
TECHNiCAL DATA REPORT - GIS
38
Florida Statewide Regional Evacuation Study Program Includes Hurricane Evacuation Study Technical Data Report East Central Florida Region Volume 1-6 Florida Division of Emergency Management East Central Florida Regional Council
-
Upload
khangminh22 -
Category
Documents
-
view
6 -
download
0
Transcript of TECHNiCAL DATA REPORT - GIS

Florida StatewideRegional Evacuation
Study Program
Includes Hurricane Evacuation Study
TechnicalData
Report
East Central Florida Region
Volume 1-6Florida Division of
Emergency Management
East Central FloridaRegional Council


East Central Florida Region Statewide Regional Evacuation Study Program
For
Brevard, Lake, Orange, Osceola, Seminole, and Volusia Counties
Prepared by: East Central Florida Regional Planning Council
for the Florida Department of Community Affairs
Division of Emergency Management

This page intentionally left blank.

Statewide Regional Evacuation Study Program Volume 1-6 East Central Florida
Technical Data Report Acknowledgements
CREDITS & ACKNOWLEDGEMENTS Funding was authorized by the Florida Legislature through House Bill 7121, as a result of the 2004 and 2005 hurricane seasons. Provisions of this bill require the Division of Emergency Management to update all Regional Evacuation Studies in the State and inexorably tied the Evacuation Studies and Growth Management. As a result, this study addresses both Emergency Management and Growth Management data needs. Funds were also provided by the Federal Emergency Management Agency (FEMA) with all money administered through
the Florida Division of Emergency Management (FDEM), 2555 Shumard Oak Blvd., Tallahassee, 32399. Web site: www.floridadisaster.org. Local match was provided by the counties of Brevard, Lake, Orange, Osceola, Seminole, and Volusia counties. The Council acknowledges and extends its appreciation to the following agencies and people for their cooperation and assistance in the development of this document: East Central Florida Regional Planning Council Staff; Federal Emergency Management Agency; NOAA; Florida Division of Emergency Management; Department of Community Affairs-Division of Community Planning; Florida Emergency Preparedness Association; Kerr & Downs Research; Dr. Earl Jay Baker - Hazards Management Group; Data Transfer Solutions; Lake-Sumter MPO; Metroplan Orlando; Volusia County MPO; Space Coast TPO; Florida Department of Transportation; Wilbur Smith Associates; National Weather Service – Melbourne Office; and the counties of Brevard, Lake, Orange, Osceola, Seminole, and Volusia. Florida Division of Emergency Management David Halstead, Director Sandy Meyer, Hurricane Program Manager Richard Butgereit, GIS Manager Northeast Florida Regional Council Jeffrey Alexander, Project Manager
Florida Emergency Preparedness Association For their support in this statewide effort County Emergency Management Agencies Bob Lay, Director of Brevard County Emergency Management Jerry Smith, Director of Lake County Emergency Management Preston Cook, Director of Orange County Emergency Management Dave Casto, Director of Osceola County Emergency Management Alan Harris, Director of Seminole County Emergency Management. Charlie Craig, Director of Volusia County
Emergency Management
Volume 1-6 East Central Florida Statewide Regional Evacuation Study Program
Acknowledgements Technical Data Report
The Statewide Regional Evacuation Study Program was completed by regional planning council staff in all eleven
regions of the State. Oversight was provided by a small group in order to facilitate an overall review of the program. Subject matter expertise was provided by
section leads for the major portions of the Study. It was these leaders who ensured that the accepted methodology was utilized across the State and that each
section was completed in a consistent manner.
State Oversight Group Gwen Keenan, Chief, Preparedness Bureau, Florida Division of Emergency Management Donald Kunish, Deputy Chief, Preparedness Bureau, Florida Division of Emergency
Management Sandy Meyer, Manager, Hurricane Program, Florida Division of Emergency Management
Brian Richardson, Manager, Natural Hazards Section, Florida Division of Emergency Management
Jeffrey Alexander, Director, Emergency Preparedness Programs, Northeast Florida Regional Council
Statewide Section Leads Betti Johnson, Principal Planner, Tampa Bay Regional Planning Council - Analyses
Marshall Flynn, Information Systems/GIS Manager, Tampa Bay Regional Planning Council - GIS
Bruce Day, Planning Director, Withlacoochee Regional Planning Council - Behavioral Richard Ogburn, Asst. to the Director, Research & Budget, South Florida Regional Planning
Council - Demographics and Population Beth Payne, Senior Regional Planner, Northeast Florida Regional Council - Statewide
Planning & Coordination Ed Ward, District 2 Emergency Coordination Officer - Florida Department of Transportation
(FDOT) Liaison Julie Dennis, Planning Analyst - Department of Community Affairs, Division of Community
Planning Liaison In addition, sincere thanks for all those staff members, both past and present, of the Florida
Division of Emergency Management (FDEM), whose contributions of time, interest and knowledge in all aspects of this project have made it a success.

Statewide Regional Evacuation Study Program Volume 1-6 East Central Florida
Technical Data Report Acknowledgements
The East Central Florida Regional Planning Council (ECFRPC), (Region 6), is one of 11 regional planning councils in Florida established under the authority of Chapter 186, Florida statutes. It has been in operation since 1962 assisting public, private, and institutional sectors in a six-
county area to address regional scale issues. The East Central Florida Regional Planning Council offers services to the six counties of Brevard, Lake, Orange, Osceola, Seminole, and Volusia.
The Council is comprised of local government elected officials and private citizen representatives within the region.
There are two distinct components of the RPC: • The RPC’s Governing Board, or Council, a body of representatives that governs the
agency.
• The staff, the professionals who provide technical support for Council decision-making
and services for local governments throughout the region.
Contributing Staff of the East Central Florida Region
Phil Laurien, AICP Executive Director
Tara M. McCue, AICP
Regional Planner II, Project Manager
Chris Chagdes
GIS Specialist/Planner I
Kate Hillman
Emergency Management & Planning
Support Specialist
George Kinney, AICP
Planning Manager
Gina Marchica
GIS Specialist
Fred Milch, AICP DRI Manager
Claudia Paskauskas, GISP, MCSD
GIS Manager
April Raulerson, FAEM
Emergency Management Planner II
Elizabeth Rothbeind
Planning & Communications Specialist
Keith Smith
GIS Specialist I

Volume 1-6 East Central Florida Statewide Regional Evacuation Study Program
Acknowledgements Technical Data Report
ECFRPC GOVERNING BOARD
COUNTY AND MUNICIPAL APPOINTEES Brevard County Commissioner Mary Bolin Commissioner Chuck Nelson Lake County Commissioner Welton Cadwell Commissioner Elaine Renick Orange County Commissioner Scott Boyd Commissioner Fred Brummer Osceola County Commissioner Brandon Arrington Commissioner Fred Hawkins Seminole County Commissioner Mike McLean Commissioner Brenda Carey Volusia County Councilman Andy Kelly Councilwoman Pat Northey City of Orlando Commissioner Patty Sheehan Space Coast League of Cities Mayor Rockey Randels Brevard County Lake County VACANT Tri County League of Cities Mayor John Land City of Apopka Tri County League of Cities Commissioner Cheryl Grieb City of Kissimmee Tri County League of Cities Commissioner Joanne Krebs Winter Springs Volusia County League of Cities Vice Mayor Mary Martin City of Port Orange
GUBERNATORIAL APPOINTEES Brevard County Mr. Al Glover
Lake County Mayor Melissa DeMarco
Orange County Ms. Christa Dixon Mr. Dan O’Keefe
Osceola County Mr. Atlee Mercer
Seminole County Ms. Melanie Chase Mr. John Lesman
Volusia County Mr. Lonnie Groot
Economic Development Mr. William McDermott
EX-OFFICIO MEMBERS
St. John’s River Water Management District Ms. Nancy Christman Florida Department of Environmental Protection Ms. Vivian Garfein South Florida Water Management District Ms. Cecelia Weaver
Florida Department of Transportation Ms. Susan Sadighi
City of Sanford Russell Gibson
LYNX Ms. Laura Minns
Orlando-Orange County Expressway Authority Vacant
Legal Counsel Jerry Livingston

Statewide Regional Evacuation Study Program Volume 1-6 East Central Florida
Technical Data Report List of Volumes
Statewide Regional Evacuation Study Program List of Volumes
Volume 1 – Technical Data Report
The Technical Data Report (TDR) is the primary document of the Statewide Regional Evacuation Study Program. The TDR contains the summary analysis of all other supporting research, survey data and modeling.
Volume 2 – Regional Behavioral Analysis The Regional Behavioral Analysis was produced by the behavioral specialist Dr. Earl J. Baker, Hazards Management Group. The report includes a summary of the behavioral survey data and analysis which
includes the regional behavioral assumptions incorporated in the calculation of evacuation population, evacuation participation rate (transportation analysis) and anticipated shelter demand. Volume 3 – Regional Behavioral Survey Report
The Regional Behavioral Survey Report, produced by Kerr and Downs, Inc., provides the survey data from the more than 2500 behavioral surveys conducted in 2009 as part of the SRES Program.
Volume 4 – Evacuation Transportation Analysis The Regional Evacuation Transportation Analysis is produced by the evacuation transportation team at Wilbur Smith and Associates. It includes a summary description of the evacuation transportation
model, study methodologies and assumptions and growth management impacts assessments on evacuation. The report includes the evacuation clearance times for the counties and the region for 2010 and 2015 under different planning and operational scenarios.
Volume 5 – Evacuation Transportation Supplemental Data Report The Supplemental Report, prepared by Wilbur Smith and Associated contains the model run inputs and outputs and serves as the source data for the Evacuation Transportation Analysis . Volume 6 – Emergency Management Evacuation Tool Kit The Emergency Management Tool Kit includes locally-selected data pertinent to the county emergency management agency. It is meant to be used as a quick reference guide for operations.
Volume 7 – Storm Tide Atlas The Storm Tide Atlas provides the storm tide boundaries based on the new SLOSH Analysis including the
boundaries of the Coastal High Hazard Area (CHHA). It is provided in several formats including GIS files, PDF files and printed copy. There is one Book for each county in the region which has a potential for storm tide flooding.
Volume 8 – Methodology of Evacuation Transportation Modeling for the Statewide Regional Evacuation Study Program, 2010 This volume provides a detailed description of the methodologies, model assumptions and the
Transportation Interface for Modeling Evacuations (TIME) developed and utilized in the Statewide Regional Evacuation Study Program.

Volume 1-6 East Central Florida Statewide Regional Evacuation Study Program
List of Volumes Technical Data Report
This page intentionally left blank.
Statewide Regional Evacuation Study Program Volume 1-6 East Central Florida
Table of Contents Technical Data Report
Technical Data Report
Table of Contents
Executive Summary
Chapter I. Regional Demographic and Land Use Analysis
Chapter II. Regional Hazards Analysis
Chapter III. Regional Behavioral Analysis Summary
Chapter IV. Regional Population and Vulnerability Analysis
Chapter V. Regional Shelter Analysis
Chapter VI. Regional Evacuation Transportation Analysis
Glossary of Terms/Definitions

Volume 1-6 East Central Florida Statewide Regional Evacuation Study Program
Technical Data Report Table of Contents
This page intentionally left blank.

Statewide Regional Evacuation Study Program Volume 1-6 East Central Florida
Preface Technical Data Report
Preface
A. About the Region The East Central Florida Region is best known for its beaches, tourism and space industry. Spanning for 6,502 sq. miles, with a land area of 5,611 square miles, the region
stretches from Brevard and Volusia Counties along the Atlantic Coastline west to Lake County and South to Osceola County. Also included in the region is Orange and Seminole
Counties. The East Central Florida region is comprised of 3 metropolitan areas-– the Melbourne-Titusville-Palm Bay MSA (Brevard County), the Orlando MSA (Lake, Orange, Osceola
and Seminole counties) and part of the Daytona Beach MSA (Volusia County). It encompasses coastal communities, rural towns, bedroom suburbs, and thriving urban centers such as Orlando, Daytona Beach,
DeLand, Melbourne, Kissimmee, Leesburg and Sanford as well as the Kennedy Space Center and Walt Disney World. In 2009, over 3 million people call East Central Florida home.
East Central Florida has changed immensely over the past 150 years since Florida became part of the United States in 1845. In the mid to late 1800’s Orlando was a cow town as ranching was the primary industry in Central Florida. With the arrival of the railroad in 1880, Orlando
and Sanford were finally connected to the rest of the nation resulting in rapid expansion of the citrus industry in central Florida. Orlando thus became the county seat and developed into a business center. In the early 1900’s, as the population of the Orlando area grew, hotels were starting to be developed, beginning the major tourism industry for the region. The 1930’s
marked the beginning of auto racing in Daytona Beach with the first NASCAR Speed Week in 1938. The mid 1900’s brought about airports and the McCoy Air Force Base, as well as the
Naval Training Center which was in
operation in Orlando until 1998. Technological companies soon began to
call East Central Florida home when the Glenn L. Martin Company, later known as Lockheed Martin, opened a missile building
facility in Orlando in 1956. Then in 1959, Cape Canaveral was forever changed with the United States’ space program and
NASA by bringing high tech jobs, wages, and minds to the Coast.
Tourism stretched inland from the beaches with the opening of Walt Disney World in 1971 growing the tourist population from 3.5 million to 10 million annually. In 2000, 43.3 million tourists visited the East Central Florida Region, the most popular tourist destination in the world
(Penn Design, 2005).
In the 1980s, the once thriving citrus industry took a severe hit with consecutive freezes, citrus
Volume 1-6 East Central Florida Statewide Regional Evacuation Study Program
Technical Data Report Preface
canker and fruit fly damage. As a result of loosing extensive grooves, land owners either moved to south Florida or sold their property due to the lack of desire for this land for agricultural uses,
opening tremendous amounts of undeveloped land for the rapidly growing central Florida Population (Penn Design, 2005).
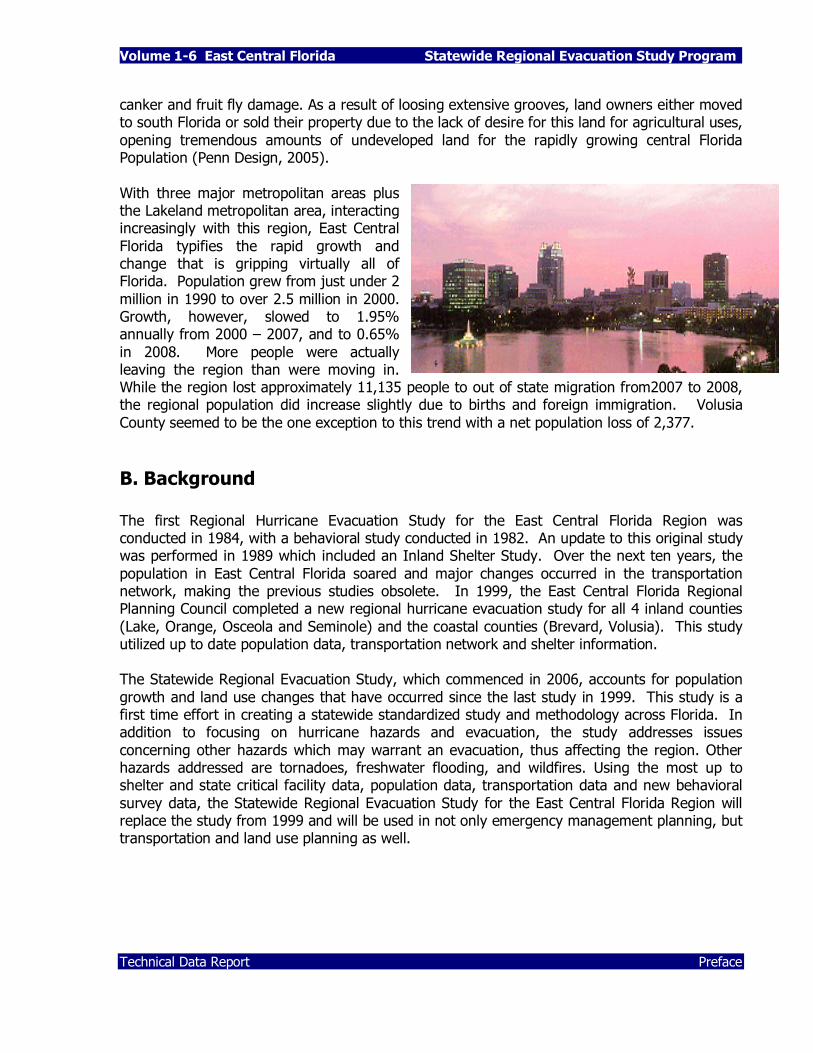
With three major metropolitan areas plus the Lakeland metropolitan area, interacting increasingly with this region, East Central
Florida typifies the rapid growth and change that is gripping virtually all of Florida. Population grew from just under 2
million in 1990 to over 2.5 million in 2000. Growth, however, slowed to 1.95% annually from 2000 – 2007, and to 0.65%
in 2008. More people were actually leaving the region than were moving in. While the region lost approximately 11,135 people to out of state migration from2007 to 2008, the regional population did increase slightly due to births and foreign immigration. Volusia
County seemed to be the one exception to this trend with a net population loss of 2,377.
B. Background
The first Regional Hurricane Evacuation Study for the East Central Florida Region was conducted in 1984, with a behavioral study conducted in 1982. An update to this original study was performed in 1989 which included an Inland Shelter Study. Over the next ten years, the
population in East Central Florida soared and major changes occurred in the transportation network, making the previous studies obsolete. In 1999, the East Central Florida Regional Planning Council completed a new regional hurricane evacuation study for all 4 inland counties
(Lake, Orange, Osceola and Seminole) and the coastal counties (Brevard, Volusia). This study utilized up to date population data, transportation network and shelter information. The Statewide Regional Evacuation Study, which commenced in 2006, accounts for population
growth and land use changes that have occurred since the last study in 1999. This study is a first time effort in creating a statewide standardized study and methodology across Florida. In addition to focusing on hurricane hazards and evacuation, the study addresses issues
concerning other hazards which may warrant an evacuation, thus affecting the region. Other hazards addressed are tornadoes, freshwater flooding, and wildfires. Using the most up to shelter and state critical facility data, population data, transportation data and new behavioral
survey data, the Statewide Regional Evacuation Study for the East Central Florida Region will replace the study from 1999 and will be used in not only emergency management planning, but transportation and land use planning as well.

Statewide Regional Evacuation Study Program Volume 1-6 East Central Florida
Preface Technical Data Report
C. Objective and Scope A major hurricane making landfall reaches beyond county
lines and effects even areas not directly hit by the storm. Jurisdictions and counties can share one bay or estuary which can experience drastic storm surge. Evacuation
routes can bring residents from one town or county into a completely different jurisdiction or even state. Therefore, it is important for local governments to communicate
across governmental lines in order to plan for the potential impacts neighboring jurisdictions may have on safely evacuating the threatened population.
The primary purpose of this study was to coordinate a statewide, regionally consistent, comprehensive and quantitative evacuation study, primarily for hurricanes. The major
components of the study consisted of the following: • Hazards Analysis - A comprehensive analysis of potential hurricane hazards in the East
Central Florida Region utilizing the Sea, Lake and Overland Surges from Hurricanes (SLOSH) model and new topographic data, Light Detection and Ranging (LiDAR).
• Vulnerability Analysis – Identification of the vulnerable areas and population to hurricane, wind and flooding hazards.
• Demographic and Land Use Analysis – Describe population and demographics for the
region and counties using current socioeconomic data for 2006, 2010 and 2015.
• Behavioral Analysis – A survey and analysis to determine how vulnerable evacuees may
respond to a hurricane threat as well as other hazards. • Shelter Analysis – A quantitative analysis of shelter availability, deficit, and special needs
(medical and pets).
• Transportation Analysis – Development of hurricane evacuation clearance times for each county and storm scenario associated with the movement of the current and projected vulnerable population from specific evacuation areas to specific evacuation destinations for
a Year 2006 base year and projected for years 2010 and 2015. • Ensure consistency in evacuating population and routes with adjacent regions.
• Update and standardize the DEM facilities database to provide all counties with consistent,
accurate and standardized emergency management data.
• Establish standardized analysis and methodology for use in deriving impacts and
determining mitigation needs as required in F.S. 163.3178.
As a result of this study, an abbreviated model called “TIME” was developed that can be used by local emergency management officials, city and county planning staff, state emergency preparedness officials, and others to recalculate clearance times based upon land use and

Volume 1-6 East Central Florida Statewide Regional Evacuation Study Program
Technical Data Report Preface
transportation system changes.
The East Central Florida Statewide Regional Evacuation Study is not intended to serve as the detailed operations plan for each unit of local government in the region. Rather, it is intended to provide the data needed to develop local and state plans. The implementation of any
evacuation plan is a local function. Therefore, the actual deployment and assignment of manpower and equipment to carry out the evacuation is best planned for at the local level. The data provided by this report will enable the local governments of the region to update specific
operating procedures for the relocation of their vulnerable populations and recovery from a hurricane strike.

Volume 1-6 East Central Region
Technical Data Report
Executive Summary

This page intentionally left blank.
Statewide Regional Evacuation Study Program Volume 1-6 East Central Florida
Executive Summary Page 1
EXECUTIVE SUMMARY This Executive Summary is provided to state and local governments, volunteer organizations,
the media and interested residents to highlight the results of the Statewide Regional Evacuation Study for the East Central Florida Region (SRES) and to quantify and illustrate the challenges of evacuation response in the region and state.
A. DEMOGRAPHIC AND LAND USE ANALYSIS
Chapter I provides a demographic profile of the region and the counties themselves. Specific socio-economic characteristics that may have an impact on evacuation vulnerability, response and mass care were identified using Census data including recent American Community
Survey data. Information includes:
• Overall Population • Group Quarters Population
• Housing Units by Type • Occupied Housing Units (Households)
• Household Size
• Seasonal Dwelling Units • Vehicles per Household
• Age Composition • Race / Ethnicity
• Place of Birth and Citizenship • Linguistic Isolation
• Labor Force • Poverty Status
• Small Area Dwelling Unit and Population Data (TAZ)
The East Central Florida Region Future Land Use Map is presented on Map I-3. There are 11 categories identified which represent a consolidation of land use categories identified in the local government comprehensive plans in the region (See Table I-17).
� RL Residential Lo (higher than AG < 1DU) � RH Residential High (more than RM and > 12DU)
� RM Residential Medium (more than RL, < 13DU) � CONS Conservation, natural and protected � PUB Public/Semi-Public, government, institutional
� AG Agriculture - rural land, farms (< 0.5DU) � REC Recreation/Open Space � COM Commercial, office, tourism, marina
� MU Mixed Use, activity centers, urban village � WAT Water bodies � IND Industrial, extractive, transportation

Volume 1-6 East Central Florida Technical Data Report
Page 2 Executive Summary
B. REGIONAL HAZARDS ANALYSIS The Hazards Analyses is the first step in the development of the regional evacuation study. The Hazards Analysis identifies type, extent and probability of those hazards which may
confront our region and necessitate a regional evacuation. The Statewide Regional Evacuation Study took an “all-hazards” approach to this evacuation study. The hazards which could necessitate an evacuation at a regional level were identified as (1) tropical storms and
hurricanes, (2) flooding, (3) hazardous materials and (4) wildfire.
C. VULNERABILITY ANALYSIS & POPULATION-AT-RISK
Depending upon the strength of the storm, the regional evacuation study calls for the
complete evacuation of successively more surge-vulnerable zones inland in addition to all mobile home residents. Using information from the Metropolitan Planning Organizations (MPOs) and the local planning commissions/departments, the population, dwelling unit
counts and vehicle data for each zone was developed (see Chapter IV, Regional Vulnerability and Population Analysis). County/ Regional population-at-risk for the years 2010 and 2015 are presented in Tables ES-1 and ES-2 below.
Table IV-1 Population-at-Risk from Hurricanes by Evacuation Level, 2010
Evacuation
Zone A
Evacuation
Zone B
Evacuation
Zone C
Evacuation
Zone D
Evacuation
Zone E
Brevard County
Population in Site-built Homes 127,138 2,488 12,056 19,579 52,015
Population in
Mobile/Manuf. Homes 6,326 732 2,535 3,237 9,077
TOTAL 133,464 3,220 14,591 22,816 61,092
Volusia County
Site-built Homes 78,861 9,459 38,601 11,791 63,890
Mobile/Manuf. Homes 1,483 1,983 9,295 2,315 7,510
TOTAL 80,344 11,442 47,896 14,106 71,400
Note: Vulnerable population determined using SRESP behavioral data and county provided evacuation zones. Vulnerable population numbers are not inclusive, meaning population numbers listed for a higher zone are not included in the lower zone. For example, vulnerable population listed for Evacuation Zone B does not include vulnerable population listed for Evacuation Zone A.

Statewide Regional Evacuation Study Program Volume 1-6 East Central Florida
Executive Summary Page 3
Table IV-2 Population-at-Risk from Hurricanes by Evacuation Level, 2015
Evacuation Zone A
Evacuation Zone B
Evacuation Zone C
Evacuation Zone D
Evacuation Zone E
Brevard County
Population in Site-built Homes 130,099 2,596 14,102 20,458 55,010
Population in Mobile/Manuf. Homes 6,538 745 2,641 3,321 9,411
TOTAL 136,637 3,341 16,743 23,779 64,421
Volusia County
Site-built Homes 80,764 9,985 40,213 12,478 66,207
Mobile/Manuf. Homes 1,744 2,053 9,535 2,432 7,913
TOTAL 82,508 12,038 49,748 14,910 74,120 Note: Vulnerable population determined using SRESP behavioral data and county provided evacuation zones. Vulnerable population numbers are not inclusive, meaning population numbers listed for a higher zone are not included in the lower zone. For example, vulnerable population listed for Evacuation Zone B does not include vulnerable population listed for Evacuation Zone A.
If everyone who was ordered to evacuate did so and those who were not ordered to
evacuate, secured their homes and stayed put, emergency management could use the population-at-risk statistics. This, however, is not the case.
Post-hurricane behavioral studies conducted along the Atlantic and Gulf coasts illustrate that many people ordered to evacuate will not and, conversely, people who live in site-built homes far outside the coastal areas will pack up and try to “outrun” the storm (“shadow evacuation”). How we quantify this behavior is key to an accurate transportation analysis. This study used the general response model (HMG, 2010) as well as the surveys conducted in 2009 (see Chapter III, Regional Behavioral Analysis Summary). Volume 2 of the Statewide
Regional evacuation Study Program provides the Regional Behavioral Assumptions based upon the General Response Model and the survey results presented in Volume 3, Behavioral Survey Report
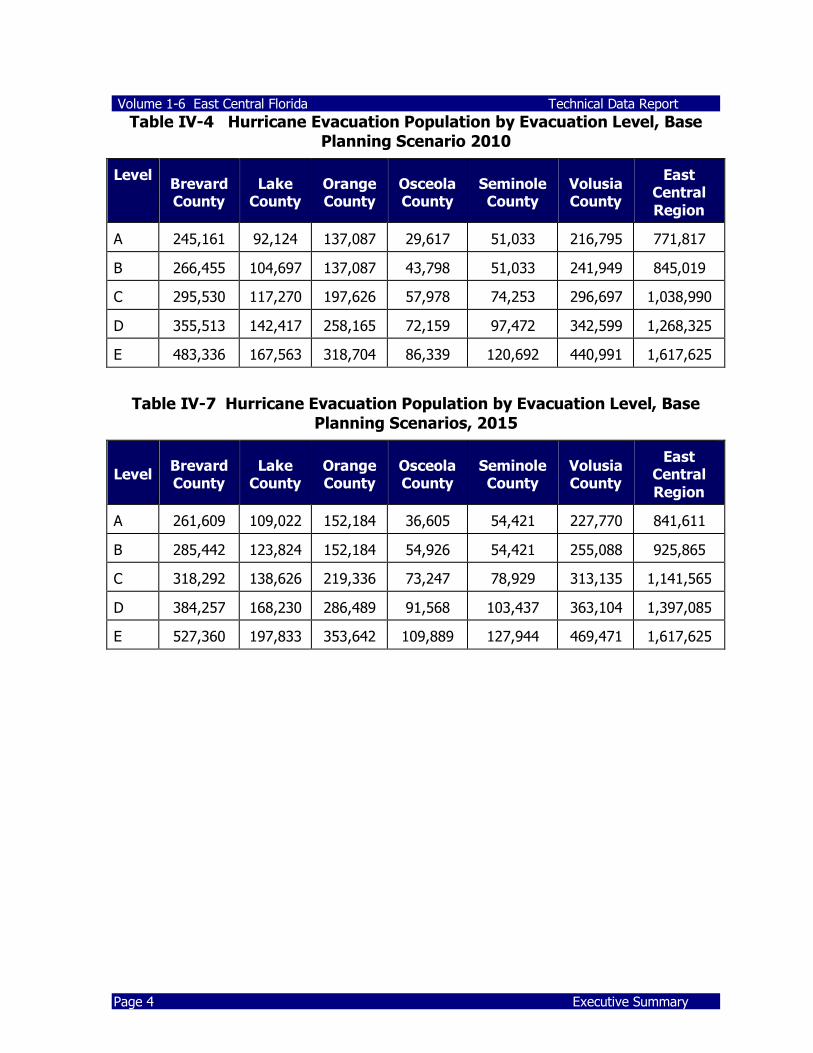
Using the behavioral assumptions discussed in Chapter III, two scenarios were developed. The Base Scenario population scenario assumes that 100% of the population-at-risk
evacuate plus the anticipated “shadow evacuation” from outside the surge vulnerable areas. The scenario is considered the most “conservative” estimate and will be used for growth management purposes. Tables ES-3 and ES-4 present these evacuation population estimates for 2010 and 2015.
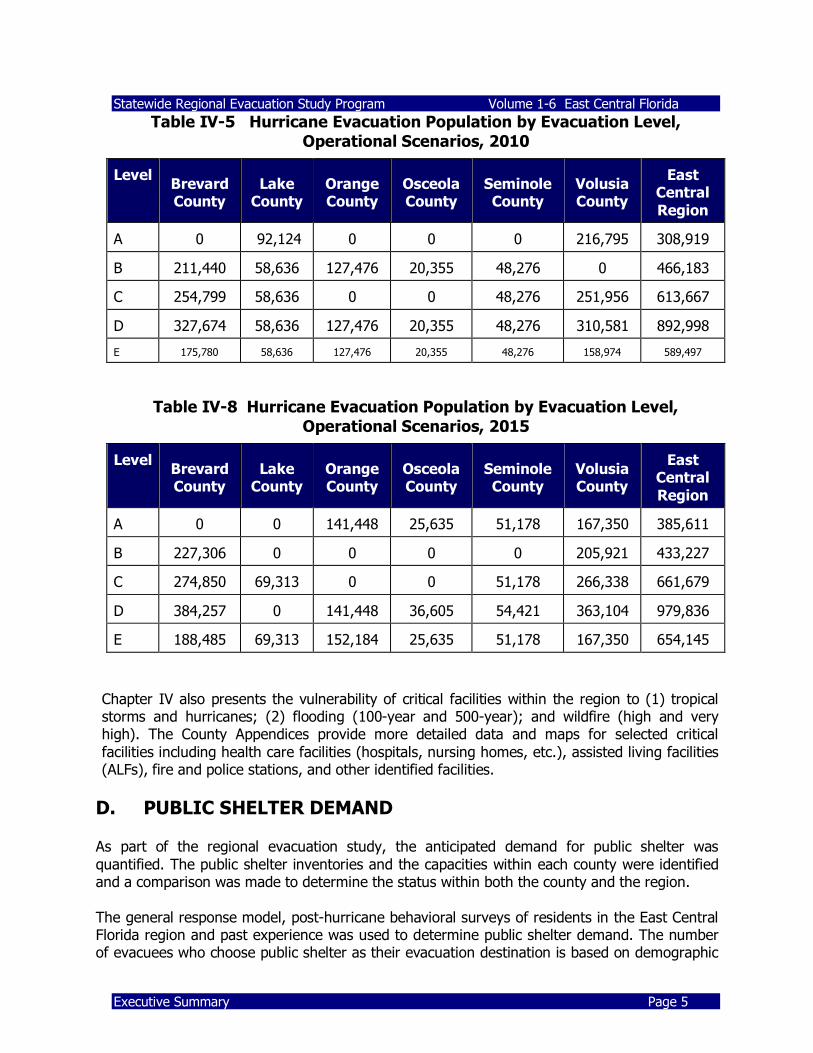
The second Operational Scenario population estimates apply the participation rates presented in the regional behavioral assumptions. They do not assume that 100% of the
population at risk evacuate but do include the “shadow evacuation” expected depending on the strength of the hurricane. Tables ES-5 and ES-6 present the evacuation population estimates and projections for 2010 and 2015.
Volume 1-6 East Central Florida Technical Data Report
Page 4 Executive Summary
Table IV-4 Hurricane Evacuation Population by Evacuation Level, Base
Planning Scenario 2010
Level Brevard County
Lake County
Orange County
Osceola County
Seminole County
Volusia County
East Central
Region
A 245,161 92,124 137,087 29,617 51,033 216,795 771,817
B 266,455 104,697 137,087 43,798 51,033 241,949 845,019
C 295,530 117,270 197,626 57,978 74,253 296,697 1,038,990
D 355,513 142,417 258,165 72,159 97,472 342,599 1,268,325
E 483,336 167,563 318,704 86,339 120,692 440,991 1,617,625
Table IV-7 Hurricane Evacuation Population by Evacuation Level, Base
Planning Scenarios, 2015
Level Brevard County
Lake County
Orange County
Osceola County
Seminole County
Volusia County
East Central
Region
A 261,609 109,022 152,184 36,605 54,421 227,770 841,611
B 285,442 123,824 152,184 54,926 54,421 255,088 925,865
C 318,292 138,626 219,336 73,247 78,929 313,135 1,141,565
D 384,257 168,230 286,489 91,568 103,437 363,104 1,397,085
E 527,360 197,833 353,642 109,889 127,944 469,471 1,617,625
Statewide Regional Evacuation Study Program Volume 1-6 East Central Florida
Executive Summary Page 5
Table IV-5 Hurricane Evacuation Population by Evacuation Level,
Operational Scenarios, 2010
Level Brevard County
Lake County
Orange County
Osceola County
Seminole County
Volusia County
East Central
Region
A 0 92,124 0 0 0 216,795 308,919
B 211,440 58,636 127,476 20,355 48,276 0 466,183
C 254,799 58,636 0 0 48,276 251,956 613,667
D 327,674 58,636 127,476 20,355 48,276 310,581 892,998
E 175,780 58,636 127,476 20,355 48,276 158,974 589,497
Table IV-8 Hurricane Evacuation Population by Evacuation Level,
Operational Scenarios, 2015
Level Brevard County
Lake County
Orange County
Osceola County
Seminole County
Volusia County
East Central
Region
A 0 0 141,448 25,635 51,178 167,350 385,611
B 227,306 0 0 0 0 205,921 433,227
C 274,850 69,313 0 0 51,178 266,338 661,679
D 384,257 0 141,448 36,605 54,421 363,104 979,836
E 188,485 69,313 152,184 25,635 51,178 167,350 654,145
Chapter IV also presents the vulnerability of critical facilities within the region to (1) tropical storms and hurricanes; (2) flooding (100-year and 500-year); and wildfire (high and very high). The County Appendices provide more detailed data and maps for selected critical
facilities including health care facilities (hospitals, nursing homes, etc.), assisted living facilities (ALFs), fire and police stations, and other identified facilities.
D. PUBLIC SHELTER DEMAND As part of the regional evacuation study, the anticipated demand for public shelter was
quantified. The public shelter inventories and the capacities within each county were identified and a comparison was made to determine the status within both the county and the region.
The general response model, post-hurricane behavioral surveys of residents in the East Central Florida region and past experience was used to determine public shelter demand. The number of evacuees who choose public shelter as their evacuation destination is based on demographic

Volume 1-6 East Central Florida Technical Data Report
Page 6 Executive Summary
characteristics of the population including income and age, risk area and housing (mobile home vs. site built homes). The planning assumptions regarding anticipated shelter use were
presented in the Regional Behavioral Analysis (See Chapter III, Appendices III-A, III-B, III-C, III-D), and were applied to the projected Hurricane Evacuation Population estimates for both the Base Planning Scenarios as well as the Operational Scenarios. As discussed in Chapter IV, the Base Planning Scenarios assume 100% compliance of the vulnerable populations (surge-vulnerable and mobile home residents) plus the “shadow
evacuation”. The Operational Scenarios use the participation rates from the behavioral analysis to determine the evacuation rates.
Table V-9a Public Shelter Demand for Hurricane Evacuation Base Scenarios 2010
County Capacity* A B C D E
Brevard 26,355 15,644 17,236 19,160 23,127 32,684
Lake 21,845 15,647 17,307 18,970 22,291 25,615
Orange 15,721 11,681 11,681 16,633 21,588 26,540
Osceola 13,230 2,605 3,789 4,975 6,159 7,346
Seminole 11,775 4,416 4,416 6,394 8,373 10,351
Volusia 25,061 15,712 18,232 23,245 28,077 38,249
Region 113,987 65,705 72,661 89,377 109,615 140,785
*Capacity based on Primary Risk ARC4496 Compliant shelters.
Numbers in Red represent a shelter deficit.
Table V-9c Public Shelter Demand for Hurricane Evacuation Base Scenarios 2015
County Capacity* A B C D E
Brevard 26,355 16,933 18,724 20,898 25,299 36,045
Lake 21,845 18,241 20,184 22,124 26,009 29,894
Orange 15,721 12,911 12,911 18,383 23,854 29,324
Osceola 13,230 3,036 4,410 5,787 7,161 8,538
Seminole 11,775 4,688 4,688 6,760 8,834 10,908
Volusia 25,061 19,508 23,427 30,815 38,395 53,881
Region 113,987 75,317 84,344 104,767 129,552 168,590
*Capacity based on Primary Risk ARC4496 Compliant shelters.
Numbers in Red represent a shelter deficit.
Statewide Regional Evacuation Study Program Volume 1-6 East Central Florida
Executive Summary Page 7
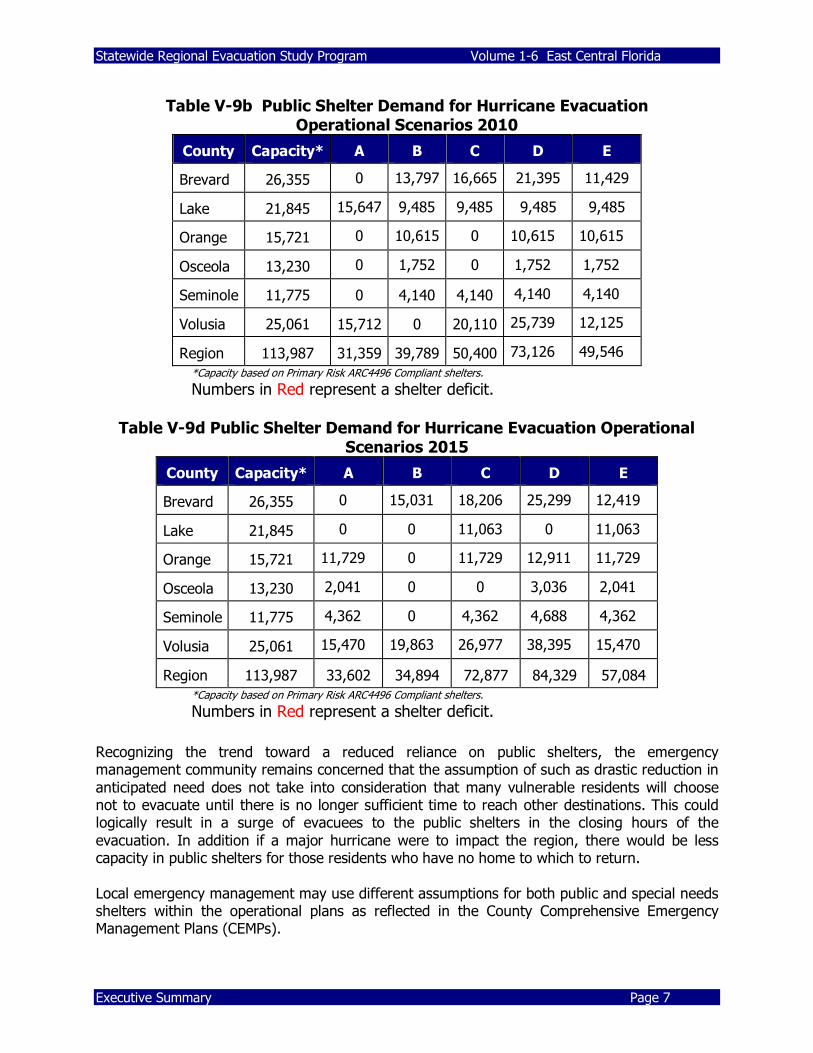
Table V-9b Public Shelter Demand for Hurricane Evacuation Operational Scenarios 2010
County Capacity* A B C D E
Brevard 26,355 0 13,797 16,665 21,395 11,429
Lake 21,845 15,647 9,485 9,485 9,485 9,485
Orange 15,721 0 10,615 0 10,615 10,615
Osceola 13,230 0 1,752 0 1,752 1,752
Seminole 11,775 0 4,140 4,140 4,140 4,140
Volusia 25,061 15,712 0 20,110 25,739 12,125
Region 113,987 31,359 39,789 50,400 73,126 49,546
*Capacity based on Primary Risk ARC4496 Compliant shelters.
Numbers in Red represent a shelter deficit.
Table V-9d Public Shelter Demand for Hurricane Evacuation Operational
Scenarios 2015
County Capacity* A B C D E
Brevard 26,355 0 15,031 18,206 25,299 12,419
Lake 21,845 0 0 11,063 0 11,063
Orange 15,721 11,729 0 11,729 12,911 11,729
Osceola 13,230 2,041 0 0 3,036 2,041
Seminole 11,775 4,362 0 4,362 4,688 4,362
Volusia 25,061 15,470 19,863 26,977 38,395 15,470
Region 113,987 33,602 34,894 72,877 84,329 57,084
*Capacity based on Primary Risk ARC4496 Compliant shelters.
Numbers in Red represent a shelter deficit.
Recognizing the trend toward a reduced reliance on public shelters, the emergency management community remains concerned that the assumption of such as drastic reduction in
anticipated need does not take into consideration that many vulnerable residents will choose not to evacuate until there is no longer sufficient time to reach other destinations. This could logically result in a surge of evacuees to the public shelters in the closing hours of the
evacuation. In addition if a major hurricane were to impact the region, there would be less capacity in public shelters for those residents who have no home to which to return.
Local emergency management may use different assumptions for both public and special needs shelters within the operational plans as reflected in the County Comprehensive Emergency Management Plans (CEMPs).
Volume 1-6 East Central Florida Technical Data Report
Page 8 Executive Summary
E. EVACUATION TRANSPORTATION ANALYSIS The evacuation transportation analysis discussed in Chapter VI documents the methodology, analysis, and results of the transportation component of the Statewide Regional Evacuation
Study Program (SRESP). Among the many analyses required for the SRESP study, transportation analysis is probably one of the most important components in the process. By bringing together storm intensity, transportation network, shelters, and evacuation population,
transportation analysis explicitly links people’s behavioral responses to the regional evacuation infrastructure and helps formulate effective and responsive evacuation policy options. Due to the complex calculations involved and numerous evacuation scenarios that need to be
evaluated, the best way to conduct the transportation analysis is through the use of computerized transportation simulation programs, or transportation models.
The development of the transportation methodology and framework required coordination and input from all eleven regional planning councils in Florida, along with the Division of Emergency Management, Department of Transportation, Department of Community Affairs, and local
county emergency management teams. At the statewide level, the transportation consultant, Wilbur Smith Associates, participated in SRESP Work Group Meetings which were typically held on a monthly basis to discuss the development of the transportation methodology and receive
feedback and input from the State agencies and RPCs.
At the local and regional level, Wilbur Smith Associates conducted a series of four regional
meetings to coordinate with and receive input from local county emergency management, the regional planning council, local transportation planning agencies and groups, as well as other interested agencies.
1. Transportation Methodology
The methodology used in the East Central Florida RPC Evacuation Transportation Analysis is identical to the methodology used for all eleven Regional Planning Councils and includes the following components:
• Behavioral Assumptions • Zone System and Highway Network
• Background Traffic
• Evacuation Traffic • Dynamic Traffic Assignment
2. Clearance Times
Based on the analysis, the Clearance Times for the Base Planning Scenario and Operational Scenarios for 2010 and 2015 are provided below.
• Clearance Time to Shelter: The time necessary to safely evacuate
vulnerable residents and visitors to a “point of safety” within the county
based on a specific hazard, behavioral assumptions and evacuation scenario.
Statewide Regional Evacuation Study Program Volume 1-6 East Central Florida
Executive Summary Page 9
Calculated from the point in time when the evacuation order is given to the
point in time when the last vehicle reaches a point of safety within the
county.
• In-County Clearance Time: The time required from the point an
evacuation order is given until the last evacuee can either leave the
evacuation zone or arrive at safe shelter within the County. This does not
include those evacuees leaving the County, on their own.
• Out of County Clearance Time: The time necessary to safely evacuate
vulnerable residents and visitors to a “point of safety” within the county
based on a specific hazard, behavioral assumptions and evacuation scenario.
Calculated from the point an evacuation order is given to the point in time
when the last vehicle assigned an external destination exits the county.
• Regional Clearance Time: The time necessary to safely evacuate
vulnerable residents and visitors to a “point of safety” within the (RPC) region
based on a specific hazard, behavioral assumptions and evacuation scenario.
Calculated from the point in time when the evacuation order is given to the
point in time when the last vehicle assigned an external destination exits the
region.
Volume 1-6 East Central Florida Technical Data Report
Page 10 Executive Summary
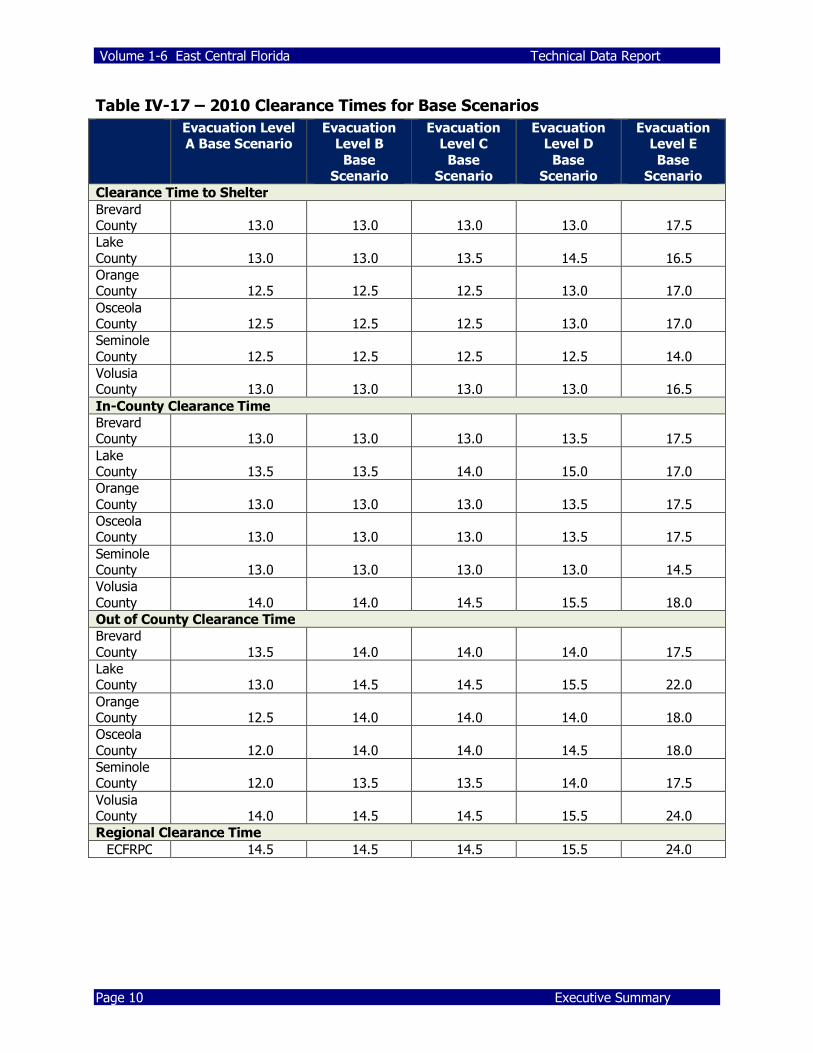
Table IV-17 – 2010 Clearance Times for Base Scenarios
Evacuation Level A Base Scenario
Evacuation Level B
Base Scenario
Evacuation Level C
Base Scenario
Evacuation Level D
Base Scenario
Evacuation Level E
Base Scenario
Clearance Time to Shelter
Brevard County 13.0 13.0 13.0 13.0 17.5
Lake
County 13.0 13.0 13.5 14.5 16.5
Orange County 12.5 12.5 12.5 13.0 17.0
Osceola County 12.5 12.5 12.5 13.0 17.0
Seminole
County 12.5 12.5 12.5 12.5 14.0
Volusia County 13.0 13.0 13.0 13.0 16.5
In-County Clearance Time
Brevard County 13.0 13.0 13.0 13.5 17.5
Lake County 13.5 13.5 14.0 15.0 17.0
Orange
County 13.0 13.0 13.0 13.5 17.5
Osceola County 13.0 13.0 13.0 13.5 17.5
Seminole County 13.0 13.0 13.0 13.0 14.5
Volusia
County 14.0 14.0 14.5 15.5 18.0
Out of County Clearance Time
Brevard
County 13.5 14.0 14.0 14.0 17.5
Lake County 13.0 14.5 14.5 15.5 22.0
Orange County 12.5 14.0 14.0 14.0 18.0
Osceola
County 12.0 14.0 14.0 14.5 18.0
Seminole County 12.0 13.5 13.5 14.0 17.5
Volusia County 14.0 14.5 14.5 15.5 24.0
Regional Clearance Time
ECFRPC 14.5 14.5 14.5 15.5 24.0

Statewide Regional Evacuation Study Program Volume 1-6 East Central Florida
Executive Summary Page 11
Table IV-18 – 2015 Clearance Times for Base Scenarios
Evacuation Level A
Base Scenario Evacuation Level B
Base Scenario
Evacuation Level C
Base Scenario
Evacuation Level D
Base Scenario
Evacuation Level E
Base Scenario
Clearance Time to Shelter
Brevard County 13.0 13.0 13.0 14.0 17.5
Lake County 13.5 13.0 14.0 16.0 15.5
Orange County 12.5 12.5 12.5 13.5 19.0
Osceola County 12.0 12.5 12.5 13.5 18.5
Seminole County 12.5 12.5 12.5 12.5 13.0
Volusia County 13.0 13.0 14.5 15.0 18.0
In-County Clearance Time
Brevard County 13.0 13.0 13.0 14.0 17.5
Lake County 14.0 13.5 14.5 16.5 16.0
Orange County 13.0 13.0 13.0 14.0 19.5
Osceola County 13.0 13.0 13.0 14.0 19.0
Seminole County 13.0 13.0 13.0 13.0 13.5
Volusia County 14.5 14.0 14.5 17.5 19.0
Out of County Clearance Time
Brevard County 14.0 14.0 13.5 14.0 17.5
Lake County 14.0 14.0 16.0 19.0 21.0
Orange County 13.5 14.0 13.0 15.0 20.0
Osceola County 13.5 14.0 12.0 15.0 19.5
Seminole County 13.5 13.5 13.0 15.0 19.5
Volusia County 14.5 14.5 14.5 20.5 34.5
Regional Clearance Time
ECFRPC 14.5 14.5 16.5 20.5 34.5
Volume 1-6 East Central Florida Technical Data Report
Page 12 Executive Summary
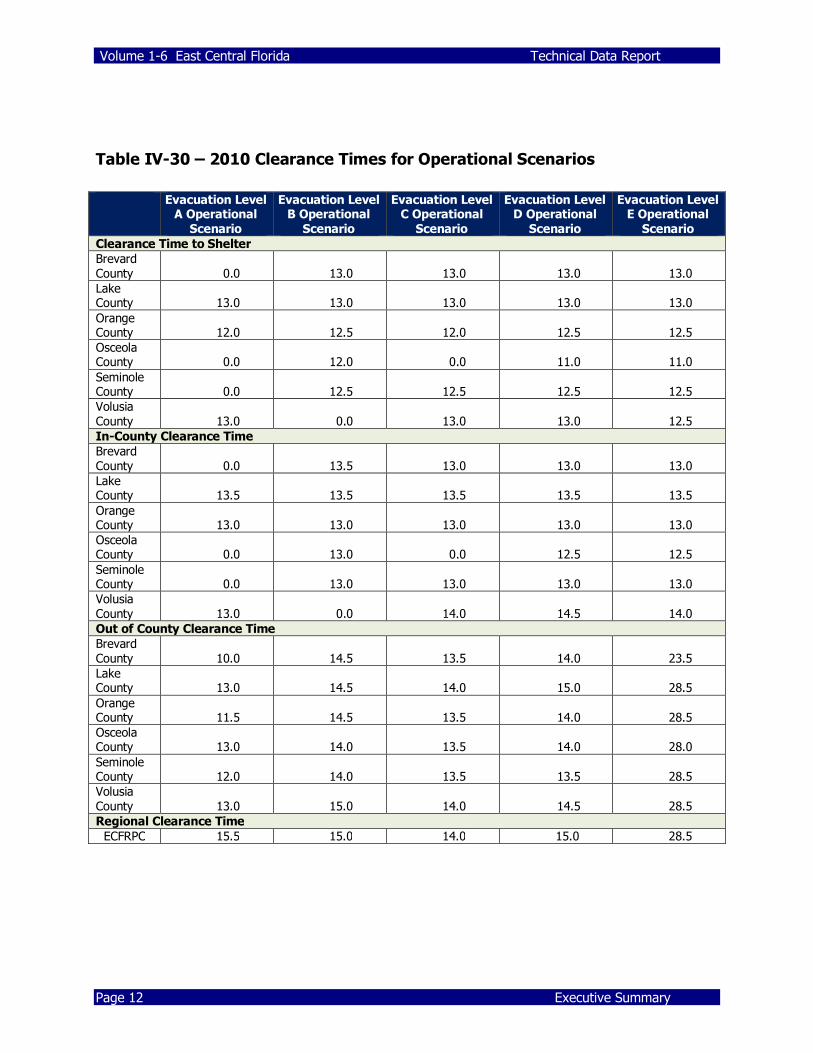
Table IV-30 – 2010 Clearance Times for Operational Scenarios
Evacuation Level
A Operational Scenario
Evacuation Level B Operational
Scenario
Evacuation Level C Operational
Scenario
Evacuation Level D Operational
Scenario
Evacuation Level E Operational
Scenario
Clearance Time to Shelter
Brevard County 0.0 13.0 13.0 13.0 13.0
Lake County 13.0 13.0 13.0 13.0 13.0
Orange County 12.0 12.5 12.0 12.5 12.5
Osceola County 0.0 12.0 0.0 11.0 11.0
Seminole County 0.0 12.5 12.5 12.5 12.5
Volusia County 13.0 0.0 13.0 13.0 12.5
In-County Clearance Time
Brevard County 0.0 13.5 13.0 13.0 13.0
Lake County 13.5 13.5 13.5 13.5 13.5
Orange County 13.0 13.0 13.0 13.0 13.0
Osceola County 0.0 13.0 0.0 12.5 12.5
Seminole County 0.0 13.0 13.0 13.0 13.0
Volusia County 13.0 0.0 14.0 14.5 14.0
Out of County Clearance Time
Brevard County 10.0 14.5 13.5 14.0 23.5
Lake County 13.0 14.5 14.0 15.0 28.5
Orange County 11.5 14.5 13.5 14.0 28.5
Osceola County 13.0 14.0 13.5 14.0 28.0
Seminole County 12.0 14.0 13.5 13.5 28.5
Volusia County 13.0 15.0 14.0 14.5 28.5
Regional Clearance Time
ECFRPC 15.5 15.0 14.0 15.0 28.5

Statewide Regional Evacuation Study Program Volume 1-6 East Central Florida
Executive Summary Page 13
Table IV-31 – 2015 Clearance Times for Operational Scenarios
Evacuation Level
A Operational Scenario
Evacuation Level B Operational
Scenario
Evacuation Level C Operational
Scenario
Evacuation Level D Operational
Scenario
Evacuation Level E Operational
Scenario
Clearance Time to Shelter
Brevard County 0.0 13.0 13.0 14.0 13.5
Lake County 0.0 0.0 13.5 0.0 13.0
Orange County 12.5 0.0 12.5 13.5 13.5
Osceola County 12.0 0.0 9.0 12.5 14.0
Seminole County 12.5 0.0 12.5 12.5 12.5
Volusia County 13.0 13.0 13.0 13.0 13.0
In-County Clearance Time
Brevard County 0.0 13.0 13.0 14.5 44.0
Lake County 0.0 0.0 14.0 0.0 13.5
Orange County 13.0 0.0 13.0 14.0 14.0
Osceola County 13.0 0.0 11.0 13.5 14.5
Seminole County 13.0 0.0 13.0 13.0 13.0
Volusia County 13.0 13.0 14.5 15.5 35.5
Out of County Clearance Time
Brevard County 13.0 13.5 13.0 14.5 45.5
Lake County 14.0 13.0 13.5 16.5 45.5
Orange County 13.5 13.5 13.0 15.0 45.0
Osceola County 13.0 13.5 11.5 15.0 44.5
Seminole County 13.0 13.5 12.0 14.5 45.5
Volusia County 14.0 14.5 13.5 15.5 46.0
Regional Clearance Time
ECFRPC 14.0 14.5 14.5 16.5 46.0
Volume 1-6 East Central Florida Technical Data Report
Page 14 Executive Summary
3. TIME User Interface
Wilbur Smith Associates developed the Transportation Interface for Modeling Evacuations (TIME) to make it easier for RPC staff and transportation planners to
use the model and implement the evacuation methodology. The TIME interface is based on an ArcGIS platform and is essentially a condensed transportation model, which provides a user friendly means of
modifying input variables that would change the clearance times for various evacuation scenarios.
The evacuation model variables include a set of distinguishing characteristics that could apply to evacuation scenarios as selection criteria. These
following variables may be selected using the TIME interface and allow the user to retrieve the best results from various evacuation alternatives:
• Analysis time period; • Highway network;
• Behavioral response;
• One-way evacuation operations; • University population; • Tourist occupancy rates; • Shelters;
• Counties evacuating; • Evacuation level;
• Response curve hours; and, • Evacuation Phasing.
It is anticipated that the regional planning council and local governments will be
able to use the TIME User Interface to simulate additional scenarios varying behavioral assumptions, reflecting proposed growth in coastal areas, new transportation improvements, etc.
F. GLOSSARY The Glossary at the back of the Technical Data Report contains the definitions of the terms used throughout the document. In many cases, it represents the legal consensus
of the definition of terms in statute pertaining to growth management. The Statewide Regional Evacuation Study Program represents a consistent and coordinated approach to provide tools for both the emergency management as well as the planning community
in the State of Florida.
Statewide Regional Evacuation Study Program Volume 1-6 East Central Florida
Executive Summary Page 15
G. CONCLUSIONS AND RECOMMENDATIONS Obviously, the implementation of a successful hurricane evacuation in the East Central Florida Region will be complex and challenging. It will require a team effort - not just on
the part of the emergency management and response personnel - but of the entire community.
The update of the East Central Florida Regional Hurricane Evacuation Study illustrates that there have been improvements in hurricane evacuation planning including increased public shelter capacity, assistance for the transit dependent, alternatives for evacuees
with pets, special needs shelters, route improvements and growth management mitigation strategies helping to reduce the population-at-risk. However, there remain serious challenges in this region if we are to avoid the loss of life and property and
human suffering witnessed in the 2005 hurricane season in Mississippi, Louisiana and Texas.
The State of Florida, County Emergency Management agencies, the American Red Cross and many other agencies have worked together to prepare regionally for a disaster – not just the inevitable strike of a hurricane but the impacts of flooding, hazardous
material incidents and terrorist attack. Recent events have tragically demonstrated the power of nature and the horrific results if government and citizens fail to respond appropriately. As public servants and elected
officials, it is imperative to address the concerns of our citizens and leaders regarding our ability to manage a major disaster.
1. Public Education
Our citizens’ knowledge and understanding of personal risk and appropriate
evacuation response remains a serious challenge. The behavioral surveys indicated that many residents – even those in the most surge-vulnerable areas and mobile homes – believe their home would be safe in a major hurricane, do not have a
family disaster plan, and many will not evacuate regardless of the intensity of the storm or government actions. This fact means that those who choose to stay behind in mobile homes and areas vulnerable to storm surge and velocity wave
action might not survive a storm. Throughout the region, county emergency management officials prepare various
educational materials and opportunities to reach out to the public concerning hurricane preparedness and evacuations. Many of these outreach initiatives include local (printed) information, web sites, citizen information lines, public speaking
engagements, and information relayed in schools, newspapers, the broadcast media and neighborhood associations throughout the season. In order to elicit an immediate evacuation response, the population-at-risk must be
clearly and conclusively convinced that (1) they are indeed residing in a vulnerable

Volume 1-6 East Central Florida Technical Data Report
Page 16 Executive Summary
area and (2) that a decision not to leave could well mean their loss of life or injury.
Post-hurricane studies have shown that the most vital piece of information is the information received from the emergency management personnel and local officials. For the most part, people will respond based upon the urgency and
seriousness of the threat as conveyed by the emergency response personnel (HMG, 1999 and 2006).
Three key messages have been identified: • Know your risk (evacuation zone/ mobile homes) • Make a family plan.
• Obtain emergency supplies for at least 3-5 days.
The accurate formulation and comprehensive dissemination of these critical pieces of information to the public in a simple and understandable form is essential for implementation of an effective hurricane evacuation plan.
Irrational emergency decision-making on the part of the population can be decreased if they determine their vulnerability to a hurricane before the emergency
occurs. Residents in the East Central Florida region are encouraged to become familiar with the county plans for evacuation and to make their "family plans” and business plans ahead of time. The State of Florida has partnered with the Florida
Broadcasting Association to encourage the “culture of preparedness” including PSAs and billboards. Partnering at the local level is also needed.
Additional notification procedures (of evacuation level) is implemented and repeated throughout the season. The local governments in the region do have programs which provide these services to their residents so it is unclear why so
many residents do not know their evacuation level or understand their risk. Some programs throughout the state and region include, but are not limited to:
• Notification on utility bills (zone designation) • Notification on tax bills (zone designation)
• Special mailings and deliveries • Interactive Web sites (zone look up)
• Citizen Information lines (zone look up)
Perhaps the answer lies in a continued strengthen initiative to partner with all levels of government, the private sector, civic and business associations and non-profit/volunteer agencies and the media to “get the word out” about preparedness
and mitigation. Businesses have been increasingly active in developing continuity plans and providing information to their employees. Churches and civic associations, neighborhood associations, crime watch and Community Emergency
Response Teams (CERT) can provide direct contact and face-to-face communication.

Statewide Regional Evacuation Study Program Volume 1-6 East Central Florida
Executive Summary Page 17
2. Special Needs Providing shelter for residents with special needs is a critical issue. Partners
including the Dept. of Health, home health agencies, hospitals and skilled nursing facilities, to name just a few, must work with local agencies to (1) register and determine the appropriate level of care and appropriate shelter alternative for each
resident and (2) provide the facility, staff, equipment and supplies and transportation assistance in an effective manner in a disaster situation.
Again, we need to develop strong partnerships with those entities in the community that work with our citizens with special needs on a daily basis to ensure they receive the information and support they need before, during and after a disaster.
3. Mitigation Message As identified, the results of the Statewide Regional Evacuation Study for the East Central Florida Region highlight the challenges of the emergency management community. If people do not respond correctly when an evacuation order is given, there will be serious implications on the entire emergency response.
For example, if residents who live in low-lying surge vulnerable areas or mobile homes do not evacuate, they are putting their safety at risk. Conversely, if residents who live in site-built homes outside the surge-vulnerable areas try to
evacuate in significant numbers, the resulting traffic congestion may prevent anyone from reaching safety.
The answer is comprehensive consistent public education which focuses on encouraging our residents to do the following (1) know their risk, and (2) plan ahead. Again, key messages include:
• Individual Responsibility – Be disaster resilient. Know your risk, plan ahead
and obtain needed supplies. • Encourage residents to “Flee from Flood; Hide from Wind”. Obviously,
coastal residents in surge vulnerable areas and mobile home residents must
evacuate; however, the key message is to seek refuge within “tens of miles, not hundreds of miles.”
• Strongly encourage all residents who live in site-built homes outside the
surge vulnerable areas to call and invite friends or relatives who must evacuate to come and stay with them if there is a hurricane threat. Once
they have committed by inviting their friends or relatives, we will also encourage residents to prepare their homes and mitigate for the potential winds, i.e. window and door protection, braced gable end roofs, and garage doors.
• It is assumed if inland residents take action to protect their homes from wind, they will be less likely to try to “outrun” a hurricane.
Volume 1-6 East Central Florida Technical Data Report
Page 18 Executive Summary
4. The Coastal High Hazard Area (CHHA) In 2006 the Florida Legislature passed a bill changing the definition of the coastal high hazard area (CHHA) from the evacuation zone to the “area defined by the SLOSH model to be inundated from a category one hurricane.” This change was welcome as the definition was more defensible tying the land use regulations to a scientific model rather than the zone delineated by roadways and familiar landmarks. However, the limitations of the model must be recognized by the local governments now responsible for its regulation. As discussed, the SLOSH model does not address wave height and other local processes. It also does not incorporate the danger of isolation in areas surrounded by storm surge with limited access such as barrier islands. These two issues are of serious concern and it is recommended that local governments address them within their comprehensive plans and land development regulations.
H. Use of SRES Data in Growth Management While this study is primarily designed for the local emergency management agencies to utilize in the preparation of emergency response, evacuation, sheltering and mitigation plans, Chapter 163.3178 of the Florida Statutes directs growth management planners to this study to identify exceedances when determining the impacts of growth on the safety of the public. Therefore, this study is also designed with many features to address growth management issues. Key items included are Coastal High Hazard Areas (CHHA), clearance times, shelter capacity, and tools for determining impacts of growth.
1. Storm Tide Limits and the Coastal High Hazard Area
The Statewide Regional Evacuation Study (SRES) contains data which is directly referenced in growth management legislation in the State of Florida and coastal/conservation elements of the Local Government Comprehensive Plans. The Storm Tide Atlas (Volume 7) and the storm tide limits it portrays for each county define the Coastal High Hazard Area (CHHA)1. Section 163.3178(9)(c), Florida Statutes requires local governments to amend their future land use map and coastal management element to include the new definition of the Coastal High Hazard Area and to depict the CHHA on the County’s Future Land Use Map. As indicated in the Hazards Analysis chapter (Volume 1: Technical Data Report, Chapter II), the ultimate amount of storm surge at any given coastal location is determined by a number of factors. It has been demonstrated that storm parameters including the wind speed and profiles, angle of approach, size of radii of maximum winds and the forward speed of the system will have a complex and
1 Section 163.3178(2) (h), F.S. “the area below the elevation of the Category 1 storm surge line as established by a Sea, Lake and Overland Surge from Hurricanes (SLOSH) computerized storm surge model.”
Statewide Regional Evacuation Study Program Volume 1-6 East Central Florida
Executive Summary Page 19
inter-related affect on the amount of surge at a particular site. For example, Hurricane Ike which struck the Galveston area in 2008 was classified as a Category 2 hurricane on the Saffir Simpson Hurricane Wind Scale yet it produced a 24 – 26 foot storm surge (often associated with a Category 5 Hurricane) due to its large wind field (radius of maximum winds) and angle of approach.
2. Storm Tide Limits and Evacuation Zones
Emergency management officials use many factors in determining County Evacuation Zones, with storm tide limits being a major component. However, it is important to note that the storm tide boundaries are not the only data used in this determination. Local officials use their knowledge of the area and other data such as: areas of repetitive loss, surge depth, freshwater flooding, isolation issues, and debris hazards, and typically choose known landmarks to identify boundaries for public warning and information.
As a result, the Evacuation zones largely correspond to the storm tide limits of the Category 1 – 5 hurricanes on the Saffir-Simpson Wind Scale. However, the degree to which any specific zone corresponds to storm tide limits is directly related to the affect other data factors have on the final determination of County Evacuation Zones by local officials. These factors may lead local officials to consolidate zones, add additional zones, expand or contract zones to ensure those threatened by the hazards are appropriately included.
The 2010 SRES introduces alphabetic Evacuation Zones/Levels (A-E) across the State for the first time. A map (Figure IV-2) of these zones is located in Chapter IV: Regional Population and Vulnerability Analysis found in Volume 1 of the Study. For purposes of growth management planning, the reference to areas to be evacuated from a Category 1 hurricane should use Evacuation Zone/Level A, reference to evacuation areas to be evacuated in advance of a Category 2 hurricane should use Evacuation Zone/Level B, and reference to areas to be evacuated from a Category 3 hurricane should use Evacuation Zone/Level C. Similarly, in policies which refers to evacuation areas from a Category 4 or 5 hurricane, Evacuation Zones/Levels D or E should be used respectively. Where there are consolidated zones or evacuation levels please refer to the detailed reference information (Chapter IV: Regional Population and Vulnerability Analysis of Volume 1).
3. Transportation
Two types of scenarios (Base scenarios and Operational scenarios) were defined in the Evacuation Transportation Analysis (Volume 4) for use in the Regional Evacuation Model to derive the evacuating population, evacuation vehicles, clearance times and critical congested roadways. Most pertinent to Growth Management are the base scenarios, which were developed to estimate a worst case scenario in which 100% of the vulnerable population (those found in evacuation zones) evacuate plus the addition of “shadow evacuation”. The standard assumptions utilized as the baseline were identified by the Division of Community Planning (DCP) as best suited for use in growth management analysis. The Base Scenarios (Table VI-9, Chapter VI: Evacuation Transportation Analysis Summary in
Volume 1-6 East Central Florida Technical Data Report
Page 20 Executive Summary
Volume One) are provided to supply the anticipated time needed to evacuate all vulnerable populations (clearance times are found in tables VI-11 and VI-12, Chapter VI: Evacuation Transportation Analysis Summary in Volume One).The Base Scenarios also supply the baseline data for planning purposes (maximum evacuation population found in tables VI-15 and VI-16, Chapter VI: Evacuation Transportation Analysis Summary in Volume One) . This allows for the evaluation of growth management strategies and provides a consistent statewide measure for clearance time calculations.
The ability to alter scenarios is also available, allowing a planner to increase or decrease population, roadway capacities, shelter availability and more; then measure the variations to determine impacts of population, land use or infrastructure changes. The Transportation Interface for Modeling Evacuations (TIME) is the tool developed to allow users to run further scenarios. Built on the Cube Voyager and Cube Avenue software, this interface is a user- friendly interface which provides the ability to run variations on the transportation scenario, without being transportation planners. If needed, a transportation planner familiar with the model’s underlying software can provide a more complex analysis.
4. Definitions
In addition to the data provided, the SRES also defines terms (Volume One: Technical Data Report, Glossary) that are referenced in Florida legislation including various Evacuation Clearance Times (Clearance Time to Shelter, In-County Clearance Time, Out-of-County Clearance Time and Regional Clearance Time). These Clearance Time definitions better clarify the criterion in determining the compliance of Comprehensive Plan Amendments with State coastal high hazard provisions as prescribed in Section 163.3178(9), Florida Statutes. Using the uniform assumptions from the Base Scenarios, the SRES supplies the information to provide a consistent statewide methodology to assess current conditions as well as quantify impacts that may need to be mitigated.
5. Sheltering
As indicated in the Hurricane Preparedness Policy Rule (Rule 9J-2.0256 (4), F.A.C.), shelter space surplus and deficits are utilized to determine impacts of Developments of Regional Impacts (DRI). Chapter 5: Regional Shelter Analysis of Volume One provides general information on sheltering (general population, special needs and pet friendly), listings of all county shelters and their capacity as well as specific public shelter demand (Table V-9 through V-12). Shelter surplus and deficits are outlined in these tables as well.
Important to note: shelters listed in the study are divided in two categories, ‘primary’ and ‘other’ shelters. Primary shelters are ARC 4496 compatible and may meet other requirements as well (Enhanced Hurricane Protection Areas). It is these primary shelters in which the assessment of a County’s shelter deficit is based upon. Each study may list ‘other shelter resources’ that are within each County, but these shelters may or may not be utilized during an event.