A Short Observation on the Printing Cotton Fabric using Some ...
Upload
khangminh22Category
view
7download
0
S A W T R I SPECIAL P U B L I C A T I O N m A
Textiles: Some Technical Information and Data V: Cotton
by
L Hunter
SOUTH AFRICAN WOOL AND TEXTILE RESEARCH INSTITUTE OF THE CSlR
P.O. B o x r 124 P O R T E L I Z A B E T H
R E P U B L I C O F S O U T H A F R I C A

CONTENTS 1 . Introduction ................................................ 1 2 . General .................................................... 1 3 . Cotton Growing ............................................. 14 4 . Fibre Structure ............................................... 25 5 . Composition of Cotton ....................................... 30 6 . Cotton Wax ................................................ 35 7 . Picking and G i n g ......................................... 39 8 . Delinting Cotton Seed ........................................ 46 9 . Cotton Grade ............................................... 47 10 . Cotton Damage ............................................. 50 11 . Sticky Cotton ............................................... 53 12 . Fibre Length Characteristics ................................... 54 13 . Micronaire ................................................. 60 14 . Fibre . Maturity .............................................. 65 IS . Fibre ............................................... 80 16 . Summary of Relationships Involving Maturity and Fineness ........ 82 17 . Structural Reversals and Fibre .Convolutions ..................... 84 18 . Fibre Dimensional Proportions ................................ 87 19 . Fibre Strength ............................................... % 20 . Some Effects of Mercerisation ................................. 101 21 . Fibre . Elongation ......... , .................................. 103 22 . Stiffness and Compressional Properties ......................... 104
. 23 . Fibre Friction ............................................... 105 24 . General Fibre Properties ....................................... 108 25 . Trash and Non-Lint Content .................................. 114 26 . Cotton Dust and Byssinosis ................................... 118 27 . General Particle Characteristics ................................ 122 28 . Waste During Processing ..................................... 124
......................... 29 . Effect of Processing on Fibre Properties 129 30 . Neps ........................................................ 131 31 . Carding and Neps ............................................. 135 32 . Effect of Fibre Properties on Yam Properties .................... 139 33 . Fibre Quality Index .......................................... I50
......................... 34 . Yarn Faults and Spinning End Breakages 155 35 . Yarn Linear Density Variation ................................. 156
References .................................................. 157
EXTILES : SOME TECHNICAL INFORMATION AND DATA PART V : C(YIT0N
INTRODUClXON
The main objective of this series of publications has been to collect, compile and collate technical information and data on textiles considered to be useful to the textile industry and researcher alike. In many cases such data and information are not readily available.
As in Parts I to N of this series, the information, in many cases, has been reproduced in the original words and form. The author does not claim originality nor does he guarantee the accuracy of all the data. Patt I1 of this series contains general fibre properties, including those of cotton.
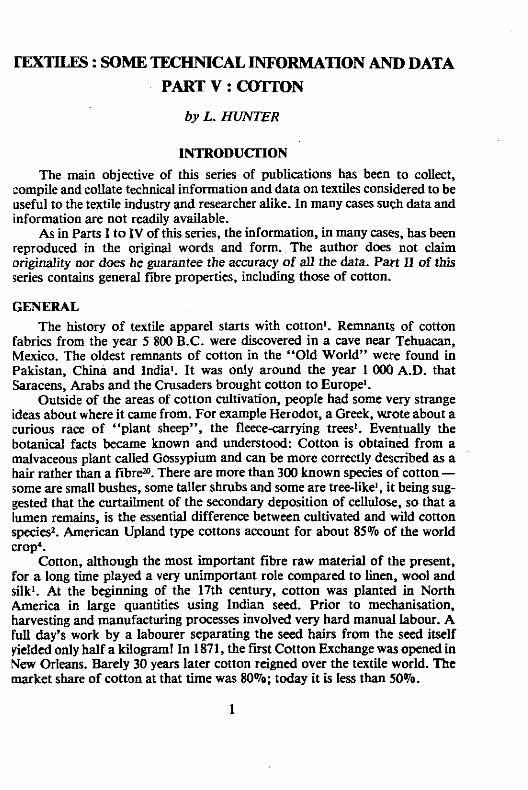
GENERAL The history of textile apparel starts with cotton1. Remnants of cotton
fabrics from the year 5 800 B.C. were discovered in a cave near Tehuacan, Mexico. The oldest remnants of cotton in the "Old World" were found in Pakistan, China and Indial. It was only around the year 1 000 A.D. that Saracens, Arabs and the Crusaders brought cotton to Europe1.
Outside of the areas of cotton cultivation, people had some very strange ideas about where it came from. For example Herodot, a Greek, wote about a curious race of "plant sheep", the fleecesarrying trees1. Eventually the botanical facts became known and understood: Cotton is obtained from a malvaceous plant called Gossypium and can be more correctly described as a hair rather than a fibreM. There are more than 300 known species of cotton - some are small bushes, some taller shrubs and some are tree-like', it being sug- gested that the curtailment of the secondary deposition of cellulose, so that a lumen remains, is the essential difference between cultivated and wild cotton species'. American Upland type cottons account for about 85% of the world crop4.
Cotton, although the most important fibre raw material of the present. for a long time played a very unimportant role compared to linen, wool and silkl. At the beginning of the 17th century, cotton was planted in North America in large quantities using Indian seed. Prior to mechanisation, harvesting and manufacturing processes involved very hard manual labour. A full day's work by a labourer separating the seed hairs from the seed itself yielded only half a kilogram! In 1871, the fmt Cotton Exchange was opened in New Orleans. Barely 30 years later cotton reigned over the textile world. The market share of cotton at that time was 80%; today it is less than 50%.
1
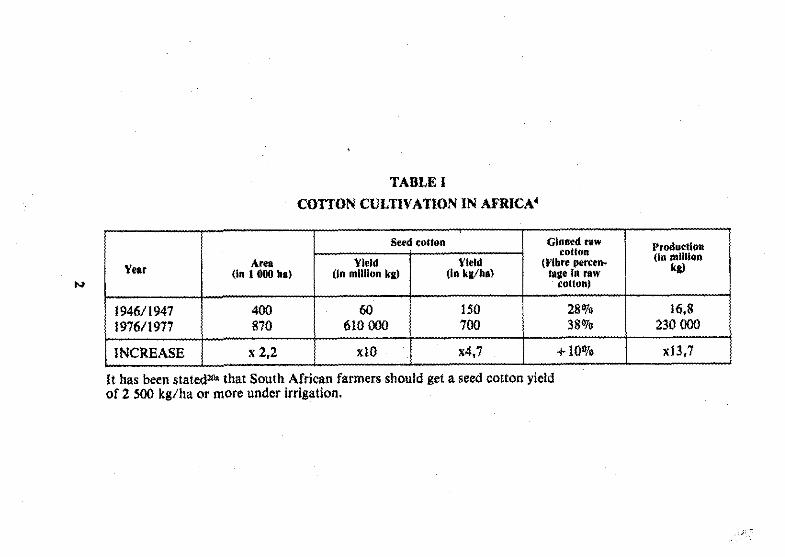
TABLE I COTTON CULTIVATION IN AFRICA'
Area (In I000 ha)
I !
ProducNm (in million
kg)
Seed cotton I Clnned raw
It has been stated?* that South African farmers should get a seed cotton yield of 2 500 kg/ha or more under irrigation.
16,s 230 W(f
x13,7
150 700
x4,7
60 610 000
x10
1946/1947 1976/ 1977
CO!!O" Wlbre pemn-
rage In raw cotton)
Vleld (ln mllllon kg)
28% 38%
+ 10%
400 870
Yidd (In kg/ha)
INCREASE x 2,2

Picking the "white gold" by hand still offers an advantage in quality, compared to machine harvesting. The pickers select only the fully ripe. radiantly white fibre bundles, while the machine harvests a whole field at the same time, including both ripe and unripe cotton. The most important quality feature, apart from purity, is fibre length, which ranges between 10 and 50 millimetre, Egypt and the Sudan producing extra long qualities. Today cotton is planted in about 70 countries on a total of about 31.6 million hectares - and in spite of man-made fibres, it remains the most processed and the most highly used textile fibre.
Japan is the world's largest cotton buyer, taking nearly 20% of the total, followed by China, South Korea, France, West Germany and Italy3.
The United States Department of Agriculture (USDA) estimated the world annual cotton production during 1979/80 at about 64 million bales (1,41x10'0 kg) of which the US. produced about 14 million bales (on 14 million acres). Australia's annual production is about 60 million kilograms and so is South Africa's.
Table 1 reflects the development of cotton cultivation in the African countries. In Table 1 "seed cotton" means the product of the cotton plant, i.e.
TABLE 2
WORLD COlTON PRODUCTION IN MILLIONS OF BALW
Argentina Brazil China E m t India Mexico Iran Pakistan Peru Sudan Colombia Turkey U.S.A. U.S.S.R. Others
TOTAL

TABLE 3
ESTIMATED PRODUCTION OF COTTON* BY STAPLE LENGTH 1976/77 THROUGH 1978/79
(1 000 BALES OF 478 POUNDS)6
NORTH AMhRlCA C",M Rira . . . . . . . . . . . . . . . . . . . . . EISalvsdor.. . . . . . . . . . . . . . . . . . . . . Gualasula.. . . . . . . . . . . . . . . . . . . . .
. . . . . . . . . . . . . . . . . . . Usilcd S l i l l ~ s . l l lherr . , . . . . . . . . . . . . . . . . . . . . . . . .
Vel,w"<la.. . . . . . . . . . . . . . . . . . . . . . Oihrrr.. . . . . . . . . . . . . . . . . . . . . . . . . WESTERN FUROPE c;recc<. . . . . . . . . . . . . . . . . . . . . . . . . . Italy.. . . . . . . . . . . . . . . . . . . . . . . . . . spa;,, . . . . . . . . . . . . . . . . . . . . . . . . . . . YvpOslaria . . . . . . . . . . . . . . . . . . . .
EASTERN EUROPE Albania.. . . . . . . . . . . . . . . . . . . . . . . . Dulgaris.. . . . . . . . . . . . . . . . . . . . . . . USSR . . . . . . . . . . . . . . . . . . . . . . . . . . ASIA AND OCEANIA Aryhallirlsn . . . . . . . . . . . . . . . . . . . . .
EXTRA-IDNC (35 m m and o w l
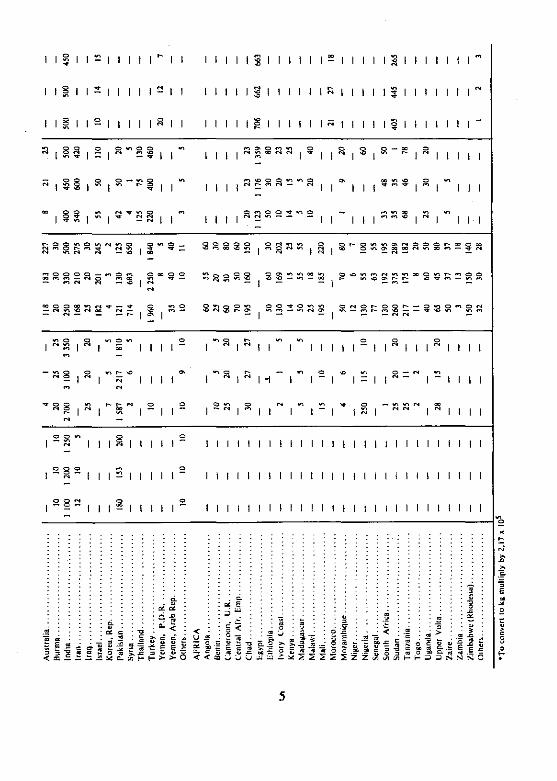
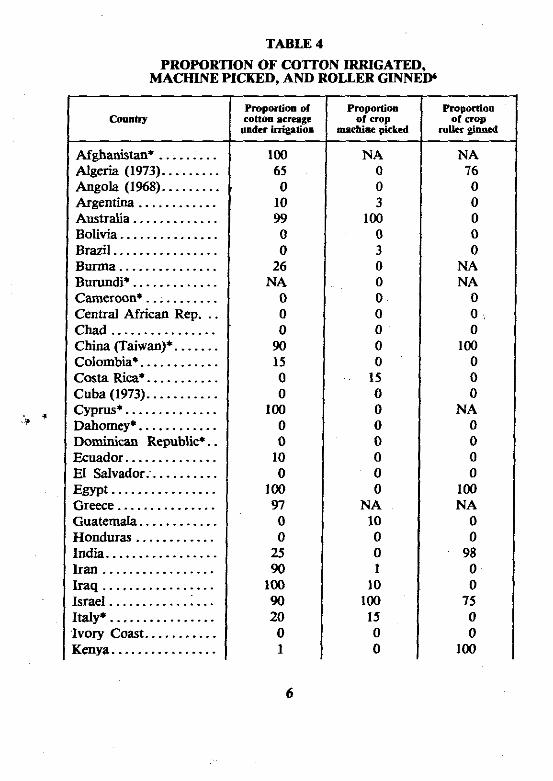
TABLE 4
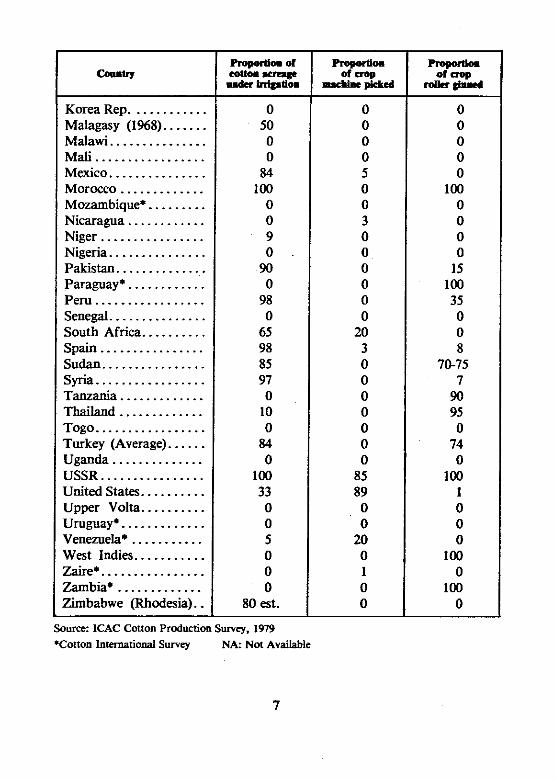
PROPORTION OF COTTOS IRRIGATED . MACHINE PICKED. AND ROLLER GINNED'
Afghanistan* ......... Algeria (1973) ......... Angola (1%8) ......... Argentina ............ Australia ............. Bolivia ............... Brazil ................ Burma ............... Burundi* ............. Cameroon* ........... Central African Rep . . . Chad ................
....... China (Taiwan)* Colombia* ............
........... Costa Ria* Cuba (1973) ........... CYPNS* .............. Dahomey* ............ Dominican Republic* . .
.............. Ecuador .......... El Salvador:
Egypt ................ Greece ...............
............ Guatemala Honduras ............ India ................. Iran ................. Iraq .................
... Israel ............ i Italy* ................ Ivory Coast ........... Kenya ................
Proportion of cotton acreage
nuder higalioa
Proportion Of crop
machine p i c M
Proportion Of crop
mlier ginned
Ropoma Of nop
Korea Rep ............ Malagasy (1%8) ....... Malawi ............... Mali ................. Mexico ............... Morocco ............. Mozambique* ......... Nicaragua ............ Niger ................ Nigeria ...............
.............. Pakistan Paraguay* ............ Peru .................
............... Senegal South Africa .......... Spain ................ Sudan ................ Syria ................. Tanzania ............. Thailand ............. Togo ................. Turkey (Average) ...... Uganda .............. USSR ................ United States ..........
.......... Upper Volta Uruguay' ............. Venezuela* ........... West Indies ........... Zaire* ................ Zambia* ............. Zimbabwe (Rhodesia) . .
0 50 0 0
84 100
0 0 9 0
90 0
98 0
65 98 85 97 0
10 0
84 0
100 33 0 0 5 0 0 0
80 est . Source: ICAC Cotton Production Survey . 1979 *Cotton InternatioDal Survey NA: Not Available
7

P N w - r m e- N N

the fibres and the cotton seed. The proportion of fibres to seed depends on the varieties and strains. It should not be overlooked that cotton seed is a very valuable product. The seeds contain from 16 to 24% of their own mass in high- grade oil4.
Tables 2 to 4 give some information on cotton production while Tables 5 to 8 give some comparative figures for various fibres.
Although cotton production has been increasing steadily (see Fig 1)'O its share of the market has been declining steadily (see Table 5 and Fig 2).
FIGURE 1
World Production of Textile Fibml" *(To obtnin kg mnltiply by 10)
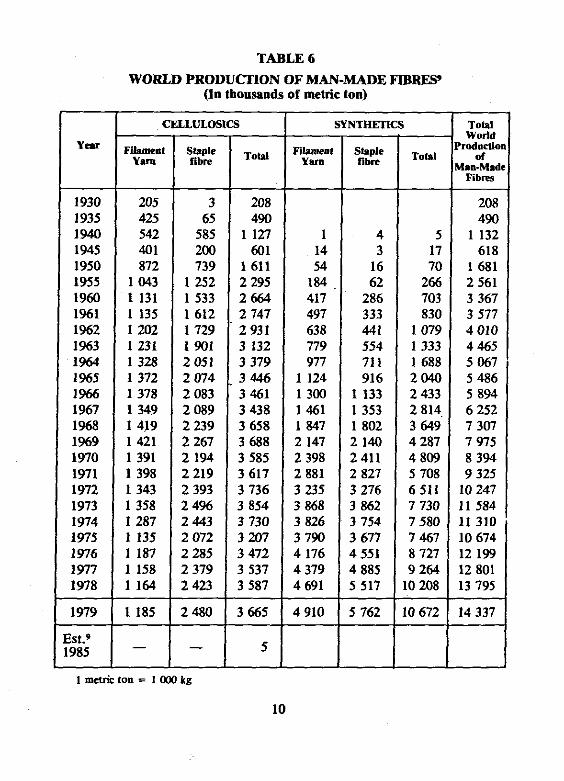
TABLE 6 WORLD PRODUCXION OF MAN-MADE FIBRES'
(In thousands of me& ton) - T o m World
'mdnctit of
aaa-Ma~ Fibm -
208 490
1 132 618
1 681 2 561 3 367 3 577 4 010 4 465 5 067 5 486 5 894 6 252 7 307 7 975 8 394 9 325
10 247 11 584 11 310 10 674 12 199 12 801 13 795
CELLULOSICS - TOW
- Stapk fibre

TABLE 7
BREAKDOWN OF WORLD PRODUCTION OF SYNTHETICS' (in percentages)
Polyester
37 39 41 43 45 45 46 46 47
Other Synthetics
6 5 4 4 3 3 4 4 4
TOW Synthetic
- 100 100 100 100 100 100 100 100 100
TOW Worl~ Production
)f Man-mad Fibm
+ 19% + 14% + 19% - 3% - 2% + 17% + 6% + 10% + 5%
TABLE 8
GEOGRAPHICAL BREAKDOWN OF WORLD PRODUCTION OF MAN-MADE FIBRES"
(in thousands of metric tons)
Change 1979: + 1% + 7% 1978
R s t of Ibc World
I metric ton = l 000 kg

W n O N .---- A
W W L
... .... .. CELWWSKS NON-CELLULOSICS
FIGURE 2
Relptire &am of varioos fibres in world mmumption 19-1975"
It has been predicted14 that world cotton production could reach 70 to 76 million bales (217 kg each) by 1985 and between 75 and 84 million bales by 1990, with America producing some 10 to 13 million bales by 1990. It has also been predictedi5 that world consumption of textile fibres will be over 46 million tonnes (46xlW kg) in 1990, with man-made fibres accounting for 58% (26.5 x 1W kg) of the total.
There is great speculation on the relative importance of increases in fuel and energy prices on natural vk-a-vis synthetic fibre viability12 '21. It has been estimated13 that for each $1 increase in oil price per barrel the price of produc- ing polyester will increase by about 2,2 cents per kilogram and the cost of growing cotton by 1,s cents per kg .
Figs 3 and 4 illustrate trends in world fibre production and per capita con- sumption".
Koedad7 estimates that conon is grown on less than 2,2% of the world's arable land cultivated for crops and only 0,8% of the total agricultural land in the world is currently used for cotton growing". It is also often overlooked that the cotton plant produces not only fibre but also cotton seed which is an important source of food. For every 1 000 kg of cotton lint, we get approx- imately 2 000 kg of cotton seed which yields 300 kg of cotton seed oil. For U.S. cotton the cotton seed comprises approximately 18,6% oil, 41% protein (cake) and 11 to 12% moisture, with hulls and linters making up the balanc6".

FIGURE 4
Projections of aggregate fibre consamptiom to AD MOO by wrious aotbod
'1 tame = 1 000 kg
In a number of developing countries, extraction of oil from cotton seeds is an established industry. Cotton seed is an important source of high-quality edible oil and protein-rich cotton seed cake for animal nutrition1', thus con- tributing indirectly to the world food supplyll. After extraction of the oil from the cotton seed the residue is exploited for food, animal fodder and fertilizer'.
The amount of protein and lipid in cotton seed is dependent on maturity, environment, and variety7'. These same factors affect the cotton fibre and the state of the fibre when it reaches the gin''. Ethanol extracts proteins and pec-

tins as well as lipids; chloroform was regarded as best for lipid determination". Free fatty acid content of cotton seed of highest quality is 0,5 to 0,6%". Ex- tremely bad oil may contain 15 to 25% of free fatty acid76.
While protein isolated from cotton seed is unsuitable at present for human consumption due to the presence of gossypol, attempts are being made to solve this problem". For example, at the SRRC in New Orleans, USA, and at the RRL in Hyderabad, India, a cyclone process has been developed to isolate gossypol-free protein from cotton seeds. (While this process has been successful on a pilot-plant scale, it seems to have m into difficulties in large- scale operation). There are also attempts to develop a gland-free variety of cotton seed, which would enable production of gossypof-free protein fit for human consumption. As and when this becomes technically and commercially feasible, cotton seed would make an important contribution to the protein availabiity in the world. The stalks of the cotton plant have been successfully used, though on a limited scale, to make building materials such as particle boards and sheetsH.
COTTON GROWING Cotton belongs to the Gossypium of the Mallowls (or Malvaceac)19
family which can be subdivided into other botanical varieties of presently cultivated cotton. None of the commercial varieties of cotton is genetically pure, in the sense of being a pure linelo. The modern varieties of cultivated cot- tons belong to four botanically distinct species of Gossypium, two old-world diploid species (G. arboreum and G. herbaceum) and two tetraploid species (G. hirsutum and G. barbadense) which originated in the new worldm. G. barbadense is the longest staple type and includes the Egyptian, American- Egyptian, Tanquis and Sea-Island varieties'16. G. hirsutum accounts for most American Upland type cottons while G . arboreum and G. herbaceum cottons. referred to as Asiatic cottons, are the short-staple types and are largely grown in India. China. Iran. Iraq, Turkey and RussiaIi6.
Typically the cotton plant appears about one week after planting the seed, the flower appears about nine weeks after planting and the boll opens some 18 weeks after planting. In general, about 160 frostless days are required to grow cotton successfully, with long-staple cotton requiring a longer growing season than short staple cotton. Frost, soon after planting, wiU kiU the young plant while if the frost occun before the boll has completed its growth, immature cotton will result. The conon seed will not germinate below a soil temperature of about lS°C while the optimum germination temperature is about 34'Cn. The optimum temperature for development from germinated cotton seed into the emergence of young plants is about WC. Frequent warm showers are helpful in maintaining adequate moisture for germination and the emergence of young plants and germination of the seed is also favoured by a high oxygen
content of the soil. Germination varies from about 7 to about 10 days depen- dhg upon the variety and environmental conditions. Under very favourable conditions the plant appears about four days after planting the seed, while if the weather is cold and wet it may take up to 14 daysls. If the weather is ex- tremely cold and wet the seed will not germinate. From four to six weeks after the emergence of the young plant, the young squares or floral buds usually appear. The four to six week period referred to above is characterised by the development and growth of stalk stems, leaves and root system. The bud is surrounded by three bracts or bracteoles (modified leaf), joined at their bases and often referred to as squareszl3. They form a "canopy" over the bud, pro- bably offering some protection to it and the subsequent young boUzI3. The development from the young squares to the open flowers is usually referred to as the blooming period. In general, the cotton flower will open about 21 days after the appearance of the young squares. For a typical American Upland cotton, the flower appears (anthesis) some 60 to 70 days after planting, the flower having a life of about one day. Fertilisation invariably occurs on the day of anthesis (flowering), mostly by self-pollination213. The fruit (boll) ripens within SO to 70 days after fertilisation, when the boll splits open and the cotton is ready for harvesting. The fruit is a dry dehiscent schizocarp of three, four or five loculi, each loculus containing about eight lint-bearing seeds (i.e. a total of about 30 seeds per boUp3.
An increase in water supply, up to a certain point, increases the growth of the cotton plant, thereby increasing the branches, both fruit and vegetable. which results in more buds and consequently more flowers. Excessive rainfall, however, promotes the growth of more vegetable branches. Moderate temperature and ample sunshine are necessary for the development of flower buds to open. The soil fertility determines to a large extent the earliness of flowering and the amount of flowering18.
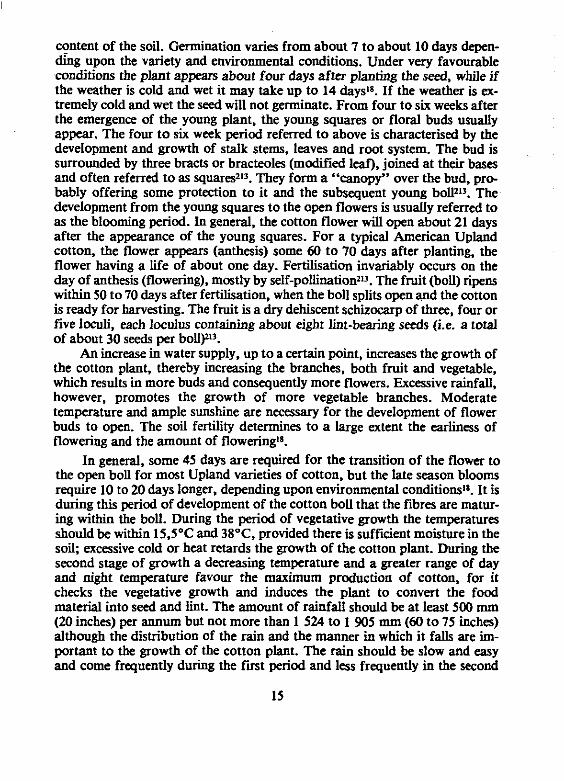
In general, some 45 days are required for the transition of the flower to the open boU for most Upland varieties of cotton, but the late season blooms require 10 to 20 days longer, depending upon environmental conditions". It is during this period of development of the cotton boll that the fibres are matur- ing within the boll. During the period of vegetative growth the temperatures should be within 15,S°C and 3S°C, provided there is sufficient moisture in the soil; excessive cold or heat retards the growth of the cotton plant. During the second stage of growth a decreasing temperature and a greater range of day and night temperature favour the maximum production of cotton, for it checks the vegetative growth and induces the plant to convert the food material into seed and h t . The amount of rainfall should be at least 500 mm (20 inches) per annum but not more than 1 524 to 1 905 mm (60 to 75 inches) although the distribution of the rain and the manner in which it falls are im- portant to the growth of the cotton plant. The rain should be slow and easy and come frequently during the fmt period and less frequently in the second
15
period. Cotton plants will grow in practically all types of soil. Abundant sun- shine during the lifetime of the cotton plant is necessary.18.
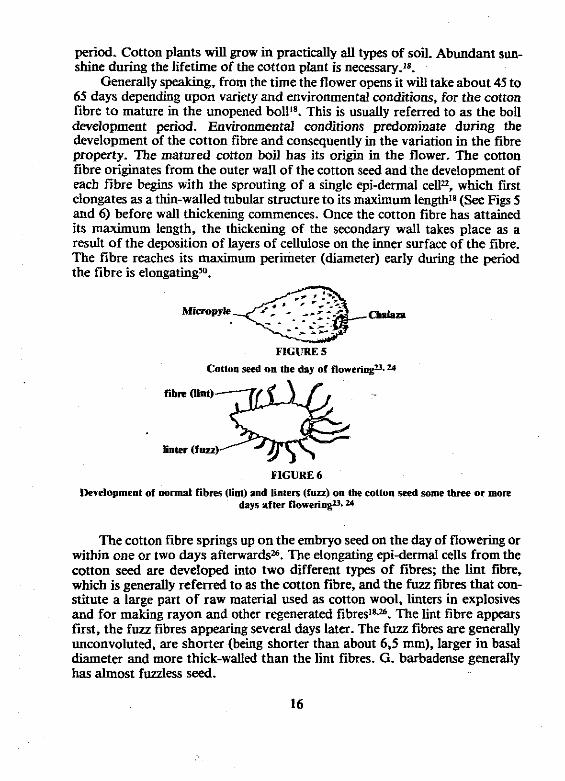
Generally speaking, from the time the flower opens it will take about 45 to 65 days depending upon variety and environmental conditions, for the cotton fibre to mature in the unopened boll18. This is usually referred to as the boll development period. Environmental conditions predominate during the development of the cotton fibre and consequently in the variation in the fibre property. The matured cotton boil has its origin in the flower. The cotton fibre originates from the outer wall of the cotton seed and the development of each fibre begins with the sprouting of a single epidermal cellz, which fust elongates as a thin-walled tubular structure to its maximum length's (See Figs 5 and 6) before wall thickening commences. Once the cotton fibre has attained its maximum length, the thickening of the secondary wall takes place as a result of the deposition of layers of cellulose on the inner surface of the fibre. The fibre reaches its maximum perimeter (&meter) early during the period the fibre is elongatings0.
FIGbXE 5
Cotton 4 on the day of floweringu. 24
FIGURE 6
Development of n o d fibm (lint) and linters ( fun) on the cotton seed some time or more days after floweringu. U
The cotton fibre springs up on the embryo seed on the day of flowering or within one or two days afterwards=. The elongating epi-dermal cells from the cotton seed are developed into two different types of fibres; the lint fibre. which is generally referred to as the cotton fibre, and the fuzz fibres that con- stitute a large part of raw material used as cotton wool, linters in explosives and for making rayon and other regenerated fibres1=. The lint fibre appears first, the fuzz fibres appearing several days later. The fuzz fibres are generally unconvoluted, are shorter (being shorter than about 6.5 mm), larger in basal diameter and more thick-walled than the l i t fibres. G. barbadense genaally has almost fuzzless seed.

Beginning on the day of flowering or very soon afterwards, each lint fibre, hereafter referred to as fibre, elongates for a period of 15 to 25 daysl8.ZS (Lord= mentions 21 to 28 days) depending upon the variety and environmental conditions, to attain its maximum lengthl8. The rate of elongation is small dur- ing the fust few days, increases for a few days, and then diminishes and gradually levels off. Long-staple cotton requires more time than short staple cotton for reaching its full length. Fibre length is predominantly a varietal characteristic under a given set of environmental conditions although en- vironmental factors do affect length development. Water stress will slow down the growth of the entire plant and consequently the rate of fibre elongationl8.
Staple Length can be reduced by as much as 3 mm by water stress occur- ring during the sixteen days after floweringm. In most countries, lint quality varies as the season progresses, the fibres often becoming weaker, shorter and less mature at the end of the season. Some varieties are better than others in this respect". When the fibre is fully elongated, it is tube-like in shape with the outside a thin membrane (primary wall) which is less than 0,5 pm thickt8. This membrane is known as the primary wall of the fibre in which protoplasm is contained. The tube-shaped fibre has a diameter which is relatively constant. Since the cotton fibre is fully elongated within the boll it does not extend in a straight h e but it bends back and forth at sharp angles. There are some 1 000 or more fibres on a single cotton seed26 and the length of fibre is from 1 000 to 3 000 times greater than its diameter depending upon the variety of cotton's. For the Asiatic cotton it is about 1 000, for the American Upland varieties it is about 2 000 and for the Sea Island variety it is about 3 000. This means the corresponding fibre diameters are roughly 25 pm, 14 pm and 12 pm, respec- tively. The cotton fibre hear density varies about 340 mtex for coarse Indian cottons t o about 100 mtex for St Vincent Sea Islandn.
After the period of elongation bas ended and the tube-shaped fibre has reached its maximum length, the development of the fibre enters into the phase of thickening of the secondary wall by depositing cellulose on the inner surface of .the tube-shaped fibre in successive layers". The thickening of the fibre's secondary wall takes about a month, ranging from 25 to 40 daysr8 (Lordz2 men- tions 35 to 50 days). During this process sugar, produced from water and carbon dioxide by action of sunlight on the plant leaves, is transported into the fibre. Here it is chemically converted into cellulose and deposited in successive layers (lamellae) on the inner wall surface, producing rings reminiscent of the annual rings found in treesls. A cross-section of the fibre viewed under the microscope reveals adjacent light and dark rings, each pair of rings represents a day's growth, the dense area is deposited at night as the result of active photosynthesis of cellulose during the day, and the less dense area during the day - there being little photosyntheses during the nightm. There would nor- mally be about 30 to 40 lamellae in a conon fibre regardless of fibre diameter. The so-called daily growth rings, or LameUae, are claimed to be analogous to
the annual growth rings observed in the cross-section of trees, but are deposited in the inverse order. The existence of lmellae in the secondary wall remains unquestioned, but confusion exists regarding the numba present. The observation that the number of lamellae in a fibre cross-section is dependent upon the cell-wall thickness of the fibre appears to be logical. Thus, thin- walled fibres and very fine matore fibres would have fewer lmellae than either thick-walled or coarse mature fibres. The actual diameter of the growing fibre and the degree of cell-wall development are largely inherited characteristics, but weather and soil environment also greatly influence the latteP. Some fibres die before they receive all the layers of cellulose they would otherwise have. Others, retarded in growth because of reduced moisture or food supply, are still underdeveloped at the end of the growing period. After growth ceases, in G 7 0 days after flowering, the boll dries outn.
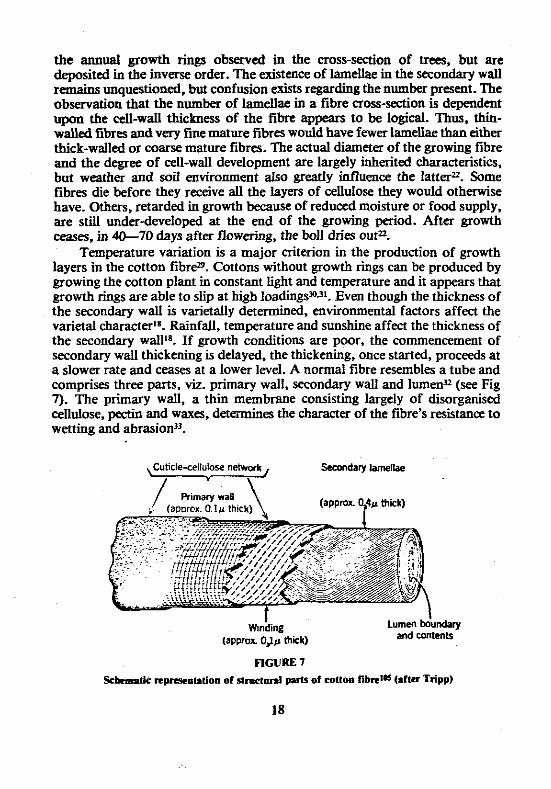
Temperature variation is a major criterion in the production of growth layers in the cotton fibre. Cottons without growth rings can be produced by growing the cotton plant in constant light and temperature and it appears that growth rings are able to slip at high loadings~~3'. Even though the thickness of the secondary wall is varietally determined, environmental factors affect the varietal characterm. Rainfall, temperature and sunshine affect the thickness of the secondary If growth conditions are poor, the commencement of secondary wall thickening is delayed, the thickening, once started, proceeds at a slower rate and ceases at a lower level. A n o d fibre resembles a tube and comorises three varts, viz. vrimarv wall, secondary wall and lumenJ2 (see Fig 7). The w i , a thin m&brse consisting largely of disor&misG cellulose, pectin and waxes, d-es the character of the fibre's resistance to wetting and abrasionJ3.
,Cuticle-cellulose Secondary iamellae
/ 1
Primary wall L falorox. OIu thick)
I Wmding
(appmx. O& thick)
I Lumen bourda~~
and untmtr
FIGURE 7
S C h m d i C mpm.111.tiom of itnrt.nl puts of cottoa fibre" (rftrr Mpp)
The tenacity of the primary wall of a cotton fibre is roughly 1100 cN/tex and that of the secondary wall 250 cN/texY.
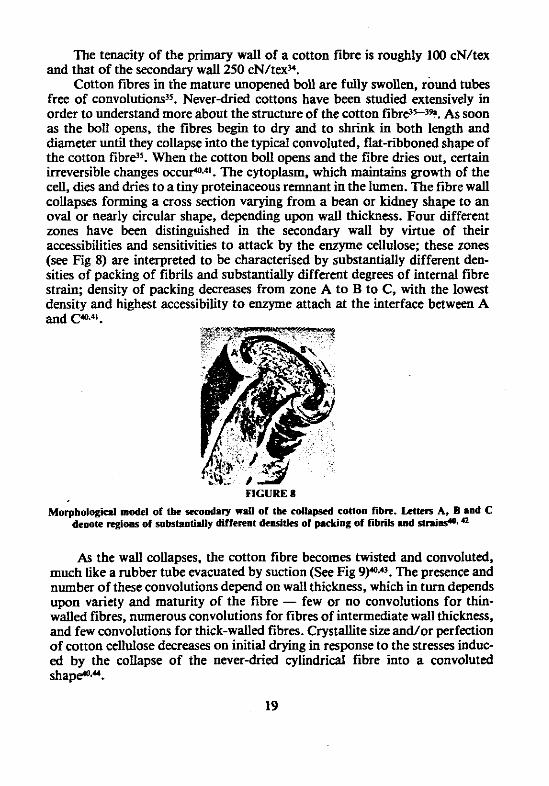
Cotton fibres in the mature unopened boll are fully swollen, round t u b s free of conv~lutions~~. Never-dried cottons have been studied extensively in order to understand more about the structure of the cotton fibre'S3a. As soon as the boll opens, the fibres begin to dry and to shrink in both Length and diameter until they collapse into the typical convoluted, flat-ribboned shape of the cotton fibreJ. When the cotton boll opens and the fibre dries out, certain irreversible changes occuPcl. The cytoplasm, which maintains growth of the cell, dies and dries to a tiny proteinaceous remnant in the lumen. The fibre wall collapses forming a cross section varying from a bean or kidney shape to an oval or nearly circular shape, depending upon wall thickness. Four different zones have been distinguished in the secondary wall by virtue of their accessibilities and sensitivities to attack by the enzyme cellulose; these zones (see Fig 8) are interpreted to be characterised by substantially different den- sities of oackine of fibrils and substantiallv different deerees of internal fibre strain, dksity of packing decreases from>one A to B i o C, with the lowest density and highest accessibility to enzyme attach at the interface between A
FIGURE 8
Morpbologial model of tsc secomdm7 rdl of tbe collapsed cottoa fibre. Letters A, B m d C denote mgions of ~ o b s ~ ~ l y diffemmt densities of packing of fibrils and smi6.4
As the wall collapses, the cotton fibre becomes twisted and convoluted, much like a rubber tube evacuated by suction (See Fig 9)"'.43. The presence and number of these convolutions depend on wall thickness, which in turn depends upon variety and maturity of the fibre - few or no convolutions for thiin- walled fibres, numerous convolutions for fibres of intermediate wall thickness. and few convolutions for thick-walled fibres. Crystallite size and/or perfection of cotton cellulose decreases on initial drying in response to the stresses induc- ed by the collapse of the never-dried cylindrical fibre into a convoluted s h a e U .

Portion of a collapsed, convoluted cotton f i b d 0 . 0
Undried fibre cylindrical
Fibrillar reversal
Spiral angle of fibrils
Dried fibre flattened tube with convolutions
reversal Convolution ....-..-
FIGURE 10
Fibre maturity (wall thickness) varies greatly from fibre to fibre within a boll (Lord) and is the main factor responsible for variations in fibre linear den- sity. Fibre properties also vary according to where it grows on the seed.
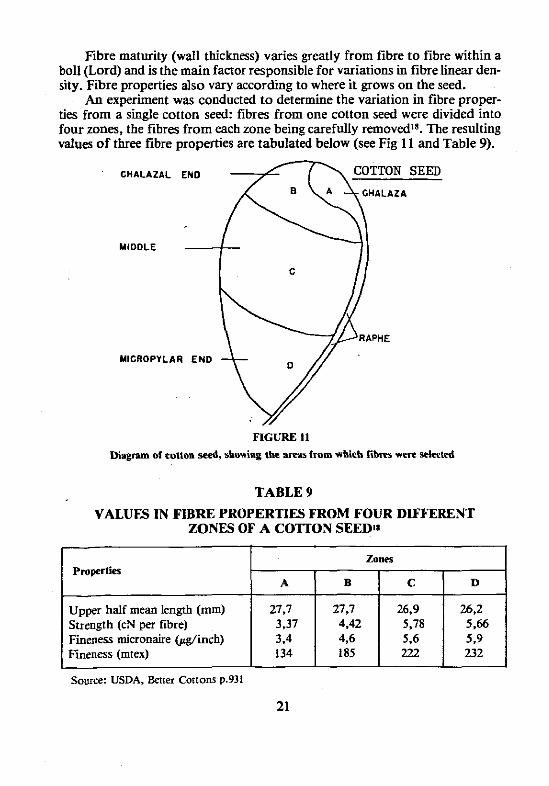
An experiment was conducted to determine the variation in fibre proper- ties from a single cotton seed: fibres from one cotton seed were divided into four zones, the fibres from each zone being carefully rem~ved'~. The resulting values of three fibre properties are tabulated below (see Fig 11 and Table 9).
UICROPVLAR END -& - //
FIGURE 11
Diagnm of cotton d, shoxing iht uers from wbich CIbm rere selected
TABLE 9
VALUES IN FIBRE PROPERTIES FROM FOUR DIFFERENT ZONES OF A COmON SEED18
propcrties
Upper half mean length (mm) Strength (cN per fibre) Fineness micronaire (&inch) Fineness (mtex)
Source: USDA. Better Cottons p.931
Zones
A
27.7 3.37 3,4 134
B
27.7 4.42 4.6 185
C
26.9 5.78 5.6 222
D
26.2 5.66 5.9 232
Tests have revealed that short fibres on a seed are more mature than long fibres. The longest fibres attached to a seed are at the chalazal end and the shoaest at the narrow or micropylar end. The thickest part of a fibre is towards its middle. Within a cotton sample the single fibre tenacity reaches a maximum at a h e a r density" close to the average for the samplfl. Wall thickness and linear density are highly correlated for mature cottons.
The distinguishing feature of the cotton fibre tip is the absence of both lumen and convolutions'6. It is normally a tapered rod-like end. All cotton fibres taper towards the growth enda and the cuticle is continuous around an undamaged fibre tip. The cuticle is also continuous around the base but it is ruptured when the fibre is pulled away. The fibre diameter also becomes smaller at the base but not to the same extent as at the tip4.
Perimeter of fibres from the raphe part of seed tend to be smaller than that of fibres from adjacent portions of the same general area49. The maximum fibre perimeter is reached very early on in the fibre elongation processg.
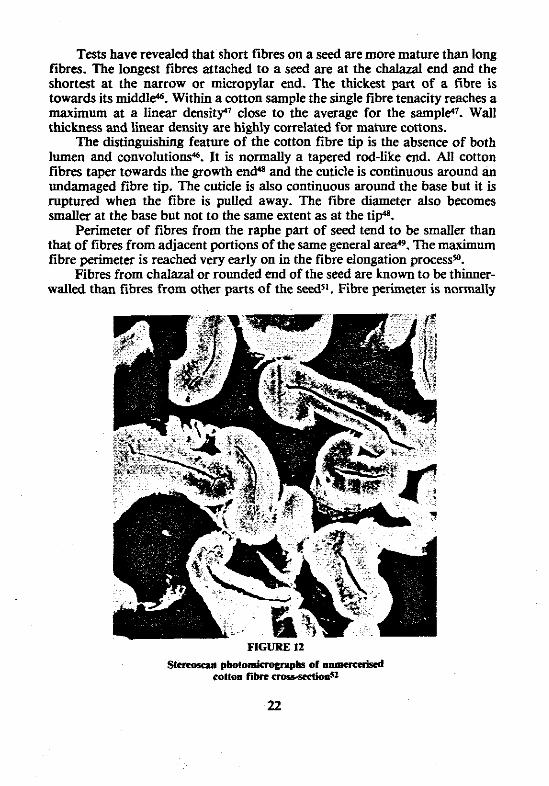
Fibres from chalazal or rounded end of the seed are known to be thinner- walled than fibres from other parts of the seeds'. Fibre perimeter is normally
FIGURE 12
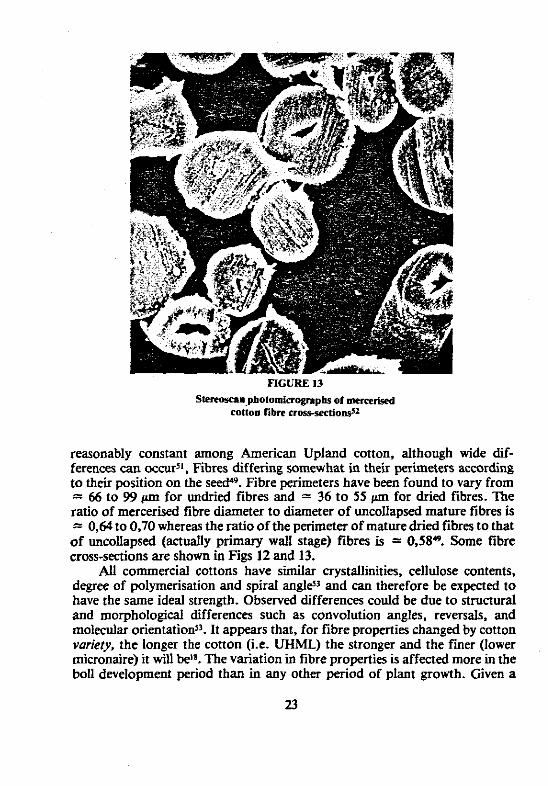
FIGURE 13 Stemwan.pbotomiaognphs of m-riscd
cotton fibre crms-sectiofl
reasonably constant among American Upland cotton, although wide dif- ferences can occurJl, Fibres differing somewhat in their perimeters according to their position on the seeda9. Fibre perimeters have been found to vary from = 66 to 99 pm for undried fibres and = 36 to 55 pm for dried fibres. The ratio of mercerised fibre diameter to diameter of uncollapsed mature fibres is = 0,64 to 0,70 whereas the ratio of the perimeter of mature dried fibres to that of uncollapsed (actually primary wall stage) fibres is = 0,58.9 Some fibre cross-sections are shown in Figs 12 and 13.
All commercial cottons have similar crystallinities, cellulose contents, degree of polymerisation and spiral angle3 and can therefore be expected to have the same ideal strength. Observed differences could be due to structural and morphological differences such as convolution angles, reversals, and molecular orientationJ3. It appears that, for fibre properties changed by cotton variety, the longer the cotton (i.e. UHML) the stronger and the fmer (lower micronaire) it will be". The variation in fibre properties is affected more in the boll development period than in any other period of plant growth. Given a
23
variety of cotton planted in a certain type of soil, the variation in fibre proper- ties can be explained to a large extent through the variation in rainfall and temperaturela.
For a long time, cotton breeders have recognised an adverse genetic association between lint yield and fibre strengthm*, they being inversely pro- portional to each others4. Nevertheless, six breeding lines that deviate significantly from this relationship have been developed. Moreover, certain other properties are often genetically linked: good fibre length is associated with low ginning out-turn and vice versa, i.e. short staple means high fibre percentage*. This state of affairs 5 all too familiar, both with Egyptian and Asiatic cottons. In American cotton, which accounts for 85% of the world crop, every intermediate stage can be found4.
By crossing various species and varieties and by selection, the breeder at- tempts to arrive at the best genetic combination - good ginning outturn, good fibre length and high yield4. The general endeavour is to breed a fine but very mature fibre. Already it is known that in OE spinning a cotton with low micronaire value perfoms better. Very often, however, these fibres are unripe, and present difficulties in dyeing".
The yield of a cotton variety is a genetic characteristic. There are strains that thrive in dry, light and poor soils, while other improved varieties yield good crops only if all the conditions are right - such as soil, climate, mineral fertilization and comprehensive pest control, etc. Naturally such varieties can- not be cultivated everywhere*. It is the breeder's function to find out which species or varieties are best suited for a given environment. Apart from the crop yield there are other properties that must be taken into account, such as: - the response to fertilizers, with or without pest control; - the r~is tance to various diseases and pests; - the suitability of the plants for mechanical picking".
Growing area and conditions have a very significant effect on cotton fibre properties. As an example, a US variety giving 85 000 psi in the Mississippi region gives only 70 000 psi in Nicaragua, and 75 000 in Chad, and this result is repeated every ye&.
Micronaire and fibre perimeter both depend upon varietys5 and within a cotton variety maturity and fineness are correlateds6. Within a variety longer fibra are finer" and strongern. Long fine cottons are stronger than short coarse ones in spite of the former having more convolutions and structural reversalsss.J9. Longer cotton groups within a cotton sample are also more uniform in strength than the shorter groupsm. Cotton fibre fmeness, length and strength tend to vary togethers7. For various cotton cultivars, within a cot- ton, fibre stiffness, fibre strength, strength uniformity, maturity and reversals per unjt length increase as the fibre length group increases, while elongation per unit load decreasesm. It appears that both the longer and shorter cottons are generally finer than the medium length cottons (within a cotton sample)
with the longer fibres the fmestS7.6', although there is still some doubt about thisa.
F'IBRE STRUCIURE The structural elements of the cotton fibre are (1) primary wall; (2) secon-
' dary wall and (3) lumen. The outside of the fibre is covered with a thin layer of wax, pectic material and encrusting material presumed to be calcium and magnesium salts of pectic acid.
Primary Wall The cotton hair consists of a thin membrane-like primary wall composed
mainly of cellulose but containing some pectins, fats and waxesm. Some workers differentiate between the cuticle and the primary wall,
whereas others consider these to be the same3. The primary wall of the cotton fibre results from the extension of certain epidermal ceUs of the developing cotton seed. It reaches its maximum length about 20 days after the cotton
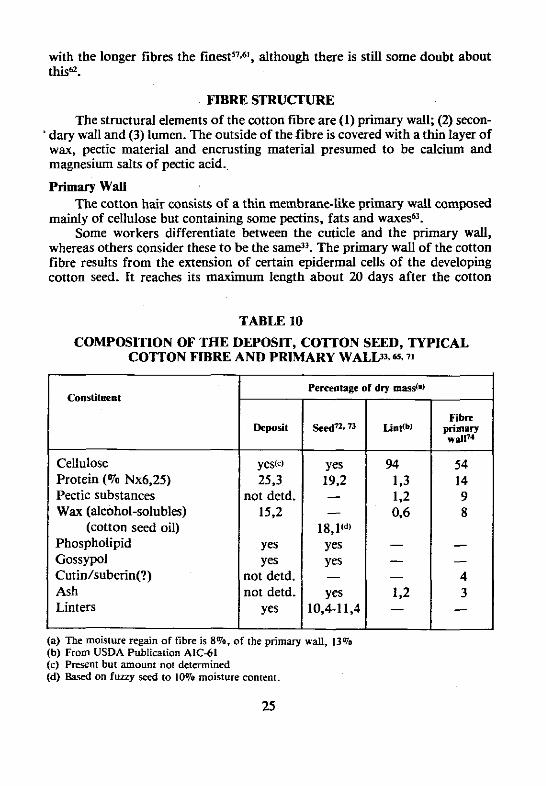
TABLE 10
COMPOSITION OF THE DEPOSIT, COTTON SEED, TYPICAL COTTON FIBRE AND PRLMARY WALL-',. f6.n
Cellulose Protein (% Nx6,25) Pectic substances Wax (alcohol-solubles)
(cotton seed oil) Phospholipid Gossypol Cutin/suberin(?) Ash Linters
Deposit
yew 25,3
not detd. 15,2
Yes Yes
not detd. not detd.
yes
Perceolagc of dry mad* - Fibre
ptimnry wall7' -
54 14 9 8
- - 4 3 - -
(a) The moisture regain of fibre is 8%. of the primary wall, 13% (b) From USDA Publication AIC-61 (c) P e n t but amount not determined (d) Based on fuzzy seed to 10% moisture content.

flowers. From studies made on the outer limiting membrane of the fibre, the primary wall seems to be less than 0.2 pm thick (some quote 0,s pm) and to be made up of laminated microfibrils33@.". The fust layer is oriented in a direc- tion parallel to the fibre axis, whereas the second layer is oriented transversely". Underneath this is a primary winding, or wide bands of microfibrils about 0,l wn thick, which spiral around the fibreb7.=. Other workers have concluded that the cellulose in the primary wall is either random- ly arrangedm or that the fibrils Lie transverse to the fibre axisu. The cornposi- tion of the separated primary wall and that of the entire mature f ibre is shown in Table 10. The primary wall constitutes about 5% of the mass of the cotton fibre and consists = 50% celldose with protein, wax and pectic substances ormrring in lesser amount+. The majority of the cotton wax is P-t on or near the surface of the wtton fibres. Seeon& Wall
The secondary wall constitutes the greater part of the cotton fibre and is composed of lamellae consisting of dense, and porous or less dense, areasn. A lamella is deposited each day after the primary wall has reached its maximum elongationn. The secondary wall is composed of cellulose chain molecules tightly packed together to form elementary fibrils which can be clearly seen under an electron minoscope63. It appears that these elementary fibrils are very long, have a rectangular cross-section and the cellulose chains are arrang- ed that they run along the length of the microfibril with complete hydrogen bonding between the chains so that the only hydroxyl groups which are accessi- ble for chemical reactions are those at the surface of the microfibW.
The secondary wall of cotton fibres can be divided into three distinct zones that differ in their accessibility and reactivity". The concave part of the characteristic bean-shaped cotton fibre is more accessible and reactive than the convex part, with the highly curved ends the least accessible and reactive7' (see Fig 8). Thus cotton fibres have an asymmetrical or "bieral" structure as a result of variations in the packing density of their fibrillar or lamellar struc- ture. Mature fibres have relatively thick walls (3 to 4
Lower strength at (or just adjacent to) the reversals of the helix fibrillar structure has been observed for cottone0.
General Cotton fibres possess a highly porous structure and have been a p .
propriately classified as a "xerogel"~'. The lumen, which is the central hollow cavity within the fibre, is by far the largest single pore in cotton. Apart from the lumen, the cell wall of a cotton fibre contains pores which have sizes ranging from about 25 A upward to those in the submicroscopic range. The porosity of cotton decreases with increasing period of fibre growth, as in- dicated by a progressive decrease in the moisture wntent of fibres and also by a reduction in lumen extent*'. It is very difficult to remove all the moisture
from cotton. The difficulty of drying cellulose is illustrated by the observation that when it is kept in a closed vessel over phosphorous pentoxide for a long period of time, it retains up to 1% of its moisture, even when dried in an oven at 105°C. it still holds up to 0,5% of physicaUy bound water. Only by heating under vacuum can the moisture content be reduced to 0,4W9.
Cotton is cellulose which is a high molecular compounds2. Cotton fibres are complex structures consisting of cellulose macro molecules which are arranged in a certain order and do not completely occupy their geometrical volume8. The volume of voids in the dry fibre is estimated to be about 30 to 40%. The diameter of the different pores in dry cotton is 5 A and after swel- ling 20-40 A . This aspect is of great importance in studying the mechanism of dyeing and the reasons for bad dyeingss2.
Powerful swelling treatments, like mercerisation, and subsequent drying, substantially reduce the accessibility to Liquids which are unable to break hydrogen bonds, but increase accessibility to water and dyes . Steaming treatments, following tension mercerisation and drying, were shown to have a permanent effect on the cotton fibre structure, suggesting that crystallime fusion of fibrils occurreds3. The length of crystallites and less-ordered regions decreased on tension mercerisationa.
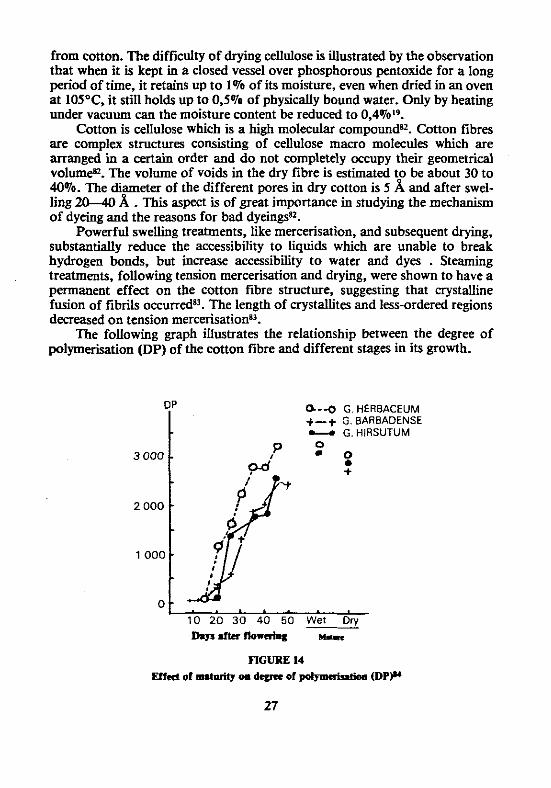
The following graph illustrates the relationship between the degree of polymerisation (DP) of the cotton fibre and different stages in its growth.
OP Q--0 G. HERBACEUM
3 000
1 000
0
10 20 30 40 50 Wet Dry mm.ttntlo~nhg MRI
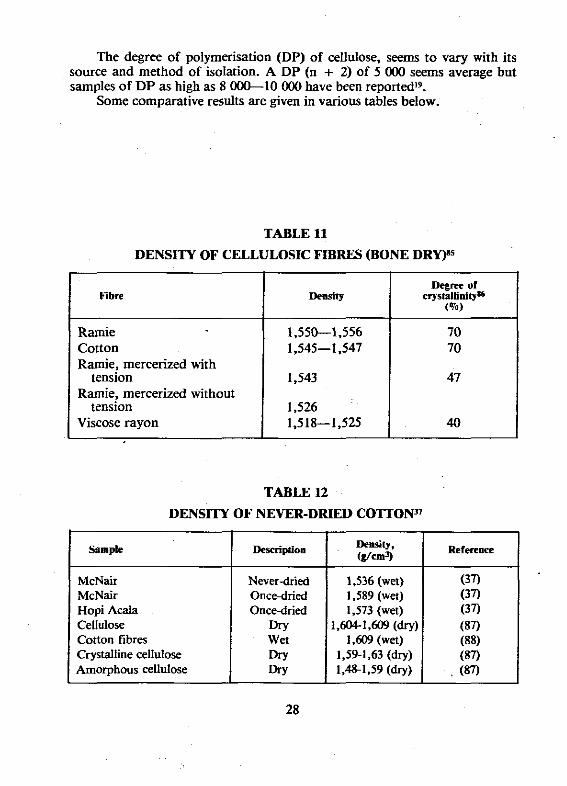
The degree of polymerisation (DP) of cellulose, seems to vary with its source and method of isolation. A DP (n + 2) of 5 000 seems average but samples of DP as high as 8 OCS-10 000 have been reportedE9.
Some comparative results are given in various tables below.
TABLE 11
DENSITY OF CELLULOSIC FIBRES (BONE DRYF5
Fibre
Ramie Conon Ramie, mercerized with
tension Ramie, mercerized without
tension Viscose rayon
TABLE 12
DENSITY OF NEVER-DRIED COTTONn
Smplc
McNair McNair Hopi Acala Cellulose Cotton fibres Crystalline cellulose Amorphous ceUulose
Refemom
(37) (37) (37) (87) (88) (87) (87)
Ikvriptiaa
Neverdried Oncedried Oncedried
Dry Wet Dry Dry
Demity. (d-9
1,536 (wet) 1,589 (wet) 1,573 (wet)
1,604-1,609 (dry) 1,609 (wet)
1.59-1.63 (dry) 1,4W59 (dry)
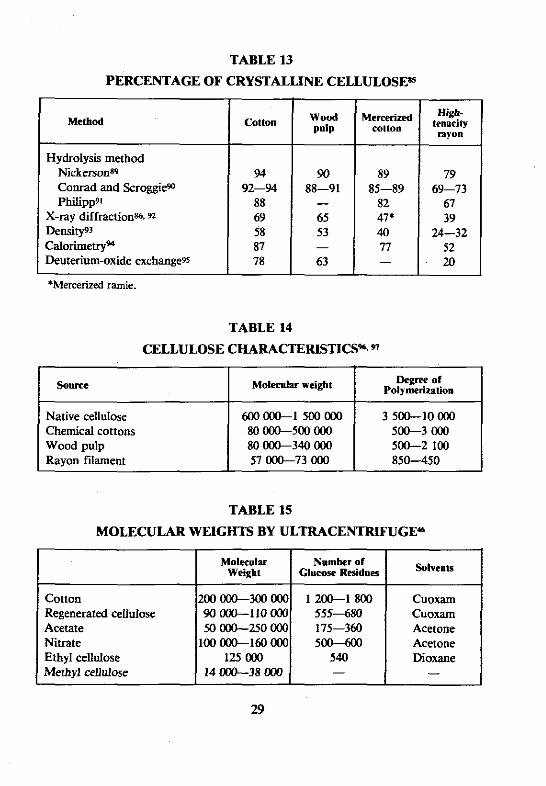
TABLE 13
PERCENTAGE OF CRYSTALLINE CELLULOSEs
Method
Hydrolysis method Nickersons9 Conrad and Scroggiew Philipp9l
X-ray diffractions. 92 Density93 Calo~irnetry~ Deuterium-oxide exchange95
'Mercerized ramie.
cotton
92-94 88-91 85-89
53 40 87 - n 78 63 -
High- tenacity myon
79 69-73
67 39
24-32 52 20
TABLE 15
MOLECULAR WEIGHTS BY ULTRACENTRIFUGEm
TABLE 14
CELLULOSE CHARACTERISTICS%."
I Molecolar Namber of Weicht I Glurmc Residues I I
S a w e
Native cellulose Chemical cottons Wood pulp Rayon ffiament
Cuoxam Cuoxam Acetone Acetone Dioxane -
Molecular weight
6 0 0 m L 1 5 0 0 0 0 0 80 000--500 000 80 -340 OW 57 -73 000
Cotton Regenerated cellulose Acetate Nitrate Ethyl cellulose Methyl cellulose
Degrpf 01 Polymeruatlon
3 500--10 000 5&3 000 5OLL-2 100 850-450
2 0 0 W e 3 0 0 0 0 0 90 m L 1 1 0 OW 50 -250 000
100mL160000 125 000
14 -38 000
12&1800 555-480 175-360 50a--600
540 -
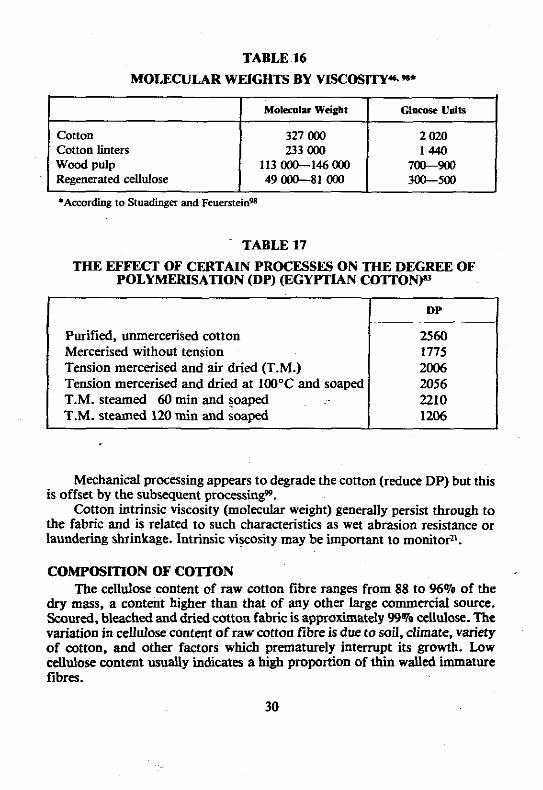
TABLE 16
MOLECULAR WEIGHTS BY VISCOSITY* **
TABLE 17
THE EFFECT OF CERTAIN PROCESSES ON THE DEGREE OF POLYhXERISATION (DP) (EGYPTIAN COR0N)w
Cotton Cotton linters wood P ~ P Regenerated cellulose
Purified, unmercerised cotton Mercerised without tension Tension mercerised and air dried (T.M.) Tension mercerised and dried at 100°C and soaped T.M. steamed 60 min and soaped T.M. steamed 120 min and soaped
Mechanical processing appears to degrade the cotton (reduce DP) but this is offset by the subsequent processing".
Cotton intrinsic viscosity (molecular weight) generally persist through to the fabric and is related to such characteristics as wet abrasion resistance or laundering shrinkage. Intrinsic viscosity may be important to monitorz'.
*According to Stuadinger and FeuersteiaW
327 000 233 000
113 -146 000 49 000--81 000
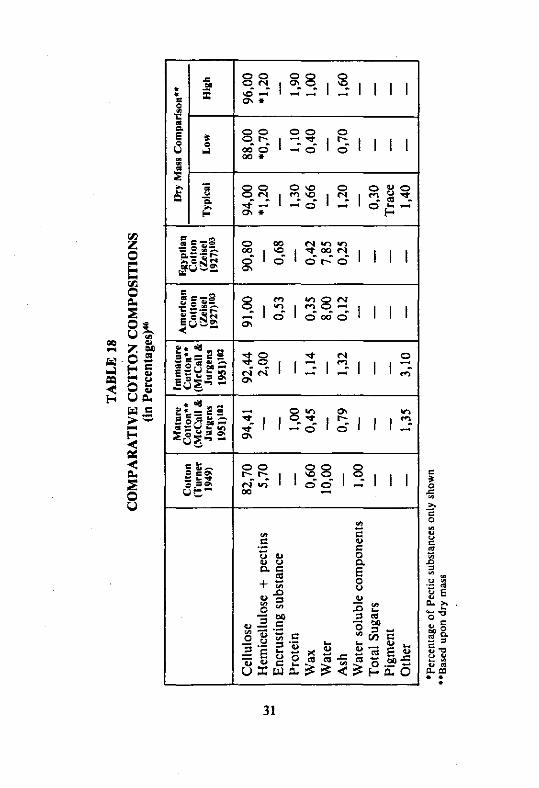
COMPOSITION OF COTTON The cellulose content of raw cotton fibre ranges from 88 to 96% of the
dry mass, a content higher than that of any other large commercial source. Scoured, bleached and dried cotton fabric is approximately 99% cellulose. The variation in cellulose content of raw cotton fibre is due to soil, climate, variety of conon, and other factors which prematurely interrupt its growth. Low cellulose content usually indicates a high proportion of thin walled immature fibres.
-- - -
2 020 1440
7OW-900 300--500
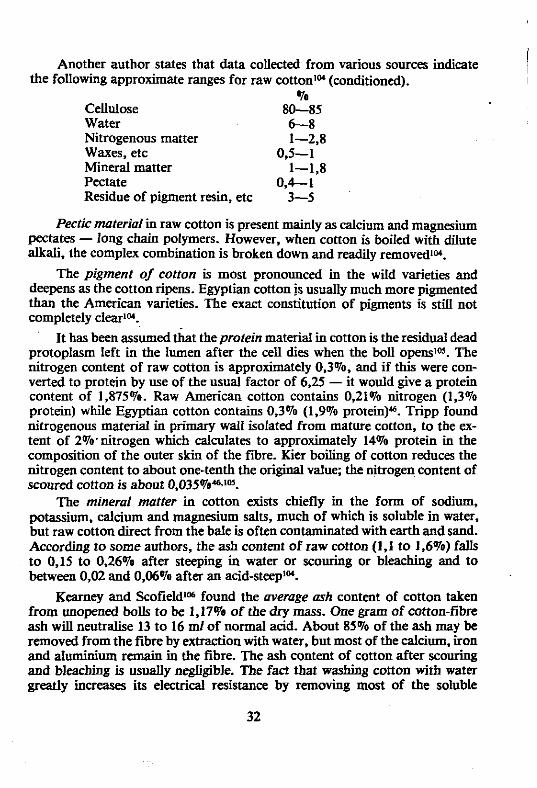
Another author states that data collected from various sourca indicate 1 the following approximate ranges for raw cottonlM (conditioned). I
"70 Cellulose 80-85 Water 6 8 Nitrogenous matter 1-2,s Waxes, etc 0,5-1 Mineral matter 1-1,8 Pectate 0,4--1 Residue of pigment resin, etc 3-5
Pectic material in raw cotton is present mainly as calcium and magnesium pectates - long chain polymers. However, when cotton is boiled with dilute alkali, the complex combination is broken down and readily removedl".
The pigment of cotton is most pronounced in the wild varieties and deepens as the cotton ripens. Egyptian cotton is usually much more pigmented than the American varieties. The exact constitution of pigments is still not completely clear'".
It has been assumed that theprotein material in cotton is the residual dead protoplasm left in the lumen after the cell dies when the boll openslm. The nitrogen content of raw cotton is approximately 0.3%, and if this were con- verted to protein by use of the usual factor of 6,25 - it would give a protein content of 1,875'70. Raw American cotton contains 0,21% nitrogen (1,3% protein) while Egyptian cotton contains 0,3% (1,9% proteiny. Tripp found nitrogenous material in primary wall isolated from mature cotton, to the ex- tent of Z%.nitrogen which calculates to approximately 14% protein in the composition of the outer skin of the fibre. Kier boiling of cotton reduces the nitrogen content to about one-tenth the original value; the nitrogen content of scoured cotton is about 0,035%*1M.
The mineral matter in cotton exists chiefly in the form of sodium, potassium, calcium and magnesium salts, much of which is soluble in water, but raw cotton direct from the bale is often contaminated with earth and sand. According to some authors, the ash content of raw cotton (I,] to 1,6%) falls to 0,15 to 0.26% after steeping in water or scouring or bleaching and to between 0,02 and 0,06% after an acid-steeplM.
Kearney and ScofieldlD6 found the uverage ash content of cotton taken from unopened bolls to be 1.17% of the dry mass. One gram of cotton-fibre ash will neutralise 13 to 16 ml of normal acid. About 85% of the ash may be removed from the fibre by extraction with water, but most of the calcium, iron and aluminium remain in the fibre. The ash content of cotton after scouring and bleaching b usually negligible. The fact that washing cotton with water greatly increases its electrical resistance by removing most of the soluble
potassium and sodium salts has made possible its adoption as a substitute for silk in tensile insulation of telephone cord, wire and cable.
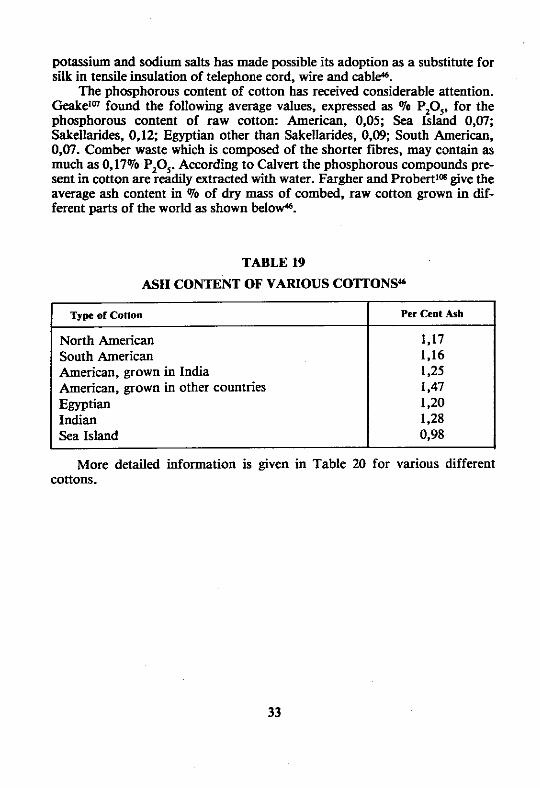
The phosphorous content of cotton has received considerable attention. Geakeim found the following average values, expressed as % P,O,, for the phosphorous content of raw cotton: American, 0.05; Sea Island 0,07; SakeUarides, 0,12; Egyptian other than Sakellarides, 0,09; South American, 0,07. Comber waste which is composed of the shorter fibres, may contain as much as 0,17% P20,. According to Calvert the phosphorous compounds pre- sent in cotton are readily extracted with water. Fargher and Probertlm give the average ash content in % of dry mass of combed, raw cotton grown in dif- ferent parts of the world as shown belo+.
TABLE 19
ASH CONTENT OF VARIOUS COTTONSa
I TYW of C oma I Per ~ c o l A& 1 North American South American American, grown in India American, grown in other countries Egyptian Indian Sea Island
More detailed information is given in Table 20 for various different cottons.

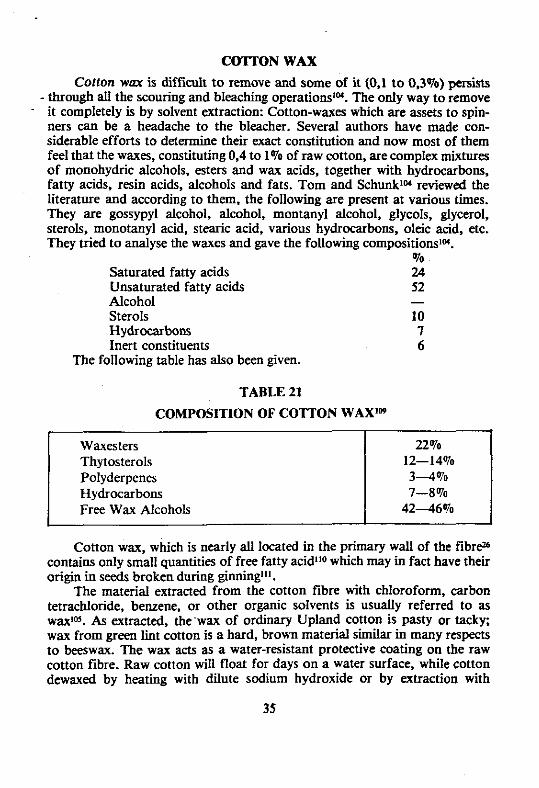
COTTON WAX Cotton wax is difficult t o remove and some of it (0,l t o 0,3%) persists
- through all the scouring and bleaching operationsIM. The only way to remove it completely is by solvent extraction: Cotton-waxes which are assets to spin- ners can be a headache to the bleacher. Several authors have made con- siderable efforts to determine their exact constitution and now most of them feel that the waxes, constituting 0.4 to 1% of raw cotton, are complex mixtures of monohydric alcohols, esters and wax acids, together with hydrocarbons, fatty acids, resin acids, alcohols and fats. Tom and SchunklM reviewed the literature and according to them, the following are present at various times. They are gossypyl alcohol, alcohol, montanyl alcohol, glycols, glycerol, sterols, monotanyl acid, stearic acid, various hydrocarbons, oleic acid, etc. They tried to analyse the waxes and gave the following compositions".
9'0
Saturated fatty acids 24 Unsaturated fatty acids 52 Alcohol - Sterols 10 Hydrocarbons 7 Inert constituents 6
The following table has also been given.
TABLE 21
COMPOSITION OF COTTON WAX""
Waxesters Thytosterols 12-14% Polyderpenes Hydrocarbons 7-8% Free Wax Alcohols 42--46%
Cotton wax, which is nearly all located in the primary wall of the fibre26 contains only small quantities of free fatty acid110 which may in fact have their origin in seeds broken during ginningI1l.
The material extracted from the cotton fibre with chloroform, carbon tetrachloride, benzene, or other organic solvents is usually referred to as waxlw. As extracted, the-wax of ordinary Upland cotton is pasty or tacky; wax from green S i t cotton is a hard, brown material similar in many respects to beeswax. The wax acts as a water-resistant protective coating on the raw cotton fibre. Raw cotton will float for days on a water surface, while cotton dewaxed by heating with dilute sodium hydroxide or by extraction with
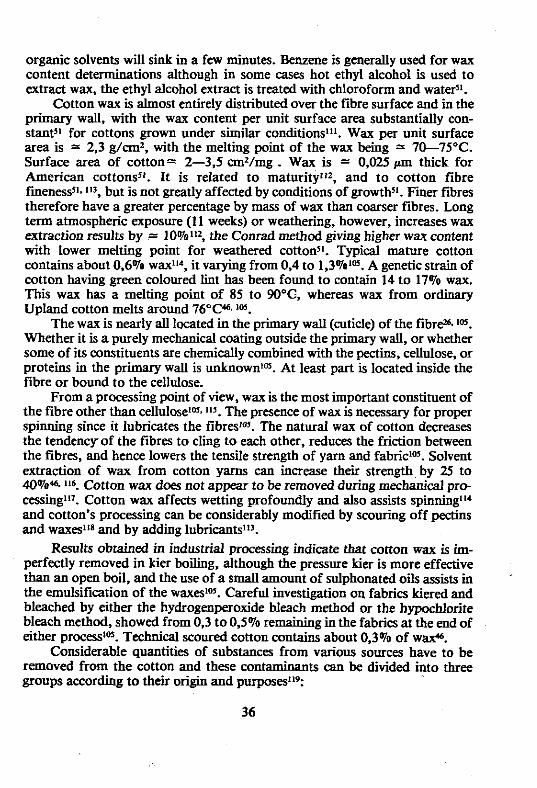
organic solvents will sink in a few minutes. Benzene is generally used for wax content determinations although in some cases hot ethyl alcohol is used to extract wax, the ethyl alcohol extract is treated with chloroform and waters].
Cotton wax is almost entirely distributed over the fibre surface and in the primary wall, with the wax content per unit surface area substantially con- stants] for cottons grown under similar conditionslll. Wax per unit surface area is = 2,3 g/cmz, with the melting point of the wax being = 70-75°C. Surface area of cotton- 2-3,5 an2/mg . Wax is = 0,025 p n thick for American cottons51. It is related to maturitylz, and to cotton fibre fineness51. g13, but is not greatly affected by conditions of growths1. Finer fibres therefore have a greater percentage by mass of wax than coarser fibres. Long term atmospheric exposure (11 weeks) or weathering, however, increases wax extraction results by = 1 0 % ~ ~ ~ , the Conrad method giving higher wax content with lower melting point for weathered cottons1. Typical mature cotton contains about 0,670 wax1]*, it varying from 0,4 to 1,3%Im. A genetic strain of cotton having green coloured lint has been found to contain 14 to 17% wax. This wax has a melting point of 85 to 90°C-, whereas wax from ordinary Upland cotton melts around 76"C4. lm.
The wax is nearly all located in the primary wall (cuticle) of the f i b r e Im.
Whether it is a purely mechanical coating outside the primary wall, or whether some of its constituents are chemically c o m b i i with the pectins, ceUulose, or proteins in the primary wall is unknownlM. At least part is located inside the fibre or bound to the cellulose.
From a processing point of view, wax is the most important constituent of the fibre other than ceUuloselm 115. The presence of wax is necessary for proper spinning since it lubricates the fibres]-. The natural wax of cotton decreases the tendencyof the fibres to cling to each other, reduces the friction between the fibres, and hence lowers the tensile strength of yarn and fabriclM. Solvent extraction of wax from cotton yams can increase their strength by 25 to 4070a. 116'. Cotton wax does not appear to be removed during mechanical pro- cessingl17. Cotton wax affects wetting profoundly and also assists spinningg1* and cotton's processing can be considerably modified by scouring off pectins and waxesIL8 and by adding lubricants113.
Results obtained in industrial processing indicate that cotton wax is im- perfectly removed in kier W i g , although the pressure kier is more effective than an open boil, and the use of a small amount of sulphonated oils assists in the emulsification of the waxeslM. Careful investigation on fabrics kiered and bleached by either the hydrogenperoxide bleach method or the hypochlorite bleach method, showed from 0.3 to 0,570 remaining in the fabrics at the end of either processzm. Technical scoured cotton contains about 0,3% of w e .
Considerable quantities of substances from various sources have to be removed from the cotton and these contaminants can be divided into three groups according to their origin and purposesll9:

A summary of the action of various solvents on the constituents of raw cotton is given belowa.
TABLE 22 FOREIGN SUBSTANCES TO BE REMOVED"'
Water (hor or cold)
Naturally occurring Sues Pretreatment chemicals
Ethyl alcohol 95 per cent (hot)
8-12% 10-15% 12-15%
30-42%
Chloroform. benren and other organic ralvenrr not mircibk wrh uater (hot)
Acids. 0.1 N ( 'dd) I- Ammonium citrale or oxalate (hot)
hydroxide (bailing)
--
Ash (84%) Palarrium salts Sodium salts Phosphacer Sugars
Pectin Cdaum rallr Iron salls Aluminium rail,
Wax I
TABLE 23
F COTTON WITH VARIOUS SOLVENTS6
4ntu. on the C"o,lsutn* "1 Wnr Cull""
Ma.. lux I * D ,
-
Protein Wax I Pectin .
2.5
0.6
Sugars Ash (25%)
I Ash
Protein Pnrin
Pectin sugars
Ash (90%) Protein (90%) Wax (69%) Pectin (KO%) Sugarr
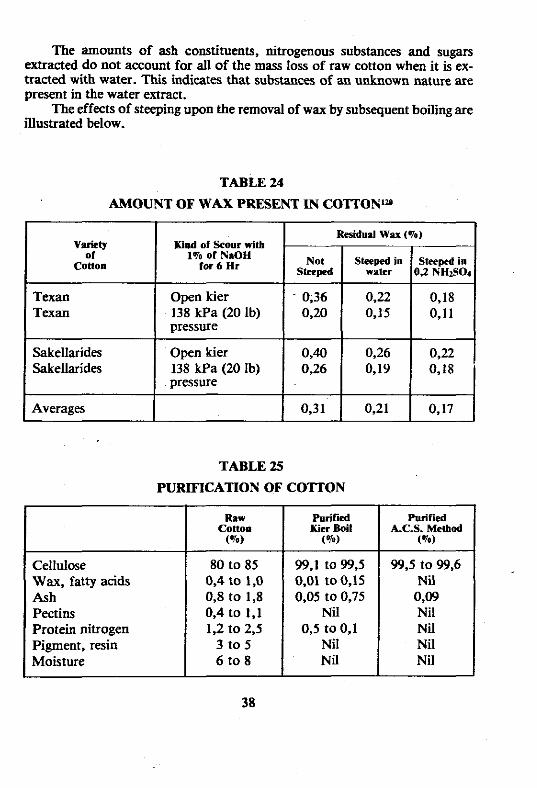
The amounts of ash constituents, nitrogenous substances and sugars extracted do not account for all of the mass loss of raw cotton when it is ex- tracted with water. This indicates that substances of an unknown nature are present in the water extract.
The effects of steeping upon the removal of wax by subsequent boilingare illustrated below.
TABLE 24
AMOUNT OF WAX PRESENT IN COITON'U
Variety of
Cotton
TABLE 25
PURIFlCATION OF COTTON
Rcridull Wnx (70) Kind of Scour with
1% of NaOH for 6 Hr
Texan Texan
SakeUarides Sakellarides
Averages
Open kier 138 kPa (20 Ib) pressure
Open kier 138 kPa (20 Ib) pressure
Cellulose Wax, fatty acids Ash Pectins Protein nitrogen Pigment, resin Moisture
- 0,36 0,20
0,40 0,26
0,31
80 to 85 0,4 to 1,O 0.8 to 1,s 0,4 to 1,1 1,2 to 2,5
3 to 5 6 to 8
0.22 0,15
0,26 0,19
0,21
99,1 to 99.5 0,01 to 0,15 0,05 to 0,75 Nil
0,5 to 0,1 Nil Nil
0-18 0,11
022 0,18
0.17
99,s to 99.6 Nil o m Nil Nil Nil Nil
WAX CONTENT %
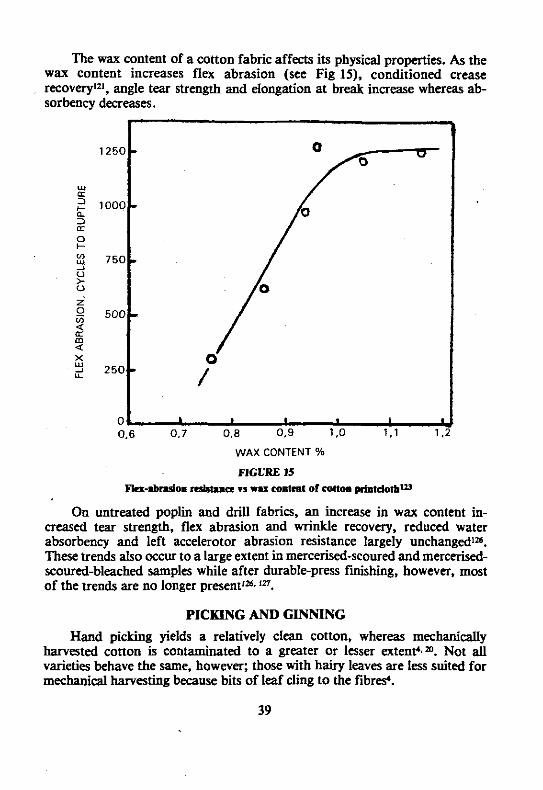
FIGURE 15 Ra-lbnsion metlnnr n w u cantrat of conom printdnIbm
The wax content of a cotton fabric affects its physical properties. As the wax content increases flex abrasion (see Fig lS), conditioned crease recovery121, angle tear strength and elongation at break increase whereas ab- sorbency decreases.
On untreated poplin and drill fabrics, an increase in wax content in- creased tear strength, flex abrasion and wrinkle recovery, reduced water absorbency and left accelerator abrasion resistance largely unchanged'". These trends also occur to a Large extent in mercerised-scoured and mercerised- scoured-bleached samples while after durable-press f&hing, however, most of the trends are no longer present'" In.
1250
u a = 1000 c 3 LT
0 + 2 7 5 0 2 u > 0
2 -0 5 0 0 0, u e m 4
2 5 0 L
0,
PICKING AND GINNING
Hand picking yields a relatively clean cotton, whereas mechanically harvested cotton is contaminated to a greater or lesser extent4.". Not all varieties behave the same, however; those with hairy leaves are less suited for mechanical harvesting because bits of leaf cling to the fibres*.
0.6 0 .7 0.8 0.9 1.0 1.1 1.2
-
-
- - - 0
/
h I 1 I
1
End breakage for hand picked cottons has been found to increase with in- creasing gin drying, whereas for machine-picked cotton there is a minimum. Yam grade and strength decreased with gin drying1". Hand-picked cotton generally processed better than machine picked cotton, with neps and end- breakage during spinning increasing with increased cleaning1". Ebre breaking in the gin, however, is closely associated with the drying and cleani~g'~8.
If the defoliation of the field prior to picking does not succeed properly, green leaves will be picked together with the cotton and green spots wilt ensue. The same will happen if certain weeds are left in the field1". Most mature fibres are obtained if defoliants are applied 35 to 41 days after peak of blooml~. For spindle picking, about 85% of the cotton bolls should be open. whereas for the stripper. 65% should be openI3'. For the former, defoliation is carried out about seven days before picking, whereas for stripper harvesting it is carried out about 15 days before harvestingl31. It has also been stated& that, for mechanical picking, about 70 to 80% of the cotton bolls should be open before defoliation.
Table 4 presents some information on the proportion of cotton which is under irrigation, machine picked and roller ginned, respectivelp. The indu- sion of green leaf in machine picked cotton adversely affects the colour of the lint and increases the moisture content leading to deterioration in storage, before ginningm. The use of dessicants and chemical defoliants reduces the amount of leaf incorporated in the seed cotton, but also leads to some loss of fibre length and strength. New smooth leaf varieties, in which the leaves are practically glabrous, improve matters since leaf fragments are more easily removed from the lint during cleaningm.
In addition to pre-cleaning equipment, lint cleaners are now extensively used at ginneries. These have their disadvantages and can cause fibre damage, particularly when poorly adjusted. Fragments of seed coat, consisting of a piece of the chalaza1 cap which had broken away during ginning, are virtually impossible to extract from the bulk of the raw cotton because of the tuft of fibres attached, and are generally incorporated into the yarns as a nep. Work has brought to light a correlation between the degree of fuzz on the seed of a variety and its proneness to produce seed-coat neps in the yarn. In commercial Upland varieties the seed is normally fuzed, but semi-fuzzed tufted and naked seeds occur, these being classed as "black". Usually reduced seed-coat fuzz is associated with a reduction in ginning percentage and may also lead to greater fibre coarseness and a reduction in strength. Negative correlations between cotton quality and yield have been reported for many cropsm.
Average cleaning efficiency of two stages of saw-cylinder lint cleaning is roughly 35% per cleaner unit, it being greatly affected by the initial foreign matter content of the cotton and the location of the cleaning unit in the sequence, the fmt Lint cleaner being more effi~ient"~.
Experiments have been conducted over a 4-year period to determine the
amount of conventional seed cotton cleaning machinery and number of lint cleaners required for machine-stripped cotton to achieve acceptable ginning performance, maximise producer returns and insure satisfactory end-use per- formance of lint'33. Seed cotton was processed through various combinations of cleaning-machinery sequences and was subjected to one, two and three stages of lint cleaning. The combined test data indicated that machine-stripped cotton can be satisfactorily cleaned with two extractors, two inclined cleaners, and an air-line cleanerl33.
At the gin, mechanically picked cotton receives a heavy beating both before and also after separation of the fibre1". Mechanically picked seed cotton generatly comes to the gin, containing more moisture than the hand picked cotton and has to be dried in order to enable proper cleaning'". Hot air is used for drying - the temperature of which may rise as high as 232'C (450°F) at the impact point of the air with the cotton. A great number of clean- ing cylinders beat the fibre to clean out trash. After fibre separation at the gin- stand, lint cleaners are used to get rid of some more of the foreign matter - which again means pretty rough handling of the fibre'". With mechanical picking, it is normal to wait until most of the bolls are open, generally between 70%--80V0, before the machine enters the field. It is not usual to carry out more than two pickings with the machine - due to economical considerations. Therefore, often some weeks may pass from the day the fust boll opens until the cotton is picked. Thus, humidity, rain or dust may cause colour deteriora- tion. The same is of course true when, due to labour shortage, "once-over" hand picking is donel".
If the cotton is picked too wet - over 12% moisture content - which may happen in the morning or late afternoon, and is stored for any period of time, it will result in spotted or yellow-stained fibre. Unlike the handpicked cotton, there is no way to dry it until it goes into the gin1".
Some blame the recent discovery of dust-related problems in textile manufacturing on modem harvesting and ginning methods, supposing that today's cotton as it comes from the gin is dustier than in decades past. To minimise the dust problem, many textile concerns have taken close looks at the gin. They thought that additional cleaning here would pay off with reduced dust levels at carding'%. But mill experience and research tests con- ducted on cotton produced from 1936 through 1971 indicate that additional gin cleaning with present technology and quality requirements may not provide the solution to textile mill dust problemslY.
According to a Clemson University studylY, if there was an increase in employee exposure to fine cotton dust particles in the past 20 years, the card and increased carding rates are mainly to blame. Further cotton cleaning at the gin is discouraged. Mechanical picking did not cause greater generation of wastelY. According to the study, of a l l the machines that rank near the top in liberating dust in cotton textile manufacturing, the card is a leading culprit.
The card is responsible for removing fme non-lint materials from the fibres. and it is difficult to keep some of these materials from getting into the airiY. This, however, no longer applies to modem cards which are totally enclosed and have dust extraction systems.
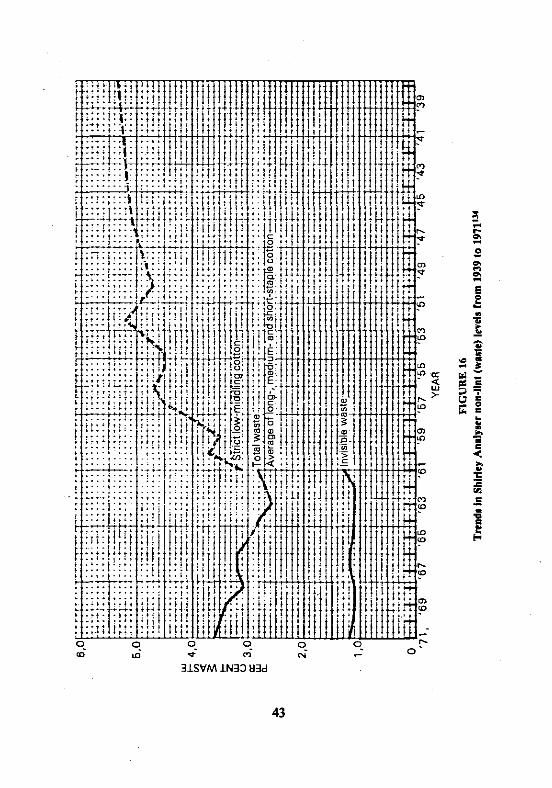
Fig 16 compares the average per cent non-lint content of the cottons produced by the United States gins during past decades. (Content was measured by tests conducted by the USDA Agricultural Marketing Service, u t i l i i g a Shirley Analyser.) Both the visible waste (waste collected by the anaIyser) and the invisible waste (predominantly smaller particles) are shown, and several important conclusions can he reached'%: 1. The advent of mechanical picking in the 1950's did not result in increased
waste generation, a fallacy that has long prevailed. In reality, a dramatic reduction in waste percentage can be tied in with the almost blanket turn to mechanical picking in the early 1950's, together with improved cleaning at the gin.
2. Further cleaning of cotton at the gin with present technology is not only possible, but practical. However, the steady decline of waste levels from 1955 through 1961 brought about dire results.
For one, overworking of cotton at the gin to achieve these low levels of waste resulted in damaged cotton fibres and a dangerous increase in neps at the card. And this drastic reduction of quality in subsequent processes came at the same time that the nation's consumers were developing a heretofore unknown quality consciousness. The result was so negative that USDA, Universities and textile makers initiated studies to determine limits of gin cleaning that would not he detrimental to quality production. The conclusions of these studies led to the stabihed non-lint content shown on the chart for the period 1%1 through 19711%.
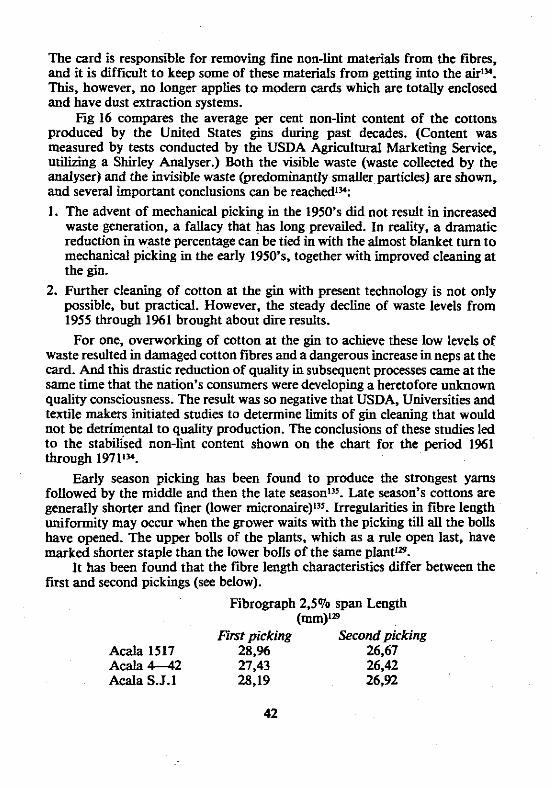
Early season picking has been found to produce the strongest yarns followed by the middle and then the late seasonnJ. Late season's cottons are generally shorter and fmer (lower micronaire)l35. Irregularities in fibre length uniformity may occur when the grower waits with the picking till all the bolls have opened. The upper bolls of the plants, which as a rule open last, have marked shorter staple than the lower bolls of the same plant'lg.
It has been found that the fibre length characteristics differ between the first and second pickings (see below).
Fibrograph 2.5'70 span Length (mm)'=
First picking Second picking Acala 1517 28.% 26,67 Acala 4--42 27,43 26,42 Acala S.J.1 28,19 26,92

The picking and ginning process has no influence on the fmeness of the fibre, but if defoliation is applied too early, some of the bolls (especially the upper ones) will open prematurely, causing immaturitylW.
Just as with the staple length, micronaire uniformity may become ir- regular when using the "once over" picking method. Here are some figures which were derived from the same test as abovelw:
Micronaire Values First picking Second picking
Acala 1517 3,7 2,7 Acala 4-42 4 2 3,4 Acala S.J.1 42 3,3
Spindle twists are tangled masses of fibre - twisted by the spindles of the picker resulting from faulty adjustment of the machine. Unfortunately these spindle twists occur quite frequently although they could be entirely prevented if the machine is adjusted properly. The gin cannot eliminate the twists. They get into the bale and may become quite a nuisance to the machinery at the mill1 w.
It has been proved that the mechanical harvest and the gin may substan- tially add to the amount of neps. Table 26 shows the cumulative effect of dif- ferent steps during the ginning process. These results, are representative of this specific trial only. Quite different figures may result from modified ginning processes or different seed cotton sources1w. (See Table 26.)
TABLE 26
CUMULATIVE EFFECI OF DWFERENT STEPS DURING THE GINNING PROCESS-
Seed cotton from Trailer Seed cotton after drying
and cleaning Lint prior to lint cleaning Lint after gentle lint
cleaning Lint after normal lint
cleaning Lint after double lint
cleanine

In practice ginning is performed with two different types of machine': - roller gins and saw gins. The roller gin is used in many countries for ginning long-staple cotton. Small versions of it are employed in research stations for ginning small sample.
The saw gin is used in most countries for ginning medium and short-staple cottons. Depending on whicb of these two machines is used, the same cotton will yield fibres of different length with different length distribution. The roller gin seizes the fibres and separates them from the seeds much more gently than the saw gin. Consequently roller-ginned cotton is always 1/16" (1,s mm) or so longer, and its uniformity 2 to 3% better than that of saw-ginned cottoe. Nevertheless, the fibre length is influenced by other factors too. Delays in picking, adverse climatic conditions, above all dry air, strong sun- shine and dew may modify the fibres or even damage them. Mechanised harvesting has no effect on the fibre length but cleaning and ginning the seed cotton may impair the quality of the fibres under certain circumstances, especially the staple length4.
Often the ginning operation is followed by a so-called lint cleaner. This machine shortens the fibre by about 0,s mm and causes additional neps if the fibres are very dry, very fine or immature".
The ginning percentage obtained by roUer ginning is about 1% higher than that obtained by saw ginning1%. The main advantage of the saw gin is its high productive rate and more uniform and clean lint whicb is obtained. At the same power consumption, the saw gin gives a higher rate of production than either single or double-roller gins, its labour requirements are also con- siderably lower. Saw gins are not suitable for ginning extra-long staple cottonsl%. Saw gins produce shorter fibres and more short fibres, more neps, lower Pressley values, lower micromire values (because the cotton is cleaned), lower trash, lower yeuowness and higher brightness (better colour) than roller ginsln. Nevertheless, the only differences in yam properties of any importance occurred in yarn appearance, where the roller gin had some advantage13'. Roller ginning produces only about half as many neps as saw ginning in some varieties of American cottonl3s although the saw-gin gives better fibre blending than a roller ginl39.
Today's gins, if operated correctly, do not create more short fibres than gins of 25 years ago. Fibre moisture content and the number of lint cleaning stages have a greater effect on short fibre content than do ginning rates or saw speed.+*. Fibre moisture content is the most important single gin- ning factor affecting the length characteristics of cotton and its subsequent manufacturing performance and yam quality141. The cotton should be neither too dry (leading to static or fibre damage) nor too wet (not easy to clean if wet)]". Excessive drying of cotton prior to ginning could cause a deterioration in spinning performanee'u although damp cotton should not be ginned1".

The recommended minimum moisture content of cotton prior to ginning is 5%lU although 6 to 8% is best1&.
Faulty adjustment of the drying equipment at the gin may cause smoke, colouring the cotton grey or blueish - this W i g mainly when oil fned burners are used. If too much heat for drying the cotton at the gin is applied, a marked shortening of the staple may occur and its uniformity impairedlm.
If the cotton lint is very carefully detached by hand from the seed (no breakage of fibres) it is found that the fibre length is remarkably uniform with a length approximately equal to the staple length as assessed subjectively. Gi- ning causes fibre breakage when the detachment force exceeds the fibre strengW. F i e and immature cotton fibres are therefore preferentially broken during ginningl". Generally, no whole fibres remain on the cotton seed after ginning. Lord4 found the mean fibre length of machine (roller) ginned cotton to be about 86% that of the hand detached fibres. Roller ginning causes a 1,5 to 3 mm reduction in mean fibre length. The short fibre tail of a cotton fibre length distribution contains an excess of broken immature fibres, possibly due to the weaker immature cottons breaking more readily during ginning, etc.O. It is claimed that the lengths of fibres removed from cotton seed are approx- imately normally distributed", but after the cotton has passed through the gin- ning process it has a bimodal distribution. This is due to the damage done by ginning machinery, especially when the cotton is dry.
Mature cotton seeds are usually very dry and hard and remain intact during ginning whereas immature seeds are quite soft and mushy and contain much moisture and could quite easily disintegrate upon mechanical treat- ment71. Avoiding immature cotton seeds or allowing them to dry should there- fore reduce problems during ginning, e.g. clogging of saw teeth7I.
Immature cotton bolls can create problems during ginning and when stripper harvesting, the immature cotton bolls are often ginned separately7'. Material collected on the inner surface of gin roll boxes after ginning immature cotton was found to be 25% protein and 8% lipid with the rest being fuzzy fibres, lint and seed-coat fragmenw.
DELINTING COlTON SEED
The development of a new pollution-free dilute sulphuric acid process for delinting cotton seed was reported in 1975145. The new process was cited for three major advantages: 1. It totally eliminates the hazardous water and land pollutant produced by
the conventional wet-acid method of delinting cotton seed. 2. It reduces by 98% the consumption of sulphuric acid used in delinting the
seed. 3. It cuts production space requirements by 70%.
In addition, the new method produces a saleable byproduct that can be

used for cattle feed or processed into glucose - and further processed into a commercial food-grade alcohol. It has been claimed that the new method eliminates the discharge of concentrated sulphuric effluent which is found in older delinting processes and therefore contributes to cleaner waterl's.
The old wet-acid method of delinting cotton seed dissolved the linters in a 93% solution of sulphuric acid. The acid-linter waste was pumped into a settling pond, creating a serious pollution problem to the water table and 1and145.
The following table compares yields of products when different methods are used for delintering of cotton seed1&.
TABLE 27
ESTIMATES OF COMPARATIVE YIELDS (in kg) OBTAINED
FROM 2 000 kg OF SEED1"
Saw delintering Abrasive delintering Hulling undelintered seed
41% meal 50% meal
Acid detintering with sulphuric acid
Acid delintering with gaseous HC1
Extracting whole seed
Oil
L .When protein in meal is not specified, 41% meal is the basis bDifference between these figures and 2 000 represents losses CHydrolyred linters plus ammonium sulphonate dHydro1yz.d linters plus ammonium chloride.
COTION GRADE
Conon grade provides an indication of the fibre colour and the waste content of the cotton. It is related to spinning waste"' and also to bleaching and dyeing properties'" but is particularly closely related to the cotton col- ourla. It also affects yam appearancele. IJ@.
Grade, as determined subjectively by the Classer, is characterised by the preparation. colour and trash content of the cotton. Cotton grading is an art and critically determines the ultimate market valueM1 of cotton. Cotton colour
(particularly that due to microbiological damage)l= and foreign contaminants (stem, leaf or dirt) greatly affect the Classer's assessment of grade. The grade of cotton is arrived at by the Grader who evaluates colour, leaf and prepara- tion in relation to the official standards1". Experience has shown the average relationship between picker and card waste and various grades of Upland cotton to be approximately as given in the tabulation shown in a subsequent section on manufacturing waste. In comparing these average grade figures with the picker and card waste data, it should be understood that variations from the averages for individual samples are attributable to the nature of the extraneous material present in the cotton, the characteristics of the fibre, and whether the grade designation was perhaps low because of poor colourl".
The total number of non-lint particles has been shown to be correlated with the grade151. I", although the partide distribution (according to size) is very similar for the various grades. The ratio of the total measured particulate area to the total surface area of the cotton .sample was found to be highly correlated with subjective assessment of non-lint levels152.
Coloor Fundamentally, there are four courses of colour in cotton, viz. dirt, fibre
geometry or morphology, intrinsic colour and extrinsic (environmental) colourl". In practice, at least five factors affect the colour of cottonIs3; (1) age- ing in storage; (2) immaturity from a freeze or other means that kills the fibres suddenly; (3) dirt or soil such as tar; (4) minerals, and (5) field damage associated with microbiological decay.
Dirt comprises dust, soil or trash residues1". The removal of dirt does not greatly affect reflectance, the effect being greater for the lower grades of cotton. Dirt is not responsible for colour differences after bleaching. Fibre geometry or morphology appears to have little effect on reflectance, studied by dissolving various cottons in H,SO,. Differences in colour after bleaching are mainly due to extrinsic colour differences as a result of fungi which flourish under the correct weather conditions1". Part of cotton colour is also due to carbohydrates and proteinaceous materials left in the residue of the proto- plasm when the fibres are suddenly killed by a freeze, insects or other causes1%. Colour is therefore related to fibre immaturity and low micronaire readings1%.
Cotton colour deteriorates upon storage155 with immature cottons yellow- ing faster than mature cottons'". Higher humidities increase colour change, it being best to store at approximately 50% RH1". Cotton can be stored for pro- longed periods (15-20 years) under controlled relatively dry indoor condi- tions with tittle or no change in either ACV or strengthln. Storage for shorter periods also appears to have tittle effect on spinning performance or yam tenacityls8.
It is recommended that cotton reaching the spinning mill should have a moisture content of no more than 870, as this is the figure at which bacteria cease to multiplyIsg.
48

Exposure to field weathering can greatly affect cotton fibre colour, thereby affecting the Classer's gradelm. Wetting and drying cycles are betiev- ed to have the greatest effect on the fibre colour. Thegreying or darkening of a cotton fibre can indicate the onset of microbial damage and greatly affects gradel61.1". Classer's assessment of trash is affected by the colour of the lintlsl. Colour can be measured by a calorimeter and reported in terms of greyness or yellownessla. A Nickerson-Hunter Calorimeter is commonly used for colour evaluation of cotton in terms of the reflectance and degree of yellownes~'~. Besides colour it also indicates extraneous material contentH5. Cotton from b o b which opened after frost may be yellow and if unpicked cotton remains in the field for a long time it becomes duller and darker in colourla. All cottons tend to turn yellow, particularly if stored under warm and wet conditions. The presence of sugar and protein materials may be responsible for this discolour- ation. Certain fungi grow on cotton, when they sporulate, the cotton turns grey or some other shade, depending upon the species1".
Cotton colour can be objectively measured in terms of reflectance and yellownessl51. Cotton bale samples are highly variable in colour and thorough blending (e.g. Shirley Analyser) is essential1" for reflectance measurements. Passing the cotton through a Shirley Analyser results in a slight decrease in 'colour' probably as a result of the removal of short fibres and trash3" and the difference in reflectance may be used as a measure of trash content1"- Elsewhere151 it is stated that trash does not always affect instrumental colour measurements in a consistent manner.
Colour is a property which has hitherto received little attention from breeders. It is known that there is a correlation between length and colour. The shoriest cottons are always whiter than the long-staple varietid.
With most cotton varieties grown the colour is not always constant. Shades are found from white to slightly yellowish, which are fvred genetically'.
In some varieties the colour is permanent, while other display a light creamy colour when the bolls opens, which however bleaches out under the actions of sunlight if harvesting does not take place within a few days after opening. If the weather is damp, the fibres may turn grey and lose their lustre'.
Under certain conditions the cotton may also turn yellowish during storage in pressed bales. Investigations are now being made to establish the proneness to yellowing of different cottons under identical storage conditions*.
Preparation (cbatacter) Cotton's "character" may be adversely affected by 'overheating' of the
cotton prior to ginning by 'over-cleaning', by severe cold, by insect infestation or by some other causesf15. The treatment the cotton gets during harvesting and ginning is reflected in its roughness or 'smoothness'l". Cotton ginned when 'wet' (i.e. without proper d l is usually cwfied as 'poor prepara- tion'. Badly ginned samples cause excessive waste in spinning and a deteric~

ration in yarn uniformity. Fibres in a properly ginned sample have a uniform appearance and are evenly distributed in the sample. Well ginned samples are comparatively free of trash'".
Trash Content Cotton usually becomes contaminated by leaf and trash due to exposure
in the field and the harvesting methods adoptedla. Trash consists of whole seed, grass, dust, etc. Trash content helps to determine the type of cleaning equipment to be used in the blowroom so as to obtain maximum spinning efficiency. The presence of an appreciable quantity of foreign matter causes greater waste losses during processing, lowers output and affects the quality of the product. The fine particles of trash also becomes the nucleus of neps during processingxa. Trash will be discussed in some detail later.
COlTON DAMAGE
When a cotton boll starts to open, it fust cracks then flares open within a few hours; the fibres will dry if sunlight is sufficient and the humidity is low enough". However, if the sky is overcast and the air humid, or the bolts are located in a damp environment (e.g. lower parts of the plant under the shelter of the leaves) microbial infection may take place at the cracking stage, and the moist fibre may be severely damaged1". Darkening or greying of cotton fibres results from humid preharvest weather and the colour change has been at- tributed'" to microbial action. Microbiological degradation of the cotton fibres starts with the digestion of the non-cellulose cuti~le'6~. Humid preharvest conditions also appear to increase the pH of the aqueous extract1". High pH values for the aqueous extract of cotton generally indicates a certain undesirable use-value of the cononlm, although a high pH does not necessarily signify damage168.Im. 171.
Arabitol and mannit01 contents of cotton may be useful as an index of biological damage1".
It has been observed that some cottons can be subject to deterioration of their fibre properties by the action of micro-organisms (fungi)IR or their metabolic product@. This alteration of fibre properties has been called "cavitoma" and the cotton exhibiting this condition "cavitomic cotton". In- creased fibre swelling in caustic soda and fibre breakage are most evident changes in such cottonsz. A method of determining the extent of cavitomic cot- ton is to measure the pH and reducing material content. A high pH together with a small amount of reducing material is associated with cavitoma. The colour change of a solution containing Gramercy Universal Indicator (Fisher Sci Co) and Santomerse S (Monsanto) after cotton has been passed through it has also been used for detecting cavitomic cottons2. Cavitoma damage causes excessive short fibres giving a sigacant reduction in spinning performance and yarn strengthln, although 25% of such cotton can be tolerated. Cavitomic
cotton is due to micro-organisms growing on the cotton under conditions of wet storage1". It shows tittle discolouration compared to the off-colour yellow-brown shades of the field damaged types (Cateye)'". "Cateye" cotton is due to cotton bolls that mature during lengthy periods of wet weather and suffering boll rot due to a fungus174. "Cateye" cotton has a doughnut shape rather than a kidney shape. It appears that when the cytoplasm dries in a cotton, tremendous surface-tension forces come into play causing the fibre to collapse into the characteristic ribbon. When, however, the lumen wall is damaged, as in "cateye" cotton, no such forces come into play and the fibre retains its circular shape174.
Marsh et UP. 161 found that cottons attacked by micro-organisms, either during humid preharvest weathering or during storage under humid conditions or an exposure to rain in outdoor storage, exhibit very high ACTS without being accompanied by any change in their Arealometer vaI~e .9~~. The ACV data ranged from 250 to 330 depending on the severity of the damage, as against an ACV of 190 for the undamaged cotton sample. The microbial damage has also been found to lead to considerable loss in the tensile strength of the fibre"'. 161.
Damage that occurs during ginning and processing of cotton gives rise to a significant increaseinits Congo Red value (3,6). However, the corresponding increase in its ACV is much lessI61. The ACV of yarn has been found to be approximately 12 units higher than that of the bale cottonl6I. This clearly in- dicates that a large increase in ACV arises mainly from microbial damage1".
Undamaged cotton exhibit a very low Congo Red value with the number of stained fibres usually about 1 Congo Red values have been found to in- crease greatly from 18% for ginned cotton to 70% at spinning176.
Increase in fluidity has been related to a decrease in strengthIn. Degradation of cotton is measured by the following testsq6:
Breaking or tensile strength. .
Cuprammonium viscosity or fluidity, a measure of average molecular chain length of the cellulose. Nitrate viscosity or fluidity. This test does not break alkali-labile oxygen linkaees Dresent in cellulose modified bv oxidisine agents. - . - - Copper number, a measure of aldehydic reducing groups present in a modified cellulose. Methylene blue absorption, usually considered to be a measure of acidic carboxyl groups present in modified cellulose. Alkali solubility, usually considered to be a measure of shortchain cellulose molecules.
The most accurate of these measures of deeradation is the viscositv or - fluidity in cuprammonium solution. An interpretation of its significance is given below in Table 28.

TABLE 28
VISCOSITY IN CUPRAMMONIUM SOLUTIONS"
6 ( 40or above 44Xl or above I
Very mildy scoured and bleached cottons. Normally scoured and bleached cottons Significant loss in strength due to processing. Overbleached, with serious loss in tensile strength. Incipient loss of fibrous structure due to chemical attack. Highly degraded by chemical attack to product described as oxy- and hydrocelluloses.
Fluidity under comparative conditions may be proportional to loss of strength but fluidities of a variety of products may not have any such deffite relationship.
Use of aids to detect mimbial damage" A pH indicator solution sprayed on raw stock (a solution of cresol red and
thymol blue,with distilled water) initiates a colour change, which if purplish in nature indicates that damage is present1".
To detect oil and immature fibre - UV light is used. Variation in the intensity of ultra-violet fluorescence of bales of cotton
could cause variations in dyeing of yarns, especially in pastel shade9. Cotton fibres can fluoresce (UV) differently because of ageing, light exposure, mildew attack1" or heat application. The water soluble substances and the waxes and resins of the conon fibres were not involved in the change in fluorescence with heating1=, even though the waxes and resins fluoresce themselves. Heating, therefore, changes the cotton itself and this changes the fluorescence. Immature fibres appeared to be more sensitive to heat degradation, heating in- creasing the cotton fibre bending stiffnessl".
The normal mechanical processing of cotton degrades the fibrelsl. Mechanical damage hardly changes ACV16I but significantly increases the Congo Red value. The latter also increases with increasing microbiological damage to the fibre161.
Weathering appears to affect coarse mature cottons less than fme immature cottons18z.'". Hence coarser cottons are to be preferred where
52
weathering is an important consideration1". In one case it was found that weathering hardly affected the cotton fibre properties although differences emerged after laundering18*. Elsewhere it is stated that weathering causes a decrease in cotton regain, dye absorption, Pressley strength and yarn strengthln. Improved light and weather resistance of cotton results from mercerisation186.
STICKY COTFONS
Sticky cottons annually cause significant production and quality losses in the cotton textile industries of certain countries. It may be caused by excessive quantities of mono-saccharides (sugars), mainly fructose and glucose, present on immature fibres1". Ig8 or by h~neydew~-~~~, a sugar-containing sap ex- creted from plant nectaries or from insects such as aphids and whiteflieslgz. Sticky cotton causes lapping at rollers and is a plague to spinners especially in the early pickings1". Cotton can cause lapping when the wax exceeds 0,6% and sugar 0,3%. Other causes of poor spinning are contamination by lubricants from harvesting or ginning machinery and immaturity. The latter is caused by a number of factors: short growing season, low night temperatures, drought, disease and time of harvest1". It is also believed3% that cotton-seed oil from seed-coat fragments and seed motes is related to stickiness problems in pro- cessing. Th: use of crush rollers at the card accentuates the problem.
Lapping or coating of rolls with wax and other materials is especially prevalent when very fme fibre (Micronaire 2 to 3) with a high sugar content is processed. This condition is particularly troublesome on card crush rolls. The fme fibres tend to follow the contour of the crush rolls and gum them up so that they lose their effecti~eness'~'. Much of this can be avoided by examining the cotton visually under ultra-violet (black) tight. A blue-white fluorescence indicates contamination from lubricating oils, yellow-orange means rust. greenish-yellow indicates fungi. A more sophisticated test, which must be carried out in a well-equipped laboratory, involves the use of infrared tight that pinpoints contamination from cottonseed oil and waxl".
The best way to cope with sticky cotton is to1": - open it early and store it as long as possible while it dries out and
blooms - blend extra well at opening with the maximum possible mix - avoid low micronaire cotton which often is immature - check cotton for seed fragments and reject before purchase to avoid
lap ups on crush rolls caused by cotton-seed oil - keep humidily as low aspmible at all processing operations, espeeial-
ly spinning. Low miaonaire or immature cotton fibres normally contain more sugar
than mature ones, sometimes going up to 0.8 to 0.9%. sugar content in cotton decreasing as the fibres m a t u ~ e ~ ~ . ~ " . The second picking of cotton, because it

normally has a lower mature fibre content, is suspect for being sticky'". In the Sudan, where only hand picking is done, stickiness was reported on the second picking1" and was found to be associated with the presence of honeydd. A recent studylm in America also revealed that stickiness in certain cottons was due to high sucrose and turanose levels, these being attributed to honeydew contamination from aphids and whiteflies.
The aphid is an insect which lives on the underside of the plant leaf, spends its whole life in one place, produces a new generation every five days, requires very small absolute quantities of foods high in protein, consumes huge quantities of plant sap high in sugars but tow in protein, and excretes large amounts of undigested sugar it does not need by spraying it as far as it possibly ean'". Thus, two well-known sources of sugar are honeydew from plant exudations and from aphid excretion1".
To detect sugar and honeydew, a cotton specimen is placed in distilled water, kneaded thoroughly, and the extract poured ofPm. Fifteen drops of the extract can be olaced in a test tube and a clinitest tablet fused bv diabetics in urine analysis)-added. The colour change is compared &th a c& supplied with tablets. Observations indicating cotton registering above 0,3% may be troublesome during processingln. More sophisticated test methods are given elsewhere'=.
FIBRE LENGTH CHARACXERJSTICS
From field to fabric, the length of the fibres is generally considered the most important physical property of cotton in both marketing and process- ingl%. The staple (of classer's) length has long been accepted as the best criterion of a cotton's spinning value1¶ and fibre length is also a principal determinant'of yarn strength and the fmest yarn which may be spun (see Part I1 of this series)'¶*. There is a worldwide trend to replace the subjective classer's staple length by objective measures of length characteristics (e.g. 2.5% span length).
Staple length is the length of a typical portion of the fibres in the samples as determined by the dasser in comparison with official standards198. Unifor- miry of fibre length, as well as other fibre properties, influence to some extent the classer's selection of the typical portion of the fibres on which the staple length designation is based. In general, there is a fairly close relationship between the staple length as designated by the classer and the fmeness and strength of the yarn that can be manufactured from the cotton. These relation- ships, however, are also influenced by other fibre properties1". The staple length corresponds very closely to the modal or most frequent length of the fibres when measured in a straightened condition1" w.
Seed cotton is remarkably uniform in lengW1. The upper half mean length, classer's staple length and upperquartile length all give values which approximate to the average length of the fibres on the seedml. They indicate
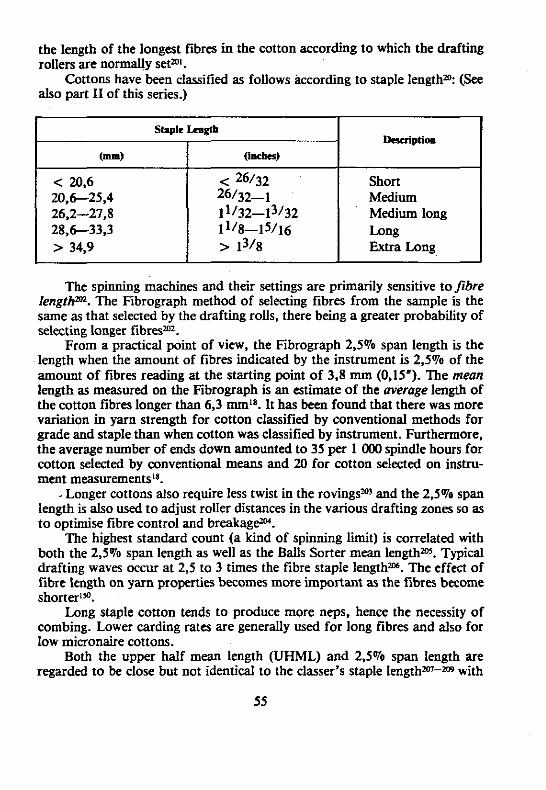
the length of the longest fibres in the cotton according to which the drafting rollers are n o d y setm1.
Cottons have been classified as follows according to staple lengthm: (See also part I1 of this series.)
Medium long
Extra Long
The spinning machines and their settings are primarily sensitive tofibre IengtNm. The Fibrograph method of selecting fibres from the sample is the same as that selected by the drafting rolls, there being a greater probability of selecting longer fibresm.
From a practical point of view, the Fibrograph 2,5% span length is the length when the amount of fibres indicated by the instrument is 2,5% of the amount of fibres reading at the starting point of 3.8 mm (0,15"). The mean length as measured on the Fibrograph is an estimate of the average length of the cotton fibres longer than 6,3 mmI8. It has been found that there was more variation in yarn strength for cotton classified by conventional methods for grade and staple than when cotton was classified by instrument. Furthermore, the average number of ends down amounted to 35 per 1 000 spindle hours for cotton selected by conventional means and 20 for cotton selected on instru- ment measurements18.
Longer cottons also require less twist in the rovingsZm and the 2,5% span length is also used to adjust roller distances in the various drafting zones so as to optimise fibre control and breakag*.
The highest standard count (a kind of spinning limit) is correlated with both the 2,5% span length as well as the Balls Sorter mean lengthm. Typical drafting waves occur at 2,5 to 3 times the fibre staple lengthm6. The effect of fibre length on yam properties becomes more important as the fibres become shorterl*.
Long staple cotton tends to produce more neps, hence the necessity of combing. Lower carding rates are generally used for long fibres and also for low micronaire cottons.
Both the upper half mean length (UHML) and 2,5% span length are regarded to be close but not identical to the classer's staple lengthzm-rns with
55
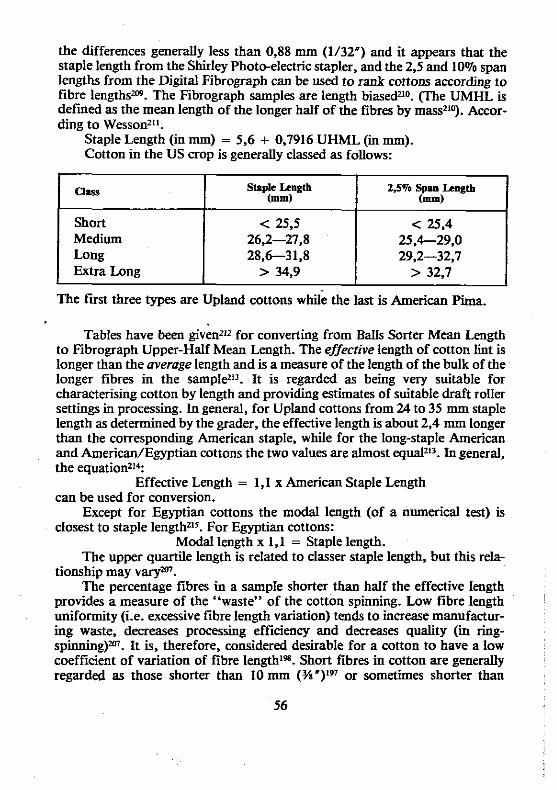
the differences generally less than 0,88 mm (1/32") and it appears that the staple length from the Shirley Photo-electric stapler, and the 2,s and 10% span length from the Digital Fibrograph can be used to rank cottons according to fibre lengths". The Fibrograph samples are length biasedZl0. (The UMHL is defmed as the mean length of the longer half of the fibres by masszi0). Accor- ding to Wessonzti.
Staple Length (in mm) = 5.6 + 0,7916 UHML (i mm). Cotton in the US crop is generally classed as fouows:
The fust three types are Upland cottons while the last is American Pima.
am
Short Medium LOW Extra Long
Tables have been given212 for converting from Balls Sorter Mean Length to Fibrograph Upper-Half Mean Length. The effective length of cotton l i t is longer than the average length and is a measure of the length of the hulk of the longer fibres in the sampleZi3. It is regarded as being very suitable for characterising cotton by length and providing estimates of suitable draft roller settings in processing. In general, for Upland cottons from 24 to 35 mm staple length as determined by the grader, the effective length Is about 2,4 mm longer than the corresponding American staple, while for the long-staple American and AmericadEgyptian cottons the two values are almost equalz". In general, the equationzi4:
Effective Length = l,l x American Staple Length can be used for conversion.
Except for Egyptian cottons the modal length (of a numerical test) is closest to staple lengthZls. For Egyptian cottons:
Modal length x 1,1 = Staple length. The upper quartile length is related to dasser staple length, but this rela-
tionship may varym. The percentage fibres in a sample shorter than half the effective length
provides a measure of the "waste" of the cotton spinning. Low fibre length uniformity (i.e. excessive fibre length variation) tends to increase manufaaur- ing waste, decreases processing efficiency and decreases quality (i ring- spinningy. It is, therefore, considered desirable for a cotton to have a low coefficient of variation of fibre lengthi". Short fibres in cotton are generally regarded as those shorter than 10 mm (3/s")lW or sometimes shorter than
Staple Length (tom)
< 25,s 26,2-27,8 28.6-313
> 34,9
2,570 spm h g t b (mm)
< 25.4 25.4--29,O 29,2--32,7
> 32,7
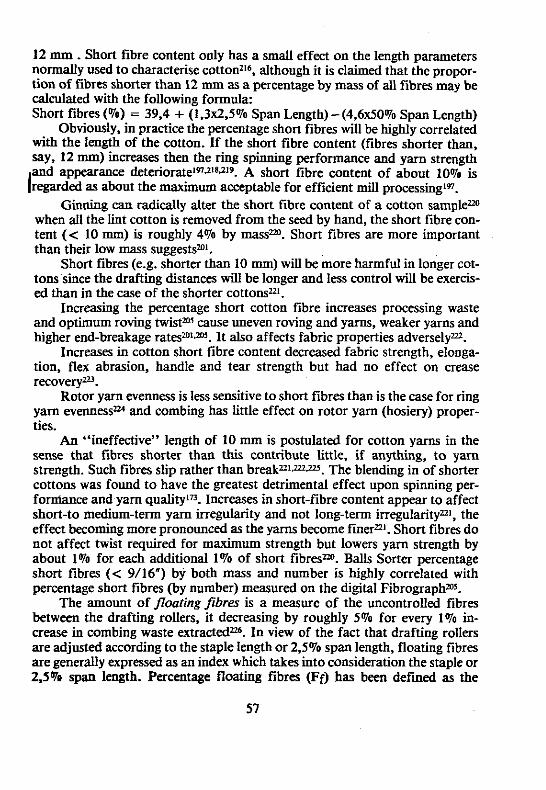
I2 mm . Short fibre content only has a small effect on the length parameters normally used to characterise cotton216, although it is claimed that the propor- tion of fibres shorter than 12 mm as a percentage by mass of all fibres may be calculated with the following formula: Short fibres (%) = 39,4 + (1,3x2,5% Span Length) - (4,6x50% Span Length)
Obviously, in practice the percentage short fibres will be highly correlated with the length of the cotton. If the short fibre content (fibres shorter than, say, 12 mm) increases then the ring spinning performance and yarn strength and appearance deteri~ratel"t'~.~'~. A short fibre content of about 10% is
(regarded as about the maximum acceptable for efficient mill processingl". Ginning can radically alter the short fibre content of a cotton s a m p l P
when all the lint cotton is removed from the seed by hand, the short fibre con- tent (< 10 mm) is roughly 4% by massm. Short fibres are more important than their low mass suggestsm1.
Short fibres (e.g. shorter than 10 mm) will be more harmful in longer cot- tons since the drafting distances will be longer and less control will be exercis- ed than in the case of the shorter cottonsnl.
Increasing the percentage short cotton fibre increases processing waste and optimum roving twistmr cause uneven roving and yarns, weaker yarns and higher end-breakage ratesmlm. It also affects fabric properties adversely*.
Increases in cotton short fibre content decreased fabric strength, elonga- tion, flex abrasion, handle and tear strength but had no effect on crease recoverym.
Rotor yarn evenness is less sensitive to short fibres than is the case for ring yarn evennessm and combing has little effect on rotor yarn (hosiery) proper- ties.
An "ineffective" length of 10 mm is postulated for cotton yarns in the sense that fibres shorter than this contribute little, if anything, to yarn strength. Such fibres slip rather than breakn1.-. The blending in of shorter cottons was found to have the greatest detrimental effect upon spinning per- formance and yarn quality17). Increases in short-fibre content appear to affect short-to medium-term yarn irregularity and not long-term irregularitynl, the effect becoming more pronounced as the yarns become fmernl. Short fibres do not affect twist required for maximum strength but lowers yarn strength by about 1% for each additional 1% of short fibram. Balls Sorter percentage short fibres (< 9/16") by both mass and number is highly correlated with percentage short fibres (by number) measured on the digital Fibrograph".
The amount of floating fibres is a measure of the uncontrolled fibres between the drafting rollers, it decreasing by roughly 5% for every 1% in- crease in combing waste extractedm. In view of the fact that drafting roUers are adjusted according to the staple length or 2,5% span length, floating fibres are generally expressed as an index which takes into consideration the staple or 2.5% span length. Percentage floating fibres (Ff) has been defined as the
percentage of fibres in the draftiig zone (1: 1 draft) not clamped by either front or back rollersma.
I t is given by=: F,= [ (S/L) -0,9751 x 100
where S is the 2,5% span length and L is the mean fibre length (in mm) L may he estimated as follows~:
L = 3 (S, - 2,5) where S, is the 66,7% span length (in mm)
Actually the mean length computed from the 66,7% span length in the above way is from 12 to 15% lower than the actual mean length. The 12.5% span length of the Fibrograph agrees very closely with the mean lengthmSm and it should be used in preference to the computed result.
The following equation has been obtained=' when relating mean length (Y) to 2,5% span length (X):
Y = 0,821 X + 0,095 where the length values are in inches or Y = 0,821 X + 2,41 if mm units are used.
When the mean fibre length was taken into consideration, floating fibres and percentage short fibres still affected spinning performance whereas percentage fibre length irregularity did notms.
The floating fibre index (FFI) is generally calculated as follows:
2,570 Span Length = G (66.7% Span Length - 2.1)
The reciprocal of the uniformity ratio is also related to the floating fibres, a uniformity ratio of = 35% corresponding to a floating fibre index of = 100%. apd a uniformity ratio of = 45% corresponding to an FR of 40=?om.
It appears that the cotton fibre staple or modal length changes very little during manufacture, up to and including the f a b r i ~ ~ ~ ~ . ~ ~ . Nevertheless, the 2.5% Span length should ideally, increase from card lap to roving because of the removal of short fibres. If optimum conditions and settings are adopted at each processing stage (including combing), 2,5% Span length can increase by up to 10Vo from the card sliver to the rovingm. It has been foundm that, on average, combing increases the 2.5% Span length by 6% and the 50% Span length by roughly 15%. For every 1% of combing waste (noil) extracted the 2,5% Span length increased by roughly 0,5%, the 50% Span length roughly by 1.2 to 1,5%, the 66.7% Span length roughly by 1,8 to 2,0% and the uniformity ratio roughly by 0.8 to 1,0qoU6. Combing performance can in fact be assessed by comparing the 50 and 66,7% Span lengths with those of the carded sliveru6.
The Digital Fibrograph 50/2,5 uniformity ratio values are a measure of the relative uniformity of fibre length in the samples's. They represent the
ratios between the 50% Span length and the 2,5% Span length, expressed as percentages. Larger values indicate more uniform fibre length distribution. Unusually low fibre length uniformity tends to increase manufacturing waste, to make processing more difficult, and to lower the quality of the product. The following adjective descriptions will serve to classify cottons from the stand- point of fibre length uniformitylB:
Uniformi@ Ratio (50/2,5)lB Below 41 Very low 4143 Low 44-46 Average 4748 High
Above 49 Very high Data source - 2076 American Upland lots tested from the crops of 1971-75.
The following values are given for the array upper quartile length (i.e. that length which is exceeded by 25% of the mass of the fibres in the sample1%) using a Suter-Webb fibre sorter. The upper quartile length is correlated with, but usually longer than, the 2,5070 span length.
Upper Quartile Length Classification < 27,9 mm (I,]") Short 27,9 mm to 31,5 mm (I,] to 1,24") Medium 31,8 mm to 35,3 mm (1,Z to 1,39") Long > 35,3 mm (> 1,39") Extra long
Array Coefficient of Length Variation Classification < 26 Very low variation 26-29 Low variation 30-33 Average variation 34--37 High Variation > 37 Very high variation
Ratings of cotton samples with respect to fibre length variation are given below?
CVV* - c 27 27 to 34 > 35
Rating
Low Variability Average Variability High Variability
'In this ease, Uniformity ratio is defmed as: Mean length x 100 Upper-half mean length
Ratings of cotton fibres with respect to uniformity ratid:
Theoretically, the maximum uniformity ratio possible decreases as the fibre length increases2'0.
MICRONAIRE Next to length, micronaire is probably the most important factor deter-
mining many textile machine processing variables'". For a particular cotton variety the micronaire values are related to maturity and are primarily in- fluenced by growing conditions and time of harvest. The importance attached to micronaire probably stems from the fact that it is generally a measure of maturity, which in turn is reflected in the dyeing characteristics and nepping potential of the cotton.
Micronaire is more critical for shorter cottons and for finer yarnsu3. The micronaire test is probably the most widely used test for cottonw. There appears to be fairly general agreement that, for ring-spinning, both
very low and very high micronaire cottons should be avoided. Micronaire of about 3,s to 4,O appear to give optimum spinning performance and yarn quality'".
Low micronaire (c 3,s) and high micronaire (r 4,9) cottons tend to be sold at discount prices because they cause problems in textile processingns. Low micronaire cottons cause neppiness during carding, necessitating lower carding speeds. High micronaire (i.e. coarse) cottons reduce yarn and fabric strength and increase end-breakage rates during spinning because of the low number of fibres in the yarn cross-sectionn5.
Originally, the minonaire value was taken to represent the fibre linear density in &imch which could be converted into millitex by multiplying by 39.4. In actual fact, however, micronaire is a function of both fibre maturity (M) and fibre linear density (H) with the result that the fibre linear density (mtex) for a particular micronaire will depend upon thefibre matur ip . It is therefore conceivable that the effect of micronaire will depend upon whether its variation is due to changes in the intrinsic fmeness of the cotton or to
Uniformitr Rstio.
Above 80 76 to 80 71 to 75 70 and below
B.m
Uniform Average Uniformity Slightly Irregular Irregular
Source: United States Department of Agridnrre
changes in the fibre maturity. If the fibre linear density remains constant, then micronaire reading will increase with increasing fibre maturityl39.
In one articlP-", micronaire reading was related to MH for a large number of Indian cottons. When MH was plotted against micronaire, the Herbaceum cottons differed to some extent from the other cottons and airflow through the cotton plug is also, therefore, to some extent dependent upon factors other than MH . Nevertheless, it appears that micronaire values agree pretty well with fibre linear density (&inch) for American Upland cottonsu7.
The general relationshipl3gis:
MH = MZH, = aX + bX2 + C = 3,86X2 + 18,16X + 13.0
where M is the maturity ratio (see next section). H is the fibre fineness or linear density (in mtex). Hs is the standard fibre fineness or linear density, which is the fineness the cot- ton would have at a standard maturity of one, and X is the micronaire as measured on a standard air-flow meter. This is an instrument test which measures the resistance of a plug of cotton to air flow'". A representative stan- dard mass of cotton fibres is placed in the instrument specimen holder and compressed to a fmed volume. Air at a known pressure is forced through the specimen and the amount of flow is indicated by a direct reading scale. Readings obtained are relative measures of either the mass per unit length (linear density), or the cross-sectional size of the fibres. Because the instrument values may differ from the actual linear density, depending upon the fibre characteristics of the sample, the results are reported in terms of "micronaire reading" instead of micrograms per inch. These readings are taken from the curvi-linear scale adopted in 1950, and now in international use. Fibre fineness contributes to yarn strength, particularly when fine yarns are spun, but it also tends to increase neppiness and to require a reduced rate of processingis8. Re- packing the cotton into the micronaire instrument after fluffing it out does not necessarily give the same reading119, although the effect is small if the cotton is fluffed out properly. Shirley Analysed lint packs more uniformly in the sample holder than raw cotton"9, and so does card web. Large vegetable particles should be removed although a low proportion of small chaff is of negligible importance.
Card web, hand opened and Shirley Analysed samples all give similar micronaire values139.
Cottons are generally graded as follows in terms of their micronaire values:
MlCRONAlRE GRADING" < 3,O Very f i e 3 to 3,9 Fine 4 to 4,9 Average 5 to 5,9 Slightly coarse > 6 Coarse
The prediction of the micronaire value of a blend from its components must be made according to the "weighted" harmonic mean239.
When producing ring yarns, low micronaire levels cause excessive fibre breakage, a large number of neps during carding, poor yam appearance and poor dyeing. Very low micronaires (below 3) result in poor performance as a result of sticking during processing, low production rates and high manufac- turing mass losses. On the other hand low micronaire cottons generally give fewer end-breakages during spinning and stronger yarns, particularly for finer yarn^^^.^'-^^. Micronaire does not appear to affect yam evenness in a consis- tent manner, intermediate micronaires appearing to be preferable in this respect1".
In ring- and rotor-sp*ning. an increase in micronaire has an adverse ef- fect on end-breakages and yarn strength and elongation, has a beneficial effect on dyeing quality (only valid for a critical dye) and wet processing losses but has little effect on yarn evennessn3. Ring- and rotor-yarn appearance generally improves with an increase in micronairem. Differences in dyeing quality associated with micronaire level have been found to be much smaller for rotor- than for ring-spun yams"]. Icappears, however, that blanket conclusions con- cerning micronaire level should not be made without knowledge of the genetic character and intended end-use of the cottonn1.
Lower micronaire cottons have also been reported to produce more even rotor yarns because of the greater number of fibres in the yarn cross-sectionz4 and fewer end-breakages during spinning. Fibre fmeness (micronaire) is more important than length in rotor spinningm. As the micronaire decreases so the optimum twist required in the roving decreasesm?.
One studyn8 found both low micronaire (2,9) and high micronaire (5.3) to give higher end-breakages during ring-spinning than an average micronaire (4,2) cotton. In another studyla, no effects of micronaire on rotor- or ring- yarn strength was observed.
Maximum yarn strength is generally reached at lower twists for low micronaire cottons than for high micronaire cottonsZ42.
Micronaire is generally negatively correlated with CSPz4z~5.2a i.e. an in- crease in micronaire decreases (CSP) but this is not always the caseo.
Lower maturity or micronaire increases yarn strength probably due to a greater number of fibres in the yarn cross-se~tion~~~. Micronaire to a large ex- tent determines carding rate. Lower micronaire cottons are more prone to nep formation and are therefore carded at a lower production rater"n3W.
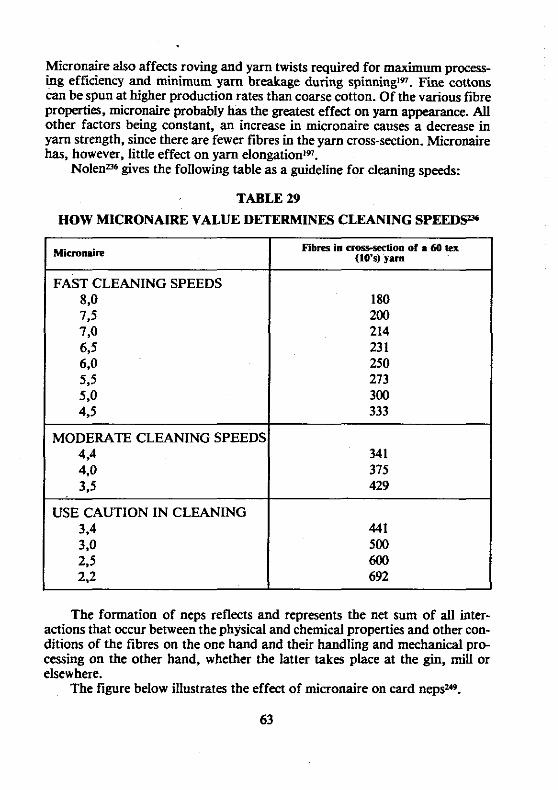
Micronaire also affects roving and yarn twists required for maximum process- ing efficiency and minimum yarn breakage during spinning'". F i e cottons can be spun at higher production rates than coarse cotton. Of the various fibre properties, rnicronaire probably has the greatest effect on yarn appearance. All other factors being constant, an increase in micronaire causes a decrease in y a m strength, since there are fewer fibres in the yarn cross-section. Micronaire has, however, little effect on yarn elongation'".
Nolenw6 gives the following table a guideline for cleaning speeds:
TABLE 29
HOW MICRONAIRE VALUE DETERMINES CLEANLNG SPEEDSZU
FAST CLEANING SPEEDS 8,O 180 7,5 200 7,O 214 6S 23 1 6.0 250 5,5 273 5,o 300 4,5 333
MODERATE CLEANING SPEEDS 4,4 341 4 0 375 3,5 429
USE CAUTION IN CLEANING
600 2.2 692
The formation of nevs reflects and revresents the net sum of all inter- actions that occur betweeithe physical and chemical properties and other con- ditions of the fibres on the one hand and their handling and mechanical p r e cessing on the other hand, whether the latter takes place at the gin, mill or elsewhere.
The figure below illustrates the effect of micronaire on card nepsm.
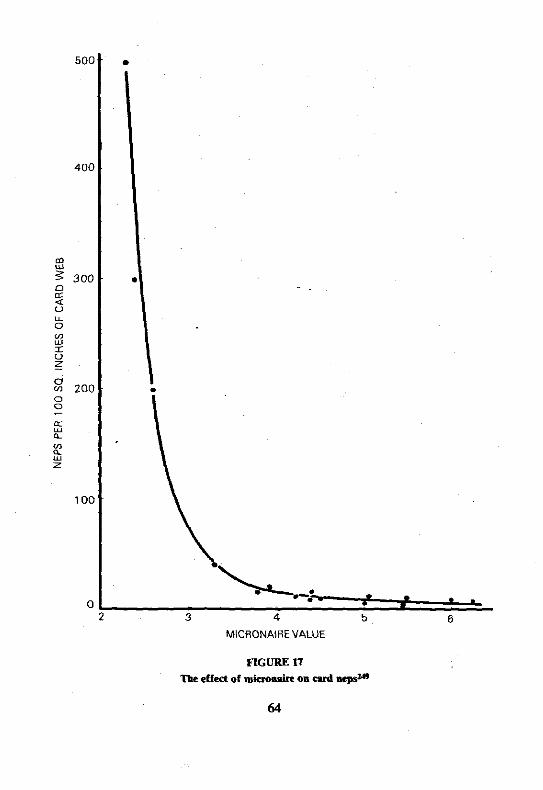
MlCRONAlRE VALUE

In one study2Q the lowest micronaire cotton produced stronger, more abrasion resistant, more elastic and softer fabrics than the coarser cottons242. Resin treatment counteracted most of these advantages, however. The lower micronaire cottons produced slightly poorer crease recovery howeveP2.
It is customary to blend different micronaires so as to produce the re- quired micronaire although the proportion of the low micronaire component is usually very lowm. Blending cotton. differing greatly in micronaire appears to have little effect on yarn and fabric properties relative to an unblended cotton with similar mi~ronairel~.24*~~, although there are exceptions. Care must be taken, however, when blending extremes in fineness, particularly if there are no hales of intermediate fineness present?, since homogenous blending may not be possible.
In one study, yarn imperfections increased as the low micronaire compo- nent in a blend increased, even though average micronaire remained con- stantx4. Blend level (micronaire blend) had no apparent effect on other yarn properties or end-breakage rates.
In one study a blend of 30% low and 70% high micronaire cottons gave slightly greater fibre breakage at higher carding rates and ends down during spinningm.
Increased card cylinder loading (i.e. low cylinder-tedoffer fibre transfer) is responsible for a deterioration in card sliver quality as micronaire decreasesn5.
FIBRE MATURITY For a detailed discussion of maturity see ref. 238. Attacks by disease, or a particularly bad growing season, can cause the
growth of cotton fibres to cease before full maturity is reached. The immature fibres show little or no development of a secondary wall and, therefore, have little rigidity. Such fibres easily entangle into knots of dead cotton, called "neps", which are not easily disentangled during spinning. Because of their thin walls they have different reflectance characteristics compared with mature fibres and the neps may show up as white spots in the dyed goodsu5. Immature fibres also dye differently to mature onesx6.
Fibre maturity is regarded as a central characteristic of a cotton fibre through its direct and indirect correlation with the principle physical properties of commercial and technical irnportancP5'. The maturity of a cotton fibre is equated with its wall thickness, i.e. with the thickness of the secondary cell wall in relation to the diameter of the fibre swollen in caustic soda256. Maturity has a high correlation with fibre linear density, but genetic differences and dif- ferences in wall thickness caused by plant diseases, soil and water conditions during growing interfere with this relationship8.
The fibre diameter and wall thickness are largely inherited characteristics but the latter is also greatly influenced by weather and soil environment26. The
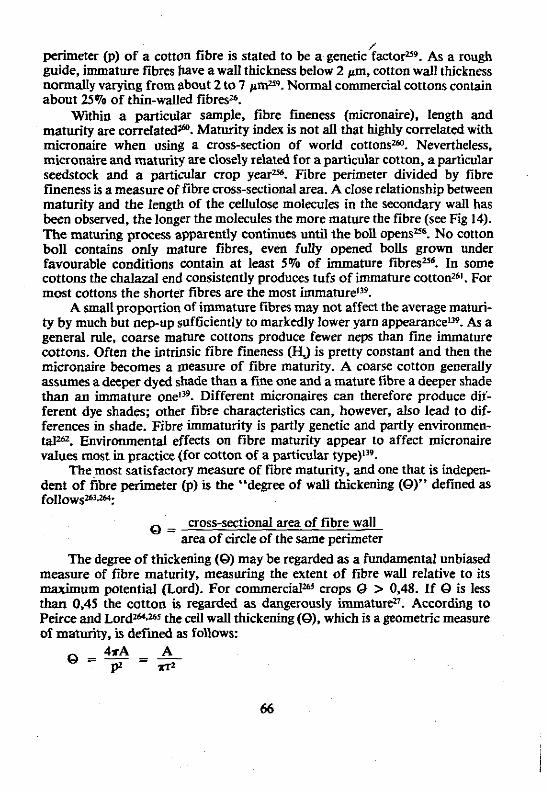
/ perimeter @) of a cotton fibre is stated to be a genetic factorz9. As a rough guide, immature fibres have a wall thickness below 2 pm, cotton wall thickness normally varying from about 2 to 7 pmz9. Normal commercial cottons contain about ZSVo of thin-walled fibresz6.
W~thin a particular sample, fibre fmeness (micronaire), length and maturity are correlated@. Maturity index is not all that highly correlated with micronaire when using a cross-section of world cononsw. Nevertheless, micronaire and maturity are closely related for a particular cotton, a particular seedstock and a particular crop yearm. Fibre perimeter divided by fibre Fmeness is a measure of fibre cross-sectional area. A close relationship between maturity and the length of the cellulose molecules in the secondary wall has been observed, the longer the molecules the more mature the fibre (see Fig 14). The maturing process apparently continues until the boll opensm. No cotton boll contains only mature fibres, even fully opened bolls grown under favourable conditions contain at least 5% of immature fibresx6. In some cottons the chalaza1 end consistently produces tufs of immature cottonzb1. For most cottons the shorter fibres are the most immature139.
A small proportion of immature fibres may not affect the average maturi- ty by much but nep-up sufficiently to markedly lower yarn appearance139. As a general rule, coarse mature cottons produce fewer neps than fine immature cottons. Often the intrinsic fibre fineness (HJ is pretty constant and then the micronaire becomes a measure of fibre maturity. A coarse cotton generally assumes a deeper dyed shade than a fme one and a mature fibre a deeper shade than an immature onel". Different rnicronaires can therefore produce dif- ferent dye shades; other fibre characteristics can, however, also lead to dif- ferences in shade. Fibre immaturity is partly genetic and partly environmen- tal=. Environmental effects on fibre maturity appear to affect micronaire values most in practice (for cotton of a particular type)139.
The most satisfactory measure of fibre maturity, and one that is indepen- dent of fibre perimeter @) is the "degree of waU thickening (0)" defmed as f0llows2~~+
Q = cross-sectional area of fibre wall area of circle of the same perimeter
The degree of thickening (0) may be regarded as a fundamental unbiased measure of fibre maturity, measuring the extent of fibre wall relative to its maximum potential (Lord). For commercialm crops Q > 0,48. If 0 is less than 0,45 the cotton is regarded as dangerously irnrnaturs. According to Peirce and LordW.Z65 the cell wall thickening (0). which is a geometric measure of maturity, is defmed as follows:
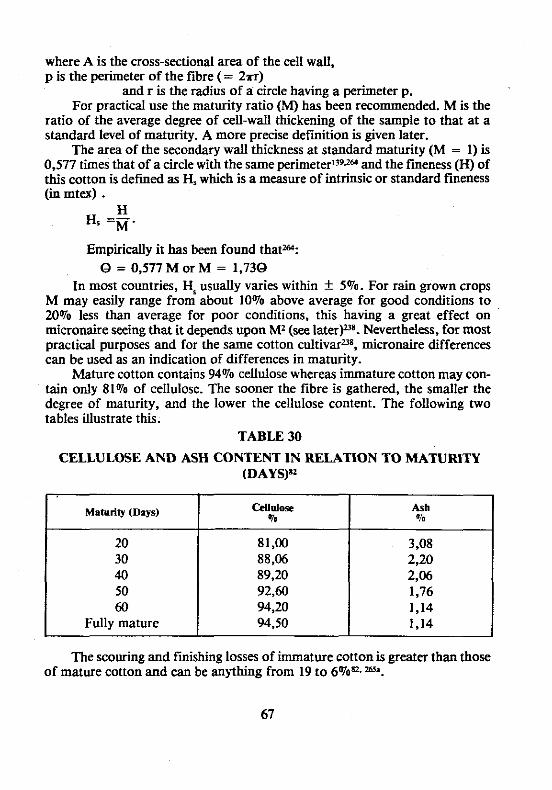
where A is the cross-sectional area of the cell wall, p is the perimeter of the fibre (= 271)
and r is the radius of a circle having a perimeter p. For practical use the maturity ratio (M) has been recommended. M is the
ratio of the average degree of cell-wall thickening of the sample to that at a standard level of maturity. A more precise d e f ~ t i o n is given later.
The area of the secondary wall thickness at standard maturity (M = 1) is 0,577 times that of a circle with the same perimeterlfg" and the fineness (H) of this cotton is defmed as H, which is a measure of intrinsic or standard fmeness Cm mtex) .
Empirically it has been found that? Q = 0,577 M or M = 1,730
In most countries, H, usually varies within f 5%. For rain grown crops M may easily range from about 10% above average for good conditions to 20% less than average for poor conditions, this having a great effect on micronaire seeing that it depends upon M2 (see later)UB. Nevertheless, for most practical purposes and for the same cotton cultivaru8, micronaire differences can be used as an indication of differences in maturity.
Mature cotton contains 94% cellulose whereas immature cotton may con- tain only 81% of cellulose. The sooner the fibre is gathered, the smaller the degree of maturity, and the lower the cellulose content. The fouowine. two tables illustrate this.
-
TABLE 30
CELLULOSE AND ASH CONTENT IN RELATION TO MATURITY (DAYS)"
20 30 40 50 60
Fully mature
The sconrina and fmishine. losses of immature cotton is =eater than those - of mature cottonand can be anything from 19 to 6%".26J'.
67
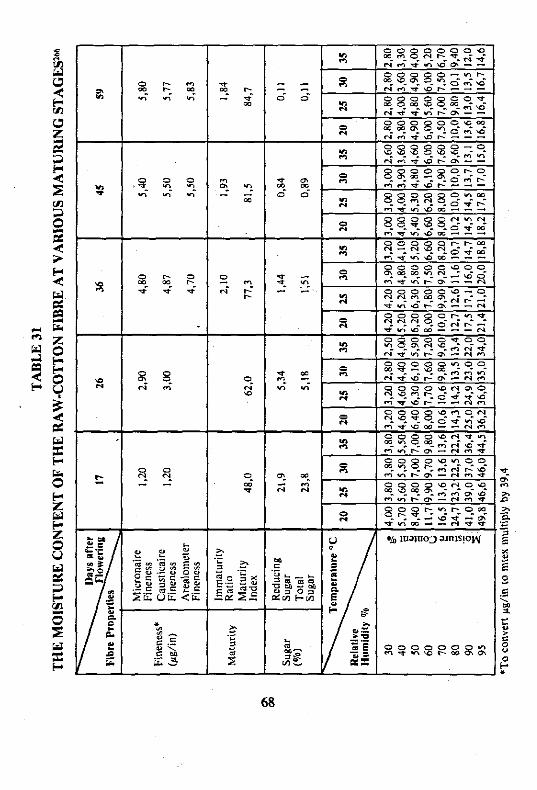
There is an optimum fibre maturity above which it is too stiff and bristly for easy processing and below which it is too flabby and unresilientu. A clear relationship between maturity and fibre strength has been observed for Soviet cottonsz6. Cotton fibre tenacity (cN/tex) decreases with decreasing maturity within a cultivarE9 and convolution frequency and fibre friction increase as cotton fibre maturity decreaseszm. Bundle tenacity appears to be negatively correlated with p"O.
A very high coefficient has been obtained between the cell-wall thickness of cotton and the number of flexural cycles required for rupturezm.
Immature fibres can also lead to roller lapping during processing and can cause difficulties with respect to nep formation and stickiness (due to excessive sugar), unevenness in yams and webs and non-uniformity in wet processingx7.
Immature fibres break easily during processing, have a tendency to become entangled around particles of leaf and trash, thus making cleaning more difficult~8 and increasing the amount of fibre removed with foreign mat- ter". They adversely affect yam appearance and dye unevenlyz8. Immature lint, in a mill at high humidity, causes many problems in the spinning process and may be one of the chief causes of nep formation"*198 and neps consist mainly of immature fibreszM.
Finer fibres increase neppiness and therefore have to be processed at lower rates. Increased fibre maturity improves yarn and fabric appearance and decreases picker and card waste'" but has little effect on yarn ~ t r e n g t h ' ~ ~ . ' ~ .
Low micronaire (immature) cottons lead to excessive end-breakage ratesm.
Cotton fibre maturity also appears to be reflected in fabric lustre270. It appears that dimensionally fmer cottons are more lustrousn'.
Fine (and relatively immature) cotton appears to perform well during wearzn, and also swell more upon wettingz6". Initial Young's modulus is cor- related with birefringe which in turn is correlated with maturitym. Mature fibres have higher elastic moduli than immature fibresn7.
- The results of one study2@ showed that lint which has dyed perfectly green by the differential dyeing method is immature. However, laboratory dyeing experiments, carried out with direct dyes on immature conon fibres of known origin, showed that maturity did not affect the amount of dye absorbed at equilibrium. The absorption and desorption rater, however, were higher for immature than for mature fibres. Mercerisation of the fibres before dyeing did not greatly affect the differences. Besides the effect of optical differences, the differences in depth between dyed neps and fabric are due to the more rapid desorption of dye from immature fibres. Such differences would be exag- gerated by unsuitable processing conditions, e.g. during rinsing, which was confirmed by some laboratory dyeings on fabric samples. It was predicted that, in order to obtain an even colour on a fabric containing immature as well as mature fibres, dyeing should not be carried on until equilibrium is reached
and that rinsiig and aftertreatments should be carried out so that the dye desorption will be as small as possiblern.
It has also been statedzn that immature or dead fibres in cotton piece goods can be dyed continuously at the same time as normal fibres and to the same shade, by impregnating the material with a padding Liquor (which, in ad- dition to dyestuffs, contains a cellulose ether) and then fvring the dyes evenly on the fibre surface whilst insolubilising the cellulose ether with a solution of a salt or acid salt of a polyvalent metal or a solution of a quarternary ammonium compoundn.
A pretreatment involving impregnating fabrics with 100 to 110% pick-up with a solution containing 4 to 7% caustic soda plus a surfactant plus a reduc- ing agent, steaming for 60 to 90 minutes, washing, neutralizing and then dye- ing seems to give good coverage of immature c0tton2'~. If a fabric is mercerised before dyeing the colour difference between the neps and rest of the fabric will be reducedm. Certain dyes will dye neps to almost the same colour as the rest of the fabricm.
Various tests have been used to obtain a measure of fibre maturity. Some of these, however, depend upon other fibre properties as well as fibre maturi- ty. Some of the more important tests used to determine fibre maturity are described below:
Caustic Soda Swelling Methods Under the action of a strong (18%) caustic soda solution, mature cotton
fibres lose their natural twists and assume a cylindrical shape, while immature and dead fibres acquire new twists. It has been suggestedm that a clearer distinction between mature and immature fibres can be made if a 32% caustic soda solution is used instead of an 18% solution. The same lye should always be used, since different lyes or lye concentrations yield different maturity indices even with the same procedure. This is important since a lye concentra- tion of 16,5% is sometimes used=. Although a cotton fibre is generally regarded as mature if its wall thickness is a quarter or more of the fibre diameter after treatment in 18% NaOHm (i.e. the fibre wall thickness is 50% or greater than the diameter of the lumen, as measured along its major axis2) this ratio is considered to be less than ideal, values of 0,67 (2/3) or 0,75 (314) W i g regarded as better.
In the standard maturity test used in the U.K. (United Kingdom) the cotton fibres are swollen in an 18% caustic solution and examined under a microscope. The fibres are then classified into the following groupsn8: 1. Nonnal fibres where the fibres have swollen into solid rods, show no con-
tinuous lumen and have no well-defined convolutions; 2. Dead fibres where the fibres have a continuous lumen and the walI
thickness is a fifth or less than the ribbon width measured at the widest portion of the fibre in the microscope field. This effectively means that the

ratio of the apparent wall thickness to the apparent lumen width is one- third or less.
3. 7'hin-walled fibres are the remaining fibres and represent the intermediate fibres.
These values are tben generally expressed as percentages which are represented by N (normal) and D (dead).
The Maturity Ratio (M) is tben calculated as followsl39.2~.n?
M = - - + O,70 also: Q = 0.577 (~9 + 0,74 200 200
Q = 0,577 M i.e. M = 1.73 Q In another article2" it is stated that when cotton lint is treated in 20%
caustic soda the cellulose in the cell walls begins to swell and in fully mature fibres it continues to swell until the lumen is completely occluded and the cell resembles a solid rod when viewed through a microscope. These are referred to as normal (N) fibres while those that do not swell at all and remain thin-walled and convoluted are called "dead" (D) fibres. The maturity ratio (M) is then calculated as above.
The theoretical range for M is from 0,2 for all fibres dead to 1,2 for all fibres mature (normal).
The following classification of various cottons according to maturity ratio (MY8 has been given:
TABLE 32
CLA!3SIFICATION OF COTTONS ACCORDING TO MATURITY RATIW
Very mature I High-grade - - ~ b & e average I Med. grade - average1
Mature I Low grade - below average uncommon I
Below average Immature Uncommon
The US test for the maturity of cotton fibres swollen in 18% NaOH only classes the fibres into two categories viz. mature (where the apparent wall thickness to ribbon width is greater than 0.25, i.e. where the lumen occupies

less than 50% of the total fibre w id thp and immature (i.e. the remaining fibres)u8. When using the fibre array method and swelling in NaOH, the number of mature fibres expressed as a per cent of the total number of fibres in the test specimen, represents the maturity2 ( P d :
Ft - Fi Pm = -- x loo
Ft
Ft = total number of fibres examined and Fi = total number of immature fibres
i.e. Pm = No. of mature fibres Total number of fibres
The following table has been given for rating maturity as determined by the array method and swelling in NaOH (18%). immature fibres being classed as those having their wall thickness one-half or less than the diameter of the lumenz.
TABLE 33 *
ARRAY FIBRE MATURITY ( p a
Mature Average Immature Very immature
The percentage mature fibres (Pm) so obtained can be related to maturity
ratio (M) as follow^^.^^:
M = 1,76 - d (2.44--0,0212Pm) Also Pm = (M - 0,2) (1,565 - 0,471M) x 100
and degree of thickening (0) = 0,577 M = 1,017 - J (0,812-0,00707Pm)
In another test212, the fibres are also swollen in 18% NaOH and classified as follows according to the wall thickness (W) and lumen width (L):
Mature fibres : L/W < 1
Half-mature fibres : 1 < !L < 2 W
L Immature fibres : - > 2 W

From these values the maturity coefficient (Mc) is then calculated as follows:
Mc = (M + 0,6 H + 0,4 I)/ 100
where M, H and I are the percentages of mature, half-mature and immature fibres212.
TABLE 34
RATINGS FOR
Airflow Tests Maturity is often determined by double-compression airflow tests.
Examples are the Arealometer, CRITER and IIC-Shirley testersu8. These generally involve compressing the fibre sample to two different densities and then measuring the airflow at a constant pressure. A primary cause of resistance to airflow through a sample is the amount of external fibre surface exposed to the airflow and this resistance is used as a measure of specific area. The resistance, however, is modified by the distribution and orientation of these surfaces; hence on suitably compressing the sample, that change in resistance which is essentially due to re-orientation of flattened fibres becomes a measure of the immaturity ratid. The aavarent increase in saecific surface
< 0,70 0,70 to 0,90 > 0,90
area at higher compressions(air-flow test) kittributed to rotation of the fibres within a plane perpendicular to the direction of flowzn. Less mature fibres are
Immature Medium mature Mature
flatter i d , therefore, provide a greater increase in a resistance when com- pressed than do the more mature fibres.
Airflow through a plug of cotton is determined by the specific surface area (So) i.e. the surface area per unit volume which in turn is a function of MHZ38.218.219.284.
So = p/A where o is the fibre oerimeter and - ~~~
A is the cross-&tional area of the cotton fib&" LhO.
A = V x H = %here p is the fibre density and D
V = specific volume. b It appears280 that: Sb = + -
QH QH2
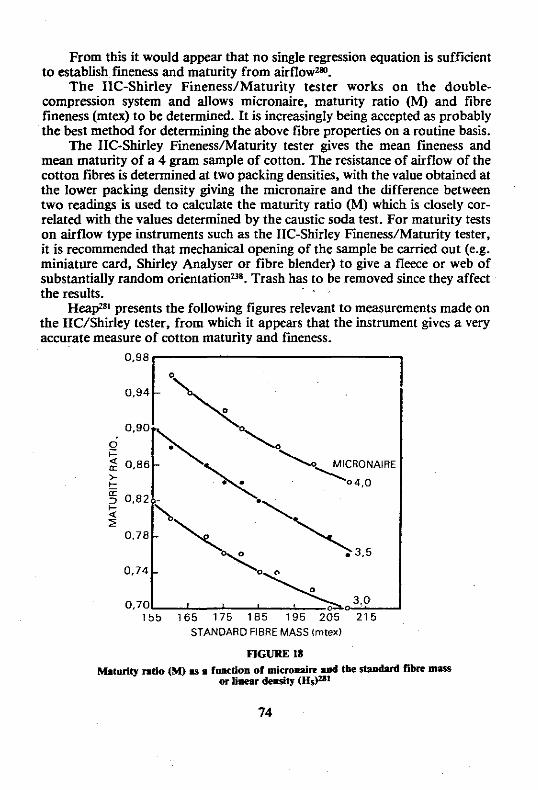
From this it would appear that no single regression equation is sufficient to establish fineness and maturity from airflowm.
The IIC-Shirley Fineness/Maturity tester works on the double- compression system and allows micronaire, maturity ratio (M) and fibre fmeness (mtex) to be determined. It is increasingly being accepted as probably the best method for determining the above fibre properties on a routine basis.
The IIC-Shirley Fmeness/Maturity tester gives the mean fmeness and mean maturity of a 4 gram sample of cotton. The resistance of airflow of the cotton fibres is determined at two packing densities, with the value obtained at the lower packing density giving the micronaire and the difference between two readings is used to calculate the maturity ratio (M) which is closely cor- related with the values determined by the caustic soda test. For maturity tests on airflow type instruments such as the IIC-Shirley Fineuess/Maturity tester, it is recommended that mechanical opening of the sample be carried out (e.g. miniature card, Shirley Analyser or fibre blender) to give a fleece or web of substantially random orientationB8. Trash has to be removed since they affect the results.
Heapzsl presents the following figures relevant to measurements made on the IIC/Shiiley tester, from which it appears that the instrument gives a very accurate measure of cotton maturity and fmeness.
STANDARD FIBRE MASS Irntex)
FIGURE 18

MATURIN RATIO ICAUSTICSODA MICROSCOPE METHOD!
mURE 19
Codation between maturity mtio results drlermiaed by lir-flow md caustic sod.
swelling, r e s p r t i ~ r ( ~ U 1
1 0 0 2 0 0 3 0 0 4 0 0
UNEAR OENSITI-MIWTEX CUTTlNG AND WEIGHING1
FIGURE 20 Cwrrlntiw b C M UCSgirkl finemas ud
that obtained by mu@ and wrigbibilyU1
In the Cautlcaire test for maturity the relative change in air permeability (airflow) between untreated and treated (i.e. mercerised in 18% NaOH) cotton fibres is used as a measure of maturity.
For causticaire we havP" =3:
M~ = UTX 100 T
F = 1,185 + (0,00075 TL) - (0,020 ML) where MI = Causticaire maturity index (i %)
UT = Causticaire reading on untreated sample T = Causticaire reading on treated sample (i.e. NaOH mercerised)
and F = Causticaire fiieness in pg/inch. To convert F to mtex, multiply by 39,4.
The above tends to underestimate coarse cottons and to be higher for mature than for immature cottonsm. According to Lordw8, the Causticaire test contains some inherent disadvantages with the Causticaire maturity biased ac- cording to fibre fiienessm.".
For American Upland cottons we have:
Another rating of fibres according to their Causticaire values is also given
MI
< 72 72 - 75 76 - 79 80 - 83 > 85
Rating
Mature Average Immature Very immature
auficltioo
Very low Low Average High VerY high
J.S.I.F. have developed a formula:
MI = 61,7 + 59.5 (PL/PH) where PL and PH are the IIC-Shirley readings.
Dye Tests A differential dyeing technique was developed by Goldthwait et UP to
estimate cotton fibre maturity. After dyeing with a mixture of green and red direct dyes, the maturity of cotton fibres can be estimated visually~." or by spectrometrically analysing the red and green dye uptake after the dye extrac- tion from the differentially-dyed samples"8. Red and green direct dyes are used in the same bath, immature fibres tend to dye green and mature fibres tend to dye redzs9, subsequent stripping in boiling water may be required for clearer di~tinction"~. Colour differences appear to be due to structural differences (porosity) during dyeing rather than to differences in wall thickness per s@. The molecular weight of the green dye is twice that of the red, hence greater fibre porosity will favour it. The action of heat, in ginning for example, also has an effect on dye uptake.
Dye absorption has been related to fibre propertiesm (see also ref. 292). The tests consist of dyeing three-gram samples of cotton in a bath of
distilted water, Diphenyl Fast Red 5BL Supra 1 and Chlorantine Fast Red BLL, the redyeing twice in the same bath plus sodium chloride and washing. The colour of the samples is compared with that of standard samplesz.
The fibre fineness also affects the appearance of the fibres in addition to the fibre maturity. Dyeing tests for maturity are discussed in detail elsewher$8 ~ 9 % %.
Alkali and Glycerol Centrifuge Tests The amount of alkali retained by cotton fibres after the fibres have been
immersed in 15% caustic soda solution for 15 min and then centrifuged is termed the Alkali Centrifuge Value (ACV) and has been used to assess cotton fibre maturity175. It is a measure of the alkali swelling of the fibre and is a func- tion of the cell wall thickness (i.e. maturity) as well as microbial or mechanical damage161 to the primary walW "5. , The ACV of an undamaged cotton is of the order of 190 and that of
severely damaged cotton 330. If, therefore, the ACV is to be used as a measure of maturity it must be
ensured that the fibre is not damaged or else an Arealometer value must be ob- tained and the results checked using a graph given by Marsh et aPS7.'6'.
The imbibition of glycerol by cotton has also been used as a measure of fibre porosity which includes a major contribution from the fibre lumen~5. Cotton is swollen in glycerol to saturation and subjected to centrifugation until constant mass is attained. The glycerol retention value (GRV) is calculated from the increase in mass of cotton after swelling and centrifugation. This method was applied to determine GRV's and pore space of 12 American cot- tons which have different wall thicknesses but more or less the same fibre perimeter. A high negative correlation was obtained between GRV and the percentage of mature fibres for various raw and extracted cottons. It bas been
shown that the average lumen area in the swollen state can be calculated from GRV and gravimetric fmenessm.
Polarized Light Tests The anisotropic nature of the fibrillar structure of the cotton fibre has
been used to assess the fibre wall developmentnc-". When examined through a microscope illuminated with plane-polarized light, fitted with cross- ed polarizer and analyser and having a fmt-order red selenite plate to give a magenta background to the field of view, cotton fibres assume different colours according to their wall thickness. Fibres with very thin walls appear violet or indigo, immature fibres are blue and native fibres with still thicker walls appear yellow. This test does not, however, classify the fibres according to 8, the colour depending essentially upon the absolute wall thickness (i.e. not the relative wall thickness). Furthermore, colour is generally assessed sub- jectively which is a disadvantagells.
In another a r t i c l e it is stated that, after interposing a Red 1 gypsum plate the fibres appear in the following colours viewed lengthwise:
Mature fibres (thick-walled) green to yellow
Immature fibres (thin-walled) indigo to blue
Dead fibres colour of basic tone. Under polarized light, mame and immature fibres not only reveal a dif-
ferent interference colour but also different luminosity, depending on the thickness of the cell wall and thus on the maturity256. Dead fibres emit no light at all.
The basis of the polarized light method of determining maturity is the abiity of the fibres to transmit light. The immature fibres will transmit the polarized light with the lumen appearing the same colour as the background. The mature or thick-walled fibres do not transmit light as do the immature fibres and will appear as a complementary colour to the backgroundz6.
Every maturity test gives a different value. Nominal values are given below of the degree of maturity of cotton obtained by different processes on cotton from seven different origins with the same micronaire value of 4,3 (from the K o ~ h - t a b l e ) ~ ~ . ~ . ~ ~ .
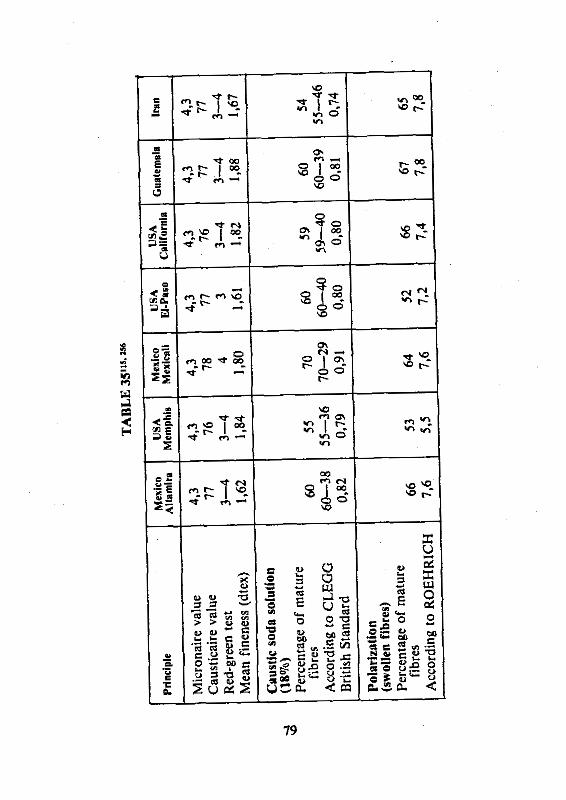

In one article the correlation between various measures of maturity has been investigated. The IIC Shirley FinenedMaturity tester was also studied30'.
FIBRE FINENESS
Correctly speaking, by d e f ~ t i o n , the fineness of a textile fibre or yarn is its mass per unit length (i.e. linear density). Originally the fineness of cotton was expressed as micrograms per inch (&inch) and initially air-flow instru- ment values (micronaire) were expressed in these units but it soon became evi- dent that the micronaire reading was a function of both the cotton fibre fineness and maturity. Thereafter the air-flow reading was more correctly described as micronaire or micronaire units since it is not a unique function of fibre fmeness although, as mentioned earlier, within a cultivar, micronaire is a function of maturity and so is fmeness. Hence, within a cultivar, micronaire is generally a measure of the cotton fineness.
Fibre fineness (i.e. mass per unit length or linear density) can be measured by the "cutting and weighing" technique where a known length of cotton fibre is weighed and then the linear density calculated. This is, however, a time con- suming and not all that simple exercise and in recent years special techniques and instruments have been developed which allow the fibre fineness to be determined by the air-flow technique in which the rate of air-flow is measured with the loose fibre assembly being compressed to two different densities. One such instrument which is becoming widely used is the IIC-Shirley Maturity/Fineness Tester which allows micronaire, fineness and maturity to be accurately determined in a very short time. This has allowed fmeness to be determined on'a routine basis and it now becomes possible to determine the importance of fineness per sP on processing performance and yarn and fabric properties. As mentioned earlier, the units for expressing cotton fibre fineness were originally pg/inch but today millitex (mtex) has been accepted almost universally. Fibre fmeness in mtex is the fibre mass in grams per 1 000 000 metres of fibre, or, equivalently, the mass in milligrams (mg) per 1 000 metres of fibre. It follows that to convert from pglinch to mtex we must multiply by 39,4.
Conon fibre fmeness and length are closely correlatedMZ. As the cotton fibre becomes finer so the minimum twist required to produce maximum yarn strength decreasesm. Fineness also affects the twists used for rovings, while fme fibres together with low yarn twists are regarded as ideal for bulky hosiery yarns=. Provided no other fibre properties are adversely affected, finer fibres produce stronger yarns, particularly in the case of rotor yarns, mainly because there are more fibres and therefore a greater surface-tesurface (and therefore interfibre frictional forces) in a yam of given linear density. Finer fibres reduce end-breakages on rotor (OE) machinesm3.
In general, fmer cottons should have a beneficial effect on yarn evenness
and strength because of the greater number of fibres in the cross-section of a yarn of a certain Linear density (tex), this being particularly important for rotor (OE) yams where fineness has assumed greater importance than is the case for ring yarns. On the other hand, fmer cottons are more prone to nep formation during carding and have to be carded at slower speeds. This increased nep for- mation adversely affects tbe yarn appearance. If cotton fineness is a measure of, or is associated with, immaturity which is generally the case within a par- ticular cultivar, then the adverse effect of lower maturity may outweigh the beneficial effect of the increasing fineness (i.e. lower mtex and therefore a greater number of fibres in the yarn cross-section). The ideal appears to be to breed a cotton which is fme and yet mature, such a cotton would appear to have particular potential in rotor spinning.
The meanfibre linear density (H) can be obtained by weighing bundles of fibres cut to a standard length or by the IIC-Shirley tester. This is a measure of the cotton fibre linear density but does not distinguish mature from immature fibres.
The standard hair m m (Hs) is a measure of the intrinsic fineness of cot- ton fibre and is obtained from the formula Hs = H/M and represents the average fibre fineness of the cotton were its maturity ratio (M) t o coincide with an arbitrary level of unity (i.e. when M = 1, then H = Hs)m.
Micronaire (X) is related to maturity and fineness as foUows'~9. an:
MH = WHS = 3,86 X2 + 18,16 X + 13 where M is the maturity ratio
H is the average fibre linear density (mtex) and Hs is the standard fibre linear density (mtex)
H Hs = M
Heapm1 gives the following graph for the yarn linear densities for different cotton varieties assuming 100 fibres in the yarn cross-section.
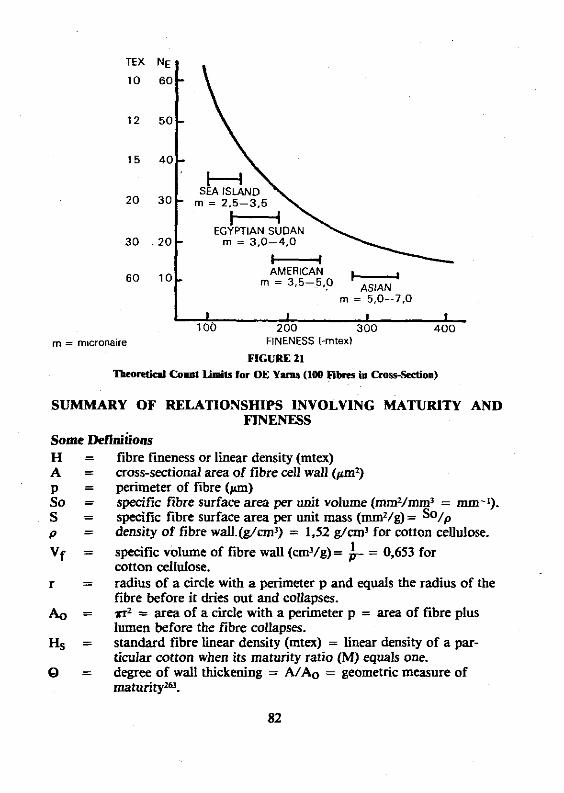
I I I I t 100 200 300 400
mbcronacre FINENESS I-rntexl
FIGURE 21 Tlcontiol Count Limits for OE Y a m (100 nbms h Cm%%tioa)
TEX NE
10 60-
12 50-
15 40-
20 30
30 20
60 10-
SUMMARY OF RELATIONSHIPS INVOLVING MATURITY AND FINENESS
Some Defiiiom
- m = 2.5-3.5
EGYPTIAN SUDAN - m = 3.0-4.0
H AMERICAN
rn = 3.5-5.0 . ASIAN rn = 5.0-7.0
fibre fineness or h e a r density (mtex) cross-sectional area of fibre cell wall @3 perimeter of fibre (m) specific fibre surface area per unit volume (mm2/mm3 = mm-I). specific fibre surface area per unit mass (mmZ/g) = density of fibre wall.(g/nn3) = 1,52 g/cm3 for conon cellulose.
specific volume of fibre wall (cm3/g)= = 0,653 for conon cellulose. radius of a circle with a perimeter p and equals the radius of the fibre before it dries out and collapses. *r2 = area of a circle with a perimeter p = area of fibre plus lumen before the fibre collapses. standard fibre linear density (mtex) = linear density of a par- ticular cotton when its maturity ratio (M) equals one. degree of wall thickening = A/& = geometric measure of maturityza.
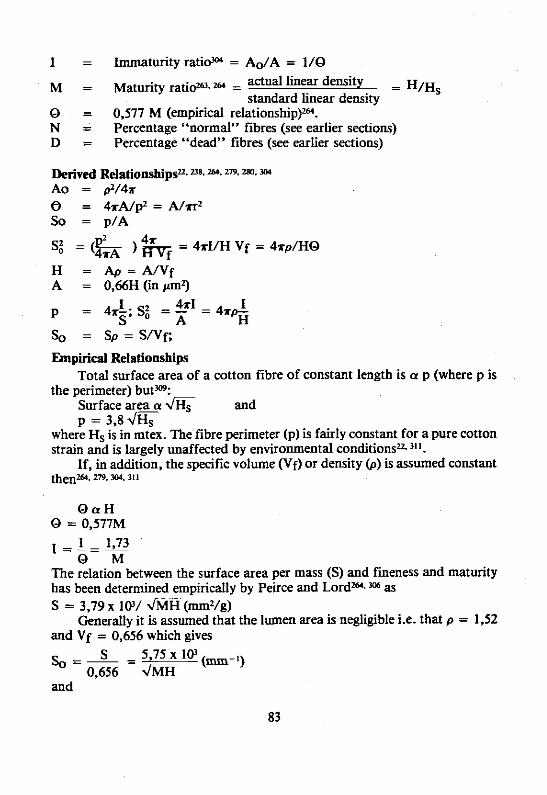
I = Immaturity rati* = W A = 1/Q
Q = 0,577 M (empirical relati~nship)~. N = Percentage "normal" fibres (see earlier sections) D = Percentage "dead" fibres (see earlier sections)
Empirid Relationships Total surface area of a cotton fibre of constant length is a p (where p is
the perimeter) butm: Surface area a and p = 3,s JHT
where Hs is in mtex. The fibre perimeter (p) is fairly constant for a pure cotton strain and is largely unaffected by environmental conditions% I".
If, in addition, the specific volume (Vf) or density (p) is assumed constant then7.64, 279. W, 111
- - - The relation between the surface area per mass (S) and fmeness and maturity has been determined empirically by Peirce and Lordm. fM as S = 3,79 x 1(Y/ m ( m m 2 / g )
Generally it is assumed that the lumen area is negligible i.e. that p = 1,52 and Vf = 0,656 which gives
and
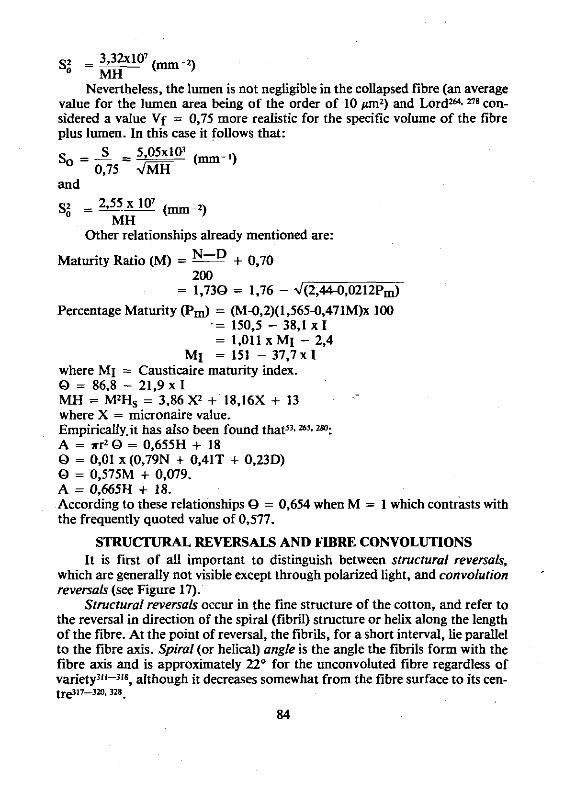
Nevertheless, the lumen is not negligible in the collapsed fibre (an average value for the lumen area being of the order of 10 pm3 and Lord" con- sidered a value Vf = 0,75 more realistic for the specific volume of the fibre plus lumen. In this case it follows that:
and
Other relationships already mentioned are:
N-D + 0,70 Maturity Ratio (M) = --
Percentage Maturity ( P d = (M-0,2)(1,565-0,471M)x 100 .= 150,5 - 38,l x I = 1,011xM1 - 2,4
MI = 151 - 37,7 x 1 where MI = Causticaire maturity index. Q = 8 6 3 - 21,9 X I MH = MZHs = 3,86X2 + 18,16X + 13 where X = micronaire value. EmpiricaUy.it has also been found thats1. m5. m: A = r r 2 Q = 0,655H + 18 Q = 0,01 x (0,79N + 0,41T + 0,23D) Q = 0,575M + 0,079. A = 0,665H + 18. According to these relationships Q = 0,654 when M = 1 which contrasts with the frequently quoted value of 0,577.
STRUCTURAL REVERSALS AND FIBRE CONVOLUTIONS It is first of all important to distinguish between structural reversals,
which are generally not visible except through polarized light, and convolution reversals (see Figure 17).
Structural reversals occur in the fine structure of the cotton, and refer to the reversal in direction of the spiral (fibril) structure or helix along the length of the fibre. At the point of reversal, the fibrils, for a short interval, lie parallel to the fibre axis. Spiral (or helical) angle is the angle the fibrils form with the fibre axis and is approximately 22- for the unconvoluted fibre regardless of v a ~ i e t y I ~ ' - ~ ~ ~ , although it decreases somewhat from the fibre surface to its cen- trp17-Irn, ".
84
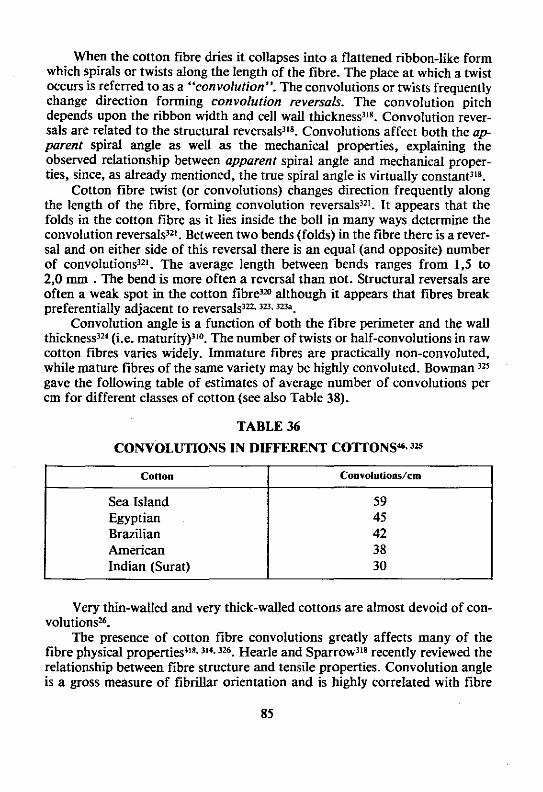
When the cotton fibre dries it collapses into a flattened ribbon-like form which spirals or twists along the length of the fibre. The place at which a twist occurs is referred to as a "convolution". The convolutions or twists frequently change direction forming convolution reversals. The convolution pitch depends upon the ribbon width and cell wall thicknessH8. Convolution rever- sals are related to the structural rever~als"~. Convolutions affect both the a p parent spiral angle as weU as the mechanical properties, explaining the observed relationship between apparent spiral angle and mechanical proper- ties, since, as already mentioned, the true spiral angle is virtually con~tant"~.
Cotton fibre twist (or convolutions) changes direction frequently along the length of the fibre, forming convolution reversalsIz1. It appears that the folds in the cotton fibre as it lies inside the boll in many ways determine the convolution reversalP. Between two bends (folds) in the fibre there is a rever- sal and on either side of this reversal there is an equal (and opposite) number of conv~lutions~~'. The average length between bends ranges from 1,s to 2,0 mm . The bend is more often a reversal than not. Structural reversals are often a weak spot in the cotton fib&" although it appears that fibres break preferentially adjacent to reversals1u. '~3 . Iwa.
Convolution angle is a function of both the fibre perimeter and the wall thickness324 (i.e. maturity)"O. The number of twists or half-convolutions in raw cotton fibres varies widely. Immature fibres are practically non-convoluted, while mature fibres of the same variety may be highly convoluted. Bowman IE
gave the following table of estimates of average number of convolutions per cm for different classes of cotton (see also Table 38).
TABLE 36
CONVOLUTIONS IN DIFFERENT COmONS"3x
cottoo I Coavolurions/rm
Sea Island Egyptian Brazilian American Indian (Surat)
Very thin-walled and very thick-walled cottons are almost devoid of con- volutions~.
The presence of cotton fibre convolutions greatly affects many of the fibre physical properties"8. 114.126. Hearle and Sparrow3'8 recently reviewed the relationship between fibre structure and tensile properties. Convolution angle is a gross measure of fibrillar orientation and is highly correlated with fibre

bundle tenacity (for G. hirsutum) as well as 40 or 50% X-ray angle, the latter two being more suitable measures of orientationln. The number of structural reversals in cotton other than G. herbaceum is = 20 per cm, while for G. her- baceum it is about 2 to 5 per cmIn. G. hirsutum cottons have = 32 convolu- tions per crn and = 23 structural reversals per cm . Convolution angles of G. herbaceum vary from 5 to 8' while those for G. hirsutum vary from 7,7 to 12,Son0, convolutions per cm varying from about 30 to 45 for the former and from about 45 to 75 for the latter3l0.
Biefringe measurements are regarded as a better measure of fibre orien- tation than convolution angle, it being correlated with bundle tenacity for both hirsutum and herbaceum cotton310.
Hebert"' found a high correlation between convolution angle and zero- gauge tenacity for different genetic varieties. He derived:
TO = Tke - k sidQc where To = zero-gauge tenacity (cN/tex)
Tk = zero-gauge tenacity of unconvoluted fibre = 52 cN/tex Qc = convolution angle corrected for edge curling.
TABLE 37
ZERO-GAUGE TENACITY AS A FUNCTION OF CONVOLUTION ANGLE'"

Fibre tenacity is inversely related to both X-ray angle and reversal fre- quencyfn, as the 40% X-ray angle increases, zero-gauge tenacity decreasesf'2. Elongation is directly related to both structural features". Bundle tenacity at zero-gauge and bundle elongation at 3,2 mm (1/8") gauge are highly cor- related with the 20% and 75% X-ray angles, respectivelyf*, the latter possibly being the best estimate of the spiral angls".
Cotton Crimp Cottons vary greatly in crimp59 " with finer cottons generally having
lower crimp energy than coarser onesS9. An optimum crimp has been postulatedz1.
FIBRE DIMENSIONAL. PROPERTIES Most American cottons vary in staple length from 19 to 34 mm and in
diameter from 15 to 22 pm6. In Sea Islands cottons, lint lengths up to 60 mm have been observed although staple length is generally around 44 mm . The total wail thickness of different types of cotton vary from about 0,35 to 15,5 pm .
Some properties of various conon types are given in the following tables:
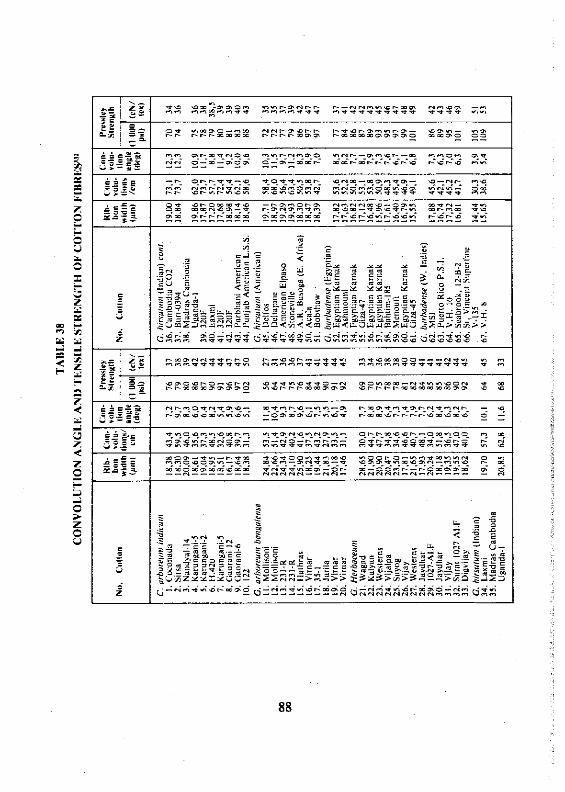
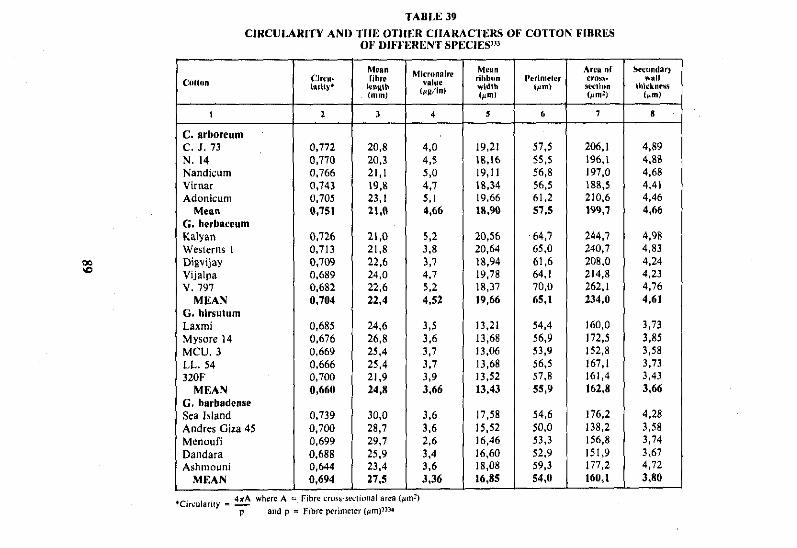
TAIILE 39 CIRCULARITY ANI) THE OTlIER CHARACTERS OF COTTON FIIIRES
OF DIFFERENT SPECIES"'
C. arboreurn
Nandicum Virnar Adonicum
C. herbaceurn Kalyan Westerns I Digvijay Vijalpa v . 797
MEAN G. hlrsuturn Laxmi Mvsore 14 MCU. 3 I LL. 54 320F
MEAN C. barbadense Sea Island Andres Giza 45 Menoufi Dandara Ashmouni
MEAN

TABLE 40 f i 6;
AVERAGE CROSS-SECTIONAL FEATURES OF COTT,ONS IN FOUR RANGES OF FINENESS3W 8
Fibre Samples
Fine American I Upland 1 155.26 1 11.89 1 143.37 I 10.92
Areas (rm2)
8
Coarse American I Upland 1 230,05 1 19,02 1 211.04 1 14.22
Dlsmetew (pm)
Lumen
~ e r ; coarse I Asiatic 1 174.26 I 27.49 1 346.78 I 12.53
- Very fine
Major 1 Minor
Rallo Major
Minar Major
9,77
Total Lumen Nett
98,90 1 10,54 1 88,38
A typical, mature raw cotton fibre is a flattened tube, examined under the low-power microscope, it is a long, twisted ribbon with slightly thickened edges. The basal fibre end is open and irregular, where it is tom from the seed coat in ginning, while the tip is closed, symmetrical, and tapered. There are many individual deviations from this typical fibre such as the more or less unflattened, tubular shapes that characterise extremely thick walled fibres, particularly those of Asiatic origin, and abnormalities such as forked, branch- ed, and bulged tipP.
Fibres of different species and varieties of cotton range in length from 1 000 to 4 000 times their widths, with values of 1 200 to 1 500 for the more common types. Actually, fibre width has only limited significance inasmuch as it may not reveal the amount of functional substance the fibre contains. In other words, both fibre width and wall thickness must be known if the dimen- sions are to have any meaninp.
The ways in which cotton fibre dimensions may change with various im- posed constraints are illustrated in figure W3'.

CONSTANT DIAMETER I 0 = 151
CONSTANT WALL THICKNESS n IW = 2.5)
D = 20 W = 2.5
SA = 3.05 WTlin = 5.25
0 = 1 5 W = 2.5
SA = 3.20 WTlin = 3.75
0 = 1 0 W = 2.5
SA = 3.55 WTlin = 2.25
CONSTANT WEIGHT PER INCH
CONSTANT SURFACE AREA
D = 20 W = 1.72 SA = 4.20
WTlin = 3.8:
D = 15 W = 1.80 SA = 4.20
WTlin = 2.85
D = l O W = 1.98 SA = 4.20
WTlin = 1 ,SO
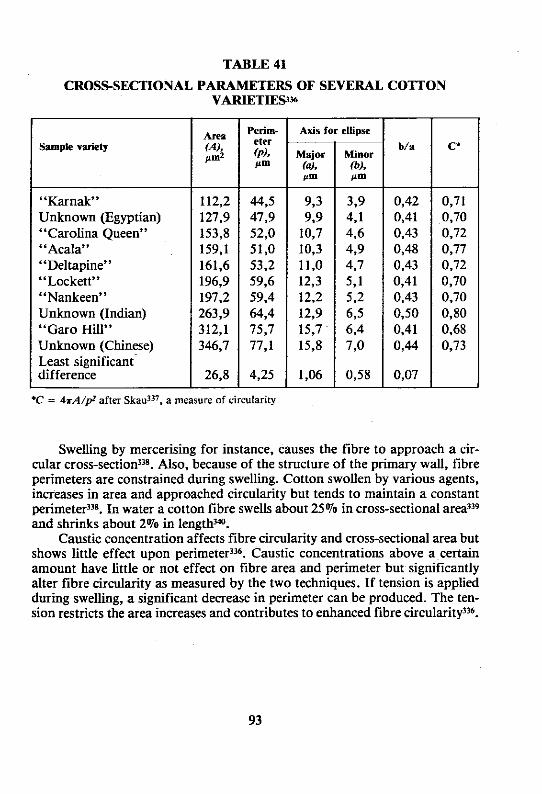
TABLE 41
CROSS-SECTIONAL PARAMETERS OF SEVERAL COTTON
Perim- eter (PA w
Axis for ellipse I
"Karnak" Unknown (Egyptian) "Carolina Queen" "Acala" "Deltapine" "Lockett" "Nankeen" Unknown (Indian) "Garo Hill" Unknown (Chinese) Least significant difference
*C = 4rA/p2 after Skad", a measure of circularity
Swelling by mercerising for instance, causes the fibre to approach a cir- cular cross-secti~n~~~. Also, because of the structure of the primary wall, fibre perimeters are constrained during swelling. Cotton swollen by various agents, increases in area and approached circularity but tends to maintain a constant perimeter338. In water a cotton fibre swells about 25% in cross-sectional area339 and shrinks about 2% in lengthw.
Caustic concentration affects fibre circularity and cross-sectional area but shows little effect upon perimeter3j6. Caustic concentrations above a certain amount have little or not effect on fibre area and perimeter but significantly alter fibre circularity as measured by the two techniques. If tension is applied during swelling, a significant decrease in perimeter can be produced. The ten- sion restricts the area increases and contributes to enhanced fibre circularity336.

TABLE 42
COTTON FIBRE SHAPE CATEGORIESU'
The fmessw of various fibres is compared in Table 43.
Roundish Elliptical Linear (flat)
greater than 0,s 0,5 to 0,8 incl less than 0,s
0,s to 1.0 0,22 to 0,5 less than 0,22
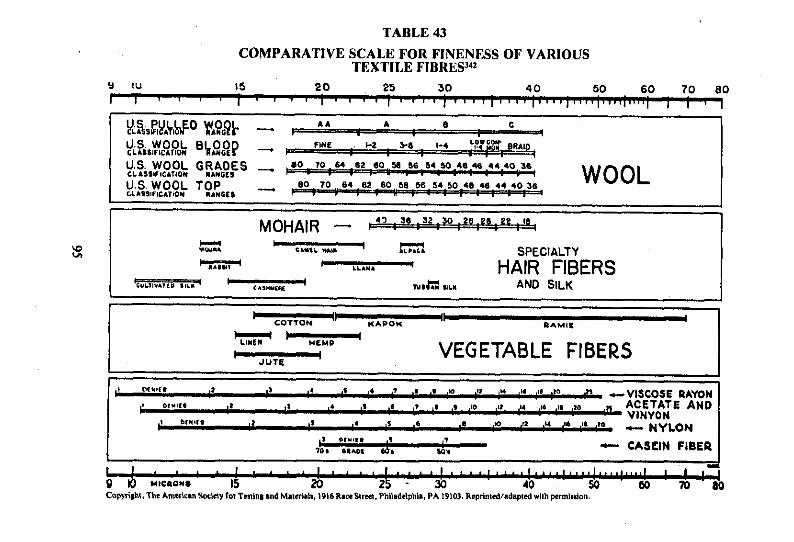
TABLE 43
COMPARATIVE SCALE FOR FINENESS OF VARIOUS TEXTILE FIBRES342
-- Cop~riC.Thr Amn1c.n Soein). ro, Tmlq and Matcri.ls, l9l6RarrStrn.Phllad~lphl~, PA 19103. R~prlnldladapld rl lh prmlulan.
Y IU I5 2 0 25 30 4 0 50 80 60 70 f I I r - , I ~ ~ ~ ~ I ~ ~ ~ ~ ; ~ ~ ~ ~ I ~ ~ ~ ~ ~ ~ ~ - ~ ~ ~ -
E
Y S & V A t t P %?,PI- - r A 4 I 0 C
%!?c?W%i ~'"fi8P - , FINE . 1-2 a 1-4 Lo.CD 14 I ~ O * 0n.w
YL?S,EcO. ik G $ , ' ? P - p - . z . . . . . . . . . ; , a0 70 M 62 GO,,% 56 54 W.40.UL.44.40 ,S.
U S WOOL TOP 8 0 70 6 4 82 00 50 56 $4 80.48 4 8 4 4 40 30 CLASWIC4liON mrW3CI - - . : ; . . . . a 1
WOOL
MOHAIR - F : - . :* 4 3 1 8 . S 2 SO I
CI1 l 'a- C."'L *.I" I m SPECIALTY %KF I LLLt4a t HAIR FIBERS
I c . ~ ~ . . ~ I N I ~ sILX AND SILK I -
I COTTON " NAPOM
1 RAW,,
.LI*tn. ' HEMP I
I JUTE I VEGETABLE FIBERS
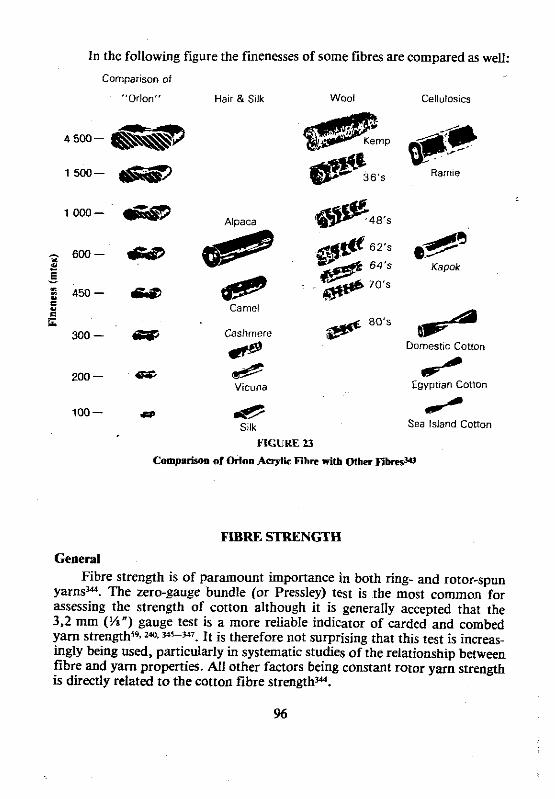
In the following figure the finenesses of some fibres are compared as well:
Comparison of
"Orlon" Halr & SOk
Alpaca
@ @@'
Camel
Cashmere
&' & Vscuna
& Silk
Wool Cellulosics
FIGURE 23
80's / 8
Domestic Cotton
Egyptian Cotton
# Sea Island Cotton
Comparison of Orion Aoylk Rbm with Other Fib+
FIBRE STRENGTH
General Fibre strength is of paramount importance in both ring- and rotor-spun
yarnsw. The zero-gauge bundle (or Pressley) test is the most common for assessing the strength of cotton although it is generally accepted that the 3.2 mm (%") gauge test is a more reliable indicator of carded and combed yarn ~ t r e n g t h ~ ~ ~ ~ ~ . ~ ~ ~ ~ ' . It is therefore not surprising that this test is increas- ingly being used, particularly in systematic studies of the relationship between fibre and yarn properties. AH other factors being constant rotor yarn strength is directly related to the cotton fibre strength".

It appears that often 70% or more of the changes in ring- and rotorspun yam strength are explained by the 3,2 mm (%") gauge strength-5.
Stronger cottons tend to produce fewer end breakages during spinning, the effect being larger for finer and low twist yarns19'.
The cotton classer's subjective strength ratings agree better with 5 mm- gauge tests than with zero-gauge tests, the former are also regarded as a better measure of tyre-cord and woven fabric strengths3".
Some typical stress strain curves are given below and illustrate the dif- ferences between the different fibres and the effects of tension and slack mercerisation in caustic soda on the fibre tensile properties3".
7 1
6 2
53
- 44 x m + . t -
35 C 0 < Z ,,, +
26.5
18
9
ELONGATION 1%) 5 1 0 15 2 0 FIGURE 24
Fibre ensile pmpcnies. Note lhat slack-mereerised and tension-mrcerised eoltons form two extremes beween rbieb fall the tensile properties of the other f i h m s h o w e 9

Because of the inherent variability of the cotton fibre it is rather time con- suming to carry out single fibre strength tests and it is therefore far more com- mon to measure the tenacity of a bundle of parallel fibres at either zero-gauge (i.e. the jaws of the tester not separated) or the jaws separated by '/a" (3,2 mm). For this purpose either the Pressley or Stelometer testers are used with the values always corrected to a common (international) level by using standard cotton samples supplied by the United States Department of Agriculture. On average, the Pressley tester gives values which are about 16% higher (10 to 15% has also been menti0nedp.3~~ than those obtained on the Stelometer3". A difference of 14% was obsewed in special test checks"'. It must be emphasized though that the use of calibration or standard cottons should eliminate such differences and it is important always to use calibration (standard) cotton samples. AU the results are adjusted to the Pressley level by means of the USDA calibration samples and when a zero-gauge is used the results are generally given as Pressley in 1 000 psi regardless of which instru- ment is used.
Bundle tenacity and extension values are correlated with single fibre results3J2.
Various ways of expressing the fibre tenacity are used (see Part I1 of this series) some of which are discussed below.
Bundle tenacity tests:
Pressley (commercial in 1 000 psi) = Pressley Index x 10,812 - 0,12 To convert Pressley (in 1 000 psi) to cN/tex multiply by 0,486. Strength-weight ratio = Pressley (in 1 000 psi) x 0,0925
= (cN/tex) x 0,190 breaking load in kg x 14,7
for %" (3,2 mm) gauge: cN/tex = bundle mass in mg ~ ~ ~ ~ - - ~ --- -
In one publicatiod" it was stated that cotton tenacity at zero-gauge (in cN/tex) = 0,454 x Pressley (in 1 000 psi). The conversion factor of 0,486 nor- mally used is to bring the valub into line with those obtained on a Chandler tensile tester.
Tenacity tests carried out at %" (3.2 mm) gauge are more highly cor- related with spinning tests2 I". There is a correlation between such tenacity results and fibre length1", the longer cottons being stronger. The Pressley In- dex varies from about 7 for weak cottons to I I or more for the very strong cot- tons2.
For %"-gauge (i.e. 3,2 mm) tests, the strengtWmass ratio (i.e. Ibs force divided by bundles mass in mg) is d e d the Pressley ratio and, based upon the average ratio of 3,19 obtained for the U S A . Crop in 1954, an index can be calculated as follows for a particular cottonz.
98

Presslev ratio 3,19
If this index is 100 the cotton equals the average for 1954; if it is below 100 the cotton is below average, etc. In one investigation2 it was found that the strength of cotton a t a gauge length of 4 mm was 42 to 55% lower than when tested at a zero gauge length.
Cottons have been graded as follows3w:
TABLE 44 Grading of Cotton according to P d e y ( i 1 000 Ibs/inebF
Pressley ( I 000 psi) Classification cN/tex c 70 weak < 34
70 to 74 unsatisfactory 34 - 36 15 to SO average 36,s - 39 81 to 86 strong 39,s - 42 82 to 92 very strong 42,s - 45 > 93 excellent > 45
(@gauge)
The following USDA classification has been given1":
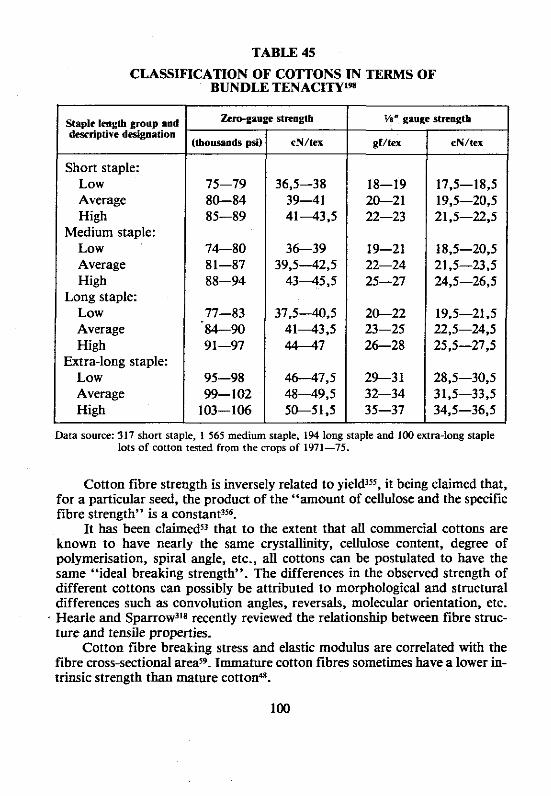
TABLE 45
CLASSIFICATION OF COTTONS IN TERMS OF BUNDLE TENACITYlm
Staple length group and dewriptire desipaation
Short staple: Low Average High
Medium staple: Low Average High
Long staple: Low Average High
Extra-long staple: Low Average High
5'8" gauge stmogth
Data source: 317 short staple, 1 565 medium staple, 194 long staple and 100 extra-long staple lots of cotton tmed from the crops of 1971-75.
Cotton fibre strength is inversely related to yield3jS, it being claimed that, for a particular seed, the product of the "amount of cellulose and the specific fibre strength" is a constantfs6.
It has been claimed53 that to the extent that all commercial cottons are known to have nearly the same crystalliity, cellulose content, degree of polymerisation, spiral angle, etc., all cottons can be postulated to have the same "ideal breakmg strength". The differences in the observed strength of different cottons can possibly be attributed to morphological and structural differences such as convolution angles, reversals, molecular orientation, etc. Hearle and Sparrow3'8 recently reviewed the relationship between fibre struc- ture and tensile properties.
Cotton fibre breaking stress and elastic modulus are correlated with the fibre cross-sectional area59. Immature cotton fibres sometimes have a lower in- trinsic strength than mature cotton48.
NolenW6 used the following formula to derive a cotton single fibre strength index from bundle strength.
Fibre Strength index = 4,29 x x Pressley x micronaire where Pressley is in thousands of pounds per square inch.
He states that the index so calculated gives a good indication of the nepping potential of a cotton.
Cotton fibre strength appears to have little effect on processing efficiency including spinningf5'-360.
Higher strength cottons produce stronger singles and two-ply yarns'm but cotton fibre strength does not influence the amount of twist required for max- imum yarn strength. Fibre strength does not affect sliver, roving and yarn evenness nor yarn extension at break'm. Rlending cottons differing in strength affects yarn strength but not spinning limits. Blending, within practical limits, can be carried out without serious disadvantagesi73. Fibre strength is regarded more important than fibre length in determining yarn strength".
In one report361 it was stated that, at optimum twist, fibre strength ac- counts for about 88% of the variation in yarn strength. In another study it was reportedw that, if micronaire is held constant, some 96% of the variation in rotor (OE) yarn strength can be accounted for by zero-gauge bundle tenacity.
Stronger cottons produce stronger knitted fabrics, whereas finer cottons produce stronger yarns but not necessarily stronger fabrics'". In a study on woven print cloth the following conclusions were drawn363. The strongest cot- ton produced the strongest fabrics in the warp direction (grey, bleached and dyed) but this did not hold in the weft direction for the bleached and dyed fabrics. Fabric extension at break appeared to be influenced more by mechanical treatment during chemical processing than by fibre properties. Fabric tear strength was correlated with bundle tenacity at zero-gauge. Fibre strength hardly affected abrasion resistance. Bundle strength (5 mm) also af- fects strength of resin treated cotton fabrics3M.
SOME EFFECTS OF MERCWSATION The changes occurring in the cotton fibre during mercerisation are
more physical than chemical in The most obvious changes are greater lustre, greater strength and improved dye affinity. During mercerisa- tion the cotton fibre untwists and assumes a more circular shape. The lumen swells and is almost closed. A mercerised fibre is more like a straight rod than a flattened, twisted ribbon365.
During the mercerisation process, proper tension must be applied. Other- wise, swelling will occur but the amount of untwisting will be greatly reduced. The entire process, consisting of impregnation, neutralisation and washing- off, must be one continuous operation for optimum results. Tension must be uniform and consistent until washing-off is completed. Low tension can cause a loss of lustre365.

The effect of mercerisation on cotton fibre shape is illustrated below=':
1 Unlrealeo cocon I ore ds $1 cnlers mercer.! ng range 2 Ca~srrc mprrgnauon - small cnange occurs m pnvscal form
Greater change occurs with time. Neutral~zation - more change occurs. Caustic washdf - fibre has become round. hollow centre is almost closed Some shrinkage occurs upon further washing.
7. More shrinkage occurs dur~ng drying.
RGURE 25 Fffm of m ~ w on cotton fibre sbnp"
The density of mercerised cotton is nearly the same as that of the native cottonm. Mercerisation reduces the effect of weak places in cotton fibres='. It appears that cottons with low maturity and low strength uniformity ratios (i.e. Yi" gauge to zero-gauge tenacity ratios) benefit most in strength as a result of mercer is at ion^. ".
High-maturity cottons, having a high strength-uniformity ratio, show a reduction in zero- and %"-gauge tenacity upon slack mercerisation, irrespec- tive of the c ~ l t i v a r ~ ~ . There appears to be a negative correlation between strength uniformity ratio and tenacity ratio (i.e. mercerised to unmercerised tenaaties), the higher the former the lower the latter3m.
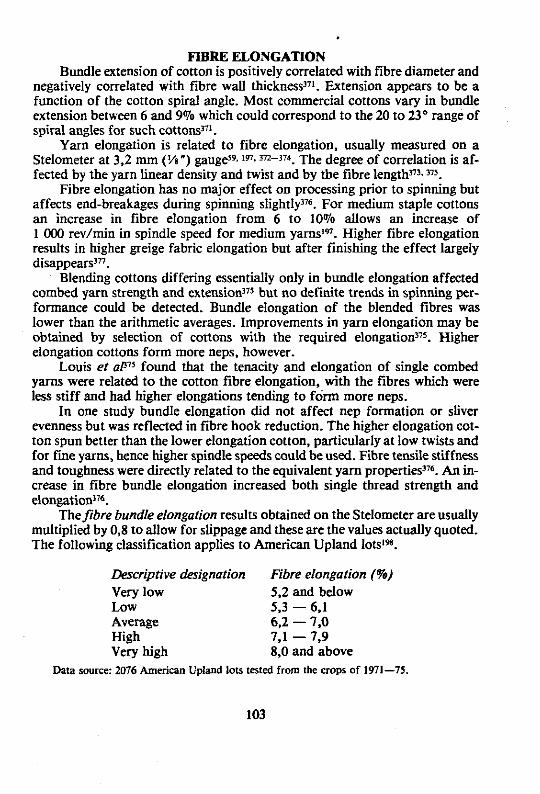
FIBRE ELONGATION Bundle extension of conon is positively correlated with fibre diameter and
negatively correlated with fibre wall thicknessJ71. Extension appears to be a function of the cotton spiral angle. Most commercial cottons vary in bundle extension between 6 and 9% which could correspond to the 20 to 23" range of spiral angles for such cottonsJll.
Yarn elongation is related to fibre elongation, usually measured on a Stelometer at 3.2 mm (Vn ") gaugeJ9. 19. m-374. The degree of correlation is af- fected by the yarn linear density and twist and by the fibre lengthn',"5.
Fibre elongation has no major effect on processing prior to spinning but affects end-breakages during spinning ~lightly3~6. For medium staple cottons an increase in fibre elongation from 6 to 10% allows an increase of 1 000 revh in in spindle speed for medium yarns1*. Higher fibre elongation results in higher greige fabric elongation but after finishing the effect largely disappears3".
Blending cottons differing essentially only in bundle elongation affected combed yarn strength and extension37s but no definite trends in spinning per- formance could be detected. Bundle elongation of the blended fibres was lower than the arithmetic averages. Improvements in yam elongation may be obtained by selection of cottons with the required e10ngation'~s. Higher elongation cottons form more neps, however.
Louis et found that the tenacity and elongation of single combed yams were related to the cotton fibre elongation, with the fibres which were less stiff and had higher elongations tending to form more neps.
In one study bundle elongation did not affect nep formation or sliver evenness but was reflected in fibre hook reduction. The higher elongation cot- ton spun better than the lower elongation cotton, at low-twists and for tine yarns, hence higher spindle speeds could be used. Fibre tensile stiffness and toughness were directly related to the equivalent yarn properties376. An in- crease in fibre bundle elongation increased both single thread strength and elongationJ76.
Thefibre bundle elongation results obtained on the Stelometer are usually multiplied by 0,s to allow for slippage and these are the values actually quoted. The following classification applies to American Upland lots1".
Descriptive designation Fibre elongation (%) Very low 5,2 and below Low 5,3 - 6,1 Average 6,2 - 7.0 High 7,1 - 7,9 Very high 8,O and above
Data source: 2376 American Upland lots fated from the crops of 1971-75.
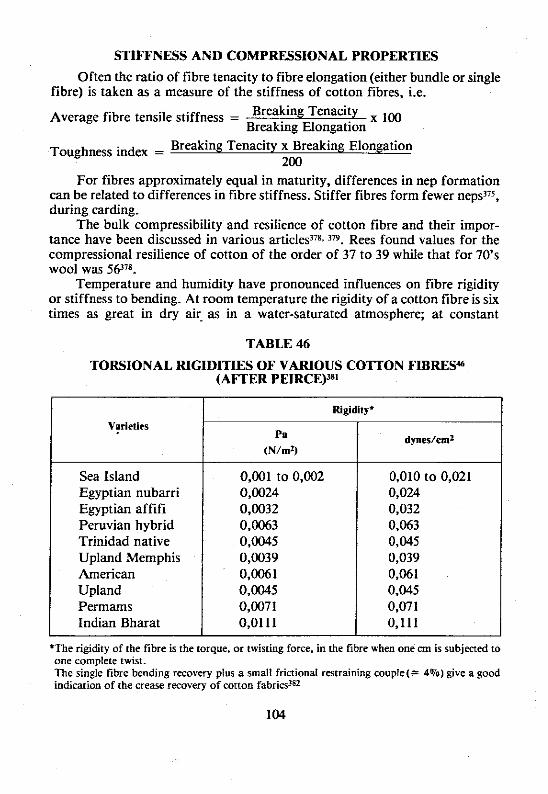
STIFFNESS AND COMPRESSIONAL PROPERTIES
Often the ratio of fibre tenacity to fibre elongation (either bundle or single fibre) is taken as a measure of the stiffness of cotton fibres, i.e.
Average fibre tensile stiffness = Breaking Tenacity 100 Breaking Elongation
Toughness index = Breaking Tenacity x Breaking Elongation 200
For fibres approximately equal in maturity, differences in nep formation can be related to differences in fibre stiffness. Stiffer fibres form fewer neps375, during carding.
The bulk compressibility and resilience of cotton fibre and their impor- tance have been discussed in various articles3178. Rees found values for the compressional resilience of cotton of the order of 37 to 39 while that for 70's wool was 5 P .
Temperature and humidity have pronounced influences on fibre rigidity or stiffness to bending. At room temperature the rigidity of a cotton fibre is six times as great in dry air as in a water-saturated atmosphere; at constant
TABLE 46
TORSIONAL RIGIDITIES OF VARIOUS COTTON FIBRES46 (AmER PEIRCEP1
Rigidit)'
Sea Island Egyptian nubarri Egyptian affifi Peruvian hybrid Trinidad native Upland Memphis American Upland Permams Indian Bharat
*The rigidity of the fibre is the torque, or twisting force, in the fibre when one an is subjected to one complete twist. The single fibre bending recovery plus a small frictional restraining couple(= 4%) give a good indication of the crease recovery of cotton fabrics3=
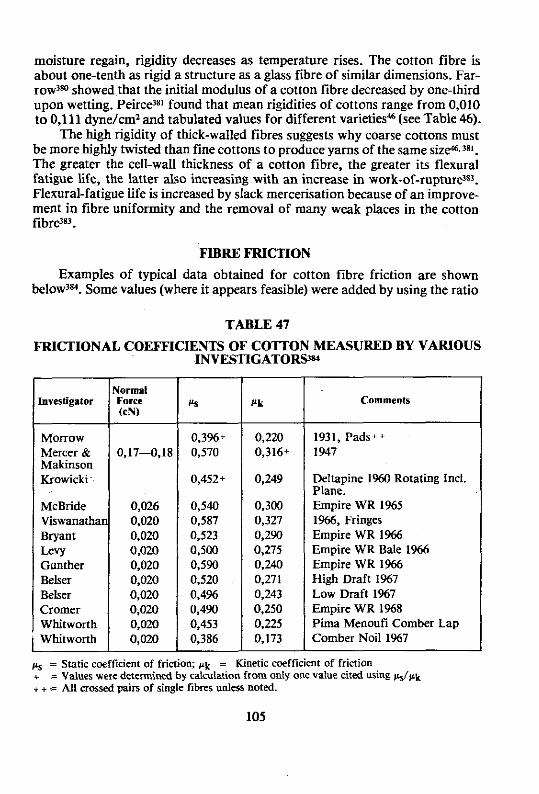
moisture regain, rigidity decreases as temperature rises. The cotton fibre is about one-tenth as rigid a structure as a glass fibre of similar dimensions. Far- row3" showed that the initial modulus of a cotton fibre decreased by one-third upon wetting. P e i r c P found that mean rigidities of cottons range from 0,010 to 0,111 dyne/cm2 and tabulated values for different varieties' (see Table 46).
The high rigidity of thick-walled fibres suggests why coarse cottons must be more highly twisted than fine cottons to produce yams of the same size46.381. The greater the cell-wall thickness of a cotton fibre, the greater its flexural fatigue life, the latter also increasing with an increase in work-of-~ptur@~~. Flexural-fatigue life is increased by slack mercerisation because of an improve- ment in fibre uniformity and the removal of many weak places in the cotton fibrGn3.
Examples of typical data obtained for cotton fibre friction are shown Some values (where it appears feasible) were added by using the ratio
TABLE 47
FRICTIONAL COEFFICIENTS OF COlTON MEASURED BY VARIOUS INVESTIGATOR94
Morrow Mercer & Makinson Krowicki
McBride Viswanatha~ Bryant Levy Gunther Beker Belser Cromer Whitworth Whitworth
Comments
1931, Pads++ 1947
Deltapine 1%0 Rotating Incl. Plane. Empire WR 1%5 1966, Fringes Empire WR 1% Empire WR Bale 1966 Empire WR 1966 High Draft 1%7 Low Draft 1%7 Empire WR 1%8 Pima Menoufi Comber Lap Comber Noil 1%7 i
,is = Static coeflicient of friction; pk =- Kinetic coefficient of friction + = Values were determid by calculauon from only one value cited using &/pk + + = All crossed pain of single fibres unless noted.
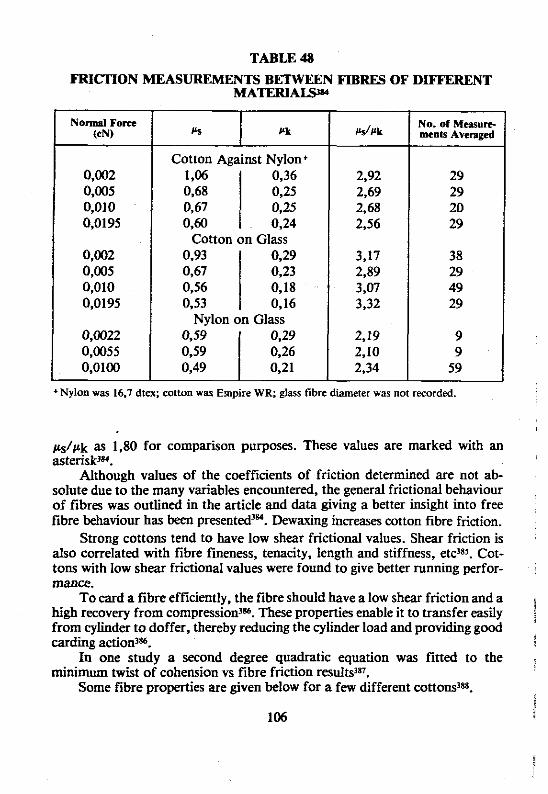
TABLE 48
FRICl'ION MEASUREMENTS B-N FIBRES OF DIFFERENT MATERlALyio
N o d F o m r-z- Cotton Against Nylont
Lo6 0,36 0,68 0,25 0.67 0.25 o m 0,24
Cotton on Glass 0,93 0,29 0,67 0,23 0,56 0,18 0,53 0,16
Nylon on Glass
NO. Of Mmre meals Avemged
+Nylon was 16.7 dtex; cotton was Empire WE. glass fibre diameter was not recorded.
ps/pk as 1,80 for comparison purposes. These values are marked with an asteriskw.
Although values of the coefficients of friction determined are not ab- solute due to the many variables encountered, the general frictional behaviour of fibres was outlined in the article and data giving a better insight into free fibre behaviour has been presented3=. Dewaxing increases cotton fibre friction.
Strong cottons tend to have low shear frictional values. Shear friction is also correlated with fibre fineness, tenacity, length and stiffness, etc3s5. Cot- tons with low shear frictional values were found to give better running uerfor- - - - rnance.
To card a fibre efficiently, the fibre should have a low shear friction and a high recovery from compressiod'. These properties enable it to transfer easily from cylinder to doffer, thereby reducing the cylinder load and providing good carding actiods.
In one study a second degree quadratic equation was fined to the minimum twist of cohension vs fibre friction results'".
Some fibre properties are given below for a few different cottons3".
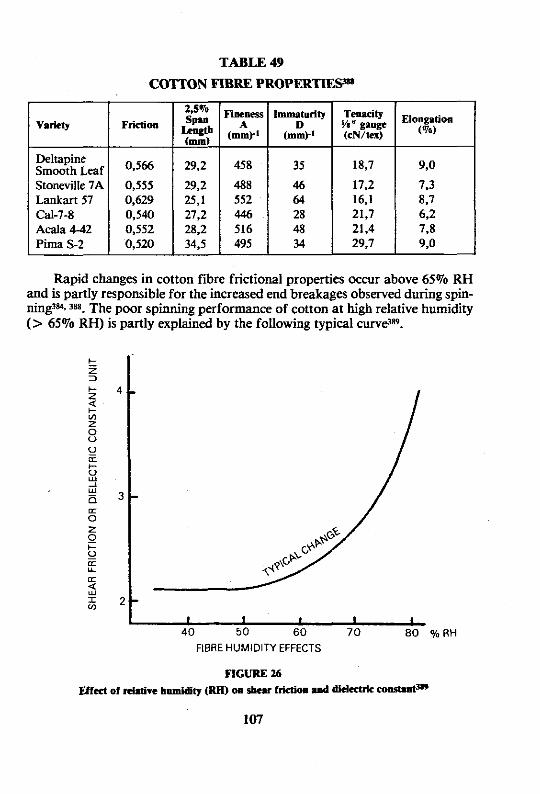
TABLE 49
COTTON FIBRE PROPERTIES91
2,5% vrliety
Deltapine
Stoneville 7A 0,555 Lankart 57 0,629 Cal-7-8 0,540 27,2 Acala 4-42 0,552 28,2 Pima S-2 0,520 34,5
Tenacity %" gauge (cN/tcx)
Rapid changes in cotton fibre frictional properties occur above 65% RH and is partly responsible for the increased end breakages observed during spin- ning3". 3ss. The poor spinning performance of cotton at high relative humidity (> 65% RH) is partly explained by the following typical CUN@.
FIBRE HUMIDITY EFFECTS

Frictional values increase with processing up to the carding stage (possibly due to fibre damage) after which it decreases agaid". Processing tends to smooth the cotton fibres and remove damaged ones, thereby reducing the average fibre frictiodw.
In one paper a correlation between fibre friction and convolution angle was found3%.
GENERAL FIBRE PROPERTIES
The followina tables give some general fibre characteristics for various - - . cottons.
TABLE 50
FLBRE CHARACTERISTICS OF VARIOUS COlTONSZU (AFTER LORD, 1962)
cotton
Sea Island St Vincent V.135 Egyptian Karnak EX Sake1 GS , Ashmouni FG
American Upland I USA 11/8th SWGM Uganda BP 52 Tanzania CLA Tanzania MZA Nigeria NA 1
American Upland 2 USA 15/16th M
- 32na in. - 62
49 50Y 38
41 41 38 38 36
33
25 -
m Linear hair mass a
Density linear densil H
(mtrx) H,
(mtex)

I les
TABLE 51 SOME COTTON FIBRE PROPERTIES3"
Span Lpogtb fmm)
Acala SJ 1 Deltapine 16 Rilcot 90 Brawley
70-118 Pima S4
A. B. C and I
*Stiffness = x IOO Extension
-
Micro- mire
1 1 21.2 4,s 1 5,s 1 0,58 3,9 23,9 10,4 1,24
turn L., and sample E is G . barbadense L.
**Toughness = Tenacity x Fxtensian x 0,035
The relationship between strength and length is illustrated on next page for American Upland Cottod9' (read Figure 27 in conjunction with Table 52).
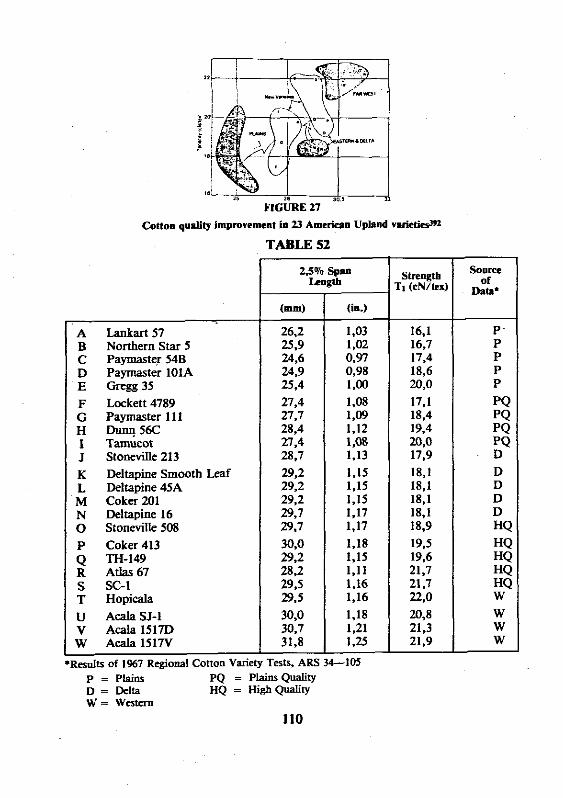
B Northern Star 5 C Paymaster 548 D Paymaster lOlA E Gregg 35
TABLE 52
F Lockett 4789 G Paymaster 111 H Dunq 56C I Tamucot J Stoneville213 K Deltapine Smoo L Deltapine 45A M Coker 201 N Deltapine 16 0 Stoneville 508 P Coker 413 Q TH-149 R Atlas 67 S SC-1 T Hopicala U Acala SJ-1 V Acala l5l7D W Acala l 5 l N
t
d t s of 1%7 Regional Cotton Variety Tests, ARS 34-105 P = Plains PQ = Plains Quality D = Delta HQ = Hi& Quality W = westem
110
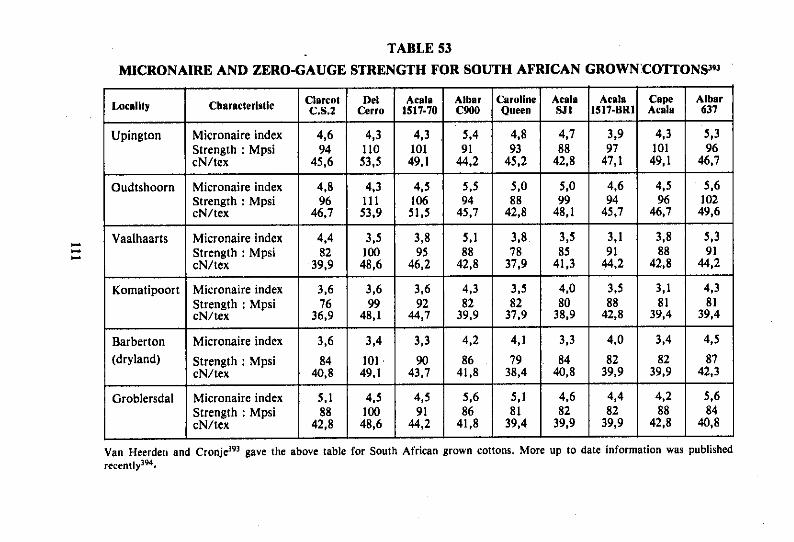
TABLE 53
MICRONAIRE AND ZERO-GAUGE STRENGTH FOR SOUTH AFRICAN GROWN COTTONS'93
Vaalhaarts Micronaire index 4.4 3.5 3,s 5,1 3,s 3,5 3.1 3,8 5,3 1 S t : p s i I 82 I I00 I 95 I 88 I 78 1 85 1 91 / 86 1 91 / cN/tex 39.9 48,6 46,2 42,s 37,9 41,3 44.2 42,8 44,2
Locality
Upington
Oudtshoorn
Komatipoort Micronaire index Strength : Mpsi cN/tex
I I I I I I I I I I
Barberton I Micronaire index 1 3,6 1 3,4 1 3,3 1 4,2 1 4 1 1 3.3 1 4,O 1 3,4 1 4.5
Char~cteristlc
Micronaire index Strength : Mpsi cN/tex
Micronaire index Strength : Mpsi cN/tex
1 Van Heerden and C~onje'~' gave the above table for South African grown cottons. More up to date information was published recentl~'P"
Clsrcot C.S.2
4,6 94
45,6
4.8 96
46.7
(dryland)
Groblersdal
Del Cerro
4,3 110 53,5
4.3 111 53.9
Strength : Mpsi cN/tex
Micronaire index Strength : Mpsi cN/tex
Acsls 1517-70
4.3 101
49.1
4.5 106 1
84 40,s
5,1 88
42,8
Albsr C900
$4 91
44.2
5 3 94
45.7
101 49,l
4,s 100
48,6
Carollne Queen
4.8 93
45.2
5,O 88
42.8
90 43,7
4,5 91
44,2
Acals SJ1
4,7 88
42.8
5.0 99
48.1
86 41,8
5,6 86
41,s
Acsla 1517-BR1
3.9 97
47,l
4.6 94
45.7
79 38,4
5,1 81
39,4
Cape Aesls
4,3 101
49,l
4.5 96
46.7
84 40.8
4.6 82
39.9
Albar 637
5,3 96
46,7
5,6 102
49,6
82 39,9
4,4 82
39,9
82 39,9
4,2 88
4 2 3
87 42.3
-
5.6 84
40.8

Country and variety
I Mexico
-
Laguna Torreson Matamoras Sonora Mexicali
Egypt Giza 30 Karnak Ashmouni Menoufi Zagora
Brazil North South
Peru Pima Tanguis Acala
TABLE 54
FIBRE lYROPERTIES OF SELECTED WORLD COTTONS'a
Staple Lenglh Micro- naire
- 4,3 4,O 4,7 4,o 4.7
4.0 4,O 4.2 4,4 4,)
3,9 4,O
3.4 4,7 3.4
Country and
variety
Pakistan 289F NT Azad 4F LSS Sind Desi India Oomra Bengsl Des Dhollera Gaorami Vijay
Broach. Jarilla Sudan Amerlcan Egyptian Short U. Stales Arizona 44 Calif. 4-43 DPL 15
Slaple Length
(in.) - 0,96 0.97 0.90 0.82 0.85 0,70
0.70 0,64 0 , w 0 3 6
.88 0.82
1.31 i,3O O,?O
1.09 1.11 1,08
Micro- nalre
- 4,5 4,8 4 3 5.3 5,O 7.3
6,) 7.6 5,4 5.1
4.9 5.6
4.2 3,8 3,l
4.3 4.0 4,4
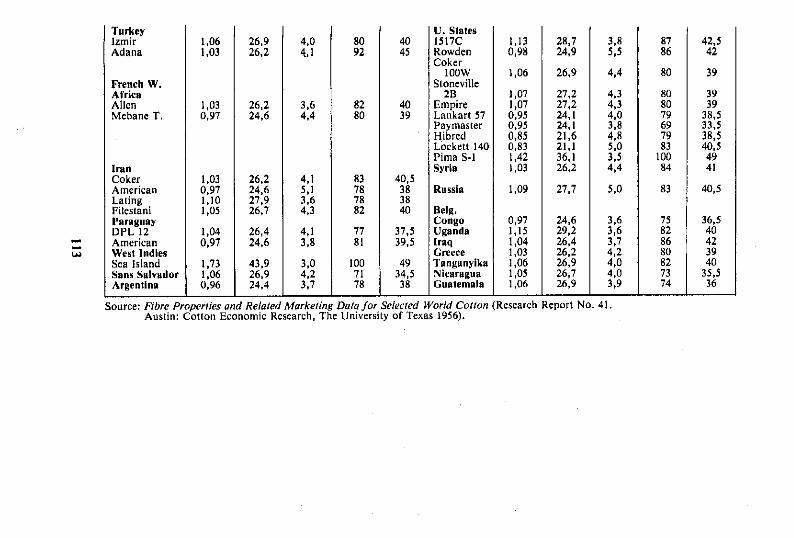
Turkey lzmir Adana
French W. Africa Allen Mebane T.
Iran Coker American Lating Filestani Paraguay DPL 12
Sans Salvador
Source: Fibre Properlies und Relala Austin: Cotton Economic R
4.0 4 1
3,6 4.4
4.1 5.1 3.6 4.3
4,l 3.8
3.0 4.2 3.7 -
furkelir arch, T
U. States 40 1517C 45 Rowden
Coker IOOW
Stonevilie 29
40 Emp~re 39 Lankart 57
Paymaster Hibred Lockett 14( Pima S-1 Svria
I
:port No. 41.
TRASH AND NON-LINT CONTENT
Cotton grade is determined subjectively by a composite rating of colour. foreign matter and ginning preparationla. Foreign matter is referred to as the kinds and amount of leaf, pieces of burrs, bracks, dirt, etc. This constitutes non-lint in lint cottons. The nature of the trash may be as important as its mass in determining grade198. Ginning preparation refers to whether the fibres have been damaged or entangled during ginning. Character includes those fibre pro- perties which are not included in either grade or staple Length. Generally recognised as components of character are fibre strength, maturity, fineness, spirality and drag. Terms usually used to describe character are hard, normal, soft , weak and perishedl~.
During harvesting and ginning, cotton seeds are broken to a lesser or greater degree depending upon the severity of the mechanical action]%. 396.
Seed-coat fragments can adversely affect spinning and can also adhere to the crush rollers on a It is also believed396 that cotton seed oil from seed- coat fragments and seed motes is related to sticking problems in processing.
The non-lint content of a cotton, particularly fine dust (micro-dust) has a particularly adverse affect-on rotor (OE) spinning since it builds up in the rotor groove and causes interference with the yam formation process and increases wear on machine parts. The deposit (dust) found in the rotor consists essential- ly of fragmented parts of the cotton plant and resembles the trash eliminated by the Shirley Analyserl%. The hard trash removed during the second passage of cotton through a Shirley Analyser correlates very well with rotor deposit3".
A seed-coat fragment may be defied as that part of a cotton seed that is broken from either a mature or immature seed during mechanical process- ingl97. It is usually black or dark brown and may or may not have fibres or linters attached. A funiculus is the slender stalk of the growing seed by which it is attached to the placenta of the boll. Fragments larger than 5 mm in diameter are removed readily, almost none remaining after two lint cleaners. More than two lint cleaners, during ginning, are not recommended because fibre breakage offsets any slight cleaning effectIm.
Broken fragments of seed or shell can cause trouble in the fabric through the bleeding of colouring matter when wet with an alkaline liquor399.
"Mote" is a whole undeveloped seed of any size or age, covered with fuzz and short fibres, certain of which bear mature lint fibres1". In one s t u d y it was found that motes, i.e. seed fragments clinging to the fibres - constitute a major portion of the trash, accounting for -75% of the total. In general, the blow room machines preferentially removes impurities other than motes so that there is a progressive increase in the relative concentration of the motes. Different types of beaters vary in their trash extraction capability although the position of a given beater in the sequence of machines appears to be im- material. At the card, there is a selective mote removal by the flats".
Nonlint (or trmh) content of cottons is generally determined by means of
114

the Shirley Analyser which separates the lint from the foreign matte@". For non-lint determination a 100 g cotton sample is generally passed twice through a Shirley Analyser.
The total non-lint values reported include both visible and invisible loss. These results are distinguished from total picker and card waste in that
practically no fibre is included, whereas textile mill wastes include appreciable amounts of fibre1-. Test performed in previous years show the following average relationship of Shirley Analyser non-lint to gradel-.
TABLE 55 APPROXIMATE RELATIONSHIP BETWEEN GRADE AND NON-LINT
Average Ame"an UpI(~nd Grade non-lint
- Data source: 4656 American Upland Colour and Trash Survey samples tated from crops of 1971-1975.
Strict Middling Middling Strict Low Middling Low Middling Strict Good Ordinary Good Ordinary
The following scale has been developed to represent the average non-lint content for grades of American Pima cotton?
TABLE 56
RELATIONSHIP BETWEEN AMERICAN PlMA GRADE AND NON- LINT
21 31 41 51 61 71
Amcriclo Pinu Grade
2 3 4 5 6 7 8 0
1 3 2 2 3,O 4.2 5,4 6,7
. 10,6 Data source - 1329 American PimaColor and Trash Survey Samples tested from the crops c 3971-1975.
115
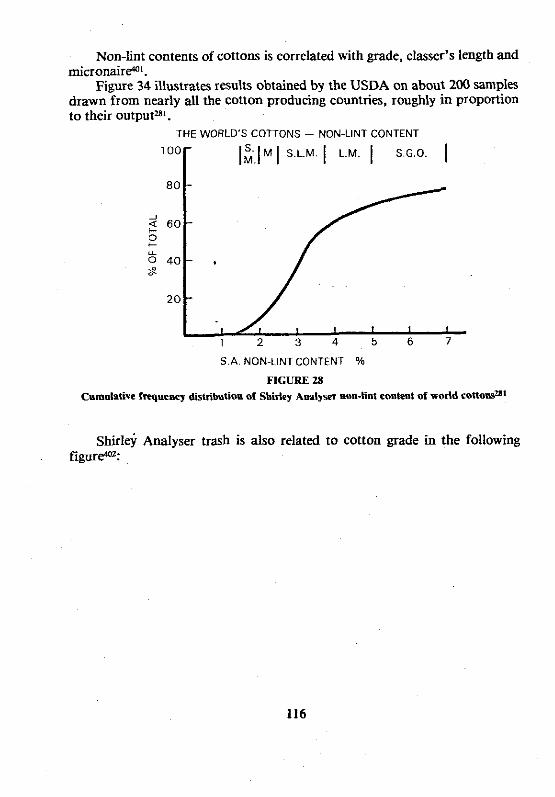
Non-lint contents of cottons is correlated with grade, classer's length and micronair@'.
Figure 34 illustrates results obtained by the USDA on about 200 samples drawn from nearly all the cotton producing countries, roughly in proportion to their output='.
THE WORLD'S COTrONS - NON-LINT CONTENT
loot- I i . 1 ~ I S.L.M. I L.M. [ S.G.O. I 8 0 -
0 C
2 0 -
1 2 3 4 5 6 7
S.A. NON-LINTCONTENT %
FIGURE 28
Cnmnlati~e fwneney distribution of Shirley Awlysor mu-lint content of world conor@'
~hirley Analyser trash is also related to cotton grade in the following f igure:

CLASS
SGM
TRASH
FIGURE 29 Average wpste quantities as a function of the class of rottoflz
(Shirley Analyser)
From 1946, when there were no lint cleaners in cotton gins, to 1974, the non-lint content of SLM cotton dropped from 5,2 to 2,8% in spite of harvesting shifting to mechanical picking during this periodm. The reduction has been ascribed primarily to lintcleaners and better g i m i n p . In 1979 it was estimated that, in the U.S., some 99% of the gins had one or more stages of lint cleaning, and some 82% had two or more stages".
The subjective grade assigned by the classer has been compared with op- tically measured non-lint content and the following classification of the Universal Standards for American Upland Cottons has been arrived at1".

TABLE 57
GRADE LIlWTS BASED ON OPTICALLY MEASURED NON-LINT CONTENT'"
White Colour Group Good Middling Strict Middling Middling Strict Low Middling Low Middling Strict Good Ordinary Good Ordinary
Spotted Colour Group Strict Middling Middling Strict Low Middling Low Middling
Tinged Colour Group Strict Middling Middling Strict Low Middling Low Middling
COmON DUST AND BYSSINOSlS
Other foreign matter is always present outside of the desirable cellulosic fibre produced by the plant itself: leaf, steam and other organic matter, and other elements such as fungi and possibly enzymes of one type or another which we are not completely and fully aware ofm. AU of these materials add up t o the causes within the processing and manufacturing operation of the health hazard being called brown lung or byssinosis. No one has as yet ab- solutely determined the specific causative agents in this rather elusive disease, although it has been linked to micro-organisms (and associated endotoxins) present in the dust liberated from cottorFe. Pre-cleaning, including washing, reduces airborn micro-organisms released during c a r d i n p .
Byssinosis is a chronic respiratory disease induced by the long-term in- halation of the dust produced during the procession of cotton, flax and soft

h e m p . Initially the disease is characterized by chest tightness and shortness of breath when the worker returns to the processing environment after having been away from the job for a weekend or longer. In later stages, which nor- mally occur after many years exposure, the afflicted individual can suffer loss of respiratory capacity and may become occupationally disabled4M.
Byssinosis, commonly called brown lung disease has been defied as acute and chronic responses in the lung by some individuals who have inhaled raw cotton d u s P . The acute phase was said to be very mild, and it takes a long time for the chronic disease to develop. From the time-of-development view- point, this is unlike the characteristics of a carcinogenw.
As far as the susceptible individuals go, it can range from 1 % to 60% of exposed persons, and generally from cotton trash and bract below 15 pm in particle size, so that operations that have the higher incidence are the early stages of yam manufacture such as opening, picking, carding, drawing and roving. Once these operations are completed, the incidence goes down for spooling, winding, twisting, slashing and weaving, due to the decrease in the amount of cotton dust fall-out. A normal individual exhales 75% t o 80% of air in 1 sec., and a decrease of 10% would be considered arbitrarily as a reac- tor; OSHA uses 5% decrease. The correlation between subjective vs objective symptoms is less than 1%. This was said to be the real problem in diagnosis. Smokers are said to he 600 times more prone to develop byssinosis and persons with asthma or chronic bronchitis are also more pronf l . The maximum work place concentration of dust allowed in milligrams of dust per cubic metre of air is given below for various countries?
MAXIMUM DUST LEVELS (mg/m-') Switzerland 1.5 total amount of dust Fed. Rep. of Germany 1,s total amount of dust at preparatory
machines up to and including card room USA . 1,O total amount of dust Great Britain 0.5 total amount of dust exclusive of fibres
longer than 2 mm USSR 4 total amount of dust
Dust levels of 0.2 m g h 3 have been proposed by OSHAw.
In 1977 OSHA released its proposed new standards for cotton dust. It proposed that after promulgation, engineering controls be implemented to en- sure that cotton dust (measured with a vertical elutriator) does not exceed 0,5 mg/m3, decreasing to 0,35 mg/m' in four years and to 0.2 mg/m3 in seven
The designation "total amount of dust" covers all the portions of matter taken in by the measuring appliance without sifting out any components. In
Great Britain all fibres longer than 2 mm are eliminated by means of an inter- posed screen.
The regulations of the individual countries generally prescribe how the dust sample is to be extracted from the atmosphere. Above all, the aspiration velocity is laid down. For instance it is 1.25 m/s in the Federal Republic of Germany. This velocity of the air is regarded as being equivalent to the rate of respiration. In this way, the penetration of heavy fly into the measuring ap- pliance is avoided. The manner of extraction of dust can lead to considerable variations in the dust concentrations measured.
In cotton spinning mills fibrous particles from the cotton plants are to be found along with non-fibrous fragments such as tiny pieces of stalk, leaf, seed- pods, husks and granules. Recently, the proportion of this trash bas increased owing to the employment of mechanical picking in the cotton fields. The dust also comprises mineral elements such as quartz granules along with various spores, mould fungus and yeasty substances408.
Cotton dust, plant parts, gin trash and weed samples have been analysed chemically in an attempt to identify causal agents for byss inos i~~~~. A typical bale of strict low middling (SLM) cotton contains about 0,s to 1,0% bract trash"2. Leaf-like particles, including bracts, comprise about 70% (by mass) of respirable cotton dust412.
In one study it was found that the total number of dust particles per- cubic-metre in the card room, airborne cotton dust was drastically reduced by the Shirley Analyser (SA) cleaning at the gin, although the reduction in dust level did not produce a change in the particle-size distribution in the respirable size range (less than 15 pm in diameter)"]. The respiratory function change of human test.suhjects when exposed to the cotton dust in the card room was identical for both the SA-cleaned and the normally-ginned cotton. The evidence provided by this experiment indicated that the extreme mechanical cleaning of lint at gins may not of itself he expected to provide relief from byssinotic symptoms among cotton mill workers4'3.
The use of single process blow room machinery, all enclosed automated bale opening and cotton feeding procedures will reduce the dust suhstan- tiallp". Oiling while utilising coarse cotton, blending with fine or synthetic fibre reduces the dust hazard. Card machines should be all-enclosed with overhead exhaust hoods and automated exhaust stripping. Air-conditioning seems to be effective in reducing dust greatly in spinning and high speed win- ding needs an improved ventilation system. Increasing dust load aggravates a decline in lung function in byssinotic and even asymptomatic workers. There seems to be a distinct pattern of decline in function with byssinosis, different from chronic bronchi ti^"^. Card production rate signicantly affects dust4ls.
A shdy by Burlington revealed the following with respect to the prevalence of byssinosis in textile plants4'6.

TABLE 58
PREVALENCE OF BYSSlNOSlS IN TEXTILE PLANTS4I6
The Burlington steam treatment technique is claimed to reduce or even eliminate byssinosism5.
Treatment of cotton with additives appears to have potential for effective dust control in the textile mill4". Additives, used in conjunction with existing air cleaning systems, might provide adequate dust control and thus negate the need for installation of additional expensive air cleaning systems4". The mechanism of dust control has not been fully explored. The effectiveness of oil treatment, however, suggests that the dust was fvred to the fibre, by wetting or adhesive action, so that it was not liberated during proce~sing4~'.
It has been found418 that the steaming of cotton lint (subsequent to ginn- ing) reduced ambient dust levels during carding. The steaming operation ac- tually removed dust, decreasing the Shirley Analyser waste from 14% to 10,7%. Steaming had no effect on lint grades but it increased staple length by about 0,8 mm in one sample. Slight tendencies towards yellowness and reduc- ed yarn strength as a result of steaming were observed, howevePls. Attempts are being made to breed cottons with a more closed boll and less total plant matter so as to reduce trash and dust during proces~ing"~.
Various other articles deal with byssinosis and dust, including the reduc- tion of dust4lza'-m, particularly by washing the cottonu.
Department
Preparation Yarn producing Weaving
TOTAL
cottom plan6
Range
- - -
11-25%
Coaon-manmsde blend plants
Average
38% 15% 15%
17,670
Range
- - -
69%
Control plant (no cooon)
Average
20% 4% 6%
7,7%
Range
- - -
-
Average
- - -
1 70

GENERAL PARTICLE CHARA(;TERISTICS The following tables give some details of particle sizes.
TABLE 59
CHARACTERISTICS OF PARTICLES AND PARTICLE DISPERSOIDS4n
Particle Diameter, rp. 1 mrn
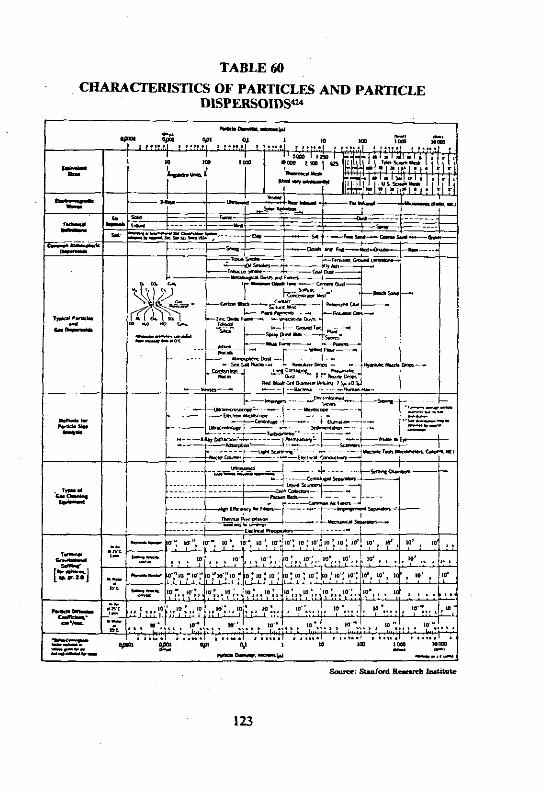
TABLE 60 CHARACTERISTICS OF PARTICLES AND PARTICLE
DISPERSOIDS4u

WASTE DURING PROCESSING The waste produced in a cotton textile mill (see Figure 30) is an important
factor in determining the cost of operating and therefore in influencing the profits of the mi IP . Since cotton goes to market principally in the form of products manufactured by the mills, better control of waste production and in- creased value of the waste produced are also important to those segments of the cotton industry which supply the raw fibre.
- BagglnL Ttes
- Mote5
clearer sweeps
- Nolls
Thread waste Clearer sweeps
Thread Waste
. Thread waste
Thread waste
, RXKS
FIGURE M
Row chart showing tbe mom important types of cotton waste produd, aad their poiat of origin in the milW

Since trash content is a factor in grade, lower grades of cotton should ob- viously yield more waste. Staple length also has an influence. Greater percen- tages of picker and card waste are obtained by processing the longer staples than by processing corresponding grades of shorter staple lengths. Slower dof- fer speeds are used for the longer staples; this automatically decreases the speed of the feed roll and hence results in a more thorough carding action of the longer staples4=. The average relationship between grade and manufactur- ing waste is shown in Table 61.
TABLE 61
AVERAGE PEHCENTACKS. PICKER AND CARD WASTE, FOR AVAIIABLE GRAIIES OF COTTOX
I Medium and I Long-staple shorl staples Upland
(%) (%) I Good middling Strict middling Middling Strict low middling
Opening room Carding room Drawframes & flyers Spinning machines
Total amount of waste Noils (combing)
A percentage of about 4 to 5% of waste may be taken as a mean value in respect of the amount of blowroom and licker-in waste produced4". To this must be added about 1.5 to 2% filter waste and flat strips. Utilisable waste consists mainly of flat strips, filterwaste and comber waste which may in fact be re-cycled either as an unmodified waste lot or mixed with raw cotton of a lower grade. Blowroom and ticker-in droppings are generally classified as non- utilisable wast@. This could be incinerated in the mill's own furnace.
For "middling" cotton the following table indicates the amount of waste occurring at the various machine+'.
TABLE 62
WASTE OCCURRING AT VARIOUS MACHINE!F7
6 3 7.2 &I 9.3
approx 3 to 7% approx 3% approx 0.5% approx 1 to 2 Yo
approx 7,5 to 12,5% 10 to 2070
9,9 10,9 11,9 13,1
In ring spinning, fly can amount to something like 0,570 of production. Today waste is increasingly being used, particularly in rotor (OE) spin-
ning and the following tables indicate waste-fibre recovery and usage2.

TABLE 63 TEXTILE WASTES - FIBRE RECOVERY AND USAGE4*
Possible usen
Ki 0,
Waste cleaner NOVACOTONlA NC Roving waste opener VOS
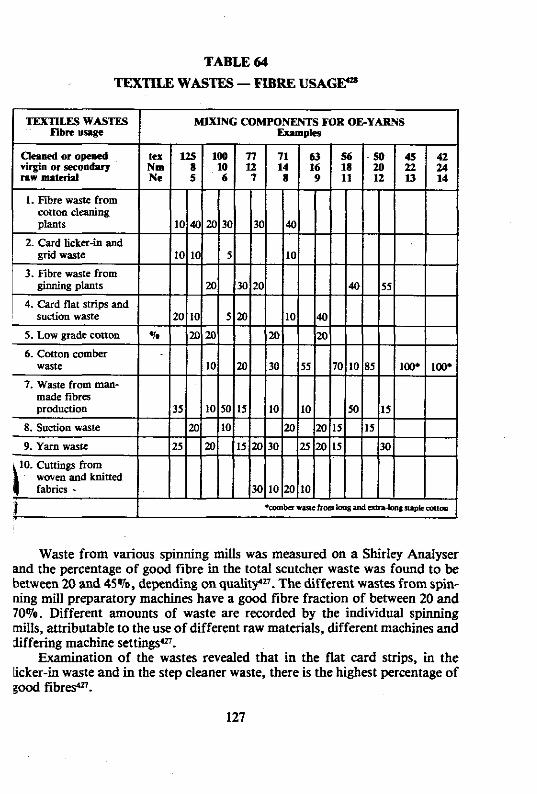
TABLE 64
TEXTILE WASTES - FIBRE U S A G P
TEXTILES WASTES MIXING COMPONENTS FOR OEYARNS Fibre usage Eumples
tes 125 100 7 l 71 63 56 50 45 42 ad or Oped Nm 8 10 14 16 18 m Z 24 virgin or moo- Nc 5 6 7 8 9 11 12 13 14
Waste from various spinning mills was measured on a Shirley Analyser and the percentage of good fibre in the total scutcher waste was found to be between 20 and 45%, depending on qualitpn. The different wastes from spin- Ring mill preparatory machines have a good fibre fraction of between 20 and 70%. Different amounts of waste are recorded by the individual spinning mills, attributable to the use of different raw materials, different machines and iiffering machine settings4n.
Examination of the wastes revealed that in the flat card strips, in the iicker-in waste and in the step cleaner waste, there is the highest percentage of zood f ibreP.
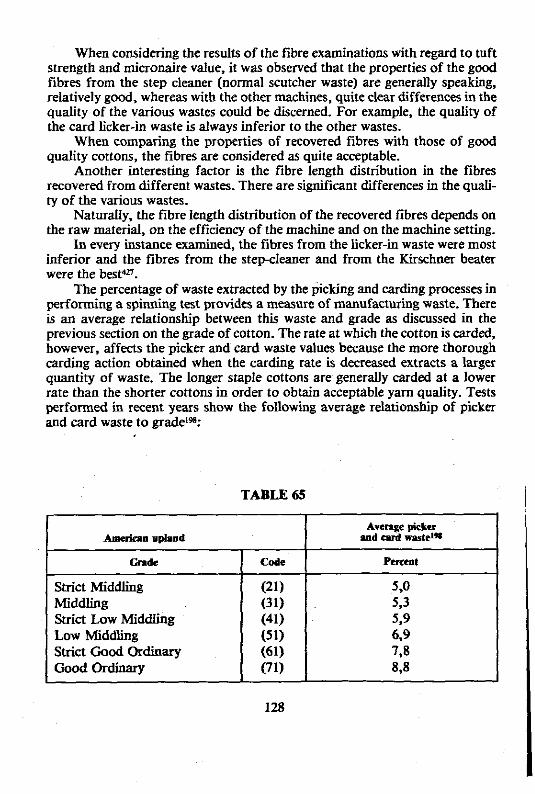
When considering the results of the fibre examinations with regard to tuft strength and micromire value, it was observed that the properties of the good fibres from the step cleaner (normal scutcher waste) are generally speaking. relatively good, whereas with the other machines, quite clear differences in the quality of the various wastes could be discerned. For example, the quality of the card licker-in waste is always inferior to the other wastes.
When comparing the properties of recovered fibres with those of good quality cottons, the fibres are considered as quite acceptable.
Another interesting factor is the fibre length distribution in the fibres recovered from different wastes. There are significant differences in the quali- ty of the various wastes.
Naturally, the fibre length distribution of the recovered fibres depends on the raw material, on the efficiency of the machine and on the machine setting.
In every instance examined, the fibres from the licker-in waste were most inferior and the fibres from the stepcleaner and from the Kirschner beater were the best4n.
The percentage of waste extracted by the picking and carding processes in performing a spinning test provides a measure of manufacturing waste. There is an average relationship between this waste and grade as discussed in the previous section on the grade of cotton. The rate at which the cotton is carded, however, affects the picker and card waste values because the more thorough carding action obtained when the carding rate is decreased extracts a larger quantity of waste. The longer staple cottons are generally carded at a lower rate than the shorter cottons in order to obtain acceptable yarn quality. Tests performed in recent years show the following average relationship of picker and card waste to grade'":
TABLE 65
I Aver8ge picker and cud w a s t e I

TABLE 66
Data source: 4 656 samples of American upland cotton and 1 329 samples of American Pima cot- ton tested for Shirley Analywr nonliot content from the crops of 1971-75 and picker and
card waste calculated from its relatiomhip to Shirley Analyxr nonlint content.
~ P i l l u
CRdc
2 3 4 5 6 7 8 9
It has also been estimated thaPm: Picker and Card waste = 27.7 - 0.15 (Grade index) - 4,03 (UHML)
- 0,54 (Micronaire) with a standard error of 0,90%.
Avenge picker md ard waste
Per cent
7,7 7,9 8,4 8 3 9.7
10,6 12,O 12,6
By means of this equation only 39% of the variation in picker and card waste could be accounted for.
Under the same operating conditions the amount of waste per flat strip is a good indication of the quality of cotton and of the total amount of waste that is being made at the card, for the flat strip is correlated to the amount of waste that is removed at other points on the card2. Such tests are considered essential after grinding or after settings have been changed on the card2.
EkTECT OF PROCESSING ON FIBRE PROPERTIES Mechanical processing affects cotton fibre properties4m to some extent
although the wet finishing operations such as bleaching, mercerisig and resin- finishing generally alter the fibre mechanical properties more than carding, spinning and weavingm. Changes in cotton fibre properties are reflected in the fabric propertidm. It has been found that tint cleaning at the gin caused a slight but consistent decrease in micronaire reading, the latter changing from 4,81 to 4,76 to 4.75 to 4.74 respectively Ster zero, one, two and three stages of lint cleaning3l. The reasons for the decrease in micronaire reading with lint cleaning is not clear although it was suggested4" that the removal of foreign
matter affected the minonaire reading. In one study, processing cotton into yarn appeared to have little effect on the length, crystal alignment and mechanical properties of the fibres, except that elongation decreased, the ini- tial modulus increased and the maturity of the carded cotton was slightly lo~er '3~ . Other workers have, however, reported fibre damage upon process- ing. An estimate of fibre damage (breakage) during carding by comparing fibre lengths prior to and after carding may be misleading due to fibre stretch- ing and the removal (in the waste) of short fibres43'. Damage to the fibre walls, however, can be assessed by means of alkali centrifuge values (ACV). Varying the speeds of certain card components did not produce, in selected fibre pro- perties, variations large enough to identify any general region within the card as a possible source of
Carding and combing should increase the 2,5% span length and the 50% span length, due to the removal of short fibres4", although fibre breakage can counteract this. The effect of processing on the 50% and 2,570 span lengths of cotton has been investigated4". It was found that in spite of the removal of short fibres during opening and carding these processes reduced both the 2,570 and the 50% span lengths. This indicated some fibre breakage during both opening and carding. On average, opening reduced the two span lengths by 4%. carding reduced them by a further 3% and breaker and finisher draw- ing each by another 1%. The average span length values for fibres in the rov- ing were about 5% higher than those in the finisher drawframe sliver while those of the fibres in the yarn were approximately 1% higher than those of the fibres in the roving. The 2,570 span length value for the yams was 4% lower than that for the original cotton mix while the 50% span length was 2% lowee35. PeircPw states that card sliver and cotton lint have very similar length characteristics. There is some breakage in going from lint to card sliver, most of which occurs in the card. This is compensated for by the removal of short fibres. If anything, the fibre length in card sliver is slightly lower than that in the lap; the card does appreciable damage to the fibres but eliminates most of the fibres it breaks. Very little breakages occur in the blowr~om'~.
Fibre linear density, as determined after combing, is generally lower than that determined on the material prior to combing, probably due to the fact that combing removes short fibres which tend to be coarse+=.
Elsewhere it is stated, however, that combing not only eliminates shorter fibres but also the finer and immature fibres417.
In another study on cottons438, it was found that combing generally in- creased mean fibre length and decreased the short fibre content.
According to Audivertm et a1 (quoting results obtained by Grundef13439) conon undergoes small changes in mean fibre length during processing but neither the modal nor the maximum fibre length is altered.

NIPS (see also Micromire and Maturity) Neps occur in all ginned cottonw (but hardly in unpicked cotton)=,
mechanical operations such as machine picking, handling, drying, cleaning, ginning, lint cleaning and particularly carding producing nepsul. % I . A nep is generally defmed as a defmite fibre tangle having a hard central knot or centre sufficiently large to be detected easilym. Neps are small knot-like aggregates of tightly entangled cotton fibres normally not larger than a common pin head. Naps are similar to neps but are usually larger, may show seed fragments and are not as closely entangled. Neps are usually associated with immature or f i e fibres and are caused by the entangling of these fibres during processing. In spinning, the nep can interfere with the drafting and cause an end breakagsm. Neps detract from the appearance of fabrics when they are to be dyed or printed because neps absorb dyes differently and appear as spots on the finish- ed materiallm. In yarns, neps are small specks consisting often of a tangle of fibres>". The following has been reproduced from an excellent review by WegeneP*:
Whilst cotton neps occur not only in raw cotton, but also in semi-finished products, in the yam and the finished fabric, the dubs contained in wool are formed during its processing. Similarly the dubs found in semi-finished pro- ducts, yarns and fabrics made from synthetic fibres are mostly formed in the course of processing.
Cotton neps De Meulemeester, Raes and De BackeP3 subdivide cotton neps in respect
of their nature as follows: (1) Fibre neps (USA: neps). They are the actual neps and consist of en-
tangled fibres which make their appearance as small knots. (2) Leaf neps (husk neps, USA: neps). They consist of leaf fragments en-
tangled with fibres. (3) Linters neps (USA: motes). These are conglomerations of normal
fibres and linters (frequently of a furry nature) with seed particles. (4) Neps made up of dead fibres (USA: matted fibres). These are fibre
bundles formed from parallel fibres and have a mat yellow gleam. These fibres are dead, adhere to one another, but can be separated.
Depending on the type of cotton neps, mature, immature or dead fibres may occur in them. According to De Meulemeester, Raes and De BackeP3 the fibre neps and leaf neps contain mainly dead fibres, the linter neps both mature as well as immature and dead fibres. Fessmannw discovered in the pro- cessing neps a considerable share of mature fibres apart from immature and dead fibres (mostly severed fibre tips). NeukirchnePs discovered that the neps occurring in the cotton card web consisted mainly of dead fibres. Frequently a mature, especially strong fibre (catching device) is the cause for the creation of the nep. Sometimes a sack-shaped deformity of a fibre (fibre collector) forms the centre of the nep.
131
Airborne fibres of different types (fly) also contribute to the formation of neps. Coalesced fibre entanglements are created as a result of the contents of the lumen escaping; the causes of this could be premature harvesting or damage due to insects. In such cases, the fibres will no longer mature. Coalescence of fibres may also be caused by honeydew (the excretions of aphids). Neukirchnef15 found that a cotton nep consists in most cases of con- glomerations of similar fibres. De Meulemeester, Raes and De BackeF fre- quently found fibres with broken-off ends in cotton neps. If a fibre breaks during processing it often rolls itself up and wraps itself around other fibres in the process, thus forming a nep.
he neps contained in cotton have a different dye affinity than the rest of the cotton fibres as a result of their high content of immature and dead fibres. The dying variations can be reduced considerably by mercerization (FessmannM, KDW7, Goldthwait, Wiles and Von S a l e ) .
During processing of the cotton in the spinning mill, neps are both eliminated or disentangled as well as new ones formed. FessmannM gives priority to the elimination of neps in favour of their disentanglement, since the neps contain a large share of dead and immature fibres leading to an un- favourable spinning structure. Up to the last scutcher, the number of neps is progressively reduced, this fact being correlated with the elimination of the im- purities contained in the cotton. At the same time new neps are being formed in the processing stages prior to the scutcher, thus increasing the number of neps contained in the cotton. Moreover (according to Ebertu9, Suebiw? and HartenhaueP1), the number of neps is increased in the scutcher.
A processing stage which does reduce neps is the carding process. On the card, more neps are eliminated or disentangled than the number of newly formed ones which are added.
The nepreducing effect of the card can be considerably increased by a number of measures. However, the realization of many of these measures is frustrated occasionally as a result of the reduction in output connected with themM. -.
The nepredudng effect is reduced as the card clothing M s up7 . 6'. ". Perner and J u n p state that the number of neps contained in the card web shortly before the card clothing is cleaned can often be double that of the number of neps in the card web shortly after the card clothing has been clean- ed. So far as the elimination of neps is concerned, the use of a tandem card or a second passage through the card will be advantageous. In addition, the use of calendering rollers will reduce the nep content considerablp". Normally a card will eliminate a greater percentage of neps, the more neps there are in the lap.
W h i t a further reduction of the number of neps is achieved at the cornbe+. 4 6 ~ the nep content may increase under certain conditions at the draw frames and speed frames. The formation of neps will be encouraged by
132

an insuffiaent degree of orientation and by the presence of fibre hook~'5~. ". According to FessmannU the formation of neps during drafting may also be caused by the breaking of excessively Long fibres.
The formation of processing neps depends on a number of influences, such as fibre characteristics and parameters peculiar to the particular process- ing method. There are correlations between the characteristics which affect the formation of neps in cotton, thus indicating that the connection found be- tween the tendency towards the formation of neps and one or the other of the characteristics need not necessarily be causative. ( 1) Fibrefinenm
Fier cotton fibres have a stronger tendency towards nep formation than coarser ones. This does not only apply to processing neps but also to harvesting neps. The reason for the increased tendency of the finer fibres to form neps is the low stiffness of these fibresm.43. 451.452.457,46647z.
( 2) Degree of fibre rnaturiry In general, the tendency of cotton to form neps increases with a rising share in dead and immature fibres or with a decrease in the average maturity of the fibres, respectivelp3. 468.
( 3) Staple length The effect of the staple length on the tendency towards nep formation is controversial. De Meulemeester, Raes and De BackeTM3 deny any such ef- fect. HartenhaueP1 states that an increase in the tendency towards nep formation can be correlated to an increase in the staple length of the cot- ton, since a long-staple cotton frequently has a greater mean fibre fineness than a short-staple one.
( 4) Fibre strength, elongation, elasticity, bending strength As the values of these fibre properties decrease, the tendency of the cot- ton to form neps increases, one of the reasons why broken fibres play a dominant part in the formation of nepF.47. 4J1.67.
( 5) Nep content of the raw cotton A cotton which has a high nep content already at the delivery stage, will also show a tendency towards nep formation during processing**l. De Meulemeester, Raes and De BackeTMj found a definite correlation be- tween the number of neps in the raw cotton and the number of neps in the card web; however, the neps contained in the card web had a lower mass than those in the raw cotton.
( 6) Origin There is a certain dependence of the nep formation on the origin of the cotton. However, even with cottons of the same origin there can be con- siderable differences with regard to neppines* 4 ~ .
( 7) Harvesting Sledded and machine-picked cotton has a greater content of dead and immature fibres as well as impurities, such as husk and other residue than
manually picked and snapped cotton. Correspondingly, the tendency towards the formation of neps is greater with machine-picked cotton*. Of great importance for a low nep content is the correct time of harvest- ing (maturity).
( 8) Ginning The breaking of fibres favours the formation of neps. Roller ginning machines have a gentler action than saw-tooth ginning machines. Of im- portance in their effect on nep formation are correct air condition, the cleaning process and the intensity of mechanical treatment*. 470.
( 9) Moisture confent of the maferial With increasing moisture content the tendency of the cotton to form neps also increases.
(10) Fibre impurities With increasing fibre impurities, such as husk, leaf and stalk particles, the tendency towards nep formation increases in the cotton.
(1 1) Fibre orientation andfibre hooks With a low degree of fibre orientation in the fibre band the formation of neps is encouraged. Fibre hooks may be regarded as the preliminary stage in the formation of processing neps. This applies especially to the pro- cessing stages following the carding. High drafts encourage nep forma- tion.
(12) Fibre separation in the cotton With a satisfactory degree of fibre separation, the formation of neps is reduced. But too high a moisture content may upset the resuIt47474.475. Fibre separation by means of prucking should be aimed at. A fibre-destroying separation (saw tooth action on clamped bundles of fibres) only increases the tendency of the cotton to form neps.
(13) Procming of the cotton by means of beaters Too intensive a beating action and too many beaters as well as too high a feed to the beaters all encourage the formation of neps. High beater speeds should be avoided. The Crighton opener gives good results with regard to the elimination of neps451.4(zm. It has been proved that the use of Kirschner beaters in opening machines leads to the creation of fewer neps than that of triple bar beaters.
(14) Interruptions of the airflow or air turbulence in the conveying ducts Occurrences of this kind encourage nep formation's1 4n.
(IS) Spin finishes Depending on their type, they may reduce or increase formation of neps in comparison with untreated cotton476.
(16) Spinning processes According to investigations carried out at the Shirley Instit~te'~ OE yarns (BD 200-20 tex) contain fewer neps than ring-spun yams made from carded cotton, but approximately the same amount of neps as ring-spun
yarns of average quality made from combed cotton. According to Kirschner and Kleinbanse16n OE yarns @D 200) are superior or at least equivalent to ring-spun yarns of similar quality so far as nep content is concerned. In order to keep the formation of neps during the processing of the cotton
to a possible minimum, the fouowing general rules apply: 1. A low intensity and frequency of processing should be aimed at. 2. The machines should be set correctly, kept in a good state of repair and free ~.
from rough places. 3. The fibres should contain few impurities and not have too high a moisture
content. 4. The fibres should have satisfactory orientation. The compression of fibres
and formation of fibre hooks should be avoided as far as possible.
CARDING AND NEPS Neps in cotton yarns may originate from machine picking, ginning, open-
ing and cleaning and particularly from the carding operation3*l. Improper set- tings and excessive beating and over-heating of the cotton are known to in- crease neps. Neps in card web increase with decreasing micronaire, particularly below a micronaire of about 4 (3 also mentionedpl. The cottons are frequent- ly broken during cleaning and particularly in the carding process. Some of the neps in the card web are worked out in the drawing and spinning processes, but additional neps and imperfections are often produced in these processes.
The number of neps in the card web, however, is a good indication of the yam appearance grade to be expected, except when grassy conon or immature cotton with seed-coat fragments attached are used3*1. It appears risky to use cottons with micronaire values below about 33.
High nep count and a cloudy web are often indicative of poor cardinp, poor cards frequently being responsible for nep formation'm, while good cards can actually reduce the number of neps. Neps increase from the raw cotton to the picker stage after which it may be decreased at the card, the drawing opera- tions gradually increase the number of nepe-. The cotton comes from the boll with about 30 neps/g and from the gin with about 270 neps/g and it reaches the card with about 495 to 525 neps/g . An excellent card may reduce the neps to about 90 neps/g while an average card can reduce it to about 165 neps/g . Dividing the neps/g by 5 approximates the neps per 100 sq. inches of card web.
Card efficiency can be defined as foUows in terms of nep removal:
Card Efficiency = Lao neos/e - . . -
It appears that 90 neps/g are subtracted from the web neps. Variations due to stripping cycle are about 75 neps/g, that due to variations in grinding

cycle about the same, that due to cotton fmeness about 90 neps/g and that due to variations in card efficiency about 270 neps/pm. There is a close relation between neps in the card web and those in the yarn, although there are more neps in carded yarn than in the card sliver. The following table allows a rating of the frequency of neps in a card sliver.
TABLE 67
NUMBER OF NEPS PER HUNDRED SQUARE INCHES OF CARD WEB (PRODUCnON RATE 4,s kg/hr)
I NUMBER. I RATING 1
(1Wsquare inch = 645 cm2) 'Multiplying by 5 approximates neps/g .
1 to 15 16 to 30 31 to 45 > 46
In one study on 8 mius, from 36 to 108% of the neps in the lap were still in the card sliveF'.
A direct relationship appears to exist between card web neps and minority hooksal. As minority (leading) hooks in the card web increase so do yarn im- perfectionsm. It has been postulated that the same mechanism which increases minority hooks in card sliver also increases card web n e p ~ ~ ~ ' . m
For cottons that nep easily, low doffer speeds are generally required*8'. Cottons with a low fibre friction and high recovery from compression
transfers from card cylinder to doffer more easily than cottons with high fibre
Low Average High . - Very high
friction and low recovery from compression^'. As the micronaire decreases the sliver mass should be reduced particularly at high production rates='.
Finer and longer cotton fibres are more prone to nep fomation'79. Although fibre length and fineness influence neppiness the proportion and distribution of thin-walled (immature) fibres contribute more to fabric defects than do either of these other fibre properties483. =. Nep formation has also been found to increase linearly as the percentage of the higher elongation cot- ton in a blend increased, indicating that nep fonnation decreases with an in- crease in ~tiffness3~s.
The effect of carding rate on yam properties appears to depend upon the micronaire of the cotton, although yarn imperfections generally increase with increasing carding rates. The card production rate can also affect yarn quality as illustrated in the following figure?

FIGURE 31
Effst of cud pmductiom n t e on yarn q d t y
Although increasing carding rate sometimes increase yarn imperfections and decrease yarn g r a d e this is not always the case as the following table shows:

TABLE 68 QUALITY COMPARISON BETWEEN HIGH-PRODUCTION AND STANDARD CARDS WITH
VARIOUS COTTONS48'
Produc- M~lerlal Csrd type tion Tex
kg/h
30
and noils production
50% American 17.5mm standard 50% Turkish l7,Jmm 1 4.2 1 high prod. I \ %
I . .
I I
South Brazil 3.3 standard d,O 30 hizh mod. 20.0 30
i - . I ' i First assortment 4.44 standard 3,s 20 American 17.5mm high prod. 20.0 20
American 17,5mm 1 4 1 standard 1 I 2 high prod. high prod. 30.0 20
Mako 1 3.95 ( standard high prod. I I I t:
Giza 1 3 1 standard ( 4) 1 10 high prod. 2 5 10 high prod. 21.0 10
Sudan 1 7 5 1 standard 1 ,:J 1 I2 high prod. 12 h i ~ h prod. 25.0 12
Peru Pima high prod.
Karnak high prod.
3,22 standard 2.0 6.5 high prod. 14.0 6.5
Yarn Resulls I
r r e g u Remarks <cN/ 1 :;$; 1 lex)
*To convert to CV multinlv bv 1.25

EFFE~OFmBREPROPERTlESONYARNPROPERTIES
It has been claimed- that, under the classification system then used for cotton the price of cotton poorly reflects its processing quality because of the great emphasis placed on grade factors (colour and trash) which have very lit- tle effect on spinning quality. Trash has its greatest effect on manufacturing waste and to a much lesser extent on yarn and fabric appearance, i.e. trash is mainly a mass lossl". Colour has very little effect on processing quality other than the colour of the yarn and dyeing behavio-.
Mixing cottons of different colours can affect the appearance of dyed materials. Cottons that are low grade because of weather damage or excess trash content increase manufacturing waste and decrease processing effiden- e9.
Over the past fifty years or more, literally hundreds of articles have been published on the subject of the relationship between yarn and fibre properties. Although high correlations and accurate predictive relationships were often ar- rived at in a particular study, as yet no relationship has been universally ac- cepted for predicting the cotton yarn properties from those of the fibre. It is possible that with all the modem instmments available which allow the various fibre properties to be measured quickly and accurately, together with the ad- vanced computer technology, a general relationship between yarn and fibre properties may soon be arrived at. Nevertheless, to do this it may be necessary to measure a wider range of fibre properties, for example, wax content, than those routinely measured now.
Yarn strength measurements are claimed to provide a reliable evaluation of fibre spinnabilityz5. Y" and qualiWW.
It appears that as the cultivar changes so the order and amount of varia- tion in yarn strength which is explained by specific fibre property ~hanges'~'. Hence the accuracy of predictive equations will be affected by environment and cultivar environment interaction. It is stated that these factors make em- pirical approaches of dubious value, whereas a statistical approach is recom- mended.
Lawson et up92 state that in a study of the contribution of cotton fibre properties to yarn strength the prediction on cottons from a single growing season is high although over environments or years the prediction was not very good. They therefore conclude that, factors other than the usually measured fibre properties of length, strength and fineness must be involved in the yarn strength. One such factor was thought to be fibre cohesion within the yarn4=.
It is more important to closely control fibre length distribution in a cotton mix than either strength or micronaire reading, within practical ranges*3, although Aldrich4% found that when two cottons differing significantly in length and strength were blended, the yarn and fabric properties generally agreed well with the values predicted from the weighted means of the com- ponents.
139

For a normal range of micronaire reading, strength and short fibre con- tent. processing performance prior to spinning is not appreciably affected by the various fibre propertieslp. '93. For ring-spun yams the fibre characteristics that have the greatest effect on yarn strength are strength, length and fmeness, in that ordeF.
F i e fibres, except for extreme fieness, are assets to yarn strength and spinning production rate.
Cotton yarn irregularity is affected more by fibre length than by fibre linear densitylw *" with the CV of cotton fibre length or length uniformity also affecting yarn irregularity*%.-.
Louis et UP- found that, for medium staple cottons, fibre strength af- fected yarn strength most, followed by fibre length. Ramey et aIYS found a bet- ter correlation between yarn strength and fibre properties for ring yarns than for rotor yarns~'.
Cotton length is considered the principal determinant of ring yarn and fabric strengthla. Long fibres tend to produce more imperfections (called neps), during carding; therefore the longer staple cottons are normally sub- jected to low carding rates and to a combing operation which removes the neps and a large percentage of short fibres and which also aligns the fibres's. Length distribution has a large effect on the appearance, strength and unifor- mity of both yarn and fabric, short fibres being particularly disadvantageous. Fibre length and length distribution are the major determinants of processing efficiency, with length more than any other fibre property determining the limiting count which can be spun (see Part 11). Generally, long fibres produce fewer end breakages and can be spun at higher processing speeds and require less twist to achieve maximum yarn strength. Fibre length is closely related to f~nenessl". Length uniformity ratio is also a good indicator of spinning perfor- mance (e.g. ends down and production rate) and yarn quality, hut is secondary to 2.5% span lengthm.
Cotton fibre length and fmeness are regarded as of paramount impor- tance for efficient ring-spinning performance'-.
An increase in short fibres (< 10 mm) degrade yarn strength, uniformity and appearance-, yam strength decreasing by about 1% for each 1% increase in short fibre+, the effect being greatest for fme yarns and lower twists. It also adversely affects spinning perf~rmance'~'.~~~. Increases in short fibre con- tent also decreased the tensile and tear strength and flex abrasion of print cloth". It has been concluded that the 2,5% span length and uniformity ratio were preferred for explaining yarn irregularity*%.
Elsewhere it was stated that yarn uniformity appears to be affected by processing variables rather than by fibre properties although the 50% span length and the fibre fineness (or micronaire) were the most important in predic- ting end breakages and these were followed in importance by bundle strength and e l~ngat ion~~.

Nevertheless, within practical ranges, yarn linear density and twist and spindle speed often affect spinning end-breakages more than do the fibre pr* pertiesl".
The calculated cost of an end break is quite small and varies, according to country, raw material, etc., within the range of approx. 3 to 20 US cent^^^.^.
Micronaire has a much greater effect on spinning quality than g r a d e . Micronaire affects yarn appearance more than any other fibre property49J. AU other factors being constant, fmer fibres produce more regular and stronger yarns, although the effect of fineness on strength is generally secondary to that of fibre length. Neps have been found to decrease rapidly and yarn strength slightly, with increasing micronaire. Yarn uniformity decreases slightly with either extra-fine or extra-coarse micronairem. It has been that, if all other fibre properties remain constant, an increase in micronaire increases end breakages during spinning, decreases yarn strength and improves yarn ap- pearance with the effects increasing in magnitude as the yarns become finer. Trash content can, however, overshadow these effects particularly for coarser yarnsm1.
Cottons with high micronaire readings (5 and higher) adversely affect spinning performance and yarn strength but improve neps and yarn a p pearance gradem. Micronaire reading of 4.0 to 4,2 is a suitable compromise between the use of low micronaire for higher strength yarns and high micronaire for better yarn appearancem (i.e. fewer neps)Im. Low micronaire fibres are generally carded at slower speeds. Fine, but mature fibres, can be spun with reduced end-breakage rateslaor at higher speeds4-.
Cotton fineness is more important in rotor than in ring spinning, with the reverse being true for fibre-strengthm, the effects being attributed to dif- ferences in the fibre arrangement and alignment in the yarns. Strong rotor yarns can be obtained by using low micronaire, strong cottons, with fibre length and uniformity appearing t o be of secondary importance.
F i e and strong cottons improve the yarn strength and spinning perfor- mance in both ring and rotor spinningm.
Vaughn and Rhodes" reported that a short staple cotton with a low micronaire (3,3) produced a stronger yarn than a medium staple 4,3 micronaire cotton. Fibre fineness also affects the roving and yarn twist re- quired to obtain optimum properties processing efficienWA.
Within varieties, micronaire does not appear to bear a consistant relation- ship to bundle tenacityB7.".
It has been shown that the neps in conon yarn affect the yarn appearance grade most, the effect of thin and thick places being slighW Jm. Nevertheless the correlation between the frequency of neps and yarn appearance grade is not very good either. Combiig greatly improves yarn evenness and strength and greatly reduces imperfections. Particles of foreign matter are also counted
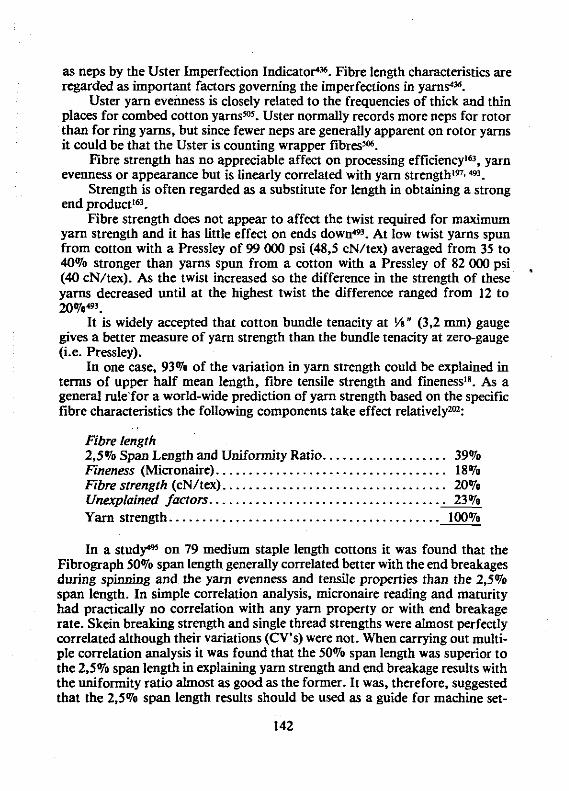
as neps by the Uster Imperfection IndicatoP. Fibre length characteristics are regarded as important factors governing the imperfections in yarns4%.
Uster yarn evenness is closely related to the frequencies of thick and thin places for combed cotton yarns%. Uster normally records more neps for rotor than for ring yarns, but since fewer neps are generally apparent on rotor yarns it could be that the Uster is counting wrapper fibres%.
Fibre strength has no appreciable affect on processing efficiencyI63, yarn evenness or appearance but is linearly correlated with yarn strengthtv, *3.
Strength is often regarded as a substitute for length in obtaining a strong end
Fibre strength does not appear to affect the twist required for maximum yarn strength and it has little effect on ends d0wn~~3. At low twist yarns spun from cotton with a Pressley of 99 000 psi (48,s cN/tex) averaged from 35 to 40% stronger than yarns spun from a cotton with a Pressley of 82 000 psi , (40 cN/tex). As the twist increased so the difference in the strength of these yarns decreased until at the highest twist the difference ranged from 12 to m%'93.
It is widely accepted that cotton bundle tenacity at '/a" (3.2 mm) gauge gives a better measure of yarn strength than the bundle tenacity at zero-gauge (i.e. Pressley).
In one case, 93% of the variation in yarn strength could be explained in terms of upper half mean length, fibre tensile strength and finenesst8. As a general rule for a world-wide prediction of yarn strength based on the specific fibre characteristics the following components take effect relativelym2:
. , Fibre length 2,5% Span Length and Uniformity Ratio.. ................. 39% Fineness (Micronaire). .................................. 18% Fibre strength (cN/tex). ................................. 20% Unexplained factors.. .................................. 23% Yarn strength.. ....................................... 100%
In a study*% on 79 medium staple length cottons it was found that the Fibrograph 50% span Length generally correlated better with the end breakages during spinning and the yarn evenness and tensile properties than the 2.5% span length. In simple correlation analysis, micronaire reading and maturity had practically no correlation with any yarn property or with end breakage rate. Skein breaking strength and single thread strengths were almost perfectly correlated although their variations (CV's) were not. When carrying out multi- ple correlation analysis it was found that the 50% span length was superior to the 2.5% span length in explaining yarn strength and end breakage results with the uniformity ratio almost as good as the former. It was, therefore, suggested that the 2,5% span length results should be used as a guide for machine set-
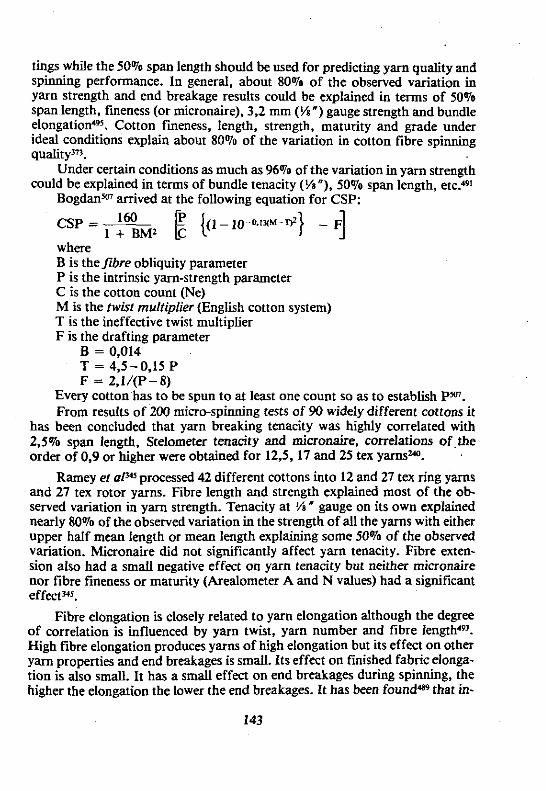
tings while the 50% span length should be used for predicting yarn quality and spinning performance. In general, about 80% of the observed variation in yarn strength and end breakage results could be explained in terms of 50% span length, fineness (or micronaire), 3,2 mm (%") gauge strength and bundle elongation4%. Cotton fmeness, length, strength, maturity and grade under ideal conditions explain about 80% of the variation in cotton fibre spinning quality373.
Under certain conditions as much as 96% of the variation in yarn strength could be explained in terms of bundle tenacity (%"), 50% span length, etc."'
Bogdanm arrived at the following equation for CSP:
where B is thefibre obliquity parameter P is the intrinsic yarn-strength parameter C is the cotton count (Ne) M is the twist multiplier (English cotton system) T is the ineffective twist multiplier F is the drafting parameter
B = 0,014 T = 4.5-0,15 P F = 2,1/(P-8)
Every cotton has to be spun to at least one count so as to establish P". From results of 200 micro-spinning tests of 90 widely different cottons it
has been concluded that yarn breaking tenacity was highly correlated with 2,5% span length, Stelometer tenacity and micronaire, correlations of the order of 0.9 or higher were obtained for 12,5,17 and 25 tex yarnsm.
Ramey et aPJprocessed 42 different cottons into 12 and 27 tex ring yarns and 27 tex rotor yarns. Fibre length and strength explained most of the ob- served variation in yarn strength. Tenacity at %" gauge on its own explained nearly 80% of the observed variation in the strength of all the yarns with either upper half mean length or mean length explaining some 50% of the observed variation. Micronaire did not significantly affect yarn tenacity. Fibre exten- sion also had a small negative effect on yarn tenacity but neither micronaire nor fibre fineness or maturity (Arealometer A and N values) had a significant effectM5.
Fibre elongation is closely related to yarn elongation although the degree of correlation is influenced by yarn twist, yarn number and fibre length493. High fibre elongation produces yarns of high elongation hut its effect on other yarn properties and end breakages is small. Its effect on finished fabric elonga- tion is also small. It has a small effect on end breakages during spinning, the higher the elongation the lower the end breakages. It has been found* that in-

strumental analysis of fibre properties accounted for 85% of the variation in break factor, 81% in spinning production rate at 40 ends down per l 000 spindle hours, 78% in manufacturing waste and 36% in yarn appearance. Corresponding values for classer's measurements were 47,58,34,43 and 26% respectively489.
The strength of raw cotton yarns can often be increased perceptibly by solvent extraction of the natural fibre wax, or by kier-boiling which achieves the same result*. Conversely, the addition of wax lowers yam strength. Vincent509 explained that treatment of yarn with dilute sulphuric acid prior to kier-boiling increases the strength of the finished yarn.
The following graph relates skein strength (CSP) to the staple ratio (staple length/fibre linear density) for 10 tex carded yarns spun from different Egyptian cottons510.


table give some general properties for U.S. cottons as well
- - % < 6
C - s x g = ylz n x 0: P- - - o;; n
ill a, $ $ g ; g $ 2 & g g g r ill -
-2 -ill m o i l l 0 - 3 3 , oe +-I& uQS 2 2 8 2 h b
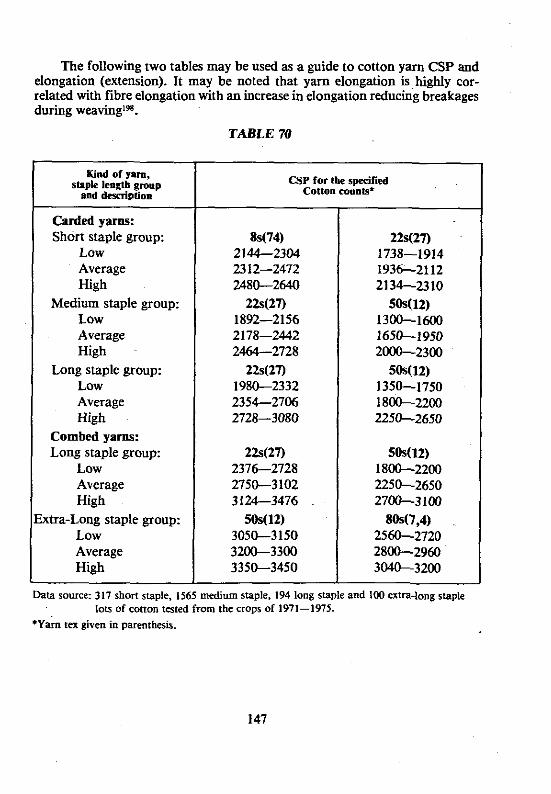
The following two tables may be used as a guide to cotton yarn CSP and elongation (extension). It may be noted that yarn elongation is highly cor- related with fibre elongation with an increase in elongation reducing breakages during weavinglP8.
TABLE 70
Kid Of y m , staple length group
and dexrintion
Carded yams: Short staple group:
LOW Average High
Medium staple group: LOW Average High
Long staple group: Low Average High
Combed yarns: Long staple group:
Low Average High
xtra-Long staple group: Low Average High
CSP for the specified cotton connts'
Data source: 317 short staple, 1565 medium staple. 194 long staple and 100 extra-long staple lots of cotton tested from the crops of 1971-1975.
*Yarn t n given in parenthesis.
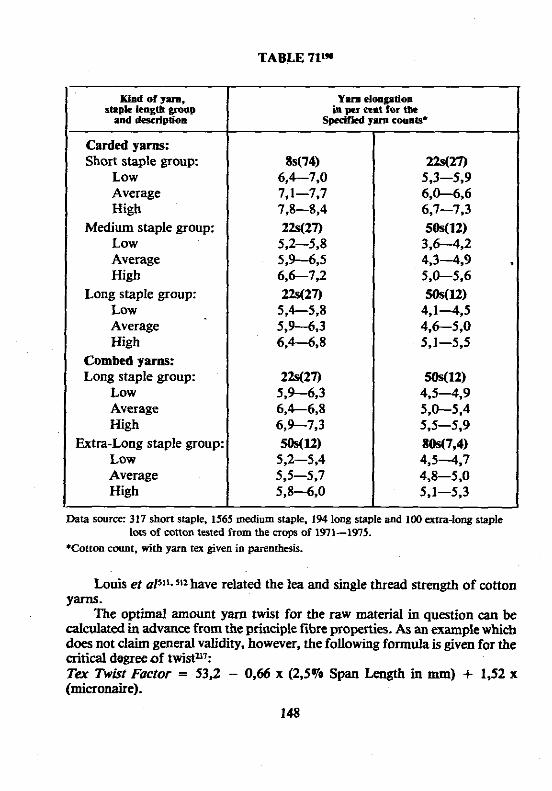
TABLE 71'"
Kind of yam, sup* length gmep lad d ~ r i p l i o n
Carded yams: Short staple group:
Low Average High
Medium staple group: Low Average High
Long staple group: Low Average High
Combed yaras: Long staple group:
Low Average High
Extra-Long staple group: LOW Average High
Data source: 317 shoR staple, 1565 medium staple, 194 long staple aod 100 am-long staple lots of cotton tested from the naps of 1971-1975.
'Cotton count, with yam tex given in parenthesis.
Louis et UP. "2 have related the lea and single thread strength of cotton Y-.
The optimal amount yarn twist for the raw material in question can be dculated in advance from the principle fibre properties. As an example which does not claim general validity, however, the following formula is given for the aitical degree of twist1": Ter Twist Factor = 53.2 - 0.66 x (2,5Vo Span Length in mm) + 1,52 x (micromire).
148
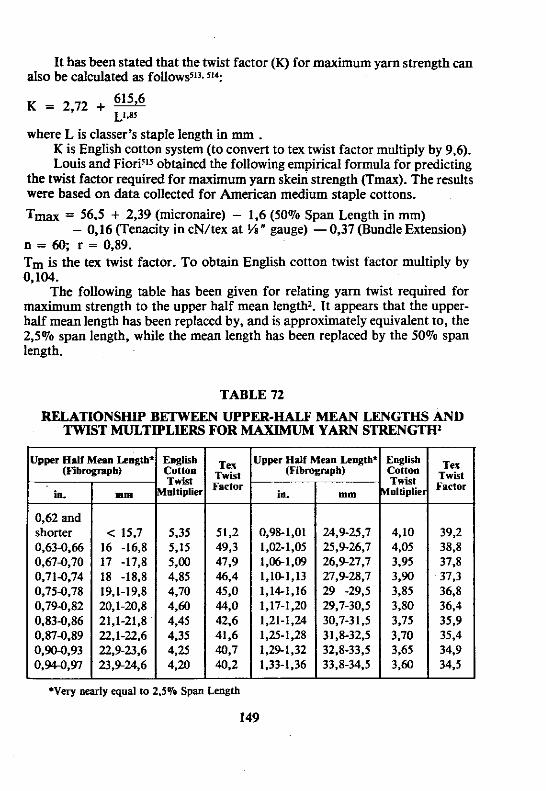
It has been stated that the twist factor (K) for maximum yarn strength can also be calculated as followssl3. 514:
where L is classer's staple length in mm . K is English cotton system (to convert to tex twist factor multiply by 9,6). Louis and Fiorixls obtained the following empirical formula for predicting
the twist factor required for maximum yarn skein strength (Tmax). The results were based on data collected for American medium staple cottons.
T- = 56.5 + 2,39 (micromire) - 1,6 (50% Span Length in rnm) - 0,16 (Tenacity in cN/tex at %" gauge) - 0,37 (Bundle Extension)
n = 60; r = 0,89. Tm is the tex twist factor. To obtain English cotton twist factor multiply by 0,104.
The following table has been given for relating yarn twist required for maximum strength to the upper half mean length2. It appears that the upper- half mean length has been replaced by, and is approximately equivalent to, the 2,5970 span length, while the mean length has been replaced by the 50% span length.
TABLE 72
RELATIONSHIP BETWEEN UPPER-HALF MEAN LENGTHS AND TWIST MULTIPLIERS FOR MAXIMUM YARN STREYGTHa
0,62 and shorter < 15.7
- English cotton TwM loltiplie
Upper Half Mean LcngL Twist (Fibrogmph) Factor
- hglish :Otto0 Twist ultipli~
- Tex
Twist Factor
*Very nearly equal to 2.57. Span Length
149
For ring-spun yarns the twist factor for maximum single thread stength is normally higher (by = 3,4 tex twist factor units) than that required for maximum skein strength5", although this does not appear to be the case for rotor yarns'm.
Various equations's, " 3 . 5 1 6 ~ for predicting the twist factor required for maximum yarn strength as well as for predicting yam strength have been derived.
Miniature and accelerated spinning tests are often used to measure spin- nab'ity but these do not always correlate well with full-scale tests'-JM.
CSP results obtained on yarns spun on a Shirley Miniature plant are generally more variable than those obtained on a pilot plant, probably due to short term irregularities introduced by the long draft system on its ring frame-'31. The relationship between Shirley Miniature yarn CSP values and those of pilot plant yarn varied according to the cotton fibre properties, with the former being higher for coarser and inferior cottons but lower for the fine superior cottons. The pilot plant results correlated with mill trials"'.
FIBRE QUALITY INDEX
. In an attempt to combine the various fibre properties into a single com- pound term which may be used to predict the effect simultaneous variations in two or more fibre properties will have on yarn properties, various fibre quality indices (FQI's) have been derived. The implication is of course that either yarn strength or yarn irregularity wiU reflect the changes in the compound fibre quality index regardless of which fibre properties are changing. Moreover, it is also implicitly assumed that other fibre properties not included in the index do not play a significant rale in the yarn properties and they can therefore be neglected. Clearly, however, the actual yarn strength or irregularity will depend to a great extent on the processing conditions and machines used as well as on the yarn h e a r density (count) and twist, etc. It must he emphasised at the outset, too, that these quality indices at best only give a measure of the fibre quality insofar as yarn strength or irregularity is concerned and they do not necessarily give an indication of how the fibre will process or spin.
The various fibre quality. indices are therefore aimed at presenting a measure of the quality of a particular cotton insofar as either yarn strength (single thread or CSP) or irregularity (Uster U or CV %) is concerned. Some of the better known ones are given below for yarn strength and irregularity, respectively.
Yarn Strength Yarn strength is usually accepted as the main criterion of yarn q u a l i t p
and also of the cotton fibre spinnability2*5, 2' and q u a l i p .
Lordm was the first to suggest the following cotton fibre-quality index:
FQI, = Effective Length x Bundle Tenacity at %"
Standard Fibre Weight per an (i.e. Hs) In modem terms this could quite easily be changed to
FQI, = Maturity Ratio x 2,5% Span Length x Bundle Tenacity at %"
Fibre Linear Density
Maturity Ratio (M) can be measured by the caustic soda or airflow method. Bundle tenacity (%" gauge) can be measured on a Stelometer and the units will be cN/tex (or possibly rnN/tex).
2.5% Span Length (or alternatively Staple length) should preferably be in mm and Fibre linear density (i.e. fineness) can be measured by cutting and weighing or by using an instrument such as the IIC-Shirley Fineness-Maturity Tester. Another fibre quality index has been suggested, vizSl6: - -
LSE FQI, = -- F
where L = 50% Span length (in mm) S = bundle tenacity at %" gauge (gf/tex) F = fibre fineness/maturity coefficient (in &inch)
In this case fibre fineness appears to refer to micronaire and not to actual fineness
and E = bundle extension (To)
In modern units this can become:
FQI, = -- MLSE where the units are as before, H
or
FQI, = mLSE H
m being micronaire. The following fibre quality index closely allied to that of Lord, has also
been suggested for predicting CSP (i.e. the yarn count strength productyfl. PUSMc LSMc or P FQIs = --
m F where: L = 50% span length in mm S = Stelometer strength at 3,2 mm (%") gauge in gf/tex M, = Mahuity coefficient m = micronaire (originally pg/inch)
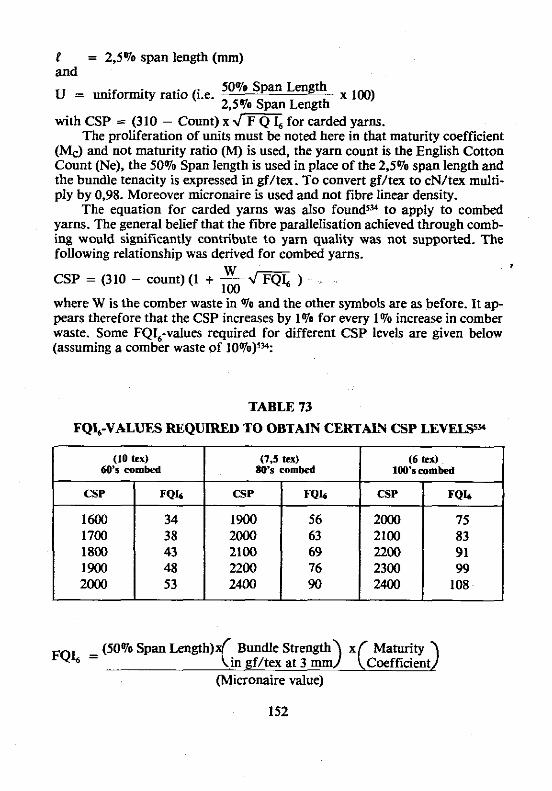
P = 2,5% span length (mm) and .~ ~~
50% Span Length U = uniformity ratio (i.e. 2,5% Span Length
with CSP = (310 - Count) x m L for carded yarns. The proliferation of units must be noted here in that maturity coefficient
( M 3 and not maturity ratio (M) is used, the yarn count is the English Cotton Count (Ne), the 50% Span length is used in place of the 2,5% span length and the bundle tenacity is expressed in &ex. To convert gf/tex to cN/tex multi- ply by 0,98. Moreover micromire is used and not fibre linear density.
The equation for carded yarns was also foundsY to apply to combed yarns. The general belief that the fibre parallelisation achieved through comb- ing would significantly contribute to yam quality was not supported. The following relationship was derived for combed yams.
W CSP = (310 - count) (1 + - ) 100 where W is the comber waste in % and the other symbols are as before. It a p pears therefore that the CSP increases by 1% for every 1% increase in comber waste. Some FQ1,-values required for different CSP levels are given below (assuming a comber waste of 10%y?
TABLE 73
FQk-VALUES REQUIRED TO OBTAlN CERTAIN CSP LEVELSsW
(Micronaire value)
(10 iex) 6Q's combed
CSP
1600 1700 1800 1900 2000
.
FQ4
34 38 43 48 53
(7.5 Iex) 80's combed
CSP
1900 2000 2100 2200 2400
- -
(6 tex) 100's combed
FQ4
56 63 69 76 90
CSP
2000 2100 2200 2300 2400
FQ4
75 83 91 99 108

In another articleJm" it is stated that the rate of increase of skein strength is 0,8% for every 1% of comber noil removed, i.e. the skein strength will be 8% higher if 10% of comber noil is removed than if no noil is removed (i.e. than that of the carded yarn). If no information on comber noil is available a conservative value of 12.5% can be assumed, i.e. generally combed yarns should be about 10Qo stronger than a carded yarn spun from the same cottonJ=.
Elsewhere it is stated that for each 2% change in the amount of comber waste removed there is a 1Qo cbange in yarn ~trength'~. Subramanian et al" suggested a fibre quality index:
rd3G FQI - - '-ms where I = effective length in 32nds S and So are bundle strengths at %" and zero-gauge (gf/tex). H is actual fibre fmeness Hs is standard fibre fineness' in mtex
Once again using the more widely accepted fibre properties and metric units we can write:
where P now becomes the 2,570 span length or the staple length (m mm) S and So are the %" and zero-gauge bundle tenacities in cN/tex H is the actual fibre fmeness (in mtex)
and Hs = is the standard fibre fmeness (m mtex), M
i.e. the fmeness the cotton would have at a maturity ratio (M) of one. Iyenger and GuptaS3' suggested that CSP can be approximated by either:
L - 10 FQL = = X S X U
u' f where L is the mean length (mm) f is in this case the actual fibre fmeness and S is the fibre bundle tenacity at 3.2 mm (%') gauge.
The following cotton fibre quality index has been used5". Jn, for the con- tniutions of the fibre length and fmeness to CSP:
Staple Length FQIu = Fibre mtex
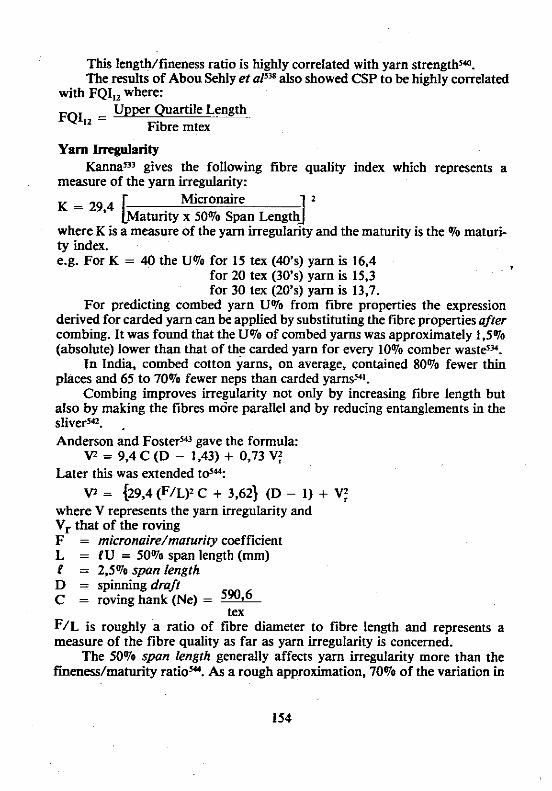
This length/fineness ratio is highly correlated with yarn strengthw. The results of Abou Sehlv et aIfl8 also showed CSP to be hiehlv correlated - .
with FOI., where: - .- Upper Quartile Length
FQL = Fibre mtex
Yarn Irregularity Kanna533 gives the following fibre quality index which represents a
measure of the yarn irregularity:
K = 29,4 1 . Micronaire Matuntv x 50% S ~ a n Len& - a
where K is a measure of the yak^ irregularity and the maturity is the % maturi- ty index. e.g. For K = 40 the U% for 15 tex (40's) yarn is 16,4
for 20 tex (30's) yarn is 15.3 for 30 tex (20's) yam is 13.7.
For predicting combed yarn U% from fibre properties the expression derived for carded yarn can be applied by substituting the fibre properties after combing. It was found that the U% of combed yarns was approximately 1,5% (absolute) lower than that of the carded yarn for every 10% comber wast@".
In India, combed cotton yarns, on average, contained 80% fewer thin places and 65 to 70% fewer neps than carded yams"'.
Combing improves irregularity not only by increasing fibre length but also by making the fibres more parallel and by reducing entanglements in the sliverY2. . Anderson and FosterY3 gave the formula:
V2 = 9,4 C (D - 1,43) + 0,73 V: Later this was extended td":
V2 = {29,4 (F/L)~ C + 3,621 (D - 1) + V: where V represents the yarn irregularity and V, that of the roving F = micronaire/maturily coefficient L = fU = 50% span length (mm) P = 2.5% span length D = spinning draff
5W,6 C = roving hank (Ne) = - tex
F/L is roughly a ratio of fibre diameter to fibre length and represents a measure of the fibre quality as far as yarn irregularity is concerned.
The 50% span length generally affects yarn irregularity more than the fmeness/maturity ratiow. As a rough approximation, 70% of the variation in
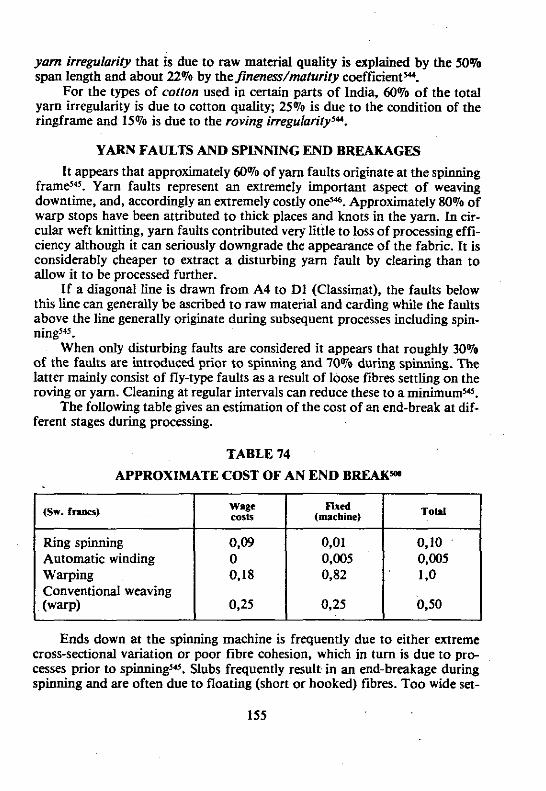
yam irregularity that is due to raw material quality is explained by the 50% span length and about 22% by thefinenw/maturify coefficientY.
For the types of cotton used in certain parts of India, 60% of the total yarn irregularity is due to cotton quality; 25% is due to the condition of the ringframe and 15% is due to the roving irregularity".
YARN FAULTS AND SPINNING END BREAKAGES
It appears that approximately 60% of yarn faults orighate at the spinning framP3. Yarn faults represent an extremely important aspect of weaving downtime, and, accordingly an extremely costly on+. Approximately 80% of warp stops have been attributed to thick places and knots in the yarn. In cir- cular weft knitting, yam faults contributed very little to loss of processing effi- ciency although it can seriously downgrade the appearance of the fabric. It is considerably cheaper to extract a disturbing yam fault by clearing than to allow it to be processed further.
If a diagonal line is drawn from A4 to Dl (Classimat), the faults below this line can generally be ascribed to raw material and carding while the faults above the line generally originate during subsequent processes including spin- nineJ45 --e -
When only disturbing faults are considered it appears that roughly 30% of the faults are introduced prior to spinning and 70% during spinning. The latter mainly consist of fly-type faults as a result of loose fibres settling on the roving or yarn. Cleaning at regular intervals can reduce these to a minimumJ4'.
The following table gives an estimation of the cost of an end-break at dif- ferent stages during processing.
TABLE 74
APPROXIMATE COST OF AN END BREAK"
costs (machiac) I I I I Fu*
Ring spinning Automatic winding Warping Conventional weaving (warp) 0,25 0,25 0,50
Ends down at the spinning machine is frequently due to either extreme cross-sectional variation or poor fibre cohesion, which in turn is due to pro- cesses prior to spi~iigJ4s. Slubs frequently result in an end-breakage during spinning and are often due to floating (short or hooked) fibres. Too wide set-
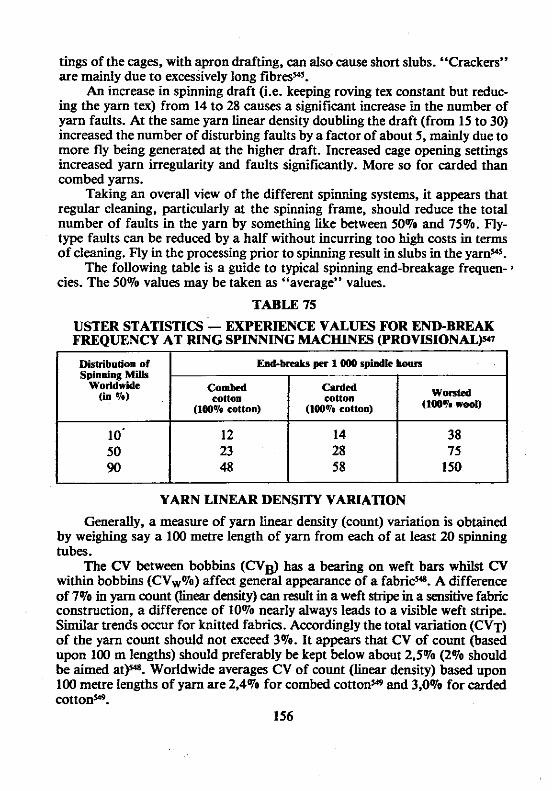
tings of the cages, with apron drafting, can also cause short slubs. "Crackers" are mainly due to excessively long fibresws.
An increase in spinning draft (i.e. keeping roving tex constant but reduc- ing the yarn tex) from 14 to 28 causes a significant increase in the number of yarn faults. At the same yarn linear density doubling the draft (from 15 to 30) increased the number of disturbing faults by a factor of about 5, mainly due to more fly being generated at the higher draft. Increased cage opening settings increased yarn irregularity and faults significantly. More so for carded than combed yarns.
Taking an overall new of the different spinning systems, it appears that regular cleaning, particularly at the spinning frame, should reduce the total number of faults in the yarn by something like between 50% and 75%. Fly- type faults can be reduced by a half without incurring too high costs in terms of cleaning. Fly in the processing prior to spinning result in dubs in the yamys.
The following table is a guide to typical spinning end-breakage frequen- cies. The 50% values may be taken as "average" values.
TABLE 75
USTER STATISTICS - EXPERIENCE VALUES FOR ENDBREAK FREQUESCY AT RING SPINNING MACHINES (PROVISIONAL)w,
YARN LINEAR DENSITY VARIATION
Generally, a measure of yarn linear density (count) variation is obtained by weighing say a 100 metre length of yarn from each of at least 20 spinning tubes.
The CV between bobbins (CVB) has a bearing on weft bars whilst CV within bobbins (CVwQo) affect general appearance of a fabricw. A difference of 7% in yam count (linear density) can result in a weft stripe in a sensitive fabric constmaion, a difference of 10% nearly always leads to a visible weft stripe. S i trends occur for knitted fabrics. Accordingly the total variation (CVT) of the yarn count should not exceed 3%. It appears that CV of count @as& upon 100 m lengths) should preferably be kept below about 2,5% (2% should be aimed a t F . Worldwide averages CV of count (linear density) based upon 100 metre lengths of yarn are 2,470 for combed cononm and 3,070 for carded cottonYp.
156
Didtihotion of Spinning Milk
Worldwide (in %)
10. 50 90
End-bmks p r 1000 spin& hoan
Combed EOltOm
(IWQ* C O ~ ~ O I I )
12 23 48
Clrded Cottoll
( i w a COUOU)
14 28 58
WoRted ~100% woon
38 75
150

REFERENCES
1. Groz-Beckert Nadelfabriken Pamphlet (1976). 2. Grover, E. B. and Hamby, D. S., Handbook of Textile Testing and
Quality Control, Textile Book Publishers Inc* (Interscience New York, 1960).
3. Text Asia, 10 (I]), 124 (Nov., 1979). 4. Gutknecht, T., Intern. Text. Bull. (Spinning), No. 3, 329 (1978). 4a. Text. Asia, 10 (9), 231 (Sept., 1979). 5. Lmdustrie Text.., No. 1095, 1096 (Dec., 1979). 6. Cotton Int., p. 257 and 258 (1980). 7. T d e Organon, 50 (6) (June, 1979). 8. Text. Month, 60 (March 1980). 9. Amer. Text. (K/A Edition), AT-9 38 (April, 1980).
10. Albrecht, W., Text. Asia, 10, 140 (Dec., 1979). 11. Mehta, P. C., Text. Imt. Industr., 17 (3), 95 (1979). 12. Van Winkle, T. L., Edeleanu, J., Prosser, E. A. and Walker, C. A.,
American Scientist, 66, 280 (1978). 12a. Koedam, H. E., De Tex. Tmilis, I16 (March, 1980). 13. 'The Knitter, AT-9, 10 (Jan., 1980). 14. Collins, K. J., Evans, R. B. and Bany, R. D., Economics, Statistics &
Cooperative Service, Washington (June, 1979). 15. Canad. Text. J., 96, 24 (Nov., 1979). 16. Int. Text. Bull., No. 1, 92 (1980). 17. Koedam, H. E., Knitt. Times, 48, 16 (6 Aug., 1979). 18. Luau, D. C., Ph.D. Thesis, University of Texas (Cotton Economic
Research, (Oct., 1959). 19. Shroff, J. J., Colourage, 14 (12). 25 (9 June, 1977). 20. Arnold, M. H., Premier Symposium International de la Recherche
Textile Cotonni6re. Paris. u.23 11969). 2&. Cornish-Bowden, M. E. &oted'by kllett, R., Fanner's Weekly, 14 (28
Nov., 1979). 21. Wakeham, H., Terf. Res. J., 26,925 (1956). 22. Lord, E., J. Text. Imt., 47, T209 (1956). 23. Chytiris, T.. Melliand Texther., 58, 789 (1978). 24. "Better Cottons". USDA Research Administration, Beltsville, Md.
(Sept., 1947). 25. Ono, Y., "Studies on the Cotton fiber as the Material for Cotton Spin-
ning, Part I, Japan Cotton Text Inst. Ozaka, (Japan, 1958). 26. Rollins, M. L. and Tripp, V. W., Text. Res. J., 24,345 (1954). 27. Morton, W. E. and Hearle. J. W. S., "Physical Properties of Textile
fibres", Heinemam and The Textile Institute (1975). 28. Ken, T., Protoplasma, 27,229 (1937). 29. Berriman, L. P., Text. Res. .I.. 36,272 (1966).

30. Berriman, L. P. and Benedict, H. M., Text. Res. J., 33,1026 (1%3). 31. DuPre, M., Text. Res. J., 29, 151 (1959). 32. Hertel, K. L. and Lawson, R., Text. Bull.. 94 (5), 23, 63 (1%8). 33. Compton, J., Martin, W. H.. Word, B. H. and Barber, R. P., Text.
Res. J., 25. 58 (1955). 34. Balls, W. L., "Studies of Quality in Cotton", Macmillan, London
(1928). 35. Berriman, L. P., Text. Res. J.. 33, 1027 (1963). 36. Williams, J. L., Sugg, H. and Ingram, P., Text. Res. J., 46,434 (1976). 37. Eckberg, R., Ingram, P. and Wiams, J. L., Text. Res. J., 46, 508
(1976). 38. Ingram, P., Eckberg, R. and Wiams, J. L., Text. Res. J., 46, 587
(1976). 39. Eckberg, R. P., Ingram, P. and W i , J. L., Text. Res. J., 46,629
(1976). 39a. Rousselle, M-A. and Nelson, M. L., Text. Res. J., 50, 103 (1980). 40. Rowland, S. P., Nelson, M. L., Welch, C. H. and Hebert, J. J., Text.
Res. J., 46, 194 (1976). 41. Kassenbeck, P., Text. Res. J., 40,330 (1970). 42. The Versatility of Cotton. Int. Inst. Cotton Publication. 43. Sloan, W. G., Hoffman, M. J., Robinson, H. M.. Moore, H. B. and
Cooper, S., Amer. Dyest. Rep., 52, P.412 (1963). 44. Mock, U., Melliand Textilber. (Eng.Ed), 2, 769 (1974). 45. Le~ox-Kerr, P., Text. Industr., 134 (lo), 57 (Oct., 1970). 46. Mauersberaer. H. R., Ed.. Textile Fibres 5th Ed.. New York, Wiey -
(1948). Patel, G. S. and Patil, N. B., Text. Res. J., 45, 168 (1975). Lord, E., J. Text. Inst., 55, T69 (1964). Pearson, N. L., Text. Res. J., 20, 152 (1950). Balls, W. L.. "Development and Properties of Raw Cotton". London, A. C. Black Ltd., (1915). Marsh, P. B., Barker, H. D., Kerr, T. and Butler, M. L., Texf. Res. J.. 20, 288 (1950). Burkitt, F. H. and Heap, S . A., Amer. Dyest, Rep., 61,58 (June, 1972). Neelakantan, P., Text. Res. J.. 47, 178 (1977). Culp. T. W., Harrell. D. C. and Kerr, T., Beltwide Cotton Production Res. Conf.. p.103 (1976). Raes, G. and Fransen, T., Text. Res. J., 24, 1000 (1954). Hessler, L. E.. Towery, J. D. and Power. B. K., Text. Res. J., 24,1010 (1954). Hertel, K. L., Text. Res. J., 27, 571 (1957). Meredith. R.. J. Text. Inst., 36. TI07 (1945). Virgin, W. P. and Wakeham, H., Text. Res. J., 26, 177 (1956).
Piay. K. P. R. and Shankaranarayana, K. S., Text. Res. J., 31, 515 (l%l). Chytiris. T., Text. Res. J., 31, 175 (]%I). Calkins, E. W. S., Text. Res. J.. 31,176 (1%1) and Iyengar, R. L. N., Text. Res. J., 31, I77 (1961). Jones, D. M., Premier Symposium International de la Recherche Textile CotonniCre, Paris, p.73 (Paris, 1%9). Muhlethaler, K., Bio-Chem. Biophys. Acta, 3, 15 (1949). Tripp, V. W., Moore, A. T. and Rollins, M. L., T&. Res. J.. 21,886 (1951). Roelofsen, P. A., Bio-Chem. Biophys. Aaa, 7,43 (1951). Hock, C. W., Ramsey, R. C. and Harris, M. J., J. Research Natl. Bur. Standar&, 26, 93 (1941). Ken, T., Text. Res. J., 16, 249 (1946). Sisson, W. A., Contrib. Boyce Thompson Inst., 9 (3), 239 (1938). Wiegerink, J. G., Text. Res. J., 9, 357 (1939). Wakelyn, P. J., Loewenschuss, H. and Roark, B. A., Text. R e . J.. 42, 597 (1972). Altschul, A. M., Lyman, C. M. and Thurber, F. H. in "Processed Plant Protein Foodstuffs", Ed. A. M. Altxhul, New York AcademiC Press, p.485 (1958). Tharp, W. H., in "Cottonseed and Cottonseed Products", Ed. A. E. Bailey, New York Interscience, p.144 (1948). Tripp, V. W., Moore, A. T. and Rollins, M. L., Text. Res. J., 21,886 (1951). Tharp, W. H., in "Cottonseed and Cottonseed Products", Ed. A. E. Bailey. New York Interscience, p.121 (1948). Bailey, A. E., Ed. in "Cottonseed and Cottonseed Products", New York, Interscience, p.365 (1948). Balls, W. L., Proc. Roy. Soc.. (London), B90.542 (1919). Kassenbeck, P., Premier Symposium International de la Recherche Textile CotonniCre, Paris, p.455 (Paris, 1969). Ingram, P., Premier Symposium International de la Recherche Textile Cotonnikre, Paris, p.519 (Paris, 1969). Raes, G., Fransen, T. and Verschraege, L., PremierSymposium Inter- national de la Recherche Textile CotonniCre, Paris, p.475 (Paris, 1%9). Kulshreshtha, A. K., Chudasarna, V. P. and Dweltz, N. E.. J. Appl. Pol. Sei., 20,2329 (1976). Sridharan, V., Colourage, 23, 31 (9 Dec., 1976). Johnson, A., Maheshwari, K. C. and Miles, L. W. C., Premier Sympo- sium International de la Recherche Textile Cotonnike. Paris, p.577 (Paris 1969). Du Bois, W. F., Melliand Textilber., 55, 1002 (1974).

85. Ward, K., Text. Res. J., 20, 363 (1950). 86. Hermans and Weidinger, J. Polymer Sci., 4 , 135 (1949). 87. Mark, H. F., Gaylord, N. G. and Bikales, N. M. (Eds.), Encyclopaedia
of Polymer Science and Technology. Vo1.3, p.135 (1965). 88. Davidson, G. F., J. Text. Inst., 18, TI75 and T275 (1927). 89. Nickerson, Ind. Eng. Chem., 33,1022 (1941); 34,85 and 1480(1942); 37,
1115 (1945); 38. 299 (1946). 90. Conrad and Scroggie, Ind. Eng. Chem., 37,592 (1945). 91. Philipp, H. J., Nelson, M. L. and Ziifle, H. M., Text. Res. J., 17,585
(1947) and 18, 149, 155 (1948). 92. Hermans and Weidinger, J. Appl. Phys., 19, 491 (1948). 93. Hermans, "Contribution to the Physics of Cellulose Fibers", New York,
Elsevier, p.50 (1946). 94. Magne, Portas and Wakeham, J. Am. Chem. Soc.. 69. 18% (1947). 95. Frilette, H. and Mark, J. Amer. Chem. Soc., 70, 1107 (1948). 96. Liang, C. Y. and Marchessault, R. H., J. Polymer Sci., 37,385 (1954). 97. Weiss, A. H., Text. Res. J., 42,526 (1972). 98. Staudiiger, H. and Feuerstein, K., Ann. 526,72 (1936) - quoted in ref.
46. 99. Bhujang, K. S. and Nanjundayya, C., T&. Res. J., 25, 137 (1955). 100. K h g , Dr., De Ter-Tertlk, No- 12, 38 (Dec., 1976). 101. Merkenich, K. and Kling, A., Textil-Praxis Int., 34, 1388 and 1497
(1979). 102. McCall, E. R. and Jurgens, J. F., Text. Res. 1.. 21, 19 (1951). 103. Zeisel, S. in "Rohstoffe des Pflan-zemeiches", Leipzig (1926). 104. Manudhane, R. G., Colourage, 22.63 (15 May, 1975). 105. Hamby, D. S.. The American Cotton Handbook, Vol. 1, Interscience
pub/., ~p.72 (1965). 106. Kearney and Schofield as quoted in ref. 46. 107. Geake as quoted in ref. 46. 108. Fargher and Probert as quoted in ref. 46. 109. Zerbe, C., "MineralBle und venvandte produkte" (1952). 110. Rollins, M. C., in "The Cotton Handbook", Vol. I, Ed.. D. S. Hamby.
New York, Interscience, p.70 (1965). 11 1. Guthrie. J. D. in "Chemistry and Chemical Technology of Cotton".
Ed. K. Ward Jr., New York, Interscience, p.1 (1955). 112. Heyn, A. N. J., Text. Res. J., 20, 771 (1950). 113. Moss, E., Britt. J. Appl. Phys. Suppl., I , 19 (1951). 114. Pandey, S. N. and Iyengar, R. L. N., Text. Res. J., 40, 1053 (1970). 115. Hadwich, F., I n d h Text. J., 89, 45 (June, 1979). 116. Abhott, G. M. and Robinson, G. A., Text. Res. J., 47, 199 (1977). 117. Viwanathan, A., J. Text. Imt., 64,553 (1973). 118. Knecht, E., J. Text. Imt., 2,22 (1911).
119. Adcock, A., Text. J. Austr., 49.34 (Sept., 1974). 120. Fargher. R. G., Hart, L. R. and Probert, M. E., J. Text. Inst., 18, T29
(1927). 121. Mehta, H. U., Gupta, K. C. and Bhatt, V. R., Text. Rer. J., 46, 356
(1976). 122. Varghese, J., Pasad, D. M. and D i t , S. R., Indian J. Text. Res.. 3.61 . .
(SGt., 1978). 123. Egerton, G. S. and Fisher, K. M., Text. Res. J., 41,789(1971). 124. Weiner, L. I., Text. Res. J., 32, 524 (1%2). 125. Starvakus, E. J. and Platt, M. M., Text. Industr., 124 (10). 141 (1960). 126. Varghese. J.. Indian Text. J.. 87. 151 (March. 1977). . ,
127. ~arghese, J. and Pasad, D. M., A&. ~ y & t . R ; ~ . . 67, 39 (April, 1978).
128. Grant, J. N., Kingsbery, E. C. and Tsoi, R. H., Text. Res. J., 33,839 (1%3).
129. Becher, D., SAWTRI Cotton Symposium (May 1974). 130. Grimes, Mary A., Text. R a . J., 22, 637 (1952). 131. Nemrkar, S. K., Indian Text. J., 89,95 (Nov., 1979). 132. Mangialardi, G. J., Text. Res. J., 49, 476 (1979). 133. Baker, R. V., Columbus, E. P. and Laird, J. W. (U.S. Dept. of
Agric.), U.S. Dept. of Agri., Agri. Research Senice, Washington, D.C., Jan., 1977, p.19 Tech. Bull. No. 1540.
134. Lyons, D. W. and Hatcher, J. D., Text. World, 124,56 (March, 1974). 135. Cook, J. M., Text. R a . J.. 26, 534 (1956). 136. Shete, D. G. and Sundaram, V., Cotton Development, 3, No.4, 3
(1974). 137. Harmancioglu, M., Textti-Praxis, 34, 1466 (1979). 138. Wiams, S. and Towery, J., Cotton, 109, 110 (April, 1945). 139. Lord, E., J. Text. h t . . 47, TI6 (1956). 1'40. Griffm, A. C., Text. Res. J.. 49,123 (1979). 141. Nelson, M. L., Andrews, F. R. and Grant, J. N., Text. Res. J., 29,260
(1959). 142. Leitgeb, D. J. and Wakeham, H., Text. Res. J., 24, 1047 (1954). 143. Baker. R. V.. Cotton Intern., 80 (1976). 144. Wigington, J. T., Cotton, 105, 62 (July, 1941). 144% Baker, R. V., Cotton Ginners Journal and Yearbook (March, 1968). 4 5 Southern Text. News, 31 (1975). 146. Clark, S. P., J. Amer. Oil Chem. Soc., 53, 684 (Nov., 1976). 147. Mikula, G. W., SABS Symposium: Quality Assurance in Modem
Textiles, Pretoria (1974). 148. Simon, S. A. and Harmon, C., Text. Res. J., 24, 12 (1954). 149. Wright, J. W., TertiI-Praxis 25, 72 (1970). 150. Gangli, B., Textil-&axis, 25 (Z), 69 (1970).
151. Barker, R. L. and Lyons, D. W., Text. Res. J., 47,289 (April, 1977). 152. Lyons, D. W. and Barker, R. L., Text. Res. J., 46, 135 (1976). 153. Berkley, E. E., Text. Res. J., 27,712 (1957). 154. Berkley, E. E.. Kennamer, H. 0. and Powell, S., Cotton Trade J.
Intern. Ed. (1954). 155. Nickerson, D. and Tomaszewski, J. J., Text. Res. J., 28,485 (1958). 156. Nickerson, D., Text. Res. J., 34,645 (1964). 157. Marsh, P. B., Merola, G. V. and Butter, M. L., Text. Res. J., 28, 95
(1958). 158. Lawson, R., Ewald, P. R. and Ramey, H. H., Text. Res. J., 45, 698
(1975). 159. Sankov., E. A., Tekhnol. Tekstil. Promys., 123 (3), 26 (1978). 160. Barker, G. L. and McClendon, R. W., Beltwide Cotton Res. Conf.,
p.122 (1976). 161. Marsh, P. B., Merola, G. V. and S ipson , M. E., Text. Res. J., 23..
831 (1953). 162. Nickerson, D., as quoted by Simon and Hamon in Ref. 148. 163. Clegg, G. C., J. Text. Imt., 31, T49 (1940). 164. Munchi, V. G., Proc. "Lecture Series on Spinning", The Textile
Association of India, p.8 (1975). 165. Wyatt, B. G., Text. Res. J., 42,474 (1972). 166. Roberts, C. W. and Cheung, P. S. R., Text. Res. J., 48,91 (1978). 167. Hook, C. W., Text. Res. J., 20,141 (1950). 168. Marsh, P. B., Guthrie, L. R. and Butler, M. L., Text. Res. J., 21,565
(1951). 169. Hall, L. T. and Elting, I. P., Text. Res. J., 21,580 (1951). 170. Marsh, P. B., Bollenbacher, K., Butler, M. L. and Merola. G. V.,
Text. Res. J., 24,31 (1954). 171. Marsh, P. B., Text. Res. J., 25,739 (1955). 172. Wakeham, H., Stickley, H. and Spicer, N., Text. Res. J., 24, 1037
(1954). 173. Waters, W. T. and Phillips, J., Text. Res. J., 31, 608 (1961). 174. De Gmy, I. V. and Carra, J. H., Text. Res. J., 47, 91 (1977). 175. Venkatesh, G. M. and Dweltz, N. E., Text. Res. J., 45,230 (1975). 176. Belser, R. B. and Taylor, J. L., Premier Symposium International de la
Recherche Textile Cotonni&e, Paris, p.1 ll (Paris, 1%9). 177. Tijskens, M. M., Melliand Tertlber., 56, 222 (1975). 178. Cocoros, C. B., Amer. Text. Rep./Bull.. AT-5, 16 (Nov., 1976). 179. Parker, R., Amer. Text. Rep./Bull. AT-3,48 (May, 1974). 180. Sheehan, W. C., Bailey, T. L. W. and Compton, I., Text. Res. J., 23,
736 (1953). 181. WhitweU, J. C. and Schwenker, R. F., Text. Res. J.. 23, 175 (1953). 182. Balasubramanian, N. Tert. Res. J., 39, 155 (1%9).

183. Desai, R. L., Ta t . Res. J., 39, 882 (1%9). 184. Lee, J. S. and Fikner, M. D., Text. Res. J., 38, 1044 (1968). 185. Marsh. P. B., Barker, H. D., Ken, T. and Butler, M. L., Text. Res. J..
20, 297 (1950). 186. Goldthwait, C. F. and Robinson, H. M., Text. Res. J., 28, 120(1958). 187. Roberts, C. W., Cheung. P. S. R. and Perkins, H. H., Text. Res. J..
48. 91 11978). ~dber ts , C.'W., Koenig, H. S., MerriIl, R. G. and Cheung, P. S. R., Text. Res. J.. 46,374 (1976). Hadwich, F., Melliand Textilber., 42, 487 (1961). Talpay, B. M., Melliand Textilber.. 49,641 (1968). Perkins, H. H., Text. Indusfr., 135 (3), 49 (1971). Cheung, P. S. R., Roberts. C. W. and Perkins, H. H., Text. Res. J.. 50, 55 (1980). Perkins, H. H., Text. World, 120,49 (July, 1970). Nickerson, D. and Tomaszewski, J. J., Text. Res. J., 28, 528 (1958). Wyatt, B. G., Text. Indurtr., 140, 144 (Oct., 1976). Prier, H. W. and Sasser, P. E., Text. Rex J., 42,410 (1972). Rusca, R. A., Text. Mach. Soc. Japan Symp. (I5 July, 1970). Hunter, L., Textiles: Some Technical Information and Data, Part I1 SAWTRI Special Publication "Wol47" (1978). Summary of Cotton Fiber and Processing Test Results for Crop of 1977, USDA Publication (Aug., 1978). W i a m s , J. F., Vlases, G. and Fielding. H.. Text. Res. J., 20, 719 (1950). .--- -
~ e x t & Terms and Detimitions, 5th Edition, p.83 (1963). Wakeham, H., Text. Res. J., 25,422 (1955). Preysch, M., Spinlab Publication (Zurich, November, 1970). Simpson, J., Codey, J. R. and Schnabel, G. G., Text. Res. J., 27,812 (1957). White, E., Proc. Textile Quality Control Ass. (1966). Prakash, I., Text. Res. J., 34, 857 (1%4). Manual for Uster Spectrograph, Part 111. Conon Testing Service Tests, Available Equipment and Techniques, and Basis for Interpreting Results, USDA Publication (May, 1970). American Cotton Gr., 12, 18 (July, 1976). Audivert, R. and De Castellar, M. D., J. Text. Inst., 63, 356 (1972).
210. Woo. J. L., J. Text. Inst.. 58. 557 (1967). 211. Wesson. M. 1.. "Physical Textile Testing", W.R.C. Smith Publishing
Co., Atlanta, Georgia, p.27 (1951). 212. Sundaram. V. and Ivenear. R. L. N.. Handbook of Methods of Tests . - .
for cotton Fibres, Yarns and Fabrics published by Cotton Technological Research Laboratory (Bombay. 1968).
213. Prentice, A. N. "Cotton", Longman Group Ltd., (London, 1972). 214. Lord, E. and Underwood, C., Emp. Cotton Gr. Rev., 35.26 (1958). 215. Lord, E.. J. Text. Inst., 33, T205 (1945). 216. Kohler, S., J. Text. Inst., 25, TI41 (1934). 217. Preysch, M., Intern. Text. Bull. (Spinnit@, No. 2.299 (1979). 218. Mehta, P. C., Mehta, R. D. and Modi, J. R., Text. Res. J., 32, 77
(1962). 219. Tallant, J. D. and Fiori, L. A., Text. Res. J., 31, 866 (1961). 220. Tallant, J. D. and Fiori, L. A., Text. Res. J., 30,792 (1960). 221. Merchant, V. B., Text. Res. J., 32,610 (1962). 222. Tallant, J. D., Fiori, L. A. and Legendre, D. C., Text. Res. J., 29,687
(1959). 223. Tallant, J. D., Fiori, L. A. and Sands, J. E., Text. Res. J., 32, 50
(1962). 224. Artzt, P., Intern. Text. BUN. (Spinning) No. 4, 139 (1978). 225. Tallant, J. D., Fiori, L. A., Herschel, W. L. and Castillon, A. V.,
Text. Res. J., 33, 1005 (1963). 226. Srikantaiah, G., Indian J. Text. Res., 3, 129 (1978). 227. Hertel, K. L., T&. Zndustr.., 125 (6), 105 (1961). 228. Hertel, K. L. and Craven, C. J., Text. Industr., 124, 103 (July, 1960). 229. Spinlab USA, Model 183 Digital Fibrograph and Model 192 Fibro-
sample, p.20 (July, 1961). 230. Prakash, J., Text. Res. J., 32.244 (1962). 231. Nayar, S. G. and Pai, S. B., J. Text. Ass., 36 (3), 142 (1975). 232. Gordon, H. B., Tert. World, 64, 39 (1923). 233. perkins, H. H. and Bargeron, J. D., USDA Publication 0-270-132
(1978). 234. Markezich, A. R., Text. Res. J., 41,789 (1971). 235. Simpson, J. and Fiori, L. A., T a t . Res. J., 41,691 (1971). 236. Nolen, N. N., Text World, 124, 95 (Dec., 1974). 237. Prakasb, J. and Iyengar, R. L. N., Text. Res. J., 35,90 (1965). 238. Lord, E., "The Origin and Assessment of Cotton Fibre Maturity"
(Technical Research Division of IIC). 239. Brenner, F. C. and Scocca, P. M., Text. Res. J., 26,899 (1956). 240. Tarrin, J. C. and Gutknecht, J., L'lndustrie Textile, No. 1016, 756
(Oct., 1972). 241. Marth, C. T., Arthur, H. E. and Berkley, E. E., Text. Res. J.. 22,561
(1952). 242. Leitget, D. J. and Wakeham, H., Text. Res. J., 26,543 (1956). 243. Perkins, H. H., Text. Industr., 135 (3), 49 (1971). 244. Ramey, H. H., Lawson, R. and Worley, S., Text. Res. J., 47, 885
(1977).
2.15. El-Hattab, H. E., El-Shaer, M. H. and Soliman, M. H., Text. Res. J., 42,655 (1972).
246. Turner, A. and Venkataraman, V., J. Tat. Imt., 25, TI (1934). 247. El-Hattab, H. E., El-Shaer, M. H. and Sarnra, A.M., Tat . Res. J., 42,
650 (1972). 248. Regnery, W., Text. Res. J., 22,49 (1952). 249. Marth, C. T., Arthur, H. E. and Berkley, E. E., Text. Res. J., 22, 561
(1952). 250. ~ i ~ s o n , J., Text. Res. J., 42,661 (1972). 251. Fiori, L. A., Louis, G. L. and Sands, J. E., Text. Res. J., 29, 706
(1959). 252. Fiori, L. A., Louis, G. L. and Sands, J. E., Text. Res. J., 30, 926
~1960L . , 253. Mayne, S. C., Mathews, W. T. and Berkley, E. E., Text. Res. J., 30,
268 (1960). 254. ~hatterjee, R. and Arora, R. K., Text. Res. J,, 44, 327 (1974). 255. ICI Technical Information Leaflet D1551. 256. Hadwich, F., Int. Text. Bull. (Spinning) No. 1, 13 (1975). 257. Woo, J. L. and Postle, R., Text. Res. J., 48, 68 (1978). 258. ASTM D1442-75. 259. D i h k a , V., J. Tat . Ins?., 49, T631 (1958). 260. Du Bois, W. F. and Van de Riet, D. F., Text. Res. J.. 24,265 (1954). 261. Iyengar, R. L. N., Indian J. Agric. Sci., 11, 866 (1941). 262. Lord, E.. Empire Cotton Gr. Rev., 25, 180 (1948). 263. Peirce, F. T., Report of 3rd E.C.S.C. Conference, p.138 (1938). 264. Peirce, F. T. and Lord, E., J. Text. Imt., 30, TI73 (1939). 265. Neelakantan, P., J. Text. Imt., 66, 332 (1975). 265a. Goldthwait, C. F. and Sloan, W. G., Text. Res. J., 31,434 (1961). 265. Ohno. Premier Symposium International de la Recherche Textile
Cotonnikre, Paris, p.157 (Paris, 1%9). 267. Lord, E.. J. Text. Imt.. 48. T37 (1957). 268. Colourage, 24, 44 (28 April, 1977). 269. Furvik, N. B., 'J Soc. Dyers Col., 74, 299 (April, 1958). 270. Fourt, L. and Rutherford, M. B., Text. Res. J.. 24,67 (1954). 271. Prakash, J., Oka, P. G. and Iyengar, L. N., Text. Res. J., 38, 52
(1%8). 272. Lee, J. S. and Fikner, M. D., Text. Res. J., 36, 547 (1966). 273. Anon, Colourage, 23, 38 (5 Feb., 1976). 274. Anon, Text. Topics, 11 (2) (Oct., 1973). 275. Pearson, N. L., Text. Res. J., 25, 124 (1955). 276. Stephens, S. G., Text. Res. J., 47,526 (1977). 277. Hawkins, W. P., Duckett, K. E. and Henry, Z. A., Tennessee Farm
and Home Science. 20 (Jan-March, 1975).

Lord, E., J. Text. Inst., 46, TI91 (1955). Morton, W. E. and Radhaktishnan, S., J. Text. Inst., 45, n 7 4 (1954). NeeIakantan, P. and Shah, N. M., Text. Res. J., 47,407 (1977). Heap, S. A., Canad. Text. J., 92,53 (August, 1975). Burley, S. T. and Barness, E. S., The Causticaire Method for Deter- mining Cotton Fibre Maturity and Fineness, USDA. (Washington, 1952). Webb, R. W. and Burley. S. T., Market Research Rep. No. 57 Washington, 1953). Lord, E., J. Text. Imt., 47, T635 (1956). De Meulemeester, D., Raes, G. and Fransen, T., Ann. Sci. Text. Belges, No. 2, 49 (1954). Goldthwait, C. F., Smith, H. 0 . and Barnett, M. P., Text. World, 97, 105-108.202.206 ~ 4 n . ~oehrich; O..'BUII. inst. ' ~ e x t . France, No. 17, 9 (1950). Porter, B. R. and Rollins, M. L., J. Appl. Polym. Sci., 16,217 (1972). Goldthwait, C. F.. Smith, H. 0 . and Roberts, F. T., Text. Rer. J.. 20, 100 (1950). - Cresp, R., Text. Res. J., 31, 80 (1961). Pal, P. N. and Esteve, R. M., Text. Res. J., 29, 811 (1959). Rebenfeld, L. and Wu, H., Text. Res. J., 31, 886 (I%]). ASTM-DIM. Wyatt, B. G., Amer. Oyest. Rep., 63, 92 (Swt., 1974). ~dshreshtha, A. K., Chudasa&a, V.P. k d ~ w e l t z , . ~ . E., J. AppI. Polym. Sci., 20,2329 (t976). Schwarz, E. R. and Hotte, G. H., Tert. Res. J., 5,370 (1935). Schwarz, E. R. and Hotte, G. H., MeNiand Textiber. 17,549 (1936). Schwarz. E. R. and Sha~iro. L.. Text. Monthlv. 19. 371 (1938). rimes,'^.^., ~ e x t . U;or~d, %(2), ~ ( 1 9 4 5 : Koch, P. A. and Wulfhorst, B., Tertl-Indmtne, 73 (4), 1% (1971). Lawson, R. and Ramey, H. H., J. Testing Evaluation, 6 (4), 248 (1978). Fiori, L. A. and Brown, J. J., Text. Res. J., 21,750 (1951). Sipson, J. and Murray, M. F., Text. Res. J., 48,270 (1978). Hertel, K. L. and Craven, C. J., Text. Res. J., 21, 765 (1951). ASTM-D14.49-58. Peirce. F. T. and Lord, E.. Shirley Institute Memoires. 17, 25 (1939). Stephens, S. G., Text. Res. J., 47,l (1977). Chauhan, R. S., Shah, N. M., Rajagopalan, A. and Dweltz, N. E.. Text. Res. J.. 49, 632 (1979). Lord, E. (Ed.) "The Characteristics of Raw Cotton" Vol. 2, Part 1. The Textile Institute (I%]). De Boer. J. J., Text. Res. J.. 48, 185 (1978).

Booth, J. E., "Principles of Textile Testing", Heywood, London (1%8). Hebert, J. J., Text. Res. J., 37, 57 (1967). Meredith, R., British J. Appl. Phys., 4, 369 (1953) and J. Text. Inst., 42, 1291 (1951). Hebert, J. J.. Giardina, R., Mitcham, D. and Rollins, M. L., Text. . Res. J., 40, 126 (1970). and 45, 356 (1975). Morosoff, N. and Ingram, P., Text. Res. J., 40,250 (1970). Rollins, M. L. in "American Cotton Handbook Vol.1 (Hamby, D. S., Ed.), Interscience Publishers, p.44 (1%5). Hearle, J. W. S. and Greer, R., Text. Prog., 2 (4) (1970). Hearle, J. W. S. and Sparrow, J. T., J. Appl. Polym. Sci., 24, 1465 (1979). Meredith, R., Text. Prog., 7 (4) (1975). Raes, G., Fransen, T. and Verschraege, L., Text. Rex J., 41,633 (1971). Iyengar, R. L. N., Text. R e . J., 34, 368 (1%4). Warwicker, J. O., Simmens, S. G. and Hallam, P., T&. Rer. J., 40, 1051 (1970). Hebert, J. J., Text. Res. J., 49, 575 (1979). Meredith, R. J., J. Text. Inst., 37, T205 (1946). Duckett, K. E. and Goswani, B. C., Text. Res. J., 49, 368 (1979). Bowman, F. H., Structure of the Cotton Fibre. Macmillan, Manchester (1908). Duckett, K. E. and Cheng, C. C., Text. Res. J., 42,263 (1972). Datar, K. L., Betrabet, S. M. and Sundaram, U., Text. Res. J., 43,718 (1973). Krishna Iyer, K. R. K., Neelakantan, P. and Radhakrishnan, T., J. Poiym. Sci. Polym. Phys., 1.983 (1%9). Egle, C. J. and Grant, J. N., Text. Res. J., 40, 158 (1970). Warrier, J. K. S., Munshi, V. G. and Chidambareswaran, P. K., Text. Res. J., 49,617 (1979). Duckett, K. E. and Tripp, V. W., Text. Res. J., 37,517 (1967). Betrabet, S. M. and Iyengar, R. L. N., Text. Res. J., 34,46 (1%4). Petkar. B. M.. Oka, P. G. and Sundaram, V., Colouroge, 25, 21 (17 A U ~ . , i978).
.
333a. Schloemer, H., Kunstseide, 12, 382 (1930). 334. Von Bergen, W. and Krauss, W., Textile Fiber Atlas (1942). 335. Calkins, W. S., Text. Rer. J., 20, 426 (1950). 336. Herbert, J. J., Boylston, E. K. and Wadsworth, J. I., Text. Res. J., 49,
540 (1979). 337. ~ k a i , E. i., ~ e x t . ~ e s . J., 21, 14 (1951).
338. Om, R. S., Humphreys, G. C. and Grant, J. N., Text. Res. J., 22,89 (1952).
339. Preston, J. H. and N i a r , M. V., J. Text. Inst., 40,674 (1949). 340. Collins, G. E., J. Text. Inst., 30, 46 (1939). 341. ASTM-D1444-72 342. ASTM-D629 343. Heckert, W. W., Text. Res. J., 27,719 (1957). 344. Text. Topics, VI (5) ( J a n . , 1978). 345. Ramey, H. H., Lawson, R. and Worley, S., Text. Res. J., 47, 685
(1977). 346. Nanjundayya, C., Text. Rex J., 26,682 (1956). 347. Brown, H. M., Text. Res. J., 24,251 (1954). 348. Pascu, E., Text. Res. J., 21,287 (1951). 349. Text. Industr., 142.64 (Oct., 1970). 350. Lawson, R., Text. Res. J., 34.725 (1%4). 351. Rouse, J. T., Text. Res. J.. 34, 908 (1964). 352. Om, R. S., Weiss, L. C. and Grant, J. N., Text. Res. J., 25,939 (1955). 353. Manual of Instruction for Stelometer (Spinlab Knoxville, USA). 354. Suessen Pocket Book (Spindel-Fabriek Suessen). 355. Dexter, L., Text. Res. J., 24. 587 (1954). 356. Raes, G., Fransen. T. and Verschraege, L., Ann. Sei. Text. Belges., No.
4, 322. 357. Fiori, L. A., Brown, J. J. and Sands, J. E., Tert. Res. J., 24, 503
(1954). 358. Fiori, L. A.. Brown, J. J. and Sands, J. E.. Text. Res. J., 26, 2%
(1956). 359. Tert. Industr., 119 (41, 116 (1955). 360. Rouse, J. T., Text. Res. J., 24,498 (1954). 361. Landstreet, C. B., Proc. Seventh Cotton Improvement Conference,
Greenville and Stoneville, Miss. U.S.A (Oct.. 1954). 362. Ruppenicker, G. F., Kingsbery, E. C. and Bouquet, N. A., Text. Res.
J., 47, 239 (1977). 363. Sands, J. E., Fiori, L. A. and Brown, J. J., Text. Res. J., 30, 389
(1W). 364. Krasny, J. F. Sookne, A. M. a d Stam, P. B., Text. Res. J., 32,258
(1962). 365. Text. Industr., 143, 80 (Sept., 1979). 366. Freiber, E. "Die Chemie der Pflanzenzellwand", Berlin Springer-
verlag. p.378 (1957). 367. Wakeham, H. and Spicer, N., Tat . Res. J., 21,187 (1951). 368. Lawson. R. and Ramev. H. H.. Text. Res. 1.. 47.249 11977). 369: ~awson; R., Ramey, H. H. and Jones, J. B.; T&. ~ k s . J.', 49, 433
(1979).
Venkatesh, G. M., Text. Res. J., 45,813 (1975). Stephens, S. G., T a t . Res. J., 48,407 and 431 (1978). Hertel, K. L. and Craven, C. J., Text. Res. J., 26,479 (1956). Fiori, L. A., Sands, J. E., Little, H. W. and Grant, I. N., Text. Res. J.. 26, 553 (1956). Du Bois, W. F. and Van de Riet, D. F., Text. Rex J., 36, 97 (1966). Louis, G. L., Ron, L. A. and Sands, J. E., Text. Rex J.. 31, 43 (]%I). Waters, W. T., Phillips, J. and Fiori, L. A., Text. Res. J., 36, 1004 (1966). Louis, G. L., Fiori, L. A. and Sands, J. E., Text. Res. J., 31, 478 (1961). Rees, W. H., J. Text. Inst., 39, T131 (1948). Amer. Rep/Bull, AT-1, No. 6, 40 (1972). Farrow, B., J. Text. Inst., 47, T58 (1956). Peirce, F. T., J. Text. Inst., 14, T7 (1923). Skelton, J., J. Text. Inst., 58, 366 (1%7). Chauhan, R. S., Shah, N. M. and Dweltz, N. E., J. Text. Inst., 71,18 (1980). Belser, R. B. and Taylor, J. L., Premier Symposium International de la Recherche Textile Cotonnitre, Paris, p.111 (Paris, 1%9). Hertel, K. L., Duckett, K. E. and Lawson, R., Premier Symposium International de la Recherche Textile Cotonnihe, Paris, p.139 (Paris, 1x9). Simpson, J. and Fiori, L. A., Text. Res. J., 44, 813 (1974). Mody, R. K. and Subramanian, P. V., Text. Digest, 177 (Dec., 1971). Duckett, K. E. and Cheng, C. C., Appl. Polym. Symp.., No. 27, 317 (19751. ~ w a l d , P. R., Appl. Polym. Symp., No. 27, 345 (1975). Seshan, K. N., J. Text. Inst., 69, 214 (1978). Lawson, R., Ramey, H. H. and Krowicki, R. S., Text. Res. J., 46,715 (1976). Lennox-Kern, P., Text. Industr., 134, 57 (Oct., 1970). Van Heerden, H. G. and Cronje, C. J., S.A. Textiles, 22, 83 (Nov., 1974). Hunter, L., Spencer, J. D. and Gee, E., SA WTRI Teehn. Rep. No. 460 (1980). Watson, H. and Helmer, J. D., Progress Report ARS 42-107, Agricultural Research Service, Beltsville, Maryland (1%4). Perkins, H. H., Text. Res. J., 41, 559 (1971). Mangialardi, G. J. and Shepherd, J. V., Text. Res. J., 39, 11 (1%9). Van Alphen, W. F., Melliond Textilber, (Eng.Ed.), 359 (May, 1978).

399. Peirce, F. T., Kelly, J. F. and Coleman, M. H., J. Text. Inst., 46, T78 (1955).
400. Anon, Colourage, 24,44 (28 April, 1977). 401. Rusca, R. A., Little, H. W. and Gray, W. H., Text. Res. J., 34, 61
(1944). 402. Danielowski, G., Canad. Text. J., 94, 51 (Nov., 1977). 403. Towery, J. D. and Baker, R. V.. Text. Res. J., 49, 127 (1979). 404. Sasser. P., Jones, J. K. and Slater, G. A., Agro-Industrial Report, 3
(3), (April, 1976). 405. Anon, Amer. Textiles Rep/BuN AT-3.48 (Sept., 1974). 405a. Ficher, J. J., Text. Rer. J., 50, 93 (1980). 406. Brown. D. F.. McCall. E. R.. Piccolo. B. and Trino. V. W.. American
~ndus&al ~ i j e n e ~ssociatidn ~ o u r n k 38,3/77,-;.i07 (1977). 407. Whitworth, J. W., Sources Resources, W?7/4,20 (1977). 408. Mandl. G., Dust in Spinning M i , Rieter Publication (1976). 409. Anon, Text. World. 127.35 (June, 1977). 410. Anon, Text. Industr., 141, 9 (Feb., 1977). 411. Mittal, D. K., Fornes, R. E. and Gilbert, R. D., Text. Res. J., 49,364
(1979). 412. Men, K., Progressive Farmer, 52 (Jan. 1980). 413. Griffm, A. C., Hatcher, J. D. and Cocke, J. B., Text. R s . J., 47,129
(1977). 414. Kamat, S. R., Kale, S. C. and Dan,mual, S. K., Indian Text. J., 87,73
(Sept., 1977). 415. C ~ k e , J. B. and Perkins, H. H., Amer. Text. Rep./Bull., AT-7, 12
(Sept., 1978). 416. Text. World, 112. 31 (May, 1971). 417. Cocke, J. B., Perkins, H. H. and Bragg. C. K., Amer. Ta t .
Rep./Bull. AT-6,43 (March, 1977). 418. Taylor, W. E. and Sasser, P. E., Beltwide Cotton Res. Conf., 125
(1976). 419. Canad. Text. J.. % (4), 93 (April, 1979). 420. Welty, R. E., Gilbert, R. D. and Fornes, R. E., T a t Res. J., 47, 38
(1977). 420a. Perkins, H. H. and Cocke, J. B., Text. Industr., 142.92 (Nov., 1978). 421. Brown, D. F. and Berni, R. J., Text. Res. J., 47. 152 (1977). 422. T a t . Rer. J., 50.61-96 (1980). 422a. Mandl, G., Melliand Textilber., 61, 305 (1980). 423. Northmp. H. and Turner, W. F., T a t . Chem. Col., 7, 60/22 (April,
1975). 424. ~o&ngues , G. S., Text. Industr., 139, 77 (April, 1975). 425. ~ockray , G. H.. Meadows, B. and Smith, L., Text. R a . J., 20.684
(1950).
426. Binder, R., Text. Mfr.. 76 (2). 10 (1976). 427. A1 Ah, R. and Schenek, A., Textil-Praris Int., 34 IX and 1459 (1979). 428. Text. Asia, 10, 68 (Nov., 1979). 429. Webb, quoted in Ref. 18. 430. Lebenfeld, L, Text. Res. J., 27,473 (1957). 431. Mangidardi, G. J., Cotton Gin and Oil Mill Press, 14 (Oct., 1975). 432. Grant, J. N., Morlier, 0. W., Scott, J. M., Text. Res. J., 22, 682
(1952). 433. Honold, E. and Brown, R. S., Text. Bull., 93 1 (Dec., 1x7)- 434. Gupta, D. K., H-Kish, M. and El-Shiekh, A., Text. Res. J,, 47, 428
(1977). 435. Anwar, M. S., Pakistan Text. J., 7 (July/Aug., 1973). 436. Proc. Eleventh Techn. Conf. (ATIRA, BTRA and SITRA), 2,1(1%9). 437. Du Bois, W. F. and Van de Riet, D. F., Text. Res. J., 24,262 (1954). 438. Srinathan, B., Ramanathan, S., Sundaram, V. and Parthasarathy,
M. S., Indian Text. J., 86, 87 (May, 1976). 439. Grunder, H. R., Tat . Indwtr., 132 (6), 93 (1968). 440. Orcutt, P. L. and Wakeham, H., Text. Res. J., 23,614 (1953). 441. Shepherd, J. V., Text. Res. J., 28, 579 (1958). 442. Wegener, W., Textil-Bar&, 35, I l l and 130 (1980). 443. De Meulemeester, D., Raes, G. and De Backer, G., Ann. Sci. Text.
Belges, 2, 39 (1953). 444. Fessmann, E. R., (1932). 445. Neuki iner , A., Textil-Praxis, 23, 403 (1968). 446. De Meulemeester, D., Raes, G. and De Backer, G., Ann. Sci. Text. 2.
14 (1954). 447. Koeb, H., Text i l -his , 10, 11 and 324 (1955). 448. Goldthwait, Ch. F., Wiles, R. L. and von Sales, V. R., Amer. Dyest.
Rep., 15, 544, 574 (1961) and Textil-Praxis, 17,405 (1962). 449: Ebert, H., Spinner und Weber, 75, 311 (1957). 450. Suebius, M., MeII. TextIber., 36, 548 (1955). 451. Hartenhauer, H. P., Textil-und-Fuserstofftechnik, 5,603, 645 (19551,
Deutsche Tertiltechnik. 8, 52, 114 (1958). 452. Bogdan, J. F., Feng, I. Y. T. and NeweU, W. A., Text. World, 1102,87
(1952). 453. Kaufmann, G., Textil-Prarir, 12,652 (1957). 454. Kaufmann, D., Textil-Praxis, 12 1077 (1957); 13 149 (1958). 455. Kaufrnann, D., Textil-Prais, 16, 1093, 1193 (1961); 17, 13, 111, 216,
326, 437, 539, 646, 760, 885, 982, 1094 and I207 (1962). 456. Fujino, K. and Itani, W., Text. Mach. Soc., Japan, 8, No. 4, 1 (1962). 457. Schenkel, E., Textil-Pr&, 12, 631 (1957). 458. Juengling, P., Tertil-Pmris, 17, 980 (1962).
459. Wegener, W. and Peuker, H., Verktiizte Baumwollspinnerei, Lapp Verlag, MMBhengladbach, (1965).
460. Herzog, A. and Koch, P. A., Mell. Texfilber., 16,413, 561, 617, 689 (1935); 17,1,101,169,285,377,453,533,613 (1936); 18,429,505,593, 701,785 (1937); 19, 157,245, 337, 425 (1938).
461. Ghosh, G. C., Wakankar. V. A. and Bhaduri, S. N., Indian Text. J.. 72,73, 80 (1961).
462. Pemer, H. and Jung, G., Deutsche Textiltechnik, 11, 61 (I%]). 463. Loecker, R., Zeitschrift fur die gesamte Textilindustrie, 62.592 (1960). 464. Jueneline. P.. T d - h m i s . 16. 1000 (1%1). - -. , . ,
465. Leunenschloss, J. and Wagner, H., T&I-haxis, D, 767 (1958). 466. Souther, R. H., Text. Res. J., 28, 582 (1958). 467. Morgan, W. V., J. Text. Inst., 51, T998 (1960). 468. Pryor, L. D. and Elting, J. P., Text. Res. J., 28, 575 (1958). 469. Marth, C. T., Arthur, H. E. and Berkley, E. E., Text. Res. J., 22,561
(1952). 470. Blaschke, K., Textil-Prmis, 10, 1213 (1955). 471. Markezich, A. R., Tallant, J. D. and Worner, R. K., Textil. Res. J.,
28, 570 (1958). 472. Schnitzler, G., Bull. Inst. Text., France, 24, No. 146, 81 (1970). 473. Rudnick, E. S., T a t . World, 102, No. 2, 169, 260 (1952). 474. Jener, J., Textil-und-Fuserstofftechnik, 3.364 (1953). 475. Simon, E., Textil-und-Fuserstofftechnik, 3, 361 (1953). 476. Wegener, W., Forschungsberichte des Landes Nordrhein-Wesrfalen,
Nr. 818, Westdeutscher Verlag K8ln nnd Opladen, (1959). 477. Break Spinning, Shirley Institute, Manchester. The Cotton Silk and
Man-Made Fibres Research Association. 478. Kirschner, E. and Kleinhansl, E., Texti/-Pr~k, 25, 599, 644, 723
(1970). 479. Souther, R. H., Tat . R s . J., 24,495 (1954). 480. Van Dalfsen, J. W. and Zaat, J. C. A., Text. Res. J., 24, 1003 (1954). 481. S i p s o n , J., Text. Res. J., 42, 590 (1972). 482. Simpson, J., De Luca, L. B. and Fiori, L. A., Text. Res. J., 37, 504
(1967). 483. Markezich, A. R., Tallant, J. D. and Womer, R. K., Text. Res. J., 28,
570 (1958). 484. Crewther, W. G. and Dowliing, L. M., Text. Res. J., 31, 14 (1961). 485. Douglas, K. (Ed.), Uster News Bulletin No. 17 (May, 1971). 486. Stigter, D., Text. Res. J., 42, 657 (1972). 487. Wolf, B.. Int. Text. Bull. (Spinning) No. 2, 115 (1972). 488. Burley, S. T., Bragg, C. K. and La Ferney, P. E., Summary Proc.
"Cotton Quality and Processing Conference': p.1 l (1971). 489. Shanklin, E. H., Bragg, C. K. and Burley, S. T., Ibid, p.4 (1971).
490. Iyengar, R. L. N. and Gupta, A. K., Text. Res. J., 44,492 (1974). 491. Sourady,A. S. E., Worley, S. andsmith, L. S., Text. Res. J., 44,301
(1974). 492. Lawson, R., Worley, S. and Ramey, H. H., Tert. R e . J., 47, 755
(1977). 493. kusca, R. A., Cotton Gr. Rev., 47, 206 (1970). 494. Aldrich, DeV., SA WTRI Techn. Rep. No. 299 (May, 1976). 495. Louis, G. L., Fiori, L. A. and Leitz, L. A., Text. Bull., 94,43 (April,
1968). 4%. Balasubramanian, N. and Iyengar, R. L. N., J. Text. Imt., 55, T377
(1969. 497. Balasubramanian, N. and Ivenzar. R. L. N.. Indian Text. J.. 71. 561 - - . - ,
(1961). 498. Ukidve, A. V., Sundaram, V. and Oka, P. G., Text. Digest, No. 3,115
(1971). 499. Felix, E., Intern. Text. Bull. (Spinning), No. 2, 313 (1979). 500. Douglas, K., quoted by Lennox-Kerr, P., Text. Asia, 11 (2), 71 (Feb.,
1980). 501. Newton, F. E., Burley, S. T. (Jr.) and La Ferney, P. E., Text. World,
116, SO (March, 1966). 502. Text. Topics, 3 (6) (Feb., 1975). 503. Vaughn, E. A. and Rhodes, J. A., Am. Soc. Mech. Eng., 76-Tex-7, 1
(1976). 504. Hancock, N. I., J. Amer. Soc. Agron., 36, 530 (1944). 505. Patel, C . K., Shelat, B. R. and Radakrishnan, T., Textile Trends, 43
(Jan., 1%4). 506. Chisholm, B. A., in "Rotor Spinning, Tecbcal and Economic
Aspects", E. Dyson, Ed., Textile Trade Press, Textile Book Service (~lainfie~d 1975). Bogdan, J. F., Text. Res. J., 37, 536 (1967). Knecht, E. and Hall, W., J. Soc. Dyers Col., 34,220 (1918). V i n t . P. D.. Shirlev Imt. Mem.. 3. 125 (1924). , -
Merzban, M. A.] ~ o i o n Intern., 126(1972). '
Harnby, D. S.. Stuckey, W. C. and Gast. B., Text. Res. J.. 30, 435 WQ). Louis, G. et al, Text. Industr., 128,71 (1964). Weiss, L. G., Tsoi, R. H., Sands, J. E. and Grant, J. N., Text. Res. J., 34, 605 (1964). Campbell, M. E. quoted in the above ref. and Text. World, 109 (7). 35 (1950). Louis, G. L. and Fiori, L. A., Proc. Cotton Res. Clinic, 35 (1x7). P iay , K. P. R., Seshan, K. N. and Venkatesan, N., Proc. Eleventh Techn. Conf. (ATIRA, BTRA and SITRA), 1.90 (1970).
5 7 Hafez, 0. M. A., Text. Res. J., 48,701 (1978). 518. Louis, G. L. and Fiori, L. A., Text. B d . 1 (July, 1967). 519. Hafez, 0. M. A., Proc. Int. Symp. Cotton Text. Res. (Paris), p.185
(1969) and Du Bois, W. F., J. Text. Inst., 62,403 (1971). 520. Cotton Trade J., 42, 4, Sec. 2, 20 (1962). 521. Pillay, K. P. R., Text. Res. J., 41, 11, 16 (1971). 522. Jain, P. S., Text. Res. J., 41, 88 (1971). 523. Mack, C. H. and Hobart, S. R., Text. Res. J., 42, 1 (1972). 524. Graham, J. S. and Taylor, R. A., Text. Res. J., 48,286 (1978). 525. Stewart, R. E. and Parsons, L. E., Text. Res. J., l9, 283 (1949). 526. Schultz, E. F., Little, H. W., Tallant, J. D. and Fiori, L. A., Text.
Res. J., 31, 872 (1x1). 527. Burley, S. T., Text. Res. J., 29, 6% (1959). 528. Fiori, L. A. and Louis, G. L., Text. Industr., 127, 66 (Oct., 1963). 529. Balasubramanian, N., Trivedi, G. K. and Bhhnot, B. N.. BTRA Scan, :
6, 5 (Sept., 1975). 530. Louis, G. L., T a t . Industr., 125, 76 (Oet., 1x1). 531. Jain, P. S., Proc. Eleventh Techn. Conf. (ATIRA, BTRA and SITRA),
1 70 (1969). 532. Brown, J. J., Howell, N. A., Fiori, L. A.. Sands, J. E. and Little,
H . W. , Text. Res. J., 27, 332 (1957). 533. Khanna, R. C., Indian Text. J., 86, 177 (August, 1976). 534. SITRA Newsletter. 16, 7 (Sept./Oct. 1975). 535. Bogdan, J. F., Proc. "Cotton Res. Clinic", 30 (1967). 536. Subramanian, T. A., Ganishi, K. and Bandyopadhyay, S., J. Text.
Inst., 65. 307 (1974). 537. Iyengar, R. L. N. and Gupta, A. K., Text. Res. J., 44,492 (1974). 538. Abou Sehly, A. A. H., Tallant, J. D. and Worner, R. K., Text. Res.
J.. 27, 73 (1957). 539. Brown, C. H., "Egyptian Cotton", Leonard Hill, London, p.102
(1953). 540. Youssef, A. A. and Hafez, 0. M. A., Text. Mfr., 80, 286 (1954). 541. SITRA Newsletter, 17 (1976). 542. Balasubramanian, N., J. .Text. Inst., 66.45 (1975). 543. Anderson, S. L. and Foster, G. A. R., J. Text. Inst., 46, T551 (1955). 544. Ratnam. T. V., Seshan, K. N. and Govindarajulu, K., J. Text. Imt..
65, 61 (1974). 545. Douglas, K. (Ed.), Uster News Bulletin, No. 21 (Nov., 1973). 546. Mueller, H., "Symp. Quality Assurance in Modern Textiles (Pretoria,
1974). 547. Douglas, K. (Ed.), Uster News Bulletin No. 27 (Aug., 1979). 548. Douglas, K. (Ed.), Uster News Bulletin No. 24 (Nov., 1976). 549. Douglas, K. (Ed.), Uster News Bulletin No. 23 (Aug., 1975).
Copyright © 2022 FDOKUMEN