TliE IKDONESIM COTTON TEXTILE INDUSTRY
442
TliE IKDONESIM COTTON TEXTILE INDUSTRY DURING INFLATION, 1950 - I963. A case study of an industry in an underdeveloped country. Ingrid Palmer This t,heisis is submitted to fulfil the requirements for the degree of Doctor of Philosophy at the Australian National University. March I968
-
Upload
khangminh22 -
Category
Documents
-
view
2 -
download
0
Transcript of TliE IKDONESIM COTTON TEXTILE INDUSTRY

TliE IKDONESIM COTTON TEXTILE INDUSTRY
DURING INFLATION, 1950 - I963.
A case study of an industry in an underdeveloped country.
Ingrid Palmer
This t,heisis is submitted to fulfil the
requirements for the degree of Doctor of
Philosophy at the Australian National University.
March I968

11
statement,
iixceiot v/here otherv/ise stated
in the text this is entirely
the v;ork of the author.

Ill
PSiiFACS
If an economist v/ere asked to choose one aspect of a country's
economy which could best illustrate the quality of its economic organ-
isation and problems he v/ould, at some stage, consider reviev/ing one of
the largest single industries in the country. 'Jnether , or not he
finally settled on a large industry v/ould depend on how deeply a study of it
it would reveal and explain the characteristics of the economy in
general. If the country v/as developing along new lines he would prefer
a new or expanding industry; if he felt the economy v;as dominated by the
state of the balance of payments he v/ould desire a strong relation
between foreign excliange and the level of activity in the industry of
his choice.
In the case of Indonesia it is not difficult to choose a subject
of economic investigation v/hich is an important part of secondary
industry, which is highly sensitive to government policy, and v/hich
demonstrates the chief frustrations of a developing country: chronic tK
balance of payraents difficulties, infle-tion, an^experienced indigenous
managerial class, and an inefficient and demoralised bure^racy. i'he
cotton textile industry has received the special attention of the
govei-nraent as a major import-replacement industry and as a vehicle for
the industrialisation of the economy, iis a manufacturing industry'-
almost entirely dependent on imports for its raw materials it has
suffered convulsions in the level of its activity: capacity utilisation
rates have varied between 'l6 and 57 per cent since 1950. Government
attempts at intervention aimed at specific goals have almost invariably

IV
failed, and yet the industry's grov th can be regarded as a success
story in as much as this predominantly privately ovaied sector of the
economy has expanded from a capacity capable of prodvicing two metres
of cloth per capita in I950 to a capacity of 7-3 metres per capita in
1965.
Development did not take place at a imiform rate and this thesis
described the serious problems v/hich the industry had to face and hov/
and v;hy some sections survived whole others fell into diduse.
An extreraeity varied bibliography provided background information
on the form of the industry, its or^-anisation and the economic regul-
ations v/hich encompassed it, but the story of the grov/th of the industry
since 1950 could not have been told in the way it has been presented
hdre without extensive interviewing of manufacturers and civil servants,
'-l-'he operation of the free market in yarn within the country and the
influence of inflation on the costs of different sections of the
industry are studied almost entirely in the light of disaussions held in
196^ and 1965 in Indonesia.
I have to thani: r.r. Bruce J. Mcfarlane for encouraging me to
undertal^e this project and for offering me advice on the basis of his
o ™ experience in developing, cotintries. '"he project was facilitated by
a scholarship from the Australian National University and ray gratitude
is extended to ^'rofessor Arndt for arranging facilities without which
this thesis would almost certainly lack some of its original source
material. Dr. W. H. Corden guided me through preparatory reading and
supported the project v/hen there appeared to be some doubt about the

prospects for field v/ork in 1964.
•t woixLd be impossible to mention all the people in Indonesia
who assisted rae in field v/ork but rny special thaniis go to i'.r. Suryana
of the Department of People's industry, Dr. Jujiin Wirasasinita, Dean of
the ""acuity of -Economics, University of Padjajaran, Hiss Angela Jo Pin
Pin, and Dr. J. Panglaykim, then of the University of Indonesia.
My special thanks are due to Dr. C. A. Blyth v/ho supervised the
v/riting of the thesis. Dr. Blyth guided me in sorting out a mass of
raw data and opinions gained during interviews and always appeared
undaunted. His advice and comments v;ere of great value to me.
Dr. Panglaykim , Kr. Mcfarlane and -r. Ken llioraas read some of
the draft chapters and their helpful comments v/ere gratefully received.
The conclusions on the develofoment of the textile industry are
ray oi-m and I must also remain responsible for any errors in fact or
analysis.

vi
Summary of arpruments»
The growth of the Indonesian textile industry from a cottage industry
using primitive haridlooms in I95O to a modern industry with improved
handlooms and power looms capble of producing almost 7.5 metres per A
capita per ajinum has not occured under conditions which were obviously
favourableo A study of the structure of the industry and the ramifications
of other expects of the economy v/as found to be necessary in order to
explain v/hy the private sector of the industry continued to grow at a
pace which doubled its production capacity in ten years while at the same
time it rarely achieved more than per cent utilisation of its capacity.
The Tjurpose of Chapter II is to provide an explanation of the origins
ajid causes of the main v/ealcnesses of the textile industry, which were so
apparent after the Second orld War, before the analysis and arguments
of the thesis are presented in Chapters III to VIII.
Chapter III, ''Government Pla.ns and the Expansion of the Industry",
describes the methods used by the governinent to expajid and improve the
textile industry and the reasons for their partial failure. A shortage
of foreign exchange is discounted as a main cause of the failure of the
plans for expansion. But the inflation which continued throughout the
period underuiined the incidence of tariff protection and this is regarded
as a major contributing influence to the lack of success. Furthermore, the
generous credit allowances to the indi3;enous group of entrepreneurs were
not accompajiied by measures to im#prove its managerial competence and no
serious consideration was given to the problem of providing working capital.

VIX
"Costs and Differences in Costs''^ (Chapter IV) describes the
sources of cost differences v;ithin the industry and demonstrates hov/
inflation acted to increase the range of costs per unit of output. The
variable cost structures provided the basis for the disruption of the
official distribution of rav/ materials and the development of the free
market in yarn v/hen there was a shortage of raw materials, ^t is bel-
ieved that a study of the structural changes in the textile industry
caiised by inflation is one of the more distinctive contributions of the
thesis because these changes are bound to affect the range of costs per
unit of output and, therefore, decisions on protection policy.
In Chapter V, "The Supply and Distribution of Materials",
determinants of the volume of imported rav; materials are discussed
together v;ith the effects of private and government distribution
systems. Official planning of supplies was invariably clui'nsy and often
inappropriate while the lack of supervision led to the disruption of
official supplies. In spite of government attempts at protection for
the whole industry and special support for the wealier enterprises, for
most of the time only 30 to per cent of weaving capacity was
utilised and most of this activity v/as confined to the larger and
stronger enterprises,
'-i-'he interest \/hich speculative practices in Indonesia arouse
usually centres on the nature and manifestation of these practices.
Fascinating as tliey are it is not the purpose of this thesis to
describe the Indonesian characteristics of a phenomenon which is the
to be found in varying degree in all countries. Instead, Chapter VI,
"The Development of a Speculative Free tiarket in Yarn", demonstrates

viii
how the free majrket benefits the industry by chejinelling yarn allocat-
ions to large enterprises Virhen they raijht not have been taken up by
small v/eavers. The irregular supplies of yarn caused speculation which
assisted large weavers by providing a more constant supply of yam. By
mailing the sale of allocations more attractive to the small v/eaver it
increajsed the shift of production to the more efficient section. Hov/ever,
the ajialysis did not indicate whether total profits of the large scale
section increased. Inflation affected the free market by leading to
larger rises in the cost schedules of the small v/eaver than of the large
weaver, and by lowering the influence of tariff protection. In fact, the
lag in price increases of several of the factors of large scale product-
ion perr.iitted this section to m.aintaj.n production with profits for some
time after the v/hole industry's position had been weakened by inflation.
If Chapter VII, "Protection ajid the Influence of Inflation", were
merely an anaJLysis of the effect of rising domestic costs on tariff
protection it would not deserve a chapter on its own. But tariffs (or
surcharges) v/ere only one form of several measures of protection used
and this chapter examines the progress of the indiistry under the effect
of inflation on different combinations of measures. One of the most
influential, measures, and one v/hich did so much to make up for the wealc-
ened tariff protection, was credit policy particularly in the form of
discriminatory requirements of advajice import payments.
Chapter VIII, "The Indiistry After Fourteen Years of Support and
Protection", is an attempt to infer from the available, though very
limited, statistics what part of the textile industry can compete with
overseas textiles at different levels of tariff protection. The earlier

XX
chapters nipJce it apparent that the competitive strength of the weaving
section was far from uniform and therefore an aggregate assessment of
the industiy is thought to be meaningless; but this review comes to the
tentative conc.ltision that only a quarter of present weaving capacity-
could operate if tariff protection were no more than 33'3 ?er cent.
Finally, Chapter IX closes the thesis with an examination of the
costs and benefits of the development of the textile industry so far.
Issues concerned with the fu.ture growth of the industry are discussed
with reference to the general economic situation in the mid 1960s and
the greater polarisation of efficiency levels and production activity
within the industry since 1950. The concliision is drawn that the
textile industrj^ is potentially an important source of forei,gn exchange
saving and C3JI be regarded as anti-inflationary. The capacity of the
v/eaving industry is probably larger than the country's capacity to
keep it fully utilised with imported raw materials, and it would seem
appropriate to use the next few years \ in training indigenous managers
before further expansion is undertalien.

X
C O N T E N T S
Preface iii
Svunmary of Arguments v i
I. Introduction. 1 Definition of the industry 2 Difficulties encountered during the expansion 5 The layout of the thesis 7 Sources of information 8
II. The Industry Prior To 1950. 'I'-r The industry under free trade, 1900-1933. Origins:
The origin of the sarong industry: Finance: 1o
Pre World Vi/ar I: 17 Public concern for the economy: 17 DeveloTonient: 20
Post World iVar I: 21 The influence of /orld ^Var I on government attitudes :21 Development: 22 The situation on the eve of the Depression: 2k
The textile industry as a means of economic development, 'l93^-^2. 26
Eeasons for the change in government policy: 2S The new policy: 32
Imports: 32 Manufacturing: 35 Other fonns of protection: 37
Entrepreneurial v/eaimesses: kO Capacity and production: 46
The expansion to 19^2: 46 Production: 51
Assessment of the expansion: 53 The industry v/ithout government planning, 1942-50. 55 The Japanese Occupation: 55 Postwar development: 56
Expansion of capacity: 56 Production and imports: 59 Capacity utilisation in 1950: 62
Economic reform in 1950: 64 Measures talcen: 64 The effects of the measures: 65
The competitive position of the industry in I95O: 69 Summary- 73

XI
III. 3-overnr.ient Plans and the Expansion of the Industry. 75 Sconofflic background to the exToajision. 75 General aims and 'principles of policy* 79 Tlie expansion. 82 The 1951 Economic Uria;ency Pro.-ramme. 85 The Mechanisation of Small Scale Industries
Programme. 87 The Five Year Plan, 1936-I96O. 91 The Ei.rqit Year Plan^ 95 Targets: 9^ Execution: 97
1.Technical training: 97 2.Spinning: 98 3.'7eaving and knitting: 101
Finishing: 102 Causes of the failure of the plan: 102
An alternative plan: 103 The role of the public sector. IO5 Teclinical problems of the expajision. 10? Obstacles to expansion of fixed capital. 109 Shortage of foreign exchange: 110 Inadequate protection: 113 Limited managerial ability and absorptive capacity: II6 Difficulties of working capital: 119
Conclusion. 120
IV. Costs and Differences in Costs. 123 Sources of cost differences and the effects of
inflation. 130 Managerial ability: I30
1.Differences in attitude to commerce: I3O 2.Financial competence: 133 3.Personal relationships: 131-
Marketing practices: 135 1.The high cost of marketing in Indonesia: 135 2.Marketing by the manufacturer: 137 3.Marketing by the cooperative: I38
i.echanisation (and depreciation): 139 1 .Spinning equipment: -139 2.V.eaving: 139 3.The cost of mechanisation: 1^2 ^-Finishing factories: 1^6 5.Depreciation: 1^6
-sv/ materials: 150 1.P^w cotton prices: 150 2.Yarn allocation prices: 151 3.Free market yarn prices: 152 ^f.Official and free market prices compared: 152 ".Prices of raw materials for finishing: 15^

XIX
Lab our c os ts: 1. -'ares and labour productivity: 2.Differences in wage costs: 156 3.' l'rends in wage costs: h.Lov/ productivity and high wages in medium
sized firms: Pov/er costs: 1.State electricity: 2.Private generators: 3.State and private pov/er costs compared:
"..'orking capital: 1. i'iav/ mate rials: '' 2.V/ages: 3. arl:eting: i.Total, requirements:
Final costs and trends* Manage rial costs: 179 yapitpl costs:
Conclusion.
I6k 16^
180 181
Different rav; materials costs: .•LLlov/ancer/:. for working ca'oital: ''82
185
Vo The Supply and Distribution of Materials. 191 Data on supplies of rav; materials. 195 Planning of imported raw materials. 201 Pre 1939: 201 1.Progress 1951-1956: 203 2.: rotecting the economy before the textile
industry, 1957-1958: 20? Departmental planning, 1959-196 1: 20?
Distribution of all supplies. 213 Official allocations: 213 1.The role of the J.P.P.(Foundation for Supplies
of -aw i laterial-s) : 215 2.The role of the Department of People's Industry: 216 3oThe role of the Price Control Office: 216 The role of the P.D.Us.(State Trading Corporations): 21o
3.The role of the cooperatives: 218 6.Corruption of the channels of distribution: 220
Free distribution: 230 The effects of government intervention in distribution: 230
Reorganisation of planning; and distribution by Kommando Tertin.ggi Operasi Ekonomi (KOTOE-Supreme Command of Economic Operations). 232
Conclusion. 236

VI. 'riie Development of a Speculative ^ree i-arket in Yarn. 239 Introduction. 239 The purpose of this chapter: 239 The blacloiiarket and the free market: 239 Speculation: i-ethod of analysis: 246
Supply and demand in the free market without uncertainty. 230 Freely imported yarn wupplies: 230 Allocations: 231 The cloth market: 237 i Market imperfections smd business motives other than
profit niajcimisation: 239 Su-'ply demand in the free market with uncertainty. 263 (i) The influence of iri-egular supplies. 263 iVithout the cloth msjrket: 263 Vith the cloth market: 269
(ii) The influence of inflation: 271 V/ithout cloth imports : 272
1. Inflation and relative fixed costs: 272 2. Inflation and the need for extra employment: 273 3. Inflation aiad changes in the cost of fixed factors
of large scale production: 27^ k. The net effect of cost increases: 27k 3. Market imperfections end business motives other
than profits majKimisation: 273 ."ith cloth imports: 277
Conclusion. 279
VII. Protection and the Influence of Inflation. lieasures of protection and the effect of inflation on
them.
283
286 Tariffs (or surcharges): 286 Quantitative restrictions: 288
loFree list: 288 2oQuotas: 289 3"The 'Marrying' system: 290
Frepajnnents: 290 The efficacy of mesjsures of protection! 292 Large imports of all kinds, 1950: 29' Foreign competition an.d a slump in the industry'-,
1931-1952: " 296 Years of prosperity for the industry, 1933-1936: 299 The re-emergence of strong overseas competition,
1937-1938:" 302 Strong support for the textile industry, 1939-1961: 3CA The decline of foreign exchange reserves, I962 onwards: ^06
^^roblems of protection internal to the industry. 307 Conclusion. 308

XIV
VIII. The Textile Industry After Fourteen Years of Support and Protection. 310
Development 6f capacity and production since 19pO* 311 General characteristics of the industry. 513 Capacity. 31'!-Raw cotton: 31---Spinning: 317 V/eaving: 320. Finishing: 325 The public sector: 525 The cottage industry: 52 r Employment: 52-r
Production azid iniports» 325 The v/eaving industry's competitiige ability. 551 Conclusion. 55S
Ev. Conclusion. The growth of the industry and the influence of
government policy. 5^1 The growth of the industry: The effects of government intervention: The effects of inflation: Likely trends if pa st government policy persists: 551
Costs and benefits of the expansion. 552 Foreign exchange expenditure ajid saving: 5-521 • .Employment creation and demand inflation: 5 ^
Problems of further development. 5^0 Foreign exchange considerations. 5'jO Ilanageicent training: 5o6 Protection and low net foreign exchange earnings: 5^9
Concluding remarks on sources of information. 575
Appendix A. Sources of Credit. 578 Appendix B. Capacity Production "easures. 597 Bibliography. ^Co
LIST OF TABLS3. 1. Imports of raw material textile fabrics; 1958-^0 S: I96O-62. 'r 2. rJuraber of new handlooms (AT3M) and power looms (ATI':) : 1930-55 2'i-5. Sources of potential and actual supply of textiles:1955* 25 kc Netherlands share of selected Indonesian imports. 29 5. Number improved handlooms and power looms: 1950-^0. 1-9 6. Imports of textile raw materials and finished goods:1955-57• 51 7. Cources of supply of textiles in 19^0. 52 3. Capacity input and output of spinning, weaving, and l-aiitting
sections of the textile industry:19^9 and 1950. 57

xv
9* Imports of textile raw materials and finished goods: 193S,
to I95O0 So
10. Total supplies of textile ra?/ materials and cloth: 1950. 62
11. Indexes of the money supply and free retail market and lajided
prices of rice & textiles, in Djakarta: 1938 and 1950» 71
12. Selected prices in the iirbaji areas of DJj.-kai-t , : 1950-1964. 77
15. Capacity of spinning, v/eaving, knitting and printing industries:
1950-1962. 82
Textile expansion according to the Sight Year Flan. 96
15* Projected distribution of expenditure on the textile industry under the Sight Year Plan. 97 1 6 . Achievements in the spinning industry under the Sight Year Plan. 100
17. The Andren short and long terra plans for weaving: 1959* 104
180 State-owned textile gfactories in 1965* IO6
19. ValLie of imports of finished textiles and yarn: 1952-1959. 112
20. ilurnber of establishments in textile and total manufacturing at end of I96I, by number of persons employed. 129 21. Output and capital-output ratios for five weaving techniques
in India. 1^1
22. Capital-output ratios of selected industries in the Philippines. 1^9
23. Yarn prices: I963 and 1964. 153
24. International comparisons of vi/ages, productivity, and labour costs in cotton spinning: 1932. 156
25. iilstimates of fixed capital and working capiral for five weav-ing techniques in India. 173
26. Potential surplus aiid r'ate of surplus for five weaving teclmiq- 179 ues in India.
27. Sates of surplus for five v/eaving techniques using two aJLternative time lags for working capitaJL and for two alternative wage scales. "184

xvx
28. Requirements for raw raateriaJLs for the spinning and weaving industries: 1930-19 " . 196
29.Supplies of raw materials: I93O-I962. 197
30. Surchai-ges on imports as a percentage of value: 1932-1960. 287,
31. Imports of selected testile raw materials and finished goods: 293 1938, 1950-196^0
32. The development of the modern textile industry since 1930. 3 1 1 (.Spinning capacity, weaving capacity, weaving product-ion, imports of cloth: 1930, 19^0, 1931, 1933 and 1960-1962).
33* Full capacity input and output of the textile industry at dates of latest available information. 318
3^. Licenced and actual capacity in 302 textile enterprises in
the Djogiaicarta area, 32I
35* ' he cottage textile industry: I96I. 32^
36. Capacity utilisation rates end production and imports of cloth: 1931-1962. 327 37• Production of large and small scale v/eaving enterprises,
imports of cotton piece goods, and surcharges: 1931-1963* 332
38. Foreign exchange considerations of expansion since 1^30.
39* Cs.pacity expansion and employment since 1930. 358 •0. Foreign exchange considerations of equating capacities of
all sections and of expanding textile production capacity by one metre per capita, per annum. 36I
LIST OF CHAPTS.
I. i:ontl-ily data on imports of textile raw materials: 1930-1962, 193
II. :;onthly data on imports of finished textile goods: 1930-1962. 19 -
III.Controlled and free distribution of yarn before 1938. 223
r.'",Controlled an-d free distribution of yarn after 1938. 228
V. I'arginal revenue product analysis with allocations to the small scale weaver. 232

VI. Marginal revenue pi'-oduct analysis of the large scale weaver with collocations.
yil. Marginal revenue product analysis of the large scale ueaver
Appendix tables.
(i) The money supply and credit outstanding of Bank Indonesia, BIN, "3NI, foi-eign private barJ s and national private bariic:;, 1951 to 1956, (as at end of each year).
ro v;ith uncertainty of supplies. ^ou
388
(ii) Selected operations of Jajasan Lembaga Djaminan Eredit., 396

CHAPTER 1.
INTRODUCTION
The Indonesian economy has vmdergone rapid changes since sover-
eignty of the country was handed over to the Republic by the Netherlands in
December 1949 and one of the most sigmficant developments has been in the
textile industiy. Like rice cultivation it produces an essential commodity
which is required in substantial quantities, but imlike rice, for which the
main reliance was on domestic production, textiles (excluding hand oven
sarongs) were almost entirely imported before 1930; and even at the outbreak
of the Second ¥orld War only about 159 million metres per annum, or less than
t>70 metres per capita, could be produced domestically.^ Actual total
production of woven goods in 1940 was 128 million metres or about 14 per cent
of total consumption. In 1962 (the most recent year for which this infor-
mation is available) weaving capacity production was 688 million metres^, or
about 7.5 metres per capita; although actiial production in 1963 (ag-ain latest
available data) was only 2.5 metres per capita, or over half of total 4
consvimption. There was little increase in weaving capacity betvjeen 1962 and
1965. Before the war very little yam was produced, but in 1961 output was
7,154 tons,^ or about 24 per cent of yam imports.^
1. In 1941 licenced capacity was 49,019 ATEMs and 7,588 power looms. Assuming each ATBM can produce eight metres a day, and each power loom forty metres a day, a 240 day working year would produce approximately 167 million metres.
2. J.O.r. Broek. Economic Development of the Netherlands Indies, p.85 5. See Table25|. 4. Unpublished data, Djakarta, May 1965. 5. Uskha Pembangunan. p.2 Publication of Department of People's
Industry. Djakarta. 1964. 6. Yam Imports in 1962 were 29,700 tons. (Statistical Pocketbook of
Indonesia 1965* p.155.

2.
From a cottage industry in 1950 textile manufacturing has become
the biggest single source of factoiy employment, providing 19.4 per cent of
the large and medium scale manufacturing employment (or 92,806 jobs), and
paying 15.4 per cent of wages and salaries of all large and medium scale
manufacturing industiy.''
Definition of the industry.
This study will be confined to the cotton textile industiy and vdll
include spinning, weaving, knitting and finishing activities. There is some
silk production but this is negligible and the economic issues involved are
quite different from those of the main textile industiy. Eayon production
has been mentioned in plans but the aim to establish a forest for its rav?
material in South Sumatra has been temporarily abandoned.
The cottage hand spinning process is very time-consimlng and the
quality of the produce is heavily dependent on the skill of the spinner. Modem
equipment is highly mechanised and the employment potential is not veiy great.
In the weaving industry there are several intermediate stages of mechanisation
from which to choose for the processing of yam into cloth; but no manufacturer
interviewed was prepared to place a worker in charge of more than tvro looms in 2 operation simultaneously.
1. Calciaated from figures in Statistical Pocketbook of Indonesia 1963. pp. 112-15. This includes all spinning, weaving, and knitting establishments of at least 10 employees, or using some power. It does not include wearing apparel production establishments.
2. Equipment for all stages of mechanisation exists in Indonesia and it is likely that the primitive (gedogan) cottage loom for weaving was used more recently than the old-fashioned spinning method, althougji it is doubtful whether either has been used since the Second Vforld War.

3. The finishing process is either the old-fashioned wash-tub cooking
(sometimes with a power driven handle) or the highly mechanised modern plejit
into which the unbleached, unwashed and unprinted cloth is placed and the
final product emerges ready for malcing into clothes. Like spinning there
are no intermediate methods of production in existence in Indonesia and the
employment potential of the new process is not large; but the qiiality of the
product is constant and high.
The batik industry which consists of cottages and small enterprises
occupied in paining and printing cambrics is excluded from the thesis for A.
several reasons. First, it is not concerned with spinning or weaving. Second,
although it ha^ received a great deal of protection and support from the
government, it is not regarded as a vehicle of industrialisation in the same
way as is the manufacture of mass produced cheap cotton textiles. Third, it
is not an import-replacement industry and its export potential is very limited
because of high cc^s; hence it is unlikely to alter its impact on the balance
of payments. Fourth, it is primarily a cottage industry (although some
factories are producing poorer quality batik), and moreover, is a declining
industry xmable to compete with more mschajiised textile production. There are
no statistics on batik production with which to compare the pre-war and post-
war situations, but some inferences can be drawn from statistics of imports
of textile fabrics classified as rav/ materials because the vast bulk of these
would be the raw materials of the batik industry.
1. It is a very labour-intensive industry and nearly all its raw materials must be imported.

4.
TABLE 1.
IICPORTS OF RAW MTi^RIM^S TEXTILE FABRICS. 1936-40
AID 1960-62 (1.000 tons).
1228 1222. J M O 126^ 1962
27.1 18.9 24.2 11.9 15.3 11.6
Source; Statistical Pocketbook of Indonesia 1963.p.135
The data in Table 1 showr a decline in imports of raw materials.
The years 1961 and 1962 were periods of unusually large imports and should
be taken as an exaggeration of the normal input of the batik industry. The
trend in these figures is in marked contrast to the rapid increase in imports
of y a m over the same period. In 1940 bleached and unbleached cotton piece
goods imports comprised 52 per cent of total imports of raw cotton and y a m ,
and in 1962 anly 29 per cent.' Mention vail be made of the batik industry only
where imports of bleached and unbleached cotton piece goods, most of which go
to the batik industiy, change in proportion to total impoii;s.
Fifth, the cottage industiy is veiy poorly documented, partly because
it is being supplanted by factory industry, and is thus falling into disuse,
and partly because of statistical collection problems. The cheap cotton tex-
tile cottage industiy already raises problems of analysis for the whole textile
industry because of poor documentation. Inclusion of the batik industiy would
inevitably increase the amount of guesswork and reduce the plausibility of
inferences made from statistics lacking in comprehensiveness.
1. These percentages are calculated from data in Statistical Pocketbook of -Indonesia 1963• pp. 134-35.

5.
Difficulties encountered during the expansion;
In order to achieve great expansion the textile industiy required
the special attention and protection of the government. In the case of post-
Independence Indonesia the special guidance and support from the government
were interrupted by the ramifications of policy in other areas of the econoiny;
this was so because of the industry's dependence on the balance of payments,
exchange rates and the incidence of protection.
Ihe problem of tariff protection was complicated by the need to
support several stages (with unequal production capacities) of the manufacture
ing process vrithin the infant industiy. During the period 1950 to 1965 the
government displayed indecision in this field by sometimes protecting spinners
while at dbher times protecting v/eavers. Moreover, the desire to help the
consumer as well as the producer placed the government in the position of
permitting the importing of certain types of cloth which amoimted to a size-
able proportion of total cloth supplies, in spite of the concurrent underutili-
sation of domestic capacity. More often, the large share of the domestic
market supplied by imported "textiles was due to miscalculations of measures of
protection.
Althou^ inflation exerted a strong influence on textile production
and plays a major role in this thesis, the causes of inflation are regarded as
outside the scope of the thesis,^ which is concerned with the effects of a given
inflation on the textile industry.
1. At times it is difficult to separate the causes of price rises and for this reason it vdll be of interest to examine situations in which movements in the price of textiles deviated sharply from the movements in prices of other commodities. Nevertheless, the causes of the general price rise Trrill not be analysed»

6.
The ever-present shortage of Vforking capital and credit increased the importance
of credit-worthiness and profitability and those enterprises which vrere imaole
to compete successfully for bank credit were forced to turn to the free
money market in which inflation had caused interest rates to rise to several
times the usual bank rates. Not only were initial variations in production
costs important to this situation but the influence of inflation on interest
rates and real wages tended to widen the range of variations.
The period of most rapid expansion, the 1950's, was dominated by
the execution of the Benteng (or as it has been described by some, the
"Indonesianisation") ProgTamme, This Programme provided assistance to a new
class of indigenous producers and traders which, it was hoped, would eventually
assume leadership of the commercial and production sectors in place of
foreigners.'' This new and inexperienced entrepreneurial gToup v/as founded
on very weak financial resources and exliibited a preference for vmmechanised
looms.
Because of problems of selective support for particular sections
it is important to exaciine hov7 these influences were permitted to affect the
development of the industry and how much of a liability they remain.
1. Benteng goods, mostly essentials, were those commodities which were the monopoly of licensed indigenous traders, who then became Benteng traders.

7. Labour supply, labour-management relations, and labour training
will not be discussed except in passing reference. There was no overall short-
age of labour, and with the exception of 1950 and 1951 labour disputes presented
no problems to management because of the effective curbing of the union's powers.
Jry 1965 the trade unions were mouthpieces of the government which used them to
inculcate state ideology into the workers. Tlie level of skills required in weav-
ing and knitting was quite loxir and training by management usually covered a period
of one month. The main bottleneck of skills was at the managerial level and
amongst maintenance employees.
The layout of the thesis;
This case study begins by examining the origins of the textile industry
in Indonesia and comparing its major weaknesses with those of textile industries
in other coimtries. In the later analytical chapters references to other countiles
will be made where deemed appropriate, particularly in Chapters IV and VII, but
because of the serious general economic disturbances in the years following 1950,
the thesis bee omes a case study of the development of an import-replacement
industry tinder strong inflationaiy pressxxres.
Chapter II, which examines the history of the industry vintil sovereign
independence, is separated from the remainder of the thesis by treating 1950 as
a watershed in the development of textile manufacturing. That year marked the
beginning of a policy of strong and active support for a major industrial
potential as distinct from the earlier support for an industry which was mainly
designed to relieve rural imemployment and poverty. However, the origins of the
industiy are important as the weaknesses in the foimdation of its development
vrere carried forvfard into the 1950s and 1960s. For this reason the pre-1950
period is introduced, although in summary foim, while the problems of the industiy
uader support and protection are analysed in much greater detail.

8.
Chapters III to VII describe and explain the problems of both
government and firm in promoting- textile production. Because of the sen-
sitivity of the industry to other economic activity, general economic trends
in the economy are provided as a backgroimd for the big expansion initiated
by the government. A study of the weaimesses of a gromng indigenous sector,
problems of supply of raw materials, variable cost structures, working capital
problems and foreign competition include all the difficulties of any magnitude
encoimtered by the industiy. ihroxaghout these chapters the all-pervading
influence of inflation is illustrated. It is fair to say that the enormous
budget deficits domineted the course of progTess of every part of the economy
and their effect on the textile industry was felt in both structviral change
and overall fates of expansion.
Chapter VIII examines the relative and absolute position of the
textile industiy in 1964-65, although, for statistical reasons, much of the
data of the actual performance of the industiy refer to 1961.
Sources of information:
The data were obtained from several quite different sources. The
bulk of the information on capacity and government policies was obtained from
intervievfs xfith civil servants in various Depcrtments, including People's
Industiy, Trade, Plantations, Agriculture, Cooperatives, and Labour, as well
as the National Planning Bureau. Government publications and departmental
memoranda were very generously lent for longer perusal.
Before the war the main emphasis of statistical collection was on
agricultural produce in keeping vath its importance in the economy.

However, according to the 1934 Statistics Ordinance,'' industrial concerns
using 5 horse-power or employing at least 10 workers were required to provide
information on number of employees, wages and salaries paid, production,
usage of raw materials, povjer installations, plant and equipment and production 2
capacity. By 1940 a comprehensive collection of data for the major industries
was obtained althou^ the returns were not exhaustive.
By 1952 the greater part of the field of statistical services as it
existed before the war was again being covered. But because industrial concerns
vjere not ordered to make returns the Central Bureau of Statistics was forced to
draw up its oi-m list of firms. The government had no record of the pre-war
addresses of firms, and the Bureau was obliged to go out into the field and
collect data by using telephone directories and advertisements in local news-
papers. Hie follovjing year the whole industrial statistical maclxLnery was
revised. Decree No.16-961 M of November 1953^ charged the Bureau with the task
of g-aining information on all concerns employing ten or more persons or using
some form of power equipment. This excluded the cottage industry, but some
machineiy was established at the same time under Regulation No. 19-960 H to
enquire into tliis sector..
As the statistical services declined in the later fifties more and
more reliance was placed on records of capacity returns which had to be made by
manufacturers who hoped to receive official allocations of raw materials. 1. E.A. van der Graaff. Statistics in Indonesia. Chapter 4, p.1 2. Additional information on safety regidations was req\iired after
1940. (ibid. Chapter 4, p.l) 3. ibid. Chapter 4, p.1

10
The -department of People's -i-ndustry keeps records of all licences for prod-
uction which aa'e issued by itself. As more and more of the smallest enter-
prises went out of production an increasing number of these licences wa^ not
renewed. This tended to deflate statistics on capacity. On the other hand,
as va]-uable allocations of cheap yarn became more important, licences for
those factories which continued production were illegally inflated. It is
reasonable to conclude that power-driven capacity is exaggerated but the
figure for handlooms might be underestirnated. The KOTOE reports made in
February 196^ after an investigation of factories indicated that the diff-
erence between actual and licenced capacity was very great although their 1
conclusions on handloom capacity are misleading.
The Central Bureau of Statistics in Djalcarta still issues data on a
section^ of large and medium sized establishments obtained from mailed
questionnaires; large scale enterprises report monthly Sjtid medium sized
re-oort annuslly. .Veaving mills provide data on yarn consumption, and
production of sarongs, shawls, towels, and cloth. The knitting mills make
returns on yarn consumption and on production of mosquito netting, singlets,
T-shirts, socks and other smaller knitted items. All returns include data
on employment, v/ages and salaries paid, 3.nd power usage. 1. P.eport I of the IICTCS (Kofaimando Tertinggi Cperasi Ekonomi-Supreme Comm-
and of i cononiic Operations) Clothing Teaj-n investigations into the dist-ribution of yarn. (Djakarta, j'ebruar ' 1965).In this ^«port the KOTOE team states that of licenced capacity of 13,598 handlooms only 303 existed. The difforei.ce is so great that doubt is raised whether handweeving capacity for the whole of Indonesia can be inferred from these figures. ..oreover, :.iuch of handweaving capacity had fallen into disuse by 19b5 because of years of insufficient raw .aaterials. The KOTOS team was laiov/n to consider the handweaving cottage industry as an economic liability and it is thou; ht that their policy was to count only those han.dlooms which could be used almost at oncc. This v/ould exclude a large amount of handweaving capacity v/hich could be brought into use after repairs had
. been madn. 2. The response of about SO per cent of mailed questionnaires was considered
good. Interviev; at "'entral Bureau of .statistics,Djakarta, 1.1l6^.

1 1 ,
It is likely tha't the more efficiently run, and therefore more successful
firms reply more faitlifully. Unpublished data on surveys of the cottage
industry emerged in departmental memoranda. The Bureau does not publish
figures for the cottage industry. Nor is there information on stocks of raw
materials or cloth, except references made to them in bank and departmental
reportso These reports, together with data on prices and imports, give some
indication of tlie great variations in stocks of raw materials that must have
taken place.
Data on imports were carefiilly recorded by the colonial admin-
istration for taxation purposes and the source was the customs office.
After 1950 the statistical service was changed to provide data resembling
the Standard Classifications of the Statistical Office of the United Nations.
Under the Republic data on all imports are collected on a monthly
basis according to weight andKup'iah value (ci.f.), Textile materials are
divided into several categories; they include raw cotton, cotton weaving yams,
other weaving yams, sewing threads, bleached and imbleached cotton piece goods, 2
dyed printed woven coloured cotton piece goods, and clothing and underwear.
1. Shipping statistics were first recorded in 1823. In 1938 the Netherlands East Indies GovemT.ent accepted the Nomenclature Douatiiere de Geneve of the League of Nations. (E.A. van der Graaff. op. cit. Chapter 8. p.1)
2. Interview at Central Bureau of Statistics, Djalcarta. 1.11 <,64.

12
There are no regularly published data on finishing and printing
output.
Much of the background to the micro-analysis of problems of the
firm, as v/ell as opiniorJSon government policies towards the textile
industry, were obtained from manufacturers, ^hree manufacturers in
Bandung and two in Madjalaja were interviewed intensively aJid an
average of about eight hours was spent with each. /ai five manufacturers
were large scale and successful entrepreneurs, but they were also able
to provide a broad picture of difficulties facing all kinds of
establislTinents in the industry. A sample survey of 25 majiufacturers of
all sizes in ^andung ajid 15 in i'-adjalaja was wade in May I965 with the
use of a schedule containing 50 questions. Thcs survey was successful
in gaining knowledge of problems facing the individual firm, and the
opinions of manufacturers concerning government attempts to protect
the industry. However, on questions of v/orking capital and profits,
particularly concerning the use of money lenders, it was obvious to
the interviewers (a group of economics students from the State
University of Padjajaran) that the replies were evasive. After the
survey was completed some of the more interesting aspects of the
results were discussed at great length with the five manufacturers
already mentioned. In this way it was possible to make a reasonable
assessment of the answers. Apart from the unwilling^ness of manufact-
urers to answer some questions the sample survey suffered from a
number of other limitations.

13
First, the siu-vey was conducted in >Vest Java, the most prosperous
area of Java and an area of concentration of the textile industry.
Second, the sample was very small and divided between two towns of
differing characteristics. Third, the survey was undertaJcen when the
industry was in an unusual state of agitation having just been
subjected to an intensive investigation by a cominittee enquiring into
corruption and other malpractices in the distribution of raw materials;
as a result respondents were suspicious of any further investigations,
-ence the results of the suiTveys were finally used, not as a sample
register of statistics of the industry, but as a supplementary source
of information on problems and conflicts within the industry.
Data and opinions were also obtained from academics, trade
unionists, cooperative officials and bankers. Books sjtid theses from
the University of Indonesia and newspapers provided background and
miscellaneous information.
Mention of limitations of sources of information will be made
v/here relevant and necessary in the text.

CHAPTER II
THE INDUSTRY PRIOR TO 195O
The Domestic Industry Under Free Trade, 19C0 -
Origins:
The origin of the sarong industry:
Until 1811 the sarong, the traditional form of dress for both sexes
in Indonesia, was made by the cottage industry using home spun cotton
from raw cotton grown by the cottager himself. In most cases this v/as
sufficient only for the family's needs. Hence the industry was located
according to the distribution of population, so that almost all textiles
were produced in Java and, in particular, around and in the towns of
Bandung, Surakarta, 'I'egal, Semarang, Djogjakarta and Kediri. Internal
trade in textiles VIBS negligible, existing only in Java where there were
large markets. Even after textile imports appeared around 1 8 1 I to 1815
the people continued to produce for themselves. However, during the period
1870 to 1380 the development of roads and railways in Java facilitated
cheap textile imports;^ and becaujse these goods were of a higher quality
than domestic output they began to replace the product of the very low
productivity domestic loom.^ In spite of encroaching imports, as income
from agriculture declined in the later nineteenth century and sources of
sup-olernentary income were sought, textile production developed around
tovms whose p. opulation preferred to purchase cheap cloth rather thaji
produce it themselves.^ 1. Kadari.iah. Ma^aJh Kebid.jaksanaan Adrriinistrasi Penjaluran 5anda.ng,p.3« 2. Kadajrijah. Fe!nban,g:unan Perindustriaji Tekstil di Indonesia, p.3. 3 . Unpublished departmental meraorandiim by Hirawan. p. 10. Department of
People's Industry, Djakarta. 196^. k. In this way the village of Wadjalaja, 3O miles southeast of Bandung
emerged as the biggest single centre of cloth production. The differ-ence between urban and rural income was increasing at this time.

Under the impact of newly-constructed transport facilities traders
t ook the cottager's produce to distant markets. This system encouraged
specialisation of colours and quality of cloth in different areasJ Host
of the centres of production strengthened their position in the market and
confirmed the geographical concentration that had already emerged. Therefore,
in spite of changes in the distribution of population and in spite of obvious
locational advantages of the bigger cities, the textile industry of Indonesia
remains, very largely, in areas where pressure on land and declining incomes of
half a century ago forced the local people to seek non-agricultural supplement-
2
ary employment to maintain their standard of living. The first entrepreneurs
of this enlarged industry were the former self-s\ifficient cottagers, and extra
labour was recruited from amongst local agricultural workers vrho were finding
it increasingly difficiilt to obtain adequate rural employment.
1. In the Philippines specialisation also took place in the face of competition from imports. Textile imports had forced many cottage looms and spindles to become idle and the industry wh-ich survived specialised in mosquito nets and blankets. (L.D, Stifel. The Textile Industry. Jks Case Study of Industrial Development in the Phili-ppines. 13.24)
2. The speed m t h wiiich they undertook contracts for traders was deter^ned by the rate of that decline and by the size of the local market. 'iMs was occuring not only in Indonesia. In the Philippines agriculture was experiencing long periods of low activity at this time and 40 per cent of farmers had secondary occupations. (Ibid. p.23).

16
Finaxice:
The loom used by the self-sufficient cottager was the primitive
gedop;aji v/hich could produce approximately 1.0 metre of cloth in seven
houi's of continuous v/ork. This loom could be made by the owner hiriiself
from local raw materials, chiefly ivood, ajid the capital investment was
very largely in terms of effort rather than goods or money. It was only
v/hen weaving oecarie the main occupation of the cottager and extra looms
were required to be worked by other members of the family or by employees
that debt v/as introduced. Moreover, while the raw cotton was grown by the
v/eaver himself in sufficient quantities for his family alone, he did not
require working capitsil. But as soon as he required raw materials beyond
the capacity of his own production he was forced to turn to the private
lender. There were many Arabs, Indiaji and Chinese traders who were already
collecting the marketable agricultural surplus of the Indonesians for
final export, and after l880 v/hon a nev; range of imports was introduced
into the coitntry these traders offered raw cotton and yarn on credit as 2
well as their marketing services for the produce.
As the self-sufficiency of the family unit broke up and as sc_jne
cottagers began to work full-time on cloth production, cotton and yarn
were obtained from traders from the two sources of indigenous produce
and imports. But as population pressure increased more land had to be
placed under rice cultivation and the importance of imported raw
materials grew. 1. This was derived from inioraiation from Eirawan's departmental
(People's Industry) memorandum (p.10) and the knov/n productivity of the power loom.
2. Ibid, p.11.

17
Pre i/orld ^ar I:
Public concern for the economy:
There was little incentive for western capital to invest in
manufacturing in Indonesia in the nineteenth century. ?he greatest profits
were to be found in supplying western markets with agricultural produce
from the -i^ndies while the Indonesian r.arkets were hampered by the lack
of transport and communications, the low purchasing power of the people
1
and the high degree of self-sufficiency of the household.
The Lutch colonial administration policy reflected these econoraic
considerations, and the infrastinicture which was built in the early
stages of colonisation v/as aimed at aiding the extraction of agricult-
ural produce. Nevertheless, this policy in itself was sufficient to add
to the material welfare of the peonle with the result that the populat-
ion of Indonesia increased from an estir ated 10 million in 1800 to 33
million in But the government, v/hich was chiefly concerned with
agricultural production and exports, failed to take measures to cater
for tne increasing pressure of population on land resources in Java
1. A similar situation existed in the Fhilip-oines where the f o m e r text-ile industry had fallen into decline as a result of the concentrat-ion on plantation crops and the competition from European majiufact-urers. (L.D. Stifel. op.cit. p.22). The position of the "Japanese textile industry wajs quite different; the massive colonial invest-ment in primary produce was absent end the indigenous government had promoted mechanisation of existing secondary industry in the l880s in order to raise income. (G.Flem.ing. Die 3truktur^.?andlungen und die Aussenhandelsverflectungen in der Welttextilwirtschaft. p. TO
2. A.Ii.de Neuman. Bkonomi dan ^-euangan Indonesia. Vol.VII. January 195^' p.248. V/idjojo Nitisastro ha^ expressed doubt about the reliability of official population data over this period mainly because of the system of complusory labour which involved registration.('Vidjojo Nitisastro. I-dgration Population Growth and liconoraic Consequences
of A1 t e m a t i ^ Patterns of Inter-Island I-ligration. pp.68, 77)

18
until 1900, when the decline in n.iral income alarmed the administration.
In 1901 the Netherlands Parliament, disturbed by reports of falling
standards of living in the Netherlands Indies,^ stressed that prosperity
in the Indies could only be increased if secondary industry were devel-
oped."^ -ajiy technical submissions followed on this interest but none was
implemented. A commission, which later became known as the 'Diminishing
Welfare Commission', empowered to enquire into the economy, devlivered
its report in 190^ and urged the promotion of factory industries.^ This
general concern was strengthened by the lobbying of manufacturers in
Holland who urged reforms in the Indies in the belief that increased sales
to the colony would result from higher indigenous income. A business
recession in 19^5 provoked further discussion whichjlapsed when the recess-
ion ended.^
liven at the height of the debate on declining income, and the need
for alternative industries, the widespread belief existed that smaJLl scale
industry/ in which the Indonesian could do good work, could offer no comp-
etition against the greater mechanised industry of other countries, in
which the Indonesian v/orker would not be at his best.
1. It is interesting to note that the adverse trends in the terns of trade caused by low commodity prices at the turn of the century are not discussed in the literature on Indonesisxi economic development as a cause of declining rural income. If this had occured in the Netherlands it would doubtless have been raised as grounds for remedial action in the economy. It may be that the Indies economy was regarded as a source of foreign exchange to the Netherlands and that it had no right to be assessed independently of the economy of that country.
2. 3.1. Harahap. Peranan "/anita dalam Keradjinan Tekstil. pp.13-^. 3 . In 1902 in his budget speech, the Colonial Minister, Captain Idenburg,
diagnosed the main cause of low income as the growth of population and the diminsihing returns to agriculture. (J.S. Furnivall. Netherlands India. A Study of Plural Economy, p.233).
k, A.M. de Neuman. op. cit. p.249. J.O.' . Broek. Economic aevelo'oment of the Netherlands Indies, p.76.

19
-•he Colonial Governor-General's policy distinguished carefully
between indigenous cottage inc'ustry and factory activity requiring
western capital, and knowledge; the former was considered more appropriate
for the country. Ho'.vever, the declining income of the people could not be
ignored and to counter this the govermient followed a policy aimed at
improving enterprises which already existed^^ through credit cooperatives,
expajiding the cottage industries ejid encouraging new ones, and increas-
ing the r'arket for cottage produce in the other islands.
In 1915, prompted by the need for increased production of consumer
goods for the domestic market- as a result of the halting of trade 'vith
Europe during the First '.'orld '"ar, the government set up a Commission 1 — for - actory Development• in its enthtisiasm the Commission outlined
2 200 plans for modern industrial development,'" one of which eventually
became the Textile Institute of " ajidung.
-t is difficult to assess from the safe distance of 19^5 the part-
icular problems of training, absenteeisiv, and social overhead costs, all
factoi-s associated with the sudden and rapid establishment of large scale
industry-' in a hitherto underdeveloped country. But the fact that the Dutch
were not prepared to contemplate the rationalisation and re-organisation
of industry, such as it existed in the Indies at the turn of the centviry,
suggests that they were not convinced, by the evidence of declining
income and increasing imports of light manufactured goods forrn.erly 1. This Commission reported that it had been provide that some goods
could be majiufactured at a lost lower than foreign import 'orices and that a serious effort should be made at import substitution. (P.H.S. Sitsen. Industrial development of the Netherlands Indies, p.59; and Hirav/aji. op. cit. p.3)*
2. A.'-, de i<eurman. op. cit. p.2^0.

20
1 produced domestically, of the need to develop new industries.
-i-t is noticeable that the interest that was shown in the cottage
industry periodically rose and fell irrverselj? with trends in the
general economic situation.
Development:
3y the early years of this century the cottage textile industry had
become overcrowded with those seeking supplementary sources of income. At
the same time financial pressures from traders and money-lenders v/ajs
becom.ing more acute because trading costs (transport and marketing) in-
creased the final price of the domestic produce at a time when cheaper
cloth of higher quality was being imported in increasing quantities.
The income of the domestic producer of cloth was very small indeed and
the opportunities for exploitation v/ere all too obvious.
In 1909-10, in an attempt to maintain and increase interest in
weaving as another source of income, the government introduced a Dutch 2
weaving loom for the cottage industry which was so successful that the
debate on industrialisation was temporarily raised one again. However,
this loom viBs not v/idely used and cannot be regarded sjs having revolut-
ionised the industry. More important to new investment was the disruption
of the importing of cloth between 191^ and 1918 which encouraged the
estaolishment of several weaving m.ills. 1. .'he textile industry of the Philippines also faced strong competition from imports at this time and was allowed to decline. In 1912 out of a total, consumption of 7.3 square yards of cloth per capita a year in the Philippines, 6 . 5 .square yards were imported. At the same time much of domestic capacity V/S.S J-VlLxip. : idle. (L.D. Stifel. op.cit.p.23/. But it was not until the 1950s that the Philippines textile industry received appropriate protection.
2. ICadarijah. Masalah Kebid.jal sanaan Administrasi Pen.jaluran oandan iT;. p.3 3 . A.i:. de Neuraan.op. cit. p.250.

2%,
Post IJorld ¥ar 1:
The influence of World War 1 on government attitudes:
It is not clear whether the results of the Report of the Conmission
for Factory Development in 1915 were small because no ^reat effort was made
to implement the recommendations, or because those recommendations were based
on the new temporary advantages offered local producers by the war. ''.vhatever
the cause of failure to implement the findings, the example of the failure of
many establishments after the war undoubtedly contributed towards the absence
of much investment in the tvrenties.
In 1924 the Commission was dissolved by Governor von Limburg Stirum
who declared that the "desire to move towards industrialisation was an imhealthy
idea"''.
Kirairan. op.cit. p.3. It was feared that the loss of the Indies markets for Dutch produce would decrease the trade (which was based on Indonesian pi-oduce) between Holland and her western nei^ibours. This fear was sufficient to allow Dutch plantation owners to dominate government thinking in spite of the other arguments and in defiance of the pressure from manufacturers in Eolland vrho saw their markets declining from loss of purchasing power. i\imival sims up the situation by saying: "But little was done, because little could be done; except by a sacrifice of Dutch interests vrhich in the existing political conditions, was impracticable. The reason for this lies at the root of all projects for eriiancing welfare in a tropical dependency; all * such projects rest essentially on the organisation of demand and not on the organisation of production, and the key to success lies in the markets rather than in the factories." (j.S.Fumivall. op.cit. p.332).

22
I'lie textile industry gained one important concession when, in 1922,
as a r?sult of complaints from the domestic manufacturers that they could
not compete against imported cloth, the duty on imported yarn was reduced
from 10 per cent to 3 per cent; and Y/SJS finally abolished in 1932. By 2
retaining the 10 per cent duty on imports of textile fabrics the govern-
ment indicated, at the very least, that it was keen to retain that amount
of manufacturing which already existed in the Indies. Another factor
which probably enabled the government to come to this decision was that
the Netherlajids's share of Indonesia's cloth imports had been declining
rapidly since before World 7ar I.^ Development:
The xirst World '«ar and its consequent interference in trade routes
to Surope caused a rise in prices and profits of local producers which
encouraged a considerable increase in investment in industrial activity.
But not much of this activity survived the post-war resumption of trade
when the ilo'j of cheap consumer goods imports started again.^
1. Kadari^ah. op. cit. p.3« 2. V/. van V/armelo. Koloniale Studien 1939. p.9* 3. Statistical Abstract for the I'ietherlands East Indies 1929. pp.312-3.
This v/as also true of the Philippines & India. In India output of cloth rose from million yards in 1913-1^ to 1,732 million yards in 1921-2. (S.D. Kehta. The Cotton Kills of India, 183^-193^. p.134)
3. Production of raw cotton rose very little during the twenties. The government did not support this crop at all and it is surprising that cotton m3Jiaged to hold its own against other crops, ileither the move towards cheaper cloth imports nor the attempts to improve productivity in weaving had any effect on raw cotton production since spinning was entirely confined to the very inefficient cottage industry. In fact, in the thirties Indonesia actually exported cotton because there was no modern spinning capacity to process the domestic crop. In 1921 production was 2,773 tons of uncleaned cotton, in 1923 it was 4,319 tons, and in 1933 3)3^2 tons. (J. FsTiglaykim. Some ?acts and Figures Concerning Textile •'•"'roduction in the Country, p.26 ; also Svie Koo. Industri Tekstil di Indonesia, Keadaan dan Masa Depaan.i'a. p.3).

23 The only private commercial textile factory in the twenties was a
western style v/eaving shed v/ith vovier looms in Padang in 1922, v/hich 2
by 1932 had put the handlooms of the surroimding area out of v/ork."" Tiie
gradual introduction of more efficient methods in weaving continued, but
even this was not of great significance. Particularly during the period
1921-26 v/as there very little investment.^ k
In 1922 the Textile institute of Bandung was founded as a factory
to set an example in mechanisation and efficiency to the rest of the
industry'. In 1926 the Institute built a new handloom, the 'Alat Tenun
Bixkaii Mesin' (ATBH),^ or non-power v/eaving loom, v/hich had five tiiaes
the productivity of the old gedogan loom, A modern weaving shed v/ith
these handlooms v/as built at Padang in 1953* I21 1930, not long after
the nev hajidloom was introduced, the first j)ov/er looms (the Alat Tenim
Mesin-AK-i) were imported from Europe.
Table 2 shows the size of the textile industry (excluding the
gedogan capacity) in the early thirties. 'Pxie buUi of the expansion was
in the improved handloom, very lUcely because of problems of capita.1
investment, skills and electricity supplies associated with the pov/er
loom.
I0 C.C. Allen and A.G. Donnithorne. Western Enterprise in Indonesia and "flalaya: a Study in Economic Development, p.
2. J.H. Boeke. The Evolution of the Netherlands Indies Economy, p.12^. 3. A.M. de Neioman, op.cit. p.250. k. Hirav/an. op.cit. p.10. 5. This loom Vvas a combination of Dutch and Indian model looms. It
had the advantages of being sufficiently cheap for the cottager and being locally made.
6. Van V/armelo states that the "production differential between hand labour and mechanised labour was reduced from 1:50 to abou.t 1:5 after the introduction of the new handloom (ATBM)." (V/. van Waraielo op.cit. p.9)«

2k-,
TABLE 2.
IPffiER OF WE¥ HAITOLOOI® (ATBM) iiM) POVJER LOOMS (ATM) 1930 - 33
ATBM ATM
1930 257 44 1931 524 44 1932 777 44 1933 1,299 46
Soiirce: J.H. Eoeke. The Evolution of the Netherlands Indies aconoioy. p.122.
The output of the ATBM is eight metres of cloth and of the ATM
t renty to twenty ei^t metres of cloth per shift (seven hours). If the hand-
looms are worked for one shift and the power looms for t-ro shifts for a 240
day working yearj capacity output amounted to about 1,000,320 metres in 1930
and 3,024,000 metres in 1933. This represents an increase of almost 200 per
ce nt in three years.
At this stage of development, there xrere still no facilities for
finishing the cloth output Trrith modem tecimiques. Without these teclmiques
the quality of the finishing process was generally poor and variable.
The situation on the eve of the Depression:
In the year before the beginning of the Depression, the population 2
was largely dependent on imports for its clothing. Table 3 shows the sources
1.
2.
The conversion factors used here were obtained from the Department of People's Industry. The figure of 240 working days a year is used throughout this thesis instead of the 300 days used by the Depart-ment because it is regarded as more realistic. It is, perhaps, a con-servative estimate but in view of the difficulty of acliieving full capacity in Indonesia in all periods, not completely inappi'opriate. The prQ;flem of capacity definition is dealt mth in Appendix B. VJ. van op. cit. p.8.

25
of supply of te::t?lles to the domestic market. The only data available are
capacity of ATBIis ajid ATMs, domestic production of raw cotton in Java and
iladura, value of yai-n imports, value of combined yarn and cotton piece goods
imports, and weights of combined yarn and cotton piece goods imports. In
the estimation of separate weights for yarn imports and cotton p^ce goods
imports, the assumption of equal value of yarn and cloth imports of the
same weight is made. Further inaccuracy is due to the unregistered domestic
production ox raw cotton. TABLE 3.
SQU2CSS CF FOTEIITIAL AITD ACTUilL SUPPLY OF TEXTILES, 1933° Domestic Domestic Imports Total Imports Weaving Weaving production production of supply of capacity capacity of raw of yarn yarn of yarn cotton output input cotton in inferred (tons) (tons) piece (excluding (excluding Java and from goods gedogans) gedogans) I -adura coliimn I (tons) (1000 (tons) (tons) (tons) metres) I II III IV V VI VII
1 1,000 6,757 7,757 81,751 3,656 653 Sources:-I. J.Fanglaykim. Some Facts and Figures Concerning the Textile Industry
in the Country, p.2o. II. This conversion is made assuming 10 per cent waste in the spinning
process.(Interview at State Pilot Spinning Project, Bandung, 12.11.6^) III.Statistica.! Abstract for Netherlands Indies1933, p.270.The weight of
yam imports was found by taking a ratio of value of yarn imports to value of combined yarn and cotton piece goods imports and multiplying tliis by thG weight of combined yarn and cotton piece goods imports.
IV. Ibid.This is the sum of colujans II and III. V. Ibid. The weight of cotton piece goods was found by subtracting the
weight of yarn imports (III) from the combined weight of yarn and cotton peice goods imports.
VI. From Table 2. VII. Calculated from Column VI assuxning, on average, 1 kilogram=5.3 metres
of cloth (Department of People's Industry source). In 1933 domestic production of yarn was only 15 per cent of
imported yarn although it was almost twice as much as the full capacity
input of the ATBI-; and ATM looms. Total yarn supplies were almost
times the volume of the capacity of these new looms so that if it is assumed that there was no cliajige in the level of yarn stocks, the

26
primitive gedogan loom was still the main source of domestically
produced cloth. I^evertheless, total domestic production of cloth
(inferred from yarn supplies) amounted to only 38 per cent of cloth
imports.
The Textile Industry as a I eans of Bconomic development,
Reasons for the chejage in government policy:
The Bepression and its very severe effects on indigenous income
and export potentialities (and therefore the profitability of agricult-
ura 1 investment) undermined many of the arguments against 1
industrialisation. Since Indonesia's economy rested mainly on the
export of agricultural produce, the collapse of world markets for 2 primary produce affected her more seriously than it did most countries.
It is difficult to point to ejiy special date or issue which resolved the government's mind in favour of industrialisation and protection. The influence of enquir«ies into the effects of imports on the cottage industry, concern of Dutch capitalists about a declining colonial market through diminishing incomes, business recessions, and disruption of trade routes during wartime had all left their mark. Fonnerly they had been rejected as arguments for industrial-isation in deference to the pressure of Dutch plantation owners who felt manufacturing would divert resources from their relatively profitable line of business.

27
1. During the i^epression raore than 100,000 labourers were sent back to Java from the other islands. (J.H. Boeke. The involution of the Netherlands Indies Bconoray* p.3l). Sugar estates in Java shrunk to one fifth of their size, 'i'here was also the ever present stnactural prob3.em of Java becoming overcrowded. Svery year Java's population wa.G increased by about 500,000 to 600,000. The government feared disturbances in the islands unless the economy could be improved, j'-ixisting v/estern agricultural enterprises could not be further expanded.
P.H.VJ. Sit sen has calculated indexes on income and purchasing power before and during the Depression and these are presented in the table here.
INDEXES OF ECONOMIC INDICATORS: 1928, 1932, 1935, 1939, 19^0 (Base, 1928 = 100)
1928 1932 1935 1939 19^0
Population 100 IO6 110 II8 119
Income from national agricultural exports in units of constant purchasing power (a) 100 52 88 I16
Income from industries in units of constant
purchasing power 100 I65 210 335 370
Consumption of textiles
per person 100 ... 92 I36 ...
Consumption of "orimary foodstuffs per person (kg) 100 102 IO5 112 115
Sotirces:- P.H.W. Sit sen. Industrial Development of the Netherlands Indies. p.2
(a) The purchesing power of the income for subsistence of a family with an income of about ^60 guilders per annum was taken s-s
a unit of purchasing power. There is no full explanation of v/hat is meant by a unit of purchasing power apart from this. However, if we assume that Dr. Sitsen had devised a reasonable measure of purchasing power the fluctuations portrayed by the figures indicate clearly enough the importance of falls in income levels on government revenue and returns to private investment, ^'eal income from agricultural exports was almost halved between 1928 and 1932, and the consumption of primary foodstuffs lagged behind population increases.

23
Koreover, the argument against the industrialisation of the Indies
put forv;ard by Dutch textile manufacturers who hoped for a large
colonial i-na.rket had been wealcened in the years before the Depression
hj advazices made by Japanese textiles in the Indies market. I'able k
provides some indication of the extent of the decline of Netherlands
participation in the market.
In spite of the fact that the Indonesian m.arket for all kinds
of imported textiles approximately doubled between 1913 and 1928,
Netherlands exports of textiles to the Indies rose negligibly in
absolute terms; and its s«ar-e of the market fell from 39»3 per cent to
23.^ per cent.
Another factor determining government attitude towards industrial
protection was the raising of tariffs by other countries; the pursuance
of 'beggar-my-neighbour' policies. Until 193^ the levying of tariffs,
which viere very moderate, was designed to raise revenue rather than to
protect the domestic industry. Clearly, when other countries raised
their tariffs against her, the Netherlands Indies had to review her
ov/n tariff position.
However, there was still some debate on the nature of the
protection measures to be tal':en. The civil servants in the administ-
ration desired a return to free trade and unfettered economic activity
as soon as possible while private business interests demanded strong
goverj-unent interference. But these business interests themselves were
divided. Importers and aspiring manufacturers wanted a strong market
within the country and large imports of capital goods. Exporters dep-

TABLE h.
NETHEl^/mS SHARE Qj' SELECTED INDONESIAN IMPORTS (VALUE IN 1000 GUILDERS)
1913 1920 1926 1927 1928
Total Neths. Total Neths.? Total Neths.? Total Neths. Total Neths.
Yarns, all kinds 0O2O 19^0 24 11270 1980 18 1^100 750 5 12120 720 6 12^00 910 7
Clothes & Fancy Art 8900 2500 28 16600 3650 22 185^0 i960 11 18830 1720 9 19330 1810 9
Cotton textiles
96280 kOOkO 42 315750 82520 26 165680 44920 27 170800 41370 24 176530 45610 26
Source:- Statistical Abstract for Netherlands East Indies 1929' pp.312-13
ro

30
pended, in the long-run, on the low indigenous standard of living
to sell their goods in the competitive world market. The civil servants^
case \'JBJ5 presented in 1937 by the head of the -department of Economic 1 Affairs in the i' etherlands Inddes Government who said:
....But I ajn no less convinced that, while retaining this competency, it will have to aim at limitation of its activities; those of the present are, in the long run, both too drastic and too expensive for out Indian society. As this society again acquires more resistance, and as the threats from outside diminish, we should systematically strive to put out of action the de facto use of some of the powers conferred upon the Government by recent statutes. The tensions of and within the Government apparatus have become too great, in ray opinion, for permanent use; these tensions today exist in many new domains where they cannot be maint-ained over a long period. The attraction of doing something nev;, of the call to action and the opportunity of showing results, attraction too of the chance to provide leadership and to support helpful movements, cannot in the long run be kept alive in scores of domains and for a relatively small group of live and versatile persons. There is the danger that the proper care for a number of important projects will urop to a mediocre level of devotion and skill, that the great evils of routine performance, foiraalism, red tape and ossification v/ill appear. Further, it is undeniable that intensive government intervention, even under the best :.circurastances, leads to a certain regidity in the relations between the authorities and the people, to a certain lowering of energy, love of ease, too easy acquiescence, and a weakening of the personal power of perception and initiative among members of the community....
2 A renowned Dutch commentator, •t'rofessor Boeke , stressed that
the countx-y:
1. J.H.Boeke. op. cit. pp.3^-5' 2. Tbid. p.36.

31
could not stay behind as the v/hole world went by without suffering ill consequences. Indeed, private interests impelled government intervention and emphatically insist-ed on it... If it (the governinent) had readily followed all the wishes and demand of private interest, government interference would have been far greater thaji it actually was or is.
In the event the government showed it was prepared to use its
powers for long as was necessary to facilitate many long terra
changes, The same head of the Department of Sconomic Affairs acted as
spokesman for the goverrjiient when he said, moderating his earlier
remarlcs:
Do I wish, then, gradually to go back to the former situation - to a pajssive government, to the principle of non-intervention in the play of economic forces, to the unimpaired rule of the law of free competition? Ko, d ecidedly not. I can see clearly a many-sided and extensive task for the Gover'-'jiient in the 'etherlands Indies. As I judge the situation, it will be obliged to continue to bring sjid keep together groups of the communitj'-, and if necessary to link such groups to one of its own organisations. It c8Jinot tolerate that oppos-ing groups should v/eaken our iifernational economic posit-ion or harm the interests of other groups in this country through either controversy or too intensive a collaboration. It will still have to control the activites of certain groups, even bona fide activities, if they are in a position to cause serious damage to the concerns of the community, at home or abroad. It will have to continue to help the economically wealcer groups to become stronger; and to this end it v;ill occasionally have to hold in check the activities of other groups if the general public interest demands it, even though these activities may be valuable in themselves. It will have to take care that economic interests do not under all circiimstances and as a matter of course take precedence over social interest....
1. Ibid. p.37

32
The reasons for the choice of the textile industry as a priority-
industry in this period corresponded to those of later years.
In 1933 Indonesia viss poised to irr^ove productivity of weaving
enormously by the mass introduction of the new hajidloom and the power
loom. Capital investment could be made by individual producers in small
increments sjid the social overheads involved ivere small. The traditional
weaving skills already existed and the application of new techniques to
an old craft, established in numerous sn all units, is much easier then
the introduction of an entirely nev; process. Marketing problems for
textiles could be expected to be smaller than for heavy industrial
produce because of the high degree of decentralisation of the textile
industry over the country as a v/hole. i-oreover, there was a large msjrket
awaiting the output of a textile industry, particularly since the loss
of export earnings in the depression had forced the issue of import
replacement of textiles.
The new policy:
The radical change of economic policy was brought about by leg-
islation in the fields of importing ajid manufacturing v/hich was
effective in redirecting scarce foreign exchange and in controlling
the development of new enterprises.
Imports:
The first stage of government interference in the economy came
in the field of imports rather than production. The ' risis Import
1. The Philippines wa^ not so fortunate with a large market and this was one of the reasons v/hy it developed much later than the Indon-esian textile industry. (L.D.Stifel. The Textile Industry- A Case 3tudv of Industrial Develp-oment in the Philippines.)

35 1 Ordinance of 1933 covered any coraiuodity ?/hich the government wished to
protect. The administration could promiilgate regulations to control
imports of a commodity but the measures taken could not be enforced
beyond ten months v/ithout the consent of the Netherlands Parliament. The
stated objective of the Ordinance v/as the prevention of excessive
imports, but the most important aim of the quotas and licences^ was to
protect the interests of European industry (especially the textile
industrj"- at Tv/ente in Hclland which supplied the Indonesian market
with particular types of cloth)It could hardly be said that the
1. J.H.Boeke. op. cit. p.85.
2. The regulations, which allowed imports to be defined clearly by qual-ity and quantity, were divided into three groups (free quota system, national qiiotas, and licence system). Under the free quota system the volume of imports peraitted was determined by v/hat was thought suff-icient for the domestic market. Imports of ready made clothes were on this system, and later unbleached cottons were added in Januarj'- 1935i not to protect the Indonesian industry but to limit the competition from Japan against bleached cottons which came from Holland, ./hen bleached cottons were placed under quota in 193 » the batik industry changed to using the cheaper unbleached cottons. (J.H. Boeke. op. cit. pp .87, 83, 9^). The national quotas were designed to protect well-established and specific exporters to Indonesia: in this context referring principally to Hollajid. As a fonv. of quantitative restrict-ions, it was also intended to provide some protection to the Indies domestic textile industry. National quotas ?/ere placed on imports of woven, coloured piece goods, cotton blankets, yarns, towels, rayon piece goods. (J.O.M. Broek. Economic Development of the Netherlands Indies^ p.63). They were contimially renewed until 19^1. (J.H.Boeke. op. cit. p.93). It was hoped that Dutch and other European importers and distributors would hold their ground against the intruding Japanese and to ensure this licences were issued in proportion to the business activity prior to the import licences. These licences applied only to essential commodities and their number could be increased if it appeared that prices were r/§ ing as a result of a shortage of imports. The price level of retail textiles was not .uch more after the re.gulation than before, (ibid. p.88).
3 . J. Pan.- laykim. Ekonomi dan Keuangan Indonesia. Vol.XVI.No.2.1963. p.8.

original aim of the legislation on imports v/as wholly protectionist but
in the following years the goverrmient changed its mind on industrial-
isation 8Jid chose to interpret the regulations in a strictly protect-
ionist manner for the Indies.
After 19^0 the licencing was made ineffective by the goverrmient's 1
direct control over imports through foreign exchajige allocation.
At the sa::ie time as these quantitative restrictions were introd-
uced, there v/as a change in tariff policy. In 1933 duties on imported
yarns were withdrawn and in 193^ industrial machinery was exempted.
Imports of variegated woven sarongs (a popular import) were subjected
to a 30
per cent duty.
A new Ordinance in 1937 lifted the ten months duration limit of
regulations after it had become evident that protection was required
over a much longer period than at first anticipated in the regulation.
The need for long terra protection was not a special characteristic
of the Indonesian textile industry. The Philippines had been unable to
develop its domestic capacity behind the import duties permitted by the
1909 Tariff Act.^ At the same time the already developed Indian textile
industry v/as only just able to compete against Japanese imports with the
aid of a 75 per cent duty^ on cloth in 1932. The Indian government 1. Ibid, p.93 2. J.O./I.Eroek. op. cit. p.8l 3 . v7. veji V/armelo. Koloniale Studien 1939» P«9 h. It was finally only with the aid of quantitative restrictions in the
fifties that the Philippines textile industry was able to develop. Protection (between I5 per cent ajad 30 per cent duties) under the 1909 Tariff Act was not sufficient. (L.D.Stifel. op. cit. pp.9, I6)
5 . S.D. i-.ehta. The Cotton Kills Of India, 1 8 5 ^ - 1 » p.l82

35
finally resorted to quantitative restrictions in 193^ after the
confusion over the exchange rates throughout the twenties had caused
an erratic expansion through uncertainty about effective rates.
i-i anuf ac turing:
In the 'Industrial Regiroentation' decree, which empowered
the government to prescribe volume, raethods of production and marketing 2
for industry, was introduced. Initially the decree was aimed at those
industries which had overproduced and whose capacity was several times
the voluEe of their sales as a result of the -i epression. However, the
sarong industry was also brought under the law in 1935 so that ais from
that year only establishments of fifteen or fewer handlooms could be
built without permission.^ ^he new import restrictions passed in the
previous year we're expected to give rise to enormous expansion in weaving, and it Mes hoped that the cottagers using the new handloom (AT3I- wotild
If
benefit fron it. Factories were licenced and had production quotas
including specifications of type of output a-nd wages to be paid.^ 1. Ibid. p.l83 2. W. van V/armelo. op. cit. p.5 3. The 1935 piece of le.gislation became known as the 'Industrial
Regimentation of weaving wills 1935'' (iCadarijah, Kasalah Kebid.jaksanaan Administrasi Fenjaltiran Sandang. p.53
k. As a result of the sudden increases in weaving enterprises, the legislation in 1937 restricted the number of handlooms in an un-licenced enterprise to five instead of the previous fifties. Xhe regulation aimed at developing the cottage industry and protecting it from medium scale enterprises.
5. P.H.,.. Sitsen. Industrial Development of the Netherlands Indies, p.3 As far as textiles were concerned, the regimentation was to limit the output of certain cloths, notably the sarong, ajid thus encourage the output of other fabrics. By restricting the expansion of the sarong industry it was hoped that the price-cutting war would stop ajid the position of existing firms strengthened. Some large organisations had successfully eliminated part of the small scale industry by price cuts.

36 This form of encoura.geraent was needed because of the teclinical
difficulties of starting new types of v/eaving and because of the lower
sale price of imported cloth. One of the reasons for the success of 1
the 'raaalcloon' system was that the larger manufacturers provided
technical advice to the cottager on a commission basis while the low
commission paid enabled the large manufacturers to e:q3eriment in new
types of production v/ithin the cottage system, 2 'file second Industrial Eegiilation Ordinance, in 1937, v/as an
attempt to coordinate new economic activity as v/ell as preclude the
chances of undesirable industries emerging, 'Undesirable' industries
were interpreted as enterprises not suited to native v/elfare, such a.s
modern, mechanised and large sca.le establishments. This policy does
not appear to have been carefully thought out because, v/hile it helped
to retain competition within the industry, the effect on the competi-
tion facing the industry as a whole v as not talien into account. The
emphasis of planning was placed on labour-intensive cottage industries
v hich v/ere to be aided by teclinical advice from government departments.
1. Tliis v/as a method of producing on credit supplied by larger majiu-factiirers. It appears to have had its origins at the time of the specialisation of textile production after the introduction of competitive imports.
2, J.H. Boeke. op.cit. p.130,

17. But it is impossible to see how this kind of enterprise cou2d have raised its
productivity above the level which fell substajitially short of its western
counterpartywithout a massive reorganisation of the financial and marketing
arrangements which would have placed the industiy on a basis similar to the
hi^ly cartelised Japanese small scale weaving industiy. Although there is
no evidence that this was explicitly stated it was most likely believed at the
time that the Depression would pass and that the coimtry would return to its
great primaiy producing industries. Even at this stage, v hen population
pressure, falling world markets for primary produce and the fear of a new
disruption of trade through war vrere obvious, the government was still consider-
ing industrialisation as a means of raising native income by utilizing simple
processes behind a tariff barrier and not as a vehicle for placing the country's
productivity on a level comparable with modem industrial coujitries. It was
only in 1940 when war broke out in Europe, and after years of stru-ggling during
which the small scale industry remained a high-cost industiy, that plans were
made to adopt large scale modem methods of production.
Other forms of protection:
Under the Department of Econoiaic Affairs in Djakarta, the government
set up three organisations to help private industry. Tlieir functions were to
provide technical assistance and credit and to report to the government on
progress made. 2 tUrst, in 1936, a Fund for Small Industry was begun vrithin the
Industrial Services Section of the Department of Economic AffelTS.
1. See later in this chapter under "Entrepreneurial weaknesses", for further reference to the Japanese industry.
2. Ibid. pp.117-18.

38. Planned to provide low inter^st loans to small scale industiy for starting new
production, the Section soon discovered that sales credits were the neatest
need of the industry. Second, in 1939, the government laujiched the Fund for
the Financing of Medim Sized Industries. The main purpose of this Fund was
to relieve producers of oppressive credit agTeements idth private moneylenders
hut the loans could also be used for enlargement of smaller factories."' Third
credit was made available for expansion of large scale enterprises in selected 2
industries, including textiles.
In 1927 legal provision had been made for cooperative societies but
progress was slow and the credit provisions, mentioned above, contributed more
to providing investment funds to individual indigenous manufactuj?ers than to •7
cooperative societies. Furthermore, these associations were managed by inexperi-
enced Indonesians and the weaknesses they x ere supposed to help overcome in
other enterprises were the causes of their oim failure.
1. P.H.W, Sitsen. op.cit. po37. 2. Ibid. p.37. 3. The table here illustrates the strength and distribution of cooperatives
in 1930 and 1938. The bulk of the increase was in general credit cooperatives; and in 1938 'other cooperatives' amounted to only about 20 per cent of the total.
IITMEER OF REGISTER!:!) COOPEF:ATIYE SOCIETIES; 1930 and 1938 Year Total Credit Consumer Producer Other ITo.members
coops. COO^S. COO-QS. . COQ-QS. COQ-Q . 1930 89 81 2 6 - 7,848 1938 540 427 16 37 60 42,031 Source;- Re-oort of the Java Banlc. 19[>1- '2. p.132

Another form of assistance to private industi; ^ was the establisMent
of central production plants,"" the origin of the later 'InduJcs', to aid small
scale industry. It was hoped that these enterprises wo\£Ld bring regularity of
production and standardisation of quality, would prevent oppressive credit
relations arising for the producer, and would stimulate an efficie t marketing
apparatus. The central plants were to take the unfinished produce of the small
scale mcjiufacturer, finish it and then market it. Buffer stocks were also to
be kept by these plants in order to stabilise supplies and prices. Loans to
small scale industry could be talcen out of the Fund for Small Industry at an
interest rate of 6 per cent per arinuia.
At the outset of this period of government interference and support
for the indigenous small scale entrepreneur, the internal trade of small scale
production that did exist was almost entirely in the hands of Cliinese who domina-
ted the financial market on which indigenous producers were dependent. If
Indonesians were to emerge as an omer-producer class, new investment incentives
had to be introduced to break the control of the Chinese. But umtil 1934 the
colonial adurLni strati on had attempted, and succeeded, in mnning the allegiance of
the Chinese by giving them concessions and recognition beyond those accorded to 2
the Indonesian. Donald E.¥ilmott has summarised their position in the colony
thus: they gathered the products of the land and sold them to big Dutch trading companies. Most of the small scale manufacturing enter-prises of the country were owned and managed by them. Except for the smallest shops and market stands, retailing was also largely in their hands. And Chinese shopkeepers, traders, and usurers remained the main source of credit for the Indonesian people, in spite of their unconscionably high rates of interest. Furthermore, the advantageous economic position of the Chinese was accompanied by superiority attitudes and social fyciusiveness.
1. '.n. Boeke. op.cit.p.118 2. Donald E. ¥ilmott. The National Status of the Chinese in Indonesia,
1900 - 19^8.p.11

However, so thoroughly had the Chinese pervaded the financial v/orld
that the technical and credit help offered by the government v/as never
able to free the Indonesian producer from being in debt to Chinese money-
lenders. Measures taicen against Chinese economic influence centred on
the availability of credit and constituted a policy of competing \in.th
Chinese influence.
Entrepreneurial weaknesses:
The weaver's family was txsually the production imit (sometimes
supplemented by hired labour) and the appropriation of profits and
reserves was made with the family's immediate requirements in mind; v;hile
social status and conspicuous consumption, although of necessity very
limited, were more common than frugality and re-investment. One of the
most important qus-lities of a successful entrepreneur is the ability to
persevere with a problem of management v/hen it appears insoluble. Too
fev/ Indonesian appear prepared to spend hours v/hich a Chinese v/ill devote
to worrying over difficulties, and if necessary, to take those business
headaches home at night. In the absence of a change in cultural con-
ditioning factors of management-trciining programmes, these v;ealmesses
were continued when the same people developed more mechanised capacity
with the help of governinent credit and protection.
At the same time Chinese traders who had accumulated financial
reserves were also attracted to textile production under the new favour-
able conditions and they introduced a strong element of competition 1 within the industry.
A very similar situation occurred in the textile industry of the Philippines under protection, when the Chinese offered strong competition to the Filipinos, and the reasons appear to have been the same. (L.D. Stifel. op.cit. pp.15-6).

Although the pre-war expansion of the Indonesian textile industry
has been given prominance by authors, methods of its financing are
poorly docuraented and reference must be made to the recollection of
manufacturers in ^Sok.
In the v/eaving section the looms available to aspiring entrepreneux-s
were the ATBLI (non-electric) and the ATI-! (power driven),which was imported 1
and which had up to seven times the productivity of the AT3M . xt was
possible to buy either of these looms as a beginning and to add further
increments later. This v/as the usueJL practice of entrants«
An exa-nple of the financing of such a business was provided by one of
the leading manufacturers in Madjslaja whose father began the family 2 _
business in the early thirties, in 1935» 'oy selling one hectare of rice
fields, it was possible to purchajse 10 ATBHs or 2 ATMs, This was by far
the most common method of capital raising. However, this merely solved
the problem of fixed capital. With so little reserves it was inevitable
that indigenous entrants should turn to the private lender (who vj8B
usually a trader also) for assistance with working capital.
The amount of working capital required would depend on the amount
of yarn in each batch of supply and on the intensity of labour input (or
the time taicen to process the yarn). Several manufacturers interviewed
in Bandung and Iladjalaja remembered good profits after 193^ but maint-
ained that it was extremely difficult to become free from creditors
because so r.uch of their working capital had been borrowed at free
market interest rates. The same Madjalaja manufacturer 1. Calciaated on the basis of the ATM being worked for two shifts. 2» Interview v/ith manufacturer in Iladjalaja. 19*5

h2
who described the method of financing capital equipment explained hov/
the profits were made. Seven kilo-rais of yarn, at 0.6 guilders a kilo,
produced 20 sarong pieces, labour changes amounted to 2 guilders and
dyestuiis cost another 2 guilders, Thus each sarong piece cost approx-
imately cents to produce while the sale price was between ^0 and 60
cents. 'Therefore, profit, although very variable, could be almost as
much as 50 per cent.
It is doubtful whether an easy sjiswer can be given to the question
'ivhy was the debt so difficult to pay off?' -i-'here are several factors
to consider. First, the profit rate depended on the speed with which
labour processed the yarn. Second, the attitude to savings was, and
remains today, extremely important. It is impossible to estimate accur-
ately the economic effect of conspicuous consumption and the desire for
leisure on the rate of capital accumulation, and no vrritsr on economic
development has dared to suggest how much of a drawback to industrialis-2
ation the attitude to commerce of the indigenous people hajs been. Hov/-
evet, there were Indonesian manufacturers who made rapid strides after
the sale of rice fields and after years of diligent production and
savings, and these ex amples suggest that many of the failures must be
attributed to the attitudes and quality of other managements. 1. If the workers were members of the household, they would be kept no
matter how hard they worked. In Indonesia nepotism is a virtue, and sometimes a necessity, but one that can be very expensive for the head of the household if he is also the employer. It was usually the case that v;hen there were only one or two looms in the new business, members of the family acted as employees.
2. L.D. StifelCop. cit. p.25) commenting on the development of the Philippines industry, observed that traditional values of the Filipinos led to conspicuous consu-mption rather than investment in industrial activity, but he did not attempt to quantify his observation.

Third, it was not only credit requirements which forced the small
manufacturer to turn towards the trader for help. He had little know-
ledge of the market, its changing tastes, and its level of demand. One
kind of creditor, known as the "verleger", offered the producer raw
materials on credit in exchajige for the final produce at a fixed price.
Thus he also became responsible for the mar"teting of the cloth, because
of the dependence on the verleger for supplies of yarn and credit, this
kind of trader was often in a monopsonistic position. Another kind of
creditor was the larger textile manufacturer who sought ways to expand
his business by promoting work to the cottager on a part-time, commission,
basis. In fact, this system, the "maal loon" system, was very similar to
the verleger system, but under the latter the larger manufacturer provided
technical assistance and pursued a patriarchal role in relation to the 2
cottager, j- ore over, there v;as no bargaining on a set price for the cloth:
payment v/as as for a wage.
/•.though it is true that the small scale industry was less effic-
ient than the large scale industry, it is by no means certain that the
physical size of the plant itself v/as very important. In the Japanese
textile industrj-- a large number of very small entejrprises which v/ere 1. i7. vaji '• armelo records that a business attitude was emerging amongst
the srnall scale producers in the later thirties when some came together to by-pass the verleger and seek markets of their own. (\7. vajn V/armelo. op. cit. p. 19).
2. After the Second World "'ar the term. "verleger"^was dropped and the term "rnaakloon" is popularly used to mean seve: l kinds of credit trails act ions.

kk
economically viable and v/hich were able to compete with the largest
firms, existed up to the early years after World V/ar II. The differ-
ence between " apanese and Indonesian smell scale enterprises lay in
other factors. The Japanese industry was highly concentrated and cartel-2
ised so that the financial and marketing problems which were always
present in the developing Indonesian industry did not occur with the
same importance in Japan. The Industrial Regulations in 1935-37
limiting the size of Indonesian enterprises would not have increased the
obstacles to efficiency if they had been accompanied by a successful
attempt to place finance, purchasing of rav/ materials and selling of
produce on a cooperative basis. As it was, the encouragement of small
enterprises strengthened the bajrgaining position of the private lender
and trader by restraining the more efficient entrepreneurs who might
have expanded and by facilitating nev? entrants into the industry.
Moreover, the system of cartels in Japan meant that the con-
tinued strength of the individual unit was in the interests of the
financiers. In Indonesia private lenders spread their activities over
several industries and the desire to make their debtors more credit-
worthy was not apparent. Furthermore, in Indonesia (as in the Philippines)
the small scale manufacturers v/ere usually indigenous while the private
lenders were usually foreign. The unfortunate racial antagonism which
inhibited the development of a cooperative or profit-sharing s|rit
was not 'oresent in Jarian. 1. G.D. ;-J.len. Japan's Economic Recovery, p. 2. G. Fleming. Die Strukturwandlungen und die Aussenhandelsver-
flectungen in der .<elttextilwirtschaft. p.50

On the other hand, Chinese producers achieved success in the
manufacturing field in the thirties, ihey started with greater finajicisl
reserves, they had close contacts with the marketing and private lending
worlds, and had a different attitude towards saving and conspicuous
consumption from the Indonesians. Gnce again, L.D. Stifel's com:ients on
the Jhinese textile manufacturers in the Philippines seem appropriate:
iVnong the reasons for the superiority of the Chinese have been their frugality ajid regular re-investment patterns, aided by Chinese baxiking facilities and cooperative ^ associations, as well as their diligence and business acumen.
IVhen new production processes v/ere introduced, it was necessary
to acquire new technical skills. Short courses were provided by the
Textile Institute in -Bandung, but it rested with the producer himself
to apply his new knowledge with care and diligence. Those managers
who were the most competent in narketing and finance tended to be those
who becsjiie more proficient in the new methods of production.
Entrepreneurial weaknesses caused a large number of failures
amongst the new indigenous maJiufacturers, and in the last few years
before the war, many Indonesian weavers sold their establishments to the
Chinese. 6f those \?ho remained in production majiy were still obtaining
a smaJLl income but v;ere heavily in debt to the government or to
private lenders.
1. L.D.Stifel. op. cit. p.l6 2. In H-djalaja, a textile centre near gjidung, 335 out of 1,500 large
and small business were sold by Indonesian to Chinese in 1939» In 19^0 35 went over to Chinese ownership. (P.H.7/.Sitsen, op. cit. p.2l) The transfer of v;eaving establisrjnents to non-indigenous persons was recorded as early as 1937* In that year of 336 applications for trajisfers, 170 were for sa2es from Indonesian to non-indigenous persons. (J.H. Boeke. op. cit. p.123)

he
Capacity and Production:
The expan.sion to 19^2:
By 19^0 both area under cotton cultivation and crop production
declined to a fraction of their 193^ levels. This was mainly due to
the abolition of duties on yarn imports in 1933 and the higher quality
of the imported commodity. Also experiments in cotton growing had failed.
1. The Netherlands Indies Government was not unduly worried when production fell shajrply in the decade before 'vorld -'ar II. The table here shows the extent of the decline.
AREA UNDER COTTON CULTITATIOI"! & COTTON PRODUCTION IN J A V A gy- M ; I D U R A , 1 9 3 ^ - ^ 3 .
Acreage (hectares) Cleaned cotton (tons) 193^ 11,^38 1,575
1935 10,305 1,^19 1936 13,382 1,842 1937 16,026 2,206 1938 8,184 1,127 1939 3,695 509 19^0 5,510 759 19^1 6,785 1,101 19^2 2,8^3 380 19^3 33,293 5,^60
Source:- J . Panglaykim. Some Facts end Figures Concerning Textile Production in the Country, p.26
N.B. (i) In the Palembang region of South Sumatra, 7,300 hectares were planted in 1935 although the annual average for 1930 and 1934 was only 2,000 hectajres J . van Hall and C. van de Koppel. De Landbouw in die Indische Archipel. Vol.III. p.30;. There are no other available data on cotton planting.
(ii) The 19^3 figure shows the effect of forced cultivation of cotton by cottagers under the ^^apanese.
A further reason for the absence of anxiety over cotton production v/as the primitive nature of the cottage spinning industry compared v/ith the improved weaving industry. The emphasis on weaving had encouraged import replacements of cloth to the exclusion of yarn import substitution. V / i t h the grov/ing prosperity in the weaving section there v/as little incentive to process domestic cotton by a laborious and costly method of production when profits were lower than elsewhere.

'The modern spinning industry only began to develop in the
second half of the 1930s. In 1936, 5,000 spindles were added to
a large v/eaving mill, N.V. Ja,va Textiel Hy, in Tegal in Central 1 2 Java, and another 10,000 spindles v/ere added in 19^0. Another
mill, Ilebritex, v;as started in 1936 in Pasuruan, in -i ast Java,
v/ith a capacity of 1,000 tons of yarn and in 19 41 a mill, N.V.
Djejitra, v/ith 15,000 spindles v/as opened in Semarang in Central
Java.
According to spinning coefficients quoted by the Depart-
ment of People's Industry in I962 this total capacity could
utilise ^,000 tons of rav; cotton and produce 31636 tons of yarn.
1. Hirawan. DepartmentaJ. (People's Industry) memorandum, 196^. p.1'1-; and J.O.M. Broek. op.cit. p.83.
2. According to Kadarijah (Development of the Textile Industry in Indonesia, p.l?) the 15,000 spindles were capable of producing 2,200 tons of yarn; but the coefficien«ts used by the Department of People's Industry are preferred here.

This is equivalent to 18.2 to 21.8 million metres of cloth. However,
it is not certain whether the mills ever worked at full capacity (which
is defined as thpee shifts).
-he weaving section, v/hici showed the -./reatest ex'oansion during the
thirties, is difficult to define, -here existed between 800,000 ejnd
1,000,000 of the primitive gedogan loom,^ with a capacity of one metre
for every seven hours of work.^ If aJ.1 these looms were operated seven
hours a day for 2^0 days a year between 192 and 2 +0 million metres of
cloth a yea.r could have been produced. However, because of their
extremely low productivity, and because of competition from both cloth
imports and the improved loom.s, it is not possible to even guess how
many were in use during this period.
In Table 5, the increase in other weaving looms, is shown. Mthough
the biggest absolute increase was in handlooms, the proportionate inc-
rease between 1930 and 19^0 was about the same for the improved handloom
as for the power loom. Horeover, the number of power looms was rising
much faster in the later years.
1. The Department of People's Industry uses the coefficient one kilo-gram = 5 to 6 metres of cloth for all its calculations.
2. Hirawan. op. cit. p.13« 3. Interview at the Baddung Textile Institute. 12.11.6^.

49 TABL3 5-
KUIIBSH OF li-mOVSD H M D L 0 0 M 3 AMD POWER L00R3, 1930 - 19^0.
N o , improved hajidlooms N o . power looms.
(ATBM) ( A W O
1950 257
1931 kh
1932 777
1933 1,299 46 1934 1,622 258
1935 3,919 4IH 1936 4,376 668 1937 12,000 2,000 1938 30,028 ^i,4oo 1939 35,000 6,600
1940 44,000 8,000
Source:- J . H . Boeke. Economics and Economic Policy of Dual
Societies, p.287
The ATBM is capable of producing eight metres of cloth and the
1
ATM betvveen 20 and 28 metres of cloth every seven hours. If the average
productivity for the ATM is 24 metres, then, in 1930 the annual capacity
for ATBKs (one shift, 240 days a year) was 493,440 metres and for the
ATI'Is (2 shifts, 240 days) waB 506,880 metres: a total of 1,000,320 metres.
In 1940 the figures were 84.5 million metres and 92.2 million metres,
respectively, totalling 178.6 million metres (or about 2.4 metres per head
of population). This is roughly ten times the capacity of the modern
spinni-ig industry of that time, and vTOuld utilise approximately 32,160
tons of cotton y-rns,
i^O-most sll of this expansion was in non-cottage weaving establish-
ments. The big increase in ATBKs and A W s is reflected in the rise of
1. Interview at Bandung Textile Institute. 12.11.64.

50
non- cottage weaving establishments from 8l in 1937 to 1,866 in 19^2.
-'ne characteristic of the nev/ industry worthy of note is its
geographical distribution. In 1935, 36 per cent of ATBMs and 85 per
2
cent of ATHs were in Java. But in 19^0 almost 100 per cent of .-.TSKs
and only 5 per cent of ATI'is were in Java.^
The knitting industry did not exist before 19^2. Singlets, which
were not so coramon as today, were imported. But in 19^-2 there were
twelve factories with hand knitting machines.
Finishing plants which, like modern spinning establishments, were
slow in developing because of large capital outlays, were started by
the govei'nment under the state central factory (Induk) scheme which aimed
at the standardisation of quality. Their capacity was very small cornpejred
with taat of v/eaving, and most of prewar finishing of cloth was done in
cottages under poor and variable conditions. It was the low quality of
this stage of the domestic production process which contributed so much
to the success of finished cloth, imports.
One of the factors limiting the increase of power capacity was the
shortage of electricity^ Spinning plants used their own generators which
enabled then to function for three shifts. 1. i-'Iadjalaii Warta Industri. Vol. III. 1^0.2. February 1957. p.7.
Department of People's Industry. Djakarta. 2. Hirawan. op. cit. p«13» 3. This variation was most likely due to the strong influence of the
Bajidung Textile Institute in Jest Java when it distributed its own invention, the ATBM. The low incomes in Java would have tended to encoura-^e the use of labour-intensive production processes, but it might also have been the case that the large mills using power loo;-s in Sujnatra were due to the initiative of a few individual businessmen, ilevertheless, the data are remarkable and show that weaving product-ivity in crowded Java v/as a great deal lower than in Sumatra.
h. -Kirawan. op. cit. p.1^. 5. Madjalaja, v/hich produced ^0 per cent of total cloth output in the
1960s, had electricity installed in 1937 and this marked the sudden and lar^e growth of the industry in that town.

51 Production:
I'he table below siiows the composition of imports of all textile
materials. Between 1935 and 1937 the capacity input of the modern
weaving industry increased by 6,1^4 tons a year, while yarn
imports increased by 55 09^ tons. The raw materials of the batik
industry, bleached and unbleached cotton piece goods, almost
doubled in this period of protection. Finished textile imports
decline^'d a little.
TABLE 6.
IHPORTS CF TEXTILE SAW tiATSSIALS AND FINIS HJ D aOCDS: 1935 -( p;ross weight, tons)
1935 1936 1937 Tarns: Cotton 5,86? 6,0^0 10,961
Other- kinds 2,153 5,104
Cotton Piece Goods: Unbleached 7,fl5 9,759 12,918
Bleached 12,9^0 13,171 23,822
Dyed 11,712 10,80if 15,723 Printed 6,633 6,516 10,996
V/oven coloured 6,995 8,191 11,964
IVoven coloured sarongs 2,348 2,146
Clothes: 10,4^1 10,004 11,920
Source:- Statistical Abstract for ether lands Indies 1937. pp. 327-28.
The only figure for 19^0 was for cotton yarn imports amounting to l3,100 tons (Statistical Pocketbook of Indonesia, 1963' p.135)'
1. Calculated from Table 5 using 5-5 metres per kilogram of yarn.

I In 1955 almost 6,000 tons of y a m were imported wliile the m o d e m
•i and ATM) weaving sector was capable of utilising 1,560 tons'*. If stocks
of y a m ren.ained unchanged this in icates that 74 p-:r cent of y a m imports were
available for the primitive gedogan looms after the new looms had been fuJly
supplied. In 1937 the m o d e m weaving industry vras capable of absorbing 7,000
tons of y a m a year vrtiile imports irere almost 11,000 tons. Tliis suggests that
a decreasing proportion of total y&.m imports, and a slightly smaller absolute
amount, was availaile for the gedogan looms.
The sources of textile cloth for the market in 1940 are presented in
Table 7. The first colrimn, giving capacity of the new weaving industry allovra
a comparison vdth actual production.
TAELE 7.
SOURCES OF SUPPLY OF TEXTILES IN 1940
Total Capacity of ATBIfe and ATIfe (lUll.metres
J
Domestic cloth production (mill.metres)
Imports P of cloth ^ supply of
(mill.metres)^ cloth _ (mill.metres)
176.6 128.0 139.2 267.2
Source:1 1.
2.
3.
Calculated from Table 5 on the basis of a 240 days world-ng year. J.O.M. Broek. Economic Development of the ITetlierlands Indies, p.83. (Believed to exclude production from the gedogan loom Imports in 1940 were 25,300 tons, of which 24,200 tons were raw material cloth for the batik industry. (Statistical Pocketbook of Indonesia 1963. pp.134-5). Using a conversion factor of 5.5 metres per IcLlogram (Department of People's Industry) this represents 139^150,000 metres.
p
In 1940 yarn imports were 18,100 tons ^ or t;:e equivalent of about
c9o5 million metres. Tliis is a good deal less than the y a m equivalent of
1. Ibid.
2. Statistical Pocketbook of Indonesia 1963. p.135

53
official statistics of cloth production and strongly suggests that the
domestic spinning industry remained an important supplier of yarn. Total
cloth supply v;as only - about 4 metres per capita which implies that the
domestic cloth produ.ction figure does not include all cottage weaving
(mainly gedogeji looms), particularly for household use.
Assessment of the expansion:
The most notable characteristic^of the new policy on textile product-
ion wefte the drive towards mechanisation, the expansion in overall
capacity, and the development of indigenous ownership of modem equipment.
The first v/as successful in so far as it encouraged a great deal of
capital investment in anticipation of good profits. The second was a qual-
ified success because the high profits did not materia.lise and the fin-
ancial bs^is of the industry v/as precarious amongst the indigenous ovmer-
ship. It is possible that the expansion reached a 'saturation point'
around 19 -0 for several reajsons. Returns to capital investment might well
have been lower than returns in other industries in 19^0. Also the domest-
ic industry was still unaccustomed to producing a wide variety of textiles
usually imported and the cloth it did produce, which was comparable in
type to imports, \7a.s not comparable in quality. The demand for the poorer 2
quality product could have been already satisfied. The increased welfajre
1. It is thought that this figu.re is very low in comparison with the target of 10 metres in the 3ight Year Plan and consumption in India and Indon-esia during the 1950s. Indonesia v;sj3 prosperous in 19^0 and cloth consunption coiild easily have been higher.
2. nevertheless, the fact that imports of yams increased ^OQ per cent between 1930 and 19^0 demonstrates the very great increase in activity in the domestic industry. (J.O.i:. Broel;, op.cit. p.83). In 19^0 total cloth production (including part of the cottage industry) was 12o million netres, which is over" 70 per cent of the combined capacity of the ATBIIs and Tlls.

of the other islands in the later thirties increased the export of cotton
piece goods from Java to the rest of the archipelego and assisted in the
accelerated expsjision of capacity in the last few years before the out-
break of war.
Finally, the rise of indigenous ownership cannot be regarded as
successful in the long run. It undoubtedly helped to increase incomes in
msjiy enteriprises and in those cases v/here Indonesians were successful it
provided experience and an exa:nple to others. However, the poor entre-
preneurial basis to the new industry lowered the chances of diminishing
the influence of middlemen and moneylenders to an extent whichallowed the
new Indonesian owner to free himself from crippling debt.
After a government enquiry in 19^0 into the state of factory 1
development two civil servants, P.H. ./.Sitsen and Surachman, provided
details of an industrial development plan which was the result of a
search for a balance between modern and primitive methods of production.
Modern industrial efficiency was not to dominate planning, but was to
co-exist with indigenous techniques. Spinning capacity was given great
thomght and there was strong feeling that further encouragement should be
given the textile industry in general; but nothing resulted and in early
19^2 the Netherlands Sast Indies fell to the Japanese. This marked the
end of effective intervention in the industry by the Dutch colonial
Government.
1. A.M. de Nexunan. Skonomi dan Keuangan Indonesia. Vol. VII. No.3* 195^* p.252.

The Industry Without Government Plaaning. 1942-1950.
The Japanese Occupation:
The final aim of the Japanese Occupation was to make Indonesia an
integral part of the Greater East Asia Co-Prosperity Sphere, It is extremely-
doubtful whether the Japanese would have encouraged a textile industiy in
Indonesia (were it ever ahle to compete with the Japanese textile industiy), but
their short run policy was to make their occupied territories as self-sufficient
as possible for the duration of the war .
ThJ.s policy encourag-ed many Chinese workshops to enter production. It
is not knoTr/n what role textiles played in this expansion but the pace of develop-
ment of the industry during the thi ties was certainly not maintained during the
war. Indonesian entrepreneurs, being the smallest and financially weakest, were
not offered the biggest contracts by the Japanese and this in turn further weak-
ened their position. Relative to his Ind nesian counteipart the Chinese emerged
from the Occupation in a stronger position than before. J.P. T'!eek has commented
that there was a large increase in the proportion of handlooms omed by Cliinese 2 after the war .
1. l ch of the textile production in Indonesia at this time was in the form of supplies to the occupation forces and the general population was reduced to rags by the end of the war. In their efforts to increase production by means of self-sufficiency the Japanese ruthlessly forced householders to grow cotton. (AJ'T. de Neuman, Ekonomi dan Keuangan Indonesia. Volume 1S54 p.535)
2. J.P. Meek. The Government and Sconamic Develoment in Indonesia 1950-54. p.86

Postwar Development:
Expansion of capacity:
By the end of the war the destru.ction of the capital stock and the
shortage of raw materials had reduced production to a fraction of its prevrar level.
It has been su-rested that as much as 60 per cent of total capital investment
was destroyed , but it is reasonable to assume it was much less in the textile
industr r becai.se of the drive to self-sufficiency in clothing pror'uction during-
the war.
The DU'Ch did not control the vjhole of Indonesia in tlie years 1945 to 2
1950 and coordination of the entire econor-y was impossible .
1. A.M. de Neioman. op.cit. p.333.
2. In spite of the obvious need for immediate reconstruction, the 1940 long- term industrial plan was stu.died by the colonial adrrdnistration (in Djakarta) and by the Republican Government (in Djogjalfcartaj and was the basis of the economic plaiming of both until the 1951 Sumitro Urgency Programme. _ Tlie Republican Government rejected the prewar liberal economy on ideological grounds and examined the 1940 Plan ath a view to using it as the fo-undation for a planned econo iy. The intention of tliis IcLnd of government interference was to chajige not only methods of production but financial and organisational asT)ects of the economy with a view to strengthening the indigenous sector. But in fovulating a plan the government was hampered by provincial and sectional interests. A Three Year Economic Plan (ibid. p.352) i.Mch finally came to be known as the Easimo Plan, and which Aas been the basis for industrial planning ever since, was circulated to all interested bodies. Because of the Revolution there vras little chance of implementing industrial progranimes during- this period.

Nevertheless, the textile industry made strides in areas under
Dutch administration''. 2
The progress of capacity expansion is presented in Table 8 .
The spiriidn ' industry did not expand in the immediate postwar period
and some of the prewar eq uipment might well have been destroyed in the Revolution.
TABLE 8. CAPACITY INPUT AI® OUTPUT OF SPimTING, DWING A H) KNITTniG
SECTIONS OF THE T^TILE IIIDUSTEY. 1949 AUD 1950; Equipment Input Output
(tons of yam) (tons of yam)
Dec.1949 Dec.IS50 Dec.1949 Dec.1950 Dec.1919 Dec.1950
Spinning: (spindles) 52,500 32,500 • •feaving: handlooms 67,161 72,001 (atbi:) poxrerlooms (ATM) 10,590 11,522
Ivnitting: machines 233 257
F.A. N.A. N.A. N.A.
22,300 24,000 134 144
11,500 12,400 63.5 65 33,000- 33,OCO- 200- 200-42,000 42,000 250 250
N.A. x:. A. N.A. IT.A.
1. Since the Japanese Occupation left the Chinese relatively stronger than before the war and with the financial resources of the administration strained vinder the burden of reconstruction it was inevitable that the Dutch looked towards the Cliinese for the expansion of textile capacity.
2. 'ihe absence of data for the years immediately after the xmr is due to the inability of the authorities to resume statistical collections in the chaos of Revolution and rehabilitation. It is believed that the data for the year 1949, when much of the textile industry in Central and East Java was in Republican hands, were draxm from both Dutch^and Indonesian sources because they were published for the first time in 1951. It was not until 1949 that the Central Bureau of Statistics began to collect industrial infoimation after the war with the >jelp of contacts, advertisements, etc. (E.A. van de Grarf. Statistics in Ind.onesia. Chapter 4. p.l)

5?. TAELE 8 (cont'd)
Source;- (i) weaving hsiidlooms and powerlooms, and biitting machines from Reriort of the Java Banic 1951-52. p. 189.
(ii) numbers of spindles recorded in the Report of the Java Bank 1951-52 vrere 203,210 and 204,028, respectively, for the ti-ro dates. In Report of the Java Bank 1952-5 (p.178) the number of spindles recorded at 31.12.51 is 119,750 and at 31.12.52 is 63,486. The decrease is assumed to arise from few returns from the cottage industry, and that included in the former figure are more of the primitive spindles. Because of the very-low productivity and doubtful commercial use of such spindles the nuinLer of modem spindles and their production capacity recorded in 1942 is used for 1950.
(iii) Input and output figures for vfeaving are derived from knox-jn technical coefficients (Department of People's Industry)-. Eandlooms (ATBM) and gedogans produce 8 metres and one metre of cloth per seven hours, respectively. The Department of People's Industiy assumes a coefficient of one kilogram of yam per 6 metres of cloth. Pull capacity is one shift, 240 days a year. The power loom produces 20 to 28 metres of cloth per seven hours and uses one kilogram of yam for 5 to 6 metres of cloth depending on the vridth of the loom. Full capacity is ti-ro shifts 240 days a year. The 32,000 spindles must refer to the modem spinning industry v/hich was installed beti reen 1936 and 1942 vrith .capacity input of 4,00C tons of raw cotton and capacity output of 3,636 tons of yam. The laiitting maciiines recorded by the Java Bank are believed to be hand machines. In thjLs chapter ifc was stated that the modem power machines were introduced in 1953. Hirawsn (Departmental memorandum- People's Industry,p.14; records that in 1942 there were about 12 knitting factories with hcnd machines. '.Tith an average of about 20 machines per factory, all 233 of 31.12.49 could be ^^cp^mted for. The productivity of these machines is not knoim, but if theyi handmachines, their input and output would be very small compared x-rf.th those of weaving.
It is interesting to note the size of the increase in vreaving capacity
between 1949 and 1950, a period of chaos and lack of raw materials.
The bulk of the increases in weaving capacity between 1940 and 1950*'
appears to have tal-cen place immediately after the war. The reason for thJLs was
the severe shortage of textiles and tls lv high prices in the early postimr years. 2
However, the expansion was rushed and badly supervised .
1. See Table 5 for weaving capacity in 1940. 2. The Repox-t of the Java Bank states:
it has not always been clearly realised what type of textiles might be expected to be in regular demand in the home market and which sort of looms should be acqvdred in order to be able to cope vdth such demand. Furthermore, in many cases the efficiency and professional knowledge of these new enterprises have left much to be desired. Report of the Java Bank, 1951-52. p.190

59 1
In 1950 approximately 2.75 metres of cloth per head of population
could have been produced by the ATBMs and ATI-Is alone, and if the primitive
gedogans v/ere used this output could have been increased to reach
2
metres per head of population. ICnitting factory capacity was still very
small. Finishing and printing capacity in 1950 was less than that in
19^2 because of destruction and lack of maintenance during the years of
the Occupation.
Production of raw cotton had declined after the war when the
enforced cultivation conducted during the Japanese Occupation was dis-
continued. In 1950 only 1,363 tons of cotton were produced^ compared with
3,^60 tons in 19^3. -Lt is probable that households which grew and
consumed their own supplies escaped the official statistics but if cotton
production is to be compared with spinning capacity in commercial use
(that is, the modern spinning capacity) official production statistics
alone provide an appropriate comparison.
Production and imports:
Tal.-)le 9 indicates changes in the level of activity in the textile
industry. If we assume that no stocks of goods were built up after the
war ajid that all imports were consumed soon after their arrival it is
possible to directly compare the level of domestic activity with supplies
of imported finished goods.
1. The population in 1950 was 77 million. (Statistical Pocketbook of
Indonesia I962, p.1l) 2 . This extra output would be using very low productivity processes. 3 . J.Panglaykim. Some Facts and Fi,a:ures of Textile Production in the
Country, p.2 8 . Ibid. p.26.

TABLE 9.
IMPORTS OF TK;[TILE RAW MATERI,\LS AND FINISHED GOODS, 1938, 19^7 to 1950 (gross v/eight in tons)
1938 19^7 1948 1949 1950
Raw cotton: 575* N.A. N.A. 1,770 2,860
Cotton yarns: 9,100 1,870 7,310 8,200 15,800 Cotton piece goods
unbleached: 7,300 (a)
40.1 6,590 (a) 36.2 5,530
(a) 30.4 5,400
(a) 29.7 14,900
(a) 82.0
bleached: 19,600 108.9 3,990 21.9 7,480 4l.1 8,100 44.6 10,500 57.8 Sewing threads: 1,100 220 580 600 800 Cotton piece goods
dyed: printed: coloured woven:
11,100 5,600 7,900
61.1 30.8 43.5
4,950 3,340 2,420
25.0 18.4 13.3
10,180 5,130 6,400
56.0 28.2 35.2
9,800 7,600 3,800
53.9 41.8 20.9
10,800 6,000 5,400
59.4 33.0 29.7
Cotton singlets & mesh shirts: 2,700 1^.9 930 5.1 1,090 6.0 1,400 7.7 1,100 6.1
Other clothing: 3,800 20.9 1,400 7.7 1,160 6.4 1,800 9.9 1,000 5.5
TOTAL: 68,^00 320.2 25,710 127.6 44,860 203.3 52,700 208.5 66,300 273.5 Source:- Reports of the Java Bank 19^9-50, pp.161-, 2, 1950-51 pp.170-1, and 1951-52, p. .190
•This is the fi.raire for 19^0. (a) This is the equiveilent in metres. The date for cloth imports are not given
in metres in the of f ic ia l statistics, but if the coefficient 1 kilogram = 5*5 metres is used, columns (a) may be deduced
o

61.
The data reflect the effect of excessive demand on the one hand and
competition from cloth imports on the other. In 1947 although yam imports were
only a fraction of their prewar level doth imports were of the order of 50 per
cent of their former quantities^. In 1948 strict quantitative restrictions were
imposed and the shift to raw materials imports was very marked althou^ imports
of finished goods continued to increase, absolutely and relatively, In 1950
a new exchange allocation method accompanied by monetary reform helped to enhance
the position of the domestic industry. At the beginning of the new decade imports
of finished cloth and made-up textile goods had not yet reached their prewar 2 level •irhile yams and unbleached cloth imports reached record levels .
1. The vrealaiess of tlie domestic industry in the face of overseas competition in 1947 and in the second half of 1950 was also due to low liquid resources and the physical hazards of production. The indigenous sector of the weaving industry had suffered economically from the Japanese Occupation and had little working capital Tfri.th which to begin production. The urban traders w^re conducting profitable activities in a situation of overall scarcities and the returns to imports of essentials were especially h-igh. But the distribution of raw materials outside the militarised urban areas was hazardous during the 1945-50 Revolution and in trds physically dangerous situation the risks attached to transporting goods to aiid from the factox-ies lo ered the profitability of importing raw materials and intermediate goods. It is not known whether the producer or the trader bore this risk. If it were the former tiiis would be reflected in lower production profits; if it were the latter hi^er prices for yam would be demanded. In the absence of high tariffs, this disadvantage was oiily overcome when quotas were intro-duced in 1948.
2. Althou^ it is not intended to evaluate activity in the batik industry-it is worth noting that imports of its raw materials since they compete vrith other textile imports and with the produce of the domestic weaving industr . After the war some of the raw materials of the batik pi-oducers, which are shown in Table 9 under the heading-of 'unbleached and bleached cotton piece goods,' were purchased by consumers (before printing) because of current very low purchasing power, and it is not kno\m how much of these imports was ever finished. But the strong competitive position of tliis soxirce of cloth in 1949 was only temporary.

6J. Capacity utilisation in 1950:
l.lien the Republican Government aciieved effective sover- ignty over
the vjhole of Indonesia in December 1949 domestic production had not reached its
postvrar level''. Al.though the overall deficiency in textiles supplies was caused
by a shortage of foreign exchange the low de.gree of utilisation of weaving cap-
acity was also a result of imports of competitive goods. Domestic cloth
production was on].y one seventh the quantity of cloth imports in spite of the
fact that the industry was operating at about per cent of its capacity'.
Table 10 summarises data on total supplies of raw matarials and the
volume of domestic production of cloth in 1950.
TAELE 10. T O m SLTPLIES OF T CTIL!: RAW M/ITBRIALS AIH) CLOTE. 1 950
Eaw cotton (tons) Yarn (tons) Cloth (million metres) Pro- -r . Pro- T , Pro- , , liiiToorts , Im-)orts , . Im'oorts duct ion duction— duction 1,363 2,860 2,450 15,800 40.5 390.3 Sources':- Pang Lay Kim Some Facts and lijCiures of Textile Production in
the Country, pp.28,32 and 35. and Reports of the'Java Bank 1950-51 . pp.170-71, and 1951-52. p.190 Cloth production of 40.5 million metres is eqiial to approximately 7,400 tons of yam. Thas leaves almost 8,00C tons of yam which would be appropriated by the knitting industry, vfeavers who are not included in the statistics (cuite unknom) and stocks. Ilnitting production not included was:
Sin .lets Sports slrLrts Undervests 1,534,186 652,548 47,088
Domestic production of raw cotton (1,363 tons) alone amounted to 2
34 per cent of full capacity input of the modem spinning industry .
1. In 1949 industrial output as a whole was 30 per cent to 130 per cent (averaging 50*per cent) of 1940 output depending on type of nroduct. (Report of the Java Bajik 1 S49-50.P. 120) A year later the overall utilisation rate of fixed capital was estimated at 50 to 60 per cent. (Report of Java Bank 1950-51 .t). 115;
2. See footnote to Table 8 (ii)

6i.
Raw cotton imports of 2,"60 tons x ere eno-a h to bring the utilisation figure
to IOC per cent. The spinning industry consisted of expensive mechanised eruip-
ment ovjned "by a few foreign companies. The problem of overseas competition was
not felt to the same extent as in the weaving section because of the higiily
developed purchasing and selling contacts of its oijner-mana.gements, the less
industrial strife vjith the liigher degree of mechanisation, and the hj.gher and
more uniform levels of efficiency and productivity. The combined p:;oduction of
ATBIfe and ATI-Is, which aniounted to 40.5 million metres'*, or 30 per cent of capacity
production, represented about 8,000 tons of yam or 2.3 times the yam production
of that time. Another 390.3 million metres of cloth were imported.
It is inferred from tids that the difference between total supplies of
.yarn (18,200 tons) and yam reqviirements to produce 40.5 million metres
(7,400 tons) was absorbed by the Emitting industrj;-, the accumulation of stocks 2 and an vmlmoi'm part of the weaving industry which is not recorded .
1. This figTire is compatible vri.tL 19.9 million metres of cloth, 5.9 million sarongs, O.3 million shawls, and 2.4 million towels. (Pang Lay JSLm. op.cit. pp.51-52)
2. It is not Imoxm how much yam was consumed by knitting machines, but if singlets can be assumed to be eq ulvalent to 0.5metres and sports shirts to 1.0 metre each, not more than. 300 tons of yam would have been consumed. The amount of unrecorded pz'oduction from recorded yam supplies would probably have been ver; siiiall because those weavers Vfho did not malce returns, in the ei-rly post-.rar years, ar.iongst whom the small establishments woidd predominate, would have found production extremely difficult wit}-i the prevailing ti^it credit and high raw material costs. Stocks of yam at th^ end of the year were reported to be very liigh. Even after allowing for a Icrge deg-ree of error in the quantities of yam available and consumed, the demand for yam for piirposes of stock-building mu t have been ver '- substantial. The large oiiantities of stocks were the principle reason for the reluctance to import further supplies in 1951.

6k The charige in composition of all textile materials imports betv/een
19^9 and 1950 reflects the influence of the drastic economic measures of
March of the latter year and it is worthwhile describing the nature and
efficacy of these measures because they v/ere designed to meet an inflation-
ary situation vrtiich was repeated in later periods. Moreover, the obstacles
to these measures exerting a favourable influence on domestic textile
production v/ere common to those v/hich occured in following years.
Economic reform in 1950-
Measures taken:
3y 1950 it was clear that special measures had to be taken to ha-lt in-
flation and bring balance into external trade. In ''arch a monetary purge
took place aimed at halving the money supply and thereby radically deflat-
ing the economy. The target of the reduction of money was 2.5 billion guild-
ers/Rupiahs (or 66 per cent of the money supply). A few days before the
purge the Foreign Exchange Inducement Certificate system was introduced where-
by an exporter received a Certificate equal to half the value of his foreign
exchsjige earnings at the official rate. An importer was obliged to purchase
Certificates at face values equivalent to the total value of his imports. 1. The devaluations of 19^6 and 1C'49 had only a temporary effect. Output
for both exports and domestic Consumption was very lov/ and the production of goods for the home market v;as as necessary as the production of exports to enable the country to import. Inflation had encouraged the tendency to auf .ent supplies by imports; what was necessary was greater incentive to increase production. It is doubtful whether the country could have v;aited for the greater export capacity to develop following a simple devaluation to increase supplies of essentials. A more selective policy than sim :le devaluation appeared to be required.
2. This was cal-culated on the bajsis of using the -inducement "certificate to produce equilibrium between the internal and external value of the Indonesian Supiah. (Report of the Java Bank 1930-31 > pp.29» 36-7). The purge was carried out by a compulsory conversion of 1.6 billion (guilders into a 3 pe r cent government loan.

65. At first these Certificates were priced on the free market but later the sale
price xfas fixed at tvjice the face value''. In effect, this aniounted to an
import rate which was 3'52 per cent of the former (official) rate.
A week^after the monetaiy purge a short list of goods was draim up
for which there was made available unlimited supplies of foreign exchange. All
other imports were subj=--.ct to quantitative restrictions, 'iliis 'free list' was
extended in May and August, and finally in November 1950 all goods were freed
from quotas.
The last important economic measure of tliis series was talren in 2
April 1S50 when ms:ximum prices set for certain imports were abolished . This
meant that cheap raw materials would no longer be available to the textile
industry. It was hoped that the free list of imports, which at t^ls time ex-
cluded competitive textiles, would increase the supply of raw materials suffic-
ient to prevent excessively liigh free market prices. The restriction on cloth
imports vras to assist in supporting a free market cloth price
The effects of the measures:
The immediate result of the ferch measures was a fall in all imports
for several reasons.
1. ¥.M. Corden and Maclde Falayan Economic Review. Volume \1I. Ho.1 April 1962. p.40. The importer purchased them in addition to paying the normal amount (at the official rate) for his goods.
2. Re ort of the Java Banlc 1950-51. p. 64- It is not inclcated whether textiles were included in tliis cat ego ly, but because of the 200 per cent rise in effective import rates and the T'jidespread free market for textiles already existing, it might be assumed that they were.

66
Jirst, when the Certificate was introduced there was hesitation in
continuing to import because of the uncertainty of the rate of exchange 1
attached to it. Second, the price of imports rose considerably with the
Oertific3.te requirement. In most cases import prices rose by more than 200
per cent. Third, an extreme shortage of working capital and credit developed
as a result of both the price increases and the monetary purge. Although
this reduced the flow of imports it did not reduce the immediate supply of
raw materials to industry because the working capital scarcity caused importers and traders to sell their stocks of goods in order to increase
2
cash holdings. But some of the goods dumped were finished textiles ajnd
these competed with new domestic production in a market in which purcha^sing
pov/er had been affected by the monetary purge and by general import price
increases.
The dumping of stocks to increase liquid resources and the virtual
halting of imports forced the governiiient to increase credit facilities.
3etv/een i-Iarch ajid September million guilders (or about 10 per cent of
the rapidly expanding money supply) was given in loans to commerce. iS the Si 1. If the rate had dropped at later date those who held "-ertificates or
who had just imported goods with them would have suffered losses. For this reason the greater possibilities of obtaining imports through increased foreign exchange made available at that time were not exploit-ed and there was a hiatus in imports of raw materials. "vVhen the govern-ment finally fixed the price at 200 per cent of the face value of the Certificate the confidence of importers was restored.
2. 'Owing to the volum.e of m.oney being halved the cash in hand suddenly dropped to 50 per cent of the normal quantities. On account of the precautionary and speculative motive a tendency developed to replenish the cash in hand. This was done on a large scale by disposing of goods... Of course, the disposal of supplies need not immediately involve a relative fall in prices under the confused conditions in this country'. (Re-oort of the Java Bank, 19^9-1930. p. 37)

67.
pre-purge level of the money supply was reached as soon as September the effect
of the monetary reform on working capital was short term although it was some
months later that the money supply was sufficient to accommodate the increased
1 import costs .
The free list system must also be regarded as the beginning of a
liberalisation of the general quota system. In March cotton y a m s were placed
on the list. Extensions were made in May, July and November^ when textiles in
general (amongst other goods), were permitted unlimited foreign exchange.
Unfortunately, as credit became less restricted the free list was extended to
cover competitive imports and the protection it offered domestic manufacturing
was lost. But while that protection lasted raw materials imports were able to
improve their share of imports^.
1. By the end of 1950 there was a strong demand for textiles and the increase^^:^^lities were used to satisfy the consumer goods market. A high proportion of the gradually expanding credit facilities was used to purchajse cloth imports to the detriment of the domestic industry. This was due to the larger profits of consumer goods imports because of a fixed exchange rate accompanied by a rising domestic price level. Neither the monetary purge nor the later
expajision of the money supply could be of benefit to textile majnufacturers and the uncertainty and confusion resulting from the chajige in economic policy might reasonably be expected to have affected the lengthier production process more than direct importing activities.
2. ReToort of the Java Bank 1950-31* pp.64 and 66.
3. ./ith the exchange rate fixed through the Certificate and inflation continuing it v;ajs inevitable that finished textiles imports became more attractive to traders ajid at the end of 1930 stocks of imported finished textiles were accumulating®

68
The failure to continue v;ith the policy of deflation rested
mainly on the problei|i of working ca'oital. Credit had to be extended in
order to stimulate production, but the government (possibly frightened
by the immediate consequences of the harsh economic measures) concent-
rated on credit to the import sector v/hich could supply goods quicicly
to the market. The argument was that the new import rate, v/hich v/as
300 per cent of the old one, warrajited aid to the importer. It does not
appear to have been fully appreciated that the producer had to pay this
extra for imported raw materials too, 8Jid therefore required credit
assistance to make his order. Moreover, the complexities of manufacturing
in Indonesia in a difficult and uncertain monetary situation caused the
domestic industry to lose ground to imports of cloth by the end of the
year. Thus r/hile it is difficult to blame the government in faltering
in its ruthlessness in carrying out deflation it is fair to criticise
it for failing to protect domestic manufacturers. This mistake was
frequently repeated in later years and it has never been clear why the
governiaent allowed this to be so. Two reasons might be suggested. First,
the policy of supporting indigenous entrepreneurship was more strongly
pursued in the import sector thaji in the manufacturing sector. Second,
problems of v/orking capital often occured at times when the supply of
goods on the market v/as verj'- low. For internal political reasons there
would be a strong desire to supoly finished goods to the n-^arket as
quickly as possible as the foreign exchange became available.

69
The competitive position of the industry in 195O:
it is not easy to assess the ability of the domestic textile
industry to coiTipete ivith imported cloth at any time after the Second
V/orld f?air because there v;as never a situation in which the strength of
competition could be observed free from the intervention of controls ajid
other measures designed to alter the incidence of competition; although
there uere periods v>rhen the influence of controls was at its lowest.
For most of 1950 quantitative restrictions were used to protect
the Indonesian manufacturer. The small tariff on cloth imports v/hich
was viewed more as a source of governi'nent revenue cannot bg, regarded as
an effective protective device or even as an approximate indicator of
the strength of overseas competition. All that can be done in this dis-
cussion is to surmise the competitive position on the basis of reports
and cor.-mients made at the time and by using price data.
2
The Report of the Java Bank records that the spinning industry
in 1950 was able to produce at landed import prices (with no tariff
protection) but suggests that domestic weaving costs were more than
25 per cent above overseas costs. There is no explanation for this
figure and it m>ight have been based on nothing more substantial tha^i
impressions. The J-ieport of the Java Bank for the following year^ states
1. Manufacturers interviewed remember import duties of these years as small, nominal percentages. Specific data on tariffs were unobtain-aole
2. :^eport of the Java Bank 19^9-30> p. 120.
3 . fieport of the Java Sank 1930-511 p.115.

70
that before the measures of inarch 1950 v/ere implemented abnormal profits
were made in the industry in spite of low rates of capacity utilisation.
These cont' .ents v;ere made at a time when the industry was functioning
at low rates of capacity utilisation behind a totally inadequate tariff.
There is no reason to beliVe that any one of these reports is
untrue. The;/ do, in fact, demonstrate the difficulty of assessing
the competitive position of the weaving industry without dividing it
between small and large sized enterprises, -mechanised and unmechsinised
equipment, and indigenous and Chinese ov/nership.
Tt mi: ht well have been the case that the average costs of the
v/hole industry/ were 25 per cent more then the costs of overseas weavers,
but this does not preclude the possibility of many of the more efficient
domestic weavers producing at the same average cost a^ their overseas
competitors. Moreover, the cost ratio mentioned by the Bank "Report does
not take into account the possibility that if there were sufficient raw
materials for the whole industry's capacity, and any ainount of imports
of textiles v/ere perrdtted, this ratio would be altered. Further-aore,
imports of both raw materials and finished textiles were purchased on the
bsusis of a fixed exchange rate while domestic costs were being contin-
uously increased by inflation.
Finally, if the problems arising from diverse costs within the
industarr are ignored, there remains the question whether the industry's
competitive position is to be judged sufficient if it merely functions
at its current full capacity (but does not satisfy the local consumer

71
market) or if it is also able to expand its capacity and thus eliminate
all imports of textiles, if the latter is in«teiided and the present
capacities of the different stages of the production process are not
equal the competitive strength of each must be judged separately. Although
the spiniaing industry is alleged to have costs equal to imported yarn
prices it has less capacity than the weaving industry which can be util-
ised to reduce imports. In order to attain equal capacity with the
weaving industry it would require larger profits than the weaving section.
Because of these qualifications it is not realistic to make more
than the most .tentative of conclusions about the competitive position
of the textile industry in 1950 on the basis of these reports.
An exajiiination of prices data does not extrude any further inform-
ation. Table 11 presents indexes of the money supply and selected free
market ajid landed prices for 1938 and 1950.
TABLE 11.
TUUEXES OF THE M0N3Y SUPPLY, M D FIRES fiSTAIL MARI^ET AITO L M D S D PHIC3S OF PJGE M P TEXTILES, IN DJAKARTA; 1938 and 1950.BASE 1958=100
Money Price Price of Textiles Landed Price of Imports Supply of Printed Striped Yeans Cotton Dyed cotton
Eice shirtings twills yarns piece goods, flow- 2^"
ered sind gingham ______ plain
1938 100 100 100 100 100 100 100 1950 910 13^8 k96o 4758 4073 478 608
Sources:- (i) Money supply. Report of the Java Bank 1950-51> P«29* (ii) Price of rice. Statistical Abstract of Indonesia 1955.p.68. (iii) Price of textiles. Statistical Poeketbook of Indonesia ^
1963, p.263; and Statistical Abstract 1955^ p.67. (iv) Landed price of cotton yarns and dyed cotton piece goods
derived from quantity and value data in Report of the Java Bank 1?31-52, pp.242-^3.

72 In 1950 free retail textile prices were between and 50 times
their I938 leveljv;hile the price of rice was only about 13 times, and
the money supply 9 times, the prewar level. O^er the same period the
landed price of yarn and cotton piece goods had risen only 3*8 times
1
and times, respectively. Clearly there were huge profits to be made
between the importing and retailing stages of cloth, and they were
enjoyed by aJIl groups in the commercial and business sectors: importers,
wholesalers, retailers, inefficient weavers and efficient weavers.
IVithout further information it is not possible to estimate the final
costs of domestic production.^
If all textile materials were freed from quantitative restrictions
the greater increase in the price of cotton piece goods imports than in
the price of yarn imports since 1938 might place the domestic weaver at
an advantage over the producer; but this v/ould depend on -oiimi ea in
costs of production other than yarn which would be constantly changing
under the influence of inflation.
1. The landed price was the Rupiah cost to an importer of purchasing a good overseas and clearing it through customs; at which stage he could sell it to wholesalers, retailers or manufacturers, whichever was relevanto
2. There is no information on free market yarn prices and it is thought that this is because yarn supplies were supposed to be distributed at a controlled price not much greater than the landed price. If weavers purchased jtarn at the landed price they too would be able to malce a large profit. But the distributive system was such that weavers were granted allocations of yarn at an official price. The result was thet inefficient firms sold their allocations to other vieev/ers through the free market and the efficient weavers processed, what was to them, high cost yarn.

73
Smnmar:/-.
At the end of the p e r i o d of f r e e t r a d e the new modern weaving s e c t o r
¥i/as a v e r y i n s i g n i f i c a n t source of t e x t i l e s . The need t o r e a s s e s s the
a b i l i t y of the economy t o mainta in s tandards of l i v i n g i n overpopulated
J a v a and the d e c l i n i n g importance of Netherlands produce i n t o t a l
Indonesian t e x t i l e imports removed the f i n a l o b s t a c l e t o the development
o f a modern Indonesian i n d u s t r y behind t a r i f f b a r r i e r s and q u a n t i t a t i v e
r e s t r i c t i o n s .
In the l a s t few y e a r s b e f o r e the Second ./orld tVar the t e x t i l e
i n d u s t r y s-s a v/hole was supported by q u a n t i t a t i v e r e s t r i c t i o n s aaid
t a r i f f s , w h i l e the emerging indigenous s e c t o r was a s s i s t e d by c r e d i t
and a d v i s o r y schemes, between 1930 and 19^0 the modern v^eaving i n d u s t r y
i n c r e a s e d i t s c a p a c i t y from one m i l l i o n metres t o 178.8 m i l l i o n m e t r e s .
The l a t t e r i n v o l v e d raw m a t e r i a l s amounting t o 32,1DO tons of y a r n , or
approxii i iately 9 t imes the c a p a c i t y of the modern sp inning i n d u s t r y of
t h a t t ime. In 19^0 the l a s t y e a r b e f o r e the war f o r which data were
a v a i l a b l e , the s p i n n i n g i n d u s t r y was ab le t o produce 3 t o n s of yarn
which was the e q u i v a l e n t of something i n the range of 18 .2 t o 2 1 . 8
m i l l i o n metres of c l o t h .
Plov/ever, the low l e v e l of e n t r e p r e n e u r i a l a b i l i t y meant t h a t a
l a r g e p a r t of the weaving i n d u s t r y was f i n a n c i a l l y v e r y weak. I t was
c l e a r tha.t Indonesia.n producers v/ould r e q u i r e many y e a r s of c r e d i t
a s s i s t a j i c e b e f o r e t h e y could compete v/ith Chinese p r o d u c e r s .
P r o d u c t i o n c a p a c i t y i n the t e x t i l e i n d u s t r y did not i n c r e a s e
d u r i n g the Japanese Occupation and some p a r t of i t was v e r y l i l c e l y
d e s t r o y e d or allov?ed t o f a l l i n t o d i s r e p a i r . The postwar expansion i n

weaving and knitting capacity was encouraged by strong demand and high
prices but competition from cloth imports prevented the full utilisation
of the industry in the immediate postv/ar period. There was no corres-
ponding increase in the capacity of the modern spinning industry.
By 1950 the weaving and knitting sections of the industry had
expanded to a capacity of 212 million metres (excluding the gedogan
looms) plus the output of 257 pov/er knitting machines; finishing and
printing capacity was quite inadequate to handle this output.
The monetary purge and the big increase in import prices affected
textile manufacturing by causing a working capital crisis and by
diminished margins. of profit.
The effects of the ilarch measures would have been much more
serious had it not been for the introduction of the free list of imports.
Even this was a^ifemporary protection device because the list was
extended to competitive goods a few months later.
It is not possible to draw any firm conclusions about the comp-
etitive strength of the domestic industry because apart from the absence
of necessary data, the divergent cost structures in the industry and the
presence of inflation mal<e any measure of competitive ability of only
partial and temporary use. Moreover, the criterion of competitive ability
might 8_lso include the ability to expand capacity profitably to satisfy
the v/hole of the consumer market,ajid a great deal more information than is
available wotild be required for this estimation. The discrepancies
between lajided and retail prices of textile materials reflect not only
cost differences but also scarcity of supplies.

75 C?LIPTER III
G-CVERNI-;ENT PLANS AND THE EXPANSION 0 ? T H E INDUSTRY.
In this chapter the government's policy concerning the physical
expansion of textile manufacturing capacity will be explained together
v/ith an examination of the causes of the failure to meet investment
tar;^-e^. The problems of competition from imports will be discussed
where it is thought that this has a bearing on the change in the rate 1
of expansion or has caused a re-scheduling of the expansion programme.
However, first it is appropriate to describe briefly, but without any
attempt' to analyse them, the main characteristics of the economic
background v/hich accounted for many of the difficulties of the growth
of the industry.
Economic Background to the Expansion.
The new •' epublic began in favourable circumstances with the
Korean V.'ar causing high prices to be offered for its exports, but this
advantage was quickly absorbed in greater quantities of imports. After
the -Var the pressure of demand on liiuited foreign exchange resources was
aggravated by the continual presence of inflation which,with fixed ex-
change rates, undermined the incentive to produce for exports and
raised the demand for imports. The recurring foreign exchange crises
became increasingly more serious until in 196^ the small quantities of
imported industrial materials were largely purchased on two-year credit
contracts. 1. The causes and extent of foreign competition are left to Chapter
VII, 'Protection and the Influence of Inflation'.

76
The rate of inflation in Indonesia^which was much greater than 1
in India and the Philippines and about as severe as in Argentina, is
indicated in "Jable 12 by the indexes of prices of the essential goods,
food and clothing. The price indexes are for the densely populated
urban area of Djakarta where prices are usually highest. But for pur-
poses of studying trends and fluctuations this limitation need not be
regarded as an obstacle because there is no reason to believe changes
occured in dt^ferent proportions over the whole of Indonesia.
1. ^ata on inflation for four underdeveloped countries are given in the table below:
COST OF LIVING INDSXSS IK THE PHILIPPINES, INDIA, INDONESIA iiWD ARGENTINA, 1951-62; base 1958 = 100
Philip oines India Indonesia Argentina 1951 88 82 37 30 1952 88 86 33 36 1953 95 87 37 36 195^ 9^ 82 if1 k2 1955 93 82 56 45 1956 95 92 55 53 1957 97 95 85 • 66 1958 100 100 100 100 1959 99 104 1 18 202 i960 103 1 opt- 154 226 1961 105 i c s 256 269 1962 1 1 1 1 1 2 - 354
Source International P 'inane ial Statistics; published by the
p.29. 195^-62: Vol . 16, June 1963, p.35
The very smal.l inflation in India and the Philippines would suggest that soKie of the structural changes observed in the Indonesian textile industry due to inflation were not so prevalent in their technically comparable industries; but it is not known whether any study has been made on the influence of inflation on the range of averp.ge production costs and on the incidence of protection in these other industries.

77
TABLE 12.
SELECTED PRICES IN THE URBAI\ AREA OF DJ;yCARTA. 1950 - 1964.
Imported textiles, iVeighted index, retail
free market Djaxarta prices, free market.
prices. D.iaicarta, 1 9 foodstuffs.
Index based Annual per Index based ilnnual per
on 1950=100 cent changes on 1950=100 cent chan.'-^es.
1950 100 100 1951 77 -23 168 +68 1952 66 -17 177 + 5 1953 75 189 + 7
195^ 81 + 8 200 + 6 1955 1^7 +82 266 +33 1956 89 -65 304
1957 1 10 33^ + 10 1953 189 +72 k37 +46
1959 ^81 +15^ 58k +20 i960 756 +57 725 +24
1961 588 -29 987 +36 1962 1,687 +1S7 2,417 +145
1963" 2,570 +52 5,957 +147
196^* 7,260 +183 12,7^0 +il4
Source:- Price indexes 1950-62 calculated on the basis of figures in
Statistik Kon.junktur I96I , pp.76, 83; and January-April I963
p p . 7 8 , 8 1 . 1963 and 196 - unpublished data obtained in
Dj al^art a, i iay 1965*
* As at December of eactjyear.
Civer the fourteen year period textile prices rose 72 times
while food prices rose 126 times. However, this is not a fair comp-
arison because textiles were in critically short supply in 1930 and
a more reasonable base year v/ould have been 1953* -Since 1953» textile
prices have risen more than food prices. The greatest annual price
increases occured in 1955) 1958-60, and after I96I; and there was a
marked increase in the rate of inflation in the later years in spite
of the decline in I96O.

78
-he fluctuations in the state of the balance of payments were not
the only cause of uncertain supplies of imported goods. The extent of
governitent intervention in the quantity and quality of imports varied
not only with the need for extra protection but also with the political
ideology of the many different Cabinets. Administrative personnel
employed to import and distribute raw materials through a frightening
barrage of regulations were invariably neither competent nor incorrupt-
ible, and their activities were sometiiiies terminated in order to halt
the chaos they caused. The extreme divergence of food and textile prices
in the table above is the strongest evidence that supplies of essentials
?/ere not always affected by disturbances in the economy in the same way.
These unfortunate circumstances impinged most severely on the
textile industry because of its almost total reliance on imported rav/
materials.
The rebellion in Sumatra in 1957 snd the expulsion of Dutch manag-
ement personnel in 1958 added to the general disturbances from which
the economy never fully recovered.
One of the most influential factors in the economic situation
was the promotion of the Benteng (or Indonesianisation) programme because
it directed most of the deficit-financed state bank credit to a new and
inexperienced group of entrepreneurs. The provision of what a m o u n t e d to
heavily subsidised credit facilities^ for an untried and not very success-
ful trading and producing class imposed an extra cost burden on the
community ajid forced greater competition on many of the well-established
and experienced entrepreneurs.
1. The Programme was an attempt to bring indigenous Indonesians into the production and commercial sectors and to create an Indonesian middle class.
2 . See Ar)-oendix A for details of these facilities.

79
- t is in the light of these general economic problems that we
novv examine the progress of government plans.
Generail aims and principles of policy.
The 1940 Sitsen Plan for industrialisation and the economic
philosophy of the ^^epublican planners were based on the belief that
strong efforts should be made to industrialise the country, particularly
over-populated Java. The need to draw some of the excess labour from the
land and to increase overall productivity had become urgent. Employment
opportunities on a large scale were very limited in rural Java; but
problems of transmigration to the other ^ islands were great, ajid even
if they could be overcome, it was believed that the increase in product-
ivity would not be as high as in modern manufacturing. Moreover, the
extension of primary production on virgin territory was hazardous,
expensive and demanding on the migrants. Finally, further industries in
Java would create a subsidiary employment which would be close to the
largest m.arkets in the country.
The case for industriaJLisation appeared overwhelming but the
choice of industry still had to be made.
The fu.ture of the country's balance of payments had to be taken
into account in view of the pressures which economic development would
inevitably place on the foreign exchange reserves^. Sxport promotion
presented difficulties because of low elasticities of demand for 1. A.M.de Neuman. Ekonomi dan Keuangan Indonesia. Vol. VII. No.3.
1954. p.252 2. These were the same reasons for the rapid expansion of the Philijpp-
ines textile industry in the 1950s. (L.D. Stifel. The Textile Industry A Case Study of Industrial Development in the Philippines. p.l8)
80
primary produce and the danger of stationary or even declining supplies
in an inflationary situation, /in industry which was directly import-
replacing appeared to have greater merit because domestic markets could
be more easily predicted and guaranteed than overseas markets whose
elasticities of demand could be altered by the introduction of
synthetics or whose potential could be disturbed by the entry of new
competitox-s.
The textile industry v;as an obvious priority for import-
replacement. Textile imports had absorbed large amounts of foreign
exchange in the pajst. I-any Indonesians were already accustomed to the
processing of raw materials, and the main process, the weaving of yarn,
provided more direct employment per unit of capital investment thaji
would highly mechanised^large^heavily industrial plants. The financing
of the expansion would also be easier because the units of machinery
could be purchased in small increments and spread over many finris and
areas. Finally, it provided the government with an exceilent opportunity
to promote its Benteng programme, because the individual enterprise
would not require large initial funds and the technical knowledge
required was small compared with that for other industries quite new
to Indonesia. There was no other industry which provided all these
opportunities together. The batik industry would have provided emploj'--
ment but its productivity remained very low. The same was true of
ceramics. An iron and steel industry would have been costly to
establish and would not have provided the same opportunity for employ-
ment per unit of capital and for promoting the Benteng programme.
T. Cera/dcs is another important cottage industry.

81
v.ithin the textile industry modern spinning and finishing
establisliments required large outlays end highly skilled personnel
to work the mechanised equipment. Because of this the weaving and
knitting processes were the obvious starting points for the new expansion
and this explains v/hy weaving capacity remained so much greater than
other ca-oacities.
-i-t was hoped that the cottage industry with its handlooms
would continue to function and provide employment and income to the
rural underemployed, but the difficulties of this occuring alongside
a modern industry appear hever to have been discussed in official
pronouncements. The failure to assess the implications of such a
dual policy lei to the problems v;hich are discussed in Chapters IV,
V , and YI.
The short run target, then, was to make the country self-
sufficient in weaving and knitting capacities while in the long run,
the entire industry, including cotton growing, spinning, and finish-
ing, v7otTld replace all imports of textile materials.
•^efore the different programmes are examined a simmary of the
physical, expansion is given to se3: \re as a source of reference for the
progress of the Plans.
1. The 1951 Urgency Programme, the iiechanisation of Small Scale Industries Programme, and the Five '^ear Plan did not discuss this
problem.

The Bx'oansion.
Table 13 provides as much data as were available on the growth of the
dif ferent sections of the text i le industry since 1950*
Table 13»
CAPACITY OF SPINNING, I'/SAVING, FITTING, MJ) FEINTING INDUSTRIES
1930 - 1962
SPINNING WEAVING KNITTING PRINTING
Outmt No. No, Output No. No. IMOo cloth ATBM ATI'4 (Million Machines Machines Spindles ; yam cloth ATBM ATI'4 Machines Machines
(tons)EauivRl. metres) (Million metres)
1950 20^,028 includes low pro-72001 11322 268.8 237 N.A. 1951 119,730 ductivity hand 71093 11971 274.6 342 1
spinning 8 1952 63,^86 3306 30.3 69032 12119 272.4 351 8
1953 67,000 3810 32.0 67746 12994 280.0 543 8 195^ 98,000 83^0 46.9 74433 12480 286.8 700 18 1933 98,000 83^0 46.9 78837 12697 297.8 772 18 1936 120,366 10^39 37.3 84933 1 1477//293 .3 970 18 1937 120,366 10if39 37.3 113322 15301 374.2 2784 24 1938 122,000 10379 38.9 118897 16524 4i8.7 3460 29 1939 123,188 10683 39.5 N.A. N.A. N.A. N.A./ N.A. i960 123,628 10716 39.7 150000 16896 482.8 N.A. N.A. 1961 K.A. N.A. N.A. N.A. N.A. N.A. N.A. N.A. 1962 162,000 1^033 77.4 223903 20284 663.7 7736 (17.4
(or 93.3 (million million metres) metres)
196^ 223,000 1932^ 106.4 N.A. N.A. N.A. N.A. N.A. (Nov) Sources:- ( i ) No.spindles 1930-7 Reports of Bank Indonesia; 1931-2 1 . Spinning:
( i i ) No.spindles 1958. Kadarijah. Ekonomi dan Keuangan In-donesia. February 1958.p.l4. (But the Report of the Execution of the Five Year Plan, I936-6O published by the National Planning Bureau, Djakarta, gave the figure of 97i3l8 spindles, p .3 l)
( i i i ) No.spindles 1959 and I96O. Perusahaan-2 Industri i960, p.96
(iv) No.spindles I962. Pembangunan Industri Rakjat, p. 13 Department of People's Industry, Djakarta. April I962.
(v) No. spindles 196^, information obtained from report of the Industrial Technical Centre Foundation, P.T. Djunti. p.3

83 (vi) Conversion factors: output figures are calculated on the
basis of ratios obtained from Pemban.g^neji Industri - aJcjat, p. 11. Full capacity is taken as three shifts a day, 260 days a year. 2. Weaving: (i) No. hand and pov/er looms and -mitting machines, 1950-3 ^^-Qorts of Bank Indonesia; 1931-2,p.l88; 1932-3, p.178; 193^-3, p.14?.
(ii) No. hand and power looms and knitting machines, 193^-8, Report of the Execution of the Five ^ear Development Plan, Covering the Years 1936-38, p.31. National Planning Bureau, Djakarta. 1953.
(iii) No. flooms I96O; Hirawaji's memorandum (People's Industry) 1964. (iv; Mo. knitting and weaving machines I962. Pembangunan Industri
Sakjat , pp. 17-27. The output data also cajne from this sourceo (v) Conversion factors: the ATBM (handloom) produces 8 metres, the
ATM (pov/er loom) of width 1 produces 20 metres, and the ATM of width 2 produces 28 metres per shift (seven hours). (Evie Koo, The Textile Industry, Nov/ and the ^'uture, p.63
The handloom is assumed to work one shift s. day, 240 days a year and the pov/er loom two shifts a day, 240 days a year. There are no available data on the division of pov/er looms between the two types, so the ratio found by KOTOS's inspection team (KOTOE -Report 13.11.2.63, Djakarta) will be taken as the basis for calculations on output of the looms. The KOTOE team found that of a total of l4,423 power looms inspected, 7i246 were ATMs of width 2. There is likely to be error from variations between the years but this is the least unreliable assessment possible.
(vi) The ratio of hand and ppv/er machines for knitting for the different years is not knov/n but it^elieved to have chajiged. The capacity..' input for 1939 was put forward by I.P. Andren (U.N. Advisor) in a meniorandum to the Minister of People's Industry, titled Foreign Exchange Bequirements I96O, p.2. The calculations for this figure were not given, but they probably refer to 3OO days a year. 3 . Printing: (i) No. machines 1931-6 from Reports of -Bank Indonesia; 1932-3, p.178; 1933-6, p.134; 1937-8, p.191
(ii) No. machines 1937 and 1938 were taken from. Report of the Execution of the Five Year Development Flan Covering the Years 1936-38. p.31. National Planning Bureau, Djakarta.
(iii) The capacity output figure for 1962 was obtained from Pembanfi;unan Industri Rakjat, p.21 (20 million metres a year was deflated from the official 3OO days a year to 260 days a year). Department of People's Industry, Djakarta. April I962. N.3. in 1936 there were 30,000 unlicenced ATBIJs in the cottage indust3ry. (Kadarijah. Ekonomi dan Keuangan Indonesia. Vol. XII. No.2/3 J'arch 1939. The decreases in spinning and v;eaving capacities in the early fifties v/ere /nost likely due to chaotic statistical services before the transfer of sovereignty in 1930. // In 1939 the knitting industry was capable of producing 4,230 tons of knitted goods. /f Jiiis fig-ure appears to be wrong but it is quoted as reported by the
iiational Planning Bureau.

The definition of full capacity used by the Department of
People's Industry is 300 days a year. In this thesis 2^0 days are
1
used because it is thought this is more realistic.
Questions of depreciation and obsolescence are le^t to the Appendix
but problems of errors in licenced capacity are discussed in Chapter VIII.
Spinning capacity doubled between 1953"5^ and 1962 but the
biggest increase occured after I96O. The expansion of handweaving
capacity V/B^ much greater than that of power weaving. However, the
biggest increases in both types of loom occured together in 1957 sJ ti
1960 to 1 9 6 2 . This v/as encouraged by the prosperity of the industry
in 1955 aiid 1956, and by the heavy importing of raw materials through
goveriornent channels in 1959 and I 9 6 O . Kuch of the increase in the last
few years v/as due to the illegal re-writing of capacity licences by
manufacturers who attempted to obtain larger allocations of raw
materials as a result. The very rapid rise in the nurnter of knitting
machines is due mainly to the growing demand for singlets and T-shirts
and the ability of new mechanised knitting equipment to exploit this
market in spite of overseas competition. Printing capacity, like
spinning capacity, expanded fastest in recent years with the introd- ^
uction of large mechanised plants.
Using the conservative capacity figure of 2^0 days a year, the
weaving industry could produce about 6.6 metres of cloth per head of
population annually in 1962; or more than double its capacity in 1950.
A l l other sections of the textile industry experienced a greater
proportionate increase. 1. See Appendix B for a discussion on capacity definition.
2 . See KOTOS investigating team's report (February I965) in Chapter VIII, 'The Industry after Fourteen Years of Support and Protection'

85 The 1931 Sconomic Urgency Pro,' rarnrne«
The Urgency Progrararne of 1951 was the first of the "Republican
plans to reach the stage of implementation. Previous to this there
had been the 19^6 Kasimo Plan ¥;hich .aid down principles for industr-
ialisation (which v/ere referred to bg the Cabinets of later years for
guidelines), and
an Operation • '•econstniction for the years 19^8—51,
which was to return production to its prewar level by 1951. However,
in 1951 it was obvious that supplies of consumer goods had to receive
first priority.
he immediate aims of the Programme, which was intended to cover
a period of txvo years, were to meet the needs of the people by stimul-
ating the greater utilisation of existing equipment and to improve 2 and standardise the quality of production. Much of the equipment used
before the war had fallen into disuse for mejny years and spare parts
were urgently required for repairs. The high priority given to small
scale enter-orises in vjhich much of the disused equipment was found,
and to cooperatives which v/ere to channel the bulk of the assistance
to small scale firms, was to be supported by the establishment of
central cooperatives plsnts. These 'Induks' were to advise on-mechanis-
ation and stajidardisation of quality;"^ but provision was made in the
Programme for only one textile Induk. Large enterprises were
encouraged v/here they could function as 'supporting elements' to small 1. Juaji B. Gaztajr.bide. An Interim Profr-ramme of Industrial Estates for Indonesia. •:. 13- Djakarta. 1.10.51. (U.N.Bureau of Technical /issist-ance Operations. U.N. New York.)
2. Ibid. p.4 3. Ibid. -p.Ik k. B.Higginso Indonesia's Sconom.ic Stabilisation and Development, p.68

86
1 indigenous firms, but only one such enterprise, a spinning mill, was
2 erected by the government. A large knitting factory did not go beyond
the planning stage.^ The projects suffered many delays through tech-
nical difficulties and the government possessed limited managerial
resources to place in the leadership of the new enterprises. It v/as
hoped that private Indonesian enterprise would em.erge from this kind
of public intervention. Special support from deficit-fina_nced credit k
was given existing enterprises to help them expand physical capacity.
Although it is impossible to estimate by how much the Programme
was a failure^ because no fixed targets for the private sector v/ere
ever made^it is generally regarded by civil servants and manufacturers
as having been only partially successful for three reasons. First,
insufficient foreign exchange was set aside for raw materials and for
imported spare parts which could not be made in the coLxntry at that
time. Second, the rehabilitation and provision for technical advice
rtjquii-ed skilled personnel and orgajiisation, and these factors were in
very short supply in 1951. It was found that the poor quality management
in the small scale industry did not respond to attempts that were
1. B. Higgins. Pacific Affairs. Vol.29. No,2. 1956, p.115
2 . L.A. Mears. Ekonomi dan Keuangan Indonesia. Vol.XIV.No.l/2.p.36
5 . B. Higgins. Indonesia's Economic Stabilisation and Development.p.75
D.S. Paauw. Financing Economic Development. The IndoneeiaJi Case,
p. 66

87
made to re-organise it. Third, the government overestimated the
capacity of the indigenous sector to absorb credit under generally
1
accepted bsjiking regulations.
In spite of the original goal of two years diiration the
Programme c o n t i n u e ^ w a s merged into the Mechanisation of Small Scale
•industries Programme.
The Mechanisation of Small Scale Industries Programme.
A five year plan with " very broad aims for economic development
was drafted in 1950* '- he most iraportant part of it was the strengthening
of the small scale, indigenous sector by the activities of Induks,
2
cooperatives, and training schemes. It was never properly implemented
and, tofgether v/ith the 1951 Urgency Programme, was absorbed by the
I mechanisation of Small Scale Industries Programme.
It had become apparent that two reasons why the smaller^ less
efficient v/eaving enterprises were not competing satisfactorily with
the rest of the industry or ¥7ith imports were the low productivity
of the equipment and the poor quality of the products. It was recog-
nised that questions of finance and organisation were more complex and
required attention over a longer period but it was hoped that technical
help might show immediate improvements in output. The Programme for
Small Scale Industries was specifically desi#gned to provide this
1. Professor Paauw sums up the situation by stating; 'The rate at which traditional modes of production could supply the increased volume of administrative, technical and entrepreneurial skills to complement capital and credit v/as once again overestimated'. (Ibid, p. 66)
2 . A.M. de lleuman. Industrial Develo-pment in Indonesia. 1955.

88 assista-nce to inefficient weavers. It also reflected a determination
on the part of the govermrient to sustain the less efficient sections
of weaving and place thern on a more permanent competitive basis.
An unspecified number of Induks (or Central Plan1 ' were to be
established and to act as cooperatives and training centres. By under-
taking the purchasing of raw materials and the sale of the product it
v/as hoped that they would be in a position to assist with working
capital. The quality of domestic production was to be standardised
and improved by offering guidance to small enterprises in new methods
of v/eaving and by finishing their cloth produce in the Induks. How-
ever, unlike the cooperatives the Induks were to manufacture cloth too.
The Programme was conducted by the •'-'epartmental of Small Scale
(later People's) Industry which supplied field officers who chose the
enterprises (in all fields of the economy) to receive assistance by
sending out questionnaires and by collecting information from many
sources. The selection was made v/ith the aim of mechanising bottle-
neck srasll scale industries in order to expand their output and was
originally confined to those firms employing fewer than 50 workers.
In prrzctice, larger enterprises were chosen for inclusion in the
Pro rairjne. To avoid abuses, the machinejry, rather than the money, was
delivered to successful applicants, and the new equipment remained
the property of the Department until the loan, which was made on low
1. K.N.PAO. Sconomic Development and Cultural Change. Vol.IV. No.2. January 1956. p.16? ~~~~~~
2. J.Bennett & E.A.Tenenbaum. Indonesian Industrial Financing, p.82

89
1 interest rate terms, was paid off. The length of time for repaynient
was about eight to ten years, but much of the total money lent was
eventually written off as bad debts. By i'iarch 1958 million had
been spent in all industries but only about 2 per cent had been repaid 2
and it was doubted whether the rest would ever be recovered.
''-'he scheme was not regarded as successful.^ By March 1958 only
11 textile sjid clothing establisl'jcents had made use of the assistance
received. However, in those firms which enjoyed greater mechanisation
the increase in productivity was very large. A weaving mill in
Semarang is reputed to have increased output 500 per cent when its
looms 'were motsrised.^
The reasons for the failure are varied. As far as the Indul s were
concerned, shortage of foreign exchange and governiiient funds delayed
their completion and the first was ready for commission at the beginning
of the Five Year Plan in 1956. I'oreover, the existing Induks which origin-
ated from prewar years were unable to operate as intended because of
a shortage of v/orking capital which restricted their lending operations.
The Occupation years had depleted their liquid reserves and the govern-
ment had not offered them sufficient practical help since the war. 1. K.r.'Aao. op.cit. p.l68 2. J. Bennett and S.A. Tenenbaum. op. cit. p.82 3. By -ecember 195^ out of ^9 enterprises in all industries which were
to have taken part in the Prograi-nrne only four were using new mach-inery although the remainder were alleged to have machines on order. (Zain and i ulia. Skonomi daji Keuangan Indonesia. Vol. X. p.13^) But by November 1956 only 22 out of the 82 enterprises in the Programme had received new machines and only 10 of them were using the equip-ment. (L.A. Kears. op. cit. p.36)
k. J. liennettand E.A. Tenenbaum. op. cit. p.83

90
Furthen?iore, the local manufacturers tended to look upon them as
government enterprises in competition with private enterprises rather 1
than as centres of guidance and assistance.
The administration involved in ordering and importing new machinery
was slow and inefficient because the equipment was imported by inexper-
ienced national importers. Parts of a mechanised unit which were ordered
from different countries v/ould arrive at different times or would not
fit together;^ often the imports would exceed price and design expect-
ations or would be broken in transit. In some areas there was no
electricity available and the new equipment could not be used because
the enterprises were too small to finance their own generators.^
There were also problems internal to the firm which were found to
be major obstacles. Like the Induks, private establishments suffered
from a shortage of working capital and this was found to be a frequent
cause of idle machinery. Other difficulties encountered in the
implementation of the Programme included marketing problems, lack of
managerial ability, and problem.s of attracting permanent and skilled
workersf
1. K.N.Eao. op. cit. p.l65 2. Z.3±n and Mulia. op. cit. p. 3. J. Bennett and E.A. Tenenbavmi. op. cit. p.8? k. Zain and Mulia. Skonomi dan Keua.nr;an Indonesia. Vol.XI. N0.3A.
March 19^8. pp.171, 201, and 203

91
Strong impressions were gained from lengthy interviews and many
observations in 196^-65 that indigenous weavers were not ne^.rly as
interested in purchasing the most mechanised equipment 3JS the already
well-established firms, particulcrly the Chinese ones. Here we have
listed specific technical ajid financial obstacles, but it is thought
that the vast majority of small weavers were not enthusiastic about
mechanisation because they were not convinced about its benefits and
their ability to handle it.
During this period when mechanisation and credit support to the
indigenous weaver was so strong, power weaving capacity hardly rose
at all.
Table 13 shows the very slow expansion of weaving capacity during
this period. The big increase in the number of knitting machines which
doubled betiveen 1952 and 195^ can be explained by the underdeveloped
state of this part of the industry at a time when demand for knitted
wear was very strong. It was later, after levels of utilisation of
existing capacity were high and profits were large, that power weaving
capacity experienced a big expajnsion.
The Five Year Plan, 1936-60.
The Five Year Plan, which was presented to the Cabinet in i-iay
1936, v;as designed to be the first of four plans and was to allocate 1
6 per cent of national income to investment, but only 23 per cent of
total govermnent investment was scheduled to go to industry and mining. 1. This percentage was to rise to 16.2 in the fourth plan.

92
Textile projects \vere divded between Central and Regional schemes. A The single Central Project was a 30>000 spindle mill at Tjilatjap
capable of producing 3j900 tons of yam a year. This project had been
started in 19.55 bvit it was 1957 before it was in commission. In that
year 2,l8l tons of yarn were produced and in 1958 the output was 2,800 2
tons.
The re::ional projects consisted of the Central textile Plants
(the Indu.ks) and Pilot Projects. The intention was to build a large
number of these projects and to locate then in areas where the textile
industry was concentrated so that they could encourage further private
expansion. In 1956 three such factories, a weaving Induk at Hadjalaja
in '.Vest Java, a weaving Pilot Project at Kudus in Central Java and a
knitting Induk at Maditin in East Java, were completed. No factories
were completed in 1957, but in I958 a weaving Induk at Tjeper in
Central Java started production and the building of two Induks was begun
in North Sumatra and South Sulawesi, respectively.
Du.rins; the Five Year Plan there was a further remarkable exnans-ion of loiitting capacity.^ Even during the early fifties the number of
knitting machines had increased more rapidly than the number of looms,
^t is not clear why this was so although it could have been due to the
late start of the loiitting industry and the change in clothing fashions.
~he Philippines textile industry also experienced a very large expans-
ion in knitting capacity during the same period and some ineteresting
explanations hp /e been put forward. ~ Report on the Execution of the Five Year Development Plan Covering
the Years I 9 5 6 - S 8 . Published by the National Planning Bureau, Djakarta. 1958. p.2^0
2. Ibid, p.242 3 . See Table 13'

93
L.J. Stifel says that after the first knitting factory was est-
ablished in the Philippines in 195O others followed in Schumpeterian
fashion. It is difficult to see what is meant by this because the
production techniques were imported. However, the demonstration effect
of the success of a first plajit of an entirely new process might have
encouraged others to venture into production. There would not have been
problems of finding a market in the Philippines for knitted goods.
Later, Stifel, mentions that knitting enterprises involved less initial
capital, a shorter installation period and fewer complications of train-2
ing personnel. But it is thought that this comment was made with a
comparison between knitting plants on the one hand and finishing and
spinning plants on the other. It is not certain how knitting establish-
ments would compare with weaving establishments.
The achievements of the Plan fell substantially below the hopes
of its architects. The main reason put forv/ard by manufacturers was the
presence of declining profits and, therefore, incentives in textile
manufacti;ring due to difficulties caused by inflation. J.A.C. Mackie
appraised the Plan on similar lines when he commented:^
1. L.D.Stifel. op.cit. p.37 2. Ibid, po'H 3 . J.A.C. Mackie. The Indonesian I conomy: 193Q'"63» p.26

The whole Plan depended on the avoidance of inflation and the continuation of the rising prodiiction trends of 1951-56. Both assximptions collapsed in 1957» when political turmoil sharply accelerated inflation (with a 30 per cent per annum increase in money supply from 1957-61, then a much higher h rate) ;ind threw all development plans and the budget into confusion. Some of the projects continued, but the entire budgetary process fell into disarray and the Five Tear Plan had become almost irrelevant by 1958.
In spite of the problems of ordering imported machinery, imposed
by the deterioration in the foreign exchange position, private weaving
capacity increased rapidly in 1957-58. The allocations of officially
priced yarn based on machine capacity to small and medium sized weavers
in 1956 provided a reason for investing in new equipment in these enter-
prises. But where attempts at mechanisation promotion by the government
had failed in earlier years, it was noticeable that the profits earned
during 1955-5^ by the most efficient firms encouraged heavy invest-
ment in further po7/er capacity. This bears out obsearvations during field
work in 196 -65 that the efficient^ ivell-established firm received
investment incentives through profits and then invested in mechanised
equipment.
The result of the expansion in weaving capacity v/as a further
imbalance in capacity within the whole textile industry which was
carried over to the Jilight Year Plan.
However, after 1957-58 incentives to expand capacity were re-
duced because of developments in the economy in general. The foreign
exchange roserves had suffered from the heavy importing of 1955-56
and inflation continued unabated. Drastic measures were necessary to

95
rectify the balance of payments situation and in these measures the
interests of the textile industry were overlooked. It might have been
assurhed at the time that the prosperity of the industry would continue
or that it would not suffer as much as other sections of the economy.
However, the use of an Inducement Certificate for all imports as part
of the reform of 1957 reduced the competitive position of textile raw
materials and made investment in weaving capacity considerably less
attractive.
The Sif-ht Year Flan, I96I-I968.
The second Indonesian development plan which was implemented
was different from that T/hich was intended in 1956. Whereas it was
hoped that there would be four Five Year Plans, the second plan was
extended to eight years and the targets rescheduled because of the
disappointment of the first Five Year Flan. In the textile industry,
in particular, the changes in composition of projects were very great.
I'he Sight Year Plan concentrated almost entirely on the spinning
industry and in some areas there were, in fact, ceilings on weaving
capa.city in the private sector.
1. See Chapter VII, 'Protection and the Influence of Inflation'.

96
Targets:
The final target of the Plan's clothing prograjrirae was complete
self-sufficieny in textile production at the spinning, weaving, and
finishing stages: this was defined BB a production capacity of
1,699 million metres of cloth a year, or 15 metres per head of
population by the end of I968.
Table shows hov/ this was to be programmed over the years I96I
to 1968. The figure for yarn output capacity in 196I assumes that all
the spinning equipment v/hich had sjrrived in Indonesia at that time was
in commission. The biggest increases in both weaving and spinning
capacity v/ere to come in the last two years of the Plan. The intention
of holding consumption at 10 to 12 metres per capita until 196? was
based on the assumption that such a level of output could be achieved
in 1961.^ TABLE
TEXTILE EXPAITSION ACCOFDING TC THE EIGHT YEAR PLAI
Expected Per capita Total cloth Total yarn population output production production (millions) (metres) (million metres) (1000 tons)
1961 94.9 10 949 158 1962 97.1 10 971 162 1963 99.3 10 993 165 1964 101 .6 12 1 , 2 19 203 1965 103.9 12 1,247 208 1966 106.3 12 1,276 212 1967 108.8 15 1,635 278 1968 1 1 1 . 3 15 1,699 278 Source:- I'ational Planning Bureau report. Clothing Needs in Indonesia.
. Djakarta. 20.10.64.
1. ^ ational Planning Bureau report. Clothing Needs in Indonesia. Djaiiarta. 20.10.64.
2. Calculations in Table 33 on capacity output for 1962 show that only 6 to 7 metres per ca.pita could be produced.

97
Execution:
The spread of investment expenditure over the years shovm in
i'able 15 does not correspond closely v/ith the figures for expansion
of capacity unless one assumes a lag of three to four years between
investment expenditure and the start of manufacturing. The actual
implementation of the Plan is best studied under the headings of
training, spinning, weaving and knitting, and finishing.
1. Technical training: There is provision in the Plan for the establ-
ishment of a '•'•extile High •School in j ajidung for 84 students. This was
to be finished by the end of 19^2, but by --ecember 1964 the Textile
Institute in jBajidung was still undertaking all training responsibilities.
The publicity drive ainongst secondary school students in Bandung who
might be interested in textile training had begun.^
TABLE 15
P20JECTED DISTRIBUTION OF EXPEIIDITUES ON THE TEXTILE INDU3TSY UNDER THE BIGHT YEAR PLAIv' (Bp. millions)
Total Expenditure on I961 19^2 I963 1964 I965 1966 1967 1968 expend- projects not iture fixed in time. 28,945 180 5624 2538 2538 2139 2140 (of v/hich Rp.14,705 millions will be spent in foreign exchange/. Source:- U.S. Economic Survey Team to Indonesia. Indonesia, Perspective
' and Proioosals for U.S. Aid. 1964. p. 171
1. Development of People's Industry in the National Overall Development Plan. Table of projects obtained from paper from i ational Plajining Bureau. Djakarta. 1964.
2. Interview at -extile Institute in Bandung, November 1964.
98
2. Spinning: The target for spinning was 1,700,000 spindles, of v/hich 1 130,000 were already installed before the beginning of the rlan. Of
the remainder 60,000 spindles were expected from Japan under the .'/ar 2 -Reparations Scheme, and 400,000 spindles on U.S. credit. Piatt
Brothers of the United Kingdom, sent 90,000 spindles valued at
approximately £stg.4.9 million to be repaid over a seven year period.^
Although the equipment arrived in I96I-62, it was not ready for
production in mid 1963' A contract was signed in April 1964 with
Jugoslavia for sjnother 30,240 spindles, valued at U.3.5.5 million,
to be delivered no later than the third quarter of 196?. It not
known what further contracts have been signed.
A report to the Minister of People's Industry in December 196I
stated that 194,672 swindles v/ere installed, 150,000 spindles
(including the Flatt Brothers contracts) were currently being installed,
and a further 115,000 would be installed in the near future.^ As far as
is known, by the end of 1964 the second group WSJS still being installed
and the third had not yet been undertaken: ejiother 875>000 spindles
1. Development of People's Industry in the National Overall Develop-ment Plan. Department of People's Industry, Djakarta, April 1962, p.11.
2. Interview at Department of People's Industry, 12.10.64. 3. Departmental memorandum (People's Industry) to the Minister,
20.12.64. 4 . Ibid. 5 . Unpublished data from Department of People's Industry, Djaiarta,
November 1964.

99
1 were in the blue-print stage. Therefore, by the end of the
first year of the Plan the spinning capacity targets had been
reduced from 1,700,000 spindles to 1,334,000 spindles, and by
the end of the fourth year not more than 3 +3>000 spindles were
in the country in some stage of installation or in production.
An interdepartmental report to the Minister (3.12.60) stated that 30,000 spindles were added to the spinning mill at Tjilatjap and were ready for production at the end of 1963* (List of ^roiects^Progress Report 19^3' Bureau for the Develop-ment of New Projects. Department of People's Industry, Djalcarta, 31.12.63, pp.27-9)• It has been found to be impossible to decide from the various reports whether the Tjilatjap extension has been included in the figure for spinning capacity in lable 16. There is another 212,388 st)indles currently being installed. (Ibid, ^ eport for 1964. 31.12.64, pp.3-23). 'he projects are Djakarta (30,000 spindles, should have been completed in 1963; hoped to complete 1966); Lawang- Ea^t Java (13,200; 1964; 1963);^enpasar - Bali^ (13,200; 1964; 1^66}; Tjipading - Bandung O0,132; 1963; 1965); ' etjang - Central Java (30,000; 1964; I966); Grati - East Java (30,132; 1963; 1965); Bsv jaran - Bandung (30,784; I966 is the first date mentioned for completion); Semarang - Central - ava (31,l40; 1966 is the first date mentioned for completion).

100 A report to the Minister in December 196^ (of which Table I6 is an
extract) stated that the Piatt Brothers mills, Tjipadung-Bandung, Setjang-
Magelajng and Grati-Pasurueji, were completed. Visits to these projects in the
same month revealed that this was obviously false and it might be more accurate
to interpret "achievements" ajs the arrival of the equipment in the country or
merely the signing of the contractso
TABLE 1 6 .
ACKIEVE'Ma'ITS IN THE SPINNING INDUSTRY UNDER THE EIGHT
i960
x-jjm i
1961 1962 1963 1964
P .P .K . Tjilatjap 30,000 P .P .K . Djantra-Semarang 31,528 P .P .K . Siantar (Raini) 6,000 P .P .K . Texin-Tegal 37,072 P.T . V/isma Us aha, Bandung 8,600 2,000 6,000 Nebritex, Pasuruan 16,876 T.D . Pardede, Medan 1,000 15,200 iif,8oo GKBI, Djogja 3^,000 Ba P . J . , Bandung 8,000 Tjipadimg, Bandung 30,000 Setjang, Kagelang 30,000 Grati, Pasuruan 30,000 Djakarta 30,000 Lawang, Simpuk 15,000 Bali 15,000
Total for year 17,200 56,800 126,000 60,000
Cvmiulative Total 131,076 148,276 205,076 241,076 391,076
Source:- Report to Minister of People's Industry, DjaJkarta. January
196^.
In June I963 an entirely different list of spinning projects was dram
1
up totalling 190,000 spindles • These did not include any contracts already
signed. On the bajsis of discussions with officials of the Department of People's
1. Decree of President of Republic of Indonesia. N0 . I I5 . Year I963.
State Secretariat. 2 0 . 6 . 1 9 6 3 .

-101
Industry it can be concluded that these projects v/ere to take the place of
the 115,000 spindles soon to be built plus the 875,000 spindles still in the
planning stage.
The most recent data for spinning capacity v/ere supplied by the Depart-
ment of People's Industrj^ to the Industrial Technical Centre Foundation in
December I963. The report of the Foundation stated that 223,000 spindles were
installed by that month. In the absence of further official data and with
first-h?jnd knowledge of the progress of the Piatt Brothers projects it will be
assumed that spinning capacity remained at 223,000 spindles for the remainder
of the period covered by this thesis.
3. ./eaving and knitting: The ceilings which v/ere imposed on weaving capacity
in some areas were not strictly supervised and capacity in the private sector
increased sharply in I96I-62.
Capacity for another 27 million metres of cloth production was under
2
implementation in 19^2 while capacity for another 262 million metres was
being planned. Hov/ever, the latter is thought to have been postponed by the
shortage of foreign currency. There was a brief resumption of large scale
development expenditure in 1961^.
It was hoped that knitting projects in each region, capable of producing
a total of 26,h million yards of mosquito netting, would be ready for production
1. Report of Industrial Technical Centre Fomdation P.T. D.junti, Djakarta, 21, 12,1963. p.5
2. Development of People's Industry in National Overall Development
Plan. Department of People's Industry, Djalcarta. April. I962. p.19.
3. J. A, C, Mackie. Op.cit. p.29*

102
by 1962, but it is not knovm what happened to these projects. A report
from the ^apartment of People's Industry in April I962 merely stated
that 22 enterprises v/ere being planned to produce ZG.h million yards of
mosquito netting.''
Finishing: Sixty large finishing enterprises, each v/ith a capacity of
p
15 million metres per annum, were to be established in all regions.^ Tog-
ether with the existing capacity {ss at April I962) of I38 million metres
and expected private expansion it was hoped that all domestically produced
cloth woiild be finished by modern processes by 1968.^ But it is doubtful
whether ajiy of these new state factories have been built. In April I962 it
was stated that twelve of these enterprises were expected to be built in
4 that year .
Causes of the failure of the Plan:
The principle cause of the failure of the Plan was the serious foreign
exchange position and the inability to obtain further overseas credit. But
even when some equipment did arrive there was the added difficulty of a
shortage of Eupiahs for the financing of the builidings to house government
projects. This problem caused endless delays, and in the case of the Flatt
Brothers' 90,000 spindles, v/hen the crates were finally opened, it was
found that 10 per cent of the equipment had been stolen and another 15 per
cent had rusted. 'Jhe scraping of the new equipment was expected to delay
completion of the project by another six months.
Develo'praont of People's Industry in the National Plan, op. cit. p.29. 2. Development of PeoT)le's Industry in the National O v e r ^ l Development
P ^ . Paper from National Planning Bureau, Djakarta, 196^. 3. Development of People's Industry in National Overall Development Plan.
Published by Dept. of People's Industry, Djakarta, April 1962.
Ibid.

103
A plan for cotton growing was included in the Flan but it was
recognised that requirements of imported cotton for the years I96I and
1963 v/ere not likely to be affected even if the cotton plans were
successful. In 196^ it was found necessary to hold in abeyance plans
for planting cotton over a large area while further research with fert-
ilisei-s and seeds was undertalien. The state of this research is given
in detail in Chapter VIII, 'The Textile Industry After Fourteen Years
of Support and Protection'.
An Alternative Flan.
In 1959 I.P. Andren (U.K.Industrial Advisor) set out short and long
terra plans for the weaving industry whiclrjwould increase supplies of
textiles '>7ithout resorting to a further expansion of capacity. The short
term plan would have provided 6 metres per capita and the long term plan
9 metres per capita per annum after taking account of population increases
in the meantime. This figure compares well with the targets for each
year under the Eight Year Flan. The calculations (Andren's originals)
assumed a 300 days working year where all other capacity production
figures in this thesis assujue 2^0 days s year for weaving production.
The data in Table 17 show that fixed ca-oital was to be held at
approximately the I958 level (see Table 13) but the number, of shifts
worked was to be increased by greater supplies of electricity and more
intensive use of the ATBIIs. :;oreover, the primitive handloom was to be
utilised. The more intensive use of ATBLs and ATMs would raise output
by rnoro than 80 per cent.
T^ I.P./mdren (U.K. .advisor'. foreign Ji^xchange R e q y e m e n t s . October 1959.

TABL3 17.
THE MDREN SHOffl? M D IXWG TERM PL.WS FOR ¥£AVING: 1959
10%
No. looms.
3hort term
No. Input of shifts yarn(tons)
Long Term
No. Input of shifts yarn(tons)
Gedogan (primitive handloora) 610,000 0.5
ATBM
ATM^
ATM^
119,000 1.0
9,005. 2.0
7,519 2.0
18,000 5^,000
18,000 22,500
103,400
0.5 18,000 2.0 108,000 3.0 28,350
3.0 55,750
188,100
Source:- I.P. Andren. (U.N. Industrial Advisor). Memorandum to Minister of People's Industry. Foreign Exchange Require-ments. Appendix D. Djakarta. October 1959'
The advantages of this scheme are that technical, majiageriel and finan-
cial problems of expanding capacity would be eliminated. Also, inflationary
credit expansion could be restricted by limiting new credit to established
1
entrepreneurs . On the other hand, there might be expected to be difficulties
associated with organising more shifts and further capital would have to be
invested in electricity projects. Moreover, the more intensive use of the hand-
loom industry might require stronger measures of protection. Andren's plan.
1. The unfortunate effects of inflation on the development of the industry, through uncertainty about protection and profits and confusion over government projects, have already been discussed. India recognised the dajagers of inflation v/hen she drew up her first Five Year Plan and she planned for a cautious expansion of all industries. (S.D.Mehta. The Cotton Mills of India, 185^-195^.p.212) The target of a 2k per cent increase in output of consumer goods was to be primarily achieved from a fuller utilisation of capacity. The existing capacity of textile mills v/as assumed to be sufficient for current demand while the better utilis-ation of it v/ould reduce the average costs of output. Andren's calcula-tions suggest that Indonesia is well capable of limiting new weaving capacity as did India,

105
which ^was an alternative to the desire expressed in aJ.1 the government plejis
to expand capacity, was drafted at the same time as the Eight Year Flan
but was never seriously considered. The role of the public sector.
iUl state factories were designed to act as an encouragement ajid 1
incentive to other firms to enter the textile industry. Essentially the
role of the public sector within the industry was the same as envisaged
by the colonial administration before the war. The ' entral weaving and
finishing Plants (Induks) were planned to help smaller enterprises with
technical and marketing advice, but instead they developed into comp-
etitive enterprises»
The state-owned factories originated from projects under the Proga?-
amme of 1950, the Five Year -development Plan and the Sight Year Develop-
ment Plan, and were mainly concerned with spinning and finishing. In
1937 Dutch enterprises which were taken over by the government were added
to this group. The chief reason for the empha-sis of the role of the pub-
lic sector in spinning and finishing was the large outlay of capital re-
quired for modern plants. The failure of private enterprise to move into
this field had caused bottlenecks in the production process and delays in
the import-replacement programme. Furthermore, the necessarj'j'protection 2 measures for weavers had resulted in smell profits for spinning. The
governi.ient recognised this as another reason why it should enter the field
of production. Thus, the shift of emphasis from 1. Government enterprises in the Philippines textile industry were also
planned with this in mind. It was recognised that some projects had to act as path breakers for private enterprise in a completely new field. (L.D. Stifel. op. cit. p.19)
2o Spinners' output was subject to price control and the profits made depended on the ability rf' to circumvent price control.

new increments of weaving and knitting capacity to finishing and spinning
capacity v/as accompanied by the public sector assuming a more significant
role. Table 18 shov;s the extent of government participation in the industry.
Out of a total spinning capacity of 1^,053 tons of yarn , 6,520 tons were under
the direct control of the government. The share of weaving and knitting is
only a fraction of the total.
TABL3 18.
STAT5-0V/NED TESTILS FACTORIES IN 1963. (i) (iii) Cotton spinning Weaving ^^^ Knitting Finishing
3 factories 7 factories 1 factory 2 factories Annual
capacity 6,520 tons 28.5 million 1.0 million N.A. output: of yam metres singlets
288,000 prs. socks
Employinent: ^,936 6,89^ (ii) 233 138 Source:- Office of state-owned enterprises, P.N.P.S. Djantra Yasa
and P.N.P.H. Djantra Busana. May 1965« N.B. (i) Plus one rami spinning mill with output of kOQ tons,
(ii) This includes employment in two combined weaving-finishing factories,
(iii) This includes two combined weaving-finishing factories.
Government activity v/as scheduled to have begun earlier than
actually occurred, but the influence of inflation and the huge defence share
of the government budget (especially during the Eight Year Plan) meant that
the state projects were constantly delayed and the long term plan to make
the public sector a rallying force for the weaker manufacturers and a pace-
setter in product quality v/as interrupted. Had the government included more
spinning and finishing projects in the earlier plans it might have had more
success when the budget v/ajs less burdaned with non-developmental expenditure.
1. See Table 13.

107
Technical problems of the expansion.
The most obvious technical difficulty of the expansion in
capacitj/ v;as the extra burden it placed on limited resources of
organisation al ability and skills. The low level of general entre-
preneurship has been discussed in the previous chaptdr. The greater
technical skills involved in erecting and running modern spinning and
finishing establishments contributed to delays in th$eir installation,
although foreign technicians often arrived with the imported machinery.
The resulting imbalance in growth bet?/een the spinning and weaving
industries caused special problems of protection because yarn had to be
obtained from both imports and domestic production. According to
J.C.Ghanpion 223»000 spindles would require the employment of 89 men
v/ith technical knowledge from top maintenance officers down to shift
supervisors. Indonesia might have such a number of competent technic-
ians but it is doubtful whether she has the technicians required
for the revised target of 1,33^^000 spindles. 'I'herefore, the bottle-
neck of skills has not shov/n itself because other factors contributed
to the realisation of plans falling far short of the targets.
Another problem was the availability of electricity. There has
always been a shortage of power in Indoni»»e.sia and state electricity
was laid on to factories only during the day, usually between 6 a.m.
and 6 p.m. This meant that any f; ctory whicijvjished to work three shifts
1. Letter from J.C. Champion to Soedibjo, Department of People's Indus c ry, Dj akart a, 18.3.61.
108
had to purchase its own generator, x'he initial capital investment was
large and supplies of fuel through official channels were uncertain,
^'ree market supplies were also erratic and the price sometimes
extremely high.
- t is hoped that when the Djatiluhur hydro-electric project in
West Java comes into commission there will be sufficient supplies for
industry in the Bandung region, but already some doubt has been
expressed whether household usage will not consume excessive quantities.
iUl the hc/%looms and some of the cheaper power looms, which
were generally regarded as not as efficient or as durable as ijnported
machines, were made in Indonesia. The workmanship was generally poor
and the metal parts were made from scrap iron v/hich caused the equip-
ment to depreciate rapidly. Furthermore, the low quality of precision
work caused fx-equent breakages in the yarn and time was lost in repairs.
The only advantage of the Indonesian-made looms was that in periods of
foreign exchange scarcity it was easier to obtain spare parts for them
than it was for imported looms. It was the practice of manufacturers
to draw pictures of the parts of an imported machine which were
required and a local metal workshop would do its best to imitate the
piece. This was not altogether a successful practice and manufacturers
usually suffered diappointments; but the alternative was to wait for
up to tv/o years for imported spajre paxts.
Skilled operators and maintenance men were required for the
large, highly mechanised spinning and finishing plants. The technicians

109
in charge of installing the three Piatt brothers spinning mills
received a year's training in Britain but the personnel v/ho operate
and repair the machinery must be found e_mongst Indonesian-educated
techniciens. So far there ha^ been no great difficulty in this regajrd
but this may be because little of the plejined capacity has been in full
operation.
Obstacles to expejision of fixed capital.
In spite of the very large increases in capacity recor#ied in
- 'able 13 the various measures taken by the government have enjoyed
only a part#ial success. Officers from the Department of People's
Industry- were disappointed by the response to the nechanisation of Small
Scale Industries Programme, while spinning and finishing remained
inadequa.te for weaving capacity because the implementation of
government projects suffered such long delays, //eaving capacity
expansion begaji ver:/ slov/ly and it was only in 1956-57 and 196l-c2
that lajrge increases were recorded.
^rom the chaos of frequently changing government regulations
and the fluctuations in the economy it is not possible to extract a
clear picture of the causes of these failures, but those obstacles
which have been held to be the main causes will be examined and
tentative conclusions drawn.
1. Interview at Tjipadung (Platt brothers) factory. 19.11.6^.

110
Shortage of foreign exchange:
1 The lov; rates of utilisation of weaving capacity would indicate
that foreign exchange for new fixed investment was not an urgent
requirement for a large section of the industry. Until capital 2
equipment is being used at near full capacity there is no strong
reason to expect the industry as a whole to expand.
The modern spinning and finishing sections have consistently
operated at high utilisation rates and because they constitute bottle-
necks in the production process it might be thought that this indicates
a shortage of foreign exchange. In the sense that the weaving section
was strongly promoted and allowed to appropriate much of the foreign
exchange made available to the textile industry there was a shortage of
funds for the spinning and finishing sections. It is also true that it
was difficult to acquire oversea^s credit for large single investments
which modern plants in these sections required. The Japanese //ar
iieparations, v/hich were set aside chiefly for the textile industrj-- and
which might well have been used for large outlays on plant, were seen
by the government as an opportunity to provide indigenous manufacturers
with a few looms each. But to the extent that the foreign exchenge
which was spent on weaving capacity was not purchajsed by aspiring
spinners, the reluctance to make these investments was a problem of lack
of entrepreneurship because protection was less of a problem than for
the weaving industry. 1. See Table 29 for data on capacity utilisation rates. 2. See Appendix B for a discussion on capacity utilisation rates at
v/hich further investment becomes desirable.

111
There v/ere also occasions when foreign currency was used
inefficiently and imported fixed capitel remained unused for long
periods of time. Equipment obtained under the Mechajiisation Pro. rarirne
v;as sometimes left idle for various reasons for several years. The
90,000 spindles from Piatt Brothers ren:ained in crates for nearly
tv/o years.
• Hence, for the industry as a whole it cajinot be assumed that the
expansion of capacity v/as delayed by a shortage of foreign exchajige
although there v/ere individual years of serious balance of payments
difficulties v/hen new capitsl investment was forced to come to a halt.
Hoxvever, it is not completely satisfactory to construe underutilisat-
ion of existing capacity as an infdication of sufficient supplies of
forei,gn exchange for imported equipment. In en industry such as the
Indonesian weaving industry, in which levels of efficiency vary
greatly, some weaving enterprises ¥/ill be producing at near full
capacity while others will be using on3.y a fraction of their capacity.
In this case, individual manufacturers might find it profitable to
expand end, for various reasons, prefer not to purchase the unused
equipment of other weavers; nor might this equipment be offered to
them for sale because of the valuable yarn allocations attached to a
weaving licence. This variation in production perfor-iance must account,
in large part, for the big expansion in 1956-57 and I96O-6I which
follov/ed years of effective support and protection in spite of the
fact that the industry as a whole was still using less than helf its
capacity. For those efficient manufacturers there might have been a

112
real lack of foreign exchange to purchase new equipment particularly
in 1957 which v/as a year of austerity.
if some v/eavers v/ere able to utilise nearly all of their capacity
it is pertinent to enquire v^hether it was a shortage of foreign
exchange V7hich reduced most of the weaving industry to low levels of
capacity utilisation. Again, there is little reason to believe that a
shortage of foreign exchange kept the weaving industry at between
20 and I-O per cent utilisation for most of the time, ^ata presented
in Table 19 show the share of foreign exchange spent on all textilei
materials which was apportioned to yajrn imports.
TABLE 19.
VALUE CF IMPORTS OF FINISHED TSXTIU^S A^m YAM'J 1932 - 39»
(millions of dollars)
Finished Yarns
textiles
1952 156
1953 Iif8 18
195if 110 20
1955 87 2k 1956 105 26
1957 88
1958 k? 18 1939 28 21
Source:- Unpublished paper, Djakarta. May I963.
I f the domestic weaving industrjr had had first call on the total
foreign exchajige recorded in Table 19 there would be little or no
underutilisation of v/eaving capacity although much of the cloth produced
domestically would have been poorly finished by cottage processes.
1. See Chapter V, 'Supply and Distribvtion of Jrcaw Materials'.

113
From this analysis it would seem that the failure of the
textile industry to successfully utilise its capacity and expand
further cannot be attributed to a lack of foreign exchange. Of the
other likely reasons for the failure the most obvious is inadequate
protection from overseas competition.
Inadequate protection:
It was noticeable from the data on capacity that after a period
of high levels of activity in the industry there was an increase in
the rate of expansion. Interference in, and protection for, textile n 1
raw materials in 195^-56 and in 1958-59 were followed by periods of
large increments of new capital investment in spite of the prevailing
economic difficulties. Conversations with manufacturers often led to
criticisms of foreign textiles supplies to the domestic market, and
complaints about the government's protection policy were accompanied
by assurances that, given guarantees of high levels of activity, there
would be further new investment and re-investment. liven when small
scale Toroducers v/ere prepared to sell their capacity licences
manufacti;.rers "oreferred to purchajse new equipment because of the more
up-to-date production methods and cheap bank credit which was avail-
able for overseas purchases. Furthermore, many of the large manufact-
urers aiready controlled the smaller firms financially, and transfer-
ing capital equipment from one licence holder to another would not
increase the total amount of official yarn allocations received by
the individual larse manufacturers. 1. See Chapter VII, 'Protection and the Influence of Inflation', for
a more detailed exaiidnation of the kind of protection applied.

114
The lorir.al protection policy v;as partly undermined by the
discriminatory nature of the government's credit policy. That section
of the textile industry which was most closely competitive with over-
seas producers v/as almost entirely in the hands of the Chinese who
were not permitted to enjoy the very cheap bank credit policy. The
Chinese producers were forced to resort to the private banks or to
moneylenders whose interest rates were several times as high as those
of the state banks. Indonesian v/eavers could enjoy the lo?/er rates
only if they met certain standards of credit-worthiness and their
frequent inability to do so was one of the reasons why so much of the
cheap credit was obtained by the new class of Indonesian trading
agents. Especially in the relatively easy business of importing was it
easier for indigenous entrepreneurs to show greater credit-worthiness
than in manufacturing industry.
Although the Chinese manufacturers could benefit from the cheap
credit by indenting the Indonesian importer for yarn, he found it
difficult to compete with the profitability of cloth imports because
his factors of production (other than yarn) were sometimes purchased
on high cost credit.
iinother reason why the prevailing protection policy provided
insufficient incentive to the individual entrepreneur to invest in
fixed capital was the frequent changes in trade regulations and the
influence of inflation on existing measures. Private bankers and
Indonesians were not keen to invest while protection appeared to be
so erratic. A stock-broker sumujed it up by saying:

115
'Indonesian industry depends on imported raw materials. Imports depend on the volume of exports thjj-ough legal channels, and that is just too uncertain*.
One private banker would only make long term credits if they were
guaranteed by the government, because as he said:
'the regulation of imports is controlled by the government, not by me'.
In 1958 almost all new investment in fixed capital was stopped.^
The rapid development of the Philippines textile industry has
been attributed to import controls by L.D.Stifel. Protection in this
case was affected not by tariffs (or surcharges) but by quantitative
restrictions which provided a high rate of return on investments in if the industry.
1. J. Bennett and S.A. Tenenbaum. Indonesian Industrial Financing.p.42 2. Ibid. p.68 3 . Ibid. p.^O 4. L.D.Stifel. op.cit. pp.37> 40,6l.But the Philippines textile ind-
ustry developed imbalances as a result of the pattern of quantit-ative restrictions. These imbalances appear to be in the opposite direction from those prevailing in the Indonesian textile industry. In the case of the latter, weaving developed rapidly because of s:naller capital outlays and less complex processes, causing a bottleneck in finishing. In the Philippines, spinning and finishing capacity increased rapidly v hile weeving lagged behind so much that unfinished cloth was imported in order to keep the finishing factor-ies in production. Stifel believes the Ihilip^Dines imbalance was caused by unco-ordinated tariff and quantitative restriction policies, lie also mentions that central bank credit provided inc-entives to those entrepreneurs wishing to integrate weaving and finishing in one shed, . fter 1957 the tariff on yarn was much higher than the tariff on woven fabrics, and this difference was bound to stir,:ulate investment in finishing capacity unless other factors inter^/ened. The tariff on yarn wa- 35 per cent, and the tariff on woven fabrics was 10 to 25 per cent.

116
It would appear that, in the absence of a discriminatory credit
policy, protection along the lines of quantitative restrictions is
more necessary in an inflationary situation than otherwise. But, in the
case of Indonesia, the presence of inflation, the erratic nature of
protection, and the failure to sillow the most efficient section of the
industry to compete with imported textiles on equal credit terms
contributed to weakening the incentive of entrepreneurs to invest more.
Limited managerial ability and absorptive capacity:
:ie have noted the failure of the textile industry to respond to
a generous credit policy and the effect of the indigenous promotion
policy on the competitive ability of the industry. Because of the
emphasis placed on this policy it is v/drthwhile examining the reasons
why a smaJ.l established class of Indonesian manufacturers failed to
emerge. J.P. Meek, v/riting on the Benteng programme and its degree of
success pointed many times to the lack of experience of the new group
of entrep|peurs and stressed the importEnce of management training,
particularly in marketing.
It is apr^ropriate to quote the Indonesian economist who was at
the centre o~ all economic plajas and rionetary affairs during this period
and who was more involved in policy fon\ation than any other man.
The former Finance Minister, Sumitro Djojohadikusumo said:
1. oT.P. i.eek. The Government and :^conoiric Qevelooment in Indonesia
1930-3^- pp.273-5.

117
In reference to capital expenditure I cannot fail to make the following remark. There is a widespread assumption in this country that many problems v/ould soon be solved if only the necessary equipment, machinery and other capital goods, were available. The rush for mailing rather indiscriminate commitrbents for the purchase of capital goods can -oartly be traced to such belief. We have experienced to our bitter disappointment hoiv-ever, the capital equipment purchased resulted in actual capacity loss just because no account was taken of the organisational prepajrations and ^ills required to generate capital expendit-ure' into really productive results. I v/ould consider for the next five .years, the problem of human investment o; equal import-ajice as capital investments, if not more important.
The Benteng programme was designed to offer special financial
facilities to the indigenous, weal:er commercial and production groups
while the i echaiiisation of Small Scale Industries Prograjnm.e was intended
to improve their efficiency ajad thereby help them to be more competit-
ive with other sections of the economy. Apart from some effort at
training managers to hanlle the new machinery the Mechanisation
Programme did nothing to overcome the poor quality of majiagement.
The expected response of indigenous managements did not eventuate
from the programme and the additional problems of an inflationary
situation made it even less likely to emerge as the years passed. The
experi raent v/ith deficit-financing showed that cheap credit does not
always overcome backwardness because the absorptive capacity of
managements for credit is limited. The low credit-worthiness of applic-2
ations received by the Credit Foundation and the very poor record
of reoa;;,'rients suggest that the volume of credit actually extended was
greater than the handling capacity of many indigenous managements 1. Sumitro Djojohadikusumo. Ekonomi dan Keuangan Indonesia. Vol. VI.
Ja-nuc.ry 1953, P-10 2. See Appendix A.

118
ig warranted. It is difficult to see any Indonesianisation policy beinc
successful until entrepreneurs are trained in the fields of finance
and marketing.
•f the government had distributed its deficit financed credit
policy on the basis of merit the Chinese manufacturers would undoubt-
edly have been in a stronger position by the end of the 1950s. The
overall efficiency and competitive ability of the textile industry
would also have been greater. However, it is not certain whether this
different textile industry would have been able to compete very
effectively in the long-run against the import sector. All that can be
concluded is that more credit would have been absorbed in fixed capital
and less in importing finishet^^nM® actually occured.
Some effort has been made in training indigenous managers
through Advanced i' anagement Programmes but these have been concentrated
in the universities and their facilities used mainly bi large entre-j preneurs, Army officers and University teachers.
1. Another aspect of the poor entrepreneurial ability which weakened the new industry was the tendency amongst Indonesian manufacturers to purchase handlooms. One' of the complaints of the technical personnel v/orking in the i-IechBhisation Programme was that indigenous entreprengiiS preferred handlooms because they were easier to use and less troublesome if they broke down. The handlooms produced 8 metres of cloth a shift while the powerlooms could produce between 20 and 28 metres each, i ach handloom required a worker* but two power looms could be supervised by one person. Electricity provided by the government was very cheap. vVith cheap credit there is little doubt hov/ the Chinese and larger Indonesian manufacturers would have invested their funds.
2. j: Panglaykim. Far Eastern i:conomic Review. Vol. XXT/II. No. 13. 3e;otember 27, 1962. pp.609-11

119
Difficulties of working capital:
•Ihe finajicial weakness of large sections of the industry, the
origins of which were explained in Chapter II, continued in the 1950s
and were reinforced by the inability to obtain state bank credit.
Appendix A shows how the more profitable and more reliable of the
(Indonesian) enterprises were able to acquire this cheap credit. The
main role of Bank Indonesia was to control credit to the foreign trade
sector because of the lack of other forr s of direct control over imports
at a time when inflation increased importing profits. Often the
importance of this function led to the neglect of credit facilities
in the production sector. Some state banks were instructed to specialise
in small scale establishments but because of the greater profits else-
where they failed in this function. The alternative source of credit
for unsuccessful applicants was a great deal more expensive.
Even when special attention and assistance were offered enter-
prises iinder the Mechanisation Pro;;;;ramme it was noticed by field officers
that one of the main reasons for the failure to use new equipment
installed under the Programme was the lack of working capital.
In those firms which had invested in new equipment, the expansion
contributed towards straining the liquid resources required for work-
ing capital. This, in itself, acted as a disincentive to expand
furt'ier. The saine problem was observed by L.D. Stifel^ in the rapid
T. H.K.Charlesworth desc^rbed the primary function of Bank Indonesia as the concern of the foreign trade sector which meant that its credit policy 'has been conditioned by the extent of import requirements necessary for the economy'. (H.K.Charlesworth, A. Banking System in Transition, p.174)
2. L.i^.Stifel. op. cit. p.101

120
development of the Philippines textile industry during the same
decade, -e claimed that the liquidity of the firm had been strained so
much by investment in fixed capital that its ability to secure
additional credit for working capital was severely limited. In the case
of Indonesia this was aggravated by the reduced credit facilities
accompanying the expansion of 1957 and I96I-62 which followed the
prosperous years of 195 —56 and 1959-60.
Ihe shortage of working capital in the cooperative sector (the
Induks and the cooperatives) caused the failure of that sector to
offer the marketing and credit facilities which were intended to
provide suitable incentives for expansion.
In the public sector the shortage of public funds to build
factories for machinery has been apparent in the spinning industry.
All government projects have been delayed through inadequate budget 1
appropriations to meet rising builidng costs.
Conclusions.
The textile industry was chosen by the Republican government as
an important vehicle for industrialisation because of its employment
creating potential, the simple techniques, and the small units of
investment in the weaving industry. J-'he last was the reason why
weaving capacity continued to expand while spinning and finishing
capacities lagged far behind. 1. Interview at National Planning Bureau, Djakarta. 11.12.6^.

121
Spinning capacity increased by about 180 per cent between 1952
and 196^ v/hile v;eaving capacity increased by almost I50 per cent betv/een
1950 and 196^.
xhe chief policy instriainents used to encourage this growth were
protection and cheap credit to the Benteng group, but the different
prograiTirnes and plans since 1950 were not very successful in reaching
their specific goals in either the public or the private sectors. The
"Mechanisation of Small Scale Industries Programffie affected only a few
enterprises and these were not amongst the smallest establishments
as was intended.
The v/eaving and knitting sectors were more successfully exoanded
tharjajiy other part of the industry but the aim of placing the weaving
sector on a mechanised basis was undermined by the tendency of those
receiving support to invest in handlooms. The spinning and finishing
capacity inadequacies were allowed to continue without intervention
by the government until the Sight Year Flan, but t . by 19^2 the
govern!i:ient's finances were so disordered that the projects in the Plan
were only partly implemented. As a result these deficiencies still
existed.
The overall expansion of the industry was due to periodic spurts
of investment in the private sector, largely by Chinese manufacturers,
follov/ing a year of strong activity in the industry.

122
In spite of frequent complaints from civil servaxLts and Ministers
of a shortage of foreign exchange for the development of new industry
it appears from analysis that this v;as not an important obstacle to
the expansion of the textile industry. I uch more da^r,aging appeared to be
the v;esJ-cness and erratic nature of protection policy which undermined
the confidence of manufacturers and banlrers in the future of the
industry. The governraent's credit policy founded on racial
discrimination contributed to this by effectively subsidising imports
of cloth v/hile the more efficient sections of the weaving industrj^
were forced to resort to the free market for much of its borrowed
working capital.
The chief reason for the failure of the indigenous section of
the industry to respond to the generous assistance programmes v/as the
lovj quality of entrepreneurial ability which was described succinctly
by the former Finance Minister, Sumitro Djojohadikusumo. The limited
v/orkii'ig capital resources were part of this managerial problem but
this wajs aggravated by a range of levels of credit-worthiness.
The next chapter discusses in r.ore detail the range of managerial
efficiency end costs of production and demonstrates the effect of
inflation on this range.

123
niAPTER IV
CCSTS Ai:D DIFFSSSNCES IK COSTS
One of the difficulties of raalcing generalisations about the textile
industry is the very great variability of size, degree of mechanisation,
managerial abilities, and financial resources. A report in 19^5 on text-
ile industries in the EGAFS region pointed out that because of these
differences it is impossible to arrive at a general estimate of average
1
manufacturing cost. There are numerous combinations of cost differences
and the industi'^y might well be regarded as being composed of a number of
separate sub-industries. However, analysis along these lines would be too
cumbersome while the ever changing composition of the industry would
cast doubt on the validity of conclusions drawn from such an analysis.
I'oreover, some of the inputs, such as management and labour, v;ould be
difficult to quantify in periods of underutilisation.
In this chapter the source of cost variations and the likely differ-
ences in magnitude of costs will be exainined. Inflation affected various
costs of production in different ways ajid it was inevitable that, with
initial differences in composition of production costs, a long period of
inflation v/ould have a varying effect on firrris. It will be demonstrated
here that inflation had a polarising effect on the weaving industry: the
widening of the range of final cost per unit of output and the strength-
ening of a snail but very efficient large scale section. This polarising
effect has helped to distin^juish those sections of the industry which sTe
most capable of competing with overseas manufacturers from those who
1. Sectoral Study. Textile Ind;^tries. Asian Conference of Industrial-
isation. EC/iFS Conference, po87»

124
appear to have peraanent features of weakness and inefficieny, because
inflation has-had a v;orse effect on small firms than on large firrns.
This land of study is important because the different cost struct-
ures present the government \7ith problems of protection and support. If
it applies one criterion to the whole industry^ on matters. such as
credit and the supply of price controlled raw materials, the benefits
will not be uniformly distributed over the whole industry. 'The profits
in some firms v/ill be disproportionately large and will help to re-
inforce the favourable financial strength of those same firms since
the efficient firms tend to be the financially sound ones. Therefore,
if protection and government assistance are designed to benefit all sect-
ions of the industry uniformly they must be discriminatory. Conversely, if
the aim of the policy is to improve the competitive ability of the industry
the weal-c elements can be eliminated by a un&orm protection policy.
JTurthermore, recognition of wide variation in costs offers a suit-
able introduction to the study of the manipulationsin the supply of raw
materials in Chapters V and VI.
Throughout this thesis the textile industry has been assumed to be
divided into sections whose degree of efficiency varies directly with '
size of operation. This has been done in the belief that organisation,
marketing and financial benefits on the one hand, and size of establish-
ment on the other, are closely related. Both were brought about by good
management in the past. The efficiency in all round organisation enabled
a firm to expand faster than others begun at the same time. There can be
advantages in marketing and finance also directly caused by size: for

125
instance, a large output might brin^; about economies of t%nsport and
selling, as well as inspire greater confidence in banlcers and private
mone^rlenders. - ut experience in the Japanese small scale v;eaving
industry vrould suggest that the cartelisation of enterprises (or the
activity of really effective cooperatives) can go a long way to mailing
marketing and financial costs independent of size.
•""here are no data on costs which can be drawn upon to prlve this
hypothesis of correlation, but it is supported in this thesis by the second
description of the origins of the industry given in the^chapter and
by corroborative explanations and descriptions of the industry offered
during interviews in 19d4-65. Strong impressions were gained during
these interviev/s of tv/o typical establishments: the large, efficient
Chinese firm and the small, inefficient Indonesian enterprise. In this
lengthy chapter recourse is made to cost investigations in other count-
ries and conclusions are argued on the basis of characteristics noted
in Indonesia.
However, it should be pointed out that there can exist some small
(new) entrants which are more efficient than larger ones. For most
purposes of this thesis these nev; . enterprises might be
classified as 'large'. Conversely, a large factory with chronic
financial problems and poor marketing and general administration might
not be capable of continuing production. But because of the high
degree of correlation between actual size of operation and degree of
efficiency 'large' and 'efficient' are used synonomously.

126
It should be said that under certain circumstances a small scale,
or cottage, industry can enjoy lower costs, especially on capital costs
1
per unit of output. M.Dobb describes the chief characteristics necess-
ary for this situation. With cheap labour a low capital-to-output ratio
can prove highly profitable. If the opportunity cost of labour in a coun-
try of excessive labour supply is zero then that employment might as v/ell
be utilised, however inefficiently. But it is possible to reach a point
where the marginal product of labour is zero. Further employment will
increase wage costs without increasing output. If the practice of employ-
ing labour-intensive techniques is easily accepted it is sometimes diffic-
ult to stop recruitment at the point where marginal product is zero. Full
time emjjloyment of entire households of small scale weavers on a fev/ hand-
looms might be such a case. Furthermore, the acceptance of labour-intens-
ive methods is not by itself a guarantee of a low capital-to-output ratio.
production technique can be so inefficient that the little capital
used is costly in relation to output.
^t v;ould appear from extensive observations of levels of activity
in Indonesia in 196^-65 that the large enterprises were able to produce
at much less cost than the small ones. Thus in a situation of permanent
scarcity of raw materials where most of the available supplies go to the
most efficient producers the labour-intensive producer, in effect,
©xpGPidicss s.
high capital—to-output ratio because of long term underutil-
isation. Admittedly, this is not the typical example v/here a government
sets out to -olan a new industry and must choose between two methods of 1. H. Dobb. Economic Growth and Underdeve"^ oped Countries, p.^6.

127
production, but it does reflect the dilemma of the present Indonesian
governinent which faces aji industry, en-ibracing both labour- ajid capital-
intensive techniques, v/hich has over-expanded in relation to the country's
capacity to maintain it fully utilised, "iven this over-expansion, the
free price mechanism and the shorta;e of yarn, the small scale weaver
does not h3ve a very low capital-to-output ratio. There might also be a
case, if supplies of raw materials increase, to expand the mechanised
section v;hile leaving the unmechanised section completely idle. Sut the
exploration of this suggestion goes beyond the scope of this thesis, nere
we are concerned with existing differences in costs of the two sections
of the industry.
Finally, if a small scale producer is unable to reach the standard
of quality of output of the mechanised process this might well have a
derogatory effect on the competitive position of the industry, and there-
fore, on the balance of payments.
• 'here are, hov;ever, two more reasons in support of retaining labour-
intensive production technioues. First, it is often possible to increase
the level of employment at which the marginal product is zero by re-
organisation and better administration as well as by improving the quality
of labour. This could be done in the fields of specialisation of jobs,
finance, marketing, and standardisation of quality. All these factors
have been recognised by past Indonesian governments but little and err-
atic effective support has been given them. Nevertheless, it is worth-
while noting the ability of the Japanese small scale weaving industry to
survive profitably into the early 1950s elongside large and highly mech-
1.. See --hapter IX, 'Conclusion'.

128
1 anised factories. G.D.Allen has shown how factors favourable to small
scale production were turned to advantage in the Japanese textile
industry v;here the niAinerous small v/eavers were brought under huge cartels
v/hich
v/ere responsible for credit—raising, purchs.sing of ra.w rnateria.lsj
r arketi ng of clotn^ directing specialisation of productj and maintain"
ing stajidardisation of quality.
Second, even though wages are greater than returns in a certain
industry, that saiTie labour declared redundant would still have to be
kept by the community, either through the family system or by direct
government subsidies, unless nev/ employment opportunities were created.
In poor countries where wages are little more than subsistence payments
the social and economic costs of unemployment might be alm.ost as much as
wages ;oai.d in employment. Concern with the increased cons amption arising
from greater employment v;ould not be relevant in this situation, ^t would
be m.ore important to consider the effects on total national output of
em.ploying limited capital n ost effectively in one industry, or in one
part of ail industry, rather than in another.
This thesis does not attempt to generalise about all small scale
indus :ries: it mereljr studies the situation of the Indonesian small scele
weaver. Indeed, if any generalisation can be made it is that all small
scale industries must be judged on their ov;n merits and against the
particular economic background in which they are found. This chapter
demonstrates v/hy, in the case of the Indonesian textile industry, there
is reason to believe that the advantages of small scale activity are
outweighed by other influences. 1. G.D.Allen. Japan's Economic Recovery, p.

There is no available information on size of majiufactiiring establ-
ishments according to plajit capacity but there are data on size according
to numbers of persons employed in firras using power. Table 20 shows
this distribution for textile and total manufacturing industries. 3ven
amongst enterprises using power equipment there is a large range
of sizes and only a very small proportion employ more than 200 persons,
although this is higher for textile manufacturing than for total manufact-
uring. ^f non-po\ver equipment v/ere included in these figures the
smallest sized firins vro uld be a great deal more ntiraerous thaji in Table
20 and would very likely indicate that textile manufacturing was more
heavily concentrated in small establishments than was total manufacturing.
TABLB 20
NUI-jBSRS OF SSTABLI.SHJffiimS IN TS^TILE AMD TOTAL M/JTOFACTUSING AT SKD OF 1961, 3Y iWiSSF^ OF PERSONS H-IPLOYBD.
Textile manufacturing Total manufacturing 0 - 4 3 TTWf 5 - 9 27 3 ,012 10 - 2k 190 3,990 25 - ^9 260 1,878 50 - 99 213 1 ,033 100 - 199 1^0 573 200 - ^99 66 231 500 & over ^ 102 TOTAL 1 , 1 0 6 12,263 Source:- Statistical Pocketbook of Indonesia I963, pp.110-11.
As size of operation is regarded as being correlated with levels of efficiency in adminisi^tation, marketing and finance it will not be
regarded as a separate cost influence but rather as a factor included in
other costs and, therefore, will be discussed only in reference to them.

130 It is not the purpose of this chapter to demonstrate hov/ size of
opex ation in time led to differences in costs. All that is intended is
to explain cost variations as they existed at the beginning and at the
end of a period of inflation.
This chapter v;ill be divided into tv;o sections. First, the differ-
ent sources of cost differences and the effect of inflation on them will
be analysed. Second, an assessment of total cost differences and the
effect of inflation v/ill be made.
Sources of cost differences and the effect of inflation.
This section begins v/ith fixed costs,
managerial ability:
i. Differences in attitude to commerce:
The main stratification of managerial resources in Indonesia is
along the lines of racial background of the owner-management. The origin
of these differences was described in Chapter II and the impression
gained during interviews was that rauch smaller differences in managerial
quality arose v;ithin the racial groups. The dominance of the Chinese in
commerce sjrid production rests on their historical business role in the
countries of their adoption. Like the Chinese in the Philippines textile
industry they have developed their ov;n trading and financial associat-
ions and v/ork in cooperation v;ith each other to a much higher degree than
do their Indonesian cou.nterparts. Their attitudes tov/ards saving and re-
investment are very frugal in comparison with the Indonesian manufacturer.
Children are expected to talce over the parents' firm and are trained at
an early age to be fit to do so. Although it is true that family
1. L.D. Stifel. 'The Textile Industry. A Case Study of Industrial Develop-ment in the Philippines, pp.12, 15, 16, 25,

131
inheritance of a business is equally strong amongst Indonesians, the
Chinese father emphasises the importance of business acumen and financial
security while the Indonesian father is primarily concerned with the
fejiiily's social status. The cultural origins of most Indonesians, espec-
ially the Javanese, also make them reluctant to enter the fierce compet-
ition of the business world. 1
The Eenteng programme of the 1950s was not rigorously adm.inistered
and did not include a management training course. The lack of official
concern for the cares of running an enterprise was amazing considering the
totally inexperienced background of most of the aspiring Indonesian busin-
essmen. One of the main internal factors hindering the success of the small scale mechajiisation programme was the lack of managerial skills amongst
2
the xndonesicjii,
vuality of output v/as a very important consideration in Indonesian
clotii production because cloth imports were generally regarded as superior.
Any producer who built up a reputation for constant high quality output
would have fev/er marketing problems. The cooperatives were never able to
standardise the quality of output of small scale weavers as the majiagement
of Japanese textile cartels did for their smaller members.
•'''ery few of the 48 manufactu-rers interviev/ed in - ajidung and Had-
jalaja attempted any kind of production and quality control and all those 1. This is dealt with in more detail in Chapter III, 'Government Plans
and the -^cpansion' . 2. "/.h'ulia. Skonomi dan Keuajigaji Indonesia. Vol. XI. No.3/4. 1958'P*201.

132
who did v/ere of Chinese origin. The sample was admittedly small but the
difference between Chinese and Indonesian in attitude towards the idea
of regulating the pace of production and checking the uniformity of qual-
ity was overwhelming. Some of the lai-gest of the Indonesian manufactur-
ers assumed the production practices of the Chinese although it was sur-
prising to learn that one of the leading Indonesian manufacturers in
Madjalaja existed almost entirely by selling his yarn allocations on the
free market during 196 -. ^t might well be impossible to find a large
scale Ghinese weaver in the v/hole of Indonesia who did this.
The rapid rise in costs placed a strain on these low managerial
resources and had a profoundly demoralising influence on many entrepren-
eurs. The result was an increased readiness to sell allocations of yarn.
It is not an entirely satisfactory explanation of the apparent
differences in managerial efficiency to conclude that Indonesians lack
the business cunning of the Ghinese. The ability of the small Indonesian
trader, who carries his wares on his back, to make a living in a situat-
ion T/here his costs and prices are rising erratically, but on average 10
per cent a month, suggests that powers of business calculation and market
discrimination are not just latent, but are used every day as a matter of
personal economic urgency. The highly developed bargaining tradition of
the Indonesian is legendary. The suggestion is put forward here, that
the Indonesian manager is basically no less capable than his Chinese
countei-part, but that his motivation to work harder does not correspond
with that of the Chinese. The Indonesian is accustomed to using his
business acumen v/hen his basic needs require it; the Chinese will

133
use it ai eJLl times. The demonstration effect of Chinese success on the
Indonesian haS very likely not yet become fully effective and the result
is tha apparent differences in managerial ability.
2. Finajicisl c ompe tence:
After competitive imports and the Depression had effectively
diminished or eliminated any resources they might once have held, Indon-
esians came to rely on the resources of others to start their textile
enterprises. Several maniifacturers, interviev/ed in Bandung ajid 'iadjalaja,
stressed the fact that amongst the Indonesians, efforts of fund raising
were directed towrards the purchase of new equipment and it was generally
accepted that the running expenses of the new production methods would be
met in the same way as those of the former low productivity method. There-
fore, while the sale of rice fields and other possessions contributed to
the purchase of fixed capital the first batch of raw materials was usually
obtained on credit. The need for loans in order to obtain a maximum re-
turn on fixed investment placed the entrepreneur in a dependent position
from v;hich his lack of experience in niodern methods of production and
management made him unable to extricate himself.
The next goverament-sponsored attempt (in the 1950s) to encourage
Indonesians to enter the textile industry was no more successful than the
earlier one in improving their financial, basis. Although the plant and
machinery were installed on generous bank credits, the working capital
was usua2.1y obtained from private lenders because Indonesians could not
meet credit-v/orthiness requirements of the banks, and the Indonesian sector
today appears as much in the debt of the Chinese traders as ever.

15
•t is, admittedly, very difficvilt for an entrepreneur to succeed
in Indonesia if he begins v/ith heavy debt and does not meet the credit-
worthiness requirements of the banlis, but the financiaJ. incompetence of
many of the entrants into the textile industry since 1950 was so great
that access to cheap bank credit might not have been of Kuch help. The
inclination to spend profits rather than re-invest is very strong and
v/ould probably have been equally, or more, effective if abundant cheap
credit had been made available.
Inilation aggravated this situation by making the financial aspect
of management more complex and by increasing the difficulties of achiev-
ing profits from working capital bortowed from the free lending market.
This is discussed in more detail under 'Working capital*.
3. Personal relationships:
Another factor which influences management is that business in Indon-
esia is very much a matter of personal friendships and contacts. This is
primarily due to the skill exercised by management in the past. 'The ad-
vantages of a widely flung netv/ork of contacts arise in acquiring greater
knowledge of the money market and of the availability of supplies of raw
materials and finished cloth on the aarket. Especially in the fields of
bank credit and seeking official allocations of raw materials was it
apparent, from interviews, that an established relationship V'/ith the supp-
lier was very important. The greater knowledge of activity throughout the
economy as well as in the textile industry provides the well organised
large scale entrepreneur v/ith a very substantial advantage over the uealc,
1. The emergence of a large nuriiber of malafide Indonesian producers and 'briefcase' importers v;ould suggest that this has, to some extent, been shovm to be true.

135
small scale firm, particularly during inflation when there is an element
of uncertainty about the profitability of production.
Marketing practices:
1. The high costs of marketing in Indonesia:
Because of the historical, entrepreneurial wealcness of the small 1
scale manufacturer, the marketing of his produce is invariably perfor:;;ed
by traders who us ually finance his production also. Unlike Japan, where
small firms are concentrated and cartelised, the Indonesian small scale
producer is very much on his own and completely exposed to chajiges in
the free market for credit ajid sales. His financial wesJcness has meaaat
that he cannot become his own trader should a new market become obvious
to him. Moreover, the monopeonistic power of the trader (v/ho acts as his moneylender also) is maintained, in spite of the large number of traders, because of the well-established creditor-debtor relationship between the txTO. Together v.rith geograp hicel divisions and inadequate knowledge, the
credit market and, therefore, the sales market, emerge as very imperfect
markets. The costs of marketing are incorporated in lower sale prices 2
and commissions. It v/ould be impossible to assess how much the small scaJLe
producer pays for sales service acquired in such an imperfect market.
In similar situations in Malayan smell scale industries, S.K.Fisk
has pointed out that however exploitive the middleman is the small producer
needs him because he has not the resources to provide various necessary 1. See Chapter II, the section on Entrepreneurial >7eaknesses. 2. The Mechanisation of Small Scale Industries Programme encountered
difficulties in extending its aid because of marketing problems.7here marketing outlets were poor the incentive to invest in mechanisation and more efficient production processes was low. This was one (^cious circle. (W.Mulia. Zlkonomi dan Keuane^an Indonesia. Vol.XI.Mo3A. I958. p.201).

156
services for himsp^f. First, imported supplies of raw materials involve
large ajiiounts of capital as well as knowledge of their overseas sources.
Second, there are some technical points which are beyond the capacity of
the small v/eaver, but which can be efficiently performed by a middleman
ser^/icing a group of weavers, i'hird, marketing and storage facilities 2
require working capital , and a knov/ledge of the consumers ' market.
Mthough the Chinese trader is known to be painstaking and efficient
in his ov/n environment, it is by no means certain that the marketing systen he is part of is as efficient as its European counterpart.^
L
J. Panglaykim has illustrated frequently how the state trading corpor-
ations had to win over the confidence of numerous middlemen who were
links in the distribution and collection channels of imported consumer
goods and export products^ As in most underdeveloped countries goods for
sale are passed through several people, each of whom takes a commission.
The distribution system is complex and cumbersome, and trade relation-
ships are often on a personal or historical basis. If there is any uncert-
ainty due to inflation or chajiges in governrnent policy each link in the
distributive process demands its risk factor as an added cost. If one
person were to bear all the risk the effects of inflation and confusion,
caused by government policy, on marketing costs might be decreased. 1. S.K.Fisk. The development of Small Scale and Cottage Industries in
the Rural Areas of Malaya, p. 2. S.i::.Fisk. The Economics of the Handweaving Industry of the ^ast Coast
of Halr^ya. p.9 3. The method of distribution through Chinese traders in the Philippines
was regarded by Stifel as unnecessarily complex ajid inefficient. (L.D.Stifel. op.cit., p.29) k J.Panglaykim. An Indonesian Experience; The 3tate Trading Corporations.

137 2. Harketing by the manufacturer:
The larger producer might sell his produce to wholesalers or to
retailers, or he mip;ht possess his ovni retail shops so that he sells his
produce to the final consumer himself. If it is sold to wholesalers or
retailers it is usually on a regular customer basis as this is advantag-
eous to both bujer and seller.
If he makes the effort to retail his own cloth it is because ohe
believes he can gain a greater profit for his produce even after the
marketing costs have been met. There are several reasons for believing
that a srr.all number of manufacturers are well able to extend the business
into retailing. First, the practice of retaining the business in the hands
of the faiiiily with its large number of children usually presents a self-
trained pool of managerial ability to be used outside the factory itself.
Second, many Chinese producers , . fnoved their resources from the
foreign ti-ade sector back to the production sector after they suffered
discrimination in the former. Their main experience was in marketing
and finance and it might be expected that they would trust their ov/n
ability to market their produce most of all. Nearly all the textile
manufacturers interviewed v/ho owned retail shops were Chinese. Third, the
low supplies of raw materials might suggest to them aa outlet for their
profits by investing in marketing facilities rather than in greater
production capacity.
If the producer ha^ the advantages of surplus experienced manage-
ment and sufficient financial resources he could make much greater profits
by undertaking vertical integration. Especially in an uncertain situat-

138
ion v/hen risk factors increase the charges of intermediaries the further
the manufacturer can extend his contact to the final consui'/ier the more
profitable it should be for him. Hov/ever, in periods of underutilisation
his overhead expenses on stora,ge, transport facilities and marketing
services are an extra burden; and this must have been the case periodic-
cilly in Indonesia, -here may also be times v/hen working capital is tied 1
up in uncleared ST;ocks. VJithin this group itself it is invariably the
large scale and efficiently orgaaiised who have built up contacts and in-
fluence which extend into the retailing business.
3. ^^arketing by the cooperative:
One of the original functions of the coop^-ratives was to assist in
marketing the produce of its members, partdicularly small scale enterprises,
to ensure a good sale price. The execution of this function v/ould have
involved substantie.l sums of working capital, not only for the running of
marketing services but for the retention of stocks in periods of low demand,
fhe enterprises needed returns from sales quickly and, v/ith inadequate
reserves of working capital caused by insufficient practical government
support, the cooperatives would have had to market the product as quick-
ly as possible.
'I'he cooperatives failed in this purpose through a combination of
mismanagement and lack of initial funds and this infortunate situation
left the small manufacturer more vulnerable to the free market at a time
v/hen the rate of inflation was increasing and v;ith it the costs and
risks of the several intermediary traders. T, i.any people buy almost all their textile requirements at the Christ-
mas or Lebaran festivals. At the latter, everybody is supposed to receive one piece of cloth about 1.5 metres in length.

139
Ivithout the assistance of a cooperative or a cartel along the
lines of the Japanese sma.ll scale v/eaving industry the v/ealc Indonesian
weaver did not stand a good chance of competing with the large scale
manufacturer v/hen the effects of inflation were felt by the industry.
Mechanisation (and depreciation):
1. Spinning equipment:
Since the modern spinning industry consists of modern equipment
from Japan and Europe cost differences arising from extreme degrees of
mechanisation do not occur in this sector. Because of the nature of the
equipment the plant must be of a certain size, but greater than that,
production per unit of modern equipment and the number of v/orkers re-
1
quired per unit of equipment do not vary much; although it has been
suggested that the minimum economical size for spinning is 10,000
spindles but that above that size production per unit of capital does not
rise much. All spinning mills in Indonesia contain at least 8,000
spindles and differences in their productivity are more likely to be
caused by differences in managerial competence,
2. V/eaving equipment:
The largest and most important differences in degrees of mechan-
isation in the textile industry arise in the weaving and knitting
industries which are also the biggest consumers of officially controlled
rav; materials, which have been: in such short supply.
1, L.D.Stifel. op.cit. p.152
2. Ibid. p.157

1^0
The capacity of a pov;er loom is defined by the Department of
People's Industry as betv/een 20 and 28 metres per shift depending on the
model; but the age of the machine also influences its performance. Power
looms which v;ere installed in one factory in andung thirty years ago,
and which produced 20 metres a shift v/hen new, could only produce 17.5
metres a shift
in 1963* 111 the sarue v/eaving shed Japanese pov/er looms
purchased five years ago v/ere producing 21 metres a shift. This variab-
ility of pov;er machine productivity is not taken into account by the
Department in its allocations of yarn which are simply divided between
handlooms, power looms of width 1, a.nd pov/er looms of width 2.
•'"t is not knov/n what the initial capital cost of the equipment
v/as, but data provided by A.K.Sen for five different v;eaving techniques
in India include capital output ratios for similar capacity outputs.
These are shovm in Table 21.
She productivity of the last three looms was very xiigh, but the
acnount invested in the automatic power loom was a grfeat deal more than
for the factory non-automatic power loom although they had equa} cap-
acity outputs. Assuming that the figures in Table 21 apply to^shifts a
day, the 'Banares' semi-automatic handloom is roughly comparable with
the AIBM, and the factory non-automatic power loom almost comparable 2 v/ith the most modern ATM,
1. Interview with manufacturer in I andung, 2. The figures for Indonesia are given in metres v;hile those for India
are given in yards, jiven after allowing for this difference it is difficult to draw closer comrjarisons with the different kinds of looms used.

TAi LB 21.
OUTPUT AKD CAPITi\LrOUTFUT RATIOS FOR i<'IVS '.vZAVING
IN INDIA.
Techniques Output per loom Capital-output per day (yards) ratio
Fly-shuttle handloora 6 .11 'Banares' semi-automatic handloorn 20 .13 Cottgge pov/er loom 30 .66 'actory non-automatic power loom 8o .66 Automatic power loom 80 1.6?
Source;- A.K.oen. Choice of Techniques, pp.10^-3
Unlitce spinning factories, v/eaving plants do not have to be of 1 1
large size before the benefit of modern machinery is achieved, '-'he
actual size of the plant does not provide much scope for greater effic-
iency in itself. Stifel states that there is disagreement whether econ-
oQies of scafe^xn'^"cotfon\extile manufacturing do exist.^
In Indonesia at the end of I96O there were 188,879 ATBMs, 9,005
ATM^s and 7,519 ATI'-'Is. This means that 88 per cent of the looms could
each produce 8 metres of cloth and 12 per cent could produce betv;een
20 and 28 metres of cloth every seven hours. In I962 there were 22J,905
ATBMs and 20,28^ pov/er looms,^ an/ increase of 88 per cent and 23 per cent, total respectively, over 1960. Since 1950 ATBM^capacity has risen 211 per cent
and AT^°capacit|y 73. per cent.^ Ilov/ever, a KOTOS team investipjating T, unless, of course, the Indonesian manufacturer v/ishes to operate three
shifts and requires a private power generator.Clearly it would not be worthv/hile making this large investment for only 10 power looas.
2. L.D.Stifel. op.cit. p.157 3. I.P.Andren.UN Advisor, memorandum to Dept. People's Industry, 2.10.59. k. Madjal&4 Industri Rakjat. Ho.6,June 1963.Dept. People's Industry. 5. Departmental memorandum (People's Industry) by Hirav/an. p. 12

licences of capacity found that of 13i598 looms of licenced capacity
inspected only 303 actually existed. This makes the 88 per cent increase
highly suspect, but it is impossible to eliminate the error over the
whole country from this sample. After 1962 there was very little expansion
because of the shortage of foreign exchenge for imported equipment.
The method and pattern of expansion of capacity in the weaving
industry affected the distribution of mechanisation between well-establ-
ished fin'ns and new entrants. As already noted in Chapter III the new
indigenous entrejits tended to invest in the handloom, the ATBM. Unfort-
unately there are no figures on distribution of modem equipment according
to size of firm or raciaJ. origin of owner, but the impression was
gained from interviews that large manufacturers were not interested in
purchasing hand equipment, and that the Chinese tended to invest
heavily in power looms.
The profitability of purchasing power equipment depends on its
initial cost relative to the cost of hand equipment, as well as on the
cost of labour involved. The next section shows how inflation
contribiited to making purchases of power equipment more profitable.
3* The cost of mechanisation:
The initial cost of new equipment was not as serious a source of
difference in overhead production costs as might be considered in a
developed and economically stable country. Most of the new capital in-
1. KOTOE Clothing Teajn %port. February, I965.

vestment of the 1950s was made on very easy credit terras with lov/
interest rates, ihe effect of inflation of between 60 per cent and 150
per cent a year for the last ten years v/as such that government loan
financing schemes for new equipment were tantamount to huge subsidies
to asp^ing entrepreneurs. The Chinese were not excluded from these ben-
efits because frequently they v;ere the real applicants, using Indonesian 1
names on official forms, for government credit, i- oreover, the purchase
of overseas equipment offered special sub/lisidies tlirough the black^,market
for foreign currency. ^manufacturers who wished to acquire foreign equip-
ment were allocated sums of foreign exchange which were accounted for
2 .
by invoices, -"y acquiring a double set of invoices from the seller of
the goods part of the foreign exchange allocation could be retained and
exclianged for Supiahs at the blackmarket rate for hard currency. If the
blackmarket rate was four times the official rate 25 per cent of the
allocation would have to be exchanged illegally to acquire new equipment
at no cost whatever. This practice was very v/idespread and some manuf-
acturers thereby acquired both capital equipment and working capital,
having begun v/ith no funds, he last such favourable exchange rate off-
ered textile investors was in 1962 and this is the main reason why in-
vestment in overseas machinery stopped then.
fhus capital repayment and interest charges did not influence
overhead costs in the Indonesian textile industry to the same extent 1. See Chapter III, 'Government i lans and the Expansion'. 2. One manufacturer admitted he obtained Sp.J.S million in foreign
exchange (Rp.11.^0 = U.S. 1.00) in 195^ which surpassed his ow expectations. Interview in Bandung, 6.^.65.

that they did in other countries. Compared with the problems of rap-
idly increasing and fluctuating costs, capital charges play a very
minor role and most capital investment made in the mid 1950s was repaid
by the early 1960s. The depreciated cost of capital equipment under
these inflationary conditions made investment in more expensive and mod-
ern machinery much more profitable than it v/ould otherv/ise have been.
Although easy credit would not alter the raiiiking of the capital-output
ratios for various v;eavigg techniques, as described in 'Table 21, it
could change the order of profitability by reducing capital costs of
the more mechanised processes by a greater proportion of total costs
than in the case of less mechanised processes.
The rise in interest rates and the increase in bribes to bank
officials in recent years contributed to the decline in new investment
in both domestically produced and imported capital equipment. It is
true that licences of capacity increased as it became more important
to acquire a larger allocation of officially priced raw m.aterials, but
this v;as achieved by a simple re-v/riting of licences rather than by the
installing of new plant and machinery.
The extra costs of produ.ction associated vn.th mechanised weav-
ing apparatus are fue^anl more expensive maintenance services.
The availability of spare parts presents difficulties partic-1
ularly for factories equipped v;ith foreign machinery. In the case of
Indonesian made equipment spare parts are available but are made from
scrap iron and by poor quality processing.. ^'ew parts for foreign
T. i.ven the state spinning factory in andung experienced problems of spare parts. Interview, 11.11.64.

machinery might be imported but in the last two years there has been
no special allocation of foreign exchange for them, ^he free market
rate
of the dollar has had to be paid for these imports recently. This
made the repairing of machinery extremely expensive, and, in some cases
where large quantities of parts were required, economically imfeasible.
'The alternative v;as to drav; the required part and request a local metal-
working shop to imitate it in scrap iron. This method of repair met v/ith
varying success. Smaller repairs are performed by maintenance officers
at the factory.
There is no information on the amount of equipment requiring spare
parts, but private estimates of power equipment in disrepair range from
30 per cent to 50 per cent, ^'achinery vmich broke down in 19^3 has never
been repaired because of shortage of raw materials, iloreover, accessor-
ies such as shuttles have to be imported and most enterprises have
grossly inadequate supplies for full capacity utilisation.
AS in the v/eaving industry, power knitting machines have supp-
lanted handmachines in production. Because of the shortage of rav/ mat-
erials the entire knitting production is now performed on pov;er-driven
equii^ment. Unfortunately there is no comprehensive information on cost
and production of Knitting macuines, but the effects of easy credit for
capital investment and of problems of supply of spare parts on the
v/eaving indu:^try also apply to the knitting industry,
It was assiimed by most manufacturers interviewed that the govern-
ment would be forced to offer very easy credit and exchange ra^e terms
for spare parts at such time as it increased the supply of raw materials sufficiently to utilise the present broken equipment aJid for ti.tis

reason they have postponed the rehabi3.itation of their fixed capital.
k, Fii^iching factories:
'Aae modern finishing section of the textile industry is very
highly mechanised and is unquestionably the most profitable part of the
vjhole manufacturing process today. The machinery, most of v/hich was
installed in the last seven years, is of the most up to date in the
world and its purchase was made under very favourable credit terms, -he
price of foreign currency to the private investor was fixed in Supiahs
and inflation and underinvoicing have assisted him in repayments. The
management of state-oi-med finishing factories has never been bothered
by capital repayments and interest claarges.
Depreciation:
Estimates of depreciation can be used for calculating the rate of
profit on fixed capital or for creating a fund for replacing equipment
at a later date, but in Indonesia it is totally ignored by textile
manufacturers, small and large alike. Historical cost means little with
inflation of between 60 per cent and I50 per cent a year. Such a charge
on the profit and loss account would be negligible after the machinery
was about five years old and the profit rate on this basis v/ould be
excessively high. Historical cost records are kept only for purposes
of taxation which permits 10 per cent of historical cost as a tax red-
uction. The replacement cost is more realistic in these circumstances
but it is not calculated because of the uncertainty of exchange rates
and inflation in the future. Such an estimation can give an approximate

1^7
indication of profit but it vrould be unsuitable as a replacement fund
unless the reserve could generate income which allov/ed its real value
to be maintained from one year to the next; other\>dse even this fund
would depreciate in an inflationary situation. In interviev/s with man-
ufacturers the imiversal opinion was expressed that inflation would
become a great deal worse because of the inability of the government
to deal v/ith the accuiniilated mismanagement of the balance of payments.
'•he attitude of textile manufacturers towards a machine v/hich
breal^s down completely was sum.:ied up by one entrepreneur who said,
'if a machine brealcs dovm, that is just too bad, 'Je have much bigger problems to thinlc about. We cannot think about)( the long run. In inflation it is impossible to depreciate carefully and buy again when necessary, w'e prefer to wait for the government to offer favourable foreign exchange rates before v;e buy machinery. There is absolutely no 3jOng run planning in the private sector of the industry'.
A failure to allow for depreciation has been noted by observers
of textile industries in several other countries. S.D. Mehta believed
that one of the reasons why the Japajiese mills were able to supply the
Indian market so successfully in the years I906 to 192? v/as because
the Japanese producers charged less than 5 per cent depreciation costs to 2 ::
their profit and loss accounts for eleven of those years, - e does noL
supply evidence but states that while they were mounting an aggressive
and efficient sales drive in India, their -loose., accounting system
assisted them in selling at very low prices, l.ehta also stated, on the
basis on interviews with Indian manufacturers, that during the years
of severe underutilisation in the Indian industry in 192^ to 1929, it was comr.on practice not to make any depreciation ~ Interview with manufacturer in Bandung, 27.^.65. 2. 3.1).Mehta. The Cotton i.ills of India.

1^8
1 charges. This incomplete accounting system was also noticed by 2
S.J.Kennedy in a study of textile mills in the United States in the
1950s, By not including these costs the marginal firms v/ere consist-
ently selling their output at belov; cost over a period of several years,
'fhese mill ovmers very likely had less hope of heavily subsidised spare
parts in future than their Indonesian counterparts today.
In the absence of any infornation on depreciation costs obtained
from interviews with manufacturers it is necessary to turn to examples
from other covintries to gain some idea of depreciation costs under
more normal conditions than those prevailing in Indonesia.
In the New England weaving industry per cent of total costs
were taicen by depreciation."^ ^f this cost had been allov/ed for in Indon-
esia it v;ould have closed many firms. It represents about one-fifth of
total raw material costs in the Philippines or in Indonesia (in 19^0),
and a good deal more than the v/ages bill in the latter country. If
capital-output ratios are tai-cen as an indication of the proportionate
burden of depreciation charges on total costs, data from the Philippines
presented in Table 22 suggest that weaving production has a higher deprec-
iation burden than spinning production and that both spinning and weaving
have much hifi:her depreciation charges than other secondary industries.
1. Ibid. p.l6l 2. S.J.Kennedy, ^'rofits and Losses in Textiles, p. 151 5. Heport of the New Enrland Textile Industry, 1952. p.2^. Coimittee
of the Governors of New iiigland.

1^9 TABLE 22
CAPITAL-OUTPUT RATIOS OF SELiGTED INDUoTRISS IK THE PHILIPPINES
Spinning 3.0 V/eaving 3.3 Food processing 1.3^ Paper and paper products 1.^2
Source:- L.D.Stiiel. The Textile Industry - A Case Study of Industrial Development in the Philippines, p.175
Further data on weaving coefficients v;ere supplied in Table 21
which compared fixed capital output ratios for five different v/eaving - 1 II
techniques in India. '-L'hese figures show that the burden of depreciat-
ion charges per unit of value added v/ould be very much higher for the
automatic pov/er loom than for the others if depreciation were calcul-
ated in proportion to fixed capital investment.
However, these ratios are of limited use as indicators of the
burden of depreciation costs because different equipment might have
different lengths of life. E.K.Fisk has judged a depreciation rate
of 2-- per cent to be appropriate in the Malayan handweaving industry,
because the looms lasted over ko years.^ This would suggest that dep-
reciation burdens on handv/eavers are even less than the capital-
output ratio v/ould indicate.
V/e might conclude that in a situation where expectations of
heavily subsidised repairs were absent, depreciation costs v/ould be a
much greater burden on the larger and more mechanised firms than on the T. These ratios are much smaller than Stifel's for the Philippines but
there is no obvious explanation, (L.D.Stifel. op.cit. p.17>) 2.E.K.Fisk. op.cit. p.1^. Fisk suggests that the low initial capital
cost and the long life of the looms explain why such a high prop-ortion of the v/eavers ovm their looms, despite their low income.

150
cottage industry. However, in the unusual circxirastances in Indonesia
the neglect of depreciation charges contributes to widening the eff-
ective range of cost differences v/ithin the weaving industry, as well
as enabling more enterprises to keep producing than v/ould otherv;ise be
expected if producers v;ished to cover all accounting costs. If the true
depreciation costs were reduced by equa! proportions over several
weaving techniques, the absolute reductions would be greater amongst
techniques using the most expensive machinery, so that their apparent
profits would be increased by the largest amounts. Hence the order of
magnitude of profitability vjould most lil ely change,
Sav/ materials: 1
Since raw materials comprise the biggest single production cost,
variations between firms are very important. 1. Haw cotton prices:
The spinning factories did not experience a blackmarket of any
magnitude because being so few mn number they were more easily
controlled. Moreover, as they were mostly state enterprises their
supplies were better guaranteed.
1.. This is borne out by a study by G. JleminK,(Die Strul^tur wand-lungen und die Aussen handelsverflectunpien in der vJelttextilv/irt-schaft. p.75) over several countries including Japan, India, Britain,"and the U.S.A. The Report of the New England Textile Industry (op.cit. p.27) estimated that for one dollar of a finished textile article 10 cents uent to raw cotton and 19 cents to the other costs of manufacturing cloth.

151 2. iarn allocation prices:
"^efore 1958 allocations of officially priced raw materials were
made to srall sized and some medi-urn sized estaljlishrnents only. They
gave these enterprises cost advantages over the larger ones but the
benefit v/as not as great as it vroxild be today because the difference
between official and free market prices at that time was not very
large.
After 1958 when official - yarn allocations were introduced in the
entire industry, power looms and knitting machines received larger
amounts because of their higher productivity and because they could
be used for two shifts. But with the breaic dovm of control over offic-
ial distributions of raw materials extra payments were involved in the
purchase of factors of production. To obtain his rightfial allocation
of yarn, a textile manufacturer was often compelled to pay a bribe.
There were tv/o categories of manufacturers especially prone to this
treatment. 7irst, the large Chinese manufacturer v/as a target, partly
because of racial hostility and partly because it was well knovm he
could afford it better than others. Second, the unorganised small scale
entrepreneurs were easily misled into paying extra sums because they
1
were never fully aware of v/hat the allocations were supposed to be.
In the badly supervised system of yarn distribution it was only with
great difficulty that v/eavers could check on their rightful allocat-
ion; and even then redjrfess was not guaranteed. This form of corrixption
v/as carried out by officials of the cooperatives whose function it was
1. oee Chapter V, 'The Sup_.ly and Distribution of Raw materials'.

152
to channel raw materials from importers to manufacturers. It \ias not
long before this corruption became institutionalised and some manufact-
urers were continually paying more than others for their raw materials.
Although this practice always existed to some extent whenever there
were official allocations it was greatest after I962.
3. ^ree market yarn prices:
Another source of variation in total rav; materials costs was the
free market. The final yarn cost depended on the mixture of officially
distributed and free market yarns which was processed. The financially
strongest and most efficient majiufacturers bought the largest shares
of free market yarn and v;ould therefore have borne the highest average
yarn costs. Those v;ho preferred to hold their yarn allocations and
process only those quantities, even at the cost of underutilisation,
would have the lov/est rav; materials costs^ except for those v/ho sold
part of their allocations.
k . Official and free market prices compared:
Table 23 provides an example of the difference between official
and free market prices of yarn. As can b e seen from the datg., purchases
of yarn from the free market merited very serious considerations from
the manufacturers.
1, There v/ere allocations to small scale and some medium, scale firms in 195^, 1935 and 1957 because of their inability to compete with other enterprises.
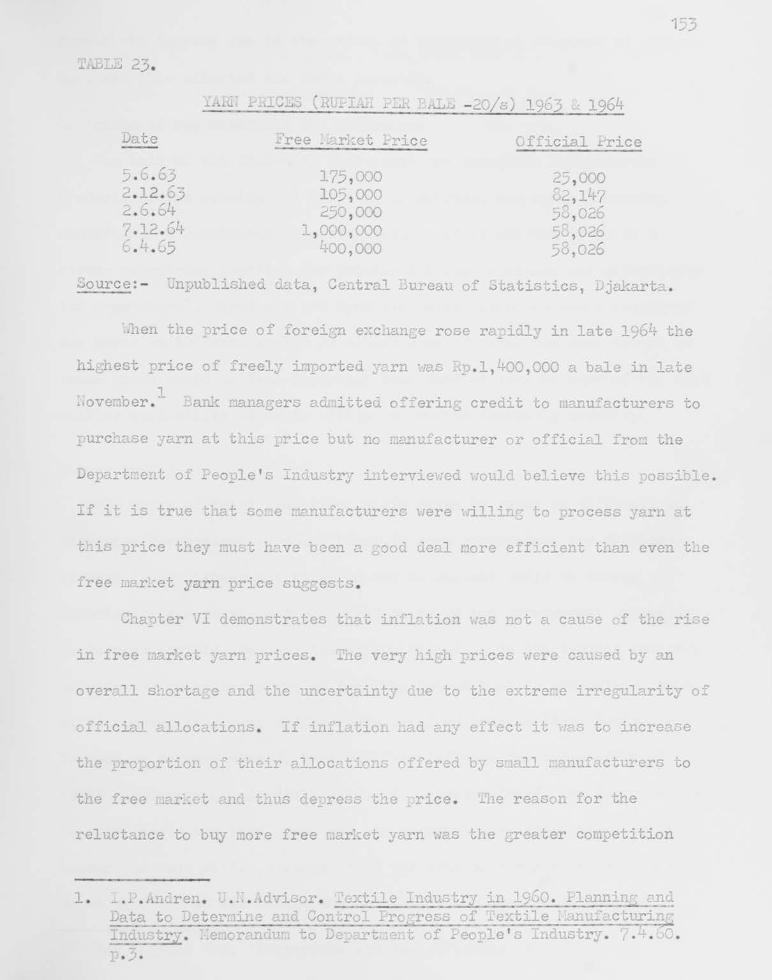
153
•TABLE 23.
YAH? PRICES (RUFIAII PEfi BALE -20/s) I963 & 1964
Date Free Market Price Official Price
5.6.63 175,000 25,000
2.12.63 105,000 82,1^7 2 . 6 . 6 4 2 5 0 , 0 0 0 5 8 , 0 2 6 7 . 1 2 . 6 4 1 , 0 0 0 , 0 0 0 5 8 , 0 2 6 6 . 4 . 6 5 4 0 0 , 0 0 0 5 8 , 0 2 6
Source;- Unpublished data, Central Bureau of Statistics, Djaliarta.
v/hen the price of foreign exchange rose rapidly in late 1964 the
highest price of freely imported yarn was Rp.1,400,000 a bale in late
November.^ Bank managers admitted offering credit to manufacturers to
purchase yarn at this price but no manufacturer or official from the
Department of People's Industry interviev/ed v;ould believe this possible.
If it is true that some manufacturers were v/illing to process yarn at
this price they must have been a good deal more efficient than even the
free market yarn price suggests.
Chapter V I demonstrates that inflation was not a cause of the rise
in free m.arket yarn prices. The very high prices v;ere caused by am
overall shortage a-nd the uncertainty due to the extreme irregularity of
official allocations. If inflation had any effect it was to increase
the proportion of their allocations offered by small manufacturers to
the free market and thus depress the price. The reason for the
reluctance to buy more free market yarn v/as the greater competition
I.P.Andren. U.N.Advisor. Textile Industry in I 9 6 O . Planning ajid Data to Detex-mine and Control Progress of Textile Hanufactviring Industry. Memorandum to Department of People's Industry. 7.'+.oO.
p.3.

from cloth imoorts due to the effect of inflation on measures of protect-
ion, and this affected the whole industry.
5o Prices of raw materials for finishing:
The bulk of the finishing factories' raw materials comprises the
products of the weaving and kniluting industries, and since finishing
constitutes a bottleneck in normeil periods of production it is in a
strong bargaining position for pricing its raw materials (or determining
its commission). Chemicals ajid dyes are mainly imported and allocations
are based on the same system as aJLlocations of yarn. The free market in
these goods would be less important thaaa that of yarn becaiise of the much
smaller variability of costs within the modern finishing industry.
Labour costs:
The share of tota2 production costs taken by wages is difficult to
determine for severa.l reasons. rirst,in many enterprises the difference
between fa;:ily labour and hired labour is unclear while in others the
salaries of the managem.ent are bsjsed on 3Ji hoc arrangement depending
on current profits. Second, the underutilisation in the textile industry
provides an unclear picture of the true labour cost in production, xiuch
of the unused labour is deliberately retained because it is desirable
to keep on workers already trained. This inflates the wa^es share of
total costs during underutilisation of capacity. Third, the fluctuatioris
in other costs are very great and the proportion of total costs taken by
labour caii ;v;ove v/ithin a range of 10 per cent in a short period. Fourth, 1
wages have logged far behind the cost of living and it is now the
1. See chapter Vil, 'Protection and the Influence of Inflation'.
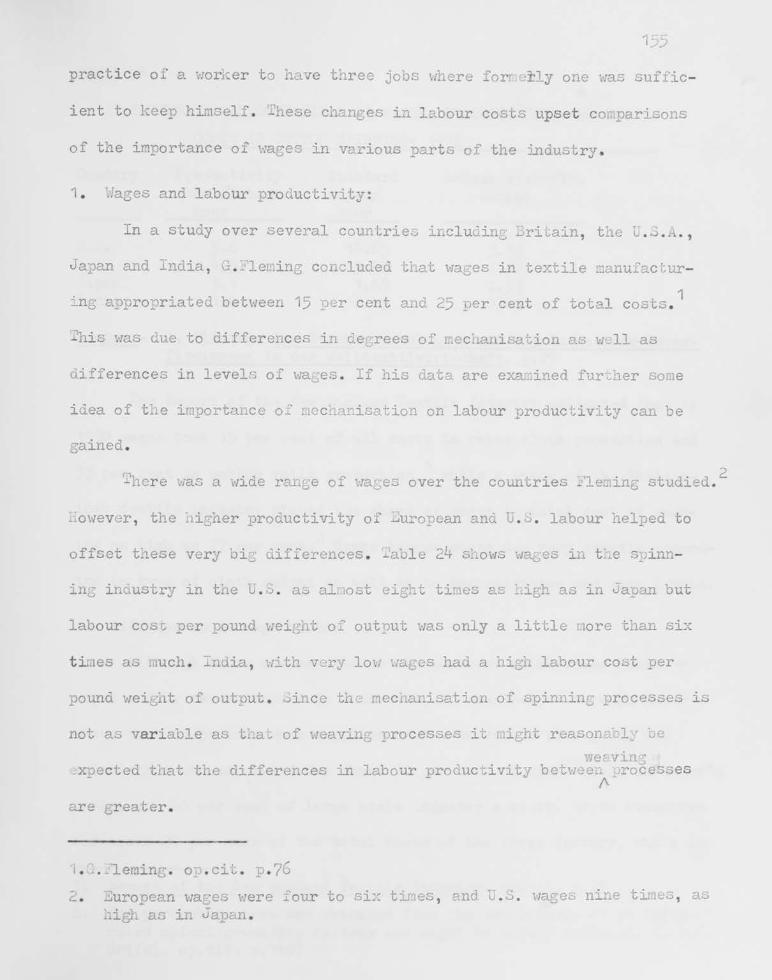
practice of a vrarker to have three jobs v/here forraetly one was suffic-
ient to keep himself. These changes in labour costs upset comparisons
of the importance of wages in various parts of the industry.
'1. Wages and labour productivity:
In a study over several countries including Britain, the U.S.A.,
Japan and India, G.Fleming concluded that wages in textile manufactur--1
xng appropriated between 15 per cent and 25 per cent of total costs.
This was due to differences in degrees of mechanisation as v/ell as
differences in levels of wages. If his data are examined further some
idea of the importance ox mechanisation on labour productivity can be
gained.
There v/as a wide ra.nge of wages over the coimtries Fleming studied.'
However, the higher productivity of European and U.S. labour helped to
offset these very big differences. Table 24 shows wages in the spinn-
ing industry in the U.S. as almost eight times as high as in Japan but
labour cost per pound v/eight of output was only a little more than six
times as much. India, with very low v/ages had a high labour cost per
pound v/eight of output. Since the mechanisation of spinning processes is
not as variable as that of weaving processes it might reasonably be weaving
ex-oected that the differences in labour productivity betv/een processes A are greater.
'i.G.Fleming, op.cit. p.76 2. European v;ages v/ere four to six times, and U.S. v/ages nine times, as
high as in Japan.

156 TABLE Zk,
I N T M A T I O K A L COMPARISON OF WAG2S, PRODUCTIVITY, AKD LABOUR
COSTS IH COTTON SPIHHING; 1932
Country Productivity Standard Labour costs/lb. lbs./labour wages/ output hour hour
U.S. 5.6 18.65 3.33 U.K. 4.3 9.90 2.20 Japan 3.I I . 6 3 0 . 3 3 India 1.0 2.^3 2.^3
Source:- G. Fleming. Die Strukturwandlungen und die Aussenhandelsver-flectunp^en in der V/elttextilwirtschaft. p.79
'j-lie Report of the Nev/ England Textile Industry estimated that in
1950 wages took 13 per cent of all costs in rayon cloth production and
1
33 per cent in cotton voile production, l /hile a study of the Philipp-
ines textile industry placed the share of wages in total cost of weav-
ing as high as 27 per cent.^ Hence labour costs can vary greatly accord-
ing to type of cloth output as well as to mechanisation and wage levels.
2. Differences in v/age costs:
Although there are no data on the share of total costs taken by
v;ages and by raw materials in Indonesia, it was learned through inter-
views that in periods when supplies of rav; materials were good, raw
materials costs accounted for about 70 per cent of small scale industry's
costs, and 60 per cent of large scale industry's costs, .-ages accounted
for about 20 per cent of the total costs of the large factory, v/hile in
1. Report of the Nev; m g l a n d Textile Industry, op.cit. p.27
2. The percentage here was obtained from the tax returns of an integ-rated spinning-weaving factory and might be unduly inflated. (L.D. Stifel. op.cit. p.1^9)

157 the case of the small enterprise it might be assumed that almost all
of the remaining 30 per cent would be taken by wages (or earnings).
3. I'rends in wages costs:
In years v/hen supplies of rav/ materials v/ere scarce, and espec-
ially since 1962,it is believed that tv/o factors have caused changes in
this range of laboxir cost shares.
l^irst, the money value of v;ages in cash and kind appear to have
fallen behind price increases, not marginally, but very substsjitially,
since 1956. V/hile textile manufacturers in the rhilipoines have compl-1
ained of high wages and an ijCAFE report in I965 commented on rising
labour charges throughout the region,^ it was verjr noticeable during
interviews in Indonesia that all manufacturers affirmed that labour and
wages presented no problems. One large scale manufacturer stated that in
1961 wages accounted for 25 per cent of his total production expenses
but that at the end of 1964 they did not talce more than 10 per cent,^
0ut regulations on dismissal of workers could maJce it difficult and k expensive to reduce the staff. A few years ago it v;as found desiraole
1. This was one of the main arguments for further protection. (.L.D. Stifel .opicit. p.61)
2. Sectoral otudy. i-'extile Industries. Asian Conference of Industrial-isation. ECAFE Conference, p.67
3. Ihe report of the Industrial Technical Centre Foundation, P.T.Djunti, pp.2^-5, 2o, 32-3)» assumed v/ages would take between 9 & 10 P®^ cent of total costs of production of a new factory in 1963» They also allowed .for 10 per cent depreciation of the highly mechanised equip-ment. The esvirnate of the share of the wages bill might have been quite accurate. However, for less mechanised processes in a situat-ion in which factory employment provides a sufficient living, it is doubtful v/hether the share can remain as low as this. r^egulation No. 12.10/9/64. Department of Labour, Djakarta.

158 to retain workers trained within the factory for as long as possible
because they might be difficult to locate later on; and in the mean -
time they were employed of gardening and cleaning tasks.
In 1964 v;hen factories began closing dovm or drastically cutting
back on production because of low supplies of raw materials, managers
could no longer afford this practice, - efore September 1964 dismissals
v/ere negotiated with the unions without much difficulty by means of a
Iwnp sum payment. The ease v/ith which manufacturers dismissed v/orkers
v;as due, more than anything else, to the acceptance of bribes from
manufacturers by union officials. The extent of corruption amongst
union officials in Indonesia was an outcome of the political structure
and could not have been tolerated in other South - ast Asian countries
with their patterns of political behaviour. This is the chief reason
why wages and labour productivity in Indonesia presented no problems
to the manufacturer.
Cooperation from the unions v;as usually obtg.ined by agreeing to
the re-employment of workers at a later date when further rav/ mater-
ials became available. This was classified as temporary dismissal alth-
ough the suspension of production might have been more than six months.
In September 1964 a regulation was passed whereby dismissals had to be
registered with the local branch of the disputes committee of the
•department of Labour. This v;as intended to have an inhibiting effect
on mass dismissals but since it came at a time of acute shortage of rav;
materials there v/ere no disputes over dismissals. A compromise was
1. Ibid.

159
worked out between worker and management such that v;orkers requested
dismissal in exchange for a lump sum which was usually the equivalent of
1
three, months' wages, ilie system was the same as before September
196^ except that it v;as formalised by the intervention of the Depart-
ment of Labour, whose officials were pacified by manufacturers in a
similar manner to imion officials.
v/orkers' contracts are incorporated in agreements between union
and management. UnicJis are usually organised on industrial lines and
there may be several unions represented in one factory. The manaigement 2 ^
would drav/ up a contract v/ith the largest on behalf of all. These
negotiations decided v/ages over and above the minimvun laid down in the
regulations of the region's Governor, oometimes the local association
of manufacturers^ would bargain on behalf of the employer. VJages are the
most important aspect of the contract, especially payment in kind in
viev/ of continuous price increases. Official v/ages in the textile
industry are lower than the average and before 196^ some manufacturers
paid tv/ice the negotiated v/age by v;ay of premiums in order to prevent
v/orkers from movihg_,to other jobs. The average earnings of a worker in
a weaving shed were about Rp.5,000 a month in early 19^5 (everything
included). At that time a family of four required a minimum of Hp.50,000
a month to exist. The deficiency of Hp.45,000 was made up by outside
employment. Most of the textile employees are women or young men and
1.. Interview with manufacturer in Bandung , 6 . 4 . 6 5
2 . In Madjalaja there are five textile unions and any combination of
them can be seen in the factories.
3. In Bandung, Pretex, an association almost entirely of Chinese manuf-
acturers frequently negotiated for manufacturers.

160
this ernployment provides them with a guaranteed, though small, income.
Not many of the main breadv/inners could afford to be textile v/orkers.
In spite of the low income and many dismissals no disputes in the
industry have been brought before the disputes committee since 1963*
This v/as because of the sympathy for textile manufacturers in their
depressed condition but it had the effect of ensuring labour costs v/ere
kept very lov/ in the industry so that variations amongst the contracts
between imion and management, when they existed, were not of great
significance.
Earnings in the small scale industry have been reduced by higher
credit and marketing costs, although with little administration and
capital costs underutilisation should not have been a great cost burden
to this kind of producer. However, it is unlikely that earnings in the
small scale industry could take such a reduction has been experienced
by factory v;ages. -'•'he history of the small scale producer has been that
he v/as left v/ith little surplus and was permanently in debt. On several
occasions in the fifties there was so little economic incentive to conti-
inue production that weaving stopped. It is more likely that if earnings
fell very much full time weaving activity would have been terminated.
"•'ence the advantage which small scale weaving might have had with
a low capital-output ratio v/as lost when factor/ wages lagged behind the
living expenses of the self-employed weaver.
-Second, the lower real income obtained from each job has notice-
ably lowered the willingness to work ajid, therefore, also the product-
1. I'he years 195^ and 1957 witnessed the closing down of many small seal? weaving establishments.

161
ivity of the worker. Some manufacti.irers complained, that v/orkers came
there
to the factory as though they werearnerely to collect attendance money,
•^"heir employees reserved their enei-gies for the second and third jobs
they v/ould xmdertalce after factory hours. Small scale v;eavers, on the
other hand, have little reason to work less enthusiastically once they
have taken the decision to produce cloth because they are more direct-
ly concerned v/ith the owTiership and administration of the enterprise
and are bound to work harder in order to obtain sufficient payment
from the traders, if they should find the work insufficiently remun-
erative, they are more likely to stop v/eaving. In some cases it can be
argued that they find it more in their interests to work harder to
obtain the r e a l value of their former earnings. Hence if the product-
ivity of the small scale producer changes under inflation it is more
lilcely to rise. 6ut there is a limit to human effort.
^he first influence leads to a fall in wage costs per unit value
of output with the lower limit of the range (t>he factory wage bill)
falling proportionately more than the upper limit (the small v;eavers'
earnings), ^'he second influence suggests a counter-balancing movement,
b y reducing the utility of one unit of labour in the factory, but
accompanied b y a possible further lowering of wage costs per unit
value of output in the small scale industry. Without data it is not
possible to make any conclusive statement on the final outcome but it
is thought that the fall in r e a l wages has been so great that it is
most unlikely that the decrease in physical product of factory labour
was great enough to stabilise the share of wages in total costs. It is
one thing to talk of labour productivity for a given machine being

162
lower in an underdeveloped country because of poor supervision and
skills, or because of a different attitude to work. It is quite another
issue to state that labour productivity has declined from this already
low level. M t h o u g h it must be recognised that the lower incentive to work
has probably had some effect it is questionable whether it has
prevented the share of value of output passing to wages from declining.
It is assumed that this is what is meajit by manufacturers who say they
have no wages problem and that this together with no provision for
depreciation is how they accommodated high raw materials costs. Finally,
although the self-employed weaver had greater incentive to improve his
productivity during inflation, it is difficult to imagine ways in which
this might have been done.
All that can be concluded is that the share of wages in total
costs has altered in the last fifteen years for each firm, and that
inflation has affected the relative wages burdens of large and small
enterprises to the disadvantage of the latter.
..hat cannot be said without further data is whether, after full
allowances for capital depreciation costs, the lower labour costs per
unit of output of the more mechanised equipment would result in
lower final average costs. Now that the small scale well-organised
Japanese weavers have been finally supplanted by very large
mechanised units it is tempting to conclude that this must also be
the case in Indonesia. The complete closure of small scale weaving
firms in 196^, while some activity continued in the large firms,

163
would tend to corroborate this. However, the apparent large differences
in costs might, in fact, be small differences plus the utter
demoralisation of the small weaver which prevents him from attempting
to process any of his allocation.
k. Low productivity and high wages in medium sized firms:
Special mention must be made of the medium sized weaving
enterprises v/hich hire labour but which are usually less efficient
than the large scale enterorise. It is quite likely that in the
fifties the v;age bill was ojtiigher proportion of total costs than in
the s.siall scale industry. ' xn 1957 v/hen the free market price of yarn
rt>se sharply it was noticeable that there was a stronger tendency
to close down ajnongst medium sized enterprises than ai'nongst small
sized enterprises. But with the fall in the real wage of hired
labour in later years the effective v/age burden became lower than
that in the smaller sized section of the weaving industry.
1.. G.D. m e n (Ja.-oan's Economic Recovei-y, p.82) refers to a similar situation in Japan in the middle fifties when the Labour Standards Law raised the cost of labour in all but the smallest enterprises. The contraction of production which followed was borne mainly by the mediurr, sized firm.

164 Povier costs:
'I. State electricity:
cost of electricity concerns only those establishments v/ith
pov;er equipment. Government electricity v;hich is a great deal cheaper
than power from private generators is available in some areas for two
shifts a day although in the tovm of i-adjalaja which produces ko per 2 cent of Indonesia's cloth output there is enough for nine hours only.
2. -t-'rivate generators:
factories using their ov;n diesel generators include spinning and
finishing establishments v;hich vrork three shifts. One finishing manuf-
acturer stated that dyes took 60 per cent of his total costs, labour
20 per cent and fuel and overheads 20 per cent in a normal period.^
Some large weaving factories installed generators several years ago,
before low yarn supplies reduced their utilisation rates, in the hope
that one day they might add a finishing plant to their v/eaving sheds.
3. State and private power costs compared:
•t is difficult to estimate how much cheaper state provided
electricity is because equipment for private generators might be paid
off at various effective rates of foreign exchange and the free market
price of fuel fluctuates greatly, " he usual brief answer received
from m-anufacturers v;as that private electricity supplies are tv/ice as If costly as government supplies.
1. Government electricity is available from 6 a.m. to 6 p.m. 2. Interview v;ith manufacturer in i^djalaja, April 1965. 3. Interview with manmfactiirer in Bandung, 6.^.65. h. Interview v/ith manufacturer in i' adjelaja, i9.A-.65.

155
Inflation increased the running costs of privately generated
power as part of the allocation of solar oil v/as bought on the free
market (as was ysTn). -he price of state ele ctricrity, like the price
of all public services, lagged far behind the gener8-l rise in prices.
In April I965 the official price of solar oil (used for private
generators) was Kp.1.30 a litre v/hile the free market price was Kp.35
per litre. At that time official supplies of oil no longer existed
after months of gradually decreasing supplies. One manufacturer stated
he was unable to continue running his factory at this high fuel price,^
while a finishing factory v;ith large orders awaiting attention could
not vrork at full capacity for a short while because the owner was
unable to find supplies of solar fuel at any price.^
Viorkin'g capital:
' 'he cost associated with bcrrov/ing vrorking capital requirements
is closely allied with managerial problems because the present financ-
ial basis of the enterprises, and therefore their credit-worthiness, is
the result of "the quality of management over a long period of time.
However, it is simpler to regard these expenses as a cost separate from
current msuaagerial efficiency.
1. r-iaw materials:
Of the factors of production v/hich absorbed working capital by
far the most important were raw materials which in periods of high
activity took between 60 per cent and 70 per cent of total production
1. Interview with manufacturer in ^andung, 22.3.65.
2. Interview ^^ith manufacturer in Bandung, 31.5.65.
3. Interview v;ith manufacturer in ^andung, 3.5.65.

166
1 costs, . oreover, unlike the other variables, it was usually paid for,
2
in part at least, in advance. Prior to October factories paid
these advances to the Perusahaan-2 Dagang '" egara (P.D.Ns. - State
Trading Enterprises) either through their cooperatives or directly, ajad
this money has been known to be held for three to six months before the
arrival of the raw materials. Smaller firms were sometimes asked for
smaller advance payments, but often they were not regarded as exception-
al cs^es, and they could only acquire working capital from their
moaeylenders or from middlemen who ivere convinced of their profitability,
and who offered an acceptable commission.^
^f there is no hiatus in the supply of raw materials or if there is
no other reason for producing at irregular intervals, once the initi^al
supply of working capital has been acquired there should be no further
difficulties, so long as the firm is at least breaking even. But
because of the irregularity of supply, working capital needs have
1. Periods of high activity in investment have meant periods when , supplies of raw materials are large end prices are low. At other times with low utilisation rates and high prices, raw materi'-^ls can assume as much as 90 per cent of total production costs.
2. In C^ctober 196^ Komrnando Tertinggi Operasi Ekonomi (KOTOS- Supreme
Commejid of economic Operations) altered the method of payment for
raw materials to cash on delivery. (Regulation No. 39/'^B-KOTOS/l96^.
19.10.64.
3. S.K.Fisk (opicit., p.28) describes the middleman in this role as the 'ind^%pens/ble catalyst of credit-worthiness that makes the provision of this capital to the weaver possible'.

16? 1
fluctuated. I.P.Andren stressed the burden placed on v/orking capital
resources by irregular supplies of yarn, while E.K.Fisk has argued
in the case of the ^--alayan handv/eaving industry that:
As supplies are sometimes difficult to obtain and shipment is not alv/ays regular, the minimum safe figure for average stocks carried is three months' supply - and this is very definitely a minimtini.
i-ioreover, regulations on the importing and distribution of raw
materials have varied so much that, at one time, it v/as necessary to
offer full payment at the time the contract for imports xvas signed
vri.th overseas suppliers, which v/as usually several months before the
goods arrived. Before 1959 private importers were sometimes prepared
to pay 80 per cent of landed cost on behalf of manufacturers. This
money might be locked up in the importing process for up to six
months.^ ^he advantage to the manufacturer was that, although inter-
est on this credit raised by the importer would be included in the
final price of the yarn, importers usually found it easier to convince
the state banks of their credit-vrorthiness and so raise credit at
lov/ interest. At other times, payment was required a fev/ days before
the factory might claim its allocation. If the former regulation
coincided with easy credit policies the effect was not so severe. But
if it came at a time when reserves had been decimated by a period of
severe inflation and the government was simultaneously undertaking a
credit restriction policy the result could be disastrous to the
individioal firm.
-I. I.P.Andren Hi. M . Advisor) .Foreign ^lixchan-e Requirements (Kachine C a m c i t y , Short & Long Term Plannin-). l^epartment of People's industry memorandum, p. . 'i. 'i'-.'.y .
2. S.X.Fisk, op.cit. p.19. Interview v/ith manufacturer in Bandung, 27.-^.65.
168
The inability to integrate overall credit policy v;ith the
needs of the industry meant that textile production v;as often sub-
jected to economic raeasures v/hich conflicted with the government's
policy on industry.
2. Viages:
Another important source of need for v/orking capital, espec-
ially in the cottage or small scale industry, were wages. The family
cottage industry usually required an advance from its commissioners
because in most cases the producer had not sufficient reserves to keep
1 -n
himself and his family until the cloth was ready to sell, -^his
advance v /as readily made but the interest was extracted in the form of
lower prices for the product or smaller total commission. On the other
hand, most of the labour employed by the larger firms v;as paid
\-/eekly or fortnightly and at the end of the pay period. There was more
chance of returns from sales arriving before the wage bill v;as paid in
this case, l^ov/ever, this comparison cannot be dravm too closely
because the period of production in the cottage industry could vary
and the pattern of production and sales of the large manufacturer
might be irregular.
1. E.K.Fisk has noted a similar situation in the handweaving industry in I-ialaya. He commented: 'The average v/eaver is unable or unv;illing to v;ait so long (14 days) for the work in progress and therefore advsjxces are paid by the middlemen at the start of the order, and augmented as work proceeds', (op.cit. p.1o)

169
3. 'Marketing:
Finally, marketing reqiiired a reserve of liquid funds unless there
was an immediate cash sale. It is thought that this was not nearly as
important a burden on v/orking capital as raw materials and wages because
traders, who generally possessed more v/orking capital r e a v e s than produc-
ers, were ready to purchase nev; produce very quickly. In the case of the
small scale producer who v/orked on commission there was no apparant need
for v/orking capital for marketing although the overall marketing costs
of the trader vrould be represented by a reduction in the commission v;hich
the producer received. E.K.Fisk has suggested that the amount of v/orking
capital tied up in stocks in all stages of marketing is not less than the
V3.1ue of six months' output, but it is thought th^t in Indonesia v/here
small scale production costs are so nigh, if cloth is produced at all on
the handlooms it is because there is an urgent need for it at that high
cost J and that it v/ill be speedily marketed.
Tliese three factors, rav/ materials, v/ages and marketing, account
for almost all v/orking capital requirements, iient and electricity are small
costs in comparison and advance payments are not usually required.
Total requirements:
Until 1963 there had been no quantitative studies made in Indonesia
concerning the total v/orking capital requirements of textile enterprises,
and it is doubtful v/hether calculations made in that year provide a true
picture of the ainounts involved as a proportion of fixed capital. In-
flation makes any estimates v/hich included initial capital cost very
difficult, v/hile the low capital utilisation rates of less than 20
Ti ro'id.

170
per cent invalidated current v.'orking capital requirements as a reliable
measure. In this situation it is desirable to compare calculations made
for textile enterprises in other countries with those made in Indonesia,
and malce qualifying observations on both sets of results in the light
of the Indonesian experience.
'•he Industrial '- 'echnical Centre Foundation made estimates for
fixed and v/orking capital costs in the three sections, spinning, v/eaving,
and finishing, of an integrated factory in Djakarta. She ratio of
workiiig capital to fixed capital was 1 : 9.I for the spinning sec ion, 1
1 : 0.8 for the v/eaving section, and 1 : 0.^1 for the finishing section.
'Ihere are sevei-al limitations of these figures which necessitate;
a modification of their range. First, the two kinds of capital cost are
evaluated at the same point in time and do not allov/ for the devaluat-
ion of fixed cost through inflation. Moreover, the rate of exchange for
capital imports was fixed at Rp.315 pe^ U.b. dollar. This v/as one of
several import rates and there is no reason to believe it represented a
free market rate or a rate v;hich corresponded to the cost of imjported
raw materials [which woxild influence the amount of v/orking capital.
Although this is not likely to affect the order of magnitude of the
ratios it could alter the absolute differences. Second, the period The data in the report by the Industrial 'technical Centre Foundation on the integrated factory P.T.Djunti is given here (p.' O)
Department Fixed capital Working capital (Rp. mill) (Hp. mill)
spinning I6 weaving I6I 19^ finishing 116 280

171 during v/hich working capital is locked up might be longer than the
J'oundation imagined. The project v/hose profitability it was esti:nat-
ing v;as intended to be a v/ell-ruji integrated factory which would rec-
eive the best treatment from the State banking system and the Department
of People's Industry which any factory was likely to obtain, ror other
enterprises the working capital might have to be more. Third, in pract-
ice, the finishing establishments require the least working capital of
all because they work on a commission basis and often receive advance
payments for their work. Tjie large ratio of oVfrking capital to fixed
capital recorded here is due to the enormous purchases of grey cloth
as the basic rav/ material, vit in Indonesia today this is not likely to
be bought by the finisher.
If the large ratio for finishing is ignored the weaving section
appears to be exceptionally burdened by requirements of vrorking capital,
^ut because of the dubious n&ture of definitions of fixed capital in
•Indonesia it might be more appropriate to relate v/orking capital to
total annual costs.
Again using the calculation of the Centre ibundation working
capital as a percentage of total annual costs was 2.4 per cent for
spinning, 20 per cent for weaving, and 21 per cent for finishing. The
low figure for spinning is due to the smaller share of total costs exid to labour,
passing to raw materials^ It is impossible to S9.y hov/ accurate this
estimate is, but in Indonesia where payments for raw cotton supplies
are much more effectively controlled than in the case of yarn supplies,
1. Interviev/ with ma.nufacturer in -'-'andung, 27.^.65. 2. F.T.D.-junti. op.cit. pp.2^-33.

172
there is no rea-son to believe this low percentage is an exaggeration.
The spinning factories which were usu.ally erected either by wealthy
weavers or by the government began production in a strong financial
position and xiere able to benefit from cheap bank credit.
The ratio for finishing is totally misleading, because out of a
total annual production cost of Ep,1,332,?60,000 for this section of
the project, grey cloth assumed Rp.1,055,000,000 (or 76 per cent) arid
this is not usually regarded by Indonesi.an finishers as a cost.
There is some comparative information on working capital costs in
weaving enterprises in other countries. In a report of investment
prospects in the textile industry in the Philippines, the Fhilipoines
I'lational Bank'' estinated that for a capital investment of 8.^ million
pesos in a weaving establishment, working capital requirements would
approximate two million pesos, or almost 25 per cent of fixed capital.
This figure, like that of 80 per cent for the project P.T.Djunti, was
for a nev/ly erected weaving establishment v;ith the latest production
technioue, and VTithout further detailed information no comments can be
made on the diverjr^ence. But A.r.Sen has calculated a higher percentage
for a weaving establishment which uses automatic power looms, and
percentages of over 100 per cent for the cottage power loom industry
in India. These data are "oresented in Table 25.
1. Investment ^ros-oects in Selected Industries. Philippines National Banlc.

173
TABLE 25.
ESTIMATES 0? FIXED GAPITaL allD WGKICII^G CAPITAL
FIVE 'aAVIIIG TECara^USS IK INDIA.
TechniGue V;orkiag capital (Hp) Fixed capital (Rp)
j?l.y-shuttle handloora 50 'Banaras' semi-automatic handloom 1,350 200 Cottage power loom 1,913 1,300 Factory non-autonatic po\'/er loom ^,873 ^,000 'Automatic power loom ^,3^7 10,000
Source;- A.K.Sen. Choice of Techniques, p.112
'-'he fly-shuttle handloom, v/hich might represent the ATBM in Indon-
esia, has v/orking capital requirements of more than eight times the
cost of the loom while the most mechanised loom has requirements of less
than half the fixed capital cost, '-"'here is no ratio which resembles
the weaving ratio of F.T. Djunti, although if fixed capital can be
assujned to be landerestimated or working capital overestimated in the
Indonesian case, it might be similar to the cottage power loom and
factory non-automatic power loom ratios.
•^en assujnes a time-lag of three months between expenditure and
receipts.'' In Indonesia the time lag is very Idicely greater because of
the cujnbersome importing and distribution reg^aations. If imported raw
materials taJce as much as 70 per cent of total production costs, and
this amount can be locked up for as long as six months in the importing
and distribution process, it is reasonable to assume a time lag of
three months as a bare minimum in Indonesia. This suggests that both Sen
and the Centre Foundation have imderestimated the burden of v/orking
capital in weaving but that Sen's figure is closer. It should be rem-
1. A.K. Sen. Choice of techniques, p.10

17^
erabered that the Centre Foimdation v;as making calcLilations for an
vinusual establishment in indonesia and its fixed capital costs might
have been determined qviite arbitrarily.
'•^he higher share of total costs tal^en by raw materials in the
cottage and small scale industry v;oiild raise the ratio for small prod-
ucers, although the occasional credit assistance of the cooperatives
or the waiving of advance payments v/hen official yarn allocations were
made, would tend to lower the figure again.
It might be concluded that in the case of Indonesia the range of
working capital to fixed capital ratios is at a higher level and is
wider than in India because of greater time-lags. Finally, mention must
be made of the influence of erratic supplies of raw materials. In recent
years supplies have arrived two or three times a year and payment has
been made in corresponding lump sums. Therefore, although Indonesian
textile manufacturers might not need as much working capital as their
Indian c o m t e r p a r t s all the time, there are periods when the v/orking
capital requirements rise to several times their Horraal level.
The burden of the cost of working capital does not necessarily
correspond with the actual capital requirements. G . Fleming observed
in a comparative study of textile manufacturing costs over a number of
coxmtries that interest charges were more important in ujiderdeveloped
countries because of poorly developed credit institutions and political
instability. k.Tiat he failed to point out was that the underdeveloped
nature of the credit market itself leads to different interest rates
within one country.
1. G . Fleming, op.cit. p . 79

175 'The smaller weaver with his fixed credit and trading relation-
ships v/ith private moneylenders has an incomplete knowledge of the
(rather elusi re) free money market. His dependence on his moneylender
for services other than the supply of credit makes him unable or unwill-
ing to attempt to gain access to cheaper credit. Banking facilities are
mostly located in the tovms and it might require a real effort to make aji
approach to a banker. Moreover, the smaJLl producer's comparatively low 2
degree of credit-worthiness makes him a bad customer for the banks, and
his finaJ. choice of creditor usually lies between one private lender and
another.^
The liquidity of the recent entrant to the industry was usually
strained by heavy investment of liquid resources in capital equipment
while his low managerial ability limited his capacity to remove the debt incurred by v/orking capital requirements,
ij. L.D.Stifel noticed a very similar situation amongst small scale
weavers in the Philippines where the strain on liquid resources caused
by capital expansion reduced the producer's ability to secure additional
credit and he wa s forced to resort to high interest loans. Hence the
initio;! low credit-worthiness of the small scale entrepreneur means that 1. The free money market is not illegal, but it is made up of many
individuals and does not have the characteristics usually attributed to a 'perfect' market. During severe inflation the boundaries of the free rn oney market became indefinable a-s money was borrowed from friends and relatives at near 'free market' rates of interest.
2. See Appendix A. .3. The situation in Indonesia wajs bad enough for H.K.Charleswotth to
describe the supply of credit to small indigenous business as usurious. (A Banking System in Transition, p.176). He commented: 'There exists a great need for several private industrial banks whose functions are to ser\''ice the needs of the small Indonesian businessmen with investment credit'. L.D.Stifel. op.cit.,p.101

176
he cannot obtain as generous credit terns as others and this in turn
1
raalces it more difficult for him to increase his credit-v/orthiness.
An example of the effective interest rates paid by the small scale
v/eaver v/as supplied by the manufacturer of a large factory in iiadjalaja.^
A trader financed a v;eaver to produce 30 metres of cloth at a total cost
of Rp.35iOOO and appropriated the cloth for sale at xip.75»000. J-he prod-
ucer received a commission of Ep.3^000 v/hile the trader made a profit of
100 per cent in less than one month, amounting to 13 times the value of
the commission. The large profit was due to the sudden arrival of offic-
ically priced yarn allocations vAen there was a shortage of cloth v/hich
provided an exceptionally high profit, nevertheless, the point is made
that the small scale v/eaver was unable to gain access to other sources of
credit to benefit himself.^
'•'•he larger enterprises by reason of their sounder financial position
required a smaller proportion of total vrorking capital requirements in the
farm of loans and v/ere more easily accepted as bank customers.
The cost of borrowing varies from year to year according to the
general economic climate. Loans are usually contracted from several sources
but in recent yeats banks have reduced their lending activity. This
1. This difficutlLy was found to be present amongst small scale businesses
in the U.S. v/here credit institutions are highly developed. (Meet in-;
the opecial Problems of Small Businesses. Committee for economic
Development, p.32) 2. -interview v/ith manufacturer in M-.djalaoa. 19.5.65.
The question might reasonably b6'asked 'why did the producer not sell his allocation on the blaci'.^ket?' Usually this was done with the connivance of the trader but v/ithout the funds to purchase the alloc-ation the producer v/as completely in the hands of the trader/lender who could virtually dictate the credit terms.

177
occured at the sarne time that inflation v/as increasing and a risk element
was being introduced into free market interest rates. In 196^ state
banlc rate v/as 1 per cent to 1J5 per cent per month, while the free market
1
rate was 10 per cent to I3 per cent. liank credit was limited at this time
and the lov; interest rate v/as usually supplemented by a private commiss-
ion to the bank manager. In this v;ay the cheaper, but limited, credit
was rationed out. -Nevertheless, the final cost of bank credit v/as still
substantially lov/er than free market credit.
• f free market rates are so much higher than bank rates and large
v/eavers have some liquid reserves, the question arises 'should the cost
of v/orking capital to these large producers be the opportunity cost of
using v/orking capital for production instead of lending?' Once again,
reference must be made to the imperfect state of the credit market. If
is doubtful v/hether such a producer v/ould be able to obtain the highest
free market lending rate for his funds, his knowledge of the market v/oixld
be imperfect and he v/ould probably be obliged to use an intermediary
v/ith far greater knowledge and experience, fhe risk premium^ demanded
in an inflationary situation, v/ould have to be shared between them and the
real profit to the producer v/ould be greatly diminished, '^he possibility
of lending reserves v/as never mentioned during interviews v/ith manufact-
urers, v/ho regarded the choice of decision as lying between producing
and holding reserves in the form of gold.
1. Interviews at ^ank I'arya Pembangunan and Banlc Negara Indonesia,
andung. . 1' i .^Zj..

178
Final costs and trends.
Lack of data and unusual economic circtimstances preclude the poss-
ibility of combining these factors in estimations of final cost variations.
Hov/ever, we can use the calculations made by A.K.Sen, v/ho combined mech-
anisation, capital costs, variable costs, and working capital costs to
reach measures of profitability of different weaving techniques in India,
and comment on them in relation to the Indonesian textile industry.
Sen's calculations covered the five different weaving techniques
described in Table 21. - e v/as able to show that although the value added
per loom (the degree of mechanisation) rose in the order of loom given,
the v/ages bill could mean that the order of the rate of surplus v/as
different, lie ignored capital considerations at first but applied five
different v/age rates on each production technique giving rise to five
different potential surpluses and rates of surplus. The rate of surplus
v;as obtained by dividing the potential surplus by the capital cost involved.
This is the same as a measure of profitability of one unit of capital
investment. Tlie other steps of the calculation are shown in Table 26.
' 'he semi-automatic handloom appears as the most profitable invest-
ment v/ith the lov/est wage rate while the factory non-automatic power
loom is the most profitable vri.th the highest wage rate. The automatic
power loom becomes more profitable than the less technically advanced
methods when v/ages are high. But these calculations take no account of
differences in managerial resources and benefits from scale of operation.
If it is assumed that the table comprises purely technical costs and
advantages the results can be modified in the light of the analysis of
the earlier part of this chapter.

179 TABLE 26.
POTEhT?iAL SUm-LUS AND liAi'E OF 3UHPLUS IvEAVIIJG
TEGHNI^fflES IM INDIA.
Technique Capital Value cost per added loom per loom Rs. per year
5s.
50 450
II 200 1500
III 1500 2250
IV 4000 6000
V 10000 6000
V/ages bill per
loom Es,
300 600 900
1200 1500
300 600 900
1200 1500
300 600 900
1200 1500
300 600 900
1200 1500
38 75
113 150 188
PotentiaJL siarplus
per loom per year
Rs.
150 neg. ii II
1200 900 600 300
0
1950 1650 1350 1050
750
5700 5^00 5100 4800 4500
5962 5925 5887 5850 5812
Eate of surplus (•oer cent)
300 neg. !l
600 450 300 150
0
130 110
90 70 50
143 135 128 120 113
60 59 59 58
Source:- A.K.Sen. Glioice of Techniques, p . 10?
Managerial costs:
One of the most important causes of variations in cost structures
was the quality of management. In Indonesia where the Chinese and more
experienced Indonesiaji v/eavers tended to invest in the more mechanised

i8o
equipment their greater administrative ability would have helped give
the more advanced techniques a higher pjjofit rate. Hov/ever, if the ATM
corresponds closer to Technique IV and the ATBM to technique II the
table does not explain why these allegedly raorelastute entrepreneurs
choose the less profitable technique.
Capital costs:
^f capital costs are financed by cheap credit and severe inflat-
ion their importance diminishes and the final rate of surplus increases
until finally, when initial investment has no relevance to cost estim-
ates, the rate of surplus loses its meaning. The profitability of the enter-
prise -.should then be measured by potential surplus in \\fhich case the
most highly mechanised method would be the most profitable method. It
might even be true that, v/hile repayments had to be made on locally made
looms, the more highly mechanised looms pujrchased overseas cost nothing
since part of the foreign exchange allocation v/as sold on the blackmarket
to finance the investment.
'Therefore, in Indonesia the more mechanised and larger scale enter-
prises v/ould be relatively more profitable than is indicated in Table
26. However, until capital cost can be completely disregarded in both
cases, or partially ignored in the more highly mechanised process there
would be no difference in the raniiing of rates of <3 rplus because
smaller percentages of depreciation make no difference.
1. -Jee Appendix A.

equipraent their greater adn

181
9
v ' / a g e s :
As the rising cost of yam, through a shortage of supply, lov/ered
the value added per loom, the cottage and small scale weavers were pushed
out of business because they could not accept a lower income. Sen showed
hov/ vulnerable the cottage industiy was to a rise in wages or to a fall
in value added. A 33 per cent reduction in value added would put the smaJ.1
producer out of business. It is also true in Indonesia that cottagers were
already on very low incomes before the cost of yarn began rising because
of shortages and the expansion of the more efficient firms. The decline in
real factory wages of women and young men provided the large firms ¥;ith a
further advantage over self-employed weaver. Hence a comparison of equal
wage rates amongst the techniques might not be realistic. It might be
more relevant to compare the wages of Rs. 1200 per loom of the first three
techniques (presumably small scale) with Es.600 and lis. 75 per loom of
the last two techniques, respectively. The most profitable technique then
is the second with I5O per cent rate of surplus followed by the fourth
with 135 per cent. If, however, it is not realistic to suppose factories
can purchase the labour of young boys and women at a lower price than the
acceptable returns to effort of a self-employed weaver, reasons for the
choice of -echnique IV must lie with capital and credit costs.
Different rav; materia3.s costs:
The final cost of yarn depends greatly on whether the weaver
processed only his allocation or whether the weaver purchased extra
yarn on the free market. This uncertain cost of production makes Sen's
calculations of fimited value in analysing the Indonesian textile
industry. Chapter VI demonstrates how the difference between official

182
and free market price might be regarded as an indication of the
range of profitabilities if it were assiamed that the official price
was just too expensive for production to take place in the small firrris.
If, on the other hand, small weavers sold yarn which might have been
processed at profit because returns fron sales were greater than
returns from production, the range of profitabilities from processing
would not be represented by the differences between official ajid
free market prices.
Allowance for v/orking capital:
i:iut sJiother factor which is important to the rate of surplus
is the working capital requirements of the firm. Table 25 of this
chapter showed how working capital as a percentage of fixed capitaJ.
was 826 per cent for the first technique and fell to per cent
for tne fifth technique. A.K. Sen found that when working capital
was included in total capital requirements, there was a change in the
order of profitability of the techniques. He used a new formula
for the rate of profitability;

183
p = A - R
K + nR
v/here A = value of annual output,
R = annual recurring costs,
K = fixed capital,
and n = ratio of the time v;orking capital was locked up to one year.
Table 2? shows the nev/ rates of surplus when profit is
divided bj the sum ; of working capital end fixed capita,] when there
is no time lag and when there is a three months' time lag (n= »
I'he first section of the table repeats Sen's selective wage rates
and bills. He has selected different wage rates for the five techniques
presujnably on the assumption that factory wages are higher because
of higher physical productivity. Hov/ever, for the analysis of the
Indonesian weaving industry it would have been preferable to
consider declining wage rates. I'his wa^ done in the second half
of the table when the small scale v/age rate wa^ assumed

18 to be xis. 5 iJer day and the large scale, mechanised v/age rate v/as taken
to be iris.3 per day. After modifying the original calculations (column II)
for wage differences luider inflation and the burden of working capital
(column VI) the magnitude and order of nia.gnitude of profit rates are
radically changed.
- he data shov/ that technique IV v;hich is roughly comparable v/ith the
ATI-i loom in large enterprises performs consistently better than others in
all cases except v;hen there is no time lag and v/hen v/ages are higher in
factories than in cottages. All techniques are affected by working
capital considerations but the automatic pov/er loom (Technique V) is
much less affected than the others, -'he small scale handweaving establish-
ment© are very susceptible to change although they can be shovm to be
highly profitable v;ith a low wage rate and no workiiag capital consider-
ations.
TABLE 27.
KATES OF SURPLUS F01< FIVE WEAVING TECHIil - UES USING TV/0 ALTEH^ATIVS TIME LAGS jDR V/0R.:ING CAPITAL AND FOR TWO ALTEBI-jATIVE WAGE SGxiLES.
Rate of Surplus Rate of Surj.lus ;hnique .Daily i(0 lag Three Daily No lag Three ;hnique
wage (n=0) month' s v/age (n=0) month's rate lag rate lag Rs. / - (n4) Rs. (n4)
- r / ••
I II III IV V VI I 1 300 32 3 nag. neg. II 3 300 39 3 0 neg. III 3 90 3 50 21 IV 5 113 51 3 128 58 V 38 40 3 59 41
Source: - A.K. Sen. Choice of Techniques. pp.107, 110-112.

185 Final differences in profitability would further be accentuated
in the Indonesian case by the fact that the time lag is very likely
nore than three months beca.use of the cumbersome nature of the importing
and distributing process, ^t has already been noted that working
capital for rav/ materials has been knovm to be locked up in this process
for six months, if there are to be very long time lags the most modern
equipment v/ill be preferred.
"or do these calculations make allowance for variable costs of
^ orking capital through different degrees of debt and different inter-
est rates. Inflation has aggravated the discrepancy in the cost of
borrov/ed v/orking capital to the disadvantage of the sraall and less
mechanised v/eaver because it has reduced his credit-worthiness. This
would tend to v/iden further the range of profitability of weaving
enterprises.
To these cost influences must be added varying qualities of
administration at the plant level and in marketing.
Conc?,usion.
This chapter studied diverse cost structures on the assumption
that the largest factories were the most efficient, although it was
reccgnised that there existed a number of exceptions, and the main
sources of differences exau.ined v/ere divided between fixed and variable
costs.
, Ianagerial ability v;as found to be largely a question of racial
origin of the ovmer-manager and v;as expressed in attitudes towards
comnerce in general and re-investment of profits in particular, as well

186
as financial and marketing arrangements, ^he quality of management in the
past led to the size of the firm at the present time and both current size
and quality of management ate the main determinants of present financial
and marketing advantages. An underdeveloped coimtry has more comr)le:><: and
numerous marketing channels, so that those IndonesiahJwith marketing
knov;ledge can achieve advantages not normally expected in an industrial
country. Statdardieation of quality is also important because of compet-
ition from inports, and this factor must be included in marketing
knov;ledge and experience, '" he csjrtels of 'Japan did not exist in Indonesia,
and efforts at cooperative activity v/ere only parti^lljA successful.
Ihe large enterprise sometimes had the financial resources to retail its
ovm produce and thus eliminate the profits of the several middlemen in a
cumbersome distribution process, and if it also possessed the initital
funds it could stock its produce long enough to benefit from the
speculative movements caused by irregular supplies of rav/ materials. Icisk
costs did not have to be spread amongst several intermediaries. ^:q)erience
in (Japan suggests that if the small scale v/eavers had been able to pool
their resources and set up their ovm marketing organisation the discrep-
ancy in final costs betv/een large and SLiall textile manufacturers v/ould be
greatly diminished.
Ilew capital investments and the repayiTient thereof were not a
serious burden on costs because inflation rapidly diminished the real
value of the debt and there v;as the possibility in some cases v/here
machin^.-ry v;as imported that no repa^onents were necessary because part of
the foreign exchange allocation at the official rate was transferred into
Hupiahs on the free maj^ket in order to repay the bexik. ITae difficulty of

18?
capital investment cannot be regarded as the cost but as the
acquisition of credit and foreign exchange allocations. In this
way inflation and several exchange rates benefited the most
efficient and credit-worthy entrepreneurs. Depreciation was
ignored by all firrns because of underutilisation of present
capacity and the belief that the government would offer substant-
ial financial assistaxice when the time came for renewal or
repair of machinery. Those entrepreneurs who invested in the
most efficient method of production benefited most from
inflationary influences on the repayment of capital
investment.
i'hus one of the advantages of the cottege industry in having
a low capital-to-output ratio" was lost in the Indonesian
weaving industry.
^he vajriations of costs due to raw materials depended
on shares of yarn purchased on the free market, '- he higher
priced free market yarn is demonstrated in Chapter VI to be
due to lo'w and extremely irre,gular supplies of raw
materials.

188
Wages provided the large manufacturer v/ith another
advantage during inflation because the cost of hired labour,
mostly women and young men, lagged increasingly behind the cost
of living. This meant that the advantage of labour-intensive
processes in small enterprises was lost in the Indonesian weav-
ing industr^f.
-'-f weaving is regarded by cotta gers as merely a supplem-
entary source of income, which would-L imply part-time work or
the use of fena^e relatives, these wage differences might not exist.
Disadvantages in costs v/ould then lie in credit and marketing
facilities, and in the absence of depreciation charges.
-'"t was thought that labour productivity fell to some
extent as a result of workers having to seek extra employment
but that this fall was not as great as the decline in real
wages.
In as m.uch as large factories used po?/er equipment, where
smell ones did not, inflation placed the former at a cost advant-
age because the cost of state electricity, like the cost
of most government services, lagged

189 far behind the rise in prices in general. Spinning and finishing factories
which had their ov/n private generators often had to turn to the feee
market for solar fuel and this raised pov/er costs very much.
Inflation increased the costs of \ orking capital and it v/as not
difficult to show that the financially weal-:c,r firm at the beginning of
inflation becaae absolutely and relatively weaker after a period of
inflation.
With the help of A.K. Sen's calculations of the relative profitabil-
ities of five weaving techniques in India it v/as demonstrated that through
the effect of inflation on v/ages and interest rates, as v/ell as tb-rough
the burden of erratic sjad infrequent supplies of raw mat-trials on capital
resources, the magnitude and order of rel-ative profitabilities could be
radically altered. In every case of a chief factor of production, inflat-
ion cast a greater burden on the small scale handweaving enterprises than
on the larger modern plants.
" nus with cheap capital, the capital to output ratio was not as
important,as a disincentive, to the individual manufacturer as is usually
thought, while the trends in operating costs, such as wages, power and
credit costs, have been to the advantage of the large scale firm. Finally,
the standardisation of quality of output provided manufacturers v/ith
mechanised looms with a more favoura,jle market.
'fhe ca^rtelisation of weavers in Japan provided obvious advantages
of v/orking capital and marketing to "Japanese small scale entrepreneurs.
In the absence of inflation and v/ith effective cartels or producer
cooperatives the Indonesian small scale industry could improve its

190
position and might even be able to continue for some years. But v;ith-
out these tv;o conditions it v;ould seem that small scale, unrieohanised
weaving is a costly liability, iioreover, as inflation proceeds unchecked
and the efficacy of government support for small v/ea.vers declines the
range of costs per unit of production is likely to increase.

191
CHAPTS5 V
THE SUPPLY . J'D DISTEIBUTICrl OF PJIV/ MATERIALS
Nearly a].l textile ravr materials are imported and their supplies are
important not on3-y because they determine current capacity utilisation
rates but because they act as an incentive to further expansion of the
industry. If these imports had been maintained at a constant high level
their importance v;ould not have justified a separate chapter for the
importing sjid distribution process. It vias because they were permitted
•to undergo enormous fluctuations causing v/eaving capacity utilisation
rates to vai^^ between l6 and 37 per cent that it found necessary to
explain the determination of imports of raw materials; these include
import planning, credit policy, the state of the economy and changes in
the emphasis of government intervention. There is an inevitable over-
lapping betv/een Chapters V and VII. This chapter deals with all the
determinants of the supply and distribution of raw materials, including
protection and in particular the method of rationing through the alloc-
ation system, while Chapter VII deals with the effect of protection on the
profitability of the industry. The sxiount of overlapping has been minimized
without sacrificing clarity.
The intemcl market for yarn developed characteristics such as very
high prices raid speculative hoarding, the latter largely due to intervent-
ion of the government in providing low priced yarn allocations. Chapter
VI explains, by using microeconomic theor-y, how these high prices and the
speculation in stocks were reached. This chapter describes government
1. See Table 29.

192
policy on the distribution of raw materials and the process by which that
system of distribution broke dovm and led to the free market in yarn.
There are two reasons v;hy spare parts are not as important to
this thesis as cotton and yarn. First, in recent years the small amounts
of foreign exchange available to the textile industry were devoted to
purchasing cotton and yarn in order to utilise those machines still in
rtmning order or which could be repaired in local metal workshops. Second,
spare parts are usually specific to one type of machine and cannot be
easily bought and sold. Therefore, the disruption to the distribution
of spare parts, caused by unequal production cost structures, was not
as great as the disturbance to the distribution of rav/ materials. Like
rav7 materials, spare parts were obtained at different times through
private orders and government allocations, and the difficulties that
were encountered in acquiring supplies of them are adequately covered in
this study of raw materials; because of this no special reference to them
v/ill be raade. The subject of this chapter is difficult to document and
analyse, and no special service will be rendered by introducing spare
parts as another manufacturing requirement warranting investigation.
The chapter will be divided between the supply of raw materials
(mainly yarn) and their distribution. Each section will show to v;hat ex-
tent government policy failed and what were the effects of that failure.
It will be useful to first describe the size and fluctuations
of supplies of raw materials as a source of reference tcr the analysis
of this chapter. Such data v/ill assist in indicating the impact of
adverse influences on supply as well as the strength of incentives to
circumvent regulations on its distribution.

CHART I
IMPORTS OF RAW COTTON AND YARNS:1952 to 1963.
(WEIGHT-METRIC TONS)
20,000.
15,000
10,000.
5,000.
Cotton weaving yarn
Raw cotton
Other weaving yarn
1952 1953 1954 1955 1956 1957 1958 1959 1960 1961 1962 1963

CHART II
20,000
15,000
10,000
5,000
IMPORTS OF COTTON PIECE GOODS:1952 to 1963.
(WEIGHT-METRIC TONS)
Sources;Statist leal Abstract, 1955 p.43
1956 p.50. StatlstUt Konjunktur,January 1958 p.58
July 1959 p.58 Sept.- Oct.1961 p.58 Jan.- April 1963 p.5b
Dyed,Printed,Woven, coloured «oods.
Bleached and rnbleached goods.
vo
1952 1953 1954 1955 1956 1957 1958 1959 1960 1961 1962 1963

195 Data on supplies of raw materials.
Table 28 presents data for full capacity requirements of the
spinning, weaving and knitting industries, while Table 29 contains a
record of annual supplies of raw cotton and yarn from both imports and
domestic production. Charts I and II illustrate quarterly changes in
these imports as well as in imports of finished cotton piece goods, A
comparison of y a m and cloth imports provides some indication of the
importance placed by the government on the supply of raw materials.
From Table 28 it can be seen that the raw material
requirements of the modern spinning industry and the handweaving industry
trebled over the v;hole period while the powerloom v/eaving capacity input
only doubled. This meant that rav; cotton requirements increased
proportionately more than total yarn requirements. There was a very
sudden rise in yarn requirements in 1957 and 1958 which was
accompanied by critical shortages of supplies. This occured as a result
of the strong imports of the preceding years v;hich provided incentives
for further investment but which depleted foreign exchange reserves so
much that the high level of imports of raw materials could not be sustained.
1, The high level of imports of textile materials in 1955 and 1956 was
accompanied by heavy importing of many other goods which contributed
to the later balance of payments difficulties.

196
TABLJI] 28
HfiQUIRliil-ISNTS K)R M W I-iATESI/vLS FOR THE SPINimrc AMD WEAVING
INDUSTRIES: I950 - 1964
SPINNING W^iA-VING
(tons of (tons of yarn) raw cotton)
ATBM ATM^ ATM^ TOTAL
1950 N.A. 25,920 9,470 13,644 49,034 1951 N.A, 25,595 10,0l4 14,424 50,033 1952 6 , 1 1 7 24,859 10 , 1 35 l4,6o6 49,601 1953 6,455 24,389 10,870 15,658 50,916 1954 9,488 26,797 10,439 15,038 52,274 1955 9,488 28,388 10,376 15,307 54,072 1956 1 1 ,598 30,577 9,598 13,844 54,008 1957 1 1 ,598 41,588 12,800 18,437 72,826 1958 1 1 , 7 5 3 76,535 13,826 19,906 76,535 1959 11 ,869 N.A. N.A. N.A. N.A. i960 1 1 ,905 54,000 14, 129 20,366 88,495 1961 N.A. N.A. N.A. N.A. N.A. 1962 1 5 , 6 1 3 80,606 16,958 24,456 122,021
1964 (Nov) 21 ,471 N.A. N.A. N.A. N.A.
Source:- The capacity inputs are based on equipment recorded in Table I3 and using the follov/ing conversion factors: (i) spinning: the nuiaber of spindles is tal^en from Table 15 and the
ratio of spindles to input is from Pembangunan Industri Hakjat p.11, Department of People's Industry, Djakarta, April I962. Three shifts, 260 days a year is assumed to be full capacity. (ii) weaving: the ATI3M uses I.5 kg., the ATM^ 3.5 kg., and the ATM^
5.0 kg. per shift. (Evie Koo, The Textile Industry, Now and the Future, p.63) . One shift a day is assumed for the ATBM, and two shifts for the ATI-Is, and 2h0 days a year for all looms. (iii) Knitting: there is no information on the input capacity of the
knitting machines, but Table "iS provides a capacity (2^0 days) of 4,250 tons in 1959. This represents about 6.55^ of total v/eaving requirements.

197
TABLi; 29
SUPPLIES OF KAV; KATEPJ iLS I95O - I962.
RAW COTTON (tons) YASI S (tons)
Dom- Imports Total r a t i o Dom-e s t i c of e s t i c Prod- supplies Prod-uction to uction
require-ments
Imports Total r a t i o of
supplies to
require-ments
1950 1,363 2,860 4,223 — ^,450 15,317 17,767 36 1951 738 4,042 4,742 - 2,943 5,812 8,755 16 1952 300 4,071 4,371 71 3,709 8,228 11,937 22 1953 223 5,078 5,301 82 4,567 12,959 17,526 34 1954 304 5,684 5,988 63 4,902 14,374 1^276 37 1955 173 7,116 7,289 77 5,531 17,957 23,488 40 1956 150 7,841 7,991 69 6,144 20,465 26,609 45 1957 158 9,327 9,485 82 7,246 10,554 17,800 22 1958 N.A. 8,124 8,124* 69 7,898 16,868 24,766 30 1959 N.A. 6,493 6,493* 55 5,826 20,486 26,312 -
1960 50 11 ,117 11,167 94 6,000 49,342 55,342 57 1961 104 12,157 12,260 — 8,114 50,263 58,377 -
1962 57 10,591 10,648 68 7,134 29,542 36,676 22
Sources;-
Paw cotton production, 195C-57, Panglaykim. Some Facts and Figures of Text i le Production in the CoTontry, p.26,
Tarn production, 1950-5^, Ibid, p.2?. xRaw cotton production 1960-6^, from P.P.Serat , Department of Agric-ulture, Djakarta, November 1964. (these f igures are actual ly for 1959-60 to 1962-63). Imports 1960-62, Stat ist i ic Kon.junktur, January-April, 1963»PP«5^-7» Imports 1963. Business Nevjs. 5 .7 .65 . Yarn production 1961-62. Usaha Pembangunan, Department of People's Industry 1964.p.2. Yarn production 1955-60. Sadl i , Hulia, Kadarijah, Zain and S u l t i . Kasalah Pertekstilan_Dewasi I n i . p . 15 . Raw cotton and Yarn roduction. 1950-59. S t a t i s t i k Kon.junktur 1956. pp.50-1; 1961. PP.5S-9.
* This fip-ure assumes there was no domestic production.

198
Unfortunately information on stocks could not be obtained and it is
doubted v;hether it even exists. The figures for utilisation rates v/ere
calculated on the assumption that no stocks v;ere held, or if they were
held, they remained at a constant level. Stocks are known to have
accumulated in the periods of heavy importing of 1951 and 1959-^0. But
if utilisation rates were calculated for longer periods, say two years,
the effect of this kind of error might be reduced.
The high rates of utilisation in the spinning industry could have
been due to the definition of capacity of 260 working days a year.^
There is a tendency in Indonesia for the spinning and finishing fact-
ories to be open on some days v/hen other factories close because they
have capacities less than those of the weaving and knitting sections.
Nevertheless, a comparison of spinning and weaving utilisation
rates shows an extraordinary disparity between levels of activity
v;ithin one industry. Moreover, the fluctuations in these rates v/ere
much greater for v/eaving than for spinning. If knitting requirements
were included the utilisation rates for weaving v/ould be lower.^
Information on supplies after 1962 are not comprehensive, and the
available data come from several sources. Domestic production of cotton
declined in the last fev/ years and was reduced to an insignificant
1. See Chapter VII, 'Protection and the Influence of Inflation'.
2. The Department of People's Industry uses 300 working days a year
but t is is thought to be unrealistic,
3. In 1959 the knitting industry could absorb ^i-,259 tons of yarn (See Table 13), In 1962 this v/as probably about twice as much, or about 8 per cent of weaving capacity requirements.

199
share of total supplies of cotton in I962. As might be expected under
the import replacement plan for spinning the domestic production of yarn
rose faster than imports of yarn. The former ap^;roximately trebled over
the twelve-year period while the latter increased a little more than
1 100 per cent.
The low figure for I951 marks a period of keen competition from
cloth imports and the overstocking 01 imports, resijlting from a mis—
2
calculation of demand. Figures for the period 1957-58 show a severe fall
in utilisation due to the harsh import regulations of June 1957 when all
import costs were greatly increased and raw materials v;ere not provided
v/ith strong tariff protection,^ In the I96OS the depressed state of
the whole textile industry was due to a general foreign exchange shortage,
iJofflestic production of cotton v/as kOO tons in 1963* Agreements
signed with the U.S. under P.L.^So betv/een 1959 and I96O provided for
0 U.S.23 million of raw cotton for 'direct use' and million of y a m
to be shipped to Indonesia after it had been processed from raw cotton
by a third country,^ This amounted to 5i1^3 tons of yarn and about 36,000
tons of rav/ cotton which, was more than enough to account for the
recorded imports of cotton in 1959 to 196I inclusive, without any other
supplies being imported. The consigiiment of yarn, on the other hand,
represented only about h per cent of total yarn imports for the same
1, Yarn imports experienced large fluctuations and it is difficult to estimate a long term trend for them,
2, Heport of the Java Bank 1951-52. p,190
3* Interviev/ at Department of People's Industry, Djakarta, November 196^,
Unpublished data, Djakarta, Hay I965.
5. U.S. Smbassy, Djakarta. 9.11.64.

200
period. It is possible that since these figures came from U.S. sources
part of the raw cotton which v;as designed to go for direct use in
Indonesia v/as sent to a third country for processing. Total P.L. +oO /
cotton and yarn amounted to approximately per cent of total imports
of cotton and yarn between I960 and 19^2 inclusive.
Another a 'reement under P.L. 480, signed in I962 provided for
^16.5 million of raw cotton to be processed in a third country and sent
on to Indonesia, and 19.8 million of rav/ cotton for direct use. This
consignment was in four parts, and the last never arrived because of the
government's policy of Confrontation towards Malaysia. At the most,
only million of the million of direct use cotton arrived but
it is not knox'm how much of the yarn from third countries arrived.^
Therefore, although about k6,000 tons of cotton and yarn were due to be
sent, possibly not much more than 25,000 tons were received. Total cotton
and yarn imports in 19^2 were of the order of ,000 tons, so that even
if 1965 imports were as much as the I962 figure, P.L. ^8o supplies were
approximately 31 per cent of total supplies. It is thought that I963
imports were a great deal less l^ar the share of P.L. ^8o supplies
therefore much higher. One report states that 7^,^00 bales (or 15,370
tons) of yarn were received in 1963,^ This is less than half the I962
level of imports.
1. Ibid, 2. Betv;een i-iarch and December I962 ^U.S.5.7 million of raw cotton
arrived in Indonesia, and between April and December I965 another 03,9 million arrived. There were no further shipments of direct use cotton.
3. Business Hews. Djakarta. 25.2.65.

201
As the foreign exchange situation deteriorated the covmtry caxp.e to
rely heavily on P.L. raw materials. \Ihen they stopped in 196^ the
textile industry virtually stopped also.
In 1964 2,250 tons of ysa-n arrived from China on credit, i-t is
believed a small amount arrived from third countries under the P.L. A-SO
agreement signed in I962. Domestic output was 7,000 tons of yarn.^ There-
for, it can be concluded that total yarn supplies in 196^ were not much
more than 10,000 tons, representing less than 10 per cent of v/eaving
capacity requirements.
The very high utilisation rate for I96O was in response to the
preceding disastrous years when the shortage of textiles produced an
enormous rise in textile prices.^ The general level of activity in the
weaving industry is a reflection of the efficiency of the government's
protection policy which is discussed in Chapter VII. It is worth bearing
in mind that large quantities of cloth were being imported v/hile this
underutilisation was being tolerated.
Planning of imported raw materials.
Pre 1959:
^efore 1959 the planning of textile raw materials was sporadic
and influenced by the immediate past experience of the industry and the
strength of its lobby. The years when there appeared to be planning v/ith-
in the period I95O to 1959 v;ere years v/hen the state pf the balance of
1. Comr.'iercial Advisory Foundation of Indonesia, Djakarta. Circulation h y / m - l M ,
2. Unpublished data, Djakarta, kay I965. 3. There was an 82 per cent rise in Djakarta textile prices between
1957 and 1958. This was much greater than for other goods.

202
payments required the imposition of quantitative restrictions and at such
times the goverriment was obliged to demonstrate its support for the
textile industry in specific terms. It is true that when quantitative
restrictions v/ere irttposed the textile industry usually, though not alv/ays,
received favoured treatment, but at other times it was expected to be able
to compete with other imports, including finished textiles, assisted
only by tariffs. If it failed to do so direct intervention was not
automatic. Moreover, it was obvious on several occasions that within the
government administration the left hand did not know v;hat the right hand
was doing. Encouragement to domestic manufacturers would be given by
greater tariff protection v/hile at the saine time this protection was
being undermined by inflation v/hose influence might have been prevented
by quotas. At other times there v;as uncertainty as changes in Cabinet
led to a revex-sal of the privileges formerly extended to the industry.
The availability of supplies of raw materials was the result of a
trial and error policy v;hich caused great uncertainty and lack of
confidence amongst textile manufacturers. However, the resulting fluct-
uations in imports of raw materials v;ere short run and the data in
Table 29 s'.'ow a steady annual increase between 1951 and 195^. 'Therefore,
in spite of the fact that during this period there v;as no obvious single
instrument of planning for rav; materials which could be said to charact-
erise government support for the industry the supply of yarn rose
steadily, although capacity utilisation rates could not be said to do
the same.

203
The steady increase night be considered as evidence that, on
balance, import policy was favourable to the textile industry and, there-
fore, that some semblance of planning was constantly in the background.
However, at the sair.e time, foreign exchajige earnings and imports of
finished textiles fluctuated greatly, and, v/hen in 1953 and late 1955
cloth imports enjoyed a large increase, yarn imports reflected only their
moderate long ruti trend upv/ards. Therefore, while the industry enjoyed
progress until 195^ it v/as not permitted to enjoy bonus exchange earnings
or to presume too much on the profitable trade in finished textile^
imports.
There is no reason to believe that the government deliberately
intende:A this to happen. v.Tiat is of interest here is to demonstrate how
the type of intervention in supplies of raw materials to the industry
which the government c.iose led to this situation,
1. ^"rogress I95I-56:
Chapter II described the difficulties facing the industry in I950
and the outcome of the monetary purge and rise in import prices. One of
the consequences of the liberalisation of the quantitative restrictions
of that year was that in the prevailing domestic inflationary situat-
ion there was a shift from production to competitive imports. Added to
this v;as the unfortunate miscalculation of market demands which resulted
in an overstocking of imports, particularly of finished textiles, because
the backlog of demand from the war years had been satisfied sooner than
expected. Traders released their stocks in an attempt to restore their
liquidity and the fall in textile prices meant that weavers could not

204
produce except at a loss. This was the reason for the sharp fall in
imports of yarn (shov/h in Table 29) which was the base from v;hich later
supplies improved.
In August 1952 surcharges v/ere imposed on all textile imports
1
except rav/ cotton, yarn, and the simpler forms of textiles, but a credit
restriction policy in that year acted to reduce all imports, ajid rav/
material imports were unable to tal^e advantage of the tariff protection.
A revision of surcliarges in January 1953 reduced the tariff
advantage vmich rav/ materials enjoyed over finished textiles imports but
the effect of this v/as partly eliminated by a reduction in all imports
in the first quarter of 1953. '•rnen the foreign exchange shortage became
acute yarn and cotton imports v/ere guaranteed by quotas in I'ay 195^ v/hile
imports of finished cloth fell sharply. Chart I shows the rise in yarn
imports in the second half of 195^ and Chart II shov/s the enormous fall
in cloth imports. The i^epartment of Industry was granted an .allocation
of foreign exchange v/hich it divided between raw materials and finished
textiles. There is no reason to believe the textile industry suffered
more discrimination at this time than at any other time. In fact, the
position appeared very favourable to the textile industry. It was, there-
fore, most unfortunate that the government chose tha.t period in v/hich to
devise a scheme for controlling imports of all textile materials. In 195^
the Jajasan Perbekalan BajriaXL-2 Perindustrian (J.P.?.- Foundation for
Supplies of i- aw materials) v/as established with the responsibility
1. V/.M.Corden and J.A.C.Mackie. I'alayan Economic Preview. Vol.VII.
N0.I. April 1962. p .
2. Report of Bank Indonesia 195^-55. P.103

205 X.
of fixing quanities and qualities of textile materials. 'The - enten.-:: /f
importers and officers of the J.P.P. v;ere IndonesiaASoi little e:qDerience
and there were many complaints irom v/eavers of wi^ong Quality yams.
the Foimdation was first established import quotas prevailed and the
general shortage of raw materials , justified some kind of controlling
agency, but the morale of its officers v;as such that the Fomidation was
soon indulging in illegal manipulations of stocks in its care and
aggravating a situation it v/as designed to prevent.
In 1955 ii spite of much larger imports there v/as speculative
hoarding in yarn and the textile industry v/as reported to be functioning
at only 50 per cent of capacity. ./hen it v/as seen that there v/as little
reason for continuing this complex system of control, part of the import-
ing of textiles was freed v/hile yarn imports remained controlled. This
provided cloth imports v/ith an advantage over yarn imports at a time v/hen
the balance of pay ments v/ould have favoured good supplies of all commod-
ities, and the situation was only rectified in September 1955 v/hen the
activities of the J.P.P. in the field of textiles were terminated.
A month after the nev/ abinet took office in August 1955 quotas 2
v/ere abolished and yarn imports were dependent for protection on sur-
criarges whose effica.cy had been eroded by several years of inflation 1. J.P.Meek. (The Government and Economic Development in Indonesia,1950-
p.267) has suggested that this was due to inflation. But inflat-ion accompanied by a reduction in quotas v/ould have led to anticip-ations of cheaper cloth imports in the future and the utilisation of stocks of yarn in the present. It is more litcely that specvilation v/as the aftermath of previous greater shortages and the fear that scarcity v/oulu return in the next year or so. "^ertainly the irregular import policy up to that date v/as sufficient to provoke such expect-ations.
2. 'e-oort of ^ank Indonesia 1955-56. p. 113

206
(although there wa.s a. SuisXX reshuffling of surcharges in oeptember) • The
result of this sudden release of overseas competition v;as the sharp fall
in iraports of yarn v;hile imports of finished textiles proceeded to rise.
• here followed a short-lived period of prosperity for the textile
industry betv/een the first and fourth quarters of I956 when supplies of
rav; materials were assisted by special credit measures. In November 1935
prepayments were rescheduled for industrial rav/ materials by allowing
the alternative to importers of a 75 per cent prexDayment without the
burden of the surcharge, or a 50 per cent prepayment plus a 50 per cent 2
surcharge. Charts i and II illustrate the gain made by raw materials
and the decline in cloth imports. V/hen Banlc Indonesia reduced its credit
facilities for importers' prepayments in July I956 national importers
of capital goods and rav/ materials v;ere given favoured treatment. Sur-
charges could be paid by them v/hen shipping documents had arrived at a
bank in Indonesia instead of at the time of making the application for
an import licence. In the conditions of limited working capital prevail-
ing at the time, this was of great importance particiilarly since
inflation had v/eakened the competitive position of the industry since the
last devaluation.
Credit policy v/as the main reason for the strong position of rav/
material imports in 1955-56. A reclassification of surcharges in Sept-^ § ember I956 reduced duties in general and left raw cotton" and yarn
1. See Charts I and II 2. Report of Bank Indonesia 195-3-56. p.151 3. n.O.ochmitt. Monetary Policy in the Political economy of Indonesia.
Chapter p.5. 1958 h. Ibid. Chapter k, p.11 5. .-.eport of ianl;: Indonesia 1956-57-p. 120

207
duty free, but the level of tariff protection to the textile industry
was less. By the third quarter of the year the vifarehouses were full of
yarn because of financial difficulties encountered in their clearance^.
The record rate of capital utilisation of per cent in I936 was due to
the high level of imports in the first half of the year,
2. Protecting the economy before the textile industry, 1957-58^
In 1957 the problems of the economy as a whole required fxill
attention and the issue of support to domestic industry was considered
less important. In June the Bul-iti Slcspor (B.S.) Inducement Certificate
2
was introduced for all imports. The reclassification of surcharges was
not sufficient to offset the inevitable large increases in import costs.
Moreover, the current inflation had the effect of diminishing the benefit
of tariff protection. Imports of yarn declined after mid 1957 but rose
again in early I958 largely because of the extra credit facilities made
available to essential imports to comiter the effect of the B.E.
Certificate. But these tv;o years talc en together were disastrous for a
large part of the weaving industry and helped to introduce, in 1959j the
system of direct planning of raw materials.
Departmental planning,
The experience of 1957 and the erratic supplies of raw materials
since I950 had a profound effect on government attitudes towards the
textile industry.
1. W.iM.Corden and J.A.C.i>,ackie. op.cit. p.51
2. Ibid. p.'^5

208
lihen the Dutch importing houses, the Big Ten, were talcen over in
April 1957 this provided an opportionitj for increasing the amount of
direct government planning. Newly established liu-ited companies, P.'r.-2 1 Kegara assumed the functions of the Dutch compeinies until the Ferus-
ahaan-2 Dagang Negara (P.D.N. - State trading Enterprises) were instit-2
uted in their place. Seven of the nine enterprises which were formed
immediately undertook most of the importing of cotton, yarns, and
textiles amongst other imports.^ In April 1959 they were given the sole
right to import rav; cotton, yarns, and textiles.
The shortage of foreign exchange compelled the government to
introduce a system of exchange rationing 3.nd it became the responsib-
ility of the Department of Trade to receive requests for foreign exchange
from all departments, including itself, and to allocate foreign exchange k according to its ov/n discretion. The total a iount to be allocated araongst the departments was
decided by Bank Indonesia and the Cabinet by an uncertain procedure.
Since the foreign exchange shortage had caused a rise in the exchange
rate the government feared that unless part of its dollar earnings was
set aside for rav/ materials at a loi*; exchange rate the textile industry
would become a high cost industry relative to those industries not
requiring imports of raw raaterials. 'Tlius the allocation of foreign
exchcinge was made at a favourable rate. 1. J.Panglaykim. State Trading Corporations in Indonesia, 7irst Year's
Perforaa-nce. p.6 2. J.Panglaykim. aconomi dan Keuaagan Indonesia. Vol.XVI.i'o.2.1963. 3. The seven State Trading -:nterprises were Aneka, Tri, Budi, Sedjati,
Djaja and Harga. h. Interview at the Department of People's Industry, Djakarta. 10.1.65.

209
In ig6l the allocating authority v/as transferred to the Kinister
1
Coordinator for -development v;ho relied on 'I'rao:e jJepartrnent officials
for guidance.
-c ach department made a list of import requirements for the 2
industries which came under its control, oince the clothing production
prograjnrne was ujider the jurisdiction of the -department of People's
Industry the control and level of the activity of the textile industry
was the responsibility of that department, - - ecords of the licenced
capacity of each manufacturer and, therefore, the full capacity input
requirements of the total industry, were knovrn by the j^epartraent. The
request v/as then passed on to the exchange allocating authority and
returned after a reduction had been made in the final account. The only
pov/er v/hich the department of People's Industry could have used to
strengthen its case was to v/rite a covering letter stressing the import-3 ance of individual industries.
1. This Minister Coordinator had under his jurisdiction the -departments of Banking, Labour, I'ational Research, People's Industry, Infrastruct-' ure, Manpower, Basic Industry ajid Mining, Development, Veteran and Demobilisation.
2. -he size of the application v;as based on two criteria; per capita requirements of cloth (a Cabinet decision) and domestic capacity. Although these estimates might have been quite different from each other they v/ere always made as the preliminary figuresjfor the final calculation. (Interview at the Department of People's industry, Djakarta. 10.1.65).
3. The application was made in October of the year preceding,that of the projected imports and the allocation was normally granted in ^^arch-
August of the^relevant year. Because of the lengthy procedure of being granted an official allocation of foreign exchange the depart-ment usually awarded about 75 per cent of the contracts to the F.D.Hs. months before the final exchs.nge allocation was made. In 196^ when its application \^as halved there was some embarrassment when it appeared
that orders already negotiated had to be reduced. (Interview at depart-ment of People's Industry, Djakarta. 8.3.65).

210
During the period v;hen the Department of I'rade was deter-':iining
imports (which in effect was until October ^96h) the textile industry
received a serious setback. The Bepartment of 'Trade entered as a direct
competitor with the Department of People's Industry by being responsible
for the importing of constimer goods, notably finished textiles. VaTien
Cabinet decided cloth supply per head of population it did not specify
how this was to be divided between imports and domestic production. The
Department of Trade's ovm allocation of foreig-n exchange for i:nporting
textiles aroused bitter feeling within People's Industry v/hich pointed
out that while the domestic industry was short of raw materials the
•department of •'•'rade was provided v;ith a mandate to estimate market
demand on a quarterly basis: their own textile goods imports v;ere not
planned ahead in the detail required for raw materials. The Directorate
of Imports (within Trade) reviewed the textile market quarterly and
calculated by how much domestic production had failed to meet demand.
On the basis of this deficiency it utilised the foreign exchange in its
care for finished goods imports.
The only possible justification for the importing of such large
a-iounts of finished textiles was the need to strengthen the financial
position of the r.D.Ns. These Enterprises had always suffered from
liquidity problems and they required quick and large profits. They were
compelled to handle all kinds of exports and imports, some of which
produced very small, if any, profits. It v/as very much a matter of
'what is lost on the sv/ings must be made up on the roundabouts'. Imports >
particularly finished cloth imports, offered very large profits.
1. Interview at the Department of People's Industry, Djalcarta. l4.3.65i

211
The directors argued that i f they were to continue to function smoothly
as a govermaent instrument, they had to be given an occasional bonus to
help them financially.
^ecause of the increasing scarcity of foreign exchange and the
influence of the Department of Trade's role in importing, the textile
industry was unable to take full advantage of the exchange allocation
system and the <favourable exchange rate.
Chart I shows the decline in the level of activity after I96I and
Table 29 indicates the rate of utilisation of weaving capacity was 22 per
cent in spite of the availability of foreign exchange for cloth imports.
'^he total amount of foreign exchange offered all government departments
p in 196 - was only 0XJ.8.2^0 millions . " The application from People's
Industry was halved. In September 196^ an allocation of ^55 ' 22
millions for textile raw materials was made to People's Industry^ (for
the year 196^) representing about 30 per cent of capacity requirements.
/mother factor which caused uncertainty in the textile industry
and waich increased its competitive ability v;as that in the 1960s yarn
was purchased on credit offered by India and Pakistan on condition that
1. In August 1959 allocations of yarn made on the basis of current
supplies were 35 kg. per month per shift for the ATBM, 90 kg. for the
ATi-f (width I ) , and 135 kg. for_the ATM (width 2 ) . (Staff Working Paper
at the Department of People's Industry, December 196^) . This was
enough for 23 working days a month for the ATBM, 26 working days for
the ATM (width I ) , and 27 working days for the ATM (widtlT2), one shift
per working day. In I96C and T96I it was planned that the domestic
industry should produce 6 0 per cent of total cloth supplies (or six
metres per capita) and 40 per cent would be imported. (Departmental
memorandum- People's Industry - by Hirawan, pp.19 and 21 . 1964) . Both
programmes were about 8 0 per cent achieved, according to this report.
2 . Interview at the Department of People's -^-ndustry, Djakarta, 3 . 6 . 6 4 . 5. Oepartmentsl memorandum (People's Industry), 6 . 9 . 6 4 . This decision
later overruled by KOTOE (see later in this chapter).

212
their ovm yarn was bought. Lack of supervision of these contracts caused
large delays before India and Fa]:iistan could orgaxiise the export of yarn
and frequently it wa.s of poor or inappropriate quality, liany weavers
found they could not use their yarn allocations on their ovm liiachinery.
The quality of the cloth v/as dependent on the quality of the yarn. If
credit had not been tied to purchases from creditor countries some of
these difficulties might have been avoided.
i rivate indenting continued through to 1964. In I962 3.I.V.A.
inducement Certificates , v;hich amo-unted to nearly free market price
dollars, could be rjssed to import anything. T'here was a period of several
months after V.aj I963 when imports of all textiles materials were free
from allocations. The effect wa.s a rise in cloth imports and a fall in
yarn imports. The government then aJ-lowed a special 'replacement' exchange
rate for yarn imports^ v/hich promptly increased. In fact, stocks of yarn
were built up in mid 1963 some of which were s ill in existence in late
1964.^ But because of the large imports of finished textiles this period
v/as of limited benefit to the textile industry.
Private indenting after 1959 was not of importance to the industry
as a whole.
In 1962 it was a smaller proportion of total supplies although
it might well have been more important in absolute terms than in 1964;
but it would have made a significant difference in output to the most
efficient firms only.
1. On .--arch 5, I963 the 'Surat Izin Valuta Asing' Inducement Certificate was introduced.
2. Interview at the Central Bureau of Statistics, Djalcarta, 4.5.65. 3. Interview at the Department of People's Industry, Djakarta, 8.3.65,

213
In 1964 the S.P.P. (Inducement Certificate) dollar was used for
private indenting of the P.D.Ks., but as this was virtually the same as
importing on blackmarket dollars it was very expensive. Officers at the
department of People's Industry believed that about 20 per cent of total
yarn supplies in v/ere purchased on S.P.P. dollars. This represents
about 1 per cent to 1.5 per cent of capacity requirements.
Distribution of all supplies.
The distribution of raw materials shov/s how and to v/hat extent the
free market in official allocations developed. There was never effective
control over this system, and together with private indenting of imports
it meant that manufacturers v/ere faced v;ith a predominantly free market
supply of yarn.
Official allocations:
Before 1959 there were tv/o occasions on which official allocations
of raw materials for the textile industry were made on a selective
basis in an effort to protect the smaller manufacturer from the competition
of the larger, more efficient, manufacturer in the weaving section.
At the beginning of 1955 the government offered the small scale and
part of the medium scale weaving industry yarn allocations through the
agency of the J.P.P. , but these were stopped in September of that
year. A second attempt at selective intervention was made in 1957
1. Soehirman. Problems of the Yarn harket in Indonesia, p.28

21^
when the government offered KOPTEIvSI , the small weavers' cooperative,
yarn at a controlled price for distribt;tion amongst small v/eavers on
the understanding that the cloth vrould be retxirned through the 1
cooperative to the government at a predetermined price.
This policy of selective support came to an end in 1959 as a
result of two important events.
First, in December 1957 Dutch enterprises v/ere taken over by the
government. This did not have an im::iediate effect on the supply of raw
materials because most of the relevant goods were imported by national
importers and, moreover, the Dutch importing houses were managed along
their established lines of business by Indonesian personnel. Imports
were affected in the short run only in so far as Dutch enterprises had
purchased goods from Benteng importers and assisted them financially
v.dth advance payments. But the government saw a chance to overcome the
inefficiency of the import trade which had arisen through inexperienced
and 'briefcase' importers^ by re-organising the big importing houses
and the J.P.P. with new firms. In April 1958 the newly formed Perusaii-
aan-2 Dagan^ I'egara, the P.D.Ws., undertook to import much of the supply
of textile materials. About 95 per cent of all imports passed through these
organisations. In April 1959 the P.D.Ns. were given sole rights of
imports of all textile .materials. It was hoped that a more straight-
forward and better supervised distribution system would result.
oP 1. Kadarijah. Development of the Indonesian Textile Industry. P-
2. This v/as the term given to Benteng importers who obtained import licences on behalf of other businessmen, usually Chinese.

215
Second, the depression in the textile industry in 1957 and 195S
left a strong impression on the government, ^he weaving industry as a
whole had operated at 22 per cent to 30 per cent of capacity and there
had been a large namber of closures amongst the weaker firms. It was a
situation which the government determined should not be repeated. lu
1958 plans v/ere drawn up to organise yarn supplies to a.11 v;eaving enter-
prises by a systera executed by the Department of People's Industry. In
order to explain how the allocations system failed it is necessary to
dijt ress into a description of the roles of the several agencies which
had a share in the cumbersome distribution procedvire.
1. The role of the J.P.P.:
In 1955 and 1958 the J.P.P. v;as held responsible for allocating
yarn to s;uall v/eavers and for holding yarn stocks in order to stabilise
the free market price. In the latter period it v/as decided to direct
per cent of yarn imports through the Foundation for distribution through 2
the cooperatives, SOTSISI and K0TM3I, to their weak - • members. Ihxs
arrangement v;as provoked by the closing dovm of many of the smaller
weavers in previous years. The cloth v/hich v/as prcuuced from these
allocations was also to be distributed by the J.P.P. The other 60 per
cent of yarn supplies was to be distributed freely ainongst enterprises
of all sizes.
1. '6ee Table 29
2, ooehirman. op.cit. p.31

216
2. The role of the Department of People's industry:
Before 195o the Department of People's industry undertook to prov-
ide yarn to smaller firms during periods when official allocations were
made and when the J.P.P. v/as not operating.
After April 1958 the department placed orders for raw materials
with importing houses on the basis of the final allocation of foreign
1
exchange it received for supplying all firms,
The amount of yarn per machine was determined by the Department
but the actual quantity offered each factory was fixed by the textile
cooperatives on the basis of capacity licences re.-:istered v/ith the
j^epartment. Any enterprise v/. ich did not have a licence did not receive
an allocation.^
3, The role of the Price Control Office:
There has been official price control of all imports of raw
cotton, yarn and finished textiles, including those finally allocated
1. The distribution of orders betv/een the P.D.Ks. depended on the extent of each Enterprise's activities in the past (under another
name) and on personal contacts in the i^epartment.
2. The Department divided supplies of raw cotton between the spinning factories according to their capacities and included their produce in total supplies of yarn \inder its jurisdiction. But in the case of weavers and ioiitters the i^epartment did not calculate the amount awarded to each factory. It merely instructed the cooperatives on how much yarn v/as to be allocated to each type of loom or knitting machine and then distributed the yarn supplies amongst the coop-eratives, in proportion to the total requirements of each cooperat-ive in that region. The actual calculations per manufacturing est-ablishment were made by the cooperatives. No recognition was given to the size or level of efficiency of the factory. However, the state-ovmed weaving and knitting factories were knovm to receive
a Slightly larger allocation per machine and it is thought that this
was also true of state spinning factories.

217 1
by serni-government organisations, since 1951. "-'av; cotton, yarn and
cloth v/hich vrere produced in -ndonesia and which v/ere chanixelled through
these organisations v;ere priced as if they had been imported. Although
the prices of private imports and official allocations of yarn vi/ere fixed
by the price controlling authority in identical manner, control over the
former v;as never effective and it v/as this state of affairs vmich led to
the official distribution ox yarn by the allocation system.
^he price of imports v;as fixed at landed cost plus a percentage
mark-up which was supposed to raise the price to between 70 per cent and
100 per cent of the free market price. From 1951 to ..ay 19^3 this ma.rk-
up stood at 25 per cent of landed cost. In i.ay I963 prices were freed but
soon afterwards the government offered a special rate of exciiange to yarn
importers which v;as intended to help replace dwindling stocks, .n
iiovember I963 the governing body of the r.D.I.s. returned the price to
landed cost plus 25 per cent, because this still represented between 70
per cent and 100 per cent of the free market price. But in January 19o^ it
believed that the free market price allowed a mark-up of 95 cent,
there v;as a great deal of unfavourable reaction to this from the textile
cooperatives and as a result the price v/as reduced to landed cost plus
45 per cent in i-ipril 196^-.^
1. I-rom 1951 to 1957 price control v;as the responsibility of the I.iniscry of economics which'was succeeded by a sub-department of the^Jepart-ment of Trade, knovm as the i-rice Control Office. In --ay 19o3 the governing body of the F.I;.i;s. appears to have assumed authority over prices of imports with the -rice Control Office assisting it with advice. In October 196^ M 0 5 (see later in this c'na.pter; was cnargea with the duty of price determination of textile raw materials.
2. This was the same as for imports of finisl.ed textiles. 3. Interview at price Control Office, ii/jaicarta.

218 if. The role of the P.D.Ws.:
The influence of the P.D.Iis. in the distribution of raw materials
rested v/ith their control over supplies imtil manufacturers had paid
for them. Advance payments amoixnting to about 70 per cent of the
value of the imports were made at the time when the cooperatives and
the QF.Ss indented the P.D.Ms. on behalf of their members. The practices
of the P.D.Ks. in relation to advance payments required, allocations
withheld, and so on, varied from area to area. Sach regional branch
was permitted some autonomy but in practice assumed as much autonomy
as it chose.
5 . The role of the cooperatives aind the O.P.Ss.:
It was the function of the cooperatives to collect all advance
payments from manufacturers and pass them on to the importer at
the time the order was placed overseas. If the cooperative had funds
of its ov/n or v;as able to extract from the large manufacturers, in the
form of advance payments, a higher proportion of the full cost of yarn
than v/as required by the importer, it could assist the small weaver
by waiving the advance i^ayment requirement demanded by the P.D.K.
Before 1959, when only the financially wea;:er enterprises received
allocations, their cooperatives were usually able to obtain credit

219
from the banks or to persuade the importer to offer credit.
The raw materials v/ere then distributed through the locally
organised cooperatives v/hich v/ere under instructions from the j epartment
of feople's Industry to inform enterprises of their rav/ materials alloc-
ations and to circulate the lists of allocations per machine so that
manufacturers could check v/hether they had received their rightful alloc-
ation. It v/as the responsibility of the cooperatives to calciilate the
quantity of yarn received by each of their factory members.
j-n 19dO the cocpera^ive system v/as reorganised in order to increase 2
their functions and responsibility. .- 11 the small scale v/eavers v;ere
placed under the control of hOflluLoI v/hile the larger -he cooperative movement in the textile industry before I96O v/as very different in structure and v/as centred on the small and less efficient establishments. In 19^7 the Gabungan Perusahaan -enim Indonesia (Gaperti - Association of '.Veaving enterprises of Indonesia) was started to assist the smaller enterprises (although all manufacturers v/ere permitted to join). In I9p6 this -••ssociation was abandoned and its members joined the Ko^rasi Tekstil -i-ndonesia (KCPTEIC3I- textile Cooperative of Indonesia). xIOlEICoI consisted eimost entirely of hand-v/eavers. At the same tim.e the 'Central Crganisasi I'ekstil Indonesia (SCiEICoI- Central lextile Organisation of Indonesia) v/as established to cater primarily for the needs of pov/er loom v/eavers. -t v/as organ-ised by private individuals and did not iiave the degree of government control associated v/ith KOIESI. Both orgarisations offered credit facilities and arranged indents with importers on request. Organisasi Perusahaan Sedjenis (CPS- Organisation of Homogenous Enterprises) , v/ere set up in each indiistry and brought under a governing body, called the Gabimgan Perusahaan Sedjenis (GPS -Association of Homogenous Dnterprises), in that particular industry. In the textile industry there are six OPSs under the care of the GPS-Iekstil: covering batik production, handweaving, pov/er weaving, knitting, textile chemicals (finishing), and clothes-mal-cing; all in private and public sectors. Ihe pm-pose of this reorganisation v/as to replace the cooperative movement by associations of homogenous enter-•orises in order to isolate technical problems in the tpd'Jjstry.

220
firms v;ere organised in various associations of private enterprises
which assigned raajiy of the traditional functions of the cooperatives.
These associations, Organisasi Perusahaan Sedjenis (O.P.3.) were not
formally regarded as cooperatives in as much as they v;ere not tinder the
control of the department of Cooperatives (as was KOPTEKoI). They did,
hov/ever, make reports to the goverrjnent department responsible for
their industry, collected payments from factories, gave credit to their
members v/hen they could, and indented the P.U.lis. for allocations.
In some cases the coopei'a.tives and the C.P.Ss. undertook responsibility
for transporting the imported rav/ materials to local warehouses.
Through these new functions it was hoped that cooperatives and O.P.Ss.
would feel obliged to serve industry more consientiously, but at the
same time they provided the cooperatives and O.P.Ss. with greater power
over manufacturers. These re-organised cooperatives assumed control
over the distribution of allocations v/hich comprised the vast bulk of
all yarn supplies.
6. Corruption of the channels of distribution:
It is interesting to note that in as much as sales of
allocations to the fv ee market contributed to determination of the free
market price of yarn, the regulation laying dovm that official prices
should be between 70 per cent and 100 per cent of the free market
price is an official recognition of that illegal market. It also

221
reflects a desire on the part of the goverriraent to make fixed prices
1
reflect free market trends. Nevertheless, the difference betv/een
official and free market prices and the infrequency and irregularity
of supplies were sufficient to encourage manipulation of official
supplies of yarn.
In 1955 and 1958 officers of the J.P.P. found it profitable
to manipulate supplies of raw materials under the control of the
Foundation and to sell them to the free market. In September 1955 the
official allocations through the J.P.P. v/ere stopped in an attempt
to eliminate the blackmarket in yarn which had arisen. Ivhen, in 1958,
the J.P.P. re-emerged as the distributor of yarn, supplies v;ere low
and the allocations made by the J.P.P. to the small manufacturers were
very small. Once again manipulations of supplies developed and this
scheme of distribution was no more successful than the first attempt
in 1955.
Hov/ever, there v/as never effective price control because of an inadequate controlling apparatus and the official price v;as closer to the free market price than the regulation would suggest. Price estimates of landed cost plus the mark-up were returned to the Price Control Office but the cost on the invoices was not usually the actual cost to the importer. During periods of large imports prices v/ere relatively lov: and there was less need for price control. But as raw materials became scarcer and inflation increased the costs of distribution, price control became even less effective when it was needed most b^ manufacturers. There have been prosecutions but none has been successful. The officers at the price Control Office have become sympathetic to the problems of traders facing rapdily rising import and export costs. Because of the extent of inflation and the problem of replacement of stocks these officers ar._,ued that a profit of 30 per cent to per cent on top of the official price should be regarded as 'normal' profit, in 1964. They shov/ed no vri.i:i ingness to prosecute malpractices in invoicing because they believed importers were undergoing sufficient stresses.

222
Chart III shows the difference betv/een controlled and free
distribution of yarn before 1959• In the first diagram v/iiich refers
to the period 195 '-55 when the J.P.P. exerted strong influence, domest-
ic spinners were obliged to sell their produce to the "department of
•^eople's Industry which also undertook to allocate imported yarn. At
the same time some yarn could be imported freely by large manufacturers,
"'he red lines indicate illegal sales of yarn during periods of control.
The second diagram presents flov/s of raw materials under free market
forces v/ithout the intervention of the J.P.P.
After 1958 there v/ere four separate agencies responsible for the
distribution and pricing of these low-priced rations of rav; materials.
In the case of raw cotton^ control was maintained to a high degree because
of the sraall nui:iber of large eind modernised spinning mills in exist-
ence} but in the case of yarn^the authority of the agencies concerned
v/as progressively undernined from inside because of the increasing
temptations to officers of the agencies to manipulate supplies and
fimds placed in their trust. The temptations existed because of the
deficiency of yarn supplies in relation to weaving capacity and the
ability of some weavers to process higher cost ya.rn at a profit,
• he situation deteriorated because of the growing scarcity of supplies
and because of the effects of inflation on the smaller recipients 1 of yarn allocations.
1. See Chapter IV, 'Costs and Variations in Costs' for a full descirption of this effect.

CHART III
CONTi OLLIS FEES DISTRIBUTION OF YAHI BEFOIS 19^8
DIAGRAI"! A Controlled
223
overseas sup'oliers
domestic s'Dinners
Depextment of People's Industry
iv
nediuni 8: 'small firms
DIAGEAII B Free
overseas sii opliers
N/ xmpo:':ers, -Grader
ixrms
domestic " iners
of:? 'rE of maaJiloon to small firms
small & medium firms

22k
The P.D.Ns. also suffered genuine problems of working capital.
They v;ere responsible for exporting primary produce as well and this
involved the payment of advances to donestic traders. They could
ill-afford to supply the working capital of textile manufacturers as
well and v/ere quick to observe possibilities of overcoming this
difficulty by increasing their profits. In branches of the P.D.Ns.
v/hich were far from D jaicarta or any other centre of some authority
every form of malpractice flourished and the chances of a weaver
receiving his rightful allocation were considerably lower than if
he were in Djakarta.
'Manufacturers had been asked to advance to the P.D.Ks. 70 per cent
of the cost of the allocation at the time the order was placed overseas,
l.lien the yarn arrived the P.D.Ns. attempted to recover the remaining
30 per cent of the cost as quickly as possible. To do this they applied
pressure in the form of time-limits to manufacturers for the collection
of their allocations. Sometimes this time-limit was as short as two
weeks which included time spent in sending orders tnrough the mail,
^n many cases manufacturers v/ere unable to secure their rightful
allocation (even after long arguments and extra payments) and the
P.D.l-Js. annotinced that part of the allocation had been forfeited through
the time-limit.^ ^This yarn would be added to 10 per cent of yarn
imports v/hich v;ere permitted by the Department of People's Industry to be
sold by the P.D.Ns. on the free market to assist in their working capital
1. Interview at the Department of People's Industry, Djakarta. 8.j?.65.
2. It is not clear whether they were legally entitled to enforce these
time-limits, but nobody appears to have questioned it.

225 1 difficulties. Sometimes these tv/o sources of free market j?am couid
a-nount to 25 per cent of total imports. The infrequency and size of
these overseajs purchases caused big differences between fixed official
and post-allocation free market prices because of speculative fluct-
uations in the latter; this v;as further encouragement to increaise the
proportion of imports released on the free market.
cat ions designated for the small scale section of the ind-
ustry, in particular, provided the P.D.Ks. with opportunities of re-
imbursement of losses,through inflation, on exports and some imports.
The advance payments made by the manufacturers were often held in the import-
ing process for as long as four months. Often the smaller enterprises
could not afford to do this and they were granted credit by their coop-
erative or by the P.D.N, in exciiange for part of their allocation. Once this
practice was established it left the v/ay open for the P.D.Ns. to decide how
much yam was equivalent to the necessary advance payments; always referr-
ing back to their v/eak working capital position when challenged. The small
manufacturer who had difficulty raising funds might otherwise have to fore-
go his allocation. On rare occasions they were prepared to waive prepay-
ment requirements of the financially weaker firms but this was depend-
ent on the current liquidity position of the P.D.Ns.
-•jiother kind of malpractice in the distribution of y-rn was a result
of the re-ulation that the P.D.Ns. were to distribute the cloth produced
from yarn ellocations. In November 1959 it was decided that 100 per cent
1. Interview at the Department of People's Industry, Djakarta. O.;,.o5.

226
of this produce would be returned to the P.D.Ns. for distribution smongst 1
consumers. But this was never achieved for the usual financial reasons
and the regulation v/as suspended in June I96O. The system VJBJS re-introd-
uced in October I962 when 60 per cent of the production was to be returned
to the P.D.Ks. In ' arch 19^3 this v/as again suspended. In the whole period
since "lovember I960 the P.D.Ns. had tried to persuade producers to channel their output through their organisations by offering them incent-
2
ives, and in spite of the absence of axiy regulation enforcing this, 20
per cent of domestic cloth was distributed by the P.D.Ns. in October I961
and 0 per cent in March 1962.
Inuring the period when these regulations were supposedly in force
the P.D.IIs. were prepared to ignore them in exchange for part of the y3.m
allocation. A manufacturer might find it profitable to sell his cloth
produce on the free market instead of to the P.D.I s. at government fixed
prices, and to do this he would surrender part of his yarn allocation to
the P.D.Ns.
It was intended that the distribution system would be safeguarded by
compelling the cooperatives and the O.P.Ss. to circulate lists of author-
ized allocations amongst manufacturers. However, in practice the circulat-
ion of these lists did not guarantee manufacturers their allocations
because the O.P.Ss. sometimes maintained there was not enough yam to meet
the 'per machine' allocations and only 75 per cent of the proper allocat-
ion would be finally offered the manufacturer. 1. Inter-ziew at the Department of People's Industry, Djakarta, 20.3.63. 2. Panglaykim. oi-.cit. p.^0

227
Advanced payments v/ere made on this reduced anount ejid, through the
procedux'e of the time-limit or by some other method, fxirther supplies
v/ere withheld by the P.D.Us. Thus in some cases a manufacturer with
enough money to purchase a,s much yarn a.s v/as offered him at the official
price was offered only about ha.lf (70 per cent of 75 per cent) of his 1
rightful allocation.
Eventually even the lists from the Depsirtment were not circulated
by the O.P.Ss. Some manufacturers complained directly to the Depsjrtment and the latter questioned the O.P.Ss. on their method of distribution of
2 yarns. They replied that because of their poor liquidity position they
were forced to retain pojrt of the yarn to sell at a large profit on the
free market; otherwise they could not continue their fimction of offering
credit to the vieal-cer firms. This argument apparently sa.tisfied the
Department and manufacturers no longer attempted to appeal agairist the
abuse of the allocation system.
Chart lY shov/s the differences between legal and illegal chejmels
of rav/ ma.terials distribution.
Through legal chajinels the P.D.E. directs private indents to the
large firms. But these indents are illegally supplemented by the
illo.go.1 sales of allocations from the P.D.Hs. direct to the large manu-
facturers. All the free m3.rket yarn finally converges on the large 1. Complaints were lodged v/ith the G.F.Ss. but it was argued that this
was the lavlt of the F.D.Ks. It has become clear from iXOr'S Reports in February I965 that the O.F.Ss. ejid P.D. Hs. were working closely to defraud manufacturers,
2. ICC'TC'E (Kommando Tertinggi Operasi Elconomi) Clothing Team's Heport, February 19^5•

CHART IV
LSGAL AIJD ILIJ GAL DI3gra3U?I0'i-I OF YAxS'I .\FTE5 19^8
228
Diagram A Le;:al channels
overseas supt)liers
P.D.N
smr-.].l & medium fimis
domestic spinners
.P.S.
(part of domestic produce)
I large firms
Diagram 3 Illeggl channels
^ % ^large firms

229
firms. The differences between this diagram and Chart III(before 1959) is
the strong and direct relationship between the importer and the cooper-
ative in the post 1958 system. The Depajrtment of People's Industry appear-
ed to follow a passive role in the distribution of yarn.
Sstimates of the amount of yarn reaching the free market vary. Some
manufacturers claimed in interviews that well over half of the total
supplies in 19^3 snd 196^ passed through the free market. In as much as
the P.D.Ns. were entitled to freely sell 10 per cent of their raw material's
imports part of this free market v;as not illegal. But if illegal sales by
the P.D.Ks., the O.P.Ss. smd the small majiufacturers are added to this 10
per cent, it is not difficult to imagine that half of total allocations of
yarn passed through the free market.
In spite of the malpractice of the O.P.Ss. there was ana attempt to
defend these organisation on the grounds that they had informed personnel
who knew the problems of the industry better than others. They were said
to be an improvement on the former cooperative system, because they
provided advice on technical problems and gave cohesion to the industry
by being a businessmen's association. It was clear that if the O.P.Ss.
were disbanded something else would have to replace them. It was not until
IXTOE devised a method of importing and distributing which took the
function of collecting payments from manufacturers away from the O.P.Ss.
that the problem was solved.
1. See later in this chapter for further detail about KOTOE.

230 Free distrib-ution:
Cotton and yarn could alwa.ys be imported privately on demand irom
coopera.tives and private manufacturers but after 1958 the universal alloc-
ations sclieme greatly diminished these orders. Because of the Benteng
programme the first stage of distribution v/a-s in the hands of indigenous
traders. But other persons were still able to use their influence in the
importing business through their superior finejice, and the distribution
of yarn could be continued without interruption. The goods were usually
transported from the port of entry by the msnufacturer or cooperative but
on rare occasions the importing firrn undertook this. The quantities
purchased depended on domestic costs and the degree of effective protect-
ion against imported finished textiles. Imports ordered on indent passed
straight from the importer to the manufacturer or to his co-^perative;
only the passage of official allocations is shown in Chart IV. In the case
of the manufacturer, the entire consignment reached him because it was
on his personal order, and finance v/as therefore arranged on a private
basis. He did not have to cajole the importer into handing him his imports
as he v/as often forced to do under the allocation system.
The effect of government intervention in distribution:
The characteristics of supply which the allocations system prod-
uced were the maintenance of small inefficient weavers, which would other-
wise have been eliminated, greater opportunities for speculation in stocks,
and a more costly distribution system, ilthough most of the small weavers
no longer produced in recent years they v/ere permitted the illusion of
being an economic force by receiving ys.rn allocations which they could sell

231
on the free market or to their cooperatives. The several stages of dist-
ribution in v/hich semi-official, non-consuming agencies had control over
supplies provided opportunities for manipulation which might not exist i f
imports v;ere made freely on indent from manufacturers. The cumbersome
procedure of payments and deliveries in the allocations system increased
the administrative costs of supply; the Department of People's Industry
was involved in planning and estimating the allocations per machine, the
officers of the P . D . N s . were obliged to wait for advance payments from
cooperatives or banks before they could make orders and were to inform
manufacturers of delivery dates and transport facilities , and the coop-
eratives functioned as an arm of the Department of People's Industry as
well as a bank.
/ a i supplies of y a m were finally allocated to weavers, roughly
according to their levels of efficiency and marginal costs, through the
operation of the free market. But the final free market price was probably
higher than i f there were no initial allocations system because of the
activities of intermediaries v/ho were placed by the government in power-
ful oligopolistic positions.
The extent of the corruption of the allocations system by govern-
ment 8Jid cooperative agencies was deter^ ined by their financial predic-
aments, the deterioration in supervision and morale, and the deficiency
in supply.
The first two are the result of lack of experience and the financial
and de:-.ioralising effects of inflation. The last is the subject of Chapter
VI . It is worth noting that while the difference between fixed and free
market "orices affected the degreee of corruption, corruption in turn

232
influenced the final free market price of yarn.
Reorganisation of planning and distribution by Komrnando Tertinggi Operasi Skonomi (KCTOE- Supreae Comrnand of economic Operations).
In the second half of ^^ok the economy appeared to be deteriorat-
ing rapidly. Imports of essentials were becoming scarce ana their prices
rising correspondingly. Ihe textile indu.str;/' v/as only partly functioning
and foreign exchange reserves v/ere almost completely'' depleted, -'he
distribution procedure of rav/ materials v/hic:i still existed was rumoured
to be v/holly in the hands of preiessional speculators.
Against this background KOTCS v;as formed, together with Supreme
Cora..ands in other fields, to improve the orgs-nisation of the country as
a necessary step to expand the 'Crush Malaysia' campagin. ''he Command
v/as established by Presidential i>ecree i;o.25 of '\3oh, dated 28th. Jiily
1964.'' On 28th. September KOTOS annomiced that it was to set up a special
team to investigate the distribution of textile raw materiaJ-S v;ith
particular reference to speculation and manipulation of yarn.
On ngth. October KOTOS announced that a consignment of 70,153 bales
of yarn from the Republic of China would arrive by ' ajiuary I965 and that
all former methods of allocation and distribution would be valid no
longer. Decisions concerning allocation axid distribution v/ould be made
by KOTOE.^ -his meant that the pov;ers of the Department of people's
'industry and the O.P.Ss. were just as great as KOTOE cared to delegate
to them.
-egulation iio.30/wEB-K0TCS/l964. 28.9.64.
2. Regulation ho.39APB-IvOTOE/1964. 19-10.64.

233
Nerr methods of payment by factories had been discussed in the
Departmentsof Trade and People's Industry for several months past and
finally it was decided that Bank Indonesia would offer short-tern credit
to the two Iliagas (the new State trading Enterprises/ which had assumed
1
the business of the former P.D.Ns. In this way the financial intermed-
iary role of the O.P.Ss. would be eliminated and the necessary credit
would be obtained from the banking system by the importing houses instead
of by the manufacturers seeking funds v.-herever they could. Kanufacturers
were given instructions to pay for the yarn on delivery by depositing
money into the account of the Niaga in the local branch of Bank Indonesia.
Only those factories passed by IIOTO J's inspection team could indent the
Niagcis for y a m and then only on the basis of long-terr contracts for
annual allocations fixed by KOTOE.
The Com. and set out to undertake a forrjiidable programme. The sus-
pension of all former methods of allocation and distribution did not
disrupt supplies since there were np supplies to be allocated between
July 196'^ ajid February 1963* Nevertheless, KOTOS aimed at inspecting all
v/eaving and knitting establisliments, issue new capacity licences, and fix
each fac;.ory's annual allocation before the February allocations. They
began inspections in December and by February I965 had examined all power
equipment and a large number of handlooms in Java. The other islands
remained untouched.
/mnual. allocations (ajssujning large supplies) were fixed in Dec-
ember 196'i.^ Each ATI'I (width 1^0 cm.) was to receive a maximum of
kilograms of yarn per month per shift, each ATM (width 90 cm.) 91 kilo-
1. xte.gulation No. W ^ P B - K O T O E / 1964. 9.12.64. 2. P.e-Illation No. 35/.VP3-X0T0E/1964. 9-12.64.

23 grams, and each ATM (width 70 cm.) 82 kilograms. If capacity input is
between 3.5 and 5.0 kilograms per shift this allows for between 23 and
28 shifts a month, or a little over one shift a day. The handlooms were
to receive a maximum of 27 kilograms a month which is about I8 shifts a
month. It is clear from these figures that KOTOE was not expecting enough
foreign exchange for two shifts a day on the power machines. It also
intended to continue supporting the handweaving section although it v/as
known that the Command was divided on this policy. At the time of form-
ulation of these allocations the only yarn on order was about 20,000 tons
(or 70,000 bales) which represented less than 20 per cent of capacity
requirements.^
In jobruary I965 the price of this yarn was set up at Sp.350,950
2
per bale (20/s).
KOTOE was also responsible for allocating foreign exchange between
Departments. It allocated ^83.5 million to the Department of People's
Industry for textile raw materials, of which ^71.3 million was to be for
yarn imports.^ This was almost half of capacity requirements and rep-
resented a little less than the annual allocations already fixed by
KOTOS, liodest as this was none of it had materialised by April 196^. At
the sajiie time that this decision was announced it was agreed that no
foreign exchange would be set aside for finished textile imports.
A press campaign was mounted in January I965 against corrupt
elements in the Department of People's Industry, the O.P.Ss. and the
P.D.Ns. Seven of the eleven directors of KOPTEKSI were imprisoned on
1. This consignsment finally arrived in March and April 1965^
2. He^gulation No. 0VWP3-K0T0E/1965. 2.2.65.
3. Inter-/iew at the Department of People's Industry, i^jakarta. 15-3-

235
evidence siipplied by KOTOE. The Department of People's Industry maint-
ained, in defence, that it was unable to function properly in the field
1 ,
of inspection because its staff was overv/orked and underpaid. The P .D .Ns.
replied to charges of blackatarke tee ring by stating that they could only
continue the export trade-., v;hich was so vital to the country, i f they
acquired increases in v;orking capital from the profits of selling some of
their imports on the free market.
In February I965 KOTOE issued two reports on its activities. In
the first report the KCTOS team responsible for investigating factories
listed the met;:ods used to acquire extra allocations^ and the malpractices
of the O .P .Ss .^ The second report gave estimates of the error of capacity
licences investigated.
The i:OTGS team offered some benefit to the textile industry. The
burden of pa;:/TTients for imports v;as eased by Bank Indonesia providing
credit to the importers v/hile the removal of financial matters from the
hands of the O .P .Ss . assured the producers of strightforward payments. By
exposing malpractices in the distribution of yarn, KOTOE restored some
1. KOTOE Special Team for Clothing Production, First Report. There were
50,000 industrial establisliments in the Bandung area for which there
were only I50 technically competent investigators in the branch of
People's Industry.
2 . These methods included more thaji one licence for the same equipment,
outdated licences in use, licences not corresponding with actual
capacity , and licences for obsolete equipment.
3. The malpractice of the O .P .Ss . centred on holding manufacturers'
advence'payments for too long, demanding payment for a second trans-
action before the first vias executed and providing factories with
too short a time limit to collect allocations.

236
confidence aiKongst manufacturers. .Uthough the team itself was knov/n to
be corrupt and to harbour strong anti-Chinese feeling, manufacturers re-
fused to testify against KOTOE when asked to do so by a teajn of touring
Parlianentariajis in March 19^5 because I''OTOE had given greater assurance
to the industry than had any other organisation. One Chinese manufacturer
who stated he knew KOTOE officials could be easily bought, maintained that
the changes the team had introduced were v/orth any trouble they had caused.
Conclusion.
The supply of rav/ cotton to the spinning industry was sufficient
for a high degree of capacity utilisation and its distribution and
pricing were quite effectively controlled. But the supply of yarn to the
weaving and l-oiitting industries v;as totally inadequate and capacity util-
isation rates for weaving were within the range of 30 to 40 per cent for
most of the period. reviewed. There v/as, ho'.'/ever, a long run increase in
supply but because of ver;?' large fluctuations it was difficult to assess
whether this kept up with expansion of capacity.
The main causes of these poor supplies were overseas competition,
complex and inefficient importr'.ng procedures, sind import restrictions. The
uncertain protection policy led to speculation of these limited supplies.
Before 1939 there was no direct planning of raw materials supply
for the textile industry and the goverrjnent intervened only to the extent
of providing tariff protection and credit support when it considered pre-
vailing conditions warranted it. Until 1957 this policy caused many of
the smaller firms to close dov/n although few of the large weavers complained
of government policy in this period. But in 1957 when drastic measures were

237
tsl:en to protect the balance of pay rients yfrrn imports fell so much that
the utilisation rate for the whole industry fell to about 22 per cent.
-he reorganisation of trading institutions in 1958 ajnd 1959
follov/ing the take over of Dutch importing houses provided the government
v/ith the opportunity of controlling the composition of all textile mater-
ials imports and of guaranteeing a lar^e supply of yarn. However, the
system of foreign exchange allocation chosen did not afford protection
to the domestic industry because the Department of Trade which wa^ respon-
sible for allocating foreign exchange among government departments was
a].so in chajrge of deciding the orders for the highly profitable cloth
imports. The personal relationship between the Minister of Trade and the
directors of the State Trading Entertjrises as well as the latter's work-
ing capital problems led to a situation where the Department of People's
Industry wa^ xmable to acquire sufficient foreign exchajige for the textile at the same tiiiie
industr;/ v/hile sizeable amounts of finished cloth v/ere being imported.
It wa^ intended that raw materials allocations could be distributed
through the State Trading Enterprises at prices lower than the free majcket
price in order to assist the wealier enterprises. However, through the
raejiipulation of supplies of yarn by officers of both kinds of agencies
together v;ith allocations sold by srnaJ-l weavers, as much a^ one half of
total supplies was diverted to the free market. The vast bulk of y?-rn
imports iina21y reached those efficient manufacturers who would have
obtained the yarn imports if the distribution system had been by auction.
3ut the inscitutional system of seni-government aJid cooperative bodies

directed by inexperienced and demorsJised officials, which dominated the
distribution system is most likely to have increased the final cost of
yarn to the manufacturer and increased the opportunities for manipulat-
ion and hoarding. The determination of the amount of yarn which was
diverted from official channels to the free market is the subject of
Chapter VI.
The cumbersome procedure through v/hich manufacturers had to pass
in order to acquire their yarn allocations was costly, uncertain and
worrying, ajid contributed to undermining the morale of the manufactvirers.
'he purpose of the procedure was to provide low cost raw materials to the
industry-. It would appear that tariff protection would have been simpler
to execute, have a greater chance of being effective and would have
provided the majiufacturer with less uncertainty. However, as Chapter VII
demonstrates, even this system is severely limited in an inflationary
situation.

239
CHAPTER VI
D3VSLCO : iIT OF A 3PSCcLATI"/S FRE3 ; .iLilST ITT YAm
Introduction*
The purpose of this chapter:
An examination of the free market for yarn will show how the weaving
industry operated when faced with a shortage of raw materials. Since ao
much of the production of the large factories came to be based on free
market yarn in spite of the allocation system, an analysis of the free
market is relevant to an understanding of the final cost and profitability
of textile production in generaJL. Chapter IV examined trends in product-
ion costs betiveen the efficient and inefficient sections of the weaving
industry. This chapter discusses how both uncertainty of supplies and
inflation altered yarn costs and relative production levels amongst
weaving enterprises.
The blacl-a-narket and the free market:
Conversations with Indonesiaja textile majiufacturers during interviews
were dominated by the problem of cost and supplies of yarn, and the word
'blackmarket' appeared to punctuate each point made concerning the
predicament of v/eavers who tried to keep producing for as long as possible.
However, in some cases it v/as clear that it was the market for freely
imported yarn that was being referred to. Sgcause of the confusion of
different descriptions it is necessary at the beginning of this chapter
to define the nature of the market to be discussed.
At different times there have been three sources of yarn: official
allocations from the government, official allocations offered for sale

zko by the small weavers, and private imports. The first source v/as priced
1 by the government at a lov/ value . purchases of yarn from snail v/eavers
and private imports of yarn, v/hich v/ere regarded by large manufacturers
as close substitutes, were determined by the free market. But of these
two sources the sa.le of cillocations v/as illegal and, therefore, constit-
uted in principle a 'blackmarket'. Hence that section of the free market
v/hich v/as supplied by sales of allocations might be termed 'black' in so
far as this practice was illegal. We can include in these sales the supp-
lies of yarn manipulated by otate " rading j-interprises and the C.P.Ss. as
described in Chapter V. i- ence the 'blackness' of the market was determined
not by the type of operator involved, but by the source of the yarn. The
periods v/hen such terminology was particularly relevant were 195^-55,
1957, and after 1959 (v/ith the exception of a short period follov.dng
the measures of l-xay I963) •
omall v/eavers might sell their allocations to State -trading enter-
prises or to Cooperative officials, to their moneylenders, or direct to
large manufacturers (v/ho might be their customary financiers). Some-
times this yarn v/ould be passed on by a chain of operators before it
reached the final user.
In the case of private imports a manufactujrer could indent importers
(the - tate -rading i^nferprises) according to what he thought he coulo.
process profitably. Soma_^imes traders were the actual indentors ajid they 1. Allocation prices were not entirely independent of market forces
because they v/ere set at between 70 and 100 per cent of the free market price. :.ov/ever, v/here the free market price was continually changing from day to day, the infrequent allocations were each dist-ributed at one price. Ihe official pricing system demonstrated the interdependence of free and official prices, xhe free rr.arket price v/as, of course, in turn influenced by the size and price of official allocations.

2^1
distributed the yarn in the sarae way as they handled allocations v/hich
they ha.d purchased, j-he supply of freely imported yarn facing the industry
can be assumed to be very elastic since Indonesian purchases would have a
negligible effect on the international price of yarn, -'Ut if there is a
limit on import licences for this comrr.odity the supply v;ill become comp-
letely inelastic at that limit, •'-'ecause import regulations changed so
frequently and could be manipulated through corruption if demand v;as strong
enough, no closely defined supply of freely imported yarn couJ.d be termed typical of Indonesia. Here \ e assuxie the usual upv-;ard sloping supply
could
curve v/hich meanif that as larger orders are made the problems of handling
customs and foreign exchange birreau officials become more expensive.
Thus the large manufacturers could either order direct from overseas
thiDough an importer and receive yarn direct from the docks, or he could
purchase his raw materials from the free market. If he did the latter, he
did not always know v;hether he was purchasing yarn v/hich had once been an
allocation or yarn which had been privately imported, -he mixing of these
tv/o sources of yarn helps to explain v/hy the government v/as unable to
eliminate the 'blackinarket', and eventually ignored it.
The saJLe of allocations alv/ays carried a risk of prosecution, however,
small, and this was often a cause of an actual cost distinction between
the two sources of yarn. Furthermore, it was usually the case tliat yarn
allocations circi£Lated amongst more traders and moneylenders (sometimes
being sold back to a trader) than private imports which went almost
direct to the large manufacturer. Together v;ith the risk of prosecution,
this caused two prices to be quoted for 'free' yarn, "iarn sold through

242 traders v/as visually more expensive to the manufacturer than yarn obtained
by importing on direct inaent. Hov/ever, this v/as not always so. if yaxn
allocations were large but private importing a cumbersome and frust-
rating procedure, during v/hich a great deal of v orking capital might be
appropriated for a long time, the free market price of yarn from allocat-
ions might be less tha.n that demanded by importers, x'urthermore, if the
free market rate of the dollar suddenly increased (usuaj.ly before Christ-
mas) the traders' price quotes might lag behind the rise in price of
private imports on free market dollars. Therefore, the price of illegal
free- market yarn might be higher or lov/er than the price of legai free
market yarn.^
Apart from differences in origin of free market yarn, there v/ere other
causes of differences in free market quoted prices.
First, distances between centres of the te>ctile industry gave rise to
several separate markets throughout the coiontry. Even vfithin the regions
of Java there were distinct yarn markets because of separate pcrts of
entry and very poor transport facilities. To some extent this was over-
come by transporting yarn from well stocked v/arehouses in one area to
manufacturers without raw materials in another, but the costs of trans-
1. The free market "crice of yarn sold from allocations was very high in October 1964 when strong measures against hoarders were announced by KCTOE; and the free market disappeared overnight. At the sarne time only the most efficient of majiufacturers could process privately imported yarn.
2. Hor is it alv/ays relevant to use these two prices. Tiie large manufact-urer might be the fir^ncier of a small weaver or he might be on close personal terms with officials of the O.F.S. or State -rading Enterprise. In either of these cases he could obtain yarn at a price well below that quoted by a trader.

2^3
porting the yarn as v/ell as losses through theft and damage liniited this
practice to those instances when regional differences in price were
substantial.
Second, the credit market (as described in Appendix A) included numer-
ous different arrangements betv/een debtor and creditor depending on the
credit-worthiness of the former. The highly peroonalised credit and inform-
ation services available to manufacturers meant, in effect, that there
could exist as many different prices as tiiere were pairs of buyers and
sellers in each area. The small v/eaver was amongst the least financiaily
secure entrepreneurs and his lack of knowledge of the business world
placed hira in a position where he v/as likely to accept any agreement his
creditor proposed. The isolation of villages and the racial differences
between creditors and debtors^ vriiich made the former a closely knit frat-
ernity^ contributed to increasing the degree of imperfection in the credit
market. Therefore, the supply curve of this kind of yarn v/as subject to
the ter;as of the creditor as well as to the allocation price and the cloth
price. This was usually aggravated by the poor entrepreneurial ability of
the small weaver v/hich precluded a rational examination of the profitab-
ility of processing allocation yarn.
In spite of these qualifications, in the areas in which the textile
industry was concentrated a narrow rsjige of free market prices prevailed
and deviations from this had to be nade by personal bargaining. The data
on free market yarn prices quoted in Table 23 were obtained -rem unpubl-
ished material gathered by officers of the Central Buxeau of statistics
in Laai'.arta. Every v;eek an average price of 20 establishments in Djal'^rta
which stocked yarn was made on the basis of an informal enquiry. Although

2kk
free imports were pernitted in stocking (or hoarding) was forbidden,
and price quotations were offered the i ureau on a confidential and, there-
fore, unverifiable basis.
^ecause of the nebulous nature of the market in which yej?n v/as freely
sold and the mixing of legal and illegal sales, only the tera 'free
market' is used in the anfJ-ysis of this chapter, iioreover, in order to
simplify the analysis of the free market differences in prices v/ithin the
free market will be ignored.
Speculation:
All trading and processing of rav; materials are based on expectations
of profits and in as much as these expectations can never be perfectly
guaranteed all economic transactions include a speculative elem.ent. '-i-h.ere-
fore, ciny discussion of speculation should centre on the degree and nature
of speculation rather than on the question of its existence.
In the case of Indonesia there is no knovm reference to speculation
in textiles before the war. But after the v/ar the word recurs frequently
in ank Indonesia 'eports and in articles on the econom.y. ±'wo periods when
mention v;as made of unusual speculative activity were I95O and 1955 when,
in spite of large imports of yarn, the textile industry was functioning at
a very low rate of capacity utilisation. In both years there was strong
evidence of the existence of tv/o sources of demand for yarn; one for
processing and one for speculation. During interviev/s midertaken in 195^
and 1965 it v/as impossible to avoid a mention of speculative activities
and it often required an effort to prevent the interview being dominated
by a discussion of speculation.

Certainly there was cause for mi:ced expectations in the textile
industry after the v/ar. -"rice indexes shov.-n in 'Table 12 indicated that the
extent of monetary inflation provided sufficient grounds for a need to
retain purchasijig pci jer in commodities.
A fl.ight from money into yarn assiirnes that weavers vd.ll be prepared
to pay high prices in future for the yarn and ti.is implies some confidence
in effective protection policy for weavers, fhe data in Table 12 also
showed that fluctuations in food and textile prices bore little relation
to each other, and since the latter commodity is almost entirely imported
in one form or ejiother, it is reasonable to conclude that the incidence of
protection influenced this difference. Chapter Y provided data on the
variable quantities of imports of textile raw materials which did not
change in equal proportion to total textile materials or to total imports.
The uncertainty of import quotas and the effects of inflation on tariff
protection v/ere strong reasons for speculation in the import trade. More-
over, the erratic nature of the allocation system, v/hen it was in force,
compelled all manufactuj:"ers to become speculators. V/hile there might have
been occasions v;hen it was preferable to move out of money into gold or
some other commodity, there were certainly occasions v/hen yarn appeared a
profitable commodity to hold against inflation. Data on prices and out-
f'ut, together v/ith nujnerous comTilaints of speculation during the 1950s
and 1960s constitute solid grounds for believing that speculation flour-
ished, v/ith varying intensity, in the market for textile raw materials.
I.In ijovember 1955 credit facilities were made much easier for yarn imports than for cloth imports during 3. period of credit restriction, and in 19^3 the very lov^ replacement price offered by the goverriinent to yarn imiDorters occured during a period of general economic liberalisation v;hich the more astute businessmen saw could not last long.

2ke
Kov/ever, the market for yarn cannot be studied effectively v/itliout
reference to the market for cloth. Prices and speculation in yarn and
cloth markets are closely interrelated, and an imbalance in one market
brings about an imbalance in the other. For this reason it is simpler
to build a model of the free market in yarn comiaencing v/ith the assump-
tion that the price of yarn is independent of the price of cloth. Apart
from domestic cloth production, imports of textiles v/ere niade by
government departments and by firms on a strictly com:..ercial basis, ' he
supply of the latter can be described in the same v/ay as freely imported
yarn.
-lie analysis of the free market during uncertainty v;ill be divided
betv;een (i) irregular supplies, and (ii) inflation, of
Hethod^ 3jialy sis:
In the following analysis it is assumed that large scale factories
demand free market yarn and small, and sometimes medium, scale enter-
prises supply it. 3ach group actually includes a range of efficiency
levels amongst the units, but the v;eavers on either side of the market
discussed here are talcen as typical ejcamples. Latitude for this variat-
ion is given by concluding tha.t a change in market conditions will 1
encourage more ( or less) of the units to act in a specified marjier.
'•'he difficulty of any method of studying the market is that the
yarn price both determines and is determined by the action of small
weavers. This is because of the nature of costs involved in the process-
1. "his means that there might be some medium scale weavers who have had experience of being both a buyer and a seller in the market at different times.

2k7
ing of small v/ea.vers' allocations, -orrnally we assume the producing firm
faces fixed costs in / competitive factor markets and that its supply
schedule depends on how it combines those factors most effectively. The
price it is offered for the product deter;.:ines its output, but not its
factor costs: there are far too man^ other user firms bidding for the
same factors, out in the case of the smaJ-1 scale weaver, faced with the
tv/o alternatives of production arid blacia^iarketeering, there is an opport-
unity cost of px-oduction equeil to the blaclnarket price of yarn. " Taen a
large number of small v/eavers act together, by offering vajrying quantities
of yarn they can thereby affect their own costs of production ajxd hence
their actual supply schedule; although it is believed unlikely that they
are strong enough to affect prices of other factors which would be used
in other industries too. The greater their readiness to sell aJLlocations,
the lower will be the free market price (all other things constant), and
the lov/er their opportunity costs of production. Because of this inter-
dependence, as v/ell as that existing between the cloth and yarn markets,
and the difficulty of quantifying such responses, it is intended to
merely point out the nature ajid direction of effects resulting from
different changes.
A simple marginal revenue product analysis is utilised to illustrate
the behaviour of the two kinds of weavers. The single variable factor is
yarn v/hile all other factors, including lo,bour, are regarded as held
constant. The limitation of this approach lies in the assumption that
quantity of yarn only is allowed to vary, whereas it might be expected
that labour in t. e large factories, at lea^t, would fluctuate with intakie

?A8
of ra?/ materials. But this assumption is not wholly unrealistic if it is
believed that changes in output are likely to o c c u r over a s m a l l range,
that weavers anticipate t h i s , and are reluctant to dismiss workers
already trained and requiring a lump sum payment on dismissal. M o r e o v e r ,
ui^til October j large weavers were compelled by law to retain workers,
ajid these employment commitments prevented the dismissal of redundant
workers. If entrepreneurs decreased the number of workers employed by not
renevifing jobs left vacant b y death o r migration, this v/ould have involved
a slow change in scale of operations and need not affect the conclusions
of the analysis g r e a t l y . In the case of the s m a l l establishments where
family labour is u s e d , it might be a simple m a t t e r to hold a certain
amount of labour in readiness: this could be drawn from a p o o l of disguised
unemployment v/ithi:: the fajnily circle. Thether or not it is continually
used in dii-ect application, such as cleaning the looms every day, w i l l not
affect the m a r g i n a l p h y s i c a l product of yai-n.
liarginaJ. productivity analysis used over a period of several months
including no violent economic fluctuations would seem a suitable
analytical framework from v;hich to drav/ conclusions.
More serious criticisms lie in the assumptions made about business
motivations of s m a l l and large weavers (not necessarily aiming at profit
\
maximisation) and the constancy of the burden of unspecified t o t a l fixed
costsC w h i c h may alter in relation to yarn costs during inflation.)
ilodifications to the m a r g i n a l analysis w i l l be made where it is thought
that business motivations and the incidence of fixed costs warrant them.
Furthermore, it is assujned here that if a l l costs are not covered by

2^9
returns in the abort run, entrepreneurs might choose to continue
production because they anticipate short run losses to be less than the
ex"pense of closing down and opening again at ^ later date. Therefore,
when an entrepreneur is producing,' it is tslien for granted that he has
covered a].l his production costs or that part of them v/hich provides the
most satisfactory short run position.
Thus in the dj.agrams below quantities and, initially, values of
capital equipment, majiagerial sl'.ill, labour, land, transportation, and
auxiliary materials are assumed fixed. The only iiiput which is allowed to
vary in quai- '.ty is yarn.
^he mar dnal physical product schedules of yarn for both small and
large weavers will very likely include a wide range of yarn input within
which marginal product is approximately constant. The other fixed factors,
including lo.bour, are unlikely to contribute much to variability in output
of cloth from a given aiiiount of yarn. V/ith yarn being so scarce and
precious to t'io weaver, wastage which is unavoidable might be expected to
be constant over a wide range of output. At activity levels approaching
phj'sical capacity of existing fixed factors, yarn input will suffer a
decline in r'-rginal product as the raw material is hastily processed by
these l.inited fc-:ictors. Finally, the fixed factors can absorb no more yarn
and mar .In a physical product falls to zero. Yarn is not purchased beyond
this limiting raiantity.
The mar';inal 3-evenue product, schedules for which are shown in Charts
V, VI, and 7 1 i s the marginal physical product multiplied by the price
of cloth which is assumed to remain constant over the whole range of output.
This assumption becomes a problem in the analysis when all firms are

230 expected to be changing levels of activity together. If all firras expand
together, che industry's supply curve -Jould shift outwards a-iid the price of
the commodity would fall; and with it the marginal revenue product curve.
The effects of this assumption will be less if it is believed that only
small changes in outr)ut are relevant. Nevertheless, the impact of the
whole industry changing its level of activity will be pointed out where
it is thought to be important.
There will, however, be differences in the overall shape and position
of the marginal revenue product schedules for small and large scale
weavers. To begin v/ith the capacity of the former is less: marginal
product will faJ.l to zero at levels of jrarn input much lower than in the
cajse of lar'-e v/eavers. Second, there will be a greater loss of yam, as a
percentage of cloth outpu^t, amongst the Griall, less mechanised looms, due
to brealcages: the schedule will be positioned a little lower than that of
the larger weaver. Third, the quality of the mechanised, standardised
process will be higher and will fetch a higher cloth price. Instead of
com.paring i''evenue schedules at different comrfiodity prices it would be simpl-
er to assume that the cloth prices facing all weavers are the same but that
the quality differences are talien into account by the lower average and
marginal physical product schedules of the smaller enterprises.
SupDly and demaiid in the free market without speculation.
Freely imported y a m supplies:
If there v/ere no allocations, the free market price of yaxn would be
deter-^ined by the marginal revenue product schedules of all weavers and
a given supply of imported yam.

251
because of the apparent scarcity of yarn in Indonesia it is thought
that this value represented levels of output in the range in v/hich marg-
inal revenue product schedules of the large v;eavers approximated the
horizontal. At this j)osition the price of yarn vrould be too high for small
weavers to process p r o f i t a b l y . Ihis is shovra at output oq in Chart V ,
Diagraii Q-'-L0 marginal return on yarn input is op and this is the price
paid for y a r n .
Hearing in mind their frequent breai-:ages and lower product qiiality,
the small v/eavers could never hope to meet this return b y their ovm
efforts and would therefore not purchase yarn imports on the free market.
Some of the medium sized enterprises might b e able to purchase a
little yarn if the quantity used b y their more efficient competitors was
so great that the latter were suffering a fall in their marginal revenue
product.
•therefore, the greater the araount of yarn available to all weavers
in the free market, the greater the chance that some of the less effic-
ient weavers could match the marginal returns of the large weavers.
Allocations:
To begin v/ith it is assumed that low priced allocations of yarn are
distributed only to the less efficient weavers, and that these weavers
must take all or nothing of the allocations, 'fhe allocations do not
affect the SLipply of privately imported yax-n. 'fhe supply of officially
allocated yarn is depicted as i"- Chart V , Diagram CO.. -f small
weavers aim to maximise total returns on their allocation purchases they
will compare the free market price of yarn (their opportimity cost) with
the return on manufacturing cloth.

252
CHAST V
:A3GII; :I 2SV3I;US PSODUCT AI'ALYSIS -..TTI: ;^LOCATIOI:3 TO T]
;73AYSP ONLY.
DIAGMI: ( I ) DIAGILAI-I ( I I )
sraall weaver lar j^ weaver
NI.R.P.
quantity of yam quantity of yarn

253 Each small enterprise has no chajice of affecting the free market price
by its own actions: the opportunity cost schedule is a horizontal line
fixed at the level of the free market price, op. As already stated, v/ith a
shortage of yarn svipplies, the small najiuiacturer cannot exceed the free
m3.rket price by his marginal return to processing. It is true that if the
official price v/ere lov/er than his maxixium rnarginaJL revenue product he
might be able to process yarn at a profit (if he covers a satisfactory
share of his other costs), but he-v/ould not maximise total earnings. Hence
he sells his entire allocation. In viev/ of past Indonesian experience it
is not realistic to consider allocations large enough to satisfy snail
weavers v/hen they are experiencing diminishing ma.rginal productivity. If
this did happen, and the size of the allocation was larger than the quan-
tity v/hich would equate marginal revenue product v/ith allocation price, the
small weaver v/ould process some said sell the remainder to maximise total
earnings.
But if 3.11 small wes-vers were to act in this way simultaneously, the
small scale industry as a whole could influence the free market price. The
effect on the large manufacturer is that his supply of yarn has increased,
and he purchases qq' more at the new prevailing price (op'J equal to his
new marginal revenue product. No accoimt has yet been taken of changes in
the price of cloth. 'The small weaver's opportunity cost has fallen from op
to op' as a result of other similarly placed weavers acting as he does, and
he night find it profitable to process his allocation if he is one of the
more efficient units in the small scale industry.
The adjustment of the free market to accommodate the sale of official
allocations might mean some medium sized weavers find it profitable to
process part of* all of their allocations (if they receive any); or even
purchase some free market yarn.

If, however, the granting of allocations is at the expense of some
of the available free market yarn, the quantity of yarn available is
unaltered. This might be the case where quotas of imported yarn,
already in force, v;ere diverted from private importers to government
distributors. There v;ould be no chajige in the level of total output
of all producing weavers. Profits will have been shifted from importers
and traders to small scale v/eavers.
There v;ere times when the govei-nment extended its allocation system
to large manufacturers also. The analysis of the marginal revenue
product shov/s that this ought to be lonnecessary given the operations of
the free market. Nevertheless, in the extraordinary but not impossible
situation, of a hopelessly ineffective protection policy, allocations
might prevent the large scale v/eaving industry from dying also, by add-
ing to its profits on the first units of output.
Here, however, it is assumed that allocations are given, for
certain political reasons,^ to a large scale industry capable of malting
some additional purchases on the free market.
In this case the supply schedule of yarn facing the large manufac-
turer is discontinuous, and is shown in Chart Vt as p^p^p^. It begins
at the official price and continues as a horizontal schedule until the
allocation, oq», is exiiausted. For fiurther supplies of yarn, this
raanufactvirer must resort to the free market with its higher, but to the
individual firm, fixed price, op. So long as his marginal revenue
n This was thought to be the case in 1959 v/hen general economic policy was designed to bring out the strongest elements in the economy.

255
CHAST YI
I-;A3GINAL BEVEITOE PRODUCT AI:;IYDIS OF THE LASGE SCALE ;7EAVEE
WITH ALLOCATIONS.
quantity of yarn

256 product schedule remains the sai'ne, and his allocation is not so large as
to satisfy all his demand for yarn, then according to the profit maximis-
ation criterion, the manufactvirer v/ill continue to operate at the sa.me
level of output and pay the same free market price while enjoying bigger
profits on the first units of output. He vd.ll purchase q^^q ujiits from
the free marketo
If his allocation were greater than oq units of yarn (and he were
acting alone) the manufacturer woi.ild lorocess all his allocation a.t a
niarginaJ. return less than the free market price but greater than the
allocation price. Usually the allocation is not as large as this, eaid if
nothing has happened to alter the free market price the manufacturer v;ill
operate at his former position, oq tmits of yarn.
But if all firms in the large scale industry behave in the same way,
the effect of allocations being made to large manufacturers is that the
industry's demond schedule for free market yarn falls: less yarn is
required-at the former price. This vjill bring about a reduction in the 1
price of ya.rn and a smaller turnover in the free market. More y a m is
retained and processed by the less efficient sector as a whole because
its opportunity costs have fallen. Each large enterprise processes more
yarn in total but this includes a smaller amount from the free market
than before. I'he more efficient of the small and medium sized enterprises
now find it more profitable to jDrocess their allocations. Sie fall in
the market price v/ill be slightly diminished by a small reduction in
private imports since these are represented by an upv/ard sloping supply
curve,
Tne final pattern of production between large and medium sized firms

I.v7
will depend on the size of allocations and on whether the allocations
displaced private imports of yarn.
There are, however, tv/o major qualifications to make concerning
this analysis before it is appropriate to move on to the effects of
vincertainty of supplies and jjiflation.
The cloth market:
First, the influence of allocations on the cloth market must be
studied becaxise any resulting change in the price of cloth alters the
revenue product schedules of all weavers. Again we consider the two
situations where allocations are made in addition to quotas or to freely
imported supplies and where allocations displace part of the quotas for
yarn.
If allocations v/ere ms-de in addition to freely imported yarn the
granting of allocations increases the total supply of yarn available.
A part of the original final supply of yarn remains the same. But the
initial addition of cheap yarn, later sold by small weavers, raises the
supply schedule® At the same time the demand schedule of large v/eavers,
who have received their ovm allocations, falls. Thus the free market
price is lov/ered and large v/eavers increase their total output. Because
of the lov/er yarn price some less efficient weavers v/ill be encouraged
to process their allocations»
But the greater domestic output causes a fall in the price of cloth
(xinless demand rises correspondingly). The new price involves a dovm-
ward shift in all marginal revenue schedules. If large weavers are
initially operating at high levels of output where the marginal produc-

258 tivity is declining sharply, they will not require so great a reduction of
output to raise niargineJ. product sufficiently to compensate for the fall
in commodity price. Less efficient weavers v/ill suffer most because they
are more likely to be operating where their marginal physical product is at
a maximum : v/here it is very elastic. The large weavers would still be
producing at lea st. as much a^ before the ctllocations were granted, but the
small scale section of the industry would suffer a reduction in total earn-
ings as a result of cloth price adjustments.
If allocations disi lace part of freely imported yam there will be no
chajige in the total araount of landed yarn. If small weavers only are granted
cheap yarn they will join the import licence-holders and sell in the free
market until the return on processing is equal to their opportunity costs
(or the marginal return of the large manufacturer). All that has happened
is a redistribution of income amongst factor 'owners' : total domestic out-
put of cloth is unchanged and we can expect the price of cloth to be un-
altered. If large weavers were given allocations too, but total landed
imports rem.ained the same, there is not likely to be a change in price for
similajT reasons.
In all situations involving a shift of activity from small to large
majiufacturers there might be a slight reduction in the price of cloth due to
a higher proportion of yarn being processed in the more efficient enter-
prises. However, this assumes the free market begins to operate in the
present period, and is, therefore, hypothetical. If the cloth price fall did
occur all revenue product curves would fall but the final distribution of ;
yarn depends on the different rates of diminishing productivity. There is
also present an upward sloping supply schedule for freely imported

259
cloth. This v;ill lessen the magnitude of price changes in the cloth
market by withdrawing supplies v/hen there is a downv/ard pressure on
prices and supplementing supplies v/hen there is an upxifard pressure.
Market imperfections and business motives other than profit maximization:
Second, by choosing marginal analysis as a means of explaining how
equilibrium is reached in the market v/e have assumed that all kinds of
producers are motivated by the profit maximization criterion. If
should be clear from earlier chapters that there are lilcely to be other
factors which are considered more important as determinants of market
prices, and that the equating of marginal revenue product and marginal
cost might be quite inappropriate. It is useful, however, to use mar-
ginal productivity analysis as a background to the question: 'v/hy does
the weaver not produce at this output?' By specifying market imper-
fections and describing various highly plausible alternative business
motivations, it is possible to explain in which direction the weaver will
deviate from his theoretical, marginal optimum. We can also decide,
given all these market ' imperfections', v;hether the large v;eavers are
likely to have larger or smaller levels of output than their marginal
optimum v/ould indicate.
As we have seen from earlier chapters the small scale weaver suffers
chronic indebtedness and lov/ credit-worthiness. IThen the allocations
are granted he is likely to be faced with the problem of finding cash for
three to six months' supply of his raw material. His bargaining position
is much lower than that of the large weaver, not ora-ly because his credit-
v/orthiness forces him into a credit market v/hich has greater imperfections

260
than the bajnicing system to which the large weaver can usually resort. In
the private money market there might be effective oligopoly amongst money-1
lenders, sometimes s pported by collusion. The practice of having trad-
ional money-lenders to whom the weaver might be permanently in debt,
increases the effective monopolistic influence. It is a highly plausible
hypothesis to state that the poorer the entrepreneur's credit-worthiness
the greater the monopolistic power in his credit market. The arrival of a
huge allocations of raw material in this kind of situation usually means
the creditor can dictate any terms he likes which leaves the sm_all weaver
with a very small net income. Where the creditor knows the small weaver
can resort to selling his allocation on the free market, the determination
of interest rates is an exercise in dividing up the profits of a licence-
holder: there is no marginal cost of production to use as a guide. He will
behave in a way as described by the marginal analysis here but with very
high arbitrary interest rates included in the effective allocation price.
Against this influence, there might exist a fear that by not processing
any of his allocation he will forfeit his right to future allocations.
In this situation he will attempt to equate, if he can, his marginal cost of
yarn with his marginal i-evenue product to ma:xiraise his production profits,
It was a common complaint of the Indonesians that Chinese money-lenders agx-ced on interest rates to levy on Indonesian, and that these v/ere much higher than they would attempt to get from fellow ClixnGS© iLn g imilar positions.

261
even tiioun;li this v/ould not maximise his potential income. Or he might
endeavour to naj:imiGe output rnalcing normal profits only. There might have
been a ioeriocl when this v;as important, but v/ith the near totaJ. absence
of effective a-uthority of the Department of People's Industry by
such a fear v;as not noticeable during field work.
Thus for those small weavers whose marginal revenue product schedules
never rise above their opportunity costs we can conclude they supply the
whole of their allocations to the free larket very readily.
There may bo some medium scale weavers whose total returns from
processing arc rjreciter thsji from sales to the free market, who still
prefer to sell their allocations. Their reasons might be the value of
the eztra effort involved in processing, or the possibility of alternative
employment, which is an additional opportunity cost of processing the
yarn. This latter fact v/ould also encourage many small weavers to sell
their allocations automaticclly.
Therefore, the net effect of other influences on the inefficient
weaver might v;ell be to increase the supply of free market yarn beyond
that suggested in the marginal an.alysis outlined; and thereby shift
production activity to the large enterprises even further.
The large scale weaver would probably have a stronger incentive to
produce at an output greater than that represented on the marginal
productivity curve by maximum profit (or minimum short run losses). This
entrepreneur is in business for good: he does not expect to exist only
so long as the government is content to provide subsidies of one kind or
another. The ].argeness of his enterprise a-S v/ell
as his own individually determined level of

262
managerial skill make the large scale weaving industry, of v/hicli he is
one unit, imperfectly competitiveo His actions today, even luider the
stress of a scarcity of raw materials, will determine tiie pov/er of his
position in future. If he has reason to believe the strain of economic
instability is greater on initially weaker enterprises, he nay forego the
exploitation of short run profits to increase his reputation and goodwill
in the market, so that at a later date when the economy returns to some
semblance of normality he can confidently expect a higher share of total
sales of cloth. Furthermore, his overt ability to survive well in
periods of hardship might be considered an important factor in his bar-
gaining for the government and armed forces contracts which can do so
much to stabilise production. Finally, an attempt to provide a^ much
cloth for the domestic market by making only normal profits might also
contribute to a 'softening' of government policy to the large, n a ^ y
Chinese, weavers, such that they are always granted allocations when the
indigenous, small weavers receive them. For all these reasons it is
likely that the large weaver would operate at levels of output greater
than t k ^ those suggested by the equating of marginal revenue product of
yarn and marginal cost of yarn, so long as he was still covei^ing his
other costs or wa^ prepared to accept some short run losses, •-.'ais means
that for every price of free market yarn these other influences v;culd
increase the quantity of yarn demanded, and there would be an u.pv,'ajrd
shift in the demand schedule.
Hence the kinds of imperfections of the market and the

263
range of entrepreneurial motivations expected in an underdeveloped
country, experiencing dual technology and chronic economic instability,
lead to a greater turnover of government allocated raw materials in the
blackmarket than marginal analysis vrould suggest. V/e can further con-
clude that this divergence is larger, the greater the polarisation of
actual application of technology (because the absence of intermediate
grades of profitability increases both supply and demand in the free
market), and the greater the economic instability (because this gives
rise to long run considerations affecting short run decisions).
Supply and demand in the free market v/ith uncertainty.
For the salce of simplicity, vmen e:>carnining the effects of irregul-
arity in siipplies and of inflation, it is assumed that the cause of
uncertainty originates in the yarn m.arket and that the cloth market
alters in response.
(i) The influence of irregular supplies,
without the cloth market:
If all that is meant by'irregular' supplies of yarn is that alloc-
ations of a constant size are made at fixed, infrequent intervals of,
say, six months apart, the purcliasing of yarn from anall weavers by
traders ajid moneylenders for sale at a later date to large weavers does
not necessarily include an element of uncertainty, xhe intermediaries
in the market, in this case, oxe acting as finsaiciers and holders of
stock, and the payinent they demand for these services includes interest
and a return for operating the facilities. The interest charged may, of
course, be strongly influenced by irap^^^^^^i^^^ ^ ^

2Gk
market while the returns for services rendered might, in the examples
of State -^rading Enterprises and Cooperatives, incorporate monopolistic .
profits; but unless there is reason to believe that the certainty of
six monthly arrivals is in doubt, there is no more reason to include a
STjeculative element in these transactions than in production and trading 1
in the most stable of economic conditions.
If, hov/ever, the fixed sized allocations are made, or expected to be
made, not only infrequently but at irregular dates, or that allocat-
ions v;ill com.e at regular intervals but be of uncertain size, then
traders, moneylenders and large manufacturers must calculate their
returns on a speculative basis. In Indonesia where both the timing and
the size of allocations have followed erratic patterns, there can be
little doubt that speculation is a strong force in the free market.
When an allocation is granted, or thoiight to be imminent, the free
market price might be depressed by a postponement of demand by large
manufacturers. The small weaver can benefit from these fluctuations in
the market if he recognises the possibility of a future rise in prices,
and decides to sell his yarn at a later date. However, his opportunity
to e:rploit this situation of uncertainty depends on his financiaJ. ability
to hold stocks of yarn until the price has risen, -^ecause of his poor
liquidity position ejid credit-worthiness his chances of benefiting from 1. Nevertheless, so long as there is some period of time betv/een one^
allocation and the next there v/ill always be mixed expectations of the future, no matter how similar costs, prices and the incidence of protection from overseas competition appear to be v.dth those of tne previous period of waiting for an allocation. The longer the period of waiting between one allocation and the next the greater the expect-ations that some factor in the market will change.

265
free market price movements are verv restricted.
The large manufacturer seeks to supplement his official allocations
with free market yarn on the basis of expectations of profits. This kind
of manufacturer v/ould lilie to make his purchases after the allocations
have been distributed before insufficient supplies in the future increased
the prices. If he did this it would lead to a temporary rise in his
demand for free market yarn.
Much depends on his financial ability to stock yarn (or his cloth
produce) until the price rises some time after the distribution of
allocations; he is usually in a better position than the small weaver to
attempt this.
However, his liquidity position might be extremely tight after he had
just paid for his allocation of yarn. Interest rates can be very high in
times of general scarcity of credit and there might be other, m.ore profit-
able, ventures competing for- loans, fhe final demand of the large manuf-
acturer v/ill depend also on his attitude tov;ards risk.
The moneylender has greater ability to hold stocks of yarn than^any
class of producer. Moreover, he is uaually the most knov/ledgeable
businessman as far as foreign trade and government policy are concerned
and, therefore, has an advantage over all manufacturers, -i-f yarn supplies
1. There are usually other factors v/hich v;ill add to this restriction. ?irst, the small v;eaver usually lacks the knowledge and experience of market analysis and goverrxment trade policy to formulate expectations sufficiently to estimate production profitability, oecond, his poor credit-worthiness malces him unable to tal e a speculative proposition to a bajilcer for easier credit terms. Third, the moneylender might raise his interest because of uncertainty of future prices. Finally, if the future price is expected to rise very m.uch after allocations have been sold and processed, it v/ill probably pay others to import yarn or cloth on private indent.

266
are expected to rise in future he will sell his yarn stocks nov/ and buy
from small producers later; and vice versa.
The effect of -sjay speculation in the -jexn market after a distribution
of allocations is to raise demand. The small ^ reaver, whose supply cur /e
has remained unaJ.tered will sell ..ore of his yarn allocations at the
higher price offered. Tence speculation has had the result of removing
more raw materials from the small scale industry by presenting it v/ith
higher opportunity costs of processing. Total income from taking up the
allocations would increase.
Kore yarn is now available to the large manufacturer, it is reasonable
to exioect that speculators' profits will be maximised when their stocks 1
have been cleared before they rot. If they charge a very high price,
large weavers might find it more profitable to purchase from importers.
Therefore, we caji conclude output of large weavers will ultimately increase
ajid there will be a shift of activity from the small scale industry
tov;ards the large scale industry.
I- arginal productivity analysis can demonstrate \vhether total large
scale profits increase or decresise with speculation. Again, it is a ssurned
that total costs are covered or that the entrepreneur is prepared to accept
some short run lesses at all levels of output considered relevant here,
and that all other factors are held fixed in ajiticipation of the arrival
of yarn supplies.
1. The length of time before yajrn deteriorates very much varies from place to place. .:.tocl':s which v/ere estimated to be two to three years old in 196^ were pajrtly rotted in Bandung. In the coastal towns the deprec-iation v/oild probably be a good deal higher.

267
In hart VII belov;, p^AD represents the supply of yarn to the indiv-
idual large v/eaver v/hen the large scale industry has acted as a v/hole to
purchase yarn for immediate use, '•here is no sjoeculation over futujre
price rises. It is assumed that this supply lasts for three months,
• hen, v;hen supplies of allocations have been depleted and private imports
are used, the free market sypply schedule rises to p^S?. "iliis supply lasts
for another three months,
'ovj it is assuTiied that there has been speculation over future
scarcities and price rises, and that this speculation has the effect of
facilitating one prevailing price of yarn for all six months: the market
supply has been stabilised at pBC,
If there is no speculation the Isxge v/eaver v/ill enjoy ABCD more
profit in the first three months but EEFC less profit in the second three
months. From the diagram it can be seen that profits woijid be greater
without speculation (even if total large scale output were increased a
little}.
But if the diagraiii were dravm with the speculative supply p'E'C at a
lower level it is not at sl.1 clear vmether profits would be more or less
with speculation. In this case the large v eaver would earn only AB'C'D
more profits in the first three months axid earn as much as B'SFC less
in the second three months. His total profits appear to be less without
speculation.
' he lower stabilised yarn svipply of p'B'C could be a result of
economies gained from purchased yarn allocations by moneylenders instead
of by large weavers, ^t may be that professional speculators buying in

268
CHAl T VII
lIAHGIK iL R3VMUE PRODUCT AIIALYSIS OF THE LARGE SC.4LS VEJAVSE V/ITH UNCESTAINTY OF SUPPLIES
quantity of yarn

269
bulk can induce the small v:ea.Yer to give up greater increments of his
allocation uith snaller price increases. Or the small and medium scale
y/eaver''^ yarn supply schedule itself is very elastic, due to the
marginal revenue product curve declining only very slightly: it requires only
a slight increase in the free market yarn price(or the weaver's opportun-
ity cost) to bring forth a large increase in amount offered.
With the cloth market:
However-, it is not possible to conclu.de this analysis without mention-
«
ing the intei"'dependence of yarn ajid cloth markets. If we allow the marg-
inaJ. revenue product schedule, as drawn, to represent cloth prices when
both yarn and cloth markets have been ste.bilised by speculation in the
yarn market, then different marginal revenue product schedules m\;ist be
dravm for the other two yarn supply curves.
'./hen the supply of yarn is p^AD, output is equivalent to an input
of yarn as large as oq^. Assuming this is immediately released on the
consumer market, the price of cloth will f£ill (unless there has been
an unexpected rise in demand for cloth). The fall in commodity price
will bring about a dovrav;ard shift in the whole of the marginal revenue
product schedule. Ijqtiilibrium in yarn aiad cloth markets will result in a
cloth output equivalent to a little less than Oq^ units of yarn input,
and reduced total profits. Similarly, a rise in yarn price to 0P2 will
reduce cloth r ^ output and cause a rise in the cloth price and an upward
shift^ in the raarginal revenue product schedule. Equilibrium will emerge
1. The supply of yarn will probably fell slightly also as a result of a
fall in demand from large msjiufacturers.

270
1
at an input a little larger than oq^ and total profit \d.ll be greater.
It is possible that the price increase v/hen output falls vdll be
greater than the price decrease v/hen output rises. If this is true it
offers the large v/eaver greater benefits than the sta.bilised stipply of
yarn at p ' B ' C .
Two factors x^ork to favour the large manufacturer in a situation of
erratic yarn supplies but no specxilative activity vmich might stabilise
the supplies. First, if consumer demajid for cloth is inelastic above a
stabilised price but elastic belo'v/ it, then as the price falls, much
more v;ill be purchased, but as the price rises, consumers are reluctant
to cut back consumption. 'This is quite likely v/ith a popular, essential
commodity such as cloth. Second, the flatter curvature of the marginal
revenue product schedule at higher yarn prices means that an increase in
commodity price permits a larger increase in output, factor prices
constant, than if the curve v/as declining rapidly.
Private imports of both yarn and cloth v/ill have the effect of d3.mp-
ening price fluctuations. Because the supply curve for private imports
v;ill be upv;ard sloping and rising faster at higher prices, the fluctuat-
ions of cloth prices at the lov/er level vri.ll be more effectively dampened
than at the higher level. This v;oiild give the same effect as a demand
curve inelastic above a stabilised price and elastic belov/ it.
1. The supply price of yarn might increase slightly in response to greater demand.

271
( i i ) The influence of i n f l a t i o n .
The impact of a r i s e i n domestic costs is tvroicld: there i s lilielj^ to
be a d i f ference in the proportional r i ses in production costs of snai l
and large scale weaving enterprises , and the v;hole industry v.dll suffer
from greater overseas competition unless there are conpensating changes
in effective exchange rates for yarn and cloth . Both these ef fects v.dll
give r ise to speculative act iv ity because a change in relative profitab-
i l i t i e s v.dll lead to changes in densjid and supply in the yejrn rnarhet,
v/hile relat ively cheaper imports of cloth in the future vdll lead to
postponement o i ° c i o t h purchases and cancellation of some yarn purchases.
I t i s preferable to consider the tv/o effects of in f lat ion i n
isolation because one i s concerned vdth chajiges vdthin the v/eaving
industry asid the other v/ith sh i fts in the posit ion of the industry as
a v/hole. Therefore, to analyse the changes i n composition of production
activity vdthin the domestic industry v;e ignore imports of cloth and
assume that consumer demand for cloth in money terms r ises roughly i n
proportion to costs of production in general : that i s , the total
amount of cloth produced and sold by the domestic industry remains
about the same a.s be fore .

272
1 VJithout cloth imports;
1. Inflation and relative fi::ecl costs:
The analysis in Chapter IV described how inflation had the effect of
increasing the profitability of Is.rgG enterprises relative to that of
small enterprises through altering initial capital costs, depreciation,
interest changes, poi;er costs, and v;ages.
The small vreavers^ only cost of production, apart from yarn costs
and interest charges, is the cost of his ovm labour. As food prices rise
these maintenance charges rise too and he must increase his money returns
from processing in order to retain his standard of living. It is normally
a very lov; standard and can-ot fall much lower, -" e produces the lowest
quality cloth and his creditor does not leave him v^ith much surplus. The
official price of his allocation v/ill probably have risen and his living
expenses will certainly have risen. .Since he has nd liquid funds he must
have credit before he can sell. If the price of his cloth output or the
returns to selling his allocation on the free market rose in the same
proportion, his credit-vrorthiness, however low, should at least remain
constant and his interest burden should not increase, iiut his moneylender
is also facing problems from uncertain price, changes because he is lending
money during a period when his capital might depreciate faster than
expected. In order to hedge against this eventuality the creditor adds
a risk premium to the e:rpected rate of inflation.
1. This can be regarded as the sai-ne situation as cloth imports made on a floating exchange rate, eand that rate varies approximately v;ith xnaexes of factor ^orices. If the exchange rate rises less than fixed factor trices, this will have the same effect as a reduction in the competit-ive position of the v/hole industry. On the other hand, if the rate rises
faster than an index of large scale fixed factor costs but slower than an index of small scale fixed costs, this additional source of cloth to the market v/il]. improve the competitive rjosition of the large '

273
In general, if the burden of inflation is greater on the small
v/eaver, his profitability of production relative to the large weaver's
vrill fall and this vdll encourage him to sell more of his allocations,
2. Inflation and the need for extra employment:
As inflation reduces the real income the small weaver can gain from
selling his allocation, increasing pressure is on him to augment his
income by talcing extra employment. This source of additional income \'ias
always available to the enteriorising smaJLl v/eaver v;ho sold his allocat-
ion and had time to occupy himself elser/here. To the extent that some
v;eavers did this without the presence of inflation the income foregone
by choosing to process yarn allocations instead ought to be counted es
another opportunity cost of being an active weaver. The effect of this
would be further encouragement to sell silocations, and hence a rise in
the supply of free market yarn.
But it is thought that the small weavers began to search for extra
erpployment in the agricu.ltural and service industries when inflation
reduced their real incomes from the allocation system.
If this were practiced only by small weavers who automatically sold
all their yarn eJLlocation it would not affect the supply of free
market yarn. But if it had a demonstration effect on v/eavers who tried
to process their yarn allocations then the result would be a rise in the
supply to the free market.
Specicl mention was made in Chapter IV of the greatly weakened
position of medium scale enterprises during B period of inflation. This
would contribute to shifting the supply schedule outwards.

27
3. Inf?i.ation sjid changes in the cost of fixed factors of large scaJ.e production:
If the price of cloth were to rise by 15 per cent, then the mar^ineJ.
revenue product schedule, and hence the demand schedule for yarn, will
a.lso rise oj 15 pe ^ cent. The supply of yarn to the free market has some elasticity so that
by the price eventually paid for yam will rise^something less than 15 per
cent and sales will be greater. The large weaver will increase the level of
production and his totaJ. money returns in excess of yarn costs will be
greater than previously. However, ujitil irore is known about the effects
of generaJ. inflation on his other fi:-:ed costs it is not possible to
conclude that the profitability of production has increased for the laj?ge
weaver. Chapter IV demonstrated that, in fact, in Indonesia factor costs
such as repayments on capital loans, apparent depreciation allowances,
wages a-nd fuel costs lagged behind the general price index. Therefore,
it is reajsonable to conclude that in this s'oecial situation the large
weaver increased his profit (or decreased his short run losses) in real
terrns during inflation. k. The net effect of cost increases:
Marginal revenue product anal^ysis shows that the greater the
difference in the burden of inflation on all other costs of production,
ezcept yarn, between small scale and large sca].e activity, the greater
the relative monetary gains of the large scale producers during a period
of inflation.

275
In a technologically du?_listic economy inflation can accelerate the
demise of the cottage ajid sms.ll scale sector. However, if it can be
shown that inflation operates niore strongly on the short run fixed costs
of large scaJ.e producers then inflation can be an advantage to small
scale activity, -^earing in mind the special advantages of a weakened trade
iinion movement, subsidized state elect^^city, and virtually free fixed
ca-oital costs to the Indonesian large scale weaving industry, it would
be xmv/ise to draw general conclusions from this analysis.
5. Marl:et imperfections and business motives other than profit maximisation:
As v/as explained earlier the weavers might not be concerned with
maximising profits. They might choose to increase output until they were
receiving only normal profits. In in:flation this is more relevant to the
position of the large scale prodiicer. If he benefits from inflation,
tiirough the demise of the small scale industry and greatly undervalued
fixed costs, such that ^ his net profit increases he will expand his
operations ajid demand more yarn from the free market. This kind of
approach to production will raise the yam price a little in relation to
the cloth price and give greater incentive to small weavers to leave prod-
uction, if some are still active produc/e/s.
If inflation continued large net profits would encourage producers
to increase their short run fixed factors. If excess physical capacity
already existed, the first factor which would be increased would be
labour. But if the price of cloth fell relative to the cost of fixed factors,
the large producer's short run profits would be decreased (or his losses
increased) oiid he would reduce some of his fixed factors in the long ru.n.

276
Speculation enters the yarn market on the basis of expectations of
future clia.n,2es in the profitability of producing. If it is believed that
inflation -aill provide greater profits to the large, efficient weavers
there will be a s'oeculative demaiid for the current allocations of small
weavers, -he strength of this kind of speculation, which can be practised
by both large v;eavers and traders, depends on the confidence with wtiich
anticipations of greater profit are held. As in the ca^e of irregular
supplies of yarn this speculative activity would add to normal demand for
yarn in the free market and might have some effect on the decisions of
small weavers whether or not to stay in production.
Luring inflation traders will be seeking goods as a store of purchasing
r;ov;er. If there ex-e other goods which are more profitable for this purpose
than yam the speculative demand for yam might not be great even
though profits of the larve scele vreaving industry are expected to rise.
If the rajige of other goods which serve as better stores of purchasing
power is large it is possible the large weaver himself will prefer them
to yam.
However, the determination of the final effect of inflation on the
profits of a section of the textile industry depends not only on what
inflation does to the distribution of factor incomes but also on its
influence on the incidence of protection to the domestic industry.

277
;,'ith cloth imports:
Inflation increases the cost of domestically produced cloth relative
to the price of imported cloth unsless there is a compensating change in
exchange rate or tariffs. It is true that imported yarn "/ill become
relatively less expensive than goods in general, and the other fixed
costs of large weavers villi probably also lag behind a general price index,
but without complete substitutability among factors of production, at best
this can only delay the closure of the efficient factories while their
former -profits are being reduced. Ultimately, unless redress is made the
competition from increasingly cheaper imports of cloth forces the
domestic industry to close dovm.
I'he total size of smeO-l scale weavers' allocations can help the still
active manufacturers by reducing the cost of yarn still further. But
because of the reduced profit margin resulting from competition the
demand schedule for yarn of the whole large scale industry will fall. At
some stage the small scale and probably the medium scale industries will
have given up all hope of competing and moved to alternative sources of
emplojTnent. Their allocations would be automatically placed on the free
marlret. Viith a fall in demand and an increase in supply the yarn price
in the market will fall but its lower limit is set by the allocation
price itself. The large weaver cannot obtain yarn below this price,
Eventually, only a change in the landed price of cloth can save the industi-y.

278
Devc?-luation of the domestic currency suddenly alters the situation.
Foreign competition is effectively reduced and the domestic industry can
malce profits once again. But this event does not occur automatically
and in the case of Indonesia, Chapter VII shows how the government
permitted inflation to continue for a couple of years without any
rectification of effective exchajige rates. Nor did periodic devaluation
always entirely redress the balance. Inflation is a continuous process
whereas devaluation involves large discrete changes in the competitive
position, '"he longer devaluation is postponed the greater it must be v/hen
it comes if it is to provide sufficient profits to overcome past losses,
^t appears that in the Indonesian case effective devaluation and tajriff
measures did not taJce tliis fully into account and the whole textile
industry SLiffered a long run decline in activity.
iVith the uncertainty of inflation and devaluation speculation is likely
to occur. If the cost of factors other than yarn is going to rise faster
than the price of cloth in the free market, speculative demand for those
factors might occur in the present. But the nature of the other factors
of production is not conducive to hoarding. Labour cannot be bought now
and used later. Yarn, which can be bought in the future cheaper relative
to other factors will not be stocked.
Hence the threat of greater overseas competition in the future is
likely to lower any speculative demand for yarn which might arise for
other reasons during inflation. Stocks which exist might even be re-
leased for fear of rotting before there is a chajige in the fortunes of
the industry. In this way inflation and fixed exchange rates reduce the

279
total, income which sniall ?/eavers might expect to gain from the sale of
allocations; but they might still sell the entire sjiiount because of the
other effects of inflation. In this case although the shift of allocat-
ions from the sma21 scale sector to the large scale sector will be
complete, the total c output of the large scale sector will be
gradually diminished as smsJLler and smaller quantities of private yarn
imports become profitable.
If it were believed that a devaluation must come in the not too
distajit future, the expectations would be of an increase in the cost of
yarn relative to other production costs and a rise in the price of cloth.
This might provoke speculative demand for yarn if anticipated profits in
this market v/ere large enough to attract the limited working capital of
speculators from other speculative ventures. In Indonesia a formal
devaluation has occured about every three years. It would be extremely
difficult for most traders and large manufacturers to hold stocks of
yarn for a couple of years. It is believed t-hat only if it were thought
devoluation was imminent would there be a strong speculative demand for
yarn.
Conclusion.
At thd beginning of this chapter it was noted that the various
sources of yarn to the free market could cause different prices to be
quoted because of the need for greater secrecy or because of sudden rises

280
in the free market cost of foreign exchange. But there were also other
imperfections in the yarn market due to geographical distances and high
cost transport, or derived from imperfections in the credit market.
However, these price differences were limited by the homogeneoiis nature
of the good and all price quotations would be affected in a similar
manner by big disturbances in demand or supply conditions. Therefore, in the
analysis one free market price was assumed to rule.
Without speculation yarn is shifted through the free market from small
to large weaving enterprises. Because the available stock of yarn is in
the hands of the most efficient ?/eavers it is more likely that there
will be a slight fall in the wholesale cloth price.
Distinctions between situations^when the allocations are made in
addition to free imports and in place of them are necessary to study the
final distribution of yarn. In the forraer case they can also affect the
price of cloth by catering the total supplies of raw materials from all
sources.
,,hen allocations are made in addition to existing free imports there
will be a fall in the price of cloth. This is likely to affect the small
scale weaver more than the large scale weaver because the latter is
more likely to be operating where marginal physical product is declining,
and hence less of a contraction of output is required to increase
marginal phyoica.l produet enough to overcome the fall in price of cloth.
The presence of an upward sloping supply curve of free yarn imports
means that the change in cloth price is modified by adjustments in quajitity
from another source.

281
" y enabling the snell v/eavers to talve up their allocations initially,
the free market adds to the supply of yarn facing the efficient manuf-
acturer; unless these official yarn imports would be made anyway and
finally eoictioned their wajs no demand f~.-orn small weavers. To this
extent the full operation of the free market increases the profits of the
large scale section of the weaving industry as well as raises their levels
of capacity utilisation. In this way j:he illegal sales of allocations
provided the lar^e scale section i.vith incentive to expejid capacity while
overall rates of u.tilisation for the industry remained low.
The nature of imperfections in credit arrajigeraents would encourage the
ready sale of allocations by sr.iall weavers. Thus the immediate situation
of the less efficient weaver would suggest that he is more likely to offer
his allocation for sale thaji marginal anaJLysis would indicate, unless
in li'-S-pginsJl costs
were included very high monopolistic interest rates
and opportunity costs.
A factor encouraging him to retain his sllocation for processing
beyond the point v/here marginal cost equals marginal revenue product
would be his fear that he might lose, his right to allocations in future.
It is believed that with time this fear disappeared and that small weavers
were content to automatically sell their entire allocations.
This factor v/as more noticeable amongst large manufacturers, part-
icularly Chinese ones, who wished to prove to the government that they
continued production even in hard times, or v;ho wished to take the
opportunity to e:roand their share of the market. A vei*y strong
impression was gained during field work "that the large manufacturers
endeavoured to remain in production for BB long a^ their total costs of

82
production and tho price of cloth uould pi70vide what each manufacturer
considered v/3i3 a tolerable profit positiono In the short run this might well
have involved losses,
^t was not possible to determine whether the profits of the large
weaver -isrere greater or less if there were no speculation in a situation
of irregular supplies. If the professionaJ. trader-speculator can gain
economies of scale in purchasing allocations ejad stocking them for some
period of time, or if the elasticity of supply of small weavers' yarn is
very high, which is quite likely, the stabilised price of free market y a m
a result of speculation might be low within the range of freely fluct-
uating prices. Changes in the price of cloth due to fluctuations in levels of
domestic production will modify the profits which might be obtained
without speculation. If the cloth price increase*^ from output reductions^
is greater thaji the price decrease (from output rises) th6 large weaver
Eight find greater benefit from having unstabilised yarn supplies. A
market cloth demand curve which is inelastic above a stabilised price but
ela-stic below it v/ould contribute to this, toigether with the presence of
monopolistic conpetition amongst the laTge manufacturers. Also, the
flatter curvature of the marginaJ. revenue product schedule at higher yam
prices would mean that an increase in the price of cloth aJ-lows for a
bigger expsjosion of activity than if : marginal revenue product were
declining rapidly. Private imports of both yarn and cloth would modify aJ-l
price changes by adding to supplies when there was an upward pressure on
prices and withdrawing supplies when there vies a dov/nward tendency. Since
this supply schedule is likely to rise fajster as quantities increase^ it

283
would have the effect of dampening fluctuations of cloth prices more at
the lower level than at the higher level.
The greater cost burden of inflation on the sraall weaver meaxi that a
greater shift of production activity to the large scale sector would
take place in such a situation.
The special impact which inflation had on the fixed costs^such as
capits-l depreciation and repayraents, fuel expenditure, and wages,of the
large weaver suggested that this nanufacturer was able to increase his
real total returns by domestic inflation.
In so far as the large raanufacturer's motivation leads him to expand
output until he is obtaining normal profits only or acceptable losses, his
extra demand for yarn v/ill tend to raise its price.
Speculation in allocation y a m based on anticipated greater profits in
the large scale industry will raise the price of yarn from this source and
might affect the decisions of some of the v/eaier producers. If there • are
some who have regained in production the higher opportunity costs will
encourage thenj to sell.
^ence speculation caused by inflation will also increase the share of
total output of cloth -indertalcen by the Icj ge producers.
Domestic inflation reduces the competitive ability of the industry as
a whole unless there are compensating adjustments made to the ba-sic
exchange rate or to the effective tajriff level, or both, ' his means that
any speculative demand which already exists for newly arrived allocations
v/ill be reduced.

2Sk
The net effect of inflation is unclear because it depends on landed
prices of competitive goods as v;ell BS the slow changing prices of
several fixed factors of large scale production. But it is believed that
the state of foreign competition and the erratic protection policy
resulted in very little spectilative demand for yarn allocations because
of inflation. I'he speculation v/hich did occur was dominated by the
irregularity of government imported yarn distributed at deliberately
lo\v prices.

2C5
CHAPTSR VII.
PROTECTION AND THE INFLUENCE OF INFLATION.
In Chapters III aoid V it v/as seen that a shortage of foreign
exchange did not constitute a sufficient explanation of the serious
underutilisation of the weaving industry because very large quantities
of finished textiles imports were permitted at the same time. But the
ratio of the quantity of ysjrn imports to cloth imports did not remain
fixed and it was apparent in the analysis of planning supplies of raw
materials in Chapter V that the incidence of protection to the domestic
industry was altering all the time. Part of the explanation of this
rests v/ith the many changes in trade regulations which caused
sudden and discrete shifts in the composition of imports, but the con-
tinuously changing incidence of protection was due to the influence of
inflation on the effectivenss of tariffs. Two other forms of protection
invoked by the government, the 'marrying' system and import prepay-
ments, could also be affected by rises in domestic costs.
This chapter is concerned v/ith assessing the impact of inflat-
ion §n tariff protection in the Indonesian textile industry and with
describing the other measures talcen by the government to mitigate this
impact.

2:6 Measures of protection and the effect of inflation on them.
Tariffs (or surcharges):
Tariffs on imports are levied as a fixed number of ^upialis per U.S.
dolla-r spent on purchases from overseas, and the amount placed on a part-
icular commodity measures the level of tariff protection awarded the dom-
estic industry producing that commodity at a given time. So long e^ the doll-
ar price of the import remained unchanged the surcharge in Rupiahs wa^ fixed.
There have ailways been tariffs on imported comnodities but they were
very small until, in August 1952, nexv much higher duties called surcharges
were introduced. These surcharges became the main instrument of protection
by radicoJLly altering effective import rates for different commodities.
The data in Table 30 present the order of magnitude of, and the
many changes in, import surcharges v/ith notes on the position of yarn end
textiles."^
1. One of the limitations of the use of this table is that textile imports varied in quality. The type of cloth which was qiost directly compet-itive with domestic production would ha^e been included in the lov/er categories. ?or instajace, in August 1952 'simpler textiles' were in same category as yarn, but it is not ^clear what was meant by s impler textiles. It might have been bleached and unbleached cloth which v;as used as raw materials for the batik industry, or it might have been the lower quality finished cloth. 5'rom the import figures for 1952 it v/ould appear that some finished cloth was in this category. ./ith so many reclassifications and changes it is difficult to compare the Indonesian incidence of tariff protection with the incidence pre-vailing in other countries, but on the v/hole they are npijverj differ-ent from the duties in the Philippines introduced through the 1957 Tariff Act. This Act altered the entire tariff system which had existed since I9O9. The tariffs are as follows:
Item 19C9 Act 1957 Act Raw cotton Ojo Yejm 15-25?i 35^ Woven fabrics 25-309o 10-255^
Other textiles have higher duties. Y a m carries a higher rate than woven fabrics becaiise the spinning industry is more higiiiy developed than the weaving industry. (L.D.Stifel. op,cit. p.6l)

2G7
TABLi] 30.
3U2CHARGES ON IllPOETS AS A PEE GENT OF VALUE, 1952 to I96O
Categories:
A.ugust January September September June August
1952 1953 1955 1956 1957 1960
A 0 A 0 I 50 I 0 I 0 A O B 100 BI 33.3 II 100 II 25 II 20 20
C 200 BII 100 III 200 III 50 III 50 D pro- C 200 IV 400 IV 75 IV 100 80 hibited D pro- V 100 V i4o higher
hibited v i - i x 150- VI 175 categ-400 ories
higher basic rates.
Yarn Category A Category A
Textiles Simpler textiles only in Category A
Category BI and higher
Free Category II (i)
Free
Categories Categories III Categories I and higher and higher II & higher
(In August 1959 the surcharge on textiles rose to
Sources: The categories and surcharges v/ere obtained from vV.M.Corden ajid J.A.C.Mackie. Malayan Economic Heview. Vol. VII. No.l, April I962.
p p . 5 7 .
(i) Kadarijah. Ekonomi dan Keu3j1g3.11 Indonesia. February 1953.

-lO-u
in October I962 import levies on finished textiles were increased 1
further but this had protective effect only if manufacturers wished to
purchase yarns by private indent in addition to their official allocat-
ions. In i-arch I963 import duties were increased such that raw cotton and
yarns were imported on an effective exchange rate of and text-
iles on Sp.810.00 per U.S. dollar;^ which amounted to a tariff protection
of about 130 per cent. In July 19^3 a special exchajige rate was offered
yarn inporters in order to replace stocks,^ but this was withdrawn a few
months later after heavy importing,
•because of the fixed RupiaJi charge on imports inflation eroded
the incidence of protection by raising costs of domestic production while
the final landed price of the imported good was fixed in Supiah terms. In
the case of the textile industry, producers benefited from the fixed
import price only in so far as raw materials were imported; but these
usually accounted for only 70 per cent of total costs.
Quantitative restrictions:
Quantitative restrictions aim to control the volume of imports in
order to guajrantee a market for domestic producers. There have been three
forms of quantitative restrictions in Indonesia since 1950.
1. Free list:
A week after the Inducement Certificate was introduced in i-Iarch 1950,
a 'free list' of imports v/as announced which included items for which an k unlimited ar.iount of foreign exchange was available: other commodities 1. A.B.Lcebis. Ordonansi dan Peratu.raji Devisen Terbaru Pen3elasann.ja,p.7^ 2. "Hconomist Intelligence Unit -j port. Indonesia. July ^^63^ No.A-3.London. 3. Interview at the Central Bureau of Statistics, January 1965*
Heport of the Java Banlc 1950-31. p p . a n d II5.

2:; being imported on restricted licences. In July I95O almost all other
goods
\7ere added to the list and in November everything v/as free-listed.
The free list system will remain effective during inflation so long
as there is no tendency to corrupt it. But if the price ratio of domestic-
ally produced cloth to imported cloth alters very much, the incentives to
manipulate invoices or allocations will be very strong, ajid in a country
like Indonesia where the bureaucracy is neither vigilant nor very honest
the disparity in profits on the two sources of cloth must be taken into account when assessing the likely efficacy of the free list.
1 2. Quotas: Inese v/ere introduced, after the free lists, in August 1953 because
of a fall in foreign exchange earnings, and in May 195^ there was a severe 2
reduction in the size of the quotas. The following year the restrictions
v;ere eajsed and in the crisis of 1957 they were rejected as an important
instrument of trade policy in favour of exchange rate and monetary measures.
In 1959 SJ exchange allocation authority decided the distribution of
foreign exchange, appropriated by Cabinet from the reserves of Bank
Indonesia, to government departments which were responsible for the level of
activity in certain industries. In this way the weaving industry received
allocations of officially priced yam vi/hich were tantamount to import 1. Quotas v/ere the chief instrurrent of protection for the later developing
Philippines textile industry in the fifties. Until a rise in tariffs in 1957 they constituted the only form of protection. /Ithough they were called allocations they were quotas of dollars rather theji quotas of existing supplies of yam, and, therefore, belong to the category of quantitative restrictions. (.L.D.Stifel. op.cit. pp.37 and ^O).
2. In spite of this quota reduction the international reserves of Bank Indonesia had to be allowed to drop below the statutory 20 per cent. (H.O.Schraitt. Monetary Policy in the Political Economy of Indonesia, 1953. Chapter 3, p.52)

290
quotas oifsred to holders of capacity licencss*
Inflation acts upon the quota system in much the same way as it
does upon the free list system.
3 . The 'Harrying' system:
In 1956 the spinning industry was unable to compete against low
priced yarn imports. The imposition of s 25 per cent surcharge on yarns in
September of that year had failed to solve the problem. In an effort to
avoid increasing import costs the government instituted in February I957
a'linlcage', or 'marrying' system, whereby an import licence holder wa^
required tp purchase 20 per cent of his import licence from a domestic
spinner. In this way the high priced domestic production was rationed out;
but tiiis raethod of protection was abandoned not long afterwards on the
complaints of the weavers that it had caused a 35 per cent rise in yarn 1
prices.
This linkage system has the advantage during inflation that no matter
hov/ l-rge domestic cost : increases are the domestic industry is .guaranteed
some oroductive activity so long as there are cloth imports. But if prices
of textiles should arise as a result of this form of protective measure
the total quantity of cloth demanded by consumers will fall. Imports of
cloth will fall; but so will cloth production.
Prepayments:
A system of advance payments for imports was designed to reduce the
quantity of money in circulation and restrain inflation with a view to
conserving foreign exchange resources and protecting the vilue of the
1. Kadarijah. Masalah Kebid.jaksanaan Administrasi Pen.jaluran Sandang. p.9

2;1
Kupiah. Hov;ever, due to the d i f f i c u l t i e s of working capi ta l experienced
by importers i t emerged as an e f f e c t i v e instrument of import discrimination,
particulLrly during periods immediately fo l lowing a monetary purge or a
r ise in overal l imports rates when l imited f inajicial resources were a l l o c -
ated to the most p r o f i t a b l e imports.
In August 1952 a re -ulation requiring a kO per cent advance payment
on the value of intended imports, to be made at the time of the granting 1
of the l i c e n c e , was introduced, i'he system allowed special credit cons-
ideration to be given to Benteng importers who were responsible f o r imp-
orting yam and t e x t i l e s .
In April 1953 the prepayment v/as raised to 73 per cent ajad in Oct-
ober i t was reduced to 50 per cent.^ Credit f a c i l i t i e s were extended in
September 1955 to provide extra assistance to Benteng importers. These
importers were given the choice between a 75 per cent prepayment v/ithout
the prevai l ing 50 per cent surcharge or a 50 per cent prepayment with a
50 per cent surcharge.^ At the same time a l l other importers were subject
to a 100 per cent prepayment.
Prepayments are generally not regarded as a measure of protect ion,
and even in Indonesia they were intended ajs an instrument of credit po l i cy
rather than of trade p o l i c y . But in a s i tuat ion when import costs have
risen through devaluation or T/hen credit i s d i f f i c u l t to acquire, prepay-
ments can be a nowerful instru'-nent of e f f e c t i v e protect ion. 1. Report of the Java Bank 1952-53• p.103 2. Paiiglaykin.on.cit . p .2? 3. jReport of Baiik Indonesia 1955-56. p.151
If import rates are fixed the protective effect of pre-
payments declines during inflation for tv/o reasons, x'irst, import jJ^'ofits
rise as internal prices rise and this assists importers in overcoming
problems of v/orking capital and, therefore, cre;.it. oecond, as the price
of domestically produced goods rises relative to the price of imports the
lov/er profitability of manufacturing v/ill cause part of the limited
vrorkiug capital, once devoted to the trading of rav; materials, to be used
for importing finished te:ctiles. Importers v;ho haridle all kinds of
textile materials v/ill change the composition of their products v/hen
relative profitabilities on individual goods change.
'The efficacy of measures of T^rotection.
In order to examine the mechanisms of protection since 1950 under
inflationary coi.ditions the years from 19>0 to 196^- will be divided into
shorter periods denoted by the share of domestic production in total
textile supplies. It might have been .referable to bring together all the
years v/hen surcharges v/ere large, or v;hen prepayments were high, and study
the effect of this measure separately, unfortunately, it is very diffic-
ult to isolate the influence of each measure since all v/ere used in
varying degree in conjunction v/ith the others. It is thought that the
simplest way of studying competition is to talce a period during which the
industry showed (or did not show) signs of competing successfully and
observe the prevailing protective influences.
^ata on the composition of all textile materials^, given in -able j;";,
indicate a possible division into six periods according to intensity of
competition. I'hey are 1950 (a special year for imports), 1951-52 (strong
competition from cloth imports), 1953-56 (gradual improvement), 1957-58

293
TP3L2 31.
IMPORTS OF SELECTED TEXTILES RAW MATERIALS ATJD FINISHED GOC'DS
RAW COTTON BLEACHED & DYED, PRINTED TEXTILE COTTON YARIiS UNBLEACHED WOVEN MATERI.^
COTTON COLOURED (CLOTHING PIECE COTTON PIECE 8c UKDER3J GOODS GOODS
1938 - 9,100 27,100 24,600 6,500
1950 2,860 13 ,317 26,139 23,600 2,339 1931 4,042 5,812 26,071 38,647 3,511 1952 4,071 8,228 24,521 23,209 8,882 1933 3,078 12,959 31,471 41,638 4 ,713 1934 3,684 14,374 24,582 33,884 3,369 1953 7 , 1 1 6 17,937 27,224 25,104 2,123 1956 7,841 20,463 23,198 33,289 3,337 1957 9,327 10,534 28,872 28,653 366 1938 8,124 16,868 18,373 13,202 207 1959 6,493 20,486 12,244 7 , 7 1 4 107 i960 1 1 , 1 1 7 49,342 14,890 18,314 392 1961 12,137 50,263 27,142 33,437 1,099 1962 10,391 29,542 19,930 17,160 333 1963 N.a . 22,783 N.A. N.A. I964(i) 4,400 16,743 5,308 9,273 579
Sources:- Report of Baril Indonesia 195^-331 pp. 199-201. (1938 f i g u r e s ) S t a t i s t i k i:on,iunktur;196l, pp.33-9; 1936, pp.30-1;
Jsjiusr.y- Apr i l 1963, pp.36-7*
N.B. ( i )
F igures f o r 1963, Business ^'ews, Djakarta , 3 . 7 . 6 5 .
Fi.gures f o r f i r s t s i x months (excluding May) of 1964 from Summary Report: Imports according to type, December 1963- June 1964.

294
(strong competition from imports), I959-6I (increased domestic activity),
and the period of economic deterioration, I962 onwards.
Large imports of all kinds, 1930:
In March 1950 the Inducement Certificate was introduced for 3II 1
imports. Since all imports were subject to this measure no particular
set of imports was at a cost disadvantage. However, goods which were not
likely to be bought immediately by the final consvimer were considered
risky investments by importers because of the possibility that stocks
would lose their value if the future rate of the Certificate fell. Imports
of raw materials were held to be at a disadvantage for this reason because
producers might have to sell their cloth at a lower price than the cost of
the yarn which they had purchased earlier. This fear disappeared when the
price of the Certificate was fixed not long after its introduction.
A week after the Inducement Certificate increased the cost of imports, a monetary purge reduced the am.ount of money in circulation by about 50
2
per cent. It was hoped that this deflationary measure would lower dom-
estic production costs and thereby benefit industry, but in conjunction
with the sudden and large increase in costs of raw materials imports it 1. Corden and J.A.C.Hackie. op.cit. p.43*
At first it was announced that the rate of the Certificate would be allowed to fluctuate according to supply and demand, but it was soon fixed at 200 per cent of the face value, .'v'ith a basic exchajige rate of Rp.3.8 per'u.S. dolla-r this meant that the effective import rate was Hp. 11.v/hich constituted a very big increase.
2. Re-oort of the Java Bank 19^9-50• p.37

295 caused a crisis in working capital. Traders who held stocks of imports
released these on the market in order to regain liquid resources for
further purchasing. The Report of the Java Bank for 19^9-50 described
this dumping of goods as to the detriment of textile manufacturers 2
because it lowered prices of consumers' goods.
Soon after the monetary purge a free list of goods^ was drawn up,
consisting of raw cottons, yarns and medicines, which was allowed unlim-
ited supplies of foreign exchange. All controls over the price and dist-
ribution v/ere to be abolished. The purp ose of this list was to ensure
sufficient supplies of essential consumer goods and raw materials; but
until credit ?/as extended to importers following the purge this measure
could not be fixlly utilised and exploited. As the government increased
credit facilities this measure became more important, and the favourable
position in which the textile industry found itself in mid 1950 must be
attributed entirely to the free list of imports.
The Import of the Java ^ank for 1950-51 suggests that due to the
tight foreign exchange position producers were able to make abnoniial pro-
fits at this time, but the presence of unlimited supplies of foreign ex-
The Java Bank commented on this period:'In the first place the mon-etary measures did not bring about the desired and necessary peace within the economic sector. The foreign exchange Certificate system which was introduced led to liquidity difficulties which were aggrav-ated by the monetary purge that v;as carried out a short time later' . Report of the Jsva Baric 1950-51 > p.115-
2. Report of the Java Bank 19^9-50, p.37. The lower costs might have alleviated the shortage of working capital in the manufacturing sector but there is no suggestion of this in Bank reports. If stocks held were mainly composed of consumer goods this would not have helped the domestic industry.
3. ReT ort of the Java Bank, 1950-511 p.1l6 Other floods were on restricted licences. (Ibid. p.'+S)

296
ehange for textiles raw materials does not amount to a 'tight foreign ex-
ch.-=nge position' unless domestic capacity is very small. In this case the
weaving industry was still grossly underutilised in spite of the free list.
It would be more accurate to say that the more efficient firms were able
to malce abnormal profits because the weaker firms were unable to process
free list yarn imports at a profit and therefore the total supply of
textiles remained low. It was the variability of cost structures within
the industry rather thaji the 'tight foreign exchange position' which
caused abnomal profits to be made by some firms. Nevertheless, however
temporary were the quantitative restrictions on cloth imports they con-
stituted the only measure of protection offered in 1950*
Later, in Kay and July 1950, the list was extended, and in November
all goods were included sjid the influence of protection declined.
The deflationary policy would have offered further advantage to the
textile industry if the expsjision of credit facilities in the months after
the monetary purge had been allotted in a discriminatory majiner.
Foreign competition and a slump in the industry, 1951-52:
i'he end of the free list system in November 1950 meant tbe- end of
any planning of raw materials imports while the enormous increase in the
money supply, from Rp.^,392 million in December 1950 to Kp.5,132 million
in December 1951, caused a rise in domestic production costs at a time
when the fixed exchange rate held constant the landed price of imports.
1. ReTDort of the Java Bajik 1951-52, p.71

297
The elimination of quantitative restrictions at a time when an
adverse trend in the cost ratio of domestic to overseas output v/ar-
ranted fu.rther protection was sufficient to cause a depression in the
Indonesian industry, but another factor contributed to the decline in
production. The profitability of producing was further reduced by labour
problems, which were caused by greater trade union militancy and the
rising cost of living. The number of disputes and the degree of uncert-
ainty about production increased in the first six months of 1951*
The combined result of these adverse influences was a big increase
in finished textiles imports and a 66 per cent reduction in yarn imports.
The total volume of imports of all textiles materials in 1951 would
probably have been larger i f importers had not overestimated demajid in
1950.^ After the extension of the free list these imports had risen to
such an extent that prices had to fall . Traders who had speculated in
stocks unloaded them on to the market because they required cash; this
caused a fall in textile prices and more manufacturers were unable to
produce|without loss.
unfortunately it is not possible to assess how much of the decline
of 66 per cent in yarn imports wajs due to the three influences: inflation,
lack of protection and the dumping of stocks.
The position was partially rectified in February 1952 by a radical
chazLge in import policy which included the introduction of heavy duties.
First, the basic rate of Rp.3 .8 to the U .S . dollar was devalued to
T, Labour troubles in the first half of 1951 were serious. ( Ibid. p.6o)
2 . Ibid. p .57
3. .'/.li.Corden and J.A.C.Mackie. op.cit. p.^6

298
1 and the L'xchajige Certificate v/as abolished except for luxuries. This
devaluation aCiOunted to including the price of the fomer Certificate
in the new basic rate. Second, surcharges (or duties) were introduced
on imports which were divided into four categories.^ Category A, which
included raw cotton, yam, and some simpler textiles, was free of sur-
charges, Categories B and C were subject to 100 per cent and 200 per cent,
respectively. Goods in Category D v/ere prohibited imports. This immed-
iately provided the textile industry with some protection against
textiles in categories other than the first; the extent of the change
in composition of textiles materials imports is illustrated in Charts
I and II v;hich provide quarterly data. Table 31 shows that yam imports
rose from 5,8l2 tons in 1951 to 8,228 tons in 1952, while finished
cotton piece goods fell from 38,6^7 tons in 1951 to 23,209 tons in 1952.
But inflation undermined the influence of this tariff protection
because domestic costs continued to increase in 1952 while the exchange
rate rerained fixed: Table 12 showed that the index for food prices in
Djakarta rose from l68 in 1951 to 177 in 1952 while the index of the price
of imported textiles actuaJ-ly fell from 77 to 66. The lower price of text-
iles must be considered as a continuation of the decline in this price
from the high level in 1950 when quantitative restrictions kept supplies
at a low level, as well as the result of the fall in world textile prices
follov/ing the elimination of the backlog of demand from V/orld sVar II and
the end of the Korean War. Second, the unfortunate position in which the 1. J.Panglaykim. op.cit. p.26 2. /7.i:.Corden and J.A.C.Mackie. op.cit. p.^5

299
industry found itself was aggravated v/hen, in .lugust 1952, prepayments
v/ere introduced whereby importers were required to make a per cent
advance payment on the value of their intended imports at the time vhen
the impoz t licence was granted. This raised the cost of all imports
because of the higher interest rates paid by importers or their custom-
ers , who had to resort to the free money market for loejtis. Although pre-
payments were intended to restrain inflation by withdrawing money in
circulation this measure was the first indication that availability of
credit covild be used as a measure of protection if it were so desired.
In this case the potential powers of discrimination were not used.
Chart I shows the decline in quarterly data of yarn imports while
finished textiles imports continued to increase in the last quarter of
1952. In the absence of quantitative restrictions these trends must be
regarded es the result of inflation and the prepayments system, although
without further information the share of responsibility cannot be apport-
ioned between them.
Years of prosperity for the industry, 1953-56:
In January 1953 a new set of import regulations reversed the comp-
etitive position and the profitability of manufacturing increased.
The surcharge categories were reshuffled such that Category A,
which inclLided cotton yarns but excluded textiles, was free of surcharges.
Cheap textiles in Category BI carried a 33-3 per cent duty, while Categ-
ories BII end C had surcharges of 100 per cent and 200 per cent, respect-
ively. Category D, once again, consisted of prohibited articles. These
' ^ es were added to the existing fixed exchange rates. 1. ./.ii.Corden and J.A.C.Mackie. op.cit. p.

J;00
Charts I and II show the immediate, but temporary, effect of this
change. Imports of cotton v;eaving yarns increased sharply in the second
quarter of 1953> apparently after a delay. The reaction of finished text-
iles was more immediate: these imports were almost halved between the last
quarter of 1952 and the first quarter of 1953. But by the middle of 1953
the trends were reversed and in the third quarter of 1953 finished text-
ile imports reached a record level while yarn imports fell sharply.
Once again, with no other obvious strong influence, the decline in
the incidence of protection must be attributed to the presence of inflat-
ion v/hich v/as greater in 1953 than in the previous year. The most remark-
able aspect is the rapidity of the decline of effective protection in the
space of six months. According to Table 31 yarn imports rose about 50 per
cent but cloth imports rose almost 80 per cent.
In August 1953 quantitative restrictions were introduced because of
declining reserves and in Hay 195^ there was a sharp reduction in import
quotas followed by another cut in September. Without any'other changes in
trade policy which might influence the composition of imports these quotas
must account completely for the large fall in cloth imports, especially
since the chronic inflation would otherwise have further encouraged cloth
imports. The data in Table 31 reflect government policy on quotas.
In Seotember 1955, a month after a new Cabinet took office, quotas
were abolished but surcharges were raised and prepayments were extended.
The basic exchange rate was still Sp.11.4 per U,S. dollar, but surcharges
1. Re-nort of Banlc Indonesia, 1955-:^6t p.113

301 rose to 50, 100 , 200 and ^00 per cents for the four categories J Rav/
cotton and yarn were exempt, and most textiles were in the first group,
V/ithout quantitative restrictions the composition of textile mater-
ials imports depended on tariff protection. In spite of the slightly
higher surcharges, the rise in domestic costs since January 1953 was so
large that the nev/ level of tariff afforded little or no protection.
Charts I and II show that imports of finished textiles continued to rise
v/hile imports of yarn fell sharply in the fourth quarter of 1955» 'Diese
data provide an excellent illustration of the erosive influence of
inflation on tariff protection.
In early 1956 yarn imports rose rapidly and in the second haJ.f of
that year imports of finished textiles began to decline. The only factor
v;hich appears to have been present to bring about this change was the
discrimine.tory policy applied to the liquidity position of importers. In
November 1955 prepayments for industrial rav; materials v;ere eased by
offering importers the alternative of 75 per cent prepayment without a
surcharge of 50 per cent, or 50 per cent prepayment vri.th a 50 per cent
surcharge, and in July 1956 this x/as reinforced by restrictions on
credit given to non-Benteng importers.^ Although the surcharge on yarn
v;as only 25 per cent at this time, yarn importers still benefitted from
being able to choose betv/een paying the surcharge or advancing the cost.
In the absence of quotas and increa.ses in tariffs it was this selective
credit policy, sjid only this policy, v/hich saved the textile industry
from the near annihilation it appeared to be moving towards at this time.
1. W.i-'. Corden and J.A.G. iiackie. op.cit. p. 2. Ibid. p.51 3. H.u. Schmitt. op.cit. Chapter h, p.5.

302
But without a large devaluation the continuing inflation success-
fully outweighed all these measures and heavy importing of cloth continued.
% e lon er the devaluation was postponed the more ground was lost by the
domestic industry. A minor rescheduling of surcharges had no effect;
nor did the new Inducement Certificate, the 3.E., introduced in September 2
1956 which was necessary for only 10 per cent of total imports.
Imports of raw cotton continued to increase but this was largely
because the spinning mills were few in number, large in size, and owned by
competent msjiagements. The Chinese or European owners had efficient
channels of supply of raw materials and the expensive machinery could not
be permitted to remain idle.
The re-emergence of strong overseas competition, 1957-58:
Prior to the crisis of 1957 the long period of inflation free of
devaluation had led to a weaicening of the competitive ability of the
spinning industry. This was the only period when domestic spinners re-
quired special government protection, and it is a sign of their efficiency
that they should have succeeded so much better than the weaving industry
during a period when competitiisn must have increased considerably. In
September I956 they were granted protection by the imposition of the 25
per cent tariff on yarn imports.^ Soon after this, stocks of yarns of
high lengtiis produced locally were sold out, but yarns of length 20/s
could not be sold because the domestic price was still higher than the
1. ./.L'.Corden and J.A.C.Mackie. op.cit. p.51 2. Ibid. p.51 3. Kadsjrijah. Development of the Indonesian Textile Industry, p.35

303
imported price. As a result, in February 1957> a 'marrying' system was
devised uhereby 20 per cent of an import licence for yarns had to be used 1
to purchase domestic yarn. ;ilthough this was successful from the point
of view of the spinners it led to a 53 per cent increase in yarn prices.
Cloth prices did not rise correspondingly and weavers suffered lower
profits. This e:cposed another difficulty of protection. V/hen imports can
be made at different stages of the manuia.cturing process the protection of 2 one section of the industry involves discrimination against another. In
the case cited above the outcome for the weaving industry was very serious.
It was not until devaluation in June 1957 that the heavy importing
of 1956 was effectively checked. Because of the serious foreign exchange
situation recourse was made to a floating Inducement Certificate, the
in an attempt to equate supply and demand for foreign exchange. In April
1938 the rate of the Certificate was fixed at 332 per cent of its face
value (Sp.11.4 per U.S. dollar) which meant that the effective basic rate
(before surchrjrges) had risen by 220 per cent. At the same time credit
facilities v/ere reduced. All imports v/ere subject to this Certificate and
the immediate result was an enormous rise iii all costs, including essentieis,
s-nd a crisis in working capital. Furthermore, the new set of surcharges
for six categories, provided a slightly smaller percentage tariff prot-
1. Kadarijali. I-IasaH-aJi Kebidjaksanaan Administrasi Fen.jaluran oandang, p.9. 2. In Chapter VIII the difficulty of estimating an 'effective tariff for
the Indonesian weaving industry is discussed. 3. Kadarijal-i. op.cit. p.23. The effective iinport rate, excludin-^ surcharges,
fluctuated betv/een 1^.23 and iip,37.8 per U.S.Dollar. On average, it meant an increajse of about I50 per cent on the basic exchange rate of Rp. 11.^ per U.S. Dollar. The basic rate remained at Ep.11.^. The Certificate gave rise to an effective ba^ic rate to which surcharges were added. 'J.M.Corden and J.A.C.Mackie. op.cit.

304 ec':ion to importers of raw materials then the former duties although the
devAluation increased the absolute size of the tariff.
Charts I and I I show the effect of these measures. Yarn imports
suffered, both proportionately and absolutely, much more than cloth
imports. The two causes were the rescheduled surcharges and the strain
on liquidity resulting from both the big increase in the effective im-
port rate and the reduction in credit. It would appear that the govern-
ment overlooked the cumulative effects of inflationary influencei^on
internal costs and working capital^ on the competitive ability of the dom-
estic textile industry when it introduced its policy of devaluation and
deflation.
Strong stipport for the textile industry, 1959-I96I:
The establishment in April 1958 of the P.T.-2 Negara limited
2
companies which were the fore-runners of the State Trading Corporations
(known as the Big Eight), meant that nearly all of raw cotton^ y a m s and
textiles imports v/ere in the hands of government monopolies run by inex-
perienced Indonesians. The raw material imports were insured by the system
of official allocations to the Department of People's Industry for this
purpose. The system was provoked by the chronic underutilisation in the
domestic industry, and imports in 1959 and I96O suggested that the govern-
ment was determined to guarantee the needs of the manufacturer before the
profitability of importing or the purchasing power of the consumers. Under-
utilisation on a growing scale had existed since 195^ and stocks of raw
1. J.Panglaykim. State Trading Corporations in Indonesia. First Year's
PerformaxLce. pTS 2 . J.Fajiglaykira. Ekonomi dan Keuangan Indonesia. Vol. I6. No.3. 1959
pp.17-18

305
materials were thorougl:ily depleted. The latter partly explains the very
large inports of yarn and rav; cotton in I96O-62.
xhe difficulty of assessing protection policy after 1959 rests on
the allocation system. It is true that less yarn was imported privately
after I96O and that manufacturers came to rely very heavily on the dollar
reserves of the Department of People's Industry. However, that quota
itself appears to have been influenced by competitive pressures of the
importers on the Department of Trade which was responsible for importing 1
cheap textile fabrics.
Aae influence of devaluation in August 1959 and increases in sur-
charges must be considered negligible in view of the degree of inflation
since June 1957* ^he B.E., which had been fixed at 332 per cent of P.p.11. per U.S. dollar, was abolished and a basic rate of Rp.45.00 wa^
2
introduced, while the textile category competitive with duty free yarn
faced an increase in surcharge from 20 per cent to 25 per cent.^ Under the
system of allocations of foreign exchange to Departments tariffs and ex-
change rates could have been iraportant determinants of protection in view
of the pressures already mentioned. But it is thought that the influence
of inflation eliminated these sme21 import cost^ increases and weakened
the bargaining position of the Department of people's Industry.
In August i960 the strength of foreign competition was increased by
a reshuffling of effective import rates. In an effort to curb all imports
a 20 per cent flat tariff was added to the surcnarges on all raw materials 1. See Chapter V, 'Supply and Distribution of Ravi Materials'. 2. •./.H.Gorclen and J.A.G.Mackie. op.cit. p.55 3. Ibid. p.45

506 1 and finished textiles; this reduced the ratio of effective import rates
of cloth to yarn. The continuing inflation aggravated the situation by-
changing relative profitabilities of finished goods and raw materials.
Cloth imports rose to a very high peak in the first quarter of I96I.
If the allocation system had not been in force the domestic industry most
likely v/ould have lost more ground to foreign textiles than it did.
The decline of foreign exchajige reserves, 1962 onwards:
The limited foreign exchange supply ajid the allocation system dom-
inated the pattern of imports during this period.
Another Inducement Certificate, but one which was mainly purchased 2
for Imciiry imports, v/as introduced in -- arch 19^2, and in October finished
textile!imports had higher duties levied on them. In "arch 19^3 the Cert-
ificate was abolished and imports were freed from the allocations system
but were subject to higher import duties. Saw cotton and yarns were
imported at the rate of Ep.315 per dollar, while competitive textiles
were imported on the rate 5p.8lO.
In July 1963 a special low exchange rate was offered importers of
yarn but this was withdravm after a few months, following heavy importing.
In the following year imports were made by the Department of People's
Industr r on the basis of its foreign exchange allocation on a fixed low
rate and by private indent of manufacturers on a near free market exchange
rate. But all imports fell markedly as a result of the extreme shortage of
foreign exchajige and the issue of overseas competition was very much a
secondajcy problem. 1. Ibid. p.57 2. A.B.Loebis. op.cit. p.

307 internal Problems of protection^to the industry
Tliere are two issues of protection involving considerations of com-
petition v/ithin the industry which make it difficult and misleading to
thinlc in terms of one fixed "effective tariff".
The first refers to protecting different stages of the manufact-
uring process. If spinning is to be protected this v ill cause high raw
material costs in the v/eaving section ajid if these costs cannot be passed
on to the consumer the profits of the industrj'- v-dll be squeezed. On the
other hand, if the v/eavers cje protected against imported cloth, this
might have to be at the ejqpense of no tariffs of yarn. The spinners
might find it difficult to compete v/ith imports. The experience of 1956
and 1957 shov;ed that v/ithout a surcharge on ys.rn imports, domestic
spinners could not produce at a profit. Furthermore, each stage of the
process v;ill probably require a different incidence of protection vdth
each development in mechanisation. In the light of the disciission in
Chapter IV, if the entire v/eaving industry v/ere mechanised the differences
betv;een tariffs on rav/ cotton and yarn might not have to be so great.
The second difficulty of protection is the variation in levels of
efficiency v/ithin each sector of the industry. This problem is almost
exclusively confined to the weaving industry. Protection for v/eavers,
sufficient to cover the costs of the small scale unmechanised weavers,
v/ould lead to abnormal profits for the efficient, large factories. The
government attempted to solve this question by offering fixed priced yarn
allocations to small scale enterprises in 1955 and 1958 but this produced
a blackmarket because profits from selling the allocation to large firms
v;ere sometimes greater than profits from processing it, and at other times

— o yjo
it was regarded as preferable to sell the allocation without even cons-
idering production profits. If there had not been a shortage of foreign
exchange the issue would be simpler because the large factories could be
provided ivith enough yarn v/ithout resorting to the black (or free) market
and the small scale enterprises would ti7rn to production if they found it
profitable to do so. But on the basis of past experience it would be pref-
erable to cheiinel supplies of yarn limited by the availability of foreign
exchange direct to the most efficient factories and adjust protection to
weavers in this situation.
Conclusion:
The composition of textile raw materials v/as constantly undergoing
alteration because several different factors were influencing the degree
of overseas competition.
The fall in imports of yarn towards the end of 1950, when there
were orly very small tariffs imposed for revenue raising purposes, re-
vealed the necessity of tariff protection if other forms of protection
were not to be used. But when sizeable surcharges were introduced in 1952
to assist the domestic textile industry tariff protection was shov/n to be
ineffective in an inflationary situation. The surcharge of the cloth
imports which were close substitutes for the cheap domestic product were
usually of the order of magnitude of 25 per cent to 50 per cent. Jith
inflation of as much as 50 per cent a year between 1950 and 195® the
influence of the surcharges was gg ab:! diminished. J etween 1952 and 1957
there v/as no devaluation but prices doubled. The landed cost of imports
was raised by a small rescheduling of surcharges in 1955» % later I956

309
rav; mater ia ls imports iaad decl ined to an all-time lev.' while f i n i s h e d
cloth iraports v/ere s t i l l a r r i v i n g i n large q u a n t i t i e s .
Cuotas vrere u.sed in 195 ''- ajid part of 1955 in order to conserve
foreign exchange reserves but it i s thought that i n f l a t i o n might have made
t h i s method of protect ion vulnerable because the increas ing p r o f i t s o f
cloth imports undermined the l i c e n c i n g system.
I n these circui'astances credit p o l i c y emerged as a pov/erful instru,;;-
ent of protect ion through i t s e f fects on the vrorKing capital resoujrces
of the importers . The -^enteng prograiTine had promoted a class of importers
which v/as h e a v i l y reliajit on subs id ised bajilc c r e d i t , and by manipulating
barji: credit p o l i c y the, governiiient i-ias able to reduce the l i q u i d i t y of
the importing s e c t o r . I n i^ovember 1955 when the t a r i f f protection on yarns
had been greatly reduced by a long period of i n f l a t i o n , and quotas had
been a b o l i s h e d some months previously , the special concessions to
importers of raw materials over advaiice payments must be he ld l a r g e l y
responsible for the increase i n the volume of imports o f those goods,
fhe cha.nge i n the fortunes o f the t e x t i l e industry at that time show t h a t ,
i f e f f e c t i v e t a r i f f protection i s impossible for one reason or another ,
se lect ive credit p o l i c y can become a very successful s u b s t i t u t e .
V/hile i t i s d i f f i c u l t to i s o l a t e the souxces of protective
b e n e f i t to the t e x t i l e industry i t csii be concluded that there were
long per iods when t a r i f f protection was one of the least i n f l u e n t i a l
metliods of support .
'.^he a b i l i t y of the large scale s e c t i o n of the weaving industry to
sui-vive, as i s shown i n Chapter V I I I , owes much to the f a i l u r e of some
costs of production , such EJS wages of h ired labour , cap i ta l repayments,
and d e p r e c i a t i o n to respond to general pr ice i n c r e a s e s .

310
CPIAPTER VIII
THE TEXTILE INDUSTRY AFTER FOURTEEN YEARS OF SUPPORT AND PROTECTION.
This chapter will review the state of the industry in 196^-65 by
examining the rate of capacity utilisation and the strength of competition
from imported textiles, unfortunately, a detailed analysis of the industry's
competitive position is not possible because of the analytical problems
posed by arbitrarily fixed multiple exchange rates and quotas, and the
presence of inflation. Rowever, a fev/ tentative conclusions will be dravm.
/-"I
Considerations of overall benefit from the industry vjill be left to
"^hapter IX,
V/e will begin by summarising the development of the industry since
1930 follov/ed by a description of the chief characteristics and the size
of the industry. Because of the incomplete nature of up to date inform-
ation some of the data refer to periods earlier than 196^ but in viev; of 1
the very small ai'iiount of private expansion after •'1962 this is not consid-
ered a serious deficiency. Data on public investment were available until
the end of
titatistics on imports and production for recent years are not fully
comprehensive and the level of activity in recent years must be inferred
from import figures acquired during interviews and from impressions
gained on visits to centres of textile production.
I0 This information was gained from interviews with manufacturers and with officials of the Department of People's -industry, Djalcarta.

311 Development of capacity and production since 1930.
A sumnarised description of the progress of the domestic
industrj?- and its importance as a source of total supply of textiles
in the country since I930 is provided in Table 32. The first tvro
decades are represented by the years 1930, 19^-0 and 1951, v/hile the
period follov/ing is shown by a mid 1955 level and the recent years of
uncertainty.
TABLE 32.
TilE D3VaL0Fi-l£i;T OF THE MCSEBI: TEXTILE INDUSTRY SIIIG]!; 1930'-(Spinning capacity, v/eaving capacity, weaving production,
imports oi%loth; 1930, 19^0~, 1951, 1955, 1960-62) opinnxng capacity (tons of
li eaving capacity
Actual weaving
Imports of cloth (million
yarn) INPUT (tons
of
OUTPUT (million metres)
(million metres)
metres)
yarn)
1930 19^0 3,636
200 32,000
0.9 117
N.A. 128
450 139.2
1951 1955
5,506^ 8,5^0
49,977 54,200
274.6 297.8
65.1 13^.0
211.8 138.1
i960 1961
1962
10,716 K. A.
1^j053
87,870 W.A.
120,793
482.8 N.A.
663.7
332.1 336.6 214.9
100.7 183.7 9k,G
Sources: —
(i) Spinning capacity 19^0; talcen from Chapter II (Capacity and Production - The Expansion to 19^t2).
(ii) .leaving camcity 1930; derived from ^'able 2. (iii) Spinning and v/eaving capacity 1951,1955,1960-62, tal^en from
i-'able 13.
(iv) Imports of cloth 1930 (actually for 1933) derived from Table 3. (v) i/eaving capacity, weaving production, imports of cloth 19^0;
taken from Table ?. (vi) Weaving production 1951-1955, 1960-1^62 talcen from the sum of
first and third coluiims of Table (vii) Im-oorts of cloth 1951, 1955, 1960-62; Table .
* The 1952 figure. H.B. Spinning production is not shown because the spinning industry always" functLned at near full capacity, -eaving capacity measures the ootential output of ATT.^s and ATMs according to the usual capacity definj'Siions of this thesis.

312
The first column indicates the development of the modern spinning
industry v/hich v;as first established as late as 1935. production
arnoiiiited to betv;een 63 and 73 pcr cent of capacity production for most of
the period. Since v/eaving and spinning capacity increased at approx-
imately the same rate although there v/ere differences over shorter periods
of time. In I962 the spinning industry was capable of supplying a little
more than 10 per cent of the yarn capacity requirements of'the weaving
industry.
A comparison of the last three columns shows that whereas before the
war the v/eaving industry had little chance of supplying total market re-
quirements, by 1962 it was well able to supplant all imports of cloth,
-he total supply of cloth in I96I was 320 million metres but capacity
in 1962 was 663.7 million metres. If total supplies of textiles are limited
by foreign exchange r^sou-rces this surplus of capacity over total supplies
would suggest that the weaving industry has over-expanded relative to the
country's ability to purchase its product. However, it is not certain
v/hether all handweaving capacity should be included in capacity estimates
as they could, by some criteria, be judged to be obsolete and superseded
by power weaving capacity. The inclusion of hand^^eaving capacity, vihich
1 comprises approximately 67 per cent of total weaving capacity, would bring
the combined capacities of the weaving and knitting industries to over
7 metres per capita v/hich is as high as consumption has ever been since
Independence.
1. Calculated from -able

313
Furthermore, the composition of potential output and its quality
might not correspond v;ith consumers' preferences, ^f the type of cloth
v/hich could be produced is not v/anted b y consumers then some capacity will
remain idle. I'ov; quality output v/ill require a much higher level of protect-
ion thsji otherv;ise.
General characteristics of the industry.
Capital investment since I950 has not significantly altered the
location of centres of textile production and the industry remains more
1
heavily concentrated in ^ava than does manufacturing as a whole.
Spinning capacity is distributed xnievenly throughout Java due to the
large single units v/hose location v/as fixed by the government in the hope
Ghat they v/ould assist local indigenous small scale v/eaving; and it bears
little relation to population or weaving capacity distribution.^
The trading centre of ^andung and the surrounding countryside in
•'est <Java, only 100 miles from Djalcarta, have established a v/eaving V
industry capable of producing almost two thirds of ndonesian cloth
production. This must be almost entirely attributed to the v;ealth of the
"andung area, the high proportion of Chinese producers amongst total prod-
ucers and their speci^-alisation in power equipment, '- he fact that almost
80 per cent of modern finishing capacity in Indonesia is located in .vest
Java^ is another indication of the foresight of the Chinese because with-
out the modern processes finishing is invariably of poor and uncertain
qualityo
1. statistical Pocketbook of Indonesia I963, pp.103-9 2: Memorandum to -e^artment of -eople s industry by i.P...ndren, U.i..
Advisor, 2.10.60. £lua_Progress i.eports on otate Projects, December 195^.
3 . M.H.Adisendjaja. I^ad.jalah Industri Ixakjat. No.6. June 19^3- P 0 6

The distribution of size of enterprise cannot coapare v ell with t'lose
of industries in more industrialised countries;,' _ economies of scale can-
not be great when over 50 per cent of textile manufacturing is in enter-1
prises employing less than 50 v/rrkers. -'evertheless, the average size of
textile establishment is larger than in most other industries in Indonesia.
-hus the textile industry can be sunimarised as being heavily con-
centrated in Java, and in uest Java in particular although the plant
capacity of the various stages of the manufacturing process (spinning,
weaving, finishing) are not distributed in similar manner, ' he Chinese wno
are usually found in control of large establisiriments using power looms
are proportionately more niimerous in aiidving than elsewhere so that the
weaving industry in l.'est Java is larger and more efficient. The same kind
of entrepreneur in Bandung has been foremost in promoting modern finish-
ing processes v/hich contribute to maicing his cloth of the highest
p^ality in Indonesia.
Capacity.
iiiaw cotton:
Although it was realised long ago that the methods of cotton grow-
ing used during the Jai^anese Occupation and earlier v;ere quite incapable
(as far as costs and quality v;ere concerned) of competing with imports
serious efforts at experimenting with new seeds and insecticides were
only started in recent years. It is possible that the old methods of cult-
ivation were believed tobe sufficient for the small modern spinning cap-
1. Calculated from data in Statistical-Pocketbook of Indonesia, 1963. pp.110-111

315 acity which still existed, or that investment in factories was consid-
ered more positive proof of econoraic progress.
Before 1959-60 all cotton growing v/as done by small farmers except
for a little experimental production, .onall farmers' output declined
throughout the fifties and in 196^ \-Jas negligible, j-'oday cotton is no
longer included amongst the crops recorded in Department of Agriculture
publications."^ The unfavourable (controlled) price of raw cotton and the
higher quality of imported cotton are the principal reasons for the
decline in small scale cotton production.^ 'fhe distribvition of price
1. i'he table in this footnote provides data for the cotton production for the most recent years for which figures are available.
PEODUCTIOM OF GLEAIvj D COTTON (tons) IQ53 223 1956 150 195^ JGk 1957 158 1955 173 1938 ^00
Sources:- J.Panglaykim. 3ome 'acts xd Figures Concerning;; Textile Productioni in the_ Country.' p.28. The figureTcTr "1938 resulted from 1,655 hectares of cultivated soil. (Department of People's Industry Staff 'forking ^ aper, 1964).
2. Kapok, with a production of 6,592 tons in I96I-62, is^mentioned, on the other hand. (Laporan Ten. ah Tahunan. January to June 196j). Department of Agriculture, Djaicarta. 1965- p.108.)
3. In November 1964 the controlled price of cotton was Sp.793 per kilo-gram of cleaned cotton. If there were no costs of cleaning the crop this vrould be the equivalent of Hp.265 of uncleaned cotton. (This was approximately the price of a kilogram of rice in Djakarta at the time)".Tlie farsaers have no facilities for cleaning the cotton them-selves and making it pay. 'jhe state-run ginning factories are cheap but the effort of getting the cotton to the factories does not malce cotton production worthv/hile particularly since productivity is so low. ^rodi^ction in the United Arab i epublic is 550 kilos of clean cottonpe ^er hectare, in California it is 1,000 kilos, but in Indon-esia it is ! only 200 kilos. (P.eport to the Planning Bureau, Djai- arta, 1964. Clothing Needs in Indonesia). Other crops, are much more proixt able for the small farmer in Indonesia. Causes of the low productivity include lack of fertilisers, persistence of plant diseases and administrative proble;ns. Cotton production was made profitable by some farmers by mixing cotton with another crop. But the farmers v/ere not given fertilisers for cotton production itself. They obtain-ed seeds (Cambodia vari .ty) from the Department of instates which stored the seeds taken from last year's crop, ' he more enterprising farmers asked for the imported -^eltapine seed v;hich was willingly^^ given by the Department.(Interview at i'.i.Jerat, Djakarta. 12.It.64)

pl6
contpolled imported cotton of higher quality, and especisdly of the
imports of P.L.'-l-So cotton from the U.S., offered too much competition,
v;hile inflation made other crops increasingly more profitable for
small farraers. '
'he most successful experiment in gro\ d.ng cotton by new raethods
has been in Asera Bagus although a unit in Sunbav/a showed good resiolts
in 196^. Other projects in 3uj-abav;a and at Lonbok s ov;ed no progress.^
However, it is difficult to judge these results on technical grounds
only, fhe failure of the cotton centre at Sumbawa and the station at
Lorabok has been blamed on the difficulties of shipping tractors, spare
parts and fertilisers to these islands. These obstacles appear
insuperable in a situq.tion of failing inter-island transport when the
raovement of essential consuraer goods must tal:e priority over the
organisation of research facilities.
Another major difficulty encountered in research v/as pest control.
Although the iise of a sticky substance lias solved the problem of
retaining insecticide on the plant during the nonsoons, insufficient
insecticide is produced doraestically, and, like the imported seeds,
supplies must rely on available foreign exchange.
1. A report on cotton grov;ing in I965 suggested tliat irrigation could solve the problems of small farmers and that cotton could become an economically feasible crop. However, if irrigation v/ere installed it v/ould most likely be used by farmers for rice prodiiction since this is more profitable. (D.A.Simpson. Report on a Programme of Breeding and Cultural Experiments v.dth Cotton in Indonesia. F.A.C. Cotton Breeding Expert. 195^).
2. fotal production v/hich v/as 16? tons compares very unfavourably with 1,365 tons produced in 1950. (Panglaykim. op.cit. ..28)
3. Interview at P.P.Serat, Djalcarta. 12.11.6 1-.

317
j-he chances of successfully producing cotton on a cornrr;ercial basis 1
are poor in the short run because the supply of insecticides and
foreign seeds for experimental purposes is not likely to be very high on
the list of import priorities in the present economic crisis.
Spinning;
•Jable 33 presents information on fixed capital in the textile
industry for latest available dates.
By the end of 1964 3911076 spindles should have been installed
according to plans^, but only 223,000 spindles were ready for operation,
'•'his existing capacity v;as capable of utilising 21,471 tons of rav/ cotton
and producing 19,324 tons of yarn, working three shifts, 260 days a yeci r.
^his output constitutes over 10 per cent of combined weaving and knitting
capacity.
1. ' he government is not planning the im,iiediate large scale expansion of the cotton grov/ing industry. Instead, research is being extended by the establishment of two more research stations, one in Asera S -gus and the other in -.usa fenggara (i-latararn ), east of Java, eighteen new 'cotton centres' are also planned. These centres are small plantations of one to five hectares situated in the centre of trad-itional cotton gr'/ ing areas and are designed, like the weaving and finishing centres, to attract, advise and aid potential cotton farmers. Jt is the long run intention of the government to m.odernise cotton growing but for reasons of employment and income small farmers will be urged to take up production or return to it if they once produced cotton.
T - *
2. Interdepartmental I eport to Minister of -"eople s Industry, Djakarta, 3.12.60'. Thirty thousand spindles v;ere added to the spinning mill at Tiilatjap and were -ready for production at the end of I963. (List of Projects for Progress Report T963 • Bureau for the l^evelopment of •ew •'Projects. Ceipartment of People's Industry. 31.12.63. pp.27-9) It has been found to be impossible to decide from the various reports whether the T jilatjap extension has been included in the figure for spinning capacity in Tabic-.33' . -here is another 212,588 spindles currently being installed. (Ibid, -.eport for 1964. .. 31.12.64. pp.3-25.^

1 Jl
t a b u : \ 3 .
r u g ^ . A P i C i t t i N m m<P o v w t o r t h e n m u ; i w w s r a T a t d a t x s
• ? f ' ^ m r ft*l^l'ld^^^f i n t o w u t i w
S P I N N I N G ( N o « a t > e r 1 9 M ) 2 2 ) , 0 0 0 • p i n d l o v o r k i n g t K r « « • h i f t ! d « T l • y e a r
A N N U A L I N I V T
2 1 , 4 7 1 t o n a r a * c o t t o n
A N N t l A L O U n V T
1 9 , > 2 4 t o n a y a r n
U S I N G I N P U T D A T A O T U S I N G I N W T O A T A o r T E r r i L t i n s t i -T V T t , B A > € J U N C .
U S I N G O U T P V T D A T A O T U S I N G O U T P V T D A T A o r T t r r i L E i n s t i -T U T E , B A N I X T N T , .
L i c e n c w d D e d a t n d b y L l c a n c e d D e f l a t e d b y L i c e n c e d D e f l a t e d b y L i c e n c e d D e f l a t e d b y c a p a c i t y a c t u a l c a p -
a c i t y o n b a a i s o f
c a p a c i t y a c t u a l c a p * a c i t y o n b a a i a o f
c a p a c i t y a c t u a l c a p -a c i t y o n b a a i a o f
c a p a c i t y a c t u a l c a p -a c 1 t y o n b a a i a o f
a u r r w y K D T X A a u r v w y
2 . W E A V I N G A p r i l l < > ( i 2
( a ) 2 2 ) , 9 0 « k a n d l o o a a w o r k i n g 1 a k i f t 2 4 0 d a y a a y e a r .
7 « > , » 0 0 t o n a y a m
N . A . » . « X i t o n a y a m
N . A , 4 J I . 0 • i l l I o n M t r e a
N . A . 4 2 9 . « • i 1 l i o n M t r e a
N . A .
( b l 2 2 , 1 7 1 P o w e r l o o w 4 1 , 4 1 2 4 ) , 2 6 0 4 6 , I 0 2 4 1 , 4 9 6 2 1 6 . 2 2 S « . 4 2 H . O w o r k i n g 2 a h i f t a 2 4 0 t o n a y a m t o n a y a r n t o n a y a m t o n a y a m mi I H o n • i 1 1 i o n • i 1 1 i o n • i 1 1 i o n d a y a a y e a r ( 2 1 , 1 1 1 P o w e r l o o M a c c o r d i n g
• e t r e a • e t r e a « e t r e a • e t r e a
t o p j O I U i . a u r v e y r e a -u l t a l • ( T b e a e d a t a i n c l u d e e q u i p a e n t u n d e r i a p l a a M n t a t I o n a t t h i a t i * e fc a o d i ( ( e r f r o a T a b l e 1 6 1
1 2 4 , 6 1 2 t o n e y a m
I 2 6 , 7 0 « t o n a y a m
6 4 7 . 2 • 1 1 l i o n M t r e a
6 « S . 2 ml 1 l i o n • e t r e a
J . K N I T T I N G A p r i l l < N > 2
« . ) S , 7 < » H a n d • i c h -i n r i v o r k i n g o n e • h i ( I 2 4 0 d a y < y e a r .
( b l J , 2 7 ^ P o « e r » j c h -i n e s w o r k i n g l * o • h i r I a J 4 0 d a y • a y e a r . ( T h e a e d a t a i n c l u d e e q u l p a i e n t u n d e r i « p 1 f a i r n t a t i o n a t t h i a t i » e , a n d a o d i f f e r f r w T a b l e I b l .
« . r i M S H l N G A p r i l l < » h 2
• o r k i n g l a o a n d t h r e e . h I 1 1 • , J h O d . . > • a r e i r
l y . o i j t o n a y a m
N . A . N . A . N . A . l O I . O • 1 1 1 i o n • e t r e a
N . A . ^ A . V s l
CO
M 4 . 4 2 ! < > . < > • i I 1 i o n a i e l r e .

319
Sources;- Pemban,:; ^ - - Industri P-alcjat. pp .11 , 17-27; and report oi the
Industrial f^echnical Foimdation '•^entre, P .T .D junt i . 2 1 . 1 2 . 6 3 .
Notes:-
Spinning factories vrork three shifts a day because of the inadequacy .
of their production capacity, i'hey have private pov;er generators. Host
of the finishing factories also hcive their private generators al.tliough
Pembangunan Industri --' akjat defines full capacity as only two shifts
a day for these establishments, i'he full capacity for three shifts a
day in the finishing factories is also given on the assujaption that the
large, expensive equipment which constitutes a bottleneck in the
manufacturing pi-oceos v;arrants the effort of installing private power
generators to enable three shifts a day.
I^wer looms and knitting machines v/ork tv;o shifts because of the
limitations of government electric".ty supplies.
[fandlooms and h^nd knittin,. machines v/ork one shift because of poor
light after seven hours of v;orl: and rest periods.
All the estimates of input and output in Pernbangionan Industri Sakjat
are based on 300 v;orking days a year. I'hese figures have been deflated
to the amounts corresponding to the more realistic working year of 2^0
days for weaving and knitting (calculated on the number of holidays
and half-holidays) and of 260 days for spinning and finishing (because
extra labour can be put on these bottleneck sections; .
According to Pembangunan Industri - ' ali.iat some equipment was being
currently installed (new factories and expansion of existing ones) in
April 1962. As these increments were not very great they were added to
the capacities existing in April 19^2 to reach a more up-to-date
estimate. However, capacity planned by April 1962 was not included.
~he conversion coefficients for input and output obtained from the
Textile Institute in Bandiong are as follows:-
Ir^ut Output
ATBM 1 .3 kg. yarn per shift 8 metres cloth per shift
ATi. 01) 3 . 5 20
AT:. (2) 5 . 0 20
The deflation of recorded capacity by the results of the svurvey of the
KOTCE textile team investigating licences in the Djogjakarta area was
based on the data in -able number of ATSHs was not altered^
because it was suspected that the results were based on capacity sLill
being used, not on actual capacity of ATBI'Is. The unexpected result of
more"ATI-l( 1) s than were re.gistered can be due to the fact that many
ATK(l)s were registered as ATM(2)s because the yarn allocations for the
latter were greater. There are reasons why the deflation ratios for
power looms should not be rigidly applied. The distribution between
ATM(l)s and ATK(2)s in the Djogjai:arta area might be quite dixierent
from that in Indonesia as a v/hole. The extent of falsification of
licences might also be different.

320 V/eaving:
'-i-lie latest comprehensi\'-e information on weaving capacity is
for April 19b2. Since then there have been reports of projects
finally iriiplemented and these can be added to the figure for 19^2
but it is not certain that all existing new equipment is included in
these reports. On the other hand, if the completion of a project has
been reported, this might be an exaggeration on the part of contract-
ors v/ho need to recover funds which have been lost throi^gh inflation.
Projects I'efer only to the public sector and there is no record of
recent private increments to textile capacity. However.,, because of
the end of the period of easy state banic credit and foreign exchange
grants for capital equipment, it is believed little new private
capital v;as installed after 19S2.
^n spite of this, licences for textile equipment continued to
increase because under the system of price controlled yarn allocat-
ions it v/as profitable to overstate actual capacity, -hen the first
few enterprises began overstating their licences others followed
suit in order to retain tl-eir share of yarn allocations. Ihe survey
team from KGlDS (oupreme Command of I^conomic Operations) began inspect-
ing factories containing power looms in '..'est Java in December
and in Central ^ava in ^aniiary 1965 v -th the purpose of obtaining
a more accurate assessment of overall capacity and to ensure a just
and fair distribution of future yarn allocations. In -ebruary 19o5
the first report of these investigations appeared.^ Cn the basis
1. 'j'his conclusion v/as reached after discussion with civil servants and manufacturers.
2. "'e-oort, -i-'esult of the KOTOii Special Survey Teajn of Yarn Distribut-ioTi. p.2

321
of the team's study of 502 textile establishments in the Djogjalcarta
area in C^entral Java some inferences can be made aoout the capacity
licences for the vjhole of Indonesia. Table Jh presents the results
of the investigations.
TABL^
LICENCED AI® ACTUAL CAPACITY IN ..502 TEXTILE ENTERPRISES IN THE DJOGJAKARTA aREA.
According to Actual Difference Licences
ATH^ 5,5^5 7,179
ATMp 10,639 7,246 16,204 14,425 -1i7oO
ATBM 13,598 303 -13,296
Source;- Report, Result of the KO'I'OE Special Survey ' 'eam on Yarn Distribution, p.2
The percentage error for the ATM^ was -23 per cent and for
ATM^ +47 per cent. The explanation for the underestimation of ATM^
capacity is that many of the ATM^ looms were recorded on licences as
ATH^ looms because the latter were awarded larger yarn allocations,
' 'he enormous corruption of handloom licences is difficult to comprehend.
Since handlooms were falling into disuse because of the lack of raw
materials it may well be that the survey team counted only those which
looked as though they had been recently worked. If this is true, and if
the others had fallen into a state of disrepair, the handloom capacity
of Table 33 should be reduced by 97.8 per cent to obtain a more accurate
picture. This very big difference between licenced and actual hand-
weaving capacity might be tal-cen as a measure of the abandonment of hand-

looms, an event which some members of the IIOTOE team hoped to see.
'Aie extent of corruption increased very rapidly after I96I v/hen
the shortage of foreign exchange encouraged some manufacturers to devise
methods of obtaining larger allocations of rav; materials, iioreover,
when corruption was found to be so easy it tended to accelerate, - t v/as
the responsibility of officers of the Cepartment of People's Industry to
inspect factories and grant licences but it v/as not feasible to rely on
people v/ho v/ere as grossly underpaid as these officers.
From Table it is seen that when the handv/eaving industry is
included potential cloth production (both v/oven and knitted) is 7 1-S
million metres (or 789 million metres if the Sandimg Textile Institute
coefficients are used). This aiiiounts to 7.0 (or 7.3) metres per head of
population per annum. If the handweaving capacity is excluded the figure
of 748 million metres is reduced by ^31 million metres to 31? million
metres, 3.O metres per head of population. The KOTCE investigation
results indicate that the capacity of the power loom industry should be
reduced by betv;een 5 per cent and 11 per cent (depending on which of the
tv/o sets of technical coefficients are used).
There was a very big increase in weaving capacity since the tran-
sfer of sovereignty. In I95O the capacity of the power weaving industry
was 65 million metres, or 0.82 metres per head of population, ^he
knitting industry, which had ex^.anded rapidly from its beginning in the
early fifties, was still able to produce only less than one metre per
capita a year by 19^2.
1. Calculated from Table 8.

323
Finishing:
Even at full capacity the finishing section still constitutes a
by pov/er equipment, oiid tv/o shifts by .-.ZEi-is, bottleneck. If three shifts were undertakery^only about 30 per cent of
cloth produced by ATBHs, ATMs and knitting machines could be properly
finished; or if only 30 per cent of modern v/eaving and knitting capacity
were utilised all cloth production could be finished by modern methods.
•' ut the finishing industry can handle 65 per cent of power v;eaving and
knitting equipment. It is because xireaving capacity utilisation has been
so lov; in recent years that finishing has not appeared to be a bottleneck.
iiJi^^the equipment of this section of the industry v/as installed after
-1930.
The public sector:
•-"'he share of the public sector in the spinning industry is much
greater than in the weaving industry. Cf the 223,000 spindles at the
end of 196^, 92,7^0 spindles were ovmed by the government. But only
1,^10 ATH^s and 1,2^2 ATM^s (pr per cent and 10 per cent of total
machines^respectively) and 11 power knitting machines were in state
enterprises.^ Three finishing factories of u n k n o t capacities are also
in the public sector."^
I0 Infromation obtained from P.II.P.R. Djantra-Yasa and F.i-i.P.E.
Busana-Yasa, Djakarta, I'iay 19^3•
2. Calculated from data in Pembangunan Industri Hak.jat, pp. 17-19.
3 . These three factories are in Tjeper (Central Java), in Bali and in Kadjalaja (West Java). From F.N.P.E. Busana^Yasa, op.cit. Their Their production capacities are included in Table 33•

32 The cottage industry:
• 'rom the data iii the KOTOE Clothing Team's report on the use of
handlooms and the very low supplies of raw materials it is easy to
assume the cottage establishraents are nov; inactive, iievertheless, in
1961 a large number of them were still registered with the Department
of People's Industry. Table 35 illustrates their composition according
to the various stages of the manufacturing process.
TAiiLE 33«
THE COTTAGE TEXTILE II^DUSTEI: I96I Kumber of households.
Primitive gedogan weaving 18,489 ATBM weaving 5, Spinning 905 Sarong v/eaving k^O Batikl^ing 27,595
Soirrce;- M.R. Adisendjaja. Madjalah Industri I^jat. No.6. Tear 11, June 1963. p.3".
•t is difficult to comment on this table because most of these
small manufacturers have, in all probability, not produced for many
years. However, a large nujiiber of cottage batilc producers was most
likely still in operation in 1962 because in that year 11,570 tons of
cambrics were imported.'^ \
Employment:
The textile industry is now the biggest single source of employ-
ment amongst manufacturing industries. In I96I textile manufacturing
employment was 92,806 or 19.4 per cent of total manufacturing employment.
1. S tatistilc Kon.jiinktur, January - April p.56 2. Statistical Focketbook of Indonesia 1963' PP.112-3

325 This was an increase of 20 per cent over the previous year's level of
emplojTnent in textiles.'' ''he most recent data on the composition of
eKiplojnnent in spinning v/as 6,08l (or 8 per cent of total textile employ-
ment), in large scale weaving was 38,262 (50 per cent), in medium scale
weaving was 13,^51 (17 per cent) and in knitting was 12,317 (16 per cent).'
If we ass-arne that every increment of 13,200 spindles (however
placed) can pr-dvide employment for 333 persons at full capacity,^ the
spinning industry at present could employ A-,650 persons. If one v/orker
can supervise tv;o looms or two power knitting machines^ the power
weaving and knitting industries could employ 2.k,kk6 persons per shift
plus majiagement personnel, vxtiile the handloom (AIBM) equipment could
provide employment for another 223,903 v/orkers. Therefore, actual
employment recorded for large and medium-sized textile enterprises in
1961 was only about one third of potential employment. The modern
finishing plants would add very little to total employment.
Production and imports.
If the level of production and capacity utilisation in the industry
is examined as a prelude to a. discussion on competitive ability in 196^
it is v/orthv/hile reviev/ing the record of these data throughout the
1930s and early I96OS because the large fluctuations in annual data
make it difficult to regard any one year as typical. The last years of
the period reviev/ed were certainly not free from unusual circumstances
and a conclusion on competitive ability of the domestic industry based
1. Ibid, pp.94-5. 2. Perusahaan-2 Industri I960. pp.9^-112 3. Industrial -echnical Centre Foundation, P.T. Djunti. p.22, Also 4. i?fora®i oerviews with manufacturers it seemed each worker v;as perm-
itted to watch only tv/o machines at a time.

326 on production and import data of those years raiglit prove quite mislead-
ing. Chapter VII exHriined the efficacy of protection measures, but this
chapter attempts to draiv conclusions about changes in the competitive
ability of the industry after fourteen years.
In Chapter VII it v;as seen that the spinning industry operated
at a high rate of capacity utilisation almost all the time and did not
suffer the problems of a depression which plagued the yarn consuming
enterprises. The surcharges on yarn which v;ere sho vn in Table ^Q appeared
to provide sufficient tariff protection for this industry. Therefore,
this section will be devoted to the v;eaving and knitting industries.
Table 36 presents data on rates of utilisation of v/eaving capacity, the
level of production in the v/eaving and knitting industries, and the
quantity of cloth imports. This information provides a basis for a
discussion on the resiilts of overseas competition, but the limitations
of this infcrrnation must be mentioned beforehand.
?irst, the rates of utilisation are calculated on the assumption
that there are no changes in the level of stocks of yarn in the country.
Hence if competitive strength increases in one year this affects the
level of imports of yarn; there is no reduction in stocks. It is believed
that after the end of 1956 the level of stocks was only a small fraction have been
of imports so that this liniitation might not serious. Second, only
large sized knitting and weaving mills are included in the . production
data and it is a central theme of this thesis that the production perf-
ormance of the large enterprises v/as better than the small ones. There-
fore, the recorded data cannot be regarded as representative of the
v/hole weaving industry. On the basis of interviews and impressions it is

327 Til-il-u 3 6 ,
CAPACITY UTILISATION KATSS AND P50DUCTI0K AND Il'ICRTS OF CLOTH:
1931 - 62 .
U t i l i s . Prod.of Production of selected Selected cloth imports
rates
of
weav'g
capa-
city
v;oven knitted goods of large
cloth of mills,indexed on base
indexed on base
1952 = 100
large
mills
indexed
on base
1952=
100
1952 = 100
sing- under-
lets vests shirts dyed,pr 'd , textile
woven,cotton materials
piece (clothing)
goods
1951 16 79 - - - 167 62 1952 22 100 100 100 100 100 100 1953 3^ 138 177 105 139 i3o 53
195^ 37 1^7 372 125 1 -0 1^7 38
1955 40 155 ^21 331 113 108 24
1956 161 602 535 108 152 62 1937 22 165 ^80 8^6 261 123 -
1958 30 160 401 852 280 57 -
1959 N .A . 118 296 498 165 33 -
i960 57 169 795 2.7 78 -
1961 N .A . 177 ^75 1522 377 1^5
1962 22 168 k72 13^6 39-1- 73 -
1963 N .A . 153 396 1319 168 K.A . IN . A
Sources:-
. I
( i )
( i i )
(c )
(d )
(iii)
ti l isation rates from -able 29.
^'roduction of woven cloth and selected knitted goods
;alculated from data in (a) Statistik Konjunktur I96I ,pp .19-20;
j ) Statistllc Konnunktur 1935, p . l S ;
Statistllc rLon.junlctur, January-April ^963, p . 1 7 ;
Summary T^eport, ~^Iateiials l^sed and Production of Weaving
and Knitting M i l l s ' , fii-st quarter 196^ . _ (Al l publicat-
ions from Central Bureau of statistics, Djakarta)
Conversion factors for total weaving production:
1 sarong = 3 metres; 1 shawl = 1 - 5 metres; 1 towel = 1
metre. (Kadarijah, Ekonoai dan Keuangan Indonesia. Vol .Xil ,
N o . 2 / 3 . Narch 1959, p . 89 )
selected cloth imports calculated from data, in Statxstik ^
Non.iunlctur I 96 I , p.5S-9; j M , p.50-1; uanuary-April 1^b3,
p . 5 6 -7. Business News 5 . 7 . 6 6 .

328
assiipied here that there was actually a decline in small scale activities
to 190^, when i ' -tfs virtually halted.
Indexes are used for production and import data to facilitate
closer comparison of proportional chaji;;;es. The year 19^2 was chosen
as the base year because it v;as not subject to the aftermath of the
1950 economic reform measures.
The utilisation rates v ere extremely variable and it is difficult
to extract a long terra trend in the ability of the industry to retain a
high level of activity. These figures are, moreover, an inadequate
basis for judgement on competitive ability because both production and
imports v;ere reduced together sometimes through foreign exchange
restrictions.
The sharp decline in utilisation rates in 1957-58 and I962 v;ere
not reflected in the production indexes for woven cloth because these
indexes represented the output of large mills only. Likewise the big
increase in the utilisation rate in I96O was accompanied by a small
increase in large scale production betv;een 1958 and I96O because many
snail firms returned to production in I96O. This indicates that the
performance of large sccile enterprise \ as more stable in the face of
variations in imports of yarn.
ihe last two columns of Table '36 show the long run decline in cloth
imports. Cotton piece goods ate the main competitive comnodity to the
domestic industry because they resemble most closely its output, i.ore-
over, in I95I these cotton piece goods imports amounted to 38,6^7 tons
compared with only 2,339 tons of imports of clothes. The latter declined
I. o tatistik KonjunLctur 195^. pp.50-1

329
to a negligi#ble q-aantity at the end of the period mainly due to the
much higher surcharges placed on thern.
tt is very difficult to trace a relationaiiip betv/een cloth imports
and utilisation rates or large scale production, " he first two series
are very erratic; sometimes changing in the same direction and at other
times in opposite directions, -his can lead only to the conclusion that
protection for the industry as a iirhole v;as variable and Chapter VII
explained why this was so. But the steady increase in the output of large
enterprises v/hile competitive imports fluctuated suggests the interesting
conclusion that the large manufacturers v/ere able to ignore competitive
imports to a great extent. In the only year, 1959, when large scale
production experienced a marked decline, imports of competitive cloth
declined to a record trough.
We cannot conclude from these figures that the large scale textile
industry operated at near fLill capacity; and the failure to expand at a
constant rate'' suggests that it was not always easy to maintain these
high levels of production. But it is easily seen that the analysis of
overseas competition must rest very largely on the performance of the
small and medium sized sections of the v/eaving industry.
Before we move on to a more detailed analysis of the strength of
the industry it is worthwhile noting some of th^ substantial changes
which have talien place in the composition of domestic output since
1952? because trends amongst components of output determine the overall
competitive strengths which is represented by official statistics.
1. See Chapter III, 'Government Plans and the i:.xpansion of the industry' 2. Information in the publications in the footnote to Tablec2 is dravm
upon hereo

330
C o t t o n p i e c e g o o d s shov/ed a s t r o n g i n c r e a s e v;hile s a r o n g p r o d u c t -
ion d e c l i n e d ( a l t h o u g h it i n c r e a s e d i n the l a s t fev/ y e a r s ) , a n d shav/ls
w e r e v i r t u a l l y e l i m i n a t e d a s a p r o d u c t . The n u m b e r of d o m e s t i c a l l y
p r o d u c e d tov/els f l u c t u a t e d g r e a t l y b u t shov;ed a n o v e r a l l i n c r e a s e v/hile
k n i t t e d u n d e r w e a r p r o d u c t i o n i n c r e a s e d m o r e than a n y o t h e r t e x t i l e
p r o d u c t . T h i s r a d i c a l l y a l t e r e d p a t t e r n of t e x t i l e p r o d u c t i o n was c a u s e d
b y n e w f a s h i o n s in c l o t h i n g . T h e d e c l i n e in the o u t p u t o f s a r o n g s a n d
s h a w l s i n d i c a t e s a l e s s e n i n g o f the i n f l u e n c e of t r a d i t i o n a l w e a r a n d
the v e r y g r e a t e x p a n s i o n of k n i t t e d o u t p u t r e f l e c t s the v/idespread
a c c e p t a n c e of u n d e r v e s t s , s i n g l e t s a n d s h o r t s a s a m o d e of d r e s s for
m e n . iTrie k n i t t i n g s e c t i o n h a s b e n e f i t e d m u c h m o r e than the w e a v i n g
of d e m a n d
s e c t i o n from t h i s change in p a t t e r ^ a n d a s a r e s u l t h a s b e c o m e an import-
ant p a r t of the i n d u s t r y . O n e of t h e r e a s o n s v;hy the o u t p u t of s a r o n g s
of the m a i n w e a v i n g m i l l s d e c l i n e d is that o t h e r t y p e s of p r o d u c t s
are m o r e p r o f i t a b l e in the m e c h a n i s e d l a r g e r scale f a c t o r y , a n d the
s m a l l e r e s t a b l i s h m e n t s v;ere l e f t to s p e c i a l i s e in s a r o n g p r o d u c t i o n . It
m i g h t b e c o n c l u d e d t h a t m u c h o f t h e s t r e ^ t h of the m o d e r n i s e d l a r g e
scale t e x t i l e i n d u s t r y r e s t s o n its a b i l i t y to shift t o w a r d s m o r e
p r o f i t a b l e l i n e s o f p r o d u c t i o n and i n t r o d u c e a d e g r e e of f l e x i b i l i t y in
p r o d u c t i o n p r o c e s s e s w h i c h permits t h i s . This w o u l d d e p e n d o n the k i n d of
new machin':;ry i n s t a l l e d and t h e v/illingness and i n i t i a t i v e of m a n a g e m e n t
to a l t e r l i n e s o f p r o d u c t i o n o n e x i s t i n g m a c h i n e s . The d i f f e r e n t t r e n d s
in c o m p o n e n t s of c l o t h o u t p u t v/ould s u g g e s t that the f a c t o r y h a s m a d e
t h e s e a d j u s t m e n t s v/ith s o m e s u c c e s s .

331
- t i s d i f f i c u l t to predict v/hether these trends w i l l continue
in the future . Sarong production w i l l very liliely continue to decline
v;hile text i le piece goods should continue to increase with population
and national income, llnitted goods output v.dll increase steadily as a
greater proportion of the people assume this modern form of dress . I f
these trends continue the modernised establisliinents can be expected to
benefit at the expense of those using older methods of production.
The v/eaving industry ' s competitive a b i l i t y .
Because of the lack of data on the distribution of capacity
according to s i ze i t v/ill be assumed here that the weaving industry i s
made up of tvra mutually e x c l ^ ^ v e sections and that the recorded product-
ion s t a t i s t i c s refer to the large scale section . The further assumption
is made that the actual production of large sca2e enterprises i s equal
to their capacity production. This assumption v;ill introduce some error
but apart from 1959 and recent years i t i s thought that the error w i l l
not be very great . The imputed production activity of the remainder of
the weaving industry v/ill be compared with tlie level of t a r i f f protection
and quantities of cotton piece goods. The methodology behind these
imputations i s given in the footnotes to '"able 57 . -he table i t s e l f
presents annual data for this comparison.
Tiiese assumptions mean that it i s the small and medium sized
firms which suffer the encroachments of imports while the large scale
can compete successfully with overseas manufacturers behind the prevail-
ing surhliarge protection; which was shovm in Table .0 to be between
25 per cent and 3 3 . 5 per cent in th is period , ' . ithin this group some

TABLE 37 .
PEODUCTIOM OF LARGE Al® SIiATiTi SCALE V/EAVING EIjTERPRISSS,
IMPORTS OF GGTTGK PIECE ^ GCODS, Alii) S URGKARGES: 1 9 5 1 --63.
Assumed Assumed Assumed Imports l a r g e s c a l e small s c a l e small s c a l e of cotton
capac i ty capaci ty ac tua l p iece Surcharges production production production goods ( m i l l . m e t r e s ) (mi l l .metres) (mi l l .metres) (mi l l .metres)
1951 38 .9 189.9 26 .2 2 1 1 . 8 0 1952 hh.7 197 .9 29.0 127 .6 100 ( i ) 1953 5 0 . 5 205.9 ^5.9 228.3 3 3 . 3 ( i i ) 1954 5 7 . 3 2 1 3 . 9 49.9 186 .5 1955 6 5 . 1 2 2 1 . 9 68.9 1 3 8 . 1 50 ( i i i ) 1956 67 .8 229.9 83 .6 194 .2 50 ( i v ) 1957 73 .9 257.9 3 0 . 3 157 .9 20 (v) 1958 60.^ 72 .6 20 1959 7 5 . 1 300.5 9 1-. 3 kzA 20 i960 7 5 . 7 3 2 7 . 3 256.^ 100.7 20 1961 7 6 . 5 ^ 0 1 . 2 260. 1 1 8 3 . 7 20 1962 7 7 . 0 1 " n 9k.6 20 ( v i ) 1963 ri. A. K.A. I 'i • A . N. A. 130 ( v i i )
Sources : -(a) Assumed l a r g e s c a l e capac i ty production. This i s equal to the a c t u a l UUI UU U J. (.•ij.c; VV cx V C iVA. v -L. vx --- — ^ — that all . l a r g e e n t e r p r i s e s v/orked at f u l l capaci ty over the vjhole per iod. 1^'ata of yarn consuinption v/ere talcen from reports of j ank Indonesia; p. 1^8; 1933 -36 , p . 1 5 3 ; 1956-37 , p . 1 7 3 ; Kadari.iah,:^konomi dan Iveuangaji Indonesia. February 195o, p . l 6 ; and o t a t i s t i c a l Pocketbook of Indonesia 1963, p. 1 20 . These data were then conver'ted into metres by the conversion f a c t o r 1 kg.= 3 . 3 metres. The f igures^for 1931 and 1952 were very low and i t i s unl i l :e ly that the capac i ty of l a r g e s c a l e v;eavers increased as much as recorded between 1952 and 1953 . ""or t h i s reason the average r a t e of increase of assumed l a r g e s c a l e capac i ty f o r 1953 to 1956 has been used to ex t rapo la te backv/ards to 1951 and 1952. ^-ence instead of 25 .0 and 36.k m i l l i o n metres, the data 33 ,9 and mi l l ion metres are used for 1951 and 1932, r e s p e c t i v e l y , '^le f i g u r e s f o r 1958 to I96O were lower than the l e v e l of 73-9 in 1957- - k i s was due ^o the low suppl ies of raw m a t e r i a l s . I f some compensating cor rec t ion were not made, the assumed c a p a c i t y ; f o r small s c a l e v/ould be o : :cess ive ly l a r g e f o r these y e a r s . i:ence data f o r t h i s short per iod in terpo la ted assujning a constant absolute annual increase betv/een 1957 and I96I . Instead of 7 2 . 6 , 50 .5

333
and 70.0 million metres, the calculated values 75. "i, and 75*7 niii.lion metres are used.
(b) Assuraed small scale capacity production. This is the difierence betv;een total v;eaving capacity (excluding gGdo-ar^) and large scale actual production (recorded) - slso capacity production. Total capacity data come from ' able - t is further assmed that this capacity includes the knitt-ing industry; but this is not true. Mov/ever, to some extent the act'jal production of the main knitting mills \;ill tend to offset the difference betv;een true and large scale v/eaving capacity ajad recorded l3.rge scale weaving production, i ata for 1951, 1952, aJid 195^-60 are based on the subtraction of estimated (see above) values for assumed large scale capacity fro-u total capacity. But figures for tne years 1952 to 195^ were interpolated by assuming a linear amiual increase betv;een 1951 and 1957. '-f this had not been done there v;culd have been a decline in capacity.
(c) Assumed small scale actual production. Since there are no data on this the assum.e:. pr:.duction v/as the difference between tf.e cloth equiv-alent of total supplies of yarn (domestic> production plus_ imports) and recorded large scale v/eaving and knitting production, -^asic data are talcen from Table converting raw cotton to yarn by subtracting 10 per cent v;aste, and total yarn supplies into metres of cloth.
(d) ImTJorts of cotton loiece goods, ^ata talcen from -able 31 3Jid conv-erted into metres. (e) Surcharges. These data v;ere taiieii from J-ablc ,0.
(i) This was introduced in august 1952 and it is not clear whether some cotton piece goods entered free of surcharges.
(ii) Introduced in < ajiuary 1955. (iii) introduced in September 195S". • ..••• (iv) In oeptember 195^ yarn imports had a 25 per cent duty
imposed on them. (v) Introdu.ced in June 1957. 0/i) T'ejctiles retained 20 per cent surcharges but had to be
imported on SIVfi Inducement certificates which added to the cost,
(vii) 3ee Chapter VII.

entrepreneurs might have made abnormal profits but for the whole group it
is not possible to describe its competitive ability beyond this comment.
A comparison of columns tv/o and three of Table 37 describes rates of
capacity utilisation in the small scale weaving industry. From 1951 to
1958 the level of activity was very low and the temporary increase in
1955 was due to the yarn allocations which v/ere offered to v/eai:er enter-
prises at that tiir.e. Tlae stringent import policy of 1957 was e:qoected to
affect all irnioorts but the accompanying inadequate tariff protection
proved disastrous to the small scale v/eavers according to these figures.
The rise in utilisation rates after 1957 must be attributed to the alloca-
tion system carried out by the Department of People's Industry, v/hich
offered a temporary respite to small scale weavers. The fall in I962 v/as
only the beginning of a long decline \fhich ended in the virtual collapse
of this section of the textile industry in 196^-65.
It is difficult to assess competitive ability at any time over the
v/hole period because of the constant rise in domestic costs and the
influence of other forms of protection, but the years 1952-53 and 1957
are probably the most suitable years for this assessment because tariff
protection was accompaJiied by the least combined influence of other
instrtiments of protection.
According to this table, v/ith tariff protection of 33.3 per cent only
about 25 per cent of v/eaving capacity outside the large scale section
could function ajid a substantisJi part of this must have comprised medium
sized establishments. Vnen, in 1957 the surcharge on cloth was 20 per
cent only about 9 per cent of small and medium scale capacity could be
utilized. In both periods there was no tariff on yarn.

335 After the yarn allocation system v/as introduced in 1938-39 it v/as
impossible to draw relia.ble conclusions about competitive ability.
Chapter IV described the wealiening of the financial structure of the
small scale industry and the polarisation of profitability v/ithin the
v;hole industry due to inflation. The support, through very cheap credit,
of indigenous entrepreneurs v/ho mostly failed to compete v/ith the v/ell-
established producer, increased the proportion of weaiic enterprises in
the industry. Hence the only comment v/hich can be made with some con-
fidence is that the overall competitive ability towards the end of the
period v;as most likely less than in the early fifties, but this does not
mean that a smaller absolute amount of capacity was able to compete
successfullyo
It has not been possible to devise a single estimate of the
"effective tariff level" v/hich has very much meaning. The value for the
effective level of tariff devised by Dr. W.M. Corden^ is given as , , . (t - a.t.) (v* - v) 1 X
g = - (1 _ a.)
v/here v = value addecfu^r free trade; v' = value addedJMer trade A protection; t = nominal tariff on the imported product; t^ = nominal
tariff on the imported input; and a^ = share of the imported input's
foreign trade value in the imported product's free trade value, ^ ^ co^MrojJt: ,
•Ti-lis means that the "effective tariff level" is determined completely
1. J.P. Meek regards the Benteng policy as having fallen far short of its target. After a study of the mechanism of the programme ajid the type of entrepreneur it assisted he came to the conclusion that the policy caused price increases because of inefficiency and corruption, and the new entrepreneurial group failed to emerge. (J.P. neek. ;ae Government and Economic Development in Indonesia, 1930-3^i pp.174-73.)
2. VJ.;.. Gorden. "The i^tructure of a Tariff System and the Effective Protective Rate", Journal of Political Economy, June I966.

erratum/ 535a
by the share of tots2 product value taken by raw materials, reflected in
international prices, and by the nominal tariffs; and is, therefore, a concept
which is inapplicable to policy determination in a country experiencing sub-
stantial inflation. According to the above equation the effective texiff level
remains constant so long ajs the nominal tariffs ajid the slliare of the input's
free trade value in the output's free trade value are unchanged. If g was cal-
culated to be 50 pei cent in a year when the domestic industry was competing
successfully, a 30 per cent effective tariff with a 200 per cent domestic cost
increase two years later might produce widespread underutilisation in the in-
dustry. A more suitable estimate for the real incidence of protection enjoyed
by industries in countries suffering chronic inflation must include some
function of inflation. Appropriate periodic devaluations could imply, in the
long run, unchanged utilisation rates for the same effective tariff level.But
even such a refinement will not accommodate an industry v/hich includes a chang-
ing composition of dual technology and managerial skills. For a proper est-
imate of real (full or partial) protection needs in an inflationary situat-
ion, not only the average level of profitability, but its range ajid standard
deviation amongst firms at each point in time ought to be included.
Apart from descriptive functions the "effective tariff level" appears to
be of limited use in a dynamic analysis of the growth of this industry v/itli-
out substajitial refinements which would be extremely difficxilt to quaoitify.
Some perspective of the competitive ability of domestically produced
textiles can be gained by ref/erring to information from other ujiderdeveloped
countries. In 1932 the Indian industry, whose weaving technology was, on
average, at a comparable level with that of Indonesia in the mid fifties, 1
v/as protected by a 73 per cent duty on Japanese imports. This taz-ixf
o.D.I-Iehta. op. cit. p. l82.

335a ^ ^ ^ pjitu-dt (mJUU ish^ ^
by^international prices^ nominal tariffs-and is, therefore, a con-
cept v/ixich is inapplicable to policj'- determination in a country exper-
iencing substantial inflation. According to the above equation the
effective tariff level remains constant so long as the nominal tariffs
and the share of the input's fo?o^a trade vaJLue in the output's
trade value are unchanged. If g wa.s calculated to be 30 per cent in a
base year when the domestic industry v/as competing successfully, a 30 pei"
cent effective tariff tv/o yoars, •anci a 200 per cent domestic cost increase^TT
Uater might ijroduce widespread imderutilization in the industry. A more
suitable estimate^s^ underdeveloped countj^es suffering chronic inflation
must include some function of inflation,^But even such a refinement v/ill''^"^^
not accommodate an industry which inclM^^dual technology and variable
managerial skills. finao arc enjoying large prof -fefr-i-fhi-to ^ -/yx^aJi j some arc cont-efiml ^ ting closiu-e-. For a proper estimate o:^protection needs
in an inflationary situation, not only the average level of profitability, of -e«jJv. -pcA^ ^ ixxl^-f.^
but fee- range and stajidard deviation/ought to be included.
Apart from/problcmd. involved in assessing fnr the Tndones-i ai-c^pjuiui -Mr-A-
\;caving ii^dtrg^^ the "effective tariff level" i-o of littlo^use in a
dynamic analysis of the grovrth of this industry without substantial
refinements which v/ould be extremely difficult to quantify.
Some perspective of the competitive ability of domestically produced
textiles can be gained by referring to information from other underdevel-
oped countries. In 1932 the Indian industry, v/hose weaving technology v/as
on average, at a comparable level with that of Indonesia in the mid fif-1 ties, v/as protected by a 75 per cent duty on Japanese imports. This tariff
i . S.D. Hehta. op.cit. p.l82.

336
v;as later reduced to 30 per cent and the industry was also supported by
quantitative restrictions, ^ut in the fifties the Japanese v/eaving
industry was more technically advanced and one might reasonably assume
a higher tariff barrier would be required for the Indonesian industry
than was found necessary for the Indian textile industry in the early
1930s.
After 1957 the textile industry of the Philippines enjoyed a 36
per cent tariff benefit on yarn and a 10 per cent to 23 per cent tariff
on v/oven fabrics, but in a letter to the Chairman of the House Tariff
Committee the President of the "extile Mills Association of the
Philippines clained that much higher tariffs were necessary. He
estimated that the ratio of domestic costs to prices of imported
materials was 2.^1 : 1 for yarn, 2.72 : 1 for grey cloth, and 2.9 : 1 1 _
for finished cloth, if these figures are approximately correct it is
apparent that the provisions of the 1937 'tariff Act were quite inadequate
and the textile industry was only supported by the use of quantitative
restrictions. Another factor v/hich mal-ces comparison of production costs
difficult to quantify is differences in quality. Both Indonesia and the p Philippines produce an inferior quality cloth due to poor finishing
processes. In Indonesia v/here, unlike^the Philippines, modern finishing
1. L.D. Stifel. op. cit. p.39 2. In spite of a big expansion of modern finishing capacity and the
finishing of grey cloth imports in the Philippines, the quality of the product remains inferior to Imports. (L.D. Stifel. op.cit. p.137) '

337 capacity constitutes a bottleneck, if v/eaving production rises above 30
per cent of \-/eaving capacity, the inferiority of product is probably
greater than in the Philippines and competition from imported textiles
is likely to be imderestimated if production costs alone are considered.
Differences in levels of efficiency in modern spinning processes
are not so important although the quality of yarn used and the degree of
labour supervision can lead to differences in costs. Once a size of
10,000 spindles has been achieved increases are not important to the
level of efficiency. The lov/er wages in Indonesia would assist in
reducing higher costs due to work interruptions.
The main limitations of this analysis must be mentioned. First,
the small scale section of the industry is not homogeneous in its cost
structuj?e. Some of the fii-ms caji be classified as medium sized ajid there
is a wide range of efficiency levels over the entire group. Second, the
only data on production is drav/n from the returns of about 80 per cent
of all large enterprises v/liich might include ei-rors. The remaining 20
per cent plus the actual underutilisation of capacity in the large scale
enterprises (v/hich v;as here assumed to be zero) might accovint for much
of the assumed capacity of smeJ-l scale weavers. Tliird, the increases in
total v/eaving capacity during the later years of yarn allocations were
inflated by false retxirns of licenced capacity. This would make the
assui-aed capacity of small scale firms ujijustifiably large. Fifth, the
1. Tne average size of spinning mill in India is 32,000, in Japan is 33,000 and in the Philippines is 25,000. (Sectoral Study. Textpe Industries, pp.82-3). The Indonesian average v/as 26,000 in 1964. (Table 21)

33S
fluctuations in large sca.le production obviously limit the use of these
statistics as measures of large scale capacity. Finally, the existence
of inflation^ encroaching on the competitive ability of domestic industry
betvjeen changes in the fixed exchange rates^ malies an examination of the
tariff system of limited value at all times.
Conclusion
The most efficient section of the textile industry is concentrated
in Bandung v/here the Chinese have their strongest influence.
The spinning industry using modern processes was capable of
producing 19,32^ tons of yarn in 1964 compared v/ith weaving require-
ments of about 50,000 tons, and appeared to be able to compete against
yarn imports v;ith a small tejriff. Tlie weaving section had capacity in
1962 enough for producing betv/een 6^7 and 688 million metres and the
knitting section another 101 million metres. One of the weaknesses of
the textile industry v/as that modern finishing capacity v/as sufficient
to handle only about 30 per cent of total weaving and loiitting capacity.
Even after allowing for their limitations capacity and production
estimates indicated very lov; levels of capacity utilisation amongst
small firms. Bearing in mind their very weal^ financial basis and the
trends towards new and more efficient processes of production in the
large firms and in overseas te:rtile industries it is highly question-
able whether this section of the Indonesian weaving industry will ever
be able to compete v/ithout very high tariffs which would provide the
larger manufacturers with abnormal profits. Although a high tariff
barrier might be costly in the short

339
rim, it offers the advantage that those firms making abnormal profits
will expand and force the permanent closjire of inefficient enterprises,
tvider considerations of economic benefits gained from the development of •
the textile industry are studied in the final chapter.
A comparison of productivities of the textile industries of
Indonesia and the Philippines led to the tentative conclusion that
•Indonesia's weaving industry could produce at equal or slightly lov;er
costs than the Phillipines's industry because of lower labour costs. This
v/as not an easy comparison to mai e because of the heavy reliance on
quantitative restrictions in the Philippines. Due to changing levels of
protective measures as v;ell as the combined use of several measures at
the same time it was not possible to draw any conclusion about an
overall tariff measure (in the absence of quantitative restrictions)
required by the Indonesian industry.

3^'RO
GHAPTES IX
CONCLUSION.
Several different aspects of the textile industry have been
exaxnined in this thesis so far, but the conclusions reached in one
chapter hcve not yet been related to cor elusions in the others. This
chapter drav/s together the analyses already made by discussing the
issues raised by policy and development since 1950, and by exploring
the likelihood as v/ell as the desirability of further structural
and capacity changes.
The chapter begins v/ith a critical study of the response of the
industry; to government intervention since Independence 3Jid the
chances that under similar measures in the future the industry will
continue to develop in the same pattern. This will be followed by BXL I
evaluation of the benefits and costs of the industry s development
so faJT, in terms of foreign exchange saving and expenditure,
employment, and the effect on other industries.
In assessing the costs ajid benefits of the growth of the
industiT" it is not intended to compare the potential of the
textile industry with that of any other industry. Nor will the merits
of imT)ort-replacement against export promotion be investigated. 5oth
these cor^siderations are beyond the scope of this thesis.

3^1
Without further data any such comparison must be highly
speculative. Hov;ever, '/here obvious benefits of establishing a
textile industry occur they v/ill be noted in relation to some of
the problems of development, such as inflation ajid shortage of
foreign exchange.
Because of the econoEiic impasse Indonesia has found herself
in in the mid 1960s it might not be possible for her to continue
her investment plans. If this is the case, then some comments can
be made with regard to the several sections of the industry and
the question of protection and profitso
Finally, possibilities of improving the industry's effic-
iency and increasing its communal benefits will be investigated.
The strengths and weaknesses of the industry can be discussed by
a consideration of reforms.
The grov/th of the industry and the influence of government policy
The grov/th of the industry:
In the fourteen years betv/een I95I and I965 capacity
for processing rav/ cotton into yarn increased by almost 200
per cent. The spinning industry v/as capable of producing
5,506 tons in 1952 and 19,32^ tons in

by v/orking'three shifts a day. I'he co.nbined handv/eaving
and pov/er weaving section of the industry increased its capacity output
(two shifts) from 27^.6 million metres to 663.7 million metres, Power
knitting factories had emerged by 1964 as an importaait source of supply
to the consujner market with a capacity of 101 million metres, having be-
gun v/ith almost no equipment in 1951' ^'he spinning industry is totally
inadequate as a supplier of yarn to the weaving industry; it can pro-
vide a little more than 10 per cent of the weaving industry's capacity
requirements. However, until the cotton grox^ing experiements are success-
ful and cultivation can be organised on a comaerciaJL basis it cannot
be regarded as a bottleneck. Finally, finishing capacity using modern
processes which were introduced after 1950 was sufficient for 216.6
million metres of cloth production by the end of this period.
This means that the industry can now produce up to 7*3 metres per
capita, of v/hich a little over t;i;o metres can be properly finished. The
targets of the Eight Year Plan assumed capacity production of 10 metres
per capita by I96I and 12 metres by I967, but these were very ambitious
and it is thought that the record of e:q)ansion reflects a creditable
performance as far as physical capacity is concerned. The references in
Chapter III to failures of the government plans refer to the specific
goals of the plans: the expansion of the indigenous private and ^ the
public sectors. There v;ere also signs that part of the existing private
sector had failed to survive both domestic and overseas competition^ and
the capacity figures discussed here should, perhaps, be qualified by an
unknown arnihunt of redundancy and obsolescence in this part of the
textile industry.

We nov; deal v/ith the causes and type of expansion ajid their
relation to government policy.
The effects of government intervention:
"^he outstanding characteristic of government intervention in the
industry v/as its support for the wealier sections, but the noticeable
outcome of the period since 1950 v/as the further polarisation of manag-
erial and financial strengths amongst individual firms. This contrad-
iction v/as due to an over-ambitious policy of support for the indigenous
group and the inability of the government to isolate the textile industry
from trends and disturbances in the rest of the economy. This can be
illustrated by referring to the main fields of concern for the entre-
preneur in v/hich the government was active: fixed capital investment,
working capital, the supply of raw materials, and protection from over-
seas competition.
I-mch of the cheap credit v/hich v/as made available to the formerly
inexperienced entrants v/as never repaid and in those cases where the
debt v/as honoured it v/as by a grossly devalued amount: the subsidized
credit was regarded by some as a rev/ard for services to the :
revolution v/hile a high rate of inflation assisted those v/ho honoured
their debts. Indonesiaias v/ho purchased new equipment vinder this scheme
but who encountered financial and economic diffic^olties later on teamed
to the Chinese for assistance and as a result often became subsidiaries
of Chinese concerns. Through this transfer of effective control over the
new capacity the level of activity amongst new indigenous firms was
largely determined by the v/illingness of Chinese producers to allov/

competition from other producers: when raw materials supplies fell the
more efficient producers usually served their own production interests
first, because of lower per unit costs. In some cases, in fact, Chinese
producers came to own the equipment. Hence frequently, the result of
the cheap credit Benteng programme was to supply the well-established
Chinese with low priced equipment.
The tendency of Indonesian entrants to purchase handlooms instead
of power looms lowered their profitability relative to mechanised plants
in a situation v/here long term loan repayment charges fell. If the new
producers had taicen advantage of the heavily subsidised credit to install
the most expensive and mechanised equipment they might have stood a
better chance of becoming independent of their financiers.
In the second field of concern to producers in which the govern-
ment chose to lend its support the cause of failure was the same as in
the Benteng programme: the government did not appear to be clear about
its objectives. The state Ijariks were briefed to concern themselves
mostly with fixed capital because it wa^ hoped that the cooperatives
end the Induics would assist with working capital. But the government
failed to recognise that the financial problems of the firms were
the same as the financial problems of the cooperatives of which they
were members, and that the credit-worthiness of one was the equivalent
of the credit-worthiness of the other. The -nduks were too concerned
with the working capital requirements of their own production activities
to offer credit facilities to other manufacturers.

The failure of the govenirnent to follow on its fixed investment
prosraniiiie by offering cheap credit for the working capital requirements
of new equipment led to the effective mortge-ging of this deficit-
financed investment to well-established non-Benteng entrepreneurs. The
only means by which the new entrepreneurial group could stave off this
decline into financial subordination was by proving its credit-worthiness
with the state banls; and this could only be done by acquiring a certain
level of managerieJL ability. The ®enteng programme as formulated by the
government was not merely an inadequate programme for enlarging the role
of the indigenous sector; as it stood it could be interpreted as a means
of strengthening the non-Benteng group. iU.though the credit facilities
for the Benteng group discriminated against the Chinese they only
represented half-measures on which the whole Benteng policy foundered. It
would seem that e^ long as the government postponed a determined effort
to train indigenoiis managers the solution to the dominance of non-
indigenous producers and financiers must alv/ays elude it. It may prove
to be the case that there is no short-cut to the government's goal of
Indonesian ov/nership and management of the economy and that a newly
conditioned class of Indonesians must emerge before aJiy measure of
support can be su.ccessfully utilised.
Special concessions to the small scale, higher cost v/eavers were
made in the form of cheap raw materials when it appeared that the
competition from imports and from the larger v/eavers would force the
closure of many small businesses. But through the development of an
illegal free market these low priced allocations were channelled to the
lar- er firms ajid production activity was concentrated in the more

3^6
efficient sector of the industry. The free market effectively auctioned
the low supplies of yarn and the proceeds of the auction went to the
small v/eavers and their moneylenders.
'fhe sale of allocations meant that the larger 'leavers could produce at
near capacity v/hile the industry a^ a "jhole vjas running at only a fraction
of its potential, and this provides an e:cpl?a'iation for the expansion of
the weaving industry. Data in Chapter VIII shov/ed that the large scale
weaving industry insjiaged to maintain a fairly stable production perfor najice
in spite of the great fluctuations in overall utilisation rates. However,
the failure to expajid capacity'- at a constant rate suggests that there wa^
some uneveiriess in rates of utilisation even s- ongst the larger weavers.
Ihe ineffective bureaucracy, by allowing fi-ee market forces to determine
the distribution of yarn, facilitated the ojcosjision of the more efficient
section of the v/caving industry,'-.
One of the greatest problems v/hich weavers faced was the erratic
nature of supplies of raw inaterials. There v;ere eight Oabinets betv;een
1950 and 195?, each with its own policy of protection to the domestic
industry and of discriminatory action within the industr;,'-. It is
difficult to esti:,;ate the overall impact of politick instability on
. the industr;^ but the uncertainty wiiich this caused becajr.e one of the
most importairt acid tests of entrepreneurial skill and financial strength.
Only those competent managers backed by sufficient resources of working
capital could overcome the uncertainty ejid speculate successfully on
future supplies. The very large fluctuations in working capital
requirements brought about by irregular- ya-rn supplies was a principal
factor causing the movement of official yarn allocations from the weak

enterprises to the strong enterprises. In this way, the government's
method (or ?i.c.c]: of method) of planning imports contributed to the
demise of the •iTeaJ'.er sections of the textile industry. At the sarne time
the speculation of the free market for yarn offered those weavers who
could survive uncertainty a more even supply and price of the basic raw
material and assisted then in functioning at a more constant rate thaji
government T)olicy v/ould allow, in this way, the specu^tive yarn market
enabled them to plsji expansion with a smaller degree of uncertainty.
Cnce again, the problems of v/orking capital and quality of
management allowed the governi-.ient' s policies to founder because they
comprised only half- measures : the granting of cheap allocations
accompanied by the hopelessly uncertain state of the market which
proved too much of a strain on weaJk managements with low working
capital resources.
Tar i f fs , v'hich were sometimes fixed at a level which successfully
protected a large number of inefficient firms, provided abnormal profits
to the most efficient firms, while quotas which varied in magnitude
benfited these sair.e firms which were the final purchasers of yarn.
Although the rate of profit was by no means constant over time the
periodic large profits of the larger finus contributed to further
expajision of weaving capacity. The expansion in 1957 was due to the
good years of 1955-56 although total utilisation was s t i l l low. irotect-
ion, both tar i f fs and quotas, brought about structural changes which
increased the overall efficiency of the industry because the abnormal

3^8
profits enjo5'-ed by the more efficient finns encouraged the expansion of
that section of the industry. It is not easy to conclude that protection
caused high prices to the consumer. The high cloth price was due to
limited supplies of all textile materials and the failure to exert
effective control over consumer goods prices. If all the quota for
textile materials had been devoted to cheap cloth free market forces
would very likely have determined a similar price level.
One of the mor"e important aspects of jjrotection concerns the
expansion of finishing capacity, ^ecause of the former poor quality of
the domestic product Indonesians had formed an aversion to it and were
strongly prejudiced against all textiles produced in the country. 3ven
\ rhen the domestic product had been finished by modern processes this
prejudice remained. The only solution appears to be to continually
imnrove finishing processes so that the preference for imports will be
exposed as prejudice.
The effects of inflation:
Chapter IV, by examining the main individual cost components of
small and lar: ;e firras, demonstrated the process by which inflation
affected fin?! average production costs. It was assumed in the analysis
that the large firms were the most efficient, having good management
and marketing outlets, large financial resources, as ivell as the most
up to date production techniques; the smrJLl firms were assumed to have
the reverse of these characteristics. ;a.though the weaving industry is
made u-o of maJiy intermediate firms there is no doubt that there

3^9
existed a high degree of polarisation along these lines which VJBB
largely the resvilt of raciaJ. differences in the ov/nership-management
of firms.
Inflation acted to reduce the importajice of repayments of long
term loajis from banks for fixed equipment, of depreciation charges,
and of the v/ages bill, v hile it increased the cost of current credit
requirements, especially from the imperfect private credit market. Those
v/eavers v/ho started in business at the beginning of the period of
inflation with a low credit-worthiness were forced to resort to the
free market for loans for working capital, and the high interest rates
which they paid in that market reduced their profits and hence their
credit-worthiness in later periods. The efficient firms with their
higher initial credit-worthiness were best able to exploit this
parta^^ular effect of inflation. If they were Chinese they would have more
difficulties than efficient Indonesian \veavers in obtaining state
banic credit but there were maJiy v/ays of overcoming discrimination.
Thus inflation aggravated the cost differences and widened the
range of costs per unit of production within the weaving industry. The
greater v/as the initial range of average costs the less was the
probability that the government would succeed in protecting the weak
iveavers.

350
Inflation affected the free market in yarn through increasing the
supply of small weavers' allocations to the market. But it also weal-cened
the effect of tariff protection. The lower profitability of domestic
production i-aised supply schedules and lov/ered demand schedules in the
market. It did not appear that inflation added to speculative demand
for yarn since the v/ealcened competitive ability lov;ered the profitability
of stocking yarn, unless devaluation of the Rupiah was thought to be
imminent. As a store of purchasing power there were much better choices
of commodities. It must be concluded that compared v/ith the effect of
xmcertainty of supplies inflation had a negligible influence on specula-
tive hoarding of yarn.
The high rates of capacity utilisation of the large scale weaving
sector, ±a spite of inflation eroding tariff protection, can be explained,
in part at least, by the fact that many of the fixed costs of large scale
production lagged behind the general price rise. Moreover, the increase
in the supply of small v/eavers' allocations to the free market helped to
lov/er the yarn price.
Finally, inflation also v/eakened the effectiveness of the bureau-
cracy in carrying out regulations because of the demoralising effect of
the reduced purchasing power of salaries.
Hence we can conclude tliat despite the preferential treatment
offered the wealcer sections of the textile industry it was the stronger

331
elements v/hich assumed an increasingly important role in cloth product-
ion because it v;as aot possible to isolate the textile industry from
the disturbances caused by inflation and uncertainty of supplies of
raw materials.
Likely trends if past government policy persists:
^ast experience has shown that the influence of other economic
factors has been greater than the intended impact of government inter-
vention. V/hile inflation and lack of appropriate controls continue
it is not likely that the government v/ill be able to isolate the text-
ile industry from the rest of the economy. Inflation might be reduced
in future after the political reversal in 1965, but the foreign
exchange crisis and, therefore, the uncertainty of raw materials supp-
lies is likely to continue in the foreseeable future.
Moreover, because the textile industry has become more polarised
by levels of efficiency since Independence the past preferential
policies of intervention have even less chance of success than formerly
because of the relatively greater advantages possessed by the larger
firms. V/ithout massive aid under strict supervision to the weak firms
it does not appear to be possible to rehabilitate the small scale
section of the weaving industry, iioreover, there is a real possibility
that vd.thout a training prograrome and a change in attitude towards
savings and re-investment, any profits that might be made as a result
of this aid would be dissipated in conspicuous consumption, ^he tend-
encies tov/ards consumption spending out of profits, noticed before
the Second V/orld War, seem to be iust as prevalent today in parts of

- ' 352 the industry. The only reason for offering financial assistance before a
new entrepreneurial class emerges v/ould be in the case ?/here income is very
loviT and some forui of state subsidy must be made anyhow. But this situation
is discussed later in this chapter. It must be stressed that the case
a~ainst the sr.iall scaJ.e industry in Indonesia rests not on strict economic
considerations of size but on the quality of management and organisation
with which it is so closely associated.
The trend in polarisation is dependent upon the rate of inflation ajid
the initial fingjiciai strength of the firm. Even if inflation is lessened
in the future the small scale firms begin in a weaker position • in 1966
than in 1950-51» and a very Jjigh level of preferential aid would have to
be maintained to meJie them viable in the foreseeable future. The desirabil-
ity of alternative policies will be discussed but before this can be done
it is necessary to reviev/ the costs and benefits of the expansion so far
in relation to the rest of the economy, and thereby gain some idea of the
advantages ajid disadvantages of future plans.
Costs and benefits of the expansion.
Foreign exchange expenditure ajad saving:
Table 38 contains what must be regarded as very approximate values
for fixed investment and potential value added savings in term.s of foreign
exchajige in the three main sections of the industry.The cost :data were tak-
en from a report on the planned costs and revenues of a modem integrated
spinning-v/eaving-finishing unit in 1963» iispenditure on new equipment v;ill
vary with the country of origin and degree of mechanisation, and it would
be impossible to sum the many diffei'ent contracts of overseas suppliers of
machinery becavise of the unavailability of the appropriate data. Neverthe-less, these estimates, however rough, will provide some indication of the

353
TABL3
FOREIGN ]XQEAIIGS CGKSIDISATIOKS 0? ZIIFANGIGK oII CE 19^0. x'iev; capacity since IJ^C
units of units of equip- output ment
Collar cost of fixed capital investment since 1930
SPIIINING: units of capacity = spindles output = yarn in 1G00 tons V/EAVIKG: A'IBM ATI-I
units of capacity = looms output = cloth ' (million metres) FINISHING units of capacity are large machines output is in million metres
181,000 13,693 26.85
151,90^ 8,962
291million 1,032 41. if
216.6 30.7
98.93
Annual dollar value added saved by capital investment since 1930
0 millions 0 raillion£
6.1
37.3
16.2
39.6 Sources:- (i) i'ev/ capacity since I95O for spinning and weaving v/as obtained from data in ^able I3. iew finishing capacity was obtained from Table
(ii) -he dollar cost of fixed investment is calculated by using the figures stated in the ^ eport of the Industrial 'technical Foundation Center, P.T.Djunti, for the U.S. dollar cost of capital investment: 15,200 spindles cost ^2.255 million (p.22); ^00 power looms cost million (p.26); finishing plant for 9 million metres cost ; 1.279 million (p.30).

( i i i ) Dollar value added was obtained from
( a ) H . i^ .Bresette , The Svaluation of Presently Instal led Cotton
Yarn Spindles and Future Potential of the Industry, p . 1 ;
1 ^ ^ , 9 0 0 bales of raw cotton cost ^ 2 2 . ^ 6 mil l ion . Therefore, one
bale ( 0 . 1 8 tons) costs
( b ) -"'-eport of the industrial Technical Foundation Centre, o p . c i t . ,
Cue bale of yarn costs 0 2 2 3 ' Therefoe, value added = per
cent', or 3I per cent of imported yarn costs can be saved by
processing raw cotton.
( c ) ^^port of the Industrial Technical Foundation Centre, op .cit-,
Gne metre of printed s h i r t i n g / d r i l l costs 0 0 . 3 t but one
baJ-e of yarn i s the equivalent of 990 metres according to the
department of P e o p l e ' s Industry . Hence 990 metres cost ^225 of
yarn , or one 1 metr& . costs ^ 0 . 2 3 « Therefore, value added = 11?
per cent ; 3^ pei" cent of the cost of imported cloth caja be saved
by weaving and f in ish ing yarn.
( d ) To separate the value added by weaving and f in ish ing , the
tota]. Rupiah costs of weaving processing in the Report of the
Industrial Technical Foundation Centre ( o p . c i t . , p . 2 8 ) are used .
The total costs of weaving were estimated to be Kupiah 1 , 0 2 0 , 0 0 0
of which imported raw materials were estimated to be Supiah. 622 , 579 "
Therefore , the foreign exchange saved (assumed here as the value
added in dollar terms) is 6k per cent; or 39 per cent of the
dollar cost of imported unfinished cloth could be saved by
processing yarn . I t i s then inferred that 15 per cent (5^ per cent-
3 9 Toer cent) of the cost of f inished cloth imports can be saved
by the f in i sh ing process performed in Indonesia .
(These might not be accurate measurements of foreign exchange
saved because a l l the data a^re in SupiaJi terms, and arbitrary
( o f f i c i a l ) exchange rates were used to evaluate imported raw
materials i n domestic currency) .
( i v ) . The ATBM loom is bu i lt in Indonesia and does not require foreign
exchange.

355 burden of the textile ind-ustry's growth on foreign exchange resources.
Since a l l rav/ materials, including chemicals are important and
government electricity charges are'very small, value added saved is
defined in this analysis as the difference between the cost of an import-
ed good a.nd the cost of the import of its rav; materials. Unfortunately
there are no data on chemicals imported forvthe textile industry, so
that only the commodity to be processed v/ill be included in 'raw mater-
ials '.
'- 'he total amount spent, excluding spare parts, since 1950 is of
the order of ^'100 million and annual foreign exchange savings by
processing the raw materials in Indonesia ajiiount to almost 06G million.
But this latter amount must be regarded as a maximum because it does
not include spare parts and chemicals, but does assume full capacity
production, - f the industry functions at 50 per cent of capacity the
value added savings are halved. ITor does it include interest on credit.
The ^/e^t Brothers spinning mills contracts carried interest of 6 per
cent. The interest on other equipment is not likely to be more than
10 per cent.
Despite these qualifications the return in terms of foreign ex-
change savings appears high; for if the industry functioned at full
capacity it could save its foreign exchange cost in less than two years.
Ko comparable data for other industries are available so that it cannot
be concluded that the textile industry v/as more suitable than other
industries from the point of view of the balance of payments, however,
weaving is a process v;hich produced a 1' rge value added and the gov-

556
ernment appears to have done well in choosing to push this section
forward^ in view of pressure on the balance of payments. Thus in
as much as foreign exchange saving is an important criteria for aji
expanding industry, weaving activity is potentially promising.
The rate of return in foreign exchajire terms is not uniform
throughout the industry: power weaving has the highest and
spinning the lowest rate, ^t v/ould take weaving a little more than
one year to save the foreign exchange spent on it; but finishing
would tal-ce two years and spinning almost four and a half years.
Unfortunately, it is these le-st two sections whose capacities lag
behind that of the weaving section so that ejiy effort to bring
the production potential of each stage of the manufacturing
process in line with the others y;ould not save as much foreign
exchange as ivould the expansion of the weaving industry.
Employment creation and demand inflation:
Another aspect of exp-nsion of the textile industrj^ which
is worthy of consideration is employment potential. One of the
reasons mentioned in Chapter III for choosing this industry as
a means of industrialisation was that it would create more jobs
than other, more capital-intensive, industries.

357
The goal of high employment potential has been argued
against on the grounds that it raises ' ,/ money income and hence
total internal, demand for goods, both directly and through the
multiplier effect, i-f militant trade unionism can overcome the
influence of seemingly unlimited supplies of labour, wages can
rise/ and generate demejid and further demand through the multiplier
effect. This will result in rises in domestic prices unless the
balance of payments can stand an increase in the quantity of
consumer goods imports.
Table presents data on the appromate number of jobs
that would have been created by investment in the textile industry
since 1950. The handweaving industry was the outstanding source
of new employment although it is not clear how reliable this
figure is if it includes new handlooms which were only used a
quarter of the time. Additional employment created from investment
of 98.95 million was 2^,926 giving tise to an overall average
initial foreign exchange cost of 3,970 of providing one job.
Similarly, each additional worker would save ^2,382 in value
added a year.

TABLE 39
CAPACITY EXPANSION AND SIFLCYI-ISNT 3IKCS I950.
358
Total employment
created
^ Cost per additional employee
0 Savings per additional employee.
Spinning
V/eaving ATM
Finishing
TOTAL
vJeaving ATBM
(assuming one v/orker/ to each loom)
Sources:-
3,965
6,530 24, 9 do
151,904
6,772
2,830
4,850
3,970
1,538
2,548
2,559
2,502
(i) Total employment created v/as inferred from data in Eeport 01 the Industrial Technical Foundation Centre, P.T.Djunti. (pp.22, 26, and 30)
(ii) 0 costs and savings per additional employee were calculated using data in Table 39, (Sources ti) and
(iii) The ATBM loom is built in Indonesia and does not require foreign exchaiige.

359 This table shows more clearly than any other the advantages of
weaving. Not only does it create many more jobs than spinning and
finishing for a given sum but it has a high return in value added. The
finishing industry has a strong advantage over the spinning industry
for thd same reason. The very high dollar savings in value added for
each worker provides the basis for a strong argument against any
suggestion that the increased employment in the industry was a source
of demand inflation for which extra resources had to be found. The rise
in demand from increased income of workers, operating through the
multiplier effect on general demand, could have been comfortably met by
further imports made with the foreign exchange saved per employee which
amounted to several times the annual income per capita in Indonesia.
For this reason expansion of weaving activity cajanot be regarded as
adding to inflationary pressures. This does not , however, apply to
the spinning section.
Out of a population of 10? million in a country in which there
is a good deal of part-time employment the labour force might be any-'1
thing between 30 and ^0 million. Annual increments to this sura, in
view of a high rate of population increase in the country, would be a
great deal more than the total number of new jobs in weaving since 1950.
And yet textile manufactijaing has seen the biggest expansion of employ-
ment in any secondary industry. With seemingly insuperable obstacles to
improving agricultural productivity the development of an import-
replacing textile industry appears to be a great advantage to a devel-
oping country. ~ The labour force for 1966 has been estimated at approximately 38
million (G../. Jones. Bulletin of Indonesian Economic Studies. Vol.1. Ko.^. p . J u n e ^ 6G') ^

360
But in order that the country should benefit fully from these
savings the industry must operate at full capacity.
Problems of further development*
Foreign exchange considerations:
ficcording; to the Sight ^ear Plan there was to be a ceiling imposed
on weaving capacity in some areas v/hile a strong effort was to be made
on increasing spinning and the bottleneck finishing capacities.Since this
constitutes the immediate plans of the government it is worthwhile consid-
ering the foreign exchange costs and benefits of these changes first.
' able ho presents data on capital costs and value added saved
of equating capacities of all stages of the manufacturing process.
^f the handweaving industry is excluded it would cost
million to bring spinning and finishing capacities up to weaving
capacity but it would save only million a year in value added. If
handweaving capacity is included million must be spent and the
ajinual saving would amount to 52.9 million. Because of the low return
relative to the weaving industry it is thought that the policy of
maintaining weaving capacity ahead of the rest of the industry was not
inappropriate in view of balance of pajnaents difficulties which
emerged periodically.
regards the future it would seem that, although the foreign
exchange cost can be returned in a few years^ the initial layout of
up to ^200 million is very large in relation to Indonesian's present

TABLiJ a.
FOREIGN SXCIIMaE CONSIDERATIONS OF EQUATING Ci\PACITIES OF ADL SECTIONS MID OF EXI'/i:DING TEXTILE PRODUCTION CAPACITY BY ONE KST:fiE PER CAPITA, PER ANNUM.
Capacity bottleneck at xn'-esent units units of of
equip- ou.t-ment m t
_____ millions SPINNING: (a) excl. ATBM capacity equipment/267,056 23,161 39.6 spindles, (b) incl. ATBM capacity output/ 1,168,595 101,3^9 173.^ tons yarn. WEAVING: Am
equipment/ looms. _ _ output/ million metres cloth.
Capital Value New capacity re-cost of added quired for in-elimin- saved if creasing output ating bottle- by 107 million
bottle- neck is metres (or by neck elimin- one metre per
ated capita) units units
0 of of millionsequipment output
9.1 223,000 19,'+32
39.6
9,288 107
FINISHING: (a) output/ million metres finished (b) cloth. TOTAL
75.1 10.7
(a) (b)
178.3 25.3
198.7
3.6
13.3
52.9
107
Cost of install-ing cap-acity for 107 mill-ion metres
millions
33.1
23.2
15.2 71.5
Value added saved of capacity of 107
rjsillion metres
^
millions
7.6
20.9
8.0 36.5
cost to vaJLuo added saved of capacity of 107 million
metres
4.36 : 1
1.11 : 1
1.9 = 1.96 VjJ cr\

362
Sources:-
(i) The estimation of bottleneck capacities was calculated from Table while the dollar costs of increasing capacity and dollar savings in value added v/ere obtained as described in Table (Sources (ii) and (iii) ).
(ii) i^ew cai^acity required for another 10? million metres annually was calculated for spinning and finishing on the basis of T'able fo^ weaving (pov/er looms only were considered) on the basis of average output of metres a shift, tv/c a day, 240 days a year, per loom. , Zh^Us
(iii) llie remaining data were calculated as in Table (Sources (ii) ajid (iii) ).

363
overseas purchasing ability. So critical is her external payments
indigenously controlled position in the mid 1960s that only an^investment which would be
returned in one or two years would have a chance of being accepted
by her overseas creditors.
With the failure to grow cotton corame^cally in Indonesia,
spinning does not represent a bottleneck, i^ither the ratio of capital
cost to value added saved nor the foreign exchange per additional unit
of employment commend the expansion of the spinning industry. The
labour employed in constructing the large plants and the low foreign
exchange savin3s per worker employed suggest that this section is much
more likely to produce demand pressure through the multiplier effect
without sufficient compensating savings of foreign exchange. Thus the
case for greater spinning capacity is very weak. It would be of much
greater benefit to give effective protection to the weavers.
There is a case for expanding finishing capacity if it is felt
that by improving the quality of the domestic product abuses of the
import licencing system will be minimised. If some cloth imports are
likely to be made in spite of regulations the expected loss of
foreign exchange in value added of the weaving and finishing processes
must be ?/eighed against the capital repayments instalments on import-
ed finishing equipment. Let us suppose that if finishing capacity
can be increased by 107 million metres (one metre per head of
population) the abuse of import licences equivalent to 10? million

36
metres of cloth can be pi-evented. She value added saved v;ould amount
to 28.9 million (^20.9 million plus 8.0 million). But the cost of
installing finishing capacity is only 15.2 million.
1'he case for expanding finishing capacity then rests on the amoiznt
of cloth imports which can be prevented by Improving domestic finishing
processes. If this capacity has to be increased by 10? million metres
to prevent only 60 million metres of cloth being imported it is still
v/orthv/hile to expand finishing capacity. Furthermore, there is a greater
likelihood that long term credit can be obtained for capital investment
than for cloth imports, so that hov/ever critical is the balance of
payments it may still profit the economy to increase finishing capacity.
A less expensive method of overcoming prejudice against domestic
production is to utilise the facilities offered by Imperial Chemicals
Industries. In the past the Indonesian branch of I.C.I, has iffered
valuable technical advice and a wide range of dyes and chemicals to the
finishing industry. But lilce management training, assistance has been
given on application to the I'extile Institute in Bandung, to I.C.I., or
to the Department of People's industry. The smaller establishments v/ith
the more primitive processes are under less astute managements and are
less likely to seek advice.
1. This need not be so. rejiidice against the domestic product might be so strong that in order to prevent an abuse of regulations amounting to 30 million metres, finishing capacity of 100 million metres must be installed to raise the reputation of domestic cloth sufficiently.
2. See Table 'l-O. .-lien finishing processes are so poor that the consumer rejects the domestic product it is the value added of both the finishing and weaving processes v;hich is lost.

365 Because of the large sised plant units involved in finishing and
the smaller strain on management exerted by finance and marketing problems
it might be preferable to retain these factories in the public sector,
if necessary m t h foreign management and technicians, until such time
as indigenous personnel are suitably trained to assume responsibility.
'Table M-0 also illusti'ates the cost of increasing total production
capacity by one metre per head of population, or by 107 million metres
a year. For an initial cost of /71.5 million a total of million
would be saved, each year, -the spinning industry woiild appropriate almost
half the cost but save only ^7.6 million annually.
VJhile this might seem a v/orthv/hile proposition, particularly if
capital investipent can be made on longer term credit than consumer goods
imports, it is questionable whether the country should attem.pt to
increase supplies of textiles from any source beyond the present weaving
capacity of almost 7.B metres per armw.io
•t is not clear hov/ m.uch Indonesia has earned in foreign exchange
in the last few years but a government spokesman announced that earn-
ings have declined from ^750 million in 1961 to million in
1. J.Panglaykim and H.W.Arndt have published data in the Bulletin of Indonesian Sconomic Studies (Volume 1, No.5, p.7) which conflict with data obtained privately in Indonesia.
Export Earnings: Indonesia. Panglaykim & Arndt estimates Other estimates (Excluding; Oil) (Includinr: Oil) (Includin-: Oil)
1963 ^12 656 ^97 196^ 426 632 300
2. ilie Sultan of Djogjakarta, i'dnister for Sconomic Affairs in the 1966 S-uharto Government made public this information on i-iay, I966,

366
It may be some years before exports can be increased to their
former level and in the meantime annual debt ^repayments are liliely to
be of the order of '^330 to million. Hence it would seem that even
a small initial investment v;ith a. fast return m.ust be foregone in the
near future and instead the greatest effort'should be made to save as
much value added on present supplies of consumer goods imports as
possible. This is another reason for halting further expansion of the
industry.
Management training:
If the Indonesian goverrirnent v/ishes to continue to promote a
Benteng programme its most obvious and immediate task is a training
scheme for m-anagers. The time for such a policy v/ould appear more oppor-
tune in 1965 than it did in I95O because the level of capacity reached
in 1965 allov/s time for training of personnel before further purchases
of equipment are made: in I95O potential output per capita of the
weaving industry was still low and the possibilities of expanding to
save foreign exchange in value added v;ere all too obvious, i ow that the
weaving industry is large enough to permit a temporary ceiling to be
placed on it, v/hile any expansion of the spinning industry would commit
large sums of foreig-n exchange, it would appear an appropriate time to
conduct an intensive management training programme.
1. Unpublished data, Djakarta, i ay I965.

367 Inhere have been a number of management training courses centred
at the universities, particularly at the School of Business Administrat-
ion at the University of Indonesia. But they have only appeared to be
of slight influence for several reasons. First, they are fee-paying
courses v/hich means that the more v/ell-established and profitable firms
send participants. A manager v/ho is prepared to attend a course already
shows a promising attitude to business. Second, the courses are invar-
iably held in a university or in a government department, 'fhere appears
to have been no attempt to offer management extension services in the
environment of the participant, as has been done in agriculture. If a
v;eaver is prepared to go to a university or to a government department
for training he has already demonstrated the initiative and interest
vmich is so important to commerce. The first stage of the problem of
management training is one of overcoming apathy and convincing entre-
preneurs that it is v/orth their v/hile enrolling for courses. Third,
there is no evidence that the course work is based on problems related
to the indigenous manufacturer. The influence of foreign universities
would suggest that there is a strong slant tov;ards problems of business experienced
administration outside Indonesia. liost of the courses are entitled, 2 'Advanced Hanagement Program.me', and v/hile this might be well suited
1. 'The School affiliated v.;ith the University of California in 1958. At the same time the University of Gadjah I'ada, in Central Java, had an affiliation progrsinme v/ith the University of Wisconsin. (j. Panglaykim, Far x^stern Economic Heviev/. Volume XKiVII. Wo. 13* •September 27, 1962. pp.609-511)
2. Ibid. p.6l1. The participants of one course were descirbed as 'an accountant, a college professor, the manager of a business concern,
• a banker, etc'., and of another, 'the majority of participatns were professional military men who have become managers as a consequence of the nationalisation of the Dutch enterprises in Indonesia'.

368
to managers of very large Indonesian concerns it might be quite
irrelevant to other manufacturers.
• he first step in improving managerial abilities is to inculcate
a set of values appi-opriate to commerce: saving, re- investment, and hard
work. This can only be done by instructors visiting the entrepreneurs,
' nce the producers have been convinced that they can do better they
are much more likely to volunteer for the course v/ork at the
universities. 1
iH.K. Fisk pointed out in a study of small scale enterprises in
I-ialaya that it is extremely difficult to supplant the middleman
because of his strong monopsonistic position. A training programme for
aspiring indigenous manufacturers v;ould have to include financial sjid
marketing problems but it is not necessary to train managers to subst-
itute perfectly for the middleman. If the new manager can increase his
credit-v;orthiness by greater efficiency and reliability he v/ould qualify
for bank credit, or if he v/ere forced to go to the free market through
a shortage of banii credit, he would be able to obtain better terms.
However, it is doubtful whether any amount of training assistance can
solve the management problems of the smallest weavers in Indonesia, - t
v/ouJ.d appear from the analysis in this thesis that the entire small
scale weaving industry in Indonesia should be allowed to fall into
permanent disuse and training facilities be accorded only to new
indigenous entrepreneurs who '. already possess modern equipment and to
aspiring manufacturers on condition that they purchase modern
equipment. 1. E.Ii Fisk. The i^evelopment of Small ocale and Cottage industries in
the I-lural Areas of iialaya, p.54

369 Any p3.rt of the sraall scale section which is still supported
would be so protected for social and political reasons rather than
for economic benefit to the country.
Protection and lov; net foreign exchange earnings:
It is difficult to know v/hat exchange rate would have equated
costs and benefits of the textile industry in the past because much
would have depended on the exchange rates for other imports which
compete for foreign exchange.
The case for refusing ' . protection to a relatively high cost
domestic industry is sometimes argued on the basis of keeping
down the internal cost of living and thereby protecting export
potential. But foreign exchange must be found for purchasing these
textiles, and it is doubtful whether present export industries
can increase the value of their hard currency earnings very much
in future. Hor it is clear what secondary industries Indonesia
could possibly develop for exports. The notion of development
through export promotion is therefore highly speculative.
Cn the other hand, the data in this chapter show that specific
gains in employment and foreign exchange savings can be made
by an import-replacement industry. Ulth so much underemployment
in Java export output is not likely to be affected by employing
labour in the new textile industry. With the textile industry, export
earnings are retained,^employment and output have risen with no
foreseeable rise in prices.

370
iIo\7ever, in the raid 1960s the government is faced v/ith a
dilemma posed by the differences in avera^ 'e production costs aiid
the shortage of forei.gn exchange. I f , as is the case now, the
balance of payments cajinot stand increased capital expenditure then
abnormal profits must be eliminated to restrain further capital
investment. But a reduction in tariff protection would also mean
lower output in the small scale section and large imports of
finished texti].es. A total ban on purcha^ses of foreign capital
equipment could resolve the immediate dilemma, and this would
allov/ greater freedom of choice of other methods of protection.
-'-f it is decided to elipiinate all imports of finished text-
iles, whether by Yerj high tariffs or by quantitative restrictions,
there remains the question, 'How much of the small scale weaving
industry should be supported, even in the short-
run ? ' . This problem arises
1. Profits in the efficient sector would accumulate and this
might present problems of a sudden burst of expansion at a
later date.

371
because total domestic capacity is the equivalent of over 7 metres per
capita but the present foreign exchange position v;ill not a.llo\-i a
total supply of that magnitude. Sven in 1962 when the supply of textiles
v;as at a record level, only about 670 million metres, or approximately
6.5 metres per capita, v/ere available; v/hile in 1959 as little as 207
million metres, or less than 2 metres per capita, could be provided.
This is the reason why I.F.Andren's plaji for maximum physical utilisat-
ion of present v/eaving equipment is no longer applicable, although
the principle of complete reliance on the domestic industry can still
be accepted.
iiov/ever, well-intentioned the government distribution of yarn
allocations to small scale industry was in periods of low supply, it
must be recognised that the scheme v/as a failvire: the yarn finally
found its way to those producers who v/ould be expected to obtain it if
there v/ere a legal free market in all yann imports. If" the government
v/ishes to subsidise or pension off the small scale and cottage
industry there must be a less cumbersome v;ay of doing so. 'fhe strain
on the bureacracy and on government revenue could be reduced by accept-
ing the existance of free market forces.
An approximate tariff can be calculated v/hereby that part of the
textile industry for v/hich there is enough foreign exchange for raw
materials can be effectively protected, but the analysis in Chapter YII
showed that this would be eroded • , by inflation. Qn the other hand,
auajititative restrictions avoid both the necessity of estimating a
1. Calculated from iVolo 31 assuming 5.5 metres = 1 kilogram.

372
tariff and the detrimental influence of inflation. Yarn quotas might
be auctioned by the government so that all the profits from the import-
ing process which v/ere formerly made by importers, traders, ajid small
weavers operating in the free market v/ould be received by the govern-
ment. In so far as the profits of importers and traders are reduced,
the high propensity to import from this foreig-n exchange saving is also
reduced.
This system is essentially no different from the allocation system
except in the distribution of profits. The free market price v/ill be
that price which equates marginal revenue product or v/hich satisfies
other criteria important to the producer. The most efficient majiufac-
turers v/ill be operating- at fvill capacity and v/ill be making abnormal
l}rofits but v/ill be prevented from e:cr.ajading capacity by a total ban on
overseas capita.l purchases, although they might find it profitable to
buy old equipment from less efficient v/eavers and improve its product-
ivity by rationalisation.
If only those v/ho possess capacity licences are allov/ed to bid at
the auction the opportunities for speculation by middlemen v;ill not be
possible but, to the extent that these traders are bound to devise ways
of financing manufacturers and thereby obtaining possession of yarn
supplies there might be some specvaative activity. If the government
can ensure regular supplies of yarn there should be no incentive to
speculate.
Shou-ld the government forego quotas or permit one q.uota for all
textile materials imports v;ithout adequate stable protection measures

373
i t can s t i l l rely on discriminatory credit measures to ensure a
supply of rav; materials . .i.fter the March I950 measures and especially i n
November 1955 the discriminatory use of credit prevented ra\ r materials
imports from f a l l i n g very sharply and there i s l i t t l e doubt that these
measures could have been used to far greater e f fect . But this v/ill
alvvays be a clumsy method of protection and in as much as i t involves
more bureaucratic work i t might not alv/ays prove r e l i a b l e , ^ f it was
thought that the bureaucracy was capable of enforcing extra controls, a
complex system of import regulations, price control measures, and
profits tajcation might prave more e f fect ive . But i t has become
patently obvious from recent history that the Indonesian c i v i l service
is not strong enough to supervise such schemes. Simplifying procedures
and at the same time f a c i l i t a t i n g greater revenue for the government
would appear to |)rovide maximum benef it to the country.
'• he chief reason given for supporting small scale weavers i s to
provide extra income to the underemployed. There are pockets of
d istressing poverty in Central Java v;here there are local concentrations
of lanused handweaving capacity and there i s a strong argument for
supporting these areas with subsidised yarn supplies because of lack
of alternative employment. But this i s not the same as an argument for
supporting small scale weavers throughout Indonesia , particularly in
V/est Java where alternative emplojTnent i s l e s s difficvilt to obtain .
Superdipion of allocations made to specif ied ajreas would be much easier
to control than over larger areas , and efforts to overcome
credit problems of the small scale industry might be

J
concentrated in local banking facilities. Furthermore, an ineffic-
ient bureaucracy might be expected to have a better chajice of
success when its geographical coverarje is smaller.
The persistence of the batik industry in spite of low supplies
of all textile materials is due to the government's deliberate
promotion policy. Cambrics (the unbleaclied cloth) imports wfcre
subject to much lov/er tariffs than are finished cloth imports,
and have usually been protected by quotas as well. It appears
likely that this deliberate policy of intervention will continue
because of both cultural prestige and the need to satisfy many
villagers v;ho prefer the traditional dress, /hile this protection
remains batik and cheap finished cloth cannot be regarded as very
cl.ose substitutes, ' he small scale weaving industry cannot supply
the rather high cost batik industry '.vith sufficiently cheap raw
materials to supplant imports, while the continued support of the
batik industry reduces the likelihood of an expansion in the
market for finished cloth which might have helped small weavers.

375
Concluding remarks on sources of information.
The analysis of the industry has been made within the limits
imposed by available data. Official statistics on capacity and product-
ion were neither reliable nor comprehensive, and-the output of the
small scale industry was completely unrecorded. Until KOTOE began
investigating all capacity licences in December 1964 no thorough
investigation had been made concerning the operations of this section
of the industry. The enormous disparity between licenced and actual
handweeving capacity recorded by KOTOE might be taken as a measure
of the capacity which had fallen into disuse but for which alloc-
ations of yarn were st i l l claimed. The inadequacy of data on the
small scale industry was revealed in Chapter V I I I when rigid
assumptions had to be made about small scale activity and capacity
in order t^ infer the competitive strength of the industry, -^^gional
sample surveys undertaken by academic institutions in the country
were subject to local conditions and offered no information about the
small producer. There were no figures for stocks of raw materials
and cloth and in the absence of good production data only tentative
conclusions could be drawn concerning • r i stock changes on the
basis of import statistics . The best that could be done was to surmise
fluctuations in stock-building from the corroborative evidence of Bank
imports, iraport statistics , price ratios, and the general state of

376
the economy. difficulty lay, not in noting the periods diuring
v/hic]|otocks rose and fell, but in measuring the extent of these
changes.
Because statistics of imports, which originated from customs offices,
were the most reliable and comprehensive of all the data used in
•this thesis they were used extensively in several analytical chapters,
j-n Chapter III, for example, imports of raw materials were used as
supporting evidence of the rate of expansion of the industry because
the data on capacity v;ere not sufficiently detailed. The sample
surveys undertaken in -^andung and ^iadjalaja revealed the necessity
of careful preparation and checking in this kind of data collection,
i-'ost of the ansv/ers were fallacious and it woLild require a painstak-
ing and well trained enumerator to obtain reliable data. J-'he
intensive questioning of a small number of large and leading
manufacturers provided more information than the survey.
The almost complete absence of cost data was another serious
obstacle to a detailed analysis. In Chapter IV data from the Philipp-
ines and India v;ere used as the basis for the argument on costs, and
conclusions concerning cost conditions in Indonesia v/ere drav/n after
mailing assumptions of the effect of inflation. But this methodology
does not provide proof of hypothesis and suppositions however well-
founded the assmiptions appear from the results of intensive inter-
viev/ing.
Some of the areas of deficient statistics can be overcome by
saijple surveys. In the case of capacity data the investigations of
KOTGE should be completed and renewed every five years or so, with

377
sample checks made on capacity licences every year. Information on
costs would be extremely difficult to obtain, and in an inflationary
situation ivould be of liraited value, -i-et these data are of vital
importance to an effective protection policy. Periodic sar.ple surveys of
a size which is thought to be statistically acceptable for inference
about the v;hole industry v/ould constitute an inefficient and unreliable
method of evaluating costs. It v/oiild be better to imdertake a thorough
investigation of the cost structure of a number of different establish-
ments thought to be representative of all types of establisliments in
the industry. The respondents would be chosen for their reliability. A
monthly 'cost of production' index could be drawn up aiid evaluated
by substituting new prices for the components of the index. The effort
involved in this procedure v/ould not be great but the results v/ould be
extremely useful.
Data on stocks would be very difficult to obtain by - any method
and quite misleading information cotild be received by way of sample
surveys. Five well paid inform.--ants with long experience in the
industry are more likely to provide good results than sa-aple surveys
or Army inspectors. The Central Burec.y, of /statistics acquired free
market yarn prices in a similar manner by maintaining complete trust
and confidence between statistical officer and traders.
Until the weaving section emerges as a reasonably homogenous
industry with regard to costs and the statistical services are more
efficient there will remain serious deficienceies in dat?. about the
textile industry.

373
APPSriDIX A.
Sources of Credit.
The availability of credit, both short and long term, vifas
an important determinant of the rate of expansion of fixed capiteJ.
and the volume of supply of raw materials for existing capacity. The
type of borroiirer and the credit terms which he was successful in ob-
taining help to explain the structure of entrepreneursliip in the
expanding industry as v/ell as the rate of capacity utilisation.
The market for credit cam be divided into the organised and
unorganised sectors. The former is comprised of the several state
banlcs, the pav/n shops, and savings banks. Of these the state bajil-;,
v/hich were financed almost entirely from budget deficits, supj)lied
the vast bulk of credit to the organised market. The unorganised
money market is so called because it is made up of thousamds of small
units who either act as brokers between savers and investors or are
the source of savings themselves. Each acts independently of the
other and although they operate in an efficient competitive manner
they comprise a heterogeneous and unorganised mai'ket. This majrket con-
stitutes a channel through v;hich private savings can be offered to
potential borrov/ers vjithout being jeopardised by ir-flation. Although
inflation is not the only factor which malces the private lending market
the most popular destination of private savings it has been strong
enough to prevent the successful establishment of the forms of credit
institutions, such as the private banks ajid the stock exchange, which

379
are v/ell-lmovm in economically advanced countries. Even so, it is
unable to attract the savings v;liich would be expected to arise in
v/estern countries. One estimate of annual total net savings placed
the figure at 5 per cent of national income.^ The result has been
tl-iat only a fraction, alleged to be 2 per cent in 1953, but 5 per cent
in 195 -1 of the private sector's gross investment v;as financed from
private voluntary savings.^
Banks v/hich are exclusively devoted to the agricultural
sector will not be mentioned. Credit facilities in the organised
lending market v;ill be discussed first although some are of much less
importe nce than the private, xmorganised money market.
Government banks and credit institutions:
The government banks concerned vdth imports and v/ith the
textile industry are Bank Indonesia, Baiik Industri Negara (State
Industrial Bank-BIN), Bank Pembangunan Indonesia (Development Bank
of Indonesia-BPI), Banl-c Negara Indonesia (State Bank of Indonesia-
Brll), Bank Halcjat Indonesia (Indonesian People's Bank-BPJ), and Bank
Dagang Negara (State Trading Bank-BDN); and they are largely financed 3 from the government budget.
1. U.S. Dept. of Commerce. 'Investment in Indonesia. Basic Information for U.S. Businessmen.' Washington. 195^. p. 79. (Footnote in J. Bennett and E.A. Tenenbaum. Indonesian Industrial Financing, p.l6).
2. D.S. Paauw. Financing Economic Development. The Indonesian Case, p. 68.
3. This v;as because 'among Indonesian people there is in general little or no inclination to entrust their money to banks.' (He^ort of the Java Bejik 1953--52, p. 78). The BWI received Hp.250 millions or approximately U.S.22 millions, in March 1952 from the govern-ment with which to commence operations. (Ibid. p. 79).

580
Banlc Indonesia (formerly the Java Bank) follows the functions
of a central bank and as such is intended to offer credit tlirough
assisting other banks v;ith rediscounting facilities. Although the bank
does not aim to compete v/ith the smaller banks in the granting of loans
to individuals or firms it exerts an extremely strong influence on the
level of activity in the textile industry by issuing directions to other
banlcs on the type and duration of loans to be made to importers and pro-
ducers.
In January 1955 Bank Indonesia v;as given pov/ers to limit the
amount of credit extended by different banks, to restrict particular
kinds of credit and set maximum and minimum rates of interest.^
Hov/ever, such policies v/ere not strongly pursued because they v/ere
believed to limit Indonesian banks m.ore than foreign baroks. A
decree in March 1957 limited credits of longer than one year to enter-
prises in v/hich paid-up capital plus free reserves v;ere greater than
the minimum working capital requirements; and then the loan was not 2
to exceed 10 per cent of paid-up capital plus free reserves. It is
not knov/n v/hat overall effect this measure had, except that it reduced
the amount of credit to further fixed investment.
But it was in the import sector in particular that the Central
Bank displayed its full powers. The balance of payments was always
a source of anxiety to the government and, except in periods of
stringent quantitative restrictions, the principle instrument of con-
trol over the foreign trade sector v/as credit policy. U.K. Charlesv;orth
1. He-port of Bsnk Indonesia 1957-5Si P» 136. 2. Ibid. p. 159-

381
described the role of the Bank in this policy thus:^
The presence of v/ell-developed sophisticated foreign exchange banks, the lack of strong national domestic private banks, and the continued presence of inflation has forced the Bank Indon-esia to be primarily concerned with regulating and controlling foreign exchange baniiing. Its primary credit policy has been conditioned by the extent of import requirements necessary for the economy This orientation tov/ard the foreign exchange sector of the bajiking system could not be avoided and vri.ll con-tinue as long as foreign exchange banking dominates the banking system.
Moreover, in the presence of continuous inflation the average
propensity to import v/ith respect to income v;as alwa.ys rising and this
caused a change in the pattern of credit av/ay from domestic production
and tov/ards imports.^
V/hen prepayments v;ere raised in March 1953» the Bank undertook
to grant rediscounting facilities v/here foreign exchange saving or earn-
ing could be shovm to benefit by the transaction.^ The other banks
were also permitted to djrav; on their credits at the Central Banl up
to kO per cent of the amounts deposited v/ith the Foreign Exchange
Fund for the purpose of import financing if their balances with the
Bank were completely eliminated. These extra credit facilities v ere
crucial in determining the volume of imports, including raw materials,
1. H.K. Chao-lesworth A Bajiking System in Transition, p. 2. Moh,Sadli has suggested a very big increase in the propensity to
import. He said: 'During inflation the coefficient of the marginal propensity to import in underdeveloped countries, 0.2 in normal times, csji through the money supply, rise to 0.8 if not checked by import controls.'
He does not state how he arrived at these figures but appears to have little doubt that the influence of inflation on imports is very great. (Moh. Sadli.The Background of the Modified Import Regulations p. I6l).
3. Report of Bajik Indonesia 1935 -56. p. 75-

382
at the time of more stringent trade regulations.
In January 195^ the Bank ordered forei£:n excliange banks to
cease the granting of credit beyond the time needed to land imports in
the country because it v/as believed this placed importers in a strong
financial position to retain goods for speculation.^
In the field of industrial financing the Bank provided
credit to other bsjiks in order to support enterprises selected by tlie
government. At the same time it offered special credit facilities to 2
all banks for pre-financing credit v/hen surcharges and prepayments
required on imports v/ere increased. The extent of these extra
facilities during a period of limited v/orking capital resources brought
about by import regulations v;as the instrument of the Bank's discrim-
inatory policy.
The BIN which was started in 1952^ v;as chiefly concerned
v;ith long-term credit and dealt exclusively v/ith Indonesian enterprises.
Although it vjas intended to specialise in long-term credits it found
itself lending for working capital purposes as well. It was also
responsible for most of the government projects. In I960 the BIN v/as
incorporated in the nev/ly formed BPI. The BKI specialised in foreign trade and, inevitably, because
1. Re-port of Bank Indonesia 1956-57, pp. 8 1-85. 2. Prepayments were compulsory payments in advance for imports^and
were designed to eliminate excess liquidity. Chapter dis-cusses their effect in more detail.
3 . The Bank v;as established by Emergency Law No, 1952 but had retroactive effect as from Ajiril 1951*

583 of the increasing slis-re of trade in their hs.nds, with the Benteng
group. At the end of 19551 21 per cent of outstanding credits vjere
taken by the foreign trade sector. The BSI^ v/as to concentrate on
small scale and medium scale enterprises, cooperatives and those in-
dividuals in the lov/er income group. However, in practice their lend-
ing activities extended to quite large enterprises and the standards
of credit-v/orthiness made it difficult for an individual in the lower
income group to acquire a. loan. In January 1957 the Bia was granted 2
the status of a foreign exchange bank i /hich meant tliat it sliared the
special re-discounting facilities offered by the Central Bank.
The BDN was founded in 1958 to replace the credit sources
which had been used by the former Dutch trading houses taicen over by
the government.
A form of state banlc credit v/hich was very common until
the authorities discouraged it v/as the permanent over-draft vdth a
ceiling, on which an enterprise could draw at any time. Interest v;as
paid only on that part of the overdraft used and the proceeds of all
sales were deposited with the banl:. It v;as a general purposes credit
and was very popular in a situa.tion when working capital requirements
1. The BRI was begun in 19^9 as a continuation of the Dutch 'People's Banlc' by the Republican Government. (Report of the Java Bank 1951-
p. 8^). 2. Report of Bank Indonesia 195^-57' P* 92.

38
v/ere irregular. But only those enterprises v;hicli could offer security
and which had good past records v.dth the Bank were permitted this kind
of credit.
In 196 - the state banks v/ere reorganised in such a way that
they were to s]pecialise in industries rather than in size of enterprise.^
The banks were assigned to government departments and thereby exclusively
committed to the industries under the jurisdiction of that department so
that greater control could be exerted over credit policy. Bank Dagang
Negara became the bank responsible for the activities of the Department
of People's Industry and therefore for the textile industry. However,
this scheme v/as not effective because of resistance by tlie banks to
change.
The Department of Economic Affairs added to credit facilities
by offering its ov.ti credit to sciall enterprises through the Credit Found-2
ation, the Department of Cooperatives, and the Small Industries Credit
Bureau, and the BPJ,"
In December 1950 the Jajasan Pemusatan Djaminan Kredit
Eakjat (Central Foundation for Guc'trantee of People's Credit) v/as founded
v/ith the object of stimulating Indonesian industry and commerce. The
Jajasaji acted as a guarajitor agency for approved enterprises v/hich v/ished
to apply for credits from BMI and BSI, but v%rhose credit-worthiness was
1. Press interviev/ reported by Business News, Djakarta, 15.1,6^. 2. This is the Jajasan Kredit mentioned later, 3. D.3. Paauw, op. cit, p. 123. k. Ibid, p. 122.

385
regarded by the banlcs as doubtful. As such it v;as a pov/erful component
of the Benteng programme. In February 195^, the JPDKR v/as changed to
the Jajasan Lembaga Djamirian ICredit and its activities expanded to
assist those enterprises unable to satisfy normal banking requirements;
but applicants v/ere more carefully screened. Hov/ever, the rate of
failure to repay remained extremely high and the Jajasan became a
credit institution for those enterprises which would not be passed by
banks v.dth reasonable business stajidards. The remarkable increase in CMM .
the volume of credit due to the functions of the Jaoasan xnspired
by the belief that the main reason why Indonesians were held back v/as
the lack of credit facilities. Nevertheless, not all enterprises were
successful in obtaining guarantees because the provisions were highly
selective. Moreover, the processing of applications v;as lengthy and
troublesome and did not help the msjimacturer who required funds sud-
denly and quickly vfhen faced vdth a large consignment of raw materials.
The number of bad debtors at all credit institutions was
high and in January 1955 Bank Indonesia v/as given powers to limit the
amount of credit extended by the banks to restrict particular kinds of
credit and to set maximum and minimum interest rates.^
The influence of the state banks altered v.dth time. In
the early years of the 1950s credit was easy for Benteng producers and
importers, and in as much as the import sector attracted most of this
indigenous group cheap credit mostly passed directly into importirig.
Later on, when state credit was not given so generously, the stricter
Report of Bank Indonesia 1957-58. p. 136

3o6
application of the credit-v;orthiness criterion meant that the more
efficient entrepreneurs, including the Chinese, \-;ho would use an Indon-
esian for application purposes, benefited most.
National private banks:
Throughout the fifties the number of private banks grew
rapidly. They v/ere usually established by groups of private business-
men who v.dshed to expand their operations or who hoped to acquire nev/
channels of credit for their existing businesso In December 1955 there
were 75,^ and in December 1956 there was a total of 89 such credit ins-
titutions but not all of them were in operation because of organisational ? 3 problems. By 1959 there were 96 of these banlcs." Nine of tliera were
foreign excliange banks and Imd stricter credit-worthiness requirements
than other banks.
Because of the emphasis on credit-worthiness sJid profit-
ability the private national banlcs v/hich had no brief for assisting
specific sections of the economy, as had the state banks, tended to con-
centrate their operations in the trading sector rather ths.n the product-
ion sector. At a conference of managers of private banl cs in March 196 '"
many delegates believed that the banks' activities should m.ove away
from the commercial sector to the industrial sector and that the
1. Report of Bank Indonesia 1955-56. p. 82 2. Report of Bank Indonesia 1956-5?' P* 95 3. Interview with Dr. Pang Lay Kim 21.8.66. k. Ibid.

3S7
government should provide encouragement to them to do so.
The national private banks started slo\ rly using private
funds and v/ere always a minor supplementary source of funds to the
organised state credit market. The large increases in credit outstand-
ing in 1956 and 1957 v/ere mainly the result of assistance from Bank
Indonesia which amounted to Ep. 235.0 million in 1956.^ In December
1951- 7 per cent of total lending in the organised loan market v;as pro-2 vided by these banlcs; this rose to 10 per cent in December 1955} and
to 22 per cent in I963.
The Stock Exchange:
In June 1952 the Indonesian Stock Exchange begaji oper-
ations in Djal-carta. But manufacturers have used it very little to
raise nev; capital and its facilities are mainly used for the turnover
of existing securities only. Tlie Governor of Bank Indonesia attributed
the failure of the Stock Excliange to increase nev; fixed capital iii-
vestment to the public's general unfajniliarity v,dth the possibilities
of the Stock Exchange, and to the great inclination to invest savings k in rea l estate or moveables.
The volume of credit in the organised market:
Table (i) provides data on credit outstanding of the banlcs
at the end of each year. In the early years credit was a much higher
1. Heport of Bank Indonesia 1956-57* 95-9^. 2. Report of Banlc Indonesia 1955-56. p. 3. Interviev; with Dr. Pang Lay Kim. 21.8.66. h. Report of Bank Indonesia 1953-5^> P* 75»

388
proportion of the money supply than later and by I963 the proportion
had fallen to almost half v/hat it v;as in the early 1950s. This reflects
the ease v/ith which credit v/as obtained through the assistance offered
in the attempt to develop an Indonesiaji commercial class. Furthermore,
the fluctuations in credit do not correspond closely \'ri.th fluctuations
in the money supply. The large budget c'ificits in 1933 and 193^ caused
a sharp increase in the rate of inflation v;hich was not ma.tched by a
proportionate increase in total credit, eind in 19371 in spite of a
30 per cent increase in the supply of money, state bank credit actually
fell . The effects of this divergence of trend are discussed in
Chapter I I I and in Chapter VI I ,
T/J3LE ( i )
THE MOriEY SUPPLY MJD CREDIT OUTSTAIIDING OF BAi-IK II\TX)NSSIA,
BIN, BNI, 3JDRSIGN PRIVATE BAtlKS AI'© NATIONAL FPJVATE BAI IKS,
1931 to 1936, (AS AT BHD OF EACH YEAS). (5p. millions)
Money supply Credit outstanding Credit outstanding
of BI , BIN, B i n , & at 20 Nations.1
Foreign Private Private Banks.
Banks.
1931 3,328 2,132* N.A. 1932 ^,3^-9 K-A.
1933 3,218 2,238 102
195!,. 2 ,660 199
1933 8 ,6^7 3,^02 182
1936 9,372 3,923
1937 14,091 3,333 680
1938 19,872 3,123 I1OI7
1939 26,383 N.A.
i960 3^,079 N.A. N.A.
1963 263,000 13,503^^""^
Sources;- ( i ) Money supply. 1931-1960 Statistical Pocketbook of Indon-
esia 1963. V. 213; 1963, unpublished data, Djalcarta^ May
T9S5I

389
(ii) Credit outstanding of non-national, non-private banks; 1951-52, 5eport of the Java Bank 1952-53» P- 75; 1953-56, D.S. Paauw. op. cit. pp. 12'!-5; 1957 a-nd 195o He-iort of Bank Indonesia 195o-9, p. U i-.
(iii) Credit outstanding of 20 national private banks, 1955-5^, D.S. Paauw. op. cit. p. 125; 1957 and 1958, Heoort of Bank Indonesia 195S-9> p. 121.
(iv) Interviev; with Dr. Pang Lay Kira. 21.8.66. ^Debtors, internal commercial bills 2: participations all together.
As bank credit declined in value so did the length of
time for which the loan was raa.de until in late 196^ it vias very diffi-
cult to obtain barJc credit for more than one v/eek.
Pavrashops and Savings Banlcs:
Pav;n broking is a very comnion soiirce of raising credit and
in 1955, with pawn shops, total outstanding loans amounted to Rp.595
million^ or more tliazi the credit outstanding at 20 na-tional private
banks. The average time of this form of credit contract v;as 95 da;'-s.
In 1955 the Post Office Savings Bank, recorded credit balances
of Sp.189 million and private savings banks Ep.25 million:^ approx-
iraa.tely half the credit outstanding at 20 national private bank^.
Cooperatives:
Producers' cooperatives were set up after the 1927 Commission
on Cooperatives with the aim of promoting the organisation of snail scale
industries. With the e:cception of a short period follov/ing the protection
measures of 193^ they were generally a failure because of lack of exper-
ience and knowledge of their office bearers. Their officials were accus-
1. Report of B^k Indonesia 1955-56, p.8!-2. Ibid. pp. oF and 85.

390
ed of having the v;rong attitude tov/ards profit, v;hich included a tend-
ency to corruption of cooperative funds and demanding h-ajrsh terms
for the extension of credit. But the most importapit reason for the
failtire was the inadequate supply of funds and support from local
governments and the competition from outside sources of credit. The
v;eakness of the financial structure of the coopera.tives was a reflec-
tion of the financial v/eaknesses of the firms themselves since much of
their finances was supposed to come from their members. The producer
cooperatives v;ere never able to reduce the effectiveness of private
credit schemes very substantially, and today maalcloon still flourishes.
The unorganised supply of funds:
The private, free money market has eJLv/ays been of great
importance in Indonesia because of the multiplicity of trade relat-
ions and the confusion of the two roles of lending and trading.
of the most common credit arrangements amongst the thousands of units
operating in the unorganised money market can be described here.
The first is the broker v;ho acts as an intermediary between units of
supply and demand for credit in exchange for a fee. The second is
the saver who arranges through a private bank to channel his money
to a potential investor. Often this arrangement never appears in the
banlc accounts.
"This source of funds v/as alv/ays more dominant amongst the
smaller and wealcer enterprises whose credit-worthiness did not reach
the standards set by the organised money me.rket. It is not possible
to indicate the magnitude and limits of the unorganised market but

391
it can be said that its importance increased absolutely and relatively
over the years since the early fifties and in 196^ it v;as almost the
only source of borrowed v;orking capital for all kinds of enterprises;
fixed capital investment had virtually halted by ths t time.
In a situation of underdeveloped credit institutions it is
inevitable that greater reliance is made on self-finajiicing aaid re-invest-
ment of profits. Unfortunately, this field is completely undocumented,
but it is thought that the Chinese v.'ho were discriminated against in
credit policy, i elied heavily on this method of financing.
The Report of the Java Bank for 1952-53^ stated that internal
savings formed an important source of funds and tliat in the absence of
a large amount of savings by other members of the public this was to be
encouraged.
Another form of financing v/hich might be said to be internal
to the firm v;as the use of the system of allocations of foreign exch-ange
for the purclaase of overseas equipment. If a manufacturer v;ere alloc-
ated U.S.100,000 sjid the blackmarket rate for the dollar v;as four times
the official rate then he could spend 75,000 on equipment and exchange 2
the other 25,000 on the blackmarket and so repay the government. This
process v;as facilitated by overinvoicing the capital goods imports.
In some cases the entrepreneur v/as able to raise initial v/orking capital
1. Report of the Java Bank 1932- 3.. p. 66. 2. Several majiufacturers v;ho v/ere interviev/ed readily agreed that they
ha.d done this to some extent.

392
in this v;ay as v;ell.
The most common solution for working capital problems of the
cottage and small scale manufacturer remains the practice of maakloon:
a long established association betv/een a private moneylender and a small
manufacturer. V/hen the approach to a nev; source of credit requires a
journey into the nearest big tov;n, a long argument about the profitab-
ility of production followed by a long v/ait and an ujicertain outcome,
it is sometimes thought preferable to rely on former creditors even
though they are more expensive. Moreover, the private moneylender is
often a middleman viho performs marketing services for the small prod-
ucer, a service which is very valuable because of the grov/ing complex-
ities of the market and the failvire of the cooperatives to function in
this field.
Interest rates and payments:
Credit charges varied according to bank, type of enterprise,
and the rate of inflation. In the early fifties state bank interest
rate was between 5 per cent and 7 per cent per annum but this was raised
to between 12 per cent and 23 per cent by Loans made through the
Jajasan Kredit were subject to higher interest rates. In 195^ of a total
charge of 10 per cent per annum the Jajasan received 3 per cent for
bearing the risks while the bank through v;hich the credit v;as channelled
received the remainder. The only information found on interest rates
1. This information v;as gathered from interviews idth rHnufacturers^and banlc managers in 1964 and from J.Bennett and 3.A.Tenenbaum, op.cit. p. 89.
2. J.Bennett and E.A. Tenenbaum. op. cit. p. 89.

393
charged by private banks v;as quoted by Charlesv;orth^ who rrHintained the
rate v;as at 36 per cent per annum. Hov/ever, if these banlzs v/ere corn-
posed of private businessmen the interest rate might be e:qpected to
change v/ith inflation. The private unorganised moneylender functions
independently of government assistance and guarantees from the Jajasan
Kredit and it is to be assumed that he raeJces a profit over and above
the rate of inflation. His final charges scaxcely bes-r comparison v/ith
bank interest rates. In 195S the free market interest ra-te sas about
2 per cent to 6 per cent a month v/hile the bajik rate was about 6 . 5 per
2
cent per annum. Because of their low credit-v/orthiness the small
manufacturers v/ere forced to turn to the private money market and in so
far aB it was a very imperfect market, moneylenders were able to bargain
from a near monopsonistic position. Cha.i-lesv/orth describes them hs.rshly
as constituting 'a significant source of credit at usurious terms to
small indigenous Indonesian business. '^ On the other ha.nd, the big
profits made in importing:^ particularly during periods of import licencing,
increased the credit-worthiness of this part of the trading sector which k succeeded in obtaining cheap bank credit.
1 . U.K. Charlesworth. op. cit. p. 177.
2 . Ibid. p. 70.
3 . H.K. Chsjrlesvjorth. op. cit. p. 176.
This was especially true after import restrictions v;ere imposed in
August 1952. The number of recognized importers rose to 6,000
but after careful screening this v;as reduced to 770 in September
1953. (J .P . Meek, The Government and Economic Development in
Indonesia p. 172) .

39^
Hov/ever, this description of interest rates is inadequate and
misleading. In practice, the effective interest rates of the banks are
much higher because of the payment of 'commissions' to bank managers
ejid contacts in addition to formal charges. As inflation worsened and
formal bar-k credit amounted to a subsidy these extra payments v;ere
raised and might v/ell, on occasion, have ajjproached the free market
interest rate, depending on the type of customer. The popularity of
state bsjilc credit is partly explained by the absence of coercion to
repay. No coercion v;as used on bad debtors because it was hoped
that a bona fide Indonesian middle class v;ould emerge from the cheap
credit policy. Some borrov;ers regarded credit as a gift or as a rev/ard
for political services. There v/as also a reluctance on the part of
government officials to bring proceedings against debtors. However, the
bad debts increased so much that in 1957 Bank Indonesia felt compelled
to comment in spite of its support of the Benteng programme:
debtors in general are still too little aware that they have to fulfil their obligations v/ith regsxd to re-demption of their loans in a disciplinary v;ay, in accord-ance v/ith the amounts agreed upon.l
The data in Table (ii) suggest the screening imposed by the
Jajassin Kredit v/as not effectively executed. In 1958 about three-
quarters of the number and about half of the value of all loans were 2 still in arres-rs.
1. Report of Bank Indonesia 195 >-57. p. 99. 2. J. Bennet and E.A. Tenenbaum. op. cit. p. 89.

395
Several v;riters of the Indonesian economy^ have commented,
that much of bank credit was given in the form of short term loan be-
cause of the risk attached to lending long term dxiring inflation and
the poor security offered in most cases. Therefore, it v;as more dif-
ficult to acquire a loan for development purposes. Of course, a short
term loan v/hich is never repaid amounts to the sane as a long term
loan never repaid but the banli v;ould laave to be convinced tha.t it w3.s
a short term loan before it could be acquired. As inflation increased,
the availability of loan term credit for developmental purposes
decreased.
1. These include D.S. Paauv; (Financinc< Economic Development. The Indonesian Case) and H.E. Charlesv/orth (A Bajilcing System in Trejisition).

. 396
TABLE (ii)
SELECTED OFESATICKS C? JAJASAi; LEIBAGA KTAIJi^/j: IIEEDIT
Credit Applications (P.p.lOOO) Eeported arrears in repair-
Received
industry:
Dec.^C-Sept.52 39,368
Sept.32-
DeG.3^ 118,662 Sept.52-Dec .36 2A-7,8i6
Se-ot.52-Dec .37 317,559
'Rejected
5,397
68,156
151,662
196,675
nien-Gs
Amount As f.' of credit n-n. 1000 reported
7,011
1 1 , 1 2 3
1 1 P - T "
10
43
69
Dec.5C-Sept .52 94,316
Sept.52-Dec.54 345,593
Sept.52-Dec.56 544,637
Sept.52-
Dec .57 662,795
13,090
130,393
264,215
338,812
742
10,457
22,239
37,360
9.9
32
53
56
Sources;- Java Bank P.eport 1952-3» P^Sj. Bank Indonesia Reports, 1954-:
1957-8 pp. 1 0 8 - 9 pp.82-3; 195^-7 pp. 98-9;

397
APPENDIX B.
Capacity Production Measurement
Department of People's Industry and thesis definitions*
In this thesis production capacity definitions have been made
on the basis of official governaent sources v/hich, in turn, referred to
manuals accompanying imported machinery. It might be reasonable to
suppose that these manuals refer to output v/ith adeo^uate supplies of
rav/ materials to sustain continuous production for the time period stated
as v;ell as uith normal machine maintenance practices of industrialized
countries. The Department of People's Industry estimates of capacity
assume 300 working days a year but this has been reduced to 260 da.ys
for spinning and finishing and 2hQ days for weaving. It v;ould be im-
possible to accurately define the total working year: some establish-
ments v;ork harder than others and there are numerous 'lialf-holidays'.
Nor is there any suggestion made here that days a year has ever been
reached by the weaving industry: the number of business holidays lias
increased considerably in the last few years to enable workers to be
given ideological and military instruction. But the number of days
used in this thesis is considered a suitable measure for physical cap-
acity after allowing for traditional religious and social holidays only.
Spinning and finishing factories are assumed to function for
three shifts as it is common practice amongst them to have their ovm
power generators installed to make up for their smaller physical
capacities. On the other hand, power v/eaving equipment is confined to

tv/o shifts a day because of linited supplies of state electric-
ity. It is obviously not v/orthv;liile to install e::penEive
pov/er plants in the snail v/eavinj^ sheds; this is the only
concession to the concexot of 'economic capacity' made in the
estimates in the thesis. Handv/ea.ving equipment^is tradit-
ionally limited to daylight hoiu-s and a minimum of household
commitments, so that only one shift is used in these capacity
estimates.
Snr^ineerinA' capacity definition.
These estimates of productive capacity are similar
to engineering estimates in as much as they are based on
technical considerations. It is not clear v/hether the
engineering concept of capacity is alv/ays taken as capacity
restricted only by teclmical consideratior^ or v'hether variable
costs associated with the equipment itself, such as deprec-
iation and maintenance, help to determine the definition of

ensineerinc capacity.^ Engineering capacity can mean different
things accordinc to different criteria.
In evidence before the Congressional Su.bco;rimittee on Econoraic Statistics, Ilr. Greenua?i.d included non-technical considerations in engineering capacity v/hen he coirauented:
'The estii.iates of capacity for steel and electric pov/er are basically engineering estimates, because they are based on teclinic£l considerv -tions such as number of ingot tons of furnace cegoacitj" or b5.11ion kilowatt-hours of generator capacity. In addition, there stated assumptions about the number of shifts, the treatment of peak loads, allov/ances for holidays and maintenance, but there is no comprehensive allov -raice for cost corjr.iderations.'
(Hearing Before the 3ubconi:.iittee on Ilconomic Statistics. Congress of the U.S. 87th Cession, keasures of Prod-uctive Ca.pacity. p.T.) This conii-ient lea.ves the engineer free to include costs related to the inten-sity of utilisation of equipment in his c-pacity measure-ment. L.I?. Klein fouoid a v-ry close relation betv/een engineering caxoacity and minimum final average cost capacity in a sample of electrical stations. He said in evidence before the Gongiressional Subco..:r;;ittee on Scononic Statistics: 'I determined tlie minimum point on this cost ci.n've and compared it in term.s of actual operation v/ith the engineering estimate of caps-city andi. actua,l operation, and I found, that ....
ac tual ope rciti ons as a per cent of minimum average cost cam.e ver;y close to the engineering estimates of per cent of capacity utilisation in the sample of electrical stations thc.t I drev;.' (ibid p. 6l)~.

koo
If optiiiium en iineerinj; capacity can be defined aa tlie
level of output at v;hich average costs associated v.dtli capital,
equipmeiit eJ.one are niinimised, capacity in Indonesia night be
more or less than the equivalent of 2^0 da.ys a yeejr for the
v/eavin^ industry. Although there is no reason to believe
maintenance charges in Indonesia are a different proportion
of total costs than in the United States the lov;er depreciation
cost schedule (due to subsidised credit and very lou.exclis.nge
rates for capital equipment) could lead to a final plairt cost
curve whose rninimun point is at a sraaller outpiit than for the
same equipment in the United States.
A more serious limitation of engineering capacity
is the tecliiiical problems of account for the age of machinery.
The estimates in this thesis are those used by the Department
of People's Industry talze no account of the inf].uence of age and yet an expert at the Textile Institute in Btaidujag stated con-
fidently that the output of the most efficient po\;er loom (ATI.)
could be 30 per cent more than the oldest power loom. It is
thought that this is the biggest single source of error in this
kind of measure of productive capacity, but vdthout further inform-

matiorx no estimate of the error can be made.
Econonic capacity definition*
The economic concept of capacity taies into accoujit the pro-
fitability of production by eJ.lov/ing for costs of factors of production
and for product prices. It might be defined as th-at level of output at
v/hich returns to the manufacturer are !7iaximized. Since there is a large
number of producers in a competitive cloth market, economic c&.pacity is
the output corresponding to the lowest point on the average cost cvTve.
An increase in demand will lead to abnormal profits being made, firms
will expand ^ d their cost schedules vdll rise until the final cost
schedule of the enlarged plant is tangential to the demand curve at
its minimum point.
Although this definition allows for cost and price consid-
erations v/ith which the entrepreneur is faced, it is limited by dif-
ficulties associated v/ith estin]c?.ting the elasticities of short run
cost curves. If there was a small rise in demand this might nalce
no difference to thos e firms whose short-run cost cujrves were
elastic near the minimum point. On the other hand, should the short-
run cost curve rise steeply after its lowest point it might pay the
enterprise to increase its plsjit and operate on a new cost curve.
If all firms were to bid for extra supplies of raw materials
at the same time the cost of production would rise rapidly: that is,
before there is time to adjust capacity to a new set of prices, or
allow new entrants. This could have the same effect as an inelastic
short-run cost curve, and therefore encourage e^cpansion, because

h02
firms recognise an opportunity to reach a liijlier outp)ut at lo 'er
cost v.'itli cidditional equipment, lloreover, some firms Ki::Iit be uxxS.ble,
for certain reasons, to invest further tuid prefer to close doim rathex
than accept looses. In this case, althoi gh there vrauld be less pres-
,3ure on factory prices the industry's total supply curve would be
higher, and therefore the product price also. Hov;ever, this situation
v/ould occur only v.'here firms v;ere of unequal efficiencies, as in the
Indonesian textile industry.
Problems of mocisuring economic ca'pacity in the Indonesian te:ctile industry
There are more important limitations associated v;ith calcul-
ating this measure in the case of the Indonesian textile industry.
The problems of estimation raised by diverse and changing cost struc-
tures, tariffs and quan.titative restrictions, and inflation are of far
greater significance than the differences v/hich are likely to occur
betv/een Fortmie Magazine's measurement, the hcGrav-Eii:'. index, the
National Industrial Conference Board's approach, and the V/l'iarton 1
School' s estimates.""
1. Fortune Lagazine calculates the ratio of total stocl; of plajat and equipment to total output (corrected for price clia.nges and ad-justed by a fixed snnucil efficiency factor). The weakness of this measure lies in the extent of obsolescence and depreci^.tion, the pattern of prices and the level of demand, and the assumption that the 3jniual efficiency factor remains constant. The i.cGrav/-Hill inde:: is obtained by aslcing firms hoi/ m.uch they expejided in the previous year, hovj much they are lik.ely to erqoand in the coming year, their output, vna the rate of utilisation at v/hich they preferred to \/ork. The preferred rate was assum.ed to be at a position of maximum profit but this need not be true. The National Industrial Conference Board procedure is to establish

403
a fixed capital to output ratio for a yeojr v/hicli is regarded as a period v.'lien capacity v/as virtually fully utilised. Cnce this 'bench mark' ratio has been obtained, a significant rise in the ratio in a later period is taken as evidence of excess capacity. Its weelmess is that it does not take account of technological chniges or dif-ferent pressures on prices. The Wharton School (L," .. Klein) uses 30 groupings of the Tederel Seserve of Industrial Production indexes and selects peaks from the quarterly, seasonally adjusted plottings of these indexes. The v/eakness of this measure is that if all industries achieve their peal s together the pattern of input prices v/ill be different from the pattern of peaks distributed over tine such that total prod-uction activity remains reasonably steady.
1. Diverse and changing cost structures:
Chs.pter III shov;ed how the ueaving industry expanded
after a period v/hen only about half of its capaxity was being
utilised; some enterprises v/ere operating at a much hi^er rate
of utilisation than others. Therefore, it vrould be misleading to
infer ejiything about the engineering capacity from levels of output
aiid further expejision.
Although the e:rpansion of some firms while others might
be closing dov;n is a strong argument for an economic concept it is
clear that a difference must be made between the firm and the in-
dustry. If the individual firm maices new capitaO. investment when
it is operating at (say) 85 per cent of physical capacity then v.dth
unequal production costs, the industry as a v;hole might begin
expanding v/hen it v/as operatir^j at less than 30 per cent of physical
capacity, due to shortages of raw materials or to competition from
cloth imports.
Furthermore, new increments of capital investment are

kok
most likely to involve the most modern equipment sjid this will cause
a change in the existing pattern of cost schedules; and the enlarged
industry might have to be operating at more or less than 50 per cent
before it begins to expand, although the individual firm will only
/I
consider re-investment at an 85 per cent rate of utilisation. If
the new industry has a greater dispersion of levels of efficiency as
a result of investment in modern machinery it v/ould begin to expand
when less than 50 per cent of capacity is being utilised.
2. Tariffs:
The level of tariffs affects the cost of rav; materials. An in-
crease in the tariff on yarn v;ill shift the weaver's cost schedules
and viith it the position of the lowest point of the average cost
curve. But the size of the industrj^ and its rate of expansion v/ill
also depend on the degree of protection offered, because this
influences the price of the product which consumers are prepa.red to
pay. If there is an increase in the tariff on cloth, demand facing
1. Frank de ifeuw points out that changes in physical capacity can lead to changes in the most efficient or most profitable level of out-put. He assuK)es tliat technical considerations and economies of scale bring about this change. In the case of the Indonesian textile industry something more is involved. The increased cap-acity v/ill be more productive and efficiently run. The change in the cost structures as a result of expansion v/ill be more radical than in the case of an industry gradually expanding former tech-niques under a uniform management. (Franlc de Leeuw. 'The Concept of Capacity'. Journal of the toerican Statistical Association. Volume 37, p.831. December 19^2).

k03
the individual manufacturer v/ill rise and he will produce v;here his
new average cost curve is tangential at its lowest point to the
higher demand curve. If, on the other hand, there is a fall in
demajid arising from lowered protection some firms v;ill have to close
(or suffer a loss) and those firms formerly making abnormal jDrofits
will have to reduce their investment plans accordingly.
3. ^Quantitative restrictions:
Restricted imports of yarn can cause a rise in the cost of
this input through the mechanism of the free market; for every size
of quota there is a different free market price. If quotas are also
imposed on cloth imports (as is almost cei-tain to be the case) the
rise in demand facing the individual firm will help to accommodate
the greater yarn cost and there may be little change in the rate of
utilisation of the more efficient firms. The final economic capaxity
of the industry v/ill depend on the size and commodity composition of
the quotas.
k. Inflation:
If inflation is present while there is a fixed exchange
rate for imports of yarn, the cost of this input i-illl fall relative
to the cost of other inputs; and the effect v ill be a shift in the
average cost curve. If money demand for cloth rises in proportion
to the rise in cost of other factors of production (that is, at the
same rate of inflation), abnormal profits can be made and the industry
v/ill expand. But unless cloth imports are prohibited the lowered

406
effective incidence of protection durins inflation v/ill mean a fall
in demand for the product of the v;eaver. Because the uhole of the
competitive good is imported eA a fixed rate of exchcinge the fall
in demand facing the industry v;ill be greater than the fall in costs.
In this v-;ay inflation will be constantly reducing economic capacity
of the industry. The economic capacity of the individual firm might
be increased if inflation forces other, vrealcer firms out of business,
and thereby affects the industry's supply curve. Another effect of
inflation on the textile industry has been to alter the patterns of
cost structures of factors of production other tli8.n imported rav?
materials. Chapter T/.. shov/ed hov/ larger enterprises gained relative
advajitage over the smaller enterprises through the i.ldening dis-
parity of interest charges tuid labour costs. This v;ould alter the
average cost ciurve of the v/hole industry sjid, therefore, the
volume of output at v/hich it v/ould be mailing normal profits. * * * *
We can conclude that the government is able to influence
the estimate of economic capacity in the textile industry to a
marked extent by its monetary and tariff policies and by its prot-
ection of the balance of payments. Therefore, it wotild seem tlia.t
any ccjreful assessment of the economic c3.pacity of this industry
1. It is assumed here that there is no significant increase in rorl income sjid no significant increase in demand for textiles through a siibstitution effect.

407
Might be velld for only a short period and could be racically upset
by 20verni.ient policy. In these circumstances it is considered
justifiable to refer alv?ays to a measure of physical capacity in
this thesis limited only by traditional v;ork patterns and po\;er
supplies.

Bookso
408
I . Adelmaii
G.C. Allen S: A.G. Donnitliorne
G.C. Allen
A.F. Barker
J.H. Boeke
Theories of Econoaic Groutli and Develo-prnent, Stanford University Press. I 9 6 2 .
V/estei-n Enterprise in Indonesia and I-Ialaya: A Study in Economic Developnent. Allen aaid Unv/in, Londo n. 1957.
Japanese Industry: I t s Hecent Development and Present Conditions. Intemationa.l Sec-retar iat . Institute of Pac i f i c Relations. Hew York. 19 1-0.
A Short Economic History of Modern Japan, Ic07-193?. Allen and Unirin. London, 19^-6.
Japcj'i* s Economic Piecovery. Oxford Univer-s i ty Press. I958.
Justice to Japan. Leeds. 1937.
Economics and Economic Policy/ of Dual Soc ie t ies . International Secretaria.t. Institute of Pac i f i c Helations, Nev; York. 1953.
The Evolution of the Netherlands Indies Econoiirr. Netherlands and rletherlsn.ds Indies Council of the Institute of Pac i f i c Relatione. New York. 19h6.
PC.E. Bounding Economic Analysis. Hajiiish najiiilton. London. 1955.
J.O.k. Broek Economic Development of the I^etherlands Indies. International Secretariat. I n s t i t -ute of Pac i f i c Relations. New York. 19i!-2.
J • J, Chapman The Cotton Industry and Trade. liothuen. London, 1903.
II. IC. C harl e sv;or th A Banking- System in Trajisition, Th^ Hew Niisajitara Publishing Company, Djalcaxta,

09
M.T. Copelojid.
Maurice Dobb.
E,K. Fisk.
Cotton ilanufacturiag-: of the U.S. sity. 1912.
Harvard Univer-
Econornic Growth and Underdevelo]oed International PublicationcT New York, 1963. Tte Develo-onient of Small Scale and Cottaf;:e Indust-ries in the Kig-al Areas of Lalaya. Patral and Industrial Development Authority, Economic 3Jid Planning Division of the Colombo Flsja Teclinical Cooperation Scheme, I96O. The Economies of the Handlooa Industry of the East Coast of Ilalaya. Kuala. Lumpur. i960.
J.S. Furnivall.
;.J. Geerta.
K.L. Govil.
G. Fleming. Die Strukti rv/andlungen und die Aussenhsaidlesver-flectungen in der IJelttextilwirtscIiaft. University of Kiel, i960. Netherlands Indies: A Study of Plural Economy. Cambridge University Press. 19-t'i-. The Social- Context of Economic Change. An Indon-esian Case Study. Centre for International Studies^Massachusetts Institute of Technology, 1956. The Cotton Industry of India. Prospect of Retro-spect. Hind. Kitabs. Bombay. 1950*
E.A. van der Graaff. De Statistik in Indonesie (Statistics in Indonesia). N.V. Uitgeverij. van Hoeve. The Hague. 1955*
C.J.J, van Hall and De Lajidbouv; in de Indische Archive 1 Vol. Ill C.van de Koppel. ' s-Gravenliage \'J. van Hoeve. 1946-50.
E. Hawkins, H. VJ. Guthri e and L.H. Palmier Entrepreneurship and Labour Skills in Indonesian
Development - A Symposium. Monograph Ko. 1. Yale University. South East Asian Studies. I96I. Labour in Transition. (In Indonesia, ed. H.T. S.D. Hav/kins.
B.H. Higgins McVey.) Yale University. 1963• Entrepreneur ship and Labottr Skills in Indonesian Economic Development. Cellar Bookshop. Stechert. 19.61.
I.. A. Jaspan.
O.O Kennedy.
Indonesia's Economic Stabilisation atld Development. Institute of Pacific Relations. New York. 1957. SocisJ. Stratification sxid Social Mobility in L. . . . . • I H •! I II
Indonesia. Gunung Agung. Djalcarta. 3-959. Profits ggid Losses in Textiles. Harper. New Yox-k. 1936.

^10
VJ.y. Lockv;ood.
A.ij. Loebis.
Friedricli and Vera Luts.
J.A.C. Ilackie.
G.D. Kehta.
A. i-. de NeuniEji,
D.S. Paaiiv/.
Psjig Lay Kim
G.J. Paukei'.
J .J . Polak,
M. Zen Ealimaii.
A.K, Sen. P.H.V/. Srisen.
Soedjatmoko.
The Economic Developaent of Japan: Grovjth and .S'ti-uctiar'a].' Ghaxige. (l-fipS-ig^S) Prince ton University Press. New Jersey. IS^h. Ordonansi dan Peratui''an Devisen Terbaru Penjel -asaimja. Kinta Printers. Djakarta. 1962. The Theory of Investment in the Fii-n. Princeton University Press. Hew Jersey. 1951• The Indonesian Economy; 1930-^3« Sonderdruck aus Bsjid XVI der Schrufter des Institute ilu- Asienlimide in Hamburg. Alfred Iletzner Verlag. Frankfurt/I Iain. 196ik The Cotton Hil ls of India. (183^-195^)• The Textile Association (India) Bombay. 195
Cambridge Industria]. Development in Indonesia. Students' Bookshop. 1955. Financing;; Economic Development. The Indonesian Case. Centre for International Studies. Free Press. I l l i n o i s . 1959» Beberapa Fekta dan Angka Produlcsi Tekstil dalam rie-;eri. (Some Facts eJid Figures of Textile Pro-duction in the Coi.iiitry). University of Indonesia Djakarta. I96C. State Trading Enterprises in Indonesia: First Year's Performance. University of Indonesia. 1956 Perspectives on Indonesiaa Pol i t i cs .snd Economic Development• National Planning Association. V/ashington. 1956. The Hational Income of the Netherlands Indies 1921-1959. University of Indonesia. Jajasaii Badan Penei-bit. Report of Sampling Survey of V/eaving Factories Which Use ATHs. University of Indonesia, Djalcarta. 15.11.62, Choice of Techniques. Blackv/ells. Oxford. I96O. Industrial Development in the NetherlsJids Indies. Bulletin No. 2 Netherlajids and Netherlands Indies Council of the Institute of Pac i f i c Relations. New York. 19^2. Economic Development as a Cultural Problem. Modern Indonesia Project . Cornell University. Ithaca. 1958.

L.D. S t i f e l .
J .O . Su t te r .
K.H. Thakker.
Donald E. Wilraott.
C. Wolf.
A r t i c l e s .
The Texti le Indust ry . A Case Study of Indi is . tr ial Development of the Ph i l i pp ines . Cornel l Data Paper, No. Nev; York. November I963.
Indonesigxiisasi; P o l i t i c s i n a Chaiiftlng Economy,
Cornel l U i i i v e r s i t I t h a c a . 1959.
Ind ian Cotton Texti le Industry Durir^ the Tvjentieth Century. Vora and Co. Bpmbay. 19^9.
The Nat ional Status of the Chinese i n Indonesia, 1900-195^« Monograph Ser ies . IndonesiaJi Pro jec t . South East Asia Program. Cornel l Univers i ty . New York. I 9 6 I .
Selected Economic Development Projects i n Buraa and Indonesia. Cornel l Univers i ty . 1954.
Abdulgani.
R. Anspach.
C. Baldier.
T. Balogh.
Beng To.
E. Bernstein .
J .O. i ; , Broek.
C. Budiajrdjo.
I i .3. Chenery
17. II. Cor den £; J .A .G. Ilackie,
' Indones ia ' s National Counc i l . ' Far Eastern Survey. Vol. /DIVII. No.?. 3.958.
'Monetary Aspects of Indonesia 's Economic Heorganisation i n 1959.' Ekonomi dan Keuangan Indonesia. Vol. X I I I . No. 1/2. I96O.
'Credit Pol icy ( Indones ia ) ' . Ekonomi dan Keuangan Indonesia. Vol. E I . No. 3. <
'Agr icu l ture and Economic Development.' Opcford Economic Papers. Vol. X I I I . No. 1. I 96 I .
'The Balance of Payments.' Ekonomi dan Keuangaja Indonesia. Vol. IX. No. ? . I956.
'Some Aspects of I lu l t ip le Excha.nge r a t e s . '
Ekonomi daji Keuangan Indonesia. Vol. 'TJ., No. 5*
— ,
'East Indonesia: Problems sjid Prospects. ' Ear Eastern Survey. Vol. Zil. No. 1951.
'Devalua.tion i n Indonesia - Use and L im i t s . ' Ekonomi daJi Keuangan Indonesia. Vol. X I I . No.
7/9. 1959.
'The Appl icat ion of Investment C r i t e r i a . ' ' ;uaLr-
ter ly Jotmia l of Economics, February 1953•
'Development of the Indonesian Excliange Kate
Ap r i l . 1 9 6 ^
System.' Ilalayan Economic Re''/ie^.'. Vol . V I I . No."'

S.K. Dey.
i;. ©160015.
'Gotons Soyong or Alans Alans.' IH-oxioni den Keuan^an Indonesia. Vol. VII±. iiO. yi 1955. "The Interdependence of A^ricultujre a:ad Industrial Planning in an Underdeveloped Country.' dan Keuangan Indonesia. Vol. VI, Ko. 11.
lonomx
K.D. Dris.
K.H. Dronkers,
'Taxation in Indonesia.' Ekonon:i dan Keuangan Indonesia. Vol. XI. llo. 8/9. 195^. 'The Utilisation of Domestic Capital for the Promotion of Economic Development.' Skonorni dan Keuangan Indonesia. Vol. 'Jl. K0.5. 195J*
Economic Research Biureau. University of Ga-djah ilada. 'The Batik Industry in Centra]- Java.' Skonomi dan Keuangaii Indonesia. Vol. XI. 2Io. 7. 195 •> 'Indonesia's Economic Prospects'. Far Eastern Surve-. Vol. XICIII. December
D.'i. Fryer,
B. Glassburner.
F. Golay.
J.J. Kartemint:.
E. Hciv.'kins.
T. Herman.
B.H. Higgins.
'Problems of Economic Policy in Indonesia, 195-0-'•"TTT 57.' Ekonomi dan Keuangan Indonesia. Vol. Ho. 7/B. i960. 'Review of Gunxiar Ilyrdal's "Economic Theory and Underdeveloped Coxintries".' Ekonomi dan Keuangan Indonesia. Vol. XII. No. i-. 1959. 'Seviev/ of Higgins' 'Indonesian Economic Stabil-isation and Development.'
Vol. XI. I95S. uiionomi dan Keuangan
inaonesia. 'Entrepreneurship and Economic Development in the Philippines.' Far Eastern Survey. Vol. iCIIX: No.6 i960. 'The Problem of Industrialisation.' Elconoai dan Keuaoigaaa Indonesia. Vol. VI. No. 5. 1953. 'Labour Ilanagenient Selations as a Strategic Factor in Indonesia's Development.' Ekonomi dan Keuan.gan Indonesia. Vol. XIIo No. h. 1959» 'The Sole of Small Scale Industries in Asian Economic Development.' Economic Development and Cultural Change.' Vol. IV. No, t. 1955-56. 'Development Problems in the Philippines: A Com-"oarison with Indonesia.' Far Eastern Survey. Vol. hlYl, November 1957. 'Indonesia's Development Plans and Problems.' Pacific Affairs. Vol. XXIX. No.2. 1956.

B.H. Ilip'cins.
D.D. Humphreys.
V/. Hollinger.
Jones.
Kadarijah.
E. Kovary.
J. van der Kroef.
Lien.
'Indonesia's Five Year Plan.' Far Eastern Survey. Vol. X}iV. 8. 1956. 'The Implementation of the Mechanisation for Small Scale Industries Prograrume.' Skonomi dan Keuangan Indone sia. Vol. X. FeToruary 1957 • •The Sationale of Import Surcharges.' Ekonoai dan Keuangan Indone sia. Vol. '71. No. 5. 1953 • 'Indonesia's National Plan for Economic Develop-ment . 1962.
Asian Survey. Vol. il. No.2. December
'The Trade and Payments Agreements Programme of Indonesia.' Economic Development end Cultviral Change. Vol. 'W. No. 2. 1955-56. 'The Grov;th and Changing Structure of the Indon-esian Labour Force, 1950-81'. Bulletin of Indonesian Economic Studies. Vol. I. Ho. June 1966. 'The Textile Industry of Indonesia.' Ekonomi dan Keuangan Indonesia. Vol. ICE I. No. 2/3. 1959 • 'A Proposal to Build up the Institutional Frai?.ev.'ork. for Economic Development in Indonesia.' Ekonomi dan Keuangan Indonesia. Vol. 'U. No.l. 1955» 'Chinese Assimilation in Indonesia.' Social ?.es-ea-rch. Vol. }GC. No. 1953. 'Economic Development in Indonesia: Some Cultural and Social Impediments.' Economic Development gjid Cultural Change. Vol. IV. K0T2I 1955-5^. 'Entrepreneurship and the iliddle Class in Indon-esia. ' Economic Develonment and Cultui-ei Change. Vol. II. No. 1952-5-. 'Indonesia's Economic Difficultie
No. c.. i'ar eastern
burvey. UOI. JWV.J. V . i.iO, ci, i-y 'V" ' liidonesia's Economic Future.' Vol. :::E:II. NO. i. 1959. 'Instability in Indonesia.' Far Eastern Survey. Vol. }CCVI. No. k. 1957.
» t: Economi dan Keuaiigan Indonesia. Vol. IX. No. 7. I95S.

E.G. IlcVoy 'Indonesi£in Manpower Survey aiid Employnent Infor-mation.' Elpnoni dan KeugJirian Indonesia, Vol. IX. No. 5. I9W' '^oae Aspects of Labour and Economic Development.' Ekonomi daji Keuan.gan Indonesia. Vol. VIII. No. h, 1955.
L.A. Hears. 'Economic Development in Indonesia Through 195S*' Ekonomi dan Keuanigan Indonesia. Vol. XIV. Ho. 1/2 19^1
H. de Heel. 'Impediments to Economic Progress in Indonesia.' Pacific Affairs. Vol. :C{r7. Ho. 1 1951.
J.E. Hoes. "Trade Unionism in Indonesia.' Fa-r Eastern 3u.rvey. Vol. iGcviii. Ho. 2. 1959.
U. Mulia £c Harun Sain. 'The Implementation of the Hechanisation programme for Small Sceie Industries. ' Ekonomi dan Keuangsji Indonesia. Vol. X. Ko. 2. 1957.
V!. Hulia. 'The Hechaiiisation of Smell Scale Industries Pro-gramme.' (Second Heport) Elconomi dan Keug.ngsn. Indonesia. Vol. X. rio.2. 1957.
National Planning Bua-eau. 'Economic Development in 1955.' EI:onomi dan I'euan;-;axL Indonesia. Vol. VI' . Ho.9. 1953. 'EincJicing Economic Development.' Ekonomi d-an Keuangaii Indonesia. Vol. VII. Ho.' ^ 195^^ 'Indonesia's Social and Economic Development in IQ J F. ' Elionom.i dan Keuangarj. Indonesia. Vol. VIII. No. 7. 1955. 'A Study of the Indonesian Economic Development Schem.e.' Ekonomi dan Keuangan Indonesia. Vol.X Ho. 9. 1957. 'Some explanations of Indonesia's Flan.' Elconomi daaa Keuar gan Indonesia. Vol. IX. i.o.ll.
A.L. de Heuman. 'Approaches to the Hational Economic Planning in Indonesia.' Elionomi daji Keuangcai Indonesia. Vol. No. 10. 1955. 'Progress of Industry end the Development Flans in Inc'cnesia.' Ekonomi dan Keuan,"an Indonesia. Vol. VII., Hos. V5. 195':. ^ 'Promotion of Indigenous Industries v.dth Credit I'acilities.' Ek.onomi dan Heuangaji Indonesia. Vol, IX. Ho. 11. 1956.

D.3 . Faauvj.
L .H. Falmiei-".
. Farno en13 3l<..
Pang Lay Kim ^
H . " . Arndt.
Pang Lay Kim.
G.J . Pauker.
Tf F Poo
ill. Sacili.
Suhadi.
Surnitro.
'The l^ole of Local finance in Indonesian Lconor.ic
Dovelopnent. ' Skonomi dan KeuanpjSia Indonesia.
Vol. rai. Ho.l . 1955.
'Aspects of Indonesia's Social Structure.'
Pacific Affairs. Vol. jZ^VIII. rJo.2. 1955.
'Notes on tlie Balance of Payments.' Siconomi dsn. J
Keugjit aii Indonesia. Vol. IX. ITo.6. 195-•
'Survey of decent Developments.' Bulletin of
Indonesia.n Economic Studies. Vol.lT No. 'l-.
June 1966.
'Business Ilc-Jiasement Tredning in Indonesia.'
:-:onomi dan Keuangan Indonesia. Vol. X I I I . No. 1 /2
196c.
'Ncnagement Training in Indonesia.' ?ar Eastern
Economic Reviei-.'. Vol. iCDr/II. No. I 3 , September
27, 1962.
'Some Notes from the History of Marketing (Trad-
ing Regulations) in Indonesia from 1935 to the
B.S. System of 1957. ' Elconomi dan Keuejigsn In-
donesia. Vol. XVI. N0T2T 1963.
'The Eight Year Flan. ' Pacific Affairs.
Vol. XXXIV. Summer I96I .
'Small Scale Industry and Economic Development in
Indone si a . ' Economic Development and Cultural
Change, vol.^vi; No. 2. 1955-56.
'Background of the Modified Import Regulations.'
Ekonomi dan Keuangan Indonesia. Vol. VI, K o . ^ ' r .
1955.
'Structural and Operational Aspects of Public
Enterprise in Indonesia.' Ekonomi dan Keusjigan
Indonesia. Vol. X I I I . No. 5 /6 . I96C}.
'Cooperatives as a Means of Economic Development.'
Ekonomi dan Keuangen Indonesia. Vol. XI I . No. 7 /9 .
1959.
'The Budget and its Implicatioris. ' Ekonomi dan
Keuangan Indonesia. Vol. VI. No.l. 1955.
'Instability of Trade and Economic Development.'
Ekonomi dan '-euangan Indonesia. Vol. ^/I. No. 12»
1955.

16
Suniitro.
Sun darn,
H.L. Tims.
A. Wardhaiia.
' S t a b i l i s a t i o n Pol i cy Skonomi dan Keuanr^an Indonesia Vol , IX. N o . l . 1956.
'iin Ins t i tu t i ona l Approach to Economic Development.' Ekonorni dan Keuangan Indonesia. V o l . X I I , Ho. 3 / 6 . 1959. 'Developing the i^anc-gerial Resources in Indonesia . ' Slionomi dan Keuanp^gji Indonesia. Vol . XII . 2 / 3 . 1959. 'Foreign Exchange ?aid i t s Implications in Indon-es ia . 'Ekonomi dan Keusji. vaji Indonesia. Vo l . X. IIo. 10. 1957.
V/. V3J1 VJaraelo. 'Onstaan. en Grooei van de Hajidvreefnijverheid in i'Iadja3-aja.' (Development and Grov:th of the Handi/eaving Industry in Madjalaja) . Koloniale Studien. 1939.
Theses.
Hasv;3iiy Achraad and NoviazL Abbas.
I^achmat A l i .
L'. G. Amstutz.
Hasran Basri.
Sustarn Didong ejid Loekrnan Djadan.
E . I . riarahap.
Kadarijah.
Iia<^ustri Tekst i l dl Indonesia. (The Text i le I n -dustry in Indonesia. ) University of Indonesia. 1959. Fengaruh Peraturan Peratviran Irnpor Terhadap PerkembanguncJi Industri Teks t i l . (The Influence of Im-Dort Regulations on the Texti le Industry} .
ox inaonesia. 1956. The Development of Indigenous Importers in Indone sia , 195C - 5 . Cornell University. 195S« Ferkembangungji Koperasi Industri Tekst i l d-i Indone s i a . (The Development of Text i le Co-operatives in Indonesia.). University of Indonesia. 1959* Perl?%bangunan Perindustrian Tekst i l di Perkadjangan. "(The Development of the Text i l e Industry in Perkadjangan). University of Indonesia. 1959. Peranan Wanita dalam Kerad:;inan T e k s t i l . (The ro l e of VJonien in the Cottage Text i le Industry) . Univer-s i ty of Indonesia. 1959. Kebid.jaksgjaaan Penerintah dalam Industri dan "Pasarim Tekstil^ (crovemment Pol icy in the Text i le Industry and Ilarket). University of Indonesia. 1959.

17
liadarijah,
Keuv; Khe Tiauv;.
Kho Sam To.
Koo Bie Hoo,
Svie Koo.
Liauvj Siok Djoe.
Seid Aciineid Mar tali.
J.P. Keek.
Musvjair Djaraal and Arifin Astrav;ina.ta Njee Liang Diien.
Pang Lay Kim.
Parjono,
Saiazaini.
H.C. Schmitt.
Soehirnan Tjokrosoebro
Perkembgnnunan Perindustrian Tekstil di Indonesia. "(The Development of the Textile Industry in Indonesia). University of Indonesia. 1958. The Distribution of Pekalongan Batik.s in D.jcl arta and Environs. University of Indonesia. Textile Cloth Icetailin? in D.jgkarta. University of Indonesia. 1959. Textile VJholesale Marketing in D.jsliarta. Univer-sity of Indonesia. 1959. Industri Tekstil di Indonesia. Keadaan dan Ilasa De-oannja (The Indonesian Textile Industry. Hovj and the Future). University of Indonesia. 195o. Pei-kembangunan Keradjinan Didatursn Tinggi^ Bandrn^:. (The Development of the Cottage Indus-try in the Surroundings of Greater Bandiing.) University of Indonesia. (Undated.) Industri Textil di Ilad.jalaia. (The Textile Indus-try in fedjalaja). University of Indonesia. 195S. The Government ar.d Economic Development in Indon-esia. 1950-5^. Doctoral Dissertation Series. Publication Wo. 17, 622. University of Michigan. ilasalah Perusaha^ Peradjutan. (Problems of a Knitting Factory). University of Indonesia. 1959. The Internal Ilarketlng Functions of the Batik Industry. University of Indonesia. 1959. I-Iarketing Benang Tenun dl Indonesia. (The liarket-ii3g of Yarn in Indonesia.) University of Indonesia. 1959. Peraturan Impor Baru dan Big VIII. (The Kev; Import Regulations and the Big VIII). University of Indonesia. 1959. Beberapa Aspek Ekonomi Perusah^an delam Industri Batik. (Some Economic Aspects of the Firm in the Batik Industry). University of Indonesia. 1959. Some Monetary and Fiscal Consequences of Social Conflict in Indonesia, 195C-5<:3. University of California.. 1959. to. Ilasalah Pasaran Benang Tenun di Indonesia. (Problems of the Yam Market in Indonesia). University of Indonesia. 1959.

^ 0 4 lu Soemawan Tjokroprawiro.Hasil Rent.jana Lima Tahuji I Industri. ''The
Results of the First Five Year Elan for Industry.) University of Indonesia. 1959.
Sudarsono.
Sjahrial Wahab.
Widjojo Nitisastro.
Peranan Multiple Exchange Hate dalam Perdangan Intemasional dan Pem'bang lnan Ekonomi di Indon-esia. (The Role of the Mxiltiple Exchange Rate In the International Treide and Economic Develop-ment of Indonesia^ University of Indonesia. 1959. Qabungan Koperasi Batik Indonesia. (The Association of Batik Cooperatives of Indonesia.) University of Indonesia. 1959. Migration, Population Gro?/th, and Economic Develop-ment in Indonesia; A Study of the Conseofaences of Alternative Patterns of Intel—Island Migration. Doctoral Dissertation, University of California. 1961.
Indonesian Government Publications
M:R. Adisendjaja.
I.P. Andren.
'Industri Tekstil Indonesia.' Madjalah Industri Rekjat. No. 6. June 1965. U.N. Industrial Advisor. Memoraidujti to Minister of People's Industry. Djakarta, 2.10.59. Foreign Exchange Requirements ( Machine Capacity, Short and Long Terrn Plarrd.ng.! Memorandum to Minister of People's Industry, Djakarta 14.10.59. Textile Industry in 1960, Planning and Data to Determine and Control Progress of Textile Manu-facturing. Memorandum to Minister of People's Industry, Djakarta, 7.4.60. Textile Planning and Implementation 1960. 24.9.60. Textile Planning Data — 1960 Programme. April 1960. Comments on Memo 14 October 1959 — Foreip;n Excheinge Requirements — Machinery Capacity^ Sjip"' sjid Long Term Planning. Februar; ' 1961.
Department of Peoples Annual Progress Reports on the Development of Industry Projects, for 1962 to 1964.
Development of People's Industry in the National Overall Development Plan. April 1962. Madjalali Warta Industri. Vol. III. No.2. February, 1957. Djakarta.

Li 119
Departiiient of People's A Review of Progress TIeport of the 'Loan Pro-jects for the 1- 9cligjiisatioil of Privately Ov/necl Inc-ustrj'
Depairtmeirt of Agriculture. riatioiial Planning Bureau.
Factories.' 15.( 60."
(By Eric D. Ilanning). Cjalcarta.
A'rril Peabangunan Ind.ustri Halcjat. Djaliart 1962. Flans for Textile Target I965. Iiemoranduni to Minister of People's Industry. December 1964. Progress Report on Spinning Capacity, l.'eniorandum idnister of People's Industry. J-.12.?.960. Usalia Pembangunan. Djalcarta. 1964. Laporan Tenga-li Tahungji. Jsnmry to June I963. Djslcarta. I963. Report. Clothing Needs in Indonesia. Djal arta. 20.1c.6 :. Report of the Execution of the Pive Year Devel-opment Plan. Covering the Years .
Other Renorts:
(a) Indonesian.
Banlc Reports:
Kadarijah.
KOTOE.
Report of the Java Banl-;: 19^9-50 to 1952-53 and Report of Bank Indonesia; 1955-5^ to I958-5 9 . IIcLsalah Kebid,iaks£Jiaan Adir.inistrasi Pen.jaluran Sandan;;. (Problems of the Aciniinistration of Policy on the Distribution of Textiles). Report of the Institute of Economic said Social Reseea-ch, University of Indonesia., Djakarta 1964. Progress Reports of the .Specisl Team for De-termining Ray; I-Iatericils for the Production of Textile£ 11 .65.
Sadli, Ilulia, Kadarijah, Masalah Pertekstilaai Dev/asi ini. (Tgjget, ijain and Sulti
Suratrnaai, Plarsono, and Soeharno.
^ iii— ProduJcsi Efektip dgn Kapasitet). University of Indonesia, Djalcarta I96';. Laporan Penjelidilcan Tentejig ojarat-ogarat I'iinimuni Jang Dip- rlu-lccji Untuk Mengadalcan 2 Hingga 5 Shift Diperusaiiaan-perusalaaan Tekstil di Indon-esia. University of Gadjah I-Iada. Djogjal iarta. 1963.
(b) United Nations.
I.P. Andren. Indonesian Industry gJid the Eight Year Plan. Draft of Final Report to the United Nations Bureau of Technical Assistance Operations. 1.10.6I.

420
ECAFE
Juan B. Gaatarabide.
D.II. Simpson.
Sectoral. Study. Textile Incxistries. Asian Con-ference of Industi-ia-lisation. Ilovember 1963* An Interim Prosrainrae of Industrial Estates in Indonesia Djal arta. 1.9.1961. United Nations Bureau of Technical Assistance Operations. Kev/ York. Report on a Prograr-ime of Breeding and Cultural Experiments uitli Cotton in Indonesia. Food and Agricultural Organisation, Cotton Breeding Expert. I95C.
(c) United States
J. Bennett S: E.A. Tenenbaum. E.N. Bresette.
Indonesian Industrial Fincuicing. Continental-Allied. Co. Inc. Washington. 1958. (Industrial Advisor-Textiles). Evaluation of Presently Installed Cotton Yarn Spindles and Future Potential of the Industry. Seport to U.S.A. A.I.i). Djalcarta. 8.6.196'i-.
Committee Appointed by the Conference of New England Governors. P.eport of the Nev; England Textile Industry. 1952. Industrial Technical Projek Pemintala.n Pertenunan Penjempurnan. Centre Foundation. P.T. 'Sjunti'. Djal-carta. Cjalcarta 2i.i2.i963. Research and Policy Committee of The Committee for Economic Development (USA) Meeting the Special Problems of Small Business.
New Yorl:. June 19'-:-7. Su.b-committee on Economic Statistics of the Joint Economic Committee, Congress of the U.S. o7th Congress. First Session. U.S. Economic Sui- vey Team to Indonesia.
(d) Philippine s.
Philippine National Banl-c.
Measures of Productivity. Indonesia, Perspective and Proposals for U.S. Aido . 1964.
Investment Prospects in Selected Industries. Depa.rtment of Economic Research and Statistics. Manila. I96O.

421
Kev/spapers and periodic publications:
B siness rievjs Djalcarta. 1964 and 1965.
Coiiniercial Advisory Foimdation of Indonesia.
Uarta GAIT. 15.s.^ )4. 19.11. ,64. 29.12. ,64. 3ol. 65.
13.1. 63. 23.1. 63. 27,1. 63. d. t;. 65.
25.2. 63. 20.3. 65. 45/HIV64
Economic Section. 12. 5.64. 26. 5.64., 1. 9.64.
30. 9.64. 31.10.6':-.
Economist Intelligence Unit Report. Indonesia. London. April 1961, llo. 36. October I96I. Ho. 38. Hay 1962. Ko. 40. July 1962. ilo. 4l. May 1963. No. 44. July 1963. Ko. 45.
Indonesian Statistics: (Central Biireau of Statistics, DjaJcarta).
Perusahaan-perusaliaan 3esar I96I (II) aaid (i l l) Statistik Konjunl tur 19335 1961 and January-April I963. Statistical Focketbooks of Indonesia, I96O to I963. Suamary Report; Materials Used and Production of Lain Knittirig
and V/eavinp; I-.ills 1964. (Ilonthly reports).

k22
Summciry Seport: Imports According to Ty-'e.. 1963 siff. 196 -. (Ilonthly reports).
Government Departmental Statistics:
Statistical Abstract for the rletherlands East Indies, 19^9-1939' Departrnen van Landbouv:, Nijverlieid en Handel. Djalia-rtcX.