Textile Enginee
178
ISTANBUL TECHNICAL UNIVERSITY INSTITUTE OF SCIENCE AND TECHNOLOGY Ph.D. Thesis by Nazan ERDUMLU Department : Textile Engineering Programme : Textile Engineering APRIL 2011 AN APPROACH TO INVESTIGATE THE SPINNABILITY OF FINE COUNT YARNS ON VORTEX SPINNING SYSTEM
-
Upload
khangminh22 -
Category
Documents
-
view
0 -
download
0
Transcript of Textile Enginee

ISTANBUL TECHNICAL UNIVERSITY INSTITUTE OF SCIENCE AND TECHNOLOGY
Ph.D. Thesis by
Nazan ERDUMLU
Department : Textile Engineering
Programme : Textile Engineering
APRIL 2011
AN APPROACH TO INVESTIGATE THE SPINNABILITY OF FINE COUNT
YARNS ON VORTEX SPINNING SYSTEM


ISTANBUL TECHNICAL UNIVERSITY INSTITUTE OF SCIENCE AND TECHNOLOGY
Ph.D. Thesis by
Nazan ERDUMLU
(503062803)
Date of submission : 28.01.2011
Date of defence examination: 21.04.2011
Supervisor (Chairman) : Prof. Dr. Bülent ÖZĠPEK (ĠTÜ)
Members of the Examining Committee : Prof. William OXENHAM (NCSU)
Prof. Dr. Cevza CANDAN (ĠTÜ)
Prof. Dr. Arzu MARMARALI (EGE Ü.)
Prof. Dr. Banu UYGUN NERGĠS (ĠTÜ)
Prof. Dr. Fatma KALAOĞLU (ĠTÜ)
Prof. Dr. Halil Rifat ALPAY (ULUDAĞ Ü.)
APRIL 2011
AN APPROACH TO INVESTIGATE THE SPINNABILITY OF FINE COUNT
YARNS ON VORTEX SPINNING SYSTEM

NĠSAN 2011
ĠSTANBUL TEKNĠK ÜNĠVERSĠTESĠ FEN BĠLĠMLERĠ ENSTĠTÜSÜ
DOKTORA TEZĠ
Nazan ERDUMLU
(503062803)
Tezin Enstitüye Verildiği Tarih : 28.01.2011
Tezin Savunulduğu Tarih : 21.04.2011
Tez DanıĢmanı : Prof. Dr. Bülent ÖZĠPEK (ĠTÜ)
Diğer Jüri Üyeleri : Prof. William OXENHAM (NCSU)
Prof. Dr. Cevza CANDAN (ĠTÜ)
Prof. Dr. Arzu MARMARALI (EGE Ü.)
Prof. Dr. Banu UYGUN NERGĠS (ĠTÜ)
Prof. Dr. Fatma KALAOĞLU (ĠTÜ)
Prof. Dr. Halil Rifat ALPAY (ULUDAĞ Ü.)
Prof. Dr. Bülent ÖZĠPEK (ĠTÜ)
VORTEX ĠPLĠK ÜRETĠM SĠSTEMĠNDE ĠNCE NUMARA ĠPLĠK
ÜRETĠLEBĠLĠRLĠĞĠNĠN ARAġTIRILMASI ĠÇĠN BĠR YAKLAġIM

iv
v
FOREWORD
I would like to express my deep appreciation for my supervisor, Prof. Dr. Bülent
Özipek, who I feel honored to study with, for his constant guidance, encouragement,
support and fatherly care during my thesis.
I wish to express my sincere gratitude to my co-supervisor, Prof. William Oxenham,
who provided me the opportunity to proceed my research at NCSU College of
Textiles, for his invaluable support, guidance and contribution to complete my thesis.
I am deeply grateful to Ilhami KÜCÜK for providing facilities of Ayka Textile
Company, and Gülfiye AKBAS and other staff at Ayka Textile Company for their
kind assistance.
I would also like to thank to Muratec USA for providing their facilities, and special
thanks go to Terry BAME, laboratory manager at Muratec USA, for his valuable
help and assistance.
I appreciate Tim PLEASANTS, spinning laboratory manager at NCSU College of
Textiles, for all his kind help during sample preparation and production.
Last, but certainly not least, I would like to thank to my husband Mert ERDUMLU
for his sincere love and patience, to my family for their enormous support, and to my
friends, who were there for me when I needed them most.
April 2011
Nazan Erdumlu
Textile Engineer

vi
vii
TABLE OF CONTENTS
Page
FOREWORD .............................................................................................................. v TABLE OF CONTENTS ......................................................................................... vii
ABBREVIATIONS ................................................................................................... ix
LIST OF TABLES .................................................................................................... xi LIST OF FIGURES ................................................................................................ xiii SUMMARY ............................................................................................................ xvii ÖZET ........................................................................................................................ xix 1. INTRODUCTION .................................................................................................. 1
1.1 Introduction and Aim of the Thesis .................................................................... 1
2. LITERATURE SURVEY ...................................................................................... 9 2.1 History of Air Jet Spinning ................................................................................ 9 2.2 Vortex Spinning System ................................................................................... 12
2.2.1 Principle of yarn formation mechanism .................................................... 12 2.2.2 Structure of vortex spun yarn .................................................................... 19
2.2.3 The effects of processing parameters on the structure and properties of
vortex spun yarns ....................................................................................... 27
2.2.3.1 Nozzle air pressure ............................................................................. 27 2.2.3.2 Yarn delivery speed............................................................................ 32 2.2.3.3 Distance between front roller nip point and the spindle: ................... 33
2.2.3.4 Nozzle angle ....................................................................................... 35 2.2.3.5 Spindle diameter................................................................................. 36
2.2.3.6 Spindle working period ...................................................................... 36 2.2.3.7 Cone angle of the spindle ................................................................... 37 2.2.3.8 Spindle type ........................................................................................ 37
2.2.3.9 Yarn count .......................................................................................... 38
2.2.3.10 Fiber composition ............................................................................ 39
2.2.4 Properties of vortex spun yarns in comparison with jet, conventional ring,
compact and open-end rotor spun yarns .................................................... 41
2.2.4.1 Yarn hairiness, bulk and rigidity ........................................................ 41 2.2.4.2 Yarn evenness and imperfections....................................................... 41 2.2.4.3 Tensile properties ............................................................................... 42
2.2.5 Properties of fabrics made from vortex spun yarns in comparison with
conventional ring, compact and open-end rotor spun yarns ...................... 44
2.2.5.1 Fabric strength .................................................................................... 44 2.2.5.2 Abrasion resistance ............................................................................ 44 2.2.5.3 Pilling propensity ............................................................................... 45 2.2.5.4 Dimensional properties ...................................................................... 46
2.2.5.5 Fabric thickness, compressional properties and fabric hand .............. 47 2.2.5.6 Dyeing properties ............................................................................... 48

viii
3. MATERIALS AND METHODS ......................................................................... 51 3.1 Materials ........................................................................................................... 51 3.2 Method .............................................................................................................. 51 3.3 Testing and Evaluation Procedures .................................................................. 54
3.3.1 Fiber Testing ............................................................................................. 54 3.3.2 Yarn Testing .............................................................................................. 54
3.3.2.1 Structural properties ........................................................................... 54 3.3.2.2 Yarn count, evenness and imperfections, hairiness ............................ 55 3.3.2.3 Yarn tenacity and elongation .............................................................. 56
3.3.2.4 Yarn twist ........................................................................................... 56 3.3.3 Fabric Testing ............................................................................................ 56 3.3.4 Statistical Analysis .................................................................................... 57
4. COMPARATIVE ANALYSIS ON RING, OPEN-END ROTOR AND
VORTEX SPUN YARNS .................................................................................... 59 4.1 Comparisons of Ring, Open-end Rotor and Vortex Yarn Properties with
Special Reference to Cellulosic Fibers ............................................................ 59
4.1.1 Yarn properties .......................................................................................... 61 4.1.2 Fabric properties ........................................................................................ 68
4.2 Effects of Draft and Yarn Delivery Speed on Viscose Vortex Spun Yarn
Properties ......................................................................................................... 78
5. SPINNING POSSIBILITIES OF FINE COUNT YARN ON VORTEX
SPINNING SYSTEM .......................................................................................... 89 5.1 Spinning Limits of Carded Cotton Vortex Spun Yarns.................................... 89
5.1.1 Yarn structure ............................................................................................ 91
5.1.2 Yarn physical properties ......................................................................... 102 5.2 Factors Affecting Spinning of Fine Cotton Yarns in Vortex Spinning .......... 108
5.2.1 Effect of noil removal ratio and yarn delivery speed on yarn structure .. 110
5.2.2 Effect of noil removal ratio and yarn delivery speed on yarn physical
properties ................................................................................................. 120
5.3 Spinning Limits of Combed Cotton Vortex Spun Yarns................................ 125 5.4 Comparison of Vortex, Conventional and Compact Ring Spun Yarn Properties
....................................................................................................................... 131
5.5 Process-Structure-Property Relationships for Vortex Spun Yarns ................ 136
6. CONCLUSION AND RECCOMENDATIONS .............................................. 141 REFERENCES ....................................................................................................... 143 CURRICULUM VITAE ........................................................................................ 151

ix
ABBREVIATIONS
AFIS : Advanced Fiber Information System
GLM : General Linear Model
gr/y : grain/yard
HVI : High Volume Instrument
MJS : Murata Jet Spinner
MVS : Murata Vortex Spinner
OE : Open End
SEM : Scanning Electron Microscope
SFC : Short Fiber Content
SPSS : Statistical Package for the Social Sciences
TPI : Turns per inch
TPM : Turns per meter
UHML : Upper Half Mean Length

x

xi
LIST OF TABLES
Page
Table 1.1 : Worldwide total shipment and installed capacities of vortex spinning
units..... ...................................................................................................... 4
Table 1.2 : Total shipment and installed capacities of vortex spinning units by
countries. ................................................................................................... 5 Table 2.1 : Fiber configuration in vortex spun yarn.................................................. 21
Table 4.1 : Cotton fiber properties ............................................................................ 59 Table 4.2 : Spinning parameters used for investigation of the vortex yarn properties
in comparison with ring and open-end rotor yarns. ................................ 60 Table 4.3 : Properties of vortex, ring and open-end rotor spun yarn samples. ......... 62 Table 4.4 : Analysis of variance test results for the properties of vortex, ring and
open-end rotor yarn samples. .................................................................. 63
Table 4.5 : Fabric parameters. ................................................................................... 68 Table 4.6 : Dimensional properties of fabric samples. .............................................. 70
Table 4.7 : Bursting strength of fabric samples. ....................................................... 73
Table 4.8 : Abrasion properties of fabric samples. ................................................... 75
Table 4.9 : Spinning parameters used for investigation of the effects of draft and
yarn delivery speed on vortex yarn properties ........................................ 79
Table 4.10 : Properties of yarn samples spun with varying draft ratios and delivery
speed ...................................................................................................... 79 Table 4.11 : The analysis of variance test results for the effects of intermediate draft
and total draft. ....................................................................................... 80 Table 4.12 : Analysis of variance test results for the effects of intermediate draft and
delivery speed. ....................................................................................... 84
Table 5.1 : Cotton fiber properties used in carded cotton vortex yarns. ................... 89
Table 5.2 : Properties of 3rd
passage drawing slivers used in carded cotton vortex
yarns. ....................................................................................................... 89
Table 5.3 : Spinning parameters of carded cotton vortex yarns. ............................... 90 Table 5.4 : Weight and ratio of wrapper and core fibers in carded cotton vortex spun
yarns. ....................................................................................................... 91 Table 5.5 : Structural characteristics (class length and percentage) of carded cotton
vortex yarns. ............................................................................................ 97
Table 5.6 : Structural characteristics (wrapping twist angle and diameter) of carded
cotton vortex yarns. ............................................................................... 100
Table 5.7 : The analysis of variance for the mean values of carded cotton vortex yarn
properties. .............................................................................................. 102 Table 5.8 : Properties of carded cotton vortex yarns. .............................................. 103
Table 5.9 : Independent sample t-test results for evaluating the effect of sliver
weight on carded cotton vortex yarns. .................................................. 108
Table 5.10 : Cotton fiber properties used to produce carded and combed cotton
vortex yarns. ........................................................................................ 110
xii
Table 5.11 : Properties of 3rd passage drawing slivers used to produce carded and
combed cotton vortex yarns. ................................................................ 110 Table 5.12 : Spinning parameters of carded and combed cotton vortex yarns. ....... 111 Table 5.13 : Analysis of variance test results for the effects of noil removal ratio and
yarn delivery speed on yarn structure. ................................................. 112
Table 5.14 : Weight and ratio of wrapper and core fibers in carded and combed
cotton vortex spun yarns. ..................................................................... 113 Table 5.15 : Structural characteristics (class length and percentage) of carded and
combed cotton vortex yarns. ................................................................ 116 Table 5.16 : Structural characteristics (wrapping twist angle and diameter) of carded
and combed cotton vortex yarns. ......................................................... 118 Table 5.17 : Analysis of variance test results for the effects of noil removal ratio and
yarn delivery speed on yarn properties. ............................................... 120
Table 5.18 : Properties of carded and combed cotton vortex yarns. ....................... 122 Table 5.19 : Tensile properties measured on Uster
® Tensojet vs. Uster
® Tensorapid
..............................................................................................................126 Table 5.20 : Theoretical and actual draft conditions in carded and combed cotton
vortex spun yarns. ................................................................................ 129
Table 5.21 : Theoretical and actual draft conditions in vortex and ring spun yarns.
.............................................................................................................130 Table 5.22 : The regression equations between yarn count and structural properties
of cotton vortex yarns. ......................................................................... 137 Table 5.23 : The regression equations between yarn count and physical properties of
cotton vortex yarns. ............................................................................. 138 Table 5.24 : Process-structure property relationships in cotton vortex spun yarns. 139
xiii
LIST OF FIGURES
Page
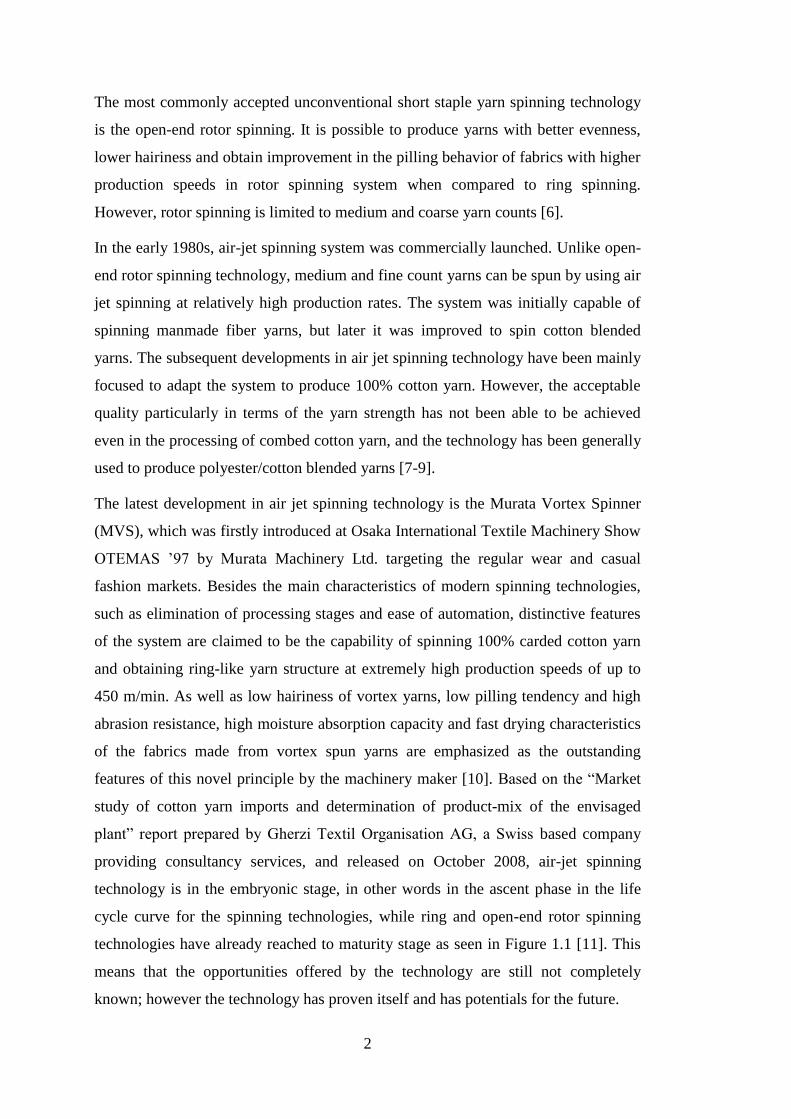
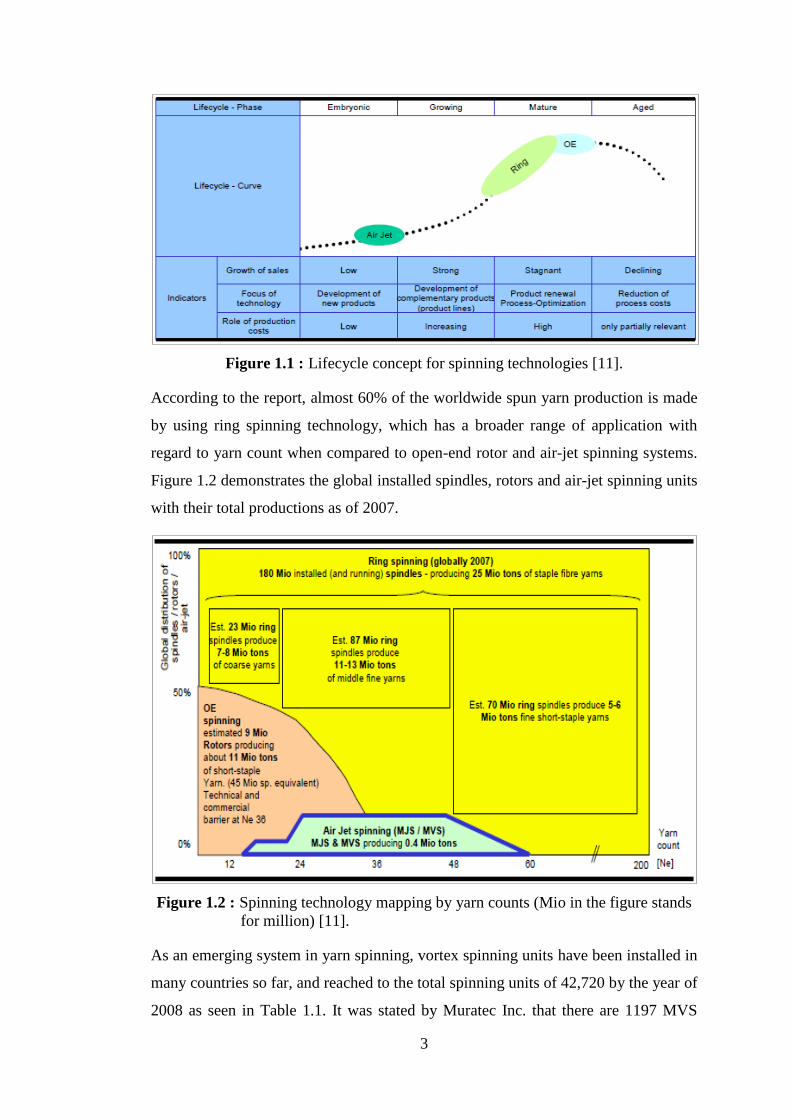
Figure 1.1 : Lifecycle concept for spinning technologies. .......................................... 3 Figure 1.2 : Spinning technology mapping by yarn counts (Mio in the figure stands
for million)........ ...................................................................................... 3 Figure 1.3 : Installed vortex spinning units by the year of 2008 by countries in
percentage. .............................................................................................. 4 Figure 1.4 : Productivity of spinning technologies. .................................................... 6
Figure 2.1 : Structure of sheaf yarn. ........................................................................... 9 Figure 2.2 : Spinning unit of Murata Vortex Spinner. .............................................. 13 Figure 2.3 : Drafting system in Murata Vortex Spinner. .......................................... 13
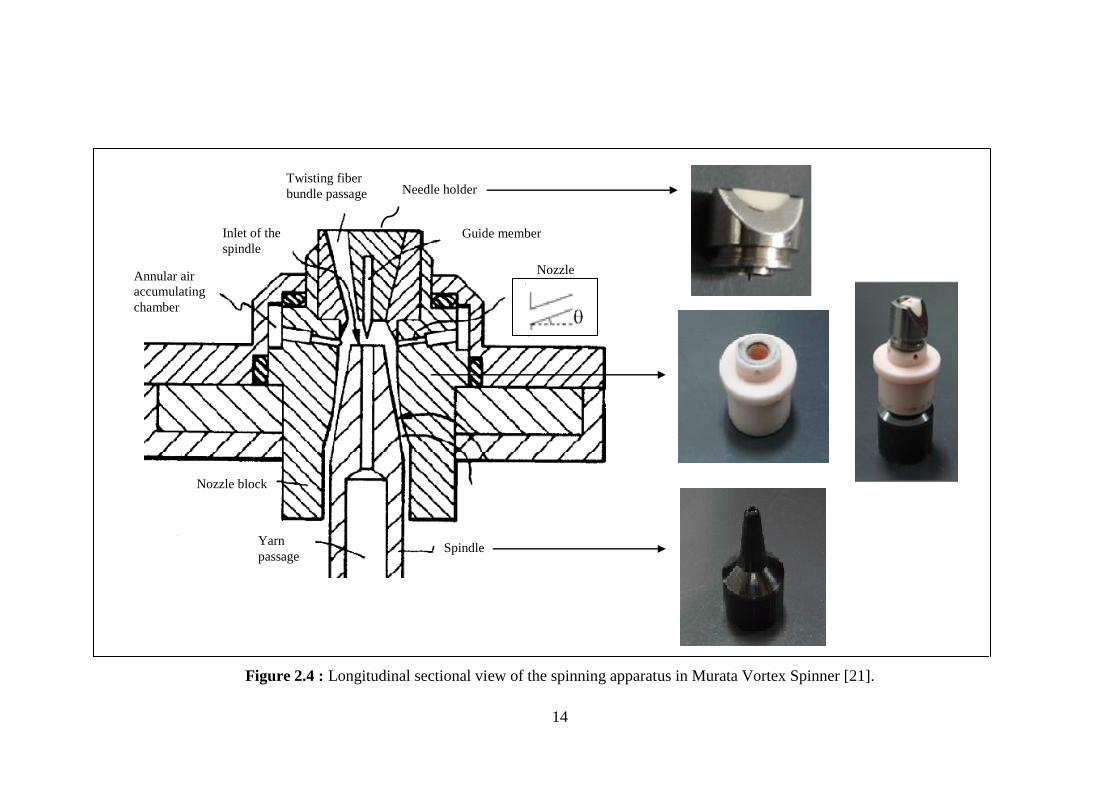
Figure 2.4 : Longitudinal sectional view of the spinning apparatus in Murata Vortex
Spinner. ................................................................................................. 14 Figure 2.5 : Principle of vortex spinning. ................................................................. 15
Figure 2.6 : Nozzle block. ......................................................................................... 15 Figure 2.7 : Yarn formation in vortex spinning. ....................................................... 16
Figure 2.8 : Yarn formation zone in Rieter J 10 air-jet spinning machine. .............. 17 Figure 2.9 : Longitudinal sectional view of yarn formation zone in Rieter J10 air-jet
spinning machine. ................................................................................. 18 Figure 2.10 : Murata vortex spinner – MVS 861. ..................................................... 19
Figure 2.11 : Rieter J 10 air-jet spinning machine. ................................................... 19 Figure 2.12 : Number of wrapping fibers in MJS and MVS. ................................... 20 Figure 2.13 : a. Vortex spun yarn (MVS), b. Jet spun yarn (MJS). .......................... 20
Figure 2.14 : Structure of vortex yarn in ideal case. ................................................. 20
Figure 2.15 : Fiber spatial trajectory in vortex spun yarn. ........................................ 22 Figure 2.16 : Four types of structural classes of MVS yarns: (a) Class-1, (b) Class-2,
. (c) Class-3, (d) Class-4. ....................................................................... 23
Figure 2.17 : Schematic diagram of fiber types in the yarn structure. ...................... 24
Figure 2.18 : Schematic diagram of yarn structures. ................................................ 25 Figure 2.19 : Yarn formation zone in vortex spinning. ............................................ 33 Figure 3.1 : Process flow and the machines used for sample production in Turkey. 52
Figure 3.2 : Process flow and the machines used for sample production in the USA.
...............................................................................................................53 Figure 3.3 : Untwisted yarn with distinctive core and sheath. .................................. 55 Figure 4.1 : Comparative results of yarn count variation. ........................................ 61 Figure 4.2 : Comparative results of yarn tenacity. .................................................... 63
Figure 4.3 : Comparative results of breaking elongation. ......................................... 64 Figure 4.4 : Comparative results of yarn evenness. .................................................. 65 Figure 4.5 : Comparative results of thin places. ....................................................... 65
Figure 4.6 : Comparative results of thick places. ..................................................... 65 Figure 4.7 : Comparative results of neps. ................................................................. 65 Figure 4.8 : Comparative results of hairiness. .......................................................... 67 Figure 4.9 : Comparative results of variation in hairiness. ....................................... 67

xiv
Figure 4.10 : Preparation of specimen for change in skewness. ............................... 69 Figure 4.11 : Widthwise dimensional change in greige fabrics. ............................... 71 Figure 4.12 : Widthwise dimensional change in dyed fabrics. ................................. 71 Figure 4.13 : Lengthwise dimensional change in greige fabrics. .............................. 71 Figure 4.14 : Lengthwise dimensional change in dyed fabrics. ................................ 71
Figure 4.15 : Skewness in greige fabrics. .................................................................. 72 Figure 4.16 : Skewness in dyed fabrics. .................................................................... 72 Figure 4.17 : Bursting strength of greige fabrics. ..................................................... 74 Figure 4.18 : Bursting strength of dyed fabrics. ........................................................ 74 Figure 4.19 : Abrasion resistance of greige fabrics. .................................................. 76
Figure 4.20 : Abrasion resistance of dyed fabrics. .................................................... 76 Figure 4.21 : Effect of draft on tenacity. ................................................................... 81
Figure 4.22 : Effect of draft on breaking elongation. ................................................ 81
Figure 4.23 : Effect of draft on work to break. ......................................................... 81 Figure 4.24 : Effect of draft on hairiness. ................................................................. 81 Figure 4.25 : Effect of draft on yarn evenness. ......................................................... 82 Figure 4.26 : Effect of draft on thin places. .............................................................. 82 Figure 4.27 : Effect of draft on thick places. ............................................................. 82
Figure 4.28 : Effect of draft on neps. ........................................................................ 82 Figure 4.29 : Effect of delivery speed on tenacity .................................................... 85 Figure 4.30 : Effect of delivery speed on breaking elongation. ................................ 85
Figure 4.31 : Effect of delivery speed on work to break. .......................................... 85 Figure 4.32 : Effect of delivery speed on hairiness. .................................................. 85
Figure 4.33 : Effect of delivery speed on yarn evenness. ......................................... 86 Figure 4.34 : Effect of delivery speed on thin places. ............................................... 86
Figure 4.35 : Effect of delivery speed on thick places. ............................................. 86 Figure 4.36 : Effect of delivery speed on neps. ......................................................... 86 Figure 5.1 : Wrapper fiber/core fiber ratio carded cotton vortex yarns by weight. .. 92
Figure 5.2 : a.Twisted yarn, b.Partially untwisted yarn, c.Untwisted yarn. .............. 92 Figure 5.3 : SEM images of carded vortex yarns in counts of 20-24-30 and 36 Ne. 93
Figure 5.4 : SEM images of carded vortex yarns in count of 40 Ne. ........................ 93 Figure 5.5 : SEM images of carded cotton vortex yarns in count of 45 Ne. ............. 94 Figure 5.6 : Structural classes in vortex spun yarns. ................................................. 95 Figure 5.8 : Effect of yarn count on class length in carded vortex yarns. ................. 98
Figure 5.9 : Measurement of wrapping angle in vortex spun yarn. .......................... 99
Figure 5.10 : Turns per meter of carded cotton vortex yarns. ................................. 101
Figure 5.11 : Tenacity of carded cotton vortex yarns. ............................................. 104 Figure 5.12 : Breaking elongation of carded cotton vortex yarns. .......................... 104 Figure 5.13 : Work to break of carded cotton vortex yarns..................................... 104 Figure 5.14 : Hairiness of carded cotton vortex yarns............................................. 104 Figure 5.15 : Yarn evenness of carded cotton vortex yarns. ................................... 105
Figure 5.16 : Thin places of carded cotton vortex yarns. ........................................ 105 Figure 5.17 : Thick places of carded cotton vortex. ................................................ 105 Figure 5.18 : Neps of carded cotton vortex yarns. .................................................. 105 Figure 5.19 : Percentage of yarn classes vs. yarn evenness for carded cotton vortex
yarns. .................................................................................................. 106
Figure 5.20 : Average class length vs. yarn evenness for carded cotton vortex yarns.
.............................................................................................................106
Figure 5.21 : Wrapper fiber/core fiber ratio by weight. .......................................... 113 Figure 5.22 : SEM images of carded yarns in different delivery speeds. ................ 113
xv
Figure 5.23 : SEM pictures of combed yarns in different delivery speeds. ............ 114 Figure 5.24 : SEM pictures of combed yarns. ......................................................... 115 Figure 5.25 : Effect of noil removal, delivery speed and yarn count on percentage of
structural classes. ............................................................................... 115 Figure 5.26 : Effect of noil removal, delivery speed and yarn count on average
length of structural classes. ................................................................ 117 Figure 5.27 : Turns per meter of carded and combed cotton vortex yarns. ............ 119 Figure 5.28 : Tenacity of carded and combed yarns. .............................................. 123 Figure 5.29 : Breaking elongation of carded and combed yarns. ........................... 123 Figure 5.30 : Work to break of carded and combed yarns. ..................................... 123
Figure 5.31 : Hairiness of carded and combed yarns. ............................................. 123 Figure 5.32 : Evenness of carded and combed yarns. ............................................. 124
Figure 5.33 : Thin places of carded and combed yarns. ......................................... 124
Figure 5.34 : Thick places of carded and combed yarns. ........................................ 124 Figure 5.35 : Neps of carded and combed yarns. .................................................... 124 Figure 5.36 : Twist of combed cotton vortex spun yarns........................................ 125 Figure 5.37 : Tenacity of combed cotton vortex yarns. .......................................... 126 Figure 5.38 : Breaking elongation of combed cotton vortex yarns. ........................ 126
Figure 5.39 : Work to break of combed cotton vortex yarns. ................................. 126 Figure 5.40 : Hairiness of combed cotton vortex yarns. ......................................... 126 Figure 5.41 : Evenness of combed cotton vortex yarns. ......................................... 127
Figure 5.42 : Thin places of combed cotton vortex yarns. ...................................... 127 Figure 5.43 : Thick places of combed cotton vortex yarns. .................................... 127
Figure 5.44 : Neps of combed cotton vortex yarns. ................................................ 127 Figure 5.45 : Percentage of yarn classes vs. yarn evenness for carded and combed
vortex yarns........................................................................................ 124 Figure 5.46 : Average class length vs. yarn evenness for carded and combed vortex
yarns. .................................................................................................. 124
Figure 5.47 : Tenacity results (Tensojet vs. Tensorapid). ....................................... 125 Figure 5.48 : Breaking elongation results (Tensojet vs. Tensorapid). .................... 127
Figure 5.49 : Work to break results (Tensojet vs. Tensorapid). .............................. 127 Figure 5.50 : Evenness of vortex spun yarns vs. ring and compact yarns. ............. 131 Figure 5.51 : Thin places of vortex spun yarns vs. ring and compact yarns. .......... 132 Figure 5.52 : Thick places of vortex spun yarns vs. ring and compact yarns. ........ 132
Figure 5.53 : Neps of vortex spun yarns vs. ring and compact yarns. .................... 133
Figure 5.54 : Tenacity of vortex spun yarns vs. ring and compact yarns. .............. 134
Figure 5.55 : Breaking elongation of vortex spun yarns vs. ring and compact yarns.
.............................................................................................................134 Figure 5.56 : Work to break of vortex spun yarns vs. ring and compact yarns. ..... 135 Figure 5.57 : Hairiness of vortex spun yarns vs. ring and compact yarns. ............. 135 Figure 5.58 : Comparison of the structures of ring and vortex yarns. .................... 136

xvi

xvii
AN APPROACH TO INVESTIGATE THE SPINNABILITY OF FINE COUNT
YARNS ON VORTEX SPINNING SYSTEM
SUMMARY
In this study, the possibilities of fine count yarn spinning on vortex spinning system
was investigated, and the factors influencing the fine count yarn spinning on the
system were identified in relation to yarn structural and physical properties.
For this purpose, experiments were carried out to compare the properties of ring,
open-end rotor and vortex spun yarns in three counts with special reference to
cellulosic fibers including cotton, viscose and 50/50 cotton-Modal® blend. Yarn
samples were converted into single jersey knitted fabrics to determine the physical
performances of yarns in knitted form. In this way, the position of vortex spun yarns
among ring and open-end rotor spun yarns was determined on the basis of yarn
physical properties and their performances on knitted fabrics.
In the following section, the experiments were conducted to examine the effects of
intermediate draft, total draft and yarn delivery speed on viscose vortex spun yarns in
order to identify the drafting conditions before proceeding to the investigation of
possibilities of extending vortex spinning to finer yarns and to estimate the spinning
limits.
The comparative investigation of yarn properties with a special reference to
cellulosic fibers revealed that the pure cotton vortex spun yarns are comparable to the
viscose and cotton- Modal® blended vortex spun yarns when overall yarn properties
are considered. The promising results regarding cotton vortex yarn led to the
investigation of possibilities of spinning fine count cotton vortex yarns. For
identifying the possibilities producing fine count cotton yarns on vortex spinning
system, 100% carded and combed cotton yarns in gradually increasing count were
produced. The factors affecting the fine count yarn spinning and the spinning limits
on vortex spinning system were determined on the basis of yarn structure and
properties by using linear regression technique.
The experimental research conducted for investigating fine count cotton yarn
spinning provided detailed understanding of yarn structure on the basis of yarn count.
The structure of vortex spun yarns depends on the yarn count and the process
conditions; and the changes in the yarn structure determine the yarn properties.
The ratio of wrapper fibers to core fibers is the most decisive structural parameter in
fine count yarn spinning in vortex spinning system. The decrease in the ratio of core
fibers in the yarn structure as the yarn becomes finer causes deterioration in yarn
properties in terms of yarn evenness and imperfections. Consequently, it seems that
there will be a limit of the ratio of wrapper fibers to core fibers for fine count
spinning in this system.

xviii
xix
VORTEX ĠPLĠK ÜRETĠM SĠSTEMĠNDE ĠNCE NUMARA ĠPLĠK
ÜRETĠLEBĠLĠRLĠĞĠNĠN ARAġTIRILMASI ĠÇĠN BĠR YAKLAġIM
ÖZET
Bu çalışma kapsamında, vortex iplik eğirme sisteminde ince iplik üretim olanakları
araştırılmış, sistemde ince iplik üretimini etkileyen faktörler ipliğin yapısı ve fiziksel
özellikleri ile bağlantılı olarak açıklanmıştır.
Bu amaçla, öncelikle pamuk, viskon ve 50/50 pamuk-Modal® karışımı olmak üzere
selülozik lifler kullanılarak üç farklı numarada üretilen ring, open-end rotor ve vortex
ipliklerin özellikleri karşılaştırmalı olarak incelenmiştir. Üretilen bu ipliklerin örme
kumaştaki performanslarının incelenmesi amacıyla sözkonusu ipliklerden süprem
kumaşlar üretilmiş ve bu kumaşların özellikleri de karşılaştırmalı olarak
incelenmiştir. Böylelikle vortex ipliğin ring ve rotor ipliklerine göre konumu, fiziksel
özellikleri ve örme kumaştaki performansına bağlı olarak belirlenmiştir.
Selülozik lifler kullanılarak üretilen iplik özelliklerinin karşılaştırmalı olarak
incelendiği çalışmanın sonucunda, iplik özellikleri bütün olarak ele alındığında 100%
pamuk ipliklerinin 100% viskon ve pamuk-Modal®
karışım iplikleri ile benzer
özelliklere sahip olduğu görülmüştür. Elde edilen bu sonuçlar ince numara vortex
pamuk ipliği eğirme olanaklarının araştırılmasına yol açmıştır. Bir sonraki aşamada,
vortex iplik üretim sisteminde ince iplik üretim olanakları ve eğrilebilirlik sınırının
incelendiği deneysel çalışmalarda kullanılacak olan çekim koşullarının belirlenmesi
için ara çekim, toplam çekim ve iplik üretim hızlarının viskon vortex iplik özellikleri
üzerindeki etkisi incelenmiştir.
Vortex iplik üretim sisteminde ince numara pamuk ipliği üretim olanaklarının
araştırılması amacıyla iplik kopuşları üretime olanak vermeyecek düzeye gelene
kadar kademeli olarak incelen karde ve penye pamuk iplikleri üretilmiştir. Sistemde
ince iplik üretimini etkileyen faktörleri ve sistemin eğrilebilirlik sınırını belirlemek
üzere ipliğin yapısı ve fiziksel özelliklerine bağlı olarak lineer regresyon tekniği ile
tahmin modelleri oluşturulmuştur.
İnce numara pamuk ipliği üretim olanaklarının araştırıldığı deneysel çalışma iplik
numarasına bağlı olarak iplik yapısının detaylı olarak anlaşılmasını sağlamıştır.
Vortex ipliğin yapısı iplik numarası ve proses koşulları ile ilişkilidir ve iplik
yapısında değişiklikler iplik özelliklerini belirlemektedir.
Vortex iplik üretim sisteminde ince numara iplik eğirmede sarım liflerinin merkez
liflerine oranı en belirleyici yapısal parametredir. İplik incedikçe merkez liflerinin
oranında görülen düşüş iplik düzgünsüzlüğü ve iplik hataları yönünden iplik
özelliklerinin kötüleşmesine neden olmaktadır. Sonuç olarak, sözkonusu sistemde
ince iplik üretimi için sarım liflerinin merkez liflerine oranına ilişkin bir limit değer
olacaktır.

1
1. INTRODUCTION
1.1 Introduction and Aim of the Thesis
The goal of short staple yarn manufacturing industry is to develop and produce value
added yarns with various features for high-end textile and apparel products so as to
compete in the global marketplace. Production of high quality and fine spun yarns
has been one of the important fields of interest due to the growing consumer
preference for lightweight fabrics particularly for sports and leisure wear, outerwear,
socks, lingerie, underwear and nightwear.
Developments that have been launched over recent years to satisfy consumer demand
for lightweight inner and outerwear items are recognized in three main areas as
manufacturing of finer fibers including microfibers, advances in modified and new
spinning systems and developments in weaving and knitting machines for enabling
the processing of fine count yarns [1].
Since it allows almost all fiber types to be spun into a wide range of yarn count and
provides an overall balance of quality aspects, ring spinning is the most widely used
technology in the world. Compact spinning is a modification to the ring spinning
process and through the better integration of fibers into the yarn structure; compact
spun yarns have significantly improved characteristics. These include better tensile
properties for the same twist level, lower hairiness and better yarn evenness, which
enable to obtain smoother fabric hand and appearance, lower pilling propensity in
end use, and lower fiber fly in fabric production. On the other hand, although
compact spinning provides higher productivity and efficiency during spinning and
downstream processes, the cost of compact spinning machines are higher than
conventional machines and the system consumes more energy since the fiber bundle
is generally condensed by air suction [2-5].
Another modified ring spinning process called siro spinning makes it possible to
produce “pseudo-plied” yarns with a smooth yarn surface, improved evenness and
low level of hairiness in a wide count range [6].
2
The most commonly accepted unconventional short staple yarn spinning technology
is the open-end rotor spinning. It is possible to produce yarns with better evenness,
lower hairiness and obtain improvement in the pilling behavior of fabrics with higher
production speeds in rotor spinning system when compared to ring spinning.
However, rotor spinning is limited to medium and coarse yarn counts [6].
In the early 1980s, air-jet spinning system was commercially launched. Unlike open-
end rotor spinning technology, medium and fine count yarns can be spun by using air
jet spinning at relatively high production rates. The system was initially capable of
spinning manmade fiber yarns, but later it was improved to spin cotton blended
yarns. The subsequent developments in air jet spinning technology have been mainly
focused to adapt the system to produce 100% cotton yarn. However, the acceptable
quality particularly in terms of the yarn strength has not been able to be achieved
even in the processing of combed cotton yarn, and the technology has been generally
used to produce polyester/cotton blended yarns [7-9].
The latest development in air jet spinning technology is the Murata Vortex Spinner
(MVS), which was firstly introduced at Osaka International Textile Machinery Show
OTEMAS ’97 by Murata Machinery Ltd. targeting the regular wear and casual
fashion markets. Besides the main characteristics of modern spinning technologies,
such as elimination of processing stages and ease of automation, distinctive features
of the system are claimed to be the capability of spinning 100% carded cotton yarn
and obtaining ring-like yarn structure at extremely high production speeds of up to
450 m/min. As well as low hairiness of vortex yarns, low pilling tendency and high
abrasion resistance, high moisture absorption capacity and fast drying characteristics
of the fabrics made from vortex spun yarns are emphasized as the outstanding
features of this novel principle by the machinery maker [10]. Based on the “Market
study of cotton yarn imports and determination of product-mix of the envisaged
plant” report prepared by Gherzi Textil Organisation AG, a Swiss based company
providing consultancy services, and released on October 2008, air-jet spinning
technology is in the embryonic stage, in other words in the ascent phase in the life
cycle curve for the spinning technologies, while ring and open-end rotor spinning
technologies have already reached to maturity stage as seen in Figure 1.1 [11]. This
means that the opportunities offered by the technology are still not completely
known; however the technology has proven itself and has potentials for the future.
3
Figure 1.1 : Lifecycle concept for spinning technologies [11].
According to the report, almost 60% of the worldwide spun yarn production is made
by using ring spinning technology, which has a broader range of application with
regard to yarn count when compared to open-end rotor and air-jet spinning systems.
Figure 1.2 demonstrates the global installed spindles, rotors and air-jet spinning units
with their total productions as of 2007.
Figure 1.2 : Spinning technology mapping by yarn counts (Mio in the figure stands
for million) [11].........
As an emerging system in yarn spinning, vortex spinning units have been installed in
many countries so far, and reached to the total spinning units of 42,720 by the year of
2008 as seen in Table 1.1. It was stated by Muratec Inc. that there are 1197 MVS
4
spinning machines (including all models) and 3500 MJS spinning machines in the
world as of June 2010 [12].
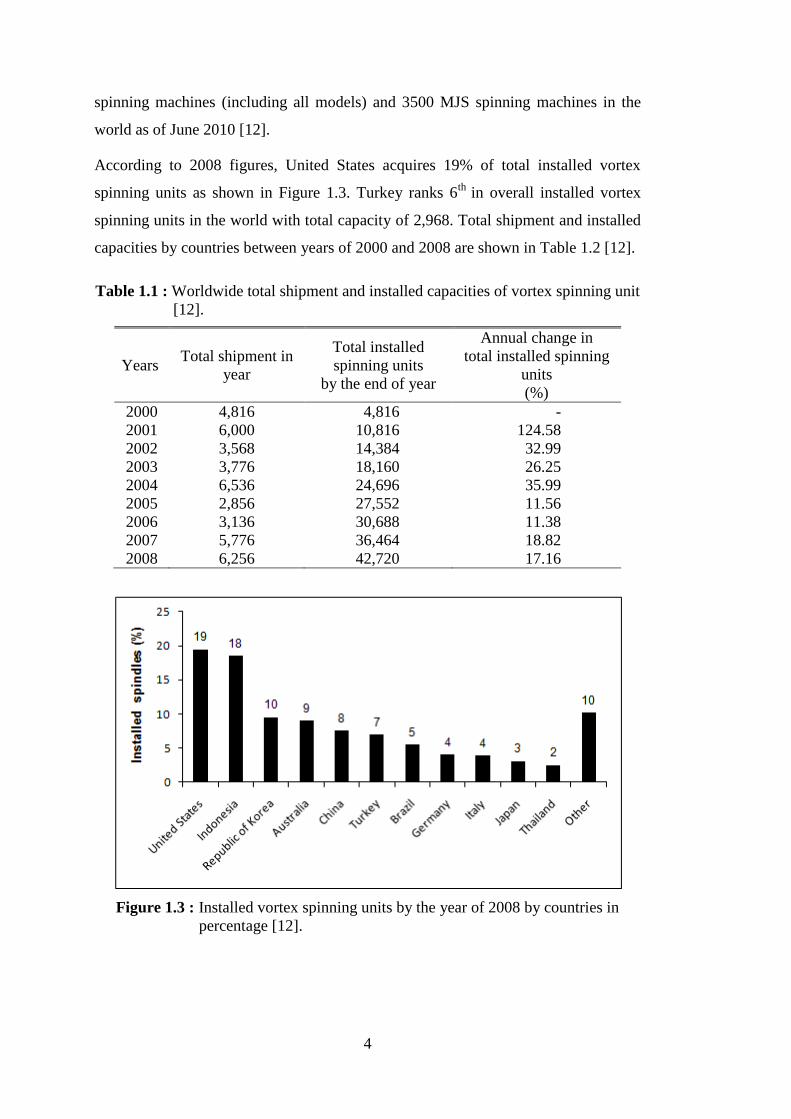
According to 2008 figures, United States acquires 19% of total installed vortex
spinning units as shown in Figure 1.3. Turkey ranks 6th
in overall installed vortex
spinning units in the world with total capacity of 2,968. Total shipment and installed
capacities by countries between years of 2000 and 2008 are shown in Table 1.2 [12].
Table 1.1 : Worldwide total shipment and installed capacities of vortex spinning unit
[12].
Years Total shipment in
year
Total installed
spinning units
by the end of year
Annual change in
total installed spinning
units
(%)
2000 4,816 4,816 -
2001 6,000 10,816 124.58
2002 3,568 14,384 32.99
2003 3,776 18,160 26.25
2004 6,536 24,696 35.99
2005 2,856 27,552 11.56
2006 3,136 30,688 11.38
2007 5,776 36,464 18.82
2008 6,256 42,720 17.16
Figure 1.3 : Installed vortex spinning units by the year of 2008 by countries in
percentage [12].
5
Table 1.2 : Total shipment and installed capacities of vortex spinning units by countries [12].
Country 2000 2001 2002 2003 2004 2005 2006 2007 2008
Total
Installed
Spinning Units
(number)
Total
Installed
Spinning Units
(%)
Argentina 80 80 80 240 0.56
Australia 64 1,440 232 1,152 80 240 640 3,848 9.01
Austria 160 320 160 640 1.50
Bangladesh 16 16 0.04
Brazil 216 288 216 320 240 160 904 2,344 5.49
China 720 576 880 1,040 3,216 7.53
Czech Republic 80 240 320 0.75
El Salvador 40 40 80 0.19
Germany 144 64 368 1040 104 1,720 4.03
Greece 80 240 320 0.75
Hong Kong 72 144 216 0.51
India 16 48 72 320 336 792 1.85
Indonesia 288 1,728 72 288 2,400 560 720 1,840 7,896 18.48
Italy 288 144 432 320 480 1,664 3.90
Japan 24 48 112 456 168 168 96 112 120 1,304 3.05
Malaysia 80 160 240 0.56
Mauritius 240 240 0.56
Mexico 64 216 280 0.66
Pakistan 72 72 0.17
Portugal 80 160 240 0.56
Republic of Korea 72 72 288 576 160 640 720 1,536 4,064 9.51
Spain 40 40 0.09
Taiwan 40 160 80 280 0.66
Thailand 128 72 144 232 80 320 80 1,056 2.47
Turkey 504 1,080 320 184 480 400 2,968 6.95
United States 3,584 2,232 776 648 824 80 80 80 8,304 19.44
Vietnam 320 320 0.75
Total Shipment 4,816 6,000 3,568 3,776 6,536 2,856 3,136 5,776 6,256 42,720 100.00
6
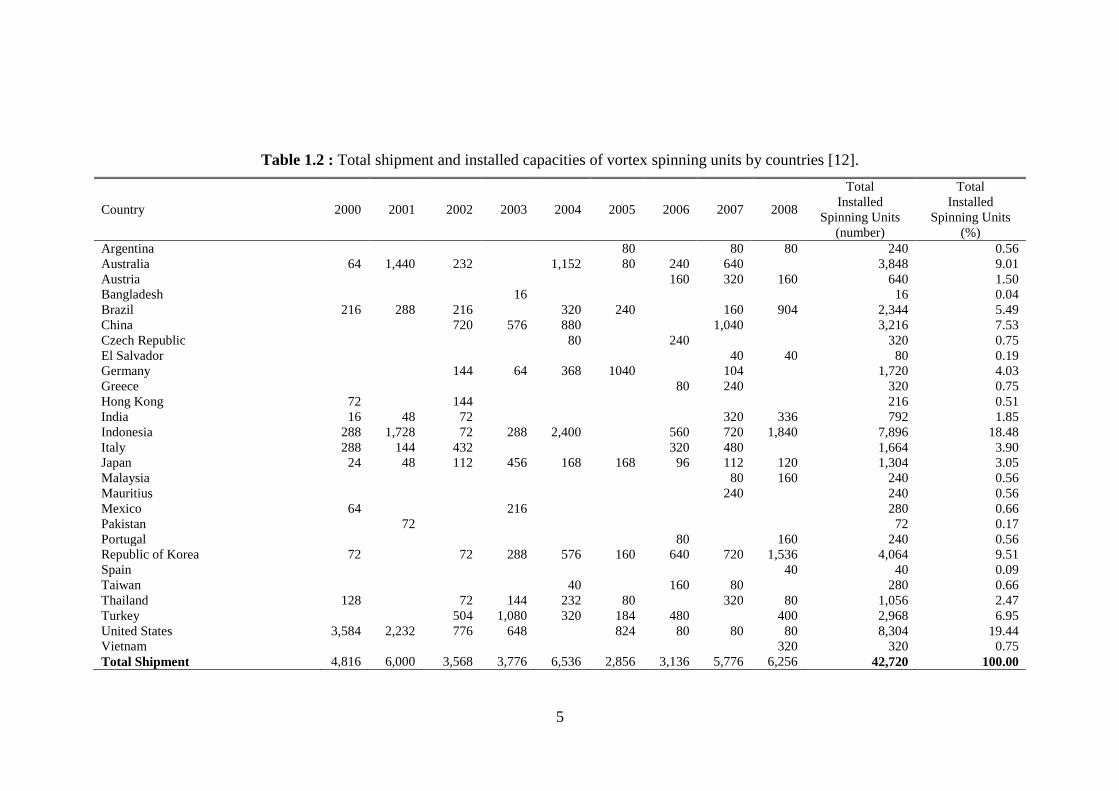
Since the twist is imparted by air flow in vortex spinning system, high speed rotating
mechanical parts are not required, and therefore considerably high production rates
can be achieved. The system is claimed to reach to the delivery speed of 450 m/min,
which means approximately 2 to 3 times higher productivity compared to rotor
spinning, and 20 to 30 times more productive than ring spinning depending on the
yarn count. The comparative productivity of the spinning systems was illustrated by
Murata Machinery Ltd. as seen in Figure 1.4 [10].
Figure 1.4 : Productivity of spinning technologies [10].
Ortlek et al compared the investment costs, raw material costs, power costs and labor
costs for 1 kg yarn produced on vortex, conventional ring and open-end rotor
spinning systems on the theoretical mill models that were sketched for producing 20
tons of 100% carded cotton yarns in count of 30 Ne per day. They found that
investment cost and labor cost for vortex spinning is higher than open-end rotor
spinning system but lower than ring spinning system. On the contrary to the
expectations, vortex spinning systems was found to be advantageous compared to
both ring and open-end rotor spinning systems in terms of energy cost, despite the
high pressure air consumption in vortex spinning. On the other hand, raw material
cost was stated to be higher for vortex spinning system than ring and open-end rotor
spinning systems, and it further increases when the material includes higher content
of short fiber [13].

7
When the above mentioned issues are taken into consideration, the vortex spinning
system appears to be the most promising and reasonable alternative to ring spinning
in fine count yarn spinning.
Production of high quality lightweight fabrics requires fine count yarns with good
evenness to ensure smooth fabric appearance, satisfactory tensile properties and low
hairiness as well as decreased propensity to generate fiber fly during fabric
production processes [1,14] .
The quality requirements of knitted fabrics are highly demanding especially in terms
of appearance and comfort. Air-jet spun yarns are mainly used to produce woven
fabrics such as tablecloths, bed sheets and covers, shirts, etc. On the other hand, the
use of air-jet spun yarns in knitting is limited due to the fact that the harsh fabric
hand is the major drawback associated with fabrics made from air-jet spun yarns
[6,7]. The investigation of the vortex spun yarn properties with a special focus on
knitted fabric may significantly contribute to the serviceability of the yarns in
knitting in practical applications.
Studies previously conducted on vortex spinning system mainly focused on the
investigation of the effects of various spinning parameters on the structure and
properties of vortex spun yarn. Furthermore, properties of vortex spun yarns and
other yarns spun on different systems as well as their performances mainly on knitted
fabrics have been compared by a few researchers so far. However, there are no
studies regarding the spinning limits of vortex spinning system available in the
literature.
The main objective of the research reported in this thesis is to identify the
possibilities of extending vortex spinning to finer yarns. This will include an
estimation of the spinning limits of the vortex spinning system when primarily using
cotton fibers. The estimation will be based on the yarn structure and properties and it
is hoped that this will result in suggestions for processing fine count yarns on the
system. A part of the yarn samples produced was also tested in knitted fabric form, to
explore the serviceability of the vortex spun yarns in knitting.

8

9
2. LITERATURE SURVEY
2.1 History of Air Jet Spinning
The use of high speed air flow in spinning initially appeared as a variation of open-
end spinning principle. In this system, the open end of the yarn is rotated by the air
vortex, in which the fibers are fed and brought into contact with the yarn end. While
the open yarn tail yarn rotates, the yarn is withdrawn by the rollers, and each
revolution of the yarn tail in the air vortex inserts a turn of twist into the yarn [15].
As a way of fasciated yarn production based on the false twist principle, where the
twist is imparted pneumatically, air jet spinning technology was firstly introduced by
DuPont in 1956 and included in a number of spinning methods. The methods
included applying false twist to the filaments and then heat setting or applying only
false twist to the filaments together with a certain amount of staple fibers. The latter
was found suitable for short staple spinning and the product obtained by using this
method was called “sheaf yarn”, which is shown in Figure 2.1. In this yarn, a part of
the staple fibers were tied firmly by the other part along the yarn length at random
intervals [7,16].
Figure 2.1 : Structure of sheaf yarn [16].
The following inventions of DuPont was based on drafting the filament tows and
breaking them into staple fiber form by stretching at the front roller nip point of the
drafting zone, and applying a torque to the fiber bundle via air vortex by the twisting
jet. This system was later modified for spinning natural staple fibers. In 1971,
DuPont developed a fasciated yarn made of staple fibers under “Nandel” trademark
and the process was patented as “Rotofil” process. Principle of Rotofil process was
similar to the previous system; however in this process, staple fiber bundle were
wrapped by the surface fibers [7].

10
Murata Machinery Ltd. from Japan has developed the most commercially successful
air jet spinning machines to date and continues to dominate the air jet spinning
technology in the world. The company introduced its first air jet spinning machine,
Murata Jet Spinner MJS 801, at American Textile Machinery Exhibition in 1982
(ATME ’82). The machine contains a 3-roll drafting system and is equipped with
two air jet nozzles that create air vortex rotating in opposite directions. In this
system, the second nozzle creates false twist on the fiber bundle coming out of the
front roller. Meanwhile, between the front roller and the first nozzle in which the air
vortex is created in the opposite direction, the twist is partially removed and some of
the edge fibers are separated from the fiber bundle and moves through the second
nozzle either in untwisted form or with a little twist. On the other hand, the core
fibers are guided in twisted form through second nozzle. The resulting structure
leaving the second nozzle is indicated to have untwisted core wrapped by edge fibers
that were twisted in the opposite direction to that of the upstream twist. The system is
stated to be suitable for processing manmade fibers and their blends with cotton,
however, it was not capable of spinning 100% cotton or rich blends of cotton yarn
[7].
Subsequently, Murata modified drafting systems and developed new nozzle designs
for better control of air flow not to disturb the arrangement of fiber bundle while
achieving higher delivery speeds. The new nozzle designs was also claimed to be
capable of spinning 100% cotton [7,17,18].
At International Textile Machinery Exhibition in 1983 (ITMA ’83), Toyoda and
Howa from Japan exhibited their air jet spinning systems, however; these two
systems had little commercial success [7].
Another Japan based manufacturer, Toray exhibited its first air jet spinning machine
AJS 101 at the American Textile Machinery Exhibition in 1985 (ATME ’85). The
system was suitable for short staple manmade fibers and their blends with cotton.
The machine was later improved so as to contain more automation and be able to
achieve higher speeds, but this also had no commercial impact [7,17,19].
In 1987, Spindlefabrik Suessen from Germany exhibited its system known as Spin
Assembly Winding at International Textile Machinery Exhibition (ITMA ’87) and
developed air jet spinning machines under the trademark of PLYfil Spin Assembly

11
Winders. Two variants of the system were developed for short staple and long staple
yarn manufacturing. In this system, two slivers of fibers are drafted simultaneously,
and the two yarns are spun in the same position and wound parallel on the same
package. In the following stage, two for one twister is used to obtain a plied yarn
[7,17].
The similar concept was introduced by Murata as Murata Twin Spinner in 1989 for
spinning two ply jet spun yarns by using both short and long staple fibers. Later,
Murata introduced Roller Jet Spinner RJS 804 at International Textile Machinery
Exhibition in 1995 (ITMA ’95) with the production speed of up to 400m/min. In this
system, a set of rubber coated balloon was used instead of second nozzle but it could
not achieve commercial success [7,19,20].
The latest concept in air jet spinning developed by Murata Machinery Ltd. is known
as vortex spinning system, which uses a modified single air nozzle, is claimed to be
capable of producing 100% carded cotton yarns and the yarn spun on this system has
a ring like appearance and higher tenacity due to higher number of wrapping fibers
when compared to previous air jet spinning systems [9,12,21,22].
The first vortex spinning machine MVS 810 was exhibited at Osaka International
Textile Machinery Show in 1997 (OTEMAS’ 97). The machine has a delivery speed
of up to 400 m/min. The modified version of this machine, MVS 81T was developed
to produce twin spun vortex yarns. The yarns spun on two spinning units passes
through the same yarn cleaning and waxing unit and they are wound on the same
package. They are twisted on two-for-one twister to obtained plied vortex yarn [23-
25]. Subsequently, Murata introduced MVS 851 spinning machine. Differently from
the previous machine, MVS 851 is not capable of spinning core yarns. Murata
exhibited its latest version of vortex spinning machine MVS 861 in 2003. This
version allows spinning core yarns and achieves higher delivery speeds, up to 450
m/min, while ensuring uniform winding tension with tension ruler and enabling
conical winding as well as less energy consumption [25,26].
Recently, Rieter from Switzerland introduced J 10 air-jet spinning machine at
International Textile Machinery Exhibition (ITM ’09) in Istanbul. The machine is
claimed to allow yarn delivery speeds of up to 450 m/min. and the yarn spun on this
machine is marketed under “ComforJet®” trademark [27].

12
The yarn spinning machine based on the innovative principle that uses air vortex
created in one nozzle block is named as vortex spinning machine by Murata
Machinery Ltd, whereas it is called as air-jet spinning machine by Rieter. However,
Rieter’s air-jet spinning machine is quite new, but Murata vortex spinning machine
dominates the market and in all experimental studies, including this thesis, conducted
for exploring this system, Murata Vortex Spinner was used, and the system referred
to as Murata vortex spinning, and the yarn produced on this system is also called
vortex spun yarn in the literature. Therefore, in this thesis, the system is referred to as
vortex spinning system and the yarn produced on this machine is also called vortex
spun yarn. In addition, the yarn produced on Murata Jet Spinner is called jet spun
yarns.
2.2 Vortex Spinning System
2.2.1 Principle of yarn formation mechanism
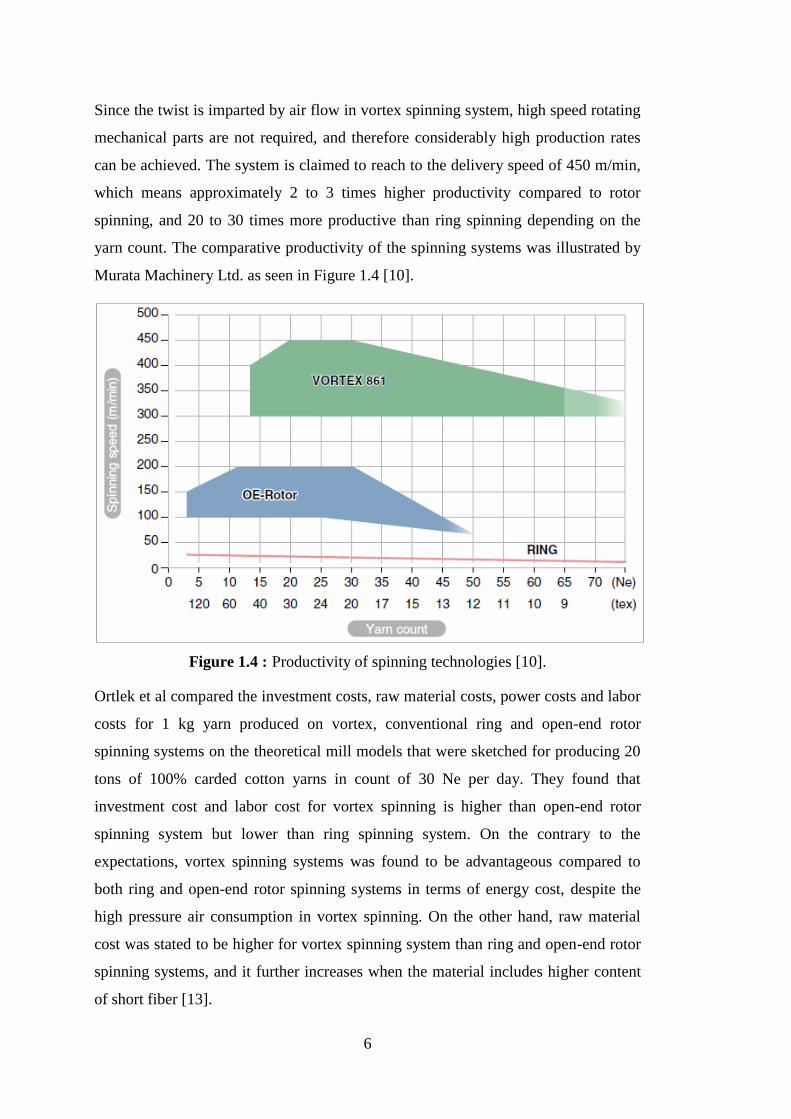
The spinning unit of Murata Vortex Spinner is shown in Figure 2.2 [26]. In the
Murata Vortex Spinner (MVS), a drawn sliver is fed to 4-line drafting system. The
drafted fibers then pass through a nozzle block provided with nozzles that induce
swirling air currents to twist the fiber bundle delivered from the drafting unit, and a
hollow spindle to be converted into a yarn. The finished yarn is wound onto a
package after its defects are removed by the yarn cleaner [21,28].
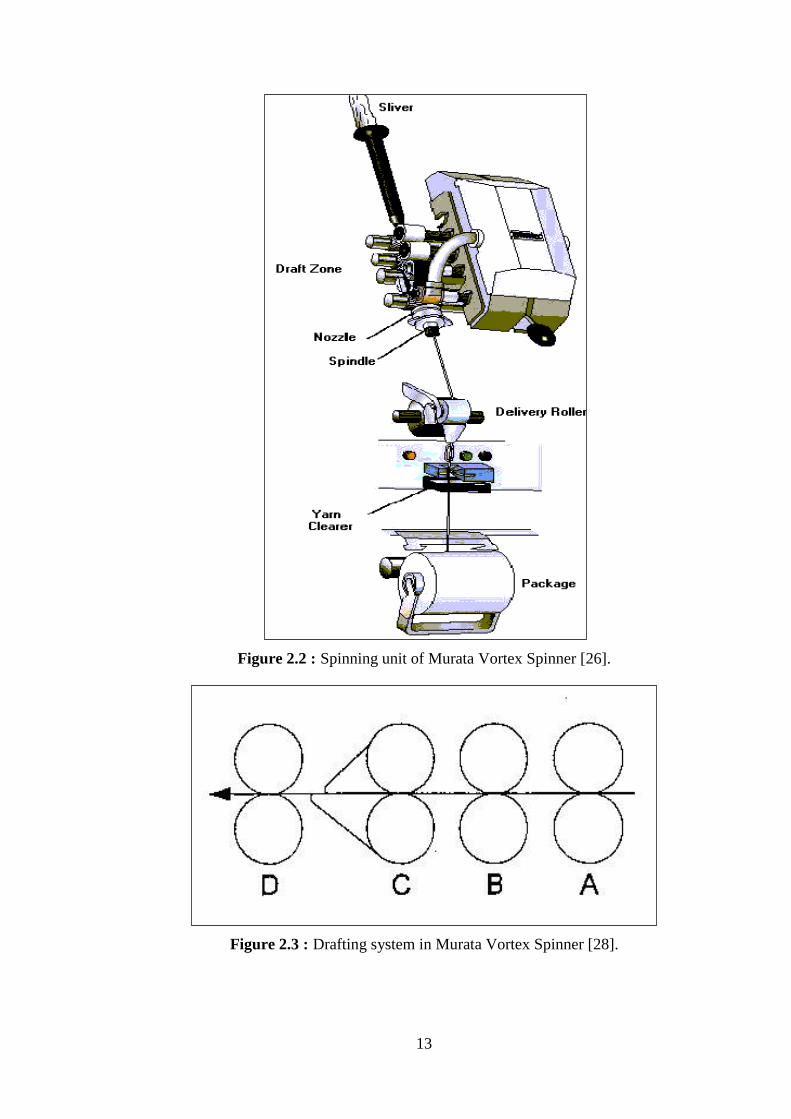
The 4-line drafting zone, which is illustrated in Figure 2.3, is made up of a set of
front rollers (D), middle rollers provided with control aprons (C) and two back
rollers (A and B) [28].
The spinning apparatus in Murata Vortex Spinner comprises a nozzle block having
nozzles for providing swirling air currents acting on fiber bundle delivered from the
drafting unit, a needle holder with a twisting guide surface which gently twists
around the longitudinal axis of the needle holder and a guide member, and a hollow
spindle through the inlet of which the guide member is projecting. A fiber bundle
passage is formed between the twisting guide surface of the needle holder and the
inner circumference of the nozzle block. The principle of vortex spinning and the
spinning apparatus with its components in Murata Vortex Spinner is illustrated in
Figures 2.4 and 2.5 [21].
13
Figure 2.2 : Spinning unit of Murata Vortex Spinner [26].
Figure 2.3 : Drafting system in Murata Vortex Spinner [28].
14
Figure 2.4 : Longitudinal sectional view of the spinning apparatus in Murata Vortex Spinner [21].
Nozzle
Yarn
passage
Nozzle block
Spindle
Twisting fiber
bundle passage Needle holder
Annular air
accumulating
chamber
Guide member Inlet of the
spindle

15
Figure 2.5 : Principle of vortex spinning [21].
When the fiber bundle leaves the front rollers of the drafting zone, they are sucked
into the fiber bundle passage through the air stream created by the nozzles. As the
cross sectional area of the fiber bundle passage gradually decreases, fibers are held
together more firmly as they move towards the needle-like guide member.
Subsequently, the fiber bundle is caused to turn around the guide member as it moves
towards the hollow spindle and it is twisted by the swirling air current provided by
the nozzles [21,29].
Figure 2.6 : Nozzle block [21].
This twisting motion tends to flow upwards toward the front rollers of the drafting
unit; however, the guide member protruding from fiber bundle passage prevents this
upward motion. Therefore, the upper parts of some fibers are kept open as they
Guide
member
Center hole
Needle
holder
Nozzle
block
Fiber
bundle
Fiber bundle
inlet

16
depart from the nip line of the front rollers. At this stage, while the leading ends of
considerably all of the component fibers of the fiber bundle are drawn into the
hollow spindle by the preceding portion of the fiber bundle being formed into the
yarn, trailing ends of some fibers that expose to the swirling air current are separated
from fiber bundle and thereby twine over the spindle as shown in Figure 2.7. They
are then caused to wrap around the core fibers to form like a real twisted spun yarn as
they are drawn into the spindle. The finished yarn is wound onto a package after its
defects are removed [20,21,28,29].
Figure 2.7 : Yarn formation in vortex spinning [29].
Pei and Yu discussed the principle of yarn formation mechanism in vortex spinning
system by developing a three-dimensional computational fluid dynamics (CFD)
model to simulate the airflow characteristics inside the air nozzle. They stated that a
negative pressure zone appears in the center of the twisting chamber causing two air
currents flowing into the twisting chamber through the nozzle inlet and the yarn
passage of the hollow spindle, respectively. While the air current flowing through the
nozzle inlet sucks the fiber strand delivered from the front rollers into the nozzle, the
air current flowing through the yarn passage of the hollow spindle gives a tension to
the trailing end of the yarn passing through the hollow spindle. The collision between
the mentioned two air currents causes a disturbance of the airflow and a reverse flow
and a vortex are formed. They help to separate fibers, which are exposed to the
airflow. As mentioned previously, the separated ends of the fibers are inverted at the
inlet of the spindle and rotate around the spindle and they helically wind around the
fiber strand while the leading ends of the fibers are joined with the preceding portion
spindle
needle
holder
17
of the strand and are subjected to helical twisting. On the other hand, the fibers with
both ends separated from the strand flow downstream and expel from the outlet of
the nozzle and become lost fibers. They concluded that the simulation results are
confirming the principle of yarn formation in vortex spinning system proposed by the
machinery maker [30].
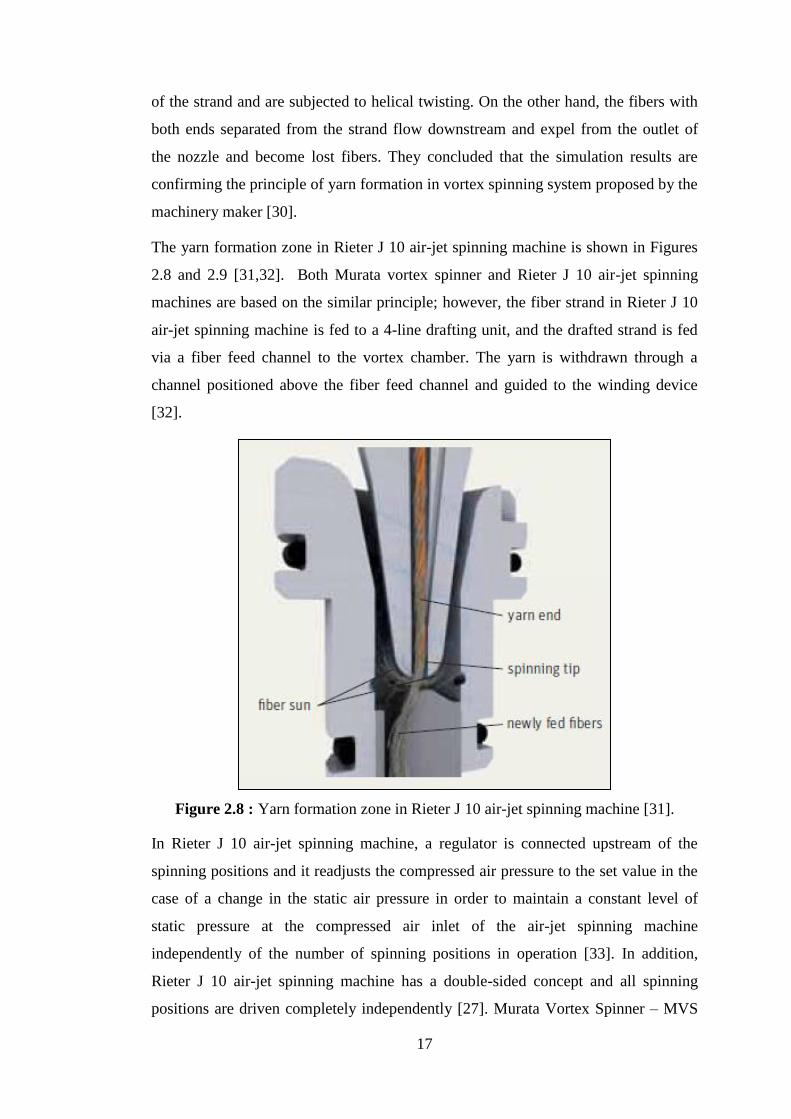
The yarn formation zone in Rieter J 10 air-jet spinning machine is shown in Figures
2.8 and 2.9 [31,32]. Both Murata vortex spinner and Rieter J 10 air-jet spinning
machines are based on the similar principle; however, the fiber strand in Rieter J 10
air-jet spinning machine is fed to a 4-line drafting unit, and the drafted strand is fed
via a fiber feed channel to the vortex chamber. The yarn is withdrawn through a
channel positioned above the fiber feed channel and guided to the winding device
[32].
Figure 2.8 : Yarn formation zone in Rieter J 10 air-jet spinning machine [31].
In Rieter J 10 air-jet spinning machine, a regulator is connected upstream of the
spinning positions and it readjusts the compressed air pressure to the set value in the
case of a change in the static air pressure in order to maintain a constant level of
static pressure at the compressed air inlet of the air-jet spinning machine
independently of the number of spinning positions in operation [33]. In addition,
Rieter J 10 air-jet spinning machine has a double-sided concept and all spinning
positions are driven completely independently [27]. Murata Vortex Spinner – MVS
18
861 and Rieter J 10 air-jet spinning machines are shown in Figures 2.10 and 2.11
respectively [12,27].
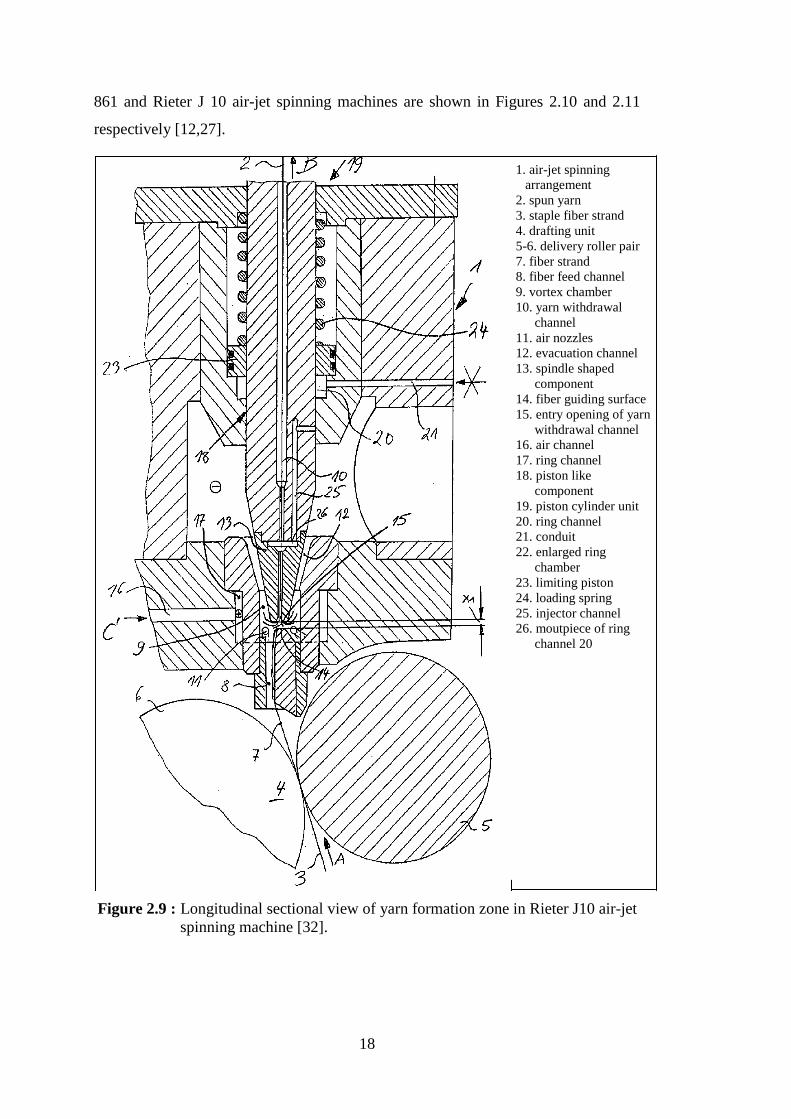
Figure 2.9 : Longitudinal sectional view of yarn formation zone in Rieter J10 air-jet
spinning machine [32].
1. air-jet spinning
arrangement
2. spun yarn
3. staple fiber strand
4. drafting unit
5-6. delivery roller pair
7. fiber strand
8. fiber feed channel
9. vortex chamber
10. yarn withdrawal
channel
11. air nozzles
12. evacuation channel
13. spindle shaped
component
14. fiber guiding surface
15. entry opening of yarn
withdrawal channel
16. air channel
17. ring channel
18. piston like
component
19. piston cylinder unit
20. ring channel
21. conduit
22. enlarged ring
chamber
23. limiting piston
24. loading spring
25. injector channel
26. moutpiece of ring
channel 20
19
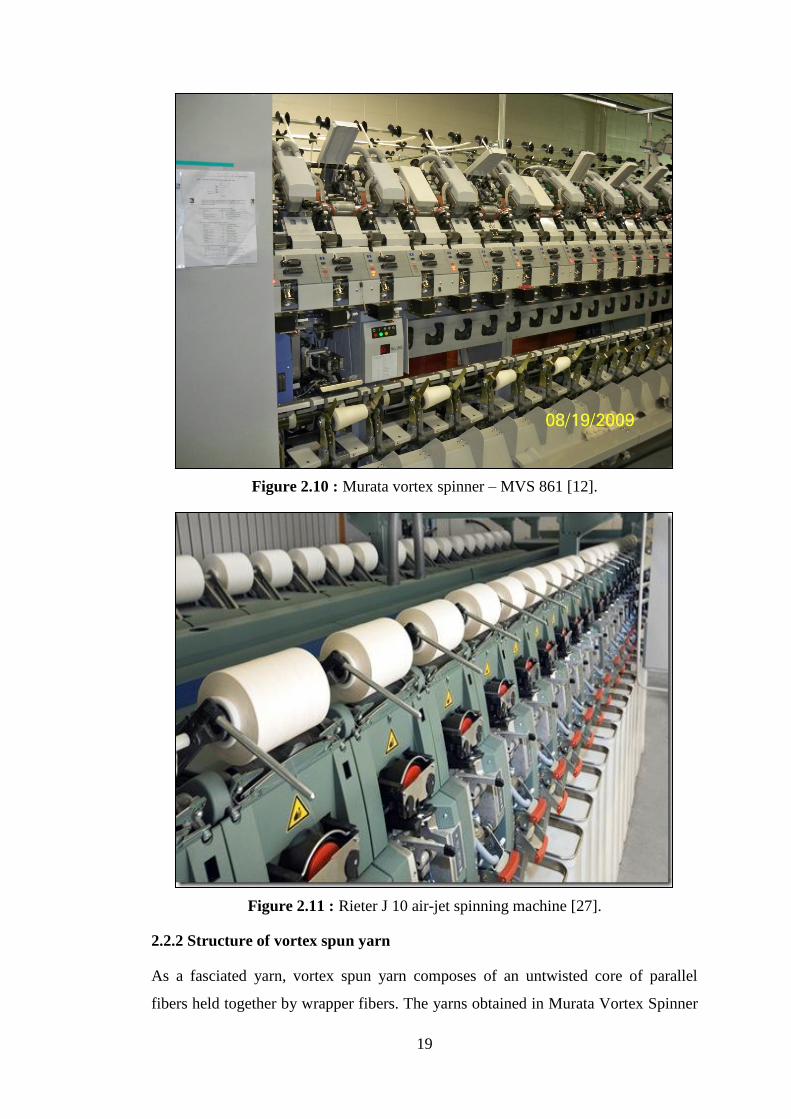
Figure 2.10 : Murata vortex spinner – MVS 861 [12].
Figure 2.11 : Rieter J 10 air-jet spinning machine [27].
2.2.2 Structure of vortex spun yarn
As a fasciated yarn, vortex spun yarn composes of an untwisted core of parallel
fibers held together by wrapper fibers. The yarns obtained in Murata Vortex Spinner
20
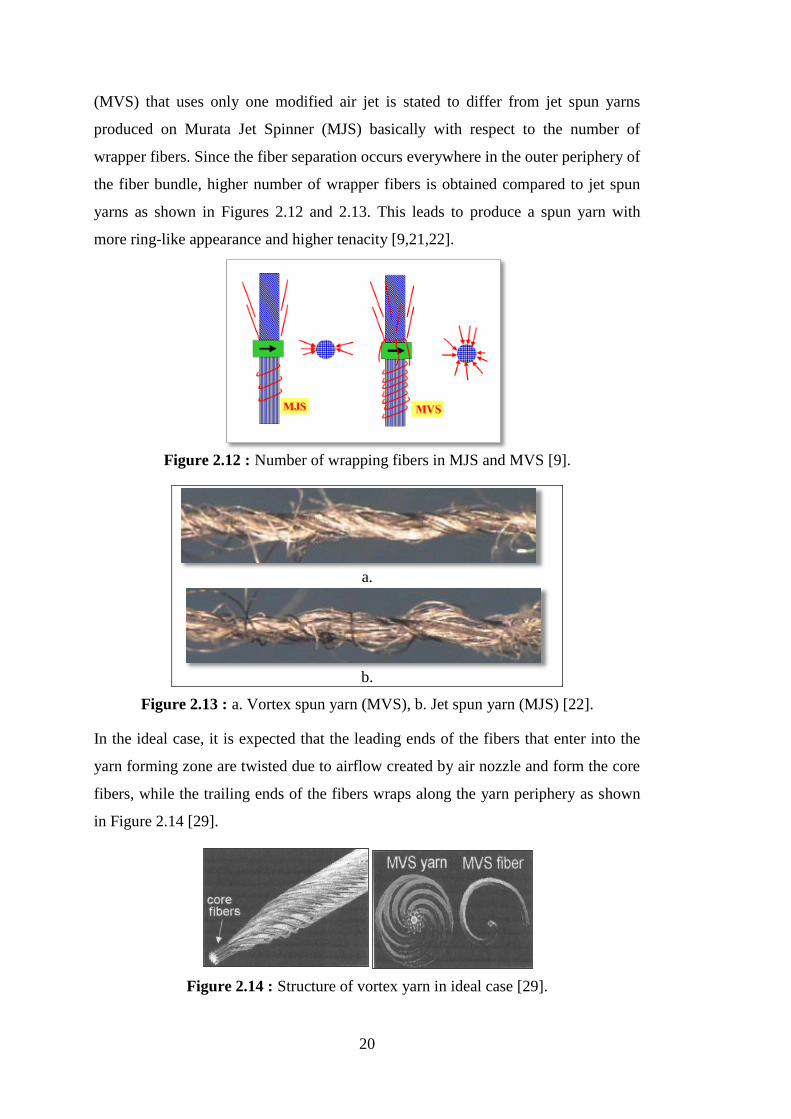
(MVS) that uses only one modified air jet is stated to differ from jet spun yarns
produced on Murata Jet Spinner (MJS) basically with respect to the number of
wrapper fibers. Since the fiber separation occurs everywhere in the outer periphery of
the fiber bundle, higher number of wrapper fibers is obtained compared to jet spun
yarns as shown in Figures 2.12 and 2.13. This leads to produce a spun yarn with
more ring-like appearance and higher tenacity [9,21,22].
Figure 2.12 : Number of wrapping fibers in MJS and MVS [9].
a.
b.
Figure 2.13 : a. Vortex spun yarn (MVS), b. Jet spun yarn (MJS) [22].
In the ideal case, it is expected that the leading ends of the fibers that enter into the
yarn forming zone are twisted due to airflow created by air nozzle and form the core
fibers, while the trailing ends of the fibers wraps along the yarn periphery as shown
in Figure 2.14 [29].
Figure 2.14 : Structure of vortex yarn in ideal case [29].
21
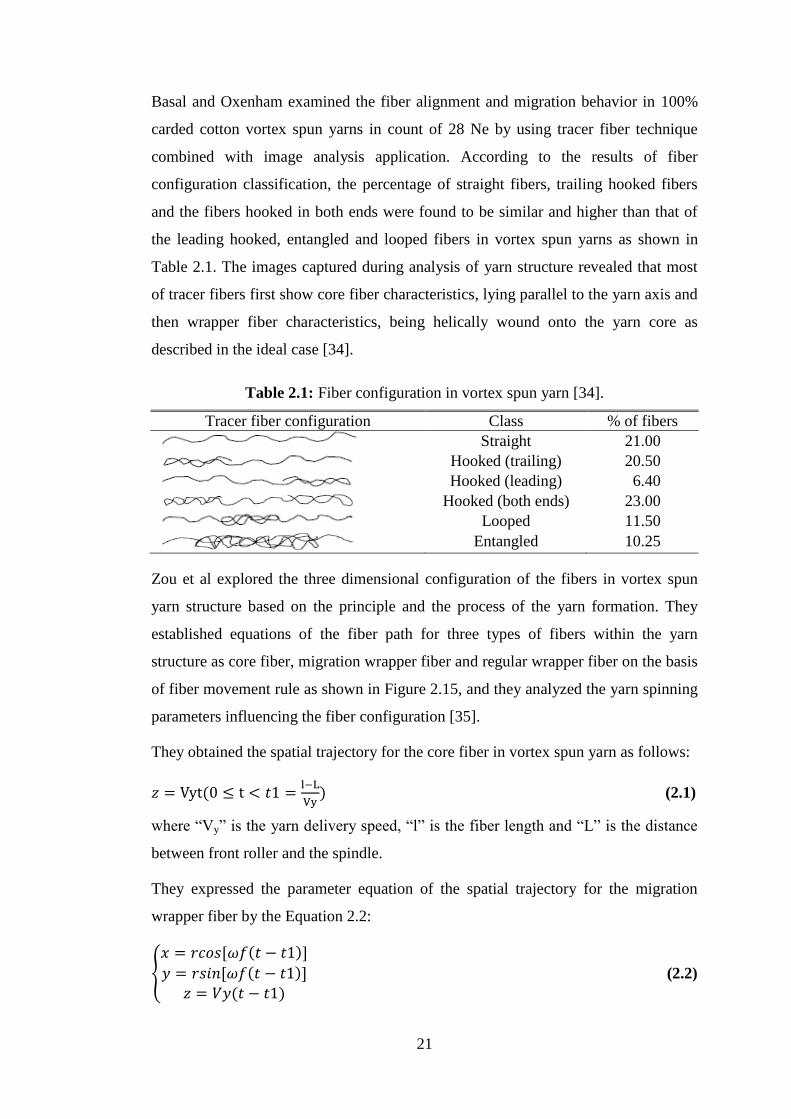
Basal and Oxenham examined the fiber alignment and migration behavior in 100%
carded cotton vortex spun yarns in count of 28 Ne by using tracer fiber technique
combined with image analysis application. According to the results of fiber
configuration classification, the percentage of straight fibers, trailing hooked fibers
and the fibers hooked in both ends were found to be similar and higher than that of
the leading hooked, entangled and looped fibers in vortex spun yarns as shown in
Table 2.1. The images captured during analysis of yarn structure revealed that most
of tracer fibers first show core fiber characteristics, lying parallel to the yarn axis and
then wrapper fiber characteristics, being helically wound onto the yarn core as
described in the ideal case [34].
Table 2.1: Fiber configuration in vortex spun yarn [34].
Tracer fiber configuration Class % of fibers
Straight 21.00
Hooked (trailing) 20.50
Hooked (leading) 6.40
Hooked (both ends) 23.00
Looped 11.50
Entangled 10.25
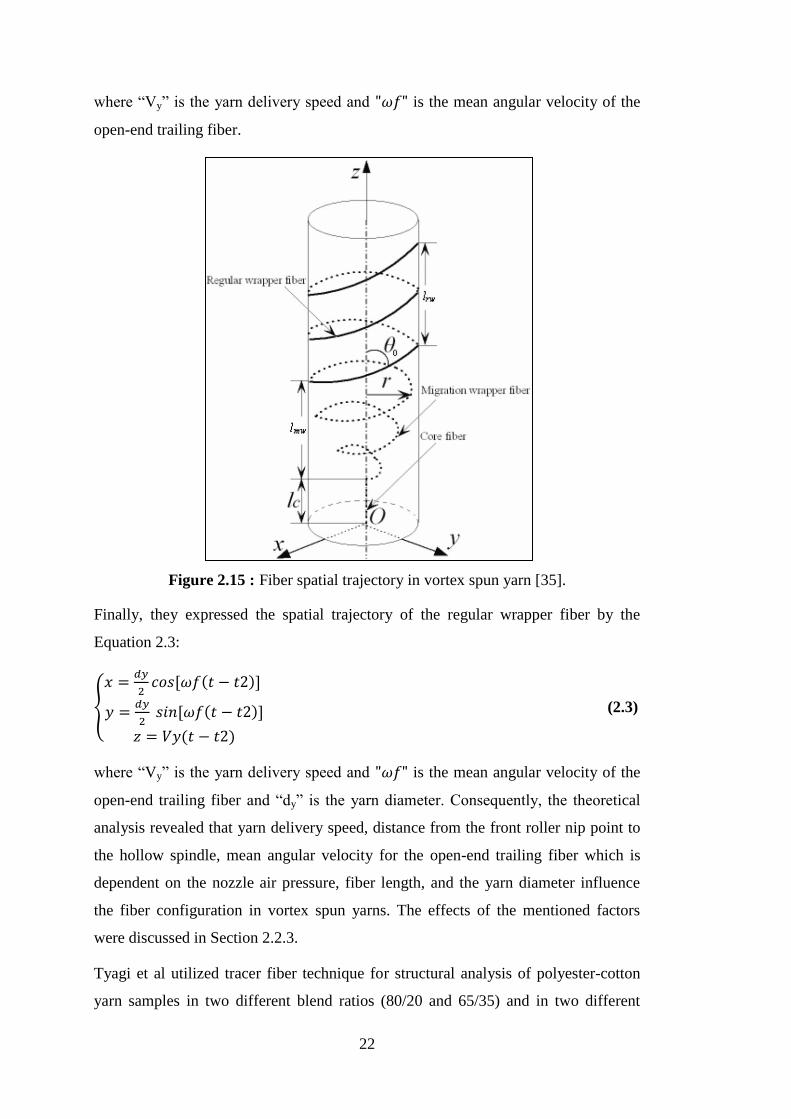
Zou et al explored the three dimensional configuration of the fibers in vortex spun
yarn structure based on the principle and the process of the yarn formation. They
established equations of the fiber path for three types of fibers within the yarn
structure as core fiber, migration wrapper fiber and regular wrapper fiber on the basis
of fiber movement rule as shown in Figure 2.15, and they analyzed the yarn spinning
parameters influencing the fiber configuration [35].
They obtained the spatial trajectory for the core fiber in vortex spun yarn as follows:
(2.1)
where “Vy” is the yarn delivery speed, “l” is the fiber length and “L” is the distance
between front roller and the spindle.
They expressed the parameter equation of the spatial trajectory for the migration
wrapper fiber by the Equation 2.2:
(2.2)
22
where “Vy” is the yarn delivery speed and is the mean angular velocity of the
open-end trailing fiber.
Figure 2.15 : Fiber spatial trajectory in vortex spun yarn [35].
Finally, they expressed the spatial trajectory of the regular wrapper fiber by the
Equation 2.3:
(2.3)
where “Vy” is the yarn delivery speed and is the mean angular velocity of the
open-end trailing fiber and “dy” is the yarn diameter. Consequently, the theoretical
analysis revealed that yarn delivery speed, distance from the front roller nip point to
the hollow spindle, mean angular velocity for the open-end trailing fiber which is
dependent on the nozzle air pressure, fiber length, and the yarn diameter influence
the fiber configuration in vortex spun yarns. The effects of the mentioned factors
were discussed in Section 2.2.3.
Tyagi et al utilized tracer fiber technique for structural analysis of polyester-cotton
yarn samples in two different blend ratios (80/20 and 65/35) and in two different
23
yarn counts as 30 Ne and 40 Ne. They studied the fiber configuration in vortex spun
yarns to classify the fiber types within the yarn, and the yarn structure [36].
They categorized the fibers into three types as core fibers, wrapper fibers and wild
fibers and observed that vortex spun yarns have about 50-60% core fibers and the
remaining is wrapper or wild fibers [36].
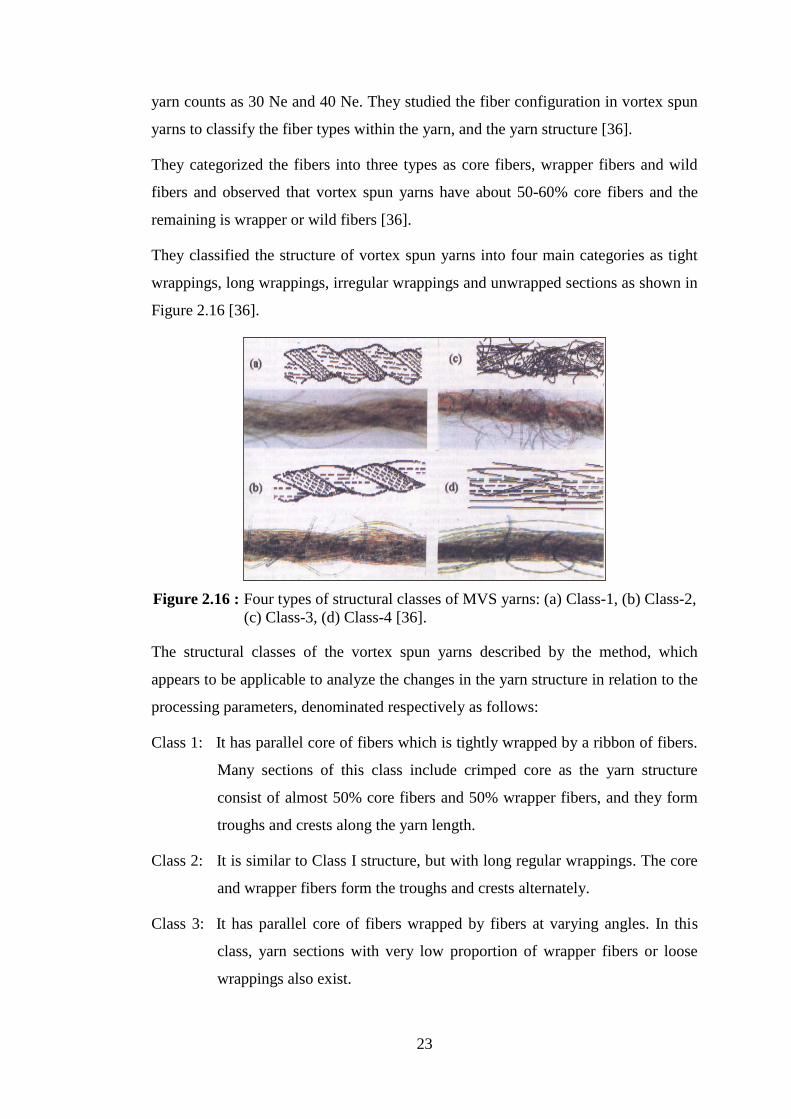
They classified the structure of vortex spun yarns into four main categories as tight
wrappings, long wrappings, irregular wrappings and unwrapped sections as shown in
Figure 2.16 [36].
Figure 2.16 : Four types of structural classes of MVS yarns: (a) Class-1, (b) Class-2,
. (c) Class-3, (d) Class-4 [36].
The structural classes of the vortex spun yarns described by the method, which
appears to be applicable to analyze the changes in the yarn structure in relation to the
processing parameters, denominated respectively as follows:
Class 1: It has parallel core of fibers which is tightly wrapped by a ribbon of fibers.
Many sections of this class include crimped core as the yarn structure
consist of almost 50% core fibers and 50% wrapper fibers, and they form
troughs and crests along the yarn length.
Class 2: It is similar to Class I structure, but with long regular wrappings. The core
and wrapper fibers form the troughs and crests alternately.
Class 3: It has parallel core of fibers wrapped by fibers at varying angles. In this
class, yarn sections with very low proportion of wrapper fibers or loose
wrappings also exist.
24
Class 4: It has no wrapper fibers. In this class, core fibers are generally untwisted
but yarn sections with some residual twist are observed.
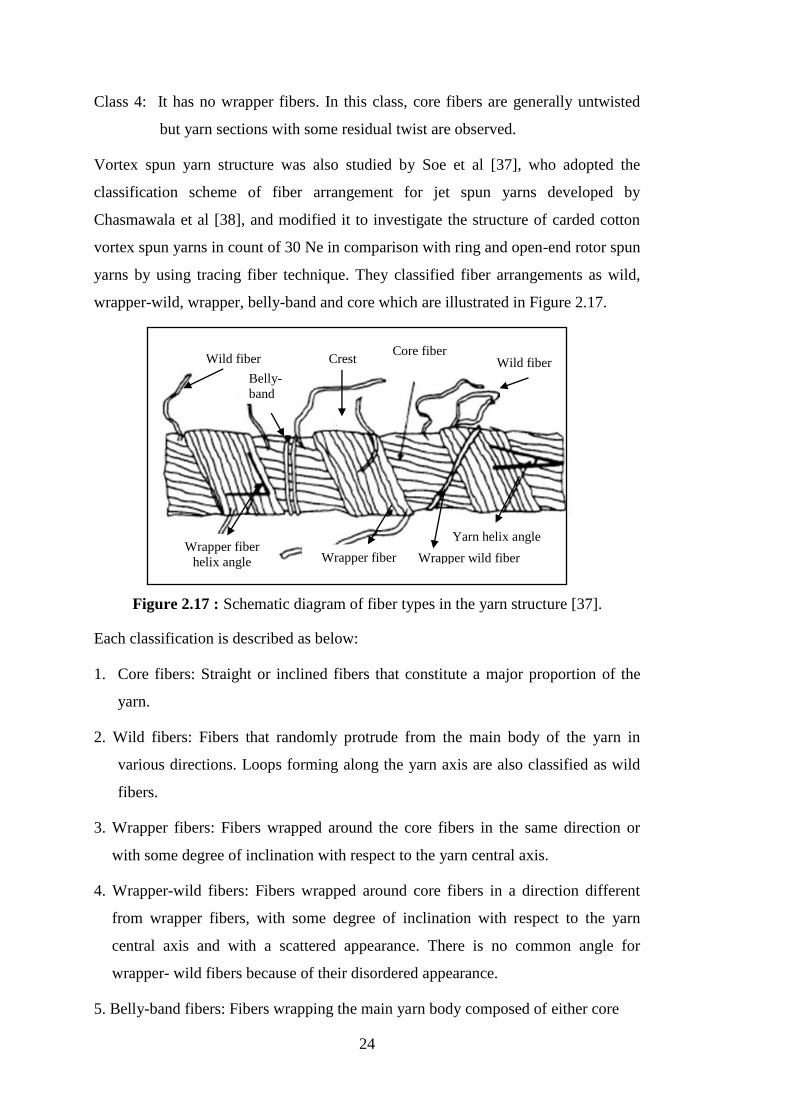
Vortex spun yarn structure was also studied by Soe et al [37], who adopted the
classification scheme of fiber arrangement for jet spun yarns developed by
Chasmawala et al [38], and modified it to investigate the structure of carded cotton
vortex spun yarns in count of 30 Ne in comparison with ring and open-end rotor spun
yarns by using tracing fiber technique. They classified fiber arrangements as wild,
wrapper-wild, wrapper, belly-band and core which are illustrated in Figure 2.17.
Figure 2.17 : Schematic diagram of fiber types in the yarn structure [37].
Each classification is described as below:
1. Core fibers: Straight or inclined fibers that constitute a major proportion of the
yarn.
2. Wild fibers: Fibers that randomly protrude from the main body of the yarn in
various directions. Loops forming along the yarn axis are also classified as wild
fibers.
3. Wrapper fibers: Fibers wrapped around the core fibers in the same direction or
with some degree of inclination with respect to the yarn central axis.
4. Wrapper-wild fibers: Fibers wrapped around core fibers in a direction different
from wrapper fibers, with some degree of inclination with respect to the yarn
central axis and with a scattered appearance. There is no common angle for
wrapper- wild fibers because of their disordered appearance.
5. Belly-band fibers: Fibers wrapping the main yarn body composed of either core
Wild fiber Crest Wild fiber Core fiber
Wrapper fiber
helix angle Wrapper wild fiber Wrapper fiber
Belly-
band
Yarn helix angle

25
fibers or core and wrapper fibers in the upright position with respect to the yarn
central axis.
They illustrated the idealized surface structures of these three types of yarns as
shown in Figure 2.18 [37].
Figure 2.18 : Schematic diagram of yarn structures [37].
Based on the visual analysis of the yarn structures, Soe et al. reported that the core
fibers in ring spun yarn are completely embedded in the yarn in a helical position,
with the diameter varying as the fibers move from the inner part to the outer part and
back within the yarn. While belly-bend fibers were observed to appear rarely,
wrapper fibers were not observed in ring spun yarn structure. Wrapper fibers, which
are the most noticeable characteristics of vortex spun yarn, were found to exist
periodically along the yarn length in vortex spun yarns, and hence they concluded
that vortex spun yarn has the highest proportion of wrapper fibers of the three yarn
types. The absence of twist in the core fibers of vortex spun yarn was also regarded
as significant. Moreover, most wild fibers in vortex yam were observed to protrude
from the wrapper fibers rather than the core because the core is encircled by the
wrapper fibers. Fibers in a loop formation along the yarn axis are categorized as wild
fibers in the vortex yarn structure. All designated fiber types were found in vortex
spun yarn, although the occurrence of belly-band fibers was very low. The number of
Wrapper
Fiber
helix
angle
α
Wrapper
fiber
Core
fiber
Yarn
helix
angle
α
Core
fiber
Core
fiber
Belly
band Yarn
helix
angle
α
Core
fiber
MVS yarn OE-rotor yarn Ring yarn
26
belly-band fibers was found to be highest in open-end rotor spun yarn, followed by
ring spun yarn [37].
As previously mentioned, the leading end of the fibers in vortex spun yarn structure
are considered to form the yarn core, while the trailing ends wrap around the core in
the ideal case [30]. However, the observations of the tracer fibers in vortex spun yarn
structure conducted by Soe et al indicated that only some of the core fibers become
wrapper fibers. These are the fibers, which of their trailing ends are spread out from
the fiber bundle and twisted into the sheath of the thin layer of wrapper fibers by
means of swirling air current. In order to estimate the number of wrapper fibers in
vortex spun yarn, they untwisted the yarn until reaching zero twist for wrapper fibers.
By separating the untwisted wrapper fibers from the twisted core fibers and counting,
they estimated the proportion of core fibers transformed into wrapper fibers and
found that 11% of the core fibers are transformed into wrapper fibers [37].
They also measured yarn helix angle and yarn diameter of three yarn types, and
wrapper fiber pitch, wrapper fiber crest width, wrapper fiber length for one-turn
twist, and wrapper fiber helix angle for vortex spun yarn. The yarn helix angles for
ring and open-end rotor spun yarns were measured as the inclination to the yarn axis
on each core fiber, while the wrapper fibers’ inclinations were measured as yarn
helix angle for vortex spun yarn. It was found that wrapper fiber parallelization in
vortex spun yarn is regarded as the same as the arrangement of core fibers in ring
spun yarn. It was found to be difficult to identify the fiber arrangements in open-end
rotor spun yarns as the outer surface layer of the yarn has a non-uniform appearance
in comparison to ring and vortex spun yarns. Using the value of wrapper fiber pitch,
wrapper fiber crest width, and wrapper fiber length for a one-turn twist, they
calculated the ratio of wrapping area made by the layer of wrapper fibers to the
surface area of the yarn for a one-turn twist as 0.57 for vortex spun yarn [37].
Kuppers et al visualized the vortex spinning process by using video and high speed
flash technology in order to understand the yarn formation mechanism and hence to
analyze the yarn structure. They found that depending on the yarn count,
approximately 75-85% of the fibers reach at the inlet of the hollow spindle, thus
forming the core fibers. The residual fibers, which accounts for 15-25% of total
fibers in the bundle, rotate around the hollow spindle and are wound as wrapper
fibers around the core fibers. However, when the SEM images of the untwisted yarn
27
for the comparable count captured by Basal are considered, wrapper fibers seem to
indicate a higher percentage [20]. It was also reported that the ratio of wrapper fibers
is almost 10% lower at yarn count of 16 Ne when compared to yarn count of 35 Ne.
In addition, they stated that the number of fibers in cross section vary with regard to
yarn count. Accordingly, the yarn composing cotton fiber with the fineness of 4.0
micronaire has about 100 fibers in cross section in yarn count of 35 Ne, while a yarn
in count of 16 Ne has 240 fibers [39].
As reported by Sukigara and Suzuki, who investigated the effect of structural
parameters on mechanical properties of viscose vortex spun yarns in count of 30 Ne,
48 to 53% of the yarn surface per unit length is covered with wrapped fibers, that is
almost in accordance with the findings of Soe et al [37,40].
2.2.3 The effects of processing parameters on the structure and properties of
vortex spun yarns
The spinning parameters and conditions that were proved to determine the structure,
mechanical and physical properties of vortex spun yarns can be listed as follows [34-
36,39,41-54]:
1. Nozzle air pressure
2. Yarn delivery speed
3. Distance between front roller nip point and the spindle
4. Nozzle angle
5. Spindle diameter
6. Spindle working period
7. Cone angle of the spindle
8. Spindle type (cross section)
9. Yarn count
10. Fiber composition
2.2.3.1 Nozzle air pressure
The theoretical and experimental studies on the effects of nozzle air pressure on
vortex spun yarns have shown that the nozzle air pressure directly influences the
fiber configuration and hence the yarn structure, which in turn affects the yarn
properties in vortex spinning system [20,34-36,41-49].
28
According to the numerical analysis of the flow field inside the nozzle block
conducted by Zou et al, increase in the nozzle air pressure results in an increase in
the velocity of the air flow at the exit of the jet orifice, then in turn an increase in the
axial, radial and tangential velocities inside the nozzle block [41].
Increasing the radial velocity inside the nozzle block is stated to enhance the
expanding effect on the fiber bundle that results in more open trail end fibers and
consequently more wrapper fibers are produced. In the meantime, increasing the
tangential velocity inside the nozzle block is expected to increase the efficiency of
twisting the open end of the fibers that form the wrapper fibers. On the other hand,
when the nozzle pressure is too high, the separated fibers are easily taken out of the
fiber bundle by the high speed airflow, which produces more wild fibers and causes
more fiber loss, and deteriorates the uniformity of the vortex spun yarn [41,42].
Tyagi et al observed that the increase in nozzle air pressure results in an increase in
tight wrappings, which were classified as Class 1 structure, while the long wrappings
(Class 2 structure) and the proportion of unwrapped sections (Class 4 structure)
decrease with the increase in nozzle air pressure. However, these structures were
observed to change into irregular wrappings (Class 3 structure) and wild fibers at
very high level of nozzle air pressure (i.e. 6 kgf/cm2) [36].
The influences of nozzle air pressure were also observed in fiber configuration in
vortex spun yarns. Basal found that the mean migration intensity, which is defined as
the rate of change in radial position of a fiber, in the yarns is higher at the higher
nozzle air pressure [20]. The theoretical analysis conducted by Zou et al revealed that
increase in nozzle air pressure causes an increase in the mean angular velocity of the
free (open) end of the fiber, and results in increasing twist received by the fiber
bundle and the fibers are integrated more tightly into the yarn structure due to the
fact that the wrapper fibers whirl around the yarn core with a greater force with the
increase in nozzle air pressure, and in turn, increasing the proportion of the tight
wrappings, as experimentally confirmed by Tyagi et al [36,41]. In addition, the width
of migration wrapper fiber and regular wrapper fiber shown in Figure 2.15 was stated
to decrease, while number of wrappings created by the regular wrapper fibers
increases along with the increase in mean angular velocity of the trailing end of the
fiber [35]. These results indicate that yarn diameter decreases and the yarn becomes
more compact due to an increase in the incidence of wrapper fibers and tight regular
29
wrappings, and consequently, the flexural rigidity of the yarn increases, in other
words, yarn becomes stiffer as the free movement of core fibers is prevented when
higher nozzle air pressure is used [34,42,44].
With regard to yarn hairiness, Tyagi et al stated that influences of increase in nozzle
air pressure on the structural classes of vortex spun yarns result in obtaining lower
hairiness up to a certain limit; however, hairiness increases due to the increase in
wild fibers at further increase in nozzle air pressure to the level of 6 kgf/cm2. On the
other hand, Ortlek and Ulku found that hairiness of 100% carded cotton vortex spun
yarns shows a decreasing trend with increased nozzle pressure as a result of better
wrapping due to the fact that the whirling force of the nozzle air stream increases
with the increasing nozzle air pressure [43,45,46]. On the basis of the study
conducted by Basal and Oxenham, it was revealed that higher nozzle air pressure and
the smaller spindle diameter result in lower hairiness. They also observed that
hairiness is lower at higher nozzle angle and higher nozzle air pressure, supporting
the belief that twist increases at higher nozzle angle and nozzle air pressure, and
fibers are integrated more tightly into the yarn structure [34].
According to Tyagi et al, despite the fact that the number of core fibers decreases
with the increase in nozzle air pressure, the increased tight wrappings and reduction
in proportion of unwrapped sections result in the improvement in tenacity; however,
it was found that tenacity decreases due to the significant change of tight regular
wrappings into irregular ones in addition to the increase in wild fibers at the nozzle
air pressure of 6 kgf/cm2, which is again in inconsistency with the results revealed by
Ortlek and Ulku, who observed a continuously increasing trend in tenacity along
with the increasing nozzle air pressure [43,45,46].
With regard to breaking elongation, Tyagi et al observed that the increased tight
wrappings with the increase in nozzle air pressure caused lower breaking elongation,
but the changes in the yarn structure with the further increase in the nozzle air
pressure caused an increase in breaking elongation [43]. On the other hand, Ortlek
and Ulku found that breaking elongation of vortex spun yarns increases with the
increase in nozzle air pressure [45]. In addition, Ortlek and Ulku observed that
breaking elongation of combed cotton vortex spun yarns is higher than that of their
carded counterparts and increase in breaking elongation as a result of increase in
nozzle air pressure is higher in combed cotton vortex spun yarns, which was
30
attributed to the higher length of wrapping in combed yarns composing of fibers with
higher mean length [46].
The studies on vortex spun yarns also revealed that yarn evenness and imperfections
are affected significantly by the nozzle air pressure. According to Tyagi et al and
Ortlek and Ulku, the yarn evenness deteriorates, and the number of thin places, thick
places and neps increase with the increase in nozzle air pressure, which is mainly
attributed to the increase in fiber loss at higher pressure [43,45]. Ortlek and Ulku also
reported that the effect of increase in nozzle air pressure with regard to yarn evenness
and the number of thin places was found to be higher in carded cotton vortex spun
yarns when compared to combed yarns. In addition, it is noteworthy to mention that
Ortlek and Ulku observed an increase in the number of thick places and neps with the
increase in nozzle air pressure in carded cotton yarns, while this trend was not clear
with regard to combed cotton vortex spun yarns, in particular for the number of thick
places. They concluded that these results can be attributed to the lower short fiber
content in combed slivers fed in the spinning zone, supporting the explanation that
higher nozzle air pressure results in an increase in fiber loss [46].
In order to explain the generation of thin places in vortex spun yarns that has been
generally attributed to the fiber loss by the researchers so far [43,45,46], Zou et al
carried out the force analysis of a separated fiber twined over the top outer surface of
the hollow spindle in the twisting chamber based on the attenuation low of flow field
inside the nozzle block in vortex spinning system. They determined the critical
angular velocity of the fiber with open trailing end that rotates around the hollow
spindle as a function of the fiber length located in the yarn core and the radius of the
area in which the fibers are situated. The critical angular velocity is regarded as a
measure of whether the leading end of the fiber is pulled out from the yarn tail or not,
which is indicated to be able to explain the generation of fiber loss and yarn thin
places. They commented that when the fiber length that locates into the vortex spun
yarn core increases or the radius decreases, higher critical angular velocity is needed
to pull out the core fiber from the vortex spun yarn tail, in other words, higher nozzle
air pressure is required, which results in greater fiber loss and more thin places [47].
As previously mentioned, increasing the nozzle air pressure can increase the velocity
of the swirling air current in the twisting chamber, and then increase the angular
velocity of the fiber with open trailing end, which can enhance the wrap intensity and

31
improve the vortex spun yarn tenacity. However, according to the force analysis
conducted by Zou et al, too large a nozzle air pressure causes angular velocity to
exceed beyond critical level, resulting in the core fiber being pulled out from the
vortex spun yarn and increasing the fiber loss and number of thin places. Therefore,
they claimed that increasing the nozzle air pressure first enhances the tenacity of the
vortex spun yarn, and then deteriorates the yarn quality, which agrees with the
experimental results of Tyagi et al [42,43]. In addition, when the trailing ends of
fibers leave the spiral fiber passage into the twisting chamber due to the negative
pressure, the leading length of the fibers embodied into the vortex spun yarn trail is
relatively shorter. Those fibers are easily disturbed by the swirling air current and
break away from the vortex spun yarn tail, ultimately causing fiber loss. They
concluded that when the negative pressure at the inlet of the twisting chamber is
high, the leading portions of the fibers more favorably enter the vortex spun yarn tail
and are infrequently affected by the swirling air current, which can reduce the fiber
loss [47].
As far as the low-stress characteristics of polyester-cotton vortex spun yarns are
concerned, Tyagi and Sharma reported that increase in nozzle air pressure leads to
improvement in structural integrity, increase in abrasion resistance, tensile energy,
tensile and compressional resilience of vortex spun yarns, however; they all
deteriorate at the nozzle air pressure level of 6 kgf/cm2. Furthermore, the
compressional energy of vortex spun yarns decreases when the nozzle air pressure
increases, but at the nozzle air pressure level of 6 kgf/cm2, the yarns require more
compressional energy due to the bulky and loose yarn structure caused by irregular
wrappings and wild fibers [44].
In the following two studies [48,49], Tyagi and Sharma investigated the low-stress
response and permeability, water vapor diffusion, wickability, absorbency and
thermal insulation of scoured and finished fabrics woven with polyester-cotton
vortex spun yarns produced by varying nozzle air pressure, nozzle distance and yarn
delivery speed. The plied vortex yarns in two different counts as 30/2 Ne and 40/2
Ne were used as weft yarns in production of twill woven fabrics. It was observed that
the compressional energy, shear energy and coefficient of friction of the fabrics
decrease initially when the nozzle air pressure increases. However, at nozzle air
pressure of 6 kgf/cm2, they all increase [48]. With regard to thermal comfort
32
characteristics, it was found that the air permeability and water vapor diffusion of the
scoured fabrics initially increase with the increase in nozzle air pressure, but then
decrease at the pressure of 6 kgf/cm2. On the other hand, wickability and thermal
insulation of these fabrics reveal a decrease initially with the increase in nozzle air
pressure and then decrease at air pressure level of 6 kgf/cm2 [49].
2.2.3.2 Yarn delivery speed
In vortex spinning system, yarn delivery speed enables to increase up to 450 m/min
in the latest version MVS 861. However, undesired results in terms of yarn quality
might be accomplished at high delivery speeds.
The yarn delivery speed determines the residence time of the fibers in the yarn
formation zone. The results obtained by Tyagi et al revealed that the decreasing
efficiency of the air flow at higher delivery speeds due to the reduced time for which
the fibers whirling over the hollow spindle results in an increase in the amount of
irregular wrappings (Class 3 structures), unwrapped sections (Class 4 structures), and
wild fibers, while reduction is observed in tight regular wrappings (Class 1
structures) and long wrappings (Class 2 structures). Such a kind of structural
worsening of vortex spun yarn was observed to result in deterioration of yarn
evenness and increase in the number of yarn imperfections [36,43]. According to the
theoretical analysis conducted by Zou et al, higher delivery speed increases the width
of migration wrapper fiber, and decrease the number of wrappings created by the
regular wrapper fibers [35]. Additionally, Basal and Oxenham observed that a
smaller yarn diameter is obtained in lower delivery speeds since the fiber bundle
being exposed to the whirling force for a longer period time receives more twist [34].
As a result of higher twist and more tight regular wrappings, it was found that
hairiness decreases as the yarn delivery speed decreases [34,43,45]. Moreover, all
values regarding tensile properties of vortex spun yarn decreases with increased
delivery speed [43,46].
As Tyagi et al, Ortlek and Ulku also observed that yarn evenness deteriorates and the
number of thin and thick places increases when a certain delivery speed is exceeded.
On the other hand, they found that the number of neps decreases as the delivery
speed increases [45]. According to Basal and Oxenham, lower yarn delivery speed
causes lower number of thick places [34].

33
It was reported by Tyagi and Sharma that increase in delivery speed deteriorates the
yarn structural integrity and leads to decrease in abrasion resistance of vortex spun
yarns possibly due to poor and improper wrappings formed at higher delivery speeds.
Furthermore, the increase in delivery speed reduces the yarn tensile energy and
tensile resilience, and leads to a decrease in yarn flexural rigidity [43,44].
According to Kuppers et al, maximum and optimum delivery speeds with regard to
yarn quality depend on the yarn count. They stated that while the maximum delivery
speed of 600 m/min is reached for a yarn count of 15 Ne, the optimum delivery speed
is 480 m/min for the same yarn count. On the other hand, maximum delivery speed is
350 m/min and optimum delivery speed is 300 m/min for yarn count of 50 Ne. They
also determined the stable spinning process by the ratio between the air speed in the
fiber guidance element and the yarn delivery speed depending on the yarn count.
They suggested that finer yarns require higher ratio, therefore delivery speed should
be reduced at constant air speed. The limiting ratio that determines the spinning limit
is stated to be between 12 and 19, and a further increase of the delivery speed can
only be reached by the increase of the air speed in the fiber suction element [39].
2.2.3.3 Distance between front roller nip point and the spindle:
The distance between the front roller nip point and the spindle in vortex spinning
system, which is illustrated as “L” in Figure 2.19, was found to have impact on the
amount of the fiber loss and the number of wrapping fibers [28,29,35,36,41-43,47].
Figure 2.19 : Yarn formation zone in vortex spinning [29].
Zou et al reported that the fiber length and the distance between the front roller nip
point and the inlet of the hollow spindle has a significant impact on the length of
fiber situated in the yarn core. The core fiber length increases along with the

34
increasing fiber length and shorter distance between the front roller nip point and the
spindle. If this distance increases, the length of the fiber embodied into the vortex
spun yarn tail is expected to decrease so does the critical angular velocity of the fiber
with open trailing end that was mentioned before [35,47].
Therefore, the leading ends of the fibers are more easily pulled out from the vortex
spun yarn tail, which results in increased fiber loss and more thin places in yarn.
Also, weak control for the separated fiber results in enhancing the probability of
producing fiber loss. As a result, decreasing the distance between the front roller
nippoint and the inlet of the hollow spindle is stated to reduce the fiber loss rate and
decrease the number of thin places generated [35,47].
Moreover, Zou et al stated that increase in “L” distance results in an increase of
negative pressure at the inlet of the nozzle block, which allows the drafted fiber
bundle to successfully enter the twisting chamber. On the other hand, while increase
in “L” distance increases the number of open trail end fibers it causes a decrease in
the tangential velocity inside the nozzle block, which results in weakening the
twisting effect of open-trail-end fibers. Furthermore, the fiber bundle entering into
the twisting chamber can be easily disturbed by high speed air flow when the “L”
distance is excessive [41,42].
It is also claimed by Murata Machinery Ltd. that the short front roller to the spindle
distance leads to better fiber control resulting in less fiber waste. In this case, more
even yarns with fewer imperfections and lower hairiness are obtained. On the other
hand, when this distance is short, both ends of fibers are tightly assembled, resulting
in fewer fibers with open trailing ends. This, in turn, results in a yarn consisting of
mostly parallel core fibers held with fewer wrapper fibers, as in the case of jet spun
yarns [28,29].
The effect of the nozzle distance was observed experimentally by Tyagi et al, who
reported that increase in nozzle distance causes an increase in long regular wrappings
(Class 2 structures) and number of wrapper fibers due to increase in the amount of
fibers with open-end configuration, while decrease in tight regular wrappings (Class
1 structures) and unwrapped sections (Class 4 structures), and the resultant yarn is
more hairy with longer hairs. A reduction in yarn tenacity is also observed at very
high nozzle distance. The interaction of nozzle air pressure and the nozzle distance
35
also influences the yarn structure in such a way that with the increase both in nozzle
air pressure and nozzle distance, more wrapper fibers are generated causing the
reduction in the ratio of core fibers [36,43].
According to Basal and Oxenham, the interaction of the high nozzle air pressure, low
yarn delivery speed and short front roller to spindle distance gives the highest mean
migration intensity values, which is the rate of change in radial position of a fiber
[34].
Tyagi and Sharma observed that wider nozzle distance offer considerable advantages
in respect of structural integrity, abrasion resistance, tensile energy and tensile
resilience on account of the increase in long regular wrappings and decreased in
unwrapped sections. Moreover, the yarn diameter decreases, the yarn becomes more
rigid and compact making it difficult to compress due to aforesaid reasons [43,44].
According to Tyagi and Sharma, the fabrics woven from the yarn spun with a short
nozzle distance exhibit higher compressional energy. Furthermore, the coefficient of
friction of vortex yarn fabrics decreases with the increase in nozzle distance. The
wider nozzle distance obviously has the most favorable effect on the shear energy of
vortex yarn fabrics, which was attributed to the long regular wrappings and hence a
relatively more compact yarn structure [48].
With regard to thermal comfort characteristics, Tyagi and Sharma reported that the
air permeability of vortex yarn fabrics shows a marked increase with the increase in
nozzle distance. As the nozzle distance increases, both yarn diameter and hairiness
reduce due to the increased long regular wrappings, and the air permeability of the
fabrics is accordingly affected. Furthermore, wider nozzle distance results in higher
water vapor diffusion, lower wickability and lower thermal insulation [49].
2.2.3.4 Nozzle angle
According to Zou et al, the changes in nozzle angle values result in variations in the
tangential, axial and radial velocities of the airflow inside the nozzle block. Based on
the numerical computation and analysis on the air flow field inside the nozzle block,
they claimed that a decreasing nozzle angle increases tangential velocity, which
twists open trail end fibers expanded by the radial velocity and enhances the yarn
strength. In addition, the negative pressure, which allows the fiber bundle to
successfully enter the inlet of the hollow spindle when it is higher, first increases and
36
then diminishes with an increasing nozzle angle [41]. On the other hand, according to
Basal and Oxenham, a high nozzle angle leads to higher tangential velocity, and in
turn higher twist; however, it has not any effect on yarn tensile properties [34].
Basal and Oxenham also reported that the nozzle angle has effects on yarn evenness
and hairiness. Higher nozzle angle results in more even and less hairy yarns. They
also observed that the interaction of a high nozzle angle and short front roller to
spindle distance leads to better evenness. Hairiness values, on the other hand, are low
at high nozzle angle and high nozzle air pressure due to increase in twist. With
regard to fiber configuration within the yarn, they stated that the mean migration
intensity and equivalent migration frequency increase at high nozzle angle and low
yarn delivery speed [34].
2.2.3.5 Spindle diameter
The studies on vortex spun yarns have revealed that the spindle diameter used in
vortex spinning mainly determines the tightness of wrappings on vortex spun yarn. A
smaller spindle diameter gives less freedom to the fiber bundle to expand as it enters
the spindle. This generates higher friction between fibers and leads to tighter
wrappings, higher twist, and in turn, denser yarns with less hair. With a spindle of
larger diameter, the fiber bundle has more freedom to move inside the spindle,
therefore some twist is lost and wrappings become looser; therefore yarn becomes
bulky and more hairy [34,50].
According to Ortlek et al, a decrease in spindle diameter from 1.3 mm to 1.2 mm
resulted in a significant deterioration in the yarn evenness since the fibers have more
freedom to arrange themselves with a larger spindle diameter. Moreover, relatively
lower friction occurring between fibers with larger spindle diameter results in lower
yarn tenacity [50].
2.2.3.6 Spindle working period
Ortlek et al investigated the effect of five levels of spindle working period as 0,1,2,3
and 4 months on the properties of 100% viscose vortex spun yarns. The results
revealed that increase in the spindle working period results in a significant
deterioration in yarn evenness and increase in Uster® hairiness index (H) due to
worsening effect of spindle wear on yarn formation as the working period gets
longer. Moreover, the tenacity, breaking elongation and work to break values of
vortex spun yarns produced with a spindle that has a 4 month working period are
37
significantly lower than those of yarns produced with spindles which have less
working periods. It was observed that spindle wear mainly occurs in the tip zone and
the inner surface of the spindle, and after a 4-month working period, the negative
effects of spindle wear becomes more critical with respect to the evenness, hairiness,
and tensile properties of vortex spun yarns [50].
2.2.3.7 Cone angle of the spindle
Guo et al investigated the effect of cone angle of the hollow spindle on vortex spun
yarn properties by simulating the airflow patterns inside the nozzles with three
different cone angles as 8°, 12° and 16°. The simulation results showed that counter
rotating vortex pair (CVP) over the spindle, high supersonic zone in the inlet of the
swirling chamber, and the distribution of wall shear stress (WSS) along the outer
wall of the spindle caused by variation of the cone angle of the spindle, are
significantly related to fluid flow and hence to properties of vortex spun yarns. They
concluded that small cone angle, i.e 8°, is unsuitable to spin staple fiber yarn as
larger and higher supersonic zone and lower wall shear stress (WSS) can lead to high
fiber loss rate and insufficient twisting of the yarn. On the other hand, big cone angle
of the spindle does not ensure the sufficient twisting of the yarn for fibers with higher
flexural rigidity and longer peripheral length due to large eccentric counter rotating
vortex pair (CVP) and high oscillation wall shear stress (WSS). Conforming the
simulation results, experiments verified that the yarns spun by using cone angle of
12° have the highest tenacity and better evenness values due to high velocity and
suitable supersonic zone [51].
2.2.3.8 Spindle type
The study carried out by Johnson using three different types of spindles as round
spindles with diameters of 1.3 mm and 1.4 mm, and a flat spindle with the diameter
of 1.4 mm to spin 100% cotton vortex spun yarns with varying nozzle air pressure
and yarn delivery speed showed that hairiness is the highest at the highest delivery
speed with the flat spindle. The yarn that was spun at the same condition is also
bulkier; on the other hand, yarn evenness and imperfections are affected negatively.
It was also observed that spindle type affects the tensile properties of vortex spun
yarns. Yarn tenacity, breaking elongation and work to break values are lower when
spindle with flat cross section is used [52].
38
2.2.3.9 Yarn count
As experienced in all types spun yarns produced in different systems, yarn evenness
and the number of imperfections in vortex spun yarns are influenced negatively as
the yarn becomes finer due to decrease in the number of fibers in the yarn cross
section [43,45].
Leitner et al from Rieter Machine Works Ltd. and Lenzing AG compared the
processing characteristics of Tencel®
LF- cotton blends on conventional ring,
compact, open-end rotor and Rieter air-jet spinning machine, and also reported that
with increasingly fine yarn counts, yarn irregularity values deteriorate in vortex spun
yarns as in all other spinning processes [31].
Tensile properties of vortex spun yarns also vary with regard to yarn count. Although
Murata Machinery Ltd. claims that the yarn tenacity improves as the yarn becomes
finer, the results of the studies carried out by both Tyagi et al and Ortlek and Ulku
revealed that coarser vortex spun yarns possess higher tenacity, breaking elongation
and work to break values than the finer ones. Tyagi et al attributed this behavior to
the fact that only about 50-60% of the fibers are core fibers which are bound by
sufficient number of wrapper fiber. Therefore, as the finer yarns contain more
proportion of wrapper fibers (or less proportion of load bearing fibers, namely core
fibers), they have lower tenacity in comparison to the coarser ones [9,43,45]. The
results of the experiments conducted by Leitner et al also confirm that coarser yarns
have higher tenacity and breaking elongation. In addition, they stated that there are
minor changes in tenacity and breaking elongation values of fine count vortex spun
yarns which is expected to make downstream processing of fine count yarns possible
without any difficulty [31].
The tenacity of jet spun yarns is mainly affected by the wrapping length of the edge
fibers in the fiber bundle, which is independent of the total number of fibers in the
bundle, and as the yarn becomes coarser, wrapping length of the wrapper fibers and
hence the tenacity declines [9]; whereas, it can be concluded that the tenacity of
vortex spun yarns is dependent on the ratio of wrapper and core fibers, which differs
in respect of yarn count. On the other hand, according to Kuppers et al, optimal
values in terms of fiber substance utilization in vortex spinning process and yarn
tenacity are obtained in yarn count range of 24-38 Ne. They stated that there is a
decrease in yarn tenacity both with fine and coarse yarns [39].

39
According to Tyagi and Sharma, the coarser polyester-cotton vortex yarns exhibit
higher rigidity, higher abrasion resistance, and higher tensile energy and require
more energy to compress. The fabrics woven from coarse vortex spun yarns display
higher bending rigidity, coefficient of friction, compressional and shear energies.
With regard to thermal properties, it was found that fabrics woven from coarse yarns
having higher cotton content have better absorbency and wickability, and the fabrics
composed of finer yarns have lower thermal insulation as less air is kept in the fabric
[44,48,49].
With regard to the hairiness, Ortlek and Ulku observed an increase in S3 values with
finer yarn count; however, this trend was not clear for the Uster® hairiness index (H)
[45]. On the other hand, Leitner et al found that finer yarns have lower Uster
hairiness index (H) [31].
2.2.3.10 Fiber composition
Basal and Oxenham compared the properties of vortex and jet spun yarns made from
various polyester-cotton blends, and examined the yarn structure under optical
microscope. Visual comparison of vortex and jet spun yarns showed that there is not
an apparent tendency of cotton or polyester fibers to become either wrapper or core
fibers in blended yarns [22].
According to Tyagi et al, the percentage of each fiber type in polyester-cotton
blended vortex spun yarns has impacts on various yarn and fabric properties. Yarns
with higher proportion of cotton fiber are less even and have higher number of
imperfections. Moreover, the yarns with higher proportion of cotton content are more
hairy on account of the higher bending and torsional rigidity of cotton fiber, and
flexural rigidity and abrasion resistance is considerably higher in yarns with higher
polyester content [43,44]. In addition, the air permeability of the fabrics woven from
vortex spun yarns was found to decrease when cotton content of the yarn increases,
since higher cotton content results in larger yarn diameter and more hairiness; on the
other hand, it was also reported by Tyagi et al that the fabrics with higher polyester
content exhibit higher water vapor diffusion [43,49].
Kilic and Okur, who investigated the properties of cotton-Tencel® and cotton-
ProModal® blended yarns in count of 30 Ne spun in conventional ring, compact and
vortex spinning systems, found that the increasing ratio of regenerated cellulosic
fiber content causes an increase on hairiness values of vortex spun yarns. They
40
attributed this behavior to the increasing length of wrapper fibers associated with the
increasing mean fiber length. However, this explanation conflicts with the results,
since the increasing wrapping length restrains fiber ends protruding from the yarn
body. The increasing ratio of regenerated cellulosic fiber also resulted in better
evenness and a decrease in the number thin places, thick places and neps. However,
irregularity and the number of thin places and thick places increased again
unexpectedly in 100% ProModal® vortex spun yarns. With regard to tensile
properties, it was observed that the increasing ratio of regenerated cellulosic fiber
content in the yarn structure causes an increase in tenacity and breaking elongation
values, and it was explained by the increasing fiber length, fiber length uniformity
and number of fibers in the yarn cross section depending on the fiber fineness. For
roughness and roundness of the yarns, they stated that the increasing ratio of
regenerated cellulosic fiber content causes a decrease on roughness and an increase
on roundness [53].
Confirming the results obtained by Kilic and Okur, Leitner et al found that knitted
fabrics with a higher Tencel® content of 67% display higher yarn tenacity and
correspondingly higher bursting strength in the fabric compared to knitted fabrics
made from a 50/50 Tencel®
-cotton blend. On the other hand, they observed higher
pilling propensity in the fabrics knitted from the yarns with higher Tencel® content
[31].
The results of the survey conducted by Gordon at CSIRO (Australian
Commonwealth Scientific and Research Organization) showed that moisture
conditions in storage and heat conditions in ginning especially with respect to fiber
moisture and drying temperature significantly affect the cotton fiber properties and
therefore yarn quality. He concluded that dry seed cotton and hot air in the ginning
lead to high short fiber content, shorter staple length, increased neps and reduced
fiber strength. These effects result in greater fiber loss during spinning, lower yarn
tenacity, and poorer yarn evenness, higher number of imperfections, higher hairiness
and lower spinning efficiency. However, he commented that increasing neps level in
the fiber did not translate into higher yarn imperfections, because neps are removed
at the twist insertion point during spinning. He added that the cotton fiber stored
under ambient conditions and treated with standard heat performed worst in terms of
almost all yarn properties, and the results revealed that the cotton fiber stored in
41
higher moisture and treated with less heat in ginning performed better in terms of
less fiber loss, yarn quality and spinning efficiency [54].
2.2.4 Properties of vortex spun yarns in comparison with jet, conventional ring,
compact and open-end rotor spun yarns
2.2.4.1 Yarn hairiness, bulk and rigidity
The most outstanding feature of vortex spun yarns is claimed as the low hairiness in
comparison to other yarns spun on different systems [10,31]. According to Basal and
Oxenham, vortex spun yarns have lower hairiness compared to jet spun yarns [22].
When compared to conventional ring, compact ring and open-end rotor spinning
systems, the yarns spun on vortex spinning system were also observed to exhibit
lower hairiness due to the uniformly distributed layer of wrapper fibers [37,53,55-
58].
As far as the yarn bulk and stiffness is concerned, Soe et al reported that vortex spun
yarn is bulkier and stiffer than ring and open-end rotor spun yarns. Due to the
untwisted core fibers, bending rigidity of vortex spun yarn is also higher than ring
and open-end rotor spun yarns. Moreover, the bulkiness and higher resistance of
wrapper fibers make vortex spun yarns less compressible [37]. According to Kilic
and Okur, the diameter of vortex spun yarn is generally higher and the density is
lower when compared to those of compact spun yarns for 100% cotton, 100%
regenerated cellulosic fibers and their blends [53].
Leitner et al also concluded that lower yarn hairiness in vortex spun yarns resulted in
lower yarn abrasion [31].
2.2.4.2 Yarn evenness and imperfections
The comparative studies on different spinning systems generally revealed that more
even yarns are obtained in vortex spinning system when compared to jet spinning
and open-end rotor spinning systems; however, vortex spun yarns are worse than
conventional and compact ring spun yarns in terms of yarn evenness [22,31,53,55-
58]. On the other hand, Soe et al found no significant difference between the
evenness values of vortex, ring and open-end rotor spun yarns [37].
The number of thin places in yarns produced by using vortex spinning system was
reported to be in the similar manner as in the case of yarn evenness. It was concluded
in earlier studies that the number of thin places in vortex spun yarns is lower than

42
that of open-end rotor spun yarns and higher than that of conventional and compact
ring spun yarns [53,55-58]. These results are again in inconsistency with the findings
of Soe et al, who concluded that there is not a significant difference between the
number of thin places measured on vortex, ring and open-end rotor spun yarns [37].
In terms of the number of thick places and neps, the results obtained in earlier studies
are not consistent. According to the Rameshkumar et al, vortex spun yarns behave in
the similar manner in terms of thick places and neps as in the case of yarn evenness
and the number of thin places; in other words, better than open-end rotor spun yarns
and worse than ring spun yarns [56]. On the other hand, while Ortlek and Ulku, and
Soe et al commented that a higher frequency of thick places and neps is observed in
100% cotton vortex spun yarns when compared to ring and open-end rotor spun
yarns, Beceren and Nergis found that the number of thick places in 100% cotton
vortex spun yarns is lower, and the number of neps is higher when compared to
conventional ring and compact ring yarns. On the other hand, Ortlek and Onal
reported that the number of thick places in 100% viscose vortex yarn is lower than
open-end rotor and compact ring spun yarns, and the lowest neps is observed in
vortex spun yarns [37,55,57,58]. According to Kilic and Okur, the number of thick
places is higher in vortex spun yarns than that of conventional ring and compact spun
yarns for cotton, ProModal® and Tencel
® and their blends with cotton. However,
they did not find any significant difference in terms of neps [53].
In addition, Basal and Oxenham observed that vortex spun yarns have fewer thick
places than jet spun yarns, while they found no significant difference between jet
spun yarns and vortex spun yarns with regard to number of thin places and neps [22].
2.2.4.3 Tensile properties
On the basis of the study conducted by Basal and Oxenham, vortex spun yarns
exhibit higher tenacity values than jet spun yarns for every blend ratio of cotton and
polyester except for 100% polyester where yarns spun on both systems have the
same tenacity. As the cotton content increases in the blend, the difference between
the tenacity values of the yarns also increases. With regard to breaking elongation,
they observed that vortex spun yarns have lower breaking elongation, and this
compensates the gains in tenacity and results in insignificant differences in their
work to break values. The higher tenacity of vortex spun yarns was attributed to the
higher number of wrapper fibers compared to jet spun yarns by the researchers. The
43
number of wrapper fibers was stated to be critical for yarn tenacity since they hold
the internal parallel fiber bundle tightly together, and this effect was stated to be
more critical for cotton fibers. According to the researchers, edge fibers ultimately
produce wrapper fibers in jet spinning, and therefore the number of wrapper fibers
depends on the fibers at the outside. However, in vortex spinning system, the fiber
separation from the bundle occurs everywhere in the outer periphery of the bundle,
and therefore higher number of wrapper fibers is obtained in vortex spun yarns. The
lower breaking elongation of vortex spun yarns was attributed to decrease in fiber
slippage due to better grip by wrapper fibers. The drop in hairiness of vortex spun
yarns is declared as the another result of better wrapping, as mentioned before [22].
It was reported by Ortlek and Ulku that the tenacity of vortex spun yarns is almost
equal to 85% of the tenacity of ring spun yarns, while the tenacity of open-end rotor
spun yarns is around 75% of the tenacity of ring spun yarns [55]. Soe et al found that
these figures are 66% and 61%, and Rameshkumar et al found 95% and 84%,
respectively [37,56]. The results of the studies conducted by Ortlek and Onal,
Beceren and Nergis, and Leitner et al also revealed that the tenacity of vortex spun
yarns is lower than conventional and compact ring spun yarns, and higher than that
of open-end rotor spun yarns [31,57,58]. Kilic and Okur confirmed that breaking
force of vortex yarns is lower than that of conventional ring and compact spun yarns
[53].
The breaking elongation values of the spun yarns obtained by different systems also
varies due to their unique structures. Although the breaking elongation of vortex
spun yarns is expected to be lower due to the presence of wrapper fibers that prevent
fiber slippage, it was found to be higher than conventional ring, compact and open-
end rotor spun yarns in some of the studies [55,58]. Leitner et al reported that vortex
spun yarns display good yarn elongation values equivalent to those of ring spun
yarns [31]. However, on the contrary to these findings, Ortlek and Onal commented
that breaking elongation of viscose vortex spun yarns is lower than that of
conventional and compact ring spun yarns and higher than that of open-end rotor
spun yarns [57]. Kilic and Okur also confirmed the lower breaking elongation of
vortex spun yarns when compared to the yarns spun on conventional ring and
compact spinning systems [53]. On the other hand, Rameshkumar et al reported that
44
vortex spun yarns have higher breaking elongation than ring spun yarns but lower
than that of open-end rotor spun yarns [56].
2.2.5 Properties of fabrics made from vortex spun yarns in comparison with
conventional ring, compact and open-end rotor spun yarns
2.2.5.1 Fabric strength
Ortlek and Onal compared the performances of 100% viscose vortex, conventional
ring, compact and open-end rotor spun yarns in knitted fabrics. The results revealed
that the lowest bursting strength is obtained from the fabrics knitted from open-end
rotor spun yarns in both undyed and dyed forms; whereas, the fabric knitted from
ring spun yarns has the highest bursting strength in undyed condition and the fabric
knitted from compact ring spun yarns has the highest bursting strength in dyed
condition. These results are in consistency with tenacity of the related yarns, where
compact and conventional ring spun yarns have higher tenacity respectively when
compared to vortex spun yarns since most of the fibers are axially positioned along
the axis of yarn by means of real twist and this improves the tenacity of the yarn
[57]. Rameshkumar et al also found that the fabrics knitted from ring spun yarn has
the highest bursting strength due to high tenacity and uniformity, and the bursting
strength of the fabrics knitted from vortex and open-end rotor spun yarns are in
consistency with the tenacity values of the yarns [56].
A similar behavior related to bursting strength of knitted fabric produced from 100%
combed cotton vortex spun yarn is stated by Beceren and Nergis that the fabric
knitted from vortex spun yarn has lower bursting strength than its conventional and
compact ring counterparts in all tightness levels as tight, medium and loose, which
reveals that tenacity of the yarns are directly reflected on the bursting strength
behavior [58]. The consistency between the yarn tenacity and the bursting strength of
the knitted fabrics was also confirmed by Leither et al., who concluded that the
bursting strength of knitted fabrics made from vortex spun yarns is therefore higher
than that of knitted fabrics made from open-end rotorspun yarns, but lower than that
of knitted fabrics made from conventional ring spun or compact yarns [31].
2.2.5.2 Abrasion resistance
Rameshkumar et al reported that fabrics knitted from ring spun yarns have low
abrasion resistance due to easy fiber migration, whereas the fabrics knitted from

45
vortex and open-end rotor spun yarns have higher abrasion resistance [56]. Similarly,
it was concluded by Ortlek and Onal that the average mass loss value of dyed fabrics
knitted from 100% viscose vortex spun yarns is significantly lower than that of all
other dyed fabrics knitted from conventional ring, compact and open-end rotor spun
yarns for 10.000 rubbing cycles. The fabric samples knitted from vortex spun yarns
generally have the highest abrasion resistance in both undyed and dyed form [57]. In
both studies, high abrasion resistance of the fabrics made of vortex spun yarns was
attributed to the existence of wrapper fibers, which resists the movement of highly
packed parallel core fibers in the yarn structure during abrasion [56,57].
On the other hand, according to Beceren and Nergis, cotton fabrics knitted from
compact spun yarns are more abrasion resistant when compared to ring and vortex
spun yarns, and the fabrics made of vortex spun yarns has the worst abrasion
resistance, although the hairiness of vortex spun yarns was found to be the lowest
during the yarn tests. The possible reason of that result was explained by the fact that
the gripping of the wrapper fibers in vortex spun yarn may not be strong enough to
resist the abrasive forces during testing [58].
2.2.5.3 Pilling propensity
Comparative analysis revealed that the fabrics knitted from vortex spun yarns exhibit
less pilling tendency than the fabrics knitted from conventional and compact ring
spun yarns. Moreover, the fabrics knitted from open-end rotor spun yarns are usually
considered to have lower pilling tendency due to belt fibers in its structure; however,
these fabrics cannot achieve the results obtained by the ones knitted from vortex spun
yarns. Fabrics knitted from open-end rotor spun yarn has higher pilling rate than its
vortex counterpart, since vortex spun yarn has longer wrapped fiber zones along the
yarn with less protruding fibers [31,55,58]. Consequently, pilling test results
obtained by Ortlek and Ulku, and Beceren and Nergis confirmed that pilling
propensity decreases with the decrease in hairiness of the yarns [55,58].
Disconcertingly, Rameshkumar et al reported that fabrics knitted from ring and open-
end rotor spun yarns have equal pilling propensity and fabrics knitted from vortex
spun yarns are less resistant to pilling [56]. The comparative experiments carried out
by Murata Machinery Ltd. also revealed that the knitted fabrics produced from both
100% cotton and 100% viscose vortex spun yarns have better pilling resistance than
that of the fabrics knitted from ring spun yarns [10].

46
2.2.5.4 Dimensional properties
Based on the experiments carried out on the fabrics knitted from combed cotton
vortex and ring spun yarns, Murata Machinery Ltd. claimed that the dimensional
changes in both widthwise and lengthwise directions and the skewness in the fabrics
knitted from vortex spun yarns are lower when compared to the fabrics knitted from
ring spun yarns [10]. Leitner et al also reported that the open-end rotor spun yarn and
vortex spun yarn displayed the best dimensional stability in the knitted fabric, in both
the length and the widthwise directions when compared to ring and compact spun
yarns [31].
According to Ortlek and Onal, the fabrics knitted from 100% viscose vortex spun
yarn in count of 30 Ne has the lowest widthwise shrinkage in comparison to its
conventional ring, compact ring and open-end rotor spun counterparts, whereas
lengthwise shrinkage is the highest of all. They also explored the relation between
twist liveliness and fabric skewness, and concluded that vortex spun yarns are less
twist lively than conventional and compact ring spun yarns respectively; but more
lively than their open-end rotor spun counterparts. Accordingly, the knitted fabrics
behave in the identical manner in terms of the angle of skewness at both dry and full
relaxed states [57].
Li et al. examined the dimensional and mechanical properties of wool-polyester
blended plain weave fabrics made from two folded and steamed vortex and
conventional ring spun yarns. Additionally, a portion of unsteamed vortex spun yarns
followed permanent setting of the wool component in the fabric samples by pressure
steaming. They stated that greater hygral expansion and relaxation shrinkage in loom
state fabrics made from unsteamed vortex spun yarns is observed when compared to
conventional ring spun yarns. While the magnitude of the relaxation shrinkage in
loom state fabrics can be reduced by pre-steaming of the yarn, permanent setting of
fabrics by pressure steaming is more effective in decrease of relaxation shrinkage of
the fabrics. Moreover, permanent setting of fabrics by pressure steaming resulted in
similar levels of hygral expansion and relaxation shrinkage in fabrics irrespective of
the yarn spinning system [59].
The visual assessments carried out by Murata Machinery Ltd. and Leitner et al on
changes in the surface of the fabrics after repeated laundering revealed that the
fabrics knitted from ring-spun or compact yarns displayed a clearer change in the
47
appearance than knitted fabrics produced from vortex and open-end rotor spun yarns
in terms of change in the surface due to napping and the formation of creases, pilling
and change in color [10,31].
2.2.5.5 Fabric thickness, compressional properties and fabric hand
According to Li et al, wool-polyester woven fabrics made from vortex spun yarns are
relatively heavier and thicker than ring and open-end rotor spun yarn fabrics due to
higher bulkiness as explained by Soe et al [37], and this is reflected in greater fabric
weight and thickness [59]. In addition, the fabrics woven from vortex spun yarns
were found to have higher shear rigidity when compared to the fabrics woven from
ring spun yarns. Li et al concluded that the fabrics made of vortex spun yarns have
firmer fabric hand [59].
Rameshkumar et al examined the drapability and color matching of fabrics knitted
from ring, open-end rotor and vortex spun yarns comparatively. They found that
drapability of the fabrics knitted from vortex spun yarn is poor compared to that of
ring and open-end rotor spun yarns. On the other hand, the shade is almost similar on
both the fabrics knitted from ring and vortex spun yarns [56].
Unal investigated the effect of spinning systems and twist direction of the cotton
folded yarns on the handle properties of woven fabrics. The single yarns with the
twist direction of Z were plied and used as weft yarns in the woven fabrics. She
measured the yarn liveliness, bending properties, stiffness, drape angle and surface
properties such as friction coefficient of the fabrics as the components of the fabric
hand. The twist direction of the all single yarn samples was Z. The results revealed
that applying twist in opposite direction in folded yarns resulted in lower yarn
liveliness for all yarn samples, as expected. In addition, folded vortex yarns were
found to have the highest liveliness in both directions, however the differences were
not statistically significant [60].
Fabrics produced with vortex folded yarns were observed to have the highest value
of circular bending rigidity and highest value of stiffness in all types of fabrics
regardless of the plying twist direction. The high bending rigidity of the fabrics
woven from vortex spun yarns was attributed to the high bending rigidity of the
vortex pun yarns, which was formerly found by Soe et al [37]. The high stiffness of
fabrics woven from vortex spun yarns was correlated with the high liveliness of the

48
yarns. In addition to the yarn liveliness, a high correlation between bending rigidity
and stiffness was found [60].
With regard to surface properties, Unal observed that the fabrics produced with rotor
yarns have the lowest values and attributed this result to the fact that rotor yarns are
the bulkiest among the ring and vortex yarns referring to Soe et al; however, Soe et al
stated that vortex yarn is the bulkier than ring and open-end rotor spun yarns [37,60].
She concluded that the subjective evaluation of the fabric handle also supported the
objective results, that is to say, the fabrics produced from ring folded yarns were
found to be the softest samples, while the fabrics produced from vortex folded yarns
were found to be the stiffest samples [60].
On the contrary to the findings of Li et al and Ulku, Ozdemir and Ogulata measured
the bending resistances of the knitted fabrics by the digital pneumatic stiffness tester,
and reported that the fabrics produced from vortex and open-end rotor spun yarns
have softer fabric hand than that of the fabrics knitted from conventional and
compact ring spun yarns. They attributed this behaviour to the bulkiness of the
vortex and open-end rotor spun yarns, and the bulky structure of these yarns are
thought to contribute to the hand of the fabric positively [61].
2.2.5.6 Dyeing properties
Kirecci et al investigated the color fastness and colorimetric properties of the fabrics
knitted from vortex and ring spun yarns. The results revealed that while washing
fastness of the fabrics knitted from both vortex spun yarns and ring spun yarns are
similar, the fabrics knitted from vortex spun yarns are generally better than their ring
counterparts in terms of acidic and alkali perspiration fastness. In addition, it was
found that dry rubbing fastness values of air-vortex spun samples are slightly better
than ring spun samples. However, the results indicated that wet rubbing fastness
values of vortex samples are much better than that of ring spun samples. Finally, they
stated that the lightness values of undyed and dyed fabrics are very close to each
other for vortex and ring spun yarns, and there is no clear difference between the
whiteness values of undyed fabrics of both yarns [62].
Ortlek et al. assessed the color values of viscose fabrics knitted from vortex spun
yarns after abrasion in comparison to the fabrics knitted from ring and open-end rotor
spun yarns for different dyeing concentrations and abrasion cycles. They reported
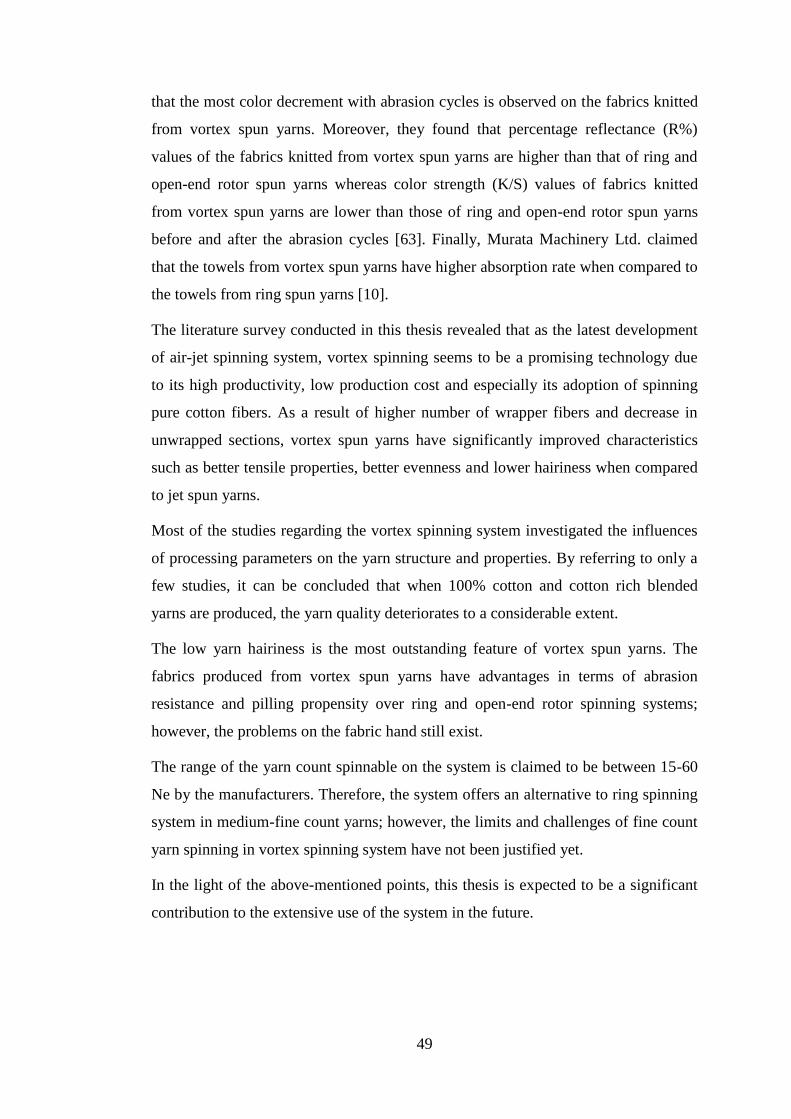
49
that the most color decrement with abrasion cycles is observed on the fabrics knitted
from vortex spun yarns. Moreover, they found that percentage reflectance (R%)
values of the fabrics knitted from vortex spun yarns are higher than that of ring and
open-end rotor spun yarns whereas color strength (K/S) values of fabrics knitted
from vortex spun yarns are lower than those of ring and open-end rotor spun yarns
before and after the abrasion cycles [63]. Finally, Murata Machinery Ltd. claimed
that the towels from vortex spun yarns have higher absorption rate when compared to
the towels from ring spun yarns [10].
The literature survey conducted in this thesis revealed that as the latest development
of air-jet spinning system, vortex spinning seems to be a promising technology due
to its high productivity, low production cost and especially its adoption of spinning
pure cotton fibers. As a result of higher number of wrapper fibers and decrease in
unwrapped sections, vortex spun yarns have significantly improved characteristics
such as better tensile properties, better evenness and lower hairiness when compared
to jet spun yarns.
Most of the studies regarding the vortex spinning system investigated the influences
of processing parameters on the yarn structure and properties. By referring to only a
few studies, it can be concluded that when 100% cotton and cotton rich blended
yarns are produced, the yarn quality deteriorates to a considerable extent.
The low yarn hairiness is the most outstanding feature of vortex spun yarns. The
fabrics produced from vortex spun yarns have advantages in terms of abrasion
resistance and pilling propensity over ring and open-end rotor spinning systems;
however, the problems on the fabric hand still exist.
The range of the yarn count spinnable on the system is claimed to be between 15-60
Ne by the manufacturers. Therefore, the system offers an alternative to ring spinning
system in medium-fine count yarns; however, the limits and challenges of fine count
yarn spinning in vortex spinning system have not been justified yet.
In the light of the above-mentioned points, this thesis is expected to be a significant
contribution to the extensive use of the system in the future.

50

51
3. MATERIALS AND METHODS
3.1 Materials
The fibers used in this thesis were selected based on the fact that they are suitable for
using in vortex spinning system, with a special focus on cotton, which has still
difficulties when processing on the systems based on jet spinning principle.
For the preliminary trials, 100% cotton, 50/50 cotton - Modal® and 100% viscose
fibers were used. The fineness of viscose and Modal® fibers are 1.3dtex, and the
lengths are 38 mm and 39 mm respectively. Fibers were obtained by the company in
Turkey.
For the following experimental studies, two more types of cotton, which were
available at the spinning laboratory of North Carolina State University in the USA,
were used. In addition, 50/50 cotton-polyester blended fibers, which were received
from Muratec USA in the sliver form, were used.
3.2 Method
Fibers were processed on cotton yarn manufacturing system. Sample production for
the preliminary trials was carried out under the conditions of a spinning mill in
Turkey. For the main investigation part of the study, samples were produced in the
spinning laboratory of North Carolina State University and in the research laboratory
of the Muratec USA, the manufacturer of Murata Vortex Spinner (MVS).
The process flow and the machines used for sample production in Turkey are shown
in Figure 3.1.
For 100% cotton yarn samples, combed cotton yarn spinning processes were
followed. 18% noils were eliminated during combing process. For 50/50 cotton-
Modal® yarns, Modal
® slivers and combed cotton slivers were blended in the second
drawing passage. Second passage drawing slivers were converted into roving before
spinning for ring spun yarns, while open-end rotor yarns were spun directly from
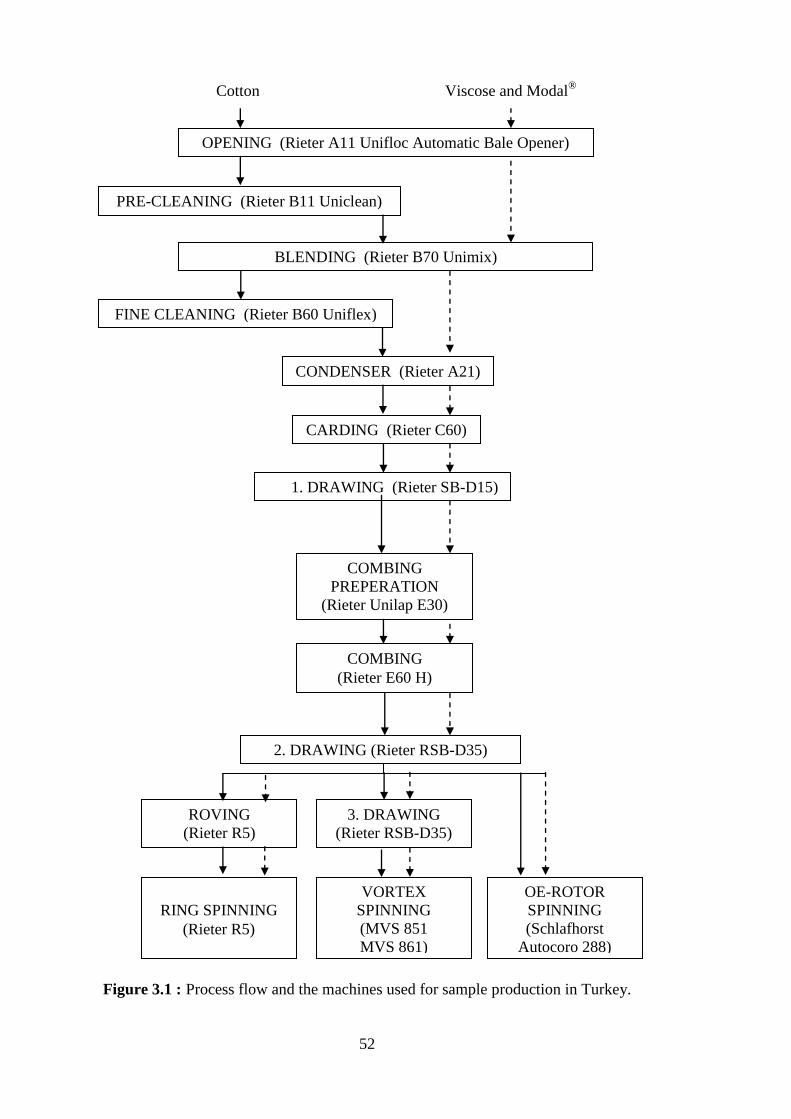
52
Figure 3.1 : Process flow and the machines used for sample production in Turkey.
OPENING (Rieter A11 Unifloc Automatic Bale Opener)
PRE-CLEANING (Rieter B11 Uniclean)
BLENDING (Rieter B70 Unimix)
FINE CLEANING (Rieter B60 Uniflex)
CONDENSER (Rieter A21)
CARDING (Rieter C60)
1. DRAWING (Rieter SB-D15)
2. DRAWING (Rieter RSB-D35)
ROVING
(Rieter R5)
RING SPINNING
(Rieter R5)
COMBING
PREPERATION
(Rieter Unilap E30)
COMBING
(Rieter E60 H)
3. DRAWING
(Rieter RSB-D35)
VORTEX
SPINNING
(MVS 851
MVS 861)
OE-ROTOR
SPINNING
(Schlafhorst
Autocoro 288)
Cotton Viscose and Modal®
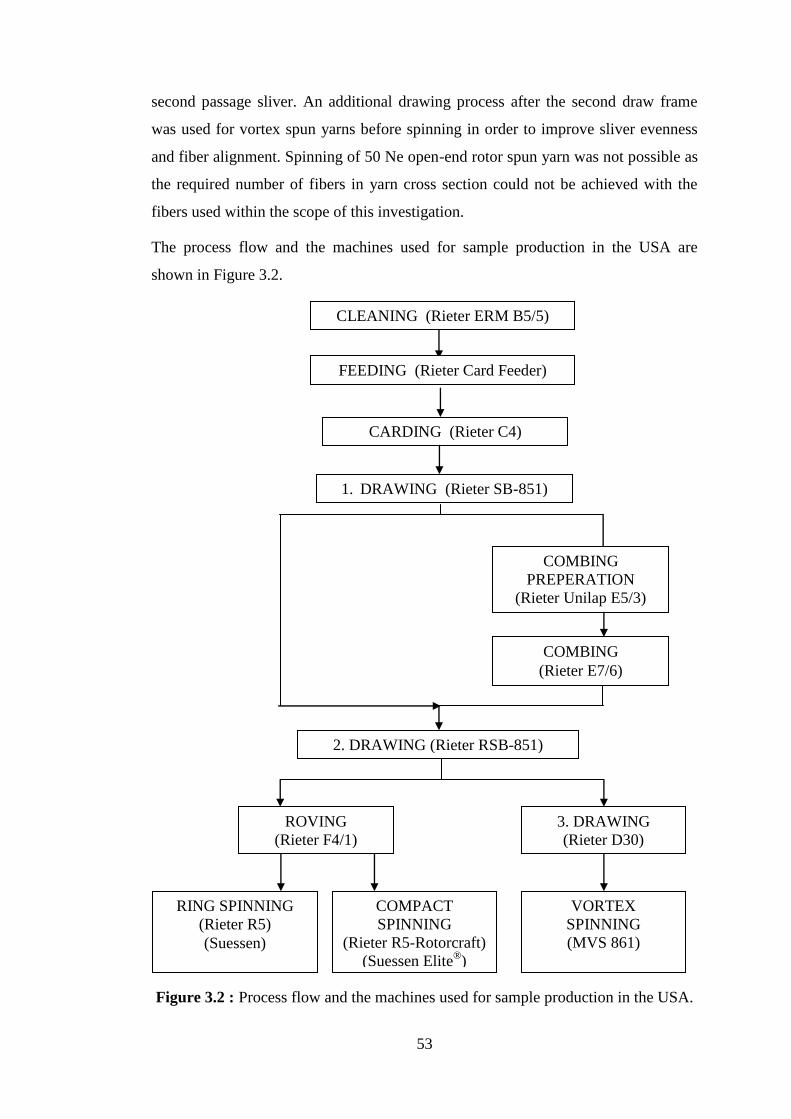
53
second passage sliver. An additional drawing process after the second draw frame
was used for vortex spun yarns before spinning in order to improve sliver evenness
and fiber alignment. Spinning of 50 Ne open-end rotor spun yarn was not possible as
the required number of fibers in yarn cross section could not be achieved with the
fibers used within the scope of this investigation.
The process flow and the machines used for sample production in the USA are
shown in Figure 3.2.
Figure 3.2 : Process flow and the machines used for sample production in the USA.
CLEANING (Rieter ERM B5/5)
FEEDING (Rieter Card Feeder)
CARDING (Rieter C4)
1. DRAWING (Rieter SB-851)
COMBING
PREPERATION
(Rieter Unilap E5/3)
COMBING
(Rieter E7/6)
2. DRAWING (Rieter RSB-851)
3. DRAWING
(Rieter D30)
ROVING
(Rieter F4/1)
COMPACT
SPINNING
(Rieter R5-Rotorcraft)
(Suessen Elite®)
VORTEX
SPINNING
(MVS 861)
RING SPINNING
(Rieter R5)
(Suessen)
54
2nd
passage drawing slivers were prepared in the spinning laboratory of North
Carolina State University. The slivers were fed to Rieter F4/1 roving frame, and then
Rieter G5/2D type ring spinning frame and RoCoS compact spinning system, which
was adapted on Rieter G5/2D ring frame, and Suessen conventional ring and Suessen
EliTe®
compact spinning systems were used to produce combed cotton ring and
compact spun yarn samples.
In order to produce the carded and combed cotton vortex spun yarn samples, 2nd
passage drawing slivers were transferred to the research laboratory of the Muratec
USA. After 3rd
passage drawing, the slivers were fed to MVS 861 vortex spinning
machine.
Fabric samples were knitted on a Pilotelli single jersey circular knitting machine with
a gauge of 28, diameter of 32 inches (81.28 cm), and 96 feeders. All greige fabrics
were dyed with reactive Everzol Blue ED-G dyestuff under the same conditions. For
100% cotton fabrics and 50/50 cotton-Modal® blended fabrics, oil remover, wetter,
and anti-peroxide enzyme were used in dying process.
3.3 Testing and Evaluation Procedures
All tests were carried out under standard atmospheric conditions, i.e. 20±2 C°
temperature and 65±2 % relative humidity. The samples were conditioned for a
minimum 24 hours before tests.
3.3.1 Fiber Testing
Cotton fiber properties were measured by using Uster®
HVI 900 testing instrument in
accordance with ASTM D5867-05 standard and Uster® AFIS instrument according
to ASTM D5866 standard [64,65].
3.3.2 Yarn Testing
3.3.2.1 Structural properties
The structural properties evaluated in this research include the ratio of wrapper fibers
to core fibers, and the classification of the yarn structure in vortex spun yarns.
In order to analyze any difference in the yarn structure that may occur due to the
change in yarn count, small pieces of yarn samples were untwisted manually and
wrapper and core fibers were separated and weighed in order to determine the ratio
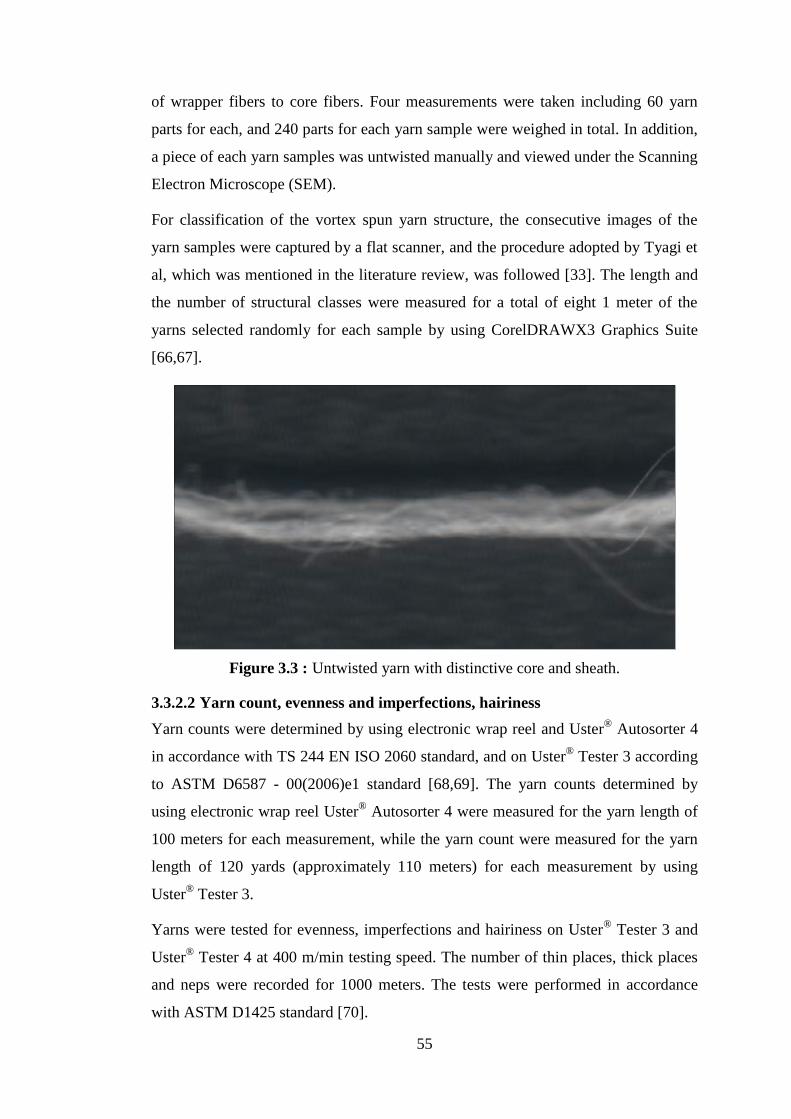
55
of wrapper fibers to core fibers. Four measurements were taken including 60 yarn
parts for each, and 240 parts for each yarn sample were weighed in total. In addition,
a piece of each yarn samples was untwisted manually and viewed under the Scanning
Electron Microscope (SEM).
For classification of the vortex spun yarn structure, the consecutive images of the
yarn samples were captured by a flat scanner, and the procedure adopted by Tyagi et
al, which was mentioned in the literature review, was followed [33]. The length and
the number of structural classes were measured for a total of eight 1 meter of the
yarns selected randomly for each sample by using CorelDRAWX3 Graphics Suite
[66,67].
Figure 3.3 : Untwisted yarn with distinctive core and sheath.
3.3.2.2 Yarn count, evenness and imperfections, hairiness
Yarn counts were determined by using electronic wrap reel and Uster® Autosorter 4
in accordance with TS 244 EN ISO 2060 standard, and on Uster® Tester 3 according
to ASTM D6587 - 00(2006)e1 standard [68,69]. The yarn counts determined by
using electronic wrap reel Uster® Autosorter 4 were measured for the yarn length of
100 meters for each measurement, while the yarn count were measured for the yarn
length of 120 yards (approximately 110 meters) for each measurement by using
Uster® Tester 3.
Yarns were tested for evenness, imperfections and hairiness on Uster® Tester 3 and
Uster® Tester 4 at 400 m/min testing speed. The number of thin places, thick places
and neps were recorded for 1000 meters. The tests were performed in accordance
with ASTM D1425 standard [70].
56
3.3.2.3 Yarn tenacity and elongation
Tenacity and breaking elongation of the yarn samples were measured on Uster®
Tensojet at the testing speed of 400 m/min. with a gauge length of 500 mm, and on
Uster® Tensorapid at the testing speed of 250 m/min. with a gauge length of 500 mm
in accordance with TS EN ISO 2062 [71].
3.3.2.4 Yarn twist
Although the yarns produced on air jet spinning systems do not possess real twist,
some researchers have recommended the use of twist measuring instruments based
on untwist-retwist principle for measuring the twist in air jet spun yarns [8,72]. An
automatic twist tester, which works on untwist-retwist principle, was used in
accordance with ASTM D1422 standard, and the average of 100 test results was
presented for each yarn sample [73]. In addition, twist to break test is used, where the
yarn is overtwisted in the original twist direction until the yarn breaks, and the yarn
is untwisted and then retwisted until the yarn breaks, and the twist is calculated based
on these two measurements [74].
In addition to untwisting and retwisting, twist of the yarn sample was determined by
optical method. The images of the yarn samples were captured by a flat scanner, and
wrapping angle and the yarn diameter for different structural parts of the yarns were
measured by using CorelDRAWX3 Graphics Suite.
3.3.3 Fabric Testing
The parameters of the fabric samples were described in terms of the number of
courses and wales per cm, loop length and weight of the fabric according to the
relevant standards [75-77].
Performance of fabric samples was evaluated in terms of pilling propensity, bursting
strength, abrasion resistance and dimensional stability.
Pilling tests of dyed fabrics were carried out on ICI pilling tester in accordance with
TS EN ISO 12945-1 standard [78]. Martindale abrasion tester was used for
determination of abrasion properties in accordance with TS EN ISO 12947-2 and TS
EN ISO 12947-3 standards [79,80]. Mass loss values were recorded at the end of
5,000, 10,000, 15,000, and 20,000 rubbing cycles. Four tests were carried out for
each type of fabric samples. Bursting strength tester applying hydraulic method
based on TS 393 EN ISO 13938-1 standard was used to determine the bursting

57
strength of all greige and dyed fabric samples. 4 tests were carried out for each type
of fabric samples [81].
For determination of dimensional stability and change in skewness of the fabric
samples, greige and dyed fabrics were washed in an Electrolux Wascator FOM 71
special washing machine, wash program 5A (TS 5720 EN ISO 6330/A1) at 40 C° for
five times and dried flat after each washing cycle [82,83]. The values demonstrated
in figures related with dimensional properties of fabric samples belong to the
measurements after fifth washing cycle. 3 tests for each sample group were
performed and the average was reported.
3.3.4 Statistical Analysis
The analysis of variance was performed on test results in order to identify the main
effects and the interactions of the observed factors by using the general linear model
(GLM) procedure on SPSS statistical software. Independent samples t-test and post
hoc test were utilized to identify the differences among sample means. Levene’s test
was used to assess the equality of variance in different samples to determine which
type of post hoc test should be used. The variances are accepted equal where the
significance level value (p value) is greater than the level of significance; otherwise
they are accepted as unequal. Tukey’s post hoc test was used when the variances are
equal, and Dunnett’s T3 post hoc test was used for unequal variances [84,85].
The results of the studies regarding the spinning of fine cotton yarns on vortex
spinning system were used to develop process-structure-property relationship models
for cotton vortex spun yarns by using linear regression and curve estimation methods
on SPSS. The plot of the standardized residuals versus standardized predicted values
was used to evaluate the normality and homoscedasticity assumptions for testing the
significance of the model and its parameters. Plots of residuals versus time series
data was used to confirm the independency of the observations [86].

58

59
4. COMPARATIVE ANALYSIS ON RING, OPEN-END ROTOR AND
VORTEX SPUN YARNS
4.1 Comparisons of Ring, Open-end Rotor and Vortex Yarn Properties with
Special Reference to Cellulosic Fibers
Experiments were carried out to examine the behavior of different fiber types on the
properties of vortex spun yarns (MVS) in comparison with ring and open-end rotor
spun yarns in three different counts including 30 Ne, 40 Ne and 50 Ne produced
under the conditions of a spinning mill. Yarn samples were converted into knitted
fabrics using a single jersey circular knitting machine and dyed with reactive
dyestuff to determine the physical performances of the dyed yarns in knitted form.
Three types of cellulose-based fibers, cotton, viscose and 50/50 cotton-Modal®
blend,
were used in the production of the yarn samples. The vortex spinning technology is
claimed to be favorable for pure cotton spinning, and the properties of 100% cotton
vortex spun yarns were investigated in most of the studies so far
[20,22,34,37,39,45,46,52-56,58,62]. On the other hand, the quality of pure cotton and
cotton rich blended vortex spun yarn is still questionable [22,43,53]. The aim of
these experiments was to explore further the usage of cotton fibers and expand the
study to the other cellulosic fibers, by considering the wide range of use, and their
mixtures with cotton. The comparative study was expected to lead to identify
whether pure regenerated cellulosic fibers or their blends with cotton may overcome
the problems arise when pure cotton fiber is used.
The properties of cotton fiber, which can be classified as medium staple cotton, were
measured on Uster® HVI 900 testing instrument and are shown in Table 4.1.
Table 4.1 : Cotton fiber properties.
Cotton fiber properties Units Value
Fiber fineness µg/inch 4.3
Fiber length (UHML-Upper Half Mean Length) mm 30.1
Strength (cN/tex) cN/tex 33.2
Breaking elongation % 5.4

60
Table 4.2 : Spinning parameters used for investigation of the vortex yarn properties in comparison with ring and open-end rotor yarns.
Ring MVS Open-end Rotor
Yarn count (Ne) 30 40 50 30 40 50 30 40
Roving count (Ne) 0.86 0.86 0.86 - - - - -
2nd
passage drawing sliver count (Ne) 0.120 0.120 0.120 0.120 0.120 0.120 0.130 0.130
3rd
passage drawing sliver count (Ne) - - - 0.211 0.211 0.236 - -
Twist (TPM) 867 968 1085 - - - 810 984
Twist multiplier (αe) 4.05 3.89 3.91 - - - 3.79 3.96
Spindle speed (rpm) 15,000 15,000 15,000 - - - - -
Rotor speed (rpm) - - - - - - 105,000 95,000
Delivery speed (m/min) 17 16 14 360 340 320 130 97
Break draft 1.19 1.19 1.19 2 2 2 - -
Total draft 38 49 60 155 186 204 231 308
Main draft - - - 43 48 54 - -
Nozzle air pressure (kgf/cm2) - - - 4.5 4.5 4.5 - -

61
Properties of viscose and Modal®
fibers were 1.3 dtex in fineness, and 38 mm, and 39
mm in length respectively, as received. The spinning parameters used in the
production of yarn samples are given in Table 4.2.
4.1.1 Yarn properties
The measured properties of the yarn samples are given in Table 4.3 and illustrated in
Figures 4.1 – 4.9. The tests were carried out on ten bobbins for each yarn sample and
the average values of 10 test results were presented for each property.
In order to evaluate the significance of the fiber type, yarn type and yarn count and
their interactions on the yarn physical properties, the analysis of variance was
performed on the test results by using general linear model (GLM) procedure. The
results of the analysis of variance test are reported in Table 4.4.
In Figure 4.1, yarn count variation between bobbins of the yarn samples are
illustrated. The variation of the yarn count in cotton vortex spun yarns was found to
be higher than cotton ring and open-end rotor spun yarns. However, less variation in
yarn count was observed in vortex spun yarns when compared to ring and open-end
rotor spun yarns made of viscose and cotton-Modal® blended fibers.
Figure 4.1 : Comparative results of yarn count variation.
The tenacity and the breaking elongation test results of the yarn samples are given in
Table 4.3 and illustrated in Figures 4.2 and 4.3. The results show that ring spun yarns
have the highest tenacity values except from 30 Ne viscose yarns; while open-end
rotor spun yarns are the weakest. This result is consistent with the findings of
previous researchers, who reported that the twisted core as opposed to untwisted one
of the vortex spun creates a stronger bond between the fibers and results in
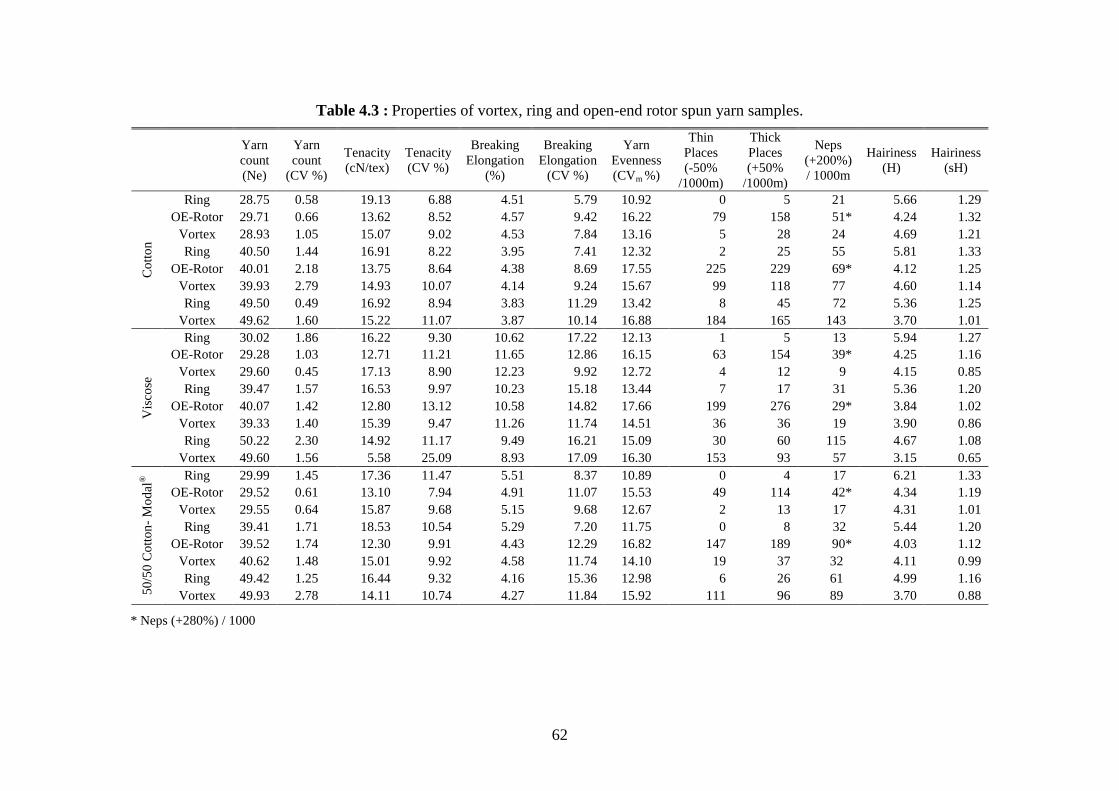
62
Table 4.3 : Properties of vortex, ring and open-end rotor spun yarn samples.
Yarn
count
(Ne)
Yarn
count
(CV %)
Tenacity
(cN/tex)
Tenacity
(CV %)
Breaking
Elongation
(%)
Breaking
Elongation
(CV %)
Yarn
Evenness
(CVm %)
Thin
Places
(-50%
/1000m)
Thick
Places
(+50%
/1000m)
Neps
(+200%)
/ 1000m
Hairiness
(H)
Hairiness
(sH)
Co
tto
n
Ring 28.75 0.58 19.13 6.88 4.51 5.79 10.92 0 5 21 5.66 1.29
OE-Rotor 29.71 0.66 13.62 8.52 4.57 9.42 16.22 79 158 51* 4.24 1.32
Vortex 28.93 1.05 15.07 9.02 4.53 7.84 13.16 5 28 24 4.69 1.21
Ring 40.50 1.44 16.91 8.22 3.95 7.41 12.32 2 25 55 5.81 1.33
OE-Rotor 40.01 2.18 13.75 8.64 4.38 8.69 17.55 225 229 69* 4.12 1.25
Vortex 39.93 2.79 14.93 10.07 4.14 9.24 15.67 99 118 77 4.60 1.14
Ring 49.50 0.49 16.92 8.94 3.83 11.29 13.42 8 45 72 5.36 1.25
Vortex 49.62 1.60 15.22 11.07 3.87 10.14 16.88 184 165 143 3.70 1.01
Vis
cose
Ring 30.02 1.86 16.22 9.30 10.62 17.22 12.13 1 5 13 5.94 1.27
OE-Rotor 29.28 1.03 12.71 11.21 11.65 12.86 16.15 63 154 39* 4.25 1.16
Vortex 29.60 0.45 17.13 8.90 12.23 9.92 12.72 4 12 9 4.15 0.85
Ring 39.47 1.57 16.53 9.97 10.23 15.18 13.44 7 17 31 5.36 1.20
OE-Rotor 40.07 1.42 12.80 13.12 10.58 14.82 17.66 199 276 29* 3.84 1.02
Vortex 39.33 1.40 15.39 9.47 11.26 11.74 14.51 36 36 19 3.90 0.86
Ring 50.22 2.30 14.92 11.17 9.49 16.21 15.09 30 60 115 4.67 1.08
Vortex 49.60 1.56 5.58 25.09 8.93 17.09 16.30 153 93 57 3.15 0.65
50
/50
Co
tto
n-
Mo
dal
® Ring 29.99 1.45 17.36 11.47 5.51 8.37 10.89 0 4 17 6.21 1.33
OE-Rotor 29.52 0.61 13.10 7.94 4.91 11.07 15.53 49 114 42* 4.34 1.19
Vortex 29.55 0.64 15.87 9.68 5.15 9.68 12.67 2 13 17 4.31 1.01
Ring 39.41 1.71 18.53 10.54 5.29 7.20 11.75 0 8 32 5.44 1.20
OE-Rotor 39.52 1.74 12.30 9.91 4.43 12.29 16.82 147 189 90* 4.03 1.12
Vortex 40.62 1.48 15.01 9.92 4.58 11.74 14.10 19 37 32 4.11 0.99
Ring 49.42 1.25 16.44 9.32 4.16 15.36 12.98 6 26 61 4.99 1.16
Vortex 49.93 2.78 14.11 10.74 4.27 11.84 15.92 111 96 89 3.70 0.88
* Neps (+280%) / 1000

63
Table 4.4 : Analysis of variance test results for the properties of vortex, ring and
open- end rotor yarn samples.
Yarn
evenness
Thin
places
Thick
places Neps Hairiness Tenacity Elongation
Fiber type s s s s s s s
Yarn count s s s s s s s
Yarn type s s s s s s ns
Fiber type*yarn count s s ns ns s s s
Fiber type*yarn type s s s s s ns ns
Yarn count*yarn type s s s s ns s ns
Fiber type*yarn count*
yarn type ns ns s s s s ns
(s: significant, ns: non-significant at the confidence level of 99%)
higher tenacity for ring spun yarns. Moreover, the lack of fibers parallelization in the
open-end rotor yarn structure is thought to lead low tensile values [37,55-58].
According to the analysis of variance results, yarn count has a significant impact on
tenacity; however, the only significant difference occurred due to a sharp decrease in
the tenacity of vortex spun yarn in count of 50 Ne made from viscose fiber. The
coefficient of variation in tenacity related to this yarn sample is also the highest
among all yarn samples.
With regard to fiber type, it was found that viscose ring yarn in count of 30 Ne has
significantly lower tenacity than the pure cotton and cotton-Modal® blended ring
spun yarns in the same count; and a considerable decrease was observed in the
tenacity of viscose vortex spun yarn in count of 50 Ne than the pure cotton and
cotton-Modal® blended vortex spun yarns in the same count.
Figure 4.2 : Comparative results of yarn tenacity.
Statistical analysis performed on the breaking elongation data of the yarn samples
revealed that fiber type has a considerably more significant impact on breaking

64
elongation than the yarn type, and the highest elongation values were obtained in
viscose yarns for each system. Regarding the yarn type, the results are confirming the
findings of Leitner et al, who reported that vortex spun yarns display good yarn
elongation values equivalent to those of ring spun yarns [31]. In addition, as the yarn
becomes finer, a slight decrease in breaking elongation was observed for all types of
yarns, and this result becomes more apparent in viscose yarn samples.
Figure 4.3 : Comparative results of breaking elongation.
The experimental results regarding the yarn evenness and imperfections are
illustrated in Figures 4.4 - 4.7. According to the statistical analysis, the yarn evenness
deteriorates as the yarn becomes finer for all yarn types, as expected. The unevenness
of vortex spun yarns is higher than that of ring spun yarns, while open-end rotor spun
yarns have the highest unevenness of all three kinds of yarns, which is confirming
the earlier findings [53,55-58]. With regard to fiber type, the results reveal that
cotton and cotton- Modal®
blended ring spun yarns are more even than viscose ring
spun yarns. On the other hand, fiber type has not a significant impact on the evenness
of the yarns spun on vortex and open-end rotor spinning systems at the confidence
level of 95%. The test results revealed that there is not a significant difference
between the number of thin places for the ring and vortex spun yarn samples in
counts of 30 Ne at 95% level of confidence, confirming the findings of Soe et al [37].
However, the difference between the number of thin places for the ring and vortex
spun yarns becomes significant in the yarn count of 40 Ne made of viscose fiber, and
in the yarn count of 50 Ne for all fiber types. When compared to open-end rotor spun
yarns, lower number of thin places was obtained in vortex spun yarns, in accordance
with the most previous studies [55-57].

65
Figure 4.4 : Comparative results of yarn evenness. Figure 4.5 : Comparative results of thin places.
Figure 4.6 : Comparative results of thick places. Figure 4.7 : Comparative results of neps.

66
The difference between the number of thin places in vortex spun yarns in counts of
30 Ne and 40 Ne was found to be insignificant; however, it becomes significant in
count of 50 Ne for all fiber types. While the yarn count has not a significant impact
on the number of thin places for ring spun yarns, the number of thin places for open-
end rotor spun yarns significantly increases as the yarn becomes finer for all fiber
types.
The statistical analysis revealed that there is not a significant difference between the
number of thick places for the ring and vortex spun yarn samples in counts of 30 Ne
at 95% level of confidence. However, the difference between the number of thick
places for the ring and vortex spun yarns becomes significant in the yarn count of 40
Ne and 50 Ne made of cotton and cotton-Modal® blended fibers and higher values
were measured on vortex spun yarns. When compared to open-end rotor spun yarns,
lower number of thick places was obtained in vortex spun yarns for all fiber types, as
concluded by Rameshkumar et al and Ortlek and Onal [56,57].
The number of thick places generally increases as the yarn becomes finer for all yarn
types.
The difference between the number of neps for ring and vortex spun yarns is
statistically insignificant at 95% confidence level, except for the cotton yarn samples
in count of 50 Ne. Cotton vortex spun yarn sample in count of 50 Ne has higher
number of neps than its ring counterpart.
While the number of neps increases as the yarn gets finer for ring and vortex spun
yarns, yarn count has not a significant impact on the number of neps for open-end
rotor spun yarns.
Statistical analysis showed that fiber type has not a significant impact on the number
of thin places and thick places for any yarn type. With regard to number of neps,
statistically significant difference was observed in vortex spun yarns in counts of 40
Ne and 50 Ne, and in view of that, cotton yarns have higher number of neps
compared to the viscose yarns. Moreover, the open-end spun yarn samples made of
viscose fiber have less number of neps when compared to the yarn samples made of
cotton and cotton-Modal® blended fibers.
The analysis showed that yarn hairiness generally decreases as the yarn becomes
finer in each spinning system. Ring spinning system appears to demonstrate the

67
highest H and sH values for all yarn samples, whereas the differences between
Uster® hairiness (H) values of vortex and open-end rotor spun yarns are not
statistically significant at 95% confidence level. Furthermore, vortex spun yarns
appears to have the lowest sH values for all fiber types and yarn counts in
comparison with the other two systems. These results indicate that the layer of
uniformly arranged wrapper fibers covering the yarn surface, which is unique for the
structure of vortex spun yarns have a positive effect in terms of reducing degree and
standard deviation of hairiness along the yarn length.
Another distinctive result for vortex spun yarns is that the lowest hairiness values
were obtained in yarns produced from viscose for yarn counts of 40 Ne and 50 Ne.
The longer length of viscose fiber when compared with cotton might constitute
longer length of wrapping resulting in fewer fibers protruding from yarn surface. The
same result was also obtained in open-end rotor spun yarns in count of 40 Ne.
Figure 4.8 : Comparative results of hairiness.
Figure 4.9 : Comparative results of variation in hairiness.
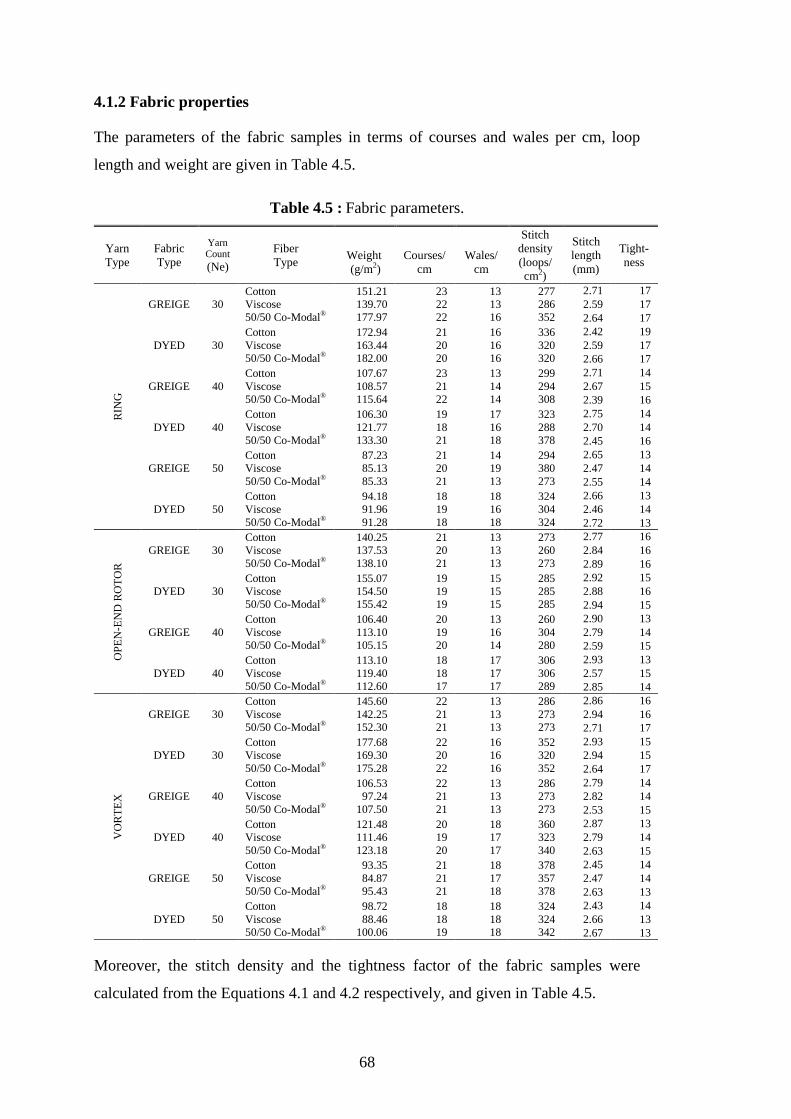
68
4.1.2 Fabric properties
The parameters of the fabric samples in terms of courses and wales per cm, loop
length and weight are given in Table 4.5.
Table 4.5 : Fabric parameters.
Yarn
Type
Fabric
Type
Yarn Count (Ne)
Fiber
Type
Weight
(g/m2)
Courses/
cm
Wales/
cm
Stitch
density
(loops/
cm2)
Stitch
length
(mm)
Tight-
ness
RIN
G
GREIGE 30
Cotton
Viscose
50/50 Co-Modal®
151.21
139.70
177.97
23
22
22
13
13
16
277
286
352
2.71 17
2.59 17
2.64 17
DYED 30
Cotton
Viscose
50/50 Co-Modal®
172.94
163.44
182.00
21
20
20
16
16
16
336
320
320
2.42 19
2.59 17
2.66 17
GREIGE 40
Cotton
Viscose
50/50 Co-Modal®
107.67
108.57
115.64
23
21
22
13
14
14
299
294
308
2.71 14
2.67 15
2.39 16
DYED 40
Cotton
Viscose
50/50 Co-Modal®
106.30
121.77
133.30
19
18
21
17
16
18
323
288
378
2.75 14
2.70 14
2.45 16
GREIGE 50
Cotton
Viscose
50/50 Co-Modal®
87.23
85.13
85.33
21
20
21
14
19
13
294
380
273
2.65 13
2.47 14
2.55 14
DYED 50
Cotton
Viscose
50/50 Co-Modal®
94.18
91.96
91.28
18
19
18
18
16
18
324
304
324
2.66 13
2.46 14
2.72 13
OP
EN
-EN
D R
OT
OR
GREIGE 30
Cotton
Viscose
50/50 Co-Modal®
140.25
137.53
138.10
21
20
21
13
13
13
273
260
273
2.77 16
2.84 16
2.89 16
DYED 30
Cotton
Viscose
50/50 Co-Modal®
155.07
154.50
155.42
19
19
19
15
15
15
285
285
285
2.92 15
2.88 16
2.94 15
GREIGE 40
Cotton
Viscose
50/50 Co-Modal®
106.40
113.10
105.15
20
19
20
13
16
14
260
304
280
2.90 13
2.79 14
2.59 15
DYED 40
Cotton
Viscose
50/50 Co-Modal®
113.10
119.40
112.60
18
18
17
17
17
17
306
306
289
2.93 13
2.57 15
2.85 14
VO
RT
EX
GREIGE 30
Cotton
Viscose
50/50 Co-Modal®
145.60
142.25
152.30
22
21
21
13
13
13
286
273
273
2.86 16
2.94 16
2.71 17
DYED 30
Cotton
Viscose
50/50 Co-Modal®
177.68
169.30
175.28
22
20
22
16
16
16
352
320
352
2.93 15
2.94 15
2.64 17
GREIGE 40
Cotton
Viscose
50/50 Co-Modal®
106.53
97.24
107.50
22
21
21
13
13
13
286
273
273
2.79 14
2.82 14
2.53 15
DYED 40
Cotton
Viscose
50/50 Co-Modal®
121.48
111.46
123.18
20
19
20
18
17
17
360
323
340
2.87 13
2.79 14
2.63 15
GREIGE 50
Cotton
Viscose
50/50 Co-Modal®
93.35
84.87
95.43
21
21
21
18
17
18
378
357
378
2.45 14
2.47 14
2.63 13
DYED 50
Cotton
Viscose
50/50 Co-Modal®
98.72
88.46
100.06
18
18
19
18
18
18
324
324
342
2.43 14
2.66 13
2.67 13
Moreover, the stitch density and the tightness factor of the fabric samples were
calculated from the Equations 4.1 and 4.2 respectively, and given in Table 4.5.

69
(4.1)
(4.2)
where l is the loop length in cm.
Dimensional changes in width and length of greige and dyed fabrics after the fifth
washing cycle are given in Table 4.6 and illustrated in Figures 4.11-4.14.
Dimensional change in each direction was calculated from the Equation 4.3:
(4.3)
where L0 represents the distance between lines marked on the fabric in initial
condition and L1 represents the distance between lines marked on the fabric
following laundering. Shrinkage was reported as negative, while release was reported
as a positive percentage.
Skewness in greige and dyed fabric samples are given in Table 4.6 and illustrated in
Figures 4.15 and 4.16. For measurement the change in skewness, a marking device
was used to draw the reference line YZ across the width of the specimen as seen in
Figure 4.10. Then, reference points A and B are marked perpendicular to the line YZ,
where A is on the midway on line YZ. After the fifth laundering cycle, one leg of the
marking device is placed on point B and the second leg on line YZ corresponds with
point A’.
Figure 4.10 : Preparation of specimen for change in skewness.
Change in the skewness of the fabric samples were calculated by using the Equation
4.4.
(4.4)
where X = % change in skewness.

70
Table 4.6 : Dimensional properties of fabric samples.
Yarn
Type
Fabric
Type
Yarn
Count
(Ne)
Fiber
Type
Dimensional
change
in width
(%)
Dimensional
change
in length
(%)
Skewness
(%)
RIN
G
GREIGE 30
Cotton
Viscose
50/50 Co-Modal®
-23.43
-19.14
-22.86
-1.71
-12.57
-3.43
10.00
8.25
9.75
DYED 30
Cotton
Viscose
50/50 Co-Modal®
0.00
2.00
1.14
-5.71
-14.86
-4.86
8.25
6.25
7.00
GREIGE 40
Cotton
Viscose
50/50 Co-Modal®
-22.86
-24.29
-26.29
-5.14
-8.57
-4.29
12.50
8.00
9.00
DYED 40
Cotton
Viscose
50/50 Co-Modal®
0.57
-4.86
-0.57
-10.00
-13.43
-6.57
7.75
8.25
2.00
GREIGE 50
Cotton
Viscose
50/50 Co-Modal®
-20.00
-23.71
-23.43
-5.71
-10.57
-6.00
21.00
14.00
9.75
DYED 50
Cotton
Viscose
50/50 Co-Modal®
2.29
-12.86
1.14
-8.57
-12.86
-10.00
15.50
19.75
26.50
OP
EN
-EN
D R
OT
OR
GREIGE 30
Cotton
Viscose
50/50 Co-Modal®
-16.00
-14.29
-12.57
-7.43
-16.86
-9.43
10.50
0.75
0.50
DYED 30
Cotton
Viscose
50/50 Co-Modal®
4.57
8.57
-4.29
-6.29
-14.29
-9.71
6.75
3.25
1.00
GREIGE 40
Cotton
Viscose
50/50 Co-Modal®
-18.00
-14.29
-17.71
-4.86
-15.71
-9.43
14.00
3.00
18.00
DYED 40
Cotton
Viscose
50/50 Co-Modal®
2.86
12.00
6.57
-10.86
-16.29
-7.14
16.00
12.50
9.25
VO
RT
EX
GREIGE 30
Cotton
Viscose
50/50 Co-Modal®
-22.29
-19.71
-20.29
-5.71
-15.43
-11.43
8.00
7.00
4.25
DYED 30
Cotton
Viscose
50/50 Co-Modal®
2.00
4.57
0.57
-4.29
-10.00
-6.00
4.75
11.00
2.50
GREIGE 40
Cotton
Viscose
50/50 Co-Modal®
-18.57
-18.29
-21.71
-8.57
-11.14
-8.29
12.00
1.75
17.75
DYED 40
Cotton
Viscose
50/50 Co-Modal®
-1.43
8.57
2.29
-7.71
-21.71
-8.00
9.75
1.00
14.00
GREIGE 50
Cotton
Viscose
50/50 Co-Modal®
-17.71
-18.57
-22.00
-6.57
-5.43
-6.29
21.25
8.75
15.25
DYED 50
Cotton
Viscose
50/50 Co-Modal®
0.29
7.14
-1.43
-11.43
-14.29
-3.71
26.75
31.50
1.25
Widthwise dimensional changes occurred as shrinkage in greige fabrics, but it also
occurred as release in dyed fabrics. While the widthwise shrinkage tendency of
greige fabrics made from vortex spun yarns are lower than that of ring spun yarns
and higher than their open-end rotor counterparts, generally a reverse widthwise
shrinkage/release tendency is observed in dyed fabrics. On the other hand, any
consistent trend was not observed in lengthwise dimensional change of the fabrics.
For all yarn spinning systems, the highest widthwise and lengthwise dimensional
changes in dyed fabric samples were obtained in yarns produced from viscose fiber,

71
Figure 4.11 : Widthwise dimensional change in greige fabrics. Figure 4.12 : Widthwise dimensional change in dyed fabrics.
Figure 4.13 : Lengthwise dimensional change in greige fabrics. Figure 4.14 : Lengthwise dimensional change in dyed fabrics.
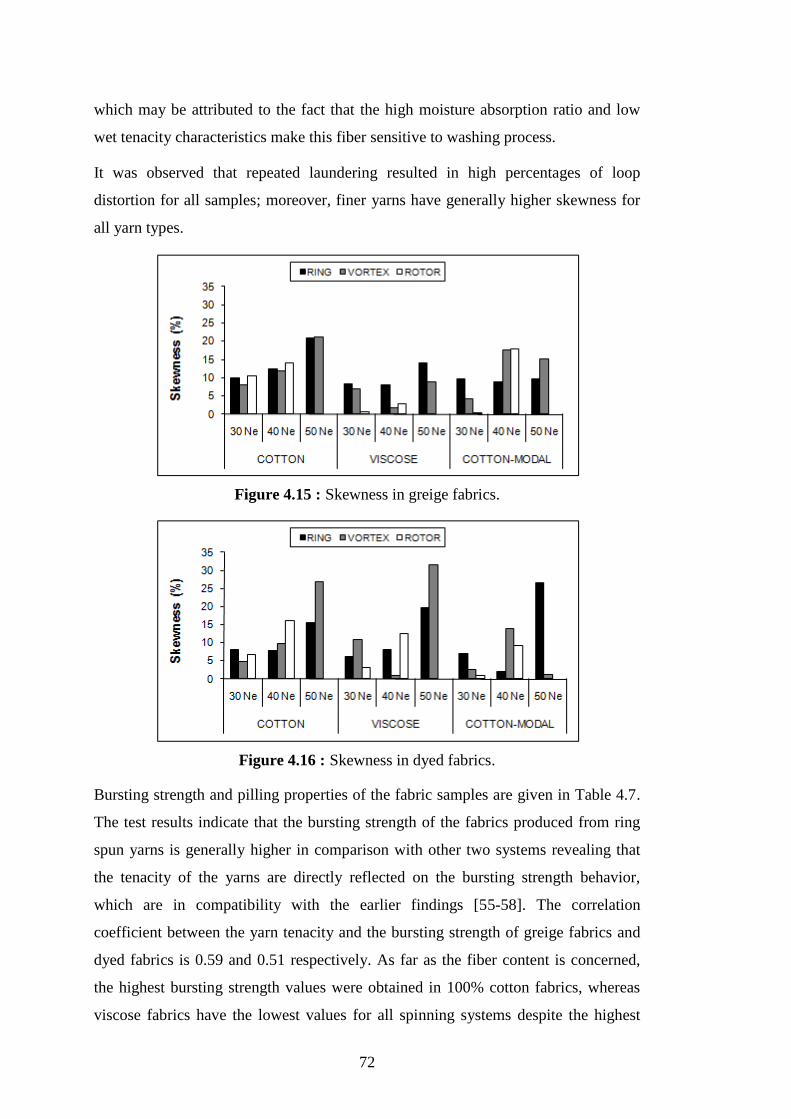
72
which may be attributed to the fact that the high moisture absorption ratio and low
wet tenacity characteristics make this fiber sensitive to washing process.
It was observed that repeated laundering resulted in high percentages of loop
distortion for all samples; moreover, finer yarns have generally higher skewness for
all yarn types.
Figure 4.15 : Skewness in greige fabrics.
Figure 4.16 : Skewness in dyed fabrics.
Bursting strength and pilling properties of the fabric samples are given in Table 4.7.
The test results indicate that the bursting strength of the fabrics produced from ring
spun yarns is generally higher in comparison with other two systems revealing that
the tenacity of the yarns are directly reflected on the bursting strength behavior,
which are in compatibility with the earlier findings [55-58]. The correlation
coefficient between the yarn tenacity and the bursting strength of greige fabrics and
dyed fabrics is 0.59 and 0.51 respectively. As far as the fiber content is concerned,
the highest bursting strength values were obtained in 100% cotton fabrics, whereas
viscose fabrics have the lowest values for all spinning systems despite the highest
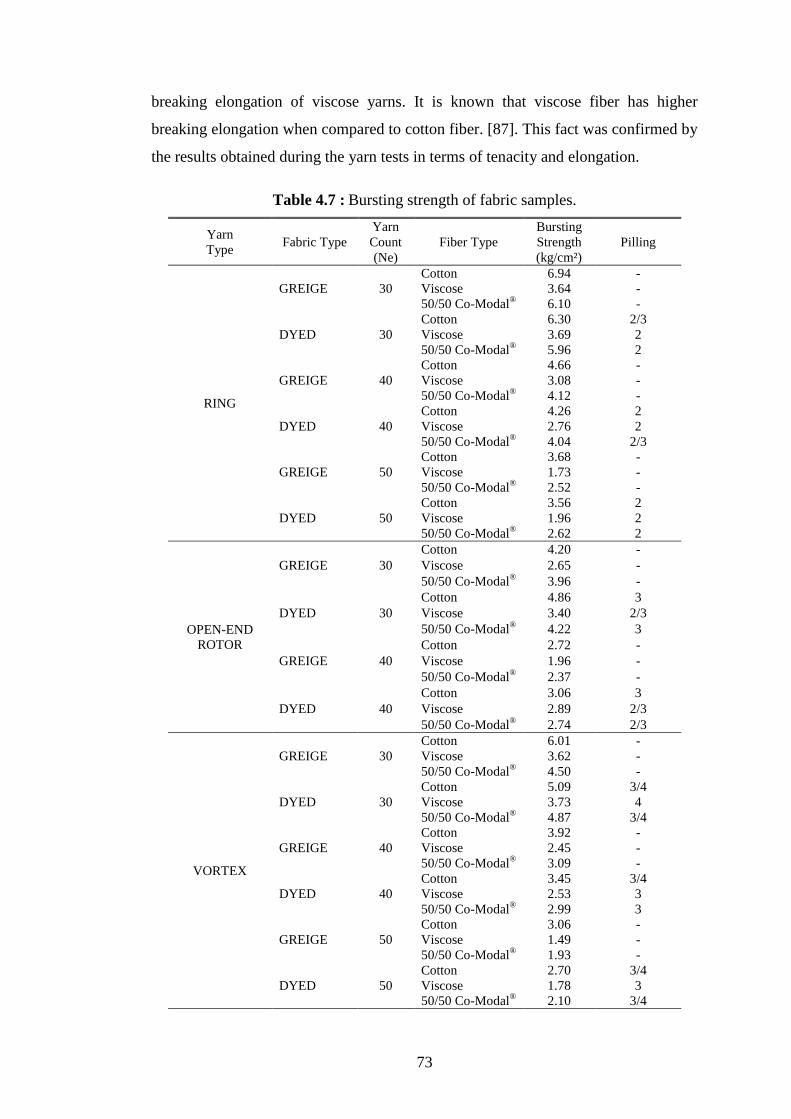
73
breaking elongation of viscose yarns. It is known that viscose fiber has higher
breaking elongation when compared to cotton fiber. [87]. This fact was confirmed by
the results obtained during the yarn tests in terms of tenacity and elongation.
Table 4.7 : Bursting strength of fabric samples.
Yarn
Type Fabric Type
Yarn
Count
(Ne)
Fiber Type
Bursting
Strength
(kg/cm²)
Pilling
RING
GREIGE 30
Cotton 6.94 -
Viscose 3.64 -
50/50 Co-Modal® 6.10 -
DYED 30
Cotton 6.30 2/3
Viscose 3.69 2
50/50 Co-Modal® 5.96 2
GREIGE 40
Cotton 4.66 -
Viscose 3.08 -
50/50 Co-Modal® 4.12 -
DYED 40
Cotton 4.26 2
Viscose 2.76 2
50/50 Co-Modal® 4.04 2/3
GREIGE 50
Cotton 3.68 -
Viscose 1.73 -
50/50 Co-Modal® 2.52 -
DYED 50
Cotton 3.56 2
Viscose 1.96 2
50/50 Co-Modal® 2.62 2
OPEN-END
ROTOR
GREIGE 30
Cotton 4.20 -
Viscose 2.65 -
50/50 Co-Modal® 3.96 -
DYED 30
Cotton 4.86 3
Viscose 3.40 2/3
50/50 Co-Modal® 4.22 3
GREIGE 40
Cotton 2.72 -
Viscose 1.96 -
50/50 Co-Modal® 2.37 -
DYED 40
Cotton 3.06 3
Viscose 2.89 2/3
50/50 Co-Modal® 2.74 2/3
VORTEX
GREIGE 30
Cotton 6.01 -
Viscose 3.62 -
50/50 Co-Modal® 4.50 -
DYED 30
Cotton 5.09 3/4
Viscose 3.73 4
50/50 Co-Modal® 4.87 3/4
GREIGE 40
Cotton 3.92 -
Viscose 2.45 -
50/50 Co-Modal® 3.09 -
DYED 40
Cotton 3.45 3/4
Viscose 2.53 3
50/50 Co-Modal® 2.99 3
GREIGE 50
Cotton 3.06 -
Viscose 1.49 -
50/50 Co-Modal® 1.93 -
DYED 50
Cotton 2.70 3/4
Viscose 1.78 3
50/50 Co-Modal® 2.10 3/4
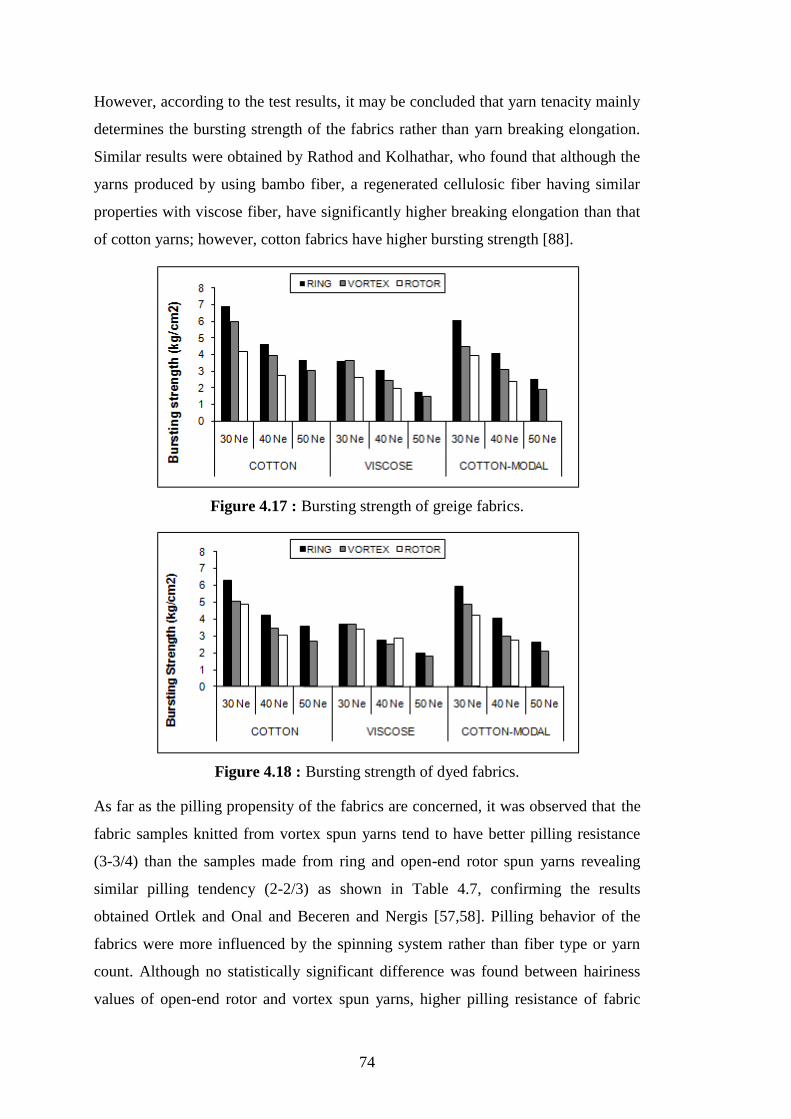
74
However, according to the test results, it may be concluded that yarn tenacity mainly
determines the bursting strength of the fabrics rather than yarn breaking elongation.
Similar results were obtained by Rathod and Kolhathar, who found that although the
yarns produced by using bambo fiber, a regenerated cellulosic fiber having similar
properties with viscose fiber, have significantly higher breaking elongation than that
of cotton yarns; however, cotton fabrics have higher bursting strength [88].
Figure 4.17 : Bursting strength of greige fabrics.
Figure 4.18 : Bursting strength of dyed fabrics.
As far as the pilling propensity of the fabrics are concerned, it was observed that the
fabric samples knitted from vortex spun yarns tend to have better pilling resistance
(3-3/4) than the samples made from ring and open-end rotor spun yarns revealing
similar pilling tendency (2-2/3) as shown in Table 4.7, confirming the results
obtained Ortlek and Onal and Beceren and Nergis [57,58]. Pilling behavior of the
fabrics were more influenced by the spinning system rather than fiber type or yarn
count. Although no statistically significant difference was found between hairiness
values of open-end rotor and vortex spun yarns, higher pilling resistance of fabric
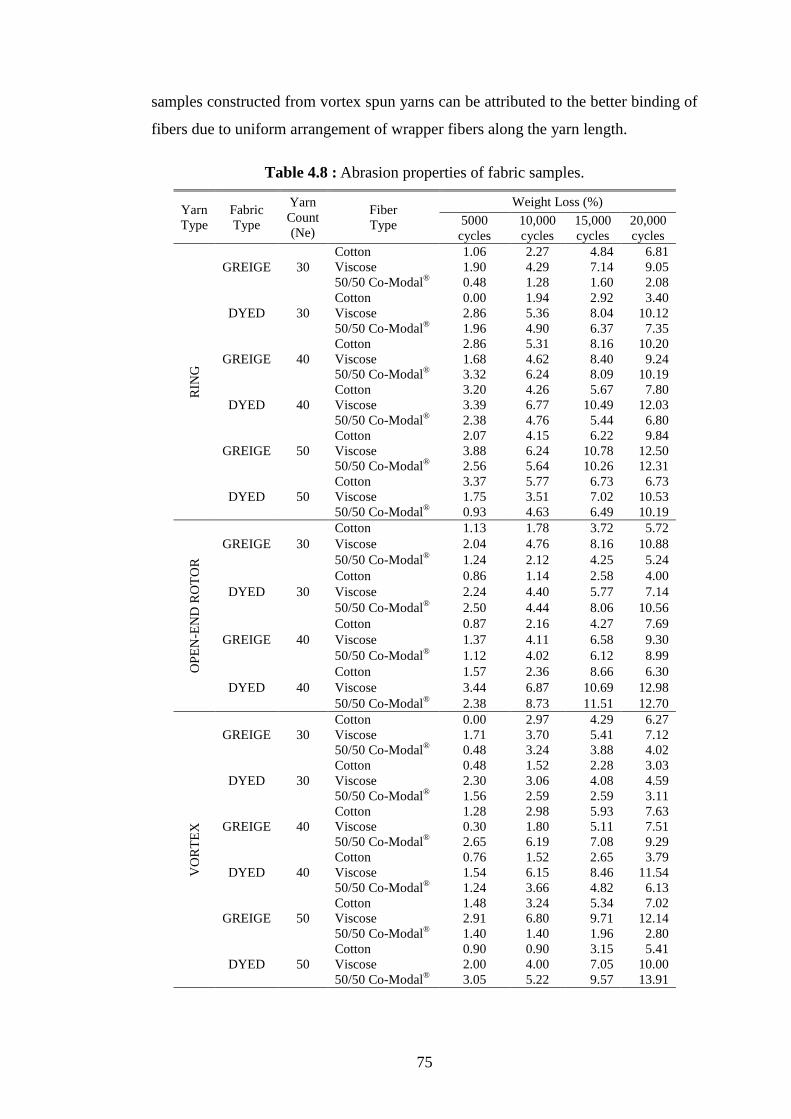
75
samples constructed from vortex spun yarns can be attributed to the better binding of
fibers due to uniform arrangement of wrapper fibers along the yarn length.
Table 4.8 : Abrasion properties of fabric samples.
Yarn
Type
Fabric
Type
Yarn
Count
(Ne)
Fiber
Type
Weight Loss (%)
5000
cycles
10,000
cycles
15,000
cycles
20,000
cycles
RIN
G
GREIGE 30
Cotton 1.06 2.27 4.84 6.81
Viscose 1.90 4.29 7.14 9.05
50/50 Co-Modal® 0.48 1.28 1.60 2.08
DYED 30
Cotton 0.00 1.94 2.92 3.40
Viscose 2.86 5.36 8.04 10.12
50/50 Co-Modal® 1.96 4.90 6.37 7.35
GREIGE 40
Cotton 2.86 5.31 8.16 10.20
Viscose 1.68 4.62 8.40 9.24
50/50 Co-Modal® 3.32 6.24 8.09 10.19
DYED 40
Cotton 3.20 4.26 5.67 7.80
Viscose 3.39 6.77 10.49 12.03
50/50 Co-Modal® 2.38 4.76 5.44 6.80
GREIGE 50
Cotton 2.07 4.15 6.22 9.84
Viscose 3.88 6.24 10.78 12.50
50/50 Co-Modal® 2.56 5.64 10.26 12.31
DYED 50
Cotton 3.37 5.77 6.73 6.73
Viscose 1.75 3.51 7.02 10.53
50/50 Co-Modal® 0.93 4.63 6.49 10.19
OP
EN
-EN
D R
OT
OR
GREIGE 30
Cotton 1.13 1.78 3.72 5.72
Viscose 2.04 4.76 8.16 10.88
50/50 Co-Modal® 1.24 2.12 4.25 5.24
DYED 30
Cotton 0.86 1.14 2.58 4.00
Viscose 2.24 4.40 5.77 7.14
50/50 Co-Modal® 2.50 4.44 8.06 10.56
GREIGE 40
Cotton 0.87 2.16 4.27 7.69
Viscose 1.37 4.11 6.58 9.30
50/50 Co-Modal® 1.12 4.02 6.12 8.99
DYED 40
Cotton 1.57 2.36 8.66 6.30
Viscose 3.44 6.87 10.69 12.98
50/50 Co-Modal® 2.38 8.73 11.51 12.70
VO
RT
EX
GREIGE 30
Cotton 0.00 2.97 4.29 6.27
Viscose 1.71 3.70 5.41 7.12
50/50 Co-Modal® 0.48 3.24 3.88 4.02
DYED 30
Cotton 0.48 1.52 2.28 3.03
Viscose 2.30 3.06 4.08 4.59
50/50 Co-Modal® 1.56 2.59 2.59 3.11
GREIGE 40
Cotton 1.28 2.98 5.93 7.63
Viscose 0.30 1.80 5.11 7.51
50/50 Co-Modal® 2.65 6.19 7.08 9.29
DYED 40
Cotton 0.76 1.52 2.65 3.79
Viscose 1.54 6.15 8.46 11.54
50/50 Co-Modal® 1.24 3.66 4.82 6.13
GREIGE 50
Cotton 1.48 3.24 5.34 7.02
Viscose 2.91 6.80 9.71 12.14
50/50 Co-Modal® 1.40 1.40 1.96 2.80
DYED 50
Cotton 0.90 0.90 3.15 5.41
Viscose 2.00 4.00 7.05 10.00
50/50 Co-Modal® 3.05 5.22 9.57 13.91

76
The weight loss of the fabric samples after 5,000, 10,000, 15,000 and 20,000 cycles
are given in Table 4.8 and the weight loss of greige and dyed fabrics after 20,000
cycles are illustrated in Figures 4.19 and 4.20.
As it can be seen from Table 4.8 and Figures 4.19 and 4.20, abrasion resistance of
the fabrics tends to decrease as the yarn gets finer. With regard to fiber type, cotton
was observed to be more resistant against abrasion than viscose and cotton-Modal®
blend irrespective of the yarn type.
The average mass loss values in abrasion of both greige and dyed fabrics knitted
from vortex spun yarns are generally lower than that of the fabrics knitted from ring
and open-end rotor spun yarns, in accordance with the findings of Rameshkumar et
al and Ortlek and Onal, supporting the consideration that wrapper fibers restrain the
movement of core fibers during abrasion [56,57].
Figure 4.19 : Abrasion resistance of greige fabrics.
Figure 4.20 : Abrasion resistance of dyed fabrics.
77
In conclusion, the following results were derived from the experiments that were
carried out to investigate the yarn properties obtained by vortex spinning system in
comparison with conventional ring and open-end rotor spun yarns and to examine the
effects of yarn properties on the fabric performances with special reference to
cellulosic fibers:
Hairiness of vortex and open-end rotor spun yarns are comparable and lower than
that of ring spun yarns. In addition, low hairiness of vortex spun yarns was
observed to result in lower pilling tendency, and therefore smoother fabric
appearance compared to ring and open-end rotor counterparts. Moreover, the
average mass loss values in abrasion of the fabrics knitted from vortex spun yarns
are generally lower than that of the fabrics knitted from ring and open-end rotor
spun yarns.
Vortex spun yarns are worse than their ring spun counterparts in terms of
evenness. As expected, yarn evenness deteriorates as the yarn becomes finer. On
the other hand, fiber type has not a significant impact on the evenness of the
yarns spun on vortex spinning system.
The difference between the number of thin places and thick places for the ring
and vortex spun yarn samples in counts of 30 Ne is statistically insignificant. The
significant differences occur in finer yarn counts. On the other hand, the
difference between the number of neps for ring and vortex spun yarns is
insignificant except for the 50 Ne cotton yarn.
While the rate of deterioration in evenness is similar for ring and vortex spun
yarns, the number of yarn imperfections, particularly the number of thick places
and neps for vortex spun yarns seems to increase significantly as the yarn
becomes finer for all fiber types.
Vortex spun yarns performed better in terms of evenness and imperfections when
compared to open-end rotor spun yarns.
Fiber type has not a significant impact on the number of thin places and thick
places for vortex spun yarns.
Yarns spun on vortex spinning system tend to have lower tenacity than ring spun
yarns, but higher than that of open-end rotor spun yarns. The tenacity of the yarns
was found to be directly reflected on the bursting strength of knitted fabrics.

78
However, the results revealed that spinning system does not significantly affect
the breaking elongation of the yarns.
Finally, it was observed that the pure cotton vortex spun yarns are comparable to
the viscose and cotton-Modal® blended vortex spun yarns when overall yarn
properties are considered, except from the high number of neps in fine count
yarns.
4.2 Effects of Draft and Yarn Delivery Speed on Viscose Vortex Spun Yarn
Properties
The effect of the ratio of drafts on the properties of jet spun yarns were investigated
by researchers using both three line and four line drafting systems on Murata air jet
spinning systems developed prior to vortex spinning system [7,38,89,90]. However,
as the structure and hence the properties of vortex spun yarns are different from jet
spun yarns, the study of the influence of draft on vortex spun yarn properties was
found significant and experiments were conducted to examine the impact of draft
ratios on the properties of vortex spun yarns in order to identify the drafting
conditions before proceeding to the main aspects of the research. In addition, a group
of the yarn samples was spun with two levels of yarn delivery speed to analyze the
effect of delivery speed and its interaction with the draft ratio on yarn properties.
In vortex spinning system, the ranges of the total draft ratio and main draft ratio vary
depending on the yarn delivery speed. The yarn delivery speed is determined by
considering the circumferential velocities of middle rollers (B and C) and the back
roller pair (A) in the drafting zone shown in Figure 2.3 [28]. In order to analyze the
interactions of draft ratio and delivery speed, a group of samples were spun with two
levels of delivery speed.
1.3 dtex 38mm viscose staple fiber was used to produce vortex spun yarns in count
of 40 Ne. After 3rd
passage of drawing, slivers with three different linear densities of
3.9 ktex, 3.2 ktex and 2.7 ktex were transferred to MVS 861 vortex spinning machine
using the values of spinning parameters shown in Table 4.9.
In order to determine the role of draft ratios on vortex spun yarn properties, two
levels of intermediate draft ratio as 2.3 and 2.5, and three levels of total draft ratio as
182, 216 and 267 were selected. It was resulted in obtaining yarn samples with six
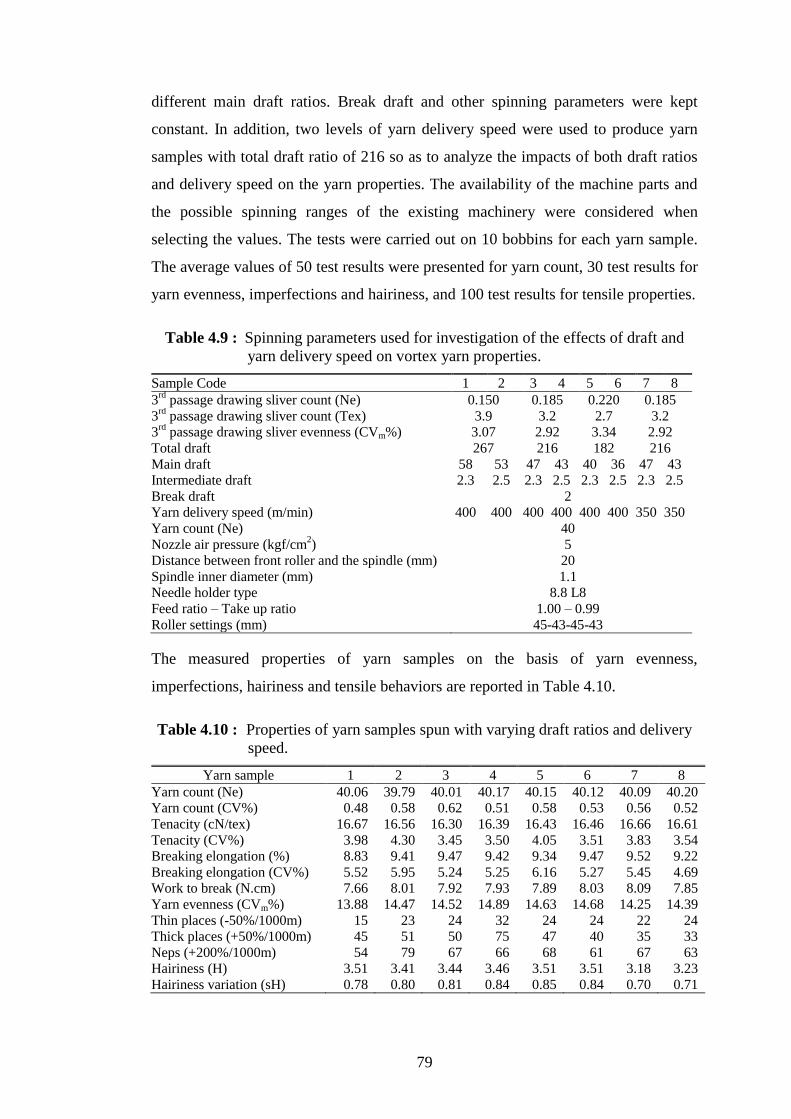
79
different main draft ratios. Break draft and other spinning parameters were kept
constant. In addition, two levels of yarn delivery speed were used to produce yarn
samples with total draft ratio of 216 so as to analyze the impacts of both draft ratios
and delivery speed on the yarn properties. The availability of the machine parts and
the possible spinning ranges of the existing machinery were considered when
selecting the values. The tests were carried out on 10 bobbins for each yarn sample.
The average values of 50 test results were presented for yarn count, 30 test results for
yarn evenness, imperfections and hairiness, and 100 test results for tensile properties.
Table 4.9 : Spinning parameters used for investigation of the effects of draft and
yarn delivery speed on vortex yarn properties.
Sample Code 1 2 3 4 5 6 7 8
3rd
passage drawing sliver count (Ne) 0.150 0.185 0.220 0.185
3rd
passage drawing sliver count (Tex) 3.9 3.2 2.7 3.2
3rd
passage drawing sliver evenness (CVm%) 3.07 2.92 3.34 2.92
Total draft 267 216 182 216
Main draft 58 53 47 43 40 36 47 43
Intermediate draft 2.3 2.5 2.3 2.5 2.3 2.5 2.3 2.5
Break draft 2
Yarn delivery speed (m/min) 400 400 400 400 400 400 350 350
Yarn count (Ne) 40
Nozzle air pressure (kgf/cm2) 5
Distance between front roller and the spindle (mm) 20
Spindle inner diameter (mm) 1.1
Needle holder type 8.8 L8
Feed ratio – Take up ratio 1.00 – 0.99
Roller settings (mm) 45-43-45-43
The measured properties of yarn samples on the basis of yarn evenness,
imperfections, hairiness and tensile behaviors are reported in Table 4.10.
Table 4.10 : Properties of yarn samples spun with varying draft ratios and delivery
speed.
Yarn sample 1 2 3 4 5 6 7 8
Yarn count (Ne) 40.06 39.79 40.01 40.17 40.15 40.12 40.09 40.20
Yarn count (CV%) 0.48 0.58 0.62 0.51 0.58 0.53 0.56 0.52
Tenacity (cN/tex) 16.67 16.56 16.30 16.39 16.43 16.46 16.66 16.61
Tenacity (CV%) 3.98 4.30 3.45 3.50 4.05 3.51 3.83 3.54
Breaking elongation (%) 8.83 9.41 9.47 9.42 9.34 9.47 9.52 9.22
Breaking elongation (CV%) 5.52 5.95 5.24 5.25 6.16 5.27 5.45 4.69
Work to break (N.cm) 7.66 8.01 7.92 7.93 7.89 8.03 8.09 7.85
Yarn evenness (CVm%) 13.88 14.47 14.52 14.89 14.63 14.68 14.25 14.39
Thin places (-50%/1000m) 15 23 24 32 24 24 22 24
Thick places (+50%/1000m) 45 51 50 75 47 40 35 33
Neps (+200%/1000m) 54 79 67 66 68 61 67 63
Hairiness (H) 3.51 3.41 3.44 3.46 3.51 3.51 3.18 3.23
Hairiness variation (sH) 0.78 0.80 0.81 0.84 0.85 0.84 0.70 0.71
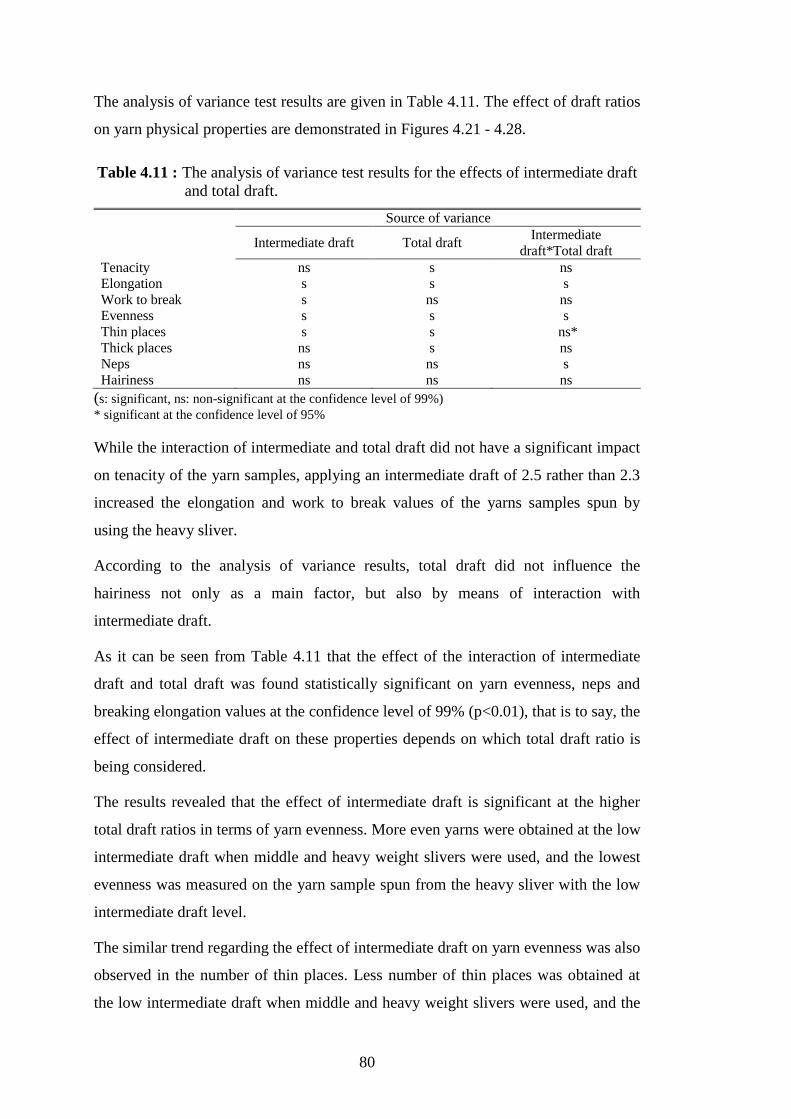
80
The analysis of variance test results are given in Table 4.11. The effect of draft ratios
on yarn physical properties are demonstrated in Figures 4.21 - 4.28.
Table 4.11 : The analysis of variance test results for the effects of intermediate draft
and total draft.
Source of variance
Intermediate draft Total draft Intermediate
draft*Total draft
Tenacity ns s ns
Elongation s s s
Work to break s ns ns
Evenness s s s
Thin places s s ns*
Thick places ns s ns
Neps ns ns s
Hairiness ns ns ns
(s: significant, ns: non-significant at the confidence level of 99%)
* significant at the confidence level of 95%
While the interaction of intermediate and total draft did not have a significant impact
on tenacity of the yarn samples, applying an intermediate draft of 2.5 rather than 2.3
increased the elongation and work to break values of the yarns samples spun by
using the heavy sliver.
According to the analysis of variance results, total draft did not influence the
hairiness not only as a main factor, but also by means of interaction with
intermediate draft.
As it can be seen from Table 4.11 that the effect of the interaction of intermediate
draft and total draft was found statistically significant on yarn evenness, neps and
breaking elongation values at the confidence level of 99% (p<0.01), that is to say, the
effect of intermediate draft on these properties depends on which total draft ratio is
being considered.
The results revealed that the effect of intermediate draft is significant at the higher
total draft ratios in terms of yarn evenness. More even yarns were obtained at the low
intermediate draft when middle and heavy weight slivers were used, and the lowest
evenness was measured on the yarn sample spun from the heavy sliver with the low
intermediate draft level.
The similar trend regarding the effect of intermediate draft on yarn evenness was also
observed in the number of thin places. Less number of thin places was obtained at
the low intermediate draft when middle and heavy weight slivers were used, and the

81
Figure 4.21 : Effect of draft on tenacity. Figure 4.22 : Effect of draft on breaking elongation.
Figure 4.23 : Effect of draft on work to break. Figure 4.24 : Effect of draft on hairiness.

82
Figure 4.25 : Effect of draft on yarn evenness. Figure 4.26 : Effect of draft on thin places.
Figure 4.27 : Effect of draft on thick places. Figure 4.28 : Effect of draft on neps.
83
yarn sample spun from the heavy sliver with the low intermediate draft level has the
least number of thin places.
Several works dealt with the investigation of the effects of drafting force and its
variability in 3-line roller drafting systems on the yarn quality have concluded that
there is a limited break draft beyond which the drafting force decreases and
concurrently increase in variation of drafting force causes deterioration in yarn
evenness and leads to increase in yarn imperfections [91-95]. Accordingly, it is
evident that intermediate draft level of 2.5 is far beyond the optimum level, and the
behavior in the yarn evenness and the number of thin places can be attributed to the
fact that while working with the intermediate draft level of 2.5, the resistance of the
fiber assembly, i.e. the drafting force in the drafting zone was lower than the peak
value basically achieved by the optimum draft level, caused poor fiber slipping
performance and the following lower main draft was not enough to acquire
appropriate fiber arrangement along the yarn.
Although the effect of total draft was found to be significant with regard to thick
places, the trend was not clear on the basis of total draft ratios. Concerning the
number of neps, the lower the intermediate draft, the lower the neps occurred in the
samples spun by using the heavy sliver.
3rd
passage draw frame sliver with count of 3.19 ktex was spun into yarns in count of
40 Ne by using two different yarn delivery speeds as 350 and 400 m/min. The results
of the analysis of variance, which was employed to observe the effect of intermediate
draft and delivery speed and their interactions on physical properties of yarn samples,
are displayed in Table 4.12. The effects of the variables on yarn properties are
demonstrated in Figures 4.29-4.36.
According to the t-test results, yarn samples that were spun with the delivery speed
of 350 m/min have significantly higher tenacity irrespective of the intermediate draft
level at 99% confidence level. In terms of breaking elongation, slightly higher values
were obtained with high intermediate draft level in delivery speed of 350 m/min.
The analysis of variance showed that intermediate draft had a significant effect on
yarn evenness and the number of thin places at 99% confidence level. However,
further analysis revealed that only the evenness and number of thin places values of
the yarn samples spun by using the yarn delivery speed of 400 m/min differ

84
considerably with regard to the level of intermediate draft. Better evenness and fewer
thin places were obtained with intermediate draft level of 2.3 at high level of delivery
speed.
Table 4.12 : Analysis of variance test results for the effects of intermediate draft and
delivery speed.
Source of variance
Intermediate draft Delivery speed Intermediate
draft*Delivery speed
Tenacity ns s ns
Elongation s ns s
Work to break ns ns ns
Evenness s s ns
Thin places s s ns
Thick places ns s ns
Neps ns ns ns
Hairiness ns s ns
(s: significant, ns: non-significant at the confidence level of 99%)
On the other hand, intermediate draft did not have a significant impact on the
mentioned yarn properties at delivery speed of 350m/min; however, better results
were obtained in both levels of intermediate draft with the delivery speed of
350m/min when compared to the results obtained by using the level of 400 m/min.
Similar to yarn evenness and thin places, lower yarn delivery speed resulted in fewer
number of thick places occurred in the yarn. However, as revealed in results of
variance analysis, neither the intermediate draft nor the delivery speed had impact on
neps values of the samples.
The effect of delivery speed on yarn evenness and imperfections is related to the
efficiency of the air jet stream, and the reduced time for the fiber strand passing
through the nozzle at higher delivery speeds results in deterioration of the yarn
properties in terms of evenness and imperfections due to increase in irregular
wrappings as well as the amount of wild fibers [34,36,43,45].
The yarn delivery speed also affected the hairiness. The results regarding hairiness
revealed that as the yarn delivery speed increases, hairiness also increases for both
levels of intermediate draft.
Higher hairiness with increased delivery speed is in agreement with the earlier
findings that have concluded that the increased frictional forces acting on the yarn
and the decreased efficiency of the air jet stream due to the reduced time for which
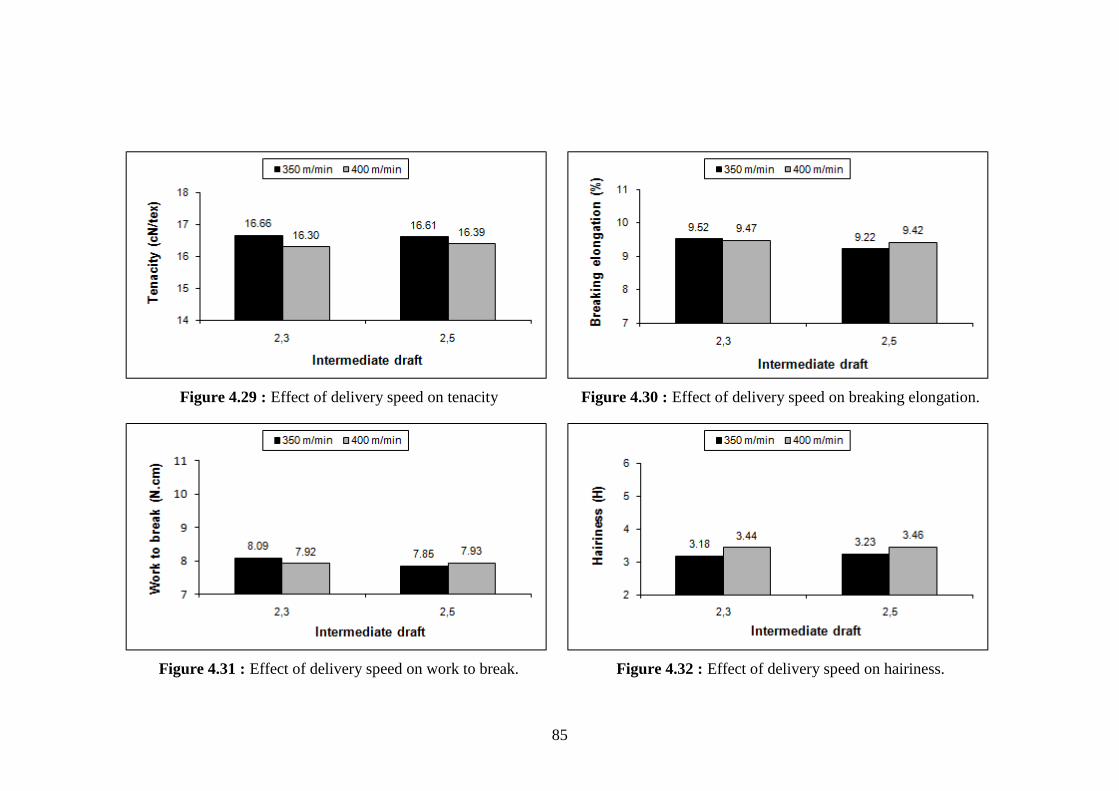
85
Figure 4.29 : Effect of delivery speed on tenacity Figure 4.30 : Effect of delivery speed on breaking elongation.
Figure 4.31 : Effect of delivery speed on work to break. Figure 4.32 : Effect of delivery speed on hairiness.

86
Figure 4.33 : Effect of delivery speed on yarn evenness. Figure 4.34 : Effect of delivery speed on thin places.
Figure 4.35 : Effect of delivery speed on thick places. Figure 4.36 : Effect of delivery speed on neps.
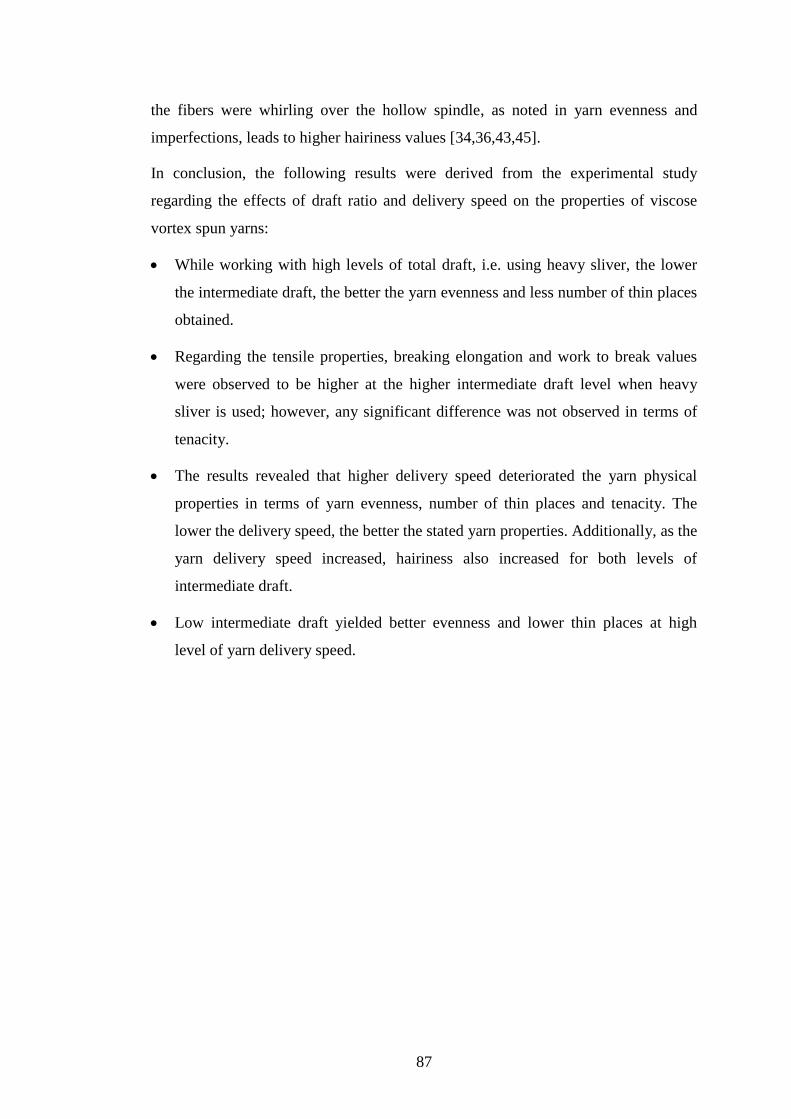
87
the fibers were whirling over the hollow spindle, as noted in yarn evenness and
imperfections, leads to higher hairiness values [34,36,43,45].
In conclusion, the following results were derived from the experimental study
regarding the effects of draft ratio and delivery speed on the properties of viscose
vortex spun yarns:
While working with high levels of total draft, i.e. using heavy sliver, the lower
the intermediate draft, the better the yarn evenness and less number of thin places
obtained.
Regarding the tensile properties, breaking elongation and work to break values
were observed to be higher at the higher intermediate draft level when heavy
sliver is used; however, any significant difference was not observed in terms of
tenacity.
The results revealed that higher delivery speed deteriorated the yarn physical
properties in terms of yarn evenness, number of thin places and tenacity. The
lower the delivery speed, the better the stated yarn properties. Additionally, as the
yarn delivery speed increased, hairiness also increased for both levels of
intermediate draft.
Low intermediate draft yielded better evenness and lower thin places at high
level of yarn delivery speed.

88
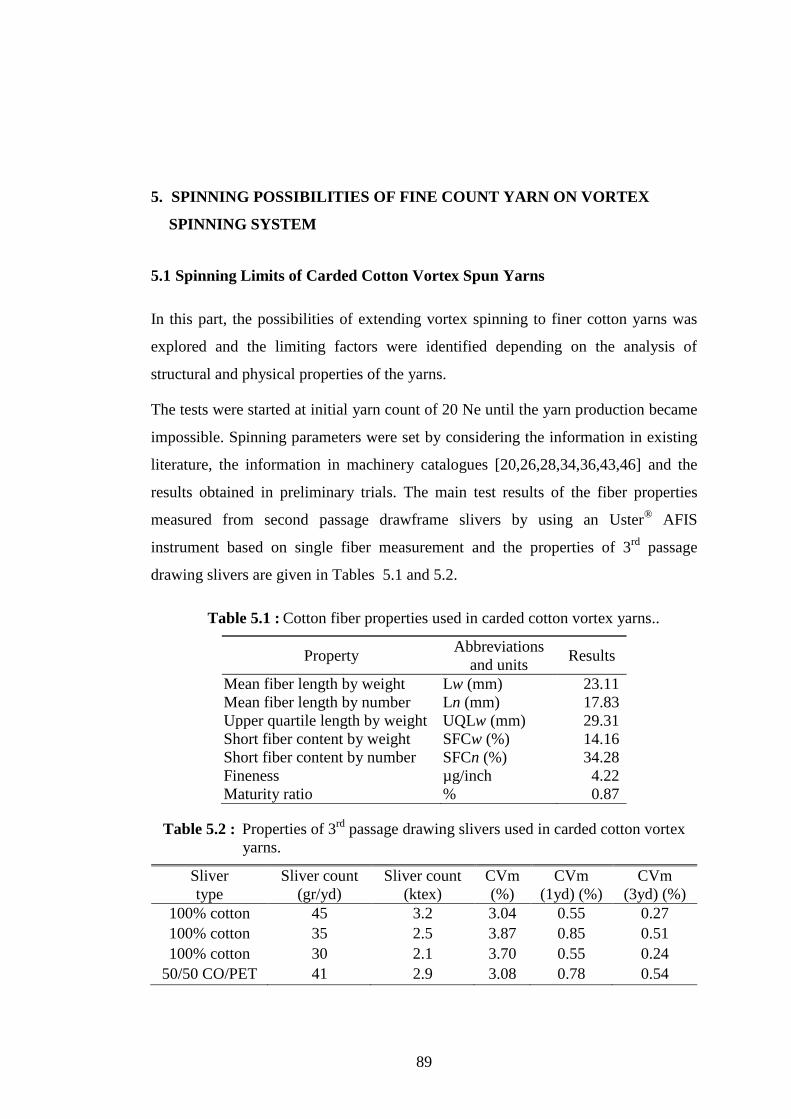
89
5. SPINNING POSSIBILITIES OF FINE COUNT YARN ON VORTEX
SPINNING SYSTEM
5.1 Spinning Limits of Carded Cotton Vortex Spun Yarns
In this part, the possibilities of extending vortex spinning to finer cotton yarns was
explored and the limiting factors were identified depending on the analysis of
structural and physical properties of the yarns.
The tests were started at initial yarn count of 20 Ne until the yarn production became
impossible. Spinning parameters were set by considering the information in existing
literature, the information in machinery catalogues [20,26,28,34,36,43,46] and the
results obtained in preliminary trials. The main test results of the fiber properties
measured from second passage drawframe slivers by using an Uster® AFIS
instrument based on single fiber measurement and the properties of 3rd
passage
drawing slivers are given in Tables 5.1 and 5.2.
Property Abbreviations
and units Results
Mean fiber length by weight Lw (mm) 23.11
Mean fiber length by number Ln (mm) 17.83
Upper quartile length by weight UQLw (mm) 29.31
Short fiber content by weight SFCw (%) 14.16
Short fiber content by number SFCn (%) 34.28
Fineness µg/inch 4.22
Maturity ratio % 0.87
Sliver
type
Sliver count
(gr/yd)
Sliver count
(ktex)
CVm
(%)
CVm
(1yd) (%)
CVm
(3yd) (%)
100% cotton 45 3.2 3.04 0.55 0.27
100% cotton 35 2.5 3.87 0.85 0.51
100% cotton 30 2.1 3.70 0.55 0.24
50/50 CO/PET 41 2.9 3.08 0.78 0.54
Table 5.1 : Cotton fiber properties used in carded cotton vortex yarns..
Table 5.2 : Properties of 3rd
passage drawing slivers used in carded cotton vortex
yarns.
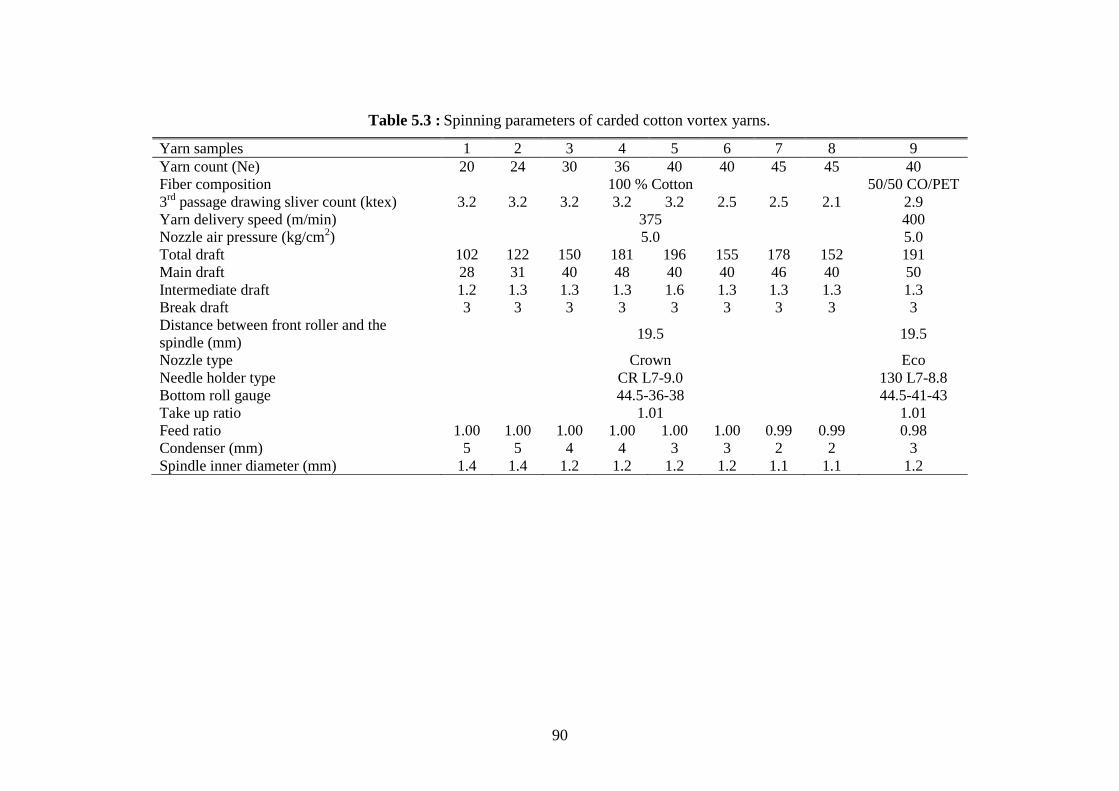
90
Yarn samples 1 2 3 4 5 6 7 8 9
Yarn count (Ne) 20 24 30 36 40 40 45 45 40
Fiber composition 100 % Cotton 50/50 CO/PET
3rd passage drawing sliver count (ktex) 3.2 3.2 3.2 3.2 3.2 2.5 2.5 2.1 2.9
Yarn delivery speed (m/min) 375 400
Nozzle air pressure (kg/cm2) 5.0 5.0
Total draft 102 122 150 181 196 155 178 152 191
Main draft 28 31 40 48 40 40 46 40 50
Intermediate draft 1.2 1.3 1.3 1.3 1.6 1.3 1.3 1.3 1.3
Break draft 3 3 3 3 3 3 3 3 3
Distance between front roller and the
spindle (mm) 19.5 19.5
Nozzle type Crown Eco
Needle holder type CR L7-9.0 130 L7-8.8
Bottom roll gauge 44.5-36-38 44.5-41-43
Take up ratio 1.01 1.01
Feed ratio 1.00 1.00 1.00 1.00 1.00 1.00 0.99 0.99 0.98
Condenser (mm) 5 5 4 4 3 3 2 2 3
Spindle inner diameter (mm) 1.4 1.4 1.2 1.2 1.2 1.2 1.1 1.1 1.2
Table 5.3 : Spinning parameters of carded cotton vortex yarns.

91
The spinning parameters used in the production of yarn samples are given in Table
5.3. Narrower condenser and spindle with smaller inner diameter were used as the
yarn becomes finer. In addition, 50/50 cotton-polyester yarns in count of 40 Ne were
spun. Four bobbins were spun at each condition. However, it is important to state that
cotton used in cotton-polyester blended yarns is not the same cotton used in the
spinning of 100% carded cotton yarns. The blended yarns were produced in order
only to observe the behavior of polyester blended yarn in terms of mainly structural
features of the yarn in comparison with 100% carded cotton yarns.
The average values of 12 test results were presented for yarn evenness and
imperfections for each yarn sample, and 100 readings were taken for tensile
properties of each yarn sample.
5.1.1 Yarn structure
The structure of vortex spun yarn consists of two parts as core and sheath, which can
be easily observed by untwisting the yarn. In order to determine the ratio of wrapper
fibers and core fibers, small pieces of yarn samples were untwisted manually and
wrapper and core fibers were separated and weighed. The weight and ratio of
wrapper and core fibers in carded cotton vortex spun yarns are given in Table 5.4 and
illustrated in Figure 5.1.
Yarn count (Ne)
Wrapper
fiber
weight
(g)
Core fiber
weight
(g)
Wrapper
fiber ratio
(%)
Core
fiber ratio
(%)
Wrapper fiber/
core fiber
19.95 0.0039 0.0089 30.29 69.71 0.43
23.87 0.0046 0.0095 32.50 67.50 0.48
29.46 0.0048 0.0074 39.48 60.52 0.65
36.00 0.0037 0.0050 42.80 57.20 0.75
39.19 - heavy sliver 0.0048 0.0064 42.72 57.28 0.75
39.67 - light sliver 0.0034 0.0042 44.70 55.30 0.81
45.14 - heavy sliver 0.0040 0.0044 47.33 52.67 0.90
44.30 - light sliver 0.0029 0.0034 46.26 53.74 0.86
39.86 - 50/50 CO/PET 0.0023 0.0048 32.75 67.25 0.49
Table 5.4 : Weight and ratio of wrapper and core fibers in carded cotton vortex spun
yarns.
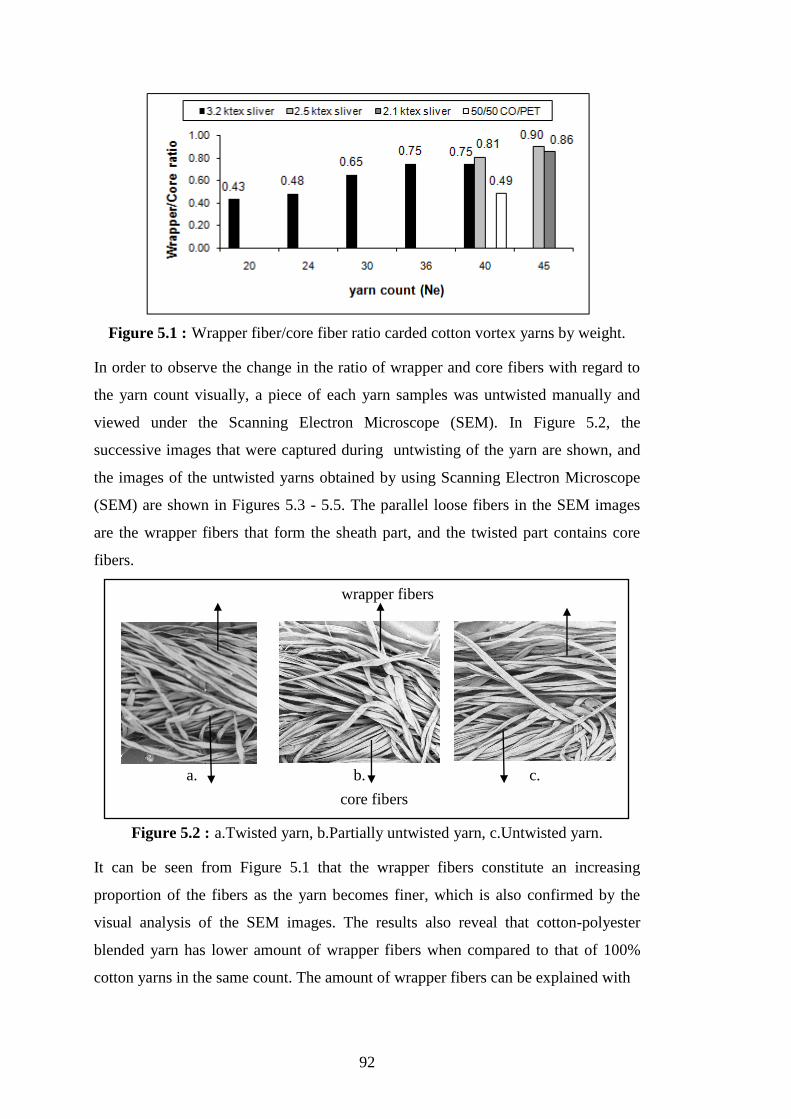
92
Figure 5.1 : Wrapper fiber/core fiber ratio carded cotton vortex yarns by weight.
In order to observe the change in the ratio of wrapper and core fibers with regard to
the yarn count visually, a piece of each yarn samples was untwisted manually and
viewed under the Scanning Electron Microscope (SEM). In Figure 5.2, the
successive images that were captured during untwisting of the yarn are shown, and
the images of the untwisted yarns obtained by using Scanning Electron Microscope
(SEM) are shown in Figures 5.3 - 5.5. The parallel loose fibers in the SEM images
are the wrapper fibers that form the sheath part, and the twisted part contains core
fibers.
a. b. c.
Figure 5.2 : a.Twisted yarn, b.Partially untwisted yarn, c.Untwisted yarn.
It can be seen from Figure 5.1 that the wrapper fibers constitute an increasing
proportion of the fibers as the yarn becomes finer, which is also confirmed by the
visual analysis of the SEM images. The results also reveal that cotton-polyester
blended yarn has lower amount of wrapper fibers when compared to that of 100%
cotton yarns in the same count. The amount of wrapper fibers can be explained with
wrapper fibers
core fibers
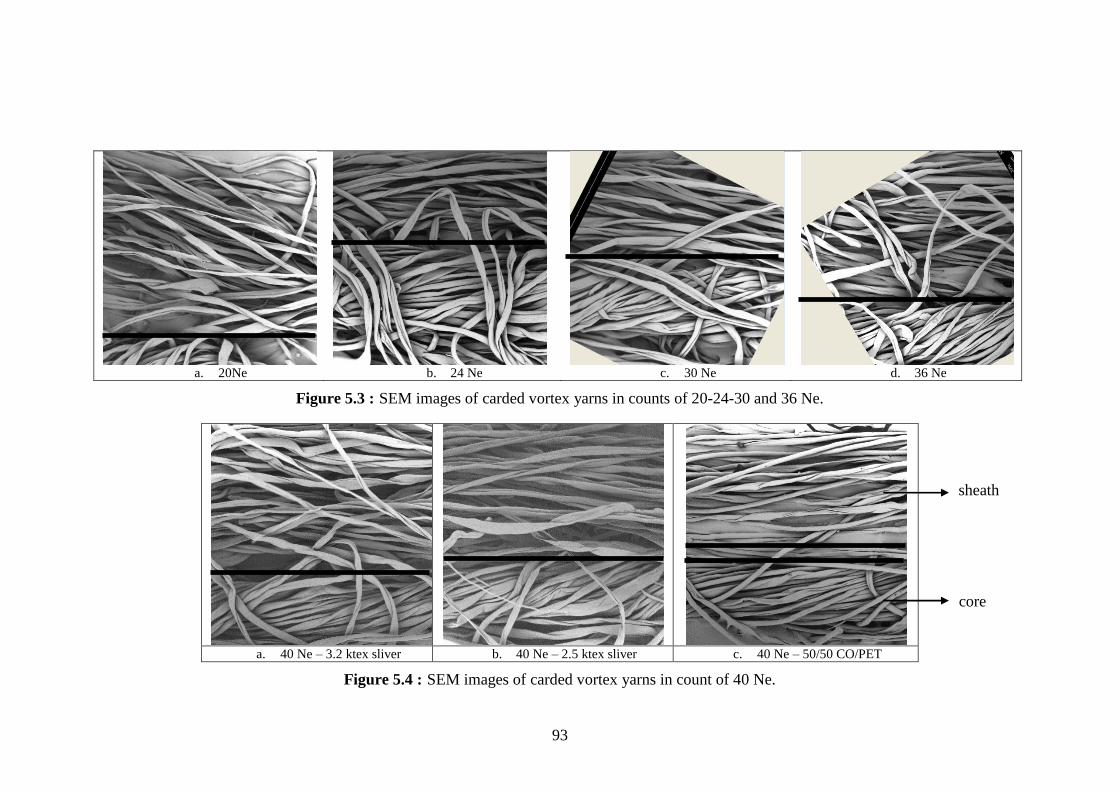
93
a. 20Ne b. 24 Ne c. 30 Ne d. 36 Ne
Figure 5.3 : SEM images of carded vortex yarns in counts of 20-24-30 and 36 Ne.
a. 40 Ne – 3.2 ktex sliver b. 40 Ne – 2.5 ktex sliver c. 40 Ne – 50/50 CO/PET
Figure 5.4 : SEM images of carded vortex yarns in count of 40 Ne.
core
sheath
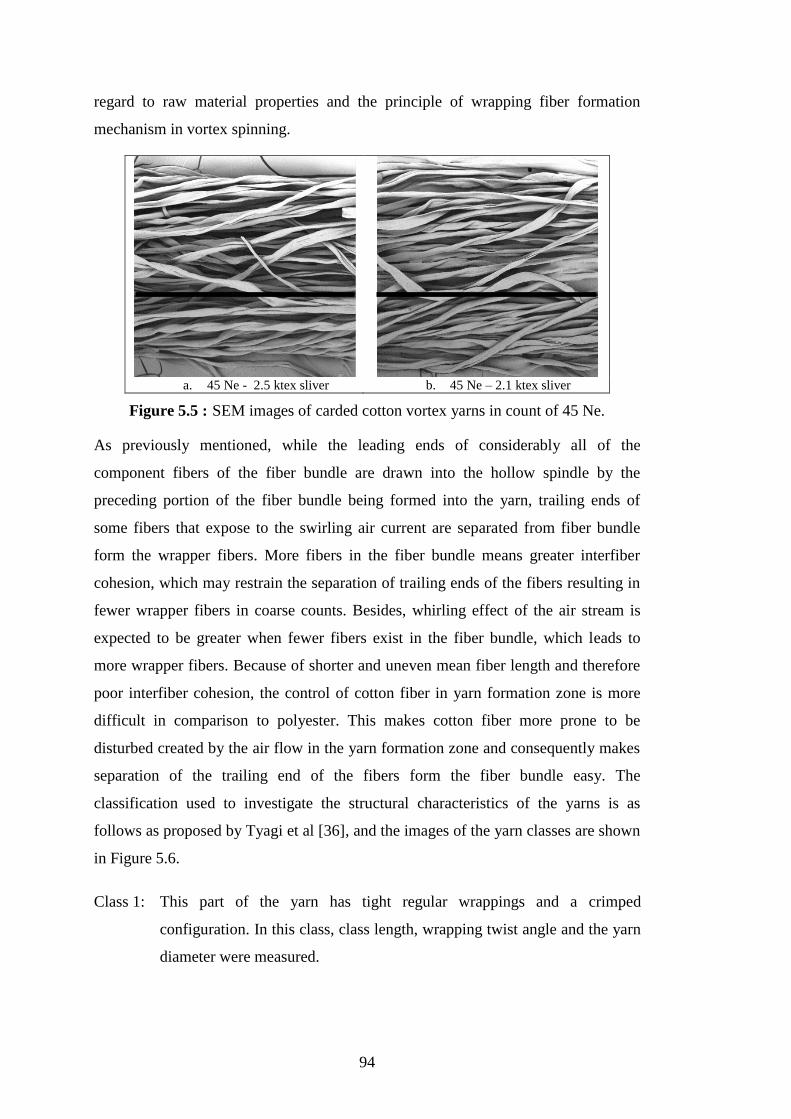
94
regard to raw material properties and the principle of wrapping fiber formation
mechanism in vortex spinning.
a. 45 Ne - 2.5 ktex sliver b. 45 Ne – 2.1 ktex sliver
Figure 5.5 : SEM images of carded cotton vortex yarns in count of 45 Ne.
As previously mentioned, while the leading ends of considerably all of the
component fibers of the fiber bundle are drawn into the hollow spindle by the
preceding portion of the fiber bundle being formed into the yarn, trailing ends of
some fibers that expose to the swirling air current are separated from fiber bundle
form the wrapper fibers. More fibers in the fiber bundle means greater interfiber
cohesion, which may restrain the separation of trailing ends of the fibers resulting in
fewer wrapper fibers in coarse counts. Besides, whirling effect of the air stream is
expected to be greater when fewer fibers exist in the fiber bundle, which leads to
more wrapper fibers. Because of shorter and uneven mean fiber length and therefore
poor interfiber cohesion, the control of cotton fiber in yarn formation zone is more
difficult in comparison to polyester. This makes cotton fiber more prone to be
disturbed created by the air flow in the yarn formation zone and consequently makes
separation of the trailing end of the fibers form the fiber bundle easy. The
classification used to investigate the structural characteristics of the yarns is as
follows as proposed by Tyagi et al [36], and the images of the yarn classes are shown
in Figure 5.6.
Class 1: This part of the yarn has tight regular wrappings and a crimped
configuration. In this class, class length, wrapping twist angle and the yarn
diameter were measured.
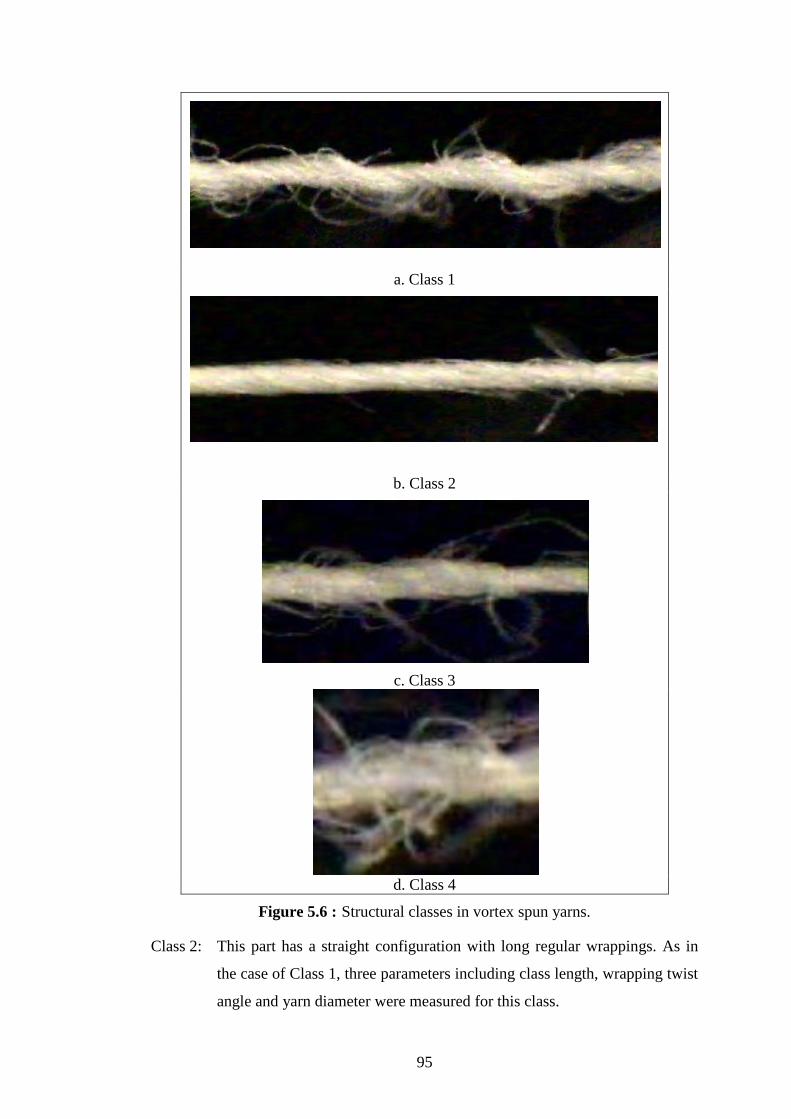
95
a. Class 1
b. Class 2
c. Class 3
d. Class 4
Figure 5.6 : Structural classes in vortex spun yarns.
Class 2: This part has a straight configuration with long regular wrappings. As in
the case of Class 1, three parameters including class length, wrapping twist
angle and yarn diameter were measured for this class.
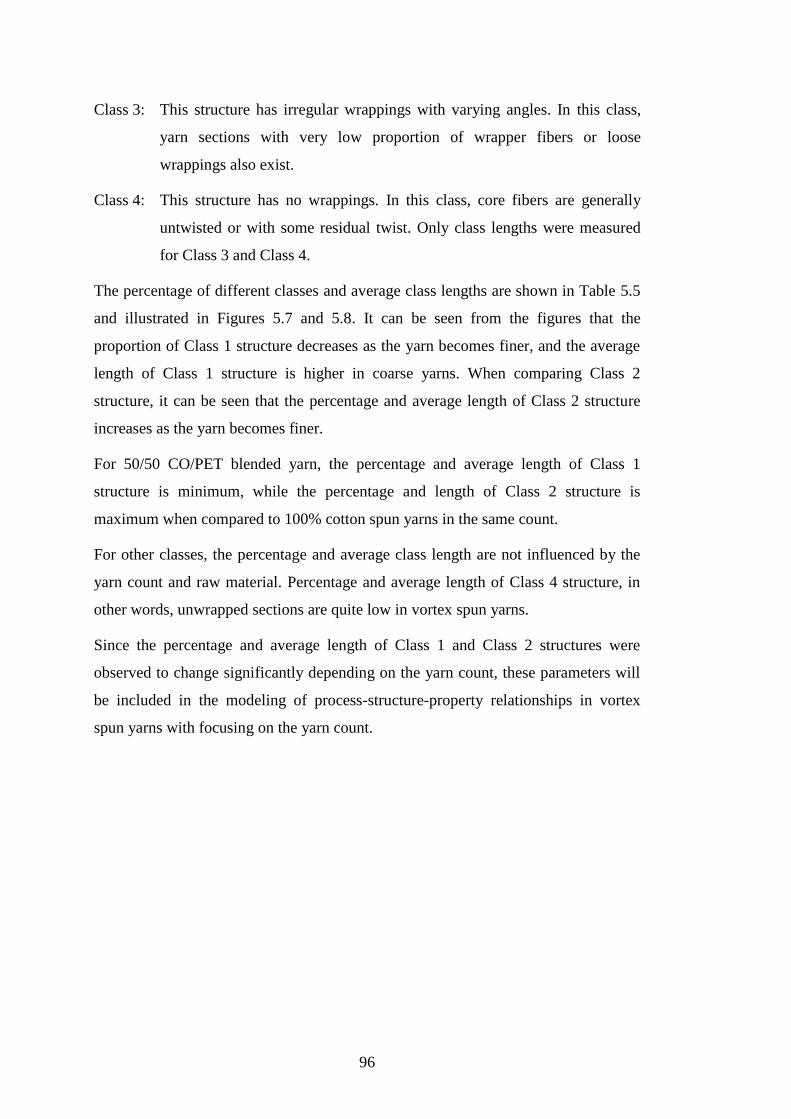
96
Class 3: This structure has irregular wrappings with varying angles. In this class,
yarn sections with very low proportion of wrapper fibers or loose
wrappings also exist.
Class 4: This structure has no wrappings. In this class, core fibers are generally
untwisted or with some residual twist. Only class lengths were measured
for Class 3 and Class 4.
The percentage of different classes and average class lengths are shown in Table 5.5
and illustrated in Figures 5.7 and 5.8. It can be seen from the figures that the
proportion of Class 1 structure decreases as the yarn becomes finer, and the average
length of Class 1 structure is higher in coarse yarns. When comparing Class 2
structure, it can be seen that the percentage and average length of Class 2 structure
increases as the yarn becomes finer.
For 50/50 CO/PET blended yarn, the percentage and average length of Class 1
structure is minimum, while the percentage and length of Class 2 structure is
maximum when compared to 100% cotton spun yarns in the same count.
For other classes, the percentage and average class length are not influenced by the
yarn count and raw material. Percentage and average length of Class 4 structure, in
other words, unwrapped sections are quite low in vortex spun yarns.
Since the percentage and average length of Class 1 and Class 2 structures were
observed to change significantly depending on the yarn count, these parameters will
be included in the modeling of process-structure-property relationships in vortex
spun yarns with focusing on the yarn count.
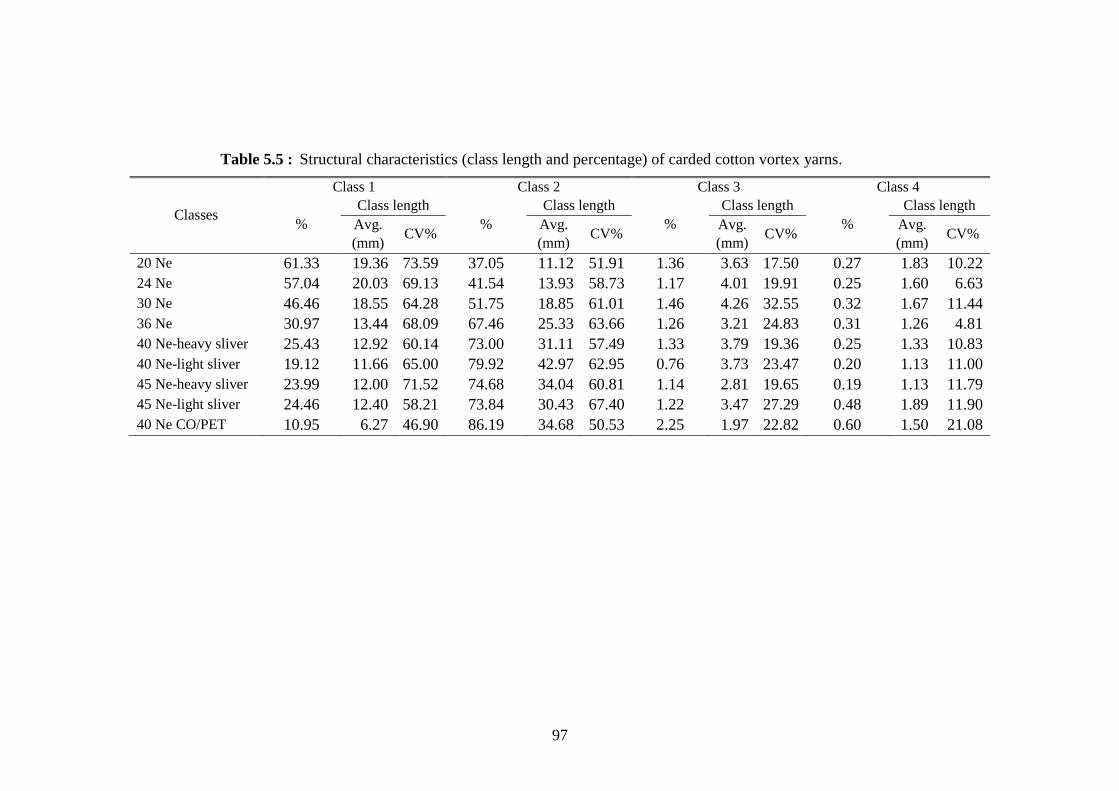
97
Classes
Class 1 Class 2 Class 3 Class 4
%
Class length
%
Class length
%
Class length
%
Class length
Avg.
(mm) CV%
Avg.
(mm) CV%
Avg.
(mm) CV%
Avg.
(mm) CV%
20 Ne 61.33 19.36 73.59 37.05 11.12 51.91 1.36 3.63 17.50 0.27 1.83 10.22
24 Ne 57.04 20.03 69.13 41.54 13.93 58.73 1.17 4.01 19.91 0.25 1.60 6.63
30 Ne 46.46 18.55 64.28 51.75 18.85 61.01 1.46 4.26 32.55 0.32 1.67 11.44
36 Ne 30.97 13.44 68.09 67.46 25.33 63.66 1.26 3.21 24.83 0.31 1.26 4.81
40 Ne-heavy sliver 25.43 12.92 60.14 73.00 31.11 57.49 1.33 3.79 19.36 0.25 1.33 10.83
40 Ne-light sliver 19.12 11.66 65.00 79.92 42.97 62.95 0.76 3.73 23.47 0.20 1.13 11.00
45 Ne-heavy sliver 23.99 12.00 71.52 74.68 34.04 60.81 1.14 2.81 19.65 0.19 1.13 11.79
45 Ne-light sliver 24.46 12.40 58.21 73.84 30.43 67.40 1.22 3.47 27.29 0.48 1.89 11.90
40 Ne CO/PET 10.95 6.27 46.90 86.19 34.68 50.53 2.25 1.97 22.82 0.60 1.50 21.08
Table 5.5 : Structural characteristics (class length and percentage) of carded cotton vortex yarns.
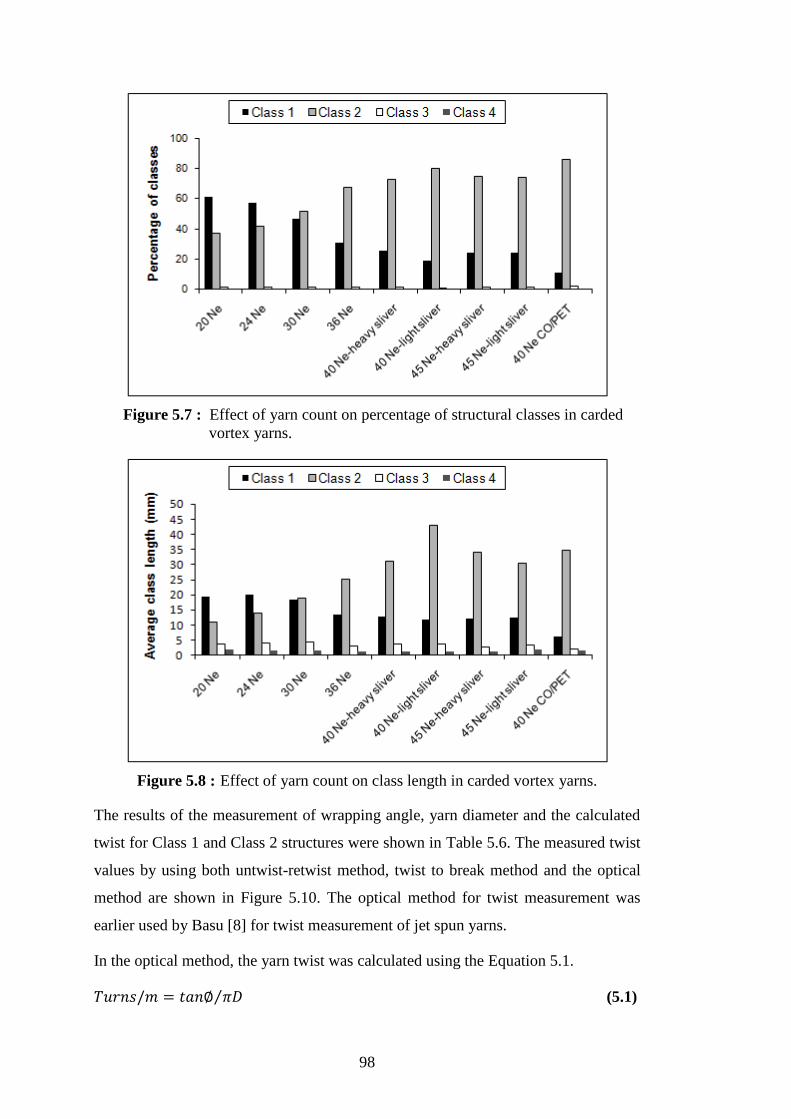
98
Figure 5.7 : Effect of yarn count on percentage of structural classes in carded
vortex vortex yarns.
Figure 5.8 : Effect of yarn count on class length in carded vortex yarns.
The results of the measurement of wrapping angle, yarn diameter and the calculated
twist for Class 1 and Class 2 structures were shown in Table 5.6. The measured twist
values by using both untwist-retwist method, twist to break method and the optical
method are shown in Figure 5.10. The optical method for twist measurement was
earlier used by Basu [8] for twist measurement of jet spun yarns.
In the optical method, the yarn twist was calculated using the Equation 5.1.
(5.1)

99
where is the angle of wrapping and D is the yarn diameter at that point. 300
readings were taken by the optical method.
Figure 5.9 : Measurement of wrapping angle in vortex spun yarn.
The results reveal that twist measured by optical method is higher than the twist
measured on twist measurement device for all yarns. By using the optical method,
wrapping angle of the surface fibers, which arrange helically around the yarn, is
measured and the twist is determined based on the wrapping angle of the surface
fibers and the diameter of the yarn at that point. Therefore, it should be kept in mind
that the optical method assumes that all fibers constituting the vortex spun yarn are
arranged helically both in inner and outer part of the yarn. However, most of the core
fibers, or the fiber ends embedded in the yarn core, do not follow a helical path in
vortex spun yarns. Consequently, the twist measured on the basis of untwist-retwist
principle is lower because of the fact that only the fibers wrapping along the yarn
length are untwisted, wrapper and core fibers are separated, and the measured twist
of the yarn is dependent on the length and the amount of the fibers wrapping around
the yarn core.
In vortex spun yarns, the twist is not distributed evenly and therefore. Measured twist
depending on wrapping angle and yarn diameter for the yarn sections with long
regular wrappings (Class 2) is slightly higher than that of the sections with tight
regular wrappings (Class 1). While the helix angle of the wrapper fiber on the yarn
surface in Class 1 and Class 2 structures differs slightly, yarn diameter is smaller in
Class 2 structures, which resulted in higher twist measured in Class 2 structures.
Ф

100
Class 1 Class 2
Wrapping
angle ( ° )
CV
(%)
Yarn diameter
(mm)
CV
(%)
Measured twist
(turns/m)
CV
(%)
Wrapping angle ( ° )
CV
(%)
Yarn diameter
(mm)
CV
(%)
Measured twist
(turns/m)
CV
(%)
20 Ne 36.04 10.77 0.284 18.53 843.67 20.70 33.72 12.41 0.240 11.44 901.17 17.85
24 Ne 33.45 12.58 0.229 15.23 920.46 15.76 32.35 14.34 0.203 17.64 992.59 13.54
30 Ne 36.87 12.95 0.227 21.45 1044.86 24.87 32.74 10.46 0.178 10.34 1151.46 21.57
36 Ne 29.60 19.68 0.181 16.25 1036.80 29.16 28.16 20.83 0.166 16.87 1079.46 33.84
40 Ne-heavy sliver 31.48 11.26 0.178 17.15 1096.65 18.88 28.44 17.34 0.152 16.54 1131.93 18.76
40 Ne-light sliver 32.77 16.06 0.185 11.08 1141.46 25.54 32.92 20.35 0.178 15.45 1196.08 26.60
45 Ne heavy sliver 30.62 15.98 0.178 18.78 1060.10 14.35 30.47 11.32 0.152 14.77 1229.26 19.87
45 Ne-light sliver 27.23 17.29 0.165 14.95 992.80 34.50 32.80 10.16 0.163 21.09 1243.32 31.24
40 Ne CO/PET 30.64 17.13 0.192 14.22 1016.19 26.52 30.47 16.88 0.187 15.08 1098.46 74.99
Table 5.6 : Structural characteristics (wrapping twist angle and diameter) of carded cotton vortex yarns.
101
Figure 5.10 : Turns per meter of carded cotton vortex yarns.

102
If the twist measured on automatic twist tester working on untwist-retwist principle
is compared, it can be seen that more residual twist exist as the yarn becomes finer.
This can be attributed to the fact that higher percentage of wrapper fibers in finer
yarns with smaller yarn diameter results in more and longer wrapping along the yarn.
The twist level of the cotton-polyester blended yarn sample measured on automatic
twist measurement device is lower when compared to the 100% cotton yarn samples
in the same count. The trend in twist measurement results seem to be similar with the
ratio of wrapper fibers to core fibers in the yarn structures. As a result, it can be
concluded that the higher amount of wrapper fiber results in higher twist level in the
yarn.
5.1.2 Yarn physical properties
The measured properties of yarn samples in terms of evenness, imperfections,
hairiness, and tensile properties are shown in Table 5.8 and Figures 5.11 – 5.18. The
analysis of variance results showing the effect of yarn count on the above mentioned
properties are demonstrated in Table 5.7.
As it is seen from Table 5.7, the p-values yarn evenness, imperfections, hairiness,
tenacity and breaking elongation are smaller 0.01 and it is indicating that there is a
statistically significant difference among the mean values of the mentioned yarn
properties at the 99% level of confidence. Therefore, post hoc tests were performed
to determine which samples differ.
F-value P-value
Tenacity 26.875 0.000
Breaking elongation 239.595 0.000
Yarn evenness 423.433 0.000
Thin places 466.382 0.000
Thick places 88.429 0.000
Neps 682.670 0.000
Hairiness 49.600 0.000
The results revealed that as the yarn becomes finer, the yarn becomes more uneven
and the number of yarn imperfections increases markedly. The regularity of the yarn
mainly relies on the arrangement of the fiber within the yarn. The uniform
arrangement of fibers within the yarn is generally deteriorated due to variations in
Table 5.7 : The analysis of variance for the mean values of carded cotton vortex
yarn properties.

103
Yarn samples 1 2 3 4 5 6 7 8 9
Fiber composition 100 % Cotton 50/50 CO/PET
Sliver count (ktex) 3.2 3.2 3.2 3.2 3.2 2.5 2.5 2.1 2.9
Measured yarn count (Ne) 19.95 23.87 29.46 36.00 39.19 39.67 45.14 44.30 39.86
Yarn count variation (CV%) 1.39 0.69 0.72 0.78 0.59 0.81 0.89 0.41 1.15
Twist (turns/meter) 454.42 535.02 679.12 762.98 768.44 774.48 853.50 871.50 437.34
Twist (CV%) 11.31 12.59 8.80 7.32 6.62 7.00 6.08 6.02 12.49
Tenacity (cN/tex) 11.57 11.12 10.95 10.22 10.46 10.30 10.10 10.13 13.55
Tenacity (CV%) 9.07 8.52 8.46 11.39 9.81 9.01 11.57 11.18 12.94
Breaking elongation (%) 6.79 6.11 5.71 5.12 5.27 5.15 4.53 4.60 7.14
Breaking elongation (CV%) 7.73 8.35 8.66 10.32 8.62 8.37 10.09 11.44 11.09
Work to break (N.cm) 4.29 4.29 3.29 2.34 2.44 2.14 1.98 1.86 4.26
Yarn evenness (CVm%) 14.30 15.53 17.34 19.18 19.40 19.78 20.69 20.62 17.32
Thin places (-50%/1000m) 5 30 159 502 515 610 868 856 137
Thick places (+50%/1000m) 120 228 324 640 661 736 898 901 443
Neps (+200%/1000m) 142 222 382 546 612 673 917 893 228
Hairiness (H) 4.47 4.23 3.97 3.92 4.06 4.01 3.65 3.70 4.11
Hairiness variation (sH) 1.39 1.35 1.33 1.32 1.34 1.33 1.22 1.24 1.18
Table 5.8 : Properties of carded cotton vortex yarns.

104
Figure 5.11 : Tenacity of carded cotton vortex yarns. Figure 5.12 : Breaking elongation of carded cotton vortex yarns.
Figure 5.13 : Work to break of carded cotton vortex yarns. Figure 5.14 : Hairiness of carded cotton vortex yarns.
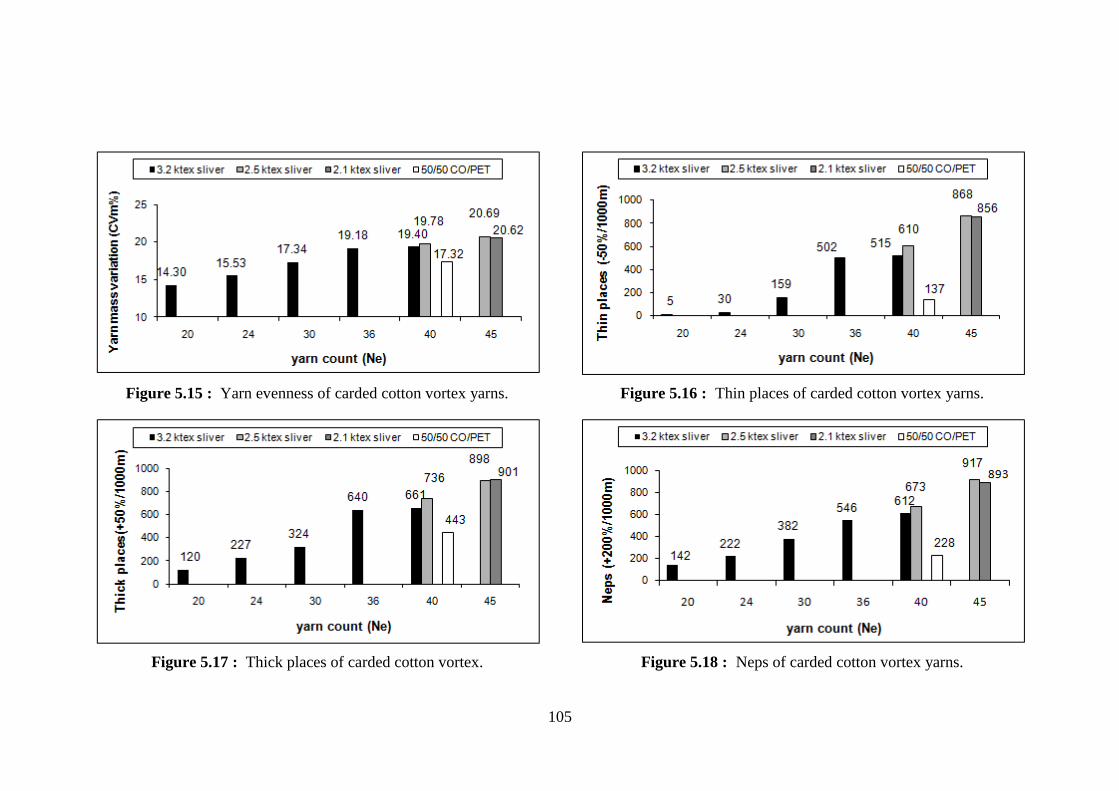
105
Figure 5.15 : Yarn evenness of carded cotton vortex yarns. Figure 5.16 : Thin places of carded cotton vortex yarns.
Figure 5.17 : Thick places of carded cotton vortex. Figure 5.18 : Neps of carded cotton vortex yarns.
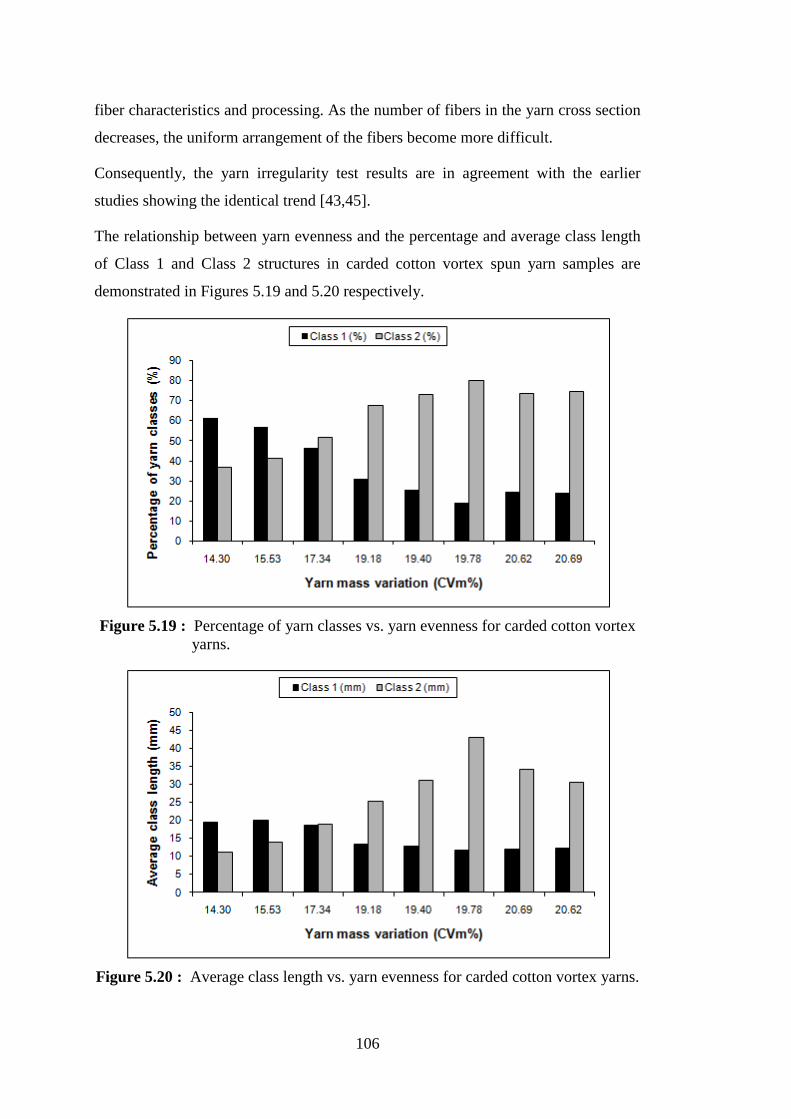
106
fiber characteristics and processing. As the number of fibers in the yarn cross section
decreases, the uniform arrangement of the fibers become more difficult.
Consequently, the yarn irregularity test results are in agreement with the earlier
studies showing the identical trend [43,45].
The relationship between yarn evenness and the percentage and average class length
of Class 1 and Class 2 structures in carded cotton vortex spun yarn samples are
demonstrated in Figures 5.19 and 5.20 respectively.
Figure 5.19 : Percentage of yarn classes vs. yarn evenness for carded cotton vortex
yarns.
Figure 5.20 : Average class length vs. yarn evenness for carded cotton vortex yarns.

107
The Figures 5.19 and 5.20 show that yarn evenness gets worse as the percentage and
average length of Class 1 structure decreases. As expected, the opposite trend was
observed with regard to Class 2 structure.
With regard to yarn hairiness, it was observed that the yarn samples in counts of 20
and 24 Ne have slightly higher hairiness values. It is an already known fact that
hairiness of ring, open-end rotor and air-jet spun yarns increases as the yarn becomes
coarser due to the fact that there are more fiber ends present in the yarn unit length
that form hairs [96]. This behavior was also confirmed for the coarse count vortex
spun yarn samples included in this experimental study.
The test results showed that the tenacity of vortex spun yarns remains almost
unchanged as the yarn becomes finer. This results contradicts with Tyagi et al who
showed that coarser yarns possess higher tenacity and explained this behavior by the
fact that as the finer yarns contain more proportion of wrapper fibers (or less
proportion of load bearing fibers, namely core fibers), these yarns have lesser
tenacity in comparison to the coarser ones [43]. The trend in tenacity test results
shows that the tenacity of vortex spun yarns is dependent on both the ratio of
wrapper and core fibers and the wrapping length of the sheath fibers. As the yarn
becomes coarser, wrapping length of the wrapper fibers and hence the tenacity
declines; however, more core fibers contribute to yarn tension, in other words,
breaking load increases. The contrasting trend holds for the finer yarns. Therefore,
the tenacity behavior of the vortex spun yarns can be attributed to these two opposing
effects.
The lower breaking elongation values obtained for finer yarn counts might be the
result of smaller diameter of the yarn core that was wrapped more tightly. This
probably increases the forces acting on the yarn core and fiber slippage becomes
more difficult.
The results of independent t-test for investigating the effect of sliver weight on the
properties of the yarn samples in counts of 40 and 45 Ne are shown in Table 5.9.
While the sliver weight has not a significant impact on any properties of the yarn
samples in count of 45 Ne at the confidence level of 95%, less number of thin places
and neps are obtained in the yarn samples with count of 40 Ne spun from heavier
sliver.
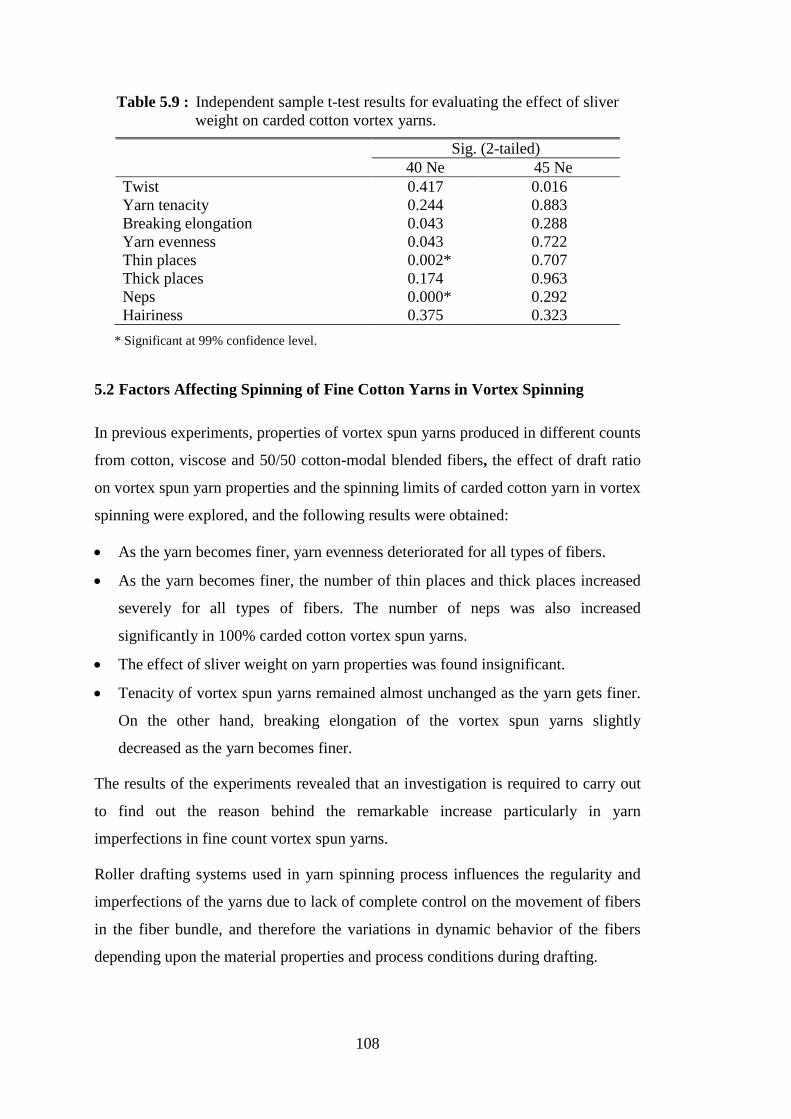
108
* Significant at 99% confidence level.
5.2 Factors Affecting Spinning of Fine Cotton Yarns in Vortex Spinning
In previous experiments, properties of vortex spun yarns produced in different counts
from cotton, viscose and 50/50 cotton-modal blended fibers, the effect of draft ratio
on vortex spun yarn properties and the spinning limits of carded cotton yarn in vortex
spinning were explored, and the following results were obtained:
As the yarn becomes finer, yarn evenness deteriorated for all types of fibers.
As the yarn becomes finer, the number of thin places and thick places increased
severely for all types of fibers. The number of neps was also increased
significantly in 100% carded cotton vortex spun yarns.
The effect of sliver weight on yarn properties was found insignificant.
Tenacity of vortex spun yarns remained almost unchanged as the yarn gets finer.
On the other hand, breaking elongation of the vortex spun yarns slightly
decreased as the yarn becomes finer.
The results of the experiments revealed that an investigation is required to carry out
to find out the reason behind the remarkable increase particularly in yarn
imperfections in fine count vortex spun yarns.
Roller drafting systems used in yarn spinning process influences the regularity and
imperfections of the yarns due to lack of complete control on the movement of fibers
in the fiber bundle, and therefore the variations in dynamic behavior of the fibers
depending upon the material properties and process conditions during drafting.
Table 5.9 : Independent sample t-test results for evaluating the effect of sliver
weight on carded cotton vortex yarns.
Sig. (2-tailed)
40 Ne 45 Ne
Twist 0.417 0.016
Yarn tenacity 0.244 0.883
Breaking elongation 0.043 0.288
Yarn evenness 0.043 0.722
Thin places 0.002* 0.707
Thick places 0.174 0.963
Neps 0.000* 0.292
Hairiness 0.375 0.323

109
The influence of the material parameters and process conditions on the roll drafting
dynamics was investigated by Huh et al. who proposed a mathematical model that
describes the dynamic behavior of the fiber bundles during drafting relating to the
linear mass density of the fiber bundle and variance of velocity of the constituent
fibers. They measured linear density of the fiber bundle in different sectional
positions in the draft zone of a draw frame with a 3-line drafting system for varying
draft ratios, feeding speeds of the material, thickness of the fiber bundle and delivery
speeds and estimated the mean velocity of the fiber bundle and velocity variance of
the fibers. It was observed that the fiber bundle starts moving with a velocity almost
equal to the feeding speed, it is attenuated continuously and reaches to almost to
output thickness before it is delivered through the front roll. In the mean time, fibers
are accelerated continuously, but as nearing the front roll, the acceleration reduces
and hence a discontinuity occurs in the slope of velocity. The increase in main draft
ratio was found to increase the velocity variance while break draft ratio is kept
constant and the same delivery speed is maintained. In addition, acceleration
increases fast as the main draft ratio increases. With regard to delivery speed, it was
found that the discontinuity of the slope of the velocity at the nip point of the front
roll is bigger as the delivery speed increases and the behavior of the fiber bundle is
disturbed more. Moreover, the velocity slope at the delivery roll was found to be
more dependent on the delivery speed than on the draft ratio. On the other hand,
sliver thickness has not a significant impact on bundle dynamics [97-99].
The earlier studies regarding the effect of yarn delivery speed on the properties of jet
spun yarns have showed that the air flow caused by the drafting rollers at a high
surface speed of the front roller has an important role on yarn properties, since the air
flow may disturb the fiber flow and cause loss of control [100]. The results obtained
during the preliminary trials also gave some hints about the disturbing effect of high
yarn delivery speed on the yarn properties.
From the above discussion, it is obvious that draft ratio and delivery speed affect the
yarn evenness and imperfections, and consequently the spinning limits of the system.
Thus, to examine the challenges of spinning fine cotton yarns on vortex spinning
system, a set of experiments combining three factors as draft (yarn count), yarn
delivery speed, and noil removal ratio in sliver preparation were performed.

110
Yarn samples in count of 36 Ne were produced from 100% carded cotton sliver and
combed slivers with two different noil removal percentages as 12% and 18% under
constant spinning conditions with the delivery speeds of 300 m/min and 425 m/min.
At the same processing conditions, yarns were spun using 50/50 CO/PET blend. It is
again noteworthy to mention that the cotton used in spinning cotton-polyester
blended yarns is not the same cotton used in spinning 100% carded and combed
yarns. Additionally, combed cotton sliver with noil removal percentage of 12% was
used to produce the yarn in count of 45 Ne, and the other combed cotton sliver with
noil removal percentage of 18% was used to produce the yarn samples in counts of
45 Ne, 50 Ne and 55 Ne.
The main test results of the fiber properties measured from third passage drawframe
slivers by using an Uster® AFIS instrument are given in Tables 5.10 and 5.11.
Property Abbreviations
and units Carded
Combed
12%
Combed
18%
Mean fiber length by weight Lw (mm) 24.23 23.32 24.13
Mean fiber length by number Ln (mm) 18.54 18.90 19.81
Upper quartile length by weight UQLw (mm) 30.89 29.26 29.77
Short fiber content by weight SFCw (%) 13.58 12.62 9.96
Short fiber content by number SFCn (%) 33.64 28.30 23.26
Fineness µg/inch 4.11 4.00 4.10
Maturity ratio % 0.88 0.84 0.85
Sliver count
(gr/yd)
Sliver count
(ktex)
CVm
(%)
CVm (1yd)
(%)
CVm (3yd)
(%)
Carded 38 2.69 3.80 1.04 0.40
Combed (12%) 38 2.69 3.77 1.61 1.44
Combed (18%) 38 2.69 3.80 1.14 0.96
50/50 CO/PET 38 2.69 3.08 0.78 0.54
The spinning parameters used in the production of yarn samples are given in Table
5.12. Four bobbins were spun at each condition.
5.2.1 Effect of noil removal ratio and yarn delivery speed on yarn structure
The results of analysis of variance test that was performed in order to reveal the
effects of noil removal ratio, yarn delivery speed and their interactions on structural
properties of the yarns are given in Table 5.13.
Table 5.10 : Cotton fiber properties used to produce carded and combed cotton
vortex yarns.
Table 5.11 : Properties of 3rd passage drawing slivers used to produce carded and
combed cotton vortex yarns.
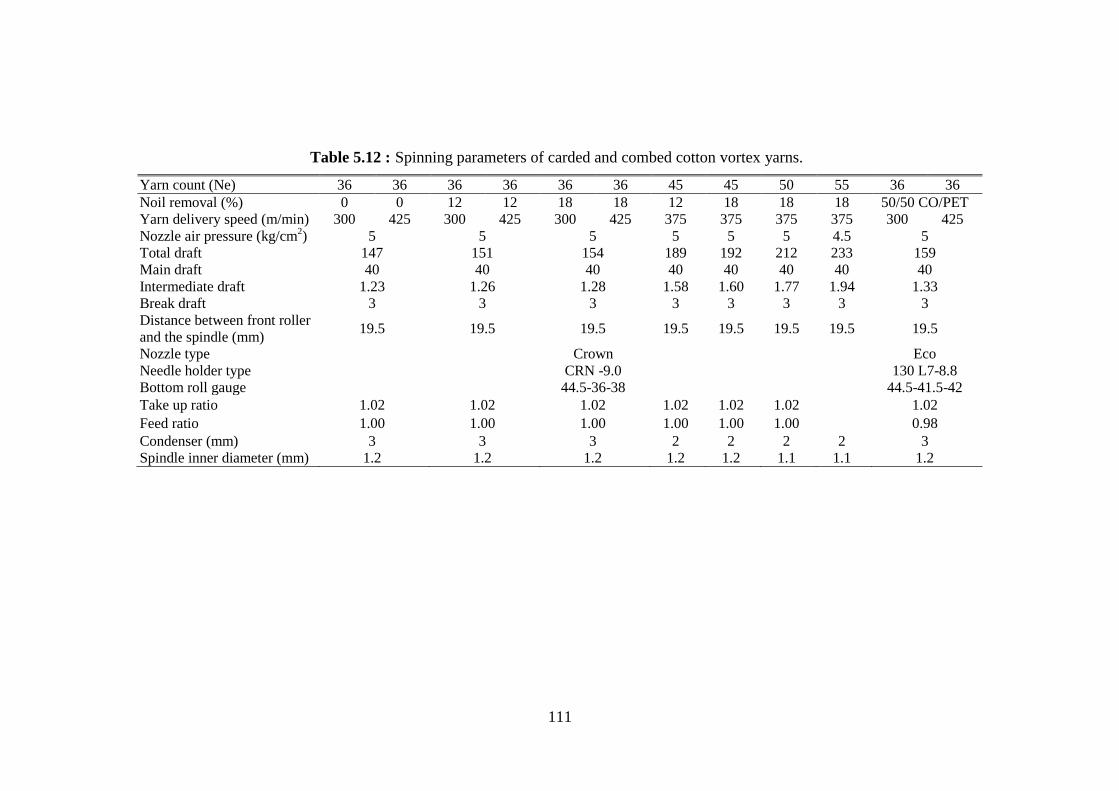
111
Yarn count (Ne) 36 36 36 36 36 36 45 45 50 55 36 36 Noil removal (%) 0 0 12 12 18 18 12 18 18 18 50/50 CO/PET Yarn delivery speed (m/min) 300 425 300 425 300 425 375 375 375 375 300 425 Nozzle air pressure (kg/cm
2) 5 5 5 5 5 5 4.5 5
Total draft 147 151 154 189 192 212 233 159 Main draft 40 40 40 40 40 40 40 40 Intermediate draft 1.23 1.26 1.28 1.58 1.60 1.77 1.94 1.33 Break draft 3 3 3 3 3 3 3 3 Distance between front roller and the spindle (mm)
19.5 19.5 19.5 19.5 19.5 19.5 19.5 19.5
Nozzle type Crown Eco Needle holder type CRN -9.0 130 L7-8.8 Bottom roll gauge 44.5-36-38 44.5-41.5-42 Take up ratio 1.02 1.02 1.02 1.02 1.02 1.02 1.02
Feed ratio 1.00 1.00 1.00 1.00 1.00 1.00 0.98 Condenser (mm) 3 3 3 2 2 2 2 3 Spindle inner diameter (mm) 1.2 1.2 1.2 1.2 1.2 1.1 1.1 1.2
Table 5.12 : Spinning parameters of carded and combed cotton vortex yarns.

112
Source of variance
Noil removal
ratio
Yarn delivery
speed
Noil removal
ratio*
yarn delivery
speed
Wrapper/core ratio
Percentage of Class 1
ns
s
s
s
ns
s
Length of Class 1 s s ns
Percentage of Class 2 s s s
Length of Class 2 ns s ns
(s: significant, ns: non-significant)
The ratio of wrapper fibers to core fibers by weight for each yarn sample is given in
Table 5.14 and illustrated in Figure 5.21. The analysis of variance test results
regarding the ratio of wrapper fibers to core fibers by weight revealed that the short
fiber content of the cotton sliver used to spin the yarns samples does not have an
impact on the ratio of wrapper fibers to core fibers. However, lower yarn delivery
speed results in slightly lower ratio of wrapper fibers to core fibers, which can be
attributed to the fact that the air flow caused by the drafting rollers at a high surface
speed of the front roller disturbs the fiber bundle more, which results in more fiber
end separated from the main fiber strand.
It can be seen from Figure 5.21 that the wrapper fibers constitute an increasing
proportion of the fibers as the yarn becomes finer, which was also previously
observed in carded cotton vortex spun yarns. As mentioned before, this result may be
attributed to the greater interfiber cohesion because of more fibers in the fiber bundle
in coarse counts, and this may restrain the separation of trailing ends of the fibers
resulting in fewer wrapper fibers in coarse counts. In addition, whirling effect of the
air stream is expected to be greater when fewer fibers exist in the fiber bundle, which
leads to more wrapper fibers.
As in the case of 100% carded cotton yarns, images were captured by using scanning
electron microscope (SEM) and they are shown in Figures 5.22 - 5.24. It is again
verified that the ratio of the amount of wrapper fibers to core fibers increases as the
yarn becomes finer.
Table 5.13 : Analysis of variance test results for the effects of noil removal ratio and
yarn delivery speed on yarn structure.
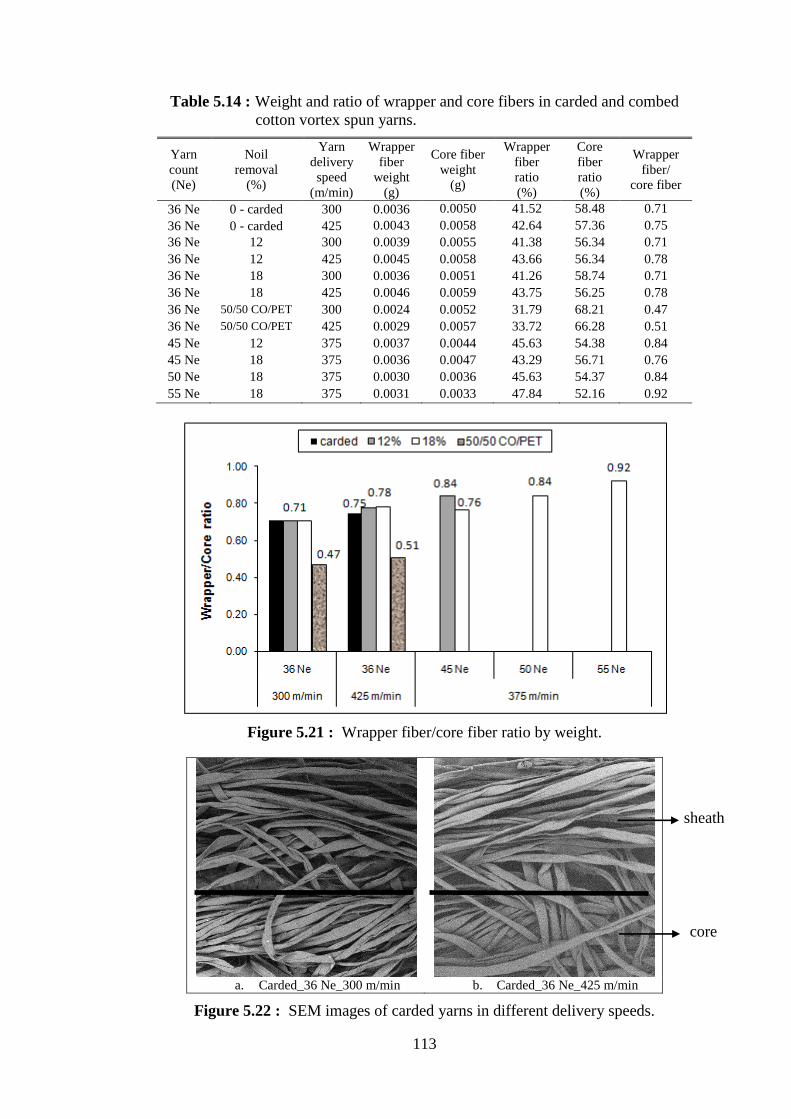
113
Yarn
count
(Ne)
Noil
removal
(%)
Yarn
delivery
speed
(m/min)
Wrapper
fiber
weight
(g)
Core fiber
weight
(g)
Wrapper
fiber
ratio
(%)
Core
fiber
ratio
(%)
Wrapper
fiber/
core fiber
36 Ne 0 - carded 300 0.0036 0.0050 41.52 58.48 0.71
36 Ne 0 - carded 425 0.0043 0.0058 42.64 57.36 0.75
36 Ne 12 300 0.0039 0.0055 41.38 56.34 0.71
36 Ne 12 425 0.0045 0.0058 43.66 56.34 0.78
36 Ne 18 300 0.0036 0.0051 41.26 58.74 0.71
36 Ne 18 425 0.0046 0.0059 43.75 56.25 0.78
36 Ne 50/50 CO/PET 300 0.0024 0.0052 31.79 68.21 0.47
36 Ne 50/50 CO/PET 425 0.0029 0.0057 33.72 66.28 0.51
45 Ne 12 375 0.0037 0.0044 45.63 54.38 0.84
45 Ne 18 375 0.0036 0.0047 43.29 56.71 0.76
50 Ne 18 375 0.0030 0.0036 45.63 54.37 0.84
55 Ne 18 375 0.0031 0.0033 47.84 52.16 0.92
Figure 5.21 : Wrapper fiber/core fiber ratio by weight.
a. Carded_36 Ne_300 m/min b. Carded_36 Ne_425 m/min
Figure 5.22 : SEM images of carded yarns in different delivery speeds.
Table 5.14 : Weight and ratio of wrapper and core fibers in carded and combed
cotton vortex spun yarns.
sheath
core
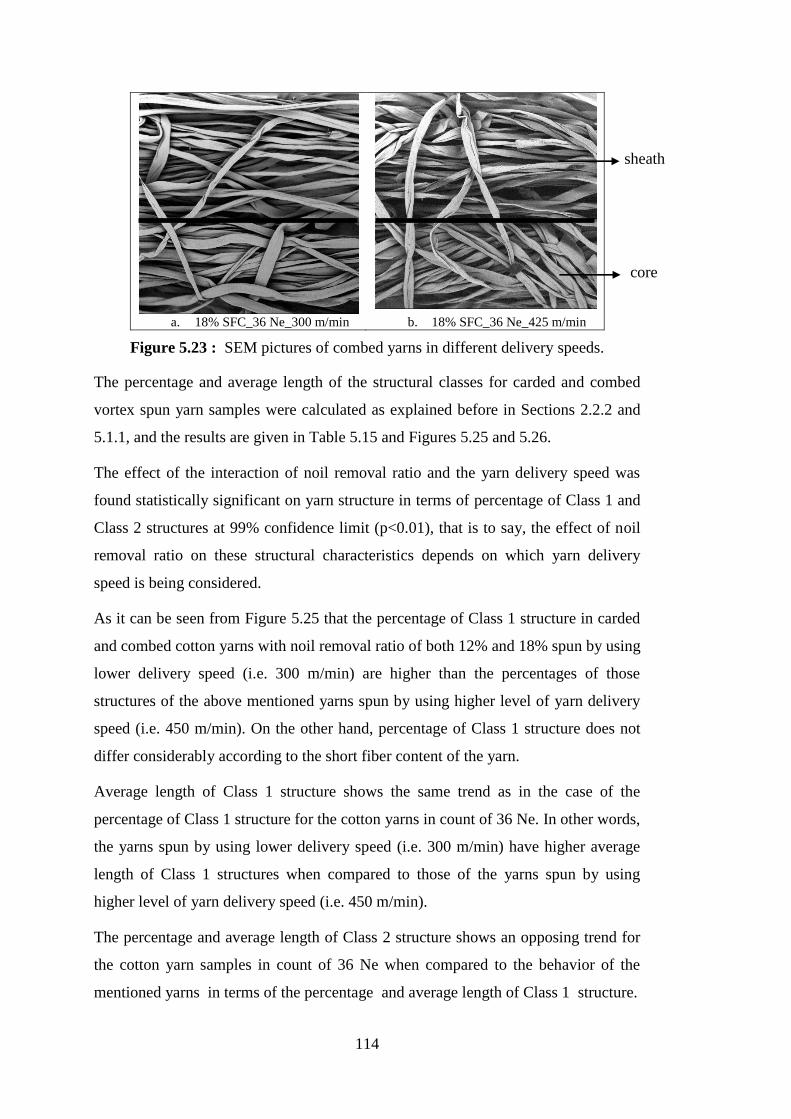
114
a. 18% SFC_36 Ne_300 m/min b. 18% SFC_36 Ne_425 m/min
Figure 5.23 : SEM pictures of combed yarns in different delivery speeds.
The percentage and average length of the structural classes for carded and combed
vortex spun yarn samples were calculated as explained before in Sections 2.2.2 and
5.1.1, and the results are given in Table 5.15 and Figures 5.25 and 5.26.
The effect of the interaction of noil removal ratio and the yarn delivery speed was
found statistically significant on yarn structure in terms of percentage of Class 1 and
Class 2 structures at 99% confidence limit (p<0.01), that is to say, the effect of noil
removal ratio on these structural characteristics depends on which yarn delivery
speed is being considered.
As it can be seen from Figure 5.25 that the percentage of Class 1 structure in carded
and combed cotton yarns with noil removal ratio of both 12% and 18% spun by using
lower delivery speed (i.e. 300 m/min) are higher than the percentages of those
structures of the above mentioned yarns spun by using higher level of yarn delivery
speed (i.e. 450 m/min). On the other hand, percentage of Class 1 structure does not
differ considerably according to the short fiber content of the yarn.
Average length of Class 1 structure shows the same trend as in the case of the
percentage of Class 1 structure for the cotton yarns in count of 36 Ne. In other words,
the yarns spun by using lower delivery speed (i.e. 300 m/min) have higher average
length of Class 1 structures when compared to those of the yarns spun by using
higher level of yarn delivery speed (i.e. 450 m/min).
The percentage and average length of Class 2 structure shows an opposing trend for
the cotton yarn samples in count of 36 Ne when compared to the behavior of the
mentioned yarns in terms of the percentage and average length of Class 1 structure.
sheath
core
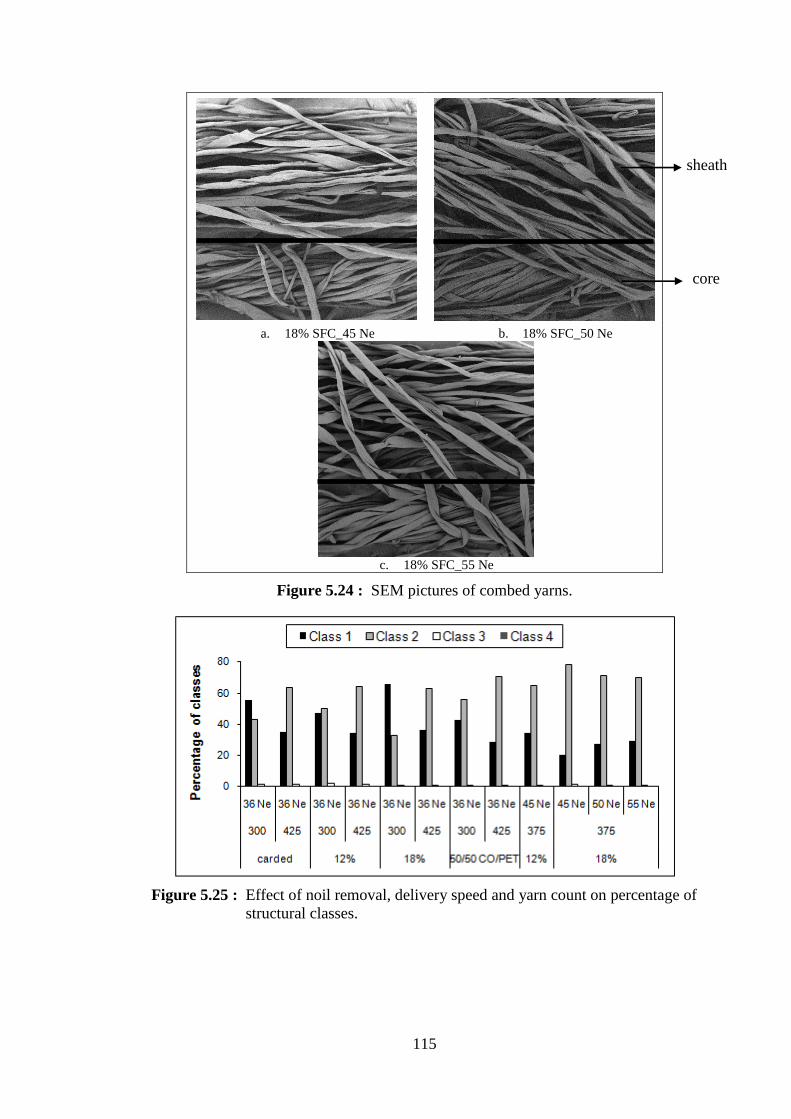
115
a. 18% SFC_45 Ne b. 18% SFC_50 Ne
c. 18% SFC_55 Ne
Figure 5.24 : SEM pictures of combed yarns.
Figure 5.25 : Effect of noil removal, delivery speed and yarn count on percentage of
structural classes.
sheath
core

116
Yarn samples
Class 1 Class 2 Class 3 Class 4
%.
Class length
%.
Class length
%.
Class length
%.
Class length
Avg.
(mm) CV%
Avg.
(mm) CV%
Avg.
(mm) CV%
Avg.
(mm) CV%
Carded 36 Ne 300 m/min. 55.64 14.74 78.11 43.10 10.75 62.96 1.06 2.19 20.00 0.21 1.22 11.11
Carded 36 Ne 425 m/min. 35.10 12.21 80.92 63.41 18.47 64.99 1.17 1.83 26.51 0.32 1.06 8.12
Combed 12% 36 Ne 300 m/min. 47.48 13.75 69.10 50.31 13.92 59.25 1.96 3.76 21.87 0.25 1.56 14.73
Combed 12% 36 Ne 425 m/min. 34.36 11.31 77.19 64.12 18.22 77.45 1.27 2.66 25.21 0.24 1.17 1.32
Combed 18% 36 Ne 300 m/min. 66.05 18.89 86.99 32.92 9.06 58.71 0.94 2.76 15.92 0.09 0.75 0.00
Combed 18% 36 Ne 425 m/min. 36.45 11.73 75.21 62.62 18.64 64.01 0.88 1.98 16.30 0.05 0.50 0.00
50/50 CO/PET 36 Ne 300 m/min. 42.80 10.31 80.00 56.10 13.36 54.43 0.95 2.71 22.71 0.15 1.50 23.57
50/50 CO/PET 36 Ne 425 m/min. 28.43 12.92 77.84 70.70 28.28 74.50 0.78 2.58 23.34 0.10 2.00 0.00
Combed 12% 45 Ne 375 m/min. 34.39 12.48 64.39 64.73 21.16 71.13 0.78 2.52 20.20 0.10 0.81 6.73
Combed 18% 45 Ne 375 m/min. 19.97 9.59 67.28 78.63 31.89 63.43 1.26 3.08 17.27 0.14 0.91 3.54
Combed 18% 50 Ne 375 m/min. 27.45 9.40 67.24 71.47 21.85 69.03 0.86 2.38 22.56 0.21 1.03 4.61
Combed 18% 55 Ne 375 m/min. 29.19 10.09 67.72 69.84 21.62 73.72 0.81 1.84 26.08 0.16 1.00 0.00
Table 5.15 : Structural characteristics (class length and percentage) of carded and combed cotton vortex yarns.
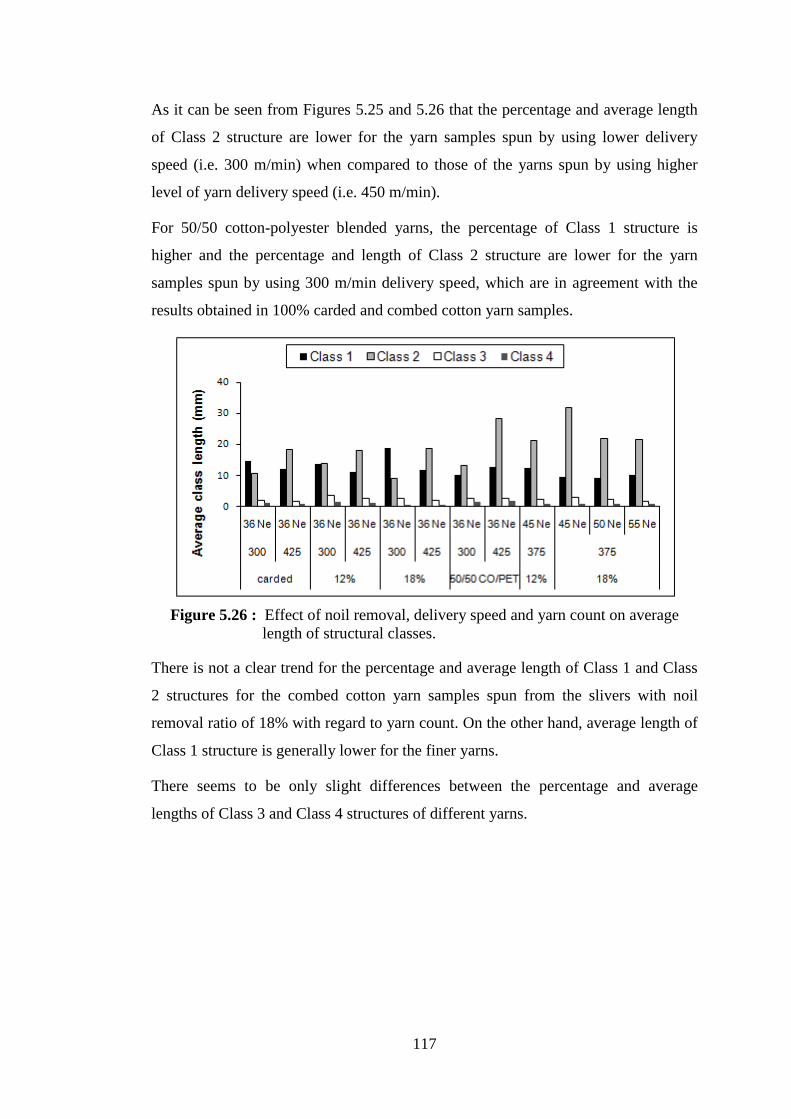
117
As it can be seen from Figures 5.25 and 5.26 that the percentage and average length
of Class 2 structure are lower for the yarn samples spun by using lower delivery
speed (i.e. 300 m/min) when compared to those of the yarns spun by using higher
level of yarn delivery speed (i.e. 450 m/min).
For 50/50 cotton-polyester blended yarns, the percentage of Class 1 structure is
higher and the percentage and length of Class 2 structure are lower for the yarn
samples spun by using 300 m/min delivery speed, which are in agreement with the
results obtained in 100% carded and combed cotton yarn samples.
Figure 5.26 : Effect of noil removal, delivery speed and yarn count on average
length of structural classes.
There is not a clear trend for the percentage and average length of Class 1 and Class
2 structures for the combed cotton yarn samples spun from the slivers with noil
removal ratio of 18% with regard to yarn count. On the other hand, average length of
Class 1 structure is generally lower for the finer yarns.
There seems to be only slight differences between the percentage and average
lengths of Class 3 and Class 4 structures of different yarns.
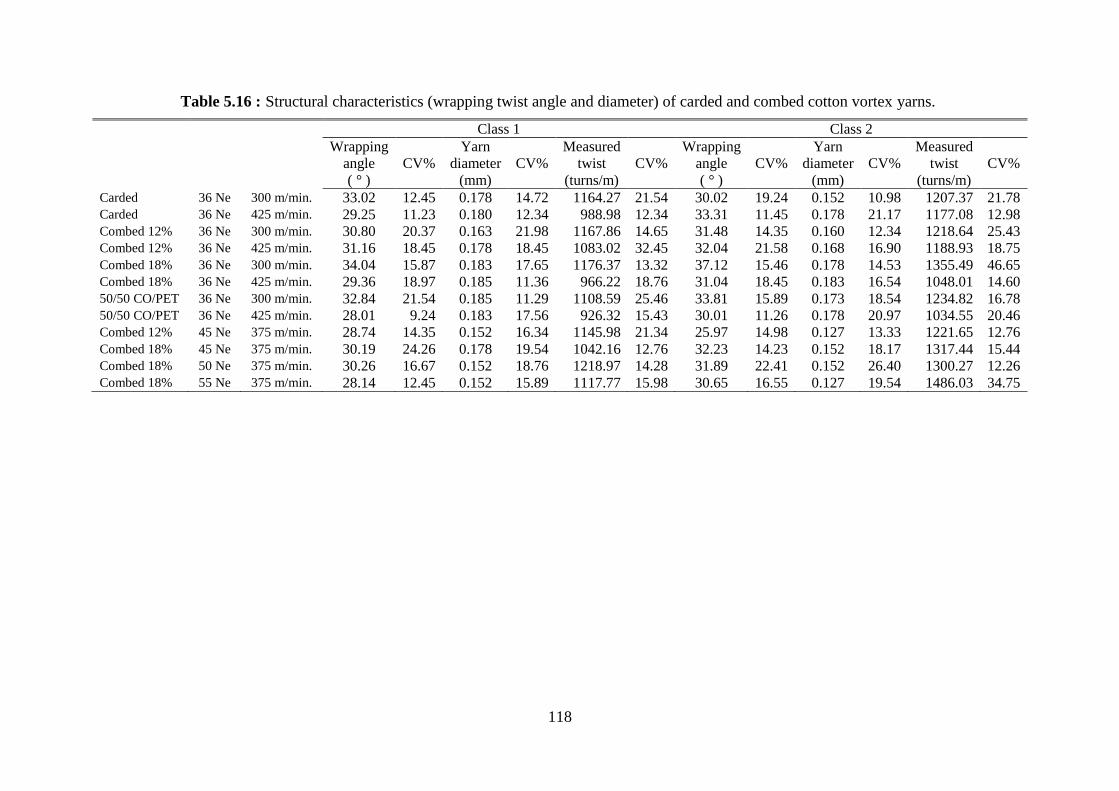
118
Class 1 Class 2
Wrapping
angle
( ° )
CV%
Yarn
diameter
(mm)
CV%
Measured
twist
(turns/m)
CV%
Wrapping
angle
( ° )
CV%
Yarn
diameter
(mm)
CV%
Measured
twist
(turns/m)
CV%
Carded 36 Ne 300 m/min. 33.02 12.45 0.178 14.72 1164.27 21.54 30.02 19.24 0.152 10.98 1207.37 21.78 Carded 36 Ne 425 m/min. 29.25 11.23 0.180 12.34 988.98 12.34 33.31 11.45 0.178 21.17 1177.08 12.98 Combed 12% 36 Ne 300 m/min. 30.80 20.37 0.163 21.98 1167.86 14.65 31.48 14.35 0.160 12.34 1218.64 25.43 Combed 12% 36 Ne 425 m/min. 31.16 18.45 0.178 18.45 1083.02 32.45 32.04 21.58 0.168 16.90 1188.93 18.75 Combed 18% 36 Ne 300 m/min. 34.04 15.87 0.183 17.65 1176.37 13.32 37.12 15.46 0.178 14.53 1355.49 46.65 Combed 18% 36 Ne 425 m/min. 29.36 18.97 0.185 11.36 966.22 18.76 31.04 18.45 0.183 16.54 1048.01 14.60 50/50 CO/PET 36 Ne 300 m/min. 32.84 21.54 0.185 11.29 1108.59 25.46 33.81 15.89 0.173 18.54 1234.82 16.78 50/50 CO/PET 36 Ne 425 m/min. 28.01 9.24 0.183 17.56 926.32 15.43 30.01 11.26 0.178 20.97 1034.55 20.46 Combed 12% 45 Ne 375 m/min. 28.74 14.35 0.152 16.34 1145.98 21.34 25.97 14.98 0.127 13.33 1221.65 12.76 Combed 18% 45 Ne 375 m/min. 30.19 24.26 0.178 19.54 1042.16 12.76 32.23 14.23 0.152 18.17 1317.44 15.44 Combed 18% 50 Ne 375 m/min. 30.26 16.67 0.152 18.76 1218.97 14.28 31.89 22.41 0.152 26.40 1300.27 12.26 Combed 18% 55 Ne 375 m/min. 28.14 12.45 0.152 15.89 1117.77 15.98 30.65 16.55 0.127 19.54 1486.03 34.75
Table 5.16 : Structural characteristics (wrapping twist angle and diameter) of carded and combed cotton vortex yarns.
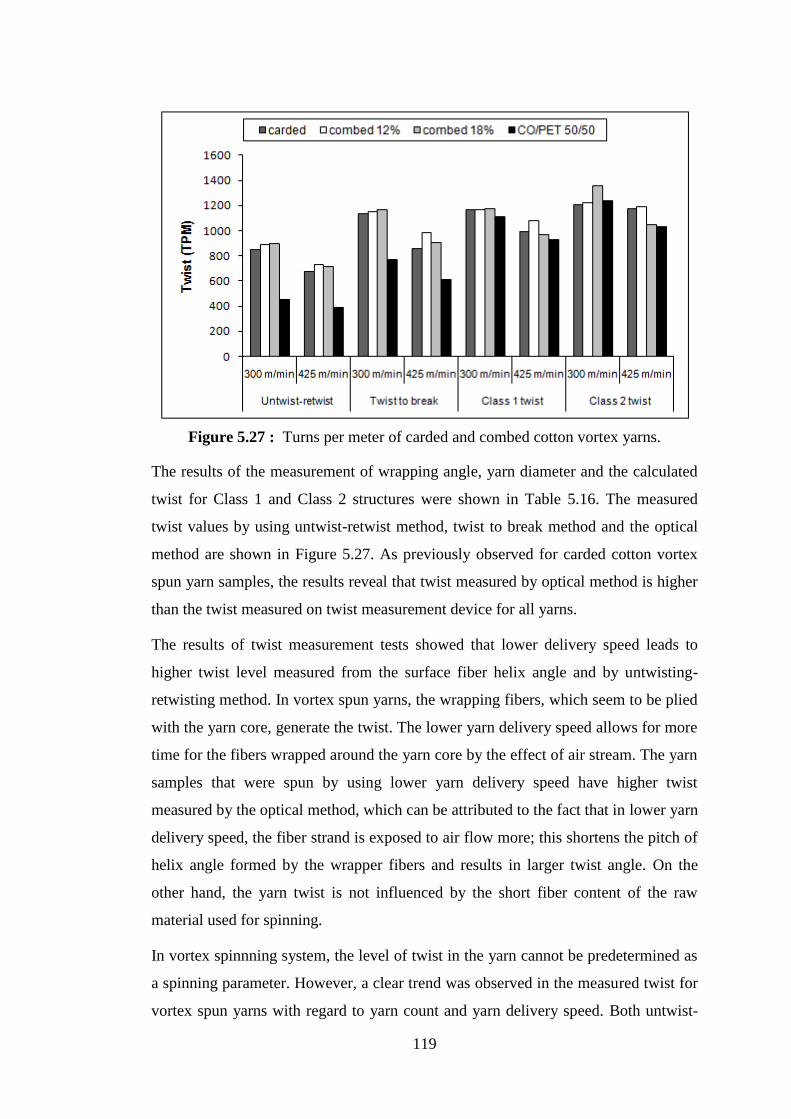
119
Figure 5.27 : Turns per meter of carded and combed cotton vortex yarns.
The results of the measurement of wrapping angle, yarn diameter and the calculated
twist for Class 1 and Class 2 structures were shown in Table 5.16. The measured
twist values by using untwist-retwist method, twist to break method and the optical
method are shown in Figure 5.27. As previously observed for carded cotton vortex
spun yarn samples, the results reveal that twist measured by optical method is higher
than the twist measured on twist measurement device for all yarns.
The results of twist measurement tests showed that lower delivery speed leads to
higher twist level measured from the surface fiber helix angle and by untwisting-
retwisting method. In vortex spun yarns, the wrapping fibers, which seem to be plied
with the yarn core, generate the twist. The lower yarn delivery speed allows for more
time for the fibers wrapped around the yarn core by the effect of air stream. The yarn
samples that were spun by using lower yarn delivery speed have higher twist
measured by the optical method, which can be attributed to the fact that in lower yarn
delivery speed, the fiber strand is exposed to air flow more; this shortens the pitch of
helix angle formed by the wrapper fibers and results in larger twist angle. On the
other hand, the yarn twist is not influenced by the short fiber content of the raw
material used for spinning.
In vortex spinnning system, the level of twist in the yarn cannot be predetermined as
a spinning parameter. However, a clear trend was observed in the measured twist for
vortex spun yarns with regard to yarn count and yarn delivery speed. Both untwist-
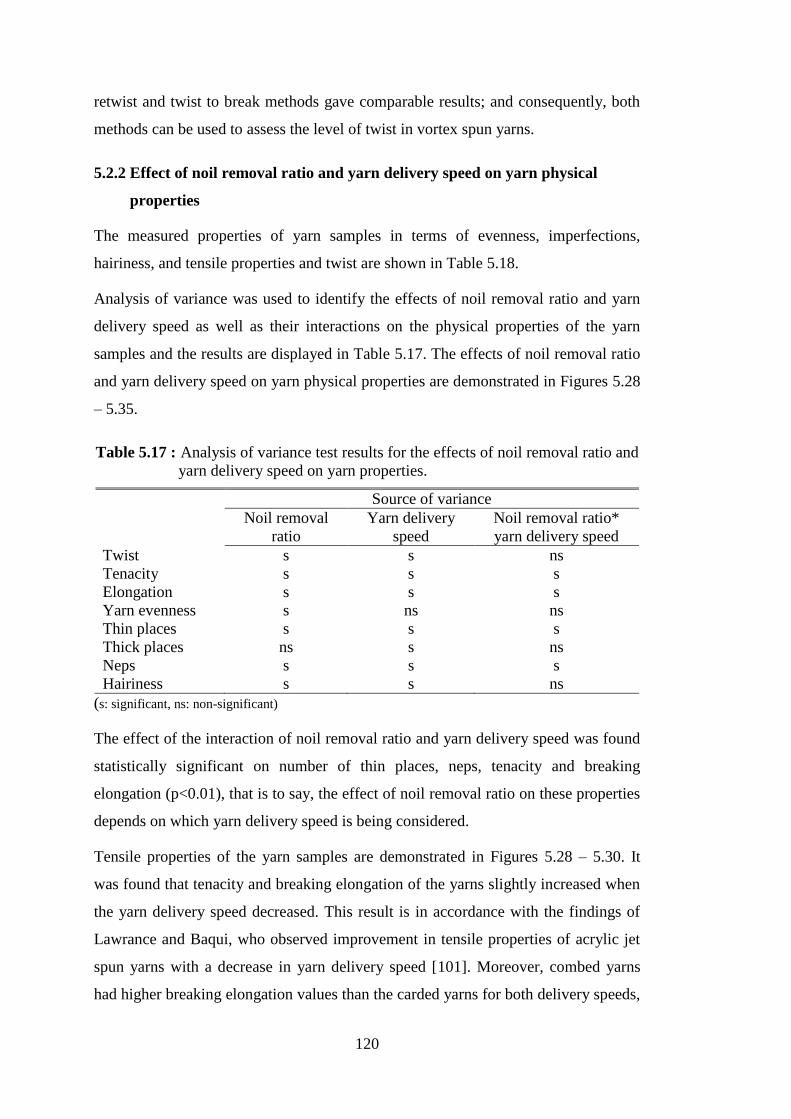
120
retwist and twist to break methods gave comparable results; and consequently, both
methods can be used to assess the level of twist in vortex spun yarns.
5.2.2 Effect of noil removal ratio and yarn delivery speed on yarn physical
properties
The measured properties of yarn samples in terms of evenness, imperfections,
hairiness, and tensile properties and twist are shown in Table 5.18.
Analysis of variance was used to identify the effects of noil removal ratio and yarn
delivery speed as well as their interactions on the physical properties of the yarn
samples and the results are displayed in Table 5.17. The effects of noil removal ratio
and yarn delivery speed on yarn physical properties are demonstrated in Figures 5.28
– 5.35.
Source of variance
Noil removal
ratio
Yarn delivery
speed
Noil removal ratio*
yarn delivery speed
Twist s s ns
Tenacity s s s
Elongation s s s
Yarn evenness s ns ns
Thin places s s s
Thick places ns s ns
Neps s s s
Hairiness s s ns
(s: significant, ns: non-significant)
The effect of the interaction of noil removal ratio and yarn delivery speed was found
statistically significant on number of thin places, neps, tenacity and breaking
elongation (p<0.01), that is to say, the effect of noil removal ratio on these properties
depends on which yarn delivery speed is being considered.
Tensile properties of the yarn samples are demonstrated in Figures 5.28 – 5.30. It
was found that tenacity and breaking elongation of the yarns slightly increased when
the yarn delivery speed decreased. This result is in accordance with the findings of
Lawrance and Baqui, who observed improvement in tensile properties of acrylic jet
spun yarns with a decrease in yarn delivery speed [101]. Moreover, combed yarns
had higher breaking elongation values than the carded yarns for both delivery speeds,
Table 5.17 : Analysis of variance test results for the effects of noil removal ratio and
yarn delivery speed on yarn properties.
121
while the amount of short fiber content does not play a significant role on yarn
tenacity.
With regard to yarn hairiness, it can be concluded that yarn delivery speed has not a
significant impact; however, combed cotton yarns have a slightly lower hairiness,
and this may attributed to the longer mean fiber length resulting in better wrapping
and preventing fiber ends protruding from the yarn body.
The results revealed that yarn evenness was not influenced by delivery speed for the
carded and combed yarns of both noil removal percentages. On the other hand, more
even yarn was obtained as the short fiber content decreased in the sliver with the
delivery speed of 300 m/min, while any significant difference was not observed with
regard to evenness of the yarns spun with 425 m/min.
The percentage of short fiber content significantly influenced the number of thin
places for all yarn samples. As the short fiber content decreased, the number of thin
places also decreased. This is also true for the number of neps. When the yarns were
spun with the delivery speed of 425 m/min., the number of thin places significantly
decreased for the carded and combed yarns with the noil removal percentage of 12%.
In contrast to the findings of Ortlek and Ulku, the number of neps increased
drastically for all yarn types when the delivery speed decreased [45].
On the contrary to the trends in the number of thin places and neps regarding yarn
delivery speed, it was observed that the number of thick places decreased when the
delivery speed decreased, which is in accordance with the results obtained by Basal
and Oxenham [22,34]. However, there appeared to be no clear trend with regard to
short fiber content.
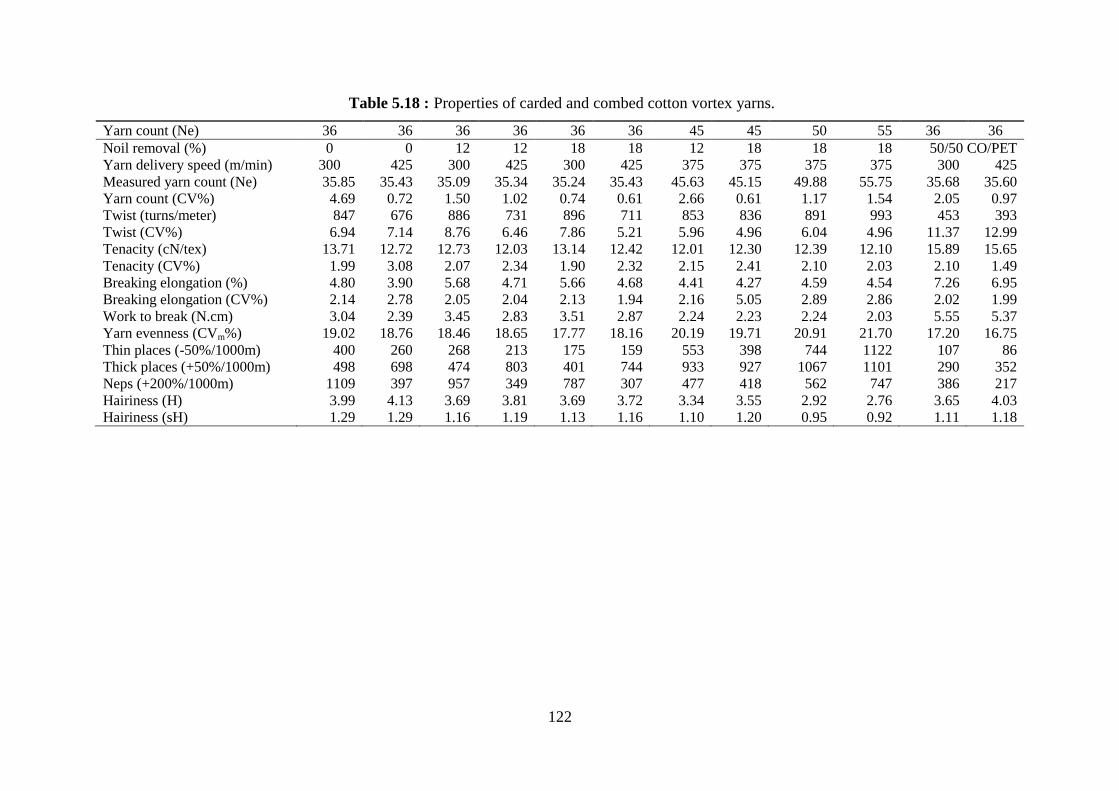
122
Yarn count (Ne) 36 36 36 36 36 36 45 45 50 55 36 36 Noil removal (%) 0 0 12 12 18 18 12 18 18 18 50/50 CO/PET Yarn delivery speed (m/min) 300 425 300 425 300 425 375 375 375 375 300 425 Measured yarn count (Ne) 35.85 35.43 35.09 35.34 35.24 35.43 45.63 45.15 49.88 55.75 35.68 35.60 Yarn count (CV%) 4.69 0.72 1.50 1.02 0.74 0.61 2.66 0.61 1.17 1.54 2.05 0.97 Twist (turns/meter) 847 676 886 731 896 711 853 836 891 993 453 393 Twist (CV%) 6.94 7.14 8.76 6.46 7.86 5.21 5.96 4.96 6.04 4.96 11.37 12.99 Tenacity (cN/tex) 13.71 12.72 12.73 12.03 13.14 12.42 12.01 12.30 12.39 12.10 15.89 15.65 Tenacity (CV%) 1.99 3.08 2.07 2.34 1.90 2.32 2.15 2.41 2.10 2.03 2.10 1.49 Breaking elongation (%) 4.80 3.90 5.68 4.71 5.66 4.68 4.41 4.27 4.59 4.54 7.26 6.95 Breaking elongation (CV%) 2.14 2.78 2.05 2.04 2.13 1.94 2.16 5.05 2.89 2.86 2.02 1.99 Work to break (N.cm) 3.04 2.39 3.45 2.83 3.51 2.87 2.24 2.23 2.24 2.03 5.55 5.37 Yarn evenness (CVm%) 19.02 18.76 18.46 18.65 17.77 18.16 20.19 19.71 20.91 21.70 17.20 16.75 Thin places (-50%/1000m) 400 260 268 213 175 159 553 398 744 1122 107 86 Thick places (+50%/1000m) 498 698 474 803 401 744 933 927 1067 1101 290 352 Neps (+200%/1000m) 1109 397 957 349 787 307 477 418 562 747 386 217 Hairiness (H) 3.99 4.13 3.69 3.81 3.69 3.72 3.34 3.55 2.92 2.76 3.65 4.03 Hairiness (sH) 1.29 1.29 1.16 1.19 1.13 1.16 1.10 1.20 0.95 0.92 1.11 1.18
Table 5.18 : Properties of carded and combed cotton vortex yarns.
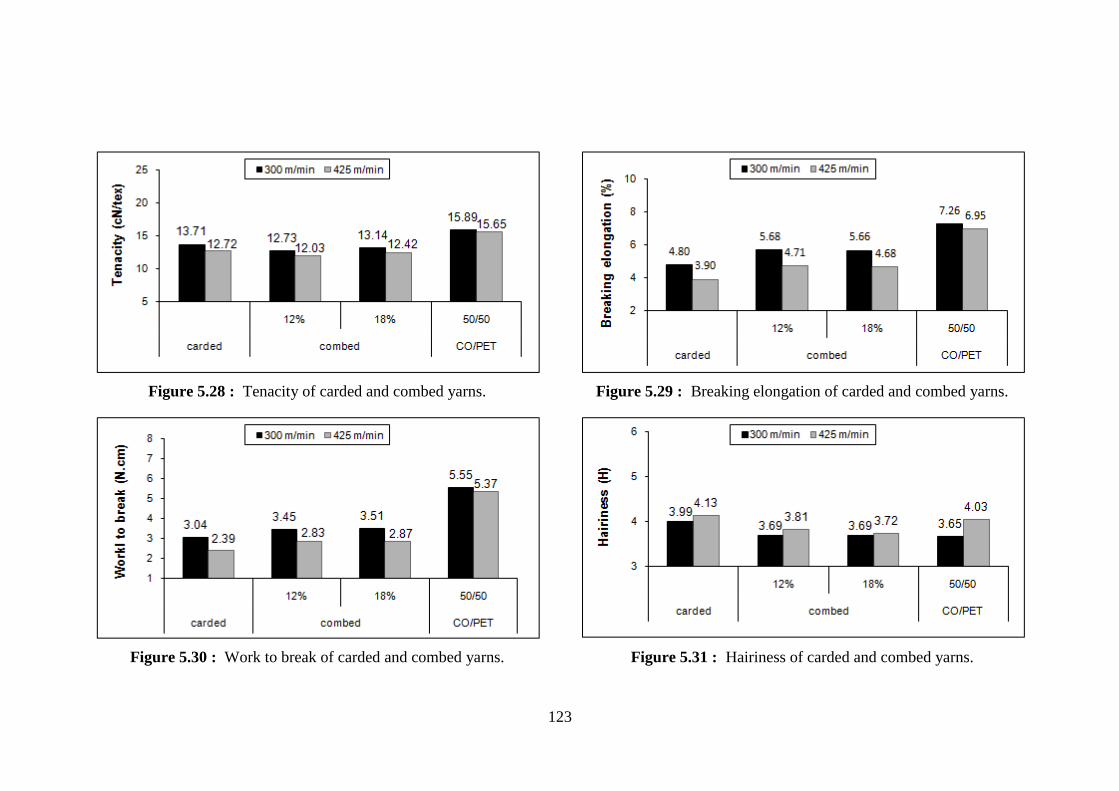
123
Figure 5.28 : Tenacity of carded and combed yarns. Figure 5.29 : Breaking elongation of carded and combed yarns.
Figure 5.30 : Work to break of carded and combed yarns. Figure 5.31 : Hairiness of carded and combed yarns.
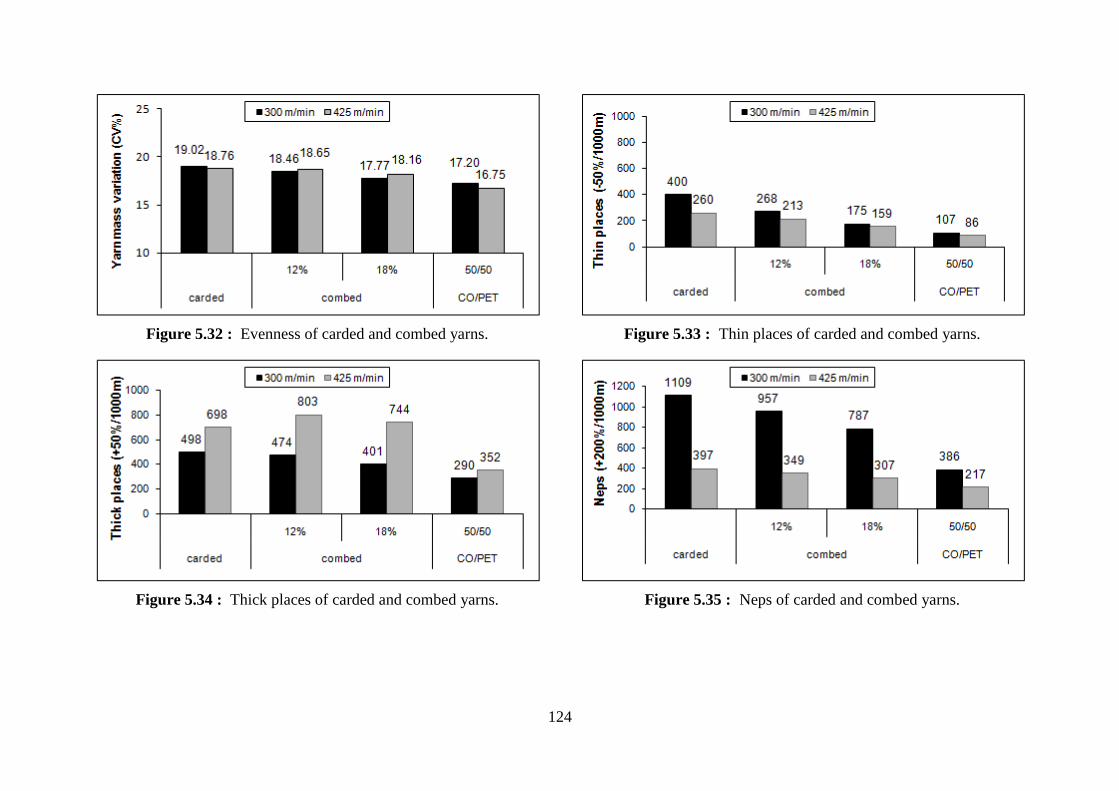
124
Figure 5.32 : Evenness of carded and combed yarns. Figure 5.33 : Thin places of carded and combed yarns.
Figure 5.34 : Thick places of carded and combed yarns. Figure 5.35 : Neps of carded and combed yarns.

125
5.3 Spinning Limits of Combed Cotton Vortex Spun Yarns
After investigating the effects of yarn delivery speed and short fiber elimination on
the properties of 100% cotton vortex spun yarns in count of 36 Ne, combed cotton
slivers were used to spin finer yarns by increasing the draft gradually. The finest yarn
count was determined by considering the performance of the spinning machinery; in
other words, spinning was carried on until yarn breakage became excessive. The
finest yarn that was able to be spun by using the combed cotton slivers with the noil
removal percentage of 12% was in count of 45 Ne, while it was possible to spin
yarns in count of 55 Ne from the slivers with the noil removal percentage of 18%.
The changes in the yarn properties in terms of yarn evenness, imperfections,
hairiness, tenacity and breaking elongation depending on the yarn count are given in
Table 5.18 and illustrated in Figures 5.36 – 5.43.
The examination of Figure 5.36 reveals that there is virtually no influence of yarn
count noticeable on tenacity of combed cotton vortex spun yarns. Moreover, only a
slight decrease observed in breaking elongation in finer yarns, which can be
explained in the same way as mentioned in Section 5.1.2.
Figure 5.36 : Twist of combed cotton vortex spun yarns.
As observed previously for 100% carded cotton vortex spun yarns, evenness and
imperfections of the yarns are dependent of the yarn count. All values follow an
increasing trend as the yarn becomes finer.
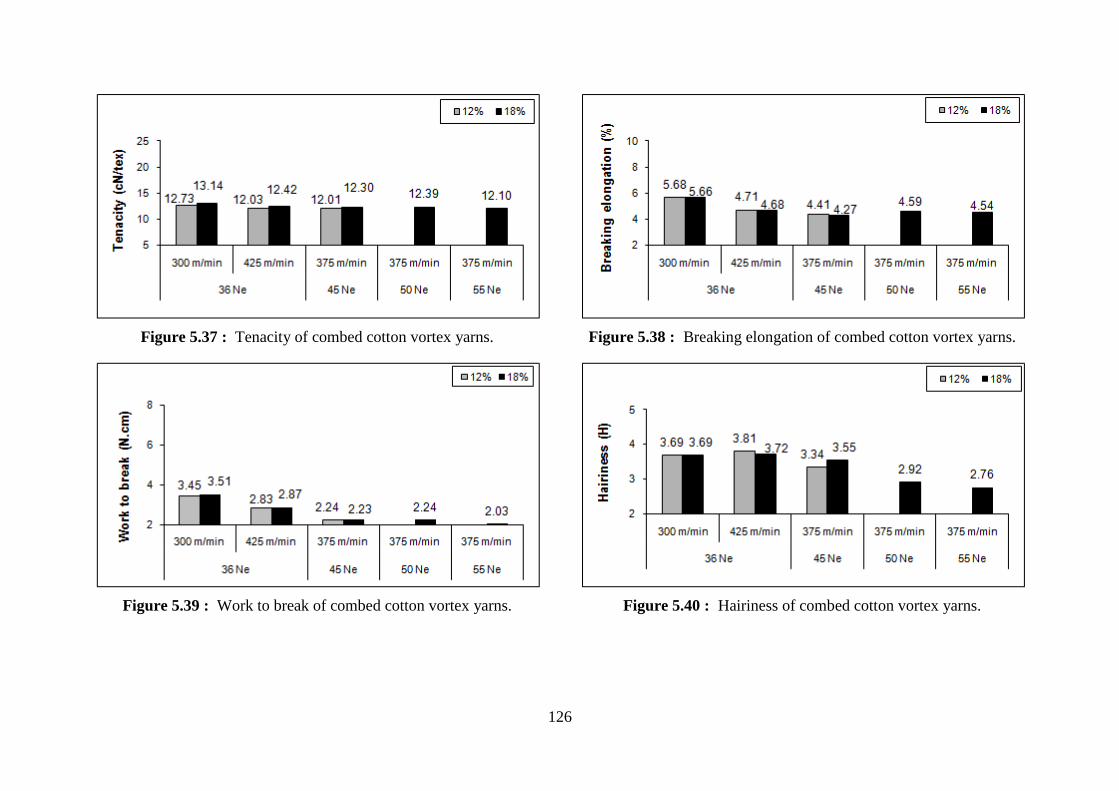
126
Figure 5.37 : Tenacity of combed cotton vortex yarns. Figure 5.38 : Breaking elongation of combed cotton vortex yarns.
Figure 5.39 : Work to break of combed cotton vortex yarns. Figure 5.40 : Hairiness of combed cotton vortex yarns.
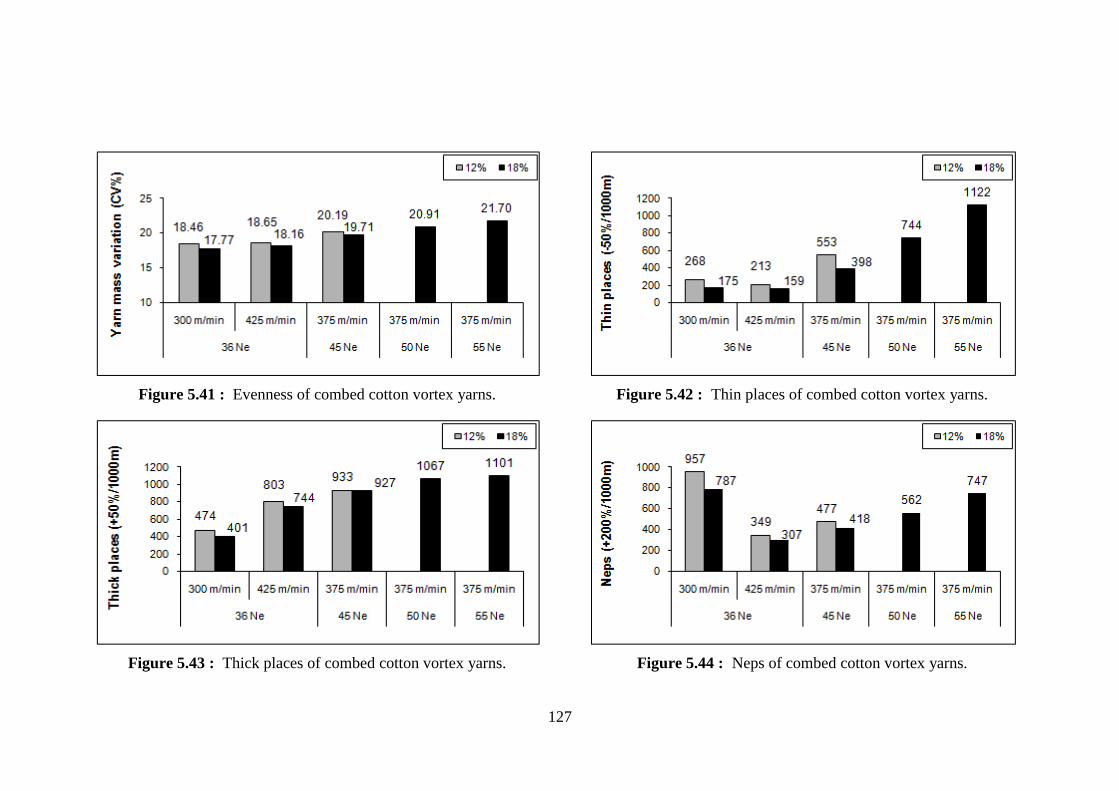
127
Figure 5.41 : Evenness of combed cotton vortex yarns. Figure 5.42 : Thin places of combed cotton vortex yarns.
Figure 5.43 : Thick places of combed cotton vortex yarns. Figure 5.44 : Neps of combed cotton vortex yarns.

124
As far as the hairiness of the combed cotton vortex spun yarns is concerned, it can be
said that it tends to decrease as the as the yarns becomes finer as in the case of carded
cotton vortex spun yarns.
Lastly, twist of the yarn samples measured by untwist-retwist method, twist to break
method and optical method are illustrated in Figure 5.44. As it can be seen from
Figure 5.44 that finer yarn have higher twist level as concluded for the carded cotton
vortex spun yarn samples.
Figure 5.45 : Percentage of yarn classes vs. yarn evenness for carded and combed
vortex yarns.
Figure 5.46 : Average class length vs. yarn evenness for carded and combed vortex
yarns.
In Figures 5.45 and 5.46, the relationship between yarn evenness and the percentage
and average class length of Class 1 and Class 2 structures in carded cotton vortex spun

125
yarn samples are demonstrated. As in the case of carded yarns, yarn evenness generally
gets worse as the percentage and average length of Class 1 structure decreases, and as
expected, the opposite trend was observed with regard to Class 2 structure. This trend
was disturbed in some cases, where lower delivery speed was used.
Penava, Ž., and Orešković stated that analysis of the dependence of yarn breaking
points on thin places revealed a high correlation between the breaking force and
deviation of the thinnest part of the thin place in the area of the breakage, which
indicates that growth in the length of the thin place exponentially reduces the
breaking force at the place [102]. Since the Uster® Tensojet testing device is able to
make a larger number of random tests, which means that the probability of detecting
faults that seldom occur in yarn or isolated weak places is higher. Therefore, the yarn
samples with different noil removal percentages were tested for tensile properties
both on Uster® Tensorapid and Uster
® Tensojet testing devices in order to observe
whether high number of thin places causes a decrease in breaking load. The
comparative results of yarn tenacity, breaking elongation and work to break values
are shown in Table 5.19 and Figures 5.47-5.49.
Figure 5.47 : Tenacity results (Tensojet vs. Tensorapid).

126
Yarn count (Ne) 36 36 36 36 36 36 36 36
Noil removal (%) 0 0 12 12 18 18 50/50 CO/PET
Yarn delivery speed (m/min) 300 425 300 425 300 425 300 425
Tenacity (cN/tex) Tensojet 13.71 12.72 12.73 12.03 13.14 12.42 15.89 15.65
Tensorapid 11.05 9.13 10.40 9.39 11.01 10.10 14.31 13.41
Tenacity (CV%) Tensojet 1.99 3.08 2.07 2.34 1.90 2.32 2.10 1.49
Tensorapid 9.03 11.96 7.54 10.77 8.80 10.60 15.12 9.27
Breaking elongation (%) Tensojet 4.80 3.90 5.68 4.71 5.66 4.68 7.26 6.95
Tensorapid 5.76 4.51 7.10 5.96 7.13 6.29 8.85 8.42
Breaking elongation (CV%) Tensojet 2.14 2.78 2.05 2.04 2.13 1.94 2.02 1.99
Tensorapid 6.85 11.55 7.27 9.38 9.36 8.92 9.42 8.13
Work to break (N.cm) Tensojet 3.04 2.39 3.45 2.83 3.51 2.87 5.55 5.37
Tensorapid 2.65 1.90 3.15 2.55 2.44 1.77 5.45 5.05
Table 5.19 : Tensile properties measured on Uster® Tensojet vs. Uster
® Tensorapid.
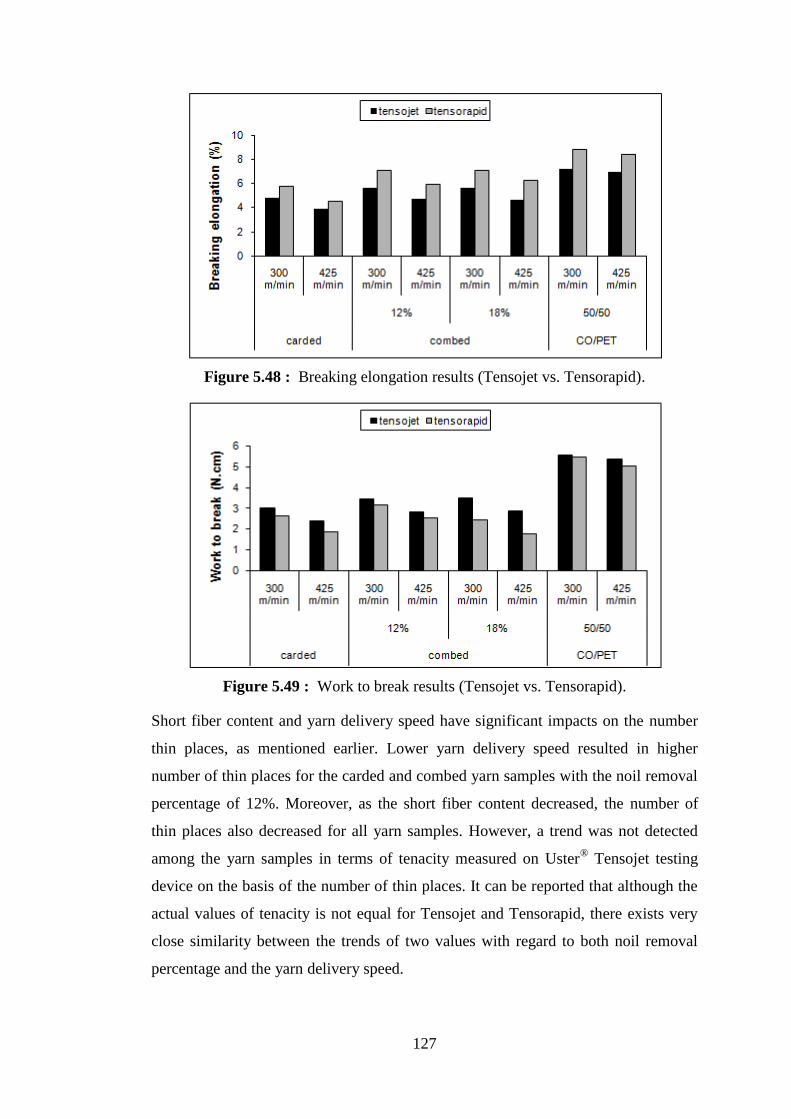
127
Figure 5.48 : Breaking elongation results (Tensojet vs. Tensorapid).
Figure 5.49 : Work to break results (Tensojet vs. Tensorapid).
Short fiber content and yarn delivery speed have significant impacts on the number
thin places, as mentioned earlier. Lower yarn delivery speed resulted in higher
number of thin places for the carded and combed yarn samples with the noil removal
percentage of 12%. Moreover, as the short fiber content decreased, the number of
thin places also decreased for all yarn samples. However, a trend was not detected
among the yarn samples in terms of tenacity measured on Uster® Tensojet testing
device on the basis of the number of thin places. It can be reported that although the
actual values of tenacity is not equal for Tensojet and Tensorapid, there exists very
close similarity between the trends of two values with regard to both noil removal
percentage and the yarn delivery speed.
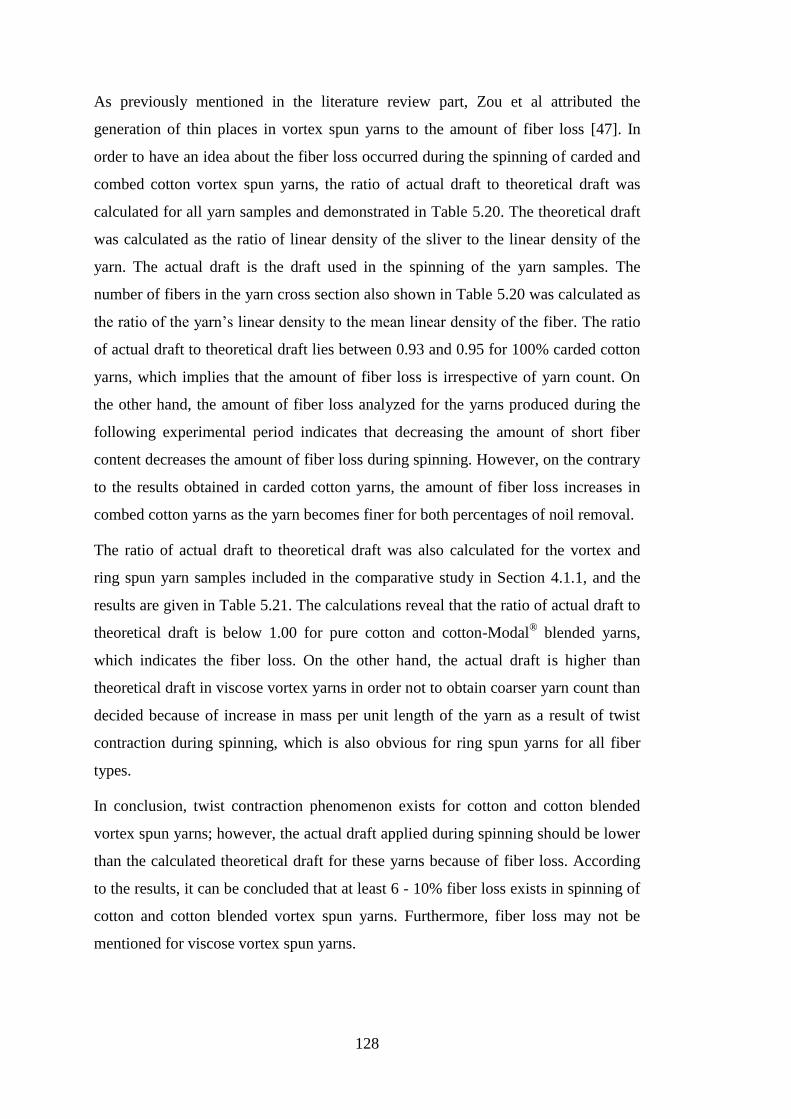
128
As previously mentioned in the literature review part, Zou et al attributed the
generation of thin places in vortex spun yarns to the amount of fiber loss [47]. In
order to have an idea about the fiber loss occurred during the spinning of carded and
combed cotton vortex spun yarns, the ratio of actual draft to theoretical draft was
calculated for all yarn samples and demonstrated in Table 5.20. The theoretical draft
was calculated as the ratio of linear density of the sliver to the linear density of the
yarn. The actual draft is the draft used in the spinning of the yarn samples. The
number of fibers in the yarn cross section also shown in Table 5.20 was calculated as
the ratio of the yarn’s linear density to the mean linear density of the fiber. The ratio
of actual draft to theoretical draft lies between 0.93 and 0.95 for 100% carded cotton
yarns, which implies that the amount of fiber loss is irrespective of yarn count. On
the other hand, the amount of fiber loss analyzed for the yarns produced during the
following experimental period indicates that decreasing the amount of short fiber
content decreases the amount of fiber loss during spinning. However, on the contrary
to the results obtained in carded cotton yarns, the amount of fiber loss increases in
combed cotton yarns as the yarn becomes finer for both percentages of noil removal.
The ratio of actual draft to theoretical draft was also calculated for the vortex and
ring spun yarn samples included in the comparative study in Section 4.1.1, and the
results are given in Table 5.21. The calculations reveal that the ratio of actual draft to
theoretical draft is below 1.00 for pure cotton and cotton-Modal® blended yarns,
which indicates the fiber loss. On the other hand, the actual draft is higher than
theoretical draft in viscose vortex yarns in order not to obtain coarser yarn count than
decided because of increase in mass per unit length of the yarn as a result of twist
contraction during spinning, which is also obvious for ring spun yarns for all fiber
types.
In conclusion, twist contraction phenomenon exists for cotton and cotton blended
vortex spun yarns; however, the actual draft applied during spinning should be lower
than the calculated theoretical draft for these yarns because of fiber loss. According
to the results, it can be concluded that at least 6 - 10% fiber loss exists in spinning of
cotton and cotton blended vortex spun yarns. Furthermore, fiber loss may not be
mentioned for viscose vortex spun yarns.

129
100% carded cotton yarns
Actual yarn count (Ne) 19.95 23.87 29.46 36.00 39.19 39.67 45.14 44.30
Yarn count (CV %) 1.39 0.69 0.72 0.78 0.59 0.81 0.89 0.41
No. of fibers in yarn cross section 178.33 149.04 120.76 98.82 90.78 89.68 78.81 80.31
Theoretical draft 107.84 129.03 159.24 194.59 211.84 168.09 191.27 157.65
Actual draft 102 122 150 181 196 155 178 152
Actual draft/theoretical draft 0.95 0.95 0.94 0.93 0.93 0.93 0.94 0.95
100% carded and combed cotton yarns
Noil removal (%) Carded Carded 12% 12% 18% 18% 12% 18% 18% 18%
Yarn delivery speed (m/min) 300 425 300 425 300 425 375 375 375 375
Actual yarn count (Ne) 35.85 35.43 35.09 35.34 35.09 35.34 45.63 45.15 49.88 55.75
Yarn count (CV %) 4.69 0.72 1.50 1.02 0.74 0.61 2.66 0.61 1.17 1.54
No. of fibers in yarn cross section 101.69 102.89 106.52 105.77 104.09 103.53 81.91 81.24 73.53 65.80
Theoretical draft 162.95 161.05 158.06 159.19 160.18 161.05 207.41 205.23 226.73 253.41
Actual draft 147 147 151 151 154 154 189 192 212 233
Actual draft/theoretical draft 0.90 0.91 0.96 0.95 0.96 0.96 0.91 0.94 0.94 0.92
Table 5.20 : Theoretical and actual draft conditions in carded and combed cotton vortex spun yarns.
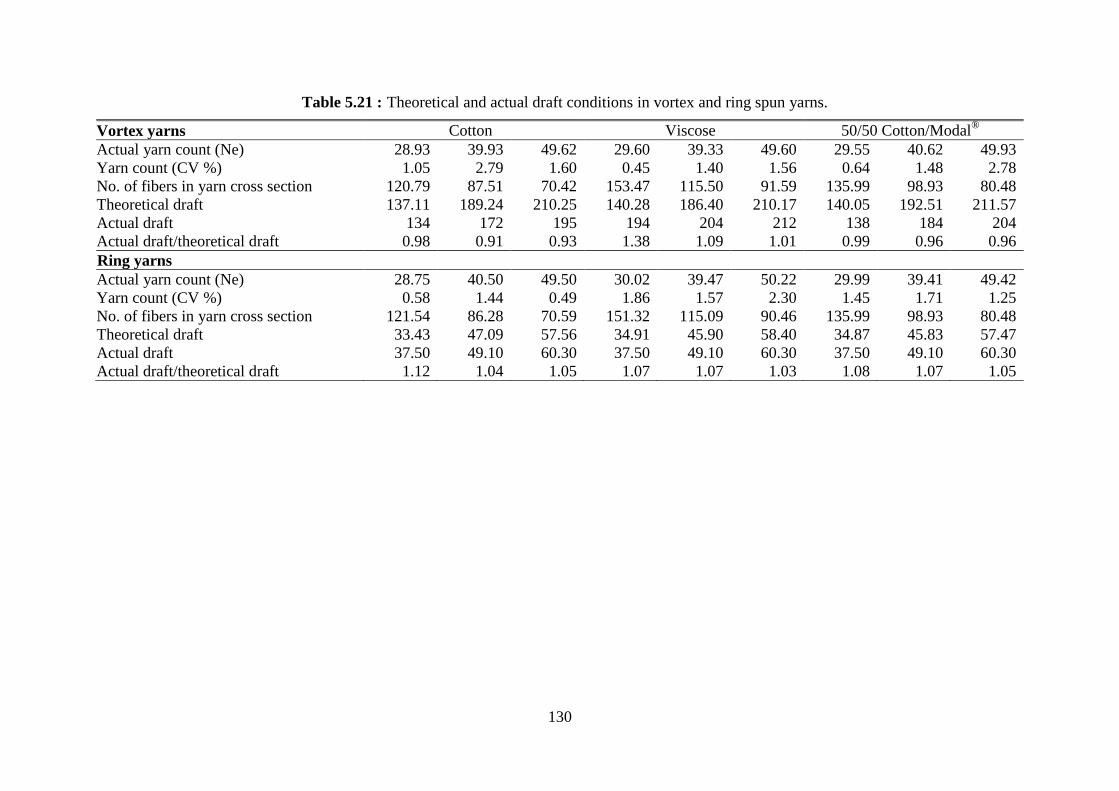
130
Vortex yarns Cotton Viscose 50/50 Cotton/Modal®
Actual yarn count (Ne) 28.93 39.93 49.62 29.60 39.33 49.60 29.55 40.62 49.93
Yarn count (CV %) 1.05 2.79 1.60 0.45 1.40 1.56 0.64 1.48 2.78
No. of fibers in yarn cross section 120.79 87.51 70.42 153.47 115.50 91.59 135.99 98.93 80.48
Theoretical draft 137.11 189.24 210.25 140.28 186.40 210.17 140.05 192.51 211.57
Actual draft 134 172 195 194 204 212 138 184 204
Actual draft/theoretical draft 0.98 0.91 0.93 1.38 1.09 1.01 0.99 0.96 0.96
Ring yarns
Actual yarn count (Ne) 28.75 40.50 49.50 30.02 39.47 50.22 29.99 39.41 49.42
Yarn count (CV %) 0.58 1.44 0.49 1.86 1.57 2.30 1.45 1.71 1.25
No. of fibers in yarn cross section 121.54 86.28 70.59 151.32 115.09 90.46 135.99 98.93 80.48
Theoretical draft 33.43 47.09 57.56 34.91 45.90 58.40 34.87 45.83 57.47
Actual draft 37.50 49.10 60.30 37.50 49.10 60.30 37.50 49.10 60.30
Actual draft/theoretical draft 1.12 1.04 1.05 1.07 1.07 1.03 1.08 1.07 1.05
Table 5.21 : Theoretical and actual draft conditions in vortex and ring spun yarns.

131
5.4 Comparison of Vortex, Conventional and Compact Ring Spun Yarn
Properties
In addition to the experiments conducted to investigate the effect of noil removal
ratio and the yarn delivery speed, the properties of the yarns in count of 36 Ne spun
from the carded and combed slivers with the noil removal ratio of 12% were
compared with those of the yarns spun on conventional ring and two different
compact spinning systems as Rotorcraft RoCoS and Suessen Elite®. The comparative
results are shown in Figures 5.50 - 5.57.
Figure 5.50 : Evenness of vortex spun yarns vs. ring and compact yarns.
While the evenness of carded vortex spun yarns are almost similar with that of ring
and compact spun yarns, combed vortex spun yarns are more irregular than ring and
compact spun yarns. The number of thin places of both carded and combed vortex
spun yarns are much higher than that of ring and compact spun yarns. With regard to
thick places, it was observed that the number of thick places in carded cotton vortex
spun yarns is lower when compared to conventional ring and compact ring spun
yarns. On the other hand, the number of thick places in combed cotton vortex spun
yarns is slightly higher than that of both other yarns, which is inconsistency with the
findings of Beceren and Nergis [58].
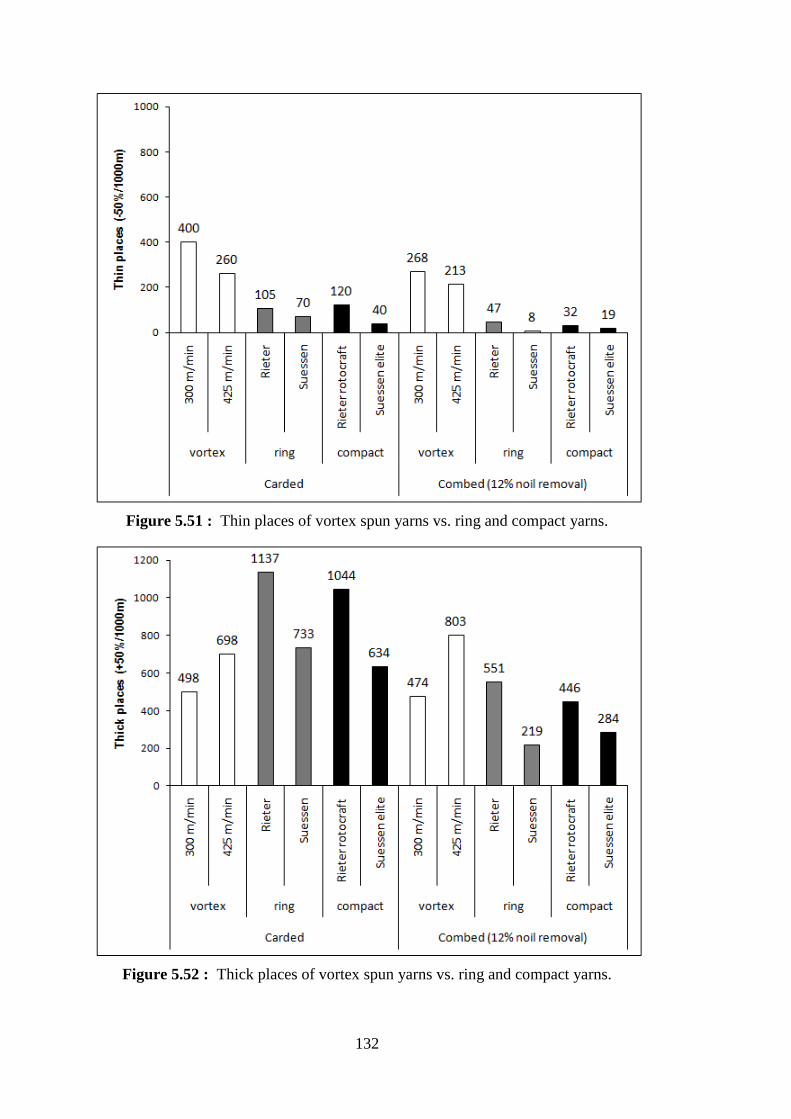
132
Figure 5.51 : Thin places of vortex spun yarns vs. ring and compact yarns.
Figure 5.52 : Thick places of vortex spun yarns vs. ring and compact yarns.

133
Figure 5.53 : Neps of vortex spun yarns vs. ring and compact yarns.
The results of the studies conducted by Ortlek and Onal, and Beceren and Nergis
revealed that the tenacity of vortex spun yarns is lower than conventional and
compact ring spun yarns [57,58]. This is also true for the yarn samples included in
this experimental study. Both carded and combed cotton vortex spun yarns yielded
lower tenacity compared to conventional and compact ring spun yarns.
The breaking elongation values of the spun yarns obtained by different systems
revealed that breaking elongation of both carded and combed vortex spun yarns is
lower than that of conventional and compact ring spun yarns, which is in
compatibility with the findings of Ortlek and Onal, who commented that breaking
elongation of viscose vortex spun yarns is lower than that of conventional and
compact ring spun yarns [57].
There is not a significant difference between the hairiness of carded and combed
vortex and compact ring spun yarns; however, hairiness of vortex spun yarns is lower
than that of ring spun yarns.

134
Figure 5.54 : Tenacity of vortex spun yarns vs. ring and compact yarns.
Figure 5.55 : Breaking elongation of vortex spun yarns vs. ring and compact yarns.
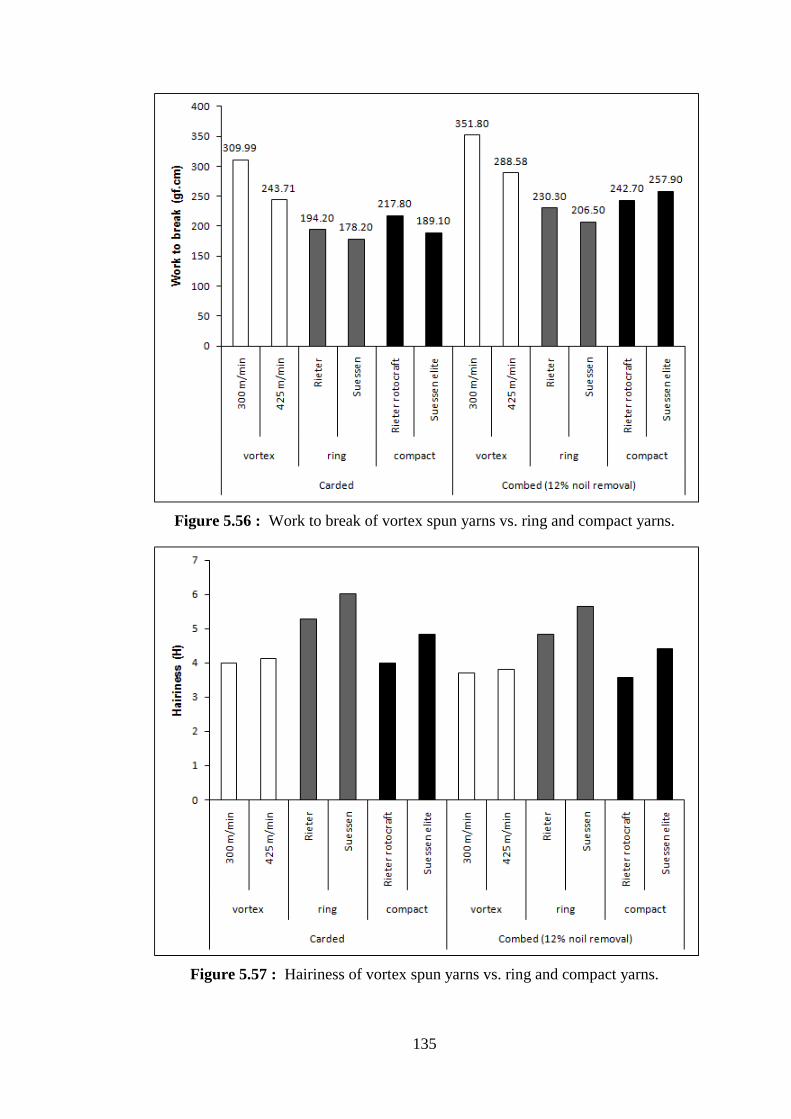
135
Figure 5.56 : Work to break of vortex spun yarns vs. ring and compact yarns.
Figure 5.57 : Hairiness of vortex spun yarns vs. ring and compact yarns.

136
The differences between the yarn properties of ring and vortex spun yarns can be
attributed to the structural differences of the yarns, which can be observed in Figure
5.58. The images were obtained by combining successive images of the yarns
captured by using Scanning Electron Microscope (SEM). Vortex spun yarn does not
have a straight yarn axis, which results in variations in yarn diameter, and
consequently more irregular yarn with higher frequency of yarn imperfections.
a. Ring yarn
b. Vortex yarn
Figure 5.58 : Comparison of the structures of ring and vortex yarns.
5.5 Process-Structure-Property Relationships for Vortex Spun Yarns
In the experimental studies on the determination of the finest spinnable yarn count on
vortex spinning system, it was observed that the structure and the properties of
vortex spun yarn changes significantly as the yarn becomes finer. Moreover, the
results revealed that the short fiber content of the cotton sliver and the yarn delivery
speed influence the structure and the properties of vortex spun yarn.
In order to prove the effect of yarn count, short fiber content and the yarn delivery
speed on the yarn structure of 100% cotton vortex spun yarns, simple linear
regression equations that relate the yarn count to the yarn structure are given in Table

137
5.22. There seems to be only minor differences between the proportion and average
lengths of Class 3 and Class 4 structures of the yarns with regard to yarn count.
Therefore, only Class 1 and Class 2 structures were included in the regression
equations.
The coefficient of determination, R2, defines the fraction of variability in the
dependent variable explained by the regression model. All of the above equations
shown in Table 5.22 have R2 values ranging from 40.5% to 73.7% at the 99% level
of confidence. According to the R2
values, the importance of the structural
parameters influenced by the yarn count can be ordered in such a way that, wrapper
fiber/core fiber ratio is the primary structural parameter determined by the yarn count
and followed by the percentage of Class 1 and Class 2 structures and the length of
the same structural classes respectively.
The equations point out that the yarn delivery speed is a decisive factor for the
amount of percentage and length of Class 1 and Class 2 structures. In addition, short
fiber content has impact on percentage of Class 1 and Class 2 structures and the
average length of Class 2 structure.
The analysis of the experimental results revealed that yarn evenness and the number
of thin places, thick places and neps are strongly related to the yarn count of the
cotton vortex yarn samples. All values follow an increasing trend as the yarn
becomes finer. Moreover, short fiber content of the sliver and the yarn delivery speed
has significant impacts on yarn properties. The regression analysis revealed that the
yarn count (Ne), short fiber content (SFC) and the yarn delivery speed is related to
the yarn evenness and imperfections including thin places, thick places and neps, and
Table 5.22 : The regression equations between yarn count and structural properties
of cotton vortex yarns.
Property Regression equation R2
Wrapper/core
ratio y = 0.013(Ne) + 0.240 0.737
Percentage
of Class 1 y = – 1.378(Ne) + 0.552(SFC) – 0.175 (speed) + 151.078 0.610
Average length
of Class 1 y = – 0.307(Ne) – 0.030 (speed) + 36.358 0.488
Percentage
of Class 2 y = 1.392(Ne) – 0.541(SFC) + 0.176 (speed) – 53.629 0.620
Average length
of Class 2 y = 0.764(Ne) – 0.584(SFC) + 0.067 (speed) – 27.995 0.405

138
the yarn tensile properties in terms of breaking load, tenacity and breaking elongation
by the equations given in Table 5.23.
The equations point out that the yarn count and short fiber content are decisive
factors for the yarn evenness. In addition, the equations show that there is a strong
correlation between the number of thin places and thick places and the yarn count,
short fiber content and the yarn delivery speed. On the other hand, these parameters
have a moderate impact on the number of neps, breaking load and breaking
elongation of the yarns.
The low R2
value for the yarn tenacity reflect the weak relationship between the yarn
count, short fiber content, yarn delivery speed and the yarn tenacity.
It can be concluded from the regression equations that the structure of vortex spun
yarns depends on the yarn count and the process conditions; and the changes in the
yarn structure determine the yarn properties. In other words, the yarn structure
interacts with the yarn count and the process conditions to determine the yarn
properties.
Process-structure and property relationships in cotton vortex spun yarns were proved
by the regression equations in Table 5.24. The equations reveal that yarn evenness
and the imperfections are strongly dependent on the yarn count, short fiber content of
the material, yarn delivery speed and the structural parameters as the ratio of wrapper
fibers to core fibers, and the percentage and length of Class 1 and Class 2 structures.
It can be concluded that these parameters also determine the breaking force, which is
an indicator of spinning performance. On the other hand, there is a moderate
Table 5.23 : The regression equations between yarn count and physical properties of
cotton vortex yarns.
Property Regression equation R2
Yarn evenness y = 0.224(Ne) + 0.079 (SFC) + 7.973 0.907
Thin places y = 38.495(Ne) +25.725 (SFC) – 0.430 (speed) – 1648.722 0.878
Thick places y = 28.093(Ne) –5.627 (SFC) + 2.230 (speed) – 1069.584 0.779
Neps y = 69.110(Ne) + 250.313 (SFC) –3.611 (speed) – 7221.524 0.628
Breaking force y = – 5.785(Ne) – 1.139 (SFC) – 0.096 (speed) + 469.975 0.675
Tenacity y = 0.009(Ne) – 0.070 (SFC) – 0.008 (speed) + 15.483 0.138
Breaking
elongation y = – 0.099(Ne) – 0.092 (SFC) – 0.009 (speed) + 15.387 0.656
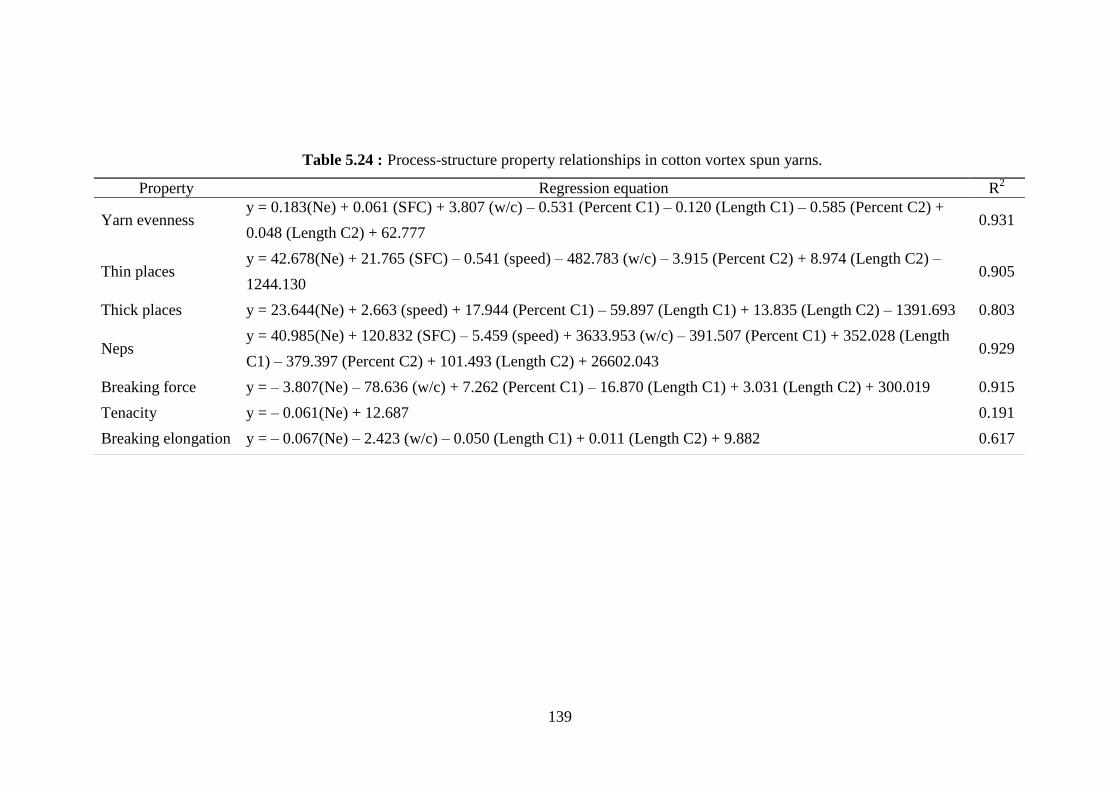
139
Table 5.24 : Process-structure property relationships in cotton vortex spun yarns.
Property Regression equation R2
Yarn evenness y = 0.183(Ne) + 0.061 (SFC) + 3.807 (w/c) – 0.531 (Percent C1) – 0.120 (Length C1) – 0.585 (Percent C2) +
0.048 (Length C2) + 62.777 0.931
Thin places y = 42.678(Ne) + 21.765 (SFC) – 0.541 (speed) – 482.783 (w/c) – 3.915 (Percent C2) + 8.974 (Length C2) –
1244.130 0.905
Thick places y = 23.644(Ne) + 2.663 (speed) + 17.944 (Percent C1) – 59.897 (Length C1) + 13.835 (Length C2) – 1391.693 0.803
Neps y = 40.985(Ne) + 120.832 (SFC) – 5.459 (speed) + 3633.953 (w/c) – 391.507 (Percent C1) + 352.028 (Length
C1) – 379.397 (Percent C2) + 101.493 (Length C2) + 26602.043 0.929
Breaking force y = – 3.807(Ne) – 78.636 (w/c) + 7.262 (Percent C1) – 16.870 (Length C1) + 3.031 (Length C2) + 300.019 0.915
Tenacity y = – 0.061(Ne) + 12.687 0.191
Breaking elongation y = – 0.067(Ne) – 2.423 (w/c) – 0.050 (Length C1) + 0.011 (Length C2) + 9.882 0.617

140
relationship between the breaking elongation of cotton vortex spun yarns and the
yarn count and structural parameters, and the tenacity of cotton vortex spun yarns
cannot be explained by these parameters.
141
6. CONCLUSION AND RECCOMENDATIONS
The overall objective of the research reported in this thesis was to identify the
possibilities of extending vortex spinning to finer yarns and to estimate the spinning
limits in vortex spinning system on the basis of yarn structure and properties.
The comparative investigation of yarn properties with a special reference to
cellulosic fibers revealed that the pure cotton vortex spun yarns are comparable to the
viscose and cotton- Modal® blended vortex spun yarns when overall yarn properties
are considered. The promising results regarding cotton vortex yarn led to the
investigation of possibilities of spinning fine count cotton vortex yarns.
The experimental research conducted for investigating fine count cotton yarn
spinning provided detailed understanding of yarn structure on the basis of yarn count.
The structure of vortex spun yarns depends on the yarn count and the process
conditions; and the changes in the yarn structure determine the yarn properties.
The ratio of wrapper fibers to core fibers is the most decisive structural parameter in
fine count spinning in vortex spinning system. The decrease in the ratio of core fibers
in the yarn structure as the yarn becomes finer causes a deterioration in yarn
properties in terms of yarn evenness and imperfections. Consequently, it seems that
there will be a limit of the ratio of wrapper fibers to core fibers for fine count
spinning in this system. This certainly shows that it would be worthy of further
investigation.
The short fiber content in the cotton sliver is an important parameter in spinning fine
count vortex spun yarns. The lower short fiber content in the sliver allows finer
counts to be spun in vortex spinning system.
The yarn delivery speed determines the residence time of the fibers in the yarn
formation zone, and also affects the fiber control due to the air flow caused by the
surface speed of the delivery rollers. The experiments revealed that yarn delivery
speed influences the yarn structure, and hence the yarn properties significantly
because of the aforesaid reasons.
142
The scope of the models describing the fiber-process-structure-property relationship,
which in turn identifies the factors that affect the vortex spinning of fine count cotton
yarns is limited to the process parameters and material properties that were used to
produce the samples. These models can be expanded to more comprehensive models
including cotton fibers with varying properties. Thus, further experiments are
required to extend the results obtained here to a wider range of fiber properties.
The current study should be followed by research analyzing the airflow in the yarn
formation zone and its impacts on the yarn structure, and particularly the ratio of
wrapper fibers to the core fibers.
In addition, the potential advantage an advantageous of the unique structure of vortex
spun yarn on knitted fabric properties should be researched. This could lead to
extended use of vortex spun yarns in this area of application.

143
REFERENCES
[1] Leitner, J., 2004. Yarn Innovations for Hoisery and Knitted Articles, Melliand
English, (9).
[2] Oxenham, W., 2002. Current and Future Trends in Yarn Production, Journal of
TATM, Vol.2,Issue 2.
[3] Babaarslan, O., and Vuruskan, D., 2005. Kompakt İplik Eğirme Sistemleri:
Tekstilde Yeri ve Önemi, Tekstil Teknolojileri ve Tekstil Makinaları
Kongresi, TMMOB Tekstil ve Makine Mühendisleri Odası, 11/12
Kasım 2005, Gaziantep.
[4] Jackowski, T., Cyniak, D., and Czekalski, J., 2004. Compact Cotton Yarn, Fibres
and Textiles in Eastern Europe, Vol.12, No.4(48), 22-26.
[5] Nikolic, M., Stjepanovic, Z., Lesjak F., Stritof, A., 2003. Compact Spinning
For Improved Quality of Ring-Spun Yarns, Fibres & Textiles in
Eastern Europe. Vol.11, No(4) 43, 30-35.
[6] Lawrence, C.A., 2003. Fundamentals of Spun Yarn Technology, CRC Press
LLC, USA.
[7] Basu, A., 1999. Progress in Air-jet Spinning, The Textile Institute, Textile
Progress, Vol.29, Number 3.
[8] Basu, A., 1991. Influence of Fibre Type on Properties of Jet Spun Yarns, PhD
Thesis, The University of Leeds.
[9] Oxenham, W., 2001. Fasciated Yarns - A Revolutionary Development?, Journal
of Textile and Apparel, Technology and Management, Vol.1, Issue 2,
1-7.
[10] Url<http://www.muratec-vortex.com>, accessed at 24.01.2007.
[11] Gherzi Textil Organisation AG, 2008. Interim report - Phase 1 & 2 - Market
study of cotton yarn imports and determination of product-mix of the
envisaged plant, Benchmarking of eleven (11) Sub-Saharan countries
as a possible location for the setting up of a cotton yarn spinning plant
project,from<http://www.unido.org/fileadmin/user_media/UNIDO_W
orldwide/Offices/UNIDO_Offices/South_Africa/Report_Phase_1_and
_2_XPRAF08005_01.pdf>, accessed at 30.10.2010.
[12] Bame, T., Private communication, 19.05.2009, Muratec, USA.
[13] Ortlek, H.G., Sener, M. and Ulku, S., 2004. Production Cost Analysis of MVS
Yarns and Comparison with the Conventional Spinning Systems (in
Turkish), Textile Technology, August, 82-92.
[14] Heitmann, U., 2008. Yarns for Fine Gauge Knitting Machines, Melliand
English, Issue 7-8, 51-52.
144
[15] Klein, W., 1993. New Spinning Systems, The Textile Institute, Manchester.
[16] US Patent 3,009,309, 1961. Fluid Jet Twist Crimping Process.
[17] Nergis, B.U., 1999. Yeni İplik Eğirme Sistemlerinden Birisi Olan Hava-Jetli
İplik Eğirme Sistemi nde Kullanılan Makinalar ve Hava-Jeti
İpliklerinin Özellikleri (in Turkish), Tekstil & Teknik, Ekim, s. 108-
120.
[18] McCreight D.J., Feil, R.W., Booterbaugh, J.H., and Backe, E.E., 1997.
Short Staple Yarn Manufacturing, Carolina Academic Press, USA.
[19] Gurcan, H.A., and Yucel, Ö., 1990. Murata Hava Jetli İplik Üretim Sistemi ve
Sistemdeki Gelişmeler, Tekstil & Teknik, No.3, 86-91.
[20] Basal, G., 2003. The Structure and Properties of Vortex and Compact Spun
Yarns, PhD Thesis, North Carolina State University.
[21] US Patent 5,528,895, 1996. Spinning Apparatus with Twisting Guide Surface.
[22] Basal, G., and Oxenham, W., 2003. Vortex Spun Yarn vs. Air-Jet Spun Yarn,
Autex Research Journal, Vol.3, No.3, 96-101.
[23]Url<http://www.textileworld.com/Articles/2002/August/Features/Compact_Or_
Fancy.html>, accessed at 11.01.2009.
[24] Ortlek, H.G., and Goksel, F., 2007. Murata Vortex Spinning System: The Role
and Importance at the Textile Market, The Journal of Textiles and
Enginners, Issue 66, 1-7.
[25] Oxenham, W., 2003. Spinning Machines at ITMA’03, Journal of Textile and
Apparel, Technology and Management, Vol.3, Issue 3, 1-6.
[26] Murata Machinery Ltd., Muratec Textile Machinery, MVS 861 Catalogue.
[27]Url<http://www.rieter.com/en/textile/short-staple-yarn/air-jetspinning>,
accessed at 17.04.2009.
[28] Murata Machinery Ltd., 2006. Murata Vortex Spinner No.861 Instruction
Manuel.
[29] Gray, W. M., 1999. How MVS Makes Yarns, 12th
Annual Engineer Fiber
Selection®
System Conference Papers, May 17 -19.
[30] Pei, Z., and Yu, C., 2009. Study on the Principle of Yarn Formation of Murata
Vortex Spinning Using Numerical Simulation, Textile Research
Journal, Vol.79(14), 1274–1280.
[31] Leitner, H., Schwippl, H., and Baldischwieler, O., 2010. Air-Jet Spinning –
Yarns & Fabrics Compared to Established Spinning Systems, XIIth
International Izmir Textile & Apparel Symposium, October 28-30,
Izmir, Turkey.
[32] US Patent 2007/0125062 A1, 2007. Air-jet Spinning Device.
[33] US Patent 2008/0190090 A1, 2008. Air Jet Spinning Machine.
[34] Basal, G., and Oxenham, W., 2006. Effects of some Process Parameters on
the Structure and Properties of Vortex Spun Yarn, Textile Research
Journal, Vol.76(6), 492–499.
145
[35] Zou, Z., Yu, J., Xue, W., Zhu, Y., Wu, J., and Cheng, L., 2009. Analysis of
the Fiber Spatial Trajectory in Vortex Spun Yarn, Textile Research
Journal, Vol.79(10), 924–929.
[36] Tyagi, G.K., Sharma, D., and Salhotra, K.R., 2004. Process-Structure-
Property Relationship of Polyester-Cotton MVS Yarns: Part I –
Influence of Processing Variables on the Yarn Structural Parameters,
Indian Journal of Fibre & Textile Research, December, Vol.29, 419-
428.
[37] Soe, A.K., Takahashi, M., Nakajima, M., Matsuo, T., and Matsumoto, T.,
2004. Structure and Properties of MVS Yarns in Comparison with
Ring Yarns and Open-End Rotor Spun Yarns, Textile Research
Journal, Vol.74(9), 819-826.
[38] Chasmawala, R.J., Hansen, S.M., and Jayaraman, S., 1990. Structure and
Properties of Air-Jet Spun Yarns, Textile Research Journal, Vol.60
(2), 61-69.
[39] Kuppers, S., Muller, H., Ziegler, K., Heitmann, U., and Planck, H., 2008.
Spinning Limits at Vortex Spinning at the Processing of 100% Cotton,
Melliand English, Issue 7-8, 71-72.
[40] Sukigara, S. and Suzuki Y., 2008. Effect of Vortex Yarn Structure on the
Fabric Mechanical and Tactile Characteristics, The Textile Institute
86th
World Conference, November 18-21.
[41] Zou, Z., Liu, S., Zheng, S., and Cheng, L, 2010. Numerical Computation of a
Flow Field Affected by the Process Parameters of Murata Vortex
Spinning, Fibres and Textiles in Eastern Europe, Vol.18, No.2 (79),
35-39.
[42] Zou, Z., Cheng, L., Xue, W. and Yu, J., 2008. A Study of the Twisted
Strength of the Whirled Airflow in Murata Vortex Spinning, Textile
Research Journal, Vol.78(8), 682-687.
[43] Tyagi, G.K., Sharma, D., and Salhotra, K.R., 2004. Process-Structure-
Property Relationship of Polyester-Cotton MVS Yarns: Part II –
Influence of Processing Variables on the Yarn Characteristics, Indian
Journal of Fibre & Textile Research, December, Vol.29, 429-435.
[44] Tyagi, G.K., and Sharma, D., 2004. Performance and Low-stress
Characteristics of Polyester-Cotton MVS Yarns, Indian Journal of
Fibre & Textile Research, September, Vol.29, 301-307.
[45] Ortlek, H.G., and Ulku S., 2005. Effect of Some Variables on Properties of
100% Cotton Vortex Spun Yarn, Textile Research Journal, Vol.75(6),
458-461.
[46] Ortlek, H.G., and Ulku S., 2008. Effect of Jet Pressure on the Properties of
Cotton MVS Spun Yarns (in Turkish), Uludağ Üniversitesi
Mühendislik-Mimarlık Fakültesi Dergisi, Vol.13, Issue 1, 47-57.
[47] Zou, Z.Y., Yu, J.Y., Cheng, L,D. and Xue, W.L., 2009. A Study of
Generating Yarn Thin Places of Murata Vortex Spinning, Textile
Research Journal, Vol.79(2), 129–137.

146
[48] Tyagi, G.K., and Sharma, D., 2005. Low-stress Characteristics of Polyester-
Cotton MVS Yarn Fabrics, Indian Journal of Fibre & Textile
Research, March, Vol.30, 49-54.
[49] Tyagi, G.K., and Sharma, D., 2005. Thermal Comfort Characteristics of
Polyester-Cotton MVS Yarn Fabrics, Indian Journal of Fibre &
Textile Research, December, Vol.30, 363-370.
[50] Ortlek, H.G., Nair, F., Kilik, R., and Güven, K., 2008. Effect of Spindle
Diameter and Spindle Working Period on the Properties of 100%
Viscose MVS Yarns, Fibres and Textiles in Eastern Europe, Vol.16,
No.3 (68), 17-20.
[51] Guo, H., An, X., Yu, Z., Yu, C., 2008. A Numerical and Experimental Study
on the Effect of the Cone Angle of the Spindle in Murata Vortex
Spinning Machine, Journal of Fluids Engineering, Vol.130, Issue 3,
1-5.
[52] Johnson, W. M., 2002. The Impact of MVS Machine Settings and Finishing
Applications on Yarn Quality and Knitted Fabric Hand, MSc. Thesis,
Institute of Textile Technology, Charlottesville, Virginia,.
[53] Kilic, M., and Okur, A., 2011. The Properties of Cotton-Tencel and Cotton-
Promodal Blended Yarns Spun in Different Spinning Systems, Textile
Research Journal, Vol.81, No.2, 156-172.
[54] Gordon, S., 2002. The Effect of Short Fibre and Neps on Murata Vortex
Spinning, The Australian Cottongrower, Vol.23, No.1, 28-37, from
<http://www.greenmountpress.com.au/cottongrower/Back%20issues/
231jfcot02/28_Effect.pdf>.
[55] Ortlek, H.G., and Ulku S., 2004. Vortex Spinning System (MVS) and Yarn
Properties (in Turkish), Tekstil&Teknik, April, 222-228.
[56] Rameshkumar C., Anandkumar P., Senthilnathan P., Jeevitha R., and
Anbumani N., 2008. Comparative Studies on Ring, Rotor and Vortex
Yarn Knitted Fabrics, AUTEX Research Journal, Vol.8, No.4, 100-
105.
[57] Ortlek, H.G., and Onal, L., 2008. Comparative Study on the Characteristics of
Knitted Fabrics Made of Vortex-Spun Viscose Yarns, Fibers and
Polymers, Vol.9, No.2, 194-199.
[58] Beceren, Y., and Nergis, B.U., 2008. Comparison of the Effects of Cotton
Yarns Produced by New, Modified and Conventional Spinning
Systems on Yarn and Knitted Fabric Performance, Textile Research
Journal, Vol.78 (4), 297-303.
[59] Li, Q., Brady, P.R., Hurren, C.J., and Wang, X.G., 2008. The Dimensional
and Mechanical Properties of Wool/Polyester Fabrics Made from
Vortex and Ring-Spun Yarns, The Journal of Textile Institute, Vol.99,
Issue 6, 561-568.
[60] Unal, P.,G., 2010. Investigation of Some Handle Properties of Fabrics Woven
with Two Folded Yarns of Different Spinning Systems, Textile
Research Journal, Vol.80 (19), 2007-2015.

147
[61] Ozdemir, H., and Ogulata, R.T., 2010. Effect of Yarns Producing Different
Spinning Systems on Bending Resistance of Knitted Fabrics, Journal
of Textile and Apparel, October-December 2010, Vol.20, Issue 4, 313-
319.
[62] Kirecci, A., Erdal, P.P., and Ġcoglu, H.I., 2009. Comparison of the Fastness
Properties and Color Values of Cotton Fabrics Knitted from Air-
Vortex and Ring Spun Yarns, Tekstil ve Konfeksiyon, Vol.19, Issue 4,
304-311. [63] Ortlek, H.G., Tutak, M., and Yolacan, G., 2010. Assessing colour differences
of viscose fabrics knitted from vortex, ring and open-end rotor-spun
yarns after abrasion, Journal of the Textile Institute, Vol.101, No.4,
310-314.
[64] ASTM D5867 – 05, 2005. Standard Test Methods for Measurement of Physical
Properties of Cotton Fibers by High Volume Instruments, American
Society for Testing and Materials, PA, USA.
[65] ASTM D5866 – 05, 2005. Standard Test Method for Neps in Cotton Fibers
(AFIS-N Instrument), American Society for Testing and Materials,
PA, USA.
[66] Rajamanickam, R., Hansen, S.M., Jayaraman, S., 1998. Studies on Fiber-
Process-Structure_Property Relationships in Air-Jet Spinning Part I:
The effect of Process and Material Parameters on the Structure of
Microdenier Polyester-fiber/Cotton Blended Yarns, Journal of Textile
Institute, Vol.89, Issue 2, 214-242.
[67] Nergis, B.U., 2000. An Investigation into the Effects of Spinning Parameters in
Plyfil 1000 System, PhD Thesis, Istanbul Technical University.
[68] TS 244 EN ISO 2060, 1999. Textiles-Yarn from packages- Determination of
linear density (mass per unit length) by the skein method, Turkish
Standards Institution, Ankara.
[69] ASTM D6587 - 00(2006)e1, 2006. Standard Test Method for Yarn Number
Using Automatic Tester, American Society for Testing and Materials,
PA, USA.
[70] ASTM D1425 / D1425M-09, 2009. Standard Test Method for Unevenness of
Textile Strands Using Capacitance Testing Equipment, American
Society for Testing and Materials, PA, USA.
[71] TS EN ISO 2062, 1996. Textiles - Yarns from packages - Determination of
single-end breaking force and elongation at break using constant rate
of extension (CRE) tester, Turkish Standards Institution, Ankara.
[72] Kato, H., 1986. Development of MJS Yarns, Journal of the Textile Machinery
Society of Japan, Vol.38, No.2, 95-102.
[73] ASTM D1422 - 99(2008), 2008. Standard Test Method for Twist in Single Spun
Yarns by the Untwist-Retwist Method, American Society for Testing
and Materials, PA, USA.
[74] Chattopadhyay, R. and Sinha, S.K., 2007. “A Study on Spinning Limits and
Yarn Properties with Progressive Change in Yarn Count in Friction
Spinning”, Autex Research Journal, Vol.7, No.1, 1-8.

148
[75] TS 251, 2008. Determination of Mass per Unit Length and Mass per Unit Area,
Turkish Standards Institution, Ankara.
[76] TS EN 14970, 2006. Textiles - Knitted fabrics - Determination of stitch length
and yarn linear density in weft knitted fabrics, Turkish Standards
Institution, Ankara.
[77] TS EN 14971, 2006. Textiles - Knitted fabrics - Determination of number of
stitches per unit length and unit area, Turkish Standards Institution,
Ankara.
[78] TS EN ISO 12945-1, 2002. Textiles - Determination of fabric propensity to
surface fuzzing and to pilling - Part 1: Pilling box method, Turkish
Standards Institution, Ankara.
[79] TS EN ISO 12947-2, 2001. Textiles- Determination of abrasion resistance of
fabrics by the Martindale method- Part 2: Determination of specimen
breakdown, Turkish Standards Institution, Ankara.
[80] TS EN ISO 12947-3, 2001. Textiles- Determination of the abrasion resistance
of fabrics by the Martindale method- Part 3: Determination of mass
loss, Turkish Standards Institution, Ankara.
[81] TS 393 EN ISO 13938-1, 2002. Textiles- Bursting properties of fabrics- Part 1:
Hydraulic method for determination of bursting strength and bursting
distension, Turkish Standards Institution, Ankara.
[82] TS 5720 EN ISO 6330/A1, 2010. Textiles- Domestic washing and drying
procedures for textile testing, Turkish Standards Institution, Ankara.
[83] AATCC Test Method 179-2004, 2004. Skewness Change in Fabric and
Garment Twist Resulting from Automatic Home Laundering, The
American Association of Textile Chemists and Colorists, NC, USA.
[84] Carver, R.H., and Nash, J.G., 2006. Doing data analysis with SPSS version14,
Belmont, CA : Thomson-Brooks/Cole.
[85] Leech, N.L., Barrett, K.C., and Morgan, G.A., 2005. SPSS for Intermediate
Statistics, Use and Interpretation, Lawrence Erlbaum Associates
Publishers, Second Edition, Mahwah, New Jersey, London.
[86]Url<http://www.hsph.harvard.edu/biostats/about/.../Lecture_14Linear_regressio
n.ppt>, accessed at 21.11.2010.
[87] Warner, S.B., 1995. Fiber Science, Prentice Hall, USA.
[88] Rathod, A., and Kolhatkar, A., 2010. Yarn&Fabric: Bamboo vs Cotton,
Indian Textile Journal, October, 18-22.
[89] Tyagi, G.K., and Sharma, D., 2001. Influence of Process Parameters on the
Properties of Polyester Jet-spun Yarns, Indian Journal of Fibre &
Textile Research, December, Vol.26, 349-353.
[90] Ersoy, O., 1995. A Study on Air-Jet Spinning: The Influence of Draft and
Sliver Weight on Yarn Structure and Properties, MSc Thesis, North
Carolina State University.
149
[91] Audivert, R., Villaronga, M., and Coscolla, R., 1967. Drafting Force in the
Front Zone of a Double Apron, Textile Research Journal, Vol.37, 1-
10.
[92] Su, C.-I., Lo, K.-J., and Lee, J.-Y., 1998. Drafting Force of Fine Denier
Polyester Fibers, Textile Research Journal Vol.6(88). 559-563.
[93] Su, C.-I., Liu, C.-H., and Jiang, J.-Y., 2003. Drafting Force of Twin Spun
Yarn, Textile Research Journal, Vol.73 (9), 815-818.
[94] Su, C.-I., and Jiang, J.-Y., 2004. Fine Count Yarn Spun with a High Draft
Ratio, Textile Research Journal, Vol.74 (2), 123-126.
[95] Su, C.-I., and Fang, J.-X., 2006. Optimum Drafting Conditions of Non-circular
Polyester and Cotton Blend Yarns, Textile Research Journal,
Vol.76(6), 441-447.
[96] Barella, A., and Manich, A.M., 2002. Yarn hairiness: A further update, Textile
Progress, Vol.31, No. 4.
[97] Huh, Y., and Kim, J.S., 2004. Modeling the Dynamic Behavior of the Fiber
Bundle in a Roll-Drafting Process, Textile Research Journal,
Vol.74(10), 872-878.
[98] Huh, Y., and Kim, J.S., 2006. Effects of Material Parameters and Process
Conditions on the Roll-Drafting Dynamics, Fibers and Polymers,
Vol.7, No.4, 424-431.
[99] Kim, J.S., Cherif C., and Huh, Y., 2008. Numerical Analysis of Fiber Fleece
Behavior in Roller Drafting in a Transient State, Textile Research
Journal, Vol.78(9), 796-805.
[100] Stalder, H., 1989. Short Staple Spinning in the Nineties, Textile Institute
World Conference, October 16-20, Nottingham, UK.
[101] Lawrence, C.A., and Baqui, M.A., 1991. Effects of Machine Variables on the
Structure and Properties of Air-Jet Fasciated Yarn, Textile Research
Journal, Vol. 61, No. 3, 123-130.
[102] Penava, Ž., and Orešković, V., 1997. Analysis of the Coincidence between
Thin Places and Breaking Points in a Yarn, Journal of Textile
Institute, Vol.88, No.1, 21-32.

150
151
CURRICULUM VITAE
Candidate’s full name: Nazan ERDUMLU
Place and date of birth: Isparta, 25.01.1980
Permanent Address: ITU Tekstil Teknolojilreri ve Tasarımı Fakültesi, İnönü Cad.
No.65 34437 Gümüşsuyu, İSTANBUL
Universities and
Colleges attended: Istanbul Technical University
Publications:
Erdumlu N., Ozipek B., "Effect of Draft Ratio on the Properties of Vortex Spun
Yarn", Fibres & Textiles in Eastern Europe, Vol. 18, No. 3, 2010, s. 38-42.
Erdumlu N., "Analysis of Global Impacts on the Turkish Cotton Spinning
Industry", Fibres & Textiles in Eastern Europe, Vol. 17, No. 5, 2009, s. 9-13.
Erdumlu N., Ozipek B., Oztuna A.S., Cetinkaya S., "Investigation of Vortex
Spun Yarn Properties in Comparison with Conventional Ring and Open-End Rotor
Spun Yarns", Textile Research Journal, Vol. 79, No. 7, 2009, s. 585-595.
Erdumlu N., Ozipek B., "Investigation of Regenerated Bamboo Fibre and Yarn
Characteristics", Fibres & Textiles in Eastern Europe, Vol. 16, No. 4, 2008, s. 43-47.
Erdumlu N., "The Factors Affecting the Structure and Proporties of the Yarns
Spun on Murata Vortex Spinner (MVS) Yarn Spinning System" (in Turkish),
Electronic Journal of Textile Technologies, Vol. 4, No. 1, 2010, s. 98-108, (Review).
Erdumlu N., "Bamboo Fibre and its Properties" (in Turkish), Electronic Journal
of Textile Technologies, Vol. 2, No. 3, 2008, s. 45-50, (Short article).
Erdumlu N., "Performances of Compact Yarns Spun on Different Principles" (in
Turkish), Örme Ihtisas, No. 29, 2008.
Erdumlu N., Oxenham W., Ozipek B., "Evaluation of Fuzz on Fabric Surfaces
Knitted from Cotton Vortex Spun Yarns", 2010, 10th
AUTEX World Textile
Conference, Vilnius, Lithuania, 21.06.2010 - 23.06.2010, (Oral presentation).
152
Saricam C., Erdumlu N., "A Research on Online Apparel Retailing Applications
in Turkey", 2010, 10th
AUTEX World Textile Conference, Vilnius, Lithuania,
21.06.2010 - 23.06.2010, (Oral presentation).
Erdumlu N., Saricam C., "Overview of Apparel Retailing Industry in Turkey",
2010, 41st International Symposium on Novelties in Textiles, Ljubljana, Slovenia,
27.05.2010 - 29.05.2010, (Oral presentation).
Saricam C., Erdumlu N., "The Impact of Knowledge on the Purchasing Decision
of Environmentally Friendly Apparel", 2010, 41st International Symposium on
Novelties in Textiles, Ljubljana, Slovenia, 27.05.2010 - 29.05.2010, (Oral
presentation).
Erdumlu N., Ozipek B., "Effects of Repeated Laundering on the Performances of
Plain Jersey Knitted Fabrics Made from Vortex and Ring Spun Yarns", 2009,
National Research Centre (NRC), 6th
International Conference, Cairo, Egypt,
05.04.2009 - 07.04.2009, (Oral presentation).
Erdumlu N., "Electromagnetic Shielding Applications in Textiles", 2008, 8th
AUTEX World Textile Conference, Biella, Italy, 24.06.2008 - 26.06.2008, (Poster
presentation).
Erdumlu R.M., Tanyas M., Erdumlu N., "City Logistics and Freight Village
Development for Textile and Clothing Industry", 2007, Intelligent Textiles and Mass
Customisation International Conference, Casablanka, Morocco, 15.11.2007 -
17.11.2007, (Oral presentation).