cotton value chain and upgrading strategies of cotton
201
COTTON VALUE CHAIN AND UPGRADING STRATEGIES OF COTTON PRODUCERS IN THE VALUE CHAIN: THE CASE OF ŞANLIURFA A THESIS SUBMITTED TO THE GRADUATE SCHOOL OF NATURAL AND APPLIED SCIENCES OF MIDDLE EAST TECHNICAL UNIVERSITY BY ASLIHAN KAHRAMAN IN PARTIAL FULFILLMENT OF THE REQUIREMENTS FOR THE DEGREE OF MASTER OF SCIENCE IN REGIONAL PLANNING IN CITY AND REGIONAL PLANNING SEPTEMBER 2019
-
Upload
khangminh22 -
Category
Documents
-
view
3 -
download
0
Transcript of cotton value chain and upgrading strategies of cotton
COTTON VALUE CHAIN AND UPGRADING STRATEGIES OF COTTON
PRODUCERS IN THE VALUE CHAIN: THE CASE OF ŞANLIURFA
A THESIS SUBMITTED TO
THE GRADUATE SCHOOL OF NATURAL AND APPLIED SCIENCES
OF
MIDDLE EAST TECHNICAL UNIVERSITY
BY
ASLIHAN KAHRAMAN
IN PARTIAL FULFILLMENT OF THE REQUIREMENTS
FOR
THE DEGREE OF MASTER OF SCIENCE
IN
REGIONAL PLANNING IN CITY AND REGIONAL PLANNING
SEPTEMBER 2019

Approval of the thesis:
COTTON VALUE CHAIN AND UPGRADING STRATEGIES OF COTTON
PRODUCERS IN THE VALUE CHAIN: THE CASE OF ŞANLIURFA
submitted by ASLIHAN KAHRAMAN in partial fulfillment of the requirements for
the degree of Master of Science in Regional Planning in City and Regional
Planning Department, Middle East Technical University by,
Prof. Dr. Halil Kalıpçılar
Dean, Graduate School of Natural and Applied Sciences
Prof. Dr. Çağatay Keskinok
Head of Department, City and Regional Planning
Prof. Dr. M. Melih Pınarcıoğlu
Supervisor, City and Regional Planning, METU
Examining Committee Members:
Prof. Dr. Anlı Ataöv
City and Regional Planning, METU
Prof. Dr. M. Melih Pınarcıoğlu
City and Regional Planning, METU
Prof. Dr. Bilge Armatlı Köroğlu
City and Regional Planning, Gazi University
Date: 10.09.2019
iv
I hereby declare that all information in this document has been obtained and
presented in accordance with academic rules and ethical conduct. I also declare
that, as required by these rules and conduct, I have fully cited and referenced all
material and results that are not original to this work.
Name, Surname:
Signature:
Aslıhan Kahraman
v
ABSTRACT
COTTON VALUE CHAIN AND UPGRADING STRATEGIES OF COTTON
PRODUCERS IN THE VALUE CHAIN: THE CASE OF ŞANLIURFA
Kahraman, Aslıhan
Master of Science, Regional Planning in City and Regional Planning
Supervisor: Prof. Dr. M. Melih Pınarcıoğlu
September 2019, 182 pages
Shifting patterns in global trade and production systems bring different new
implications for the regions who want to integrate into it. From the perspective of
regional development, engaging with these global trade and production networks
became one of the major concerns of developers and policy makers; however, the
terms and conditions of the engagement determine whether the region gains or loses
because of this integration. Value chains approach, in this respect, come into
prominence as a useful framework to understand the recent dynamics of global trade
and provides valuable tools for enhancing the position of actors participating into these
global trade networks.
The thesis investigates cotton value chain in Şanlıurfa. Even though Şanlıurfa is the
greatest cotton supplier of the GAP Region and Turkey, there are several problems
associated with cotton value chain affecting the competitiveness of the region and
textiles sector. The study aims to identify problems and opportunities of the cotton
value chain and further examines upgrading strategies taking place in cotton
production. It also aims to explore positions and attitudes of farmers towards
upgrading, and factors affecting their upgrading decisions. Particular attention is paid
to “upgrading” activities because regional value creation or value increase are usually
vi
achieved through upgrading strategies. Upgrading is also important in terms of
promoting appropriate strategies to improve the ways and terms that agricultural
producers are integrated into the global cotton value chain and enhancing their
position in this integration in order to promote more sustainable economic and
regional development.
Keywords: Value chain, upgrading, cotton, agricultural production, Şanlıurfa
vii
ÖZ
PAMUK DEĞER ZİNCİRİ VE PAMUK ÜRETİCİLERİNİN DEĞER
ZİNCİRİNDE YÜKSELTME / İYİLEŞTİRME STRATEJİLERİNİN
İNCELENMESİ: ŞANLIURFA ÖRNEĞİ
Kahraman, Aslıhan
Yüksek Lisans, Bölge Planlama
Tez Danışmanı: Prof. Dr. M. Melih Pınarcıoğlu
Eylül 2019, 182 sayfa
Küresel ticaret ve üretim sistemlerindeki değişen dinamikler bu sistemlere entegre
olmak isteyen bölgeler için yeni ve farklı gereksinimler teşkil etmektedir. Bölgesel
kalkınma perspektifinden bakıldığında, bu küresel ticaret ve üretim sistemlerine
entegre olmak bölge kalkınmacılarının ve politika yapıcıların önemli kalkınma
hedefleri arasında yer alsa da bölgelerin kazanan veya kaybeden bölgeler arasında
olmasında belirleyici faktör bu küresel sistemlere entegre olma biçimi ve şartlarıdır.
Değer zinciri yaklaşımı bu bağlamda, küresel ticaretin güncel dinamiklerini anlamada
ve katılan aktörlerin sistem içerisindeki pozisyonlarının iyileştirilmesinde faydalı bir
araç olarak ön plana çıkmaktadır.
Bu tezin amacı Şanlıurfa İli’ndeki pamuk değer zincirini araştırmaktır. Şanlıurfa, GAP
Bölgesi ve Türkiye’nin en büyük pamuk üreticisi olmasına rağmen, pamuk değer
zinciri bölgenin ve bölgedeki gelişmiş tekstil sektörünün rekabet gücünü olumsuz
etkileyen pek çok probleme sahiptir. Çalışmanın hedefi öncelikle pamuk değer
zincirinin problem ve potansiyellerini, daha sonra da değer zincirinin tarımsal üretim
aşamasında gerçekleşen iyileştirme/yükseltme (upgrading) stratejilerini ve pamuk
üreticilerinin bu stratejiler karşısındaki tutumlarını, pozisyonlarını ve karar verme

viii
mekanizmalarını etkileyen faktörleri araştırmaktır. Özellikle iyileştirme/yükseltme
stratejilerine konsantre olunmasının sebebi bölgedeki değer yaratma ve yaratılan
değer artışının bu stratejiler aracılığıyla sağlanmasıdır. Değer zinciri yaklaşımı aynı
zamanda ildeki tarımsal üreticilerin küresel pamuk değer zincirine eklemlenme
biçimlerinin ve şartlarının iyileştirilmesi ve daha sürdürülebilir bir ekonomik ve
bölgesel kalkınma sağlaması açısından da önem taşımaktadır.
Anahtar Kelimeler: Değer zinciri, iyileştirme, yükseltme, pamuk, tarımsal üretim,
Şanlıurfa

ix
To my mother & father..
x
ACKNOWLEDGEMENTS
I would like to express mydeepest gratitude and thanks to the people who supported
and encouraged me during this thesis study. In my deepest and modest
acknowledgement, first of all, I am particularly thankful to my supervisor Prof. Dr.
M. Melih Pınarcıoğlu for his valuable insight, guidance and encouragement
throughout the study. I would also like to thank the jury members Prof. Anlı Ataöv
and Prof. Bilge Armatlı Köroğlu for their comments and contributions to the thesis.
I owe special thanks to the ‘Integrated Resource Efficiency in Agriculture and Agro-
based Industries in Southeast Anatolia’ Project team members from GAP-RDA and
UNDP who organized several fieldtrips to the GAP Region (Southeastern Anatolia
Region) and enabled making local connections to conduct field research and
interviews. In addition, it was a pleasure to work with distinguished academics Prof.
Halis Akder and Prof. Haluk Kasnakoğlu throughout the project and benefit from their
extensive knowledge and experience. I am also deeply thankful to all local people who
talked to me during my interviews.
With deepest gratitude to my family, I must express that I would not be able to write
this thesis without their support, encouragement and patience all the time. I deeply
appreciate their help with all my heart.
xi
TABLE OF CONTENTS
ABSTRACT ................................................................................................................. v
ÖZ ........................................................................................................................... vii
ACKNOWLEDGEMENTS ......................................................................................... x
TABLE OF CONTENTS ........................................................................................... xi
LIST OF TABLES ..................................................................................................... xv
LIST OF FIGURES ................................................................................................. xvi
LIST OF ABBREVIATIONS ................................................................................. xvii
CHAPTERS
1. INTRODUCTION ................................................................................................ 1
1.1. Aim .................................................................................................................... 1
1.2. Justification ....................................................................................................... 5
1.3. Research Questions ........................................................................................... 8
1.4. Context ............................................................................................................ 13
1.5. Methodology ................................................................................................... 14
1.6. Why Şanlıurfa? ................................................................................................ 19
1.7. Why Cotton? .................................................................................................... 20
2. THEORETICAL FRAMEWORK ...................................................................... 25
2.1. Changing Theory ............................................................................................. 25
2.2. Value Chains ................................................................................................... 28
2.2.1. Origins of the Value Chains Framework .................................................. 31
2.2.2. Why Value Chains .................................................................................... 34
2.2.3. Value Chains and Regional Development ................................................ 41
xii
2.3. Value Chain Analysis...................................................................................... 45
2.3.1. Setting the Content of the Study ............................................................... 47
2.3.2. Actors and Activities ................................................................................ 48
2.3.3. Economic Analysis ................................................................................... 50
2.3.3.1. The Concept of Value and Its Measurement ..................................... 50
2.3.3.2. Economic Rent and Barriers to Entry ................................................ 52
2.3.3.3. Analysis of Input-Output Markets and Demand ................................ 54
2.3.4. Analyzing Socio-Economic Context ........................................................ 56
2.3.5. Analyzing Institutional Set up .................................................................. 57
2.3.6. Governance ............................................................................................... 58
2.3.7. Upgrading ................................................................................................. 71
2.3.7.1. Product Upgrading ............................................................................. 73
2.3.7.2. Process Upgrading ............................................................................. 73
2.3.7.3. Functional Upgrading ........................................................................ 74
2.3.7.4. Chain Upgrading / Inter-sectoral Upgrading ..................................... 74
2.3.7.5. Horizontal Coordination .................................................................... 77
2.3.7.6. Vertical Coordination ........................................................................ 78
2.3.7.7. The Enabling Environment ................................................................ 78
2.3.7.8. The Relationship of Upgrading with Governance ............................. 79
3. A BRIEF OVERVIEW: NEED FOR UPGRADING IN COTTON
PRODUCTION.......................................................................................................... 81
3.1. Organic Cotton ................................................................................................ 83
3.1.1. Organic Cotton in the World .................................................................... 83
3.1.2. Organic Cotton in Turkey ......................................................................... 89
xiii
3.2. Better Cotton ................................................................................................... 94
3.2.1. Better Cotton in the World........................................................................ 94
3.2.2. Better Cotton in Turkey ............................................................................ 96
3.3. Local Context .................................................................................................. 99
4. ANALYZING COTTON VALUE CHAIN IN ŞANLIURFA ......................... 103
4.1. Cotton Value Chain Analysis ........................................................................ 105
4.1.1. Major Activities and Actors .................................................................... 105
4.1.1.1. Input Supply ..................................................................................... 107
4.1.1.2. Agricultural Production .................................................................... 111
Economic Sustainability of Cotton Production in Şanlıurfa ......................... 116
Environmental Sustainability of Cotton Production in Şanlıurfa ................. 118
4.1.1.3. Processing ........................................................................................ 121
Ginning .......................................................................................................... 122
Textile Manufacturing ................................................................................... 125
4.1.1.4. Logistics ........................................................................................... 130
4.1.2. Governance ............................................................................................. 130
4.1.3. Economic Analysis ................................................................................. 132
4.1.3.1. Barriers to Entry and Rent................................................................ 132
4.1.3.2. Input-Output Markets and Demand for Value Chain Outputs ......... 133
4.1.3.3. Distribution of Value Added Along the Chain ................................ 133
5. UPGRADING ACTIVITIES IN COTTON VALUE CHAIN ......................... 135
5.1. Upgrading in Cotton Production ................................................................... 137
5.1.1. Organic Cotton in Şanlıurfa .................................................................... 137
5.1.2. Better Cotton in Şanlıurfa ....................................................................... 141
xiv
5.2. Impacts of Product Upgrading on Cotton Farmers in Şanlıurfa ................... 143
5.2.1. Increase in Unit Prices for Cotton .......................................................... 143
Pricing of Organic Cotton ............................................................................ 143
Pricing of Better Cotton ................................................................................ 144
5.2.2. Vertical Coordination and Contract Farming ......................................... 145
5.2.3. Horizontal Coordination ......................................................................... 148
5.2.4. Environmental Improvement .................................................................. 150
5.2.5. Increased Learning and Knowledge ....................................................... 151
5.2.6. Increased Exports and Access to Different Markets .............................. 152
5.3. Attitudes of Farmers Towards Upgrading .................................................... 153
5.4. Planning Solution vs. Market Solution for Upgrading ................................. 158
6. CONCLUSION ................................................................................................ 161
REFERENCES ........................................................................................................ 167
APPENDICES ......................................................................................................... 175
A. Interview Questions .................................................................................. 175
B. Informant List ........................................................................................... 180

xv
LIST OF TABLES
TABLES
Table 1.1. Research Questions, Sub-questions and Indicators .................................. 11
Table 1.2. Distribution of Informants ........................................................................ 18
Table 1.3. Cotton Supply and Distribution (Metric Tons) by Country 2018/19 ........ 21
Table 3.1. Organic Cotton Cultivation Area, Number of Farmers and Production ... 90
Table 3.2. Organic Cotton Production by Cities in Turkey ....................................... 91
Table 3.3. Comparison of Organic and Conventional Cotton Production Costs and
Revenues .................................................................................................................... 93
Table 3.4. National Better Cotton Statistics ............................................................... 98
Table 4.1 Farm Scale and Sizes ............................................................................... 112
xvi
LIST OF FIGURES
FIGURES
Figure 1.1. Groups of informants that have been interviewed .................................. 17
Figure 1.2. Cotton Production by Country 2018/19 .................................................. 22
Figure 2.1. (Neo) Classical Theory of International Trade ....................................... 28
Figure 2.2. The Generic Value Chain ........................................................................ 32
Figure 2.3. A Simple Value Chain ............................................................................. 48
Figure 2.4. Key determinants of global value chain governance .............................. 63
Figure 2.5. Orders of Worth and Quality Conventions ............................................. 66
Figure 2.6. Micro-level analysis of governance with two modules (linkages and
conventions) ............................................................................................................... 68
Figure 2.7. Meso-level analysis of governance with two modules ............................ 69
Figure 2.8. Macro-level framework for the analysis of ‘whole chain’ governance .. 70
Figure 3.1. Organic Cotton Production Share by Countries ...................................... 84
Figure 3.2. Enter the Figure Caption here Organic Seed Cotton & Organic Lint Cotton
Prices (2016/17) ......................................................................................................... 88
Figure 3.3. Highest Organic Cotton Producing Cities in 2016 and Their Shares in
Percentages ................................................................................................................ 92
Figure 3.4. Organizational Structure of Better Cotton People ................................... 95
Figure 3.5. Organic Cotton Production by Cities in Turkey ...................................... 97
Figure 4.1. Cotton Value Chain Map in Şanlıurfa ................................................... 106
Figure 4.2. Processing Stage Activities of Cotton Value Chain .............................. 125
Figure 5.1. Share of Organic Cotton Production of Şanlıurfa in Turkey ................ 138
xvii
LIST OF ABBREVIATIONS
ABBREVIATIONS
BCI – Better Cotton Initiative
GAP – Güneydoğu Anadolu Projesi
GAP RDA – GAP Regional Development Administrative
GAPTAEM – GAP Tarımsal Araştırma Enstitüsü Müdürlüğü
ICAC – International Cotton Advisory Committee
ICT – Information and Communication Technologies
IPUD – İyi Pamuk Uygulamaları Derneği
TUİK – Türkiye İstatistik Kurumu
TURKSTAT – Turkish Statistical Institute
UNDP – United Nations Development Programme

xviii
1
CHAPTER 1
1. INTRODUCTION
1.1. Aim
Globalization have caused a considerable increase in flows of people, goods and
services across the world. When globalization combined with the developments in
logistics, information and communication technologies, these movements have taken
place in a more rapid and easy way. In terms of production and trade, first reflection
of this situation became decentralization of production across borders. Economic
activities have dispersed around the world as the most known example of firms
bringing their inputs from where raw material or inputs are cheaper, and moving their
production facilities to where production conditions are more favorable. Increasing
number of international subcontracting is just another example of it. Market also
expanded across the world again due to the information and communication
technologies and much more rapid and convenient transportation systems. Firms have
started to commercialize their products internationally or even intercontinentally. As
a result, global trade scaled up but at the same time “nations have become more
interdependent through the flows of goods, services, and financial capital since the
1970s” (Gereffi, Humphrey, Kaplinsky and Sturgeon, 2001).
Besides, countries or regions needed to specialize in some specific areas of these
geographically dispersed production systems to remain competitive. Some countries
specialized in design, some in production or marketing phases etc. For the nations,
important point is that it is significantly matter in which stage of the whole process
you fall into. When we consider the whole process/cycle as starting from agricultural
production to marketing of the final product or even recycling, developed countries
usually involve in higher value-added activities such as design or marketing while
2
developing countries mostly engage in production and industrial processing stages
from which already-developed western world have started to stand back for a while.
This also implies that, according to the role one undertakes, there are winners and
losers of this increasing global trade with its shifting patterns and new organization.
Another change we experience in the new system of global trade is the changing
consumer preferences and its obvious power in product design and production
methods. As a reaction to the exploitation of environment, natural resources, labor –
especially women and children- and so on caused by several years of mass production,
now, consumers are much more sensitive to these issues. People started to show a
clear tendency to prefer more ‘environmentally-friendly’, ‘clean’, or ‘free-from child
labor’ products. This tendency is especially notable in “in sectors such as garments,
processed fruit and horticulture” (Gereffi 1999; Kaplan and Kaplinsky 1998: Dolan
and Humphrey 2000).
As a result, this new system requires some specific qualifications and efforts for firms,
organizations, or nations (such as understanding consumer preferences better and
responding them properly, specializing in some specific functions or tasks of the
separated economic activities such as production, processing, design, marketing etc.
according to their comparative advantages) to hold a competitive position in the global
trade network.
These shifting patterns in global trade and production systems also required a new set
of approaches/concepts to understand and analyze how this new system of
geographically dispersed but functionally connected activities takes place and works.
Analytical frameworks such as international production networks, global value
chains, supply chains, global commodity chains etc. have risen from the efforts to
conceptualize that complex network of economic activities. Even though these
approaches carry different names, almost all of them are, at the heart, interested in
issues such as how those chains and networks are coordinated, managed and governed.
3
Distinctions in the names come from the different scholarly disciplines they are
adopted and advocated.
From the perspective of regional and rural development, integrating into these global
trade and production networks became one of the major concerns of developers and
policy makers; and value chain analysis became a commonly used instrument to
understand how that complex networks are structured. Researchers have benefited
from the useful set of tools that value chain analysis provide in order to facilitate
integration of small producers into global economy through improving their
engagement in global value chains and production networks. Value chain analysis
deals with the issues of how this integration takes place, in other words, position of
smallholders and/or farmers and how their positions in the chain can be improved
through possible upgrading opportunities. Therefore, understanding the structure of
the chains is important in terms of integrating into them and improving your
conditions/positions/role when you are entered. It also provides a good insight into
understanding the challenges of globalization and shifting patterns in global trade
faced by smallholders and agricultural producers of the developing world.
This thesis study aims to examine cotton value chain in Şanlıurfa province in Turkey’s
Southeast Anatolia Region – which is the largest cotton producing area of the country.
There are several problems regarding cotton value chain in the region such as
inefficiencies, excessive consumption of natural resources, and poor product quality
due to improper practices etc. However, many opportunities also exist including the
valued characteristics of the local cotton, already established textiles industry as one
of the most competitive exporting industries of the country, available labor, or
government subsidies to name some of them.
The study particularly aims to investigate how cotton value chain in Şanlıurfa can be
improved. This improvement may come from, first, pointing out the opportunities for
improvement to gain more value from the chain –with particular focus on production
stage. Second, the chain can be improved by overcoming the bottlenecks and
4
weaknesses. The ultimate aim in both approaches is to augment the overall value
gained from the cotton value chain in the area and enhance its competitiveness.
Therefore, understanding the dynamics and circumstances that enables improvement
of the chain -especially for the most problematic stages- would provide valuable
insight for policy decisions and proper interventions.
Since improvements and value increases are performed by upgrading activities in
value chains, the thesis further focuses on whether any upgrading activities exist in
cotton production in Şanlıurfa. This part of the study particularly focuses on
agricultural production stage and farmers due to our special interest in value chain
analysis’ contribution to development in rural areas. The importance of upgrading
comes from its ability to impact the ways/terms our focus group (agricultural
producers) are engaged in global trade and global/national/regional value chains and
how this engagement can be improved in favor of them. Appropriate upgrading
strategies can empower farmers’ positions in value chains, increase their capacity, and
provide more sustainable incomes. Therefore, we will be looking for present/available
and possible upgrading strategies for agricultural producers that can be adopted in the
study area. These upgrading activities can be in the forms of producing a higher-value-
added product (product upgrading), improving the efficiency of the production
process (process upgrading), integrating into a different regional/national/global
chain, vertical or horizontal coordination (for example contract farming).
Furthermore, the study aims to explore positions of the cotton farmers in the value
chain and their attitudes towards upgrading. Discerning the differences between the
farmers who involve in upgrading activities in order to improve their position in the
value chain and the farmers who stay unwilling/resistant or hesitant will provide us a
valuable insight to understand the impact of local dynamics on farmers’ activities and
decisions. Thus, understanding the motivations of the agricultural producers who are
willing to upgrade, factors affecting their decision to upgrade or not, their preferred
methods to do so, access to information etc. will be the key elements to evaluate
farmer’s positions toward upgrading.

5
1.2. Justification
It is obvious that globalization provided many opportunities in terms of local and
regional development. Some parts of the world have had the chance to integrate
themselves into global economy and new trade system and procured considerable
income opportunities for themselves, some have had access to better quality and
distinct products which were not available before (Kaplinsky, 2004). According to
Parrilli, Nadvi and Yeung (2013) globalization promoted regional development
through facilitating “knowledge absorption”, “R&D alliances”, “productive
investments” and “the emergence of new consumers” (Parrilli, Nadvi & Yeung, 2013).
However, neither everyone nor every region have made the most of globalization
evenly. Some, on the contrary, suffered desperately from the consequences of it. Some
regions lost their production activities to emerging countries and regions which
resulted in empty plants, increasing unemployment rates, brain drain and many others
(Parrilli, Nadvi & Yeung, 2013). Increasing poverty and inequalities in some parts of
the world just exacerbated due to the devastating consequences of globalization as
well. As a result, it is fair to say that new dynamics caused by globalization and
integration of the world economy reveals both winners and losers. The first step to
take, in order not to be excluded from the global economy and to get your share from
the opportunities came up from globalization is to be integrated into global trade
networks in a smart and sustainable way. However, one should certainly acknowledge
that it is not an easy process and requires considerable efforts. As Kaplinsky (2004)
indicates;
“If the “losers” had been confined to those who did not participate in the
global economy, then the policy implications would be clear—join the rush.
But, when (as is the case) the “losers” include those who have participated in
global processes, then the policy challenge is much more daunting. It is not so
much a matter of whether to participate in global processes, but how to do so
6
in a way that provides sustainable income growth for poor people and for poor
countries.”
As it can be understood from the expression above, the point is not just to participate
global trade somehow, but doing it according to the rules of the new organization.
Therefore, always looking for the opportunities to improve on what terms one engages
in global economy is critical for the progress and continuing success.
From this point of view, this thesis aims to illustrate cotton value chain in Şanlıurfa
and, specifically, how cotton producers’ positions in the global trade network can be
improved through upgrading methods of value chain approach. Cotton value chain in
the area is already part of a global trade network and integrated into global economy.
Cotton is one of the most important crops for the city as well as for the counrty. Turkey
ranks among the highest 10 countries in the world (6th in 2017/2018 season) in terms
of cotton supply (USDA, 2018). Almost 50% of the cotton produced in Turkey comes
from Şanlıurfa and it is critically important as a livelihood for the local people (URL
1). It is also equally important for the textiles industry in Turkey which uses cotton as
their main input. Textiles industry is one of the most competitive exporting sectors in
the country and already integrated into the world economy. Turkey is one of the
world’s largest textiles and garments suppliers mostly due to its ability to respond
market demands and quality standards, already established manufacturing
infrastructure, accumulated knowledge and qualified labor among others. However, it
is also among the top 5 cotton importers in the world cotton market together with
Bangladesh, China, India, and Vietnam (OECD & FAO, 2016). Therefore, there is a
huge imbalance between sector’s local supply and demand balance. In the regional
context, this imbalance in the market causes some significant problems.
To do this research, we use value chain analysis approach. As it is indicated above,
recent developments and changes in the global trade mechanisms have dispersed
production activities around the world. Even though those activities take place in
distinct geographies, they still need to be somehow connected with each other by
7
vertical linkages. At that point, value chain approach comes as a quite practical tool
to understand how this geographically scattered but still inter-dependent economic
activities are organized and managed. As Gereffi et al. (2001) argues, “If globalization
in the productive sphere implies functional integration between internationally
dispersed activities, then the value chain perspective is an effective means of
conceptualizing the forms that this integration takes.”
One of the greatest advantages of value chain approach is that it enables us to analyze
distinct stages of a complete process with their own dynamics without neglecting the
big picture. Value chains focus on issues such as how the chains operate and are
governed, barriers to the entry, relationships between the actors involved in each stage,
distributional issues along with the chain (how gains are distributed), income
diversification, opportunities to upgrade and many others. Upgrading of value chains
are especially important because most of the increase in value (the ultimate aim at
value chains studies) comes from upgrading activities which are also essential for
promoting competitiveness. Upgrading can be done by several methods such as:
process upgrading for efficiency improvements, product upgrading by producing
higher-value added goods (Humphrey & Schmitz, 2002), or completely moving to a
new chain in order to enter different markets (Kaplinsky and Morris, 2001).
From the perspective of regional development, value chain analysis provides policy
makers with valuable input for designing the most appropriate interventions to
facilitate development. Value chain analysis basically points out the problematic
points and bottlenecks on one hand, opportunities and potentials to increase the overall
value for the benefit of the region and local people on the other hand. By doing this,
it helps policy and decision makers to design projects and development plans for
overcoming the drawbacks associated with the chain. Value chain analysis are used
widely in diverse developmental topics including poverty reduction, income
diversification and distributional issues, inequality, improve agricultural production,
food security and promoting sustainability among others. Besides, by systemic
efficiency and upgrading components, value chain analysis enables policy makers to
8
identify essential intervention points in order to improve local agents’ positions in the
local, regional or global markets and improve total value-added transmitted to the
targeted area or groups. These analyses can be also used by the private sector and
entrepreneurs in evaluating possible investment opportunities.
1.3. Research Questions
The research is organized around the two main research questions and sub-questions
which help to answer these main questions.
The first research question is:
‘How can cotton value chain in Şanlıurfa be improved in an economically and
environmentally sustainable manner?’
This question aims to examine the ways that cotton value chain in Şanlıurfa can be
improved in order to increase its contribution to overall value generated from cotton
in the region. In order to do this, the most problematic stages (weak points) that
negatively impact the competitiveness of cotton sector, decrease efficiency and cause
value losses through the chain are intended to examine. In addition to the problems,
the section targets to search opportunities in cotton value chain that contributes to
overall value generation from the cotton in the region.
The research aims to answer this question (basically identifying problems and
opportunities) by using value chains approach. Therefore, dynamics of cotton value
chain in the study area are attempted to illustrate by using main components of value
chains framework.
After a detailed general value chain analysis, the research focuses on agricultural
production stage and farmers because our preliminary research showed that it is one
of the most problematic stages of the cotton value chain in Şanlıurfa. As a means of
achieving improvements in value chain, the study focuses on upgrading activities
carried out. Particular attention is paid to upgrading activities because regional value
9
creation and value increase are usually achieved through upgrading strategies. Here,
we look for the upgrading strategies adopted by the agricultural producers which result
in economic or environmental improvement in the value chain. The ultimate aim here
is to understand how cotton value chain in Şanlıurfa can be improved depending on
these analyses.
The sub-questions that help to answer the first main research question are:
- What are the existing problems and opportunities in the cotton value chain?
- What are the existing upgrading activities in agricultural production as means
of achieving improvements and increasing value generation in the chain?
The second part of the research focuses on agricultural producers and their integration
into the cotton value chain. The aim of this part is to investigate upgrading activities
that help to improve positions of farmers in value chain and promote their better
integration into the local and global cotton value chains.
This section aims to answer the second main research question:
‘How can the terms and positions that agricultural producers integrate into the cotton
value chain be improved?’
In order to answer this question, the sub-questions below are also answered:
- How does adopting upgrading strategies affect the position of farmers in the
value chain? In other words, does upgrading improve the terms and conditions
they are integrated into the cotton value chain and cause a value increase?
- What are the attitudes of farmers toward upgrading (Upgraders vs Not-
Upgraders) and factors affecting their upgrading decision?
- What are the differences between planning solution and market solution on
upgrading?
10
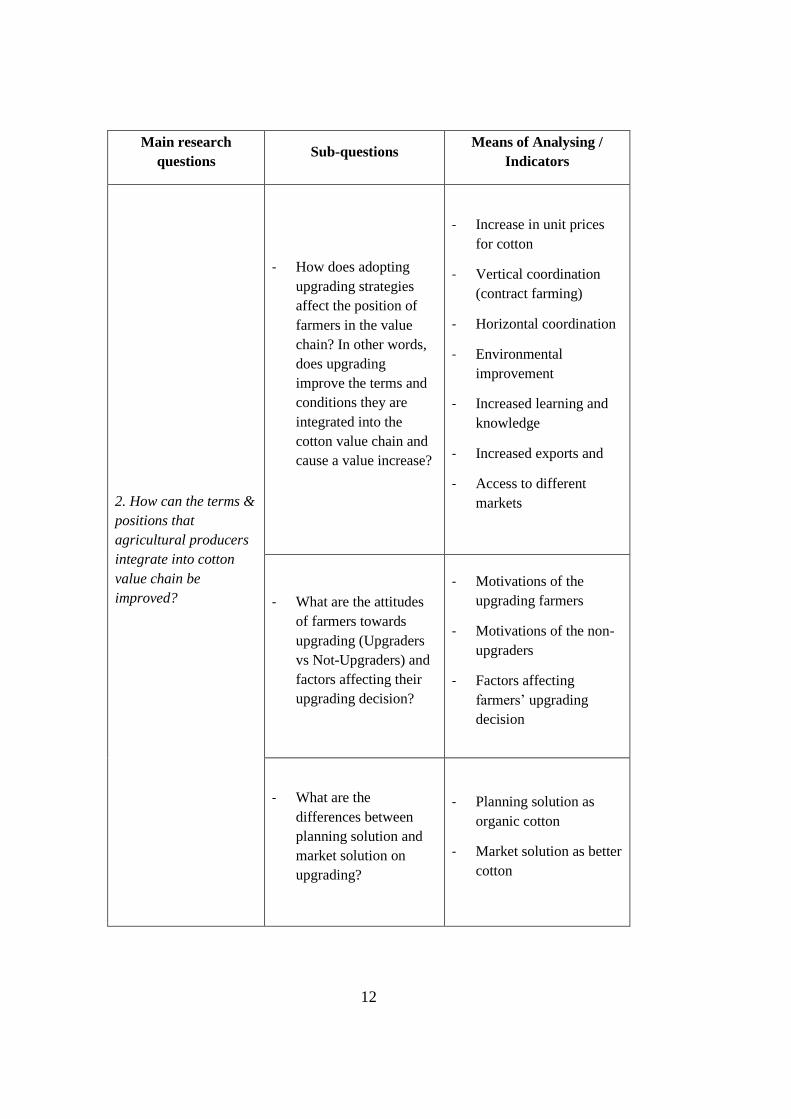
For the first sub-question, in order to observe the effects of upgrading on the farmers,
we examine some indicators showing what outcomes upgrading strategies lead to.
These indicators are: increase in unit prices for cotton, vertical coordination (contract
farming), horizontal coordination, environmental improvement, increased learning
and knowledge, increased exports and access to different markets. The thesis
investigates whether these indicators take place due to upgrading activities and how
they impact the position of farmers within the cotton value chain. We specifically look
for whether upgrading enhances farmers’ terms of engagement in the market and
advances the conditions they are integrated into the value chain.
The second sub-question listed above investigates attitudes of farmers towards
upgrading and factors affecting their decision for whether to adopt upgrading
strategies or not. The main purpose here is to understand the motivations of the
upgrading farmers, what factors lead to this decision and, on the other hand, attitudes
of the ones who do not attempt to upgrade. From the policy making perspective,
answering this question will contribute to making more precise and appropriate policy
interventions to empower local producers and enhance their position.
The third sub-question of the second research question investigates the difference
between the planning solution and market solution in upgrading activities in
production stage of the cotton value chain. Upgrading through organic cotton is
considered planning solution because it is encouraged by the government subsidies in
order to promote quality of the cotton produced and supply market demand for organic
production. Agricultural subsidies are one of the most critical determinants for the
farmers’ decision to cultivate a specific product or not. On the other hand, upgrading
through better cotton is a market solution for problems associated with traditional
conventional cotton production and increased product quality. There is no agricultural
support for better cotton. It works on a voluntary basis and managed through market
dynamics. Answering this question will provide valuable insight into understanding
advantages and disadvantages associated with market and planning solution to the
problems and enable comparing these two approaches.
11
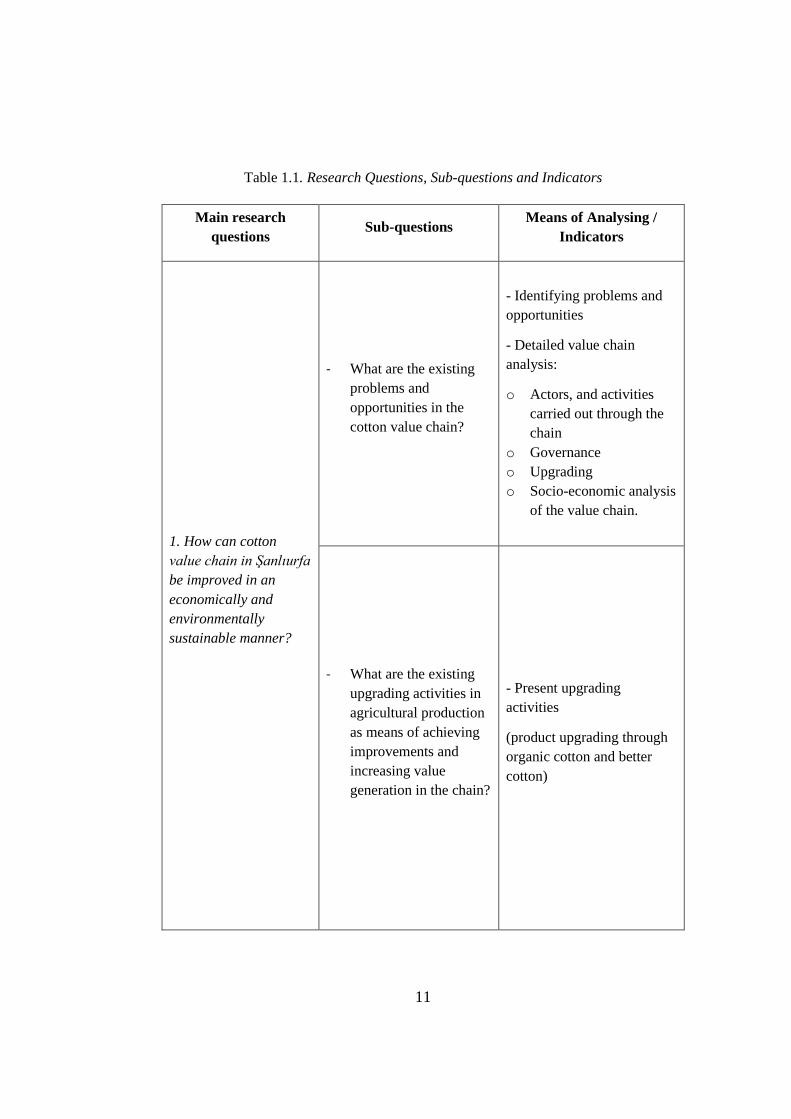
Table 1.1. Research Questions, Sub-questions and Indicators
Main research
questions Sub-questions
Means of Analysing /
Indicators
1. How can cotton
value chain in Şanlıurfa
be improved in an
economically and
environmentally
sustainable manner?
- What are the existing
problems and
opportunities in the
cotton value chain?
- Identifying problems and
opportunities
- Detailed value chain
analysis:
o Actors, and activities
carried out through the
chain
o Governance
o Upgrading
o Socio-economic analysis
of the value chain.
- What are the existing
upgrading activities in
agricultural production
as means of achieving
improvements and
increasing value
generation in the chain?
- Present upgrading
activities
(product upgrading through
organic cotton and better
cotton)
12
Main research
questions Sub-questions
Means of Analysing /
Indicators
2. How can the terms &
positions that
agricultural producers
integrate into cotton
value chain be
improved?
- How does adopting
upgrading strategies
affect the position of
farmers in the value
chain? In other words,
does upgrading
improve the terms and
conditions they are
integrated into the
cotton value chain and
cause a value increase?
- Increase in unit prices
for cotton
- Vertical coordination
(contract farming)
- Horizontal coordination
- Environmental
improvement
- Increased learning and
knowledge
- Increased exports and
- Access to different
markets
- What are the attitudes
of farmers towards
upgrading (Upgraders
vs Not-Upgraders) and
factors affecting their
upgrading decision?
- Motivations of the
upgrading farmers
- Motivations of the non-
upgraders
- Factors affecting
farmers’ upgrading
decision
- What are the
differences between
planning solution and
market solution on
upgrading?
- Planning solution as
organic cotton
- Market solution as better
cotton
13
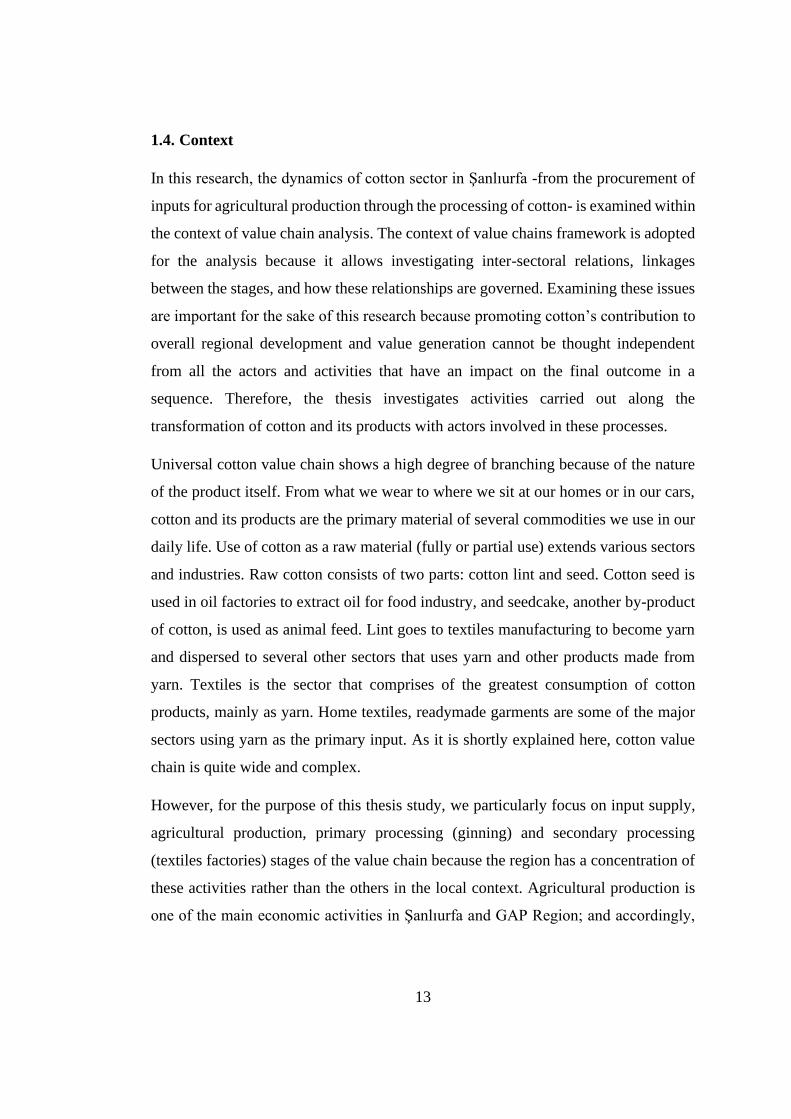
1.4. Context
In this research, the dynamics of cotton sector in Şanlıurfa -from the procurement of
inputs for agricultural production through the processing of cotton- is examined within
the context of value chain analysis. The context of value chains framework is adopted
for the analysis because it allows investigating inter-sectoral relations, linkages
between the stages, and how these relationships are governed. Examining these issues
are important for the sake of this research because promoting cotton’s contribution to
overall regional development and value generation cannot be thought independent
from all the actors and activities that have an impact on the final outcome in a
sequence. Therefore, the thesis investigates activities carried out along the
transformation of cotton and its products with actors involved in these processes.
Universal cotton value chain shows a high degree of branching because of the nature
of the product itself. From what we wear to where we sit at our homes or in our cars,
cotton and its products are the primary material of several commodities we use in our
daily life. Use of cotton as a raw material (fully or partial use) extends various sectors
and industries. Raw cotton consists of two parts: cotton lint and seed. Cotton seed is
used in oil factories to extract oil for food industry, and seedcake, another by-product
of cotton, is used as animal feed. Lint goes to textiles manufacturing to become yarn
and dispersed to several other sectors that uses yarn and other products made from
yarn. Textiles is the sector that comprises of the greatest consumption of cotton
products, mainly as yarn. Home textiles, readymade garments are some of the major
sectors using yarn as the primary input. As it is shortly explained here, cotton value
chain is quite wide and complex.
However, for the purpose of this thesis study, we particularly focus on input supply,
agricultural production, primary processing (ginning) and secondary processing
(textiles factories) stages of the value chain because the region has a concentration of
these activities rather than the others in the local context. Agricultural production is
one of the main economic activities in Şanlıurfa and GAP Region; and accordingly,
14
there is a quite developed textiles sector utilizing these agricultural outputs. Other
branches such as cotton seedcake use in animal feeding or oil factories are not primary
economic activities in the study area.
In terms of the locational context, we focus on the agricultural production and
producers in the city of Şanlıurfa. The reason is that Şanlıurfa is one of the major
cotton growing cities not only in the GAP Region but also in nationwide. However,
the ginning and textiles factories being interviewed are not limited with the boundaries
of Şanlıurfa because cotton produced in the city can also be processed in surrounding
neighbor cities of the region. Thus, analysis of processing stage can go beyond
Şanlıurfa but limited within the GAP Region.
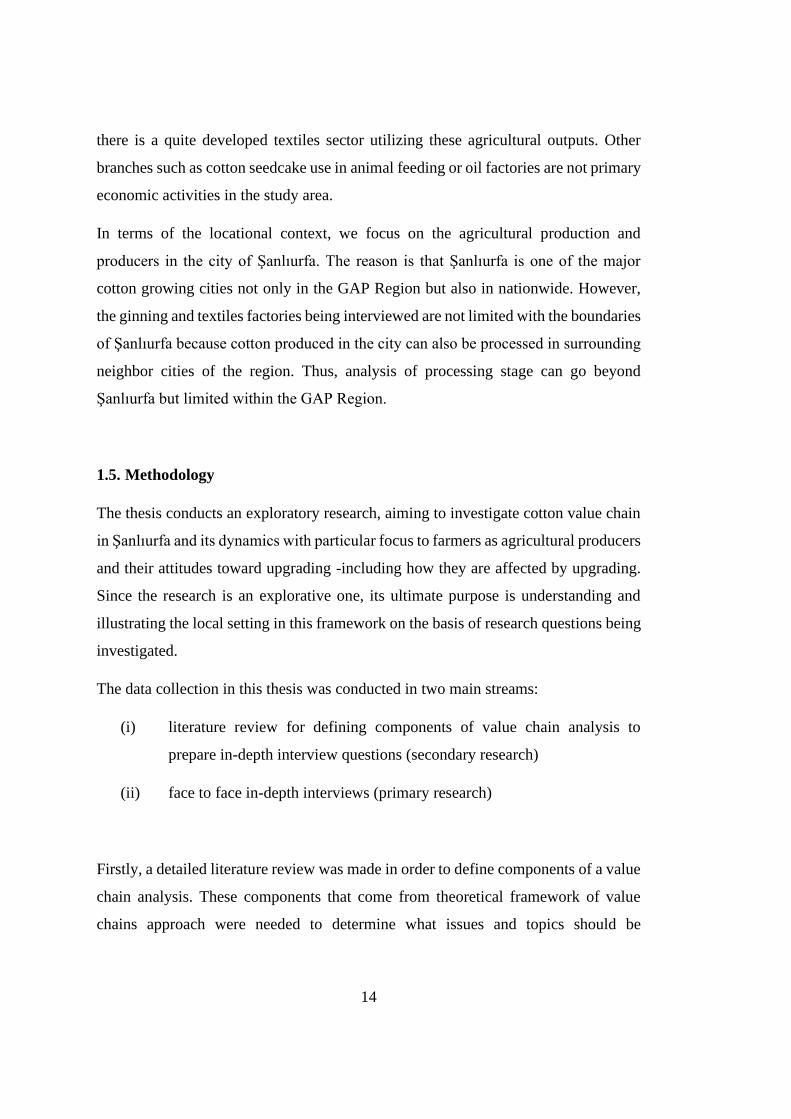
1.5. Methodology
The thesis conducts an exploratory research, aiming to investigate cotton value chain
in Şanlıurfa and its dynamics with particular focus to farmers as agricultural producers
and their attitudes toward upgrading -including how they are affected by upgrading.
Since the research is an explorative one, its ultimate purpose is understanding and
illustrating the local setting in this framework on the basis of research questions being
investigated.
The data collection in this thesis was conducted in two main streams:
(i) literature review for defining components of value chain analysis to
prepare in-depth interview questions (secondary research)
(ii) face to face in-depth interviews (primary research)
Firstly, a detailed literature review was made in order to define components of a value
chain analysis. These components that come from theoretical framework of value
chains approach were needed to determine what issues and topics should be
15
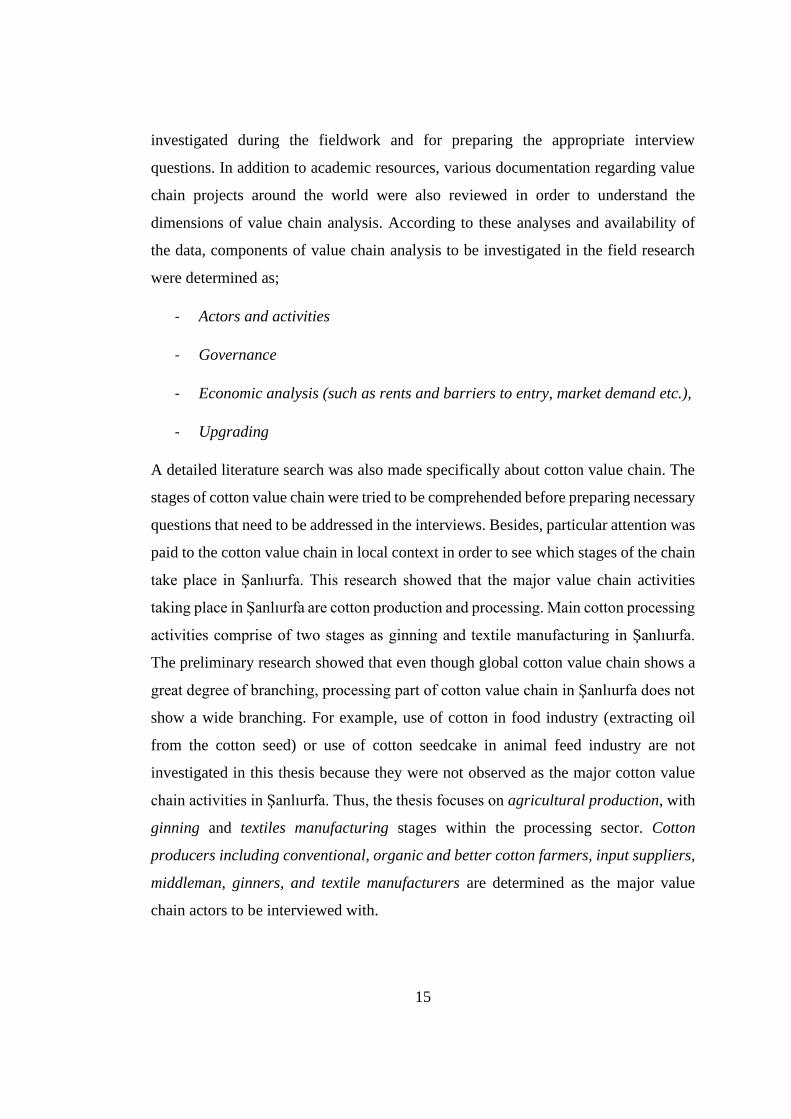
investigated during the fieldwork and for preparing the appropriate interview
questions. In addition to academic resources, various documentation regarding value
chain projects around the world were also reviewed in order to understand the
dimensions of value chain analysis. According to these analyses and availability of
the data, components of value chain analysis to be investigated in the field research
were determined as;
- Actors and activities
- Governance
- Economic analysis (such as rents and barriers to entry, market demand etc.),
- Upgrading
A detailed literature search was also made specifically about cotton value chain. The
stages of cotton value chain were tried to be comprehended before preparing necessary
questions that need to be addressed in the interviews. Besides, particular attention was
paid to the cotton value chain in local context in order to see which stages of the chain
take place in Şanlıurfa. This research showed that the major value chain activities
taking place in Şanlıurfa are cotton production and processing. Main cotton processing
activities comprise of two stages as ginning and textile manufacturing in Şanlıurfa.
The preliminary research showed that even though global cotton value chain shows a
great degree of branching, processing part of cotton value chain in Şanlıurfa does not
show a wide branching. For example, use of cotton in food industry (extracting oil
from the cotton seed) or use of cotton seedcake in animal feed industry are not
investigated in this thesis because they were not observed as the major cotton value
chain activities in Şanlıurfa. Thus, the thesis focuses on agricultural production, with
ginning and textiles manufacturing stages within the processing sector. Cotton
producers including conventional, organic and better cotton farmers, input suppliers,
middleman, ginners, and textile manufacturers are determined as the major value
chain actors to be interviewed with.
16
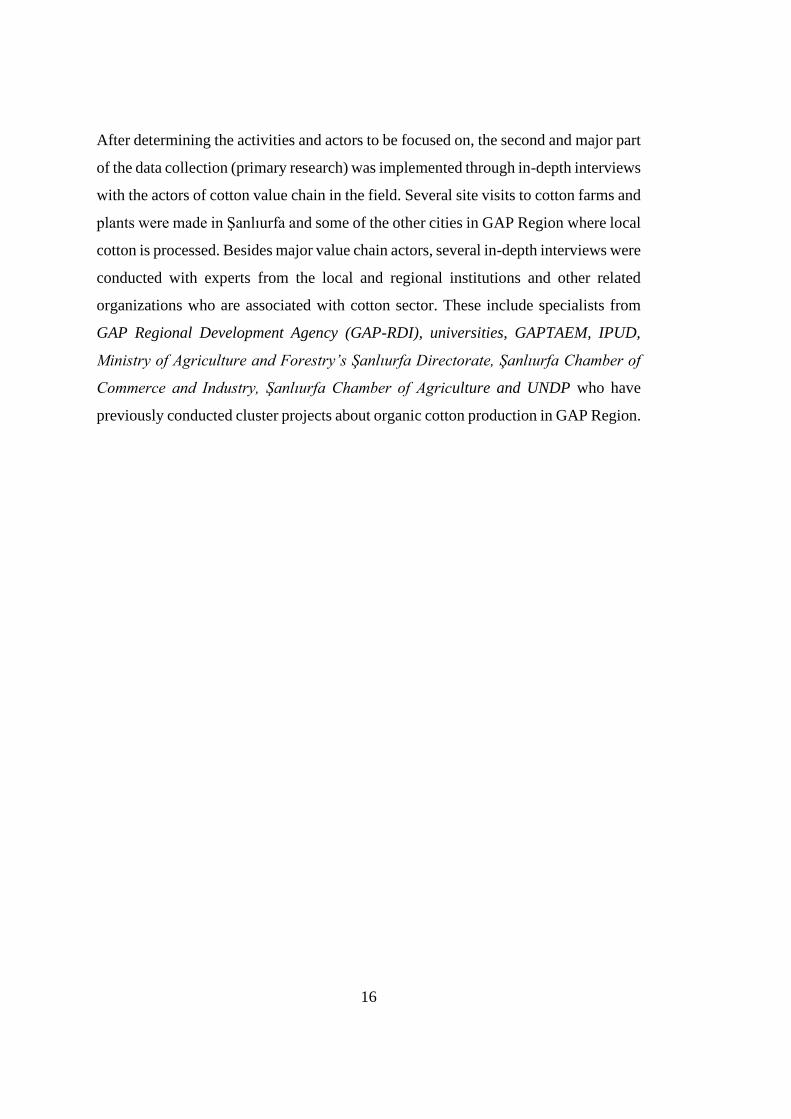
After determining the activities and actors to be focused on, the second and major part
of the data collection (primary research) was implemented through in-depth interviews
with the actors of cotton value chain in the field. Several site visits to cotton farms and
plants were made in Şanlıurfa and some of the other cities in GAP Region where local
cotton is processed. Besides major value chain actors, several in-depth interviews were
conducted with experts from the local and regional institutions and other related
organizations who are associated with cotton sector. These include specialists from
GAP Regional Development Agency (GAP-RDI), universities, GAPTAEM, IPUD,
Ministry of Agriculture and Forestry’s Şanlıurfa Directorate, Şanlıurfa Chamber of
Commerce and Industry, Şanlıurfa Chamber of Agriculture and UNDP who have
previously conducted cluster projects about organic cotton production in GAP Region.
17
Figure 1.1. Groups of informants that have been interviewed
INTERVIEWEES
Actors of Major Value Chain Activities
Agricultural Producers
- Conventional Cotton Prodcuers
- Organic Cotton Producers
- Better Cotton Producers
Ginners
Textile Manufacturers
Input Suppliers
Middleman
Actors of Supporting Services / Institutions
GAP-RDAGAPTAEM
IPUD UNDP
Ministry of Agriculture and
Forestry’s Şanlıurfa Directorate
Şanlıurfa Chamber of Commerce and
Industry
Şanlıurfa Chamber of Agriculture

18
The data was intentionally collected in the form of in-depth interviews rather than via
a survey or questionnaire because we did not want to limit answers of the interviewees
and grasp as much as possible insight regarding the dynamics of activities conducted
and relationships between the actors. Also, our past experience showed that collecting
data from the farmers with questionnaire forms without face-to-face interaction could
be quite challenging because they sometimes do not want to share information with
foreigners. To overcome this issue, we particularly access to the farmers via input
suppliers, ginners, textiles manufacturers, GAP-RDA, GAPTAEM, IPUD, or UNDP.
When we went to the farmers with the reference of people from these institutions or
entities that farmers are familiar with and worked before, they trust and become more
open to information sharing. This method also helped to access specific groups of
farmers such as organic or better cotton producers. For example, we asked IPUD
specialist that we have interviewed for which farmers they work with for better cotton
production and if they can share the farmers’ contact information. By this method, we
were able to access better cotton farmers as an example, and the reference of IPUD
specialists made us more trustworthy to share information.
Table 1.2. Distribution of Informants1
Interviewee Groups Number of
Interviewees
Farmers 18
Ginners 8
Textile Manufacturers 6
Middleman 1
Input Suppliers 2
Local Experts / Specialists 14
In g a project called ‘Integrated Resource Efficiency in Agriculture and Agro-Based
Industries in Southeast Anatolia Region’. The project was conducted by Ministry of
1 For a detailed list of all informants please see the appendices
19
Devethe research part of the thesis, data regarding value chain activities was compiled
durinlopment, GAP Regional Development Agency, MATPUM (METU) and
technical assistance of United Nations Development Programme (UNDP). The author
of this thesis participated as a researcher in the project, and worked in data collection
and research part, conducting interviews with local actors, and analysis of these
interviews.
1.6. Why Şanlıurfa?
There are several reasons that make Şanlıurfa interesting as a case study in the context
of regional development and planning. First of all, Southeastern Anatolia, referred as
GAP Region, has long been one of the most problematic geographic regions of Turkey
in terms of socio-economic development. The region has been under the excessive
development concerns for years in order to reduce development disparities, improve
competitiveness and promote economic and social integrity of the region (GAP Action
Plan, 2014). In order to achieve these goals and prevent the region from lagging,
significant resources have been transferred to the region including various social and
economic development projects and infrastructure investments. GAP Project
(Southeast Anatolia Project) has been the greatest one among the others in terms of
scale and impact. GAP Project is the “largest scale and costliest project in the history
of the Republic of Turkey”2. As Şengül and Erkan argues, “GAP is the most
comprehensive integrated regional development project ever carried out in Turkey”
dealing with in a wide range of issues including economic growth, social development,
education, health, transportation, tourism, infrastructure, urbanization, institutional
capacity building to name a few. GAP has been one of the most aggressively pursued
development projects of the nation for years. Construction of the Atatürk Dam was at
the center of the project due to the regions’ dominant rural profile and agricultural
background. The main objective of the project at the beginning was utilizing the water
2 Retrieved from: http://www.gap.gov.tr/en/ , last accessed August 2019
20
and land resources of the region through a series of infrastructure projects for
agricultural irrigation and energy generation (construction of 22 dams, 19 hydraulic
power plants and other investments for irrigation of 1.8 million hectares in the
Euphrates-Tigris Basin was initially planned)3.
The project then evolved to a more comprehensive regional development project with
the industrial development, transportation, education, health, urban and rural
infrastructure development components added with the 1989 Maser Plan. However,
the opportunities believed to be thriven with the new agricultural lands open up with
new irrigational infrastructure after the construction of the dam was at the hearth of
the project. This is particularly because agriculture is crucial for the region as the main
source of economic activity and income. When the project started, its motto was “Oil
exhausts, but wheat does not” referring to another important source of the region, oil,
but belittling it against agricultural production.
1.7. Why Cotton?
Cotton is a global commodity covering 2,3% of the arable land in the world produced
approximately in 75 countries (ILO, 2016). About 80% of the global cotton is
produced by only 4 countries; China, India, United States and Pakistan, as shown in
the table below (USDA, 2019). China is the leader in cotton production with over 6
million tons of cotton bale followed by 5.8 million tons of India and 4 million tons of
the USA. China and India alone account for almost half of the world cotton
production. United States is the main exporter with Brazil while China is in the leader
position in world cotton export.
3 Retrieved from: http://www.gap.gov.tr/en/ , last accessed August 2019
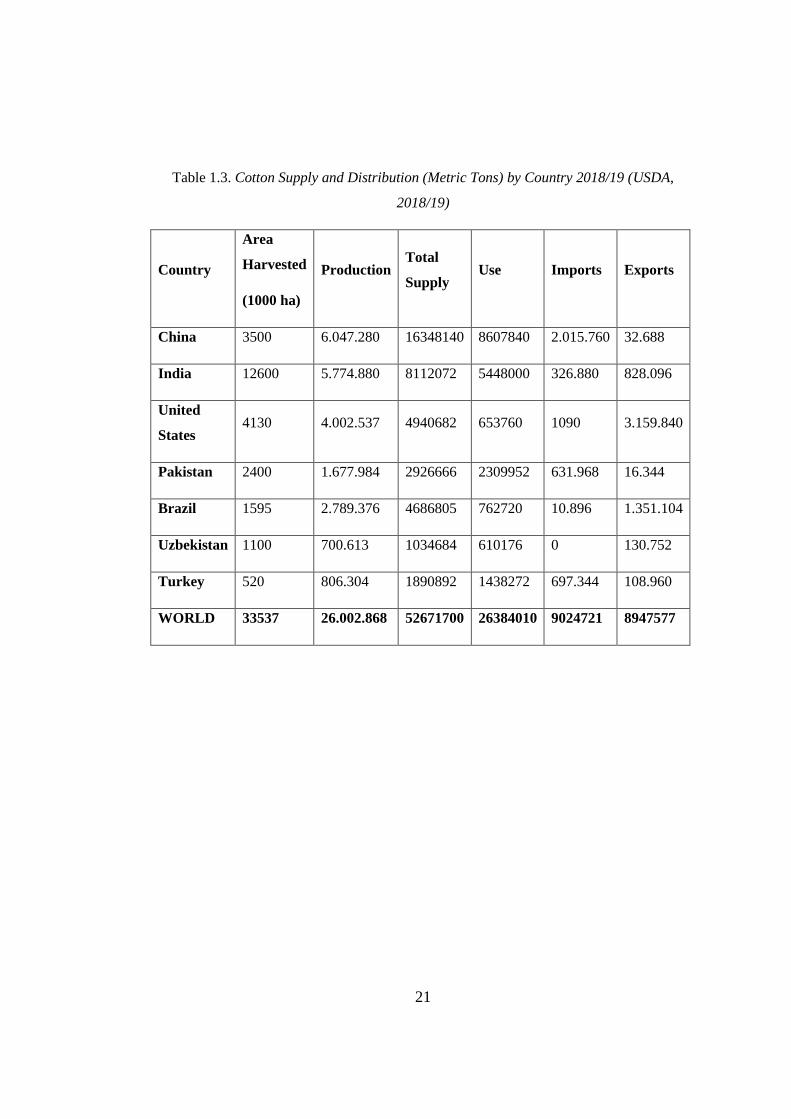
21
Table 1.3. Cotton Supply and Distribution (Metric Tons) by Country 2018/19 (USDA,
2018/19)
Country
Area
Harvested
(1000 ha)
Production Total
Supply Use Imports Exports
China 3500 6.047.280 16348140 8607840 2.015.760 32.688
India 12600 5.774.880 8112072 5448000 326.880 828.096
United
States 4130 4.002.537 4940682 653760 1090 3.159.840
Pakistan 2400 1.677.984 2926666 2309952 631.968 16.344
Brazil 1595 2.789.376 4686805 762720 10.896 1.351.104
Uzbekistan 1100 700.613 1034684 610176 0 130.752
Turkey 520 806.304 1890892 1438272 697.344 108.960
WORLD 33537 26.002.868 52671700 26384010 9024721 8947577
22
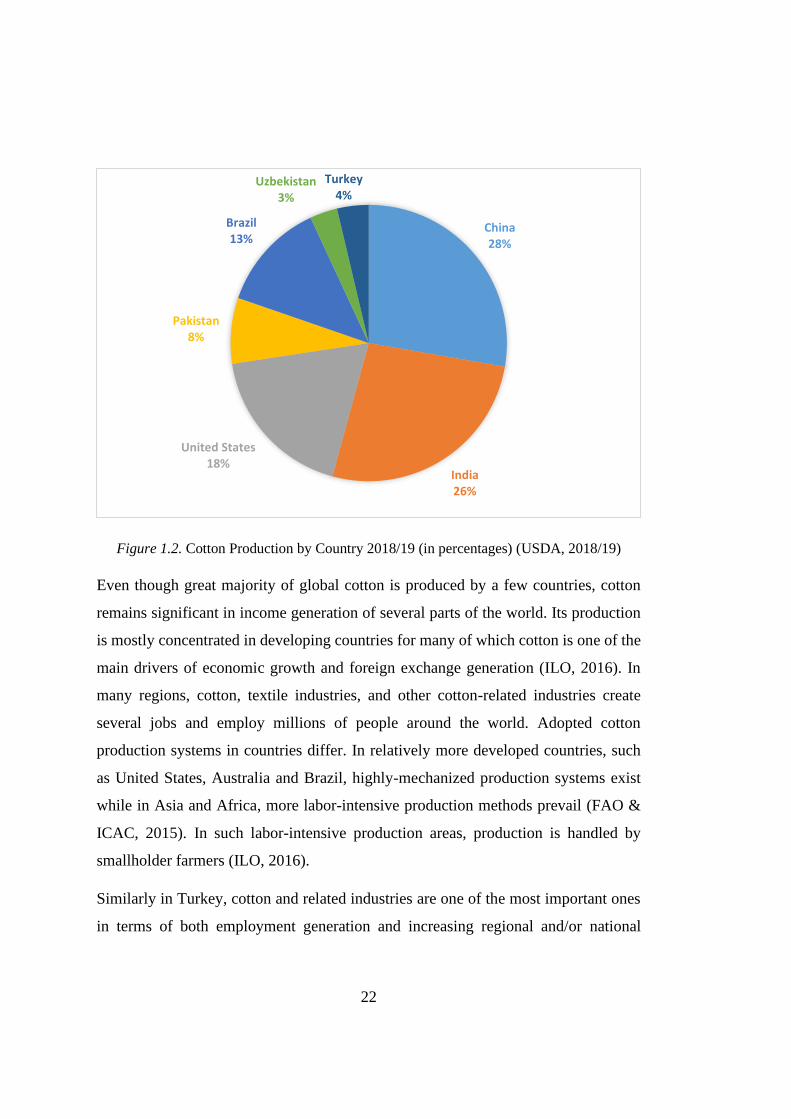
Figure 1.2. Cotton Production by Country 2018/19 (in percentages) (USDA, 2018/19)
Even though great majority of global cotton is produced by a few countries, cotton
remains significant in income generation of several parts of the world. Its production
is mostly concentrated in developing countries for many of which cotton is one of the
main drivers of economic growth and foreign exchange generation (ILO, 2016). In
many regions, cotton, textile industries, and other cotton-related industries create
several jobs and employ millions of people around the world. Adopted cotton
production systems in countries differ. In relatively more developed countries, such
as United States, Australia and Brazil, highly-mechanized production systems exist
while in Asia and Africa, more labor-intensive production methods prevail (FAO &
ICAC, 2015). In such labor-intensive production areas, production is handled by
smallholder farmers (ILO, 2016).
Similarly in Turkey, cotton and related industries are one of the most important ones
in terms of both employment generation and increasing regional and/or national
China28%
India26%
United States18%
Pakistan8%
Brazil13%
Uzbekistan3%
Turkey4%
23
competitiveness in these sectors. In agricultural production, for instance, cotton
remains one of the most commonly cultivated crops and provides jobs and income for
several farmers. In processing sectors as well, textiles industry is the greatest
consumer of locally produced cotton. Turkey has a quite developed and competitive
textiles sector. According to the USDA (2019) textile industry is among the most
important sectors in Turkish economy “accounting for “8% of GNP and 16% of
industrial employment”. Even though Turkey is a cotton importer, in textile industry
the country is one of the major exporters of textiles products to the world -especially
Middle East, North Africa and Europe (USDA, 2019).
In Şanlıurfa cotton is one of the major agricultural products as well. Agriculture meant
a lot to the region. With the construction of the dam and new infrastructure, extensive
land became available for irrigated farming. The coming of irrigation infrastructure
caused important changes in agricultural crop variety in the region and local producers
enjoyed a broader range of crops that can be produced from then on. Cotton was one
of them that farmers of the region have met immediately after the enabling of irrigated
farming and it has become more and more prevalent day by day. Especially Harran
and Suruç planes have become major cotton producing areas in the region. In 2017,
Şanlıurfa accounted for the 42% of the total cotton produced in the country which was
approximately equal to the total amount produced in Adana, Aydın, Hatay and
Diyarbakır together4. Obviously, it was cotton’s profitability which made it that
prevalent so fast and it has become one of the most strategic products of the region.
4 http://www.zmo.org.tr/genel/bizden_detay.php?kod=30467&tipi=17&sube=0 , last accessed August
2019

25
CHAPTER 2
2. THEORETICAL FRAMEWORK
2.1. Changing Theory
It is a fact that the world economy and trade is now quite different from the times
David Ricardo constructed classical trade theory two centuries ago. A series of
conditions that altered the pre-globalized world have not only challenged the premises
of his classical theory, but also caused old theories and models to be reconstructed.
Considering trade at the core of the value chains, the paradigms, models and theories
discussed below have contributed to the development of analytical framework of value
chains.
The criticisms were mainly to the basic assumptions of the classical trade theory
(which were considered unrealistic) such as perfect competition, trade in final
products, constant returns to scale, homogeneous producers in the industry,
availability of technology for everyone, optimally performing market and so on.
Definitely, radical revolutions in transportation technologies triggered the first wave
of change (Baldwin, 2006). When cost of transportation was considerably decreased,
international trade expanded in an increasing manner. The ultimate aim for the
producers was delivering their goods to the most profitable markets around the world.
Thus, the place of market became independent from the place of production (Baldwin,
2006). The next wave of revolution in international trade was enabled by the
developments in information and communication technologies in 1980s. Lowered cost
of communication, with rapid and constant transfer of information, brought about
unbundling of production activities of firms around the world. Proximity was no
longer a limitation and firms relocated their production segments to the place where
those functions can be handled less expensive. Owing to the efficient and inexpensive
26
cost of communication, coordination of various production segments located in
several distinct places became easy (Inomata, 2017). These technological
breakthroughs reshaped international trade and the relationship of countries
significantly.
In parallel with these changes and empirical evidence from the real-life international
trade patterns that challenge some of the main premises of classical trade theory,
theoretical framework on trade was needed to be reconstructed and new school of
thoughts emerged (Inomata, 2017). First, the premises of perfect competition and
constant returns to scale were confronted and New Trade Theory in international trade
was introduced by Helpman and Krugman in 1980s (Inomata, 2017). The further
empirical findings and observations of Grubel and Lloyd (1975), that challenged the
prevailing model, were the existence of intra-industry trade -which also meant that
trade can happen between countries in the same industry and “between countries with
similar technology and resource endowments -a phenomenon that cannot be explained
by the orthodox notion of comparative advantage” (Inomata, 2017). New Trade
Theory was able to explain that intra-industry trade enables increasing returns to scale
which also promotes trade among the countries in the same industry (Mitchell, Keane
and Coles, 2009). According to the Neary (2009), New Trade Theory asserts that “two
types of trade coexist, with net or inter-industry trade driven by differences between
countries in comparative advantage, and intra-industry trade encouraged by
similarities between countries” (Mitchell, Keane and Coles, 2009).
Another important argument asserted by the New Trade Theory is the prevalence of
trade in intermediate goods, challenging the classical theory’s premise of trade only
in final products. Since developments in transportation and communication
technologies enabled cheaper prices for moving goods and services, firms started to
relocate their production segments to the places where those activities can be handled
more efficiently (Inomata, 2017). Increasing outsourcing due to the advances in
transport and ICT, resulted in fragmentation of production and firms became more
independent in moving some of the production phases across national borders.
27
Fragmentation of production and countries’ specialization on these specific tasks
constitutes the basis for the value chains framework. Later on, Melitz (2003)
challenged the homogeneous producers assumption by his research on firms
heterogeneity in productivity between exporter and non-exporter firms which is
considered as New-New Trade Theory (Inomata, 2017).
Moreover, Baldwin (2006), Grossman and Rossi-Hansberg (2006) underlines the
importance of arising “tasks-versus-sectors distinction” in competitiveness of nations
which is also regarded as a “’new paradigm’ in trade theory” (Baldwin, 2006). That
means specializing in a specific sector or product may not bring the competitiveness
nations seek in this era because production is highly fragmented across the national
borders -which enables getting a particular task in a production process done in the
most efficient place with relatively little cost. In doing so, production is highly divided
into separate value-adding tasks (phases) handled in different locations. Increased
offshoring and foreign direct investments by multinational companies are some of the
clear indicators of that (Baldwin 2006, Inomata 2007).

28
Figure 2.1. (Neo) Classical Theory of International Trade (Inomata 2007)
To sum up, those concepts discussed above are some of the basic ideas that constitute
the basic for the development of value chain framework. Changing trade dynamics
required new set of tools and approaches to conduct analysis of evolving trade
patterns. This is especially important when nations or regions seek competitiveness in
global trade. Value chains came up as a useful framework at that point in order to
analyze those complex dynamics and determine the most appropriate strategies to
improve one’s competitiveness.
2.2. Value Chains
The most well-known definition of value chains is made by Kaplinsky and Morris’s
(2001) and describes them as “the full range of activities which are required to bring
a product or service from conception through the different phases of production
29
(involving a combination of physical transformation and the input of various producer
services), delivery to final consumers, and final disposal after use” (Kaplinsky and
Morris, 2000; Kaplan et al., 2016). Another definition describes value chains as “a set
of interdependent economic activities and to a group of vertically linked economic
agents” (FAO, 2013). Mitchell, Keane and Coles (2009) articulates that value chains
consist of primary functions which are generally regarded as “input supply,
production, processing, storage, wholesale (including export), retail and consumption;
and secondary services that support primary functions including “transportation,
brokerage and service processing.” They also indicate that during each ‘downstream
flow’, goods are altered and value and, costs are added. Trade, especially global trade,
is at the core of the value chains framework. Similarly, Keane (2008) refer global
value chains as the mechanisms enabling interaction of developing world with the
developed through trade; and systems comprising of value-adding activities (“nodes
of production”) in and between. It is also possible to describe “sub-chains” of a value
chain depending on the differentiated processing techniques or usages of the main
output, for example cotton fiber and cotton seed production are the two primary sub-
chains of cotton value chains (FAO, 2013).
Since value chain refers to a series of economic activities required to bring about a
product or service, considering several actors engaged with the chain -and with each
others- is inevitable. Not only consumer-producer relationships, but also interactions
between the parties which handle distinct parts of the chain is one of the most
important interests of value chain analysis. The more actors involved in a chain; the
more sophisticated governance is required to manage those complex relationships
among the actors. Therefore, governance is another crucial component of value chain
framework.
The main objective of the value chain analysis is improving the efficiency of the
production or a targeted specific part of it in order to increase overall value gained and
improve competitiveness. Efficiency improvements in value chains can be made in
various ways - mainly by sourcing cheaper inputs (domestically or outsourcing),
30
technological advancement or exploiting any possible cost advantages. Thus, value
chain analysis focuses on problems, bottlenecks and opportunities associated with the
tasks handled through the chain.
Value chain analysis not only deals with inefficiencies associated with production, but
also examines market dynamics in order to help beneficiaries to draw the most useful
road map that get them reach their desired positions in the market. Mitchell, Keane
and Coles (2009) highlights that “value chains are a market-oriented approach, in the
sense that all activities in the chain are directed towards the market (no market = no
value chain).” Moreover, global markets are subject to change quite fast depending on
the rapidly changing consumer tastes and preferences. Besides consumers’ interest in
variety and different quality standards in goods and services, social and environmental
dimensions of economic activities are recently at issue. A tendency towards organic
products, sustainable production, fair trade, child-labor free products and so on are
quite common in consumer preferences. Consumer demand for environmentally and
socially responsible production processes impose higher standards to the producers to
comply with. Value chains, in this regard, help producers to understand and respond
market preferences better and respond accordingly while maintaining efficient
production.
It is clear that developments in logistics services and information & communication
technologies lowered the costs of moving goods, people and information which
contributed a lot to the spread of economic activities globally. In addition to this,
another important factor is trade liberalizations that many countries have been going
through. Reduced trade barriers and lowered tariffs allowed firms to spread some of
their activities over developing regions to benefit from lower costs. Trade
liberalization not only benefited the investing big firms, but also give the smallholder
producers or traders of low-income countries the chance of engaging in global trade
and ultimately enhance their incomes. However, it is evident that process of
globalization and accordingly trade liberalization does not always do the best for
smallholder producers or for the poor of the developing world. Several studies, for
31
instance, illustrated how China’s rapid economic growth and participation into world
economy in 1980-1990s also aggregated inequality levels in the country. One of the
main objectives of value chains framework, in that respect, is dealing with
distributional issues associated with participants of the value chains and enhancing the
position of the disadvantaged groups.
2.2.1. Origins of the Value Chains Framework
First use of the value chains framework was encountered in 1960-1970s for the path
development purposes in mineral exporting sector (Girvan, 1987 as cited in
Kaplinsky, 2004). The other primary use of the value chains is considered ‘French
filière’ approach which is intorduced by the French school of territorial development
(ADEFI, 1985 as cited in Parrilli , Nadvi & Yeung, 2013) and used for some of the
agricultural export commodities including cotton, coffee, cocoa etc. (Raikes et al.,
2000 as cited in Gereffi et al., 2001). Mitchell, Keane and Coles (2009) articulates that
French filière approach that used by the agricultural scientist can be considered as
more like a practice of efficiency improvement attempts in value chains.
Use of value chain analysis as an analytical structure tool became widespread in 1990s
with the contributions of Michael Porter’s work which describes the concepts of value
chain and value system as the important frameworks contributing to nation’s
upgrading capabilities (Porter, 1985). Porter makes the classic distinction between the
primary activities (inbound logistics, operations, outbound logistics, marketing &
sales, and service) and support services (firm infrastructure, human resource
management, technology development and procurement) -both of which are also
subdivided into their own generic categories. According to Porter (1985), activities
are differentiated based on the technology and strategy used. Primary activities refer
to the physical stages that are mainly required to create a product and then its delivery
to the customers while support activities are the ones helping primary activities to take
place (Porter, 1985). He indicates that all activities are handled in a firm; however, the
32
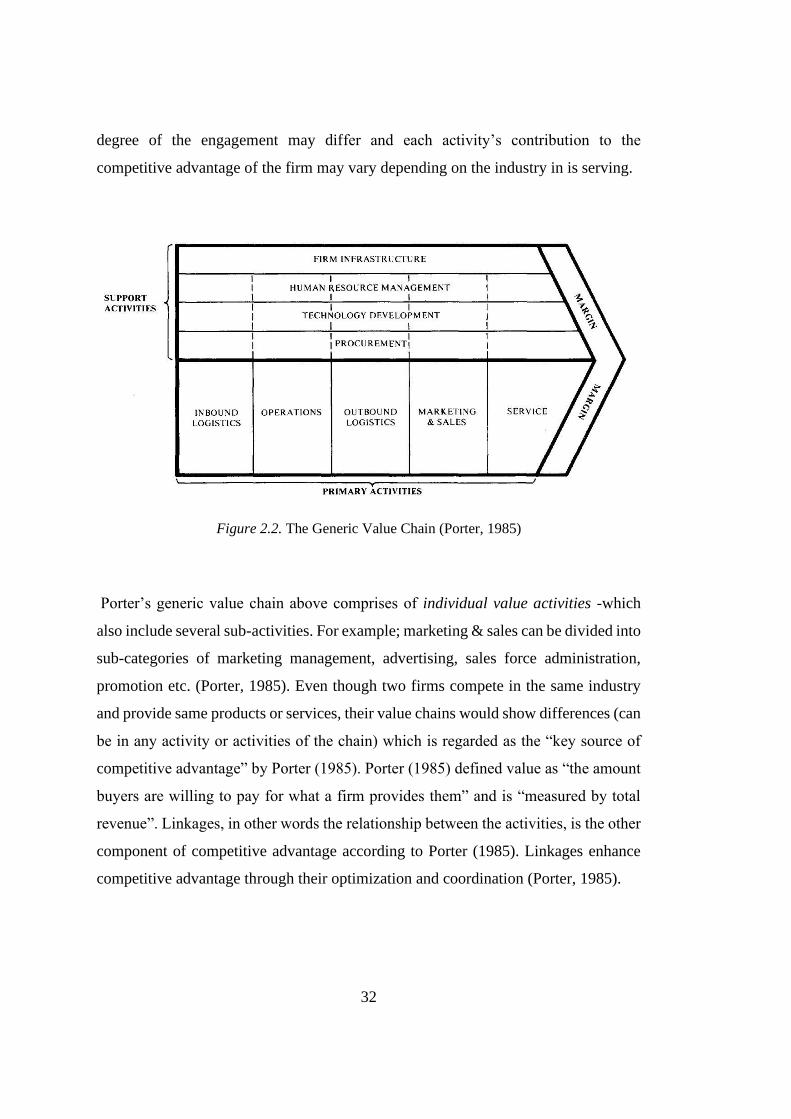
degree of the engagement may differ and each activity’s contribution to the
competitive advantage of the firm may vary depending on the industry in is serving.
Figure 2.2. The Generic Value Chain (Porter, 1985)
Porter’s generic value chain above comprises of individual value activities -which
also include several sub-activities. For example; marketing & sales can be divided into
sub-categories of marketing management, advertising, sales force administration,
promotion etc. (Porter, 1985). Even though two firms compete in the same industry
and provide same products or services, their value chains would show differences (can
be in any activity or activities of the chain) which is regarded as the “key source of
competitive advantage” by Porter (1985). Porter (1985) defined value as “the amount
buyers are willing to pay for what a firm provides them” and is “measured by total
revenue”. Linkages, in other words the relationship between the activities, is the other
component of competitive advantage according to Porter (1985). Linkages enhance
competitive advantage through their optimization and coordination (Porter, 1985).
33
Later on, Gereffi and Korzeniewicz developed the global commodity chains (GCC)
approach in 1990s based on the world systems analysis. They emphasized the
importance of ‘chain governance’ as the critical component for the competitiveness
of a chain (Gereffi et al., 2005; Mitchell, Keane and Coles, 2009). They further made
the distinction between the chains by their governance dynamics (buyer-driven and
producer driven chains) and increasing influence of global buyers, retailer and brand
name companies over the governing of “globally dispersed and organizationally
fragmented production and distribution networks” (Gereffi et al., 2005).
In the beginning of 2000s, GCC researchers evolved their studies and came up with
the concept of global value chains (GVC) based on the notion of ‘value generation’ in
each distinct stage along the chain of a product or service (Parrilli, Nadvi & Yeung,
2013). Gereffi and others developed a broader and more detailed conceptual
framework for conducting analysis of governance in value chains in an attempt to
understand the nature of value creation along the stages of a chain; therefore they
enlarged two-type governance schema (buyer and supplier driven) to 5 categories
approach which are: markets, modular value chains, relational value chains, captive
value chains, and hierarchy (Gereffi et al., 2005; Parrilli, Nadvi & Yeung, 2013).
Development of the value chain framework further was carried by Humphrey and
Schmitz (2002) and other scholars in an attempt to integrate it into local and regional
production systems (including local industrial clusters) and exploit the opportunities
and potentials for growth and local development for both developed and developing
countries engaging in global markets (Parrilli, Nadvi & Yeung, 2013). Humphrey and
Schmitz (2002) examined export-oriented clusters that are integrating into global
value chains; and how their governance and upgrading strategies differ from the
classical cluster upgrading strategies. Their main findings basically revealed that, for
the clusters engaged with global value chains, external linkages gain much more
importance compared to the local linkages.
34
In summary, value chain analysis can be regarded a multidisciplinary framework
barrowing from various fields and topics including “…economic activities and farm
management (income statements, crop and farm budgets), industrial economics
(production coefficients and vertical integration) national accounts (value added
analysis, generation and distribution through classical distributional channels, such as
wages, interest, rents and profits), Cost-Benefit Analysis for investments
(counterfactual scenario analysis, discounted annual-equivalent investment costs),
welfare economics (social optimum benchmarking), international trade
(competitiveness and protection), contract and game theory (negotiations, strategic
behaviour of agents along the chain)” (FAO, 2013).
2.2.2. Why Value Chains
As conditions, theories and practices have changed, researchers needed new concepts
and tools to develop a better understanding of the new system in an effort to respond
appropriately to the development issues of time. This thesis adopts value chain
analysis as one of the most suitable conceptual frameworks to conduct an analysis on
the dynamics of a specific trade and production network and its importance in terms
of regional development of a particular area. The discussion below intends to
articulate how value chain analysis responds appropriately to examining the shifting
patterns and recent dynamics of global economy -in terms of fragmented production
systems, changing perceptions of competitiveness and specialization- and, as a result,
informs policy and decision makers for taking the necessary steps to overcome
development issues.
Fragmentation of production
First, developments in information and communication technologies, decreasing costs
of transportation and logistics services and trade policy reforms facilitated “access to
35
resources and markets” in overseas and, consequently, “geographical fragmentation
of production processes across the globe according to the comparative advantage of
the locations” (OECD, 2012). For example, developing countries have become
holders of a comparative advantage in manufacturing (primary branch) due to their
supply of cheap labor, resources and production costs while already developed
industrial countries created a comparative advantage in “secondary economic
activities and value-added traded services” (Kaplinsky, 2004). Interestingly, this
process can be considered a ‘separation’ and ‘interconnectedness’ at the same time –
explained by two somewhat contrary terms- and well-explained as “functional
integration between internationally dispersed activities” (Dicken 1998 as cited in
Gereffi et al., 2001) and “disintegration of production and its re-integration through
inter-firm trade” (Gibbon et al., 2008). Whole process of creating a product or offering
a service became much more divided and detailed but a more sophisticated system is
required to handle these divided stages. For example, some stages such as design,
marketing, or disposal after use gained extra importance. The more production process
gets complex, the better organization and management became crucial for success in
the markets. In addition to this, worldwide sensitivity to environmental externalities
and social issues of production activities started to get more attention. Consumer
preferences towards environmentally friendly products and production processes
show a considerable increase. Besides environmental concerns, production process
which are not free from child labor or exploitation of women workers are highly
criticized and not preferred by a lot of consumers around the world. All these factors
make the whole process of bringing out a product from design to final disposal even
more complicated and elaborated.
Not only stages of production fragmented across the borders with globalization, but
also producers and customers of these products or services became spread globally.
As a result, a global economic system consisting of “global buyers” and “global
suppliers” (OECD, 2012) has occurred and “nations have become more
36
interdependent through the flows of goods, services, and financial capital since the
1970s” (Gereffi et al., 2001).
Therefore, new system of production can be summarized as a much more complex
process comprising of several distinct value adding tasks (as stages of production)
with their own complicated dynamics, but also a complete chain -required to be
considered as a whole system- at the same time. Value chain analysis focuses on all
distinct, but interconnect economic activities carried out through a chain and
investigates each stage in detail -not only within its own inner-stage dynamics but also
its relationship with other phases. Thus, value chain approach brings a comprehensive
approach to see the big picture (whole set of activities) without neglecting peculiar
dynamics of stages that constitutes the whole chain activities. As Gereffi et al. (2001)
indicated:
“If globalization in the productive sphere implies functional integration
between internationally dispersed activities, then the value chain perspective
is an effective means of conceptualizing the forms that this integration takes.
… It shifts the focus from production alone to the whole range of activities
from design to marketing, and it problematizes the question of governance –
how chains are organized and managed” (Gereffi et al., 2001).
Governance
This even more complex and fragmented economic system requires a better
organization due to its nature of complexity. However, it is worth to note that again,
even though we are picturing a world where production processes are geographically
more dispersed and fragmented, overall trade and other economic activities are
happening in a more integrated global platform. As it is indicated above, being
production processes more fragmented around the world makes nations and regions -
as global buyers and global suppliers- more interdependent to each other (Gereffi et
al., 2001) in economic activities. Continually increasing number of participants in
37
global markets makes governing these complex relationships among the actors an
important issue.
Value chain analysis provides practical tools to understand how these complex
networks and relationships between various participants (actors) are organized and
managed. As oppose to the classical industry studies, value chain approach shifts the
focus from ‘firm’ level analysis to the “chain or organizational network as the unit of
analysis” and raises questions about power and governance (Gereffi et al., 2001)
which helps to understand complex relationships and hierarchies that shapes trade
activities between the parties.
Changing Trade Patterns and Policy
In such an integrated and complex global economy, how trade patterns were also
altered is discussed above in the previous chapters. In fact, the search for cheaper
inputs or supplies and exploring distant prosperous markets across the national borders
go way before globalization -actually it started in the “internationalization period”
around the 17th century by colonial empires (Gereffi et al., 2001). The difference
between two trends -internalization and globalization- is that, with the coming up of
globalization, the nature of products being traded has changed and trade became more
organized and well-governed.
Similarly, Mitchell, Keane and Coles (2009) indicates that the rise of outsourcing
highly contributed to the fragmentation of production and countries, now, trade
intermediate goods as much as final products (Mitchell, Keane and Coles, 2009). As
a result of gaining importance of trading intermediate goods and services, new areas
for the countries or regions to specialize in and compete with the worldwide providers
of the same product or service emerged.
In terms of policies regulating trade, Backer and Miroudor argues that:
38
“While most policies still assume that goods and services are produced
domestically and compete with “foreign” products, the reality is that most
goods and an increasing number of services are “made in the world” and that
countries compete on economic roles within the value chain. The concept of
GVCs is thus important to close the gap between policy and the reality of
business.” (Backer and Miroudot, 2013).
Value chain analysis constitute the basis for identifying most advantageous stages for
the countries to specialize in. As indicated above by Backer and Miroudot (2013), now
it is possible to specialize in a specific part of the value chain for countries or regions
rather than focusing on the final product itself. Value chain analysis help examining
the most advantageous stages nations can achieve or improving existing chain
activities by focusing on inefficiency problems. Value chain framework not only
provides useful tools to shed light on these issues, but also informs policy makers to
take the necessary steps for creating the enabling environment required to improve
value chains.
Competitiveness
These changes in trade patterns and increasing accessibility of global resources and
markets have created an extra competitive environment for nations and firms.
Especially after the decentralization and fragmentation of production activities, and
increasing participation of ‘low-cost producers’ into the global markets, ‘local
determinants of competitiveness’ became the center of attention in many schools of
thought including “new economic geography, business studies, regional science and
innovation studies” (Humphrey & Schmitz, 2002). Industrial cluster literature, for
example, emphasized the significance of local linkages (vertical and horizontal) and
local sources in creating competitive advantage through enabling collective
efficiencies (Schmitz, 1995; Giuliani, Pietrobelli & Rabellotti, 2005). However,
current transformations in production systems and increasing global trade, mostly
39
facilitated by the improved and eased mobility of resources, information, capital and
other factors, enabled firms to participate in global value chains and trade across
countries (Giuliani, Pietrobelli & Rabellotti, 2005). Especially in ‘labor-intensive’
industries such as garments, footwear, furniture, toys etc. in developing countries,
which are also referred as “buyer-driven chains” (Kaplinsky, 2004), “global buyers
have come to play in increasingly important role in organization of global production
and distribution systems” (Humphrey & Schmitz, 2002). Thus, when the control and
power of global buyers and huge brand-name companies over the organization of
production at a global scale is so obvious, the attention in competitiveness has shifted
from local linkages to the cross-border linkages (Gereffi and Korzeniewicz, 1994;
Gereffi and Kaplinsky, 2001 as cited in Humphrey & Schmitz, 2002). Global linkages
and participation into global markets and international networks have become
significant in promoting competitiveness. Value chain analysis, in this manner,
promotes local producers’ engagement with global trade and production networks. It
further examines core rents and barriers to entry in a value chain to facilitate
participation of the target groups to those global networks (Mitchell, Keane and Coles,
2009). Moreover, through upgrading, value chain analysis can help targeted local
producers forming their own barriers to entry in order to enhance their competitiveness
in the market (Mitchell, Keane and Coles, 2009).
Besides, several value chain analysis not only promotes participation of target groups
into global trade networks, but also concentrates on how they can improve their
position in the chain to enhance their incomes and conditions. To do this, value chain
analysis offers upgrading strategies through which local participants can improve
efficiency in production, lower the production costs and increase profits (efficiency
issues), improve the terms of their engagement in the existing chains. Transferring
into more profitable chains is also another option for the actors seeking development.
All these strategies are commonly adopted by the low-income targeted groups of
developing regions, especially in Latin America, Asia, and Africa, which benefits
from value chains framework.

40
Specialization
Specialization has gained extra importance in such a competitive world. However, the
nature of specialization has altered as well as the changing nature of trade and
competitiveness. While countries specialize in particular products or industries before
too, now “countries tend to specialize in specific business functions rather than
specific industries, such as the assembly operations for China or business services for
India” (Backer and Miroudot, 2013). In fact, according to many researchers, value
chain perspective can be considered as “‘incomplete’ firms that have specialized in
certain value chain functions, such as design or marketing” (Gereffi et al., 2001).
Some researchers argue that comparative advantage is a concept that is subject to
change at any given time and countries may adopt specialization strategies according
to their “dynamic comparative advantage” rather than “static comparative
advantages” because they ultimately want to transfer into increasing-return industries
(Lin and Chang 2009: Mitchell, Keane and Coles, 2009). That means, sticking at a
specific task or product may not be the most profitable option over time. Countries
ultimately revise their position in the value chain and can abandon some of the tasks
they have been handling if those tasks are no longer that reasonable to maintain. An
outstanding example of it could be the Netherlands and cut flower value chain.
Although the Netherlands has been concentrated in all stages of cut flower value chain
for long periods of time, it recently tends to be rather a marketplace node -reducing
domestic production and exporting mostly the flowers that are produced abroad
(Levelt, 2010). As Levelt (2010) indicates, it is due to the “scale economies in flower
logistics” and local knowledge in flower product development accumulated
throughout the years that make the Netherlands a global hub in cut flower trade.
Obviously, it has a lot to do with the Netherlands’ long-time specialization in logistics
of perishable products which brings a great advantage in some specific phases of the
value chain compared to the other countries.
41
2.2.3. Value Chains and Regional Development
Globalization of trade and production, which are considered the most important
characteristics of the contemporary economy has different implications for different
groups and places around the world (Ponte and Sturgeon, 2014; Gereffi et al., 2005).
Global scale re-organization of economic activities opened up several new
opportunities in a wide range of developed and developing countries which had the
opportunity to fuel growth in their industrial capabilities (Gereffi et al., 2005). In this
respect, “why and how new opportunities have opened up for firms, localities, and
countries to engage in the global economy — as suppliers, processors, value-added
resellers, distributors, contractors, intermediaries, and service providers” have been
main interest of value chain studies (Ponte and Sturgeon, 2014). From the perspective
of regional development, value chain analysis provides valuable insight and useful
tools for countries or regions to evaluate themselves depending on their strengths and
opportunities; and ultimately help to engage with global economy according to their
competencies.
Vertical disintegration became prominent as multinational companies reconsidered
their core competencies in the direction of highest value-added activities while
decreasing direct ownership of ‘non-core’ and lower value-added activities. This
situation opened new specialization areas for large scale industry segments in
developing countries inducing export-oriented economic development (Ponte and
Sturgeon, 2014). Several regions have experienced “growth through trade and GVC
participation” (Keane, 2008). Specialization has gained extra importance with
globalization of production and while developing countries usually focused on
manufacturing and its related activities, developed economies mostly specialized in
product design and development, finance, marketing, retailing (Gibbon et al., 2008).
Value chain analysis provide set of tools and approaches to investigate proper
strategies for regions in determining their specialization options in the value chains
they are engaged with and help to layout a roadmap to upgrade themselves in this
direction.
42
Innovation, technological spillovers and learning through GVC participation have
been some of the prevalent topics in value chain studies (Inomata, 2017) which are
also related to the development of regions. Value chain analysis enable developing
countries to overcome barriers to entry to the specific markets and integrate into global
trade networks (Ponte and Sturgeon, 2014). Once they are integrated, developing
country firms get the opportunity to learn a great deal from working with global
leaders and enhance their technological knowledge and industrial capabilities which
ultimately decreases their economic dependency (Ponte and Sturgeon, 2014).
Especially lower income local producers are encouraged to improve themselves by
participating in global value chains and trading with lead firms. Much more
demanding standards of worldwide buyers compel local suppliers to always update
themselves and this interaction ultimately promotes learning and knowledge transfer
for local producers.
Another issue is the distributional inequalities intensified by globalization. Gibbon
and others highlight that economic globalization is, in fact, geographically and
sectorally highly uneven (Gibbon et al., 2008). Still, there are several groups who are
“excluded, marginalized or expelled from this process, or have experienced increased
inequality and social polarization” as indicated by Ponte and Sturgeon (2014). GVC
analysis as a diagnostic tool allow identifying critical issues and blockages for those
groups, and help to prepare a roadmap for appropriate interventions for change. GVC
analysis are widely adopted by disadvantaged local producers or the poor in an attempt
to search for ways to engage with global trade and participate in global networks; or
enhance their positions (or terms of integration) once they are engaged. Value chain
analysis help to discern core rents and barriers to entry which shows the ultimate
beneficiaries of production, so that can draw a useful roadmap in participation of the
poor and how this participation should take place (Mitchell, Keane and Coles, 2009).
Poverty alleviation is, in this respect, one of the important areas in value chains
approach which contributes to regional development.
43
Moreover, participation into GVCs not only help the poor or disadvantaged to increase
their incomes and revenues, but also may help to improve social terms and working
conditions. This issue has gained extra importance and attention with the exploiting
characteristics of global production over labor and income distribution issues and has
been a center of attention in GVC studies (Inomata, 2017). Gibbon and Ponte (2008)
explains that how opportunities and rewards gained by participating a value chain are
determined and distributed; and how unequal distribution of these gains and limited
access or entry to the global value chains issues can be overcome in favor of poor or
local producers of developing countries are more of a concern of GVC analysis.
Increasing the competitiveness of firms, regions or countries is one of the most
important objectives of value chain approach which is enabled through procurement
of efficiency in the activities conducted. As Mitchell and others (2009) indicated:
“International evidence shows that achieving systemic competitiveness
requires cooperation along the chain, as well as within links in the chain. After
all, a chain is only as strong as its weakest link. So the establishment of a
collation of interested parties involved in promoting participation by the poor,
or the restructuring of value chains, is often a necessary process to ensure that
appropriate global competitiveness is realised.”
Value chains approach is also widely adopted in promoting agricultural production
and integrating smallholders and local producers into larger global trade networks.
The aim in developing agricultural value chains is to improve agricultural production
and processing so that targeted groups can generate increased incomes, more paid
employment and better working conditions (Kaplan et al., 2016). Also, after the 2007-
2008 food crises, promoting agricultural value chains became one of the central
concerns in food security and poverty alleviation (Kaplan et al., 2016).
Even developed world sometimes face significant challenges due to the rapidly
changing dynamics of the today’s world economy. As Ponte and Sturgeon (2014)
indicate, participation in global trade networks not only provided opportunities for
44
developing and developed world, but also imposed new challenges and risks for
everyone and “increased sense of economic insecurity, even among the ‘winners’ in
the global economy.” Value chain studies, in this respect, provide valuable insights to
the actors regarding what the possible outcomes of participating and not participating
in those global networks are (Ponte and Sturgeon, 2014).
Another area that value chains framework can remarkably contribute is policy making.
In fact, policy makers are expected to define development objectives and provide
guidelines for various issues including uneven development, economic growth,
poverty alleviation, competitiveness, and industrial policy to name some. GVCs
analysis provide policy makers with valuable data and outcomes and inform policy
making process by helping them to set more achievable lucrative goals, and offer set
of tools to conduct these analysis.
As Todeva and Rakhmatullin (2016) indicate:
“Economic development policies require more GVC insights and
comprehensive understanding of the concentration of capabilities in countries,
regions and clusters, as well as the backward and forward linkages that are
taking place across sectors and between core and periphery actors, and the
distribution of these capabilities across SMEs, medium and large firms”
In line with these developmental contribution areas, value chains approach has been
considered a descriptive tool offering a heuristic framework for data collection and
processing; however, more recent development of the value chain concept indicates
tendency towards a more analytical structure providing valuable insights into most
crucial developmental concerns such as “determinants of global income distribution”
and “identification of effective policy levers to ameliorate trends toward
unequalization” (Kaplinsky, 2004).
In this respect; Kaplinsky (2004) identifies 3 key analytical characteristics of value
chain analysis as being related to one of the crucial concerns of contemporary age –
“spreading the gains from globalization-” as: (i) dynamic rents, (ii) governorship, and
45
(iii) systemic efficiency gains. Kaplinsky considers these three elements interrelated
and argues that key driver for that is the prevalence of competition which decreases
profits by lowering the barriers to entry that consequently increases number of actors
participating to the chain around the world. Increased number of participants search
for new economic rents which requires powerful actors to assist suppliers to update
their own operating procedures.
Major topics regarding the benefits of utilization of value chains perspective in
regional development are briefly discussed in this chapter. Value chains approach
provides more up-to-date tools to understand the dynamics of recent development
issues and conceptualize well-designed policy solutions to the current problems of the
regions. Especially in Turkey, we have a long history of improper or useless policy
responses to some major development issues of the country. The problem mostly
arises from the misinterpretation or not fully understanding the dimensions of the issue
and accordingly not being able to design appropriate policy responses to it. Value
chain analysis, in this respect, provides policy makers with necessary tools and devices
to, first, identify the major problem regarding a developmental issue and then
determining the best policy response to overcome it.
Different from classical sector-based approaches, value chains perspective underlines
the important role of actors participating value chain and governance of the
relationships between them. Value chains perspective take actors’ intentions into
consideration in providing a well-designed policy response. In this respect, when
designing policy responses to a development issue, value chains approach enables
incorporating major actors of the value chain being examined, and benefit from the
dynamics of relationship between these actors.
2.3. Value Chain Analysis
Value chains approach basically aims to provide answer such policy issues; “Is a
value chain creating value added? Who is creating value within the value chain? What
46
is the relation between value added creation and profit earning? What is the income
distribution within the value chain?” (FAO, 2013). It further focuses on the ways
value creation along the chain, namely ‘upgrading’, can be accomplished (Kaplan et
al., 2016), possible upgrading positions and promoting new ones (EU, 2016). In line
with this purposes, being able to answer these questions requires analysis of some
aspects, characteristics, or elements of value chains. As it can be understood from the
definition below, value chains are complex structures comprising of several distinct
components which should be analysed in detail to develop a broad understanding. This
section talks about the various components of a value chain.
In ‘A Handbook for Value Chain Research,’ a keystone in value chain literature,
Kaplinsky and Morris (2000) highlight that, in conducting value chain analysis, there
is not a specific “correct” way to do it and the researcher can take an approach
depending on the question being asked. Similarly, Gereffi et al. (2001) underlines the
absence of a well-developed theoretical framework; and the necessity for common
parameters and robust indicators in order to evaluate different case studies and
compare various value chains. However, the paragraphs below explain frameworks
developed and implemented in several case studies for value chain analysis by some
researchers and institutions.
Kaplinsky (2004) identifies three key elements for value chain analysis as: barriers to
entry and rent, governance, and systemic efficiency. In a broader perspective, FAO
(2013) indicates value chain analysis parts as: socio-economic context of the value
chain, demand for value chain outputs, institutional set up, analysis of input-output
markets, economic analysis, and functional analysis (including: setting the boundaries
of the value chain, identifying activities and agents, and quantifying physical flows).
Also, Gereffi et al., (2001) discusses about a central concept to value chain analysis –
conceptualization and measurement of the ‘value’. Differently, European Commission
put emphasis on the mapping of global value chains in addition to the classical
analysis, believing that mapping interconnected capabilities (emerging and integrated
inter-sectoral value chains both at regional and national levels) can improve regional
47
stakeholders’ knowledge of their own capabilities and help them connecting to other
regions in the most effective way possible, and enhance market relationships via
match-making (Todeva and Rakhmatullin, 2016 -2). Lately, FAO has developed a
‘VCA-Tool Software’ for value chain analysis to use in policy making, and it has
widely been used in several countries for analyzing the socio-economic impact of
policies (FAO, 2013).
As can be seen, one can compile a set of parameters and indicators depending on the
ultimate purpose of the study. One useful feature of value chain analysis is its being
‘inherently scalable’. It is possible to scale a value chain development exercise based
upon a particular firm or producer group, the practice can be applied to a larger context
such as a cluster, region or a country (Mitchell, Keane and Coles, 2009).
For the specific purpose of this thesis, the components below are chosen to be further
investigated and some of the related ones are regrouped. Also, some of the components
are given relatively more coverage due to its importance for this specific study.
2.3.1. Setting the Content of the Study
First step in functional analysis is the setting the boundaries of the value chain being
investigated (FAO, 2013). Most value chains are defined on the basis of primary
commodity used; for example, cotton value chain, wheat value chain etc. in
agricultural chains (FAO, 2013). Boundaries of the value chain research depends on
the scale and purpose, when studying a national value chain, for instance, the
boundaries can be taken as national borders (FAO, 2013). However, if value chain is
of an internationally traded commodity, the boundaries of the study can exceed
national borders and requires investigation of all parties involved (FAO, 2013).
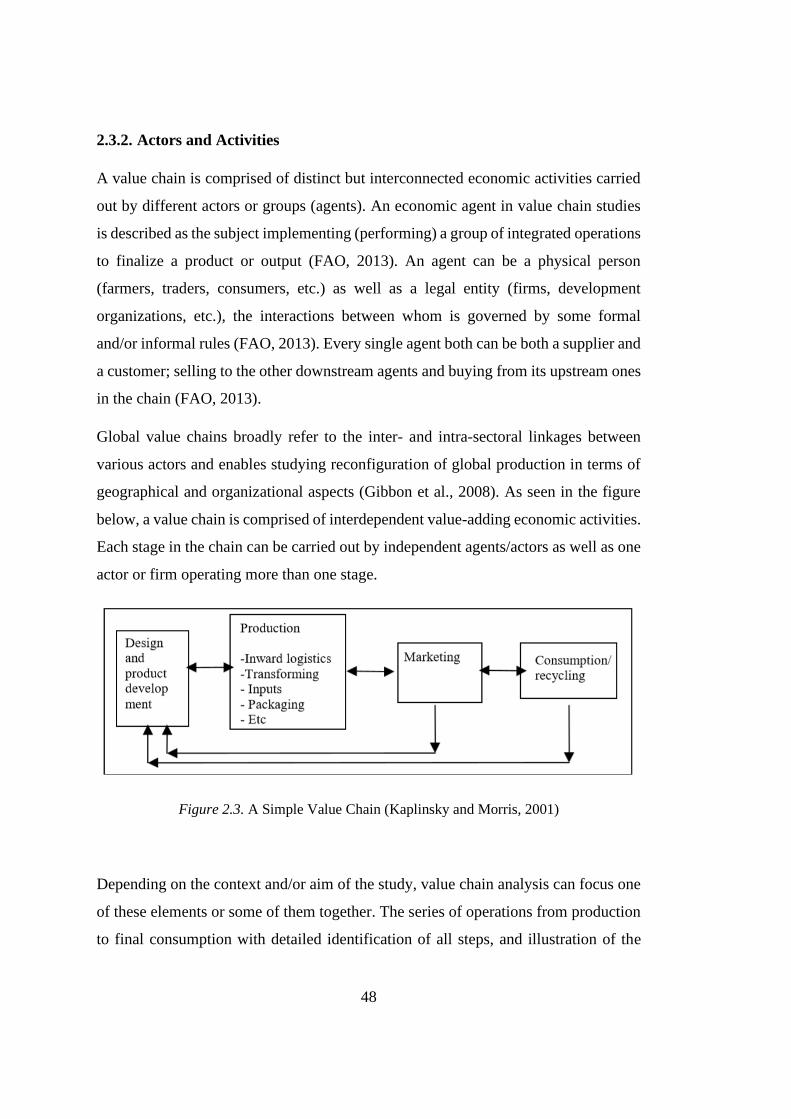
48
2.3.2. Actors and Activities
A value chain is comprised of distinct but interconnected economic activities carried
out by different actors or groups (agents). An economic agent in value chain studies
is described as the subject implementing (performing) a group of integrated operations
to finalize a product or output (FAO, 2013). An agent can be a physical person
(farmers, traders, consumers, etc.) as well as a legal entity (firms, development
organizations, etc.), the interactions between whom is governed by some formal
and/or informal rules (FAO, 2013). Every single agent both can be both a supplier and
a customer; selling to the other downstream agents and buying from its upstream ones
in the chain (FAO, 2013).
Global value chains broadly refer to the inter- and intra-sectoral linkages between
various actors and enables studying reconfiguration of global production in terms of
geographical and organizational aspects (Gibbon et al., 2008). As seen in the figure
below, a value chain is comprised of interdependent value-adding economic activities.
Each stage in the chain can be carried out by independent agents/actors as well as one
actor or firm operating more than one stage.
Figure 2.3. A Simple Value Chain (Kaplinsky and Morris, 2001)
Depending on the context and/or aim of the study, value chain analysis can focus one
of these elements or some of them together. The series of operations from production
to final consumption with detailed identification of all steps, and illustration of the
49
profile of value chain in physical terms are also referred as “functional analysis”
(FAO, 2013). This analysis comprises of technical operations used in various value
chain stages, input and output flows throughout the chain, agents involved at different
stages and functions they are occupied with, physical flows of the products between
the agents, and bottlenecks (FAO, 2013).
It is also important to aggregate actors into meaningful categories. This categorization
can be based on technology or production system used, location or farm size in
agricultural value chains etc. (FAO, 2013). For example, in agricultural value chains,
considering irrigation systems farmers can be grouped as pumping irrigating ones or
gravitational irrigating; in terms of farm size farmers can be grouped as large scale,
small scale etc.; or in terms of land ownership they can be categorized as landowners,
sharecroppers, tenants etc. Similarly, in an industrial value chain, actors can be
categorized based on the technology they are using, scale of production, or type of
product they are producing etc.
Identifying key stakeholders, lead firms or powerful actors is also a quite important
aspect of actors’ analysis in value chains because they have the ability and power to
impact overall functioning of the value chain. These critical actors can induce
technology and knowledge spillovers, assist their suppliers, influence customer
preferences, or even affect the value distribution along the chain (Kaplinsky, 2004).
Sometimes, they can even function as the governors of the value chain they are belong
to. Gereffi et al., (2001) describes lead firms as the determiners of ‘what is to be
produced, how, and by whom.’ They possess the power to control access to resources
such as new technologies; decide the location of the production, product design, time
and pace of the deliveries, etc. which have a significant effect on the overall structure
and performance of the value chain (FAO, 2013).
Related with actors and activities carried out through the chain, tracing commodity
flows from one agent to another with their physical quantities provide valuable insight
about the relative weight of the operating agents (FAO, 2013). Quantification of
50
physical flows can be actualized by, for example, yields per unit of activity, cultivation
area, product value, etc. Also, input-output matrices of flows, graphical
representation, and other value chain flow charts (with particular attention to the
consistency of data represented) may help to illustrate commodity movements
between the value chain stages better. (FAO, 2013).
Thus, identifying the activities carried out and interacting actors participating in a
value chain can be considered one of the first steps to begin with analysis. This, then,
should be followed by the examination of the roles of the actors, power relations
(governance) and other dynamics which can have an impact on that relationship such
as trust issues, communication, ethnic ties between the groups and so on.
Understanding the agents’ behavior cannot be fully comprehended without
understanding the institutions governing the chain because structure of the market they
are performing in and rules have a lot to do with the choices of agents (FAO, 2013).
The types of relationships between the actors are widely discussed in the governance
section.
2.3.3. Economic Analysis
This chapter discusses economic aspect of value chain analysis; particularly focus on
topics such as ‘barriers to entry and rent’ (Kaplinsky, 2004), ‘demand for value chain
outputs’ (FAO, 2013), ‘analysis of input-output markets’ (FAO, 2013), ‘measurement
of value’ (Gereffi et al., 2001).
2.3.3.1. The Concept of Value and Its Measurement
Gereffi et al., (2001) argues “a fundamental aspect of global value chain research is
how ‘value’ itself is conceptualized and measured.” They indicate 3 indicators for
assessing value in the chains as profits, value added, and price markups:

51
- Profits: When examining income shares, distribution of profits is one
of the basic indicators that we can apply. In measuring profits, ‘return
on capital employed’ or ‘rent’ are the general factors that can be used
(Kaplinsky 1998 as cited in Gereffi et al., 2001). One downside of this
method is that profits does not say much about the returns to labor or
the productivity level of the overall economy. Another downside is that
profits are often not explicitly mentioned, and value is difficult to
measure in regard to tasks and places of value chains.
- Value added: It refers to the allocation of value added among the
tasks/stages of the value chain. Value added shares can be calculated
either 1) splitting the final price of a product according to how much
price is added between the links of the chain or 2) by examining
international import-export data in order to see nations’ value-added
shares.
- Price markups: When using price markups as an indicator to measure
value increase, special attention must be paid in order to avoid
unreliable results. Price markups can be misleading if factors such as
volume of transactions or activities that result an increase in price are
not considered carefully.
(Gereffi et al., 2001)
It is also important how ‘value added’ is created and distributed among the actors in
the chain (FAO, 2013). Value added is defined as “a measure of wealth created in an
economic system by a production process, net of the resources consumed by the
process itself” (FAO, 2013). Besides value added created by the whole chain,
economic analysis also considers; created value added and margins for discrete
economic agents and stages of the chain, and its allocation among production factors
(FAO, 2013).

52
2.3.3.2. Economic Rent and Barriers to Entry
Rents stem from “the control of scarce valuable resources” (Mitchell, Keane and
Coles, 2009). Economic rent theory firstly defined by David Ricardo, who highlighted
the difference between ‘rent as a factor of income’ and ‘economic rent’ (Kaplinsky,
2004). His important contribution was underlining the significant role of scarcity
indicating that the source of economic rent does not come from differential fertility of
land itself but unequal access to land as a resource cause this to arise (Kaplinsky,
2004). Thus, controlling this scarce and valuable resource generate rent that needs
protection from competition and this protection mostly achieved by creating barriers
to entry (Mitchell, Keane and Coles, 2009). However, Schumpeter argued that agents
(mainly entrepreneurs) can induce scarcity on purpose through their actions, therefore,
scarcity can be constructed unnaturally as well (Kaplinsky, 2004).
Kaplinsky (2005; as indicated in Mitchell, Keane and Coles, 2009) describes 4 basic
types of rent:
i. First type of rent is the “ability to shape market relations” by enforcing
monopoly and preventing competitive practices (anticompetitive practices
such as predatory pricing or cartels eliminating other competitors). For
example, agricultural lobbies in developed countries may impose tariffs to
prevent from imports and exhibit an unfair discrimination against those other
producers.
ii. Second type is the ‘resource rent’ which provide advantage to its holder such
as high-yielding agricultural land.
iii. Third is the ‘endogenous rents’ created by firms, local research and technology
centers, and interactions between them.
iv. Fourth type is the ‘exogenous rents’ generated by the outsiders of the value
chain. Those agents do not have a direct relationship with the production
processes nor active participants. Governmental activities can be an example
53
of it such as transportation and telecommunications infrastructure, financial
intermediation, or policy incentives etc.
The “power of human agency” in shaping rents and affecting production processes are
more obvious in the third and fourth types of rents (Mitchell, Keane and Coles, 2009).
Distribution of the rents in a value chain is highly related with the barriers to entry -
determining the gainers and the losers (Kaplinsky, 2004). He further articulates;
“Those who command rents, and have the ability to create new domains of rent
when barriers to entry fall, are the beneficiaries. By contrast, those who are
stuck in activities with low barriers to entry lose, and in a world of increasing
competition, the extent of these losses will increase over time” (Kaplinsky,
2004).
Moreover, intangible parts of the value chains are observed as providing growing areas
of rent which can be illustrated by the falling barriers to entry in manufacturing over
the last decades with more and more countries’ with lower wage costs entered global
trade while copyright and brand names showed very long lasting forms of economic
rent (Kaplinsky, 2004). An example of this situation is:
“Nike now concentrates on the “D” (develop) and “S” (sell) rather than on
the “M” (make) and “B” (buy) of its value chain. The winners include Nike as
the coordinator and through its institutionalization of design and marketing,
and key celebrities such as Michael Jordan. The losers are the factory owners
and the predominantly semiskilled workers in developing country production
sites as Nike relocates production to locales with lower wages or where the
pressures of competition induce governments to devalue, hence undermining
the international purchasing power of domestic wages” (Kaplinsky, 2004).
That was an example of how intercountry distribution of income is affected by the
geographical spread of production activities. However, the same situation is also valid
for intra-country distribution of income because, similarly, high-income markets
54
require more complex capabilities that are usually not possessed by poor producers,
farmers, or enterprises etc. (Kaplinsky, 2004).
2.3.3.3. Analysis of Input-Output Markets and Demand
Understanding the dynamics of domestic and international markets that actors engage
for providing their inputs or selling their products is a crucial part of GVC analysis.
As indicated earlier, detailed investigation of market dynamics is necessary for
understanding and anticipating agents’ behavior because their choices cannot be
considered independent from the market set-up and rules governing the market (FAO,
2013).
Markets, where the transactions between the sellers and buyers take place, exhibit
different dynamics depending on their features such as; “number of agents, level of
information available to sellers and buyers, entry/exit barriers for sellers and buyers,
control binding the supply, control over the prices, and nature of product” (FAO,
2013). Also, efficiency level and pricing mechanisms in a market are highly depend
on the market structure including “perfect competition, monopoly, oligopoly (few
sellers), monopsony (only one buyer), oligopsony (few buyers) to name some of the
main structures (FAO, 2013). All these factors and many others play a significant role
in value chain performance and chain dynamics such as value-added generation and
its distribution etc. (FAO, 2013).
Another aspect in market research is the financing mechanisms that actors need to use
in their value chain activities (FAO, 2013). Availability of national or international
financing mechanisms, funding, support mechanisms and incentives are important in
actors’ decisions and behaviors in the market. Especially in agricultural value chains
including smallholder farmers, these financial instruments and mechanisms may be
crucial for their survival in global value chains. Besides, these smallholder producers
in agricultural value chains may be quite vulnerable in the face of risks and
uncontrollable variables (these can be natural disasters, climate change, etc.) directly
55
affecting production activities and output. In these circumstances, their risk-coping
capacities and resilience levels play a significant role in maintaining their activities in
the value chains they are participating. Availability and accessibility of insurance
services help small producers to cope with such kind of contingencies.
Another important topic in this framework is the demand for value chain outputs, in
other words, “consumer side of a value chain” (FAO, 2013). Demand analysis
basically focuses on elements such as: “current and potential domestic and foreign
demand for the value chain outputs (including trends and/or forecasts), domestic
and/or international output prices and price trends, socio-economic features of current
and potential customers, including spending capacities, current and potential foreign
competitors, specific features of products, including product diversification to target
different types of clients, current or potential substitutes that influence prices or
volume demanded, Other issues related to demand, such as dependency from
economic cycles or other determinants of demand” (FAO, 2013).
Analyzing market demand is quite important in several aspects. For example, demand
analysis in some products and services may underpin innovation and product
diversification to satisfy consumer preferences and may induce more profitable niche
markets (FAO, 2013).
Furthermore, increasing integration into global markets with rapid and easy transfer
of information -facilitated by developments in communication technologies-
consumers became much more concerned about production and process methods of
the products they buy. For example, quality standards, safety (pesticide use etc. in
agricultural products), environmental and socio-economic conditions (such as organic
or better agricultural practices, fair-trade etc.) (Ponte and Gibbon, 2005) to name a
few. An increasing tendency towards environmentally and socially responsible
products in terms of human rights, gender equality, child labor etc. issues;
environmentally sustainable use of natural resources in production (FAO, 2017);
56
emerging preferences for ethical and ecological food (FAO, 2017) cause restructuring
of value chains in accordance with the newly emerging consumer preferences.
2.3.4. Analyzing Socio-Economic Context
The socio-economic context in which a value chain develops has important
implications in terms of functioning and performance of the chain. FAO (2013) list of
the key elements in terms of socio-economic context that influence the value chain
and vice-versa:
- “Geo-strategic positioning of the country, including membership in
regional organizations etc.
- Macro-economic and social situation of the country(ies) in which the
value chain develops.
- Contribution of the value chain or the sector(s) to which it belongs to the
economy (output, value added, employment, balance of trade, competition
in use of natural resources and environmental issues, etc).
- Contribution of the value chain to the socio-economic situation, including
income, expenditure and other social wellbeing implications for various
social groups of interest to the value chain.
- Geographic location of the value chain and implications for territorial
set-up and development (rural-urban relationships, synergies with other
activities, role in local production systems etc.).
- Current policies and strategies affecting the value chain, including price,
factor and natural resource policies, specific incentives or disincentives
to producers and consumers, macro-economic policies affecting
exchange rates and interest rates, credit policies and international trade
policies”

57
FAO (2013).
2.3.5. Analyzing Institutional Set up
In promoting or developing value chains, formal and/or informal rules in which value
chain is performing and actors are interacting constitute another important aspect of
value chain analysis. Institutional set up analysis involve; functioning of vertical
linkages among the actors, trust and conflicts, synergies, role of public and private
sector, public policies, set of rules (self-imposing or by an authority) that enable value
chain functioning, role of the state and other institutions, regulatory and legal
environment (FAO, 2013). It is important to foster an institutional environment that
facilitates development of value chains and further encourage upgrading in value chain
activities (FAO, 2017). Institutions can promote GVC engagement for development
purposes, and enable this by “fostering skill building, innovation, and efficient access
to capital; by including deep provisions in agreements with key trade partners; by
supporting the engagement of more local firms and workers in the GVC network; and
by focusing on structural reforms that raise domestic labor productivity and skills”
(World Bank Group et al, 2017).
Value chain activities may require interactions in different levels of governments so
policies at different levels of governance should also be compatible (World Bank
Group et al, 2017). Also, especially in developed countries, predictability of policy
implementations impacts investment decisions of value chain participants (World
Bank Group et al, 2017). Prevalence of uncertainties (for example in trade policies)
and risks, and an unstable environment discourages value chains to thrive in that
regions and deter investors.

58
2.3.6. Governance
Governance is described by Gereffi et al. (2001) “as non-market coordination of
economic activity”; “the authority and power relationships that determine how
financial, material, and human resources are allocated and flow within a chain”
(Gereffi, 1999, as cited in Humphrey and Schmitz, 2002). Governance dynamics in a
global value chain basically can be understood as the “nature and basis of value
creation along each stage of the GVC” and one of the determinants of value adding
distributing processes (Gereffi et al, 2005; Parrilli et al, 2013).
In a broader explanation, Gibbon et al. (2008) articulates:
“The idea of GVC governance rests on the assumption that, while both
disintegration of production and its re-integration through inter-firm trade
have recognizable dynamics, they do not occur spontaneously, automatically,
or even systematically. Instead, these processes are initiated and
institutionalized in particular forms as a result of strategizing and decision-
making by particular actors, usually large firms that manage access to final
markets in developed-country (but also increasingly, emerging) markets.”
Several researchers attempted to provide a theoretical explanation to the governance
of global networks or chains. Humphrey and Schmitz (2002) articulate that production
and distribution systems, involving recurrent transactions among the parties, require
coordination which aims to minimize costs associated with production and
transactions. This coordination basically concerns: what is to be produced, how to
produce (technology, quality and other standards), how much and when to produce,
and then how to manage physical flow of the produced material (Humphrey &
Schmitz, 2002). They argue that this has been the interest of transaction cost
economics which assert ‘market’ and ‘hierarchy’ as the prominent coordination
systems when “coordination requirements between different points in the chain are
low, valuation of the product and monitoring of supplier performance is relatively
easy, and economies of scale are likely to be significant” thus, customers and
59
producers can maintain arm’s length market relations for the standard products. If
these conditions change, for instance in the situations where buyers demand more
customized products or detailed monitoring through the production process to
maintain specific standards; supplier and producer need to communicate more,
coordination of the production becomes more elaborated, economies of scale
decreases as the product becomes more customized, and valuing the product traded
becomes more complex. These circumstances rise transaction costs and direct firms
towards hierarchy or vertical integration for the organization of production
(Humphrey & Schmitz, 2002; Gereffi et al., 2005).
Approaches to governance in value chains literature distinguishes 3 groups which
consider governance as ‘driving’, ‘linking/coordination’ and ‘normalizing’ (Gibbon
et. al., 2008; Ponte and Sturgeon, 2014).
The first approach to global value chains governance, which is referred as ‘driving’,
is conceptualized by Gereffi and Kaplinsky according to the economic power
exercised by the lead firms and a ‘functional division of labor’ along the chains
(Gibbon and Ponte, 2008). The power of global buyers and brand-name companies in
organizing inter-firm relations in trade networks was previously emphasized by
Gereffi and others’ ‘global commodity chains’ (GCC) framework in 1990s and then
adopted in global value chain studies (Gereffi et al., 2005). Global ‘Buyers’ and
‘Producers’ constitute the two types of lead firms according to the Gereffi’s GCC
approach; where producer-driven refers mostly to the large multinational
manufacturers such as General Motors, IBM etc., while global buyers include big
retailers such as Walmart, Tesco, Carrefour, JC Penny etc. as well as highly successful
merchandisers such as Nike, Nestle, Kraft etc. (Ponte and Sturgeon, 2014). According
to Gereffi’s empirical findings, technology and capital intensity affect governance
characteristics in some ways:
“Because innovation in buyer-driven GCCs lies more in product design and
marketing than in manufacturing know-how, it is relatively easy for lead firms
60
to outsource the manufacturing of labour-intensive products. In the more
technology- and capital-intensive items made in producer-driven chains,
technology and production expertise are core competencies that need to be
developed and deployed in-house, or in closely affiliated ‘captive’ suppliers
that can be blocked from sharing them with competitors”. (Ponte and Sturgeon,
2014).
Global producers mostly have been the focus of attention in the literature due to these
multinational manufacturers’ methods to engage with global economy and sometimes
transferring capabilities to developing countries while global buyers have been
analyzed in terms of how they are able to successfully build, design and coordinate
their supply chains (through headquarters, ‘overseas buying offices’, or
intermediaries) comprising of a broad range of actors (Ponte and Sturgeon, 2014).
Especially, these global buyers’ explicit ability and power in coordinating
geographically dispersed and fragmented production and distribution networks -
which underpins their strong supply-base- introduced “buyer-driven global
commodity chains” (Gereffi 1994 as cited in Gereffi et al., 2005). In this approach,
lead firms use the power to oblige its immediate (first-tier) suppliers to adjust their
production activities so that the lead firms can focus on more profitable activities
(Gibbon and Ponte, 2008).
Gereffi and others reveal that even though global commodity chains framework
emphasized the ‘explicit coordination’ in spatially dispersed distinct value chains (as
opposed to vertical integration, this coordination is achieved without direct
ownership), global commodity chains approach failed to elaborate the forms of
networks and coordination. Moreover, Ponte and Sturgeon (2014) criticizes buyer-
and producer-driven approach to governance as being specific to a particular time
period and to particular industries; and highlight the need for a more dynamic and
61
updated approach that is compatible with changing technology, learning and new
norms and standards.
The second approach to governance, a more elaborated and updated one, of global
value chains was built around the idea of “different forms of coordination between the
buying and supplying firms” (Gibbon and Ponte, 2008). This approach considers
governance as ‘linking’ (Ponte and Sturgeon, 2014) or ‘coordinating’ (Gibbon et al.,
2008). In this approach, Sturgeon (2002) and Sturgeon and Lee (2001) as mentioned
in Gereffi et al. (2005), highlighted the role of supply relationships in network
coordination depending on the level of standardization in product and process. This
approach mainly implies that coordination between the buyers and suppliers is highly
affected by (i) the level of complexity of information and knowledge required to
maintain transactions, (ii) to what extend this information and knowledge can be
codified and efficiently transmitted between the parties, and (iii) the capability of the
suppliers (Gibbon and Ponte, 2008). According to them, three types of product and
suppliers -depending on the complexity level of information transmitted between
firms and how elaborated the production process- are: “(1) the ‘commodity supplier’
that provides standard products through arm’s length market relationships, (2) the
‘captive supplier’ that makes non-standard products using machinery dedicated to the
buyer’s needs, and (3) the ‘turn-key supplier’ that produces customized products for
buyers and uses flexible machinery to pool capacity for different customers” (Gereffi
et al., 2005).
Gereffi et al. (2005), by building on the approaches explained above, provided a more
comprehensive value chain governance model based on the characteristics of buyer-
supplier linkages and power relations. They identify five basic governance typologies:
1.Markets: Markets give buyers and suppliers quite much freedom to change
partners because cost of this switch is not high. It may comprise temporary
transactions as well as persistent ones such as spot markets.
62
2. Modular value chains: The degree of specification in the products produced
by the supplier is relatively higher than the ones in market networks.
Specifications that are undertaken by the supplier may include use of particular
technologies or use of generic machinery to ensure competencies requested by
the buyer.
3.Relational value chains: Important criteria in relational value chains are the
complexity of the relationship between the buyer and seller; and accordingly,
increased interdependence and specificity among the actors. Since dependence
is high in this type of relations, issues such as trust and reputation are quite
important -which may build upon family, ethnic ties. Spatial proximity may
play an important role in maintaining these type of value chains, but it is
possible to built trust and reputation among geographically dispersed nodes.
4.Captive value chains: In captive value chains, large buyers are clearly
dominant over small suppliers in terms of transactions, monitoring, control etc.
Small suppliers cannot easily switch the buyer due to high costs of doing so
and highly dependent on the lead firm which makes the relationship captive.
5. Hierarchy: It is also described as vertical integration. Managerial control
(between managers and subordinates; or headquarters and subsidiaries or
affiliates) exists in this type of networks.
After constructing these 5 governance typologies, Gereffi and others articulated the
conditions that form a basis for these coordination types to occur in value chains
(Gereffi et al., 2005). They argue that there are three circumstances value chain
governance depends on:
- The complexity of transactions: The degree of specification regarding product
and process defines the complexity level associated with information and
knowledge to maintain a transaction. Most of the time, the complexity in the
value chain is rise by the lead firms’ demands such as product differentiation
or just-in-time supply.
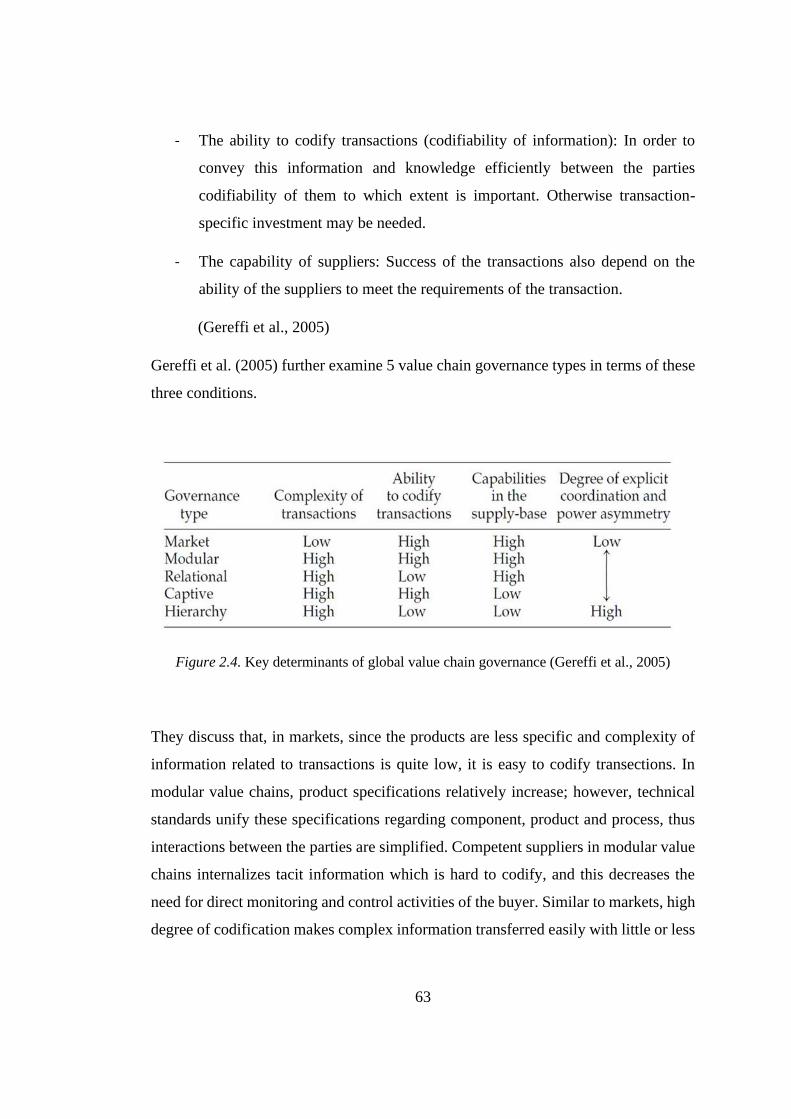
63
- The ability to codify transactions (codifiability of information): In order to
convey this information and knowledge efficiently between the parties
codifiability of them to which extent is important. Otherwise transaction-
specific investment may be needed.
- The capability of suppliers: Success of the transactions also depend on the
ability of the suppliers to meet the requirements of the transaction.
(Gereffi et al., 2005)
Gereffi et al. (2005) further examine 5 value chain governance types in terms of these
three conditions.
Figure 2.4. Key determinants of global value chain governance (Gereffi et al., 2005)
They discuss that, in markets, since the products are less specific and complexity of
information related to transactions is quite low, it is easy to codify transections. In
modular value chains, product specifications relatively increase; however, technical
standards unify these specifications regarding component, product and process, thus
interactions between the parties are simplified. Competent suppliers in modular value
chains internalizes tacit information which is hard to codify, and this decreases the
need for direct monitoring and control activities of the buyer. Similar to markets, high
degree of codification makes complex information transferred easily with little or less
64
need for coordination. In relational value chains, when transactions are more complex
and mutual relations depend on family or ethnic ties or social and spatial proximity
etc., codification of product specifications is difficult, and these chains require higher
levels of coordination. Complex tacit knowledge is most of the time transferred
through face-to-face interaction in this type of chains which also increases the
difficulty of codification and costs of changing partners for the buyer. Supplier
competencies are considered high in relational value chains. Conversely, in captive
value chains, supplier capabilities are low, but product specifications are quite
complex. These complex products and specifications need a considerable control and
intervention of the lead firm, and as a result, lead firm wants to lock-in suppliers in
order to protect its benefits from being exploited by other firms. Also, the suppliers
are often engage with a single activity, such as only basic assembly etc., and mostly
dependent on the lead firm for more complex activities such as design, logistics,
technology upgrading and so on which imposes significant costs for the suppliers for
switching partners and the relationship becomes captive. Lastly, in hierarchy,
codification of the product specifications is not possible, products are complex, and
there are not competent suppliers available; thus, the lead firms have to include several
activities inside its body. This governance type usually associated with high levels of
tacit knowledge transfer among the activities of value chain and the excessive need to
control over resources, inputs, and outputs etc.
The power asymmetry between the lead firm and supplier increases as going from
market to hierarchy as well as explicit coordination of the value chain by the lead firm
(for example standards regarding quality, production process, component, delivery,
material sources etc.) (Ponte and Sturgeon, 2014). Similarly, sensitivity to spatial
proximity varies depending on the form, the importance of co-location rises in
relational value chains where exchange of tacit knowledge is crucial, while it is
relatively less important in markets where arm’s-length relationship markets enable
simple transparent transactions, and price based information exchange (Ponte and
Sturgeon, 2014).
65
Another approach which regards governance as ‘normalizing’ – the term normalizing
here is refer to “re-aligning a given practice so that it mirrors or materializes a standard
or norm” rather than normalizing as “making things normal” (Gibbon et al., 2008).
This approach criticizes Gereffi’s framework as implying “…the discursive dimension
of the framing of buyer-supplier relations, based on a constructivist approach to the
knowledge content of transactions and the capacities of suppliers” (Gibbon et al.,
2008). Governance as normalizing approach is developed based upon convention
theory of Boltanski and Thévenot (1991, as cited in Ponte and Sturgeon, 2014; Gibbon
et al., 2008) who contends that economic activities between different people, firms or
objects is generally established on the basis of a judgement (or systems of justification)
based upon a ‘higher principle’; and identified six ideal-type ‘orders of worth’ that
used as justificatory devices in people and firm interactions, economic practices, and
in firm organizations (Ponte and Sturgeon, 2014). Conventions, as indicated by
Gibbon et al. (2008), are “sets of mutual expectations that include – but are not limited
to – institutions” and institutions are the “collective and intentional objects that draw
on a variety of criteria of justice or ‘worth’ in order to lend normative sense to
decisions and actions occurring in relation to management, production and
consumption” (Gibbon et al., 2008).
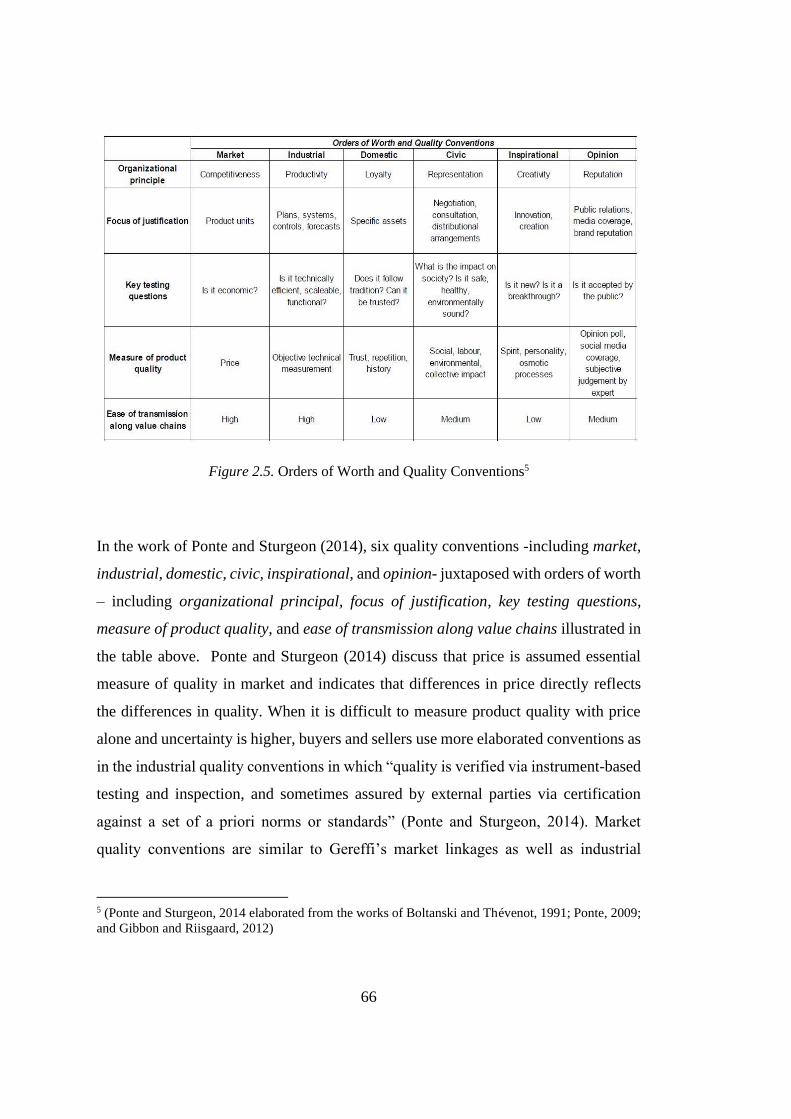
66
Figure 2.5. Orders of Worth and Quality Conventions5
In the work of Ponte and Sturgeon (2014), six quality conventions -including market,
industrial, domestic, civic, inspirational, and opinion- juxtaposed with orders of worth
– including organizational principal, focus of justification, key testing questions,
measure of product quality, and ease of transmission along value chains illustrated in
the table above. Ponte and Sturgeon (2014) discuss that price is assumed essential
measure of quality in market and indicates that differences in price directly reflects
the differences in quality. When it is difficult to measure product quality with price
alone and uncertainty is higher, buyers and sellers use more elaborated conventions as
in the industrial quality conventions in which “quality is verified via instrument-based
testing and inspection, and sometimes assured by external parties via certification
against a set of a priori norms or standards” (Ponte and Sturgeon, 2014). Market
quality conventions are similar to Gereffi’s market linkages as well as industrial
5 (Ponte and Sturgeon, 2014 elaborated from the works of Boltanski and Thévenot, 1991; Ponte, 2009;
and Gibbon and Riisgaard, 2012)
67
quality conventions to modular GVC linkages, and domestic quality conventions to
relational and captive GVC linkages (Ponte and Sturgeon, 2014).
Recently, Ponte and Sturgeon (2014) contributed to governance studies by developing
a broader approach using ‘modular theory-building’ technique which aims to link
compatible arguments and insights of different literatures and/or disciplinary fields in
an attempt to provide explanation for highly complex, dynamic and variant issues. In
line with this porpuse, they accommodate previous studies on GVC governance -to
which they previously have contributed: theory of linking (Gereffi et al., 2005) and
theory of conventions (Ponte and Gibbon, 2005); and elaborate and link those previous
theoretical studies in order to provide a broader framework. In their model, Ponte and
Sturgeon (2014) build a three-scalar GVC governace framework consisting of: micro,
meso and macro levels.
- Micro level: The purpose in this level is exploring exchange characteristics of
individual value chain nodes in terms of different linkage mechanisms and
conventions summarized above. They offer two modules as: Module 1
including five GVC linkage mechanisms developed in Gereffi et al (2005) and
Module 2 listing typology of conventions. The authors emphasize that: “these
modules can be applied, sequentially or in combination, to an overall
framework (middle box) that represents a simplified succession of stylized
value chain nodes (represented by circles) where exchange takes place – either
internally in a firm or externally between independent firms.”
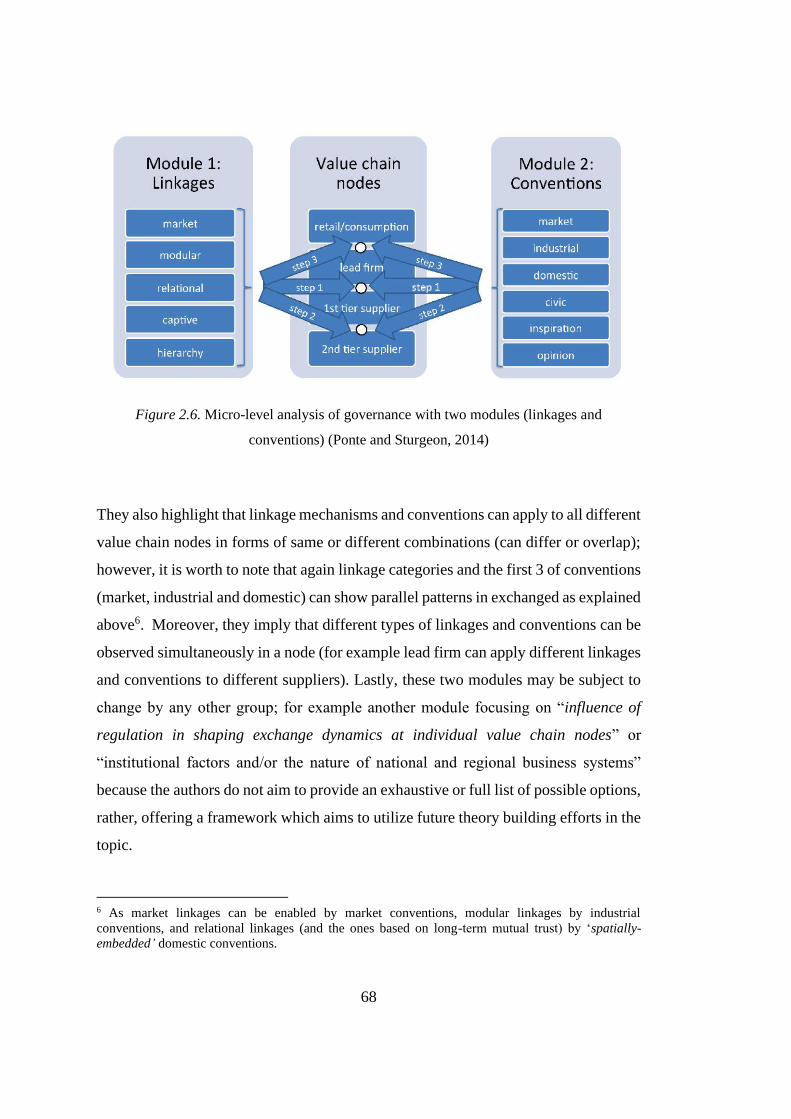
68
Figure 2.6. Micro-level analysis of governance with two modules (linkages and
conventions) (Ponte and Sturgeon, 2014)
They also highlight that linkage mechanisms and conventions can apply to all different
value chain nodes in forms of same or different combinations (can differ or overlap);
however, it is worth to note that again linkage categories and the first 3 of conventions
(market, industrial and domestic) can show parallel patterns in exchanged as explained
above6. Moreover, they imply that different types of linkages and conventions can be
observed simultaneously in a node (for example lead firm can apply different linkages
and conventions to different suppliers). Lastly, these two modules may be subject to
change by any other group; for example another module focusing on “influence of
regulation in shaping exchange dynamics at individual value chain nodes” or
“institutional factors and/or the nature of national and regional business systems”
because the authors do not aim to provide an exhaustive or full list of possible options,
rather, offering a framework which aims to utilize future theory building efforts in the
topic.
6 As market linkages can be enabled by market conventions, modular linkages by industrial
conventions, and relational linkages (and the ones based on long-term mutual trust) by ‘spatially-
embedded’ domestic conventions.
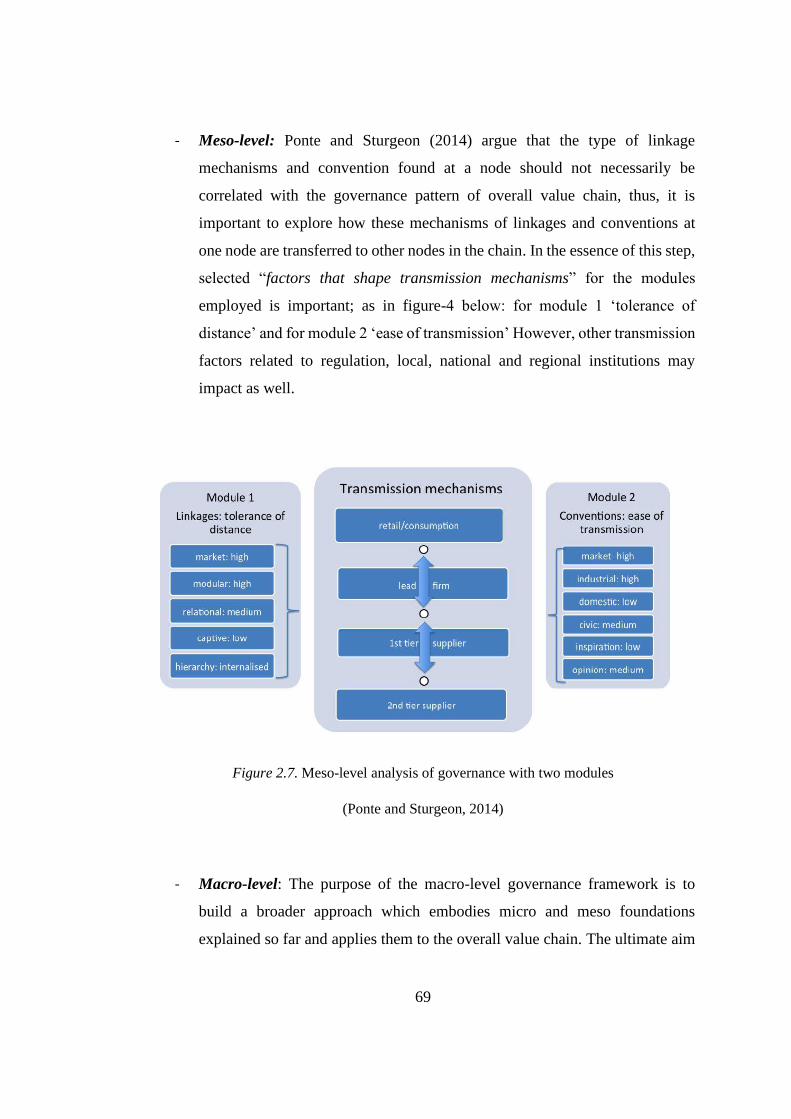
69
- Meso-level: Ponte and Sturgeon (2014) argue that the type of linkage
mechanisms and convention found at a node should not necessarily be
correlated with the governance pattern of overall value chain, thus, it is
important to explore how these mechanisms of linkages and conventions at
one node are transferred to other nodes in the chain. In the essence of this step,
selected “factors that shape transmission mechanisms” for the modules
employed is important; as in figure-4 below: for module 1 ‘tolerance of
distance’ and for module 2 ‘ease of transmission’ However, other transmission
factors related to regulation, local, national and regional institutions may
impact as well.
Figure 2.7. Meso-level analysis of governance with two modules
(Ponte and Sturgeon, 2014)
- Macro-level: The purpose of the macro-level governance framework is to
build a broader approach which embodies micro and meso foundations
explained so far and applies them to the overall value chain. The ultimate aim
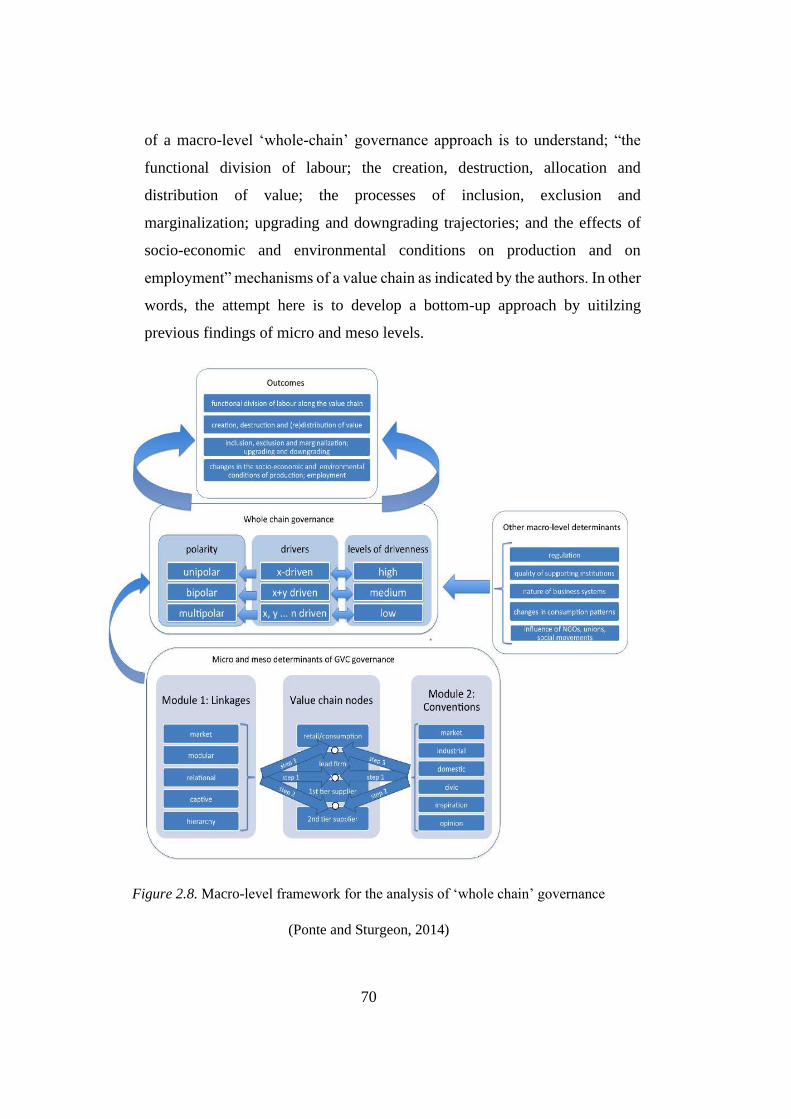
70
of a macro-level ‘whole-chain’ governance approach is to understand; “the
functional division of labour; the creation, destruction, allocation and
distribution of value; the processes of inclusion, exclusion and
marginalization; upgrading and downgrading trajectories; and the effects of
socio-economic and environmental conditions on production and on
employment” mechanisms of a value chain as indicated by the authors. In other
words, the attempt here is to develop a bottom-up approach by uitilzing
previous findings of micro and meso levels.
Figure 2.8. Macro-level framework for the analysis of ‘whole chain’ governance
(Ponte and Sturgeon, 2014)
71
Besides, the authors aim to provide an overall value chain governance approach from
the perspective of ‘polarity’. They consider previous studies on governance usually
focused on ‘unipolar’ value chains such as ‘buyer-driven’, ‘producer-driven’ etc.
where the power of a ‘lead-firm’ is explicit in coordinating and impacting relations
between the value chain nodes and actors. Ponte and Sturgeon in this study (2014)
rather focus on ‘multipolar’ chains which are governed by powerful actors, they may
have different kinds of linkages and multiple power focuses though. This is especially
important in terms of the relationship of macro level governance with micro and meso
levels since overall chain governance is highly related with the dominant linkage
mechanisms and conventions that are adopted in the key node between the lead firm
and first-tier suppliers. Also, recent studies have shown that value chain governance
mechanisms can transform from unipolar to multipolar due to increased influence of
some groups of powerful actors, environmental groups and standard makers or social
NGOs (work of Ponte (2013) about governance of biofuel value chain as indicated in
Ponte and Sturgeon, 2014). The authors argue that the ‘plurality of drivers’ also
critical in terms of acknowledging the increasing influence of other powerful actors
(in addition to firms) such as “standard setting bodies, international NGOs, social
movements, certification agencies, labor unions, and consumer associations” in
governance of global value chains.
2.3.7. Upgrading
Upgrading activities are directly related to enhancing the position of a target group in
the chain by enabling them to develop necessary “technological, institutional and
market capabilities” in order to improve their competitiveness and gain higher values
from a value chain (Mitchell, Keane and Coles, 2009). In other words, it is a process
of advancing “value creation” through a set of strategies; however, what we mean by
‘value’ does not necessarily has to refer solely economic value. Building knowledge
72
and enhancing local capabilities, diminishing environmental detriments associated
with value chain activities, or improving working conditions, for instance, may also
be considered value creation or acceleration.
It is already discussed that in the context of shifting dynamics of global trade and
economy in the 21st century, competitiveness has become even more crucial for
maintaining sustainable returns and revenues especially for developing countries.
According to Humphrey & Schmitz (2002)’s analysis on the literature on
competitiveness, it is revealed that upgrading is one of the most favorable strategies
to increase competitiveness of actors in value chains (Humphrey & Schmitz, 2002).
Also, upgrading strategies are often used by the developing countries as a means of
coping with the challenges imposed by globalization (Ponte and Ewert, 2009).
Besides, being able to respond recently changing consumer preferences and market
demands -such as punctuality in delivery, environmentally conscious production
practices, special packing materials, commodities free-from child labor or labor
exploitation, gender equality in labor- is also another factor that have an important
impact on competitiveness and entails producers for upgrading their products or
production operations. Such kind of improvements directly affect the position of
producers and firms in the value chain and offer them better deals, better bargaining
positions, or enable them to access completely different and more prosperous end-
markets.
Ponte and Ewert (2009) argues that two main directions exist in the literature regarding
the ultimate target that is desired to be achieved through upgrading in value chains.
First approach focuses on identifying the “sources of capabilities” which enables
actors to connect with new markets and enhance their competitiveness; however, there
is a conflict among the researchers regarding how that is achieved through: one group
advocates “locational and institutional knowledge transmission” while others promote
“transmission via buyer-supplier relations” (Ponte and Ewert, 2009). Second approach
carries a more development focus and tends to analyze “what conditions and
73
trajectories can lead to ‘a better deal’” for the target group in a value chain (Ponte and
Ewert, 2009).
In the literature, traditional upgrading strategies for firms are characterized in four
groups as “process improvements”, “product improvements”, functional
improvements” (or “changing the mix of activities”) and “moving to a new value
chain” (Kaplinsky and Morris, 2000; Humphrey & Schmitz, 2002):
2.3.7.1. Product Upgrading
Product upgrading basically means improving the quality of the product (Mitchell,
Keane and Coles, 2009) and producing higher-value added, more sophisticated
products entailing “increased unit values” (Humphrey and Schmitz, 2002) which
result in higher gains. Product upgrading can be achieved both in the forms of
designing or producing a completely new product or making improvements to existing
products (Kaplinsky and Morris, 2000).
Improving the quality of produce provide a better bargaining opportunity to the
producers in the market or they can even shift to another more profitable markets due
to the new higher-value and more sophisticated product.
2.3.7.2. Process Upgrading
The main focus of the process upgrading in value chains is the improving efficiency.
Efficiency can be promoted through various ways; most prevalent ones include
lowering the cost of production per unit of output or increasing the output gained per
unit of input used in the production (Mitchell, Keane and Coles, 2009). Thus, process
upgrading for efficiency improvements may require a “reorganization of activities”
involved in production (Ponte and Ewert, 2009) or “introducing superior technology”
(Humphrey & Schmitz, 2002) preventing value-loss due to inefficient practices or
74
technologies. Process upgrading can be achieved both in an individual stage of the
chain or inter-chain activities (Kaplinsky and Morris, 2001).
Schmitz (2006) argues that when working with global buyers, local producers get the
opportunity to learn a great deal from them about improvements of production
operations, achieve consistency and high quality, and punctuality in their responses to
customer.
2.3.7.3. Functional Upgrading
Functional upgrading refers to changing the composition or mix of activities carried
out in a value chain by adding new functions (upgrading) or eliminating some of the
existing ones (downgrading) (Mitchell, Keane and Coles, 2009). Firms can
incorporate, for example outsource activities such as logistics, accounting (Kaplinsky
and Morris, 2001). Acquiring new functions may also be regarded as “increasing the
skill content of activities” (Ponte and Ewert, 2009) because moving to higher value
parts of a chain mostly requires a greater degree of skills (World Bank Group et al,
2017).
2.3.7.4. Chain Upgrading / Inter-sectoral Upgrading
Inter-sectoral upgrading happens when a firm or producer transfers into a completely
new value chain (Kaplinsky and Morris, 2001) or to a different sector which is also
compatible with its already accumulated knowledge (Ponte and Ewert, 2009). As
Kaplinsky and Morris (2000) explains, “it may involve changes in the nature and mix
of activities, both within each link in the chain, and in the distribution of intra-chain
activities” The skills and capabilities of the producer should be qualified with the new
sector’s or chain’s demands. For example, television producers may have sufficient
and appropriate knowledge for making monitors or other computer parts when they
are transferred between those production activities (Humphrey & Schmitz, 2002).
75
Inter-chain upgrading may involve significant barriers to entry due to attempts to
access more profitable activities or chains, thus chain upgrading is more prone to
exclude less-advantaged participants (Ashraf et al. 2008 as cited in Mitchell, Keane
and Coles, 2009). However, there are other studies found “no significant relationship
between individuals‟ pre-existing wealth characteristics and their likelihood of
participation” (based on the work of McCulloch and Ota, 2002 as cited in Mitchell,
Keane and Coles, 2009).
All these strategies for sure depend on the availability of opportunities, local
trajectories and chain-specific conditions since each value chain has its own unique
dynamics. The literature on upgrading indicates that, generally, these upgrading
methods occurs in sequence of first process upgrading, followed by product and
functional upgrading, and finally chain upgrading (Kaplinsky and Morris, 2000). This
upgrading trajectory and 4-stage categorization is, in fact, build upon the
industrialization experience of East Asian countries as explained by Kaplinsky and
Morris (2000);
“This accords with the common assertion that East Asian firms have made the
transition from OEA production (original equipment assembling, that is, thin
value added assembling under contract to a global buyer) to OEM (original
equipment manufacturing manufacturer, that is manufacturing a product
which will bear the buyer’s badge), to ODM (own design manufacturer) to
OBM (own brand manufacturing)” (Kaplinsky and Morris, 2000).
However, this 4-stage upgrading is found limited and quite specific to explaining the
upgrading trajectories of only some particular industries. Mitchell, Keane and Coles
(2009), for instance, indicates that;
“This categorization, based on the historical experience of the newly
industrialized countries of East Asia, may still be relevant for manufacturing
firms seeking global markets, but it needs adjustment if it is to be relevant to
76
the pressing task of upgrading some of the poorest and most disadvantaged,
including agricultural producers and exporters, into viable value chains”
(Mitchell, Keane and Coles, 2009).
It is a fact that each sector or industry have its own dynamics that may require different
approaches for improvements. Similar to the differences between sectors and
industries, challenges and availability of opportunities for upgrading in developing
regions may be quite different from the experience of developed world. In terms of
challenges; “lack of an enabling environment offering institutional and infrastructural
support, availability of resources and efficient and effective coordination” are some of
the limitations developing regions experience (Trienekens, 2011). As Trienekens
(2011) further explains, in such developing regions especially “…small-scale
producers are at a disadvantage because they have little capital to invest, prone to use
traditional techniques, depend on family labor and lack contact with (international)
market players (De Janvry and Sadoulet 2005; Daviron and Gibbon 2002; Reardon
and Barret 2000)”. As a result, upgrading strategies should be relevant to the local
settings and circumstances. For these reasons, the literature indicates that there may
be different approaches to upgrading -apart from the traditional four categories stated
above- to be able to respond local needs properly. For instance, Mitchell, Keane and
Coles (2009) argues that especially in rural regions of developing countries, horizontal
coordination, as an upgrading strategy, may be a prerequisite, at least in order to
generate sufficient amounts of produce to take the attention of markets or for access
to technical support and even for access to inputs (Mitchell, Keane and Coles, 2009).
Ponte and Ewert (2009) also draw attention to some of the limitations of these 4
categories of classification for upgrading strategies. They underline, sometimes it may
be a little ambiguous to differentiate product and process upgrading in agro-food
industries for new categories such as “organic” or “sustainable” products which fall
into both process and product upgrading. Similarly, they argue that process upgrading
put too much emphasizes on efficiency issues improved by innovation and technology,
however, disregards the improvement activities carried out to respond customer and

77
market preferences, or comply with standards and regulations (for instance EU
regulations, food-safety standards, environmental regulations, ISO certifications etc.)
(Ponte and Ewert, 2009). Even though these practices do not bring more efficiency or
higher value to the firms or producers all the time, sometimes they are considered as
requirements for the entry to the market which is notably more prevalent in buyer-
driven value chains (Ponte and Ewert, 2009).
Based on these criticisms and limitations of traditional 4-category upgrading
classification, Mitchell, Keane and Coles (2009) introduces additional upgrading
strategies below which can also be relevant to the trajectories of rural regions of
developing countries that are mostly involved in agricultural production and basic
craft goods:
2.3.7.5. Horizontal Coordination
Horizontal coordination is based on the collective practices of a group of producers or
firms at the same level (intra-nodal, within a stage of value chain). Forming a group
provides actors with several benefits especially when actors have limited capacity and
power when they act individually.
As Mitchell, Keane and Coles (2009) states;
“The purpose of all horizontal institutions is to develop economies of scale,
increasing functional efficiency and reducing transaction costs. It is often the
first step in a sequence of interventions that ultimately facilitate market access,
often as a prerequisite for other forms of upgrading, particularly vertical
coordination and functional upgrading.”
For example, it can be widely used in accessing expensive inputs, assets, resources or
infrastructure when they are not affordable or feasible to obtain individually. Also, it
is critically important from the perspective of traders or buyers in terms of guarantee
of sufficient amounts of supply -especially in agricultural areas consisting of small

78
producers. It would be fair to say that collectivism can be considered as a precursor
for participating in greater regional value chains or global markets. Besides, ones
smallholders access to the global markets and value chains, horizontal coordination
and collectivity increase “bargaining power resulting in better negotiation outcomes
such as higher prices or more favorable terms of business; … makes individuals more
creditworthy which enhances financial stability, in turn enabling investment and
smoothing cash flow; enable access to information, training and technical services”
(Mitchell, Keane and Coles, 2009).
2.3.7.6. Vertical Coordination
Vertical coordination in value chains is quite related to the concept of governance. It
highlights the importance of building trust-based longer-term relationships among the
inter-nodal actors of a value chain (e.g. between producer-processor) based on the
‘win-win’ benefits of interacting agents (Mitchell, Keane and Coles, 2009). A
contractor in a vertical coordination enjoys “a stable, assured market, with guaranteed
prices that usually at least match the market going rate and, as an incentive for longer-
term commitment, often exceed it… embedded services such as discounted bulk input
supply (reducing the risk of high-cost inputs), access to credit (cash or in kind),
technical support and supply of capital equipment.” (Mitchell, Keane and Coles,
2009). On the other hand, contracting firm benefits from guarantee of supply at quality
and quantity demanded and risk minimization depending on this (Mitchell, Keane and
Coles, 2009).
2.3.7.7. The Enabling Environment
The enabling environment in which value chain operates has a large impact on the
overall competitiveness, efficiency and success of the chain. In addition to the
upgrading strategies articulated above (product, process, functional, inter chain),
79
advancement in ‘support services’, institutional setting, ‘legal and policy frameworks’
play an important role in the achieving targeted upgrading strategies (Mitchell, Keane
and Coles, 2009). For example, when there is high confidence in institutions; and
business friendly and stable policies, that enable more complete contracts and reduces
the administrative burden especially in high-income targeting countries. (World Bank
Group et al, 2017).
2.3.7.8. The Relationship of Upgrading with Governance
Humphrey and Schmitz (2002) argue that governance type of a chain also has
significant impact on upgrading strategies. In the quasi hierarchy chains, they
indicate, upgrading possibilities of the local producers is highly dependent on the
opportunities opened up to them by the lead firms (Humphrey and Schmitz, 2002).
For example, they discuss that global buyers in labor-intensive sectors (such as
garments) tend to search for new suppliers from developing countries in an attempt to
reduce costs. When developing country firms supply global buyers, the product
demanded from the global buyer differ from the product they used to produce for their
local market (in terms of product and process standards, design, quality etc.). In such
situations, global buyer supports local producers of developing countries to upgrade
and enhance their capabilities so that they can meet the requirements of export market
(Humphrey and Schmitz, 2002).
Depending on his research on garment chain, Gereffi (as cited in Humphrey and
Schmitz, 2002) found that upgrading of local producers working with global buyers
in the value chain can take place in forms of “learning by exporting” and
“organizational succession.” Producers in buyer-driven ‘captive’ value chains have
good prospects for product and process upgrading (and further upgrading to design,
marketing and branding) (Schmitz 2006, based on the work of Gereffi, 1999). He
exemplifies this with how Asian garment producers are upgraded from “(1) assembly
of imported inputs; to (2) increased local production and sourcing; to (3) the design of
80
products sold under the brands of other firms; and finally to (4) the sale of own branded
merchandise in internal and external markets” (Gereffi, 1999, as cited in Humphrey
and Schmitz, 2002). Schmitz (2006) emphasizes that foreign buyers are crucial for
local producers’ access to distant markets and knowledge.
However, there are other researchers who find this example too optimistic and indicate
that even if increasing production to some degree can be possible for local producers
engaged in global value chains, transferring into design and branding stages would not
be that easy. Moreover, global buyers can discourage or even prevent local producers
from jumping into design, marketing or branding tasks (Schmitz and Knorringa, 2000
as cited in Humphrey and Schmitz, 2002). As a result, even though global buyers
enhance local producer’s knowledge and learning to some extend regarding “to
improve their production processes, attain consistent and high quality, and increase
the speed of response”, global buyers’ asymmetric power and competence is obvious
and they do not let other parties threat their core competences (Humphrey and
Schmitz, 2002; Schmitz 2006).
81
CHAPTER 3
3. A BRIEF OVERVIEW: NEED FOR UPGRADING IN COTTON PRODUCTION
A series of challenges cotton production has been experiencing globally for years
underpin the changes in market preferences for cotton and its products. Its negative
environmental impacts are considered among the most drastic ones due to the
unsustainable production practices. Cotton is a crop that requires relatively higher
amounts of water -the greatest consumer of water among the agricultural commodities
according to some researchers (URL 2). Flood-or-furrow is the most prevalent
irrigation system used in cotton cultivation due to its easy installation and cheap price;
however, it is also the most inefficient irrigation system (Kooistra and Termorshuizen,
2006). In addition to this, intensive use of pesticides and chemical fertilizers in
growing cotton causes degradation of soil, contamination of water resources, damage
in natural ecosystems and biodiversity, and threat for public health (URL 2). Besides,
cotton production usually requires crop rotation in order to sustain a balanced nutrient
and mineral context of soil; however, rotation is mostly not followed by the farmers
due to the higher economical returns of cotton compared with its rotation subsidiaries.
Another controversial issue about the cotton production is food security. The global
population is now around 7.5 billion people and it is estimated to increase around 9.7
billion people by 2050 (URL 3). According to the FAO (2017), this almost 10 billion
population by 2050, with changing consumption patterns and preferences in their
dietary habits, will cause an approximate 50% greater pressure on demand for
agricultural products even in a modest economic development scenario (FAO, 2017).
Besides, world rural-urban population composition is expected to change from
roughly 45% rural and 55% urban now, to 40% rural and 60% urban by 2050 (URL
3). When coupled with global excessive urbanization trends, it means that we will
have less people, smaller land, and more limited resources to feed a greater population
82
-which also indicates an increasing pressure on natural resources. Such a pessimistic
scenario will probably aggravate the discussions regarding the competition of food
crops with non-coop crops. In this respect, cotton may be one of the crops whose
production may be restricted in order to give priority to food crops and others that
have less detrimental production processes for the environment and natural resources.
Other criticisms target social issues associated with cotton production, namely,
exploitation of labor, unequal working conditions for women, and child labor. From
agricultural production to industrial processing, almost every stage of cotton value
chain has a bad reputation about prevalence of child labor and poor working conditions
for workers in many parts of the world. International Trade Center’s report ‘Women
in Cotton’ (2011) illustrated that women participate in various activities along the
cotton value chain. The same study showed that although women’s participation is
mostly in similar type of tasks along the cotton value chain such as cotton picking,
catering, planting etc. across the cotton producing countries, there are high disparities
across countries for women’s earnings. However, the general finding is that women
are paid less than men workers (ITC, 2011). Child labor is also quite prevalent across
the countries participating in cotton value chain, especially in developing countries.
International Labor Organization’s report (2016) on child labor in cotton reveals that
factors contributing to child labor can be considered as supply side factors such as
poverty, social norms, migration, barriers to education, and weak legislative
environment; and demand side factors including cheap and compliant labor, technical
requirements (children’s small hands are found better for some tasks in cultivation).
Another study regarding child labor in cotton supply chain in Turkey found children
as young as eight years old working in cotton harvesting in Şanlıurfa. These children
included children of the relatives or owners of the field, children of Turkish migrant
families, children of tenant farmers, as well as Syrian refugee families’ children (Fair
Labor Association, 2017).
Given the cotton’s excessive environmental externalities, its being an industrial crop
competing with food-crops, and social issues associated with its production -coupled
83
with its high prevalence among the agricultural commodities grown all around the
world-, it seems that existing cotton production practices need an urgent need to
change in order to sustain. Recently, changing market demand and customer’s
sensitivity to production processes of commodities they consume require cotton
production to become more environmentally sensitive. Organic cotton and better
cotton come into prominence at this point as a response to the modern age concerns
associated with cotton cultivation.
3.1. Organic Cotton
3.1.1. Organic Cotton in the World
Organic production concept is developed based on the idea of adopting
environmentally-friendly agricultural practices and production technologies which
promote efficient use of natural resources and diminishing ecological footprint of
agricultural production. Some potential benefits of the organic production are listed
as; “(i) A greater yield stability, especially in risk-prone tropical ecosystems, (ii)
higher yields and incomes in traditional farming systems, once they are improved and
the adapted technologies are introduced, (iii) an improved soil fertility and long-term
sustainability of farming systems, (iv) a reduced dependence of farmers on external
inputs,(v) the restoration of degraded or abandoned land, (vi) the access to attractive
markets through certified products, and (vii) new partnerships within the whole value
chain, as well as a strengthened self-confidence and autonomy of farmers” (Forster et
al., 2013).
There are worldwide acknowledged problems associated with conventional cotton
production which can be summarized as excessive consumption of natural resources,
over and uncontrolled use of harmful chemicals, poor working conditions, gender
issues and existence of child labor, unfair distribution of income along the cotton value
chain etc. (GAP & UNDP, 2014). Organic cotton initiatives around the world attempts
to overcome these drawbacks as much as possible with appropriate practices. In light
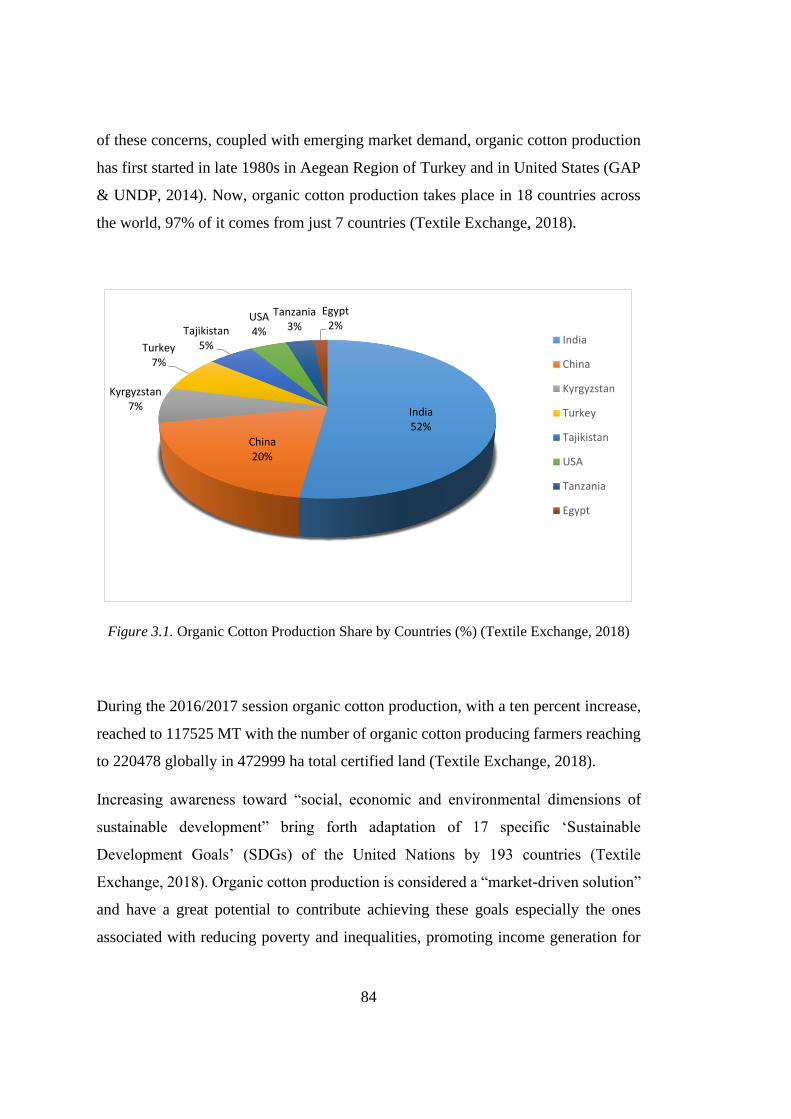
84
of these concerns, coupled with emerging market demand, organic cotton production
has first started in late 1980s in Aegean Region of Turkey and in United States (GAP
& UNDP, 2014). Now, organic cotton production takes place in 18 countries across
the world, 97% of it comes from just 7 countries (Textile Exchange, 2018).
Figure 3.1. Organic Cotton Production Share by Countries (%) (Textile Exchange, 2018)
During the 2016/2017 session organic cotton production, with a ten percent increase,
reached to 117525 MT with the number of organic cotton producing farmers reaching
to 220478 globally in 472999 ha total certified land (Textile Exchange, 2018).
Increasing awareness toward “social, economic and environmental dimensions of
sustainable development” bring forth adaptation of 17 specific ‘Sustainable
Development Goals’ (SDGs) of the United Nations by 193 countries (Textile
Exchange, 2018). Organic cotton production is considered a “market-driven solution”
and have a great potential to contribute achieving these goals especially the ones
associated with reducing poverty and inequalities, promoting income generation for
India52%
China20%
Kyrgyzstan7%
Turkey7%
Tajikistan5%
USA4%
Tanzania3%
Egypt2%
India
China
Kyrgyzstan
Turkey
Tajikistan
USA
Tanzania
Egypt
85
local producers, creating more resilient communities and sustainable use of natural
resources and environment (URL 4, URL 5, Textile Exchange, 2018).
In addition to social and environmental necessities, there is a growing market demand
for organic cotton and textile products. The demand, in fact, originates from the
changing final consumer demand in the new era who shows increased sensitivity
toward environmental externalities of products they consume, fair treatment of labor,
and enhanced justice in distributional issues. All these factors require improved
traceability through supply chains of commodities. Depending on these market
tendencies, several brand-name global textiles companies and retailers make
commitments to update their supply chains in order to increase their use of organic
cotton.
Recently increasing initiatives such as Sustainable Cotton of Bayer E3 Program,
Better Cotton Initiatives, Cotton Made in Africa, Real Connect Initiative of Cotton
Connect and Fair Trade are emerged to provide market with more sustainable forms
of cotton (GAP & UNDP, 2014). From production to processing, supplying organic
cotton and its products all through the chain has become an indicator of
competitiveness (GAP & UNDP, 2014). As a result, brand-name companies look for
regions from which they can procure organic cotton and make innovative investments
to upgrade those chains in an attempt to secure their supply in long-term (GAP &
UNDP, 2014; Textile Exchange, 2018). Superdry for example, a British clothing
brand, declared that it will be supporting farmers and suppliers in producing organic
cotton to achieve its goal of using 100% organic cotton by 2040; Skunkfunk, Stella
McCartney, and EILEEN FISHER announce their commitment to transfer 100% of
their cotton supply to organic by 2020; Mantis World by 2021 (Textile Exchange,
2018). There is also ‘2025 Sustainable Cotton Challenge’ signed up by 38 clothing
and textile companies, including the worldwide renowned ones, committed to ensure
that 100% of their cotton will be coming from sustainable resources by 2025 (Textile
Exchange, 2018). The global stakeholders and key international organizations
working on organic cotton are basically focused on activities of: supply chain
86
intervention (setting standards, market making), field-level interventions (field data &
analytics, seed breeding, field capacity building and training, cotton cultivation and
processing), informing and convening (education & awareness raising, market
research & analytics, creating multi-stakeholder platforms) (Textile Exchange, 2018).
As indicated by the Textile Exchange (2018), there is not a worldwide accepted
definition or methodology for determining pricing of organic cotton seed and fibre;
however, the mechanism works as first taking a ‘reference price’ which is usually the
price of conventional cotton quoted in that specific region or in the international
commodity market at a given time; then adding a percentage increase for the value
adding of being organic; and adding possible compensation for yield loss. ‘Price
premium’ refers to this differential in price (on average between 5-20 percent) agreed
on between the buyer and seller and highly affected by the conventional commodity
market prices (Textile Exchange, 2018). Price premium (differential) should cover:
“production cost, International Control System (ICS) certification and inspections,
training and extension services, investment in farming operations, to some part of
collective needs of the community such as schooling, health care, and housing,
research, development and investment in seed and farm innovations” (Textile
Exchange, 2018). Besides, according to the Textile Exchange (2018) price differential
of the cotton seed or lint (ginned fibre) is determined by the factors of:
- “Market conditions and price elasticity, and market variances (in the
supply and demand cycle)
- Quality and staple length,
- Country of origin,
- Amount of trash or contamination,
- Trade agreements between producers and buyers,
- Fairtrade certification on top of organic certification”
87
(Textile Exchange, 2018).
Organic cotton seed and lint prices differ around the world. According to the Textile
Exchange’s 2018 Organic Cotton Report Turkish organic cotton prices range between
1.90 and 2.32 USD/kg, quality and staple length are the main determinants of the price
difference. The same report indicates that the price of Turkish organic fibre is 10%
higher on average than conventional cotton prices on the İzmir Commodity Exchange.
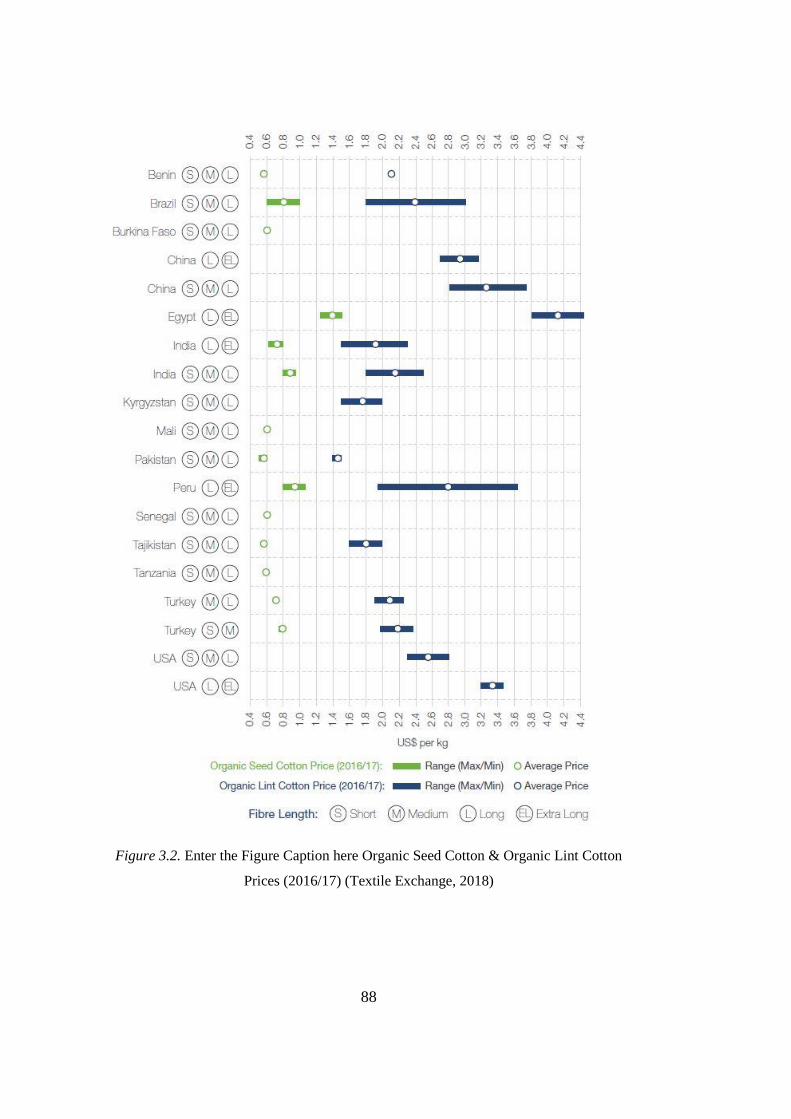
88
Figure 3.2. Enter the Figure Caption here Organic Seed Cotton & Organic Lint Cotton
Prices (2016/17) (Textile Exchange, 2018)
89
3.1.2. Organic Cotton in Turkey
According to the data of Textile Exchange (2018), Turkey accounts for 6,6% of global
organic cotton production with 7741 MT organic cotton fibre in 2016/2017 session
(with and average yearly increase of 2,2%) corresponding to 1,1% of national cotton
fibre production. Organic certified land in Turkey is 3.863 hectares (Textile Exchange,
2018).
Organic cotton production in Turkey started in 1998 in line with global demand for
organic cotton and its products (Özüdoğru, 2017). Production of organic cotton rise
from 2500 tons produced in 806 ha land by only 59 farmers to 19000 tons cultivated
in 3863 ha area by 196 certified producers (Özüdoğru, 2017).

90
Tab
le 3
.1.
Org
anic
Cott
on C
ult
ivati
on A
rea, N
um
ber
of
Farm
ers
and P
rod
uct
ion (
ton)
(Özü
do
ğru
, 2
017
)
2
00
5
2006
2007
2008
2009
2010
2011
20
12
20
13
20
14
20
15
20
16
Nu
mb
er o
f
Fa
rmer
s 3
13
164
71
105
117
178
287
3
11
2
20
20
7
16
7
19
6
Are
a (
ha)
83
67
12857
12079
13129
2408
4045
6192
68
85
44
36
44
43
32
97
38
63
Pro
du
ctio
n
(to
ns)
3
53
54
63966
55535
68311
11897
18042
33347
31
06
6
20
60
3
22
05
8
16
65
3
19
35
3
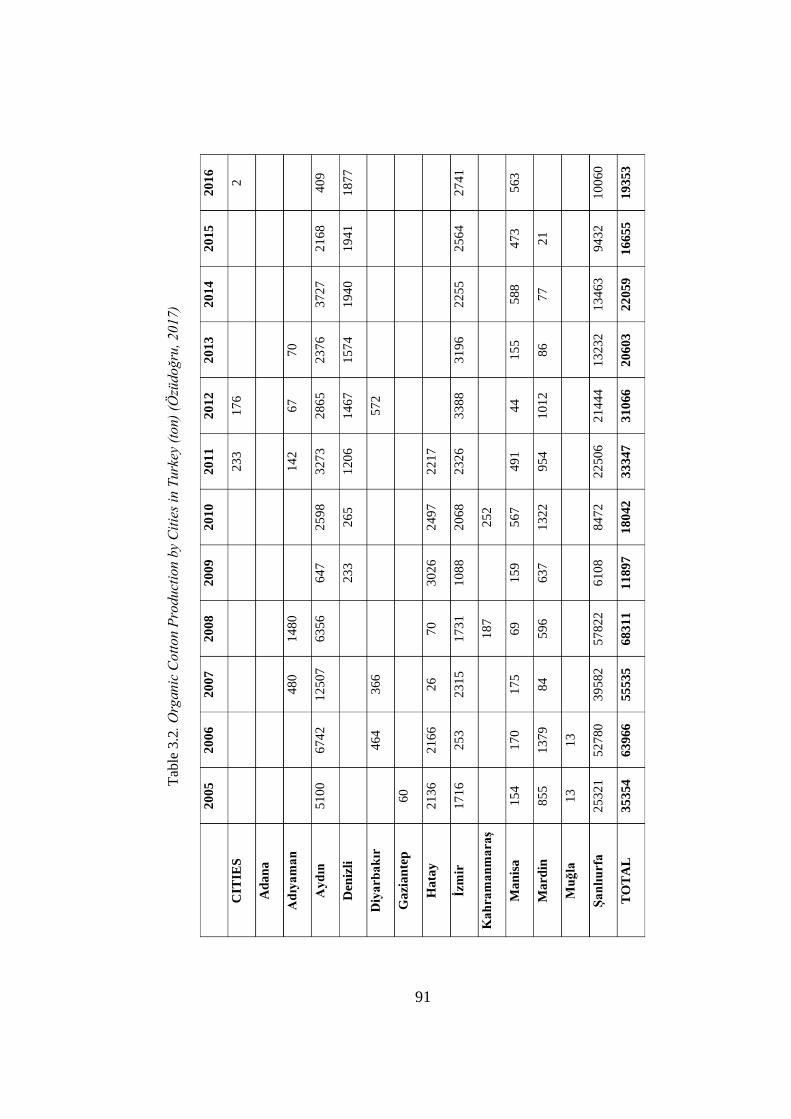
91
Tab
le 3
.2.
Org
anic
Cott
on P
roduct
ion b
y C
itie
s in
Turk
ey (
ton)
(Özü
do
ğru
, 2
01
7)
2
00
5
20
06
20
07
20
08
20
09
20
10
20
11
20
12
20
13
20
14
20
15
20
16
CIT
IES
2
33
17
6
2
Ad
an
a
Ad
ıya
ma
n
48
0
14
80
14
2
67
70
Ay
dın
5
10
0
67
42
12
507
63
56
64
7
25
98
32
73
28
65
23
76
37
27
21
68
40
9
Den
izli
2
33
26
5
12
06
14
67
15
74
19
40
19
41
18
77
Diy
arb
ak
ır
4
64
36
6
57
2
Ga
zia
nte
p
60
Ha
tay
21
36
21
66
26
70
30
26
24
97
22
17
İzm
ir
17
16
25
3
23
15
17
31
10
88
20
68
23
26
33
88
31
96
22
55
25
64
27
41
Ka
hra
ma
nm
ara
ş
18
7
2
52
Ma
nis
a
15
4
17
0
17
5
69
15
9
56
7
49
1
44
15
5
58
8
47
3
56
3
Ma
rdin
8
55
13
79
84
59
6
63
7
13
22
95
4
10
12
86
77
21
Mu
ğla
1
3
13
Şa
nlı
urf
a
25
321
52
780
39
582
57
822
61
08
84
72
22
506
21
444
13
232
13
463
94
32
10
060
TO
TA
L
35
354
63
966
55
535
68
311
11
897
18
042
33
347
31
066
20
603
22
059
16
655
1
93
53
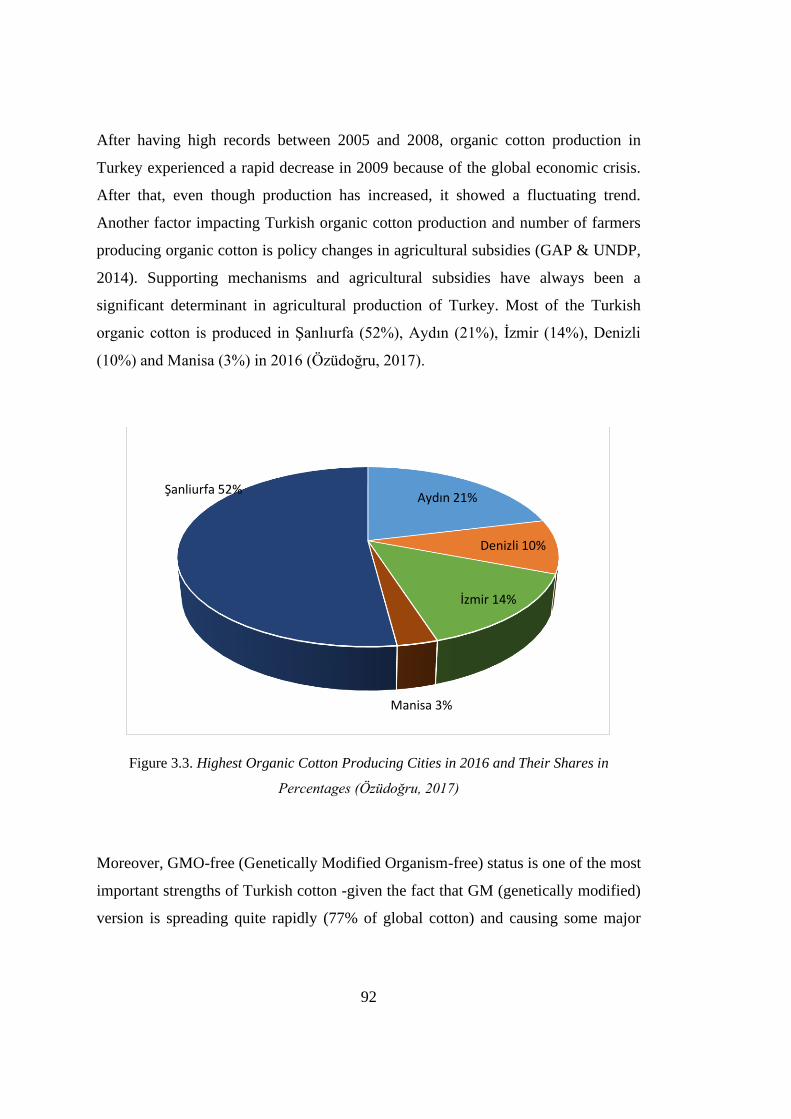
92
After having high records between 2005 and 2008, organic cotton production in
Turkey experienced a rapid decrease in 2009 because of the global economic crisis.
After that, even though production has increased, it showed a fluctuating trend.
Another factor impacting Turkish organic cotton production and number of farmers
producing organic cotton is policy changes in agricultural subsidies (GAP & UNDP,
2014). Supporting mechanisms and agricultural subsidies have always been a
significant determinant in agricultural production of Turkey. Most of the Turkish
organic cotton is produced in Şanlıurfa (52%), Aydın (21%), İzmir (14%), Denizli
(10%) and Manisa (3%) in 2016 (Özüdoğru, 2017).
Figure 3.3. Highest Organic Cotton Producing Cities in 2016 and Their Shares in
Percentages (Özüdoğru, 2017)
Moreover, GMO-free (Genetically Modified Organism-free) status is one of the most
important strengths of Turkish cotton -given the fact that GM (genetically modified)
version is spreading quite rapidly (77% of global cotton) and causing some major
Aydın 21%
Denizli 10%
İzmir 14%
Manisa 3%
Şanliurfa 52%
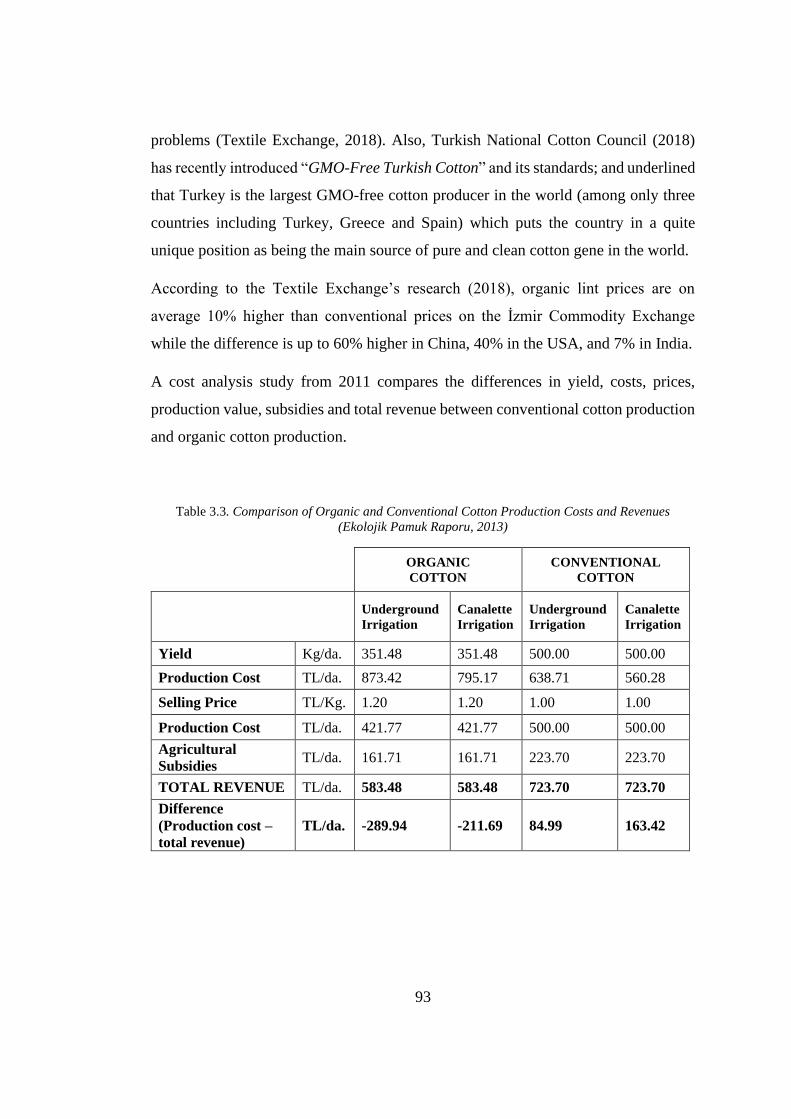
93
problems (Textile Exchange, 2018). Also, Turkish National Cotton Council (2018)
has recently introduced “GMO-Free Turkish Cotton” and its standards; and underlined
that Turkey is the largest GMO-free cotton producer in the world (among only three
countries including Turkey, Greece and Spain) which puts the country in a quite
unique position as being the main source of pure and clean cotton gene in the world.
According to the Textile Exchange’s research (2018), organic lint prices are on
average 10% higher than conventional prices on the İzmir Commodity Exchange
while the difference is up to 60% higher in China, 40% in the USA, and 7% in India.
A cost analysis study from 2011 compares the differences in yield, costs, prices,
production value, subsidies and total revenue between conventional cotton production
and organic cotton production.
Table 3.3. Comparison of Organic and Conventional Cotton Production Costs and Revenues
(Ekolojik Pamuk Raporu, 2013)
ORGANIC
COTTON
CONVENTIONAL
COTTON
Underground
Irrigation
Canalette
Irrigation
Underground
Irrigation
Canalette
Irrigation
Yield Kg/da. 351.48 351.48 500.00 500.00
Production Cost TL/da. 873.42 795.17 638.71 560.28
Selling Price TL/Kg. 1.20 1.20 1.00 1.00
Production Cost TL/da. 421.77 421.77 500.00 500.00
Agricultural
Subsidies TL/da. 161.71 161.71 223.70 223.70
TOTAL REVENUE TL/da. 583.48 583.48 723.70 723.70
Difference
(Production cost –
total revenue)
TL/da. -289.94 -211.69 84.99 163.42
94
3.2. Better Cotton
3.2.1. Better Cotton in the World
Better cotton is another approach arising from environmental, social and economic
concerns associated with worldwide cotton production. It is launched by the Better
Cotton Initiative. The ultimate aim of better cotton is “to transform cotton production
worldwide by developing Better Cotton as a sustainable mainstream commodity… and
make global cotton production better for the people who produce it, better for the
environment it grows in and better for the sector’s future” (BCI, 2017). Namely,
Better Cotton initiative targets to promote productivity and enhance producers’
incomes in a socially and environmentally sensitive manner (BCI, 2017). Similar to
organic cotton, several global brand-name retailers and companies (including Adidas,
Gap, Nike, IKEA, Levi Strauss & Co., etc.) who make commitments in regard to
procuring their cotton from more sustainable sources also prefer better cotton in their
supply chains (BCI, 2014). According to the newest data from BCI 2018 Annual
Report, BCI’s Retailer and Brand Members have sourced more than 1 million Mt of
better cotton last year (BCI, 2018).
Better cotton production under the BCI Assurance Program is based upon producing
cotton in compliant with defined specific minimum requirements. These specific
requirements cover a wide range of practices in various topics including crop
protection, water consumption, soil health, biodiversity, fibre quality etc. (BCI, 2017).
Besides, better cotton production adopts important Principles and Criteria in regard to
specific controversial issues associated with cotton production such as climate change
and gender equality among many others (BCI, 2017).
After participating in a series of training, farmers who comply with BCI’s ‘Better
Cotton Standard System’ and ‘Principles and Criteria’ became eligible for licensing.
According to the BCI (2017), as 2016/2017 season, there are 21 countries producing
better cotton including Australia, Brazil, Burkina Faso, Cameroon, China, Cote
d’Ivoire, Ghana, India, Israel, Kazakhstan, Madagascar, Mozambique, Pakistan, South

95
Africa, Tajikistan, Tanzania, Turkey, Uganda, USA, Zambia and Zimbabwe.
Produced by 1,3 million licensed BCI farmers, better cotton accounts for 14% of
global cotton production (BCI, 2017). BCI aims to reach 5 million farmers and
increase better cotton share to 30% of global cotton production by 2020 (BCI, 2017).
Figure 3.4. Organizational Structure of Better Cotton People (BCI, 2017)
The organizational structure of better cotton production includes Implementation
Partners (IPs), Producer Unit (PUs), Learning Groups, PU Managers and Field
Facilitators. Each component of the structure is explained in BCI Annual Report 2017
as below: Implementation Partners (IPs), who can be NGOs, cooperatives or
companies, help farmers in better cotton cultivation, provide technical assistance and
knowledge; and encourage proliferation of better cotton among communities.
Implementation Partners support Producer Units (PUs) who are the group of better
cotton farmers comprising of smallholder or medium size farmers in the same locale.
96
Producer Units consist of smaller farmer groups called Learning Groups multiple of
which are led by a PU Manager who assist them to master better cotton production
practices and techniques according to Better Cotton Principles and Criteria. Also, there
are Field Facilitators providing on-the-ground training for the farmers’ to adopt better
cotton practices through demonstrations in the field.
3.2.2. Better Cotton in Turkey
Better cotton lint production accounts for 0.15 % of total cotton lint produced in
Turkey7. In 2018, 135788 MT better cotton lint was produced in Turkey. In terms of
the distribution of better cotton lint production, GAP Region is the leader with 76900
which accounts for 57% of national better cotton production (produced in Şanlıurfa
and Diyarbakır) as shown in Table 3.4 below in this section. The rest of the better
cotton is produced in Ege (31%) and Çukurova (12%) Regions (see Table 3.4 below).
7 Calculated based on the data of TUİK -retrieved from Cotton Sectoral Report (2018) and National
Better Cotton Statistics of İyi Pamuk Uygulamaları Derneği (IPUD) retrieved from
https://iyipamuk.org.tr/sayfa/556/better_cotton/turkiye%20de_better_cotton_uretimi.html
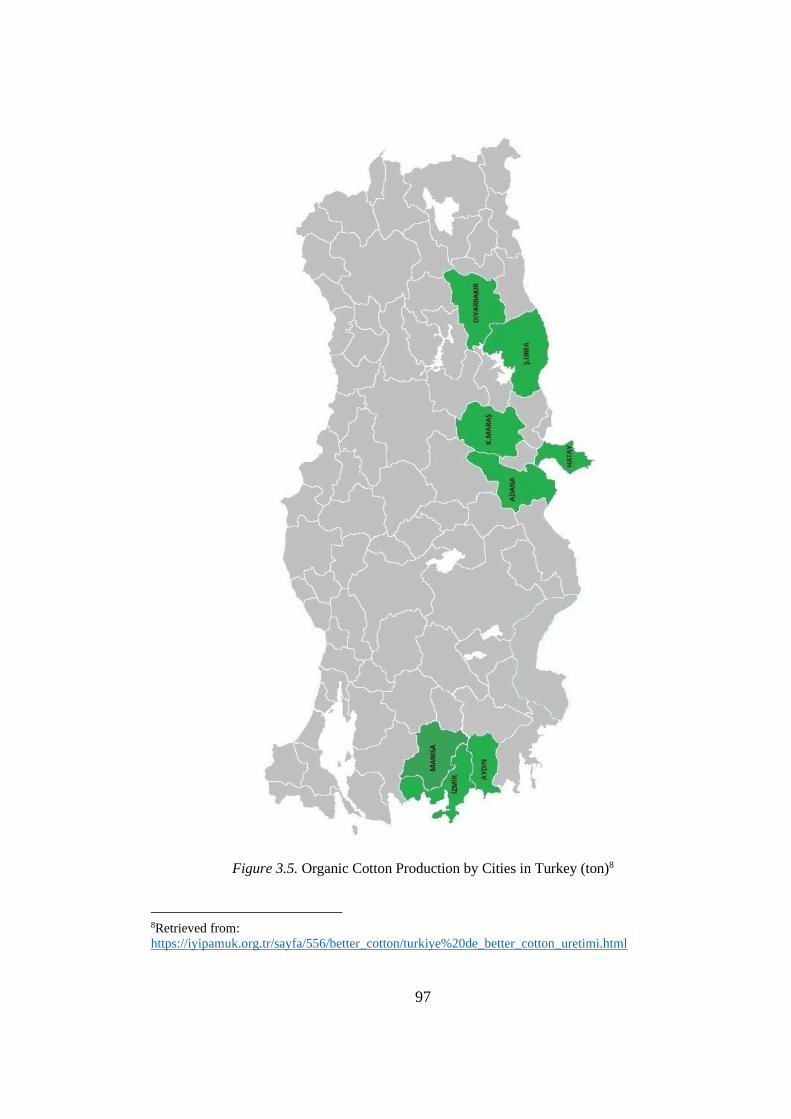
97
Figure 3.5. Organic Cotton Production by Cities in Turkey (ton)8
8Retrieved from:
https://iyipamuk.org.tr/sayfa/556/better_cotton/turkiye%20de_better_cotton_uretimi.html
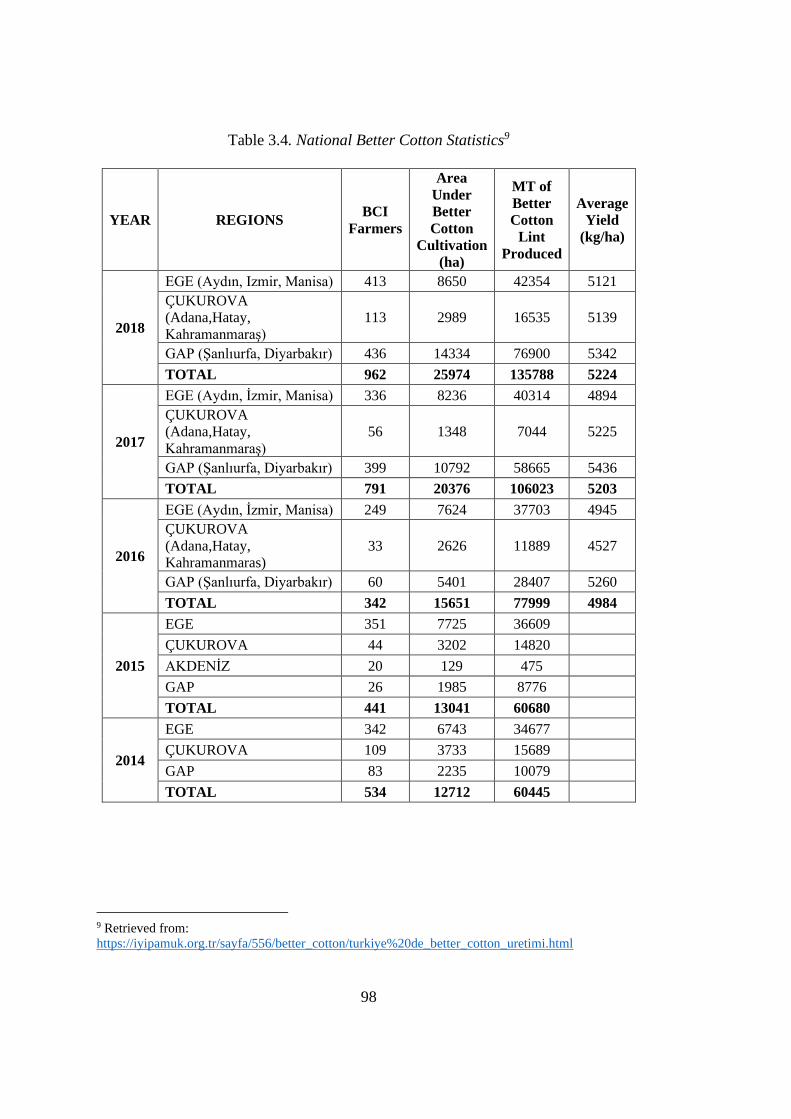
98
Table 3.4. National Better Cotton Statistics9
YEAR REGIONS BCI
Farmers
Area
Under
Better
Cotton
Cultivation
(ha)
MT of
Better
Cotton
Lint
Produced
Average
Yield
(kg/ha)
2018
EGE (Aydın, Izmir, Manisa) 413 8650 42354 5121
ÇUKUROVA
(Adana,Hatay,
Kahramanmaraş)
113 2989 16535 5139
GAP (Şanlıurfa, Diyarbakır) 436 14334 76900 5342
TOTAL 962 25974 135788 5224
2017
EGE (Aydın, İzmir, Manisa) 336 8236 40314 4894
ÇUKUROVA
(Adana,Hatay,
Kahramanmaraş)
56 1348 7044 5225
GAP (Şanlıurfa, Diyarbakır) 399 10792 58665 5436
TOTAL 791 20376 106023 5203
2016
EGE (Aydın, İzmir, Manisa) 249 7624 37703 4945
ÇUKUROVA
(Adana,Hatay,
Kahramanmaras)
33 2626 11889 4527
GAP (Şanlıurfa, Diyarbakır) 60 5401 28407 5260
TOTAL 342 15651 77999 4984
2015
EGE 351 7725 36609
ÇUKUROVA 44 3202 14820
AKDENİZ 20 129 475
GAP 26 1985 8776
TOTAL 441 13041 60680
2014
EGE 342 6743 34677
ÇUKUROVA 109 3733 15689
GAP 83 2235 10079
TOTAL 534 12712 60445
9 Retrieved from:
https://iyipamuk.org.tr/sayfa/556/better_cotton/turkiye%20de_better_cotton_uretimi.html
99
İyi Pamuk Uygulamaları Derneği (IPUD) is the BCI’s strategic partner in Turkey and
it is the organization responsible from the management of better cotton production in
the country. Even though number of farmers practicing better cotton production
fluctuates by years, the area under better cotton cultivation and the amount of better
cotton lint produced in the country show an increasing pattern in Turkey. During the
in-depth interviews, one of the IPUD experts responsible from training and capacity
building clarified that the decrease in the number of farmers is stem from the high
standards that farmers are expected to meet in order to be eligible for better cotton
production.
Better cotton in Turkey is cultivated in Ege (Aegean), Akdeniz (Mediterranean,
including Çukurova) and GAP Regions. Even though better cotton production in
Turkey is dominantly existed in GAP and Ege Regions, GAP has become the leader
in the number of better cotton farmers, area under cultivation, amount of better cotton
lint prodcution and yields. GAP Region has not only become prominent with its high
share of overall national cotton production, but also become the leader in higher-value
added (upgraded) cotton produced.
3.3. Local Context
There are also some issues in the local context that underpin the need for upgrading in
cotton value chain in Şanlıurfa. As main participants of the cotton value chain, there
seems several issues and conflicts between cotton producers and industrial processors,
in other words, textiles firms in the region. According to the industry, producers take
advantage of the supply-demand imbalance in the market and therefore do not pay
attention to the quality of the crop they produced. Firms indicate that since there is a
great shortage in the supply, farmers think that quality does not matter that much as
long as they can sell their product and, since the shortage is huge, they are always able
to find someone willing to buy their output no matter quality of the yield. Processing
sector is not satisfied with the quality of the local cotton fiber and states that improper

100
practices in the production stage affect the quality of their outputs significantly. They
also emphasize that even if the essential characteristics of local cotton fiber is of quite
high-class (for example in terms of fiber length, paint adherence, touching etc.), the
quality substantially decreases due to the incorrect and imprecise practices during the
irrigation, harvesting, or storage operations etc. which ultimately cause a considerable
decrease in the value of the cotton fiber they use as an input. As a result, the problems
in the agricultural production stage of the cotton value chain causes value and income
losses not only for the farmers but also for the actors involved in further stages of the
value chain. Besides, inaccurate practices of farmers in the field –in terms of
uncontrolled usage of chemicals (pesticides and fertilizers) and inefficient irrigation
systems- cause extensive deterioration of the soil and depletion of water resources
which are already highly scarce in the region. The improper practices of the farmers
lead to important environmental consequences as well as economic ones. Despite all
this, it is also argued that cotton farmers in the region show a strong resistance to
improve the quality standards of the cotton they produced and change the conventional
practices they have been performing for years.
Considering all this, cotton production in Şanlıurfa may not be economically and
environmentally sustainable as long as cotton producers change their attitudes and
practices. First of all, quite higher rates of cotton import may become an important
threat for their local products which falls behind the quality standards that market
requires. If local cotton cannot meet the quality requirements and standards of the
competitive textiles industry, firms would opt for more imported cotton in order not
to reduce the quality of their output. Second, current practices used in cotton
production in the region poses significant threats to the environment and already
scarce resources of the area. Several researchers and studies show that deterioration in
the soil due to improper practices and depletion of water resources as a result of
excessive use probably will not allow cultivation in the foreseeable future. Also,
government’s recent expressions and more aggressive intentions about changing
subsidy mechanism to enforce crop rotation mandatorily in order to improve soil
101
structure shows that environmental concerns outweigh production size and became a
priority. Crop rotation is already legally mandatory; however, it is not fully enforced
yet -at least not in the Southeast Anatolia Region. Local agencies indicate that farmers
who do not follow the crop rotation will not benefit from agricultural subsidies soon -
hoping that new arrangement can deter them from insisting on planting cotton
subsequently over the years. To sum up, it seems that there is an urgent need for the
farmers in Şanlıurfa to alter their position in the market because there are several risks
awaiting them if they do not take any action.
In terms of our case, the cotton produced in Şanlıurfa is also part of a global trade
network and cotton value chain in the region gets connected with the world markets
especially after the industrial processing stage of the chain. The thesis aims to
concentrate on existing positions of cotton producers in relation to the other actors and
stages in the cotton value chain in GAP Region. In addition to this, it aims to compare
farmers that have changed their position in the market and managed to improve their
terms of integration into the cotton value chain, in other words upgraders, with the
others who do not show a tendency to do so. Understanding their motivations for the
change and conditions/circumstances that either facilitate or prevent this transition are
going to be the key indicators for increasing the overall value gained from the cotton
value chain in the area.

103
CHAPTER 4
4. ANALYZING COTTON VALUE CHAIN IN ŞANLIURFA
This section of the study aims to discuss the first research question of the thesis:
‘How can cotton value chain in Şanlıurfa be improved in an economically and
environmentally sustainable manner?’
The sub-questions that help to answer the first main research question are:
- What are the existing problems and opportunities in the cotton value chain?
- What are the existing upgrading activities in agricultural production as
means of achieving improvements and increasing value generation in the
chain?
This section aims to discuss these questions in the context of value chains framework.
What is meant by ‘improving the cotton value chain’ here is basically enhancing value
generation from cotton, increasing its contribution to regional competitiveness in
cotton related sectors, and promoting overall regional welfare by increased incomes
and revenues for local people. As it can be inferred from the research question and
following sub-questions above, the thesis aims to discuss this in the steps of: (i)
identifying problematic and weak stages of the value chain, (ii) shedding light on
opportunities associated with the chain, and (iii) discussing upgrading activities taking
place along the cotton value chain as means of improving value generation and value
increase. Data collection of this section is conducted within a project called
‘Integrated Resource Efficiency in Agriculture and Agro-Based Industries in
Southeast Anatolia Region’ with a group comprising of researchers, specialists and
local experts from the Ministry of Development, GAP Regional Development
104
Agency, MATPUM (METU) and UNDP in which the author of this thesis worked as
a researcher.
The first step is identifying the most problematic and weakest stages in the cotton
value chain that prevents region from greater value generation out of cotton and related
sectors. Understanding the dynamics that negatively impact the competitiveness of the
sector, decrease efficiency and cause value losses are crucial to be able to provide
useful policy advices.
Secondly, in addition to the problematic nodes, identifying opportunities also offer
valuable insight for describing appropriate environment which enables exploiting
these opportunities. As part of the value chain analysis, focusing on strong
characteristics and dimensions of cotton value chain in Şanlıurfa is another target
desired to achieve in this part of the thesis.
Third, the section discusses existing ‘upgrading’ activities because regional value
creation and value increases are usually achieved through these upgrading strategies.
In discussing upgrading, we particularly focus on agricultural production stage and
farmers because our preliminary research revealed that this is the most problematic
stage of the cotton value chain in Şanlıurfa. Therefore, upgrading strategies adopted
by the agricultural producers which result in economic or environmental improvement
in the value chain are the particular focus in this section.
In order to answer these questions, a detailed value chain analysis is required to be
able spot these problematic weak stages, opportunities associated with the sequential
chain activities, and upgrading strategies carried out to increase value generation.
Value chain approach is not only important in terms of investigating individual sector
activities, but also crucial in terms of examining inter-sectoral relations and dynamics
which may have a significant impact on achieving a successful value chain.
105
4.1. Cotton Value Chain Analysis
Based on the detailed literature review in the theoretical framework chapter of this
thesis and depending on the available data, the components of value chain analysis to
be investigated in the thesis are determined as;
- Actors and activities
- Governance
- Economic analysis (such as rents and barriers to entry, market demand etc.),
Therefore, this section investigates cotton value chain in Şanlıurfa by these
components listed above. As indicated in the research question, these topics are
discussed, first, in terms of their natural dynamics, and then in terms of problems and
opportunities associated with them.
4.1.1. Major Activities and Actors
Major value chain activities taking place in cotton value chain in Şanlıurfa are
observed as; input supply, agricultural production, primary processing (ginning), and
secondary processing (textiles manufacturing) activities.
The preliminary research showed that even though global cotton value chain shows a
great degree of branching, processing part of cotton value chain in Şanlıurfa does not
show a wide branching. For example, use of cotton in food industry (extracting oil
from the cotton seed) or use of cotton seedcake in animal feed industry are not
investigated in this thesis because they were only observed as minor cotton value chain
activities in Şanlıurfa. Thus, the thesis focuses on agricultural production, with
ginning and textiles manufacturing stages within the processing sector. Cotton
producers including conventional, organic and better cotton farmers, input suppliers,
middleman, ginners, and textile manufacturers are determined as the major value
chain actors to be interviewed with.
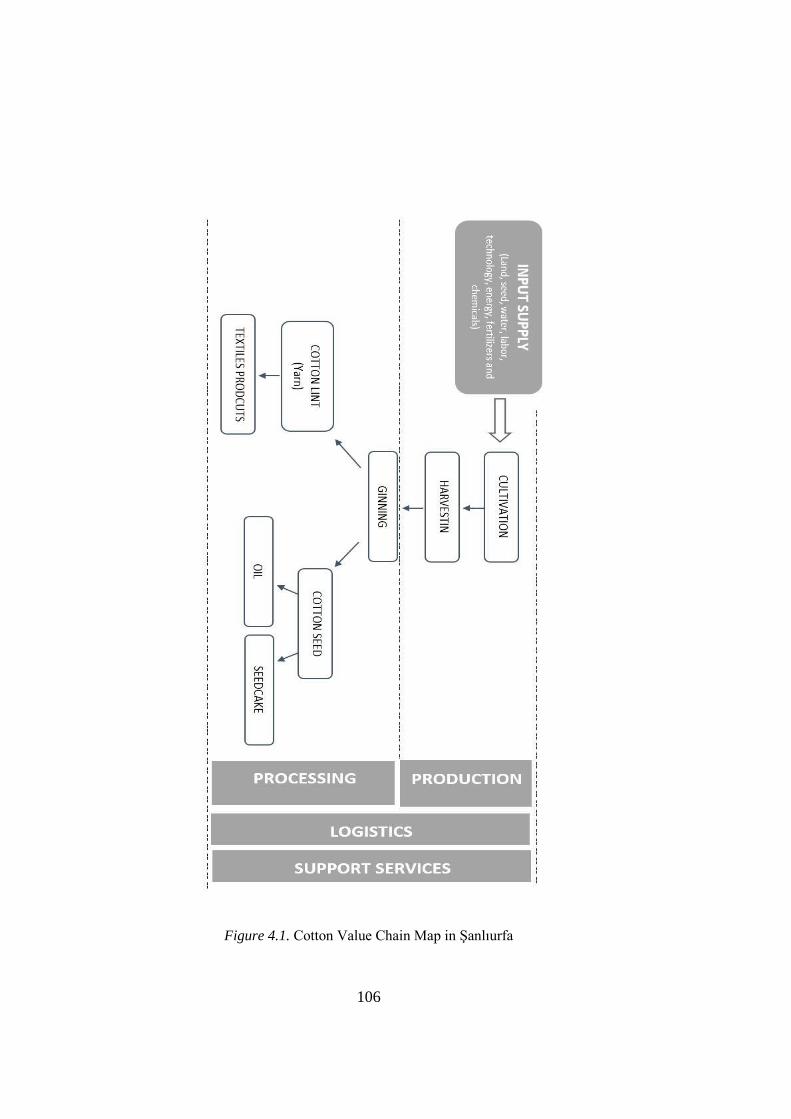
106
Figure 4.1. Cotton Value Chain Map in Şanlıurfa
107
4.1.1.1. Input Supply
Input supply of agricultural production constitutes the initial step of the value chain.
Inputs identified in the cotton value chain in Şanlıurfa are: land, labour, seed,
technology, chemicals, fertilizers, energy and water. Input supply stage is examined
through i) interviews with input suppliers (distributors in the city) and ii) information
regarding input supply stage during the farmer interviews.
The interviewed input supplier firms are the providers (distributor) of seed,
technology, chemicals, fertilizers and technical consultancy. They define themselves
as the agents responsible from providing inputs required for agricultural production
activities to the farmers and offering technical support and consultancy in regard to
usage of their products (I20, I21). They are not the producers of inputs but only
distributors.
Water:
Water (irrigation) is one of the most problematic issues in agricultural production in
the city. The problem about irrigation is the excessive water consumption due to the
use of inefficient traditional systems and deterioration of the soil as a result of
enormous irrigation (I40, I41, I42). In the northern part, where the altitude is higher
(Viranşehir, Siverek and other parts of Suruç) they pump water from the water wells.
The elevation in this part of the city creates pressure which allows water to be pumped
from the wells. In the southern part of the city, where the geography is plainer (Harran,
Akçakale, some parts of Suruç), farmers use water canals for irrigation. In this part of
the city the prevalent irrigation method is surface irrigation with flooding method.
Most of the canals in the city are open canals which result in significant water loss as
evaporation due to very high degrees of air temperature. There is an urgent need to
transform them closed-canals to avoid evaporation and reduce water loss. Farmers
indicated that a great amount of water-saving is possible if open-canals are closed
(I14, I15).

108
Seed:
The input suppliers (I20, I21) indicated that most of the seed used in production is
imported from outside of the region. However, they underline that production of the
seed in the region would be more practical in terms of producing seeds that are more
compatible to the region-specific conditions (such as climatic factors). Another point
they made is the limited seed breeding institutions in the region. They indicated that
there are research institutes in the region who reproduces seed but does not make any
breeding research for local variations that are more durable for domestic conditions.
Existing few local producers in the region are also holders of production licenses of
international or national seed brands and only involved in reproduction, not any
research activities. Besides, the most prevalent seeds used in cotton production are
foreign brands not the local ones; however, local research institutions carry breeding
studies on local breeds which are not commonly preferred by the farmers. Even though
they are more expensive, Farmers prefer these foreign brand seeds because they give
higher yields when compared to local seeds.
Chemicals and fertilizers:
One problem associated with the use of chemicals and fertilizers is that they are
sometimes applied without following the instructions or without technical assistance
by the experts (I49). This may cause misapplication and contamination of the soil.
Similar to the seed, input suppliers argue that the region lacks local (or national)
producers of chemicals and fertilizers, thus they have to provide farmers with imported
chemicals and fertilizers which are quite expensive for them.
In terms of overall input prices, one of the input suppliers (I20) emphasizes that
“Turkish farmers can be considered the ones who use the most expensive inputs in the
world” in terms of energy, seed, chemicals and fertilizers. This is particularly because
these inputs are imported with high currency rates. Even local products use imported
109
raw materials which boosts the prices as well. However, despite excessive cost of
inputs, agricultural output prices should be in accordance with the world market prices
which puts the farmers in a very disadvantaged position, diminishes their income and
decreases competitiveness in the world markets. Price fluctuations depending on the
inconsistent currency rates and unstable national economic standing have significant
impact in farmers’ expenses and earnings. This problem is one of the biggest
challenges local farmers face.
Given the limited financial sources and unstable conditions of farmers, input suppliers
usually make informal contracts and quite flexible payment schedules with the
producers (I20, I21). Farmers mostly wait to make payment until the harvest. Even
though this situation puts considerable financial burden to the supplier, they accept
the condition as it is and consent late payments (I20, I21). This indicates strong ties
and trust between the agricultural producers and local input suppliers. This also
requires a long-term business relationship because trust building between the parties
can be a slow process. Because of that situation, input suppliers indicate that they all
have their own farmer networks that they maintain long-term transactions.
Technology:
Technology in production stage refers to the machinery and farming equipment. Large
and expensive machinery may be leased by the farmers who cannot afford to buy (I17).
Mostly, there is sufficient amount of machinery equipment to lease; however, it is
reported that sometimes there may be congestion in demand especially in the peak
season (for example cultivation or harvesting seasons) (I1).
Cotton is mostly harvested by machinery. Farmers indicate that mechanization in
cotton harvesting increased the product quality because before machinery, when
cotton was picked by hands and level of contamination was higher. Now it is
significantly reduced according to the farmers (I2, I3, I17).
110
Land:
Land ownership and use among the cotton producers in the area varies, including
landlords, smallholder farmers, sharecroppers and tenants (leasers). There are a lot of
small farmers who do not own sufficient amount of land for efficient production,
therefore lease extra land for production or became sharecroppers. In sharecropping,
small farmer works under the landowner. Landowner is responsible from the
management of the production and expenses. Small farmers can also lease a piece of
land and produce by his/her own independent from the landowner.
The law requires farmers to get soil analysis completed in order to benefit from
agricultural supports. Using fertilizers and other chemicals should be based on these
analyses to protect the structure of the soil.
During the interviews, urbanization is indicated as another threat causing loss of fertile
agricultural lands. Urban sprawl through the peripheries put a considerable risk on the
valuable agricultural production areas in Şanlıurfa (I14).
Labor:
Analysis revealed that there is sufficient labor in the city, especially young population
who are suitable for working in agricultural production is adequate. However, there is
an unwillingness to participate agricultural labor force among the young population.
Younger generation looks for more urban-type occupations (I14).
In addition to the local labor, Syrian refugee population contributes to the labor force
(I1, I2). Syrian workers seem favorable to the local farmers due to their lower wages.
It is also indicated that in local families, almost all family members contribute to the
labor (in various ways) (I1). In cotton production, the need for labor diminished after
mechanization of harvesting in Şanlıurfa though (I1, I2, I3).
111
Energy:
The problem highly underlined during the interviews is that the production areas quite
frequently experiences power cut-outs (I5). This creates a considerable problem for
the farmers who irrigates by using electric power. It is indicated that farmers
sometimes have yield loss due to often interrupted irrigation during the season (I5).
4.1.1.2. Agricultural Production
Agricultural production stage in cotton value chain consists of growing cotton crop
from planting to the harvest. The main actor of production is the farmer. The
investigated farmers can be grouped in three main categories based on the production
area size: large-scale, medium-scale, and smallholder farmers. Another categorization
can be made based on the land ownership as landowners and tenants or sharecroppers.
Farmers, as the main actors of the production stage, are also related to the input
suppliers through backward linkages and to the processing sector agents (ginners) as
the forward linkages. As the primary consumers of the cotton grown in the fields,
ginners and textiles factories also provided valuable insight into the production
process. Therefore, production phase dynamics are not evaluated by solely on the
statement of farmers, but also collocated with the considerations of processing stage
actors. Also, there is a small group of middleman involved in cotton trade between the
farmers and ginners. Mostly, smallholder farmers (cultivating in an area
approximately less than 20 decare) work with middleman to commercialize their
cotton due to small amount of their produce. Number of middleman and farmers who
trade cotton through middleman is quite low in the area though.
The size of the cotton production areas in Şanlıurfa vary. Depending on the farm size
and, accordingly, amount of labor required for the management of the production,
farm scale can be divided into categories of: large scale, medium scale and small-scale
farming. Farms which has a production area greater than 200 hectares is considered

112
large-scale; the ones between 20-200 hectare are medium scale; and smaller sizes than
20 hectares are regarded small-scale farming (BCI Annual Report, 2017).
Table 4.1 Farm Scale and Sizes (BCI Annual Report, 2017)
Farm scale Farm size Labor requirement
Large-scale farming >200 ha Dependent on permanent hired labor
Medium-scale farming 20-200 ha Dependent on permanent hired labor
Small-scale farming 1-20 ha
Does not dependent on permanent hired
labor
Large scale producers that were interviewed indicated that they rent extra land in
addition to their own area for cotton production because of the scale economies, cotton
production is not reasonable and efficient in small sizes (I2, I3, I12, I13). They further
indicated that they make cooperation with surrounding farmers and enlarge their
production area in order to increase profits. However, small farmers, on the other hand,
have the opportunity to take care of their crop quite better compared to large scale
producers (I16). Since the area they handle is small, they can spend extra time and
effort to improve their produce (I16). Also, due to the small size of the area, they can
afford to use higher quality fertilizers or chemicals which ultimately improves the
quality of cotton they produce (I16). Thus, it is better for the small farmers to grow
higher quality cotton.
One factor affecting cotton farmlands is the division of land through inheritance which
causes farmlands getting economically unviable sizes for agricultural production.
Lately, policies setting minimum size limits for the division of the farmlands and
protecting them at a economically viable size for agricultural production were put into
implementation. Preventing division of the farmlands is followed by land acquisition
regulation in order to regain proper farm sizes which enables efficient agricultural
production and improves fertility.
113
Another common problem existing in the area is the migration of the landlords and
landowners of large farmlands from rural to urban areas as explained by one of the
informants (I7): Migrated landowners lease their farmlands -partially or as whole- to
shareholders or tenants. When large agricultural lands rented to several tenants in
small pieces, each farmer may choose to grow another variation of cotton seed and
homogeneity decreases. For example, variation can lead to cotton fibres with different
micronaire values which results in homogeneity problem in the processing sector and,
accordingly, a decrease in product quality.
Main activity carried out in this stage of the value chain is the production of cotton
consisting of operations such as preparation of the land, planting, growing the plant
(includes irrigation, fertilization, pest control etc.), harvesting, storage and finally
transferring product to the next stage actor. Average cotton production (yield) in
Şanlıurfa is indicated 500 - 600 kg/decare in Şanlıurfa. There are several local
characteristics effecting yield in the area including varieties in temperature,
availability of irrigation, height to name some. The ultimate aim of the local cotton
producers is making the highest possible yield and, accordingly, greatest amount of
revenues out of cotton. From the comprehensive logic of value chain approach, higher
level of yield is, together with higher product quality, not only for the benefit of
farmers but also directly for the benefit of other actors involved in cotton value chain.
This is particularly because increasing the value created in one of the value chain
stages also directly cause a value increase in other stages of the chain. Knowing that,
as a response to those sometimes harsh conditions, a global pharmaceuticals company,
Bayer, developed a special type of seed called ‘Candia’ and it has become the most
prevalent seed used in cotton production in the city, especially in Harran plain where
the temperature is higher and altitude is low. Farmers particularly emphasized
Candia’s endurance against different temperatures and water levels and its obvious
superiority over other types. Besides adaptation to the local conditions and higher
yield, Bayer has also made a significant contribution to the solution of regions’ another
critical problem, the low quality of the cotton. The quality of cotton fibre is typically

114
determined by its strength, colour, length and purity (the absence of foreign matter).
With Candia, cotton producers in Şanlıurfa have become capable of growing more
quality cotton in terms of color (whiter), fiber length and strength with higher level of
yield.
Farmers are required to abide crop rotation to protect nutrient and mineral balance of
the soil. However, they insist on subsequently growing cotton because of its higher
income generation compared with other crops. Rotation is technically mandatory for
the farmers in order to benefit from agricultural subsidies, though it is not fully
enforced yet and farmers keep growing cotton and other higher-price crops.
In-depth interviews with ginners and textiles sector revealed that, besides inherent
characteristics which could be overcame by seed development to some degree, low-
quality of raw cotton caused by the improper practices that farmers implement in the
field is a major problem in the agricultural production stage. By its nature, cotton is a
product which requires extra sensitivity and care in almost all steps of production.
Low-quality of raw cotton adversely affects all the subsequent processes in the chain
by disturbing appearance or cleanness of all the cotton-based commodities -to which
purity of the material is the essential criteria in determining the product quality and
price. These problems related with agricultural production stage below are reported
during the meetings with downstream stage actors, namely processing sector agents
using cotton as their primary input and other actors belong to supporting services (I30
– I41; I45 – I49)
- Contamination: There are several factors and malpractices that cause
contamination problem in cotton production. Firstly, during harvest, if cotton
is not picked cautiously and in a clean way, various contaminants (foreign
matters) may mix into the harvest and adulterate its purity. Even though
mechanization allowed diminishing contamination levels in harvesting,
farmers still may be negligent in handling the raw cotton. Once harvested,
115
cotton is stored in jute bags before going into processing. Small particles of
these jute bags blend into raw cotton and cause another type of contamination.
- Humidity: Farmers sometimes pick cotton early in the morning when the dew
is on the crop. They purposely do not wait the dew to dry because humidity
makes cotton bales weight heavier so that farmers earn more from the cotton
they sell. However, this misbehavior causes a decrease in the quality of cotton.
Humidity distorts the whiteness and texture of the cotton. Local government
plans to control this malpractice by installing GPS devices to tractors
(harvesters) to detect farmers who pick cotton early in the morning before dew
dry up or in the evening when humidity is high.
- Variety in cotton seeds: Another factor is the variety of different cotton seeds
which causes diverse cotton fibre lengths. High variation in fiber length causes
standardization problems in the processing stage of the value chain.
- Excessive irrigation: Besides exploitation of local natural water resources,
excessive irrigation causes increasing humidity levels in the fields which
creates a suitable environment for the spread of insects and disease. Over-
irrigation also reduces the effectiveness of fertilizers and triggers over-use of
those inputs which not only increases expenses but also distorts the quality of
the soil and cause impairments.
During the interviews, cotton producers reported that technological equipment is
sufficient for maintaining production activities (I2, I14). They further explained,
before mechanization cotton was mostly picked by hands which increases
contamination level and dependency to human labor. After mechanization, they
observed a remarkable diminish in contamination levels of cotton. However, the
region still lacks the latest technology farming equipment and systems that are used in
developed cotton producing countries. Both the farmers (I14, I3) and local experts
(I38, I47) highlight the need for adaptation of satellite tracking systems in agricultural
production. This technology allows to detect whether the plantation needs irrigation,
116
fertilization or any other maintenance, the optimum amount and timing of these
requirements and so on. Having such a technology would prevent excessive use of
production inputs and enable higher quality cotton in a more efficient manner.
Economic Sustainability of Cotton Production in Şanlıurfa
Before starting discussion, it is important to note that we consider conventional cotton
production in this section. Primary and secondary analysis reveal that conventional
cotton production in Şanlıurfa does not seem economically sustainable for several
reasons. The information below is compiled based on the secondary data from
literature research and in-depth interviews with local experts and specialists.
First reason is that, as it is already mentioned, input prices in cotton production is
considerably expensive due to the higher exchange rates. As one of the interviewees
emphasized, Turkish farmers produce the most expensive cotton compared to the other
producers from the other parts of the world. Using imported inputs, especially
fertilizers and chemicals (pesticides, herbicides etc.) create excessive financial burden
on farmers budget. On the other hand, they must sell their products at average market
rates determined by world cotton prices in international markets or based on local
prices in the national market. In other words, local cotton producers do not have equal
conditions in production side; however, they are expected to compete with other
producers based on the prices determined by external factors. Kaçıra and Karlı (2002)
argue that high production costs adversely affected the competitiveness of cotton
production in Çukurova and Antalya regions, land devoted to cotton production shrank
and cotton production diminished significantly. Cotton gave its place to alternative
crops such as citrus fruits, fresh fruits and vegetables in Antalya; soybean, corn and
peanut in Çukurova (Kaçıra and Karlı, 2002). GAP Region as well may have the same
risk of changing crop patterns in the near future.
According to the National Cotton Council’s Cotton Sectoral Report (2018), national
average yield is indicated 456 kg per decare and 500 kg/decare for Şanlıurfa (average)
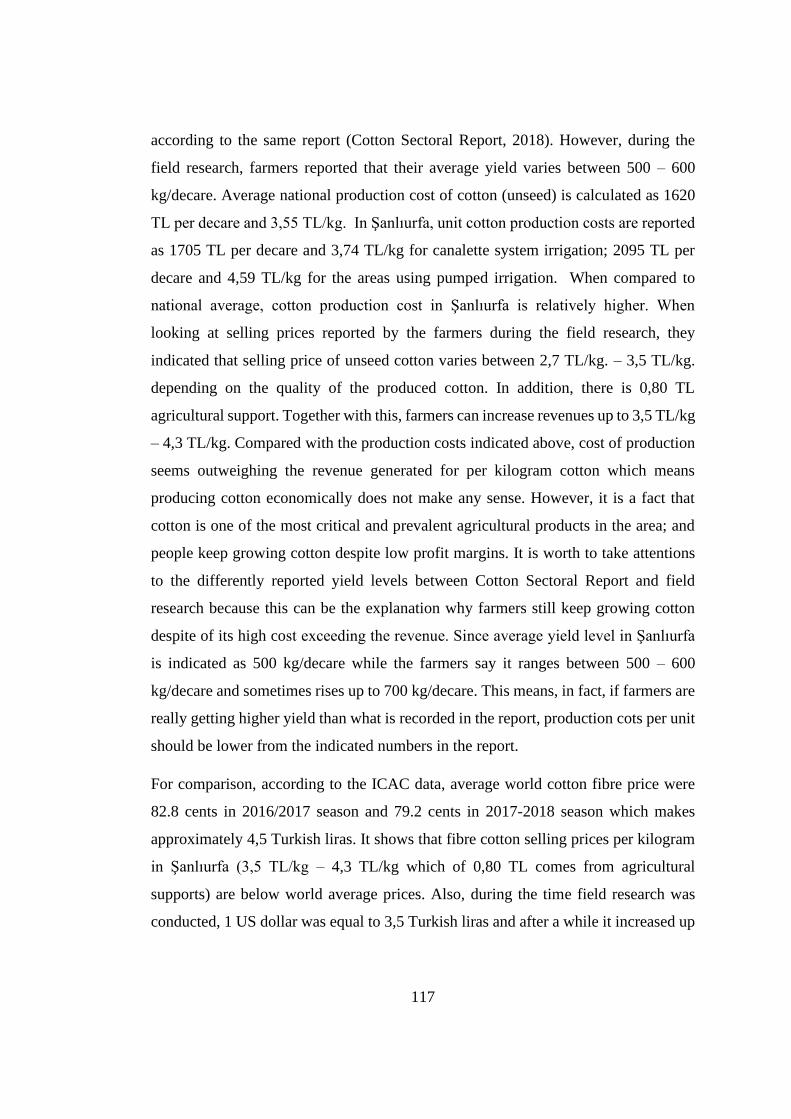
117
according to the same report (Cotton Sectoral Report, 2018). However, during the
field research, farmers reported that their average yield varies between 500 – 600
kg/decare. Average national production cost of cotton (unseed) is calculated as 1620
TL per decare and 3,55 TL/kg. In Şanlıurfa, unit cotton production costs are reported
as 1705 TL per decare and 3,74 TL/kg for canalette system irrigation; 2095 TL per
decare and 4,59 TL/kg for the areas using pumped irrigation. When compared to
national average, cotton production cost in Şanlıurfa is relatively higher. When
looking at selling prices reported by the farmers during the field research, they
indicated that selling price of unseed cotton varies between 2,7 TL/kg. – 3,5 TL/kg.
depending on the quality of the produced cotton. In addition, there is 0,80 TL
agricultural support. Together with this, farmers can increase revenues up to 3,5 TL/kg
– 4,3 TL/kg. Compared with the production costs indicated above, cost of production
seems outweighing the revenue generated for per kilogram cotton which means
producing cotton economically does not make any sense. However, it is a fact that
cotton is one of the most critical and prevalent agricultural products in the area; and
people keep growing cotton despite low profit margins. It is worth to take attentions
to the differently reported yield levels between Cotton Sectoral Report and field
research because this can be the explanation why farmers still keep growing cotton
despite of its high cost exceeding the revenue. Since average yield level in Şanlıurfa
is indicated as 500 kg/decare while the farmers say it ranges between 500 – 600
kg/decare and sometimes rises up to 700 kg/decare. This means, in fact, if farmers are
really getting higher yield than what is recorded in the report, production cots per unit
should be lower from the indicated numbers in the report.
For comparison, according to the ICAC data, average world cotton fibre price were
82.8 cents in 2016/2017 season and 79.2 cents in 2017-2018 season which makes
approximately 4,5 Turkish liras. It shows that fibre cotton selling prices per kilogram
in Şanlıurfa (3,5 TL/kg – 4,3 TL/kg which of 0,80 TL comes from agricultural
supports) are below world average prices. Also, during the time field research was
conducted, 1 US dollar was equal to 3,5 Turkish liras and after a while it increased up
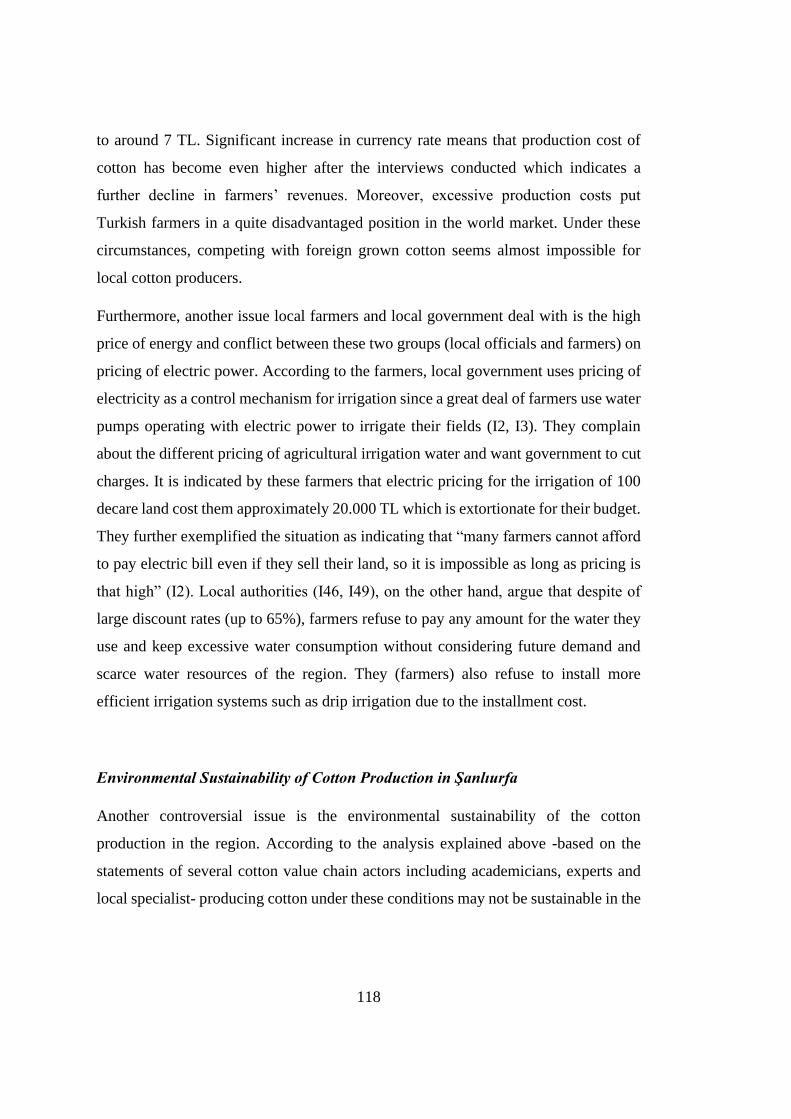
118
to around 7 TL. Significant increase in currency rate means that production cost of
cotton has become even higher after the interviews conducted which indicates a
further decline in farmers’ revenues. Moreover, excessive production costs put
Turkish farmers in a quite disadvantaged position in the world market. Under these
circumstances, competing with foreign grown cotton seems almost impossible for
local cotton producers.
Furthermore, another issue local farmers and local government deal with is the high
price of energy and conflict between these two groups (local officials and farmers) on
pricing of electric power. According to the farmers, local government uses pricing of
electricity as a control mechanism for irrigation since a great deal of farmers use water
pumps operating with electric power to irrigate their fields (I2, I3). They complain
about the different pricing of agricultural irrigation water and want government to cut
charges. It is indicated by these farmers that electric pricing for the irrigation of 100
decare land cost them approximately 20.000 TL which is extortionate for their budget.
They further exemplified the situation as indicating that “many farmers cannot afford
to pay electric bill even if they sell their land, so it is impossible as long as pricing is
that high” (I2). Local authorities (I46, I49), on the other hand, argue that despite of
large discount rates (up to 65%), farmers refuse to pay any amount for the water they
use and keep excessive water consumption without considering future demand and
scarce water resources of the region. They (farmers) also refuse to install more
efficient irrigation systems such as drip irrigation due to the installment cost.
Environmental Sustainability of Cotton Production in Şanlıurfa
Another controversial issue is the environmental sustainability of the cotton
production in the region. According to the analysis explained above -based on the
statements of several cotton value chain actors including academicians, experts and
local specialist- producing cotton under these conditions may not be sustainable in the
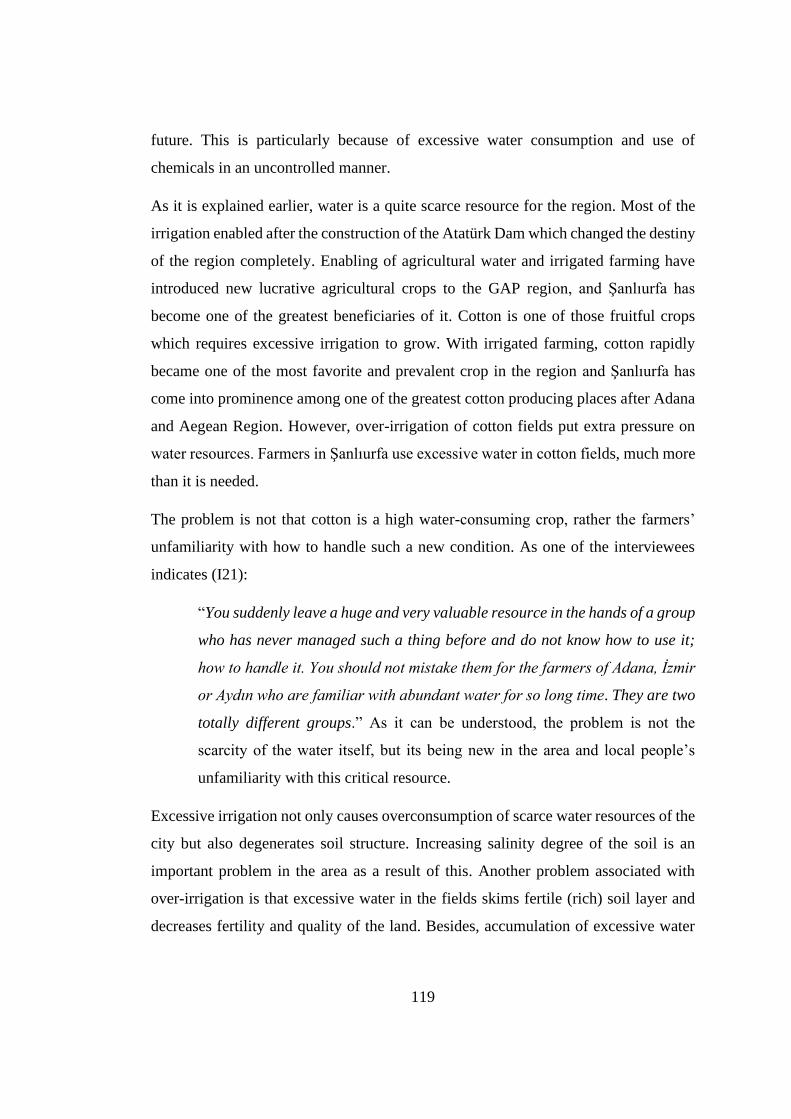
119
future. This is particularly because of excessive water consumption and use of
chemicals in an uncontrolled manner.
As it is explained earlier, water is a quite scarce resource for the region. Most of the
irrigation enabled after the construction of the Atatürk Dam which changed the destiny
of the region completely. Enabling of agricultural water and irrigated farming have
introduced new lucrative agricultural crops to the GAP region, and Şanlıurfa has
become one of the greatest beneficiaries of it. Cotton is one of those fruitful crops
which requires excessive irrigation to grow. With irrigated farming, cotton rapidly
became one of the most favorite and prevalent crop in the region and Şanlıurfa has
come into prominence among one of the greatest cotton producing places after Adana
and Aegean Region. However, over-irrigation of cotton fields put extra pressure on
water resources. Farmers in Şanlıurfa use excessive water in cotton fields, much more
than it is needed.
The problem is not that cotton is a high water-consuming crop, rather the farmers’
unfamiliarity with how to handle such a new condition. As one of the interviewees
indicates (I21):
“You suddenly leave a huge and very valuable resource in the hands of a group
who has never managed such a thing before and do not know how to use it;
how to handle it. You should not mistake them for the farmers of Adana, İzmir
or Aydın who are familiar with abundant water for so long time. They are two
totally different groups.” As it can be understood, the problem is not the
scarcity of the water itself, but its being new in the area and local people’s
unfamiliarity with this critical resource.
Excessive irrigation not only causes overconsumption of scarce water resources of the
city but also degenerates soil structure. Increasing salinity degree of the soil is an
important problem in the area as a result of this. Another problem associated with
over-irrigation is that excessive water in the fields skims fertile (rich) soil layer and
decreases fertility and quality of the land. Besides, accumulation of excessive water

120
in the field decreases efficacy of fertilizers and farmers ultimately end up using more
and more fertilizers. These improper practices (both excessive water and degenerated
soil) have a considerable impact over the environment and agricultural product
quality.
There are farmers who indicated that (I2, I5) they have already realized the impairment
caused in soil structure affecting agricultural product quality and yield. In more
sloping land, farmers can install drip or sprinkler irrigation systems which are much
more efficient irrigation methods; however, most of the agricultural producers avoid
employing those infrastructures due to higher costs. There are farmers who attempt to
install efficient irrigation systems in their fields partially, if not fully, as much as they
can afford. They indicate that governmental incentives (if there would be any) would
encourage making such kind of investments (I2).
However, these constitute a small group of farmers among the interviewees (2
farmers) and among the overall farmers in the city according to their statement, a great
portion does not attempt for that because they do not want to bear extra financial
burden due to such kind of infrastructure installments. The underlying reason for this
is that there is a common tendency in the region for not paying a price for water. The
interviews with local officials also confirm that great majority among the local
producers does not really pay the bills for water consumed in irrigation. As indicated
by a local specialist (I39), debt accumulation is so high that it is impossible for the
farmers to pay those bills, even if they sell their fields they still cannot pay off. Some
others believe that pricing for water is so high and should be reduced.
This is one of the major structural problems and a cultural issue in the region. It is a
common knowledge that a substantial number of local people consider water as
‘given’ and they do not feel obliged to pay any price for it. Moreover, there is a fallacy
in the region - farmers believe that ‘the more they irrigate, the more yield and high-
quality product they get’. One of the farmers reported that (I8):
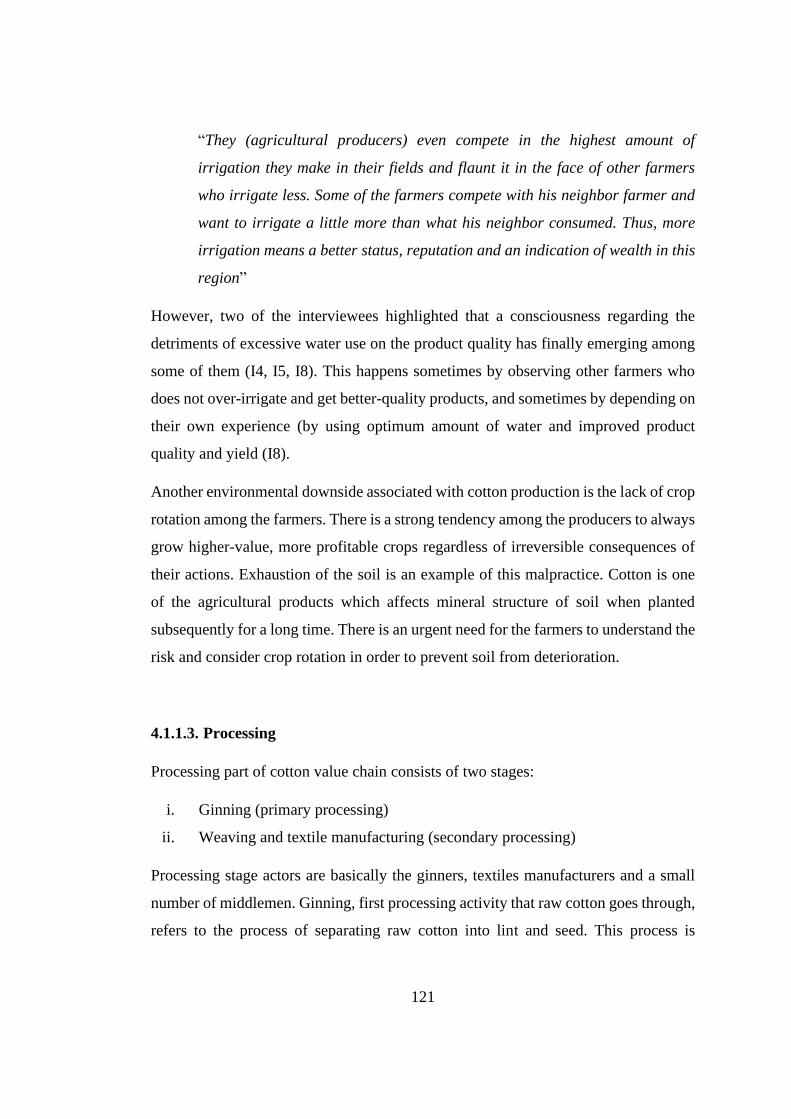
121
“They (agricultural producers) even compete in the highest amount of
irrigation they make in their fields and flaunt it in the face of other farmers
who irrigate less. Some of the farmers compete with his neighbor farmer and
want to irrigate a little more than what his neighbor consumed. Thus, more
irrigation means a better status, reputation and an indication of wealth in this
region”
However, two of the interviewees highlighted that a consciousness regarding the
detriments of excessive water use on the product quality has finally emerging among
some of them (I4, I5, I8). This happens sometimes by observing other farmers who
does not over-irrigate and get better-quality products, and sometimes by depending on
their own experience (by using optimum amount of water and improved product
quality and yield (I8).
Another environmental downside associated with cotton production is the lack of crop
rotation among the farmers. There is a strong tendency among the producers to always
grow higher-value, more profitable crops regardless of irreversible consequences of
their actions. Exhaustion of the soil is an example of this malpractice. Cotton is one
of the agricultural products which affects mineral structure of soil when planted
subsequently for a long time. There is an urgent need for the farmers to understand the
risk and consider crop rotation in order to prevent soil from deterioration.
4.1.1.3. Processing
Processing part of cotton value chain consists of two stages:
i. Ginning (primary processing)
ii. Weaving and textile manufacturing (secondary processing)
Processing stage actors are basically the ginners, textiles manufacturers and a small
number of middlemen. Ginning, first processing activity that raw cotton goes through,
refers to the process of separating raw cotton into lint and seed. This process is
122
conducted by local ginners in ginning factories. Ginners buy raw cotton mostly from
the farmers; however, there is a small number of middlemen who may collect cotton
of small producers whose produce is so small to be directly put on the market.
Middleman collects those small quantities of cotton from various smallholders and
markets them at reasonable amounts to the ginners (I19). Smallholders especially
prefer selling their cotton to the middlemen when they have no or limited access to
processing sector (I19). However, processors mostly prefer to buy cotton directly from
the farmers rather than the middlemen in order to avoid middlemen’s commission, and
to have more bargaining options; they indicated that middleman is quite rare in cotton
trade in Şanlıurfa (I24, I33). Providing cotton directly from the producers is cheaper
for the ginners. Also, middlemen in the area usually work informally, it is not a formal
institution.
When the cottonseed is separated from the lint in ginning, both goes into different
processes. Cottonseed is used to produce oil and seedcake (küspe); cotton lint is used
to generate yarn which is further used in making textile products, namely fabric (can
be raw, finished or dyed) and then garments (Feyso, 2018).
Ginning
The primary stage of cotton processing, ginning, basically refers to the process of
separating lint from the cotton seed. When cotton is arrived at ginning, firstly, it should
be brought to appropriate moisture level in dryers to be further processed. Next, it goes
through cleaning process to remove trash, dirt or foreign matters in it. Cleaned cotton
is then goes to the process of separating cotton fibre and cotton seed in the gin stand.
The raw fibre is called lint once it went through ginning process. At the end of the
ginning, lint is pressed and finalized in the form of bales to be transferred to following
processing steps. Ginning factories should be located in close proximity to the
production areas because ginning is a weight-losing activity and transporting raw
material would otherwise be quite costly. When raw cotton is separated as fibre and
123
seed, it losses almost half of its weight. Owners of ginning factories are generally
cotton producing farmers at the same time. Thus, they process their own produce and
these entities can be considered as family business.
There are several problems associated with the structure of ginning sector in Şanlıurfa.
The problems below are compiled based on the statements of ginners that have been
interviewed (I22, I23, I24, I25, I26, I27, I28):
- Short operation period: Ginning factories in Şanlıurfa province, as well as
other ginners in the region, actively operates in a very limited time period
during the year -only a few months following cotton harvest.
- Unutilized capacity: In addition to the short operating period, unutilized
capacity is a big problem for the ginning factories. This is particularly because
imbalance between the amount of cotton production and capacity of ginning
facilities in the city. Cotton production of Şanlıurfa supply approximately 50%
of the ginning capacity, thus, almost all gins operate under inefficient
conditions. The main problem emanates from the short period of operation and
unutilized capacity of ginning sector which make ginners unconcerned and
inattentive to the work they handle. Due to the high demand and limited
supply, ginners usually do not face difficulties in selling their products at the
market, Therefore, lack of competition decreases their sensitivity to quality
and value-adding. Due to the short working duration, they are also prone to
exploitation of labor and sometimes may employ workers informally (without
insurance).
- Lack of control and inspection mechanisms: There is not a controlling
mechanism or enforcement for ginning activities which makes them even more
careless. Most of the ginning factories in the region are owned by local
landlords who also has an influence over small farmers around them. Such a
non-institutionalized and non-corporate system does not allow trust building
from the perspective of advanced higher quality demanding textile
124
manufacturers in the region. According to textiles sector, imprecise attitude of
the ginners and malpractices in that stage are the primary sources of value loss
in cotton value chain. To achieve quality guaranteed supply from the ginning,
there should definitely be standardization and active controlling mechanisms
in this stage of the value chain.
- Uncertainties in cotton prices: Ginning factories in the area have very low
profit margins. During the ginning process outage and other losses cause total
amount of input to diminish. Together with operating expenses, ginning
factories sometimes even make loss. Under these circumstances, when cotton
prices are low, ginners tend to stock cotton rather than selling and wait until
prices increase.
- Low technological capacity: Ginning factories in the area stated that available
technology is an important factor in determining quality of the output they
produce. Short operating period together with unutilized capacity cause
ginners to avoid any improvement investments for their facilities, most of the
plants even need higher degree of maintenance. Due to limited financial
availability, ginning factories avoid making investment in modernization of
the existing technology. However, upgrading in technological capacity could
allow increased efficiency levels in production.
- Low Quality of input: Ginners emphasize that quality of the raw cotton they
are provided by the farmers is quite low. Most of the ginners argue that
especially improper practices of farmers such as wrong timing of using
chemicals or high contamination during harvest cause decreasing quality
levels prior to cotton’s arriving to ginning.
- Insurance: Ginners also complain about insufficient insurance services
provided for ginning factories. The requirements of insurance companies to be
qualified for insurance is overwhelmingly difficult for ginning firms. Given
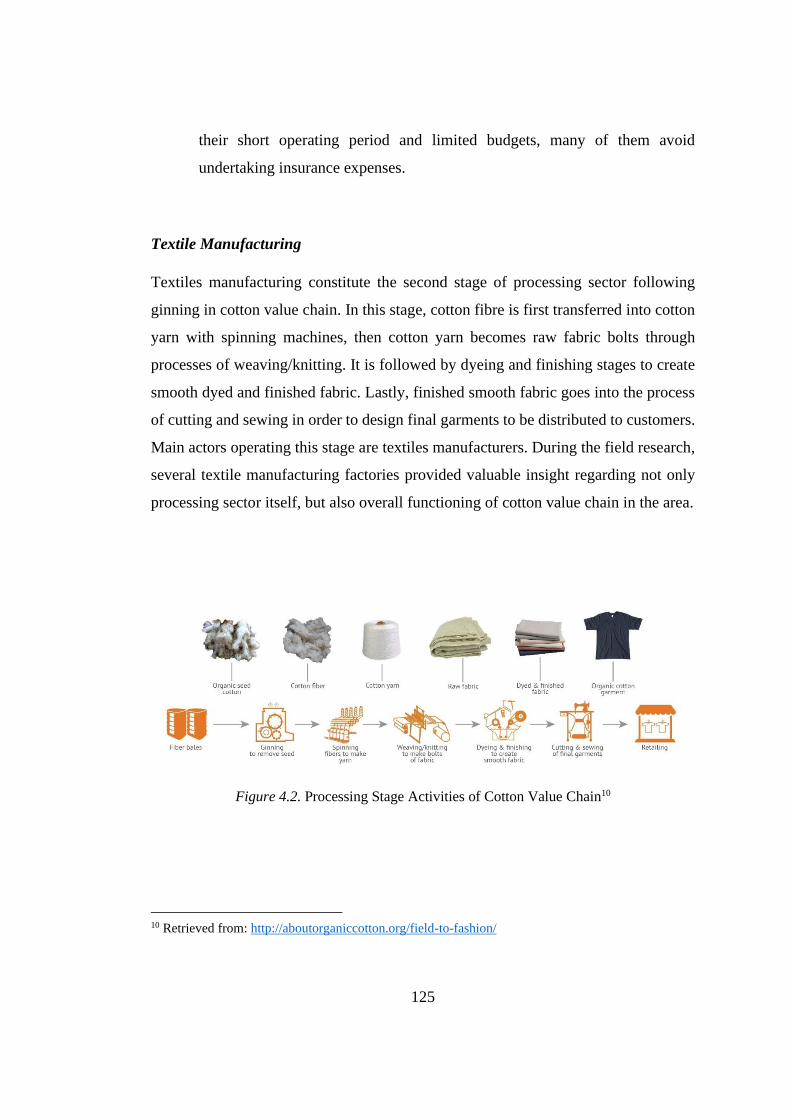
125
their short operating period and limited budgets, many of them avoid
undertaking insurance expenses.
Textile Manufacturing
Textiles manufacturing constitute the second stage of processing sector following
ginning in cotton value chain. In this stage, cotton fibre is first transferred into cotton
yarn with spinning machines, then cotton yarn becomes raw fabric bolts through
processes of weaving/knitting. It is followed by dyeing and finishing stages to create
smooth dyed and finished fabric. Lastly, finished smooth fabric goes into the process
of cutting and sewing in order to design final garments to be distributed to customers.
Main actors operating this stage are textiles manufacturers. During the field research,
several textile manufacturing factories provided valuable insight regarding not only
processing sector itself, but also overall functioning of cotton value chain in the area.
Figure 4.2. Processing Stage Activities of Cotton Value Chain10
10 Retrieved from: http://aboutorganiccotton.org/field-to-fashion/
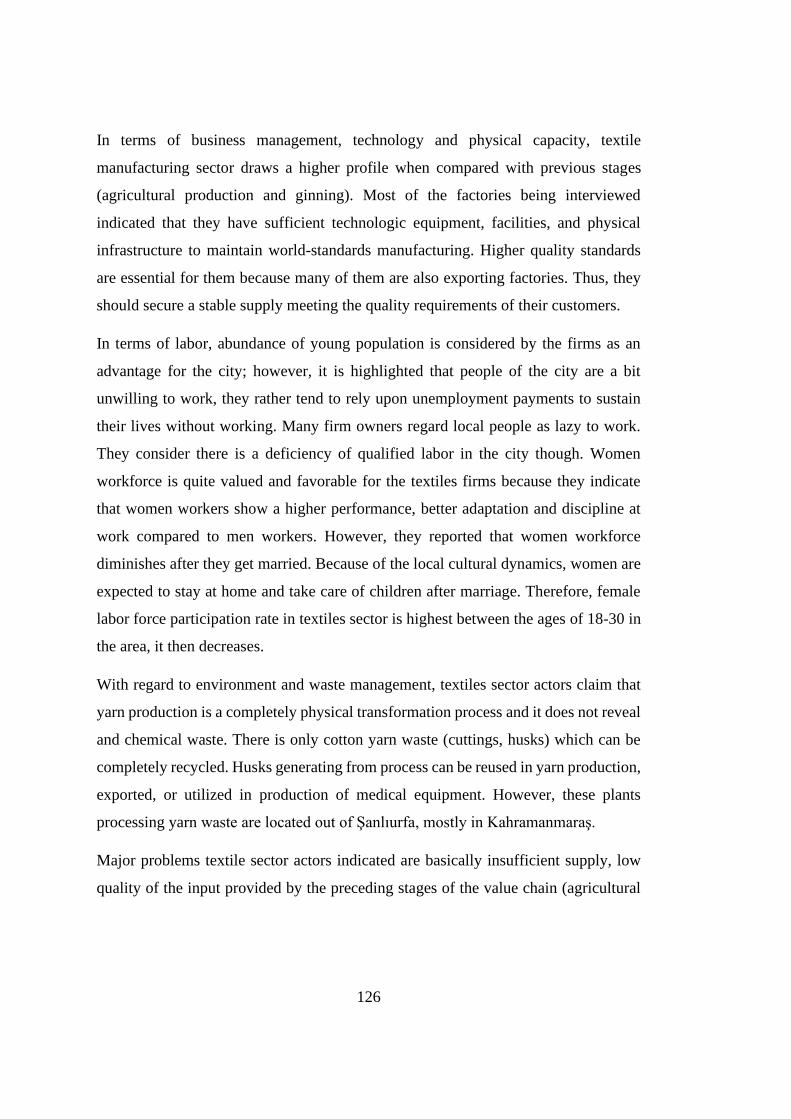
126
In terms of business management, technology and physical capacity, textile
manufacturing sector draws a higher profile when compared with previous stages
(agricultural production and ginning). Most of the factories being interviewed
indicated that they have sufficient technologic equipment, facilities, and physical
infrastructure to maintain world-standards manufacturing. Higher quality standards
are essential for them because many of them are also exporting factories. Thus, they
should secure a stable supply meeting the quality requirements of their customers.
In terms of labor, abundance of young population is considered by the firms as an
advantage for the city; however, it is highlighted that people of the city are a bit
unwilling to work, they rather tend to rely upon unemployment payments to sustain
their lives without working. Many firm owners regard local people as lazy to work.
They consider there is a deficiency of qualified labor in the city though. Women
workforce is quite valued and favorable for the textiles firms because they indicate
that women workers show a higher performance, better adaptation and discipline at
work compared to men workers. However, they reported that women workforce
diminishes after they get married. Because of the local cultural dynamics, women are
expected to stay at home and take care of children after marriage. Therefore, female
labor force participation rate in textiles sector is highest between the ages of 18-30 in
the area, it then decreases.
With regard to environment and waste management, textiles sector actors claim that
yarn production is a completely physical transformation process and it does not reveal
and chemical waste. There is only cotton yarn waste (cuttings, husks) which can be
completely recycled. Husks generating from process can be reused in yarn production,
exported, or utilized in production of medical equipment. However, these plants
processing yarn waste are located out of Şanlıurfa, mostly in Kahramanmaraş.
Major problems textile sector actors indicated are basically insufficient supply, low
quality of the input provided by the preceding stages of the value chain (agricultural
127
production and ginning sector), standardization, infrastructure, and risks associated
with geographical location of the area (I30, I31, I32, I33, I34, I35).
- Insufficient supply: Cotton production in the region and in Şanlıurfa is not
sufficient to meet the demand of textiles sector in the region. Thus, most of the
factories run under the capacity they could process if enough input is supplied
from the previous stages. This creates efficiency problems in firms and
operating under these circumstances bring extra costs. In order to utilize
available capacity, textiles sector imports cotton bales from various countries.
- Poor Quality cotton: The major factor affecting quality of the local cotton is
the high demand in the presence of low supply. On the strength of imbalance
between demand and supply, farmers and ginners believe that they can sell
their products no matter what quality it has because of low supply. They
assume that they can find a buyer in the market, so they do not make an effort
to provide high quality products to market. Major problem reported by the
textiles manufacturers is mixing cotton bales of different qualities in ginning
and contamination.
Textiles sector demands high quality input with low contamination levels. If
locally produced cotton does not satisfy the quality requirements of the local
buyers, they may increase the amount of imported cotton which is cleaner and
more appropriate to the requirements of the textiles manufacturers. Large scale
textile enterprises who had been interviewed indicated that out of 3 months
following cotton harvest, they usually import cotton to maintain production. In
addition to local cotton grown in Şanlıurfa, places that firms procure cotton
are mentioned as Bismil, Çınar Havzası, Silopi, Nusaybin in the region; US,
Brazil and some of the Turkic Republics among the international cotton
producers. When local cotton is compared with import cotton: the advantage
of the locally available cotton for the firms is that they can chose desired
quality at a relatively lower price. Extra costs such as transportation, logistics
128
and customs expenses sometimes constrain firms to import second-quality
cotton especially when currency rates are that high and national economy is
unstable.
Another quality problem stem from ginning stage is the mixing cotton bales of
different types or qualities during the stowage. Textiles manufacturers
highlight that it has, in fact, an easy solution that ginners can manage by
stowing cotton bales properly without mixing different types; however,
ginners consider this as an extra cost factor, so they avoid. Also, ginners do
not pay sufficient attention to the drying phase and let the cotton rest for a few
days before processing.
As reported by the textile manufacturers, foreign fiber problem is another
critical issue affecting quality of cotton products. The problem in ginning
sector is that they cannot guarantee supply of products free from foreign fiber
which is critical for textile manufacturers. Foreign fiber is one of the greatest
problems, together with contamination, causing value loss in the cotton value
chain.
- Standardization problem: Non-standardization of the locally grown cotton is
also another major problem for the processing sector. Classification of cotton
bales is mostly handled by ginners in Şanlıurfa by manually -hand classing. In
order to prevent value loss and efficiency losses appropriate standardization of
the cotton by its length, color, level of foreign matter, whether being hand-
picked or mechanized harvest seems necessary. Standardization enables easier
marketing of the cotton and cotton products in national and global markets.
Thus, in an attempt to ensure proper standardization in the sector, government
works for the implementation of ‘Tek Balya Sistemi’ -a regulation for proper
classification of cotton bales in ginning based on quality indicators such as
color, length, purity by instrument testing instead of manual allocation. With
this regulation, it is intended to preclude manual classification in ginning and
129
provide markets with more standardized product. Proper classification can
enable producers to market their products with better pricing and allow buyers
to access cotton with desired quality. It can increase efficiency and value-
adding in processing sector.
- Insufficient infrastructure: Another problem associated with the processing
sector is the inadequate infrastructure. Despite of the technical advancement
of textiles manufacturers, insufficient infrastructure in the industrial areas,
especially power cut-outs which interrupts production is reported as an
important problem. Higher energy prices (compared to the other textile
manufacturing countries) are also reported as a disadvantage undermining
competitiveness of local textile sector by increasing production costs.
- Locational risks: There are region-specific risks coming from geopolitical
position of the area. Characteristics such as locating on the border of Syria and
previous terror incidents impose region-specific risk which sometimes make
firms refrain from making investments in GAP Region cities. Being located in
a high-risk area sometimes causes difficulties in access to loans and bank
credits for the firms. Besides, cotton grown in Şanlıurfa also seems investors
a little risky in terms of stock and raw cotton supply because, unlike Diyarbakır
or other cities that have been growing cotton for a long time, quality and
characteristics of cotton grown in Şanlıurfa may widely vary by session.
On the other hand, firms expressed that they benefit from industrial incentives and
subsidies because of Şanlıurfa’s becoming a priority region for development. Many of
the interviewed firms (4 out of 6) highlighted that especially during the establishment
of the firm and its improvements, they used these governmental aids. Since GAP
Region is among the priority regions in development, establishing firms in this area is
relatively less costly due to the government based financial aids which is an advantage
for the region.
130
4.1.1.4. Logistics
Logistics activities in cotton value chain in Şanlıurfa comprise of transportation of
inputs and products between the value chain stages, storage and distribution. Both
agricultural production and ginning stage actors implied that their outputs do not wait
long time before transferring to the next stage, therefore they are not in need of extra
or improved storage facilities. Raw cotton is directly transferred to ginning factories
immediately after the harvest, and to the textile factories after ginning. Most of the
storage activities is handled in textile plants. However, an important problem
associated with storage of ginning factories is that cotton bales of different qualities
can frequently be mixed here. This problem is reported by the textile manufacturers
who are negatively affected from this mishandling. Mixed cotton bales with different
quality and cotton characteristics decrease efficiency in textiles processing and cause
significant value losses.
Transport services between those stages is mostly operated by the actors themselves.
For example, farmers transport raw cotton to the ginners or ginners go and get the
produce from the farmers with their own transport vehicles. Textile factories as well
transport their products from the ginners and to the retailers by their own means or
through logistics companies.
4.1.2. Governance
When the relationships among the actors which govern the value chain are considered,
it is possible to observe the power of brand-name textile companies in cotton value
chain in the study area as well as other value chains around the world. However,
Şanlıurfa case shows a lot of different parameters and dynamics affecting the forms
of governance in the area. For this reason, the relations can be examined by different
groups including conventional cotton production, organic cotton production and better
cotton production.
131
In conventional cotton production, it is possible to observe typical market relations
where buyers and seller are free to change partners. Complexity of information related
to transaction is basic and easy to access since cotton is a basic commodity.
When we think about organic cotton case, higher degree of monitoring and control of
a contracting farm is observed. This contracting firm shows an explicit power and
influence over the production methods. Breaking the contract is almost impossible for
the supplier and causes high costs. Therefore, it is possible to classify this relationship
as a captive governance.
In better cotton production, the influence of global-buyers or brand name companies
was observed more clearly. Better cotton producers that we have interviewed
underlined that the influence of these global brand-name companies and their
commitments to change their supplier channels toward more sustainable cotton
production in a few years encouraged them to produce better cotton (I12, I13). They
also indicated that working for those global companies and producing a higher-value
product are the main motivational factors for their decision to transfer from
conventional cotton to better cotton production. However, since better cotton
production is not maintained by contracting, we cannot name this as a captive
governance relation.
It is also worth to mention the influence of input suppliers over farmers, which is
thought to be a unique situation in this location. Most of the farmers interviewed told
that input suppliers are their primary source of information regarding market
conditions, prices, new products etc. Moreover, farmers sometimes get technical
assistance from them and consult if they have a problem regarding their produce. A
strong relationship is observed between the farmers and those input suppliers.
Another powerful group of actors influencing the value chain in the region is local
governing bodies and institutions, namely GAP RDI and Ministry of Agriculture and
Forestry’s Şanlıurfa Directorate. These are the actors encouraging farmers towards
product upgrading (for better and organic cotton), organizing training and education
132
programs to improve farmers, taking measures and impose sanctions in order to
prevent miss-practices in the fields that lead to low quality products.
4.1.3. Economic Analysis
Economic analysis discusses ‘barriers to entry and rent’ (Kaplinsky, 2004), ‘demand
for value chain outputs’ (FAO, 2013), ‘analysis of input-output markets’ (FAO, 2013),
and distribution of value added along the chain aspects of the cotton value chain in
Şanlıurfa.
4.1.3.1. Barriers to Entry and Rent
The greatest economic rent in the area comes from ownership of different land-sizes -
where land is considered a scarce resource to which farmers have unequal access. Big
landlords and large-scale producers enjoy from this rent while smallholder farmers
and renters are most of the time excluded from several benefits. For example, when a
contracting firm establishes new agreements in the area, they prefer big landowners
because it is easy to agree with one person rather than making several agreements with
many individual small farmers. Due to such kind of burdens that firms want to avoid,
small-scale producers have the risk of being excluded from new opportunities. This is
also called ‘resource rent’ which provides advantages to its holder (big land owners).
In terms of barriers to entry, it is possible to observe it in organic cotton production.
As it is explained earlier (I39), because of very high costs of inputs and certification
expenses, it is impossible for small-scale farmers to enter organic cotton market
individually. Given the contracting firms’ tendencies toward working with large-scale
landowners to make procedures and agreements easier (I29, I39), small-scale farmers
face strong barriers to entry to the organic cotton production.
133
4.1.3.2. Input-Output Markets and Demand for Value Chain Outputs
For the agricultural production stage of the cotton value chain, producers have access
to inputs; however, inputs are quite expensive for the farmers. The reason for that (as
it is explained in the related section) is the inputs used in cotton production are mostly
imported, and highly dependent on fluctuating currency rates. High foreign exchange
rates make input prices even higher which puts extra financial burden on farmers’
budgets. One of the interviewees underlined that they use the most expensive energy
(oil for machinery or electric power) in the world so they can never compete with other
cotton producers around the world. In terms of output market, all of the farmers we
have interviewed told that they have no problem in selling their products in the
national markets. Locally produced cotton is mostly processed factories in GAP
Region. Local textile firms are the major buyers of locally produced cotton. Since the
supply of cotton is quite less than the need, farmers can usually sell all their produce.
From the perspective of processing sector, textile firms complain about the insufficient
local cotton supply. They indicated that out of 3-4 months following cotton harvest,
they must import their main input -cotton- from outside sources, mostly from the
United States, Brazil, Uzbekistan, Burkina Faso and Benin (I32, I33, I34). They told
that the cotton fibre they use from the international markets varies between 30 – 50 %
of total cotton required. When we asked textile firms about their output market, they
also informed that there is no problem in selling their products in the market. While
some of the firms supply national markets in İstanbul, Çorlu, Denizli, Bursa where
textile sector is concentrated, some of them supply international markets including
Fas, Russia, Brazil (I34, I35).
4.1.3.3. Distribution of Value Added Along the Chain
In order to understand how value-added changes between the stages and actors of
cotton value chain we tried to trace monetary value of cotton along the chain; however,
sometimes it was difficult to grasp exact price information.
134
For the production stage, average cost of producing cotton is found as 3.55 TL/Kg.
according to the Cotton Sectoral Report (2018). The average of selling prices reported
by the farmers during the interviews is 2,9 TL per kilogram, as 2,6 being the minimum
and 3,5 being the maximum prices reported. When 0,80 Kuruş agricultural subsidy for
cotton is added, Total revenue for a farmer can be calculated (based on the average
production cost and selling prices) as 4,35 TL for a kilogram of cotton.
When a ginner buys cotton at this price, after adding the production costs for ginning,
overall average cost for ginners is reported as 8,4 TL/kg. and average selling price is
reported as 11.5 TL/Kg for cotton bale.11
It is difficult to trace prices after ginning because in textiles manufacturing final
product variety increases too much. When there are extensive products and several
expense items for each of them, it requires product specification among several final
outputs of the textile firm to see price difference between the costs and profits.
However, as it is argued by one of the informants (I29) that “…when you consider a
brand-name textile company can sell a basic t-shirt more than 200 TL…”, profit
margins can increase significantly in the processing sector of the value chain and this
margin even exceeds when the product is labeled as produced from organic or better
cotton.
11 For ginners, the minimum reported price for the costs is 6 TL/Kg and maximum is 11,5 TL/Kg; for
selling prices, the minimum reported price is 11 TL/Kg. and the maximum is 12 TL/kg.
135
CHAPTER 5
5. UPGRADING ACTIVITIES IN COTTON VALUE CHAIN
The previous sections discussed the dynamics of cotton value chain in Şanlıurfa. It is
followed by existing upgrading strategies adopted in cotton production as means of
improving value generation. These topics were discussed in order to understand how
cotton value chain in Şanlıurfa can be improved in an economically and
environmentally sustainable manner -with particular focus on agricultural production.
In this section, the thesis discusses the second research question ‘How the terms and
positions that agricultural producers integrated into cotton value chain can be
improved.’
After a general examination of value chain dynamics in the previous section, this
section particularly focuses on agricultural producers because preliminary research
revealed that agricultural production is the most problematic stage of the cotton value
chain in Şanlıurfa. To discuss ways of improvement in the farmers’ engagement in
value chain we search for these sub-questions below:
- How does adopting upgrading strategies affect the position of farmers in the
value chain? In other words, does upgrading improve the terms and conditions
they are integrated into the cotton value chain and cause a value increase?
- What are the attitudes of farmers towards upgrading (Upgraders vs Not-
Upgraders) and factors affecting their upgrading decision?
- What are the differences between planning solution and market solution on
upgrading?
For the first sub-question, in order to measure the effects of upgrading on the farmers,
we examine some indicators showing what outcomes existing upgrading strategies has
led to. These indicators are: increase in unit prices for cotton, vertical coordination
136
(contract farming), horizontal coordination, environmental improvement, increased
learning and knowledge, and increased exports and access to different markets. The
thesis investigates whether these indicators take place due to upgrading activities and
how they impact the engagement of farmers with the cotton value chain. We
specifically look for whether upgrading enhances farmers’ position in the market and
advances the terms or conditions they are integrated into the value chain.
The second sub-question listed above investigates attitudes of farmers towards
upgrading and factors affecting their decision for whether to adopt upgrading
strategies or not. The main purpose here is to understand the motivations of the
upgrading farmers, what factors lead to this decision and attitudes of the ones who do
not attempt to upgrade. From the policy making perspective, answering this question
will contribute to making more precise and appropriate policy interventions to
empower local producers and enhance their position.
The third sub-question of this section investigates the difference between the planning
solution and market solution in upgrading activities in production stage of the cotton
value chain in Şanlıurfa. Upgrading through organic cotton is considered planning
solution because it is encouraged by the government subsidies in order to promote
quality of the cotton produced and supply market demand toward organic production.
Agricultural subsidies are one of the most critical determinants for the farmers’
decision to cultivate a specific product or not. On the other hand, upgrading through
better cotton is a market solution for problems associated with traditional conventional
cotton production and increase product quality. There is no agricultural support for
better cotton. It works on a voluntary basis and managed through market dynamics.
Answering this question will provide valuable insight into understanding advantages
and disadvantages associated with market and planning solution to the problems and
enable comparing these two approaches.
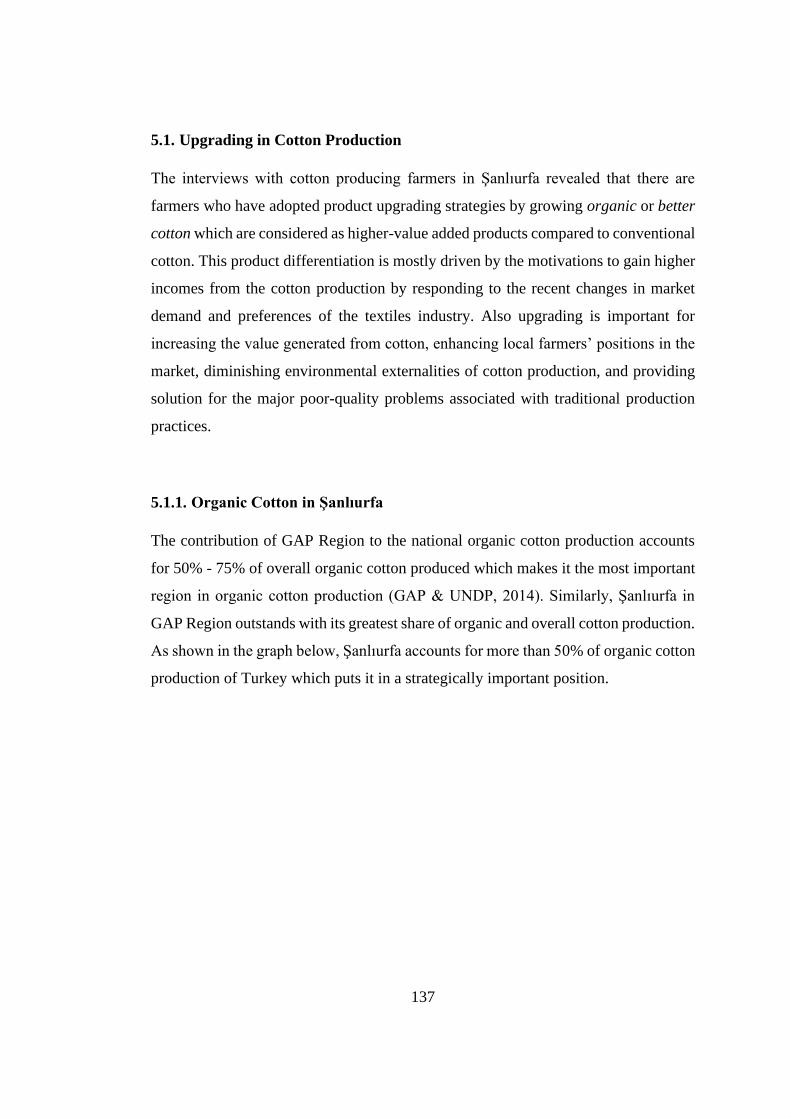
137
5.1. Upgrading in Cotton Production
The interviews with cotton producing farmers in Şanlıurfa revealed that there are
farmers who have adopted product upgrading strategies by growing organic or better
cotton which are considered as higher-value added products compared to conventional
cotton. This product differentiation is mostly driven by the motivations to gain higher
incomes from the cotton production by responding to the recent changes in market
demand and preferences of the textiles industry. Also upgrading is important for
increasing the value generated from cotton, enhancing local farmers’ positions in the
market, diminishing environmental externalities of cotton production, and providing
solution for the major poor-quality problems associated with traditional production
practices.
5.1.1. Organic Cotton in Şanlıurfa
The contribution of GAP Region to the national organic cotton production accounts
for 50% - 75% of overall organic cotton produced which makes it the most important
region in organic cotton production (GAP & UNDP, 2014). Similarly, Şanlıurfa in
GAP Region outstands with its greatest share of organic and overall cotton production.
As shown in the graph below, Şanlıurfa accounts for more than 50% of organic cotton
production of Turkey which puts it in a strategically important position.

138
Figure 5.1. Share of Organic Cotton Production of Şanlıurfa in Turkey (Özüdoğru, 2017)
Considering this great potential, there are valuable attempts in the region to exploit
this opportunity. GAP Organic Agriculture Cluster Project was one of the biggest
projects conducted in the region. The project was implemented by GAP Regional
Development Administration (GAP RDA) in technical cooperation with United
Nations Development Programme (UNDP). Despite of its abundant resources and
potentials, the region has a long history of being one of the least-developed regions in
Turkey. The project12 underlines that, the problem arises from the region’s
concentration on lower-value-added segments of value chains that it participates.
Fulfilling the organic agriculture potential of the region to enable transferring into
higher value-added economic activities and eventually contributing to the sustainable
development of the region is the main concern of the project.
12 http://www.gap.gov.tr/en/gap-organic-agriculture-cluster-project-page-24.html last accessed August
2019
0%
10%
20%
30%
40%
50%
60%
70%
80%
90%
2005 2006 2007 2008 2009 2010 2011 2012 2013 2014 2015 2016
139
Despite of the great potential of the city in cotton production, recent agricultural
practices in cotton cultivation are quite problematic (as discussed previously). To
summarize again, yield instability is a problem impacting sustainable income
generation and increasing risks for the farmers. Elevated degeneration of the soil and
salinization due to over irrigation impose significant risks for the long-time fertility of
the soil. Local cotton farmers are highly dependent on external inputs which put
excessive financial burden on farmers’ budgets. Local producers do not have direct
access to international cotton markets. Even if they get access, due to the lack of
standardization and lower quality products, they would not have a good bargaining
position in specific markets. All these conditions imply that recent agricultural
practices cause significant value-losses for the region.
Organic cotton, in this respect, can be regarded as a product upgrading which not only
leads to higher-value generation out of cotton produced in the region but also may
have the potential to solve several problems of the local cotton producers in the area.
From the value chains perspective, transition from conventional to organic cotton, as
a product upgrading method, means improving the quality and standards of the
products which results higher returns and increased value-added.
Production stage of organic cotton value chain in Şanlıurfa is mainly organized and
governed through contract farming, by a leading contractor firm. The
contracting/buyer firm is the key leading actor in this stage who is responsible for
various tasks including:
- Organic input supply for the farmers
- Technical assistance and consultancy
- Enabling access to markets (marketing)
During the interviews, it is emphasized that special inputs which are required for
organic production are extremely expensive for local farmers to afford. Thus, the first
responsibility of the buyer/trader firm is procuring required organic inputs for its
140
contracting farmers as part of the agreement. Firms also indicate that those inputs are
only available in bulks so that farmers individually cannot order them. Firms, instead,
procure these materials and distribute to farmers as needed. (I29)
Second, buyer firm provides technical assistance whenever farmers need -from
plantation through harvesting. Organic cotton production is quite new and challenging
for traditional cotton farmers who are used to practice conventional methods. Breaking
this routine first and foremost is a psychological challenge for the farmers (I39, I40).
For example, during the interviews both local experts and farmers underlined that
adaptation to irrigation requirements in organic cotton production is the most difficult
challenge for the cotton producers who are used to over-irrigate for years (I38, I40,
I9). Unfortunately, there is a common misbelief in the region that the amount of water
used in irrigation is associated with the higher amount of yield. Thus, farmers tend to
overconsume water in the field which is one of the major problems in conventional
farming. Besides amount of water consumed, the fertilizers and pest control materials
used in organic production differ from conventional cotton farming and farmers
associate the amount of these materials they use with the level of yield. In other words,
they believe the more they use these chemicals and fertilizers, the greater yield they
get in harvest season. New practices of organic production make farmers afraid of that
the yield levels will decrease due to not using the traditional chemicals and fertilizers
they have been excessively using from the beginning. These old habits create
psychological barriers for the farmers against transition to new practices of organic
cotton production.
Another responsibility of the buyer (contracting firm) is enabling access to markets.
Unfortunately, farmers’ trade network in Şanlıurfa does not go beyond the local
ginning factories to which they sell their cotton. Lack of a well-developed licensed
warehouse system is an important reason for the limited trade options for the area.
Licensed warehouse system is required for proper storage of cotton and marketing it
through the year (especially when cotton prices are higher). Now, cotton is sold to
ginners and then to manufacturers immediately after the harvest. Also, licensed
141
warehouse system would provide farmers with electronic product bills which they can
use to market their products in different markets. In addition to this, local farmers do
not sell their cotton in any futures exchange. Financial literacy is one of the areas that
local producers should improve in order to access various markets, maintain a more
stable income, and decrease uncertainties arising from price fluctuations. Contractors
enables marketing of local cotton to various domestic or foreign markets since they
have well-developed network connections compared to the farmers.
5.1.2. Better Cotton in Şanlıurfa
Better cotton in GAP Region is produced in Şanlıurfa and Diyarbakır provinces. The
region accounts for more than 50% of the area under better cotton production and
amount of better cotton lint produced in Turkey (I42).
Similar to organic cotton production, better cotton is also an important contributor to
diminishing negative externalities of cotton production in the area. As parallel to the
criteria and standards of better cotton, pesticide and synthetic fertilizer usage
diminishes in better cotton production compared to traditional / conventional cotton
farming. Better cotton promotes using organic fertilizers and lower volumes of water
for irrigation. These environmental benefits contribute to the sustainability of cotton
production in the area which was already threaten by damaged natural resources such
as degenerated soil structure, salination or decreased irrigation water levels. In
addition to the environmental dimension, better cotton production requires farmers to
meet some social standards such as eliminating child labor or gender equality in cotton
production (I42, I43, I44).
Prevalence and familiarity to better cotton differs among the farmers interviewed. One
of the cotton producers stated that they (as a whole village) have never heard about it
and nobody around them produces better cotton (I6). He stated that there farmers who
have no knowledge of upgraded cotton production. Another group is familiar with
better cotton concept. When we ask how they are informed about it, the answers reveal
142
that advisers from the Ministry of Agriculture and Forestry’s Şanlıurfa Directorate
introduced better cotton and provide technical consultancy about it (I1). Some farmers
are informed through IPUD (I12, I13). A large proportion of the farmers are
introduced by ginners they work with and highly encouraged by them to cultivate
better cotton (I25). A leader farmer in the community who cultivates better cotton is
also the greatest driver for the proliferation of better cotton because when farmers see
someone in a better position relative to them (for example a large-scale farmer) doing
something new and getting better result, they find the courage to try as well (I10).
Besides, smallholder farmers are generally risk-aversive, so they avoid uncertainties
and trying new methods as opposed to traditional practices they have been doing for
years. Large scale farmers, on the other hand, are more open to uncertainties (I42). As
a result, we can infer that information channels, access to information and a
leader/model are the critical factors for upgrading to better cotton. Economic
profitability and increased/sustainable income are, of course, the underpinning
motivations behind all.
Prices for better cotton also quite uncertain, vary depending on the market demand at
that specific time. Farmers producing better cotton say that profit they make from
better cotton is not so much different from conventional cotton; however, they keep
producing better cotton because of the brand value it has (I12, I13). During the
interviews, farmers highlighted that it is valuable for them to supply global brand-
name textile companies who use better cotton in their supply chains (I12, I13). They
believe that actual value of better cotton as a brand will be soon well-understood. The
main customer of better cotton produced in Turkey is the exporting textile companies.
They especially supply European and Western markets who rises demand for products
made from better cotton. Some of the global brands specifically search for certified
better cotton (I30).
When compared to organic cotton, local experts and value chain actors we have
interviewed argued that better cotton seems more favorable to the local cotton farmers
due to its more moderate requirements compared to organic production (I40, I42). The
143
standards and criteria farmers are required to meet to get certified for better cotton
production are easier to accomplish and less restricted than organic cotton. Better
cotton is not implemented through contract farming unlike organic cotton production.
It is produced on a voluntary basis -no contract required- and at the end, farmers are
free to sell their products in the market as they want. Another difference is that better
cotton is not included in agricultural subsidies unlike organic cotton. This is reported
as the biggest disadvantage discouraging farmers from better cotton. Better cotton
producers wish that it is also become a supported crop as soon as possible.
5.2. Impacts of Product Upgrading on Cotton Farmers in Şanlıurfa
In order to measure the impacts of product upgrading on cotton producers we can
examine some indicators including; increase in unit prices for cotton, vertical
coordination (contract farming), horizontal coordination, environmental
improvement, increased learning and knowledge, increased exports and access to
different markets. The aim here is basically to illustrate whether product upgrading
cause an increase in the indicators listed above based on the statements of value chain
actors.
5.2.1. Increase in Unit Prices for Cotton
As it is indicated previously, organic cotton and better cotton are the two main
upgrading strategies practiced in the area which have the potential to increase unit
prices for cotton and enable creating higher value-added product.
Pricing of Organic Cotton
Normally, it is expected that due to its higher-quality and sophisticated nature, organic
cotton production should reveal more profits and higher returns for the producers.
However, in practice, organic cotton production could not provide farmers with the

144
expected increase in returns. Conversely, it brings extra costs for the producers. The
reasons for decreased returns are explained below as (I2, I3, I4, I5);
- Higher production costs related to organic cotton production
- Lower yield in organic cotton production
Increases in production costs for organic cotton are mostly due to the different
practices adopted in the processes of cultivation, expensive inputs such as using
certified organic seed, ecological crop protection methods and materials, and efficient
irrigation systems which cost relatively higher. The most affecting factor is the lower
yield in organic cotton. Getting less product at the end of the harvest reduces farmers’
overall revenues considerably. Farmers try to balance price difference with
agricultural supports for organic cotton. These subsidies are the main motivation for
the farmers to produce cotton.
Pricing of Better Cotton
Similarly, farmers indicated that better cotton sale price does not make a considerable
difference from conventional cotton (I9, I10, I12, I13). Some of the stated price
differences between better cotton and conventional cotton indicate approximately 5 %
- 7% increase (I1). However, this increment is not considered sufficient by the
producers. One of the farmers even indicated that prices should be as higher as 20% -
25% for the better cotton to be considerably motivational for everyone (I4, I5).
Similar to organic cotton, expensive input prices and lower yield are main problems
affecting profits in better cotton too. Different from conventional cotton production,
better cotton requires biological pest control methods or more natural fertilizers which
are more expensive and less protective compared to traditional fertilizers and pest
control chemicals; however, more environmentally sensitive (I1)
Prices are quite uncertain and always subject to change depending on the market
demand and supply. It is possible to gain higher returns, while there is no guarantee
145
and one may end up selling his better cotton almost as the same price with
conventional cotton (I43, I44). However, it is indicated that it is almost impossible to
get great increments in sale prices for now.
Different from organic cotton, better cotton production is not subject to subsidies, so
it is another drawback for the farmers (I9). In other words, despite their efforts to
improve the quality of the product, there is no extra incentive from the government -
which was an important motivation in organic cotton production (I9).
However, it is worth to note that, even though both organic and better cotton
production do not provide significantly higher returns when compared to conventional
cotton production (which is considered not only more profitable but also less
demanding and effortless to produce), there seems an increasing trend in both of them.
Many farmers indicated that they are already trying or determined to plant organic or
better cotton in a small part of their fields (approximately around 20-25% of the total
cultivation area to begin with) to experience and see the results (I1, I4, I5). In addition
to this, farmers who are already actively involved in organic or better cotton
production indicated that they plan to expand or increase production (I12, I13, I25).
Even if gains from better cotton are not so much different from conventional cotton
(when extra effort that put into better cotton production practices are considered as
well), producers are intended to grow better cotton because they believe prices will
increase due to the accelerating demand for better cotton from the global brand-name
textile companies such as Adidas, Nike, GAP, H&M etc.(I10, I12, I13). Also, brand
value of the better cotton is reported as a motivational factor to keep producing it even
though low returns (I12, I13).
5.2.2. Vertical Coordination and Contract Farming
Organic cotton is mostly produced via contract farming in Şanlıurfa. Generally,
organic cotton trading firms organize and govern organic production in the area. It is
a win-win position both for the farmer and for the firm for several reasons. From the
146
perspective of firms, contract farming ensures a sustainable supply with desired
quality or requirements for a targeted period. From the perspective of the farmers, the
best advantage of contract farming is that contracting firm undertakes all the risks.
Farmers get a guarantee price -which was settled at the beginning of the agreement-
to sell their produce at the end of the season. Normally, prices are quite uncertain and
tend to fluctuate depending on market demand and fluctuations in foreign exchange
rates. Contracting firms mostly offer a buying price which is relatively higher than the
market prices at that specific time. Thus, having a guarantee selling price from the
beginning relieves the farmers. Contractor firm is also responsible from providing all
necessary inputs to the farmers and pay for the certification documents. In other words,
contracting firm bears all the extra expenses occurred to the farmer due to producing
organic cotton (compared to the expenses of conventional cotton) so eliminates the
risks and uncertainties associated with organic cotton production for the farmer.
The interviews with local governing bodies (GAP-BKI), firms and farmers revealed
that organization of organic cotton production in the region is mostly managed by the
private firms involved in organic cotton trade, and there is a consensus on that ‘farmers
cannot manage organic cotton production individually and/or separately – it requires
a collective action’ (I29, I39). Thus, organic cotton production in the region almost
completely practiced through contract farming -exception to this is the farmers who
indicated that they try planting organic cotton in a small part of their fields mostly as
an experiment before fully involved in.
There are several reasons that organic cotton production seems almost impossible
without a contracting firm. These are (I29, I39);
- First of all, organic cotton production requires specific procedures that local
farmers in Şanlıurfa have no practical or technical knowledge of it. These
specific procedures for organic cotton are also significantly different from the
traditional practices that local farmers have been doing in the region for years.
The most apparent example for this situation is the input use. Farmers in the
147
region unfortunately have a bad reputation for using excessive water,
chemicals and fertilizers in cultivation which ultimately exploits soil and water
resources. Organic cotton production requires considerably less water use
compared to conventional cotton, ecological fertilizers and biological pest
control. All these different practices, especially using considerably less water
for irrigation, creates a psychological barrier for the farmers, and they believe
that the less water they use, the less yield they get from the harvest. In other
words, it is psychologically quite difficult for them to change their old habits
and routines ones they shift to organic cotton production. Contract farming at
this point provide farmers with technical assistance and training regarding new
practices they should follow.
- Second, organic inputs such as organic fertilizers or organic agricultural pest
control are much more expensive for farmers to afford. Contracting firms
indicate that, farmers cannot even have access to organic inputs without a
contracting firm since those materials are mostly ordered in large parties.
Therefore, obtaining those inputs individually seems both economically and
technically impossible for the farmers.
- Third, if farmers individually enter the market and try to sell their organic
cotton, the price is determined by the instant supply and demand for organic
cotton. It means that there is no guarantee that they will be able to get a
reasonable price allowing them to make profit. However, in contract farming
firms and farmers agree on a pre-determined selling price at the beginning, so
farmers do not have any concerns about not being able to sell their organic
cotton at a reasonable price.
- When doing organic cotton, farmers have to obey crop rotation rule and plant
other crops (such as wheat and lentil for the case of cotton) in order to protect
soil structure and the balance of the minerals in it. As a result, sometimes
during the year, farmers get organic wheat and/or organic lentil which are quite
148
costly to produce and difficult to sell in the market at that high prices.
Contracting firms also guarantee to buy these other organic products which
have quite limited demand in markets.
Besides contract farming, during the interviews it is emphasized that product
upgrading is more advantageous for the farmers who also have ginning factories (I29).
Almost all of the ginners in the area are farmers at the same time -as an example of
vertical coordination. Local experts (I29, I39) highlight that organic cotton business
is only profitable if an organic cotton producer is also an organic cotton ginner. This
is particularly because number of organic ginning factories are quite low in the area
and all ginners have their designated farmers. These farmers make pre-agreements
with the organic ginners to sell produced cotton to them, so organic ginners prefer
buying from their previously agreed suppliers. An individual organic cotton producer
has the risk of not being able to sell his product to a random organic ginner. Besides,
farmers cannot benefit from organic cotton subsidies before selling their product to
ginners and getting a document called ‘müstahsil makbuzu’ (producer receipt).
Subsidies are paid based upon this document. If an actor is both a farmer and ginner
at the same time, he have the opportunity to grasp more gains due to carrying out two
stages of the value chain. Vertical coordination in organic cotton, in this respect, seems
more advantageous for the parties involved.
5.2.3. Horizontal Coordination
Product upgrading in cotton production requires farmers’ horizontal coordination in
several aspects. The advantages of horizontal coordination can be examined both from
the perspectives of agricultural producers (as sellers) and buyers. In terms of farmers,
collectivity enable easier access to expensive inputs, resources and infrastructure. As
it is discussed in organic cotton case earlier, such kind of special inputs are quite
expensive and only available in large amounts (as bulks). Farmers cannot obtain these
inputs (such as organic seed, fertilizers or biological control) individually in small
149
quantities. Second, horizontal coordination enables access to different markets and
buyers due to large amount of supply provided by collectivity and empowers farmers
in better bargaining positions when they take action together. From the perspective of
buyers, farmers’ coordination is desired because firms get the opportunity to access
sufficient amount of supply in this way. Otherwise, especially when smallholders
dominate the production, downstream actors may have problems to procure raw
materials in sufficient amounts at one time.
In Şanlıurfa case, there is a cultural drawback that prevents farmers taking collective
action. The farmers we have interviewed underlined that the culture of ‘ağalık’ is one
of the greatest obstacles for horizontal coordination in this area (I16, I18). Ağas are
generally the large landowners and they are the first choice of contracting firms or
other buyers most of the time due to their capacity to provide great amounts of supply
at one time. However, the social status they possess because of being an ağa prevents
them taking cooperative action with other medium and small-scale farmers (I8, I30).
During the interviews, local experts especially underlined the necessity of horizontal
coordination in organic cotton, and, an urgent need for an actively operating
cooperative of cotton farmers (I29, I39). They argued that this is particularly important
because organic market requires connectivity among the farmers, ginners, contracting
firms and textile manufacturers. Ones organic cotton is not processed in organic
ginning or textile mill, there is no value out of it. Besides, organic production requires
mandatory crop rotation to keep the health of the soil structure available for organic
production. In Şanlıurfa; however, farmers prevent cultivating other rotation crops
such as lentil because they are not as profitable as cotton and there is no market for
organic lentil. Horizontal coordination would enable farmers to be able to market also
these rotation crops in larger quantities and access to foreign markets where demand
for such kind of products is exist. Individually, quantities are not appropriate to access
different markets. To sum, horizontal coordination is not only a pre-requisite for well-
functioning of the organic cotton chain, but also a requirement for the farmers to gain
more profits out of organic prodcution.
150
In terms of better cotton, it naturally works in a more suitable manner for collectivity.
This is because Field Facilitators in better cotton production creates their own
Production Units (PUs) and each PU is comprised of a group of farmers. Also,
licensing in better cotton is made to a group -not to the individual farmers- so farmers
should first create a group to be a licensed better cotton producer. Moreover, farmers
benefit from training courses for better cotton practices, principles and standards as
groups.
5.2.4. Environmental Improvement
Cotton, by the nature of itself, is not an environmentally-friendly crop because it
requires vast amount of water in irrigation. Also, there are several local diseases that
make farmers use lots of chemicals (pesticides and herbicides) which deteriorate soil
structure and decreases its fertility. Another contributor to diminishing soil fertility is
the excessive use of fertilizers in the cotton fields of Şanlıurfa. Organic and better
cotton in this respect, are the two mechanisms that can decrease detrimental impacts
of cotton production to the natural resources because these practices promote using
more natural inputs and sustainable methods in cotton cultivation. However, recent
share of organic and better cotton production in total cotton produced in the region is
quite small and it should be increased in order to get more significant positive impacts
on the environmental sustainability.
It is already possible to discuss some achievements though. For example, farmers
experimenting organic cotton production (even in a small portion of their land) stated
that they have started to use less irrigation water by installing efficient water systems
such as drip irrigation as a requirement of organic production, and amount of fertilizer
required in their field is already reduced, they started to get more quality products (I4,
I5). Even seeing early results encourage some of the farmers to adopt more sustainable
production practices. It is also reported that these sustainable practices become more
prevalent in the area as some leader large-scale farmers adopt them (I7). Then, small
151
or medium scale farmers who observe the positive outcomes also start to practice these
methods in their own fields. This imply that information transmits in the area through
observations, and leader farmers have an important role in the community to guide
farmers towards more sustainable production practices.
Moreover, IPUD conducts a survey investigating achievements accomplished via
better cotton production such as changes in the use of pesticides and fertilizers, water
consumption, and profits. In the survey better cotton production is compared to
traditional conventional cotton farming and the results are reported. According to the
2014 and 2015 season harvests (BCI, 2014; BCI, 2015): Level of yield has increased
3% in 2014 and 7% in 2015 with better cotton. Use of pesticides and synthetic
fertilizers has decreased respectively 8% and 9% in 2014; 12% and 6% in 2015
compared to traditional conventional cotton farming. Better cotton producers
consumed approximately 9% less water in 2014 and 10% less in 2015. In terms of
returns, better cotton resulted in 28% higher profits in 2014 and 26% in 2015. In 2016
/ 2017 season, level of yield has increased 2%. Use of pesticides is diminished 3%
while synthetic fertilizer consumption is elevated 2% in the last season. Better cotton
farmers in Turkey had 2% higher yields and 10% higher profits compared to the
average non-BCI farmers (BCI, 2017). In addition to the environmental and economic
measures, social indicators of better cotton production contributed to eliminating child
labor in cotton production areas and promote women’s equal inclusion in better cotton
production in Turkey. According to the 2016/2017 season’s data (BCI, 2016/2017)
better cotton enabled 83% advancement in eliminating child labor and increasing
knowledge in this issue.
5.2.5. Increased Learning and Knowledge
Participating in organic and better cotton value chains contributes to the local farmers’
knowledge accumulation in regard to these new and more sustainable agricultural
practices. Especially in better cotton, farmers are required to go through a series of on-
152
the-ground training provided by the IPUD to master better cotton production practices
and techniques (I42). Besides, some of the farmers participated to the training sessions
and educations in this topic provided by the Ministry of Agriculture and Forestry’s
Şanlıurfa Directorate (I1, I41). GAP International Agricultural Research and Training
Center (GAP-TAEM) is also another important local institution serving research and
training activities in the area (I45, I46). Providing education and training sessions,
research in the topics of organic and better cotton, and dissemination of the findings
of these studies are some of the main responsibilities of GAP-TAEM.
Knowledge transfer may occur from downstream actors through the upstream ones in
the value chain because access to knowledge is enhanced when going through
downstream in the chain. In this case, exporting textiles manufacturers who have a
direct relationship with the global buyers and brand-name companies have greater
opportunity for learning from those global buyers. They know recent market dynamics
better and transmit this information to the upstream actors (their suppliers). For
example, the concepts of organic and better cotton are firstly known by the textile
manufacturing. Then the information regarding an existing demand towards these new
updated products conveyed to the ginners, and from ginners to the agricultural
producers (I7, I25).
5.2.6. Increased Exports and Access to Different Markets
When we tried to trace exports in cotton, first of all, almost all of the locally produced
cotton is consumed within the region as indicated by the informants. Textile
manufacturers even import approximately 30-50 % of their input from outside sources
(I32, I33, I34). It is reported that there may be organic and better cotton exported from
the region; however, there is no regional or local level data regarding the amount and
value of this export, or this information is not sharable by third parties (I42).
In any case, farmers do not have direct access to different markets, but their cotton
may be arriving international markets via other downstream agents (such as cotton
153
traders, ginners, middleman, or textile manufacturers processing their cotton) who
trade those farmers’ products in the cases of organic and better cotton. Only other
buyers may be exporting local cotton to international markets.
5.3. Attitudes of Farmers Towards Upgrading
It is possible to divide farmers into two groups as upgraders and the ones who do not.
There are different circumstances that underpin the farmers’ decision in this point.
When considering not-upgraders, we can categorize them as the ones who do not
upgrade by their own decision, and the ones do not upgrade because they have no or
limited information regarding upgrading. During the interviews, it is discovered that
there is a group of producers who are totally unaware of product upgrading options
associated with cotton production, stating that they have never heard about it. These
farmers’ access to information sources are limited. They are mostly smallholder
farmers. During the interviews they told that, no one advised them to try these
practices, they would do if they knew or provided technical assistance (I8, I10). There
are farmers among them who indicated they heard about it but do not know much so
they have never thought to try (I2, I10). It is implied that limited information regarding
upgrading processes is also a deterring factor to take action.
The other not-upgrader group is the ones who know upgrading options but do not
attempt to upgrade. During the interviews several reasons were stated by these
farmers. First and the most prevalent reason is that cotton producers avoid cultivating
better or organic cotton because they do not have problem in selling their conventional
cotton at the market. As it is explained previously, there is an imbalance between the
supply and demand in Turkish cotton market. While demand is huge due to the well-
developed and competitive textiles sector, domestic supply fall behind, accounting for
40% of national cotton demand (USDA, 2019). A similar situation also exists in
Şanlıurfa. The textile manufacturers we have interviewed reported that they must
import 30% – 50% of the input cotton they process because of the limited supply.
154
Thus, textile sector consumes all the domestic supply and import the remaining from
outside sources. Under these circumstances, local producers are able to sell their
cotton despite its quality problems. When there is not a big impediment in selling their
produce, local cotton farmers do not think that upgrading to organic or better cotton is
necessary for them.
Second, even though contracting firms compensate extra expenses imposed by organic
cotton production, there may be extra expenses associated with organic or better cotton
such as installation of efficient irrigation systems etc. Given the fact that revenues
from cotton production is almost equal to the production costs, farmers do not want to
bear extra financial burden. Besides, yield levels are normally less in organic and
better cotton compared to conventional production. Therefore, even if all the extra
expenses caused by upgrading is compensated by the contracting firm, lower yield
levels mean lover revenues -which is a discouraging factor for the farmers’ decision
to upgrade (I7).
Another factor for the farmers’ avoiding transition into product upgrading is the
uncertainties about prices of organic and better cotton. The prices of organic and better
cotton are quite unpredictable and unstable depending on the market demand at the
time of transaction, so farmers refrain from any situation that put their predictable
income at risk. In fact, this situation can be overcome by some methods. First,
financial literacy can be promoted in the area so that farmers can have the opportunity
to market their products at futures exchange or options exchange markets at more
desirable prices. However, this would only be enabled if a well-functioning licensed
warehousing system operates in the area -enabling proper classification of the cotton
depending on its quality and other features; and providing appropriate storage
facilities. In this scenario, farmers could market their properly allocated products
depending on their quality and characteristics at any time during the year. Enabling of
such a system would also facilitate access to different markets where demand for
Turkish organic or better cotton can be higher at more promising prices.
155
Another reason for the farmers’ decision in regard not to upgrade is that organic and
better cotton production methods are new and unknown to the local producers. As it
is discussed earlier, local farmers have some undesirable habits such as over-irrigating,
using excessive fertilizers and chemicals during the cultivation; and believing that
these practices are associated with higher yields, preventing losses, and minimizing
risks. On the other hand, organic and better cotton practices preclude these improper
routines. However, it is quite difficult for the farmers to abandon these old habits and
traditional methods. Requirement of change in organic or better cotton imposes
psychological barriers that are difficult to overcome for the farmers and stand their
way to adopt more sustainable practices through upgrading.
On the other hand, when we look at the upgraders, first prominent characteristic of
these group is the improved access to information. Information flow is highly
dependent on connections and networks. Consequently, the actor who is involved in
the largest network has the information and transmit it through its upstream chain
actors. In better cotton case, it is first known by the textile sector actors who are
engaged with trade, so their information channels are wider. The interviewed ginners
stated that they are informed about better cotton by the textile companies they work
with. Similarly, ginners are the information sources of the farmers. They introduce
better cotton to the cotton producers and advise them to cultivate it in order to upgrade
their products, access to different markets, and eventually to increase revenues.
Farmers who have communication with ginners that are working with exporting textile
manufacturers benefit from the information channels of these downstream actors. This
information may be about the types of newly developing products, market demand
and tendencies, cotton prices, and so on (I12, I13).
Another source of information for the farmers are indicated as input supplier firms
who work as consultants as well. These firms sometimes encourage farmers to try
recent agricultural practices and provide technical assistance. Moreover, a group of
farmers stated that they have been informed through training and consultancy services
of Ministry of Agriculture and Forestry’s Şanlıurfa Directorate. Several cotton
156
producers told that they decided to cultivate organic or better cotton at least in a small
portion of their lands -as trial, just for experimenting- after participating training and
services provided by the directorate. When it is asked whether they think to enlarge
their production, the farmers affirmed and showed their willingness to increase their
production in better or organic cotton.
It is observed that motivation and encouragement of Ministry of Agriculture and
Forestry’s Şanlıurfa Directorate is quite effective and influential in farmers’ decisions
regard upgrading because producers trust governmental institutions. In addition to
these institutions, experts from IPUD (I43, I44) also indicated that:
“Trust building period between the farmer and IPUD specialists took almost
one year. Usually, at the end of the one year of continuous interaction trust
building is completed and farmer accepts to join us”
Another determinant in upgrading decision is observed as education level. Transition
to better or organic cotton increases as farmers get more educated. One of the
interviewees indicated that (I9):
“Educated farmers easily understand the terms and conditions of better cotton
principles and adopts. On the other hand, uneducated farmers hesitate and
refrain from because they have difficulties in understanding. When they do not
understand, they afraid to do paperwork and sign documents. According to
them this is something threating.”
When we look at the motivations of the farmers who made up his mind to upgrade,
they can be examined in three groups. The first motivational factor for upgrading to
organic or better cotton is the risk management. However, it is more common in
organic cotton production rather than better cotton since it is organized and managed
through contract farming. Farmers usually decide product upgrading because
contracting firm compensates all the extra costs (such as providing organic seed and
other organic inputs, certification expenses, technical support) occurred because of
organic production methods (I29). Moreover, contracting firms and farmers settle a
157
pre-determined selling price prior to production, thus farmers protect themselves from
price fluctuations. Normally, farmers always have the risk of making a loss in cotton
production because of always changing prices due to economic instability, weather
conditions affecting yield and output, or unpredictable market dynamics. Assuring
these risks management relieves farmers and enhance their motivation towards
upgrading (I29).
The second motivation, especially among the better cotton producers, is the
developing market demand and brand value of sustainable cotton. Better cotton
producing farmers emphasized that they believe better cotton market demand will
considerably increase in the near future due to the commitments of global brand-name
textile companies to source their cotton from sustainable sources (I43, I44).
Different from organic cotton in which contract farming is a major motivational factor
to participate, there is not a contract between the farmers and IPUD or BCI to
guarantee prices in better cotton. In fact, better cotton is riskier than organic in this
respect; however, it is easier to adopt in practice. Being easily adoptable in practice
(without tough requirements and standards that are difficult to fulfill for the farmers)
is another motivational aspect of better cotton production (I40).
Observing positive outcomes is the other encouraging factor for the farmers to decide
transition into sustainable cotton practices. A group of farmers who have started to try
cultivating better or organic cotton underlined that they decided to experiment these
new practices because they observed some leading farmers in the community who are
already growing better or organic cotton (I1, I7). Seeing the positive outcomes of
leading farmers encourage other small or medium scale agricultural producers to
easily adopt these sustainable production methods.
Moreover, upgrading is usually observed among the farmers who also have ginning
facility, in other words, among the actors who are involved in more than one stage of
the value chain. The reason is that those farmers -who are also ginners- have the
opportunity to gain more when they upgrade so they capture the value added from 2

158
different stage of the chain (one degree of value increase from agricultural production,
one degree from ginning). Therefore, it seems easier for them to make a decision for
upgrading which provides them with more increased incomes.
5.4. Planning Solution vs. Market Solution for Upgrading
As it is indicated before, upgrading activities take place in cotton production in the
study area for increasing the value generated from cotton, enhancing local farmers’
positions in the market, meeting increasing market demand for organic and better
cotton products, diminishing environmental externalities of cotton production, and
providing solution for the major poor-quality problems associated with traditional
production practices.
Implementation of organic cotton production can be considered as a planning solution
for achieving these targets listed above because it is encouraged by the governmental
subsidies and implemented through legal regulations -similar to conventional cotton
subsidies as paying a premium per kilogram of seed cotton. The working principle is
that, the government basically encourage production of organic cotton by paying
agricultural subsidies for the area of land dedicated for organic cotton cultivation (30
TL per decare of organic production land). Similarly, conventional cotton production
is subsidized by the amount of production as well as organic cotton (0,80 TL/Kg. of
cotton).
The problem here is that, since the support is determined based on quantitative factors,
quality and practices adopted in production (such as sustainable production methods,
eliminating child labor, gender equality etc.) are not a determiner in the amount of
subsidy payments farmers receive for growing cotton. In other words, only quantity
of the produce matters. As a result, this mechanism does not solve the existing poor-
quality issues and negative environmental impacts of cotton production in Turkey.
The most upsetting aspect of this mechanism is as explained by one of the local experts
(I41);
159
“This mechanism attempts to increase revenues of farmers but unfortunately
does not solve the essential problem of low-quality cotton production. On the
contrary, it causes farmers to produce just to get the subsidy but do not care
about the quality because it is not rewarded. Farmers would change their
behavior and mindset when they are not paid by the amount of production, but
according to the quality of their product”
On the other hand, better cotton can be considered a market solution for the problems
of cotton production mentioned at the beginning because there are no governmental
subsidies for it. It takes place on a voluntary basis and market rules are accepted. Prices
are determined according to the supply and demand conditions -no pre-determined
prices settled by a contracting firm and guarantee of selling as in the organic farming
example. Under these circumstances, better cotton farmers focus more on quality of
their product because it is the determinant for the price they can sell their product at
the market. Better cotton farmers that we have interviewed indicated that quality,
value added generated from better cotton practices (such as using natural resources
moderately, avoiding child labor, or being sensitive to the labor rights and gender
equality in production) are important to them (I9, I10, I12, I13); however, none of the
organic cotton farmers told that they value such kind of practices.
What we can infer from the discussion above is that, policies rather than directly
supporting amount of production, the ones rewarding high-quality production and
sustainable practices could be a better approach to solve existing problems of cotton
prodcution. Current circumstances show that subsidies such as direct payments or
premiums per production do not change the farmers’ attitudes toward improving
value-generation and enhancing their position in the value chain. Despite, policies
which help operating market dynamics without interruption may provide a better
solution as it can be seen in the example of better cotton. Also, providing the required
infrastructure for the well-functioning of market dynamics may be another useful
approach too. On this subject, for example, field research revealed that establishment
of a licensed warehousing system would be a solution for many problems of the area.
160
In licensed warehousing, first of all, producers would have the chance to get exact
worth of their produce by a well-established system which allocates products
according to their quality and other characteristics so that give farmers the chance to
market their products by their exact value and quality.
Second, they would have the option to store their produce and sell when cotton prices
get higher. In the existing system, because of the limited and unsuitable storage
conditions of farmers and ginners, they do not want to keep the produce for long time
to avoid risks and harm, therefore, they directly send it to the textile factories
immediately after the harvest. With the storage facilities of licensed warehousing,
farmers would have the option to sell their produce in parties through the year,
especially when cotton prices rise. Besides, this option would benefit manufacturers
as well because they could have the chance to access local cotton supply not only
during the time period following harvest, but also all through the year.
Third, a licensed warehouse system would enable farmers access to different markets
since in this method they can sell their produce with the electronic product bills (ürün
senedi) in other world markets and future forward options exchange and take
advantage of competition between numerous buyers. Moreover, having product bills
enable farmers to benefit from financial credits and increases their creditworthiness.
As a result, an alternative solution to direct agricultural subsidies can be a subsidy
mechanism based not only on quantity, but also considering quality, or a mechanism
which provides required infrastructure and enabling environment for well-functioning
of the market dynamics. Another solution could be providing subsidies for cotton
inputs. Such a solution could work quite better in a country like Turkey where high
input prices are one of the major problems of the cotton producers.
161
CHAPTER 6
6. CONCLUSION
The thesis aimed to conduct a research regarding cotton value chain in Şanlıurfa and
ways to improve it in order to enhance its contribution to regional value generation
and overall development of the GAP Region. The research is organized in the context
of value chain analysis because of its comprehensive approach pectives of farmers
differ a lot from the perspectives of textile manufacturers regardifocusing on not only
sectoral dynamics, but also inter-sectoral linkages and relations between the actors. In
accordance with that, we put extra emphasis on different perspectives of different
actors on important issues of cotton value chain. For example, persng the problems
associated with agricultural production stage of the value chain. Each group of actors
face different problems and provide totally different and valuable insights based on
their own unique experiences.
In accordance with this purpose, firstly, a detailed value chain analysis is conducted
to understand the dynamics of cotton value chain in Şanlıurfa; and to identify problems
and opportunities. Understanding these issues of the value chain was necessary to
examine how improvements can be achieved. Therefore, major value chain activities
in the study area -input supply, agricultural production, processing, and logistics
stages- are investigated. The study basically focused on actors and activities carried
out through the cotton value chain, its governance, some economic analysis, and
finally particular attention is paid to a detailed discussion on upgrading. During the
interviews, the most common problems were the poor-quality problem of locally
produced cotton and improper practices of farmers in Şanlıurfa. This is why the study
focuses on upgrading in particular. Upgrading is considered a way not only to help
increase value generation through higher value-added products in the area, but also to
promote a better integration of the farmers into cotton value chain and improve their
position.
162
In the essence of the problems, the underlying reason is spotted as the incompatibility
of agricultural production and processing sectors (secondary processing-textiles
manufacturing). There is a well-developed and very competitive textile industry which
needs sustainable high-quality cotton supply on one hand; and there are less
enthusiastic and ambitious farmers supplying cotton to this successful sector on the
other hand. Moreover, the imbalance between the quantity of cotton demanded from
the textiles sector and amount of supply coming from farmers is another underlying
reason which exacerbates the problem. Farmers do not have problem in selling their
produce because of the low supply -despite of its poor quality depending on the
improper practices in the cotton fields. Excessive irrigation, contamination, and
inconvenient storage are some of the major factors diminishing the quality of the local
cotton caused by those improper practices. However, farmers do not attempt to solve
the poor-quality problem as long as they can sell their produce. For now, there is no
problem in selling this low-quality cotton in local and national markets, but the future
of local cotton may not be optimistic if farmers still do not attempt to improve the
quality and take care of cotton well.
Two factors threating the future of local cotton are; economic and environmental
sustainability. Several issues which are revealed during the interviews imply that,
sustaining cotton production under these conditions may not be possible in the near
future. The first reason is environmental externalities of producing cotton which are
already at high levels in Şanlıurfa and GAP Region. The level of irrigation water is
already started to fall, and the structure of soil is already deteriorated due to excessive
water use in the cotton fields. These are just some of the major environmental
detriments. On the other hand, expensive input prices and low profit margins put
critical financial burden on cotton producers, especially when the economy is that
fragile and full of uncertainties.
Upgrading may come into play at that point as a way to improve the quality of the
cotton and the position of farmers in the cotton value chain. Existing upgrading
activities take place in the form of product upgrading through organic cotton and better
163
cotton as an alternative to conventional cotton production in Şanlıurfa. These methods
(organic and better cotton) have the potential to solve the poor-quality problem of
local cotton, promote higher-value generation in the region out of cotton, and prevent
environment degeneration and excessive use of natural resources. For these reasons,
we wanted to investigate dynamics of product upgrading through organic and better
cotton in the area.
When examining upgrading, the thesis firstly investigated the dynamics of organic
and better cotton production in Şanlıurfa (as means of product upgrading) through a
series of in-depth interviews and meetings with value chain actors. The question in
mind was how to improve the position of farmers in the cotton value chain while
promoting environmental sustainability through more conscious and precise methods
of organic and better cotton practices. To investigate this, we first attempted to analyze
the effects of current upgrading activities adopted by local organic and better cotton
farmers. In other words, we aimed to see whether product upgrading caused any
improvement in their conditions and contributed to the regional value generation.
The first indicator we search for this was whether upgrading has led to an increase in
unit prices of cotton. The findings showed that transition into organic cotton and better
cotton provides an increase in the earnings of farmers; however, the amount is quite
small for now. Farmers hope that it will increase in the future though. Since organic
and better cotton is managed through contract farming or with the help of the
institutions such as IPUD, GAP-BKI or other local government bodies, vertical
coordination is increased among the actors and value chain participants. Similarly,
working with experts and brand-name companies promotes learning and knowledge
of local producers.
In terms of attitudes of farmers towards upgrading, the greatest motivation for the
farmers decision toward upgrading is possible value increases and higher incomes.
Second, better cotton producers reported that working with global brand-name
companies and producing a higher-value branded product is the main motivational
164
factor for them. Third, observing positive outcomes of other farmers’ experiences
(especially leader farmers’ and big landowners’) with organic and better cotton; and
encouragement of locally effective actors such as experts/specialists from GAP-BKI
or Ministry of Agriculture and Forestry’s Şanlıurfa Directorate work a lot in
influencing farmers’ decision towards upgrading. Trust is another important factor in
their decision. If they are advised by a trusted agent, they decided easier. There are
some farmers who started to cultivate organic or better cotton in a small portion of
their land as a trial. They are intended to experiment and transfer into product
upgrading if they can achieve and see positive results. Moreover, educated farmers are
more prone to adopting upgrading strategies compared to uneducated ones.
On the other hand, when we look at the not-upgraders, there is a group who are totally
unaware of such kind of product differentiations. Have they not heard about organic
nor better cotton before -which indicates that they have limited or no access to the
information channels. This situation triggers the question of how successful
transmission of information is in the region. Among the others who have heard about
product upgrading options but prefer not to, uncertainties regarding prices is one of
the reasons. Also, they are required to quit their old habits such as using excessive
irrigation water, fertilizers or chemicals during the production which lower yields in
organic and better production to some degree and this constitutes psychological
barriers for the farmers. Lastly, difficult procedures and standards to meet -especially
in organic cotton- is another factor deterring farmers from transition into organic
cotton farming.
Despite of difficult procedures and uncertainties in prices, organic cotton producers
tend to continue organic farming because it is managed through contract farming. The
advantages of contract farming include that contracting firm eliminates most of the
risks and uncertainties for the farmers. For example, it removes uncertainties regarding
prices by settling to buy all the produce at a pre-determined price, so farmers do not
need to worry about fluctuating prices. Contracting firm provides all the expensive
165
inputs and closes the extra financial gap occurred to the farmer because of cultivating
organic cotton over conventional.
Finally, the thesis discussed and compared planning solution and market solution for
existing problems of cotton -considering organic cotton as planning solution since it
is encouraged through government subsidies; and better cotton as market solution
because it is a market-oriented approach which works on voluntary basis and does not
subject to any subsidy mechanism. The problem created through government
subsidies is that, farmers aim to earn from subsidies -not from the quality of their
produce. Since government subsidies are paid on the basis of amount of production,
quality is not an issue for the farmers to be considered. An exception for this is the
better cotton which does not work based on subsidies- only by market dynamics.
Better cotton farmers sell their products based on the supply and demand at the time
of transaction, so they always aim to produce higher-quality products and adopt
sustainable practices that add extra value to their produce. While better cotton farmers
we have interviewed indicated that quality and value added generated from better
cotton practices (such as using natural resources moderately, avoiding child labor, or
being sensitive to the labor rights and gender equality in production) are important to
them; none of the organic cotton farmers told that they value such kind of practices.
Based on the observations in the field, policy approaches which promotes well-
functioning of market dynamics, and providing required infrastructure and enabling
environment would be a better solution for the existing problems of cotton production.

167
REFERENCES
Baldwin, R. (2006). Globalisation: The Great Unbundling(s). Helsinki: Economic
Council of Finland. 20 September 2006
BCI (2014) Better Cotton Initiative 2014 Hasat Raporu
BCI (2015) Better Cotton Initiative 2015 Hasat Raporu
BCI (2016/2017) Better Cotton Initiative. Environmental & Economic Indicators.
Farmer Results
BCI (2017) Better Cotton Initiative. 2017. Annual Report
BCI (2018) Annual Report
Bernard, A. B., and J. B. Jensen. 1995. “Exporters, Jobs, and Wages in U.S.
Manufacturing, 1976–1987.” Brookings Papers on Economic Activity,
Microeconomics Vol. 1995 (pp. 67–119), Washington, DC.
Cotton Sectoral Report. 2018. National Cotton Council.
http://www.upk.org.tr/User_Files/editor/file/pamuksektorraporu.pdf
Daviron, B., and P. Gibbon. (2002). Global Commodity Chains and the African Export
Agriculture. Journal of Agrarian Change 2:137-161
De Backer, K. and S. Miroudot (2013), “Mapping Global Value Chains”, OECD Trade
Policy Papers, No. 159, OECD Publishing, http://dx.doi.org/10.1787/5k3v1trgnbr4-
en.
168
De Janvry, A., and E. Sadoulet. (2005). Achieving Success in Rural Development:
Toward Implementation of an Integral Approach. Agricultural Economics 32 (1): 75-
89.
Ekolojik Pamuk Raporu. (2013) Gap Organik Tarım Küme Projesi Tekstil Çalışma
Grubu
Fair Labor Association (2017) Child Labor in Cotton Supply Chains Action-based
Collaborative Project to Address Human Rights Issues in Turkey. 2017.
FAO (2013) Value Chain Analysis for Policy Making. Methodological Guidelines and
country cases for a Quantitative Approach. Lorenzo Giovanni Bellù Policy Officer
(Economist), Agricultural Development Economics Division
FAO (2017) The future of food and agriculture – Trends and challenges. Rome.
Feyso, A. (2018). Cotton Value Chain Analysis: The Case of Smallholder Farmers
Arbaminch Zuria District, Gamo Gofa Zone, Ethiopia.
Food and Agriculture Organization of the United Nations and International Cotton
Advisory Committee (2015) Measuring Sustainability in Cotton Farming Systems
Towards a Guidance Framework
Forster D, Andres C, Verma R, Zundel C, Messmer MM. (2013) Yield and Economic
Performance of Organic and Conventional Cotton-Based Farming Systems – Results
from a Field Trial in India. PLoS ONE 8(12): e81039.
doi:10.1371/journal.pone.008103
GAP RDA and UNDP (2014) Güneydoğu Anadolu Bölgesi’nde Organik Pamuk
Üretiminin ve Sanayide Kullanımının Arttırılması İstişare Çalıştayı / 18 Mart 2014.
Çalıştay Raporu

169
Gereffi, G., Humphrey, J., Kaplinsky, R. & Sturgeon, T. (2001) Globalisation, Value
chains and Development, IDS Bulletin, 32(3)
Gereffi, G. and Korzeniewicz, M. (eds) (1994) Commodity Chains and Global
Capitalism, Westport: Praeger.
Gereffi, G., Sturgeon, T. and Humphrey, J. (2005) „The Governance of Global Value
Chains‟. Review of International Political Economy 12(1): 78-104.
Gibbon, P. and Ponte, S. (2008) “Global Value Chains: From Governance to
Governmentality?” Economy and Society, Vol. 37, No. 3, pp. 365-392. DOI:
10.1080/03085140802172680
Giuliani, E., Pietrobelli, C., & Rabellotti, R. (2005). Upgrading in global value chains:
Lessons from Latin American clusters. World Development, 33(4), 549–573.
Humphrey, J. and Schmitz, H. (2002) ‘How Does Insertion in Global Value Chains
Affect Upgrading in Industrial Clusters?’, Regional Studies 36(9): 1017–27.
ILO International Labour Office (2016) Child labour in cotton : a briefing. 2016.,
Fundamental Principles and Rights at Work Branch (FUNDAMENTALS) - Geneva:
ILO, 2016. ISBN: 978-92-2-131140-9 (Print); 978-92-2-131141-6 (Web PDF)
Inomata, S. (2017) Analytical Frameworks for Global Value Chains: An Overview
(July 10, 2017). Global Value Chain Development Report 2017. Available at SSRN:
https://ssrn.com/abstract=3074988
ITC International Trade Centre (2011) Women in cotton: Results of a Global Survey.
Geneva: ITC, 2011.xii, 23 p. (Technical paper) Doc. No. SC-11-208.E
Kaçıra, Ö., and Karlı, B. (2002) Türkiye, GAP Bölgesi ve Şanlıurfa’da Pamuğun
Üretim Yapısı ve Pazarlama Sorunları. Turkiye V. Tarım Ekomisi Kongresi 18-20
Eylul 2002 Erzurum
170
Kaplan, M., S. Bettighofer, S. Brüntrup-Seidemann and M. Noltze (2016),
Agricultural Value Chains, German Institute for Development Evaluation (DEval),
Bonn.
Kaplinsky, R. (2004) Spreading the Gains from Globalization : What Can Be Learned
from Value-Chain Analysis?, Problems of Economic Transition, 47:2, 74-115
Kaplinsky R., and Morris, M., (2000). A Handbook for value chain research,
International Development Research Centre, Canada, IDRC, Canada.
Keane, J. (2008). “A ‘New’ Approach to Global Value Chain Analysis,” Working
Paper 293, Overseas Development Institute, London
Kooistra, K.J., Pyburn, R., Termorshuizen, A.J. (2006). The sustainability of cotton.
Consequences for man and environment, Science Shop Wageningen University &
Research Centre. Report 223. ISBN: 90-6754-90-8585-000-2.
Levelt, M. (2010). Global trade & the Dutch hub: understanding variegated forms of
embeddedness of international trade in the Netherlands: clothing, flowers, and high-
tech products. Oisterwijk: Uitgeverij BOXPress.
Mario Davide Parrilli , Khalid Nadvi & Henry Wai-Chung Yeung (2013) Local and
Regional Development in Global Value Chains, Production Networks and Innovation
Networks: A Comparative Review and the Challenges for Future Research, European
Planning Studies, 21:7, 967-988, DOI: 10.1080/09654313.2013.733849
Melitz, M. J. (2003). “The Impact of Trade on Intra-Industry Reallocations and
Aggregate Industry Productivity.” Econometrica 71 (6): 1695–725.
Mitchell, J., Keane J. and Coles, C. (2009) “Trading Up: How a Value Chain
Approach Can Benefit the Rural Poor” December 2009. COPLA Global: Overseas
Development Institute
171
Murphy, J. T. (2007). The challenge of upgrading in African industries: Socio-spatial
factors and the urban environment in Mwanza, Tanzania. World Development, 35(10),
1754–1778.
Nadvi, K. & Halder, G. (2005) Local clusters in global value chains: Exploring
dynamic linkages between Germany and Pakistan, Entrepreneurship and Regional
Development, 17(5), pp. 339–363.
National Cotton Council (2018) GMO FREE TURKISH COTTON. Standart Version
2.0. July 10, 2018
Neary, P. (2009). "Putting the "New" into New Trade Theory: Paul Krugman's Nobel
Memorial Prize in Economics," Economics Series Working Papers 423, University of
Oxford, Department of Economics.
OECD (2012) Mapping Global Value Chains. Trade and Agriculture Directorate
Trade Committee. Working Party of the Trade Committee. Sébastien Miroudot &
Koen De Backer. 4-5 December 2012 The OECD Conference Centre, Paris
OECD & FAO (2016), “OECD-FAO Agricultural Outlook”, OECD Agriculture
statistics (database), http://dx.doi.org/10.1787/agr-outl-data-en. StatLink:
http://dx.doi.org/10.1787/888933382111
Özüdoğru, T. (2017) Pamuk Durum Tahmin Raporu 2017/2018. Tarımsal Ekonomi
ve Politika Geliştirme Enstitüsü (TEPGE) TEPGE Yayın No: 285 ISBN: 978-605-
9175-89-0
Pietrobelli, C. & Rabellotti, R. (Eds) (2007) Upgrading to Compete (Cambridge, MA:
Harvard University Press).
Pietrobelli, C. and Rabellotti, R. (2010) Upgrading to Compete Global Value Chains,
Clusters, and SMEs in Latin America (February 11, 2010). UPGRADING TO
COMPETE GLOBAL VALUE CHAINS, CLUSTERS, AND SMES IN LATION
AMERICA, Carlo Pietrobelli, Rabellotti, R. (2006) Harvard University Press.
Available at SSRN: https://ssrn.com/abstract=1551498
172
Ponte, S. & Ewert, J. (2009). "Which Way is "Up" in Upgrading? Trajectories of
Change in the Value Chain for South African Wine," World Development, Elsevier,
vol. 37(10), pages 1637-1650, October.
Ponte, S. and Gibbon, P. (2005) ‘Quality standards, conventions and the governance
of global value chains’, Economy and Society, 34(1): 1-/31
Ponte, S. and Sturgeon, T. (2014) Explaining Governance in Global Value Chains: A
Modular Theory-Building Effort. / Ponte, Stefano; Sturgeon, Timothy. In: Review of
International Political Economy, Vol. 21, No. 1, 2014, p. 195-223
Porter, M. E. (1998) The Competitive Advantage: Creating and Sustaining Superior
Performance. NY: Free Press, 1985. (Republished with a new introduction, 1998.)
Reardon, T., and C.B. Barrett. (2000). Agroindustrialization, Globalization, and
International Development. An Overview of Issues, Patterns, and Determinants.
Agricultural Economics 23:195-205.
Schmitz, H. (2006). Learning and earning in global garment and footwear chains. The
European Journal of Development Research, Vol.18, No.4, December 2006, pp.546–
571 ISSN 0957-8811 print/ISSN 1743-9728 online DOI:
10.1080/09578810601070688. 2006 European Association of Development Research
and Training Institutes.
Şengül, H. and Erkan, O. (1999) Structural Relations Between Cotton Production and
the Textile Industry in the Southeastern Anatolia Project (GAP) Region. Turkish
Journal of Agriculture and Forestry; Year: 1999 Volume: 23 Issue: 5; 483-492 ISSN
: 1300-011X
Textile Exchange (2018) Organic Cotton Market Report
Tokatli, N. (2007). Networks, firms and upgrading within the blue-jeans industry:
Evidence from Turkey. Global Networks, 7(1), 51–68
173
Todeva, E. and Rakhmatullin, R. (2016) Global Value Chains Mapping: Methodology
and Cases for Policy Makers, JRC Science for Policy Report, European Union, EUR
28085 EN; doi:10.2791/273290
Trienekens, J.H. (2011). Agricultural Value Chains in Developing Countries: A
Framework for Analysis. International Food and Agribusiness Management Review
Volume 14, Issue 2, 2011.
URL 1.
http://www.zmo.org.tr/genel/bizden_detay.php?kod=30467&tipi=17&sube=0
Accessed date: 22.12.2018
URL 2. https://www.worldwildlife.org/industries/cotton 10.12.2018 Accessed date:
03.01.2019
URL 3 http://databank.worldbank.org/data/reports.aspx?source=Health-Nutrition-
and-Population-Statistics:-Population-estimates-and-projections# Accessed date:
03.01.2019
URL 4 http://aboutorganiccotton.org/sdgs/ Accessed date: 25.07.2019
URL 5 http://www.tr.undp.org/content/turkey/en/home/sustainable-development-
goals.html Accessed date: 25.07.2019
USDA (2018) United States Department of Agriculture. Foreign Agricultural Service.
Cotton: World Markets and Trade. November 2018.
https://downloads.usda.library.cornell.edu/usda-
esmis/files/kp78gg36g/k3569777r/5x21tj544/cotton.pdf Accessed date: 23.06.2019
USDA (2018/19) Foreign Agricultural Service, Cotton Supply and Distribution by
Country 2018/19
174
USDA (2019) Turkey Cotton and Products Annual. Date:3/29/2019. GAIN Report
Number:TR9007
World Bank (2019) Databank: Population Estimates and Projections. Retrieved from:
http://databank.worldbank.org/data/reports.aspx?source=Health-Nutrition-and-
Population-Statistics:-Population-estimates-and-projections#
World Bank Group, the Institute of Developing Economies, the Organisation for
Economic Co-operation and Development, the Research Center of Global Value
Chains and World Trade Organization, 2017. GLOBAL VALUE CHAIN
DEVELOPMENT REPORT 2017. MEASURING AND ANALYZING THE
IMPACT OF GVCs ON ECONOMIC DEVELOPMENT
WWF (2019) Sustainable Agriculture: Cotton – Overview. Retrieved from:
https://www.worldwildlife.org/industries/cotton
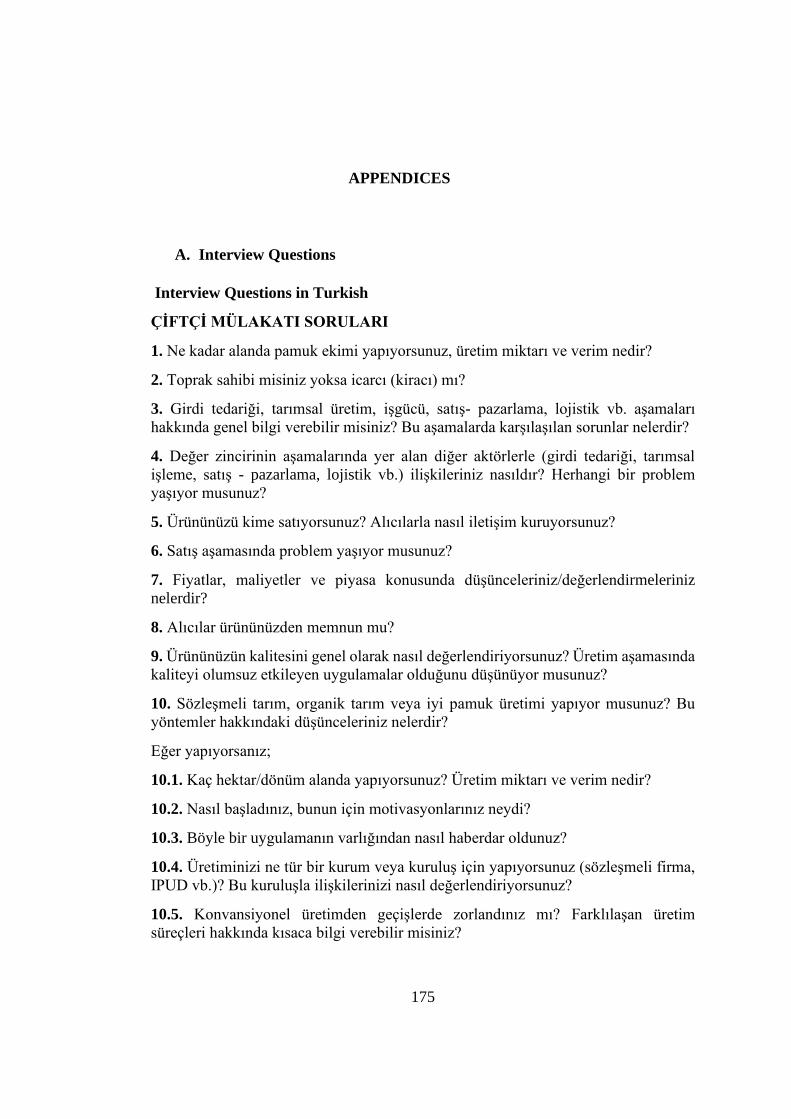
175
7. APPENDICES
A. Interview Questions
Interview Questions in Turkish
ÇİFTÇİ MÜLAKATI SORULARI
1. Ne kadar alanda pamuk ekimi yapıyorsunuz, üretim miktarı ve verim nedir?
2. Toprak sahibi misiniz yoksa icarcı (kiracı) mı?
3. Girdi tedariği, tarımsal üretim, işgücü, satış- pazarlama, lojistik vb. aşamaları
hakkında genel bilgi verebilir misiniz? Bu aşamalarda karşılaşılan sorunlar nelerdir?
4. Değer zincirinin aşamalarında yer alan diğer aktörlerle (girdi tedariği, tarımsal
işleme, satış - pazarlama, lojistik vb.) ilişkileriniz nasıldır? Herhangi bir problem
yaşıyor musunuz?
5. Ürününüzü kime satıyorsunuz? Alıcılarla nasıl iletişim kuruyorsunuz?
6. Satış aşamasında problem yaşıyor musunuz?
7. Fiyatlar, maliyetler ve piyasa konusunda düşünceleriniz/değerlendirmeleriniz
nelerdir?
8. Alıcılar ürününüzden memnun mu?
9. Ürününüzün kalitesini genel olarak nasıl değerlendiriyorsunuz? Üretim aşamasında
kaliteyi olumsuz etkileyen uygulamalar olduğunu düşünüyor musunuz?
10. Sözleşmeli tarım, organik tarım veya iyi pamuk üretimi yapıyor musunuz? Bu
yöntemler hakkındaki düşünceleriniz nelerdir?
Eğer yapıyorsanız;
10.1. Kaç hektar/dönüm alanda yapıyorsunuz? Üretim miktarı ve verim nedir?
10.2. Nasıl başladınız, bunun için motivasyonlarınız neydi?
10.3. Böyle bir uygulamanın varlığından nasıl haberdar oldunuz?
10.4. Üretiminizi ne tür bir kurum veya kuruluş için yapıyorsunuz (sözleşmeli firma,
IPUD vb.)? Bu kuruluşla ilişkilerinizi nasıl değerlendiriyorsunuz?
10.5. Konvansiyonel üretimden geçişlerde zorlandınız mı? Farklılaşan üretim
süreçleri hakkında kısaca bilgi verebilir misiniz?
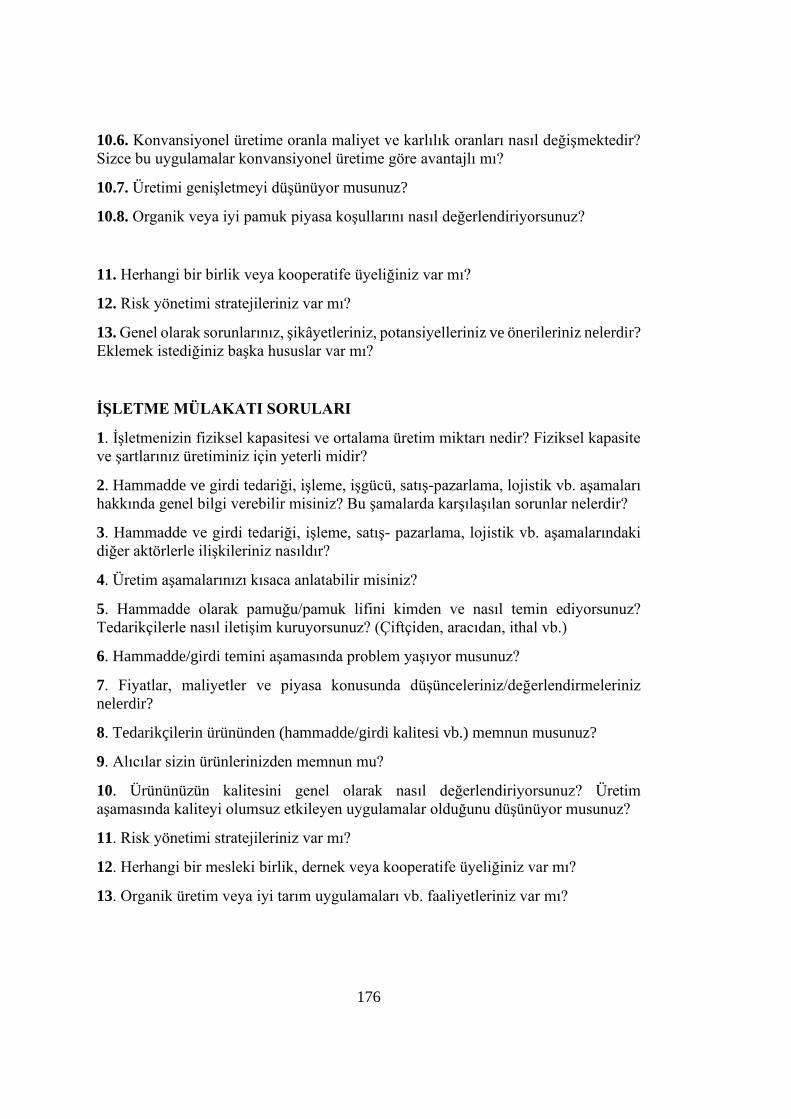
176
10.6. Konvansiyonel üretime oranla maliyet ve karlılık oranları nasıl değişmektedir?
Sizce bu uygulamalar konvansiyonel üretime göre avantajlı mı?
10.7. Üretimi genişletmeyi düşünüyor musunuz?
10.8. Organik veya iyi pamuk piyasa koşullarını nasıl değerlendiriyorsunuz?
11. Herhangi bir birlik veya kooperatife üyeliğiniz var mı?
12. Risk yönetimi stratejileriniz var mı?
13. Genel olarak sorunlarınız, şikâyetleriniz, potansiyelleriniz ve önerileriniz nelerdir?
Eklemek istediğiniz başka hususlar var mı?
İŞLETME MÜLAKATI SORULARI
1. İşletmenizin fiziksel kapasitesi ve ortalama üretim miktarı nedir? Fiziksel kapasite
ve şartlarınız üretiminiz için yeterli midir?
2. Hammadde ve girdi tedariği, işleme, işgücü, satış-pazarlama, lojistik vb. aşamaları
hakkında genel bilgi verebilir misiniz? Bu şamalarda karşılaşılan sorunlar nelerdir?
3. Hammadde ve girdi tedariği, işleme, satış- pazarlama, lojistik vb. aşamalarındaki
diğer aktörlerle ilişkileriniz nasıldır?
4. Üretim aşamalarınızı kısaca anlatabilir misiniz?
5. Hammadde olarak pamuğu/pamuk lifini kimden ve nasıl temin ediyorsunuz?
Tedarikçilerle nasıl iletişim kuruyorsunuz? (Çiftçiden, aracıdan, ithal vb.)
6. Hammadde/girdi temini aşamasında problem yaşıyor musunuz?
7. Fiyatlar, maliyetler ve piyasa konusunda düşünceleriniz/değerlendirmeleriniz
nelerdir?
8. Tedarikçilerin ürününden (hammadde/girdi kalitesi vb.) memnun musunuz?
9. Alıcılar sizin ürünlerinizden memnun mu?
10. Ürününüzün kalitesini genel olarak nasıl değerlendiriyorsunuz? Üretim
aşamasında kaliteyi olumsuz etkileyen uygulamalar olduğunu düşünüyor musunuz?
11. Risk yönetimi stratejileriniz var mı?
12. Herhangi bir mesleki birlik, dernek veya kooperatife üyeliğiniz var mı?
13. Organik üretim veya iyi tarım uygulamaları vb. faaliyetleriniz var mı?
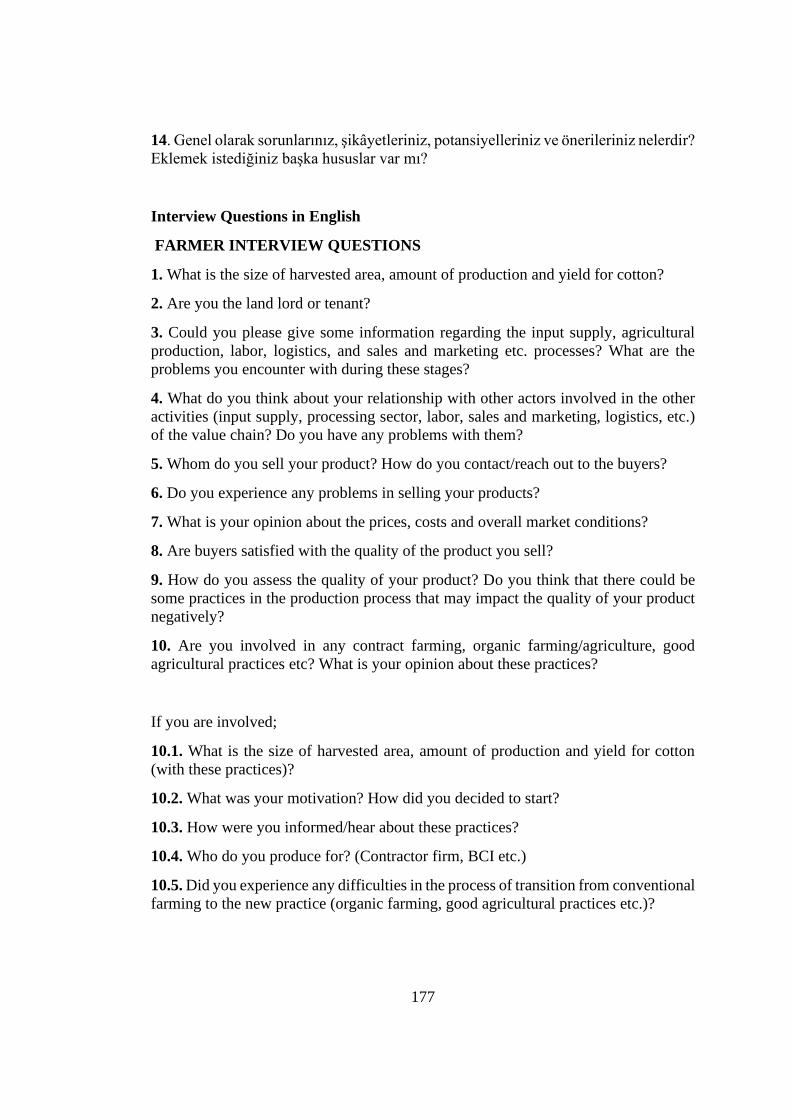
177
14. Genel olarak sorunlarınız, şikâyetleriniz, potansiyelleriniz ve önerileriniz nelerdir?
Eklemek istediğiniz başka hususlar var mı?
Interview Questions in English
FARMER INTERVIEW QUESTIONS
1. What is the size of harvested area, amount of production and yield for cotton?
2. Are you the land lord or tenant?
3. Could you please give some information regarding the input supply, agricultural
production, labor, logistics, and sales and marketing etc. processes? What are the
problems you encounter with during these stages?
4. What do you think about your relationship with other actors involved in the other
activities (input supply, processing sector, labor, sales and marketing, logistics, etc.)
of the value chain? Do you have any problems with them?
5. Whom do you sell your product? How do you contact/reach out to the buyers?
6. Do you experience any problems in selling your products?
7. What is your opinion about the prices, costs and overall market conditions?
8. Are buyers satisfied with the quality of the product you sell?
9. How do you assess the quality of your product? Do you think that there could be
some practices in the production process that may impact the quality of your product
negatively?
10. Are you involved in any contract farming, organic farming/agriculture, good
agricultural practices etc? What is your opinion about these practices?
If you are involved;
10.1. What is the size of harvested area, amount of production and yield for cotton
(with these practices)?
10.2. What was your motivation? How did you decided to start?
10.3. How were you informed/hear about these practices?
10.4. Who do you produce for? (Contractor firm, BCI etc.)
10.5. Did you experience any difficulties in the process of transition from conventional
farming to the new practice (organic farming, good agricultural practices etc.)?
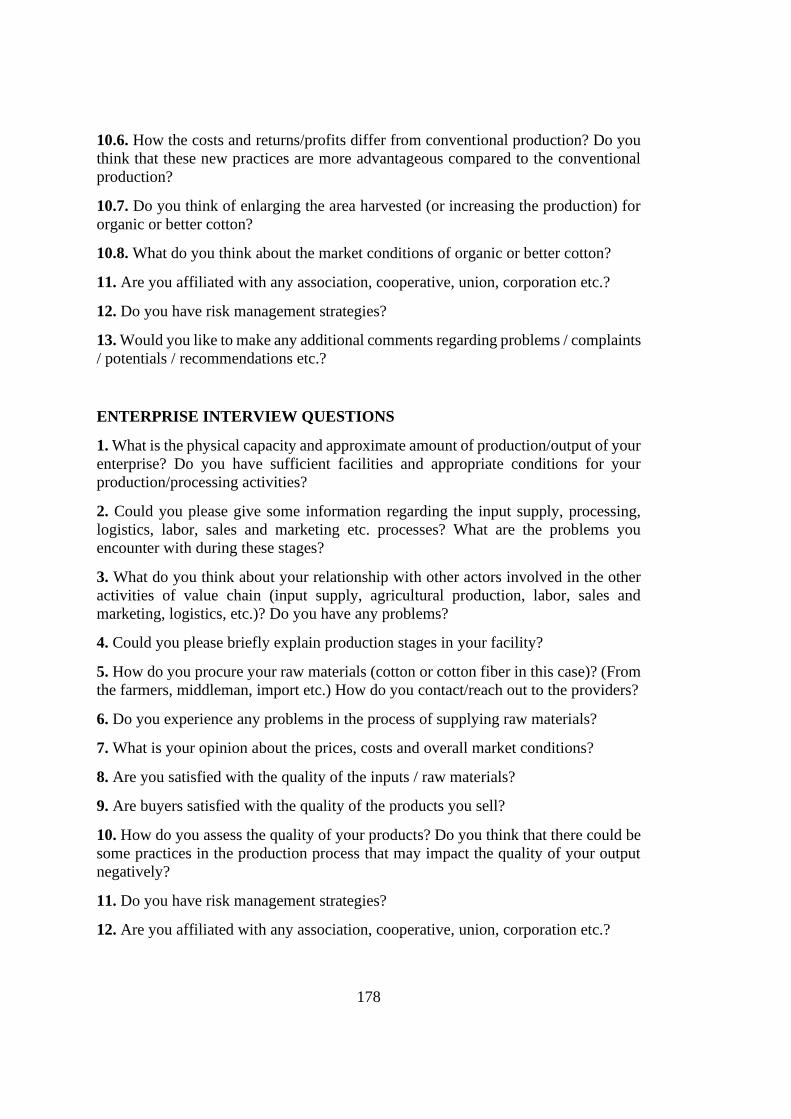
178
10.6. How the costs and returns/profits differ from conventional production? Do you
think that these new practices are more advantageous compared to the conventional
production?
10.7. Do you think of enlarging the area harvested (or increasing the production) for
organic or better cotton?
10.8. What do you think about the market conditions of organic or better cotton?
11. Are you affiliated with any association, cooperative, union, corporation etc.?
12. Do you have risk management strategies?
13. Would you like to make any additional comments regarding problems / complaints
/ potentials / recommendations etc.?
ENTERPRISE INTERVIEW QUESTIONS
1. What is the physical capacity and approximate amount of production/output of your
enterprise? Do you have sufficient facilities and appropriate conditions for your
production/processing activities?
2. Could you please give some information regarding the input supply, processing,
logistics, labor, sales and marketing etc. processes? What are the problems you
encounter with during these stages?
3. What do you think about your relationship with other actors involved in the other
activities of value chain (input supply, agricultural production, labor, sales and
marketing, logistics, etc.)? Do you have any problems?
4. Could you please briefly explain production stages in your facility?
5. How do you procure your raw materials (cotton or cotton fiber in this case)? (From
the farmers, middleman, import etc.) How do you contact/reach out to the providers?
6. Do you experience any problems in the process of supplying raw materials?
7. What is your opinion about the prices, costs and overall market conditions?
8. Are you satisfied with the quality of the inputs / raw materials?
9. Are buyers satisfied with the quality of the products you sell?
10. How do you assess the quality of your products? Do you think that there could be
some practices in the production process that may impact the quality of your output
negatively?
11. Do you have risk management strategies?
12. Are you affiliated with any association, cooperative, union, corporation etc.?
179
13. Are you involved in organic production or good agricultural practices etc.? What
is your opinion about these practices?
14. Would you like to make any additional comments regarding problems / complaints
/ potentials / recommendations etc.?

180
B. Informant List
AGRICULTURAL PRODUCERS (FARMERS)
Informant
Number Occupation Production Type
Land Size13
(decares)
Additional
Value Chain
Stage
I1 Farmer* Better Cotton 1000 + Ginner
I2 Farmer Conventional 1000 +
I3 Farmer Conventional 1000 +
I4 Farmer Conventional 100 – 199
I5 Farmer Conventional 100 – 199
I6 Farmer Conventional 500 – 999
I7 Farmer Organic Cotton 200 – 499
I8 Farmer* Conventional 1000 + Ginner
I9 Farmer ** Better Cotton
1000 + Ginner,
Textiles
Manufacturer
I10 Farmer Better Cotton 1000 +
I11 Former farmer ** Former organic
cotton producer 1000 +
Ginner,
Textiles
Manufacturer
I12 Farmer Better Cotton 1000 +
I13 Farmer Better Cotton 1000 +
I14 Farmer Conventional 200 – 499
I15 Farmer Organic Cotton 200 – 499
I16 Farmer Conventional 200 – 499
I17 Farmer Conventional 500 – 999
I18 Farmer Conventional 200 – 499
INPUT SUPPLIERS, MIDDLEMAN and PROCESSORS
Informant
Number Occupation
Additional
Value Chain
Stage
I19 Middleman
I20 Input Supplier
I21 Input Supplier
I22 Ginner* Farmer
I23 Ginner* Farmer
I24 Ginner* Farmer
13 Land size classification is adopted from Agricultural Farm Structure Survey, 2016 of TUİK
(TurkStat) and groups are: -5; 5 – 9; 10 – 19; 20 – 49; 50 – 99; 100 – 199; 200 – 499; 500 – 999; 1000+
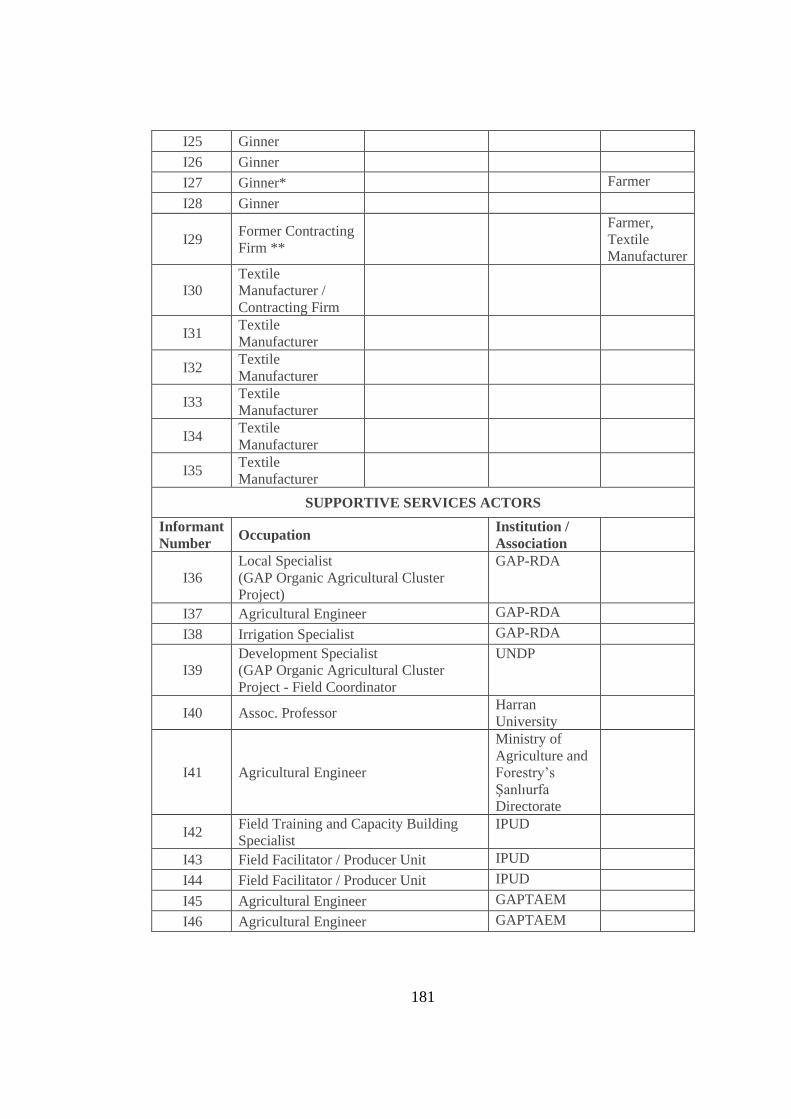
181
I25 Ginner
I26 Ginner
I27 Ginner* Farmer
I28 Ginner
I29 Former Contracting
Firm **
Farmer,
Textile
Manufacturer
I30
Textile
Manufacturer /
Contracting Firm
I31 Textile
Manufacturer
I32 Textile
Manufacturer
I33 Textile
Manufacturer
I34 Textile
Manufacturer
I35 Textile
Manufacturer
SUPPORTIVE SERVICES ACTORS
Informant
Number Occupation
Institution /
Association
I36
Local Specialist
(GAP Organic Agricultural Cluster
Project)
GAP-RDA
I37 Agricultural Engineer GAP-RDA
I38 Irrigation Specialist GAP-RDA
I39
Development Specialist
(GAP Organic Agricultural Cluster
Project - Field Coordinator
UNDP
I40 Assoc. Professor Harran
University
I41 Agricultural Engineer
Ministry of
Agriculture and
Forestry’s
Şanlıurfa
Directorate
I42 Field Training and Capacity Building
Specialist
IPUD
I43 Field Facilitator / Producer Unit IPUD
I44 Field Facilitator / Producer Unit IPUD
I45 Agricultural Engineer GAPTAEM
I46 Agricultural Engineer GAPTAEM
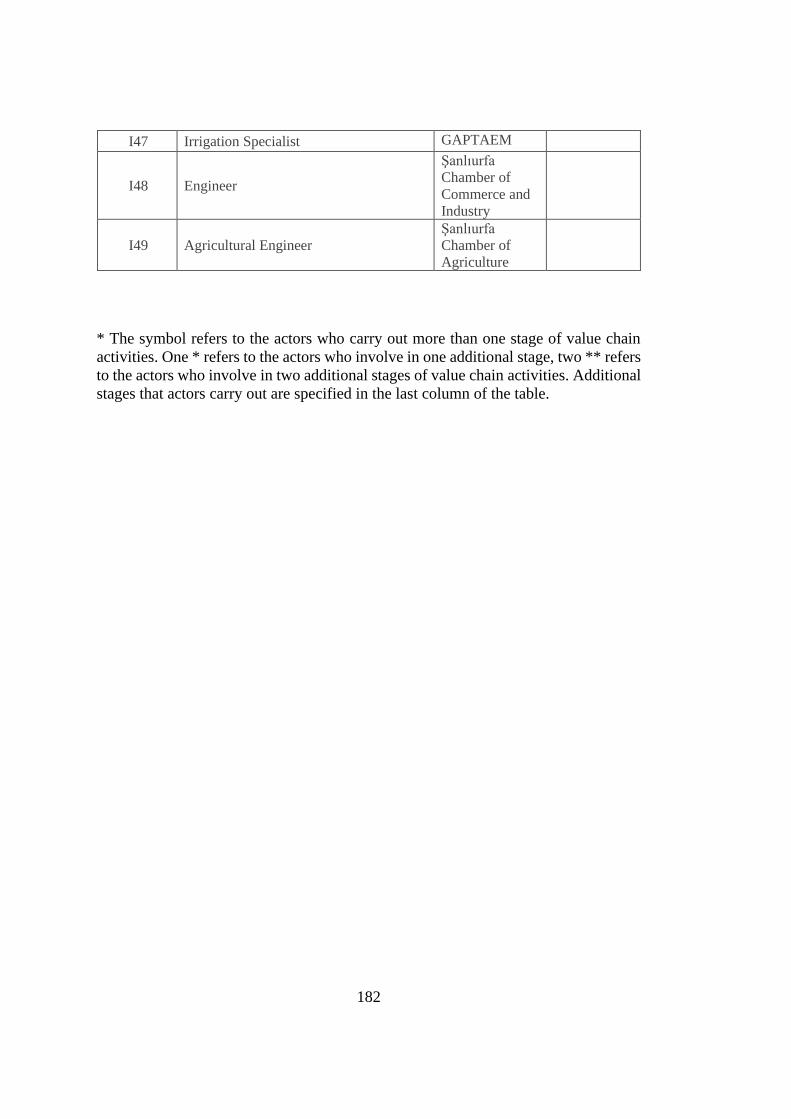
182
I47 Irrigation Specialist GAPTAEM
I48 Engineer
Şanlıurfa
Chamber of
Commerce and
Industry
I49 Agricultural Engineer
Şanlıurfa
Chamber of
Agriculture
* The symbol refers to the actors who carry out more than one stage of value chain
activities. One * refers to the actors who involve in one additional stage, two ** refers
to the actors who involve in two additional stages of value chain activities. Additional
stages that actors carry out are specified in the last column of the table.

183