Cotton Science and technology.pdf
569
-
Upload
khangminh22 -
Category
Documents
-
view
0 -
download
0
Transcript of Cotton Science and technology.pdf


Cotton: Science and technology
i
Related titles:
Total colour management in textiles
(ISBN-13: 978-1-85573-923-9; ISBN-10: 1-85573-923-2)Managing colour from the design stage to the finished product can be a difficultactivity as colour perception is subjective and can therefore be inconsistent. Total
colour management in textiles covers all aspects of managing colour from the designstage to the final product ensuring that the designer’s vision is fulfilled in the finishedcolour. Many new developments in the area of colour measurement and colourperception are discussed, including the sensory effect of colour for design and use inproduct development, and digital colour simulation.
Digital printing of textiles
(ISBN-13: 978-1-85573-951-2; ISBN-10: 1-85573-951-8)At present the textile industry produces the majority of its 34 billion square yards ofprinted textile fabric by screen printing. However, in the digital age new developmentsin the digital printing of paper are now being adapted for the textiles market. Thiscollection gives full coverage of all the current developments in digital textile printing.It is divided into four parts covering printer and print head technologies, printersoftware, digital printing colouration, and design and business for digital printing. Itcontains fundamental technical explanations along with current research.
Recycling in textiles
(ISBN-13: 978-1-85573-952-9; ISBN-10: 1-85573-952-6)An increasing amount of waste is generated each year from textiles (including carpetsand clothing) and their production. For economic and environmental reasons it isnecessary that as much of this waste as possible is recycled instead of being disposedof in landfill sites. On average approximately ten million tonnes of textile waste iscurrently dumped in Europe and America each year. Recycling in textiles is the firstbook to bring together textile recycling issues, technology, products, processes andapplications for all those in the industry who are looking for ways to recycle theirtextile waste.
Details of these books and a complete list of Woodhead’s titles can be obtained by:∑ visiting our web site at www.woodheadpublishing.com∑ contacting Customer Services (e-mail: [email protected];
fax: +44 (0) 1223 893694; tel.: +44 (0) 1223 891358 ext.30; address: WoodheadPublishing Ltd, Abington Hall, Abington, Cambridge CB21 6AH, England)
ii

Cotton: Scienceand technology
Edited by
S. Gordon and Y-L. Hsieh
CRC Press
Boca Raton Boston New York Washington, DC
W O O D H E A D P U B L I S H I N G L I M I T E DCambridge, England
iii

Published by Woodhead Publishing Limited in association with The Textile InstituteWoodhead Publishing Limited, Abington Hall, AbingtonCambridge CB21 6AH, Englandwww.woodheadpublishing.com
Published in North America by CRC Press LLC, 6000 Broken Sound Parkway, NW,Suite 300, Boca Raton, FL 33487, USA
First published 2007, Woodhead Publishing Limited and CRC Press LLC© 2007, Woodhead Publishing LimitedThe authors have asserted their moral rights.
This book contains information obtained from authentic and highly regarded sources.Reprinted material is quoted with permission, and sources are indicated. Reasonable effortshave been made to publish reliable data and information, but the authors and the publisherscannot assume responsibility for the validity of all materials. Neither the authors nor thepublishers, nor anyone else associated with this publication, shall be liable for any loss,damage or liability directly or indirectly caused or alleged to be caused by this book.
Neither this book nor any part may be reproduced or transmitted in any form or by anymeans, electronic or mechanical, including photocopying, microfilming and recording, orby any information storage or retrieval system, without permission in writing fromWoodhead Publishing Limited.
The consent of Woodhead Publishing Limited does not extend to copying for generaldistribution, for promotion, for creating new works, or for resale. Specific permission mustbe obtained in writing from Woodhead Publishing Limited for such copying.
Trademark notice: product or corporate names may be trademarks or registered trademarks,and are used only for identification and explanation, without intent to infringe.
British Library Cataloguing in Publication DataA catalogue record for this book is available from the British Library.
Library of Congress Cataloging in Publication DataA catalog record for this book is available from the Library of Congress.
Woodhead Publishing ISBN-13: 978-1-84569-026-7 (book)Woodhead Publishing ISBN-10: 1-84569-026-5 (book)Woodhead Publishing ISBN-13: 978-1-84569-248-3 (e-book)Woodhead Publishing ISBN-10: 1-84569-248-9 (e-book)CRC Press ISBN-13: 978-0-8493-9101-9CRC Press ISBN-10: 0-8493-9101-6CRC Press order number: WP9101
The publishers’ policy is to use permanent paper from mills that operate a sustainableforestry policy, and which has been manufactured from pulp which is processed usingacid-free and elementary chlorine-free practices. Furthermore, the publishers ensure that thetext paper and cover board used have met acceptable environmental accreditation standards.
Project managed by Macfarlane Production Services, Dunstable, Bedfordshire, England(e-mail: [email protected])
Typeset by Replika Press Pvt Ltd, IndiaPrinted by T J International Ltd, Padstow, Cornwall, England
iv

Contributor contact details xi
Introduction xv
Part I The structure and properties of cotton
1 Chemical structure and properties of cotton 3
Y-L HSIEH, University of California, USA
1.1 Introduction 31.2 Chemistry 31.3 Fiber development 71.4 Fiber strength 171.5 Conclusion 291.6 Acknowledgements 301.7 References and further reading 30
2 Physical structure and properties of cotton 35
J W S HEARLE, University of Manchester, UK
2.1 Introduction 352.2 Cotton morphology 352.3 Moisture absorption 402.4 Mechanical properties 462.5 Other physical properties 572.6 Sources of further information 622.7 Future trends 632.8 References 63
3 Cotton fibre quality 68
S GORDON, CSIRO Textile and Fibre Technology, Australia
3.1 Introduction 683.2 Length properties 703.3 Transverse properties 77
Contents
v

Contentsvi
3.4 Tensile properties 813.5 Colour 843.6 Impurities in cotton 853.7 Moisture 923.8 Wax content 923.9 Microbial attack 943.10 Future trends 943.11 Sources of further information 953.12 References 95
Part II Production processes for cotton
4 The genetic modification of cotton 103
S ORFORD, S DELANEY and J TIMMIS, The University of Adelaide,Australia
4.1 Introduction 1034.2 Advantages and limitations of conventional plant breeding 1044.3 The molecular genetics of cotton 1074.4 Genetic transformation of cotton 1104.5 Genetic engineering in cotton 1134.6 Recent experiments and future targets for genetic
manipulation of cotton 1164.7 Potential impacts of GM crops 1194.8 Conclusions 1224.9 Sources of further information 1224.10 References 123
5 Organic cotton 130
P J WAKELYN, National Cotton Council, USA and M R CHAUDHRY,Internatonal Cotton Advisory Committee, USA
5.1 Introduction 1305.2 World organic cotton production 1315.3 Why organic cotton? 1335.4 Production of organic cotton and how it varies from
conventional cotton production 1395.5 Post-harvest handling/processing of organic cotton 1495.6 Limitations to organic production 1545.7 Methods to improve organic cotton production 1575.8 Certification 1585.9 Naturally colored organic cotton 1635.10 Conclusions 1645.11 References 165
Appendix 5.1 171Appendix 5.2 174

Contents vii
6 The harvesting and ginning of cotton 176
W S ANTHONY, formerly United States Department of Agriculture, USA
6.1 Introduction 1766.2 Harvesting 1786.3 Seed cotton storage 1816.4 Gin machinery 1836.5 Effect of gin machinery on cotton quality 1966.6 Summary 1986.7 Future trends 2006.8 References 201
7 The opening, blending, cleaning and carding of cotton 203
C LAWRENCE, University of Leeds, UK
7.1 Introduction 2037.2 Stage 1: pre-opening/pre-mixing 2067.3 Stage 2: heavy particle detection and extraction 2077.4 Stage 3: carding 2177.5 Silver quality and quality control 2257.6 References 238
8 Cotton spinning technology 240
L HUNTER, CSIR and Nelson Mandela Metropolitan University,South Africa
8.1 Introduction 2408.2 Preparation for spinning 2428.3 Combing 2498.4 Roving 2518.5 Spinning 2538.6 Spinning limits and yarn irregularity 2698.7 Yarn twisting (folding) 2708.8 Winding, clearing and lubrication 2718.9 Yarn steaming (setting) 2728.10 Conclusions 2728.11 References 272
9 Cotton knitting technology 275
N UÇAR, Istanbul Technical University, Turkey
9.1 The development of knitting technology 2759.2 Terms used in knitting technology 2769.3 Classification of knitting technology 2849.4 Weft knitting technology 2859.5 Warp knitting technology 302

Contentsviii
9.6 Faults in knitted fabrics 3169.7 Physical and mechanical properties of knitted fabrics 3189.8 Production calculation 3239.9 Conclusions 3259.10 References 325
10 Cotton weaving technology 328
I DORAISWAMY and A BASU, The South India Textile ResearchAssociation, India
10.1 Introduction 32810.2 Preparatory processes for weaving 32910.3 Weaving process 33210.4 Woven fabric 34010.5 Modern weaving machines 34210.6 Looms installed and weaving costs in selected countries 34910.7 Future of weaving 35010.8 Sources of further information 351
11 Dyeing cotton and cotton products 353
D KING, CSIRO Textile and Fibre Technology, Australia
11.1 Introduction 35311.2 General principles 35311.3 Direct dyes 35711.4 Reactive dyes 35811.5 Vat, sulphur and azoic dyes 35911.6 Exhaust dyeing of cotton 36411.7 Semi-continuous dyeing 36711.8 Continuous dyeing of cotton fabrics 36811.9 Printing of cotton fabrics 36911.10 Environmental aspects of dyeing cotton 37211.11 Future trends 37311.12 Sources of further information 37611.13 References 376
Part III Quality and other issues
12 Testing cotton yarns and fabrics 381
L HUNTER, CSIR and Nelson Mandela Metropolitan University,South Africa
12.1 Introduction 38112.2 Yarn testing 38212.3 Fabric testing 39812.4 Colourfastness 411

Contents ix
12.5 Weathering test 41412.6 Dimensional stability 41412.7 Abrasion resistance 41512.8 Fabric strength 41812.9 Miscellaneous tests 41912.10 General 42112.11 Conclusions 42112.12 References 422
13 Controlling costs in cotton production 425
T TOWNSEND, International Cotton Advisory Committee, USA
13.1 Introduction 42513.2 The economic importance of cotton 42513.3 Production 42613.4 Consumption 43413.5 Trade 44113.6 Government measures 44913.7 Prices 45213.8 Future trends 45313.9 Sources of further information 45413.10 References 455
Appendix 456
14 Health and safety issues in cotton production and
processing 460
P J WAKELYN, National Cotton CounciL, USA
14.1 Introduction 46014.2 Cotton production 46214.3 Harvesting and ginning 46614.4 Yarn and fabric manufacturing 46714.5 Wet processing (preparation, dyeing and finishing) 47014.6 Consumers 47914.7 Future trends 47914.8 References 479
15 Recycling of cotton 484
B J COLLIER, J R COLLIER, Florida State University, USA, S PETROVAN,University of Tennessee, USA and I I NEGULESCU, LouisanaState University
15.1 Introduction 48415.2 Textile life cycle and waste treatment choices 48415.3 Cotton sources 48715.4 Mechanical reprocessing 489

Contentsx
15.5 Chemical recycling 49015.6 Future trends 49615.7 Sources of further information 49815.8 References 498
16 Nonwoven technology for cotton 501
G BHAT, University of Tennessee, USA
16.1 Nonwovens 50116.2 Production of nonwovens 50316.3 Fibers used in nonwovens 51216.4 Finishing and treatment of cotton nonwovens 52316.5 Future trends 52416.6 Conclusions 52516.7 References 526
Index 528
(* = main contact)
Contributor contact details
Editors
Dr Stuart GordonCSIRO Textile and Fibre TechnologyP.O. Box 21Belmont, VIC 3216Australia
E-mail: [email protected]
Dr You-Lo HsiehDivision of Textiles and ClothingUniversity of CaliforniaOne Shields AvenueDavis, CA, 95616-8722USA
E-mail: [email protected]
Chapter 1
Dr You-Lo HsiehDivision of Textiles and ClothingUniversity of CaliforniaOne Shields AvenueDavis, CA, 95616-8722USA
E-mail: [email protected]
Chapter 2
Professor John W. S. HearleThe Old VicarageMellorStockportCheshire SK6 5LXUK
E-mail:[email protected]
Chapter 3
Dr Stuart GordonCSIRO Textile and Fibre TechnologyP.O. Box 21Belmont, VIC 3216Australia
E-mail: [email protected]
Chapter 4
Sharon Orford,* Sven Delaney andJeremy TimmisSchool of Molecular and BiomedicalScienceThe University of AdelaideSouth Australia 5005Australia
Email: [email protected]@adelaide.edu.au
xi

Contributor contact detailsxii
Chapter 5
Dr Phillip J. Wakelyn*National Cotton Council1521 New Hampshire AveNW Washington, DC 20036-1205USA
E-mail: [email protected]
Dr M. Rafiq ChaudhryInternational Cotton AdvisoryCommittee1629 K Street, Suite 702Washington, DC 2006USA
E-mail: [email protected]
Chapter 6
Mr W. Stanley AnthonyUSDA-ARS Cotton Ginning ResearchUnit (Retired)2750 Ascot PlaceGreenville, MS 38701USA
E-mail: [email protected]
Chapter 7
Professor C. LawrenceSchool of DesignUniversity of LeedsWoodhouse LaneLeeds LS2 9JTUK
E-mail: [email protected]
Chapters 8 and 12
Dr Lawrance HunterCSIR and Nelson MandelaMetropolitan UniversityP O Box 1124Port Elizabeth 6000South Africa
E-mail: [email protected]@nnmu.ac.za
Chapter 9
Nuray UçarIstanbul Technical UniversityFaculty of Textile Technology andDesignTextile Engineering Departmentİ nönü Caddesi 87Gümü ş suyu 34437Beyo ğ luIstanbulTurkey
E-mail: [email protected]
Chapter 10
Ms Indra Doraiswamy* andDr Arindam BasuThe South India Textile ResearchAssociationPost Box No. 3205Coimbatore Aerodrome PostCoimbatore – 641 014India
E-mail:[email protected]
xiiiContributor contact details
Chapter 11
Dr David KingCSIRO Textile and Fibre TechnologyTextile & Fibre Technology – BelmontColac RoadBelmont VIC 3216Australia
E-mail: [email protected]
Chapter 13
Mr Terry TownsendExecutive DirectorInternational Cotton AdvisoryCommittee1629 K Street, N.W., Suite 702Washington DC 20006-1636USA
E-mail: [email protected]
Chapter 14
Dr Phillip J. WakelynNational Cotton Council1521 New Hampshire AveNW Washington, DC 20036-1205USA
E-mail: [email protected]
Chapter 15
Dr Billie J. Collier*DeanCollege of Human Sciences242 Sandels BuildingFlorida State UniversityTallahassee, FL 32306-1490USA
E-mail: [email protected]
Dr Simioan PetrovanThe University of Tennessee432 Dougherty Engineering Building1512 Middle DriveKnoxville, TN 37996-2200USA
E-mail: [email protected]
Dr John R. CollierDepartment of Chemical andBiomedical EngineeringA-156 EngineeringFAMU-FSU College of Engineering2525 Pottsdamer StreetFlorida State UniversityTallahassee, FL 32310-6049USA
E-mail: [email protected]
Dr Ioan I. NegulescuLouisiana State University Center232 Human Ecology BuildingLouisiana State UniversityBaton Rouge, LA 70803USA
E-mail: [email protected]
Chapter 16
Dr Gajanan BhatThe University of Tennessee204 TANDEC Building1321 White AvenueKnoxville, TN 37996-2200USA
E-mail: [email protected]

xiv

Introduction
Cotton fiber is the purest source of cellulose and the most significant naturalfiber. The economic significance of cotton in the global market is evident byits majority share (over 50%) among fibers for apparel and textile goods.Both the market value and the quality of cotton products are directly relatedto fiber quality. Competition with other fibers is affected by innovations andcommercialization of other fibers including microdenier (polyesters andnylons), elastomeric (spandex), and lyocell fibers, among others. Fundamentalunderstanding of the fibers (structural formation during development, chemistry,physics), significant improvement in fiber quality as well as in processinnovation and product differentiation are critical to uphold the inter-fibercompetitiveness of cotton fibers and the share of cotton fibers in the globalapparel and other textile markets.
Part I of this book focuses on the chemical and physical properties ofcotton fibers. The most essential cotton fiber qualities related to mechanicalprocessing, i.e. traditionally yarn spinning, weaving, and knitting, are length,strength, fineness and their distributions. The ranking importance of thesefiber qualities varies with the type of yarn spinning method, such as ring,rotor, and air-jet. These fiber qualities also determine the yarn strength, yarnregularity, handle and luster of fabrics. For chemical processing such asscouring, dyeing and finishing, fiber structure related to maturity, or thelevel of development, plays a major role. This is largely due to the impact ofthe noncellulosic cell wall components and the cellulose in the secondarycell wall on these chemical processes.
In order to develop effective strategies for fiber quality improvement andfor innovative processing and product development, the developmental linkagesbetween these chemical and physical properties and particular fiber qualitiesneed to be identified. The relationship between cell wall development andfiber structure and properties has only gained attention more recently. Findingsfrom some of these systematic studies linking fiber structures and strengthwith stages of fiber development and genotypes are detailed in Chapter 1.Chemical properties of cotton are discussed in both Chapters 1 and 2. Thechemical structures and reactions are detailed in Chapter 1 whereas the
xv
effects of moisture, mercerization, swelling and resin-treatments are includedin Chapter 2.
The strength of cotton fibers is attributed to the rigidity of the cellulosicchains, the highly fibrillar and crystalline structure, and the extensiveintermolecular and intramolecular hydrogen-bonding. Chapter 2 includesdetailed discussion of mechanical properties, including tensile strength, fractureand fatigue, and structural mechanics as well as other physical propertiessuch as thermal, electric, friction and optical. The majority of strength datahave been based on bundle strength, such as that generated by the Stelometeror high volume instruments (HVI) in recent years.
The understanding of structural origins of fiber properties such as strengthand dyeability is fundamental to competitiveness and future development ofquality cotton goods. However, significant challenges remain today partlydue to the variability of the cotton fibers, a common characteristic of anatural product. Even the complex strength relationships between singlefibers and bundles or fibers and yarns are not completely clear. For example,fibers shorter than 12.7 mm make little contribution to yarn strength. Fiberelastic behavior (elongation) and inter-fiber frictional characteristics mayalso contribute to yarn strength, but their association with strength has notyet been systematically studied.
The fiber properties that determine the market value of cotton arediscussed in Chapter 3 along with the test methods used to measure theseproperties, and caveats associated with each method. Currently around 30%of the world’s cotton is objectively tested using HVI1. The remaining 70% islargely classed subjectively by humans against physical cotton standards.The USDA Universal Cotton Standards are used in over twenty countries toclass and determine the value of cotton for trade and spinning. Other nationalstandards and merchant ‘shipper type’ standards are also used to ascribevalue to traded cotton. International efforts to expand the use of objectivetesting and to develop fast and accurate test methods for important propertiessuch as fiber fineness and maturity, trash content, neps and stickiness continue.Other important qualities to the spinner and dyers such as the wax layer thatenvelopes the fiber, moisture uptake and microbial decay are also discussedin Chapter 3.
In Part II, the production (growing of cotton) and processing of cottonfiber and fabric are described. Genetic modification or transformation ofcotton plants via molecular genetic approaches has resulted in the introductionof pest-tolerant, and herbicide-resistant traits to cotton. A brief history andintroduction to the science behind genetic modification of cotton, includingtraditional plant breeding is given in Chapter 4. The new traits introduced tocotton via molecular genetic modification have improved crop productivityand significantly reduced the reliance by cotton on some insecticides. Arounda third of all cotton grown in the world is now genetically modified. However,
Introductionxvi
despite the potential of genetically modified crops, there remain significanttechnical hurdles to overcome before many of the promises and claims madefor genetically modified cotton are realized. Genetic transformation, that isthe artificial insertion of a single foreign gene or a few genes into a plant’sgenome, requires two fundamental steps: Introduction of the new gene andregeneration of intact plants. Both steps have numerous constraints, and notleast is the understanding of the role inherent genes have in their ownchromosome set. Future genetic manipulation of cotton is aimed at realizingbetter fiber quality, increased resistance to pests and diseases, and improvingthe ability of the cotton plant to grow under adverse water, heat and nutrientconditions.
Like genetically modified cotton, organic cotton generates much debateon its worth to society. There continues to be worldwide interest in organiccotton on the basis that it is an environmentally friendly and cost-effectiveway to produce cotton. Production of organic cotton has recently increasedto about 0.1% or about 110,000 bales of world cotton production, mainly dueto increased production in Turkey as well as India, China and some Africancountries. Based on the facts available, growing organic cotton is moreexpensive to produce than conventional cotton if the same nutrient and pestmanagement equivalents are used to ensure comparative yield and qualityoutputs. Viewed from this perspective organic cotton production practicesare not necessarily more environmentally friendly or sustainable than currentconventional practices. Management of organic cotton, from production throughtextile processing, is discussed in Chapter 5 and compared with conventionalpractices. How organic cotton is certified and organized as an industry segmentis also discussed, along with the limitations of organic cotton productionpractice that need to be overcome if organic cotton is to become more thana small niche product.
Harvest and ginning processes are discussed in Chapter 6. These processes,which represent the first steps in the conversion of fiber to fabric, have asignificant influence on the quality of the fiber realized from a crop. Enormousdifferences exist in harvest and ginning processes across the cotton world.Harvest methods range from totally hand-harvested crops in some countriesto totally machine-harvested in others with only the United States, Australiaand Israel harvest methods being fully mechanized. The principal functionof the cotton gin is to separate lint from seed and produce the highest monetaryreturn for the resulting lint (fiber) and seed under the marketing conditionsthat prevail. Currently the market rewards whiter, cleaner cotton with acertain traditional appearance of the lint known as preparation. Preparationis a relative term describing the amount of cleaning or combing given tocotton so that it matches official (USDA) physical grade standards uponwhich cotton is valued. However, these properties are more often not asimportant to the final product as the focus at the gin and across the merchant
Introduction xvii
desk would attest. The majority of spinners prefer fiber that is long, even inlength, strong, fine and without high proportions of nep and short fiber.These last two parameters are unfortunate characteristics of cottonharvested and ginned by mechanized means. Whilst not included in existingclassification systems for cotton, the presence of nep and short fiber seriouslyaffects the attractiveness of some cotton produced in the USA and Australia,which utilize automated harvesting and ginning systems.
Cotton accounts for the bulk of the raw material used in the very largeshort-staple spun yarn market, despite rapid incursion of synthetic fibers intothe textile market over the last 35 years. The proportion is considerably lessin the non-woven market, although the potential for increased use on thebasis of cotton’s natural attributes is high. Opening and carding, spinning,knitting, weaving and non-woven production processes are describedrespectively in Chapters 7 to 10 and 16. Whilst the basic mechanics of theseprocesses, which evolved from hand-operated machines and tools, someused over 6000 years ago, have not changed greatly, speed, efficiency andthus productivity have increased dramatically. For example, cotton cardingmachines processing fiber at 70 kg per hour just over ten years ago nowprocess fiber in excess of 200 kg per hour, and modern yarn spinningtechnologies, like the Murata Vortex Spinner (MVS) enable yarn to be spunat speeds in excess of 400 m per minute. Likewise the productivity of knittingand weaving machines has increased. Chapters 7 and 8 cover the variousprocesses and technologies involved in the conversion of raw cotton fiberinto yarn suitable for subsequent fabric manufacturing. Chapters 9, 10 and16 cover the major cotton fabric formation processes, which are most commonlyknitting and weaving processes, as well as the newer non-woven processes.In the last few decades non-woven fabrics have become more popular, andcurrently represent the fastest growing sectors of textile materials, particularlyin the market for single use, or disposable products.
Coloration of cotton is a well-developed industrial process to add value.Chapter 11 discusses the common classes of dyes and dyeing and printingmetholodogy. Dyeing involves the diffusion of dyes into the non-crystallineregions of the highly crystalline cellulose structure in the cotton fibers, thusfavoring elongated and coplanar dye structures. Retention or substantivityrequires strong secondary forces and/or chemical bonding with the hydroxylfunctional groups of cellulose. Improvement of dye affinity to cotton, reductionof chemical effluents from dyeing as well as development of dyes that serveother functions are among some of the current trends.
Survival in today’s textile market relies on knowledge of raw materialcosts, the maintenance of product quality, health and safety issues and recycling(cradle-to-grave) processes associated with the manufacture of cotton products.Part III of this book provides insight into the science and technology thatinfluences and is used in these areas. In the highly competitive global textile
Introductionxviii
market, the survival of a textile company depends greatly upon its ability tomeet demanding quality specifications within acceptable price and deliverytime frames. Chapter 12 deals largely with the objective or instrument testingof yarn and fabric physical and related properties inasmuch as they relate totheir subsequent performance in textile processing and end-use performance.Whilst, generic or general testing of yarns and fabrics is carried out irrespectiveof their end-use to ensure consistency in production, specific tests are alsoconducted to determine the performance of fabric or yarn for specific andespecially critical end-uses. For example, for fabric to be used in children’snightwear, flammability is of paramount importance, whereas for fabricsused in parachutes, bursting and tear strength, impact resistance and airpermeability are critically important.
Chapter 13 covers world cotton and cotton textile production and theinfluence of technological advances on productivity, and on consumer supplyand demand for cotton. Government subsidies have a significant and distortinginfluence on production and the final price paid for cotton. The distortingeffects of these subsidies, which are created in response to local politicalpressures in each country, are also discussed. World cotton production andconsumption are currently trending higher under the influence of newtechnologies, including the use of genetically modified cotton varieties. Worldcotton production reached 26 million tons in 2004/05 with the cost of productionfor most producers falling between 50 and 60 US cents per pound. Internationalcotton prices have declined in real terms over the last six decades because ofadvances in technology, and this process is continuing. In the 20 to 25 yearsto the mid-1990s, the average world price of cotton was 70 cents per pound,but the average international price during the current decade is expected tostay between 50 and 60 cents per pound, in line with the costs of productionfor most producers.
Health and safety are key components of responsible production andprocessing of cotton and of a responsible management system for cottonoperations. Workers handle and process cotton in many work operationsfrom planting the cottonseed, to the finished cotton textile, i.e. from production,harvesting, ginning, yarn and fabric manufacturing, and preparation, throughto dyeing and finishing. Each cotton industry sector has its own particularhealth and safety considerations. Chapter 14 covers the pertinent health andsafety issues for each sector of the cotton industry.
Environmental conservation from the perspective of preserving expensiveproduced cotton, reducing disposed wastes and regenerating new usage fromspent cotton goods is of significant concern today. Chapter 15 discussesissues related to the recycling of cotton textiles including reuse, disposal,landfill and incineration. Life cycle analyses of cotton require the examinationof the environmental impact of cotton production, energy consumption inprocessing and disposal. The sources of cotton as well as the processing
Introduction xix
methods for recycling are detailed in this chapter. The ultimate conversion ofcotton cellulose requires chemical processing or dissolution and remains atechnological challenge.
Reference
1. McDill, N.R., Commercial Standardization of Instrument Testing of Cotton, Proceedings
of the EFS® Systems Conference, 7pp., 2004
Introductionxx

Chemical structure and properties of cotton 1
Part I
The structure and properties of cotton

Cotton: Science and technology2
3
1.1 Introduction
Cotton fibers are the purest form of cellulose, nature’s most abundant polymer.Nearly 90% of the cotton fibers are cellulose. All plants consist of cellulose,but to varying extents. Bast fibers, such as flax, jute, ramie and kenaf, fromthe stalks of the plants are about three-quarters cellulose. Wood, both coniferousand deciduous, contains 40–50% cellulose, whereas other plant species orparts contain much less cellulose. The cellulose in cotton fibers is also of thehighest molecular weight among all plant fibers and highest structural order,i.e., highly crystalline, oriented and fibrillar. Cotton, with this high quantityand structural order of the most abundant natural polymer, is, not surprisingly,viewed as a premier fiber and biomass.
This chapter focuses on the chemical structure of cotton fibers and itsstructural relationship to cellulose synthesis, fiber development and dehydrationas well as other chemical and structural aspects (physical properties, dyeingand finishing) not dealt with in the following chapters. Cotton fiber cells aredeveloped in four overlapping but distinct stages of initiation, elongation,secondary cell wall thickening and maturation and desiccation (Naithani et
al., 1982). Structural development and properties of cotton fibers during theprimary wall formation (elongation) and secondary wall thickening (cellulosesynthesis) as well as during desiccation (transition from mobile to highlyhydrogen-bonded structure) are detailed.
1.2 Chemistry
1.2.1 Chemical composition
Cotton fibers are composed of mostly a-cellulose (88.0–96.5%) (Goldwaithand Guthrie, 1954). The noncellulosics are located either on the outer layers(cuticle and primary cell wall) or inside the lumens of the fibers whereas thesecondary cell wall is purely cellulose. The specific chemical compositions
1Chemical structure and properties of cotton
Y L H S I E H, University of California, USA

Cotton: Science and technology4
of cotton fibers vary by their varieties, growing environments (soil, water,temperature, pest, etc.) and maturity. The noncellulosics include proteins(1.0–1.9%), waxes (0.4–1.2%), pectins (0.4–1.2%), inorganics (0.7–1.6%),and other (0.5–8.0%) substances. In less developed or immature fibers, thenon-cellulosic contents are much higher.
The primary cell walls of cotton fibers contain less than 30% cellulose,noncellulosic polymers, neutral sugars, uronic acid, and various proteins(Huwyler et al., 1979; Meinert and Delmer, 1977). The cellulose in theprimary cell walls has lower molecular weight, with the degree ofpolymerization (DP) between 2,000 and 6,000 and their distributions arebroader (Goring and Timell, 1962; Hessler et al., 1948). The secondary wallof the cotton fiber is nearly 100% cellulose. The DP of the cellulose in thesecondary wall is about 14,000, and the molecular weight distribution ismore uniform (Figini, 1982). The high molecular weight cellulose characteristicof mature cotton has been detected in fibers as young as eight days old. Inthe later stage of elongation or 10–18 days following initiation, the highermolecular weight cellulose decreases while the lower-molecular weight cellwall components increase, possibly from hydrolysis (Timpa and Triplett,1993). Between the ages of 30 and 45 days, the DPs estimated from intrinsicviscosities of fibers have been shown to remain constant (Nelson and Mares,1965).
Of the non-cellulosic components in the cotton fibers, the waxes andpectins are most responsible for the hydrophobicity or low water wettabilityof raw cotton fibers. The term ‘cotton waxes’ has been used to encompass alllipid compounds found on cotton fiber surfaces including waxes, fats, andresins (Freytag and Donze, 1983). True waxes are esters, including gossypylcarnaubate, gossypyl gossypate, and montanyl montanate. Alcohols and higherfatty acids, hydrocarbons, aldehydes, glycerides, sterols, acyl components,resins, cutin, and suberin are also found in the wax portion of the cuticle invarying quantities. Pectins are composed primarily of poly(b-1,4-polygalacturonic acid) and rhamose to make up the rhamnogalacturonanbackbone (Heredia et al., 1993). The side chains are composed of arabinose,galactose, 2-O-methylfucose, 2-O-methylxylose and apiose. Eighty-five percentof the polygalacturonic acid groups are methylated leading to a highlyhydrophobic substance. Proteins are located primarily in the lumen, butsmall amounts of hydroxyproline rich proteins are present on the fiber surface(Darvill et al., 1980). The far lower extents of the non-cellulosics than cellulosemake their detection in mature cotton fibers challenging. Extraction andreaction techniques are often employed to separate the non-cellulosic cellwall components for characterization. These procedures, however, tend todisrupt their organization and possibly alter their chemical compositions.
The amounts of the noncellulosic components change during fiber elongationand the transition from primary to secondary wall, but discrepancies remain
Chemical structure and properties of cotton 5
in the exact quantities of these changes. Some of the protein constituents(enzymatic, structural or regulatory) are unique to cotton fiber cells and havebeen found to be developmentally regulated (Meinert and Delmer, 1977).The non-cellulosic constituents in developing cotton fibers through the onsetof secondary cell wall synthesis can be clearly identified by analyticaltechniques, including FTIR/ATR, DSC, TGA, and pyrolysis-GC/MS methods(Hartzell-Lawson and Hsieh, 2000). The waxy compounds in developingfibers up to 17 days old are detected by their melting endotherms in the DSC.Pectins can be detected by FTIR in the 14-day-old as well as the maturefibers. FTIR/ATR measurements indicated the presence of proteins indeveloping fibers up to 16 dpa. The presence of proteins can be measured byFTIR/STR methods in up to 16-day-old fibers and by pyrolysis-GC/MS inup to 14-day-old fibers. Only pyrolysis-GC/MS could detect the presence ofthe non-cellulosic compounds in 27-days-old fibers. The detection of thenon-cellulosics diminished as the proportion of cellulose rapidly increasedat the onset of secondary cell wall synthesis. The presence of hydrophobiccompounds on the surfaces of cotton fibers of all ages and their removal byalkaline scouring are easily determined by their water contact angles.
Among the inorganic substances, the presence of phosphorus in the formof organic and inorganic compounds is of importance to the scouring processused to prepare fibers for dyeing. These phosphorus compounds are solublein hot water, but become insoluble in the presence of alkali earth metals. Theuse of hard water, therefore, can precipitate alkali earth metal phosphates onthe fibers instead of eliminating them (Hornuff and Richter, 1964).
1.2.2 Cellulose chemistry and reactions
Cotton cellulose is highly crystalline and oriented. a-cellulose is distinct inits long and rigid molecular structure. The b-1,4-D(+)-glucopyranose buildingblocks in long cellulose chain are linked by 1,4-glucodic bonds. The stericeffects prevent free rotation of the anhydrogluco-pyranose C-O-C link. Eachanhydroglucose contains three hydroxyl groups, one primary on C-6 and twosecondary on C-2 and C-3. The abundant hydroxyl groups and the chainconformation allow extensive inter-molecular and intra-molecular hydrogenbonding to further enhance the rigidity of the cellulose structure.
Chemical reactions and heating effects on cotton cellulose depends on thesupermolecular structure as well as the activity of the C-2, C-3 and C-6hydroxyl groups. Heat or reactions begin in the more accessible amorphousregions and the surfaces of crystalline domains. Chemical reactivity of thecellulose hydroxyl groups follows those of aliphatic hydroxyl groups, i.e.,higher for the C-6 primary than the secondary on the C-2 and C-3. Etherificationand esterification are the two main categories of reactions. Esterificationreactions, such as nitration, acetylation, phosporylation, and sulfation, are

Cotton: Science and technology6
usually carried out under acidic conditions. Etherification, on the other hand,is favored in an alkaline medium.
Cellulose is readily attacked by oxidizing agents, such as hypochlorites,chlorous, chloric, and perchloric acids, peroxides, dichromates, permanganates,periodic acid, periodate salts, and nitrogen tetroxide (Bikales and Segal,1971). Most oxidizing agents are not selective in the way they react with theprimary and secondary hydroxyl groups. Oxidation of cellulose can lead totwo products, reducing and acidic oxycellulose. In reducing oxycellulose,the hydroxyl groups are converted to carbonyl groups or aldehydes, whereasin acidic oxycellulose, the hydroxyl groups are oxidized to carboxyl groupsor acids. The oxycellulose can be further oxidized to acidic oxycellulose.Reducing oxycellulose is more sensitive to alkaline media and the chain lengthsare often reduced. Periodic acid and periodate salts break the anhydroglucosering between C-2 and C-3, converting the two secondary hydroxyl to aldehydeswhich can be further oxidized to carboxyl groups. Nitrogen tetraoxide reactsspecifically with the primary hydroxyl groups on C-6, oxidizing it to carboxylgroup directly or to polyglucuronic acid, an oxycellulose.
1.2.3 Heating effects
Heating generally causes dehydration and decomposition of cellulose. Thesereactions are influenced by the presence of other compounds as well as thetemperature and rate of heating. Dehydration reactions are favored in thepresence of acid catalysts whereas depolymerization reactions are favoredby alkaline catalysis. Heating at lower temperatures favors dehydrationand enhances subsequent char formation (Shafizadeh, 1975). Highertemperature heating causes rapid volatilization via the formation oflaevoglucosan, forming more gaseous combustible products. Greaterdehydration also reduces the yield of laevoglucosan and subsequently lowersthe volatile species. Therefore, acid catalysts are of special importance toimpart flame retardancy to cellulose.
Heating cotton cellulose up to 120 ∞C drives off moisture without affectingstrength. Heating to a higher 150 ∞C has been shown to reduce solutionviscosity, indicative of lowered molecular weight, and tensile strength(Shafizadeh, 1985). Between 200 ∞C and 300 ∞C, volatile products and liquidpyrolyzate, mainly 1,6-anhydro-b-D-glucopyranose, commonly known aslevoglucosan, evolve. At 450 ∞C, only char remains. Of total pyrolytic products,20% is the gaseous phase (CO, CO2, CH4), 65% is the liquid phase (of which80% is levoglucosan) and 15% is the char. The heating rate can affect theamount of char formation (Shafizadeh, 1985). Heating below 250 ∞C affectsonly the amorphous regions since no change in the crystalline structure hasbeen found. The crystalline structure of cellulose has been shown to be lowerwhen heated at 250 ∞C to 270 ∞C, and then disappear on further heating to

Chemical structure and properties of cotton 7
300 ∞C. Highly crystalline cellulose has been shown to decompose at highertemperatures, for instance 380 ∞C (Bikales and Segal, 1971).
Blocking the primary hydroxyl groups of cellulose preventsdepolymerization, thus reducing production of volatiles. The reduction offlammable gases is accompanied by more complete intra-ring and inter-ringdehydration, giving rise to keto-enol tautomers and ethermic linkages,respectively. The carbonyl groups so formed can participate in a variety ofreactions, leading to cross-linking, thus increasing char formation as well ascarbon dioxide. The packing density of cellulose also affects the extent oflevoglucosan formation. Lowered crystallinity in cotton by either mercerizationor liquid ammonia leads to a higher yield of levoglucosan formation(Shafizadeh, 1985). Mono- and difunctional radicals are formed by the cleavageof glucoside linkages, and these radicals in turn give rise to volatile productsand levoglucosan.
1.3 Fiber development
1.3.1 Fiber structures during cell growth
The structure of cotton fibers can be viewed along the fiber axis and acrossthe fiber section. Current understanding of cotton fiber structure has beenmainly from investigation of the matured fibers in their dried state. Althoughthe biochemical nature of cotton cell structure, particularly during early cellgrowth, has been extensively studied, the development macrostructure of themain constituent of the fiber, cellulose, is not as well understood.
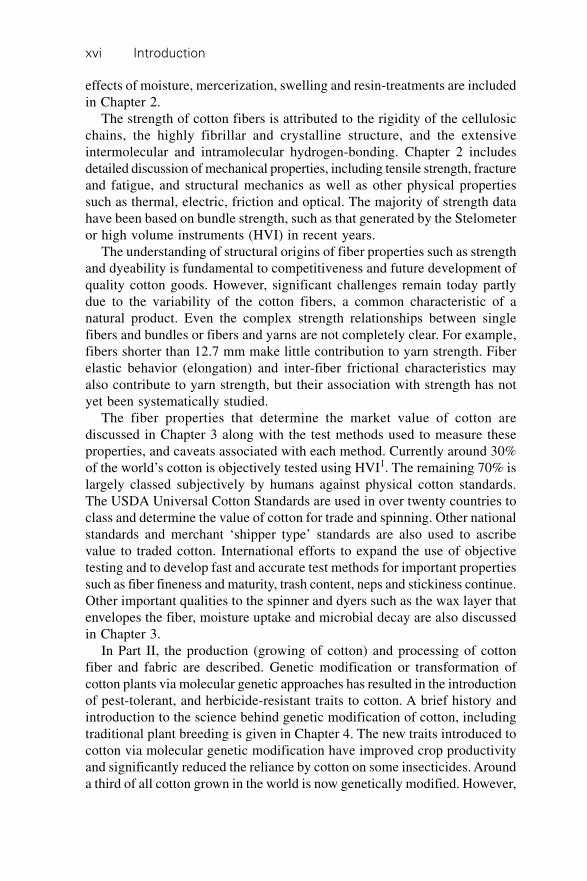
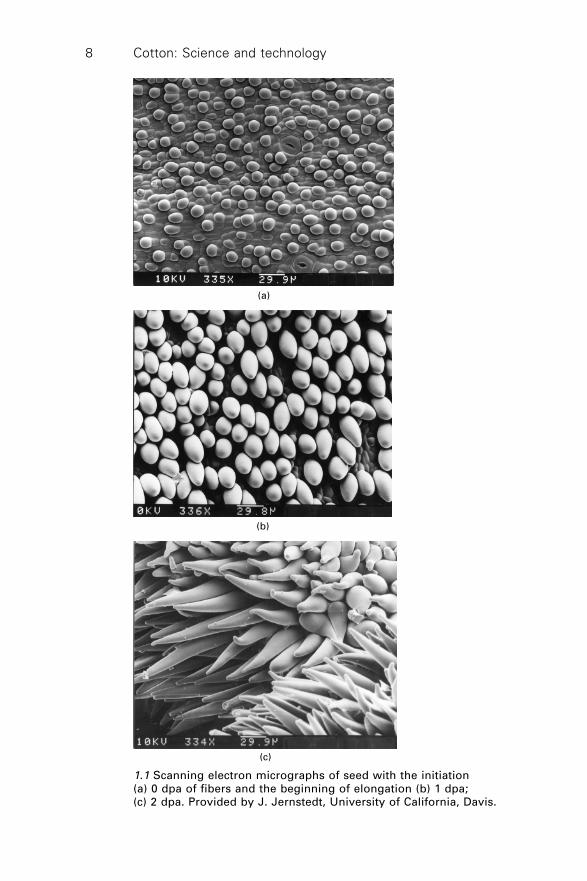
Cotton fibers are the largest (longest) single cells in nature. The fibers aresingle-celled outgrowths from individual epidermal cells on the outerintegument of the ovules in the cotton fruit. About one in four epidermalcells differentiates into fiber cells beginning at one day before to two daysafter anthesis (flowering) (Graves and Stewart, 1988). Four overlapping butdistinct stages are involved in cotton fiber development: initiation, elongation,secondary-wall thickening, and maturation (Naithani et al., 1982). The initiationof fibers begins from the epidermal cells on the ovule surface (Fig. 1.1(a))followed by the elongation and formation of the primary cell wall. Elongationof the primordial fiber cells starts on the day of anthesis by spherical expansionabove the ovular surface (Figs 1.1(b) and 1.1(c)) and continues for 16 to 20days. The cell elongation orients initially against the micropylar end of theovule, then become spiral after two to three days. The primary cell wallscontinue to elongate until reaching the final fiber lengths of 22 to 35 mm inabout 20 to 25 days. This primary cell wall is very thin (0.2 to 0.4 mm) andextensible.
Secondary wall synthesis starts around 15 to 22 days past anthesis (dpa)and continues for 30 to 40 days. The cellulose formation is about 130 ng/mm
Cotton: Science and technology8
1.1 Scanning electron micrographs of seed with the initiation(a) 0 dpa of fibers and the beginning of elongation (b) 1 dpa;(c) 2 dpa. Provided by J. Jernstedt, University of California, Davis.
(a)
(b)
(c)

Chemical structure and properties of cotton 9
during secondary wall formation as compared to 2 ng/mm during primarywall development (Meinert and Delmer, 1977). Fiber maturation is evidentby desiccation of the fiber and collapse of the cylindrical cell into a flattened,twisted ribbon beginning 45 to 60 dpa. Most cotton fibers have aspect ratios,or length-to-width ratios, in the 1,000 to 3,000 range. However, some maturedfibers can reach up to 4,000 times in length of their diameters. Both fiberlength and secondary wall thickness are increased with higher potassiumsupply during growth (Cassman et al., 1990).
1.3.2 Desiccation and dehydration
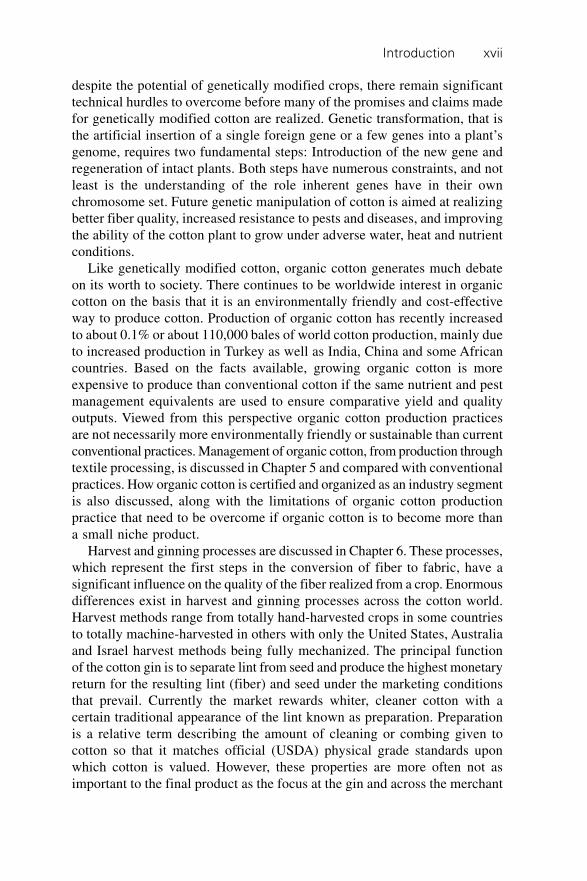
The fully hydrated cylindrical fibers are cylindrical under light microscopy(Fig. 1.2(a)). Drying of the fibers involves the removal of fluids from thelumens and inter-molecular water in the cellulose. The fluid loss from thelumens causes the cylindrical fibers to collapse to form twists or convolutions(Fig. 1.2(b)). The loss of intermolecular water allows the cellulose chains tocome closer together and form intermolecular hydrogen-bonds. Prior to balldehiscence and fiber desiccation, matured cotton fibers have been shown toexhibit high intrinsic mobility and porosity in their structure (Ingram et al.,1974). The accessibility of water in fiber structure in the hydrated state ishigher than after desiccation.
The collapse of cell walls and hydrogen bond formation cause irreversiblemorphological changes including structural heterogeneity, decreasing porosity,and sorption capacity in the fibers (Stone and Scallan, 1965). These changesincrease molecular strains and reduce chain mobility, and may have an influenceon properties essential to strength and dyeing/finishing processes. As theseirreversible changes determine the utility of fibers, understanding of thestructural changes from desiccation is essential to fiber quality research.
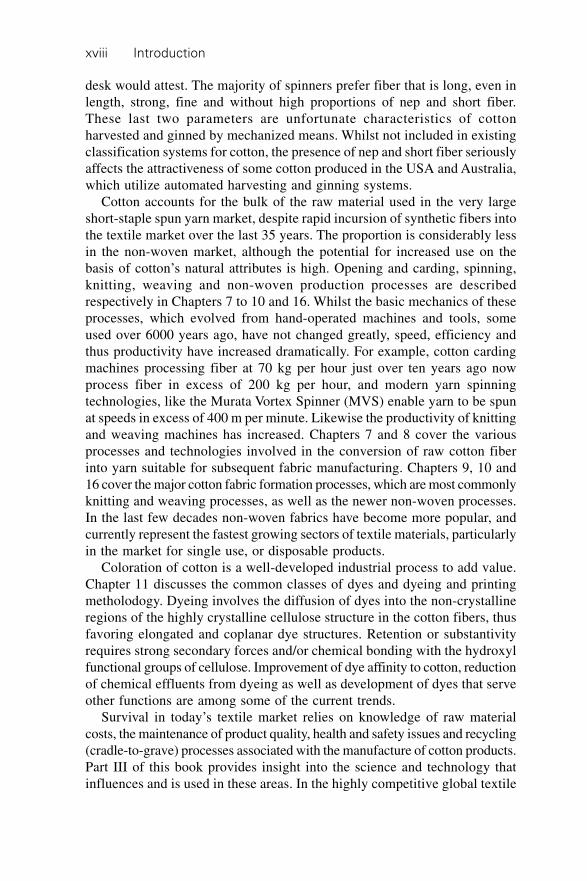
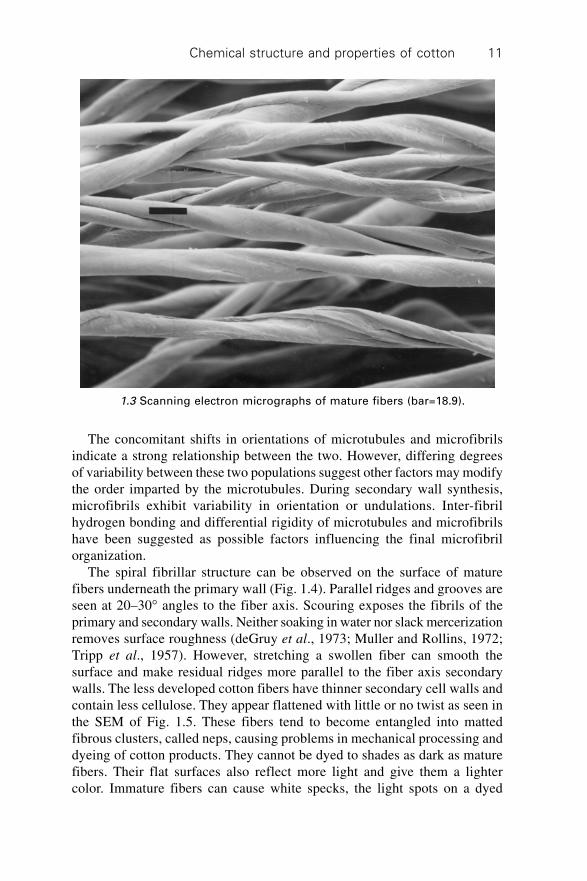
The matured fibers dry into flat twisted ribbon forms (Fig. 1.3). The twistor convolution directions reverse frequently along the fibers. The number oftwists in cotton fibers varies between 3.9 and 6.5 per mm (Warwicker et al.,1966) and the spiral reversal changes one to three times per mm length(Rebenfeld, 1977). The convolution angle has been shown to be varietydependent (Peterlin and Ingram, 1970). Differences in reversal frequencyhave been observed among different species and varieties of cotton, betweenlint and fuzz on the same ovule, and along a single fiber (Balls, 1928).
The reversals in cotton fibers are related to the orientation of the secondarywall microfibrils whose organization is critically important to fiber strength.The orientation angles and shifts of microfibrils along the fiber axis changewith cell-development stages and have been related to the cellular organizationof the cortical microtubule during cotton fiber development (Seagull, 1986,1992; Yatsu and Jacks, 1981). At the beginning of fiber development, i.e.,1 dpa, cortical microtubules have a random orientation. During the transition

Cotton: Science and technology10
1.2 Light micrographs of fully hydrated fibers (top) and dried fibers(bottom).
between initiation and elongation, i.e., 2–3 dpa, a shallow pitched helicalorientation of 75–80∞ is developed. Such angles, which are nearly perpendicularto the fiber axis, are maintained throughout primary wall synthesis. An abruptshift in orientation to a steeply pitched helical pattern occurs between theprimary and secondary wall synthesis. As secondary cell walls thicken, theangles reduce further. In early secondary wall synthesis, there is a four-foldincrease in the number of microtubules. The fibrillar orientation reversesalong the fiber periodically. The mechanism which regulates the synchronizedshifts in microtubule orientation is not yet understood.
Chemical structure and properties of cotton 11
The concomitant shifts in orientations of microtubules and microfibrilsindicate a strong relationship between the two. However, differing degreesof variability between these two populations suggest other factors may modifythe order imparted by the microtubules. During secondary wall synthesis,microfibrils exhibit variability in orientation or undulations. Inter-fibrilhydrogen bonding and differential rigidity of microtubules and microfibrilshave been suggested as possible factors influencing the final microfibrilorganization.
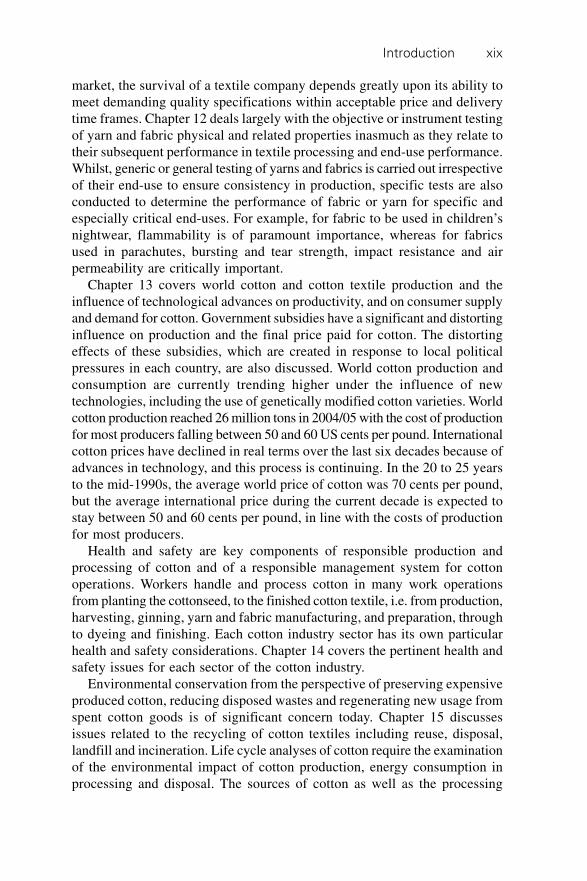
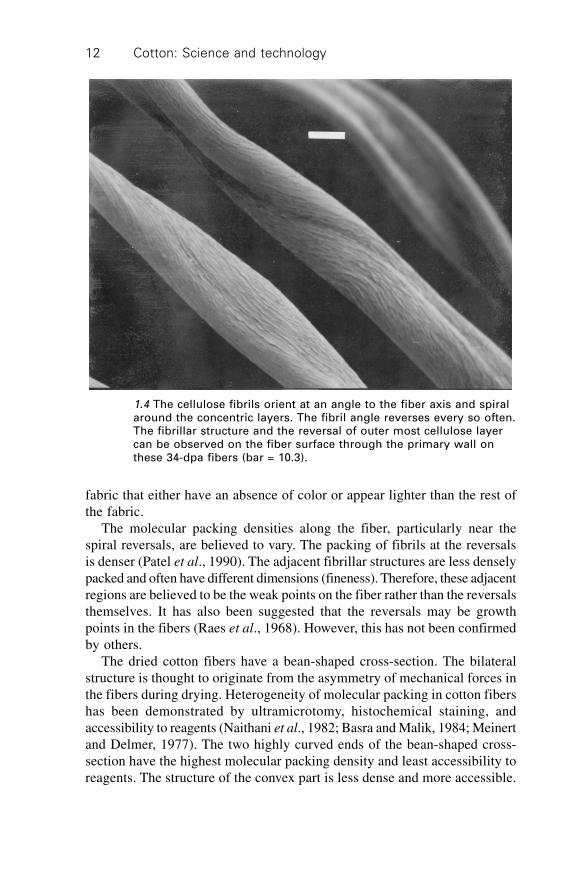
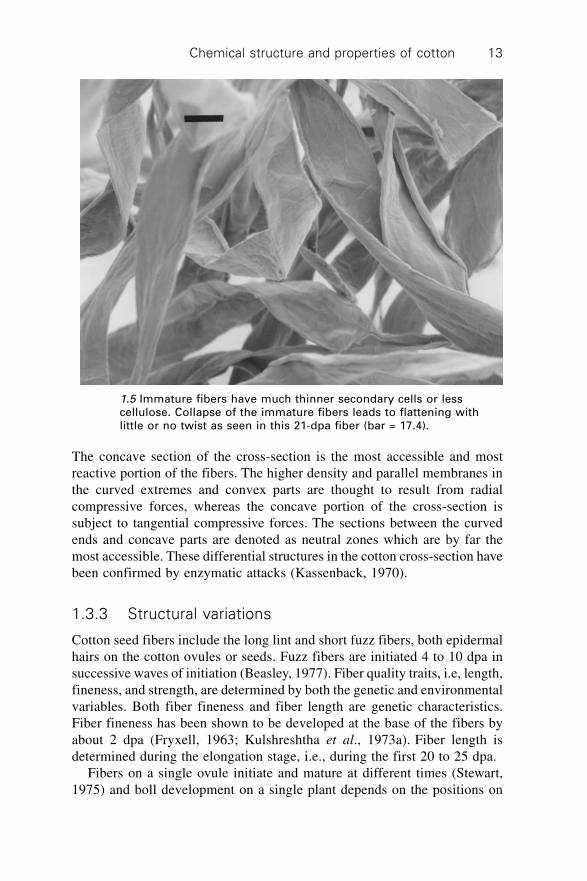
The spiral fibrillar structure can be observed on the surface of maturefibers underneath the primary wall (Fig. 1.4). Parallel ridges and grooves areseen at 20–30∞ angles to the fiber axis. Scouring exposes the fibrils of theprimary and secondary walls. Neither soaking in water nor slack mercerizationremoves surface roughness (deGruy et al., 1973; Muller and Rollins, 1972;Tripp et al., 1957). However, stretching a swollen fiber can smooth thesurface and make residual ridges more parallel to the fiber axis secondarywalls. The less developed cotton fibers have thinner secondary cell walls andcontain less cellulose. They appear flattened with little or no twist as seen inthe SEM of Fig. 1.5. These fibers tend to become entangled into mattedfibrous clusters, called neps, causing problems in mechanical processing anddyeing of cotton products. They cannot be dyed to shades as dark as maturefibers. Their flat surfaces also reflect more light and give them a lightercolor. Immature fibers can cause white specks, the light spots on a dyed
1.3 Scanning electron micrographs of mature fibers (bar=18.9).
Cotton: Science and technology12
fabric that either have an absence of color or appear lighter than the rest ofthe fabric.
The molecular packing densities along the fiber, particularly near thespiral reversals, are believed to vary. The packing of fibrils at the reversalsis denser (Patel et al., 1990). The adjacent fibrillar structures are less denselypacked and often have different dimensions (fineness). Therefore, these adjacentregions are believed to be the weak points on the fiber rather than the reversalsthemselves. It has also been suggested that the reversals may be growthpoints in the fibers (Raes et al., 1968). However, this has not been confirmedby others.
The dried cotton fibers have a bean-shaped cross-section. The bilateralstructure is thought to originate from the asymmetry of mechanical forces inthe fibers during drying. Heterogeneity of molecular packing in cotton fibershas been demonstrated by ultramicrotomy, histochemical staining, andaccessibility to reagents (Naithani et al., 1982; Basra and Malik, 1984; Meinertand Delmer, 1977). The two highly curved ends of the bean-shaped cross-section have the highest molecular packing density and least accessibility toreagents. The structure of the convex part is less dense and more accessible.
1.4 The cellulose fibrils orient at an angle to the fiber axis and spiralaround the concentric layers. The fibril angle reverses every so often.The fibrillar structure and the reversal of outer most cellulose layercan be observed on the fiber surface through the primary wall onthese 34-dpa fibers (bar = 10.3).
Chemical structure and properties of cotton 13
The concave section of the cross-section is the most accessible and mostreactive portion of the fibers. The higher density and parallel membranes inthe curved extremes and convex parts are thought to result from radialcompressive forces, whereas the concave portion of the cross-section issubject to tangential compressive forces. The sections between the curvedends and concave parts are denoted as neutral zones which are by far themost accessible. These differential structures in the cotton cross-section havebeen confirmed by enzymatic attacks (Kassenback, 1970).
1.3.3 Structural variations
Cotton seed fibers include the long lint and short fuzz fibers, both epidermalhairs on the cotton ovules or seeds. Fuzz fibers are initiated 4 to 10 dpa insuccessive waves of initiation (Beasley, 1977). Fiber quality traits, i.e, length,fineness, and strength, are determined by both the genetic and environmentalvariables. Both fiber fineness and fiber length are genetic characteristics.Fiber fineness has been shown to be developed at the base of the fibers byabout 2 dpa (Fryxell, 1963; Kulshreshtha et al., 1973a). Fiber length isdetermined during the elongation stage, i.e., during the first 20 to 25 dpa.
Fibers on a single ovule initiate and mature at different times (Stewart,1975) and boll development on a single plant depends on the positions on
1.5 Immature fibers have much thinner secondary cells or lesscellulose. Collapse of the immature fibers leads to flattening withlittle or no twist as seen in this 21-dpa fiber (bar = 17.4).
Cotton: Science and technology14
plants (Jenkins et al., 1990). On an ovule, fibers initiate first near the chalazalend, then down toward the micropylar end. Seeds located near the middle ofa locule have the longest fibers whereas those near the basal location havethickest secondary cell wall (Davidonis and Hinojosa, 1994). On a singleovule, fibers in the micropylar region have thicker cell walls than those in thechalazal end. Bolls located closer to the main stem are favored in the allocationof nutrients (Jenkins et al., 1990). Temperatures lower than optimal reduceboth fiber length and cell wall thickness (Gibson, 1986; Haigler et al., 1991).Seasonal effects of secondary wall development have been demonstrated onsummer-grown versus autumn-grown fibers (Goynes et al., 1995).
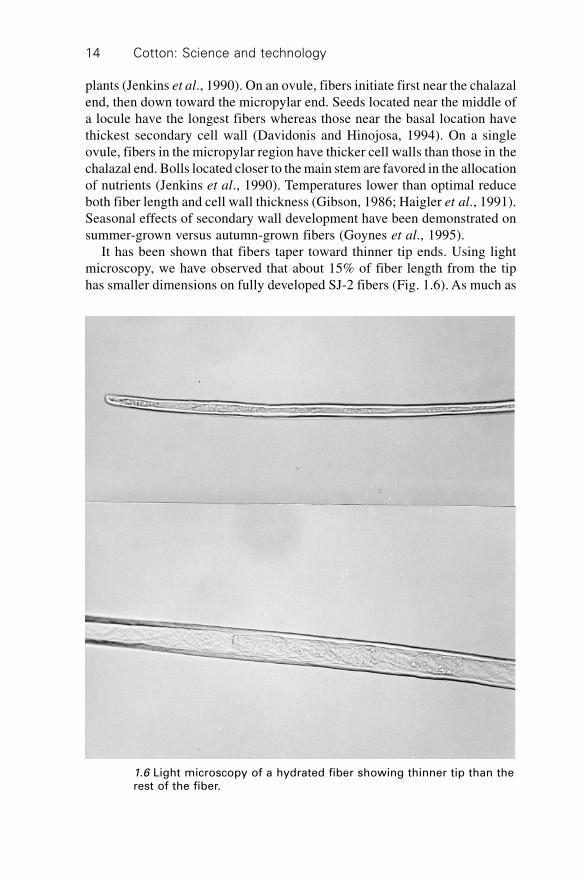
It has been shown that fibers taper toward thinner tip ends. Using lightmicroscopy, we have observed that about 15% of fiber length from the tiphas smaller dimensions on fully developed SJ-2 fibers (Fig. 1.6). As much as
1.6 Light microscopy of a hydrated fiber showing thinner tip than therest of the fiber.

Chemical structure and properties of cotton 15
one-third of fiber length has been reported on Delta 61 fibers (Boylstonet al., 1993). Fibers shrink in proportion to the amount of cellulose presentin the cell wall. The perimeter of less mature fibers (thinner cell wall) islarger than that of a more mature (thicker cell wall) fiber. The thinner cellwall is found nearer the fiber tip than the rest of the fiber. Fiber finenessdirectly determines yarn fineness. Although as few as 30 fibers can be spuninto yarns in ring spinning, approximately 100 fibers in the yarn cross-section are usually the lower limit. Therefore, reduction in fiber fineness isthe only way to achieve fine yarns within the limit of spinning processes.
Fiber maturity is a growth characteristic. The definition of fiber maturityis the proportion of cotton cell wall thickness compared to the maximumwall thickness when growth is completed. Therefore, maturity represents thedevelopment of the secondary cell wall and the maturity level can becomplicated by both developmental and environmental factors.
1.3.4 Twist and convolution
The formation of twists or convolution occurs when the fully hydratedcylindrical fibers collapse from the loss of fluids and drying upon maturationand boll opening or as previously shown during light microscopy observation(Fig. 1.2). On developing SJ-2 fibers, typical twists were observed on 28-dpa fibers whereas 21 dpa fibers tend to roll and fold onto themselves (Fig.1.5). The lateral dimensions of convoluted fibers are characterized by theirribbon or ‘fiber width’ (widest portion) and ‘twist thickness’ (thinnest portion).The fiber widths decrease from drying (Fig. 1.7(a)). The twist thicknessesincrease with fiber development, from approximately 6.5 mm at 21 dpa to10.5 mm at 40 dpa and maturity (Fig. 1.7(b)). The twist frequency or thelengths between twists have been found to be highly irregular along anindividual fiber as well as among fibers. The lengths between twists havebeen grouped into ‘short’ and ‘long’. At 21 dpa, the average short and longlengths between twists are 110 mm and 240 mm, respectively. As fibersdeveloped, long lengths reduce by nearly one-half to 130 mm. Short twistlengths, on the other hand, show only a slight decrease with fiber developmentto about 90 mm. Upon drying, fiber widths between the long twists arereduced slightly but not significantly than those of the hydrated fibers. Fiberwidths between the long twists are slightly higher than those between theshort twists, but these differences diminish with fiber development.
The twist thicknesses increase slightly between 20 and 36 dpa and thenbecome level, but the twist thicknesses remain similar between the long andshort twists. Using the average W and L values, the convolution angle (q) ofthe twist is calculated as q = tan–1 (2W/L). A distinct increasing trend withdevelopment to about 40 dpa has been observed on the convolution angles ofthe long twists whereas only a slight increase is observed on the short twists

Cotton: Science and technology16
during the same period (Fig. 1.8a). This trend is expected from the fiberwidth and twist length data. The lengths between twists lowered with increasingconvolution angles (Fig. 1.8(b)). The insignificant changes in convolutionangles after 36 dpa indicate insignificant changes in both the twist lengthand width, coinciding with the little change in the linear density or cell wallmass. These findings show that twist characteristics are closely associatedwith secondary cell wall thickness and thus are excellent indicators of fibermaturity within a given variety of cotton.
As the spiral reversals occur less frequently (1 to 3 times per mm asreported by Rebenfeld, 1977) than the convolution (3.9 to 6.5 twists per mmby Warwicker et al., 1966), the lateral alignment of the fibrillar reversals inthe concentric cellulose layers and the ultimate twists in the dried fibersappear to be related. Twists are formed from cell collapsing and the numbersof twists increase with fiber maturity or with increasing secondary cell wall
0 10 20 30 40 50 60 70dpa
(a)
35
30
25
20
15
10
5
0
Fib
er
wid
th,
mic
rom
ete
rs
0 10 20 30 40 50 60 70dpa
(b)
20
18
16
14
12
10
8
6
4
2
0
Th
ickn
ess,
mic
rom
ete
rs
1.7 Fiber dimensions at varying developmental stages of G. hirsutum(SJ-2), (a) Fiber width: � hydrated, y = 24.0 – 0.034x, r = 0.16;� dried short twists, y = 18.1 – 0.03x, r = 0.41. (b) Twist thickness:� long twists, y = 5.0 + 0.10x, r = 0.77, � short twists, y = 5.1 – 0.10x,r = 0.78.

Chemical structure and properties of cotton 17
thickness. Upon drying, lateral dimensions of the fibers reduce. The spiralreversals of the cellulose fibrils are where buckling most likely occurs ineach layer. As secondary cell wall thickens, the probability of the reversalsin the concentric layers overlapping at a given point across the fiber increases,leading to twists. It appears that when a threshold level of overlapped reversalsis reached, stress from buckling leads to twist formation. Whether the twistor the span between two twists is where the reversals overlapped is unclear.How the reversals in the concentric layers related to the varying packingdensity or accessible regions in the fiber cross-section is also an importantquestion.
1.4 Fiber strength
1.4.1 Single fiber strength
The strength of cotton fibers is attributed to the rigidity of the cellulosicchains, the highly fibrillar and crystalline structure, and the extensive
0 10 20 30 40 50 60 70dpa(a)
30
25
20
15
10
5
0
An
gle
, d
eg
ree
s
0 5 10 15 20 25 30Convolution angle, degree
(b)
300
250
200
150
100
50
0
Le
ng
th b
etw
ee
n t
wis
ts,
mic
rom
ete
rs
1.8 Convolution or twist characteristics of developing G. hirsutum(SJ-2) fibers (� long, � short): (a) angles; (b) relationship betweenlengths and angles.

Cotton: Science and technology18
intermolecular and intramolecular hydrogen-bonding. Varietal link to fiberstrength has been well documented by bundle strength, such as that generatedby the Stelometer and the high volume instrument (HVI) in recent years.Much less is known about the strength of developing cotton fibers. Kulshreshthaet al. (1973a) have shown that the Stelometer bundle strength increasesgradually with fiber growth between 30 and 70 dpa. The youngest age, inthat case, is about two weeks into, or about half way through, the secondarycell wall development. However, bundle strength has been shown not to besensitive to strength variability.
How fiber strength is developed during growth and is related with geno-typical traits has been confirmed by single fiber tensile measurements. Themajor challenges in single fiber measurements are the selection and thequantity of fibers to represent each specific population. Single fiber tensilemeasurements using a standard tensile tester and fiber sampling protocolswere evaluated in an exploratory study (Hsieh, 1994) and subsequent extensivedata collection (Hsieh et al., 1995).
Tensile measurements of both hydrated (as early as 15 dpa) and driedfibers were made using either an Instron tensile tester (1122 TM) equippedwith standard pneumatic and rubber-faced grips or a Mantis single fibertester. A 3.2 mm-gauge length was used with both methods. A 50-mm/minstrain rate was employed on the Instron whereas the strain rate on the Mantiswas 60 mm/min. All measurements were performed at a constant temperatureof 70 ∞F and a 65% relative humidity. The much higher rate of measurementon the Mantis instrument has enabled collections of much larger number ofsingle fiber strength data (Hsieh et al., 1995, 1997; Hsieh 1999; Hsieh andWang 2000; Hu and Hsieh, 1996, 1997a, 1998; Liu et al., 2001, 2005). As aMantis single fiber tensile instrument is not readily available but is employedin most work cited in the following sections, it is worth mentioning thedifference from the Instron measurements. The breaking forces measured bythe Mantis instrument appear to be slightly higher than those by the Instronwhereas the opposite is observed with the breaking elongation values (Hsiehet al., 1997). On the Mantis, fibers are positioned manually. The instrumentautomatically straightens, clamps down, and exerts a preload on individualfibers. Single fiber measurements conducted on the Instron tensile instrumentrequired extensive handling to prepare each fiber in a paper holder (Hsieh et
al., 1995). The extra fiber handling on the Instron is believed to be the causeof the lower strength. The absence of preload when preparing fibers formeasurement using the Instron explains the higher breaking elongation values.
A standardized fiber selection and sampling approach for developing cottonhas been established. It starts with tagging the flowers on the day of flowering(anthesis). Green bolls aged 14 days post anthesis (dpa) to 50 dpa and openedbolls can be sampled from first-position (closest to the main stem) betweenthe fourth and the twelfth fruiting branches. Sources of fiber development

Chemical structure and properties of cotton 19
variations can be minimized by using the fibers from the medial section ofthe ovules and the middle ovules from each boll. Furthermore, the middlesections of fibers are measured as they are stronger than the fiber sectionscloser to the basal or the tip ends at all stages of fiber development. Theverification of this approach is briefly summarized in the following section.
The forces required to break hydrated and dried single Maxxa fibersincrease with fiber development (Fig. 1.9(a)), with hydrated fibers beingstronger. The breaking elongation values are higher for the dried fibers,leading to similar work to break between the hydrated and dried fibers. Thebreaking forces of the dried fibers appear to increase at a higher rate between20 and 30 dpa than in the later stages. The decreasing forces and increasingstrain at break from the hydrated state to the dry state may be explained bythe increased convolution angles resulting from cell collapsing and dehydration.The effects between branches from branch four to twelve on single fiberstrength are negligible (Fig. 1.9(b)).
0 10 20 30 40 50 60 70dpa
(a)
8
7
6
5
4
3
2
1
0
Bre
akin
g f
orc
e,
g
0 10 20 30 40 50 60 70dpa
(b)
8
7
6
5
4
3
2
1
0
Bre
akin
g f
orc
e,
g
1.9 Single fiber breaking forces of developing G. hirsutum (SJ-2)cotton: (a) � hydrated, � dried; (b) � random first-boll positionfrom 6 plants, � first-boll position from single plant.
Cotton: Science and technology20
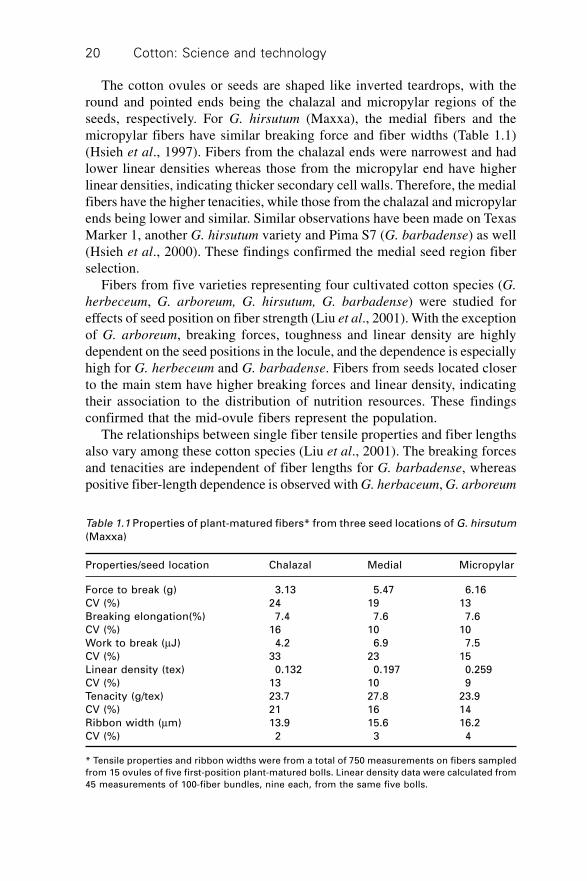
The cotton ovules or seeds are shaped like inverted teardrops, with theround and pointed ends being the chalazal and micropylar regions of theseeds, respectively. For G. hirsutum (Maxxa), the medial fibers and themicropylar fibers have similar breaking force and fiber widths (Table 1.1)(Hsieh et al., 1997). Fibers from the chalazal ends were narrowest and hadlower linear densities whereas those from the micropylar end have higherlinear densities, indicating thicker secondary cell walls. Therefore, the medialfibers have the higher tenacities, while those from the chalazal and micropylarends being lower and similar. Similar observations have been made on TexasMarker 1, another G. hirsutum variety and Pima S7 (G. barbadense) as well(Hsieh et al., 2000). These findings confirmed the medial seed region fiberselection.
Fibers from five varieties representing four cultivated cotton species (G.
herbeceum, G. arboreum, G. hirsutum, G. barbadense) were studied foreffects of seed position on fiber strength (Liu et al., 2001). With the exceptionof G. arboreum, breaking forces, toughness and linear density are highlydependent on the seed positions in the locule, and the dependence is especiallyhigh for G. herbeceum and G. barbadense. Fibers from seeds located closerto the main stem have higher breaking forces and linear density, indicatingtheir association to the distribution of nutrition resources. These findingsconfirmed that the mid-ovule fibers represent the population.
The relationships between single fiber tensile properties and fiber lengthsalso vary among these cotton species (Liu et al., 2001). The breaking forcesand tenacities are independent of fiber lengths for G. barbadense, whereaspositive fiber-length dependence is observed with G. herbaceum, G. arboreum
Table 1.1 Properties of plant-matured fibers* from three seed locations of G. hirsutum
(Maxxa)
Properties/seed location Chalazal Medial Micropylar
Force to break (g) 3.13 5.47 6.16
CV (%) 24 19 13
Breaking elongation(%) 7.4 7.6 7.6
CV (%) 16 10 10
Work to break (mJ) 4.2 6.9 7.5
CV (%) 33 23 15
Linear density (tex) 0.132 0.197 0.259
CV (%) 13 10 9
Tenacity (g/tex) 23.7 27.8 23.9
CV (%) 21 16 14
Ribbon width (mm) 13.9 15.6 16.2
CV (%) 2 3 4
* Tensile properties and ribbon widths were from a total of 750 measurements on fibers sampled
from 15 ovules of five first-position plant-matured bolls. Linear density data were calculated from
45 measurements of 100-fiber bundles, nine each, from the same five bolls.

Chemical structure and properties of cotton 21
and a negative trend is found with the Maxxa variety of G. hirsutum. For G.
herbaceum, G. arboreum, longer fibers have higher breaking forces whereasthe opposite is found in Maxxa. The single fiber breaking elongation decreaseswith increasing fiber lengths for all except for G. barbadense. Overall variationsof single fiber tensile properties are associated more strongly with the seedpositions in the locule than with the fiber lengths. Among these five cultivars,the single fiber strength of Pima S7 is highest, with G. hirsutum varietiesbeing second, G. herbaceum the third and G. arboreum the lowest (Table1.2). The cell wall mass as indicated by the linear density (LD) follows thesame order, except that G. herbaceum is the highest due mostly to its highfiber widths.
The distributions of breaking forces and elongation of single fibers fromthese five cultivated cotton varieties show significantly different range anddistribution patterns and appear to be highly dependent on genotypes (Liuet al., 2005). Within each cultivar, fibers of varying lengths have similardistributions in their breaking forces and elongation. This lack of relationshipwith fiber length suggests that these fiber tensile properties may be independentof length development, i.e., during elongation of primary cell wall throughthe early state of secondary cell wall synthesis. Single fiber breaking forceand elongation were positively correlated (r = 0.259 to 0.443) for all fivevarieties, with Pima having the highest correlation coefficient.
The mass of seed fibers (fiber and seed) and fibers as in linear densityhave both shown to be reliable indicators for the stage of fiber development.The seed fiber weights increase linearly with fiber development. Withdeveloping fibers, the strength and seed fiber weight relationship is similarto that of the strength-dpa relationship. Therefore, it is quite conceivable thatfiber strength may be projected from seed fiber weight throughout the secondarycell wall synthesis stage when such strength-seed fiber weight correlationshave been established. The linear densities of the developing fibers alsoincrease with fiber development, most significantly during the first 10–14days of secondary cell wall synthesis. The linear density to age relationshipvaries with the varieties, indicating the rate of cellulose synthesis and howsingle fibers gain strength during the early part of secondary cell develop tobe variety dependent.
Generally, the forces to break single fibers increased significantly duringthe fourth week of fiber development. Beyond 30 dpa, neither linear densitiesnor single fiber tenacities showed any changes. Data on G. hirsutum varietieshave shown that fibers at about 21–24 dpa exhibit significant strength. Thisis at the onset of the secondary wall formation where fiber elongation isnearly completed. Using estimated linear densities for SJ-2 fibers at 14 to 16dpa, the breaking tenacities of dried fibers are estimated to be 21.5 and 31.3g/tex, respectively (Hsieh et al., 1995). The primary cell wall appears tocontribute toward two-thirds or more of the fiber strength. These fiber strength

Co
tton
: Scie
nce
an
d te
ch
no
log
y2
2
Table 1.2 Tenacity (gf/tex) and linear density (mtex) of fibers from middle seeds in locule*
G. herbaceum G. arboreum G. hirsutum G. barbadense
African-51 Asian-163 Maxxa TM-1 Pima S7
tenacity LD tenacity LD tenacity LD tenacity LD tenacity LD
Mean 44.6 213 37.3 274 41.2 180 39.1 185 55.9 150
CV (%) 7.3 11.9 5.7 3.2 2.8 5.7 3.1 4.0 6.2 7.4
r 0.77 0.99† –0.70 0.82 0.64 0.96† 0.43 0.89† 0.80 0.95†
* Twenty first-position plant-mature bolls from ten plants of each variety were harvested five to seven days after boll opening. Three bolls with weights closest
to the average boll weight (BW) of the 20 collected were used.
† Denotes different correlation coefficients of the linear regression between fiber tensile properties and seed positions in locule at a 5% significance level.

Chemical structure and properties of cotton 23
estimations are consistent with the report on 14 dpa G. hirsutum Delta Pine61 fibers whose breaking tenacity was slightly more than half of the fibersthat were 49 dpa (Hebert, 1993). Both the breaking forces and fiber mass orlinear densities continue to increase throughout the first 36–40 days of fiberdevelopment. Therefore, the secondary wall thickening continues tocontribute to the single fiber breaking force. However, the breaking tenacitiesof single fibers appear to reach the maximal level when the fibers are about21 to 24 dpa.
1.4.2 Crystalline structure of cellulose
The fine structure of cotton cellulose has been most widely investigated bywide-angle X-ray diffraction, a well-developed and powerful tool for discerningstructural organization of polymer solids. The structural studies of cottoncellulose have been extensively reported, mainly on field grown maturedcotton and those treated in urea and sodium hydroxide (Khalifa et al., 1991).The formation of primary and secondary cell walls in cotton fibers is distinctand of relatively long duration, allowing studies of crystalline structure atspecific stages of fiber development. The crystalline structure of developingG. hirsutum cotton fibers (Hu and Hsieh, 1996, 1997a; Hsieh et al., 1997)has been detailed using wide-angle X-ray diffraction and a multi-peak resolutionmethod previously developed (Hindeleh et al., 1980). In this method, thetotal scatter was resolved into peaks over a non-crystalline scatter background,where crystallinity is the ratio of the summation of all resolved peaks to thetotal scatter as detailed in our previous paper (Hu and Hsieh, 1996). Crystallitedimensions normal to the hkl planes were calculated following peak broadeningcorrections caused by structural broadening (db) and instrumental broadening.The apparent crystallite sizes of the 101, 101 and 002 reflection planes wasbased on the Sherrer equation.
A typically resolved X-ray diffraction spectrum of 60-dap Maxxa cottonfibers is illustrated in Fig. 1.10. The multiple peak resolution method yieldsseven peaks from the WAXD spectrum collected between 5∞ and 40∞. Thefour peaks located near 2q angles of 14.7∞, 16.6∞, 22.7∞ and 34.4∞ arecharacteristic of the 101, 101 , 002 and 040 reflections of cellulose I,respectively, and are used for structural analysis and comparison.
The cellulose I crystalline structure is clearly evident near the onset ofsecondary cell wall formation, or 21 dpa (Fig. 1.11). The cellulose I crystallinestructure has been confirmed on dried SJ-2 and Maxxa cotton fibers at varyingdevelopmental stages and remains unchanged during secondary cell wallbiosynthesis and at maturity (Hsieh et al., 1997). The degree of crystallinitydoubled from the beginning to the end of the secondary cell wall formation,i.e., from about 30% at 21 dpa to 60% at 60 dpa. The most significantincrease in crystallinity, i.e., from 30% to 55%, is observed between 21 and

Cotton: Science and technology24
5 10 15 20 25 30 35 40Two theta (deg)
60
40
20
0
Inte
nsit
y(002)
(004)Ppara
(021)(101)
(110)
(101 )
1.10 Typical wide-angle X-ray diffraction pattern of matured cotton fibers.
5 10 15 20 25 30 35 40Two theta (deg)
150
100
50
0
Inte
nsit
y
60 dpa
48 dpa
35 dpa
28 dpa
24 dpa
1.11 Crystallite dimensions of developing G. hirsutum (Maxxa)cotton fibers.

Chemical structure and properties of cotton 25
34 dpa. The extensive data on several Acala varieties grown under well-controlled green-house conditions show that significant crystallinity is attainedduring the first half of the secondary cell wall development. One early reportalso showed increased crystallinity with fiber development of a field-grownIndian cotton variety (Kulshreshtha et al., 1973b). The stage studied was inthe later stages of secondary cell wall development (35 to 65 dpa).
Both G. barbedense and G. hirsutum series of developing cotton fibersshow increased overall crystallinity and apparent crystallite sizes withfiber development (Table 1.3) (Hsieh et al., 2000). The most significantincreases in L101, L101 , and crystallinity occur between 20 dpa and 35 dpa,corresponding to the first two weeks of cellulose synthesis or the fourth andfifth weeks of overall fiber development. Fiber development beyond fiveweeks does not contribute to any change in crystallite dimensions norcyrstallinity. This is consistent with the leveling of tenacities at the laterstage of fiber development. These are consistent with others’ findings thatthe lateral apparent crystallite sizes and their orientation increase during thecellulose biosynthesis (Nelson and Mares, 1965).
Structural studies of native celluloses have also included the use of high-resolution CP/MAS 13C NMR (Atalla and VanderHart, 1984; VanderHartand Atalla, 1984, 1987). Native celluloses have been classified into twofamilies: that of algal-bacterial cellulose, where the cellulose is rich in the Ia
phase, and that of cotton-ramie-wood cellulose, where the Ib phase is dominant.Infra-red spectroscopy is another solid-state technique that can be used todistinguish the structures of these two families of celluloses (Michell, 1990).The Fourier transfer infra-red spectroscopy (FTIR), another structuralcharacterization tool, was employed to elucidate the crystalline structure ofa series of highly crystalline celluloses (Sugiyama et al., 1991). The absorption
Table 1.3 Crystallite size (L, angstrom) and crystallinity (X, %) of developing G. hirsutum
(Texas Marker 1) and G. barbedense (Pima S7) cotton fibers*
20 dpa 28 dpa 35 dpa 42 dpa Mature
G. hirsutum (Texas Marker 1)
L101 22.2 27.2 37.8 40.1 37.7
L
101 22.3 27.1 36.0 39.5 37.5
L002 41.3 41.2 41.9 44.4 43.6
X 23 37 52 54 46
G. barbedense (Pima S7)
L101 26.9 35.2 43.6 43.9 45.7
L
101 22.1 30.9 34.8 34.6 35.7
L002 37.7 40.7 41.4 41.2 42.3
X 23 48 55 56 60
* Fibers for each stage of development were sampled from five first-position bolls randomly
sampled from nine plants.

Cotton: Science and technology26
bands at 3240 and 750 cm–1 corresponding to the Ia phase and those near3270 cm–1 and 710 cm–1 corresponding to the Ib phase were reported.
The FTIR spectra of developing cotton fibers exhibit absorption bands at764 cm–1 and 722 cm–1, characteristic of Ia and Ib phases of the cellulosecrystalline structure, respectively (Fig. 1.12) (Hu and Hsieh, 1997b). The764 cm–1 band intensity was highest in the 3-dpa fibers, indicating rich Ia
phase in fibers at the beginning of elongation. While the 764 cm–1 peak
1.12 FTIR of developing G. hirsutum (Maxxa) cotton fibers.
722
764
Matured
30 dpa
20 dpa
15 dpa
10 dpa
7 dpa
5 dpa
3 dpa
1000 900 800 700 600 500Wave numbers (cm–1)
115
110
105
100
95
90
85
80
75
70
65
60
55
50
45
40
35
30
25
20
% T
ran
sm
itta
nce

Chemical structure and properties of cotton 27
intensities decreased rapidly from 3 dpa to 10 dpa, the 722 cm–1 band, alsoobserved in the spectrum of 3-dpa fibers, increased markedly. Only a traceof the 764 cm–1 band was observed in the spectrum of 15-dpa fibers. TheFTIR spectra clearly showed that the Ia and Ib phases coexist at the beginningof fiber elongation. The Ib phase increases markedly from 3 dpa to 10 dpaand becomes predominant at the onset of the secondary wall synthesis, i.e.,15 dpa, the onset of secondary cell wall synthesis. These results indicate thatthe crystalline components in developing cotton fibers change from thecoexistence of the Ia and Ib phases at 3 dpa to a predominantly Ib phase at 15dpa.
The interesting questions brought by the FTIR results of developing fibersare the origin in the biphasic character and their conversion of cotton fibers.The Ia phase was previously thought to be from the built-in strains duringcellulose biosynthesis whereas the Ib phase was from crystallization in anentirely strain-free environment. The strong relationship between Ib/Ia ratioand fiber elongation by our FTIR suggest that such a relationship may berelated to the changes in turgor pressure during fiber elongation. Otherfactors, such as interactions among cellulose chains, the arrangement of Tcs(cellulose-synthesizing terminal enzyme complexes), and the affinity of otherpolysaccharides for cellulose, may also affect the biphasic character andtheir conversion, but their effects are not clearly understood at this point.
The IR spectra of 20-dpa, 30-dpa, and matured samples only showed theband at 722 cm–1, while the band at 764 cm–1 disappeared, indicating theabsence of the Ia phase during the secondary cell wall synthesis and in thematured cotton fibers. This is consistent with the common knowledge ofcellulose structure from higher plants. The Ib phase becomes more dominantwith increasing cellulose biosynthesis in the primary cell wall. Only the Ib
phase was found in the secondary wall and matured cotton fibers. The questionthat remains to be answered is whether the formation of the Ia phase hasstopped or the triclinic Ia phase is metastable and is later converted to thestable monoclinic Ib phase during the secondary cell wall synthesis.
The evidence is clear that cotton fibers exhibit only cellulose I crystallinestructure during the entire fiber biosynthesis. Contrary to few reports, neitherX-ray, solid-state NMR nor FTIR provides any evidence of other cellulosestructure, i.e., II, III or IV. The primary cell walls of cotton fibers containcrystalline cellulose whose degree of crystallinity is lower than that of thesecondary cell wall (Hsieh et al., 1997). In contrast to solid-state NMRspectroscopy and X-ray diffraction, infra-red spectroscopic methods requiremuch smaller quantities of materials, a particular advantage for studyingcotton fibers at early stages of development where fiber mass is very limited.The studies of the Ia and Ib phases in the primary and secondary walls andtheir polymorph changes during cell wall synthesis help to discern the invivo mechanism for cellulose biosynthesis and crystallization.
Cotton: Science and technology28
1.4.3 Strength and crystalline structure relationship
Positive relationships between bundle strength by the Stelometer andcrystallinity (53% to 69%) have been reported on matured fibers from eightEgyptian cottons (Hindeleh, 1980). However, the relationships between strengthand crystallinity may not be easily compared among studies. One reason isthat the extents of crystallinity of matured cottons range from 50% to nearly100% depending on the measurement techniques. The differences resultingfrom the methods of crystallinity determination are further complicated bythe inevitable variations among cotton fibers due to a combination of varietaland environmental factors.
One intriguing question about the development of strength in cotton fibersis the structural contributing factors. Although positive relationship betweenthe Stelometer bundle tenacities and crystallinity has been shown (Hindeleh,1980), information on strength-crystallinity relationship on developing fibersis limited. Our work has shown positive relationships between single fiberbreaking forces and overall crystallinity among developing fibers from theSJ-2 and Maxxa varieties (Hsieh et al., 1997). With increasing crystallinityfrom 30% to 58%, the forces to break Maxxa fibers increase more than thosefor the SJ-2 fibers. In other words, single fiber breaking forces are higher forMaxxa fibers than SJ-2 fibers when compared at the same crystallinity.Crystallinity of the Maxxa fibers is lower than SJ-2 with the same amount ofcellulose. The positive relationship between single fiber breaking force andcrystallinity may be variety dependent.
In general, the overall crystallinity, apparent crystallite sizes, and singlefiber breaking forces of fibers increase with fiber development (Hsieh et al.,1997). The patterns by which these crystalline structure parameters andproperties vary with age are different between these two varieties. The breakingforces of the developing Maxxa fibers increase more with crystallinity (between30 and 50%) than those of the SJ-2 counterparts. The increasing patterns incrystallite dimensions were different between the two varieties, resulting indifferent breaking force-crystallite dimension relationships. The most significantdifferences between SJ-2 and Maxxa are in their breaking relationships withthe 101- and 002 crystallite dimensions. Therefore, the dependency of singlefiber breaking force on crystallite sizes is obviously different for these twovarieties.
Although the overall crystallinity and apparent crystallite sizes increasewith fiber development, the unit cell sizes decrease slightly and thus thecrystal densities increase with fiber development. Among the crystal latticeplanes, the alignment of the glucosidic rings in respect to the 002 planesimproves most significantly with fiber cell development. The crystallinityand crystal density of SJ-2 fibers are higher than those of Maxxa fibersduring the fifth and sixth weeks of fiber development. The 002 and 101

Chemical structure and properties of cotton 29
crystallite dimensions of Maxxa fibers, on the other hand, are larger thanthose of the SJ-2 fibers. These increases coincide with the largest increase inforces to break single fibers.
Within each variety, positive relationships are observed between singlefiber breaking forces and the overall crystallinity as well as between singlefiber breaking force and crystallite size. However, the relationships betweentenacities and crystallinity are different between these two varieties. Thesingle fiber breaking tenacities of the SJ-2 cotton fibers do not appear to varyfrom 21 dpa to maturity. For the Maxxa cotton fibers, however, breakingtenacities appear to be positively related to fiber development or thickeningof the secondary cell wall. Additionally, negatively relationships have beenobserved between breaking tenacities and crystal densities for both varieties.The increased crystallinity and crystallite sizes and perfection offer onlypartial explanation to the strength development of cotton fibers. Althoughsome preliminary observation regarding the tenacity-age relationships andvarietal differences in tenacity-structure relationship of developing fibershave been made, additional data collection and analysis are necessary tofully establish these relationships. Furthermore, structural parameters suchas fibril orientation and residual stress may play key roles in cotton fiberstrength and should be considered in future work.
1.5 Conclusion
Cotton fibers are nature’s purest form of cellulose, composing about 90% ofa-cellulose. The non-cellulosics are located on the outer layers or inside thelumens of the fibers whereas the secondary cell wall is purely cellulose.Both the structure and compositions of the cellulose and noncellulosics dependon the variety and the growing conditions. The cellulose fibrils spiral in theconcentric cell wall layers at decreasing angle toward the center of the fiber.The spirals reverse along the fiber length and cause the cylindrical cells tocollapse into the twisted ribbon fibers upon drying.
Cotton cellulose consists of b-1,4-D(+)-glucopyranose that repeats thousandsof times. The very long chain that is limited in rotational freedom about theanhydrogluco-pyranose C-O-C link leads to a rigid and highly crystallinestructure. The abundant hydroxyl groups, one C-6 primary and two C-2 andC-3 secondary on each anhydroglucose unit, allow extensive inter-molecularand intra-molecular hydrogen bonding to further enhance the cellulose structurefor strength. These hydroxyl groups are also critical chemical characteristicsof cotton fibers as they bond water and are responsible for the chemicalreactivity such as in chemical modification, dyeing and finishing.
All three main fiber quality parameters, i.e., length, fineness and strength,have been linked to genotypes as well as growing conditions. The length andfineness of fibers are determined in the early stages of cell growth and

Cotton: Science and technology30
development. Fiber length is determined during the elongation stage, i.e.,during the first 20 to 25 days past anthesis (dpa). The final thickness of fibercells is developed at the base of the fibers by about 2 dpa. How cotton fibersgain strength has much to do with both primary wall formation (elongation)and secondary wall thickening (cellulose synthesis) as well as during desiccation(transition from mobile to highly hydrogen-bonded structure).
Ultimate fiber tensile properties were reached in the 30 dpa fibers andfurther fiber development contributed to thicker cell wall, thus fiber mass orlint turnout, but not the intrinsic fiber strength. For G. hirsutum varieties, thesingle fiber breaking forces increase most significantly during the fourthweek of fiber development. The forces required to break single fibers aresimilar among varieties through the end of the fourth week of cell development.Beyond 30 dpa, both the single fiber breaking forces and tenacities differentiateamong cultivars due partly to the differences in their linear densities andseed fiber weights at the same developmental stages. The cellulose I crystallinestructure is clearly evident at 21 dpa and remains unchanged throughoutfiber development. The overall crystallinity and the apparent crystallite sizesincrease with fiber development for all varieties. Within each variety, thesingle fiber breaking forces are positively related to both the overall crystallinityand crystallite sizes. At the same developmental stages, Maxxa fibers havelarger crystal sizes but lower crystallinity and lower crystal density than theSJ-2 fibers.
Although positive relationships between single fiber breaking forces andthe overall crystallinity as well as between single fiber breaking force andcrystallite size have been observed in both G. hirsutum and G. barbedense
varieties, the relationships between tenacities and crystalline structureparameters are different between these two varieties. The tenacity-agerelationships and varietal differences in tenacity-structure relationships remainto be further clarified. Additionally, experimentally determined fiber strengthsare far from those predicted theoretically. Better understanding of the structuralfactors for cotton fiber strength will help to explain these discrepancies, andto improve strength.
1.6 Acknowledgements
Special appreciation is extended to Dr X.-P. Hu, Dr M.M. Hartzell, ProfessorsJ. Liu, A. Wang, H. Yang, E. Honik, P.T. Dong, V. Ngyen and A. Ngyen, fortheir contributions and assistance in research. Support from Cotton Incorporated(#93-069) is greatly appreciated.
1.7 References and further reading
Atalla, R. H. and VanderHart, D. L. (1984). Native cellulose: a composite of two distinctivecrystalline forms, Science, 223, 283–285.

Chemical structure and properties of cotton 31
Balls, W. L. (1928). Studies of Quality in Cotton, Macmillan, London.Basra, A. S. and Malik, C. P. (1984). Development of the Cotton Fiber, Int. Rev. Cytol.,
89, 65–113.Beasley, C. A. (1977). Ovule culture: fundamental and pragmatic research for the cotton
industry, in Plant Cell, Tissue and Organ Culture, J. R. Reinert and J. P. S. Bai, eds,160.
Benedict, D. R., Kohel, R. J. and Jividen, G. M. (1994). Crystalline cellulose and cottonfiber strength, Crop Science, 34(1), 147–151.
Berlin, J. D. (1986). The outer epidermis of the cottonseed, in Mauney, J. R. and J. McD.Stewart, eds, Cotton Physiology, pages 375–415, The Cotton Foundation.
Bikales, N. M. and Segal, L. Eds, (1971). High Polymers, Vol. V, Part V, Cellulose and
Cellulose Derivatives, Wiley Interscience, New York, NY.Boylston, E. K., Thibodeaux, D. P. and Evans, J. P. (1993). Applying microscopy to the
development of a reference method for cotton fiber maturity, Textile Res. J., 63(2),80–87.
Cassman, K. G., Kerby, T. A., Roberts, B. A., Bryuant, D. C. and Higashi, S. L. (1990).Potassium nutrition effects on lint yield and fiber quality of Acala cotton, Crop Sci.,30, 672–677.
Darvill, A., McNeil, M., Albersheim, P. and Delmer, D. P. The Biochemistry of Plants,
Vol. 1, Academic Press, New York, 1980, pp. 91–161.Davidonis, G. and Hinojosa, O. (1994). Influence of seed location on cotton fiber
development in planta and in vitro, Plant Science, 203, 107–113.deGruy, I. V., Carra, J. H. and Goynes, W. R. (1973). Fine Structure of Cotton, An Atlas
of Cotton Microscopy, in Fiber Science Series V.6, ed. R. T. O’Conner, Dekker, NewYork.
Elias, H. G. Macromolecules: Part 2: Synthesis and materials, Plenum Press, New York,1977, chap. 31, p. 1081.
Figini, M. (1982). Cellulose and other natural polymer systems, Biogenesis, structure
and degradation, 243–271, Plenum Press, New York.Freytag, R. and Donze, J.-J. (1983). Alkali Treatment of Cellulose Fibers, in Handbook
of Fiber Science and Technology: Volume 1, Chemical Processing of Fibers and
Fabrics, Fundamentals and Preparation, Part A Marcel Dekker, NY, pp. 94–120.Fryxell, P. A. (1963). Morphology of the base of seed hairs of Gossypium I. gross
morphology, Bot. Gas., 124, 196–199.Gibson, J. R. (1986). Temperature effects on growth, development, and fiber properties,
in Cotton Physiology, J. R. Mauney and J. M. Steward, eds, The Cotton Foundation,Memphis, TN, pp. 47–56.
Goldwaith, F. G. and Guthrie, J. D. (1954). Matthew’s Textile Fibers, H. R. Mauersberger,ed., Wiley Interscience, New York.
Goring, D. A. I. and Timell, T. E. (1962). Molecular weight of native cellulose, TAPPI,45, 454–460.
Goynes, W. R., Ingber, B. F. and Triplett, B. A. (1995). Cotton fiber secondary walldevelopment – time versus thickness, Textile Res. J., 65(7), 400–408.
Graves, D. A. and Stewart, J. M. (1988), Chronology of the differentiation of cotton(Gossypium hirsutum L.) fiber cells, Planta, 175, 254–258.
Green, C. C. and Culp, T. W. (1990). Simultaneous improvement of yield, fiber quality,and yarn strength in Upland cotton, Crop Sci., 30, 66–69.
Haigler, C. H., Rao, N. R., Roberts, E. M., Huang, J., Upchurch, D. R. and Trolinder,N. L. (1991). Cultured ovules as models for cotton fibers developed under lowtemperatures, Plant Physiol. 95(1), 88–91.
Cotton: Science and technology32
Harig, H. (1992). Possibilities and problems in the further development of cotton as a rawmaterial, ITS Textile Leader, 10, 71.
Hartzell-Lawson, M. M. and Hsieh, Y.-L. Characteristics of noncellulosics in developingcotton fibers, Textile Research Journal 70(9): 810–819 (2000).
Hebert, J. J. (1993). Strength of the primary wall of cotton fibers, Textile Res. J. 63(11),695.
Hebert, J. J., Boylston, E. K. and Thibodeaux, D. P. (1987). Orientation Measurements inDeveloping Cotton Fibers, Text. Res. J., 57(12), 742–743.
Heredia, A., Guillen, R., Jimenez, A. and Fernandez-Bolanos, J. Review: Plant Cell WallStructure. Revista Espanola de Ciencia y Technologia de Alimentos, 33, 113–131(1993).
Hermans, P. H. and Weidinger, A. (1949). X-Ray Studies on the Crystallinity of Cellulose,J. Polym. Sci., 4, 135–144.
Hermans, P. H. and Weidinger, A. (1950). Quantitative Investigation of X-Ray Diffractionby ‘amorphous’ Polymers and Some Other Noncrystalline Substances, J. Polym. Sci.,5, 269–281.
Hessler, L. E., Merola, G. V. and Berkley, E. E. (1948). Degree of polymerization ofcellulose in cotton fibers, Textile. Res. J., 18, 628–634.
Hindeleh, A. M. (1980). Crystallinity, crystallite size, and physical properties of nativeEgyptian cotton, Textile Res. J., 50(11), 667–674.
Hindeleh, A. M., Johnson, D. J. and Montague, P. E. (1980). Computational Methods forProfile Resolution and Crystallite Size Evaluation in Fibrous Polymers, in Fiber
Diffraction Methods (eds, A. D. French and K. H. Gardner), ACS Symposium, No.
141, 149–182.Hornuff, G. V. and Richter, H. (1964). Chemical Composition of Cotton Fibers Originating
From Various Areas, Faserforsch. Textiltechn., 15, 115–126.Hsieh, Y.-L. (1994). Single fiber strength: greenhouse grown SJ-2 Acala cotton. Biochemistry
of Cotton 109–114.Hsieh, Y.-L. (1999). Structural development of cotton fibers and linkages to fiber quality,
Cotton Fibers, ed. A. S. Basra, Food Products Press, New York, 137–165.Hsieh, Y.-L. and Wang, A. (2000). Single fiber strength variations of developing cotton
fibers – among ovule locations and along fiber length, Textile Research Journal 70(6):495–501.
Hsieh, Y.-L, Honic, E. and Hartzell, M. M. (1995). A developmental study of single fiberstrength: greenhouse grown SJ-2 Acala cotton, Textile Research Journal, 65(2): 101–112.
Hsieh, Y.-L., Hu, X. P. and Nguyen, A. (1997). Strength and crystalline structure ofdeveloping Acala cotton, Textile Research Journal 67(7): 529–536.
Hsieh, Y.-L., Hu, X.-P. and Wang, A. (2000). Single fiber strength variations of developingCotton gibers – strength and structure of G. hirsutum and G. barbedense, Textile
Research Journal 70(8): 682–690.Hu, X. P. and Hsieh, Y.-L. Distribution of single cotton fiber tensile properties, Textile
Research Journal (submitted).Hu, X. P. and Hsieh, Y.-L. (1996). Crystalline structure of developing cotton fibers,
Journal of Polymer Science, Polymer Physics Edition, 34, 1451–1459.Hu, X. P. and Hsieh, Y.-L. (1997a). Breaking elongation distributions of single fibers,
Journal of Materials Science 32: 3905–3912.Hu, X.-P. and Hsieh, Y.-L. (1997b) Crystalline phases in developing cotton fibers by
FTIR, Recent Research Developments in Polymer Science, 1: 249–254.
Chemical structure and properties of cotton 33
Hu, X.-P. and Hsieh, Y.-L. (1998). Distribution of single-fiber toughness, The Journal of
Textile Institute, 89, 457–467.Hu, X.-P. and Hsieh, Y.-L. (2001). Effects of dehydration effects on the structure and
tensile properties of developing Acala cotton fibers, Textile Research Journal 71(3):231–239.
Huwyler, H. R., Franz, G. and Meier, H. (1979). Changes in the composition of cottonfiber cell walls during development. Planta 146, 635–642.
Ingram, P., Woods, D. K., Peterlin, A. and Williams, J. L. (1974). Never-dried cotton, partI: morphology and transport properties, Textile Res. J., 44, 96–106.
Jacobsen, K. R., Grossman, Y. L., Hsieh, Y.-L., Plant, R. E., Larlor, W. F. and Jernstedt,J. A. (2001). Neps, seed-coat fragment and non-seed impurities in processed cotton,dyeing characteristics of processed fibers, Journal of Cotton Science 5(1): 53–67.
Jenkins, J. N., McCarthy, J. C. and Parrot, W. L. (1990). Fruiting efficiency in cotton: bollsize and boll set percentage, Crop Science, 30, 857–860.
John, M. E. and Stewart, J. McD. (1992). Trends in Biotechnology, 10(5), 165–170.Joshi, P. C., Wadhwani, A. M. and Johri, B. M. (1967). Morphological and embryological
studies of Gossypium L. Proc. Natl. Inst. Sci. India, B(33), 37–93.Kassenback, P. (1970). Bilateral structure of cotton fibers as revealed by enzymatic
degradation, Textile Res. J., 40, 330–334.Khalifa, B. A., Abdel-Zaher, N. and Shoukr, F. S. (1991). Crystalline character of native
and chemically treated Saudi Arabian cotton fibers, Textile Res. J., 61(10): 602–608.Kulshreshtha, A. K., Patel, K. F., Patel, A. R., Patel, M. M. and Baddi, N. T. (1973a). The
fine structure and mechanical properties of cotton fibres at various stages of growth,Cellulose Chemistry and Technology, 7: 307–314.
Kulshreshtha, A. K., Patel, K. F., Patel, A. R., Patel, M. M. and Baddi, N. T. (1973b). Astudy of equatorial X-ray diffraction from fresh, undried cotton fibre at various stagesof its growth, Cellulose Chemistry and Technology, 7: 343–349.
Liu, J.-H., Yang, H. and Hsieh, Y.-L. (2001). Variations of mature cotton fiber tensileproperties – association with seed positions and fiber lengths, Textile Research Journal
71(12): 1079–1086.Liu, J.-H., Yang, H. and Hsieh, Y.-L. (2005). Distribution of Single Fiber Tensile Properties
of Four Cotton Genotypes, Textile Research Journal 75(1): 117–122.Mark, H. (1940). Intermicellar Hole and Tube System in Fiber Structure, J. Phys. Chem.,
44, 764–788.Meinert, M. C. and Delmer, D. P. (1977). Changes in biochemical composition of the cell
wall of the cotton fiber during development, Plant Physiol., 59: 1088–1097.Michell, A. J. (1990). Carbohydr. Res. 197, 53.Muller, M. (1991). Precise measurement of important fiber properties in cotton, International
Textile Bulletin, 73–88.Muller, L. L. and Rollins, M. L. (1972). Electron microscopical study of cotton fiber
surfaces after purification treatment, Microscope, 20, 143–152.Naithani, S. C., Rama Rao, N. and Singh, Y. D. (1982). Physiological and biochemical
changes associated with cotton fiber development, Physiol. Plant, 54, 225–229.Nelson, M. L. and Mares, T. (1965). Accessibility and lateral order distribution of the
cellulose in the developing cotton fiber, Textile Res. J., 35, 592–603.Patel, G. S., Bhama Iyer, P., Sreenivasan, S. and Krishna Iyer, K. R. (1990). Reversals in
cotton: a study with scanning electron microscopy, Textile Res. J., 60, 771–774.Peterlin, A. and Ingram, P. (1970). Morphology of secondary wall fibrils in cotton, Textile
Res. J., 40, 345–354.

Cotton: Science and technology34
Raes, G., Fransen, T. and Verschraege, L. (1968). Study of the reversal phenomenon inthe fibrillar structure of cotton fiber: reversal distance distribution as origin of anextended hypothesis in the cotton fiber development, Textile Res. J., 38, 182–195.
Rebenfeld, L. (1977). Mechanical properties of native fibrous materials, Proc. 1st Cleveland
Symp. Macromol. A. G. Walton, ed., Elsevier, Amsterdam, 177–201.Seagull, R. W. (1986). Changes in microtubule organization and wall microfibril orientation
during in vitro cotton fiber development: an immunofluorescent study, Can. J. Bot.,64, 1373–1381.
Seagull, R. W. (1992). A quantitative electron microscopic study of changes in microtublesarrays and wall microfibril orientation during in vitro cotton fiber development, J.
Cell Sci., 101, 561–577.Shafizadeh, F. (1975). Appl. Poly. Symp., 28, 153.Shafizadeh, F. (1985). Thermal Degradation of Cellulose, in Cellulose Chemistry and Its
Applications, T. P. Nevell and S. H. Zeronia, eds; Ellis Horwood Ltd., Chichester.Stewart, J. M. (1975). Fiber initiation on the cotton ovule, Am. J. Bot., 62, 723–730.Stone, J. E. and Scallan, A. M. (1965). Consolidation of the paper web, Technical Section
of the British Paper and Board Makers’ Assoc., London, 145–174.Sugiyama, J., Persson, J. and Chanzy, H. (1991). Combined infrared and electron diffraction
study of the polymorphism of native celluloses Macromolecules, 24, 2461–2466.Timpa, J. D., Ramey, Jr. H. H. (1994). Relationship between cotton fiber strength and
cellulose molecular weight distribution: HVI calibration stardards, Textile Res. J.,64(10): 557–562.
Timpa, J. D. and Triplett, B. A. (1993). Analysis of cell wall polymers during cotton fiberdevelopment, Planta, 189(1), 101–108.
Tripp, V. W., Moore, A. T. and Rollins, M. L. (1957). The surface of cotton fibers, PartII: Modified fibers, Text. Res. J., 27, 427–436.
VanderHart, D. L. and Atalla, R. H. (1984). Studies of microstructure in native cellulosesusing solid-state 13C NMR, Macromolecules, 17, 1465–1472.
VanderHart, D. L. and Atalla, R. H. (1987). In Atalla, R. H. (editor), The Structure of
Celluloses, page 88, ACS Symposium Series 340, American Chemical Society,Washington, DC.
Vigil, E. L., Anthony, W. S., Columbus, E., Erbe, E. and Wergin, W. P. (1996). Finestructure aspects of cotton fiber attachment to the seed coat: morphological factorsaffecting saw ginning of lint cotton, Int. J. Plant Sci., 157(1): 92–102.
Warwicker, J. O., Jeffries, R., Colbran, R. L. and Robinson, R. N. (1996). Shirley InstitutePamphlet, No. 93, Manchester, U.K., December.
Yatsu, L. Y. and Jacks, T. J. (1981). An ultrastructural study of the relationship betweenmicrotubules and microfibrils in cotton cell wall reversals, Am. J. Bot., 68, 771–777.
Zeronian, S. H. (1991). The mechanical properties of cotton fibers, J. Appl. Polym. Sci.,
Appl. Polym Symp., 47, 445–461.
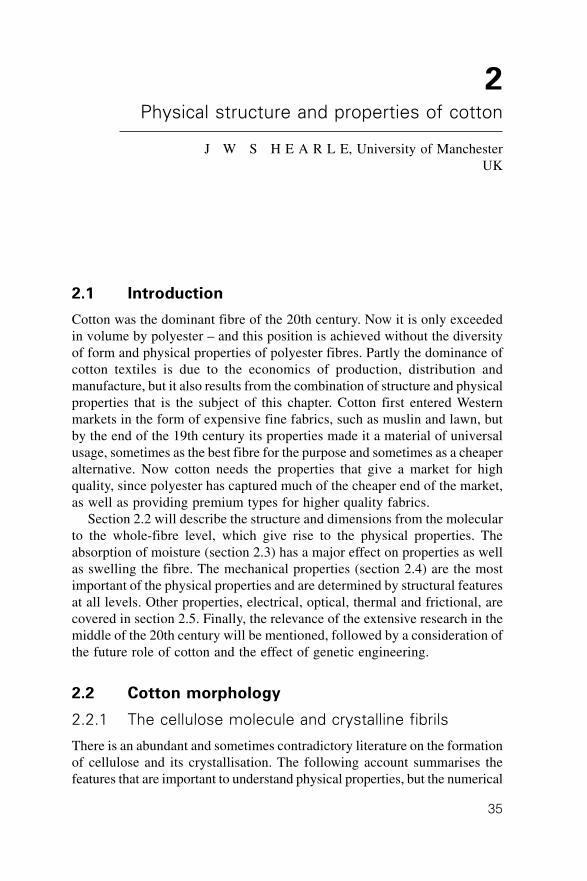
35
2.1 Introduction
Cotton was the dominant fibre of the 20th century. Now it is only exceededin volume by polyester – and this position is achieved without the diversityof form and physical properties of polyester fibres. Partly the dominance ofcotton textiles is due to the economics of production, distribution andmanufacture, but it also results from the combination of structure and physicalproperties that is the subject of this chapter. Cotton first entered Westernmarkets in the form of expensive fine fabrics, such as muslin and lawn, butby the end of the 19th century its properties made it a material of universalusage, sometimes as the best fibre for the purpose and sometimes as a cheaperalternative. Now cotton needs the properties that give a market for highquality, since polyester has captured much of the cheaper end of the market,as well as providing premium types for higher quality fabrics.
Section 2.2 will describe the structure and dimensions from the molecularto the whole-fibre level, which give rise to the physical properties. Theabsorption of moisture (section 2.3) has a major effect on properties as wellas swelling the fibre. The mechanical properties (section 2.4) are the mostimportant of the physical properties and are determined by structural featuresat all levels. Other properties, electrical, optical, thermal and frictional, arecovered in section 2.5. Finally, the relevance of the extensive research in themiddle of the 20th century will be mentioned, followed by a consideration ofthe future role of cotton and the effect of genetic engineering.
2.2 Cotton morphology
2.2.1 The cellulose molecule and crystalline fibrils
There is an abundant and sometimes contradictory literature on the formationof cellulose and its crystallisation. The following account summarises thefeatures that are important to understand physical properties, but the numerical
2Physical structure and properties of cotton
J W S H E A R L E, University of ManchesterUK
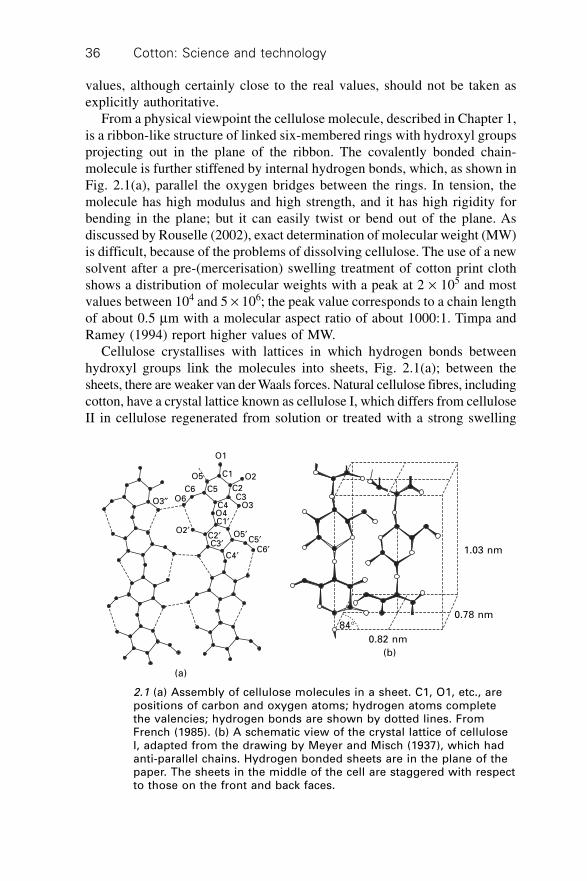
Cotton: Science and technology36
values, although certainly close to the real values, should not be taken asexplicitly authoritative.
From a physical viewpoint the cellulose molecule, described in Chapter 1,is a ribbon-like structure of linked six-membered rings with hydroxyl groupsprojecting out in the plane of the ribbon. The covalently bonded chain-molecule is further stiffened by internal hydrogen bonds, which, as shown inFig. 2.1(a), parallel the oxygen bridges between the rings. In tension, themolecule has high modulus and high strength, and it has high rigidity forbending in the plane; but it can easily twist or bend out of the plane. Asdiscussed by Rouselle (2002), exact determination of molecular weight (MW)is difficult, because of the problems of dissolving cellulose. The use of a newsolvent after a pre-(mercerisation) swelling treatment of cotton print clothshows a distribution of molecular weights with a peak at 2 ¥ 105 and mostvalues between 104 and 5 ¥ 106; the peak value corresponds to a chain lengthof about 0.5 mm with a molecular aspect ratio of about 1000:1. Timpa andRamey (1994) report higher values of MW.
Cellulose crystallises with lattices in which hydrogen bonds betweenhydroxyl groups link the molecules into sheets, Fig. 2.1(a); between thesheets, there are weaker van der Waals forces. Natural cellulose fibres, includingcotton, have a crystal lattice known as cellulose I, which differs from celluloseII in cellulose regenerated from solution or treated with a strong swelling
1.03 nm
0.78 nm
0.82 nm
84∞
(b)
(a)
C1
O1
O2
C2C3
O3
O5¢C5¢
C6¢C4¢
C2¢C3¢
O2¢
O3≤ O6C6
O5
C5
C4O4C1¢
2.1 (a) Assembly of cellulose molecules in a sheet. C1, O1, etc., arepositions of carbon and oxygen atoms; hydrogen atoms completethe valencies; hydrogen bonds are shown by dotted lines. FromFrench (1985). (b) A schematic view of the crystal lattice of celluloseI, adapted from the drawing by Meyer and Misch (1937), which hadanti-parallel chains. Hydrogen bonded sheets are in the plane of thepaper. The sheets in the middle of the cell are staggered with respectto those on the front and back faces.
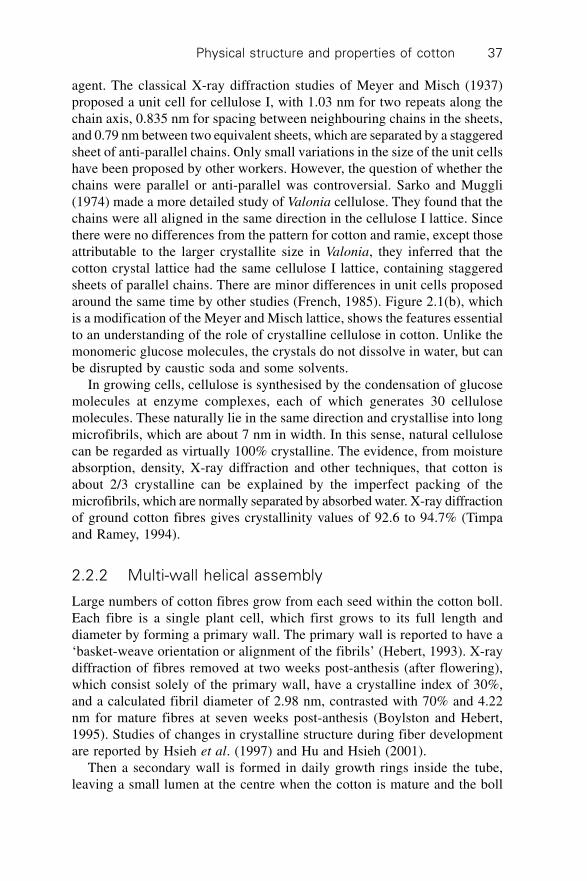
Physical structure and properties of cotton 37
agent. The classical X-ray diffraction studies of Meyer and Misch (1937)proposed a unit cell for cellulose I, with 1.03 nm for two repeats along thechain axis, 0.835 nm for spacing between neighbouring chains in the sheets,and 0.79 nm between two equivalent sheets, which are separated by a staggeredsheet of anti-parallel chains. Only small variations in the size of the unit cellshave been proposed by other workers. However, the question of whether thechains were parallel or anti-parallel was controversial. Sarko and Muggli(1974) made a more detailed study of Valonia cellulose. They found that thechains were all aligned in the same direction in the cellulose I lattice. Sincethere were no differences from the pattern for cotton and ramie, except thoseattributable to the larger crystallite size in Valonia, they inferred that thecotton crystal lattice had the same cellulose I lattice, containing staggeredsheets of parallel chains. There are minor differences in unit cells proposedaround the same time by other studies (French, 1985). Figure 2.1(b), whichis a modification of the Meyer and Misch lattice, shows the features essentialto an understanding of the role of crystalline cellulose in cotton. Unlike themonomeric glucose molecules, the crystals do not dissolve in water, but canbe disrupted by caustic soda and some solvents.
In growing cells, cellulose is synthesised by the condensation of glucosemolecules at enzyme complexes, each of which generates 30 cellulosemolecules. These naturally lie in the same direction and crystallise into longmicrofibrils, which are about 7 nm in width. In this sense, natural cellulosecan be regarded as virtually 100% crystalline. The evidence, from moistureabsorption, density, X-ray diffraction and other techniques, that cotton isabout 2/3 crystalline can be explained by the imperfect packing of themicrofibrils, which are normally separated by absorbed water. X-ray diffractionof ground cotton fibres gives crystallinity values of 92.6 to 94.7% (Timpaand Ramey, 1994).
2.2.2 Multi-wall helical assembly
Large numbers of cotton fibres grow from each seed within the cotton boll.Each fibre is a single plant cell, which first grows to its full length anddiameter by forming a primary wall. The primary wall is reported to have a‘basket-weave orientation or alignment of the fibrils’ (Hebert, 1993). X-raydiffraction of fibres removed at two weeks post-anthesis (after flowering),which consist solely of the primary wall, have a crystalline index of 30%,and a calculated fibril diameter of 2.98 nm, contrasted with 70% and 4.22nm for mature fibres at seven weeks post-anthesis (Boylston and Hebert,1995). Studies of changes in crystalline structure during fiber developmentare reported by Hsieh et al. (1997) and Hu and Hsieh (2001).
Then a secondary wall is formed in daily growth rings inside the tube,leaving a small lumen at the centre when the cotton is mature and the boll

Cotton: Science and technology38
opens. Goynes et al. (1995) report SEM and TEM studies of the developmentof the secondary wall in field and greenhouse grown cotton at differentnumbers of days post-anthesis. In mature fibres, the secondary wall comprisesabout 94% of the fibre material and thus dominates the mechanical properties.Immature cottons, resulting from premature opening of the boll, due to frostdisease or application of plant hormone, are thin-walled tubes. The fibresurface consists of a waxy cuticle, which is removed by wet processing.Studies of changes in crystalline structure during fibre development arereported by Hsieh et al. (1997) and Hu and Hsieh (2001).
An impression of the overall structure of the cotton fibre is shown in Fig.2.2. In the secondary wall the microfibrils are laid down in helical layers onthe inside of the tube, with helix angles changing from around 35∞ in theouter layers to 20∞ in the inner layers (Hebert et al., 1970; Morosoff andIngram, 1970). At intervals along the cell walls, there are reversals betweenleft-handed to right-handed helices. In a scanning electron micrograph, thereversals can be seen on the fibre surface.
2.2.3 Collapse and convolutions
When the fibre dries, the hollow tube collapses a characteristic shapeKassenbeck (1970) pointed out that different parts of the collapsed fibre,
Reversal
Lumen
Pectin
Fats Waxes
Primarywall
S2
20–30∞
S1
20–30∞
S3
2.2 Representation of the structure of a cotton fibre. From Jeffries etal. (1969).
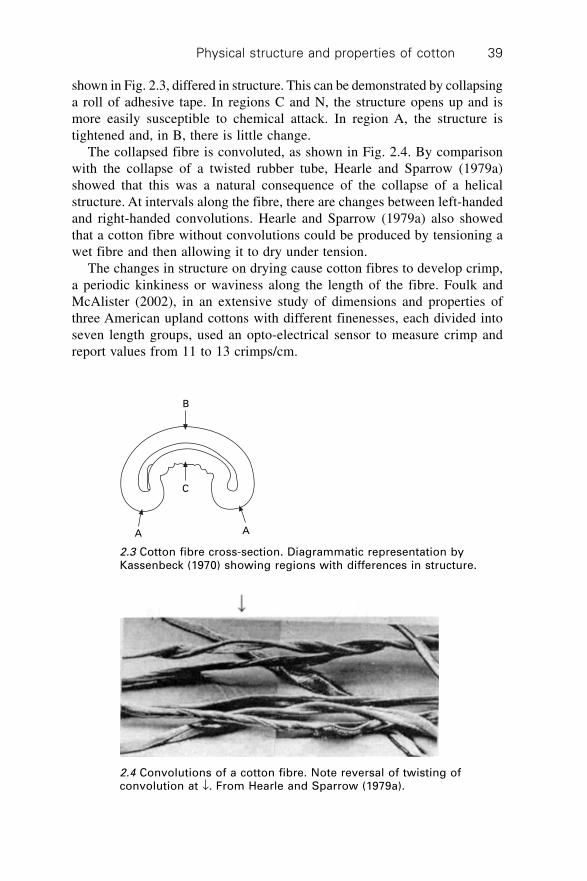
Physical structure and properties of cotton 39
shown in Fig. 2.3, differed in structure. This can be demonstrated by collapsinga roll of adhesive tape. In regions C and N, the structure opens up and ismore easily susceptible to chemical attack. In region A, the structure istightened and, in B, there is little change.
The collapsed fibre is convoluted, as shown in Fig. 2.4. By comparisonwith the collapse of a twisted rubber tube, Hearle and Sparrow (1979a)showed that this was a natural consequence of the collapse of a helicalstructure. At intervals along the fibre, there are changes between left-handedand right-handed convolutions. Hearle and Sparrow (1979a) also showedthat a cotton fibre without convolutions could be produced by tensioning awet fibre and then allowing it to dry under tension.
The changes in structure on drying cause cotton fibres to develop crimp,a periodic kinkiness or waviness along the length of the fibre. Foulk andMcAlister (2002), in an extensive study of dimensions and properties ofthree American upland cottons with different finenesses, each divided intoseven length groups, used an opto-electrical sensor to measure crimp andreport values from 11 to 13 crimps/cm.
B
C
A A
2.3 Cotton fibre cross-section. Diagrammatic representation byKassenbeck (1970) showing regions with differences in structure.
2.4 Convolutions of a cotton fibre. Note reversal of twisting ofconvolution at Ø. From Hearle and Sparrow (1979a).
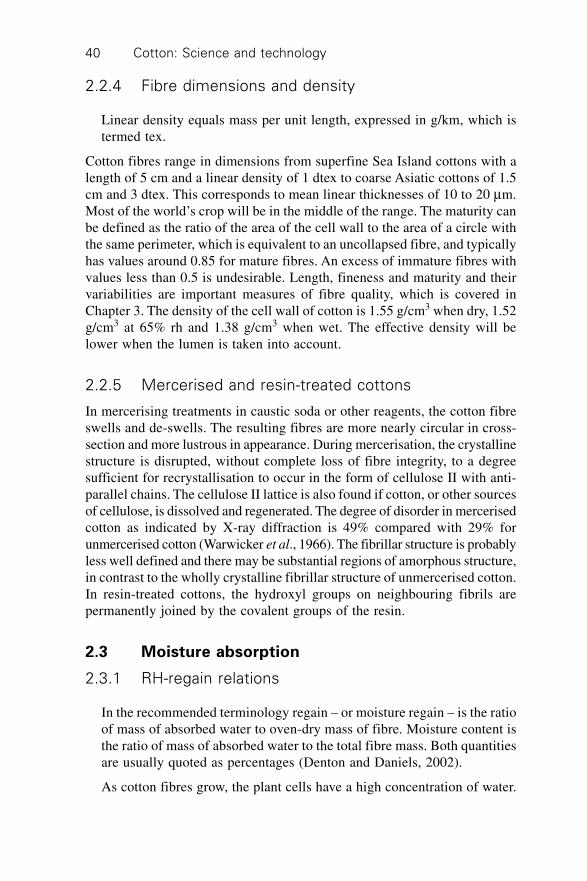
Cotton: Science and technology40
2.2.4 Fibre dimensions and density
Linear density equals mass per unit length, expressed in g/km, which istermed tex.
Cotton fibres range in dimensions from superfine Sea Island cottons with alength of 5 cm and a linear density of 1 dtex to coarse Asiatic cottons of 1.5cm and 3 dtex. This corresponds to mean linear thicknesses of 10 to 20 mm.Most of the world’s crop will be in the middle of the range. The maturity canbe defined as the ratio of the area of the cell wall to the area of a circle withthe same perimeter, which is equivalent to an uncollapsed fibre, and typicallyhas values around 0.85 for mature fibres. An excess of immature fibres withvalues less than 0.5 is undesirable. Length, fineness and maturity and theirvariabilities are important measures of fibre quality, which is covered inChapter 3. The density of the cell wall of cotton is 1.55 g/cm3 when dry, 1.52g/cm3 at 65% rh and 1.38 g/cm3 when wet. The effective density will belower when the lumen is taken into account.
2.2.5 Mercerised and resin-treated cottons
In mercerising treatments in caustic soda or other reagents, the cotton fibreswells and de-swells. The resulting fibres are more nearly circular in cross-section and more lustrous in appearance. During mercerisation, the crystallinestructure is disrupted, without complete loss of fibre integrity, to a degreesufficient for recrystallisation to occur in the form of cellulose II with anti-parallel chains. The cellulose II lattice is also found if cotton, or other sourcesof cellulose, is dissolved and regenerated. The degree of disorder in mercerisedcotton as indicated by X-ray diffraction is 49% compared with 29% forunmercerised cotton (Warwicker et al., 1966). The fibrillar structure is probablyless well defined and there may be substantial regions of amorphous structure,in contrast to the wholly crystalline fibrillar structure of unmercerised cotton.In resin-treated cottons, the hydroxyl groups on neighbouring fibrils arepermanently joined by the covalent groups of the resin.
2.3 Moisture absorption
2.3.1 RH-regain relations
In the recommended terminology regain – or moisture regain – is the ratioof mass of absorbed water to oven-dry mass of fibre. Moisture content isthe ratio of mass of absorbed water to the total fibre mass. Both quantitiesare usually quoted as percentages (Denton and Daniels, 2002).
As cotton fibres grow, the plant cells have a high concentration of water.

Physical structure and properties of cotton 41
When the boll opens, the fibres lose water to equilibrate with theambient humidity. The amount of absorbed water then rises and falls withchanges in humidity. The maximum absorption at 100% rh or in water neverreaches the original value, so that some studies are carried out on never-dried fibres.
The rate of absorption and desorption of water with change of humidity isvery fast for an isolated fibre. For fibre assemblies, the changes are muchslower and involve interaction between the rate of diffusion of water moleculesand the evolution and transmission of heat of sorption. Experimental andtheoretical studies by Henry (1939) and others are summarised by Mortonand Hearle (1993). Changes are carried on two waves with a final exponentialapproach to equilibrium. A standard half-change period of 12 hours appliesto a slab of cotton fibres 2.5 cm thick, with a density of 0.5 g/cm3 when dry,at a regain of 7% and a temperature of 18 ∞C. Ninety-nine per cent of thetotal change is completed in 14 times the half-change value (one week). Thetime increases linearly with (volume/ surface area)2; it increases with packagedensity from 1/6 of standard value at 0.09 g/cm3 to 1.33 times at 0.7 g/cm3;it falls from six times the standard value for zero regain, to a minimum of2/3 at 4% and then rises to five times at 14% regain; it falls from 2.4 timesthe standard value at 5 ∞C to 0.4 times at 30 ∞C. Due to hysteresis, theequilibrium regain is higher when humidity is increased than when humidityis decreased.
Figure 2.5(a) shows a typical rh-regain curve (Urquhart and Eckersall,1930). Enough time was allowed for equilibrium to be reached at eachhumidity. The lower curve is for absorption from the dry state; the uppercurve is for desorption from 100% rh; the dotted line shows desorption froman intermediate value. As Ashpole (1952) showed for viscose rayon, thereare difficulties in making measurements close to 100% rh and the true saturationvalues may be higher than shown in Fig. 2.5(a). Preston and Nimkar (1952)found that suction of a wet cotton yarn to minus 30 cm of mercury gave aretained regain of 52%, and of 48% after centrifuging at 1000 g for fiveminutes; however, there is a question of how much water is held by capillaryforces and how much is absorbed within the fibre. Figure 2.5(b) shows howthe primary desorption curve of cotton from the boll is at a higher regainlevel down to 40% rh.
Urquhart and Williams (1924) showed that up to about 85% rh, the regainof cotton at a given humidity decreases with rise of temperature from 50 to110 ∞C. The reduction increases from 0.9% at 20% rh to 1.8% at 70% rh. At85% rh, the curves cross over and there is a higher regain at higher temperatures.In a standard atmosphere of 65% rh and 20 ∞C, the absorption regain ofcotton is 7–8%. Hysteresis increases the desorption value by 0.9%. Therecommended allowance for calculating the mass of fibre in commercialtransactions is 8.5%.

Cotton: Science and technology42
2.3.2 Heat of sorption
The [differential] heat of sorption is the heat evolved when one gram ofwater is absorbed by an infinite mass of material at a given humidity. Theheat of wetting [integral heat of sorption] is the heat evolved when aspecimen of material, which has a mass of one gram when dry, is completelywetted out.
Table 2.1 gives values of the heat of sorption of cotton, which decreasesrapidly from a high value for dry cotton as the starting humidity increases.The upper row are measured values for absorption of liquid water; the lower rowis corrected by adding the latent heat of vaporisation of water, 2.45 kJ/g.Values of heat of sorption from the dry state ranging from 1.19 to 1.33 kJ/ghave been reported for three different types of cotton (Morton and Hearle,1993). The corresponding heats of wetting from the dry state ranged from46.1 to 47.3 kJ/g; other data for various types and methods ranged from 41to 54 kJ/g (Morton and Hearle, 1993).
Primarydesorption
Usualabsorption and
desorption curves
40 50 60 70 80 90 100Relative humidity %
(b)
25
20
15
10
5
Re
ga
in %
A
CB
0 20 40 60 80 100Relative humidity %
(a)
Re
ga
in %
25
20
15
10
5
0
2.5 (a) Typical regain-rh curve for cotton (soda-boiled). A: absorption.B: desorption. C: intermediate. (b) Primary desorption curve forcotton taken from the boll. From Urquhart and Eckersall (1930).
Table 2.1 Variation of heat of sorption of Sea Island cotton with humidity. From
Guthrie (1949)
Relative humidity %
0 15 30 45 60
Heat of sorption from liquid 1.24 0.50 0.39 0.32 0.29
water kJ/g
Heat of sorption from water 3.69 2.95 2.84 2.77 2.74
vapour kJ/g

Physical structure and properties of cotton 43
2.3.3 Swelling
Figure 2.6(a) shows the change of density of cotton with change of regain;in Fig. 2.6(b), this is converted into change in specific volume. Initially fromthe dry state, there is an increase of density due to water molecules occupying‘empty space’ within the fibre. The density is a maximum at about 2%regain, and then decreases since the density of water is less than that of fibre.Above 20% regain, the volume increase equals the equivalent volume ofliquid water.
The swelling of cotton fibres is predominantly in the transverse direction.Meredith (1953) states that, in going from the dry to the wet state, theincrease in length is 1.2% but the increase in diameter is 14%. However,these quantities are difficult to measure because of the lumen, the cross-sectional shape of cotton fibres, and changes in helix angles and twist angleof convolutions as a result of swelling. Preston and Nimkar (1949) checkedvalues from different sources and found values for diameter swelling fromdry to wet of 23, 20 and 7%, with area swellings of 42, 41 and 21%. Ibbettand Hsieh (2001) report a diameter swelling of 10–15% with a lengthcontraction of 0–0.5%. The data in Fig. 2.6(b) would give a maximum volumeswelling of 63%. This is compatible with a regain of 40%, but implies thatthe increase of area or length of the fibre material, excluding the lumen, mustbe greater than indicated by the above values.
0 10 20 30 40Moisture regain %
(a)
Cotton
1.6
1.5
1.4
1.3
1.2
1.1
De
nsit
y g
/cm
3
1.1
1.0
0.9
0.8
0.7
0.6
Vo
lum
e o
f 1
g f
ibre
in
cm
3
0 10 20 30 40Moisture regain %
(b)
Cotton
Empty space
Vol. of water absorbed
Apparent vol. of fibre
2.6 (a) Change of cotton fibre density with regain. Dotted line isdensity from mixture law for fibre and water based on high regainvalues. (b) Recalculated as change of volume. From Meredith (1953).

Cotton: Science and technology44
2.3.4 Structural changes and theoretical models
In the completely dry state, hydrogen bonds will form between those hydroxylgroups that are not already linked within crystalline regions. With the viewof the structure described in section 2.2.1, the available hydroxyl groups willbe on the surface of the crystalline fibrils. As humidity is increased, waterwill be attracted to accessible hydroxyl groups. There will be an equilibriumbetween the free energy of the cellulose/water mixture and the free energy ofthe water vapour in the atmosphere.
The first water molecules to be absorbed will be directly attached tohydroxyl groups. Later absorption may be on remaining available hydroxylgroups or form secondary layers attached to already absorbed water molecules.As indicated in section 2.3.3, the direct absorption results in more efficientmolecular packing and gives an initial increase in density. The later absorptionjust adds the same volume as that of liquid water. The heat of sorption, asnoted in section 2.3.2, is also higher for the initial absorption. At very highhumidities, some water will be held by capillary forces. Experimental resultssuggest that this is significant only above 99% rh, which would correspondto a pore size of 110 nm (Morton and Hearle, 1993).
There have been a number of theories that explain the shape of the regain-rh curve in terms of multilayer absorption. Peirce (1929) presented a simplemechanistic argument. He assumed that there was an equal probability of anadded water molecule being absorbed by unoccupied sites and already occupiedsites. The experimental regain-rh curve then divides between directly andindirectly absorbed water as shown in Fig. 2.7. If C is the total number ofabsorbed water molecules per absorption site, which is divided into Ca directlyabsorbed and Cb indirectly absorbed, the resulting partition is:
0 20 40 60 80 100Relative humidity %
Total CDirect Ca
Indirect Cb
2.0
1.6
1.2
0.8
0.4
0
Mo
lecu
les/s
ite
22.25
17.8
13.35
8.9
4.45
0
Re
ga
in %
2.7 Division between directly and indirectly absorbed wateraccording to Peirce (1929).

Physical structure and properties of cotton 45
Ca = 1 – exp(–C) Cb = C – 1 + exp(–C) 2.1
He then showed that the torsional rigidity of cotton fibres decreased linearlywith Ca, the amount of directly absorbed water.
Peirce postulated that the directly absorbed water, which is more firmlybonded, will make only a small contribution to the vapour pressure p. Theindirectly absorbed water is the main controlling factor, with a vapour pressuregiven by (saturation vapour pressure p0 ¥ fraction of sites occupied by indirectlyabsorbed water). In order to fit experimental data, it was necessary to introducean arbitrary factor (1/b), which represented the fraction of sites that wereaccessible to secondary absorption. Peirce justified this by suggesting thatone indirectly absorbed water molecule blocks off a number of sites. Thisleads to the expression:
p/p0 = 1 – exp(– b Cb) 2.2
With the addition of a contribution from directly absorbed water reduced bya factor K, the assumption that only a fraction g of hydroxyl groups areeffective in absorption, substitution of the fractional regain r, and takingaccount of the molecular weights of water and cellulose per hydroxyl group,this gives the following dependence of rh on regain:
p/p0 = 1 – [1 – K(1 – exp(–3g r)]
exp{–b [exp(–3g r) – 1 + 3g r)]} 2.3
Peirce found a good agreement with an experimental rh-regain relation withg = 1/3, K = 0.4 and (1/b) = 0.185.
In several other theoretical treatments, which are discussed by Mortonand Hearle (1993), corrections are needed at low or high humidities. Goodagreement with experiment is found by Hailwood and Horrobin (1946), whotreat the directly absorbed water molecule as a hydrate attached to particularunits of the cellulose molecule and the indirectly absorbed water as formingan ideal solid solution.
A different approach to moisture absorption, which was developed byBarkas (1949) in relation to wood, is also relevant to cotton. Barkas, basedon the analogy with osmotic pressure, considers that water is absorbeduntil the stresses generated by swelling prevent more water flowing into thefibres. He used a thermodynamic cycle to derive a differential equationrelating directional swelling to directional stresses and moisture absorption.An alternative derivation, which includes a relation between absorptionand fibre tension, is given by Hearle (1957); the prediction agreed withabsorption by regenerated cellulose fibres under tension as measured byTreloar (1953).

Cotton: Science and technology46
On a purely molecular approach, hysteresis in moisture absorption isexplained as a tendency for the structure to resist change in absorption anddesorption:
cross-links breaking; water attachingdry structure with ÆÆÆÆÆÆÆÆÆÆÆÆ wet structure withmany cross-links ¨¨¨¨¨¨¨¨¨¨¨ few cross-links
water coming off; cross-links forming
In terms of swelling stresses, hysteresis in moisture absorption results frommechanical hysteresis, which is covered in section 2.4.1.
2.4 Mechanical properties
2.4.1 Tensile stress-strain relations
For fibres, tensions are best normalised on a mass basis. Specific stress isgiven in N/tex. On an area basis, conventional stress in GPa equals (specificstress in N/tex ¥ density in g/cm3). Tenacity is specific stress at break.Modulus is the slope of the specific stress vs. strain curve.
Meredith (1945a) made an extensive study of the tensile properties ofcottons available in the middle of the 20th century, which showed the widerange of values in different cottons. Table 2.2 gives data for the strongest,weakest and intermediate strength types. The weaker cottons, such as thosegrown in India, will now have been replaced by improved varieties. Tensileproperties of modern cottons are included in the chapter on fibre quality.Cotton falls in the category of weaker and less extensible general textilefibres. The toughness (work of rupture) values are low, in comparison withmany other textile fibres. Generally longer and finer fibres show greatertenacity, which is a measure of strength, and modulus, which is a measure ofstiffness. Within a given sample of cotton, Morlier et al. (1951) found a risein tenacity for fibres in increasing length array groups. Timpa and Ramey(1994) found an increase of strength, measured in four laboratories accordingto HVI standards, from 0.2 to 0.3 N/tex with increasing length from 21.2 mm
Table 2.2 Tensile properties of cotton at 65% rh, 20 ∞C. From Meredith’s (1945a) set of
tests (1 cm test length; 0.9 (N/tex)/min; 50 tests per sample)
Fineness Initial Tenacity Work of Breaking
dtex modulus N/tex rupture extension
N/tex mN/tex %
St Vincent, Sea Island 1.00 7.3 0.452 15.0 6.80
Uppers, American 1.84 5.0 0.323 10.7 7.10
Bengals, Indian 3.24 3.9 0.185 5.0 5.60
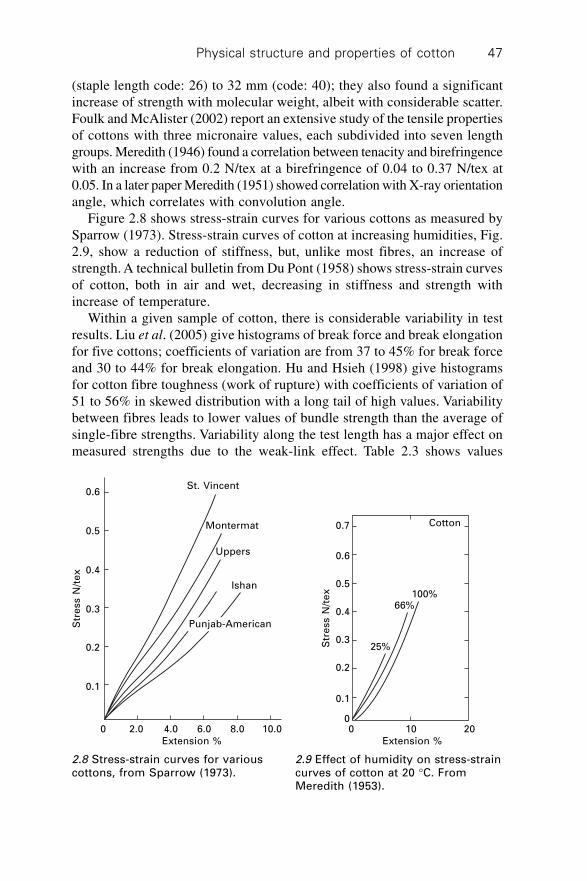
Physical structure and properties of cotton 47
(staple length code: 26) to 32 mm (code: 40); they also found a significantincrease of strength with molecular weight, albeit with considerable scatter.Foulk and McAlister (2002) report an extensive study of the tensile propertiesof cottons with three micronaire values, each subdivided into seven lengthgroups. Meredith (1946) found a correlation between tenacity and birefringencewith an increase from 0.2 N/tex at a birefringence of 0.04 to 0.37 N/tex at0.05. In a later paper Meredith (1951) showed correlation with X-ray orientationangle, which correlates with convolution angle.
Figure 2.8 shows stress-strain curves for various cottons as measured bySparrow (1973). Stress-strain curves of cotton at increasing humidities, Fig.2.9, show a reduction of stiffness, but, unlike most fibres, an increase ofstrength. A technical bulletin from Du Pont (1958) shows stress-strain curvesof cotton, both in air and wet, decreasing in stiffness and strength withincrease of temperature.
Within a given sample of cotton, there is considerable variability in testresults. Liu et al. (2005) give histograms of break force and break elongationfor five cottons; coefficients of variation are from 37 to 45% for break forceand 30 to 44% for break elongation. Hu and Hsieh (1998) give histogramsfor cotton fibre toughness (work of rupture) with coefficients of variation of51 to 56% in skewed distribution with a long tail of high values. Variabilitybetween fibres leads to lower values of bundle strength than the average ofsingle-fibre strengths. Variability along the test length has a major effect onmeasured strengths due to the weak-link effect. Table 2.3 shows values
0 2.0 4.0 6.0 8.0 10.0Extension %
0.6
0.5
0.4
0.3
0.2
0.1
Str
ess N
/te
x
St. Vincent
Montermat
Uppers
Ishan
Punjab-American
0 10 20Extension %
Cotton
100%66%
25%
0.7
0.6
0.5
0.4
0.3
0.2
0.1
0
Str
ess N
/te
x
2.8 Stress-strain curves for variouscottons, from Sparrow (1973).
2.9 Effect of humidity on stress-straincurves of cotton at 20 ∞C. FromMeredith (1953).

Cotton: Science and technology48
obtained by Meredith (1946) for lengths of 1 cm and 1 mm in single-fibretests. Although the result for Sakel cotton is anomalous, the general trend isfor the loss in strength from 1 mm to 1 cm test length to increase with thecoefficient of variation of the tenacity test. Data on the reduction of bundlestrength with test length for various cottons is given by Brown (1954) andTaylor (1994).
Research at University of California, Davis, has studied the change ofstrength and structure during fibre development in greenhouse-grown Acalacottons (Hsieh et al., 1995, 1997), G. hirsutum and G. barbadense (Hsiehet al., 2000), among ovule locations and along fibre lengths (Hsieh andWang, 2000), and effects of dehydration (Hu and Hsieh, 2001). A study onmature fibres examined the association with seed position and fibre length(Liu et al., 2001).
Hebert (1993) reported that the strength of an immature fibre withonly primary wall was one-sixth that of a mature fibre, which is dominatedby the thicker secondary wall. The tenacity was just over half that of themature fibre, reflecting the basket-weave orientation of fibrils in thesecondary wall.
2.4.2 Elastic recovery
Even under constant test conditions for a particular cotton fibre, there is nota single-valued relation between stress and strain. In tests to successivelyhigher strains, the recovery curve falls below the elongation curve and theunrecovered extension at zero stress increases with the increase in maximumstress and strain. Figure 2.10 shows the dependence of elastic recovery,which is the ratio of recovered to total extension, as functions of imposedstrain and stress respectively. Cyclic tests between strains will show acharacteristic hysteresis loop.
The ‘permanent’ extension left after elongation when dry is reduced oreliminated when the fibre is wetted out due to swelling recovery. This effectis related to the glass transition temperature discussed in section 2.5.3. Theincreased stiffness and strength and reduced break extension after cotton has
Table 2.3 Effect of test length and variability on tenacity in N/tex tests by Meredith
(1946)
Tenacity Standard Coefficient Tenacity Tenacity ratio %
deviation of variation
1 cm 1 cm % 1 mm (1 cm/1 mm)
St Vincent 0.473 0.136 28.7 0.609 78
Sakel 0.405 0.180 44.4 0.535 76
Uppers 0.288 0.136 47.2 0.477 60
Ishan 0.324 0.093 28.7 0.446 73
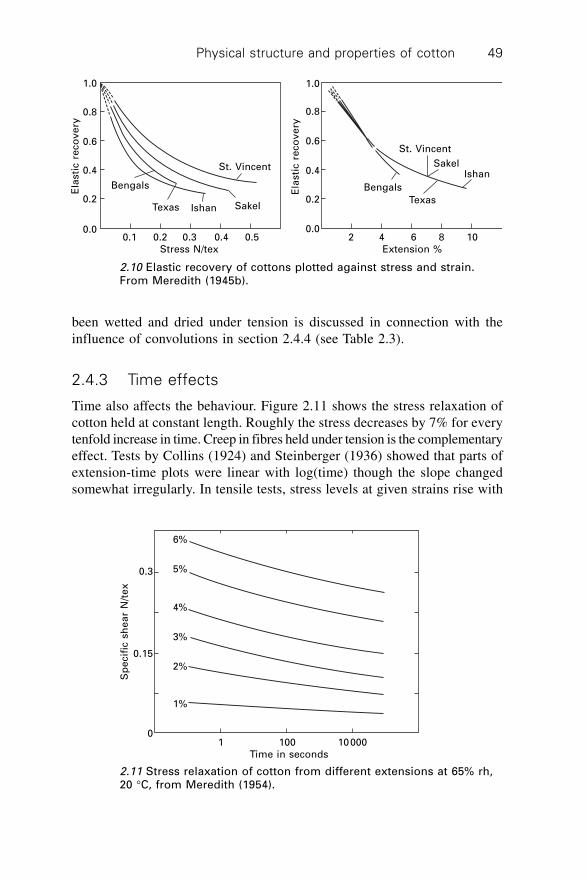
Physical structure and properties of cotton 49
been wetted and dried under tension is discussed in connection with theinfluence of convolutions in section 2.4.4 (see Table 2.3).
2.4.3 Time effects
Time also affects the behaviour. Figure 2.11 shows the stress relaxation ofcotton held at constant length. Roughly the stress decreases by 7% for everytenfold increase in time. Creep in fibres held under tension is the complementaryeffect. Tests by Collins (1924) and Steinberger (1936) showed that parts ofextension-time plots were linear with log(time) though the slope changedsomewhat irregularly. In tensile tests, stress levels at given strains rise with
2 4 6 8 10Extension %
1.0
0.8
0.6
0.4
0.2
0.0
Ela
sti
c r
eco
ve
ry
Texas
Bengals
IshanSakel
St. Vincent
0.1 0.2 0.3 0.4 0.5Stress N/tex
1.0
0.8
0.6
0.4
0.2
0.0
Ela
sti
c r
eco
ve
ry
St. Vincent
SakelIshanTexas
Bengals
2.10 Elastic recovery of cottons plotted against stress and strain.From Meredith (1945b).
1 100 10000Time in seconds
0.3
0.15
0
Sp
ecif
ic s
he
ar
N/t
ex
6%
5%
4%
3%
2%
1%
2.11 Stress relaxation of cotton from different extensions at 65% rh,20 ∞C, from Meredith (1954).
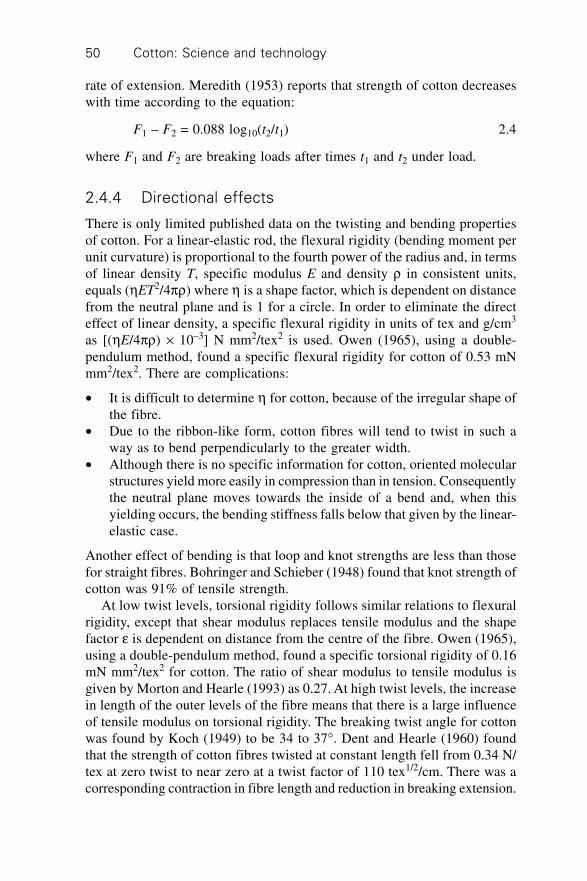
Cotton: Science and technology50
rate of extension. Meredith (1953) reports that strength of cotton decreaseswith time according to the equation:
F1 – F2 = 0.088 log10(t2/t1) 2.4
where F1 and F2 are breaking loads after times t1 and t2 under load.
2.4.4 Directional effects
There is only limited published data on the twisting and bending propertiesof cotton. For a linear-elastic rod, the flexural rigidity (bending moment perunit curvature) is proportional to the fourth power of the radius and, in termsof linear density T, specific modulus E and density r in consistent units,equals (hET2/4pr) where h is a shape factor, which is dependent on distancefrom the neutral plane and is 1 for a circle. In order to eliminate the directeffect of linear density, a specific flexural rigidity in units of tex and g/cm3
as [(hE/4pr) ¥ 10–3] N mm2/tex2 is used. Owen (1965), using a double-pendulum method, found a specific flexural rigidity for cotton of 0.53 mNmm2/tex2. There are complications:
∑ It is difficult to determine h for cotton, because of the irregular shape ofthe fibre.
∑ Due to the ribbon-like form, cotton fibres will tend to twist in such away as to bend perpendicularly to the greater width.
∑ Although there is no specific information for cotton, oriented molecularstructures yield more easily in compression than in tension. Consequentlythe neutral plane moves towards the inside of a bend and, when thisyielding occurs, the bending stiffness falls below that given by the linear-elastic case.
Another effect of bending is that loop and knot strengths are less than thosefor straight fibres. Bohringer and Schieber (1948) found that knot strength ofcotton was 91% of tensile strength.
At low twist levels, torsional rigidity follows similar relations to flexuralrigidity, except that shear modulus replaces tensile modulus and the shapefactor e is dependent on distance from the centre of the fibre. Owen (1965),using a double-pendulum method, found a specific torsional rigidity of 0.16mN mm2/tex2 for cotton. The ratio of shear modulus to tensile modulus isgiven by Morton and Hearle (1993) as 0.27. At high twist levels, the increasein length of the outer levels of the fibre means that there is a large influenceof tensile modulus on torsional rigidity. The breaking twist angle for cottonwas found by Koch (1949) to be 34 to 37∞. Dent and Hearle (1960) foundthat the strength of cotton fibres twisted at constant length fell from 0.34 N/tex at zero twist to near zero at a twist factor of 110 tex1/2/cm. There was acorresponding contraction in fibre length and reduction in breaking extension.
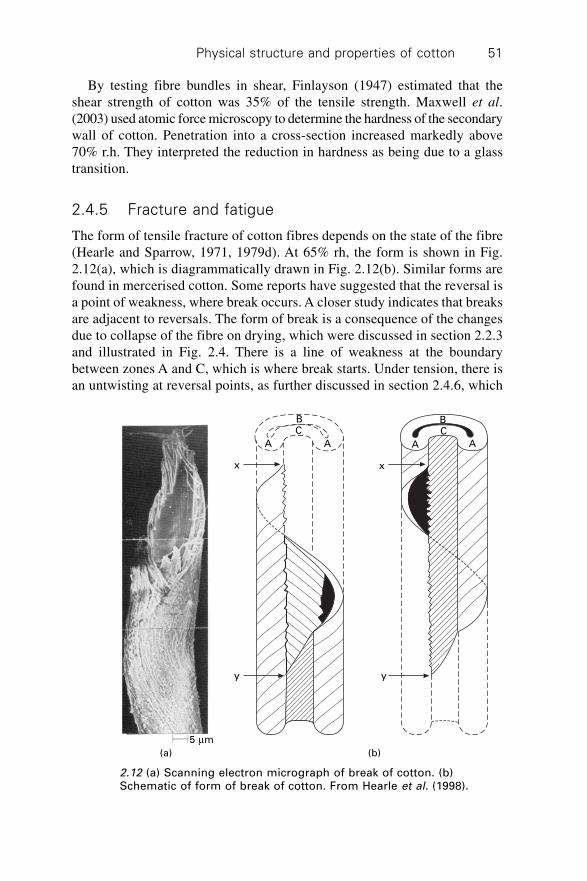
Physical structure and properties of cotton 51
By testing fibre bundles in shear, Finlayson (1947) estimated that theshear strength of cotton was 35% of the tensile strength. Maxwell et al.(2003) used atomic force microscopy to determine the hardness of the secondarywall of cotton. Penetration into a cross-section increased markedly above70% r.h. They interpreted the reduction in hardness as being due to a glasstransition.
2.4.5 Fracture and fatigue
The form of tensile fracture of cotton fibres depends on the state of the fibre(Hearle and Sparrow, 1971, 1979d). At 65% rh, the form is shown in Fig.2.12(a), which is diagrammatically drawn in Fig. 2.12(b). Similar forms arefound in mercerised cotton. Some reports have suggested that the reversal isa point of weakness, where break occurs. A closer study indicates that breaksare adjacent to reversals. The form of break is a consequence of the changesdue to collapse of the fibre on drying, which were discussed in section 2.2.3and illustrated in Fig. 2.4. There is a line of weakness at the boundarybetween zones A and C, which is where break starts. Under tension, there isan untwisting at reversal points, as further discussed in section 2.4.6, which
y y
BC
A AA A
BC
5 mm
(b)(a)
2.12 (a) Scanning electron micrograph of break of cotton. (b)Schematic of form of break of cotton. From Hearle et al. (1998).
x x

Cotton: Science and technology52
gives rise to shear stresses. A crack develops and runs round the fibre followingthe lower bonding between fibrils until it reaches the line of weakness andtears across zone C.
In resin-treated cotton at 65% rh, Fig. 2.13(a), and in raw cotton at zerohumidity, there is a granular break, which is typical of fibres with a fibrillarstructure. The axial splitting of Fig. 2.12 is resisted due to the stronger inter-fibrillar bonding between fibrils by covalent bonds in the treated fibre andhydrogen bonds in the dry fibre. The boding is weaker in wet resin-treatedcotton, which shows breaks similar to Fig. 2.12. For wet raw cotton, thelinks between fibrils are weaker still. There is no cooperative effect and thefibrils break individually, Fig. 2.13(b).
Twist breaks of cotton show axial splitting with a sharp tear-off at the end,Fig. 2.14(a), (b). Tensile fatigue (Hearle and Sparrow, 1979c) results inextensive splitting between fibrils before failure, Fig. 2.14(c). Biaxial rotationfatigue gave failure with considerable splitting, but tests give a large scatter
5 mm5 mm
(a) (b)
2.13 (a) Break of resin-treated cotton at 65% rh. (b) Break of wetmercerised cotton. From Hearle et al. (1998).
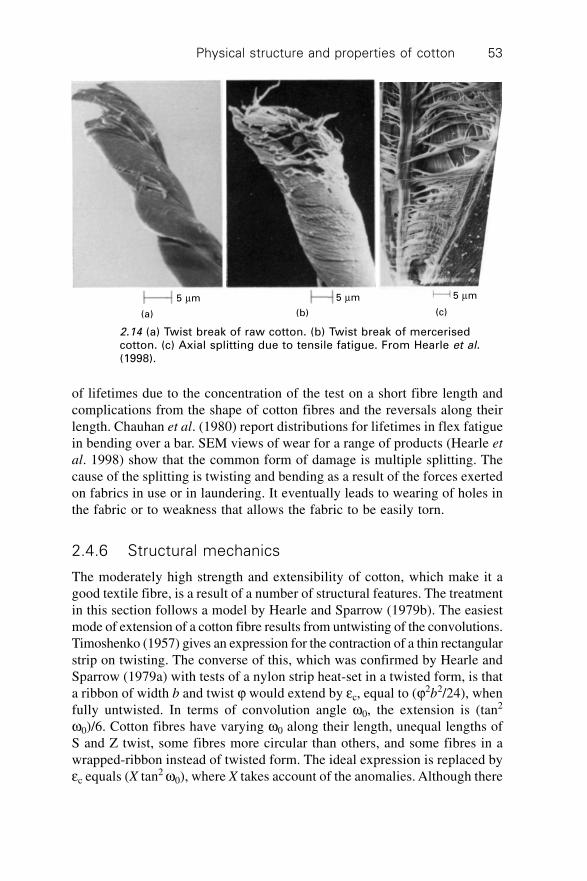
Physical structure and properties of cotton 53
of lifetimes due to the concentration of the test on a short fibre length andcomplications from the shape of cotton fibres and the reversals along theirlength. Chauhan et al. (1980) report distributions for lifetimes in flex fatiguein bending over a bar. SEM views of wear for a range of products (Hearle et
al. 1998) show that the common form of damage is multiple splitting. Thecause of the splitting is twisting and bending as a result of the forces exertedon fabrics in use or in laundering. It eventually leads to wearing of holes inthe fabric or to weakness that allows the fabric to be easily torn.
2.4.6 Structural mechanics
The moderately high strength and extensibility of cotton, which make it agood textile fibre, is a result of a number of structural features. The treatmentin this section follows a model by Hearle and Sparrow (1979b). The easiestmode of extension of a cotton fibre results from untwisting of the convolutions.Timoshenko (1957) gives an expression for the contraction of a thin rectangularstrip on twisting. The converse of this, which was confirmed by Hearle andSparrow (1979a) with tests of a nylon strip heat-set in a twisted form, is thata ribbon of width b and twist j would extend by ec, equal to (j2b2/24), whenfully untwisted. In terms of convolution angle w0, the extension is (tan2
w0)/6. Cotton fibres have varying w0 along their length, unequal lengths ofS and Z twist, some fibres more circular than others, and some fibres in awrapped-ribbon instead of twisted form. The ideal expression is replaced byec equals (X tan2 w0), where X takes account of the anomalies. Although there
(a) (b) (c)
5 mm 5 mm 5 mm
2.14 (a) Twist break of raw cotton. (b) Twist break of mercerisedcotton. (c) Axial splitting due to tensile fatigue. From Hearle et al.(1998).

Cotton: Science and technology54
is considerable scatter in extensions, values of X between 0.5 and 1 giveagreement with experiment.
The role of convolutions is supported by two observations (Hearle andSparrow, 1979a). First, when a cotton fibre was extended in a scanningelectron microscope, the convolutions are gradually removed. The ribbonwas partially untwisted at 3.8% extension and fully untwisted at 6.8%;break was at 7.4%. Second, when wet cotton fibres were tensioned at twograms for five minutes and then held while being allowed to dry, opticalmicroscopy showed that the convolutions had been removed; they are set inan extended state, which would be released on wetting. The stress-straincurves of these fibres showed less curvature, with a mean modulus aboutthree times higher. Table 2.4 compares mean properties before and after thetreatment.
The above discussion does not introduce the effect of stress in pulling outconvolutions. When the convolution angle is reduced from w0 to w, the straine is X(tan2 w0 – tan2 w). An approximate energy analysis by Hearle andSparrow (1979b) then gives the following expression for stress f at increasingvalues of extension e:
f = K{[tan w0/(tan2 w0 – e/X)1/2] – 1} 2.5
where K = (g A S/p b2 X) and g is a shape factor, A is area of cross-section,and S is shear modulus. Data on fibre dimensions and torsional propertiesindicate a value for K of 180 MPa, but values can be expected to vary widelyfor different cottons. Plots of stress against deconvolution strain with K =200 and w = 14∞ are markedly concave upwards. The curves become moreconcave with decreasing values of K and increasing values of w.
The second influence on the extensibility of cotton is the basic helicalarrangement of the fibrils. The simplest approximation indicates that thehelix angle reduces the strain in fibrils by cos2 q and the contribution tostress by cos2 q. Stiffness and strength would be proportional to the meanvalue of cos4 q. In cotton, the helix angle changes little from a value of 22∞with distance from the centre of the fibre; this would give a reduction of 0.74compared to a fibre with axially oriented fibrils.
Table 2.4 Properties of three fibre types before and after wetting and drying under
tension. From Sparrow (1973)
Fibre Permanent Break extension % Break load g
type extension % Before After Before After
Deltapine 11.4 11.1 3.6 4.7 6.8
Menoufi 7.0 8.2 4.9 5.7 8.4
Acala 1517 5.8 7.0 3.5 4.6 7.4
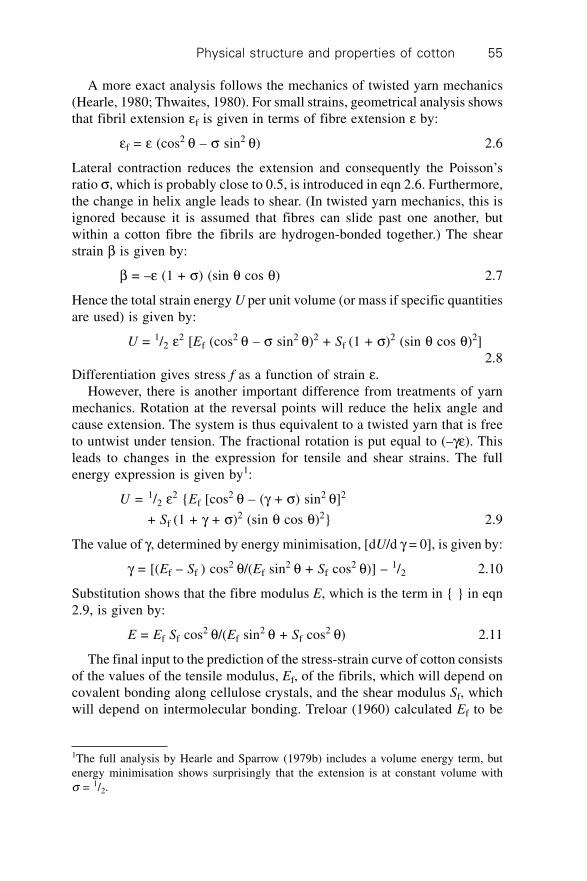
Physical structure and properties of cotton 55
A more exact analysis follows the mechanics of twisted yarn mechanics(Hearle, 1980; Thwaites, 1980). For small strains, geometrical analysis showsthat fibril extension ef is given in terms of fibre extension e by:
ef = e (cos2 q – s sin2 q) 2.6
Lateral contraction reduces the extension and consequently the Poisson’sratio s, which is probably close to 0.5, is introduced in eqn 2.6. Furthermore,the change in helix angle leads to shear. (In twisted yarn mechanics, this isignored because it is assumed that fibres can slide past one another, butwithin a cotton fibre the fibrils are hydrogen-bonded together.) The shearstrain b is given by:
b = –e (1 + s) (sin q cos q) 2.7
Hence the total strain energy U per unit volume (or mass if specific quantitiesare used) is given by:
U = 1/2 e2 [Ef (cos2 q – s sin2 q)2 + Sf (1 + s)2 (sin q cos q)2]2.8
Differentiation gives stress f as a function of strain e.However, there is another important difference from treatments of yarn
mechanics. Rotation at the reversal points will reduce the helix angle andcause extension. The system is thus equivalent to a twisted yarn that is freeto untwist under tension. The fractional rotation is put equal to (–ge). Thisleads to changes in the expression for tensile and shear strains. The fullenergy expression is given by1:
U = 1/2 e2 {Ef [cos2 q – (g + s) sin2 q]2
+ Sf (1 + g + s)2 (sin q cos q)2} 2.9
The value of g, determined by energy minimisation, [dU/d g = 0], is given by:
g = [(Ef – Sf ) cos2 q/(Ef sin2 q + Sf cos2 q)] – 1/2 2.10
Substitution shows that the fibre modulus E, which is the term in { } in eqn2.9, is given by:
E = Ef Sf cos2 q/(Ef sin2 q + Sf cos2 q) 2.11
The final input to the prediction of the stress-strain curve of cotton consistsof the values of the tensile modulus, Ef, of the fibrils, which will depend oncovalent bonding along cellulose crystals, and the shear modulus Sf, whichwill depend on intermolecular bonding. Treloar (1960) calculated Ef to be
1The full analysis by Hearle and Sparrow (1979b) includes a volume energy term, butenergy minimisation shows surprisingly that the extension is at constant volume withs = 1/2.
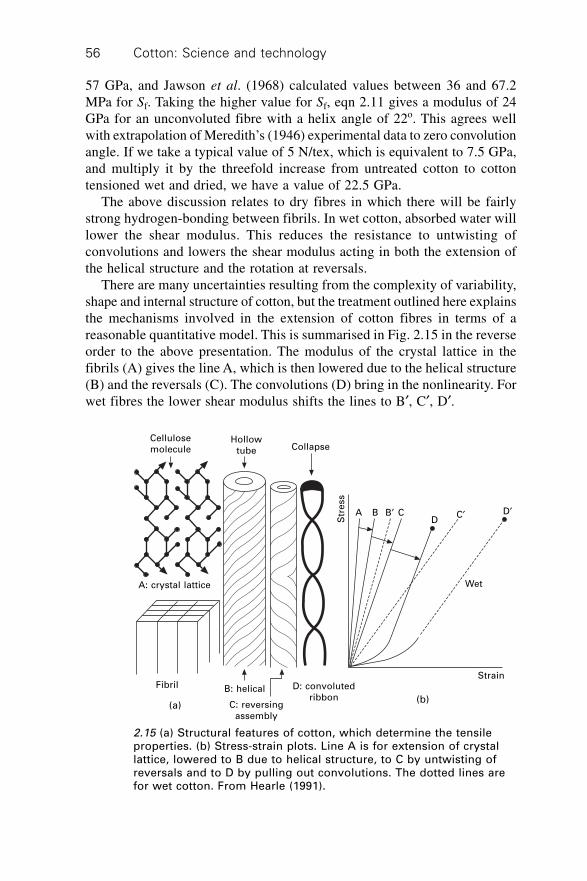
Cotton: Science and technology56
57 GPa, and Jawson et al. (1968) calculated values between 36 and 67.2MPa for Sf. Taking the higher value for Sf, eqn 2.11 gives a modulus of 24GPa for an unconvoluted fibre with a helix angle of 22o. This agrees wellwith extrapolation of Meredith’s (1946) experimental data to zero convolutionangle. If we take a typical value of 5 N/tex, which is equivalent to 7.5 GPa,and multiply it by the threefold increase from untreated cotton to cottontensioned wet and dried, we have a value of 22.5 GPa.
The above discussion relates to dry fibres in which there will be fairlystrong hydrogen-bonding between fibrils. In wet cotton, absorbed water willlower the shear modulus. This reduces the resistance to untwisting ofconvolutions and lowers the shear modulus acting in both the extension ofthe helical structure and the rotation at reversals.
There are many uncertainties resulting from the complexity of variability,shape and internal structure of cotton, but the treatment outlined here explainsthe mechanisms involved in the extension of cotton fibres in terms of areasonable quantitative model. This is summarised in Fig. 2.15 in the reverseorder to the above presentation. The modulus of the crystal lattice in thefibrils (A) gives the line A, which is then lowered due to the helical structure(B) and the reversals (C). The convolutions (D) bring in the nonlinearity. Forwet fibres the lower shear modulus shifts the lines to B¢, C¢, D¢.
Strain
Str
ess
Wet
A B CD
D¢C¢B¢
CollapseHollow
tube
Cellulosemolecule
A: crystal lattice
Fibril D: convolutedribbon
B: helical
C: reversingassembly
2.15 (a) Structural features of cotton, which determine the tensileproperties. (b) Stress-strain plots. Line A is for extension of crystallattice, lowered to B due to helical structure, to C by untwisting ofreversals and to D by pulling out convolutions. The dotted lines arefor wet cotton. From Hearle (1991).
(a)(b)

Physical structure and properties of cotton 57
The increase in strength with increase of moisture content is due to therelease of internal stresses as the hydrogen-bonding is weakened and to theability to pull the structure into a more highly oriented form without generatingstress concentrations. The existence of internal stresses is confirmed byPerel (1990), who found that the apparent crystallite size in the (0,0,1) directionincreased from measurements at 20% rh to those at 90% rh.
2.5 Other physical properties
2.5.1 Electrical properties
For many fibres, static electrification is the electrical property of most concernbut, as shown below, the electrical conductivity of cotton is high enough todissipate the charge rapidly except at extremely low humidities. Static electricityis not a problem for cotton. For moisture-absorbing fibres such as cotton,conductivity is by movement of charged ions. Salts, which are naturallypresent in the fibre, increase their degree of dissociation with increase indielectric constant, thus increasing the number of ions available to transportelectric charges. Hearle (1953d) showed that this led to the following relationbetween electric resistance R and dielectric constant (permittivity) k:
log R = a /k + b 2.12
where a is proportional to the energy of dissociation with k = 1 and inverselyproportional to temperature, and b depends on the concentration and valencyof available ions.
The above relation fits experimental data well except at very high humidities,when dissociation is complete. Interestingly, salts with bivalent ions do notdissociate so easily and consequently replacement by calcium sulphate increasesthe resistance. A more detailed account of experimental and theoretical aspectsof dielectric properties, resistance and static electrification of fibres is givenin Morton and Hearle (1993).
In practice, it is only possible to measure the dielectric properties of anassembly of fibres, which is a mixture with air. Hearle (1954) mademeasurements on cotton yarns wound on a cone. An outer cone was pressedon to give a packing factor of about 45%. Figure 2.16 shows values of thedielectric constant em and power factor cos j of the air-cotton mixture. Atthe lower frequencies, there is a rapid rise in dielectric constant, which isalternatively termed relative permittivity, and power factor with humidity.The changes are not as great at lower frequencies. The dielectric constantdecreases with frequency and this trend continues in other experiments atfrequencies in the megacycle range (Hearle, 1956). Except for some data atlow humidity and low frequency, power factor decreases with increase offrequency. When plotted against moisture content M, dielectric constant
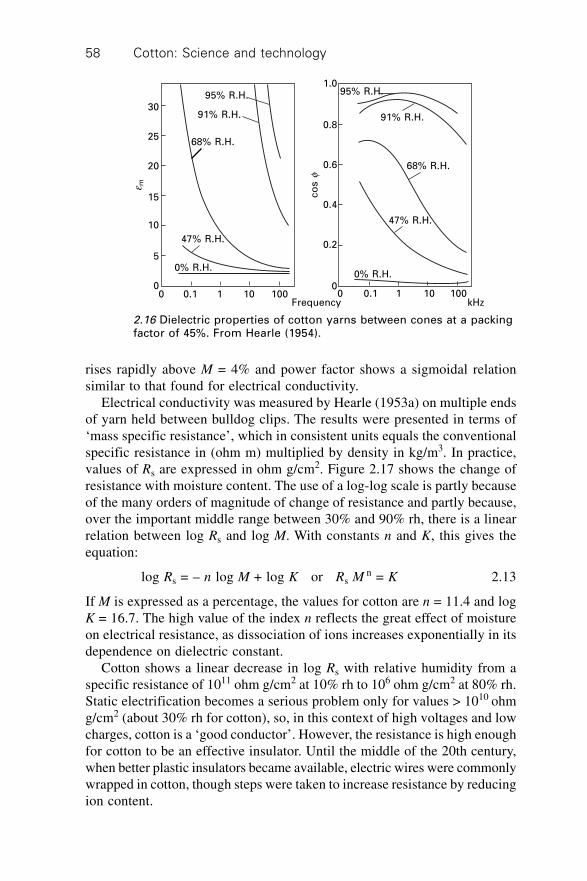
Cotton: Science and technology58
rises rapidly above M = 4% and power factor shows a sigmoidal relationsimilar to that found for electrical conductivity.
Electrical conductivity was measured by Hearle (1953a) on multiple endsof yarn held between bulldog clips. The results were presented in terms of‘mass specific resistance’, which in consistent units equals the conventionalspecific resistance in (ohm m) multiplied by density in kg/m3. In practice,values of Rs are expressed in ohm g/cm2. Figure 2.17 shows the change ofresistance with moisture content. The use of a log-log scale is partly becauseof the many orders of magnitude of change of resistance and partly because,over the important middle range between 30% and 90% rh, there is a linearrelation between log Rs and log M. With constants n and K, this gives theequation:
log Rs = – n log M + log K or Rs Mn = K 2.13
If M is expressed as a percentage, the values for cotton are n = 11.4 and logK = 16.7. The high value of the index n reflects the great effect of moistureon electrical resistance, as dissociation of ions increases exponentially in itsdependence on dielectric constant.
Cotton shows a linear decrease in log Rs with relative humidity from aspecific resistance of 1011 ohm g/cm2 at 10% rh to 106 ohm g/cm2 at 80% rh.Static electrification becomes a serious problem only for values > 1010 ohmg/cm2 (about 30% rh for cotton), so, in this context of high voltages and lowcharges, cotton is a ‘good conductor’. However, the resistance is high enoughfor cotton to be an effective insulator. Until the middle of the 20th century,when better plastic insulators became available, electric wires were commonlywrapped in cotton, though steps were taken to increase resistance by reducingion content.
0 0.1 1 10 100 0 0.1 1 10 100Frequency kHz
e m
co
s f
1.0
0.8
0.6
0.4
0.2
0
95% R.H.
91% R.H.
68% R.H.
47% R.H.
0% R.H.
95% R.H.
91% R.H.
68% R.H.
47% R.H.
0% R.H.
30
25
20
15
10
5
0
2.16 Dielectric properties of cotton yarns between cones at a packingfactor of 45%. From Hearle (1954).
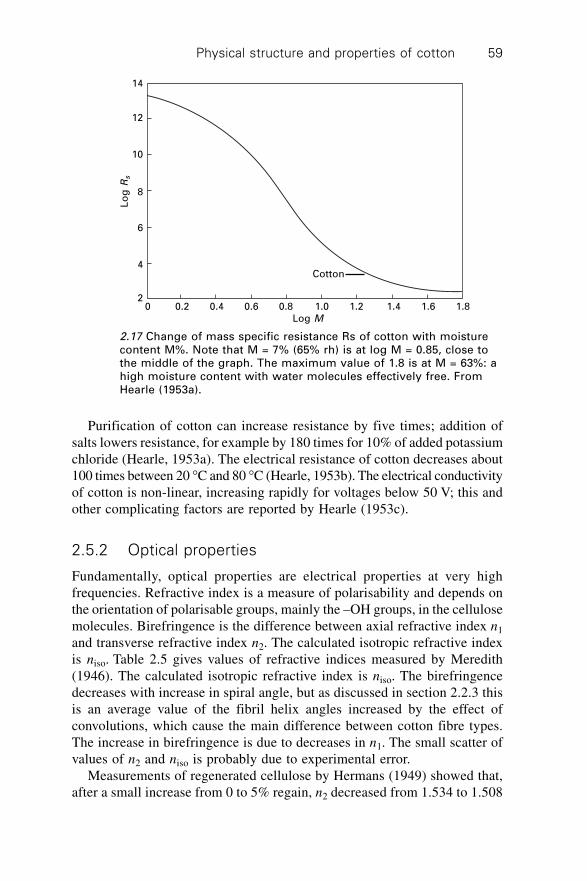
Physical structure and properties of cotton 59
Purification of cotton can increase resistance by five times; addition ofsalts lowers resistance, for example by 180 times for 10% of added potassiumchloride (Hearle, 1953a). The electrical resistance of cotton decreases about100 times between 20 ∞C and 80 ∞C (Hearle, 1953b). The electrical conductivityof cotton is non-linear, increasing rapidly for voltages below 50 V; this andother complicating factors are reported by Hearle (1953c).
2.5.2 Optical properties
Fundamentally, optical properties are electrical properties at very highfrequencies. Refractive index is a measure of polarisability and depends onthe orientation of polarisable groups, mainly the –OH groups, in the cellulosemolecules. Birefringence is the difference between axial refractive index n1
and transverse refractive index n2. The calculated isotropic refractive indexis niso. Table 2.5 gives values of refractive indices measured by Meredith(1946). The calculated isotropic refractive index is niso. The birefringencedecreases with increase in spiral angle, but as discussed in section 2.2.3 thisis an average value of the fibril helix angles increased by the effect ofconvolutions, which cause the main difference between cotton fibre types.The increase in birefringence is due to decreases in n1. The small scatter ofvalues of n2 and niso is probably due to experimental error.
Measurements of regenerated cellulose by Hermans (1949) showed that,after a small increase from 0 to 5% regain, n2 decreased from 1.534 to 1.508
2.17 Change of mass specific resistance Rs of cotton with moisturecontent M%. Note that M = 7% (65% rh) is at log M = 0.85, close tothe middle of the graph. The maximum value of 1.8 is at M = 63%: ahigh moisture content with water molecules effectively free. FromHearle (1953a).
Cotton
0 0.2 0.4 0.6 0.8 1.0 1.2 1.4 1.6 1.8Log M
14
12
10
8
6
4
2
Lo
g R
s

Cotton: Science and technology60
at 20% regain with little change in birefringence. A similar reduction in n2
with increased moisture absorption would be expected in cotton, but thebirefringence will be affected by the change in helical structure and convolutionsdue to swelling.
The lustre of cotton fibres is strongly influenced by their ellipticity, a/b
where a and b represent equatorial and polar fibre x-section radii respectivelyAdderley (1924) examined ten cotton types and found that the lustre inarbitrary units ranged from 5.7 for an American cotton with a /b = 3.07 to10.7 for a Sea Island cotton with a/b = 1.91. The correlation was not perfectfor intermediate values and this may be due to differences in convolutions.A rounder mercerised cotton with a/b = 1.47 gave a lustre of 13.9.
2.5.3 Thermal properties
Values for various thermal properties of cotton are reported in the literature.The specific heat of dry cotton is 1.21 J g–1 K–1 (Magee et al., 1947).However, as discussed in section 2.3.2, the effective specific heat of cottonwill be dominated by the heat of absorption as the moisture content changeswith temperature. The thermal conductivity of a pad of cotton with a bulkdensity of 0.5 g/cm3, i.e., a packing factor of 1/3, is 71 mW m–1 K–1 (Rees,1946), which is 2.8 times that of still air. The coefficient of expansion ofcotton is 4 ¥ 10–4 K–1 (Morton and Hearle, 1993). Cotton does not melt, butdecomposes by charring with loss of water at about 200 ∞C with increasedburning to carbon dioxide at higher temperatures. Illingworth (1953) reportedthat at 100 ∞C cotton lost 8% of its strength after 20 days and 32% after 80days; at 130 ∞C, the losses were 62% and 90%.
Table 2.5 Refractive indices and birefringence of cotton related to spiral angle
(Meredith, 1946)
Cotton Refractive indices Birefringence Spiral angle
type n1 n2 nisoq
St Vincent 1.581 1.530 1.556 0.052 27∞Giza 1.579 1.530 1.554 0.049 29∞Sakel 1.580 1.532 1.556 0.048 29∞Montserrat 1.578 1.529 1.553 0.049 30∞Punj-Amer 1.577 1.530 1.553 0.047 31∞Uppers 1.576 1.530 1.554 0.046 32∞Uganda 1.576 1.532 1.554 0.044 32∞Memphis 1.575 1.532 1.554 0.044 33∞Texas 1.575 1.532 1.554 0.044 33∞Tanguis 1.575 1.530 1.554 0.044 34∞Brazilian 1.574 1.531 1.552 0.044 34∞Oomras 1.574 1.532 1.552 0.043 34∞Bengals 1.574 1.531 1.551 0.043 34∞

Physical structure and properties of cotton 61
As in all polymers, there are secondary transitions, which may be calledglass-to-rubber transitions, at temperatures below the notional melting-pointwhen thermal vibrations would disrupt the crystals if decomposition had notintervened. Increase of temperature causes a drop in elastic modulus and apeak in the dissipation factor tan d. For dry cotton, Meredith (1969) foundthat tan d in dynamic bending tests on mercerised cotton was a minimum atabout 40 ∞C. Tan d was increasing towards one peak at less than –50 ∞C,which would be due to the loss of rotational and flexural mobility in somecovalent bonds, most likely the oxygen bridges, in amorphous regions ofmercerised cotton. The effect may not be present in more perfectly crystalline,unmercerised cotton. Going to higher temperatures, there is a small shoulderat about 125 ∞C and continuing rise to what would be a peak above 170 ∞C.This change is ascribed to increased mobility at hydrogen bonds. A similareffect was found by van der Meer (1970, 1974) for viscose rayon, who alsoobserved that the peak fell below 0 ∞C when the fibre was wet. Increasedmobility and a low transition temperature would also be expected in wetcotton. The change from above to below the transition temperature whencotton dries is a cause of creasing and wrinkling after laundering.
2.5.4 Friction
The frictional properties of fibres are determined by the state of the fibresurface. In raw cotton there are natural waxes on the surface that may beremoved by washing and bleaching. Other finishes may be added to improveprocessing or to enhance performance in use. Furthermore, the simple lawsof friction are not obeyed; the coefficient of friction varies with normal load,form and area of contact, and speed and direction of rubbing. Reportedvalues of coefficient of friction thus vary widely. Table 2.6 gives typicalvalues for the coefficient of friction m of cotton.
Buckle and Pollitt (1948) measured friction for a coarse grey (unbleached)cotton yarn over stainless steel of radius 0.75 in (19 mm) at standard conditionsof 79 yd/min (72 m/min), 25 g initial tension, 70 ∞F (21 ∞C) and 65% rh.
Table 2.6 Values for coefficient of friction m of cotton
System m Reference
Cotton on cottonCrossed fibres 0.29, 0.57 Mercer and Makinson (1947)
Parallel fibres 0.22 Morton and Hearle (1993)
Cotton passing over guidesHard steel 0.29 Buckle and Pollitt (1948)
Porcelain 0.32 Buckle and Pollitt (1948)
Fibre pulley 0.23 Buckle and Pollitt (1948)
Ceramic 0.24 Buckle and Pollitt (1948)
Cotton: Science and technology62
Increasing speed increased the coefficient of friction from 0.159 at 1.9 yd/min (1.7 m/min) to 0.279 at 120 yd/min (110 m/min). On a finer cotton yarnat 67 yd/min (61 m/min), the coefficient of friction fell from 0.30 at 25 ginitial tension to 0.245 at 250 g.
Morrow (1931) found that the coefficient of friction of cotton on steelincreases from 0.24 at 0% regain to 0.36 at 11% regain. This can be explainedby the increased softening of the fibre, which leads to more intimatecontact. Theory indicates that frictional force is proportional to shear strength¥ area of contact. If contact results from plastic yielding this leads toproportionality to (normal load)n, where n is between 0.5 and 0.75 dependingon the contact geometry. El Mogahzy and Broughton (1993) describeexperimental and theoretical studies of the effect of number of contactsin fibre/fibre and fibre/metal contacts. In general, one can say that thecoefficient of friction of cotton is highly dependent on the state of the fibreand the test conditions.
2.6 Sources of further information
The great period for the study of cotton structure and properties startedaround 1920 with the formation of the British Cotton Industry ResearchAssociation, which grew to several hundred staff. Later the Textile ResearchInstitute was founded in the USA and the United States Department ofAgriculture did a great deal of work on cotton in their New Orleans laboratory.Other laboratories in Europe and India were also active. The National CottonCouncil in USA and the International Institute for Cotton in Europe supportedresearch. This period of major research activity ended by about 1980.
Consequently, the major source of information on physical structure andproperties of cotton is found in research papers from this early period,particularly those in the Journal of The Textile Institute and the Textile Research
Journal. Books from the same period are another source of information,notably Matthews’ Textile Fibers (Mauersberger, 1954), Meredith’s (1956)The Mechanical Properties of Textile Fibres and the chapter by Bailey et al.(1963) in Fibre Structure. More specialised books are Moisture in Textiles
(Hearle and Peters, 1960) and Friction in Textiles (Howell et al., 1959).More general aspects of physical structure and properties are covered inPhysical Properties of Textile Fibres (Morton and Hearle, 1993). The reviewby Warwicker et al. (1966), of which about a quarter is directly relevant tothis chapter, contains 1484 references.
Finally, one should mention a pioneer in the field, the botanist, W. L.Balls who, after working on cotton growing in Egypt, became research directorof a UK spinning company; his Studies of Quality in Cotton (1928) stillprovides valuable insights and information.
Physical structure and properties of cotton 63
2.7 Future trends
The physical structure and properties of cotton have been thoroughly researched.Experimental studies will continue to characterise the properties of particularcottons depending on their type and growth location and conditions. Themajor new feature is the advent of genetic engineering. To date, this has beenused to improve yields and resistance to pests. It has not been used, so far asI know, to modify fibre properties – and conventional breeding has beenlimited to the more obvious characteristics of length, fineness, colour andstrength.
Genetic engineering gives the opportunity to design cottons withproperties optimised for particular markets, including new features withspecial market opportunities. However, if molecular biologists are not tointroduce genes at random, it will be necessary to develop a thoroughunderstanding of the sequence: genes Æ growth of fibre Æ fibre structure Æfibre properties Æ performance in processing and use. In the context of thischapter, the need is to convert the generic analysis described in section 2.4.6into a model that can input the structural differences between differentcottons. The model would be validated by measurements on current cottonsand then used to explore new variants. The model would also need to bedeveloped to include other properties that influence performance, particularlybending and twisting of fibres. The effects of moisture absorption andchemical treatments on structure and properties would also have to be covered.This is a challenging research opportunity, but should be possible with currentcomputer power.
2.8 References
Adderley A (1924), ‘The physical causes of the luster in cotton’, J Textile Inst, 15, T195–206.
Ashpole D K (1952), ‘The moisture relations of textile fibres at high humidity’, Proc Roy
Soc, A212, 112–123.Bailey T L W, Tripp V M and Moore A T (1963), Cotton and other vegetable fibres, in
Hearle J W S and Peters R H, Fibre structure, Manchester, The Textile Institute, 422–454.
Balls W L (1928), Studies of quality in cotton, London, Macmillan.Barkas W W (1949), The swelling of wood under stress, London, HMSO.Bohringer H and Schieber W (1948), cited by Schiefer H F, Fourt L and Kropf R, ‘Textile
testing in Germany. Part II. Serviceability evaluation of textiles’, Textile Res J, 18,18–38.
Boylston E K and Hebert J J (1995), ‘The primary wall of cotton fibres’, Textile Res J, 65,429–431.
Brown H M (1954), ‘Correlation of yarn strength with fiber strength measured at differentgauge lengths’, Textile Res J, 24, 251–260.
Buckle H and Pollitt J (1948), ‘An instrument for measuring the coefficient of friction ofyarns against other materials’, J Textile Inst, 39, T199–210.
Cotton: Science and technology64
Chauhan R S, Shah N M and Dweltz N E (1980). ‘The flexural bending fatigue of singlecotton fibres’, J Textile Inst, 71, 18–29.
Collins G E (1924), ‘The stress-strain relations of cotton hairs’, J Textile Inst, 15, T519–528.
Dent R W and Hearle J W S (1960), ‘The tensile properties of twisted single fibres’,Textile Res J, 30, 805–826.
Denton M J and Daniels P N (2002), Textile terms and definitions, 11th edition, Manchester,The Textile Institute.
Du Pont (1958), Technical Bulletin X-82, Wilmington, Delaware, E I du Pont de Nemours& Co Inc.
El Mogahzy Y E and Broughton R M (1993), ‘A new approach for evaluating the frictionalbehaviour of cotton fibers’, Textile Res J, 63, 465–475.
Finlayson D (1947), ‘The shear strength of fibres and filaments’, J Textile Inst, 38, T50–53.
Foulk J A and McAlister D D (2002), ‘Single cotton fibre properties of low, ideal andhigh micronaire values’, Textile Res J, 72, 885–891.
French A D (1985) ‘Physical and theoretical methods for determining the supramolecularstructure of cellulose’, in Nevell T P and Zeronian S H, Cellulose chemistry and its
applications, Chichester, Ellis Horwood Ltd.Goynes W R, Ingber B F and Triplett B A (1995), ‘Cotton fibre secondary wall development
– time versus thickness’, Textile Res J, 65, 400–408.Guthrie J C (1949) ‘The integral and differential heats of sorption of water by cellulose’,
J Textile Inst, 40, T489–504.Hailwood A J and Horrobin S (1946), ‘Absorption of water by polymers: analysis in
terms of a simple model’, Trans Faraday Soc, 42B, 84–102.Hearle J W S (1953a), ‘The electrical resistance of textile materials. Part I. The influence
of moisture content’, J Textile Inst, 44, T117–143.Hearle J W S (1953b), ‘The electrical resistance of textile materials. Part II. The effect of
temperature’, J Textile Inst, 44, T144–154.Hearle J W S (1953c), ‘The electrical resistance of textile materials. Part III. Miscellaneous
effects’, J Textile Inst, 44, T155–176.Hearle J W S (1953d), ‘The electrical resistance of textile materials. Part IV. Theory’, J
Textile Inst, 44, T177–198.Hearle J W S (1954), ‘Capacity, dielectric constant and power factor of fiber assemblies’,
Textile Res J, 24, 307–321.Hearle J W S (1956), ‘The dielectric properties of fiber assemblies’, Textile Res J, 26,
108–111.Hearle J W S (1957), Thermodynamic relations among stresses, deformation and moisture
absorption, Textile Res J, 27, 940–945.Hearle J W S (1980), ‘The mechanics of dense fibre assemblies’, in Hearle J W S,
Thwaites J J and Amirbayat J, editors, Mechanics of flexible fibre assemblies, Alphenaan den Rijn, Sijthoff & Noordhoff, 51–86.
Hearle J W S (1991), ‘Understanding and control of textile fibre structure’, J Appl
Polymer Science: Appl Polymer Symp, 47, 1–31.Hearle J W S and Peters R H (1960), editors, Moisture in textiles, Manchester, the Textile
Institute.Hearle J W S and Sparrow J T (1971), ‘The fractography of cotton’, Textile Res J, 41,
736–749.

Physical structure and properties of cotton 65
Hearle J W S and Sparrow J T (1979a), ‘Mechanics of the extension of cotton fibres. I.Experimental studies of the effect of convolutions’, J Appl Polymer Sci, 24, 1465–1477.
Hearle J W S and Sparrow J T (1979b), ‘Mechanics of the extension of cotton fibres. II.Theoretical modelling’, J Appl Polymer Sci, 24, 1857–1874.
Hearle J W S and Sparrow J T (1979c), ‘Tensile fatigue of cotton fibers’, Textile Res J,49, 242–243.
Hearle J W S and Sparrow J T (1979d), ‘Further studies of the fractography of cotton’,Textile Res J, 49, 268–282.
Hearle J W S, Lomas B and Cooke W D (1998), Atlas of fibre fracture and damage to
textiles, Cambridge, Woodhead Publishing.Hebert J J (1993), ‘Strength of the primary wall of cotton’, Textile Res J, 63, 695.Hebert J J, Geardina R, Mitcham D and Rollins M L (1970), ‘The effect of convolutions
in orientation measurement of cotton fibres’, Textile Res J, 40, 126–129.Henry P S H (1939), ‘Cotton bales: uptake of water’, Proc Roy Soc, A171, 215–241.Hermans P H (1949), Physics and chemistry of cellulose fibres, Amsterdam, Elsevier,
pages 214 et seq.Howell H G, Miezkis K W and Tabor D (1959), Friction in textiles, Manchester, The
Textile Institute.Hsieh Y-L and Wang A (2000), ‘Single fiber strength variations of developing cotton
fibers: among ovule locations and along the fiber length’, Textile Res J, 70, 495–501.Hsieh Y-L, Honik E and Hartzell M M (1995), ‘A developmental study of single fiber
strength: greenhouse grown SJ-2 Acala cotton’, Textile Res J, 65, 101–112.Hsieh Y-L, Hu X-P and Nguyen A (1997), ‘Strength and crystalline structure of developing
Acala cotton’, Textile Res J, 67, 529–536.Hsieh Y-L, Hu X-P and Wang A (2000), ‘Single fiber strength variations of developing
cotton fibers – strength and structure of G. hirsutum and G. barbadense’, Textile Res
J, 70, 682–690.Hu X-P and Hsieh Y-L (1998), ‘Distributions of single-fiber toughness’, J Textile Inst, 39,
Part 1, 457–467.Hu X-P and Hsieh Y-L (2001), ‘Effects of dehydration on the crystalline structure and
strength of developing cotton fibres’, Textile Res J, 71, 231–239.Ibbett R N and Hsieh Y-L (2001), ‘Effect of swelling on the structure of Lyocell fabrics’,
Textile Res J, 71, 164–173.Illingworth J W (1953), ‘Yarns and fabrics in the rubber industry’, J Textile Inst, 44,
P328–346.Jawson M A, Giles P P and Mark R E (1968), ‘The elastic constants of crystalline native
cellulose’, Proc Roy Soc, A306, 389–412.Jeffries R, Jones D M, Roberts J G, Selby K, Simmens S C and Warwicker J O (1969),
‘Current ideas on the structure of cotton’, Cellulose Chem Technol, 3, 255–274.Kassenbeck P (1970), ‘Bilateral structure of cotton fibers as revealed by enzymatic
degradation’, Textile Res J, 40, 330–354.Koch P-A (1949), ‘Textile fibres: angle of twist to rupture’, Textil-Rundschau, 4, 199–
211.Liu J, Yang H and Hsieh Y-L (2001), ‘Variations of mature cotton fiber tensile properties:
association with seed position and fibre length’, Textile Res J, 71, 1079–1086.Liu J, Yang H and Hsieh Y-L (2005), ‘Distribution of single fibre tensile properties of
four cotton genotypes’, Textile Res J, 75, 117–122.Magee F C, Portas H J and Wakeham H (1947), ‘Moisture in textile fibres: calorimetric
investigations’, J Amer Chem Soc, 69, 1896–1902.

Cotton: Science and technology66
Mauersberger H R editor (1954), Matthews’ Textile Fibers, 6th edition, New York, JohnWiley.
Maxwell J M, Gordon S G and Huson M G (2003), ‘Internal structure of mature andimmature cotton fibers revealed by scanning probe microscopy’, Textile Res J, 73,1005–1012.
Mercer E H and Makinson K R (1947), ‘The frictional properties of wool and othertextile fibres’, J Textile Inst, 38, T227–240.
Meredith R (1945a), ‘The tensile behaviour of raw cotton and other textile fibres’, J
Textile Inst, 36, T107–130.Meredith R (1945b), ‘A comparison of the tensile elasticity of some textile fibres’, J
Textile Inst, 36, T147–164.Meredith R (1946), ‘Molecular orientation and the tensile properties of cotton fibres’, J
Textile Inst, 37, T205–218.Meredith R (1951), ‘Cotton fibre tensile strength and X-ray orientation’, J Textile Inst,
42, T291–299.Meredith R (1953), ‘Properties depending on the amorphous regions of fibres’, in Preston
J M, editor, Fibre Science, 2nd edition, The Textile Institute, Manchester, 236–262.Meredith R (1954), ‘Relaxation of stress in stretched cellulose fibres’, J Textile Inst, 45,
T438–461.Meredith R editor (1956), The Mechanical Properties of Textile Fibres, Amsterdam,
North-Holland Publishing Company.Meredith R (1969), ‘Dynamic mechanical properties of textile fibres’ Proc Fifth Int
Congress in Rheology, Tokyo, University of Tokyo Press, Vol 1, 43–60.Meyer K H and Misch L (1937), ‘Cellulose: crystal structure’, Helv Chim Acta, 20, 232–
244.Morlier O W, Orr R S and Grant J N (1951), ‘The relation of length to other physical
properties of cotton fibres’, Textile Res J, 21, 6–13.Morosoff M and Ingram P (1970), ‘The spiral angle of cotton’, Textile Res J, 40, 250–
255.Morrow J A (1931), ‘The frictional properties of cotton materials’, J Textile Inst, 22,
T425–440.Morton W E and Hearle J W S (1993), Physical Properties of Textile Fibres, Manchester,
The Textile Institute.Owen J D (1965) ‘The application of Searle’s single and double pendulum methods to
single fibre rigidity measurements’, J Textile Inst, 56, T329–339.Peirce F T (1929), ‘A two-phase theory of the absorption of water vapour by cellulose’,
J Textile Inst, 20, T133–150.Perel J (1990), ‘An X-ray study of regain-dependent deformation in cotton crystallites’,
J Textile Inst, 81, 241–244.Preston J M and Nimkar M V (1949), ‘Measuring the swelling of fibres in water’, J
Textile Inst, 40, P674–688.Preston J M and Nimkar M V (1952), ‘Capillary phenomena in assemblies of fibres’, J
Textile Inst, 43, T402–422.Price J B, Cui X, Calamari T A and McDaniel R G (2001), ‘Assessing the quality of four
naturally colored cottons’, Textile Res J, 71, 993–999.Rees W H (1946), ‘The protective value of clothing’, J Textile Inst, 37, P132–153.Rouselle M-A (2002), ‘Determining the molecular weight distribution of cotton cellulose:
a new GPC solvent’, Textile Res J, 72, 131–134.Sarko A and Muggli R (1974), ‘Packing analysis of carbohydrates and polysaccharides.
III Valonia cellulose and cellulose II’, Macromolecules, 7, 486–494.

Physical structure and properties of cotton 67
Sparrow J T (1973), The fracture of cotton, PhD thesis, University of Manchester.Steinberger R L (1936), ‘Cotton hair: creep under load; effect of humidity’, Textile Res J,
6, 325–330.Taylor R A (1994), The true strength of HVI bundles. Part B: Stelometer and reference
measurements, ITMF HVI Working Group Meeting, Bremen.Thwaites J J (1980), ‘A continuum model for yarn mechanics’, in Hearle J W S, Thwaites
J J and Amirbayat J, editors, Mechanics of flexible fibre assemblies, Alphen aan denRijn, Sijthoff & Noordhoff, 87–98.
Timoshenko S (1957), Strength of materials, Part II, New York, Van Nostrand, page 259.Timpa J D and Ramey H H (1994), ‘Relationship between cotton fibre strength and
cellulose molecular weight distribution: HVI standards’, Textile Res J, 64, 537–562.Treloar L R G (1953), ‘The absorption of water by cellulose and its dependence on
applied stress’, Trans Faraday Soc, 49, 816–823.Treloar L R G (1960), ‘Calculations of elastic moduli of polymer crystals. III. Cellulose’,
Polymer, 1, 290–303.Urquhart A R and Eckersall N (1930), ‘The moisture relations of cotton. vii – A study of
hysteresis’, J Textile Inst, 21, T499–510.Urquhart A R and Williams A M (1924), ‘The moisture relations of cotton. The taking up
of water by raw and soda-boiled cotton at 20 ∞C’, J Textile Inst, 15, T138–143.van der Meer S J (1970), The dynamic mechanical properties of fibres, Doctoral thesis,
Delft University of Technology.van der Meer S J (1974), ‘The dynamic mechanical properties of yarns in water and the
critical washing temperature of fabrics’, J Textile Inst, 65, 288–292.Warwicker J G, Jeffries R, Colbran R L and Robinson R N (1966), A review of the
literature on the effect of caustic soda and other swelling agents on the fine structure
of cotton, Manchester, The Cotton Silk and Man-Made Fibres Research Association.
68
3.1 Introduction
Measures of cotton fibre quality may be described by any of, or in relationto, the chemical and/or physical properties described in Chapters 1 and 2.The reason for attributing value to cotton is to gain premiums (or discounts)from the market on the basis of that cotton’s suitability for particular end-uses. In fact it can be said that cotton fibre quality is the utility particularcotton achieves in the textile processes involved in its conversion to the finalproduct. Traditionally, the most desirable cotton (Gossypium spp.) is said tobe as white as snow, as strong as steel, as fine as silk and as long as wool.1
As well as this, spinners also demand that the fibre be inexpensive.2 Thischapter discusses the fibre properties defined and valued by the textile industry;how these properties are currently measured, and the limitations of the testmethods applied to measure each property. For the most part the fibre propertiesdiscussed in this chapter are closely linked to the physical and chemicalproperties already discussed in Chapters 1 and 2, however each of theparameters discussed in this chapter has a large effect on yarn and fabricquality and processing efficiency, and as such, are be used routinely incombination with other parameters to predict the expected quality of theyarn or fabric and the efficiency with which it is produced.
Fibre quality properties, e.g. length, strength, fineness and colour havealways been important in determining the value of cotton fibre. These propertiesand others are measured soon after the cotton is ginned to determine themarket value of the cotton, and to reward (or discount) growers for thequality they have grown. Until 50 years ago a sample of cotton taken fromthe ginned bale was classed against physical cotton standards by a humancotton classer. Comparison with physical standards, whether those of theUnited States Department of Agriculture (USDA) Agricultural MarketingService (AMS), to which there are over 20 signatory cotton associationsfrom around the world, or other national country standards, is still thepredominant method for measuring the value of cotton fibre. However, there
3Cotton fibre quality
S G O R D O N, CSIRO Textile and Fibre Technology, Australia

Cotton fibre quality 69
is currently active organization from within the international cotton industryto promote objective test measurement of important fibre parameters.3
The stimulus to determine cotton fibre quality by more accurate and preciseobjective means is not only based on technical considerations of predictingspinning efficiency and product quality from measured fibre properties moreaccurately; it is also based on the cost and risk of using cotton as a naturalraw material. Raw material costs in a spinning mill comprise up to 65% ofmill operating costs. Further, the advocacy for objective testing is also aboutcompetition in the world short-staple fibre market and keeping cottoncompetitive with synthetic fibres such as polyester, which are less variablein nature and more predictable in terms of processing behavior.
For the three short-staple spinning systems used by the cotton textileindustry today, i.e. ring-spinning, rotor (or open-end) spinning and air-jetspinning, the fibre properties listed in Table 3.1 are considered especiallyimportant. In combination, the listed parameters describe fibres that aresufficiently flexible to accommodate the continuous arrangement and bendingof fibers during drafting and consolidation; and which also have optimumsurface adhesion to allow smooth drafting.
3.1.1 Cotton classing
Subjective classing by hand and eye with the help of physical referencestandards has been the predominant method of grading cotton fibre qualitysince cotton trading began. Establishment of formal cotton classificationstandards occurred in the United States after the 1907 International CottonCongress at a time when the commercial trade of raw cotton and fabricsmade from cotton yarns reached significant volumes.4 Even at the time itwas recognized that cotton destined for the manufacture of textiles for householdand clothing products, demanded the development of measurements forpredicting yarn and fabric attributes. The first cotton classification standardsfor fibre colour and length grades were established in 1909 by the USDA.The standards for colour were, at first, based on physical samples that exhibiteda range of colour. Cotton fibre length was judged by a human cotton classerusing a manual technique that involved pulling fibres away from small bundlesinto a spread of fibres from which the fibre length, or staple length as it isstill known, could be determined.
Table 3.1 Major fibre parameters of importance in short-staple spinning systems
Importance rank Ring Rotor (open-end) Air-jet (inc. MVS)
1 Length Strength Length
2 Strength Fineness Trash
3 Fineness Length Fineness
4 Trash Strength

Cotton: Science and technology70
A Universal Cotton Standards Agreement was established in 1923 betweenthe USDA and 23 other cotton associations from 21 countries.4 Since thistime other cotton nations have developed their own official cotton standardsand descriptions, e.g. the Tanzanian Cotton Board (TCB) has developedphysical standards based on colour, trash and preparation, good preparationof which is essentially the smooth appearance of the fibre after combing inthe lint cleaning process. The USDA Universal Cotton Standards now coverstrength, length, uniformity index, micronaire, colour grade, and proceduresused to achieve agreement.
3.1.2 Development of instrument test methods
Anderson5 defined three distinct phases in the development of fibremeasurement methods; the first being subjectively based hand and eyeperceptions, the second phase from 1920 to 1948, which utilized direct,more objective tests, e.g. microscopes, scales and comb sorters, and the thirdphase from 1950 to 1970, which arose from industry demand for quickerobjective test methods. The high volume instrument (HVI) lines used today(Fig. 3.1) evolved during this period as textile mills installed high-speedmanufacturing equipment that places additional stresses on the raw fibres.These instrument-based methods, which except for strength measurementsmade using a strain gauge, measured fibre properties indirectly via lightmeters, air-flow meters, pressure gauges and capacitors.
The second and third phases defined by Anderson5 are actually less distinctas the Fibrograph and Micronaire, two instruments still used today to assessfibre quality, were developed during the 1940s. After 1980, increases incomputing power and the development of digital sensors and robotic systemsenabled a cotton sample to be measured for multiple properties in less thana minute. Today, one HVI line measures 825 samples for length, lengthuniformity, short fibre content (SFC), strength, extension, micronaire andcolour in a seven-hour, 20-minute shift.6 Since 1980 there has also been thedevelopment of test instruments to measure other important fibre propertiessuch as stickiness, fineness and maturity, and the distribution of fibre propertiessuch as length and trash.
3.2 Length properties
Cotton fibre length is probably the most significant fibre property because itdirectly affects irregularity of fibre assemblies and longer lengths contributeto the tenacity of yarn via increased frictional forces with adjacent fibres.The presence of short fibre in cotton causes appreciable increases in processingwastes, excessively uneven fibre assemblies, less efficient spinning, andweaker yarns. Cotton is the shortest commercial textile fibre and as such a
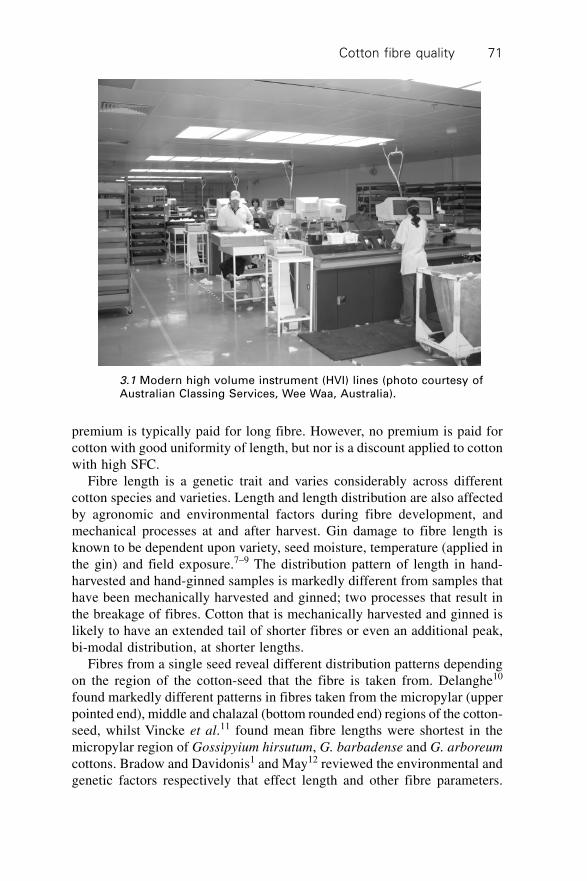
Cotton fibre quality 71
premium is typically paid for long fibre. However, no premium is paid forcotton with good uniformity of length, but nor is a discount applied to cottonwith high SFC.
Fibre length is a genetic trait and varies considerably across differentcotton species and varieties. Length and length distribution are also affectedby agronomic and environmental factors during fibre development, andmechanical processes at and after harvest. Gin damage to fibre length isknown to be dependent upon variety, seed moisture, temperature (applied inthe gin) and field exposure.7–9 The distribution pattern of length in hand-harvested and hand-ginned samples is markedly different from samples thathave been mechanically harvested and ginned; two processes that result inthe breakage of fibres. Cotton that is mechanically harvested and ginned islikely to have an extended tail of shorter fibres or even an additional peak,bi-modal distribution, at shorter lengths.
Fibres from a single seed reveal different distribution patterns dependingon the region of the cotton-seed that the fibre is taken from. Delanghe10
found markedly different patterns in fibres taken from the micropylar (upperpointed end), middle and chalazal (bottom rounded end) regions of the cotton-seed, whilst Vincke et al.11 found mean fibre lengths were shortest in themicropylar region of Gossipyium hirsutum, G. barbadense and G. arboreum
cottons. Bradow and Davidonis1 and May12 reviewed the environmental andgenetic factors respectively that effect length and other fibre parameters.
3.1 Modern high volume instrument (HVI) lines (photo courtesy ofAustralian Classing Services, Wee Waa, Australia).

Cotton: Science and technology72
The selected studies they reviewed showed length to be affected bytemperature,13–16 water supply17,18 and light.19 Selective plant breeding hasresulted in increases in ‘staple’ length20 (Fig. 3.2).
Upland cotton varieties (G. hirsutum), which represent 90% of the world’scotton production have staple lengths typically ranging from 1 (25.4 mm) to11/8 inches (28.6 mm). Fibre lengths of Upland cotton have increased overthe last 20 to 30 years with new Upland varieties extending this range currentlyto 11/4 inches (32 mm). Pima-type cotton (G. barbadense), which includes‘Sea Island’ and ‘Egyptian’ long staple (LS) and extra-long staple (ELS)type cotton and represents around 8% of the world’s production, are longerand finer than Upland cotton. The staple length of G. barbadense cottonstypically ranges from 11/4 (32 mm) to 2 inches (50.8 mm). Fibre from othercotton plant species such as G. Arboreum and G. Herbaceum is produced insmall quantities (< 2%), and typically have very short, coarse fibre withstaple lengths ranging only to 1 inch (25.4 mm).
3.2.1 Measuring fibre length
Fibre length is defined usually as the upper-half mean length (UHML) or 2.5%span length (2.5%SL) from a Fibrogram beard. Both measures coincide in aroundabout way with the classer’s staple. Historically, fibre length is measuredin inches (in 1/32-inch divisions) although conversion into millimetres is nowcommon. There are various methods of measuring fibre length. Length canbe measured simply by aligning the end length of a fibre against a ruler andnoting its length. However, this approach is tedious and cotton fibres in anysample vary considerably in their length such that measuring a representativesample in this way is impractical. In the past cotton classers were trained toevaluate ‘staple’ length by measuring the length of a paralleled bunch of fibres
1.25
1.2
1.15
1.1
1.05
1
HV
I le
ng
th (
inch
es)
1974 1978 1982 1986 1990 1994 1998 2002 2006
3.2 Improvement in Upland HVI staple length (UHML) [20].

Cotton fibre quality 73
against one of their digits. The Textile Institute definition of staple lengthnoted that ‘the staple length corresponds very closely to the modal or mostfrequent length of the fibres when measured in a straightened condition’.21
Accurate determination of fibre length can be achieved using fibre arraysor staple diagrams (Fig. 3.3) produced using a comb-sorter apparatus. Thediagrams can be used to define upper staple lengths such as the upper-quartile length (UQL), which is the length of the shortest fibre in the upperquarter of the length distribution by weight, and other length parameterssuch as mean length, ‘effective’ length and SFC.22,23 Comb-sorter apparatususes a series of hinged combs separated at 1/8-inch intervals, to align, separateand allow the withdrawal and description of weight-length or number-lengthgroups from a sample.
Whilst comb-sorter methods are accurate they are unacceptably expensivein terms of operator cost, too slow and too imprecise for routine testing forcommercial trading purposes. To this end the Fibrograph Tester instrumentwas developed in the early 1940s by Hertel.24 Initially used as a stand-aloneinstrument it was later incorporated into HVI lines. Test specimens are fibrebeards prepared either manually for stand-alone and older HVI instruments,or automatically from a bale sample by newer HVI units. The fibre beard isheld in a comb that is inserted into the instrument and scanned by a lightsource. The variation in density (light intensity) of the different lengths offibre is recorded and reproduced in the form of a length-frequency curvecalled a Fibrogram (Fig. 3.4). Interpretation of the Fibrogram takes intoaccount the comb gauge length, i.e., the depth of the comb at which fibresare held (0.25 inch).
Two different kinds of fibre length measurement can be generated from aFibrogram; mean lengths and span lengths. Mean lengths, e.g. UHML, whichis the mean length by numbers of the longer half (50%) of the fibre byweight,25 and the mean length (ML) are more commonly used since they
3.3 Comb-sorter staple array of ginned cotton (CSIRO Textile andFibre Technology, Belmont, Australia).
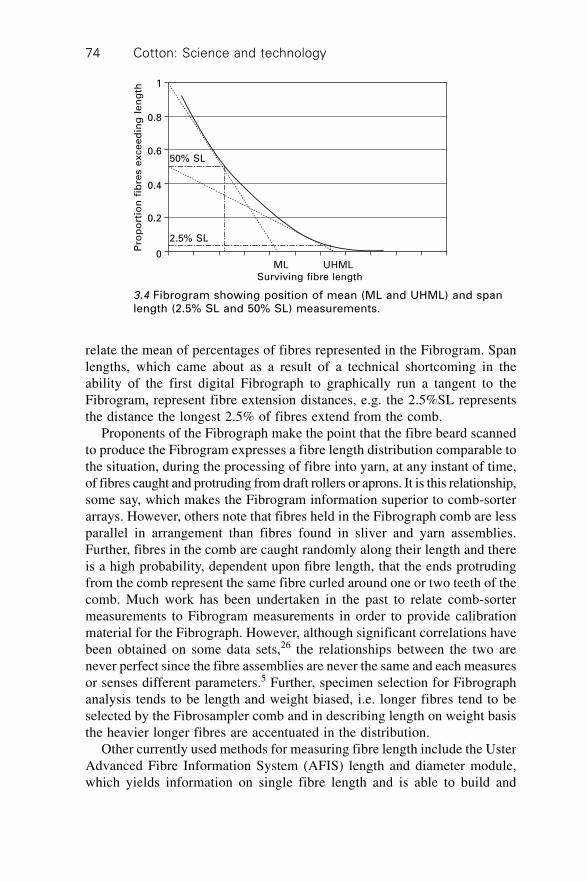
Cotton: Science and technology74
relate the mean of percentages of fibres represented in the Fibrogram. Spanlengths, which came about as a result of a technical shortcoming in theability of the first digital Fibrograph to graphically run a tangent to theFibrogram, represent fibre extension distances, e.g. the 2.5%SL representsthe distance the longest 2.5% of fibres extend from the comb.
Proponents of the Fibrograph make the point that the fibre beard scannedto produce the Fibrogram expresses a fibre length distribution comparable tothe situation, during the processing of fibre into yarn, at any instant of time,of fibres caught and protruding from draft rollers or aprons. It is this relationship,some say, which makes the Fibrogram information superior to comb-sorterarrays. However, others note that fibres held in the Fibrograph comb are lessparallel in arrangement than fibres found in sliver and yarn assemblies.Further, fibres in the comb are caught randomly along their length and thereis a high probability, dependent upon fibre length, that the ends protrudingfrom the comb represent the same fibre curled around one or two teeth of thecomb. Much work has been undertaken in the past to relate comb-sortermeasurements to Fibrogram measurements in order to provide calibrationmaterial for the Fibrograph. However, although significant correlations havebeen obtained on some data sets,26 the relationships between the two arenever perfect since the fibre assemblies are never the same and each measuresor senses different parameters.5 Further, specimen selection for Fibrographanalysis tends to be length and weight biased, i.e. longer fibres tend to beselected by the Fibrosampler comb and in describing length on weight basisthe heavier longer fibres are accentuated in the distribution.
Other currently used methods for measuring fibre length include the UsterAdvanced Fibre Information System (AFIS) length and diameter module,which yields information on single fibre length and is able to build and
ML UHMLSurviving fibre length
50% SL
2.5% SL
1
0.8
0.6
0.4
0.2
0
Pro
po
rtio
n f
ibre
s e
xce
ed
ing
le
ng
th
3.4 Fibrogram showing position of mean (ML and UHML) and spanlength (2.5% SL and 50% SL) measurements.
Cotton fibre quality 75
report length by number and by weight distributions. The AFIS is also calibratedto measure fineness and maturity, neps and trash and dust. Measurement isbased on detecting the amount of light that is scattered and occluded by afibre or particle as it is transported by air through a beam of near-infra-redlight. When the fibre or particle impinges on the beam the electro-opticalsensor records two signals, i.e. scattered and occluded light. A computerprogram analyzes the signals and presents mean and distribution data on theparticular parameter. The AFIS takes a 0.5 gram sample of fibre hand-drawninto a 25 cm sliver. Test time is around three minutes including samplepreparation, which limits the test to laboratory analyses rather than commercialtesting. Further, results are influenced by operator technique in preparingsamples.
Cotton length measurements using the Peyer Almeter AL-101 system areless frequently reported. This instrument, a version of which is widely usedto test wool fibre length, is less common in cotton testing because of speedand sample preparation issues. The measurement is based on a scanninglight measurement like the Fibrograph but is able to return a staple diagramby number on the basis that the fibre ends of the sample are aligned duringthe test. Using an estimate of the sample weight allows the AL-101 to calculatelength characteristics according to three length distribution types; unbiaseddistributions by number, weight-biased and a length-weight span lengthdistribution.27 The Premier aQura is a new cotton test instrument that automatessample preparation and measures length from an end aligned sample in thesame way as the AL-101.
3.2.2 Length uniformity
Length uniformity is generally defined as either the uniformity index27 (UNI),which is the ratio between the ML and the UHML expressed as a percentage,or the uniformity ratio (UNR), which is the ratio generally between the2.5%SL and the 50%SL.28 Table 3.2 lists the descriptive designations givento HVI generated values of uniformity index by the USDA AMS.29 Inter-laboratory coefficients of variation (CV) for UNI are good; across a range ofdifferent cottons tested as part of the Bremen Round Trials between 2003and 2005, inter-lab CVs ranged between 0.67% and 1.09%.30
3.2.3 Short fibre content
The most common definition of short fibre content (SFC) is the proportionby weight of fibre shorter than one half inch (12.7 mm). The value is ofconcern to textile manufacturers because it relates directly to the amount ofwaste extracted in combing and cotton with high values has a detrimentaleffect on the quality of yarn and fabric.31–33 Short fibre content measured by

Cotton: Science and technology76
the HVI is referred to as short fibre index (SFI) and is the most widely usedvalue to describe SFC in a sample, even though short fibres are not actuallymeasured directly by the HVI Fibrograph, nor can the instrument be calibrated.Typical SFI values vary from 4–12% in ginned lint and are much lower inun-ginned lint. Precision is generally poor by comparison with test methodsfor other properties. Inter-laboratory CVs for SFI across a range of differentcottons tested as part of the Bremen Round Trials between 2003 and 2005ranged between 15.8% and 24%.30
Accuracy of the measure of HVI SFI is debatable. Calibration and selectionof appropriate predictors are the main issues. In the past, SFI has beencalculated from Fibrogram data using first-order algorithms that used measuressuch as 2.5%SL and 50%SL and the 2.5%SL and the uniformity index34 asindependent variables. More recently SFI in HVI lines has been predictedusing second-order algorithms containing HVI length and uniformityindex35 (see eqn 3.1). The author notes that because these length measuresare functions of the fibre-length distribution they will work well only forcotton exposed to similar picking and gin practices. Currently, a SFI valuedetermined by an algorithm, which calculates the fibre array curve from theFibrogram, is being tested. From this a weight-based length distributionis derived from which the percentage of short fibres at one-half inch iscalculated. The mathematical basis for the conversion algorithms is describedin reviews by Woo36 and Zeidman and Batra.37 The relationship between SFImeasured this way and SFC measured by the AFIS is reasonable with acorrelation of 0.96 quoted for a series of standard cottons with differentstaple lengths.38
Z = a + bX + cX + dX2 + eY2 + fXY 3.1
whereZ = predicted short fibre index,X = HVI length,Y = Uniformity Index,a = 384.3966, b = –120.3791, c = –6.7003, d = 12.4901, e = 0.02957 andf = 1.0306
Table 3.2 USDA descriptive designation for HVI uniformity
index values
Descriptive designation HVI uniformity index
Very high Above 85
High 83 to 85
Average 80 to 82
Low 77 to 79
Very low Below 77
Cotton fibre quality 77
As well as the issue of repeatability in the SFC measurement, muchdebate is currently centred on the definition of SFC; the view held is that theone-half inch definition is inadequate given that spinning machinery is largelyadjusted to accommodate the proportion of longer fibres, synonymous withthe standard measures of staple length. The argument for changing the one-half inch benchmark is that for a given amount of fibre damage short-staplecotton will show a higher percentage of short fibres than longer staple cotton.One inch staple fibre is not necessarily unfortunate if processing equipment,i.e. draft zones have been set up for this length fibre. Short fibre content istherefore a relative number that should be minimized as a proportion of themeasured long or effective length so that problems associated with uncontrolledfibres can be avoided. Heap39 proposed a measure of relative SFC, definedas the percentage of fibres by weight shorter than one-half of the staplelength (or UHML).
Kearny-Robert et al.40 proposed and illustrated the concept of the brokenfibre content (BFC), which they propose would be a more accurate measureof SFC, since the term allows for separation of inherent SFC from ‘phenotypic’SFC. El-Moghazy and Krifa41 define the length utilization efficiency (LUE)expressed as the ratio between the percentage of fibres longer than an upperthreshold, of nominally one inch, and those shorter than a lower threshold,nominally a half inch, although its value at these thresholds had yet to bedetermined.
3.3 Transverse properties
Cotton fibres are single elongated plant cells and their growth from thecotton seed epidermis is determined largely by the environmental conditions.A mature fibre is defined as one that has achieved an acceptable degree ofcell wall thickening relative to the perimeter of its cross-section. Conversely,an immature cotton fibre is one that has little or no cell wall thickening. Theperimeter by itself, and which is largely genetically determined, defines theintrinsic or biological fineness of a cotton fibre, although cotton fibre finenessis nearly always expressed in terms of linear density, defined as the mass perunit length. Units are usually given in tex (grams per km) or more usually forfibres, millitex (milligrams per km). The average linear density depends onboth perimeter and the degree of wall thickening (maturity). Intrinsicallyfine cottons of small perimeter can give lower values or mass per unit lengththan coarse cottons of large perimeter. For a constant perimeter mature fibreshave a higher degree of wall thickening.
Both properties are regarded as important; both define the number offibres required in a yarn cross-section, a number which has significant effectson yarn quality and processing efficiency. Both also have significant effectson fibre lustre and degree of dye uptake. Immature fibres are associated with
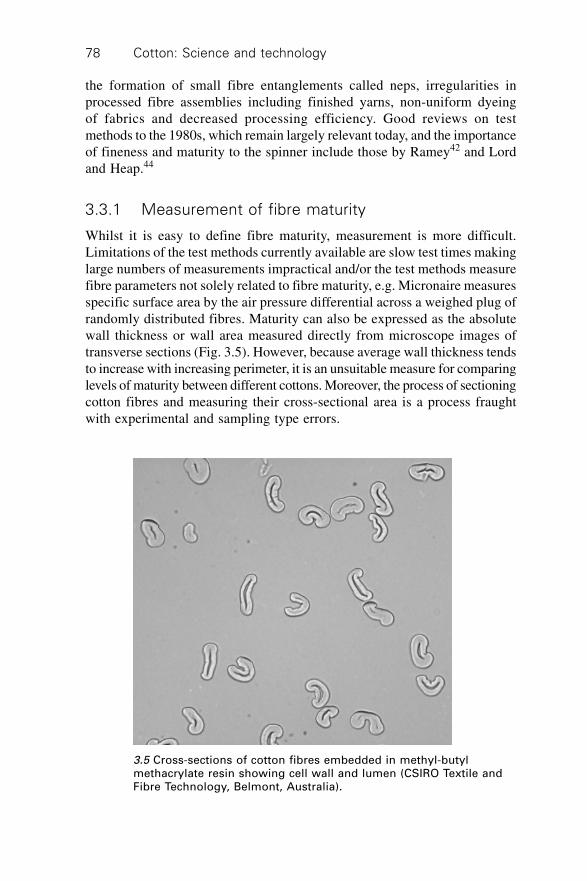
Cotton: Science and technology78
the formation of small fibre entanglements called neps, irregularities inprocessed fibre assemblies including finished yarns, non-uniform dyeingof fabrics and decreased processing efficiency. Good reviews on testmethods to the 1980s, which remain largely relevant today, and the importanceof fineness and maturity to the spinner include those by Ramey42 and Lordand Heap.44
3.3.1 Measurement of fibre maturity
Whilst it is easy to define fibre maturity, measurement is more difficult.Limitations of the test methods currently available are slow test times makinglarge numbers of measurements impractical and/or the test methods measurefibre parameters not solely related to fibre maturity, e.g. Micronaire measuresspecific surface area by the air pressure differential across a weighed plug ofrandomly distributed fibres. Maturity can also be expressed as the absolutewall thickness or wall area measured directly from microscope images oftransverse sections (Fig. 3.5). However, because average wall thickness tendsto increase with increasing perimeter, it is an unsuitable measure for comparinglevels of maturity between different cottons. Moreover, the process of sectioningcotton fibres and measuring their cross-sectional area is a process fraughtwith experimental and sampling type errors.
3.5 Cross-sections of cotton fibres embedded in methyl-butylmethacrylate resin showing cell wall and lumen (CSIRO Textile andFibre Technology, Belmont, Australia).

Cotton fibre quality 79
It is proposed43,44 that the most satisfactory expression of maturity is onethat measures maturity independently of differences in intrinsic fineness.Thus the degree of thickening (notated q) is defined as the ratio of the cross-section area of the fibre wall (Aw) to the area of a circle of the same perimeter(P) as the fibre cross-section (see eqn 3.2).
q = 4pAw/P2 3.2
The ratio is equal to unity for a completely solid circular fibre and becomessmaller for fibres with less wall development. Mature cottons have averageq in excess of 0.60 whilst particularly immature cottons have average qvalues of less than 0.30. In all cottons there will be a wide distribution of qvalues, e.g. a sample of mature cotton will contain fibres with q valuesranging from 0.15 through to 0.96.45 Ratios of other cross-sectional andlongitudinal geometric measurements have also been used to express maturityalthough q remains the preferred and most used measure.
3.3.2 Measurement of fibre fineness
The Micronaire is the most widely used test method for obtaining estimatesof cotton fibre fineness. The test measures the resistance offered by a weighedplug of fibres to a metered airflow. The change in the rate of airflow orpressure is correlated with measurements of linear density although it is nowunderstood that the change in airflow is dependent upon specific surfacearea. The test was incorporated into HVI lines from the beginning of theirdevelopment and has been changed to improve test time and precision fromthe earlier laboratory bench-top instrument of the late 1940s, which took acouple of minutes to measure a well blended and conditioned sample of 50grains (3.24 grams) in weight. The HVI version now takes a 10 gram sampleof raw, unblended but conditioned fibre from the bale sample and completesthe test in seconds. The scale on the Micronaire is marked in micrograms perinch, which is based on an observed linear relationship between air permeabilityand linear density for a range of cotton samples of similar maturity. Subsequenttesting of immature cotton produced results that varied significantly fromactual weight per unit inch determinations. Further studies showed therelationship between Micronaire and fibre weight was curvilinear and thatchanges in fibre maturity produced concomitant variations in Micronairereadings.46 Equation 3.3 shows the relationship between Micronaire (X) andthe linear density (H) and maturity (M), measured as maturity ratio,56
determined in ref. 46:
MH = 3.86X2 + 18.16X + 13 3.3
Despite these shortcomings the Micronaire test is still widely accepted onthe basis that the usefulness of other expressions for cotton fibre fineness,

Cotton: Science and technology80
including perimeter, diameter or ribbon width, cross-sectional area and standardfibre weight, is also hindered by inter-relationships that exist between themand other parameters such as maturity and the density of the fibre. Inter-laboratory CVs for Micronaire across a range of different cottons tested aspart of the Bremen Round Trials between 2003 and 2005 ranged between1.7% and 3.2%.30 Table 3.3 lists the typical range of Micronaire valuesfound in Upland cotton together with comments on the type of cotton theyrepresent from a market viewpoint and the range of premiums anddiscounts applied to particular values. The Micronaire scale is nominallycalibrated from 2.3 mg/inch to 8.0 g/inch,47 and suffers from significant errorat either end of the scale. An alternative scale exists for Pima-style cotton.48
3.3.3 Methods for separating fibre maturity and fineness
The need to separate the widely used Micronaire into its fineness and maturitycomponents is of particular importance to producers of fine, mature cottonwhich can be wrongfully discounted because low Micronaire values aretaken as indicating immaturity. For example, there is cotton grown in the 3.3to 3.7 range in Table 3.3 that is actually fine and mature and therefore shouldhave a premium rather than a discount applied.
The International Textile Manufacturers Federation (ITMF) Working Groupon Fineness and Maturity advocates that any instrument measure of fibrematurity should give results that vary directly with q.44 However, whilsttheoretically more accurate, this direct method suffers from significantexperimental error due to the fine detail involved in preparing fibres formeasurement and the limited number of fibres that can be practically measured.The same issue applies to Standard Methods for determining fibre lineardensity.51 These issues have limited the measurement and application ofreference method values to only a few laboratories around the world and leftfineness and maturity measurement to indirect methods such as Micronaire,the Uster AFIS and the ‘Shirley’ Fineness and Maturity Tester (FMT), a
Table 3.3 Micronaire values for Upland Cotton
Micronaire Comments Discounts applied
(mg/inch) (points* per pound [49, 50])
< 3.2 Significantly immature 400 to 1400 pts off
3.3–3.7 Immature 200 to 500 pts off
3.8–4.5 Fine and mature fibre for fine to 50 pts on for 3.8 to 4.2
medium count yarn range
4.6–4.9 Coarse fibre for coarse count yarn
> 5.0 Significantly coarse 250 to 700 pts off
* 100 points = 1 US cent.
Cotton fibre quality 81
double compression airflow instrument that relates the pressure differentialfor air metered at two flow rates between a plug of fibres compressed to twovolumes.52
Over the last twenty years a number of methods different from thosealready discussed have been investigated for their potential to measure fibrefineness and maturity separately. Near-infra-red reflectance (NIR) spectroscopywas investigated extensively for measuring fibre fineness and maturity becausethe speeds that can be applied in measurement and sample preparation suitinclusion in HVI lines. However, the method largely measures the physicalscattering of light from the specimen, a response that correlates very wellwith Micronaire and other descriptions of surface area. A thorough review ofpublished work on its application to measuring cotton fineness and maturityhas been written by Montalvo and Von Hoven.53 Other more recent andpromising investigations have focused on automating already standard directmethods utilizing high-speed digital cameras and image analysis to measurefineness and maturity. Two such methods are the Commonwealth ScientificIndustrial Research Organisation (CSIRO) SiroMat,54,55 which measuresmaturity based on the interference colours transmitted by fibres under crossedpolars,56 and the CSIRO Cottonscan,55,57 which measures the length of aweighed bundle of fibre snippets suspended in a liquid as they pass throughan optical cell.
3.4 Tensile properties
The ability of cotton to withstand tensile force is fundamentally important inthe processing of cotton. Yarn strength correlates highly with fibre strength,and good tensile strength specific to fibre fineness, is an important factor inresisting damage through the gin, particularly through the lint cleaner.58 Aminimum tensile strength exists for base grade cotton with large discountsfor fibre with values below this level. Table 3.4 lists the descriptive designationsgiven to HVI measured values of tenacity by the USDA AMS.29 Much of theworld’s exported cotton exceeds these tenacity values. However, no premiumsare paid for high tenacity values although improved tensile properties remaina primary objective for cotton plant breeders.
3.4.1 Tensile measurement
The fundamental aspects of tensile strength testing are explained in depth inChapter 2. To recap, the maximum resistance to stretching forces developedduring a tensile test in which the fibre or fibre bundle is broken is called thebreaking load, and is measured in terms of grams (or pounds) weight. Inorder to compare cotton fibres of different fineness the breaking load isnormalized by dividing it by the fineness of the fibre measured in terms of

Cotton: Science and technology82
linear density. Tenacity is a useful parameter for describing fibre qualitybecause different cotton varieties and growths can be compared directly witheach other and with values for the subsequent yarn or fabric.
Rapid measurement of fibre tenacity and breaking extension is currentlyrealized through HVI measurement of these properties. The current HVIinstrument that measures tensile properties evolved from laboratory benchfibre bundle test method instruments like the Pressley Tester and later theStelometer. In both, a flat bundle of fibres is prepared and the ends fixedbetween two clamps. A controlled rate of load is applied; in the PressleyTester by the application of a beam-lever mechanism, and later in the Stelometerby a dashpot controlled pendulum assembly, which improved reproducibilityover the Pressley Tester and added the measurement of breaking extension.The broken fibre bundle is weighed using a micro-balance and the resultexpressed as the average tenacity of that bundle. Average single fibre testresults correlate reasonably well with bundle test results, with differencesattributable to fibre interaction within the fibre bundle and subsequent effectson the ‘weak-link’ theory, particularly at small to zero gauge lengths.59 Table3.5 from ref. 59 lists the tenacity measured on a Pima cotton tested in singlefibre and fibre bundle forms over a series of gauge lengths. The drop intenacity values is attributed to a ‘weak-link’ effect in both situations.
Bundle tests measure the tensile properties of the weakest and least extensiblefibres included in the bundle. Suh et al.60 pointed out that a typical bundlestrength test measures only 1/25,000,000th of the fibres in a bale. The use ofsmall, flat bundles of aligned cotton fibres expedites accurate measurementthat could be obtained only through exhaustive sampling and testing ofthousands of single fibres. However, the methods of bundle preparation andthe gauge length at which they are broken have significant effects on the endresult. Residual crimp adversely affects the bundle force measurement inHVI lines. If a bundle is not flat then not all fibres will contribute directly tothe load applied. The same is true if fibres are not 100% extended betweenthe jaws by brushing.61 Fibre specimens prepared by automatic samplerswere more representative of cotton lint than specimens prepared for strengthtests by conventional methods.62 Further, the gauge length at which fibres
Table 3.4 USDA descriptive designation for HVI tenacity values
Descriptive designation HVI tenacity (grams per tex)
Very weak < 20
Weak 21 to 23
Average 24 to 26
Strong 27 to 29
Very strong > 30

Cotton fibre quality 83
are broken introduces an inverse length bias on the test, particularly if asample has a high SFC.
Use of laboratory bench bundle testers is diminishing and most tensilevalues reported today are generated using HVI lines. Inter-laboratory CVresults for fibre strength across a range of different cottons tested as partof the Bremen Round Trials between 2003 and 2005 ranged between 3.6and 5.1%.30 Aside from increased speed, due to faster equilibrating straingauges and the development of high-speed measurements of specimen lineardensity using light, the success of the HVI strength measurement has arisenfrom the change in specimen loading to a constant rate of extension ratherthan a constant rate, which eliminated force measuring errors caused byhardware accelerations.63 Godbey et al.64 varied the extension rate of theclamping jaws in an HVI over a wide range, and showed tensile strengthincreased with rates of extension at moderately high speeds and then declinedat near-ballistic speeds of load. Since the measurements of specimen lineardensity do not provide sufficient accuracy, strength calibrations areperformed by testing calibration cottons whose bundle strength value hasbeen established. The strength values of calibration cottons areestablished by testing them on other HVI systems, calibrated with calibrationtest cottons.
3.4.2 Extension
As well as average tenacity, breaking extension, which is also termedextensibility and elongation is also measured, although the value of thisparameter in the market is less understood. No premium or discount is paidon the basis of this property and only a small number of high-end spinningmills appear to pay attention to this property.2 Little or no attention is paidalso to the continuous record of load versus extension although it is likelythat plant breeders will take an interest in new varieties that withstand higherbreaking loads but which reportedly have lower breaking extensions.
Table 3.5 Pima cotton stress properties at different gauge lengths
using different tensile tests
Nominal gauge length Tenacity (gf/tex)
Single fibre Flat bundle
0-inch 52.23 40.67
1/8-inch 42.92 27.9
3/16-inch 39.61 25.261/4-inch 37.65 23.41
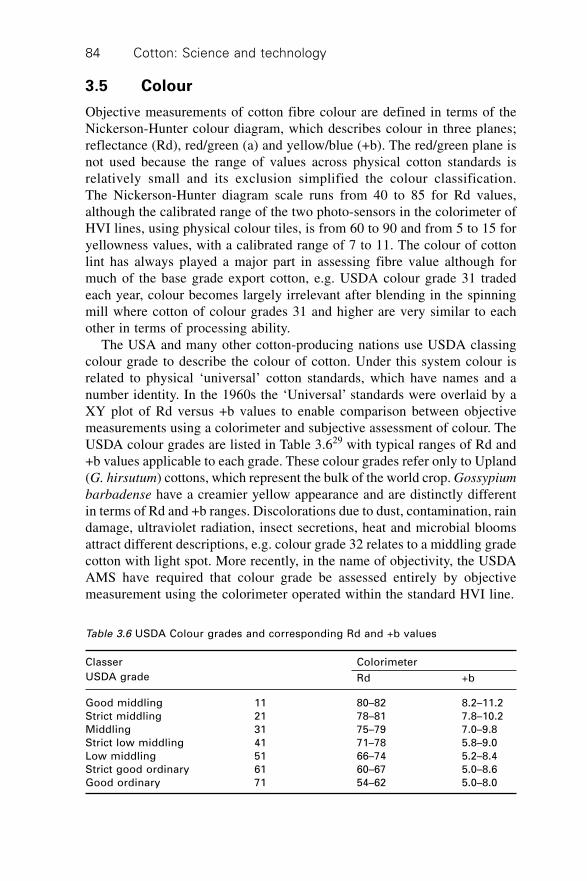
Cotton: Science and technology84
3.5 Colour
Objective measurements of cotton fibre colour are defined in terms of theNickerson-Hunter colour diagram, which describes colour in three planes;reflectance (Rd), red/green (a) and yellow/blue (+b). The red/green plane isnot used because the range of values across physical cotton standards isrelatively small and its exclusion simplified the colour classification.The Nickerson-Hunter diagram scale runs from 40 to 85 for Rd values,although the calibrated range of the two photo-sensors in the colorimeter ofHVI lines, using physical colour tiles, is from 60 to 90 and from 5 to 15 foryellowness values, with a calibrated range of 7 to 11. The colour of cottonlint has always played a major part in assessing fibre value although formuch of the base grade export cotton, e.g. USDA colour grade 31 tradedeach year, colour becomes largely irrelevant after blending in the spinningmill where cotton of colour grades 31 and higher are very similar to eachother in terms of processing ability.
The USA and many other cotton-producing nations use USDA classingcolour grade to describe the colour of cotton. Under this system colour isrelated to physical ‘universal’ cotton standards, which have names and anumber identity. In the 1960s the ‘Universal’ standards were overlaid by aXY plot of Rd versus +b values to enable comparison between objectivemeasurements using a colorimeter and subjective assessment of colour. TheUSDA colour grades are listed in Table 3.629 with typical ranges of Rd and+b values applicable to each grade. These colour grades refer only to Upland(G. hirsutum) cottons, which represent the bulk of the world crop. Gossypium
barbadense have a creamier yellow appearance and are distinctly differentin terms of Rd and +b ranges. Discolorations due to dust, contamination, raindamage, ultraviolet radiation, insect secretions, heat and microbial bloomsattract different descriptions, e.g. colour grade 32 relates to a middling gradecotton with light spot. More recently, in the name of objectivity, the USDAAMS have required that colour grade be assessed entirely by objectivemeasurement using the colorimeter operated within the standard HVI line.
Table 3.6 USDA Colour grades and corresponding Rd and +b values
Classer Colorimeter
USDA grade Rd +b
Good middling 11 80–82 8.2–11.2
Strict middling 21 78–81 7.8–10.2
Middling 31 75–79 7.0–9.8
Strict low middling 41 71–78 5.8–9.0
Low middling 51 66–74 5.2–8.4
Strict good ordinary 61 60–67 5.0–8.6
Good ordinary 71 54–62 5.0–8.0

Cotton fibre quality 85
3.6 Impurities in cotton
3.6.1 Trash
Trash particles or visible foreign matter (VFM) in cotton are typically plantparts that are incorporated into the seed-cotton during harvest and then brokendown into smaller pieces during mechanical ginning. Chief components arepieces of stem, bract, bark, seed-coat fragments, motes (whole immatureseeds) and leaf. Trash accounts for 1–5% by weight of baled cotton with theamount and type of trash reflected in the leaf and colour classing grade ofparticular cotton.
The need to determine the amount and type of trash in a particular cottonfibre is based on the effort required to clean it, the adverse effects on yarnquality and process efficiency and the realized yield of fibre, in particularraw cotton. Whilst larger particles of cotton fruit and leaf trash affect theclasser’s leaf grade they are easier to remove during processes in the spinningmill. The presence of bark and grass is a more serious problem because theirfibrous nature makes these contaminants difficult to separate from the cottonfibre. Bark or grass spun into yarn and then knitted or woven into fabric,results in costly claims to the seller of the yarn or fabric. As a result thepresence of bark and grass in the classer’s sample attracts heavy discounts atclassing. Pepper trash, which comprises very small particles of plant matterand dust, is more difficult to ‘see’ and even though by weight represents asmall proportion of the bale, creates large problems in rotor spinning. Thesensitivity to rotor spinning of small trash and dust particles has led to thedevelopment of instruments that measure the different aspects of trash content;the Uster AFIS Trash and Dust module separates and measures the amountof trash and dust by number and by weight; the Micro-Dust and Trash Analyzer(MDTA3), which has had several manufacturers, separates trash and dustparticle fractions via a series of filters, allowing expression of a weight-based measure.
Trash content in a particular cotton is still largely determined by subjectiveassessment against physical and descriptive grades. Determination byinstrument is either too slow, e.g. gravimetric based methods, or too imprecise,e.g. optical (scanner) methods utilized in current HVI lines. The USDA ARShas been investigating the latter methods since the late 1970s when Barkerand Lyons65 used a TV monitor to capture images to measure trash. Researchover the last 20 years on the application of scanning devices (TV and videocameras were followed by digital cameras and scanners) for measuring trashhas focused on the spectral contribution of colour and trash particles, gainingconsistent illumination and contrast in samples to ensure accurate thresholdingof scanned images, measuring the effects of pixel resolution and thus trashparticle edge definition and calibration of image shape to define the type oftrash ‘seen’ by the analysis.66
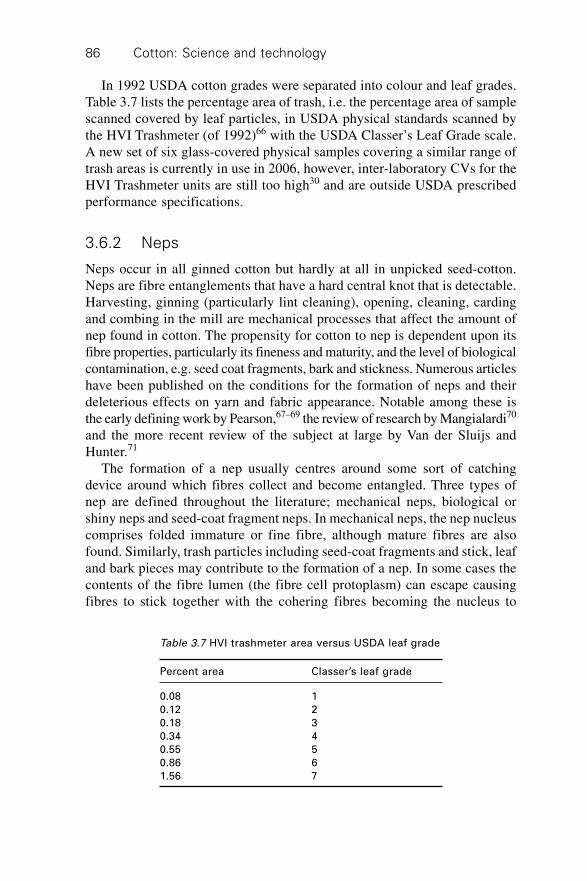
Cotton: Science and technology86
In 1992 USDA cotton grades were separated into colour and leaf grades.Table 3.7 lists the percentage area of trash, i.e. the percentage area of samplescanned covered by leaf particles, in USDA physical standards scanned bythe HVI Trashmeter (of 1992)66 with the USDA Classer’s Leaf Grade scale.A new set of six glass-covered physical samples covering a similar range oftrash areas is currently in use in 2006, however, inter-laboratory CVs for theHVI Trashmeter units are still too high30 and are outside USDA prescribedperformance specifications.
3.6.2 Neps
Neps occur in all ginned cotton but hardly at all in unpicked seed-cotton.Neps are fibre entanglements that have a hard central knot that is detectable.Harvesting, ginning (particularly lint cleaning), opening, cleaning, cardingand combing in the mill are mechanical processes that affect the amount ofnep found in cotton. The propensity for cotton to nep is dependent upon itsfibre properties, particularly its fineness and maturity, and the level of biologicalcontamination, e.g. seed coat fragments, bark and stickness. Numerous articleshave been published on the conditions for the formation of neps and theirdeleterious effects on yarn and fabric appearance. Notable among these isthe early defining work by Pearson,67–69 the review of research by Mangialardi70
and the more recent review of the subject at large by Van der Sluijs andHunter.71
The formation of a nep usually centres around some sort of catchingdevice around which fibres collect and become entangled. Three types ofnep are defined throughout the literature; mechanical neps, biological orshiny neps and seed-coat fragment neps. In mechanical neps, the nep nucleuscomprises folded immature or fine fibre, although mature fibres are alsofound. Similarly, trash particles including seed-coat fragments and stick, leafand bark pieces may contribute to the formation of a nep. In some cases thecontents of the fibre lumen (the fibre cell protoplasm) can escape causingfibres to stick together with the cohering fibres becoming the nucleus to
Table 3.7 HVI trashmeter area versus USDA leaf grade
Percent area Classer’s leaf grade
0.08 1
0.12 2
0.18 3
0.34 4
0.55 5
0.86 6
1.56 7
Cotton fibre quality 87
form a biological nep. Other naturally occurring ‘cements’ such as the exudatesfrom insects (see stickiness) or the cotton flower can also act to coalescefibres and create neps. Mechanical processes involved in taking fibre to theyarn stage also influence the extent to which neps are formed although nepsformed from overly aggressive processing are not necessarily correlatedwith the above fibre properties.
Mechanical neps
The formation of mechanical neps is dependent on two factors; the propertiesof the fibre that enable it to resist collapse and buckling when frictional anddirect forces are applied and the type and degree of mechanical processingexerting force on the fibre. Properties that affect the degree of nep formationinclude fibre immaturity, fineness (micronaire), low strength, length (in relationto the aspect ratio), high and low wax content and resistance to bending andtwisting. Dever et al.58 found nep formation was influenced and inverselyrelated to fibre maturity and directly related to the trash content of cotton.The combination of long-staple length and fibre fineness was conducive tonep formation during mechanical manipulation. Together with non-lint content,these fibre properties predicted nep formation better than any single fibreproperty. Alon and Alexander72 suggested that processing fibres producesneps through a stress build-up and sudden realease mechanism, which inducesbuckling along the fibre length. The propensity for a fibre to buckle isstrongly correlated with fibre properties such as maturity, fineness and length.Marth et al.73 found an inverse logarithmic relationship between neps in cardsliver and Micronaire values. Fibre with micronaire values less than 3 hadmore than four times the number of neps greater than fibre with Micronairevalues greater than 3.5.
The number of mechanical neps found in cotton has been surveyed manytimes by workers through each stage of processing from the boll throughginning to the spinning mill.71 Typical nep numbers found at each stage ofmechanically harvested and ginned cotton through to the mill are listed inTable 3.8. Although there is no discount applied to cotton on the basis of itsmeasured nep content most spinning mills prefer fibre with low nep numbers.A value of 250 neps per gram, as measured by the AFIS nep instrument, isoften nominated as a maximum value.
Biological neps
Unlike mechanical neps, the nuclei of biological or shiny neps are not formedas a result of a mechanical process. They are found in the opened cotton bolland are thought to form when sticky fluid from the cell protoplasm leaksonto fibres causing them to stick together. It has been noted that the fibres in

Cotton: Science and technology88
these neps are usually dead or very immature and are stuck together in aparallel arrangement.74,75 This suggests that these neps are formed when theboll ripening process is interrupted by insect attack, extreme weather or thepremature application of a harvest aid. When these fibres are processed theydo not separate from the cemented clump, although the clump may be brokeninto smaller particles. The clumps tend to be larger prior to ginning and arebroken down into smaller particles during ginning and other mechanicalprocesses. The concern for weavers and knitters is that these neps surviveprocessing and show up as white and light-coloured un-dyed specks onfinished fabric.76
Measurement of neps
When cotton was assessed largely by hand and eye, high levels of nep in thebale or classing sample would indicate that the cotton was likely to beimmature. However, subjective assessment of nep levels is unable to be anymore than an indicator of potential problems in later processing. There areseveral methods for measuring the number of neps in loose fibre or mechanicallyprepared fibre webs. Some involve counting neps directly while more recentmethods utilize electro-optical signals and/or digital cameras to measure thenumber and also the size and shape of neps in a sample. Methods for measuringneps in loose fibre can be divided into four general groups.
1. Manual assessment, where neps in cotton are counted in thin webs preparedby a carding machine or by hand; such methods have become less practicalas speeds of other fibre test methods have increased. Further, there is
Table 3.8 Mechanical neps found through each stage
of production and processing
Process AFIS neps per gram
Field
Boll 30
Harvest 90
Gin
Pre-clean 115
Pre-gin 140
Pre-lint cleaner no. 1 210
Pre-lint cleaner no. 2 290
Bale 300
Pre-card 400
Card sliver 90
1st Draw passage 80
Comber lap 60
Comber sliver 20

Cotton fibre quality 89
always difficulty in obtaining reproducible results when the counting isconducted by different operators.
2. Gravimetric assessment, where dust, trash and neps are mechanicallyseparated in a trash separator and weighed; the difficulty with this approachis that neps are not separated from other trash and non-lint particles.There is also the question of whether the opening process in the separatoralso contributes to the formation of neps.
3. Electro-optical assessment is used in the AFIS Nep Module to assess thenumber, size and shape profile of neps that pass through a beam of nearinfra-red light. The voltage/time wave forms produced are proportionalto the amount of light scattered and occluded by the object. Individualneps produce a characteristic spike wave form, which is much greater inamplitude and period than the wave forms for individual fibres. A seriesof threshold voltage levels indicate the size and shape of the nep, whichallows neps to be categorized into two categories, fibre (or mechanical)neps and seed-coat fragments.77,78
4. Digital cameras are currently used in two commercial instruments thatmeasure neps via analysis of web images. The Truetzschler Nep Control(NCT) uses a digital camera to record the condition of the fibre webbeing doffed in a cotton card. It continuously records the number andtype of neps; fibrous and seed-coat fragment neps, in the fibre web.Good correlations (r = 0.98) have been observed between NCT resultsand the AFIS nep results.79 The recently developed Lintronic FibreContamination Tester (FCT) works in a similar manner to the NCT. Theinstrument automatically prepares a web from a sample of raw fibre,which is then photographed by a digital camera. The image is thenanalysed for neps.
Measurement of biological or shiny neps using any of the above methodsis difficult because of their small size. Conversion of fibre into woven anddyed sateen fabric is required for accurate counts of these neps. Againstmoderately dark, dyed backgrounds these neps contrast as white specks andcan be counted manually or by image analysis. Knitted fabric can be usedalso although nep counts are lower as a proportion of the neps are hidden inthe knit structure.
3.6.3 Stickiness
Sticky cotton is a major concern for spinning mills. Physiological plantsugars in immature fibres, contaminants from crushed seed and seed coatfragments, grease, oil and pesticide residues are all potential sources ofstickiness. However, these are insignificant compared with contamination ofcotton from the exudates of the silverleaf whitefly (Bemisia tabaci) and the

Cotton: Science and technology90
cotton aphid (Aphis gossypii).80 The sugar exudates from these insects leadto significant problems in the spinning mill including a build-up of residueson textile machinery, which results in irregularities and stoppages in sliverand yarn production. Even at low to moderately contaminated levels, sugarresidues build up, decreasing productivity and quality, and forcing the spinnerto increase the frequency of cleaning schedules.81 A reputation for stickinesshas a negative impact on sales, exports and price for cotton from regionssuspected of having stickiness. Reductions in the market value of lint due tostickiness are applied regionally and indiscriminately. In Arizona, perceptionsregarding stickiness lead to 563-point (5.63 US cents)/lb discounts relativeto Californian cotton.82
The major sugars excreted by A. gossypii are melezitose, sucrose, glucoseand fructose while for B. tabaci, there is the additional sugar, trehalulose.Analysis by Hendrix et al.83 of cotton aphid and silverleaf whitefly exudatesshowed that around 40% of the total sugar exuded by the aphid was melezitose,while the silverleaf whitefly exudate consisted of around 40% trehaluloseplus about 17% melezitose. The two sugars that contribute most to cottonstickiness problems in spinning mills are trehalulose (a disaccharide) andmelezitose (a trisaccharide).
Measurement of stickiness
There are a range of test methods currently used to assess stickiness incotton. Test methods can be divided into two types: either counting methodswhereby sticky spots that arise from heating a thin card web of the suspectedcotton compressed against a heated plate for a certain time are counted, orchemical analyses whereby the sugars are extracted and identified accordingto colour changes, spectroscopy or chromatography. The main limitations ofthese are speed and, except for high-performance liquid chromatography(HPLC) and forms of spectroscopy, which are not widely used in routineanalyses, the inability of the test methods to distinguish between types ofsugar, particularly with regards to concentrations of the sugar trehalulose,which is difficult to collect because of its low melting point and highhygroscopicity. Recent work has shown that whitefly exudate caused moretrouble in the mill than the cotton aphid exudate.81
Specific test methods for measuring cotton stickiness (spots) include theSticky Cotton Thermodetector (SCT) developed by the Center de Co-operationInternationale Recherché Agronomique pour le Development (CIRAD), theHigh Speed Stickiness Detector (H2SD), which is a high speed version ofthe original SCT developed also by CIRAD and the Lintronics FiberContamination Tester (FCT) developed by Lintronics. Agreement betweentest method results, and between laboratories for the same test method aretypically poor84 although the methods are reasonable at ranking sticky cottonsamples consistently.
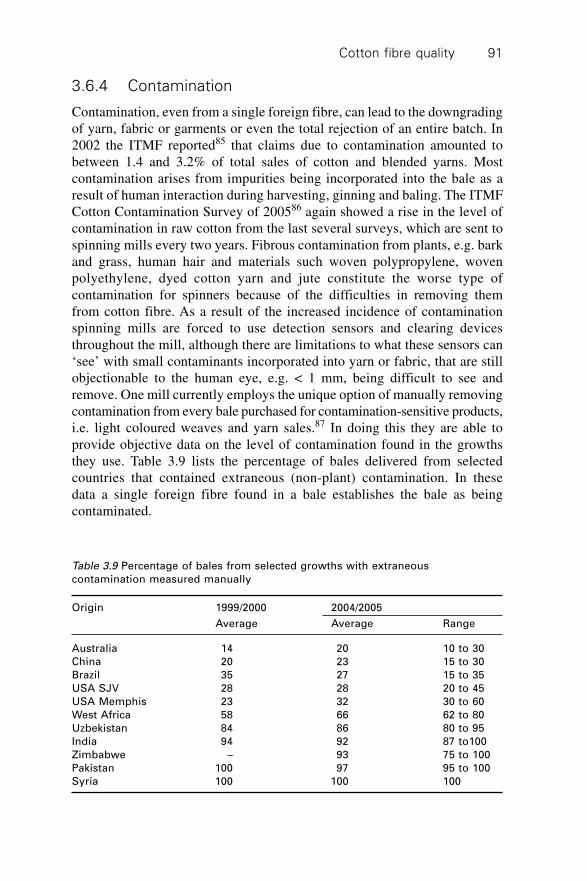
Cotton fibre quality 91
3.6.4 Contamination
Contamination, even from a single foreign fibre, can lead to the downgradingof yarn, fabric or garments or even the total rejection of an entire batch. In2002 the ITMF reported85 that claims due to contamination amounted tobetween 1.4 and 3.2% of total sales of cotton and blended yarns. Mostcontamination arises from impurities being incorporated into the bale as aresult of human interaction during harvesting, ginning and baling. The ITMFCotton Contamination Survey of 200586 again showed a rise in the level ofcontamination in raw cotton from the last several surveys, which are sent tospinning mills every two years. Fibrous contamination from plants, e.g. barkand grass, human hair and materials such woven polypropylene, wovenpolyethylene, dyed cotton yarn and jute constitute the worse type ofcontamination for spinners because of the difficulties in removing themfrom cotton fibre. As a result of the increased incidence of contaminationspinning mills are forced to use detection sensors and clearing devicesthroughout the mill, although there are limitations to what these sensors can‘see’ with small contaminants incorporated into yarn or fabric, that are stillobjectionable to the human eye, e.g. < 1 mm, being difficult to see andremove. One mill currently employs the unique option of manually removingcontamination from every bale purchased for contamination-sensitive products,i.e. light coloured weaves and yarn sales.87 In doing this they are able toprovide objective data on the level of contamination found in the growthsthey use. Table 3.9 lists the percentage of bales delivered from selectedcountries that contained extraneous (non-plant) contamination. In thesedata a single foreign fibre found in a bale establishes the bale as beingcontaminated.
Table 3.9 Percentage of bales from selected growths with extraneous
contamination measured manually
Origin 1999/2000 2004/2005
Average Average Range
Australia 14 20 10 to 30
China 20 23 15 to 30
Brazil 35 27 15 to 35
USA SJV 28 28 20 to 45
USA Memphis 23 32 30 to 60
West Africa 58 66 62 to 80
Uzbekistan 84 86 80 to 95
India 94 92 87 to100
Zimbabwe – 93 75 to 100
Pakistan 100 97 95 to 100
Syria 100 100 100
Cotton: Science and technology92
3.7 Moisture
Regain and moisture content are terms used interchangeably to refer to themass of water as a percentage of the fibre mass. The correct terminology isdefined in Chapter 2. The commercial regain of cotton is 8.5% although thislevel is practically unachievable in new cotton under normal ambient conditions.As per descriptions given in Chapter 2 regains in excess of 7.5% indicateswet cotton. The rate of diffusion between absorption and desorption is relativelyquick and cotton will readily equilibrate to ambient conditions dependentupon temperature and packing density of the cotton sample. Under ambientconditions in temperate climes moisture levels in bales of cotton typicallyrange from 3.5% to 6.5% moisture.
Moisture is important in fibre testing because of its effect on the physicalproperties of cotton particularly tensile properties and other expressionsnormalized for weight. Fibre crimp, compressability and torsional rotationare also affected by high humidity. The fibre strength (tenacity) of cottonconditioned at 55% relative humidity (RH) was 25.8 g/tex and this increasedto 29.1 g/tex after conditioning at 75% RH.88 Moisture content increaseswith trash content and fibre yellowness.89 Much work has been aimed atadjusting HVI tensile measurements for conditions in the laboratory at thetime of testing.90 Under ideal standard laboratory conditions and conditioningfibre samples passively for 48 hours, or by following prescribed rapidconditioning protocols, these adjustments do not need to be made. However,maintaining and exposing cotton to standard conditions is a large cost and sonew methods that adjust measurements to allow or correct for moisture areattractive. Taylor90 investigated four methods for measuring moisture inHVI systems including capacitance, two conductivity methods and NIR. Allwere compared to weight loss by oven drying, which remains the standardtest for determining moisture.91 Near infra-red reflectance spectroscopy wasthe most accurate method of the four tested.
3.8 Wax content
Cotton wax is essential for the efficient processing of cotton fibre into spunyarn. It provides a lubricating layer that reduces fibre-to-metal friction andtherefore fibre breakage during mechanical processing. The downside is thatthis layer also acts as an impermeable barrier to the entry of water and dyemolecules into the fibre. For successful even dyeing this barrier must beremoved by scouring and/or bleaching.
Cotton wax is the lipid material extracted from cotton by an organicsolvent. Sugars are co-extracted with most solvents and it is necessary toseparate the wax lipids from these sugars for quantitative wax analysis. Themost common method for determination of the wax content of cotton was
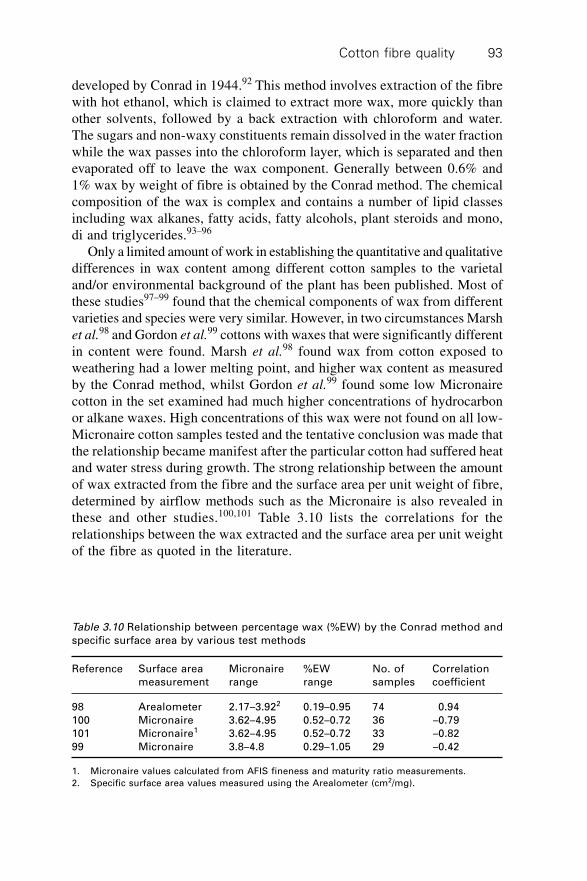
Cotton fibre quality 93
developed by Conrad in 1944.92 This method involves extraction of the fibrewith hot ethanol, which is claimed to extract more wax, more quickly thanother solvents, followed by a back extraction with chloroform and water.The sugars and non-waxy constituents remain dissolved in the water fractionwhile the wax passes into the chloroform layer, which is separated and thenevaporated off to leave the wax component. Generally between 0.6% and1% wax by weight of fibre is obtained by the Conrad method. The chemicalcomposition of the wax is complex and contains a number of lipid classesincluding wax alkanes, fatty acids, fatty alcohols, plant steroids and mono,di and triglycerides.93–96
Only a limited amount of work in establishing the quantitative and qualitativedifferences in wax content among different cotton samples to the varietaland/or environmental background of the plant has been published. Most ofthese studies97–99 found that the chemical components of wax from differentvarieties and species were very similar. However, in two circumstances Marshet al.98 and Gordon et al.99 cottons with waxes that were significantly differentin content were found. Marsh et al.98 found wax from cotton exposed toweathering had a lower melting point, and higher wax content as measuredby the Conrad method, whilst Gordon et al.99 found some low Micronairecotton in the set examined had much higher concentrations of hydrocarbonor alkane waxes. High concentrations of this wax were not found on all low-Micronaire cotton samples tested and the tentative conclusion was made thatthe relationship became manifest after the particular cotton had suffered heatand water stress during growth. The strong relationship between the amountof wax extracted from the fibre and the surface area per unit weight of fibre,determined by airflow methods such as the Micronaire is also revealed inthese and other studies.100,101 Table 3.10 lists the correlations for therelationships between the wax extracted and the surface area per unit weightof the fibre as quoted in the literature.
Table 3.10 Relationship between percentage wax (%EW) by the Conrad method and
specific surface area by various test methods
Reference Surface area Micronaire %EW No. of Correlation
measurement range range samples coefficient
98 Arealometer 2.17–3.922 0.19–0.95 74 0.94
100 Micronaire 3.62–4.95 0.52–0.72 36 –0.79
101 Micronaire1 3.62–4.95 0.52–0.72 33 –0.82
99 Micronaire 3.8–4.8 0.29–1.05 29 –0.42
1. Micronaire values calculated from AFIS fineness and maturity ratio measurements.
2. Specific surface area values measured using the Arealometer (cm2/mg).
Cotton: Science and technology94
3.9 Microbial attack
The term ‘cavitoma’ was coined in the 1950s to describe cotton damaged bymicro-organisms such as cellulolytic bacteria and fungi. All cotton containspopulations of micro-organisms that increase if the right conditions for theirgrowth are applied. The condition was noted in the 1950s in the mid-southand eastern growth areas of the USA during some wet years. Moisture andwarmth are the chief criteria required to propel micro-organism populations.Moisture levels in excess of 9% are the minimum required for growth of themicro-organisms.102
Perkins and Brushwood103 provide the most recent review of the conditionsand fibre effects associated with micro-organisms and test methods to identifytheir presence. Acute infection by cellulolytic micro-organisms results inalkaline pH, low sugar content, colour change, poor appearance, low strengthand increased wet-out. The tests for cavitomic infection tend to be qualitativetests based around pH indicator tests, and exposure of the sample to UV lightto view any fluorescent spots associated with growth of some fungi. Spinningmills using a pH indicator spray will sometimes rate the degree of stainingthat occurs after spraying the cavitomic cotton. Infected fibres can also beexamined under a microscope. Examination of cavitomic fibres under a lightmicroscope can reveal fungal hyphae and fractures in the surface of thefibre. Swelling cavitomic fibres in concentrated sodium hydroxide will causedifferential swelling at fracture points along the length of the fibre. Allen et
al.104 found good agreements between laboratories examining cavitomic cotton,induced in the field, on the basis of pH determinations and reasonableagreements between laboratories using a method involving microscopic analysisof fibres in sodium hydroxide.
3.10 Future trends
Cotton fibre quality is dependent upon progress in understanding and modifyingthe genetic and environmental influences on the cotton plant, particularly atthe point of fibre development. In the future fibre quality will be defined bythe expression of fibre properties in transgenic cotton varieties (see Chapter4) and through better control of agronomic, water and nutritional variables.The fibre from these plants will likely be longer, finer and stronger, and mayhave new attributes such as colour or increased extension.
Measurement of fibre quality in industrial countries, e.g. the USA, willoccur in the gin rather than at classing laboratories. According to Ghorashi,6
the future fibre testing system will be implemented in the gin (see Chapter6). The testing will be fully automated and installed in line with the processflow of the gin. The system of the future will have remote monitoring,calibration and will measure all pertinent fibre qualities a multiplicity of

Cotton fibre quality 95
times. For agricultural based countries the proportion of cotton classed byHVI lines will increase.
3.11 Sources of further information
Steadman, R. G., Cotton Testing, Textile Progress, 27(1), 66 pp., 1997.
USDA Agricultural Marketing Service (AMS), http://www.ams.usda.gov/Cotton/
Hunter, L., Textiles: Some Technical Information and Data, V: Cotton, SAWTRISpecial Publication, Port Elizabeth, South Africa, 174 pp., 1980.
Lord, E., Manual of Cotton Spinning, Vol. 2, Part I, Physical Properties of
Cotton Fibre, Butterworths, London, UK, 245 pp., 1965.
3.12 References
1. Bradow, J. M. and Davidonis, G. H., Quantitation of Fibre Quality and the CottonProduction-Processing interface: A Physiologist’s Perspective, J. Cotton Sci., 4, 34–64, 2000.
2. Gordon, S. G., Van Der Sluijs, M. H. J. and Prins, M. W., Quality Issues for AustralianCotton from a Mill Perspective, Report to the Australian Cotton Industry, AustralianCotton CRC (pub.), 54pp, July 2004.
3. International Cotton Advisory Committee, A Summary of Decisions to Date of the
Task Force on CSITC, ICAC, 3 pp., Mar. 2006.4. Knowlton, J. L., Cotton Classing and the Need for a Universal Cotton Quality
Evaluation System, Proceed. Cotton Council International Cotton Symposium Turkey,24–26 April 2005.
5. Anderson, S. L., The Measurement of Fibre Fineness and Length: The PresentPosition, J. Textile Inst., 68, 175–180, 1976.
6. Ghorashi, H., The Universal Transition from Manual to Instrument Cotton Classing,report to ITMF HVI Working Group Meeting, Bremen, 2006.
7. Van der Sluijs, M. H. J., Gordon, S. G. and Naylor, G. R. N., Australian FibreQuality and International Feedback, Proceed. Australian Cotton Grower Research
Conf., Gold Coast QLD, August 2004.8. Anthony, W. S. and Bragg, C. K., Response of Cotton Fiber Length Distribution to
Production and Ginning Practices, Trans. American Society of Agricultural Engineers,30, 290–296, 1987.
9. Anthony W. S., ‘Postharvest management of fiber quality’, in Basra, A. S. (ed.),Cotton Fibers, Food Products Press, Inc., New York, London, Oxford, 293–337,1999.
10. Delanghe, E. A. L., Lint Development, in Mauney, J. R. and Stewart, J. McD. (eds),Cotton Physiology, The Cotton Foundation, Memphis TN, 325–349, 1986.
11. Vincke, H., DeLanghe, E., Fransen, T. and Verschreage, L., Cotton Fibres are Uniformin Length Under Natural Conditions, in Cotton Fibres: Their Development and
Properties, Inst. of Cotton, Manchester UK, 2–4, 1985.12. May, O. L., Quality Improvement of Upland Cotton, in Basra, S. A. and Randhawa,
Cotton: Science and technology96
L. S., (eds), Quality Improvements in Field Crops, The Haworth Press Inc., 371–394, 2002.
13. Hanson, R. G., Ewing, E. C. and Ewing Jr., E. C., Effect of Environmental Factorson Fiber Properties and Yield of Deltapine Cottons, Agron. J., 48, 546–581, 1956.
14. Gipson, J. R. and Ray, L. L., Fiber Elongation Results in Different Varieties ofCotton, Proc. Beltwide Cotton Conferences, 212–217, 1968.
15. Gipson, J. R. and Ray, L. L., Influence of Night Temperature on Boll Developmentand Properties of Five Varieties of Cotton, Proc. Beltwide Cotton Conferences, 117–118, 1969.
16. Bradow, J. M., Bauer, P. J., Hinojosa, O. and Sassaranth-Cole, G. F., Quantitation ofCotton Fibre-Quality Variations Arising from Boll and Plant Growth Environments,Eur. J. Agron., 6, 191–204, 1997.
17. Grimes, D. W. and Yamada, H., Relation of Cotton Growth and Yield to MinimumLeaf Water Potential, Crop Sci., 22, 134–139, 1982.
18. Hearn, A. B., The Principles of Cotton Water Relations and Their Application toManagement, Proc. World Cotton Conf. I, Brisbane Australia, Feb. 1994.
19. Bradow J. M., Bauer, P. J., Sassaranth-Cole, G. F. and Johnson, R. M., Modulationsof Fiber Properties by Growth Environment that Persist as Variations of Fiber andYarn Quality, Beltwide Cotton Conferences, 1351–1360, 1997.
20. Constable, G. A., Australian Cotton Research Institute (ACRI) Fibre Quality Data,1976 to 2006.
21. Textile Terms and Definitions, The Textile Institute, Manchester, 5th edition, 1963.22. ASTM D1440, Standard Test Method for Length and Length Distribution of Cotton
Fibers (Array Method).23. Shirley Institute Test Leaflet 1961.24. Hertel, K. L., A Method of Fiber Length Analysis Using the Fibrogram, Textile Res.
J., 10, 510–524, 1940.25. ASTM D4604, Standard Test Method for Measurement of Cotton Fibers by High
Volume Instruments (HVI).26. Zeidman, M. I., Suh, M. W., Batra, S. K. and Sasser, P. E., Determining HVI-Specific
Fibre Length Measures from Array Data, Paper presented to the 7th Ann. Cotton Inc.EFS Res. Forum, Raleigh NC, 177–189, Nov 1994.
27. Behery, H. M., Short Fibre Content and Uniformity Index in Cotton, ICAC ReviewArticles on Cotton Production Research No. 4, 35pp., 1993.
28. ASTM D1445, Standard Test Method for Breaking Strength and Elongation of CottonFibers (Flat Bundle Method).
29. USDA AMS, Explanation of HVI Fiber Measurements on the Class Card for Classing
Offices Equipped with Video Trashmeters, USDA (pub.), July 1990.30. Drieling, A., Comparison Between Bremen Round Trial Results for Uster and Premier
High Volume Instruments, Present. To ITMF HVI Working Group, Bremen, Mar.2006.
31. Tallant, J. D., Fiori, L. A. and Landstreet, C. B., The Effect of Short Fibers in Cottonon its Processing Efficiency and Product Quality Part II: Yarns Made by MiniatureSpinning Techniques from Differentially Ginned Cotton, Text. Res. J., 30, 792–795,1960.
32. Pillay, K. P. R., A Study of the Hairiness of Cotton Yarns – Part I: Effect of Fiber andYarn Factors, Text. Res. J., 34, 663–674, 1964.
33. Hequet, E. and Ethridge, D. A., ‘Effect of Cotton Fibre Length Distribution on YarnQuality’, Proceed. Beltwide Cotton Conf., 1507–1514, 2000.

Cotton fibre quality 97
34. Zeidman, M. I. and Batra, S. K., Determining Short Fiber in Cotton Part II: Measuresof Short Fibre Content from HVI – Statistical Models, Textile Res. J., 61, 103–113,1991.
35. Knowlton, J. L., New Measures of HVI SFI, Proceed. Beltwide Cotton Conf., 1093–1098, 2001.
36. Woo, J. L., An Appraisal of the Length Measures Used For Cotton Fibres, J. Textile
Inst., 59, 557–572, 1967.37. Zeidman, M. I. and Batra, S. K., Determining Short Fiber in Cotton Part I: Some
Theoretical Fundamentals, Textile Res. J., 61, 21–31, 1991.38. Schleth, A., A New Measure of HVI SFI, Present. to ITMF Length Working Group,
ITMF (pub.) Bremen, Mar. 2006.39. Heap, A. S., Relative Short Fibre Content, Present. To ITMF Length Working Group,
ITMF (pub.), Bremen, 2004.40. Robert, K. Q., Dunn, M. C., Cui, X. L. and Price, J. B., Method for Determining
Broken Fibre Content in Ring Yarn, Proceed. Beltwide Cotton Conf., 3068–3074,2005.
41. El-Moghazy, Y. E. and Krifa, M., Fiber Length Utilization Efficiency – A New
Approach to Utilizing Fibre Length, Proceed. Beltwide Cotton Conf., 3056–3066,2005.
42. Ramey Jr., H. H., The Meaning and Assessment of Cotton Fibre Fineness, InternationalInstitute for Cotton, 30 pp., 1982.
43. Pierce, F. T. and Lord, E., The Fineness and Maturity of Cotton, J. Textile Inst., 30,T173–T210, 1939.
44. Lord, E. and Heap, S. A., The Origin and Assessment of Cotton Fibre Maturity,International Institute for Cotton, 40 pp., 1988 and in ITMF Working Group Meetingson Cotton Fibre Fineness and Maturity, Bremen, ITMF (pub.) 1990 to 2006.
45. Gordon, S. G., Cotton Fibre Maturity: Its Measurement and Effects on Processing,Doctoral dissertation, Latrobe University, Melbourne, Australia, 1994.
46. Lord, E., Air Through Plugs of Textile Fibres, Part II. The Micronaire Test forCotton, J. Textile Inst., 47, T17–T47, 1956.
47. USDA Production and Marketing Administration Cotton Branch, Revised MicronaireFiber-Fineness Scale for Use in Testing American Upland Cottons, Washington, Oct.1950.
48. USDA Production and Marketing Administration Cotton Branch, Micronaire Fiber-Fineness Scale for Use in Testing American Egyptian Cotton, Washington, Jan.1952.
49. Adams, G., Managing Lint quality, Making a Profit: An Economic Perspective,Proceed. Beltwide Cotton Conf., 3091–3092, 2005.
50. Australian Cotton Industry, Average Premiums and Discounts Applied to GrowerCotton, Collected Merchant P&D Sheets from 2004–2005.
51. ASTM D1769, Standard Test Method for Linear Density of Cotton Fibers (ArrayMethod).
52. ASTM D3818, Standard Test Method for Linear Density and Maturity Index ofCotton Fibers (IIC Shirley Fineness/Maturity Tester).
53. Montalvo Jr., J. M. and Von Hoven, T., Cotton Fiber Quality, Chapter in Near
Infrared Spectroscopy in Agriculture, Roberts, C.A., Workman, Jr., J. and ReevesIII, J.B. (eds), Crop Science Society of America (pub.), 822 pp., 2004.
54. Gordon, S. G. and Phair, N. L., An Investigation of the Interference Colours Transmittedby Mature and Immature Fibre Under Polarized Light Microscopy, Proceed. Beltwide
Cotton Conf., 2566–2573, 2005.
Cotton: Science and technology98
55. Gordon, S. G., Naylor, G. R. N. and Van Der Sluijs, M. H. J., New Developments in
Cotton Quality Assessment: The Australian Direction, Proceed. Bremen InternationalCotton Conference, Mar. 2004.
56. ASTM D1442, Standard Test Method for Maturity of Cotton Fibers (Sodium HydroxideSwelling and Polarized Light Procedures).
57. Naylor, G. R. N. and Purmalis, M., Update on Cottonscan: An Instrument for Rapid
and Direct Determination of Fiber Maturity and Fineness, Proceed Beltwide CottonConf., 2302–2307, 2005.
58. Dever, J. K., Gannaway, J. R. and Baker, R. V., Influence of Cotton Fiber Strengthand Fiber Fineness on Fiber Damage During Lint Cleaning, Textile Res. J., 58, 433–438, 1988.
59. Duckett, K. E., Krowicki, R. S. and Cheng, C. C., Some Observations on SingleFiber and Flat-Bundle Tensile Tests, and on the Application of Weak-link Theory tothe Determination of True Zero-gauge Tensile-Test Length of Single Cotton Fibers,Applied Polymer Symposium, 27, 359–368, 1975.
60. Suh, M. W., Cui, X. and Sasser, P. E., New Understanding of HVI Tensile Data
Based on Mantis Single Fiber Test Results, Proceed. Beltwide Cotton Conf., 1400–1403, 1994.
61. Taylor, R. A. and Godbey, L. C., A Control on Specimen Brushing will Improve HVI
Strength Measurements, Proceed. Beltwide Cotton Conf., 1083–1084, 1993.62. Taylor, R. A., Cotton Tenacity Measurements with High Speed Instruments, Text.
Res. J., 56, 92–101, 1986.63. Taylor, R. A., The True Strength of HVI Bundles Part B: Stelometer and Reference
Measurements, Present. to ITMF HVI Working Group Meeting, Bremen, Germany,1994.
64. Godbey, L. C., Taylor, R. A. and Brown, R. S., Development of a ComputerizedMethod to Measure Cotton Tenacity at Different Extension Rates, Text. Res. J., 61,452–460, 1991.
65. Barker, R. L. and Lyons, D. W., Instrumental Procedures for Analysis of Non-LintParticles in Cotton, ASME Trans. J. Engr. For Industry, 98, No. 7, 1976.
66. Taylor, R. A., An Update on HVI Technology: Its Use in Optimizing Cotton Fiber
Performance and Utilization, Present. to ITMF HVI Working Group, Bremen, Mar.1992.
67. Pearson, N. L., Neps and Similar Imperfections in Cotton, USDA Technical Bulletin,No. 396, Nov. 1933.
68. Pearson, N. L., Naps, Neps, Motes and Seed Coat Fragments, US Agricultural
Market Service Report, Mar. 1937.69. Pearson, N. L., Neps in Cotton Yarns as Related to Variety, Location and Season of
Growth, USDA Technical Bulletin, No. 878, Dec. 1944.70. Mangialardi, G. J., Neps in Ginned Lint: A Review of Research, Proc. Beltwide
Cotton Conf., 358–368, 1985.71. Van Der Sluijs, M. H. J. and Hunter, L., Neps in Cotton Lint, Textile Prog., 28 (4),
51 pp., 1999.72. Alon, G. and Alexander, E., Mechanism of Nep Formation, Melliand Textilber., 59,
792–795, 1978.73. Marth, C. T., Arthur, H. E. and Berkley, E. E., Fiber fineness (Micronaire), Neps in
Card Web, and Yarn Appearance Grades, Textile Res. J., 22, 561, 1952.74. Hebert, J. J., Boyleston, E. K. and Thibodeaux, D. P., Anatomy of a Nep, Textile Res.
J., 58, 380–382, 1988.
Cotton fibre quality 99
75. Watson, M., Mechanical and Biological Neps and Their Influence on Quality, InternalReport, Cotton Inc., Raleigh NC, 1991.
76. Bel-Berger, P. D., Vinyard, B.T., Thibodeaux, D.T., Von Hoven, T.M. and Columbus,E.P., The Effect of Harvesting Times on White Specks: A Study of Field to Fabric
Properties, Proceed. Beltwide Cotton Conf., 1440–1444, 1995.77. Douglas, K. (ed.), Measurement of the Quality Characteristics of Cotton Fibers,
Uster News Bulletin, No. 38, July, 1991.78. Jones, P. C. and Baldwin, J. C., The influence of seed-coat neps in yarn manufacturing,
Uster Solutions, No. 3, Sep. 1995.79. Schlicter, S. and Lösbrock, P., On-line Test of Neps and Trash Particles at High
Performance Cards, Proceed. Bremen Int. Cotton Conf., Bremen, 1996.80. Hequet, E. and Wyatt, B., Evidence of the Origins of Sugar Causing Stickiness in
Cotton, Proceed. Beltwide Cotton Conf., 698–700, 1999.81. Hequet, E. and Abidi, N., Processing Sticky Cotton, Implication of Trehalulose in
Residue Build-up, J. Cotton Sci., 6, 77–90, 2002.82. Ellsworth, P. C., Tonstrad, Leser, J., Goodell, P. B., Godfrey, L. D., Hennebury, T. J.,
Hendrix, D., Brushwood, D., Naranjo, S. E., Castle, S. and Nichols, R. L., Sticky
cotton resources and solutions, IPM Series No. 13, Uni. of Arizona, Tucson AZ, 4pp., 1999.
83. Hendrix, D. L., Wei, Y. and Leggett, J. E., Homopteran Honeydew Composition isDetermined by Both the Insect and Plant Species, Comparative Biochemistry
Physiology, 101B, 23–27, 1992.84. Goze, E., Frydrych, R. and Gourlot, J. P., The H2SD: Inter-laboratory Test Results,
Proceed. Beltwide Cotton Conf., 2590–2595, 2005.85. Strolz, H. M., ITMF Cotton Contamination Survey 2001, Proceed. Bremen Int.
Cotton Conf., 40–44, 2002.86. Schindler, C., The ITMF Cotton Contamination of 2005, Proceed. Bremen, Int.
Cotton Conf., 57–60, 2006.87. Vijayshankar, Extraneous Contamination in Raw Cotton Bales: A Spinners Nightmare,
Proceed. Bremen, Int. Cotton Conf., 61–76, 2006.88. Taylor, R. A. and Godbey, L. C., A Reference Method for HVI Strength, Proceed.
Beltwide Cotton Conf., 1076–1079, 1993.89. Taylor, R. A., Moisture Analysis for HVI Testing of Cotton, Textile Res. J., 60, 94–
102, 1990.90. Taylor, R. A. and Godbey, L. C., Evaluation of High Speed Methods to Measure
Cotton Moisture for HVI Testing, Proceed. Beltwide Cotton Conf., 1418–1421, 1994.91. ASTM D2495, Oven Method of Moisture Measurement.92. Conrad, C. M., Determination of Wax in Cotton Fibre, A New Alcohol Extraction
Method, Ind. Eng. Chem. Anal. Ed.,16, 745–748, 1944.93. Fargher, R. G., Cotton Wax, Brit. Assoc. Adv. Sci. Rept., 436, 1923.94. Fargher, R. G. and Probert, M. E., Alcohols Present in the Wax of American Cotton,
J. Textile Instit., 15, 337–346T, 1924.95. Hornoff, Gunther v. and Richter, H., Chemical Composition of Cotton Fibres
Originating from various Areas, Faserforsch. Textiltech., 15, 165–177, 1964.96. Kling, A., and Hofstetter, H. H., Lipids in Cotton, Seifen-Oele-Fette-Wachse, 92,
323–329, 1966.97. Heyn, A. N. J., Relationship of Wax Content to Maturity of Cotton, Letters to the
Editor, Text. Res. J., 19, 711–714, 1949.98. Marsh, P. B., Barker, T. K., Kerr, T. and Butler, M. L., Wax Content as Related to
Surface Area of Cotton Fibers, Text. Res. J., 20, 288–297, 1950.

Cotton: Science and technology100
99. Gordon, S. G., Evans, D., Church J., Petersen, P., Thom, S. L. and Woodhead, A.,A Survey of Cotton Wax Contents in Australian Cotton, Report to the Australian
CRDC, 34 pp., Nov. 2002.100. Cui, X. L., Price, J. B., Calamari, T. A., Hemstreet J. M. and Meredith, W., Cotton
Wax and its Relationship with Fibre and Yarn Properties, Part I: Wax Content andFibre Properties, Text. Res. J., 72, 399–404, 2002.
101. Price, J. B., Cui, X. L. and Calamari, T. A., Cotton Wax and its Relationship withFibre and Yarn Properties, Part II: Wax Content and Yarn Properties, Text. Res. J.,72, 631–637, 2002.
102. Heyn, A. N. J., Causes and Detection of Damage in Raw Cotton, Textile Ind., 120,137–145, 1956.
103. Perkins, H. H. and Brushwood, D. E., Cavitoma – A Modern Assessment, Proceed.Beltwide Cotton Conf., 1654–1657, 1997.
104. Allen, S., Auer, P. D. and Pailthorpe, M. T., Microbial Damage to Cotton, Textile
Res. J., 65, 379–385, 1995.
The genetic modification of cotton 101
Part II
Production processes for cotton

Cotton: Science and technology102

103
4.1 Introduction
For several thousand years, farmers have been altering the genetic makeupof the crops they grow. Human selection for features such as faster growth,larger seeds or sweeter fruits has dramatically changed domesticated plantspecies compared with their wild relatives. In cotton, sexual crosses betweenplants with desirable characteristics and selection within their progeny resultedin varieties with increased fibre quality and yield and the ability to grow intemperate regions (May, 1999). However, despite the remarkable advancesmade by traditional plant breeding in the twentieth century, yield potentialhas reportedly plateaued over the last 30 years (Meredith Jr, 2000). Such ascenario suggests that the limits of the material available for conventionalplant breeding have been reached. The continued viability and future of thecotton industry therefore demands new sources of diversity and novel genetictechniques.
Plant breeding has been revolutionised by molecular genetic approacheswhich permit the manipulation and insertion of genes not only from sexuallycompatible species but of any origin. Foreign genes introduced into the plantgenome may confer novel traits which enhance crop quality either directly,by influencing morphological traits, or indirectly by providing protectionagainst biotic and abiotic stresses in the environment. Transgenic crops grownin the world today include soybean, rice, tomato, potato and cotton, in whichcharacters such as nutritional quality, insect resistance, disease resistance,herbicide resistance and salinity tolerance have been genetically manipulated.
Current crop improvement programs involve a combination of plant breeding(hybridisation and selection) and plant biotechnology approaches, and it isthe latter which will be considered in this chapter. The advantages andlimitations of conventional plant breeding will be considered alongside thepotential offered by DNA technology. Cotton crop genetics will be discussed,together with the gene delivery and regeneration systems used to generatetransgenic lines. An overview of the transgenic cotton grown today on a
4The genetic modification of cotton
S O R F O R D, S D E L A N E Y and J T I M M I S,The University of Adelaide, Australia
Cotton: Science and technology104
commercial scale will be presented, and the hopes and fears for geneticallymodified (GM) crops discussed more generally. Examples of engineeringprojects for improved yield and cotton fibre quality will be used to illustrateprospects for the future of genetic manipulation in this species.
4.2 Advantages and limitations of conventionalplant breeding
4.2.1 Evolutionary origins of cultivated cotton
Four species in the genus Gossypium, tribe Gossypiaeae and family Malvaceaecomprise the cultivated cottons (Fryxell, 1969). Two species were domesticatedin Africa and/or India, one in South America and one in Mesoamerica (Lee,1980). The Old World cultivated cottons, G. arboreum and G. herbaceum,are diploid (2n = 26), that is, their cells contain two sets of chromosomes,one haploid set from each parent. They have a haploid chromosome numberof 13, the basic number for the genus. The New World commercial cottonsare the allotetraploid (2n = 4x = 52) cottons G. hirsutum (Upland cotton) andG. barbadense (Pima, Sea Island and Egyptian cottons). Their cells containfour haploid sets of chromosomes or two diploid sets, double the normalnumber. Although the diploid species G. arboreum is still intensively bredand cultivated in Asia, it is the improved tetraploid species that are mostcommonly grown, with medium staple G. hirsutum accounting for over 90%of world cotton production.
The genomes of diploid Gossypium species have been divided into eightgroups (designated A to K) on the basis of cytogenetic features such aschromosome size and meiotic pairing (Endrizzi et al., 1985). These groupscorrespond with distinct biogeographical regions, such that species that evolvedin a particular region share a common genomic grouping. Hence specieswith A, B, E and F genomes have an African/Asian origin; species with C,G and K genomes originated in Australia; and D genome species evolved inthe Americas. Nearly all the possible genomic combinations can be madeartificially, though some of the hybrids are sterile. All of the tetraploid speciesintercross readily, although the progeny are frequently genetically unstable,and crossability does not always reflect phylogenetic affinities. For example,the Old World cultivated species (A and D genomes) are difficult to crosswith AD allotetraploid species (Lee, 1980).
Allotetraploid cotton (designated AADD) is thought to have arisen fromhybridisation between ancestral AA and DD diploid species to produce ahybrid (AD) that underwent chromosome duplication (reviewed by Adamsand Wendel, 2004). G. herbaceum (A genome) and G. raimondii (D genome)are generally considered to be extant representatives of the ancestral A andD genome donors (Endrizzi et al., 1985). The hybridisation and polyploidisation

The genetic modification of cotton 105
event is thought to have occurred after the ocean migration of the A genomefrom Asia to Mesoamerica approximately 1–2 million years ago (Wendel,1989). Subsequent radiation of the allotetraploid gave rise to the five modernallopolyploid Gossypium species (G. hirsutum, G. barbadense, G. tomentosum,
G. darwinii and G. mustelinum). In addition to the cultivated cottons, thereare over 30 wild taxa in the genus Malva, distributed from dry to tropical andsubtropical climates around the world (Fryxell, 1969). This germplasm, alongwith stocks and obsolete varieties of the cultivated species, provides animportant resource for potential use in improving cultivated cottons. Manywild species of cotton have valuable agronomic traits such as disease andinsect resistance and salinity and drought tolerance. However, only in oneinstance has a cross between Gossypium and a related Malva species beenreported (Vysotski, 1958).
4.2.2 Conventional plant breeding
The generation of improved cotton varieties began with the domestication ofcotton for textile production. Modern cotton breeding programs originatedin the early 20th century, driven by an increasing demand for fibre strengthand quality in the international textile market (May, 1999). Plant breedingprograms have produced most of the varieties used in commercial cottonproduction. In Australia, for example, decades of organised plant breedingby the Commonwealth Scientific and Industrial Research Organisation (CSIRO)have produced a range of elite cotton cultivars suited to Australian conditionsthat incorporate useful characteristics from a number of varieties. This efforthas resulted in a 20% increase in average cotton fibre strength and a 5%increase in cotton fibre length in the last fifteen years.
Plant breeding and selection techniques have clearly produced substantialimprovements in the cotton germplasm, but also have a number ofdisadvantages. For example, a large amount of time and significant resourcesare required for plant growth, reproduction and selection. Once a desirablegene has been introduced into a species, several rounds of backcrossing arerequired to restore the commercial genetic background, with the result thatsix to ten years of breeding are required for development of a new cottonvariety (John, 1999). In addition, the need for hybridisation limits plantbreeding to genetically compatible species capable of producing fertile progeny.This prevents the direct introduction of traits from wild cotton species intocommercial cotton through conventional breeding programs.
4.2.3 Genetics in cotton breeding
The aim of a plant breeder is to achieve a favourable combination of genesfor incorporation into a new crop. Traditionally this has been done with a
Cotton: Science and technology106
basic knowledge of how genes are inherited but in the absence of anyinformation about the molecular nature of the genes themselves. Manycharacteristics of horticultural and some agronomic interest are controlledby a single gene (are monogenic) whose effects fall into a small number ofdiscontinuous classes. For example, resistance is mostly monogenic, so aplant containing one form of the gene will be resistant, whilst a plant with avariant gene is susceptible. In this case the plant breeder can make a predictionabout the progeny of a particular cross and breeding programs can be readilydirected towards a specific aim. However, many important agronomic targetsfor crop improvement, for example yield, are polygenic and showcharacteristically continuous variation that is more difficult to evaluate inbreeding programs. That is, the trait has a wide spectrum of variation and iscontrolled by a number of genes, each of which exerts a small influence onthe character we observe. The genes that contribute to a polygenic trait arereferred to as quantitative trait loci, or QTLs, and the mapping and trackingof QTLs is being used increasingly to augment traditional methods of plantand animal breeding, by allowing marker-assisted selection.
Quantitative trait loci (QTLs) associated with fibre quality and othercharacteristics have been identified in a number of studies, and, once statisticallylinked to a particular trait, may be useful for the selection of superior linesduring the breeding process (marker-assisted selection). For example, Zhanget al. (2003a) identified a QTL from Acala 3080 cotton which accounted formore than 30% of variation in fibre strength. Paterson et al. (2003) isolateda large number of QTLs associated with fibre quality traits expressed underwell-irrigated and water-stressed conditions, and QTLs associated with lowerosmotic potential, drought tolerance and increased seed cotton yield wereidentified by Saranga et al. (2001). Despite coming from an ancestor thatdoes not produce spinnable fibres, the D genome interestingly appears tocontribute substantially to the fibre quality of tetraploid cottons (Jiang et al.,1998).
Once they have been identified in controlled experiments, tracking theinheritance of QTLs using molecular markers enables identification of themost promising cotton breeding lines. In this process genetic sequences ormolecular markers that are part of, or closely linked to, a useful QTL areused to identify which plants in a progeny carry the targeted trait and whichdo not. This greatly facilitates the difficult or impossible task of evaluatingminor changes in a particular trait, but the process is heavily reliant on thequality of the underpinning research that established the significance of aparticular QTL. DNA markers used in cotton include restriction fragmentlength polymorphisms (RFLPs), random amplified polymorphic DNAs(RAPDs), simple sequence repeats (SSRs) and amplified fragment lengthpolymorphisms (AFLPs) (reviewed in Mei et al., 2004).
The genetic modification of cotton 107
Determining the positions of DNA markers on the chromosomes, or genomemapping, has been hampered in cotton by inadequate DNA sequenceinformation and the relatively large size of the cotton genome (particularlyin the allotetraploid cottons). Linkage maps, in which genes and sequencesare mapped by recombination during meiosis (the two-part process of celldivision whereby gametes are produced with half the number of chromosomesof the parent cell), have been independently developed by a number ofgroups, but the maps have not been integrated with each other, and individuallyprovide as little as 10% coverage of the genome (Mei et al., 2004). In 2001the International Cotton Genome Initiative was formed, with the aim of co-ordinating cotton genome research, and in 2004 more comprehensive geneticmaps for the diploid (D) and allotetraploid (AD) cotton genomes were published(Rong et al., 2004). These maps consist of sequence tagged sites (STS) at3,347 loci, giving a resolution of 1.72 centiMorgans (cM) (~600 kilobases(kb)) in the AD genome and 1.96 cM (~500 kb) in the D genome. This worksignificantly increases the number of markers available for QTL analysisand positional cloning and provides a basis for the comprehensive sequencingof cotton genomes.
4.3 The molecular genetics of cotton
4.3.1 How genes control plant structure and function
Gene activity underlies the form and function associated with all life processes,from cell structure and behaviour to development and reproduction. Therefore,the genes of a plant, which number between 25,000 and 40,000, determineall its characteristics, such as leaf shape and flowering time, and determineits responses to the environment. For a crop this will include fluctuatingbiotic stresses, such as insect and fungal parasites, and abiotic stresses, suchas drought and mineral deficiency, that influence crop yield and quality.Most genes carry the instructions for making specific proteins, and the processby which a gene generates a protein product, which then carries out itscellular function, is known as gene expression. At any one time, only someof the genes in a particular genome are active, and only a specific subset ofgenes is active in each tissue and organ. In this way a particular protein isonly produced where and when it is needed. The suite of proteins producedby a specific subset of genes is what gives each cell, tissue and organ itsunique properties and defines its biological function.
The phenotype of any organism, that is, anything which is part of itsobservable structure, function or behaviour, is determined by a combinationof genetic (genotypic) and environmental factors. Some characters will bestrongly influenced by the environment, while others will be more directlydetermined by the genes being expressed (i.e. have a higher heritability).

Cotton: Science and technology108
The latter have the most immediate potential as targets for genetic engineering.For example, most fibre properties are significantly influenced by genes,with heritability estimates varying between approximately 40 and 80% formost fibre parameters (May, 1999).
4.3.2 Gene discovery in cotton
The use of transgenic plants for the generation of improved cotton varietiesrelies firstly on the identification of useful genetic material that can beincorporated into existing commercial varieties. However, identifying andlocating genes for agriculturally important traits is currently the most limitingstep in the transgenic process. We still know relatively little about the specificgenes required to enhance yield potential, improve stress tolerance, modifychemical properties of the harvested product, or otherwise affect plantcharacters. As previously discussed, many traits are polygenic, such thatidentifying a single gene involved with a trait is often not possible. Even inthe case of single genes with large effects, simple identification is normallyinsufficient and scientists must understand how a gene is regulated, whatother effects it might have on the plant, and how it interacts with other genesactive in the same biochemical pathway.
A clear place to begin the search for useful genes is in the germplasm ofthe cotton species themselves. A number of molecular genetic techniqueshave been employed in this work, including isolation of genes on the basisof their known function in another species, characterisation of genes expressedspecifically in particular tissues and, more recently, comprehensive analysisof gene expression using cDNA microarrays and random sequencing ofexpressed sequence tags (ESTs).
The four phases of cotton fibre growth and development are regulated bythe expression of several thousand genes in the fibre cell (John and Crow,1992). These genes are often expressed in both cotton fibres and other planttissues, although a proportion (perhaps several hundred) are expressedpredominantly or exclusively in the fibre (Ji et al., 2003). Genes that arepreferentially expressed in the fibre are likely to have important functions innormal fibre development and elongation and these have been the focus ofnumerous molecular studies (reviewed by Wilkins and Jernstedt, 1999). Areferenced selection of fibre-expressed genes is presented in Table 4.1. Inaddition, expressed sequence tags (ESTs), generated by the random sequencingof cDNA clones, have been assembled by a number of research groups fromfibre libraries of both diploid and tetraploid cotton, such that there are nowmany thousands of cotton ESTs in the public databases (e.g. see Arpat et al.,2004, Haigler et al., 2005).
Whilst we can assign putative functions for cotton genes on the basis oftheir sequence similarity to known genes, functional analysis of the genes
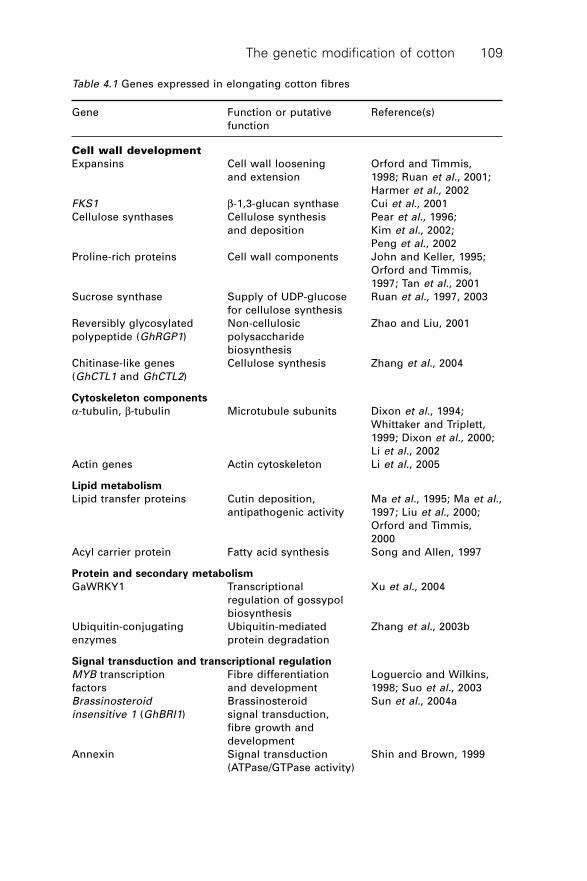
The genetic modification of cotton 109
Table 4.1 Genes expressed in elongating cotton fibres
Gene Function or putative Reference(s)
function
Cell wall development
Expansins Cell wall loosening Orford and Timmis,
and extension 1998; Ruan et al., 2001;
Harmer et al., 2002
FKS1 b-1,3-glucan synthase Cui et al., 2001
Cellulose synthases Cellulose synthesis Pear et al., 1996;
and deposition Kim et al., 2002;
Peng et al., 2002
Proline-rich proteins Cell wall components John and Keller, 1995;
Orford and Timmis,
1997; Tan et al., 2001
Sucrose synthase Supply of UDP-glucose Ruan et al., 1997, 2003
for cellulose synthesis
Reversibly glycosylated Non-cellulosic Zhao and Liu, 2001
polypeptide (GhRGP1) polysaccharide
biosynthesis
Chitinase-like genes Cellulose synthesis Zhang et al., 2004
(GhCTL1 and GhCTL2)
Cytoskeleton components
a-tubulin, b-tubulin Microtubule subunits Dixon et al., 1994;
Whittaker and Triplett,
1999; Dixon et al., 2000;
Li et al., 2002
Actin genes Actin cytoskeleton Li et al., 2005
Lipid metabolism
Lipid transfer proteins Cutin deposition, Ma et al., 1995; Ma et al.,
antipathogenic activity 1997; Liu et al., 2000;
Orford and Timmis,
2000
Acyl carrier protein Fatty acid synthesis Song and Allen, 1997
Protein and secondary metabolism
GaWRKY1 Transcriptional Xu et al., 2004
regulation of gossypol
biosynthesis
Ubiquitin-conjugating Ubiquitin-mediated Zhang et al., 2003b
enzymes protein degradation
Signal transduction and transcriptional regulation
MYB transcription Fibre differentiation Loguercio and Wilkins,
factors and development 1998; Suo et al., 2003
Brassinosteroid Brassinosteroid Sun et al., 2004a
insensitive 1 (GhBRI1) signal transduction,
fibre growth and
development
Annexin Signal transduction Shin and Brown, 1999
(ATPase/GTPase activity)
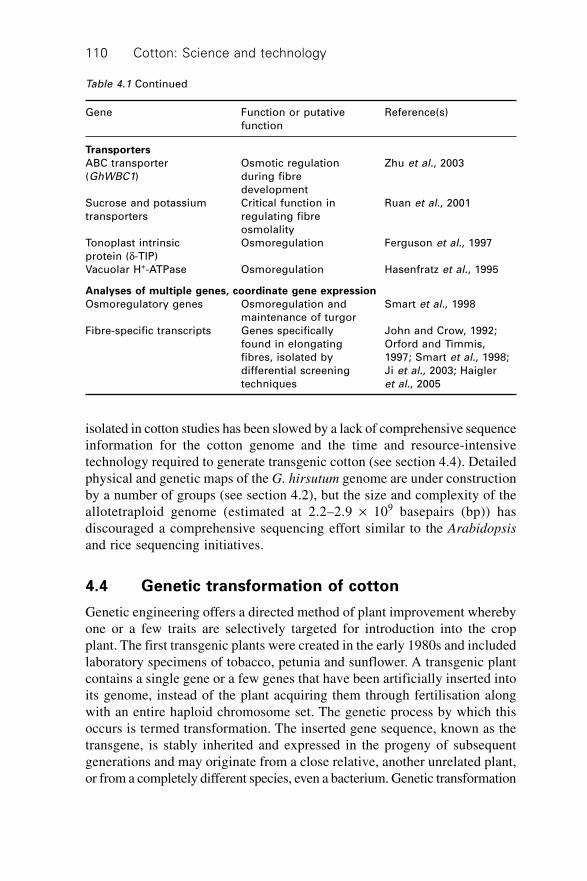
Cotton: Science and technology110
Transporters
ABC transporter Osmotic regulation Zhu et al., 2003
(GhWBC1) during fibre
development
Sucrose and potassium Critical function in Ruan et al., 2001
transporters regulating fibre
osmolality
Tonoplast intrinsic Osmoregulation Ferguson et al., 1997
protein (d-TIP)
Vacuolar H+-ATPase Osmoregulation Hasenfratz et al., 1995
Analyses of multiple genes, coordinate gene expression
Osmoregulatory genes Osmoregulation and Smart et al., 1998
maintenance of turgor
Fibre-specific transcripts Genes specifically John and Crow, 1992;
found in elongating Orford and Timmis,
fibres, isolated by 1997; Smart et al., 1998;
differential screening Ji et al., 2003; Haigler
techniques et al., 2005
Table 4.1 Continued
Gene Function or putative Reference(s)
function
isolated in cotton studies has been slowed by a lack of comprehensive sequenceinformation for the cotton genome and the time and resource-intensivetechnology required to generate transgenic cotton (see section 4.4). Detailedphysical and genetic maps of the G. hirsutum genome are under constructionby a number of groups (see section 4.2), but the size and complexity of theallotetraploid genome (estimated at 2.2–2.9 ¥ 109 basepairs (bp)) hasdiscouraged a comprehensive sequencing effort similar to the Arabidopsis
and rice sequencing initiatives.
4.4 Genetic transformation of cotton
Genetic engineering offers a directed method of plant improvement wherebyone or a few traits are selectively targeted for introduction into the cropplant. The first transgenic plants were created in the early 1980s and includedlaboratory specimens of tobacco, petunia and sunflower. A transgenic plantcontains a single gene or a few genes that have been artificially inserted intoits genome, instead of the plant acquiring them through fertilisation alongwith an entire haploid chromosome set. The genetic process by which thisoccurs is termed transformation. The inserted gene sequence, known as thetransgene, is stably inherited and expressed in the progeny of subsequentgenerations and may originate from a close relative, another unrelated plant,or from a completely different species, even a bacterium. Genetic transformation
The genetic modification of cotton 111
requires two fundamental steps: introduction of the gene and regeneration ofintact plants.
4.4.1 Transfer of genes into cotton
The most common method for engineering genetically modified plants usesthe remarkable biology of the soil-borne bacterial pathogen Agrobacterium
tumefaciens. Naturally occurring Agrobacterium infect damaged plant tissueand inject their DNA into the cells of the plant. The DNA stably integratesinto the DNA of the plant and alters plant metabolism to produce conditionsfavourable to bacterial growth (visible as ‘crown gall’ disease). WildtypeAgrobacterium has been modified to remove its pathogenic characters andcan be used to transfer any desired gene into the plant genome. The firstsuccessful Agrobacterium-mediated transformation of cotton (Firoozabadyet al., 1987; Umbeck et al., 1987) paved the way for commercial release ofthe first generation of transgenic cotton (Perlak et al., 1990) and most transgeniccotton grown commercially today was originally transformed using this method.Although used widely in cotton biotechnology and with a number of successstories, Agrobacterium-mediated transformation is not without its problems.Most notable is its limitation to a few specific cultivars which can be regeneratedin tissue culture (see below).
Direct gene delivery systems, without using a bacterial vector, weredeveloped by the biotechnology sector especially for recalcitrant species orthose without established transformation protocols. The premise of suchdelivery systems is to introduce genes directly into the host genome in amanner which is genotype-independent and bypasses tissue culture-relatedregeneration difficulties. In cotton the methods which have beeninvestigated include direct transfer of DNA into protoplasts and particle gunbombardment.
Although direct transformation of cotton protoplasts has been reported(Peeters et al., 1994), the isolation of protoplasts is a difficult procedure andthe method has not been extended beyond the easily regenerable varieties.Microprojectile bombardment (or ‘biolistics’) employs high-velocity metalparticles to deliver biologically active DNA into plant cells, and its discoverywas seen as a way for effective gene transfer into tissues and species that areotherwise inaccessible to genetic modifications using recombinant DNAtechniques. Genetic engineering of such recalcitrant crops as soybean andrice is now possible and in some cases routine. A number of different cottonvarieties, including a few in commercial production, have been transformedby biolistic bombardment (Wilkins et al., 2000). However, this gene deliverysystem is beset by a number of disadvantages and is certainly not a panacea;major technical and scientific barriers need to be overcome to bring thetechnology to its full potential (Wilkins et al., 2000).

Cotton: Science and technology112
4.4.2 Regeneration of transgenic cotton plants
The second requirement of transformation, the generation of fertile plantsderived from single cells, has proven to be particularly difficult to surmountin cotton. The development of cell culture techniques that permit efficientDNA delivery, selection of transformed cells and regeneration to normaltransgenic plants has involved many years of research and all availablesystems for cotton are inefficient compared with more amenable speciessuch as tobacco.
Somatic embryogenesis is the process by which plant embryos are generatedfrom single isolated plant cells, rather than via the normal reproductiveprocess. It is the most common and reliable technique for the recovery ofwhole cotton plants from single transformed cells. First reported in cotton byFiroozabady et al. (1987) and Umbeck et al. (1987), somatic embryogenesisinvolves the Agrobacterium-mediated transformation of cotton cells withconstructs containing antibiotic selectable marker genes, followed by extensivetissue culture to generate embryogenic callus, somatic embryos and (afterapproximately 12 months) whole transgenic plants. After antibiotic selectionand tissue culture, a high percentage of somatic embryos are germlinetransformants derived from single cells, such that several independentlytransformed lines may be generated in a single transformation (Leelavathi et
al., 2004). The main disadvantage with somatic embryogenesis is that theprocess is poorly understood and highly genotype-dependent, with manyelite cotton varieties having a low regeneration potential. The strategy usedinternationally is to first transfer the gene of interest to a variety with highembryogenic potential (usually Coker), and then introduce the trait into acommercial line by backcrossing. This procedure adds several years to thedevelopment of an elite transgenic variety.
In recent times there has been an increasing focus on the direct transformationof meristems, shoot apices and protoplasts in cotton genetic engineering(Wilkins et al., 2000; Li et al., 2004), in an effort to bypass the genotypedependence associated with somatic embryogenesis. In this case whole plantsare generated in as little as three months, but the frequency of stable germlineintegration events is low. That is, the transgene cannot be passed on to theprogeny. An improvement in the procedure is the use of vacuum infiltrationto directly transform pollen (Li et al., 2004), which is then used to fertilisecotton plants. This simple technique is Agrobacterium-mediated but doesnot require tedious preparation of target explant or tissue culture to regenerateplants. Somatic hybridisation provides another potential method for cottontransformation, and is a protoplast-based technique that permits the combinationof genomes from sexually incompatible species. Sun et al. (2004b) appliedthis method to generate a fusion between Coker 201 (G. hirsutum) and a wildvariety (G. klotzschianum). Although confirmed somatic hybrids were

The genetic modification of cotton 113
produced, the stability of the hybrids was unknown and several rounds ofbackcrossing will be required to generate a novel hybrid cultivar.
Despite these technical advances, alternative techniques for cottontransformation all suffer from low transformation efficiencies and have perhapsnot realised the potential first envisaged for them. In the past five years theresearch emphasis has returned to Agrobacterium-mediated transformationand regeneration via somatic embryogenesis, and this method is likely toremain the preferred method for transformation of cotton, since its advantagessignificantly outweigh the disadvantages compared to other methods. Inaddition, recent research has shed light on the process of embryogenesis(Poon et al., 2004) and refined regeneration protocols have significantlyincreased the range of varieties which can be genetically modified (Sakhanokhoet al., 2001; Zhang et al., 2001; Mishra et al., 2003). Such advances havemade somatic embryogenesis more effective and led the industry a stepcloser to transformation of elite cotton cultivars and enhancement of geneticdiversity in molecular breeding programs.
4.5 Genetic engineering in cotton
The implementation of transgenic crops has been dramatic over the last tenyears, with the driving force behind the biotechnological revolution attributedto only two classes of genes (Willmitzer, 1999). One class confers resistanceto herbicides, whilst the other confers resistance to larvae of certain detrimentalinsects. In cotton, insect pests and competition from weeds contributesubstantially to crop losses and to fibre yield and quality. Cotton crops aretargeted by a variety of lepidopteran and coleopteran insects, and over 100weed species have been recorded in cotton fields worldwide (Wilkins et al.,2000). Weeds compete with crop plants for water, nutrients and availablesunlight, harbour insect pests and reduce the quality of the harvested cottonfibre by increasing the trash content. Together with conventional cropmanagement practices, growers rely heavily on chemicals to control bothinsects and weeds. Pesticides are routinely used to control insect populations,but heavy pesticide use encourages the evolution of insect resistance andincreases the costs and environmental effects of cotton production. Herbicidesmay reduce or eliminate the cost of manual or mechanical weeding, butconventional cotton is generally susceptible to herbicide damage. Therefore,the development of insect- and herbicide-resistant cotton has been a majorfocus of cotton transformation research.
Insect-resistant transgenic cotton (or Bt cotton) represents the first majorcrop genetically engineered for commercial production. It was first developedin the 1980s by Monsanto and is now widely used in commercial cottonproduction. Grown initially as Bollgard‚ in the USA and Ingard‚ in Australia,Bt cotton contains one or two cry toxin genes from the soil bacterium Bacillus

Cotton: Science and technology114
thuringiensis. The cry genes encode crystalline proteins that cause lethaldamage to the gut lining (lamae) of insect larvae that feed preferentially oncotton. In contrast with many insecticides, cry proteins are not toxic tomammals or birds and have limited effects on non-target invertebrates.Moreover, field resistance to Bt transgenic plants has not been observedsince the commercial release of Bt cotton in 1996. This suggests that resistancemanagement strategies and the biology of Bt action may be successful inpreventing the rapid evolution of resistance (see section 4.6). After ten yearsof commercial production, it is clear that Bt cotton has been economicallyadvantageous to growers and has significantly reduced the use of pesticidesprays. In Australia, for example, the planting of Bt cotton has reducedpesticide applications by up to 80% per growing season since 1998(Fitt, 2003).
The large variety of weeds that infest cotton crops and the herbicidesavailable to combat them have been covered elsewhere (Wilkins et al., 2000)and will not be considered in detail here. Most herbicides have a narrowrange of effectiveness, so usually a combination of herbicides is required tocontrol all problematic weed species over a growing season. An exception isglyphosate [(N-phosphonomethyl)glycine] or Roundup‚, a broad-spectrum,non-selective herbicide which is active on most species of green plants butis non-toxic to mammals and fish and rapidly degraded by soil microorganisms(Williams et al., 2000). Roundup Ready‚ cotton contains a herbicide tolerancegene (cp4 epsps) from Agrobacterium that confers resistance to glyphosate(Kishore and Shah, 1988). Glyphosate can therefore be used as a foliar sprayto control weeds in a young Roundup Ready‚ cotton crop, and providesgrowers with an important new tool in weed control.
Crossing of Bt transgenic cotton with Roundup Ready‚ cotton has produced‘stacked’ varieties, containing Bt toxin genes coupled with herbicide-resistancegenes. The benefits of these dual insect- and herbicide-resistant lines encouragedan increase in the planting of transgenic cotton to 28% of the total worldcotton crop in 2004 (Lawrence, 2005). In the USA, adoption of all GMcotton, taking into account acreage with either or both Bt and herbicide-tolerant traits, reached 79% in 2005 (Fernandez-Corneio, 2005). In addition,over 95% of Australia’s cotton growers planted Bollgard“II or RoundupReady“ GM cotton for the 2004–2005 season, translating to over 70% of thecrop (CottonAustralia, 2005).
Transgenic varieties with a number of commercially valuable traits otherthan insect- and herbicide-resistance have also been developed. These varietieshave not been commercially released as yet and instead may contribute toconventional breeding programmes. Included are varieties with improvedtolerance to desiccation and nutritionally enhanced oilseed. In addition, geneticmodification has been used extensively in scientific research aimed atinvestigating the function of cotton genes, many of which may have a

The genetic modification of cotton 115
commercial application. Transgenic cotton varieties generated prior to 2000are reviewed in Wilkins et al. (2000), and subsequent reports are presentedin Table 4.2 and discussed in the following section.
Table 4.2 Transgenic cotton varieties generated since 2000
Reference(s) Promoter/transgene Summary of results
cassette
He et al., Synthetic ‘super’ promoter Increased fibre yield
2005 derived from Agrobacterium (accompanied by improved
mannopine synthase driving photosynthesis and nitrogen
expression of a vacuolar assimilation) under high salt
Na+/H+ antiporter encoded conditions
by the Arabidopsis AtNHX1
gene
Light et al., CaMV 35S promoter Overexpression of Nt107 in
2005 driving expression of the tobacco increased tolerance
glutathione-S-transferase to a number of stressors
(GST)/glutathione (including herbicide,
peroxidase (GPX) gene temperature extremes and
Nt107 from Nicotiana salt), but these effects were
tabacum (tobacco) not observed in Nt107
cotton
Li et al., 2002 b-tubulin gene promoter High-level GUS expression
(GhTUB1) driving GUS only in fibre and primary
gene gusA root tips
Li et al., 2004 CaMV 35S promoter Increased fibre length and
driving expression of the strength but reduced
cellulose synthase genes micronaire
acsA and acsB from
Acetobacter sylinum
Li et al., 2005 Promoter of actin gene GUS expression was
GhACT1 driving expression detected predominantly in
of GUS or dsRNA designed young fibres of
to inhibit expression of GhACT1::GUS plants. Fibre
endogenous GhACT1 by elongation was significantly
RNA interference. reduced in GhACT1 RNAi
plants, indicating a role for
GhACT1 in fibre elongation.
Liu et al., Soybean lectin promoter Nutritionally enhanced seeds
2002a; Liu driving seed-specific with high oleic or high steric
et al., 2002b expression of antisense or acid and low palmitic acid
hairpin RNA to alter content
fatty acid composition of
cottonseed oil by silencing
fatty acid desaturase
genes ghSAD1 and
ghFAD2-1.

Cotton: Science and technology116
Table 4.2 Continued
Reference(s) Promoter/transgene Summary of results
cassette
Martin et al., CaMV 35S promoter driving Significant reduction in
2003 expression of antisense gossypol and heliocide
sequence directed against production in plant tissues
(+)-delta-cadinene synthase (especially leaves)
Ruan et al., Strong S7 promoter of the Strong suppression of fibre
2003 subterranean stunt virus initiation and elongation
driving expression of sense
and antisense sequences
directed against sucrose
synthase
Sanjaya et al., CaMV 35S promoter driving Preliminary results suggest
2005 expression of antisense improved resistance to
sequence directed against CLCuD virus infection
movement protein (AV2) of
cotton leaf curl disease
(CLCuD) virus
Singh et al., Constitutive promoter Hybrid Bt gene produced a
2004 driving expression of a functional Bt toxin with
hybrid cry1Ea/cry1Ca enhanced toxicity to the
Bt toxin gene Bt-tolerant Lepidopteran
pest Spodoptera litura
Sunilkumar CaMV 35S promoter GFP detected in most plant
et al., 2002b driving green fluorescent tissues including cotton
protein (GFP) gene fibres
mgfp5-ER
Sunilkumar Cotton a-globulin promoter GUS expressed at high levels
et al., 2002a driving gusA in cotton seed and almost
entirely absent from other
plant tissues
Yan et al., CaMV 35S promoter driving Improved resistance to wilting
2004 expression of Arabidopsis and increased photosynthesis
GF14l 14-3-3 protein gene under water-deficit conditions
Zhang et al., Chitinase-like gene promoter GUS expression in
2004 (GhCTL2) driving gusA numerous cell types during
secondary wall deposition
4.6 Recent experiments and future targets forgenetic manipulation of cotton
Fibre yield and quality are the major determinants of the value of thecotton crop. Hence, improvement of fibre properties by the introduction ofspecific genes is emerging as an important area of research in cottonbiotechnology. Methods for controlling gene expression within the cotton
The genetic modification of cotton 117
plant are also receiving increased attention, since tissue-specific expressionis likely to optimise the benefits of the transgene. The second generationof transgenic cotton is therefore likely to include varieties with enhancedseed and/or fibre quality in which the expression of a few defined genes istightly controlled.
Genes with a significant influence on fibre quality have been identified ina number of studies and are attractive targets for genetic manipulation. Forexample, Ruan et al. (2003) demonstrated that suppression of sucrose synthase(SuSy) expression in transgenic cotton prevented fibre formation. It followsthat over-expression of SuSy in the elongating cotton fibre could increasefibre length. Similarly, the large number of identified genes that are expressedpreferentially or exclusively in the cotton fibre (see Table 4.1) are likely tohave important roles in fibre development, and manipulation of their expressionmay improve fibre characteristics. Li et al. (2004) generated transgenic cottonexpressing two cellulose synthase genes (acsA and acsB) from the bacteriumAcetobacter xylinum. The fibres of the transgenic plant were approximately15% longer and 17% stronger than wildtype, suggesting that cellulose synthasegenes may be useful in improving fibre properties.
Gene expression is primarily regulated by regions of DNA known aspromoters. The majority of transgenic cotton varieties contain a transgeneregulated by a strong or constitutive promoter such as the 35S promoter fromthe cauliflower mosaic virus (CaMV) (see Table 4.2 and Wilkins et al.,2000). Constitutive promoters produce a high level of gene expression inmost plant tissues. This increases the likelihood of the transgene producingthe desired phenotype, but may also have a number of disadvantages. Transgenecontainment, for example, may be more difficult when the transgene is coupledto a constitutive plant promoter, since plants that gained the promoter-transgenecassette through outbreeding would be likely to express the transgene (seesection 4.7). Similarly, excessive levels of transgene protein may haveunintended environmental or phenotypic effects. These could include theaccidental targeting of beneficial insects with a toxin gene, or reductions inviability or yield due to transgene expression in a large number of non-targettissues.
These problems may be avoided by using a tissue-specific promoter todrive transgene expression primarily within the target tissue. This approachmay also have the advantage of coupling transgene expression to developmentalsignals, resulting in developmentally appropriate modifications to the timingand level of gene expression and enhancement of the desired transgenicphenotype. For example, Sunilkumar et al. (2002a) used the cotton a-globulinpromoter to drive expression of the GUS (b-glucuronidase) reporter gene intransgenic cotton. GUS activity was restricted primarily to the cottonseed,and was enhanced during seed development. This promoter may be usefulfor the engineering of cottonseed with enhanced nutritional or other properties,but with no effect on other properties of the plant.

Cotton: Science and technology118
Fibre-specific promoters restrict gene expression almost completely to thecotton fibre, and have been used in a number of studies to generate transgeniccotton. These studies have primarily involved investigations of fibre developmentand promoter activity, but have also included attempts to enhance fibreproperties (see Wilkins et al. (2000) and Table 4.2). For example, John andco-workers used promoters from the fibre-specific genes FbL2A and E6 todrive expression of the biopolymer synthesis genes phaA and phaB (John andKeller, 1996; Rinehart et al., 1996). These genes enabled production of thepolypropylene-related polymer poly-D(-)-3-hydroxybutyrate (PHB) in thecotton fibre. Fabric spun from PHB-containing fibres demonstrated a slightlylower thermal conductivity than control fabric (John and Keller, 1996). However,no improvements were obtained in other fibre properties, and the benefitswere insufficient for commercial production (John, 1999). Li et al. (2002)demonstrated that the GhTUB1 promoter drives gene expression almostexclusively in the fibre of transgenic plants, and may be useful in the geneticmodification of fibre properties. A number of other promoters from genesexpressed preferentially in the fibre are also promising, however, their expressionprofiles have not been verified in transgenic cotton (e.g. Hsu et al., 1999; Liuet al., 2000; Wang et al., 2004). Similarly, the effects of coupling a strongfibre-specific promoter to a gene with a strong influence on fibre development(e.g. sucrose synthase) are yet to be reported. In 1999 a report appeared in thepopular press (Jingen, 1999) that Chinese scientists had produced transgeniccotton expressing rabbit keratin genes in the fibre. Fibres from the transgenicvarieties were reported to have improved strength and thermal properties, andwere 60% longer than wildtype fibres. These results are promising, but aredifficult to assess since the work is commercially sensitive and has not yetbeen published in the open scientific or patent literature.
Future improvement programmes are also likely to focus on emerginginsect pests of cotton crops, such as aphids and mirids, and on diseases suchas seedling diseases, nematodes, bacterial blight, and the fungal infectionswhich cause Verticillum wilt and Fusarium wilt. Despite the large crop losseswhich occur as a result of diseases, disease-resistant cotton varieties haveyet to reach the marketplace. Existing strategies to combat diseases of cottonrely entirely on crop management practices such as farm hygiene, crop nutrition,crop rotation and use of quality seeds and fungicides. Very little is knownabout the molecular basis of the virulence of cotton pathogens or of plantresistance. Current research includes identification of disease tolerance inexisting commercial cultivars, screening wild cotton germplasm for toleranceand therefore presence of useful resistance genes and using molecular toolssuch as microarrays to compare the activity of genes upon infection ofsusceptible and more resistant varieties. Other studies are focused on thepathogens themselves, such as genetic comparison between different strainsof Fusarium, in order to identify genes involved in pathogenicity.

The genetic modification of cotton 119
4.7 Potential impacts of GM crops
Cultivation of genetically modified (GM) crops is standard practice in modernagriculture. The eight years between 1996 and 2003 saw a staggering 40-fold increase in the worldwide acreage planted to GM crops, with 25% ofcultivated land devoted to GM crops in 2003 (University of Richmond,2004). The development and widespread use of transgenic food crops hasstimulated intense debate on the potential socioeconomic, health andenvironmental impacts of genetic modification. Many of the same issues andconcerns are applicable to non-food crops such as GM cotton, althoughdebate on GM crops should be reviewed on a case-by-case basis. The followingreview describes recent research on the possible impacts of GM crops, witha focus on transgenic cotton. Technologies and management strategies designedto reduce the environmental impacts of GM crops are also discussed.
GM crops present a number of potential risks relative to their conventional(non-GM) equivalents (reviewed by Dale et al. (2002)). Transgenes thatconfer a selective advantage (e.g. herbicide resistance) could increase thepersistence or invasiveness of crop species, and could produce ‘superweeds’if transferred to other transgenic varieties or sexually compatible relatives byhybridisation. High-level expression of insect toxins in Bt crops could placeundue selection pressure on insects to adapt, encouraging the developmentof resistant populations, and may have toxic effects on non-target insects orother organisms. Antibiotic resistance genes are commonly inserted intoGM crops during transformation, and transfer of these genes could encouragethe evolution of antibiotic-resistant bacteria. The proteins produced bytransgenes could also have an allergenic effect or be unexpectedly toxic tohumans or animals, reducing the safety of the GM crop. The incorporationof herbicide-resistance genes in GM crops could encourage increased herbicideuse, resulting in an increase in herbicide contamination of soil and water andreduced weed (and hence farm) biodiversity. A more general concern is thatmultinational corporations will gain excessive control over the cultivationand use of GM crops.
In cotton, the potential for transgene introgression and ‘superweed’ evolutionare limited by the biology and agronomy of the species. Cotton is generallyself-pollinating and there is limited overlap between cotton crops and sexuallycompatible relatives (see section 4.2), suggesting that transgene flow intowild relatives is unlikely. There is no evidence to suggest that current varietiesof Bt cotton and herbicide-resistant cotton are significantly more invasivethan their conventional counterparts. However, cotton varieties with noveltransgenes (e.g. drought or salt tolerance) that confer a selective advantagemay be more invasive, and could encourage the development of ‘superweeds’in the unlikely event of a gene passing to a wild relative. A number ofmethods have been proposed for limiting the flow of genes from GM crops

Cotton: Science and technology120
to wild relatives. These include the induction of pollen or seed sterility andthe manipulation of GM crops to produce seed set without fertilisation (orapomixis) (Daniell, 2002). Kumar et al. (2004) reported the development ofa cotton variety containing a transgene inserted into the chloroplast genome.The chloroplast displays strict maternal inheritance in most flowering plants(including cotton), and so this method may be useful in preventing themovement of transgenes to wild relatives in pollen. However, Huang et al.
(2003) demonstrated gene transfer from the chloroplast to the nuclear genomein the pollen of transgenic tobacco. This result suggests that trials of a largenumber of cotton plants will be necessary to assess whether maternal inheritanceeffectively prevents gene flow in transgenic cotton.
Although resistance genes have been detected in insects, there have beenno field failures of Bt cotton due to resistance, suggesting that the insectresistance management (IRM) strategies used with Bt crops have so far beeneffective in minimising and managing the risk of insect resistance (Tabashniket al., 2003). Several IRM strategies, including both agronomic and geneticapproaches, have been used in Bt crops, but the ‘high dose/refuge’ approachis the most widespread (Bates et al., 2005). This approach involves expressingthe Bt toxin at a high enough level in the transgenic plant to kill all targetinsects, including individuals with one or two copies of a Bt resistance gene,while providing a ‘refuge’ crop that permits target insect breeding. Therefuge crop encourages the mating of resistant and susceptible individuals to‘dilute’ any resistance genes in the population, and also discourages theevolution of resistance by reducing selection pressure. The high dose/refugestrategy makes a few assumptions that may be violated in a number of targetinsects (reviewed by Bates et al., 2005), and the effectiveness of refuges islimited by their size and location and by the level of grower compliance withrefuge cropping programmes. Moreover, insect resistance to Bt plants canemerge rapidly under laboratory selection (Tabashnik et al., 2003), andresistance to Bt sprays has been recorded in greenhouse and field environments(Tabashnik et al., 1990; Shelton et al., 1993; Janmaat and Myers, 2003).These observations suggest that the high dosage/refuge strategy has significantlydelayed, but perhaps not prevented, the evolution of insect resistance to Bt
crops.The high dose/refuge strategy is likely to be most effective when combined
with another IRM approach such as the ‘pyramiding’ of toxin genes. Pyramidinginvolves the generation of transgenic plants expressing two or more toxingenes. The probability of any individual insect gaining resistance to bothtoxins is extremely low, and significantly delays the evolution of resistance.Several pyramided cotton varieties have been developed, including WideStrike“
(Dow AgroSciences) and Bollgard“II (Monsanto). These varieties contain asecond Bt gene in addition to the cry1Ac gene present in first-generation Bt
cottons. Zhao et al. (2005) demonstrated that concurrent growth of plants

The genetic modification of cotton 121
containing one and two Bt toxins can encourage the rapid evolution of resistanceto the pyramided variety when the two varieties contain an identical Bt gene.This suggests that first generation Bt cotton should be completely removedfrom the farming landscape prior to the introduction of two-gene varieties.In Australia, the use of one-gene Bt cotton was permitted for only two yearsafter the commercial release of Bollgard“II, and now only two-gene varietiesare allowed (CSIRO, 2003; Bates et al., 2005). In addition, a minimum non-Bt refuge of 20% is required for two-gene Bt cotton, compared with 30% forfirst-generation Bt varieties (CSIRO, 2003). This strategy should significantlyreduce the potential for insect resistance to the two-gene varieties, and providesa regulatory model for the full introduction of two-gene varieties in theUnited States and other countries.
Current varieties of transgenic cotton appear to have few negative impactson human health or the environment. Bt proteins have been extensivelystudied for toxic effects and are non-toxic and non-allergenic to humans anda large number of vertebrate and invertebrate species (including beneficialinsects) (Wilkins et al., 2000; Dale et al., 2002). This contrasts sharply withmany synthetic pesticides. The pollen of Bt maize was found to have toxiceffects on the larvae of monarch butterflies, but the impact on butterflypopulations was shown to be negligible under field conditions. Bt proteinsare stabilised in clay and humic soils and may persist for several hundreddays (Stotzky, 2000, 2004), but Cry1Ac protein from transgenic cotton appearsto degrade rapidly in the field (Head et al., 2002). Processing of cottonseedoil involves complete separation of the oil component from protein, andintact Bt proteins or genes have not been detected in the meat or milk ofstock fed on Bt cotton products (Castillo et al., 2004). Similarly, the enzymepresent in Roundup Ready‚ cotton cannot be detected in cottonseed oil orprocessed fibres (Sims et al., 1996), and there is no evidence to suggest thatthe transgene poses a health risk to humans or animals.
Transgenes (including antibiotic resistance genes) could be transferredfrom GM cotton to bacteria or other organisms during the consumption ordegradation of transgenic plant material. However, free DNA is often degradedrapidly in the environment, and horizontal transfer of functional transgenesfrom GM plants to other organisms has not been documented (reviewed byDale et al., 2002). Farm-scale evaluations of glyphosate and glufosinate-ammonium herbicide-tolerant GM crops in Britain suggested lower levels ofbiodiversity than in conventional crops (Squire et al., 2003). This was attributedto a lower number and diversity of weeds (and hence reduced animal foodand habitat), since glyphosate and glufosinate-ammonium are significantlyless toxic to animals than other herbicides (Giesy et al., 2000). However, theuse of glyphosate-resistant crops has permitted a reduction in the use ofmore toxic herbicides (Smyth et al., 2002). Moreover, reduced biodiversitywithin a crop can be readily addressed by land management initiatives suchas the planting of refuges and/or the conservation of natural vegetation.
Cotton: Science and technology122
The herbicide- and pesticide-tolerance traits in GM cotton provide cottonproducers with clear economic benefits. Multinational corporations andgovernment regulators largely control the use and distribution of GM cottonand other crops, but this has not resulted in excessive control over individualproducers and has enabled the implementation of coordinated IRM strategies.Technologies designed to restrict the use of genetically modified crops, suchas the controversial ‘Terminator’ seed sterilisation technology (US Patent5,723,765), have not been used in GM cotton or other crops due to publicopposition. These technologies are unlikely to be further implemented providedthat licensing mechanisms provide the developers of GM crops with anadequate return on investment.
4.8 Conclusions
Genetic manipulation is not restricted to sexually compatible species andmay enable the rapid introduction of commercially valuable traits. Hence, acombination of genetic modification and plant breeding is likely to reducethe time required to develop improved cotton varieties. Biotechnology hasbeen used to develop cotton varieties with a number of improvements includingherbicide and insect resistance, stress tolerance and novel fibre properties.Insect- and herbicide-resistant GM cotton varieties have achieved substantialcommercial success, and now account for approximately a third of the worldcotton crop.
Cotton biology and the management of GM cotton crops address many ofthe environmental and health concerns relating to genetic manipulation.Hybridisation between GM cotton and related wild species is unlikely, resultingin limited potential for gene flow or the evolution of ‘superweeds’. Effectiveinsect resistance management (IRM) strategies have so far been successfulin delaying insect resistance to Bt cotton, and the maintenance of a highdose/refuge IRM strategy, together with the introduction of pyramided varietieswith two or more toxin genes, is likely to further delay or prevent the emergenceof resistance. The commercial herbicide- and insect-resistant GM cottonvarieties have limited impacts on non-target species and provide a clearenvironmental benefit by reducing the application of more detrimentalpesticides and herbicides. Future genetic manipulation of the cotton crop islikely to focus on the improvement of fibre quality and yield, managementof diseases and the control of gene expression in specific cotton tissues.
4.9 Sources of further information
Review articles
A comprehensive review of cotton biotechnology until 2000: (Wilkins et al.,2000).
The genetic modification of cotton 123
A report on the global impact of the first ten years of transgenic crops:(Brookes and Barfoot, 2005).Environmental impact of transgenic crops: (Dale et al., 2002).Containment of genes in GM crops: (Daniell, 2002).Emergence of insect resistance: (Tabashnik et al., 2003).Gene pyramiding in transgenic crops: (Zhao et al., 2005).
Websites
International Cotton Advisory Committee: http://www.icac.org/World Cotton Database: http://www.econcentral.com/wcd/Cotton Functional Genomics Centre: http://cottongenomecenter.ucdavis.edu/International Cotton Genome Initiative: http://algodon.tamu.edu/icgi/
4.10 References
Adams K L and Wendel J F (2004), ‘Exploring the genomic mysteries of polyploidy incotton’, Biol J Linn Soc, 82, 573–581.
Arpat A B, Waugh M, Sullivan J P, Gonzales M, Frisch D, Main D, Wood T, Leslie A,Wing R A and Wilkins T A (2004), ‘Functional genomics of cell elongation in developingcotton fibers’, Plant Mol Biol, 54, 911–929.
Bates S L, Zhao J Z, Roush R T and Shelton A M (2005), ‘Insect resistance managementin GM crops: past, present and future’, Nat Biotechnol, 23, 57–62.
Brookes G and Barfoot P (2005) ‘GM crops: the global socioeconomic and environmentalimpact – the first nine years 1996–2004’, PG Economics Ltd, UK.
Castillo A R, Gallardo M R, Maciel M, Giordano J M, Conti G A, Gaggiotti M C, QuainoO, Gianni C and Hartnell G F (2004), ‘Effects of feeding rations with geneticallymodified whole cottonseed to lactating Holstein cows’, J Dairy Sci, 87, 1778–1785.
CottonAustralia (2005), http://www.cottonaustralia.com.au/factSheets/resources/Biotechnology.pdf, 2/9/05
CSIRO (2003), http://www.csiro.au/proprietarydocuments/pi_info_bollgard.pdf, 18/10/05
Cui X, Shin H, Song C, Laosinchai W, Amano Y and Brown R M, Jr. (2001), ‘A putativeplant homolog of the yeast beta-1,3-glucan synthase subunit FKS1 from cotton(Gossypium hirsutum L.) fibers’, Planta, 213, 223–230.
Dale P J, Clarke B and Fontes E M (2002), ‘Potential for the environmental impact oftransgenic crops’, Nat Biotechnol, 20, 567–574.
Daniell H (2002), ‘Molecular strategies for gene containment in transgenic crops’, Nat
Biotechnol, 20, 581–586.Dixon D C, Seagull R W and Triplett B A (1994), ‘Changes in the accumulation of a- and
b-tubulin isotypes during cotton fibre development’, Plant Physiol, 105, 1347–1353.Dixon D C, Meredith Jr W R and Triplett B A (2000), ‘An assessment of alpha-tubulin
isotype modification in developing cotton fiber’, Int J Plant Sci, 161, 63–67.Endrizzi J E, Turcotte E L and Kohel R J (1985), ‘Genetics, cytology and evolution of
Gossypium’, Adv Genet, 23, 271–375.Ferguson D L, Turley R B and Kloth R H (1997), ‘Identification of a delta-TIP cDNA
clone and determination of related A and D genome subfamilies in Gossypium species’,Plant Mol Biol, 34, 111–118.

Cotton: Science and technology124
Fernandez-Corneio J (2005), http://www.ers.usda.gov/Data/BiotechCrops/adoption.html,19/10/05
Firoozabady E, DeBoer D L, Merlo D J, Halk E L, Amerson L N, Rashka K E and MurrayE E (1987), ‘Transformation of cotton (Gossypium hirsutum L.) by Agrobacterium
tumefaciens and regeneration of transgenic plants’, Plant Mol Biol, 10, 105–116.Fitt, G P (2003) ‘Implementation and impact of transgenic Bt cottons in Australia’. In
Cotton Production for the New Millenium. Proceedings of the third World Cotton
Research Conference, Cape Town, South Africa, Agricultural Research Council, 371–381.
Fryxell P A (1969), ‘A classification of Gossypium’, Taxon, 18, 585–591.Giesy J P, Dobson S and Solomon K R (2000), ‘Ecotoxicological risk assessment for
Roundup (R) herbicide’, Rev Env Contam Toxicol, 167, 35–120.Haigler C H, Zhang D and Wilkerson C G (2005), ‘Biotechnological improvement of
cotton fibre maturity’, Physiol Plant, 124, 285–294.Harmer S E, Orford S J and Timmis J N (2002), ‘Characterisation of six alpha-expansin
genes in Gossypium hirsutum (upland cotton)’, Mol Genet Genomics, 268, 1–9.Hasenfratz M P, Tsou C L and Wilkins T A (1995), ‘Expression of two related vacoular
H+-ATPase 16-kilodalton proteolipid genes is differentially regulated in a tissue-specific manner’, Plant Physiol, 108, 1395–1404.
He C, Yan J, Shen G, Fu L, Holaday A S, Auld D, Blumwald E and Zhang H (2005),‘Expression of an Arabidopsis vacuolar sodium/proton antiporter gene in cotton improvesphotosynthetic performance under salt conditions and increases fibre yield in thefield’, Plant Cell Physiol, 46, 1848–1854.
Head G, Surber J B, Watson J A, Martin J W and Duan J J (2002), ‘No detection ofCry1Ac protein in soil after multiple years of transgenic Bt cotton (Bollgard) use’,Env Entomol, 31, 30–36.
Hsu C Y, Creech R G, Jenkins J N and Ma D P (1999), ‘Analysis of promoter activity ofcotton lipid transfer protein gene LTP6 in transgenic tobacco plants’, Plant Sci, 143,63–70.
Huang C-Y, Ayliffe M A and Timmis J N (2003), ‘Direct measurement of the transfer rateof chloroplast DNA into the nucleus’, Nature, 422, 72–76.
Janmaat A F and Myers J (2003), ‘Rapid evolution and the cost of resistance to Bacillus
thuringiensis in greenhouse populations of cabbage loopers, Trichoplusia ni’, Proc
Royal Soc London B, 270, 2263–2270.Ji S J, Lu Y C, Feng J X, Wei G, Li J, Shi Y H, Fu Q, Liu D, Luo J C and Zhu Y X (2003),
‘Isolation and analyses of genes preferentially expressed during early cotton fiberdevelopment by subtractive PCR and cDNA array’, Nucl Acids Res, 31, 2534–2543.
Jiang C, Wright R J, El-Zik K M and Paterson A H (1998), ‘Polyploid formation createdunique avenues for response to selection in Gossypium’, Proc Natl Acad Sci USA, 95,4419–4424.
Jingen J (1999), http://www.people.com.cn/english/199906/11/chnmedia.html, 2/11/05John M E (1999), ‘Genetic engineering strategies for cotton fiber modification’. In Basra
A S, Cotton Fibers: Developmental Biology, Quality Improvement and Textile Processing,New York, Haworth Press, 271–292.
John M E and Crow L J (1992), ‘Gene expression in cotton (Gossypium hirsutum L.)fibre: cloning of the mRNAs’, Proc Natl Acad Sci USA, 89, 5769–5773.
John M E and Keller G (1995), ‘Characterisation of mRNA for a proline-rich protein ofcotton fiber’, Plant Physiol, 108, 669–676.
The genetic modification of cotton 125
John M E and Keller G (1996), ‘Metabolic pathway engineering in cotton: biosynthesisof polyhydroxybutyrate in fiber cells’, Proc Natl Acad Sci USA, 93, 12768–12773.
Kim H J, Williams M Y and Triplett B A (2002), ‘A novel expression assay system forfibre-specific promoters in developing cotton fibres’, Plant Mol Biol Rep, 20, 7–18.
Kishore G M and Shah D M (1988), ‘Amino acid biosynthesis inhibitors as herbicides’,Ann Rev Biochem, 57, 627–663.
Kumar S, Dhingra A and Daniell H (2004), ‘Stable inheritance of the cotton plastidgenome and maternal inheritance of transgenes’, Plant Mol Biol, 56, 203–216.
Lawrence S (2005), ‘Agbio keeps on growing’, Nat Biotechnol, 23, 281.Lee J A (1980), ‘Cotton’. In Fehr W R and Hadley H, Hybridisation of crop plants,
Madison, Wisconsin, American Society of Agronomy.Leelavathi S, Sunnichan V G, Kumria R, Vijaykanth G P, Bhatnagar R K and Reddy V S
(2004), ‘A simple and rapid Agrobacterium-mediated transformation protocol for cotton(Gossypium hirsutum L.): embryogenic calli as a source to generate large numbers oftransgenic plants’, Plant Cell Rep, 22, 465–470.
Li X B, Cai L, Cheng N H and Liu J W (2002), ‘Molecular characterisation of the cottonGhTUB1 gene that is preferentially expressed in fiber’, Plant Physiol, 130, 666–674.
Li X, Wang X D, Zhao X and Dutt Y (2004), ‘Improvement of cotton fiber quality bytransforming the acsA and acsB genes into Gossypium hirsutum L. by means ofvacuum infiltration’, Plant Cell Rep, 22, 691–697.
Li X B, Fan X P, Wang X L, Cai L and Yang W C (2005), ‘The cotton actin1 gene isfunctionally expressed in fibres and participates in fiber elongation’, Plant Cell, 17,859–875.
Light G G, Mahan J R, Roxas V P and Allen R D (2005), ‘Transgenic cotton (Gossypium
hirsutum L.) seedlings expressing a tobacco glutathione S-transferase fail to provideimproved stress tolerance’, Planta, 222, 346–354.
Liu H C, Creech R G, Jenkins J N and Ma D P (2000), ‘Cloning and promoter analysisof the cotton lipid transfer protein gene Ltp3’, Biochim Biophys Acta, 1487, 106–111.
Liu Q, Singh S and Green A (2002a), ‘High-oleic and high-stearic cottonseed oils:nutritionally improved cooking oils developed using gene silencing’, J Am Coll Nutr,21, 205S-211S.
Liu Q, Singh S P, Green A G, Singh S and Green A (2002b), ‘High-stearic and high-oleiccottonseed oils produced by hairpin RNA-mediated post-transcriptional gene silencing’,Plant Physiol, 129, 1732–1743.
Loguercio L L and Wilkins T A (1998), ‘Structural analysis of a hmg-coA-reductasepseudogene: insights into evolutionary processes affecting the hmgr gene family inallotetraploid cotton (Gossypium hirsutum L.)’, Curr Genet, 34, 241–249.
Ma D P, Tan H, Si Y, Creech R G and Jenkins J N (1995), ‘Differential expression of alipid transfer protein gene in cotton fibre’, Biochim Biophys Acta, 1257, 81–84.
Ma D P, Liu H C, Tan H, Creech R G, Jenkins J N and Chang Y F (1997), ‘Cloning andcharacterisation of a cotton lipid transfer protein gene specifically expressed in fibrecells’, Biochim Biophys Acta, 1344, 111–114.
Martin G S, Liu J, Benedict C R, Stipanovic R D and Magill C W (2003), ‘Reduced levelsof cadinane sesquiterpenoids in cotton plants expressing antisense (+)-delta-cadinenesynthase’, Phytochem, 62, 31–38.
May O L (1999), ‘Genetic variation in fibre quality’. In Basra A S, Cotton Fibers:
Developmental Biology, Quality Improvement and Textile Processing, New York,Haworth Press, 183–230.
Cotton: Science and technology126
Mei M, Syed N H, Gao W, Thaxton P M, Smith C W, Stelly D M and Chen Z J (2004),‘Genetic mapping and QTL analysis of fiber-related traits in cotton (Gossypium)’,Theor Appl Genet, 108, 280–291.
Meredith Jr W R (2000), ‘Continued progress for breeding for yield in the USA’. InKechagia U, World cotton research conference II, Athens, Greece, 97–101.
Mishra R, Wang H-Y, Yadav N R and Wilkins T A (2003), ‘Development of a highlyregenerable elite Acala cotton (Gossypium hirsutum cv. Maxxa) – a step towardsgenotype-independent regeneration’, Plant Cell, Tissue and Organ Culture, 73, 21–35.
Orford S J and Timmis J M (1997), ‘Abundant mRNA’s specific to the developing cottonfibre’, Theor Appl Genet, 94, 909–918.
Orford S J and Timmis J N (2000), ‘Expression of a lipid transfer protein gene familyduring cotton fibre development’, Biochim Biophys Acta, 1483, 275–284.
Paterson A H, Saranga Y, Menz M, Jiang C X and Wright R J (2003), ‘QTL analysis ofgenotype x environment interactions affecting cotton fiber quality’, Theor Appl Genet,106, 384–396.
Pear J R, Kawagoe Y, Schreckengost W E, Delmer D P and Stalker D M (1996), ‘Higherplants contain homologs of the bacterial celA genes encoding the catalytic subunit ofcellulose synthase’, Proc Natl Acad Sci USA, 93, 12637–12642.
Peeters M-C, Willems K and Swennen R (1994), ‘Protoplast-to-plant regeneration incotton (Gossypium hirsutum L. cv. Coker 312) using feeder layers’, Plant Cell Reports,13, 208–211.
Peng L, Kawagoe Y, Hogan P and Delmer D P (2002), ‘Sitosterol-beta-glucoside asprimer for cellulose synthesis in plants.’ Science, 295, 147–50.
Perlak F J, Deaton R W, Armstrong T A, Fuchs R L, Sims S R, Greenplate J T andFischhoff (1990), ‘Insect resistant cotton plants’, Biotech, 8, 939–943.
Poon S, Clarke A and Heath R (2004), ‘Improving the efficiency of embryogenesis inelite cotton cultivars’. In Proceedings 11th Australian Cotton Conference, Broadbeach,Australia, ACGRA, 733–737.
Rinehart J A, Petersen M W and John M E (1996), ‘Tissue-specific and developmentalregulation of cotton gene FbL2A. Demonstration of promoter activity in transgenicplants’, Plant Physiol, 112, 1331–1341.
Rong J K, Abbey C, Bowers J E, Brubaker C L, Chang C, Chee P W, Delmonte T A, DingX L, Garza J J, Marler B S, Park C H, Pierce G J, Rainey K M, Rastogi V K, SchulzeS R, Trolinder N L, Wendel J F, Wilkins T A, Williams-Coplin T D, Wing R A, WrightR J, Zhao X P, Zhu L H and Paterson A H (2004), ‘A 3347-locus genetic recombinationmap of sequence-tagged sites reveals features of genome organisation, transmissionand evolution of cotton (Gossypium)’, Genetics, 166, 389–417.
Ruan Y L, Chourey P S, Delmer D P and Perez-Grau L (1997), ‘The differential expressionof sucrose synthase in relation to diverse patterns of carbon partitioning in developingcotton seed’, Plant Physiol, 115, 375–385.
Ruan Y L, Llewellyn D J and Furbank R T (2001), ‘The control of single-celled cottonfiber elongation by developmentally reversible gating of plasmodesmata and coordinatedexpression of sucrose and K+ transporters and expansin’, Plant Cell, 13, 47–60.
Ruan Y L, Llewellyn D J and Furbank R T (2003), ‘Suppression of sucrose synthase geneexpression represses cotton fiber cell initiation, elongation, and seed development’,Plant Cell, 15, 952–964.
Sakhanokho H F, Zipf A, Rajasekaran K, Saha S and Sharma G C (2001), ‘Induction ofhighly embryogenic calli and plant regeneration in Upland (Gossypium hirsutum L.)and Pima (Gossypium barbadense L.) cottons’, Crop Sci, 41, 1235–1240.

The genetic modification of cotton 127
Sanjaya, Satyavathi V V, Prasad V, Kirthi N, Maiya S P, Savithri H S and Sita G L (2005),‘Development of cotton transgenics with antisense AV2 gene for resistance againstcotton leaf curl virus (CLCuD) via Agrobacterium tumefaciens’, Plant Cell Tissue and
Organ Culture, 81, 55–63.Saranga Y, Menz M, Jiang C X, Wright R J, Yakir D and Paterson A H (2001), ‘Genomic
dissection of genotype x environment interactions conferring adaptation of cotton toarid conditions’, Genome Res, 11, 1988–1995.
Shelton A M, Robertson J L, Tang J D, Perez C, Eigenbrode S D, Preisler H K, WilseyW T and Cooley R J (1993), ‘Resistance of Diamondback Moth (Lepidoptera, Plutellidae)to Bacillus-thuringiensis subspecies in the field’, J Econ Entomol, 86, 697–705.
Shin H and Brown R M, Jr (1999), ‘GTPase activity and biochemical characterisation ofa recombinant cotton fiber annexin’, Plant Physiol, 119, 925–934.
Sims S R, Berberich S A, Nida D L, Segalini L L, Leach J N, Ebert C C and Fuchs R L(1996), ‘Analysis of expressed proteins in fibre fractions from insect-protected andglyphosate-tolerant cotton varieties’, Crop Sci, 36, 1212–1216.
Singh P K, Kumar M, Chaturvedi C P, Yadav D and Tuli R (2004), ‘Development of ahybrid delta-endotoxin and its expression in tobacco and cotton for control of apolyphagous pest Spodoptera litura’, Transgenic Res, 13, 397–410.
Smart L B, Vojdani F, Maeshima M and Wilkins T A (1998), ‘Genes involved inosmoregulation during turgor-driven cell expansion of developing cotton fibers aredifferentially regulated’, Plant Physiol, 116, 1539–1549.
Smyth S, Khachatourians G G and Phillips P W B (2002), ‘Liabilities and economics oftransgenic crops’, Nature Biotech, 20, 537–541.
Song P and Allen R D (1997), ‘Identification of a cotton fiber-specific acyl carrier proteincDNA by differential display’, Biochim Biophys Acta, 1351, 305–312.
Squire G R, Brooks D R, Bohan D A, Champion G T, Daniels R E, Haughton A J, HawesC, Heard M S, Hill M O, May M J, Osborne J L, Perry J N, Roy D B, Woiwod I P andFirbank L G (2003), ‘On the rationale and interpretation of the farm scale evaluationsof genetically modified herbicide-tolerant crops’, Phil Trans Royal Soc London B,358, 1779–1799.
Stotzky G (2000), ‘Persistence and biological activity in soil of insecticidal proteins fromBacillus thuringiensis and of bacterial DNA bound on clays and humic acids’, J
Environl Qual, 29, 691–705.Stotzky G (2004), ‘Persistence and biological activity in soil of the insecticidal proteins
from Bacillus thuringiensis, especially from transgenic plants’, Plant and Soil, 266,77–89.
Sun Y, Fokar M, Asami T, Yoshida S and Allen R D (2004a), ‘Characterisation of theBrassinosteroid insensitive 1 genes of cotton’, Plant Mol Biol, 54, 221–232.
Sun Y, Zhang X, Nie Y, Guo X, Jin S and Liang S (2004b), ‘Production and characterisationof somatic hybrids between upland cotton (Gossypium hirsutum) and wild cotton (G.
klotzschianum Anderss) via electrofusion’, Theor Appl Genet, 109, 472–479.Sunilkumar G, Connell J P, Smith C W, Reddy A S and Rathore K S (2002a), ‘Cotton
alpha-globulin promoter: isolation and functional characterisation in transgenic cotton,Arabidopsis, and tobacco’, Transgenic Res, 11, 347–359.
Sunilkumar G, Mohr L, Lopata-Finch E, Emani C, Rathore K S, Connell J P, Smith C Wand Reddy A S (2002b), ‘Developmental and tissue-specific expression of CaMV 35Spromoter in cotton as revealed by GFP’, Plant Mol Biol, 50, 463–474.
Suo J, Liang X, Pu L, Zhang Y and Xue Y (2003), ‘Identification of GhMYB109 encodinga R2R3 MYB transcription factor that expressed specifically in fiber initials and
Cotton: Science and technology128
elongating fibers of cotton (Gossypium hirsutum L.)’, Biochim Biophys Acta, 1630,25–34.
Tabashnik B E, Cushing N L, Finson N and Johnson M W (1990), ‘Field development ofresistance to Bacillus-thuringiensis in Diamondback Moth (Lepidoptera, Plutellidae)’,J Econ Entomol, 83, 1671–1676.
Tabashnik B E, Carriere Y, Dennehy T J, Morin S, Sisterson M S, Roush R T, Shelton AM and Zhao J Z (2003), ‘Insect resistance to transgenic Bt crops: lessons from thelaboratory and field’, J Econ Entomol, 96, 1031–1038.
Tan H, Creech R G, Jenkins J N, Chang Y F and Ma D P (2001), ‘Cloning and expressionanalysis of two cotton (Gossypium hirsutum L.) genes encoding cell wall proline-richproteins’, DNA Seq, 12, 367–380.
Umbeck P, Johnson G, Barton K and Swain W (1987), ‘Genetically transformed cotton(Gossypium hirsutum L.) plants’, Biotech, 5, 263–266.
University of Richmond (2004), http://pewagbiotech.org/resources/factsheets/display.php3?FactsheetID=2, 5/10/05
Vysotski K A (1958), ‘Cotton-mallow and cotton-hybiscus hybrids’, Bot Genet Select, 31,151–161.
Wang S, Wang J W, Yu N, Li C H, Luo B, Gou J Y, Wang L J and Chen X Y (2004),‘Control of plant trichome development by a cotton fiber MYB gene’, Plant Cell, 16,2323–2334.
Wendel J F (1989), ‘New World tetraploid cottons contain Old World cytoplasm’, Proc
Natl Acad Sci USA, 86, 4132–4136.Whittaker D J and Triplett B A (1999), ‘Gene-specific changes in alpha-tubulin transcript
accumulation in developing cotton fibers’, Plant Physiol, 121, 181–188.Wilkins T A and Jernstedt J A (1999), ‘Molecular genetics of developing cotton fibres’.
In Basra A S, Cotton Fibers: Developmental Biology, Quality Improvement and Textile
Processing, New York, Haworth Press, 231–263.Wilkins T A, Rajasekaran K and Anderson D M (2000), ‘Cotton biotechnology’, Crit Rev
Plant Sci, 19, 511–550.Williams G M, Kroes R and Munro I C (2000), ‘Safety evaluation and risk assessment of
the herbicide Roundup and its active ingredient, glyphosate, for humans’, Reg Toxicol
Pharmacol, 31, 117–165.Willmitzer L (1999), ‘Plant biotechnology: output traits – the second generation of plant
biotechnology products is gaining momentum’, Curr Opin Biotech, 10, 161–162.Xu Y H, Wang J W, Wang S, Wang J Y and Chen X Y (2004), ‘Characterisation of
GaWRKY1, a cotton transcription factor that regulates the sesquiterpene synthasegene (+)-delta-cadinene synthase-A’, Plant Physiol, 135, 507–515.
Yan J, He C, Wang J, Mao Z, Holaday S A, Allen R D and Zhang H (2004), ‘Overexpressionof the Arabidopsis 14-3-3 protein GF14 lambda in cotton leads to a “stay-green”phenotype and improves stress tolerance under moderate drought conditions’, Plant
Cell Physiol, 45, 1007–1014.Zhang B-H, Feng R, Liu F and Wang Q (2001), ‘High frequency somatic embryogenesis
and plant regeneration of an elite Chinese cotton variety’, Bot Bull Acad Sin, 42,9–16.
Zhang T Z, Yuan Y L, Yu J, Guo W Z and Kohel R J (2003a), ‘Molecular tagging of amajor QTL for fiber strength in Upland cotton and its marker-assisted selection’,Theor Appl Genet, 106, 262–268.
Zhang X D, Jenkins J N, Callahan F E, Creech R G, Si Y, McCarty J C, Saha S and MaD P (2003b), ‘Molecular cloning, differential expression, and functional characterization
The genetic modification of cotton 129
of a family of class I ubiquitin-conjugating enzyme (E2) genes in cotton (Gossypium)’,Biochim Biophys Acta, 1625, 269–279.
Zhang D, Hrmova M, Wan C H, Wu C, Balzen J, Cai W, Wang J, Densmore L D, FincherG B, Zhang H and Haigler C H (2004), ‘Members of a new group of chitinase-likegenes are expressed preferentially in cotton cells with secondary walls’, Plant Mol
Biol, 54, 353–372.Zhao G R and Liu J Y (2001), ‘Isolation of a cotton RGP gene: a homolog of reversibly
glycosylated polypeptide highly expressed during fibre development’, Biochim Biophys
Acta, 1574, 370–374.Zhao J Z, Cao J, Collins H L, Bates S L, Roush R T, Earle E D and Shelton A M (2005),
‘Concurrent use of transgenic plants expressing a single and two Bacillus thuringiensis
genes speeds insect adaptation to pyramided plants’, Proc Natl Acad Sci USA, 102,8426–8430.
Zhu Y Q, Xu K X, Luo B, Wang J W and Chen X Y (2003), ‘An ATP-binding cassettetransporter GhWBC1 from elongating cotton fibres’, Plant Physiol, 133, 580–588.

130
5.1 Introduction
Cotton grown without the use of any synthetically compounded chemicals(i.e., pesticides, plant growth regulators, defoliants, etc.) and fertilizers isconsidered ‘organic’ cotton (National Organic Program, 2005; Kuepper andGegner, 2004; Pick and Givens, 2004; Guerena and Sullivan, 2003; Myersand Stolton, 1999; Chaudhry, 1998 and 2003; International Cotton AdvisoryCommittee (ICAC), 1996; Le Guillou and Scharpé, 2000; Marquardt, 2003).However, chemicals considered ‘natural’ can be used in the production oforganic cotton (see Appendix 5.1; Synthetic substances allowed for use inorganic crop production) as well as natural fertilizers. The different certificationorganizations have similar lists for allowed chemicals (e.g., see OfficialJournal European Union, 2006). Bacillus thuringiensis (Bt), a naturallyoccurring soil bacterium, can be used as a natural insecticide in organicagriculture (Zarb et al., 2005). Bt is the bacterium, that produces the insecttoxins that scientists use to produce genes for insect-resistant biotech cottons.However, biotech cottons, containing Bt genes, are not allowed to be usedfor the production of organic cotton – the general reason being that thetechnique is synthetic not natural.
The production of cotton using organic farming techniques seeks to maintainsoil fertility and to use materials and practices that enhance the ecologicalbalance of natural systems and integrate the parts of the farming system intoan ecological whole. ‘Organic farming is part philosophy and part businesssense’ according to an article in the Lubbock Avalanche Journal of 31October 2005 (E. Blackburn, ‘Organic cotton not all fluff’; http://www.lubbockonline.com/cgi-bin/printit2000.pl).
According to Le Guillou and Scharpé (2000), organic farming originatedin England on the theories developed by Albert Howard in An Agricultural
Testament (1940). ‘Biodynamic agriculture’, developed from the teachingsof Rudolf Steiner in Germany in the 1920s, and ‘biological agriculture’,developed in Switzerland by Hans-Peter Rusch and Hans Müller, are types
5Organic cotton
P J W A K E L Y N, National Cotton Council, USA andM R C H A U D H R Y, International Cotton Advisory
Committee, USA

Organic cotton 131
of organic farming. There are several principles that characterize certifiedorganic farming: biodiversity, integration, sustainability, natural plant nutrition,and natural pest management (Kuepper and Gegner, 2004). The US NationalOrganic Standards Board adopted the following definition of ‘organic’agriculture (National Organic Program, 2002):
Organic agriculture is an ecological production management system thatpromotes and enhances biodiversity, biological cycles and soil biologicalactivity. It is based on minimal use of off-farm inputs and on managementpractices that restore, maintain and enhance ecological harmony.
‘Organic’ is a labeling term. For cotton to be sold as ‘organic cotton’, itmust be certified by an independent organization that verifies that it meets orexceeds defined organic agricultural production standards (see section 5.8).To produce ‘organic cotton textiles’, certified organic cotton should bemanufactured according to organic fiber processing standards/guidelines (seesections 5.5 and 5.8.5). Regulations are important because they standardizecriteria for organic production and post-harvest handling/processing thatwill facilitate domestic and international trade. A three-year transitional periodfrom conventional to organic cotton production is required for certification.Cotton produced during this three-year period is described variously as‘transitional’, ‘pending certification’ (in California), or ‘organic B’ (inAustralia). Labels such as ‘green’, ‘clean’, or ‘natural’, which can causeconfusion, are used by some manufacturers (Myers and Stolton, 1999). Toavoid confusion, this chapter refers to cotton produced by modern organicfarming techniques as ‘organic cotton’. Regarding organic labeling, accordingto Laurie Demeritt (2006), for most consumers the word ‘organic’ is primarilya marker – a word that symbolizes a lifestyle that they want to be part of.Certification or regulation itself and the ‘science’ behind organic products isnot what most consumers care about when buying organic products.
5.2 World organic cotton production
Certified organic cotton was introduced in about 1989/90 and over 20 countrieshave tried to produce organic cotton (see Table 5.1). Serious efforts havebeen made, with the help of international and national institutions, mostlyfrom Europe, to produce organic cotton in many African countries (PaulReinhart AG, 2006). This includes Burkina Faso, Benin, Mali, Tanzania andUganda, where insecticides and fertilizer were either not used or minimallyused even in conventional production (Ratter, 2004). There are small projects inMali (35 metric tons (MT) in 2003/04, expected to be >300MT in 2006/07(Garrott, 2006)), Kyrgyzstan (~65MT in 2004/05), and some other developingcountries (Anonymous, 2004; Traoré, 2005). Some countries have alreadystopped organic cotton production for economic reasons but others areexpanding their production.

Co
tton
: Scie
nce
an
d te
ch
no
log
y1
32
Table 5.1 World organic cotton production
Country 1990/91 1991/92 1992/93 1993/94 1994/95 1995/96 1996/97 1997/98 1998/99 1999/00 2000/01 2001/02 2002/03 2003/04 2004/05
Argentina 75 75
Australia 500 500 750 400 300 300
Benin 1 5 20 20 30 38 46 25 67
Brazil 1 5 1 1 1 5 10 20
Burkina Faso 45
China (PRC) 106 596 1,601 1,870
Egypt 14 45 50 153 600 650 625 500 360 200 200 200 122 122 240
Greece 300 150 125 100 75 50 50
India 200 250 400 925 850 1,000 825 1,150 1,000 696 855 2,231 6,320
Israel <425 390 380 436
Kenya 5 5 5 2
Kyrgyzstan 65
Mali 19 35 296
Mozambique 100 75 50
Nicaragua 20 20 20 20
Pakistan 256 400 600
Paraguay 100 75 50 50 50 9 60 70
Peru 200 675 900 900 900 650 650 500 550 300 300 404 813
Senegal 1 1 10 50 146 200 – 6 6 27
Tanzania 30 30 100 230 190 180 400 380 600 1,213
Turkey 789 200 463 725 933 1,000 835 7,840 7,697 5,504 12,865 11,625 10,460
Uganda 25 75 75 450 250 246 248 250 500 740 900
USA 330 820 2,155 4,274 5,365 7,425 3,396 2,852 1,878 2,955 1,860 2,227 1,571 1,041 1,968
Zambia 2
Zimbabwe 1 5 5 2 3
TOTAL 344 865 3,894 6,153 8,978 11,527 7,382 7,094 5,188 13,317 12,035 10,148 19,270 17,645 25,394
Source: Organic Exchange, 2005–06 and ICAC, 2005–06 for most of the data; and Baird Garrott, Paul Reinhart AG (Garrott, 2006), for Turkey, Israel, Mali and Burkina Faso in 2004/05.
Organic cotton 133
In the USA, organic cotton production increased from 330 MT (1,516 US480-lb US bale equivalents) in 1990/91 to 7425 metric tons (16,338 US 480-lb bale equivalents) in 1995/96 but since then, organic production has declinedto about 1,000–1,500 metric tons (4593–6890 US 480-lb bale equivalents)per year (Organic Exchange, 2006; Anonymous, 2004a). In the 1999/00 cropyear, Turkey surpassed the USA in organic cotton production and since thenhas been by far the largest producer of organic cotton in the world (see Table5.1). In 2003/04, in the USA, 1,008 metric tons (4,628 US 480 lb baleequivalents) of organic cotton were produced on 4,060 planted acres; in2004/05, 5,550 acres were planted and about 1,480 metric tons (6,814 US480 lb bale equivalents) were produced; and in 2005/06 6,577 acres wereplanted, according to 2004 and 2005 surveys of organic cotton farmers reportedby the Organic Trade Association (OTA) (Anonymous, 2004a, 2006, 2006a).
In 2001/02 about 14 countries in the world produced about 5,700 metrictons (26,000 480 lb US bale equivalents) of organic cotton, according toOTA, with Turkey, the USA, and India accounting for about 75% of production(Marquardt, 2003). The Organic Exchange and ICAC data for world organiccotton production are higher than the OTA numbers (10,148 MT vs. 5,700MT in 2001/02; see Table 5.1). In 2004/05, the world production of organiccotton, according to the Organic Exchange (2006), ICAC and Baird Garrott,Paul Reinhart AG (Garrott, 2006), was about 25,394 metric tons (116,600US 480 lb bale equivalents) [~0.1% of world cotton production, which wasabout 25 million MT (120 million US 480 lb bales)] (see Table 5.1). The bigincreases have been since 2001–02, from about 10,000 MT to about 25,000MT, because of big increases in Turkey, India, and China. The proportion ofcertified organic wool is similar to organic cotton – the major suppliers areSouth America (Patagonia) and Australia. Natural fibers like flax, hemp, andsilk are not yet produced in any significant quantity as certified organicfibers.
5.3 Why organic cotton?
‘Why organic cotton?’ is an important question. Consider – is organic cottonmore ‘sustainable’ than conventional cotton; an environmentally preferableproduct, of added benefit to the environment, farmers, and consumers; or isit essentially a marketing tool or is it both? Proponents of organic cotton andthose who market organic cotton products promote the perception thatconventional cotton is not an environmentally responsibly produced crop(Myers, 1999; Yafa, 2005; Organic; Exchange, 2006; Patagonia, 2006; OrganicEssentials, 2006; Hae Now, 2006; Greenfeet, 2006). Some of the reasonsused to support their contentions are that conventional cotton productiongreatly overuses and misuses pesticides/crop protection products that havean adverse effect on the environment and agricultural workers and

Cotton: Science and technology134
conventionally grown cotton fiber/fabrics/apparel has chemical residues onthe cotton that can cause cancer, skin irritation, and other health-relatedproblems to consumers. Factual documentation for many of the statementsexpressed by proponents of organic cotton is lacking and some globalcorporations base their marketing programs around undocumented, misleading,incorrect, information.
Proponents also indicate that organic cotton is a more sustainable approach(Myers and Stolton, 1999). Organic cotton production is not equivalent tosustainable – either organic or conventional cotton production practices maybe sustainable. According to the US Environmental Protection Agency:
Sustainability has many definitions but the basic principles and conceptsremain constant: balancing a growing economy, protection for theenvironment, and social responsibility, so they together lead to an improvedquality of life for ourselves and future generations (US EPA, 2006d).
‘Sustainable agriculture’ was addressed by the US Congress in the 1990‘Farm Bill’. Under that law, the term ‘sustainable agriculture’ means (FarmBill, 1990):
an integrated system of plant and animal production practices having asite-specific application that will, over the long term;
∑ satisfy human food and fiber needs∑ enhance environmental quality and the natural resource base upon
which the agricultural economy depends∑ make the most efficient use of nonrenewable resources and on-farm
resources and integrate, where appropriate, natural biological cyclesand controls
∑ sustain the economic viability of farm operations∑ enhance the quality of life for farmers and society as a whole.
Sustainable agriculture has three long-term concurrent goals:
1. quality of life (i.e. to satisfy personal, family, and community needs forhealth safety, food, and happiness);
2. environmental quality (i.e., to enhance finite soil, water, air, and otherresources);
3. economics (i.e., to be profitable).
The most sustainable choice is the one where the net effects come closest tomeeting these goals. Sustainable production must supply the world’s demandfor natural fiber and food; it must maintain environmental quality and thenatural resource base upon which the agricultural economy depends; and itmust sustain the economic viability of cotton farming operations. If a production

Organic cotton 135
system requires significantly more land and significantly more labor to producethe crop and production costs are significantly higher, it is questionable if itis sustainable.
5.3.1 Cotton production/farming practices considerations
As discussed in section 5.4.1, some aspects of conventional farmingpractices have not always been environmentally sound. Irresponsibly usedinsecticides and other pesticides/crop protection products can lead to seriousconsequences in agriculture and, while some of the effects are long term,others are reversible. Excessive use of insecticides can significantly affectthe natural biological control system, at the same time as it increases production.Insect populations can continue to increase because of the lack of appropriatecultural operations and the availability of alternative hosts during off seasons.Years ago, as the population of insects increased, the number of spraysincreased. Researchers have tried to compensate the natural biological controlwith artificial rearing of natural enemies, but no significant success has beenachieved in most countries. Biotech cottons, which are not allowed to beused in organic cotton production, greatly reduce the use of insecticides,reduced the use of herbicides, and minimize adverse effects on non-targetspecies and beneficial insects (Fitt et al., 2004; Wakelyn et al., 2004). Withbiotech cottons there has been a significant return of beneficial insects to thefields, which also has reduced the number of pesticide applications necessaryto control insects. The use of insect-resistant cotton plants (e.g., ‘Bt cotton’)reduces the use of harmful insecticides needed to control certain insect pestsin the crop. Use of plants tolerant to a specific broad-spectrum herbicide(‘HT cotton’) allows this herbicide to be used to remove a range of weedspecies in the crop without destroying the genetically modified plantsthemselves. This type of herbicide reduces the need for a greater number ofspray treatments with specific herbicides that destroy only a single or a fewweed species.
Earlier excessive reliance on crop protection chemicals was a problem incotton production but according to Hake et al. (1996), modern conventionalcotton production is part of the solution, not the problem. The cost of cropprotection products and the cost of production relative to the selling price ofcotton, demands that insecticides, herbicides and other crop protection productsare applied judiciously and environmentally responsibly – only when andwhere necessary to protect the crop, using integrated pest management practices(IPM), integrated weed management (IWM), in some cases, remote sensing/precision farming techniques (GPS and satellite technology), and computer-aided crop and pest management (Australian Cotton Industry, 2005). Reducinginput costs drives many producer decisions today.

Cotton: Science and technology136
Crop protection products
Today, it is incorrect to say pesticides/crop protection products are overusedand misused in conventional cotton production in developed countries and inmany developing countries. Because of better management practices, the useof crop protection products is decreasing in all countries and what is used isheavily regulated in developed countries and regulated to some degree indeveloping countries.
In 2004, about 8.5% of all global crop protection chemical use (based onsales data in millions of US$) was on cotton (Cropnosis, 2005). Fruit andvegetables consumed about 29% and cereal crops including rice and cornabout 35% (Table 5.2). Some organizations suggest that about 680 kg (1,500lb) of pesticide and herbicide are used per acre to grow cotton – the correctfigure, in the USA, where accurate, transparent data are available, is about 0.48kg (1.06 lb) of insecticide and 0.91 kg (2.0 lb) of herbicide/acre (USDA-NASS, 2004). Total US pesticide used in cotton for 2003 (USDA-NASS,2004) was about 4.8 kg/ha (4.3 lb/acre) – 6.2 g/kg (0.1 oz/lb) of fiber produced.It is unfortunate that incorrect, misleading, undocumented data regarding theuse of crop protection products sometimes is accepted as true and used as abasis for marketing organic cotton by some corporations and organizations.
Historically, health hazards of insecticide spraying, disposal of insecticidecontainers and many other aspects of insecticide storage, handling and disposal
Table 5.2 (a) World pesticides sold in 2004 by crop and (b) world pesticides sold in
2004 by product type
(a)
Crop Total sales ($M) %
Fruit & veg. 9,298 28.7
Cereals 5,136 15.9
Soybeans 3,409 10.5
Rice 3,084 9.6
Maize 3,002 9.3
Cotton 2,745 8.5
Sugar beet 611 1.9
OSR/Canola 482 1.5
Other crops 4,582
TOTAL 32,349
(b)
Product type Total sales( $M) Cotton sales ($M)
Herbicides 14,849 777 (5.2%)
Insecticides 8,635 1618 (18.7%)
Fungicides 7,296 70 (1.0%)
Others 1,569 280 (17.8%)
TOTAL 32,349 2745 (8.5%)
Source: Cropnosis, Ltd Edinburgh, UK.
Organic cotton 137
have caused damage to human life and environment. However, the developmentof new insecticide products, less persistent and less toxic to humans, hasbeen helpful in reducing risks to human life and the environment. New cropprotection products, on the average, cost millions of US$ and take years todevelop. In fact, in the USA each new crop protection product is subjectedto about 120 separate tests and it costs about US$180–220 million and 8–9years to develop a new product (from discovery to first sales) (CropLifeInternational, 2005). Tolerances usually are set at about 1,000 times less thanthe no observable effect level (NOEL) depending on the risk factors (e.g.,cancer risk, infants and children’s exposure, etc.) used (US EPA, 1999 and2006a ; US EPA, 2006b (40 CFR 158, Subpart F)).
Since cotton is both a fiber and food crop, any crop protection productsthat are used in the production of cotton have to meet the same regulationsas any food crop. In addition, countries like the USA have strict regulationsfor approval and use of crop protection products as discussed above (USEPA, 1999, 2006a and 2006b) as well as strict worker protection standardsfor application of crop protection products, field re-entry (US EPA, 2006),and for storage and disposal of crop protection products and used containers(US EPA, 2006c). This greatly reduces health risks to workers and theenvironment. No crop protection products registered for use on US cottonand cotton from many other countries are on the list of restricted productsthat have to be tested to comply with the EU Ecolabel for Textiles (EU,2002; Bremen Cotton Report, 1993). According to USEPA, US pesticidesafety is the highest in the world (USEPA, 2006e). Biotech (transgenic)cottons, containing Bt genes, also can greatly reduce health risks to workersfrom agricultural chemicals (Fitt et al., 2004; Wakelyn et al., 2004) but arenot allowed for organic cotton production even though Bt can be used forinsect control for organic cotton production.
Crop production
If a lifecycle assessment of cotton production is looked at, it can be seen thatall methods of cotton production (see section 5.4) have some practices thatare not necessarily environmentally friendly but are necessary to produce thecrop. For example, conventional cotton typically uses between 90–168 kg/ha(80–150 lb/acre) of a nitrogen fertilizer as well as about 0–90 kg/ha(0–80 lb/acre) of phosphorus, and about 90 kg/ha (80 lb/acre) of potassium,applied in most cases to fields using some form of conservation tillage. (Inthe USA in 2003 159 kg/ha (142 lb/acre) of synthetic fertilizers were appliedto conventional cotton (USDA-NASS, 2004). Whereas, to replenish nutrientsin the soil, organic production uses 6.7–10.8 metric tons/ha (3–5 tons/acre)of poultry manure (Alabama Cooperative Extension System, 2006) or aboutthree times that amount of cattle/dairy manure (about 20–30 MT/ha; (9–15

Cotton: Science and technology138
tons/acre)) (Agronomy Facts 55, 1997) (see section 5.4.4). This presents aproblem in containing nutrient runoff into streams (phosphates to surfacewater can cause eutrophication) (Schmidt and Rehm, 2002) or leaching intogroundwater (nitrates in ground water can be a mammalian toxin). Also bio-hazards can be associated with manure, e.g., the H5N1 virus (avian flu) andpathogenic bacteria are carried in poultry manure, the preferred source ofmanure for organic cotton production. The manure, which may or may notbe composted, is applied to fields that have been worked with initial tillageoperations, by spreading and incorporating into the soil by two additionaldiskings (Swezey and Goldman, 1999). These organic production tillagepractices of increased tillage can have adverse effects on the soil and canlead to more soil erosion as well as use more fossil fuels. Whereas, over 60%of conventional cotton production in countries like the USA use conservationtillage practices. Conservation tillage leaves more crop residue on the soilsurface and also reduces greenhouse gas emissions – by burning less fossilfuel and by sequestering carbon in the soil.
Conventional cotton production controls weeds with herbicides that areapplied by integrated weed management (IWM) practices. Organicproduction, for weed control, uses mechanical cultivation and hand hoeingand other hand practices, which are the main source of ergonomic workerhealth problems in agriculture. Conservation tillage is difficult or impossibleto implement in organic cotton production systems because of the heavyreliance on mechanical cultivation or use of extensive hand labor forweed control. This increases risk of soil erosion and use of fossil fuels formechanical cultivation.
Organic cotton production does not use synthetically compounded chemicalsbut does use ‘natural’ chemicals like sulfur dust and Bt and other biologicalcontrol agents in pest management and organic acid-based foliar sprays(e.g., citric acid) and nitrogen and zinc sulphate in harvest preparation. Thesenatural chemicals used in harvest preparation are not as effective for leafdrop, which can lead to slower harvesting, reduced grade of the cotton, andincreased cost of ginning (Swezey and Goldman, 1999).
Organic cotton is more expensive to produce – results from a six-yearstudy in the USA (Swezey, 2002) showed organic cotton production costs atabout 50% higher than those of conventional cotton. Organic cotton usuallyhas lower yields, which requires more land to produce the same quantity ofcotton and can have lower grades, which affects economics; and it requiressignificantly more labor to produce. For example, the growing of organiccotton usually requires many workers with hoes to kill weeds, which increaseslabor and production costs. It also can require more energy than conventionalcotton production because of increase tillage. Differences in cotton productiontechniques should be considered when assessing the sustainability of organiccotton vs. conventional cotton.
Organic cotton 139
5.3.2 Fiber/fabric/apparel
Another main marketing point that organic proponents suggest is thatconventional cotton is covered with pesticides harmful to consumers andthat certified organic means ‘pesticide residue-free’. This is a commonmisconception (Kuepper and Gegner, 2004). The facts are that from a residue-free standpoint, there is essentially no difference between conventionallygrown cotton and organic cotton.
∑ In response to numerous inquiries concerning agricultural chemical residueson cotton, the Bremen Cotton Exchange, since 1991, has tested forpesticides residues (herbicides, insecticides, fungicides) on US and othercottons. The results showed that all cotton, including US cottons, satisfythe Eco-Label standard and easily pass the regulations for foodstuffs,‘Thus cotton under German law theoretically can be used as a foodstuff’(Bremen Cotton Report, 1993).
∑ US cotton and cottons grown in some other countries meet the requirementsfor the current EU Eco-label for textile products (2002) without testing.This is because none of the pesticides that have to be tested is registeredby US EPA for use on US cotton as well as registered for use on manyother countries’ cotton. So, if these pesticides are used, they are beingused in violation of regulations.
∑ ‘The customer demand for organically grown cotton is not a residue-freeissue’ (Fox 1994), since there is no difference between organic andconventionally grown cotton from a residue standpoint.
∑ In preparation for dyeing and finishing, cotton fabrics undergo scouringand bleaching treatments that would remove any pesticide residues, ifthey were present (Kuster, 1994).
5.3.3 Summary
In summary, it can be seen that organic cotton production is not any moreenvironmentally friendly or sustainable than current conventional cottonproduction. It can require more land to produce the same amount of cotton,it can require more labor, and, it costs significantly more to produce. Froma consumer residue standpoint, there is no difference between conventionallygrown cotton and organically grown cotton.
5.4 Production of organic cotton and how it variesfrom conventional cotton production
Cotton is produced in over 80 subtropical and tropical countries (59 grow atleast 5,000 ha) in the world under a great diversity of farming practices.Cotton production (Hake et al., 1996) is considered highly technical and

Cotton: Science and technology140
difficult because of both crop vulnerability to a variety of pests and sensitivitiesof quality and yield to environmental (e.g., drought and temperature) andnutritional conditions. Current production practices in conventional and organiccotton are similar in some ways and not in other ways depending upon theoperation (Guerena and Sullivan, 2003; Myers and Stolton, 1999). If allconventional practices were followed in organic production, organic productionwould be ineligible for certification as organic cotton. Organic cotton productiondoes not allow the use of most synthetically compounded chemicals (fertilizers,insecticides, herbicides, growth regulators and defoliants) that are registeredfor use for conventional cotton production or biotech cottons varieties, whereascurrent conventional cotton production depends on appropriate use of pesticides,fertilizers and other crop protection products/chemicals. Since the use ofthese products are critical inputs to conventional production as are biotechcotton varieties in some countries, alternative methods are necessary fororganic production. Organic production can be a particular challenge onsome soils and if pest pressures are high. ‘Growing organic cotton is demanding,but with commitment, experience, and determination, it can be done’ (Guerenaand Sullivan, 2003).
Both organic and conventional cotton production employ crop rotation.For organic production all other crops grown on the organic fields wouldhave to be grown using organic production practices. Also no non-naturalcrop protection products can be used on organic fields for three years priorto the start of organic production. It also should be noted that many of theenvironmentally friendly procedures that are used in some organic cottonproduction are also used in producing conventional cotton – cover crops,trap crops, strip cropping, wind breaks, biological control of insects, includingpheromone trapping and mating disruption, etc. (Australian Cotton Industry,2005; Wakelyn, 1994; Wakelyn et al., 2000). In conventional cotton productioncomputer-aided management based modeling systems, like COTMAN (ICAC,2005), are used by some to help manage and monitor crop and pest developmentas well as precision farming/remote sensing (Smith, 1996). Organic cottonproduction uses some ‘IPM systems’, which have shown a high potential forsuccess both ecologically and economically, but does not and cannot considerall available IPM techniques – conventional cotton production does. About60% of USA cotton acreage uses IPM (USDA-NASS, 2001).
5.4.1 Historical background
Before mechanized agriculture and the use of synthetic crop protection products,which began in the 1930s, cotton production practices of planting andcultivation were performed with mule-drawn farm equipment, weeds werecontrolled by the hoe, the use of fertilizer was sporadic, and the crop washarvested by hand (Lee, 1984). From 1926 through 1945 it required 175
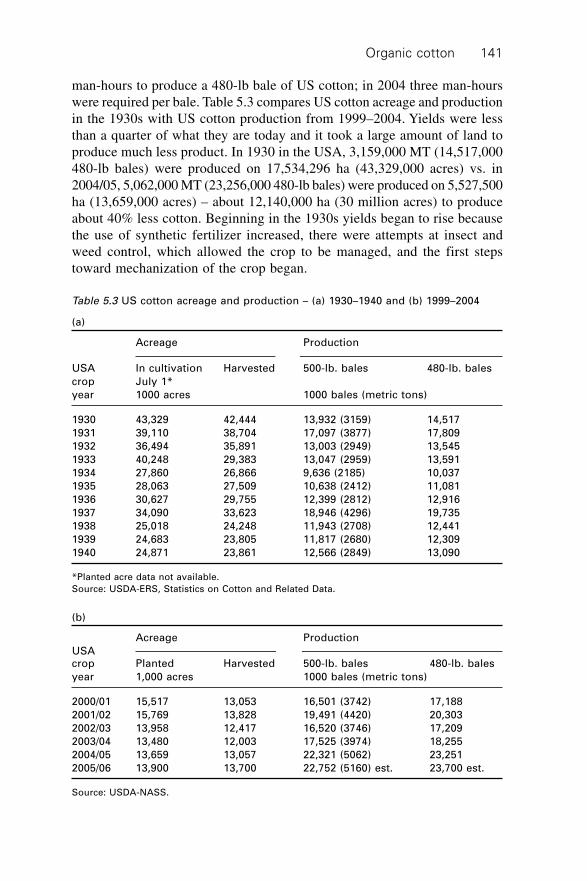
Organic cotton 141
man-hours to produce a 480-lb bale of US cotton; in 2004 three man-hourswere required per bale. Table 5.3 compares US cotton acreage and productionin the 1930s with US cotton production from 1999–2004. Yields were lessthan a quarter of what they are today and it took a large amount of land toproduce much less product. In 1930 in the USA, 3,159,000 MT (14,517,000480-lb bales) were produced on 17,534,296 ha (43,329,000 acres) vs. in2004/05, 5,062,000 MT (23,256,000 480-lb bales) were produced on 5,527,500ha (13,659,000 acres) – about 12,140,000 ha (30 million acres) to produceabout 40% less cotton. Beginning in the 1930s yields began to rise becausethe use of synthetic fertilizer increased, there were attempts at insect andweed control, which allowed the crop to be managed, and the first stepstoward mechanization of the crop began.
Table 5.3 US cotton acreage and production – (a) 1930–1940 and (b) 1999–2004
(a)
Acreage Production
USA In cultivation Harvested 500-lb. bales 480-lb. bales
crop July 1*
year 1000 acres 1000 bales (metric tons)
1930 43,329 42,444 13,932 (3159) 14,517
1931 39,110 38,704 17,097 (3877) 17,809
1932 36,494 35,891 13,003 (2949) 13,545
1933 40,248 29,383 13,047 (2959) 13,591
1934 27,860 26,866 9,636 (2185) 10,037
1935 28,063 27,509 10,638 (2412) 11,081
1936 30,627 29,755 12,399 (2812) 12,916
1937 34,090 33,623 18,946 (4296) 19,735
1938 25,018 24,248 11,943 (2708) 12,441
1939 24,683 23,805 11,817 (2680) 12,309
1940 24,871 23,861 12,566 (2849) 13,090
*Planted acre data not available.
Source: USDA-ERS, Statistics on Cotton and Related Data.
(b)
USA
Acreage Production
crop Planted Harvested 500-lb. bales 480-lb. bales
year 1,000 acres 1000 bales (metric tons)
2000/01 15,517 13,053 16,501 (3742) 17,188
2001/02 15,769 13,828 19,491 (4420) 20,303
2002/03 13,958 12,417 16,520 (3746) 17,209
2003/04 13,480 12,003 17,525 (3974) 18,255
2004/05 13,659 13,057 22,321 (5062) 23,251
2005/06 13,900 13,700 22,752 (5160) est. 23,700 est.
Source: USDA-NASS.
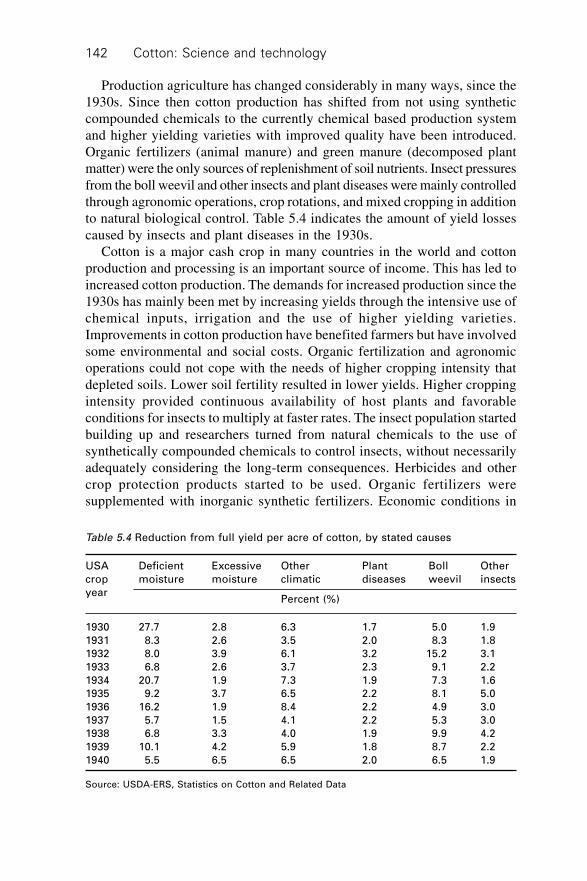
Cotton: Science and technology142
Production agriculture has changed considerably in many ways, since the1930s. Since then cotton production has shifted from not using syntheticcompounded chemicals to the currently chemical based production systemand higher yielding varieties with improved quality have been introduced.Organic fertilizers (animal manure) and green manure (decomposed plantmatter) were the only sources of replenishment of soil nutrients. Insect pressuresfrom the boll weevil and other insects and plant diseases were mainly controlledthrough agronomic operations, crop rotations, and mixed cropping in additionto natural biological control. Table 5.4 indicates the amount of yield lossescaused by insects and plant diseases in the 1930s.
Cotton is a major cash crop in many countries in the world and cottonproduction and processing is an important source of income. This has led toincreased cotton production. The demands for increased production since the1930s has mainly been met by increasing yields through the intensive use ofchemical inputs, irrigation and the use of higher yielding varieties.Improvements in cotton production have benefited farmers but have involvedsome environmental and social costs. Organic fertilization and agronomicoperations could not cope with the needs of higher cropping intensity thatdepleted soils. Lower soil fertility resulted in lower yields. Higher croppingintensity provided continuous availability of host plants and favorableconditions for insects to multiply at faster rates. The insect population startedbuilding up and researchers turned from natural chemicals to the use ofsynthetically compounded chemicals to control insects, without necessarilyadequately considering the long-term consequences. Herbicides and othercrop protection products started to be used. Organic fertilizers weresupplemented with inorganic synthetic fertilizers. Economic conditions in
Table 5.4 Reduction from full yield per acre of cotton, by stated causes
USA Deficient Excessive Other Plant Boll Other
crop moisture moisture climatic diseases weevil insects
yearPercent (%)
1930 27.7 2.8 6.3 1.7 5.0 1.9
1931 8.3 2.6 3.5 2.0 8.3 1.8
1932 8.0 3.9 6.1 3.2 15.2 3.1
1933 6.8 2.6 3.7 2.3 9.1 2.2
1934 20.7 1.9 7.3 1.9 7.3 1.6
1935 9.2 3.7 6.5 2.2 8.1 5.0
1936 16.2 1.9 8.4 2.2 4.9 3.0
1937 5.7 1.5 4.1 2.2 5.3 3.0
1938 6.8 3.3 4.0 1.9 9.9 4.2
1939 10.1 4.2 5.9 1.8 8.7 2.2
1940 5.5 6.5 6.5 2.0 6.5 1.9
Source: USDA-ERS, Statistics on Cotton and Related Data

Organic cotton 143
the developed countries allowed them to embrace the new chemical basedproduction system faster than developing countries. Governments of developedand developing countries provided subsidies to promote the use of fertilizersand pesticides. In hindsight, the earlier overemphasis on the use of fertilizersand pesticides was done without fully understanding the consequences. Cottonin the USA has a history mostly of strong growth, but some of its historyrecounts the farming conditions that were environmentally unsound and arediscussed above.
5.4.2 Planting seed
Unlike most other field crops, seedcotton cannot be stored for a year andplanted the next year. Seedcotton is a perishable commodity that must beseparated into fiber and seed by ginning. So farmers usually have to sell theirseedcotton and thus lose the possession of the seed. Obtaining the seed fromthe gin or through a middleman can cause the seed purity to be questionable.Planting seed for organic production is not different from conventionalproduction, except it cannot be a biotech cotton variety – mechanical or aciddelinting are options for smooth flow of upland cotton (G. hirsutum) seedduring planting and extra long staple (ELS) cotton (G. barbadense) seed isusually smooth and does not require delinting. In addition the planting seedfor certified organic production cannot be treated with synthetic fungicides,insecticides or any other synthetic chemicals, which are used in conventionalcotton planting seed. Both organic and conventional planting seed containcalcium carbonate (to neutralize the seed), biological fungicides, and a polymercoating. Seed treatments are necessary to protect the seed from fungi andbacteria which can affect germination and lower yields.
5.4.3 Soil/land preparation (tillage) and planting
Organic agriculture is often incorrectly characterized as addicted to ‘maximumtillage’ (Kuepper and Gegner, 2004). Soil and seedbed preparation can beabout the same for organic production as for conventional but may involvemore tillage for preparing soil for planting. Organic production conditionsrequire that soil is rich in organic matter and seed bed preparation beginswith working the ground with initial tillage operations. Higher organic mattercould also be helpful in better germination, better plant-stand and higheryields, particularly, if other resources are not available for preparing the seedbed. Plant densities are sometimes lower in organic than conventional systemswithout necessarily sacrificing yield. The resultant changes in the microclimatearound the plants can reduce pest populations and improve plant growthparameters (Van Elzakker and Caldas, 1999).
Cotton: Science and technology144
5.4.4 Fertilization
Meeting the nutrient needs of the cotton plant as closely as possible, assureshigh yields if the crop is properly protected against losses due to pests.Dryland and irrigated cotton take up between 15.7–22.4 kg of N/ha (14 to 20lb of N/acre) to produce each 45.4 kg (100 lb) of lint (www.ppi-ppic.org).Since soil fertilization needs vary for different soils in the world, the N rateto lint output range is much wider, e.g., in Australia conventionally grown(irrigated) cotton works on a different N fertilizer to lint production ratio.Typical N rates do not exceed 200 kg/ha for return lint yields in excess of1,500 kg/ha. Organic farming and conventional farming vary greatly infertilization of the crop. Soil fertility in organic farming is a long-term issuecompared to conventional production, where there is more flexibility inprecision application and dosage of plant nutrients. In conventional productionnutrient applications, particularly nitrogen, can be split into two or threedoses in consonance with the plant growth. If the plant is behind or advancedof the normal growth curve, nitrogen applications can be adjusted to matchthe decreased or increased yield potential. Conventional production can losea portion of the nitrogen, which is a reason why nitrogen applications aresplit in smaller doses. Organic production does not have this option. Organicproduction must start with a good soil fertility status. Soil fertility practicestypically include crop rotation, cover cropping, animal manures, and use ofnaturally occurring rock powders (Guerena and Sullivan, 2003). Livestockmanure is the key nitrogen (N) fertilizer for organic farming.
Organic production of cotton as a component of the farming system willbuild up phosphorus, potassium and micronutrients but the nitrogen levelhas to be augmented through the use of animal manure (6.7–10.8 MT/ha(3–5 tons/acre) of poultry (16.5–32.6 kg N/MT; 37–73 lb N/ton) or aboutthree times that amount (20.2–33.6 MT/ha; 9–15 tons/acre) of cattle/dairymanure (4.5–4.9 kg N/MT; 10–11 lb N/ton) (Agronomy Facts 55, 1997;Agronomy Series Alabama Cooperative Extension System, 2006)), as thebasic fertilizer, along with green manure, crop rotation, nitrogen fixing cropsand incorporation of cotton stalks. The total N in poultry manure is slightlyless effective as N in an ammonium nitrate fertilizer (Alabama CooperativeExtension System, 2006). Poultry manure contains more N than cattle manureand is preferred for organic cotton production. Conventional cotton productionuses a small amount of a nitrogen fertilizer, phosphorous and potassium (seesection 5.3; about 89.7–168.1 kg/ha (80–150 lb/acre N), 0–89.7 kg/ha (0–80lb/acre P), and 0–89.7 kg/ha (80 lb/acre K)).
5.4.5 Water use
Cotton is a drought- and heat-tolerant crop that does not require excessiveamounts of water to grow. Cotton requires about 610–660 ha mm (24–26

Organic cotton 145
acre inches) of water during the growing season as rainfall or supplementalirrigation to produce about 750 kg lint/ha of cotton. The yields achieved,which depend not only on water and method of irrigation (e.g., sub-surfacedrip, furrow, flood irrigation) but many other factors, determine the wateruse efficiency (WUE) (ICAC, 2003). According to Orgaz et al. (1992), cottonWUE is 2.7 kg lint ha–1 mm–1. WUE varies considerably between countries– about 227 kg lint/mega liter water in Australia, about 139 kg/mega liter inCalifornia, about 136 kg/mega liter in Egypt, and only about 50 kg/megaliter in Pakistan (ICAC, 2003).
Cotton uses about as much water as a Bermuda grass lawn. Proper irrigationmanagement is essential for cotton, and is used to balance vegetative growthwith boll development, as well as to manage disease and insect populations.About 35% of the USA acreage receives supplemental irrigation and about55% of world cotton production comes from irrigated land (ICAC, 1998 and2003). The delivery method, number of applications, and the amount ofapplied surface water varies from location to location. Total applied waterdepends on the soil type, residual soil moisture and water availability. Forcotton, furrow irrigation is the preferred application method. Methods shouldbe used to improve irrigation efficiency by minimizing evaporative waterloss and reducing labor costs. Without access to irrigation technology tostabilize and optimize cotton production, many more millions of hectares ofland would be required to maintain current levels of world output. Conventionalcotton production should not require more water/irrigation than organic cottonproduction as is sometimes alleged, unless there is a great difference in theorganic matter in the soil. The water use requirements per acre for conventionaland organic cotton should be similar, although if yields are reduced with onesystem relative to the other, then water use efficiency would also be reduced.
5.4.6 Weed control/management
Control of weeds can be a major problem in cotton production (McWorterand Abernathy, 1992). Cotton production can be affected by a wide varietyof weed pests, including, velvetleaf (Abutilon theophrasti), pigweed(Amaranthus spp.) tropical spiderwort (Commelina benghalensis),bermudagrass (Cynodon dactylon), yellow nutsedge (Cyperus esculentus),purple nutsedge (Cyperus rotundus), crabgrass (Digitaria sanguinalis), morningglory (Ipomoea spp.), common purslane (Portulaca oleracea), foxtail(Portulaca oleracea), johnsongrass (Sorghum halepense), cocklebur (Xanthium
spp.), etc. Weed control during the cotton production year can be one of thebiggest challenges in organic production (Swezey and Goldman, 1999).Elimination of synthetic herbicides in organic production gives rise to adifferent weed management approach in organic farming vs. conventionalfarming.

Cotton: Science and technology146
Organic production conditions can result in a wide variety of weeds in thecotton field, but they may be easier to control than conventional cotton. Croprotation, which is used in both conventional and organic cotton production,reduces the weed problem to some extent. Other current methods of weedmanagement for organically produced cotton include a combination ofmechanical cultivation, flame weeding, and other cultural practices, such ashand hoeing, but these manual and cultural operations may not be adequateto produce clean fields (Guerena and Sullivan, 2003). If there are weeds inthe cotton field, they could harbor insects and also steal nutrients fromcotton. Smaller growers can handle the weed management issue but it can bea concern for large organic growers.
5.4.7 Insect control/management
Cotton is attacked by a wide variety of insects (King et al., 1996) includingthe American cotton bollworm (Helicoverpa armiger), pink bollworm(Pectinophora gossypiella), tobacco budworm (Heliothis virescens), spiny,Egyptian, and spotted bollworms (Earias spp.), red or Sudan bollworm(Diparopsis spp.), cutworms (Agrotis spp.), beet armyworm (Spodoptera
exigua), armyworms (Spodoptera spp.), boll weevil (Anthonomus grandis),cotton aphid (Aphis gossypii), silver leaf whitefly (Bemisia argentifolii),sweetpotato whitefly (Bemisia tabaci), lygus (Lygus spp.), alfalfa looper(Autographa californica), cabbage looper (Trichoplusia ni), thrips (Thrips
spp.), spider mites (Oligonchus spp. & Tetranychus spp.), etc. Syntheticchemical insecticides used in conventional cotton production are not allowedin organic production. This is one of the most significant changes/differencesin production practices with organic farming. Elimination of syntheticinsecticides can be the biggest savings for organic producers. These savingscould be used to improve other field operations and management of crop.Organic cotton producers not only save in cost of insecticides, but also inspray equipment.
Pest management in organic farming is directed toward enhancing andutilizing the natural balance of useful pests. The primary insect and mite pestmanagement tools of organic growers are field strips of vegetation as beneficialinsect habitats (i.e., trap cropping, strip cropping, and border vegetation),regular and systematic monitoring of the population levels of pests, naturalpredators, parasites, and the release of biopesticides/biological control agents(i.e., bacteria, like Bt, viruses, and fungal insect pathogens) (Swezey andGoldman, 1999; Guerena and Sullivan, 2003). Organic cotton productionalso may use ‘natural’ chemicals like sulfur dust. The first two years oftransition from using synthetic insecticides could be difficult but by the thirdyear, natural balances usually build up reducing the need for insecticides.The need for laboratory rearing of biological control agents and utilization
Organic cotton 147
of other cultural control measures is more necessary in organic farmingthan in conventional production. While conventional cotton production isdependent on insecticides for control of pests, conventional cottonproduction also uses integrated pest management (IPM) systems that applya number of different controls on insect pests as well as pesticides includingbiotech cotton, systematic monitoring of the population levels of pests,beneficial natural predators and field strips of vegetation as beneficial insecthabitats.
5.4.8 Disease control/management
Cotton may require management for seedling disease, soil disease, boll rot,and foliar disease (Guerena and Sullivan, 2003). Causes of cotton diseasesinclude fungi, bacteria, viruses, and nematodes. Seedling diseases are due tosoil-borne fungi (primarily Rhizoctonia solani, Phyium spp., and Thielaviopsis
basicola). The most common fungal soil diseases of economic significanceare Fusarium wilt (Fusarium oxysporum), Verticillium wilt (Verticillium
dahliae), and Texas root rot (Phymatotrichum omnivorum). Boll rots are aproblem where bolls are starting to open or have been damaged by insects inareas of high rainfall and humidity. Foliar diseases include bacterial blight(Xanthomonas campestris), common in areas with warm, wet weather duringthe growing season, alternaria leaf spot (Alternaria macrospore), and cottonleaf crumple virus, which can be vectored by silverleaf whitefly (Bemisia
argentifolii).Most cotton diseases are controlled through the use of naturally resistant/
tolerant cotton varieties to pathogens (host-plant resistance) or creatingconditions unfavorable for pathogens to grow and spread. Resistant varietiesused in conventional production are the best option against most diseases. Ifthe soil is well drained due to sufficient organic matter and proper croprotations are followed (which is usually the case in organic farming) diseasesmay not be a major concern for organic production. Control measures underorganic farming conditions (such as sanitation and planting when the soil iswarm) are more important compared to conventional farming conditions,since synthetically compounded crop protection products cannot be used inorganic production.
5.4.9 Nematode control/management
Nematodes are soil-dwelling, worm-like animals which cause damage that isusually considered soil disease. The main nematodes affecting cotton arereniform (Rotylenchulus reniformis), root-knot (Meloidogyne incognita), andColumbia lance (Hoplolaimus columbus). The purpose of nematodemanagement is to keep nematode population densities at a low level during

Cotton: Science and technology148
the early growing season to allow cotton plants to establish healthy rootsystems (National Cotton Council, 2006b). The goal is not the completeelimination of nematodes, because they are a normal part of the soil microbialpopulation and most are beneficial.
Use of tolerant varieties of cotton and cultural practices are the controlmeasures used for organic farming. Many early resistant cotton varietieswere developed primarily to control the root-knot nematode/fusarium wiltcomplex. Currently, most commercial varieties have some tolerance to thiscomplex, but very few varieties of cotton show significant tolerance to othermajor cotton nematodes. Effective cultural practices, include, tillage, watermanagement, clean equipment, and crop rotation. Conventional cottonproduction, in addition to using tolerant varieties of cotton and culturalpractices, also when necessary, uses synthetically compounded crop protectionproducts that cannot be used in organic cotton production. Chemical controlsinclude fumigants and non-fumigants. Fumigants are non-selective materialsthat vaporize when applied in the soil and as gases, they move up through airspaces in the soil, killing nematodes and other microorganisms. Non-fumigantsare available in liquid or granular forms that are applied either in a band orin the seed furrow at planting. Non-fumigants protect plants early in thegrowing season allowing them to produce deep, healthy root systems.
5.4.10 Harvest preparation, boll maturation, andharvesting
Hand picking is the method used in about 75% of world production. Handpicking of organic cotton is the same as for conventional cotton. Hand pickingcan result in cleaner cotton, if only the fiber is removed from the boll duringhand harvesting, instead of the whole boll, and other contaminants from theworkers and the field (e.g., synthetic fibers from clothing and plastic), natural‘organic matter’ from inadequate defoliation, and ‘inorganic matter’ fromsand or dust, are avoided. In addition, there can be seed-coat fragments andstickiness (insect and plant sugars). Efficient ginning of the cotton alsomakes a difference in trash/contamination in the lint. According to the ‘CottonContamination Surveys 1999–2001–2003–2005’ by the International TextileManufacturers Federation (ITMF) (ITMF, 2005), the most contaminated cottonsoriginate in India, Turkey, and Central Asia (Uzbekistan and Tajikistan), allhand picked cotton, whereas the cleanest cottons can be sourced from theUS, which is all machine harvested, Zimbabwe, and selected West Africancottons (Senegal and Chad), which are hand harvested.
If machine picking (picker or stripper harvesting) is used to harvest thecotton, usually defoliation is necessary, particularly where timely frost doesnot occur. Defoliation is a significant obstacle to organic production (Guerenaand Sullivan, 2003). Synthetic chemical defoliants are prohibited for use on

Organic cotton 149
organic cotton and no other strong choice is available for mechanized farmersto get rid of green leaves, except frost. ‘Natural’ chemicals like organic acid-based foliar sprays, like citric acid, and nitrogen and zinc sulphate can be used inharvest preparation in organic production as well as flamers. Ceasing irrigationcan assist leaf drop and boll maturation in some growing areas. These techniqueshelp boll maturation, plant desiccation, and leaf drop, but they usually do notachieve the same results as the synthetic materials used in addition to frostin conventional cotton production (Swezey and Goldman, 1999).
Green leaves (leaf drop) must be removed prior to harvesting because lowleaf drop slows the harvest, reduces the grade of the cotton, and increases gincosts (Swezey and Goldman, 1999). Frost helps to drop leaves but it may notoccur or, if it does, it may not be advisable to wait for the freezing temperatureswhen most bolls on the plant have already opened. Damage to cotton qualityas well as increases in aflatoxin levels, in areas where it is prevalent, arerelated to harvest date. So it is always advisable to harvest as soon as possibleafter a sufficient number of bolls have opened. Development of naturallyleaf-shedding varieties is another choice, but no such varieties have beencommercialized so far. Proper water management could also help to enhanceleaf shedding. But, in order for organic cotton to progress with large-scalegrowers, alternative defoliants need to be developed that are acceptableunder organic conditions since the current practices of using organic acid-based foliar sprays and nitrogen and zinc sulphate in harvest preparation arenot always very effective (Swezey and Goldman, 1999).
5.5 Post-harvest handling/processing of organiccotton
To protect organic integrity, all stages of processing, storage, and transportof organic fiber products should be segregated and protected from cominglingwith conventional fiber products and not come into contact with prohibitedmaterials or other contaminants. Seedcotton (consisting of cotton fiber (lint)attached to cottonseed plus plant foreign matter) obtained at harvest is aperishable raw agricultural commodity. The seedcotton is transported to theginning plant in trailers or modules, or is stored in the field in modules.When the cotton is stored in the field in modules, the modules have to beproperly covered to protect the cotton from wet weather to prevent loss ofquality. Ginning, which is part of the harvest (Wakelyn et al., 2005), is theprocess of removing and separating lint fibers from the seed and plant foreignmatter (Anthony and Mayfield, 1994). Cotton essentially has no commercialvalue/use until the fiber is separated from the cottonseed and foreign matterat the gin.
The three major post-harvest processes in the conversion of raw cottonfiber into a finished fabric are: yarn manufacturing (spinning, or yarn making),
Cotton: Science and technology150
fabric manufacturing (weaving, knitting, or non-woven), and dyeing andfinishing. To produce organic textiles, certified organically produced cottonshould be processed according to processes certified as organic (Tripathi,2005). It should be spun, woven/knitted, and processed with energy-efficientand toxic-free methods. All processing agents used must meet requirementsfor toxicity and degradability/eliminability. All wet processing facilities shouldhave water conservation and resource management in place and should conformwith waste water disposal standards.
The Organic Trade Association (OTA) developed voluntary organicstandards for fiber processing standards (post-harvest handling, processing,recordkeeping and labeling; ‘Organic Trade Association’s Fiber ProcessingStandards’) in 2004 (Murray and Coody, 2003; OTA, 2005a). They cover allpost-harvest processing, from storage of organic fiber at the gin or warehouse,to yarn manufacturing, fabric manufacturing, wet finishing, quality assurance,and labeling and list chemicals that can be used (see section 5.8.5). TheOrganic Exchange (OE) developed voluntary guidelines, the Organic Exchange100 standard (OE 100), and the OE Blended Standard to help companiesproducing organic products understand what they need to do to track anddocument the purchase, handling and use of organic cotton in their products(see section 5.8.4).
5.5.1 Ginning
Organic cotton has to be ginned separately from conventional cotton so thegin has to be thoroughly cleaned prior to ginning the organic cotton andorganic cotton is stored in a segregated section of the gin yard unless a ginis designated only for organic production. The movement and quarantine ofgin trash/by-products is sometimes necessary to reduce transmission of soil/plant borne pathogens from conventional and organically raised cotton. Aftercleaning the gin, the first bale of cotton ginned is considered ‘conventionalcotton’ in case any conventional lint still remained in the ginning system.Ginning is no different for organic and conventional cotton unless there ishigh trash content. Ginning operations are normally considered to includeconditioning (to adjust moisture content), seed-fiber separation, cleaning (toremove plant trash), and packaging. Upland cottons are ginned on saw gins,whereas roller gins are used for ELS cottons. Higher trash in seed cottonrequires additional cleaning (i.e., stick machines, incline cleaner) at the ginbefore ginning the seed cotton and additional cleaning (lint cleaners) afterthe lint fiber has been through the gin stand and before baling. Additionalmechanical processing can have an effect on fiber quality as well as causehigher gin loss. In the case of mechanical harvesting, if the picker or stripperharvesters have picked green leaves along with cotton because harvest aidchemicals were not used where necessary, there could be a noticeable impacton quality.

Organic cotton 151
5.5.2 Yarn manufacturing
The textile manufacturing of organic cotton from opening, blending, carding,drawing, combing, if necessary, roving, spinning into yarn and winding is nodifferent than for conventional cotton, particularly if no processing oils areused. Processing oils are not usually necessary because of the natural waxeson the surface of cotton. Sometimes biodegradable oils are used in ringspinning, but these oils are removed by fabric scouring and bleaching priorto dyeing.
Prior to yarn and fabric manufacturing all lines must be thoroughly cleanedto remove conventional cotton or lines have to be dedicated to organic cottonyarn and fabric manufacturing. The first step in textile mill processing isopening and blending (Wakelyn, 1997). The quality parameters of cotton(i.e., length, length uniformity, strength, micronaire (an indicator of finenessand maturity), color, leaf, and extraneous matter) vary considerably frombale to bale and from growing region to growing region. To ensure consistencyin processing efficiency and product quality, many cotton bales of similarquality are blended to produce a homogeneous mix. To do this, bales ofcotton are arranged in a ‘lay-down’ so that sophisticated blending equipmentcan continuously remove some cotton from up to 100 bales of cotton at atime, thereby ensuring consistency of fiber properties along the length of theyarn. If the cotton is not blended properly there can be problems later withthe dyed (e.g., barre) and finished fabric/textile. Since the supply of organiccotton is limited, it may be difficult sometimes to get sufficient bales oforganic cotton with similar properties from one growing area, to blend toavoid these quality problems.
5.5.3 Fabric manufacturing
Weaving, knitting or non-woven fabric manufacturing of organic cotton andconventional cotton should be similar as long as natural starch sizes areused. Weaving preparation (i.e., direct and indirect warping and sizing) is animportant process in the production of woven fabric, especially for high-speed weaving, and will continue to be so depending on the future technologyof woven fabric production (Diehl, 2004). It requires the yarn to be coatedwith starch or some other ‘size’, prior to weaving for extra strength andabrasion resistance. Sizing is the only operation that may have someenvironmental concerns in weaving. The size has to be removed, prior todyeing and finishing. If starch is used for sizing, it is normally removed withenzymes and scouring. The starch size is not recycled and has to be handledin a manner that does not cause water pollution or other environmentalproblems. Starch breaks down during the enzymatic treatment and is removedby washing. It consumes oxygen thus lowering oxygen (biological oxygen
Cotton: Science and technology152
demand, ‘BOD’) in the washing water. Polyvinyl alcohol size, usually usedin conventional sizing, can be removed by scouring and can be recycled. Itis, therefore, considered to be more environmentally friendly than ‘natural’starch. There is research under way on sizeless weaving, but there are nocommercial processes. Sizing is not required in the manufacture of knittedfabrics, but knitting oils are usually used. They are removed during normalscouring in preparation for dyeing and finishing. Non-woven fabricmanufacturing does not require the use of natural or synthetic sizes either,but various additives can be used, which would need to be considered natural.
5.5.4 Preparation, dyeing, and finishing
Typically, in normal preparation for dyeing or printing and finishing, raw(greige) fabric is singed, desized, scoured, bleached, and mercerized (CottonIncorporated, 1996, Wakelyn et al., 2006). These treatments remove naturalnon-cellulosic constituents/impurities and increase the affinity of cellulosefor dyes and finishes. Caustic soda (sodium hydroxide) is commonly used inscouring which removes natural waxes and impurities from the fabric.Bleaching is done with hydrogen peroxide but without optical whiteners andthe temperature must be over 60 ∞C, which increases energy consumption.Bleaching removes residual impurities and changes the fabric color to clearwhite rather than the off white it was before bleaching. If chlorine bleachingmethods, which are very rarely used today, are used it is sometimes incorrectlyclaimed (Green Cotton Thailand, 2006) that ‘dioxins’ are created. Cotton isnot a ligninified cellulose and it has been shown that dioxins are not formedby chlorine bleaching of cotton (Wakelyn, 1994). Mercerization, treatmentof the fabric with strong aqueous solution of sodium hydroxide, is done toadd luster, strength and dye absorption properties of the fabric. Fabricappearance and strength are greatly enhanced by mercerization. Appendix 2contains a list of some chemicals allowed and prohibited in preparation,dyeing, printing and finishing of textiles that follow various voluntary organicstandards for wet finishing of organic cotton textiles.
The fabric is dyed after preparation. For organic processing, all dyesshould conform to the Ecological and Toxicological Association of Dyes andOrganic Pigments Manufacturers (ETAD) Guidance Documents regardingresidual heavy metals and aromatic amines found in finished products (ETAD,1997; EU Directive, 2002). Dyeing of organic cotton should use dyes free ofheavy metals, e.g., chromium, and formaldehyde or other hazardous chemicals.A closed water circuit dyeing process is used to filter and neutralize thewaste (Tripathi, 2005).
Conventional cotton textiles are dyed with an extensive number of dyeclasses, including reactive, azoic, direct, indigo, pigment, sulfur, and vatdyes (Cotton Incorporated, 1996). The first choice to be used on organic
Organic cotton 153
fabric, when applicable, should be plant-based natural dyes. But commerciallyavailable natural dyes are extremely limited, usually require fixing agents(metal-based ‘mordants’, which can be pollutants), high temperatures, canhave poor light and wash fastness, and can have variation in color tones. Thenext choice should be low impact dyes. Many dyes used in conventionaldyeing of cotton fabric are synthetic and are prohibited for use on organiccotton textiles. However, some ‘non-toxic’ dyes that are used on conventionaltextiles, including some azo reactive dyes, are allowed to be used on organiccotton textiles. Azo dyes, which by reductive cleavage upon degradation canrelease one or more of 22 aromatic amines (ETAD, 1997; EU Directive,2002), are prohibited for use in organic processing. These dyes are alsoprohibited for use in the EU and are no longer used in the USA and mostother countries. Pigment dyes, except for non-toxic, naturally occurringpigments, e.g., indigo and clays, are also prohibited in organic processing.Only printing methods based on water or natural oils are allowed inorganic processing. Printing using heavy metals as discharging agents isprohibited.
After dyeing/printing fabrics can be treated with chemicals to conveyflame resistance, water repellence, durable press/crease resistance, etc.Chemicals that can release or contain formaldehyde are prohibited. Stonewashing and other environmentally harsh textile finishing processes that useauxiliary additives and large amounts of water are prohibited in organicprocessing. Products that meet criteria established by ecolabels are intendedto be a market-oriented tool to guide consumers. However, ecolabels maynot identify products which are ‘better’ for the environment than non-labeledproducts, because the process by which products are assessed can be flaweddue to difficulties inherent in life cycle analysis (Hardy, 1998).
It is suggested that dyeing should be skipped to prevent pollution (GreenCotton Thailand, 2006). However, most dyeing and finishing processes cannotbe avoided if organic cotton textiles are to have the same aesthetics asconventional textiles, but they can be substituted with more environmentfriendly operations and chemicals. Since some operations and treatments,though not organic, cannot be avoided, it is important that energy efficientprocessing with less use of toxic chemicals and low water use be applied.Large quantities of chemicals and water can be used in finishing of a fabric,but today most conventional and organic dyeing and finishing processes uselow inputs for water and chemicals. The conventional dyeing and finishingprocessing systems at textile mills can pollute the environment if properpractices, including effluent guidelines, are not followed. The resultant effluentshould be treated in a waste water treatment process at the dyeing and finishingplant prior to being emitted as an effluent. The effect of chemicals on workers’health can also be a concern if workplace occupational health and safetyregulations are not followed.

Cotton: Science and technology154
5.5.5 Product assembly
For organic textiles, natural fibers such as cotton (organic if available) arepreferred for use as sewing thread but synthetic sewing thread may be used.Labels made of natural fiber can be used.
5.5.6 Quality assurance
To meet consumer demands for good aesthetic and fastness properties organictextiles should meet the same quality/fastness parameters for color uniformity,light and wash fastness, wet and dry crock fastness, and shrinkage (Tripathi,2005), that the consumer expects for conventional textiles.
5.6 Limitations to organic production
Various issues hinder the adoption of organic cotton production. These includeproduction problems, particularly insect and weed control, and marketingproblems, particularly price variability and unstable, underdeveloped markets.
5.6.1 Problems with organic production practices
In 2002/03, the OTA (Pick and Givens, 2004), in a project funded by CottonIncorporated, attempted to identify limitations to organic cotton productionin the US. The Organic Fiber Council of the OTA surveyed all US organiccotton growers concerning organic cotton production practices and problems.The International Cotton Advisory Committee (ICAC) collected similarinformation in 1994, in addition to information on the cost of production andthe price premium for organic versus conventional production. These studiesconcluded that the main problems for organic cotton production are weedcontrol (due to prohibition of herbicides), defoliation (due to lack of efficientnatural products), and insect control (due to lack of efficient natural/organicinsecticides). Defoliation is a limitation, particularly in the USA, where allcotton is machine harvested, because the plant needs to be treated for leafdrop (defoliated) before harvesting machines enter fields. Some farmers alsoindicated lack of seed treatment, which is not permitted in organic production.Availability of inputs needed for organic farming and additional paper work/record keeping also hinder adoption of organic cotton production.
The boll weevil has caused heavy losses to cotton production in the USAsince the 1920s (Dickerson et al., 2001). The boll weevil eradication program,which has successfully eliminated the boll weevil from many parts of the UScotton belt, particularly in the southern states (El-Lissy and Grefensette,2002), continues in many other parts of the USA (National Cotton Council,2006a). Farmers are not able to grow organic cotton in these boll weevil

Organic cotton 155
eradication treatment areas. The same is true in the pink bollworm eradicationareas. In the areas where eradication is completed, there should be fewerinsect problems – this would be helpful to organic cotton production.
The USDA, AMS, National Organic Program (NOP) at first did not allowacid delinted seed, but had to amend its decision since no machines forplanting un-delinted fuzzy seed are being manufactured. Acceptance of aciddelinted seed for organic planting did not increase organic cotton production,but was helpful to planting of organic seed. In the OTA report (Pick andGivens, 2004), the NOP rule was identified ‘as creating some difficulties forfarmers, including some increased costs, the sourcing of agricultural inputs,increased paperwork, and inconsistencies in interpretation of the rule bycertifiers’.
US organic standards as well as international standards do not allow theuse of biotech cotton. The current biotech varieties convey insect resistanceand herbicide tolerance (Fitt et al., 2004; Wakelyn et al., 2004). Insect resistanceis conferred through the incorporation of genes from Bacillus thuringiensis
(Bt) that produce Bt d-endotoxins, naturally occurring insect poisons forbollworms and budworms. The use of Bt biotech cotton reduces the use ofinsecticides and minimizes adverse effects on non-target species and beneficialinsects. Herbicide tolerance (HT) enables reduced use of herbicides and useof safer, less persistent materials to control a wide spectrum of weeds thatreduce yield and lint quality of cotton. Biotech herbicide tolerance movescotton weed management away from protective, presumptive treatments towardresponsive, as-needed treatments. If biotech varieties were allowed, it wouldbe helpful to organic production.
5.6.2 Other issues that hinder the adoption of organiccotton
Various other issues that are hindering the adoption of organic cotton includealternative inputs, crop rotation problems, ineligibility of transgenic cottonfor organic certification, lack of organic cotton marketing information, andorganic certification issues. One of the most important aspects of organiccotton production and expansion requires improvement in marketing, andmarket linkages between cotton producers and international organic cottonbuyers, including access to market information distribution channels.Improvements in all these areas are needed to promote organic cotton properly.
Lack of information on cost of production
Elimination of some conventional inputs is expected to lower the cost ofproduction per hectare (cost/ha), but may not mean lower cost of productionper kilogram of lint, if reduction in yield is more than compared to reduction

Cotton: Science and technology156
in input costs. Also other organic practices, such as the control of weeds byhand hoeing, increase costs. The cost of production greatly varies amonggrowers, production regions and countries, but unfortunately no authenticdata are available to compare cost of production of organic cotton versusconventional production. In the absence of such information or limitedinformation, farmers can be reluctant to adopt organic agricultural practices.
Price premium/unstable markets
Organic producers expect a price premium in exchange for the cost ofcertification, risk for lower yield, and possibly lower quality due to spottedor more trash in the cotton due to imperfect control of bollworms or otherinsects and problems in harvesting. Spotted and higher trash cotton – lowergrades of cotton – could cause the farmer to receive a discounted price ratherthan a premium.
There appears to be no fixed premium for organic production efforts. TheOTA survey (Pick and Givens, 2004) data indicated that in the US ‘theaverage price per pound received by farmers showed a wide range, from$0.69 to $1.40 for upland (organic) cotton’ compared to US$0.57–76 in2003/04 and US$0.48–0.57 in 2004/05 for base grade conventional cotton(A-index world price). The enormous variability in prices received by farmersis an indication of how unstable the market is. The premium is supposed tobe enough to compensate for the loss in yield or even to increase farmers’income over conventional production. No authentic information is availableto potential organic cotton growers on how much premium an organic producershould expect when shifting to organic production and this has discouragedsome growers from growing organic cotton. Solid indications that pricepremiums will be received would encourage organic production.
Development of national markets
Most organic cotton produced in Turkey and the USA has been exported toother countries. Organic cotton production in Turkey was initiated by amultinational company called the Good Food Foundation in 1989, whichwas followed by a second project by a German company called Rapunzel.Currently, a number of companies are involved in organic cotton productionin Turkey and almost all organic production is through contract farming.Companies contract growers to produce organic cotton for them and alsoarrange their own certification. In the USA organic cotton certification is bythe USDA. In spite of many years of organic production in both countries, alocal market for consumption of organic cotton has not developed, thusleaving organic cotton producers at the mercy of unknown internationalbuyers scattered in many countries. Beyond production and local markets,

Organic cotton 157
the standards for eco-friendly textile products have been variable. There is aneed to develop local markets for organic cotton closer to the productionchain and harmonization of international labeling schemes for eco-friendlyorganic textile products.
5.7 Methods to improve organic cotton production
If some of the factors that have limited the adoption of organic farmingpractices (discussed in section 5.6) and that keep it a niche market are removed,organic production could spread to more countries and expand production inthose countries. The chances of obtaining higher prices for organically producedcotton are much better if it is produced under contract for a committedbusiness. Suitable varieties and improved insect and weed control anddefoliation technology are some of the parameters that could help increaseorganic cotton markets.
5.7.1 Suitable varieties
In all of the 20-plus countries where farmers have tried to produce organiccotton, they have used the conventionally grown varieties developed for thatgrowing area for organic production. These commercially grown varietieshave been developed for high input conditions, synthetic fertilizer, andinsecticide usage. Varieties that perform well under optimum conventionalconditions cannot maintain their yield level when the conditions they havebeen developed for change so drastically. Varieties suitable for organic farmingproduction conditions must be developed (Chaudhry, 1993, 2003).
5.7.2 Production technology
For conventional cotton production breeders, agronomists, entomologists,and pathologists jointly develop a technological package that includes thebest use of inputs and production practices. These practices recommend theproduction technology practices for achieving high yields. Next the informationis disseminated to cotton growers in many ways through federal and stateextension workers and consultants. The communication of the technology isequally as important as the development of the technology. The thirdcomponent, the adoption of technology, is at the discretion of individualgrowers. Development, transfer and adoption of technology help give thefarmer some assurance that high yields will be obtained. For conventionalcotton production this is the normal practice. Organic cotton productiontechnology needs to be and should be developed and formally transferred byspecialized extension workers to organic cotton growers.
Cotton: Science and technology158
5.7.3 Soil fertility
The soil has to be replenished to maintain the optimum supply of nutrientsthe plant requires to grow and if it is not done, growth and yields are affected.Nutrient needs change from minimum to maximum for N, P and K duringthe course of crop development. Matching nitrogen is more critical, becausenitrogen moves in the soil and could leach out by the time the plant’s needsreach their peak. This is why nitrogen fertilizers are always split into dosesso that supply is close to the needs of the plant. Organic fertilizers (manure)and other permissible sources of nutrient for organic conditions fail to meetthe plant’s changing needs for nitrogen and thus, limit organic cotton production.New methods are required to keep soil fertility high and sufficient to meetplant needs. This is necessary for high yields.
5.7.4 Pest control
The cotton plant is naturally vulnerable to a variety of insects. Unless efficientand effective control methods are available under organic conditions, yieldis going to be affected negatively. Insects like bollworms/budworms andwhitefly can lower cotton grade and depress prices received by farmers.Sucking insects at early stages of cotton plant growth affect physiologicalactivities in leaves and result in the plant producing less fruit. Insecticidesprovide efficient and effective control but are not allowed. Biological controland non-conventional insect control insecticides like products from the Neemtree (Azadirachta indica) do not provide control equivalent to syntheticinsecticides. Moreover, after synthetic insecticides are eliminated, the reductionin yield is the greatest in the first year but may improve as natural biologicaldefense builds. Many farmers cannot sustain the loss in yields in the first fewyears. This is a disincentive for potential organic producers. Research mustbe conducted to keep the loss in yield to the minimum for the first two years,when loss in yield is high and there is no premium since the cotton is still inthe transitional stage.
5.8 Certification
Certification is a prerequisite for a product to be sold as ‘organic’ cotton.Certification provides a guarantee that a specific set of standards has beenfollowed in the production of the organic cotton. Cotton was first certified asorganic in 1989/90 in Turkey. Currently there are hundreds of private organicstandards worldwide for all organic products. Organic standards have beencodified in the technical regulations of more than 60 governments. There are99 accredited certifying companies/organizations in the world dealing withcotton with 56 located in the USA and 43 in all the other organic cotton

Organic cotton 159
producing, processing, and consuming countries. European Union (EU)regulations, International Federation of Organic Agriculture Movements(IFOAM) standards, and the US National Organic Standards (NOP) havehelped to formulate organic farming legislation and standards throughout theworld. Certifying companies develop their own standards but all are essentiallycomparable. Organic cotton producers have to commit to follow the standardsset by the certifying organizations/companies, which includes verificationthrough field visits by independent third parties. The certifying agency mustbe accredited, recognized by buyers, and the system must be independentand transparent. The fee for certification must be low enough so that it doesnot add significantly to the cost of production, otherwise it can become adisincentive to grow organic cotton.
In many cases for cotton, certification has been limited to fiber production.Yarn and fabric manufacturing and dyeing and finishing are done in theconventional way. Such efforts can facilitate organic production and at thesame time recognize the difficulties faced in certifying the whole chain asorganic. The Organic Trade Association (OTA) has adopted voluntary organicstandards for fiber processing standards for post-harvest handling, processing,recordkeeping and labeling (Murray and Coody, 2003; OTA, 2005a) (seeSection 5.8.5) as has the Organic Exchange (see section 5.8.4).
5.8.1 International Federation of Organic AgricultureMovements (IFOAM)
The International Federation of Organic Agriculture Movements (IFOAM)was established in 1972 (IFOAM, 2005). IFOAM implements specific projectsthat facilitate the adoption of organic agriculture, particularly in developingcountries. The IFOAM adopted basic standards for organic farming andprocessing in 1998. The IFOAM standards, revised over time, are not bindingfor any country/producer of organic agricultural products, but they do providevaluable guidelines for organic producers and processors. The IFOAM OrganicGuarantee System enables organic certifiers to become ‘IFOAM Accredited’and for their certified operators to label products with the IFOAM Seal, nextto their own seal of certified production/processing.
5.8.2 European Union (EU) regulation of organic cotton
The European Union adopted Regulation No. 2092/91 in June 1991 fororganic production of agricultural products and labeling of organic plantproducts (EU, 1991; Dimitri and Oberholtzer, 2005 and 2006). It came intoeffect in 1993. Since then it has been amended on several occasions. Theregulation defines a minimum framework of requirements for organicagricultural products, including organic production methods, labeling,

Cotton: Science and technology160
importation, and marketing for the whole of Europe, but each member stateis responsible for interpreting and implementing the rules, as well asenforcement, monitoring, and inspection. EU labeling of organic products iscomplex because some member states have public labels, while private certifiersin other member states have their own labels. According to this regulation,the minimum period to convert from conventional farming to organic productionis two years (before planting) for annual crops and three years (before thefirst harvest) for perennial crops. According to the EU regulation, just as inthe US regulations, biotech cotton varieties cannot be used for certifiedorganic production nor can ionizing radiation be used on products.
In March 2000, to improve the credibility of organic products, the EUintroduced a voluntary logo for organic production bearing the words ‘OrganicFarming’ (EU, 2000). It can be used throughout the EU by producers whosesystems and products, on inspection, satisfy EU regulations. The logo assuresthat the product complies with the EU rules on organic production. The EUregulation 2092/91 permits labeling a product as ‘organic farming’ if:
∑ at least 95% of the product’s ingredients have been organically produced∑ the product complies with the rules of the official inspection scheme∑ the product has come directly from the producer or preparer in a sealed
package∑ the product bears the name of the producer, the preparer or vendor and
the name or code of the inspection body∑ 70–95% of the ingredients are from organic production conditions, the
product may refer to organic production methods in the list of ingredientsbut not in the sales description
∑ less than 70% of the ingredients are from organic production conditions,the product cannot make any reference to organic production methods.
In December 2005, the European Commission made compulsory the use ofeither the EU logo or the words ‘EU-organic’ on products with at least 95%organic ingredients. Organic products from other countries can be importedinto EU countries and freely moved within the EU countries if the organicproduction rules in the exporting country are equivalent to the EU regulations.
5.8.3 USA National Organic Standards
The 1990 USA Farm Bill contained provisions (Organic Foods ProductionAct of 1990 (‘OFPA’) as amended (7 US Code 6501 et seq.)) requiring theUS Department of Agriculture (USDA) and the Agricultural Market Service(AMS) to develop National Organic Standards. USDA promulgated theregulations/standards governing organic products in December 1997, whichbecame effective October 21, 2002 (National Organic Program, 2002; Dimitriand Oberholtzer, 2005 and 2006). Organic certification in the USA is voluntary

Organic cotton 161
and self-imposed. According to the US standards, biotech products, irradiatedfoods, and crops fertilized with municipal sewage sludge cannot be certifiedas ‘organic’. USDA, AMS is in charge of implementation of the standards.Any company involved in certification of organic products must have authorityfrom the USDA to carry out certification activities. On the NOP website(http://www.ams.usda.gov/nop/certifyingAgents/Accredited.html) is acomprehensive list of the USDA Accredited Certifying Agents (ACAs)organized alphabetically by state for domestic ACAs and by country forforeign ACAs. In the USA, if a cotton grower decides to produce organiccotton, an ‘Organic System Plan’ must be submitted to a USDA accreditedcertifying company/department for approval. All natural materials are permittedto be used in organic production or processing unless prohibited on thenational list. A product is certified as ‘100 percent organic’, if it is all organicor contains 95% organic ingredients and it is ‘made with organic ingredients’or if it has at least 70% organic product ingredients.
The National Organic Program (NOP) issued a statement on August 23,2005 intended to clarify its position with respect to the issue of products thatmeet the NOP program standards for organic products based on content,irrespective of the end use of the product (NOP, 2005). Agricultural commoditiesor products that meet the NOP standards for certification under the OrganicFoods Production Act of 1990, 7 USC §§ 6501–6522, can be certified underthe NOP and be labeled as ‘organic’ or ‘made with organic’ pursuant to theNOP regulations, 7 CFR part 205.300 et seq. Operations currently certifiedunder the NOP that produce agricultural products that meet the NOP standardsto be labeled as ‘organic’ and to carry the USDA organic seal, or which meetNOP standards to be labeled as ‘made with organic’, may continue to be solabeled as long as they continue to meet the NOP standards.
5.8.4 Organic Exchange
The Organic Exchange is a non-profit organization in the USA committed toexpanding organic agriculture, with a specific focus on increasing theproduction and use of organically grown fibers, such as cotton (OrganicExchange, 2006). It also tracks world production of organic cotton. TheOrganic Exchange is funded through company sponsorships and revenuesfrom its activities. It has an ‘Organic Cotton’ logo for use by its membercompanies to identify their products or family of products, from yarn tofinished goods, that contain organic cotton. The Organic Exchange hasdeveloped voluntary guidelines (Organic Exchange Guidelines, 2004) tohelp companies involved in the production of organic products containingcertified organic cotton fiber understand how to track and document thepurchase, handling and use of organic cotton in their products. The OrganicExchange 100 standard (OE 100) was developed and approved in 2004
Cotton: Science and technology162
(Organic Exchange Guidelines, 2004) to allow companies to have theiroperations certified by a third party as complying with the handling, tracking,and documentation for products containing a percentage blend of organic cotton.In 2005, the Organic Exchange finalized their OE Blended Standard (2005).
5.8.5 Organic Trade Association (OTA)
The Organic Trade Association (OTA) is the membership-based businessassociation for the organic industry in North America. OTA develops guidelinesbut is not a certification organization (OTA, 2005). Since there are alreadyUS and other organic fiber production standards in place concerning the on-farm production of raw fiber (cotton), OTA does not have their own separatestandards for organic cotton production. However, since there are no USstandards for the processing of organic raw fiber from the time it leaves thefarm, to when a finished product is available for retail, the OTA developedorganic fiber processing guidelines (OTA, 2005a), approved January 2004,that address all stages of textile processing, from post-harvest handling towet processing (including bleaching, dyeing, printing), fabrication, productassembly, storage and transportation, pest management, and labeling offinished products. These standards also include an extensive list of materialspermitted for, or prohibited from, use in organic fiber processing under thestandards (see Appendix 5.2). The evaluation criteria are designed to minimizenegative environmental effects and risks to human health. For example,materials allowed under the standards cannot be known to cause cancer,genetic damage, birth defects or endocrine disruption. In addition, they mustbe biodegradable and meet strict requirements which limit toxicity. Examplesof materials prohibited by the standards include chlorine bleach, formaldehyde,and some azo dyes.
OTA’s standards for claims that can be put on labels are the USDA NOPstandards and include four label categories that are modeled after the standardsfor organic foods in the USA organic regulations: ‘100% organic’, ‘organic’,‘made with organic’, and listing of the individual organic components on theingredients panel. However, the USDA prescribed system for labeling fiberproducts allows only one category for organic cotton textiles. The USDArule says goods that utilize certified organic fibers in their manufacture maybe labeled only as ‘made with organic cotton’. USDA has addressed thescope of the federal program. Certifiers are able to certify according to theOTA standards, using OTA’s labeling provisions. So long as the processedfiber product is certified clearly to OTA’s American Organic Standards, theOTA’s language can be used to describe a product. The US Federal TradeCommission has indicated that companies may list the percentage of organicfiber content on a product’s content label and include the word ‘organic’ todescribe the fiber. Because there are no federal standards for finished fiber

Organic cotton 163
products in the USA and the OTA standards are voluntary, a company maysell in the USA organic fiber products certified under these or other standardsas long as the certifier of the organic fiber is accredited by the USDA and thelabel claims are truthful.
5.8.6 Quality Assurance International
Quality Assurance International (QAI, Inc.), an NSF International company,is one of the global leaders in organic certification services (http://www.qai-inc.com/). QAI currently offer organic certification under the USDA NOPand fiber certification under the OTA or other USA organic standards.
5.8.7 ECOCERT International
ECOCERT International (http://www.ecocert.com/index.php?id=about&l=en), with operational offices in Germany, is an inspection and certificationbody accredited to verify the conformity of organic agricultural productsagainst the organic regulations of Europe, Japan and the USA. They currentlyperform such inspection and certification services in 70 countries outside theEU, on all continents. ECOCERT is accredited according to ISO Guide 65(equals to European Norm EN 45011), by a member of European Accreditation(EA) and IAF (International Accreditation Forum) and thus is an internationallyrecognized accreditation body. In the USA, they have been accredited to theNOP standard by the USDA and in Japan to the JAS organic standard byMAFF. ECOCERT certifies organic cotton production in many African andEuropean countries. Their website does not mention certification or guidancefor organic cotton textiles, although some organic cotton textiles carry theECOCERT label.
5.9 Naturally colored organic cotton
Organic production of naturally colored cotton has been tried but none iscurrently available as ‘certified organic’. Since the late 1980s and early1990s, there has been a renewed interest in naturally colored cottons, whichhave existed for over 5,000 years (Vreeland, 1993 and 1999).The need forhigher output cotton production and the availability of inexpensive dyescaused naturally colored cottons to almost disappear about 50 years ago.Yields were low and the fiber was essentially too short and weak to bemachine spun. These cotton varieties are spontaneous mutants of plants thatnormally produce white fiber. Naturally colored cotton exists in variousshades of brown and green. Very light blue colored cotton is also availablein the germplasm in Uzbekistan. Researchers have tried to develop othercolors through conventional breeding, but have not been successful. Some
Cotton: Science and technology164
naturally colored cottons have botanically formed material bodies in thelumen (Ryser, 1999) of the fiber (brown, red, mocha, and mauve cottons)that conveys the color whereas the color of green cotton is due to a lipidbiopolymer (suberin) sandwiched between the lamellae of cellulose microfibrilsin the secondary wall (Ryser, 1983 and 1999; Schmutz et al., 1993).
Breeding research over the last 15 years in many countries reportedly hasled to some improvement in yields, fiber quality, fiber length and strength,and color intensity and variation (Kimmel and Day, 2001; Öktem et al.,2003; Wakelyn and Gordon, 1995). There are claims of development ofcolored cotton equivalent to white cotton in fiber quality, but no coloredcotton varieties have been officially approved for commercial cultivation.Progress has been made, but still there is a long way to go before the qualityof colored cotton is equivalent to white cotton and the same yields areachieved. Research undertaken to improve colored cotton is limited. Availabilityof suitable germplasm in colored cotton for use in breeding is the biggesthurdle for improvement in colored cotton.
Naturally colored cottons are a very small niche market. Those availabletoday are usually shorter, weaker, and finer than regular Upland cottons, butthey can be spun successfully into ring and rotor yarns for many applications(Kimmel and Day, 2001; Öktem et al., 2003). For a limited number ofcolors, the use of dyes and other chemicals can be completely omitted intextile finishing, which can compensate for the higher raw material price.The color of the manufactured goods can intensify with washing (up to 5–10washings), however colors vary somewhat from batch to batch (Wakelynand Gordon, 1995) and colors have low light fastness and start fading in thesun after a few washings.
The amount available in 2005/06 in the world was very small, perhaps10,000 US 480 lb bale equivalents (about 2,180 MT). Some naturally coloredcotton is presently being grown in China, Peru, India, Brazil, and Israel.Colored cotton projects were initiated in many countries including India,Israel and the USA, but the momentum for producing colored organic cottoncould not be sustained due to limited color choice for consumers and lowerquality fiber. In efforts to make naturally colored cotton economicallyadvantageous to produce, organic farming of naturally colored fiber hasbeen tried. There is a market for colored organic cotton but the consumerdemand for more color choices is limiting the spread of colored organiccotton. Some countries, particularly Brazil, China, India, Israel and Peru,continue to produce some colored cotton, but not much as certified organic.
5.10 Conclusions
There continues to be worldwide interest in organic cotton as a potentiallyenvironmentally friendly way to produce cotton and for economic reasons.

Organic cotton 165
Production of organic cotton has increased recently to about 0.1% of worldcotton production, mainly due to increased production in Turkey as well asIndia, China and some African countries. Organic production is not necessarilyany more environmentally friendly or sustainable than current conventionalcotton production. From a consumer residue standpoint there is no differencebetween conventionally grown cotton and organically grown cotton. Thereare limitations to organic cotton production that need to be overcome iforganic cotton is to become more than a small niche market. Growing organiccotton is more demanding and more expensive than growing cottonconventionally. Organic production can be a real challenge if pest pressuresare high. But with commitment and experience, it may be possible and couldprovide price premiums for growers willing to meet the challenges.Conventional and organic cotton production can co-exist. Profitability willdrive decisions in the supply chain.
5.11 References
Agronomy Facts 55 (1997), Estimating Manure Application Rates, Pennsylvania StateUniversity, College of Agricultural Sciences, Cooperative Extension (http://cropsoil.psu.edu/extension/facts/agfact55.pdf).
Alabama Cooperative Extension System (2006), Broiler Litter as a Source of N for
Cotton, Timely Information, Agriculture and Natural Resources, Agronomy Series,Department of Agronomy and Soils, Auburn University (http://hubcap.clemson.edu/~blppt/chick/html).
Anonymous (2004), ‘Kyrgyzstan: organic cotton tested in the South, Reuters Alert Net’,Dec 28, 2004 (http://www.alertnet.org/).
Anonymous (2004a), ‘US organic cotton production drops despite increasing sales oforganic cotton products’, Organic Trade Association, news release, Dec 28, 2004(http://www.ota.com). Organic Exchange, http://organicexchange.org, 2005.
Anonymous (2006), ‘US organic cotton production trends: US Acreage of organic cottongains ground’, Organic Trade Association, news release, Jan 4, 2006 (http://www.ota.com/news/press/185.html).
Anonymous (2006a), ‘2004 US organic cotton acreage increases by 37 percent’, Textile
World, Textile News, Feb 24, 2006 (http://www.textileworld.com/News.htm?CD=5&ID=10644).
Anthony WS and Mayfield WD, eds, (1994), Cotton Ginners Handbook, US Dept. ofAgriculture, Agricultural Handbook 503, Washington, DC.
Australian Cotton Industry (2005), BMP Cotton, Best Management Practices.Bremen Cotton Report (Feb. 5, 1993), special edition, Investigation of Chemical Residues
on Cotton http://www.baumwollboerse.de/cotton/investig.htm.Chaudhry MR (1993), ‘Suitable varieties for organic cotton production’, presented at the
International Conference on Organic Cotton, Cairo, Egypt, September 23–25, 1993.The conference was held under the auspices of the International Federation of OrganicAgriculture Movements, Germany, and the Bio Foundation and IMO Institute ofMarket Ecology, Switzerland.
Chaudhry MR (1998), ‘Organic cotton production IV’, The ICAC Recorder, vol. XVI,No. 4, December 1998.
Cotton: Science and technology166
Chaudhry MR (2003), ‘Limitations on organic cotton production’, The ICAC Recorder,vol. XXI, No. 1, March 2003.
Cotton Incorporated (1996), Cotton Dyeing and Finishing: Technical Guide, CottonIncorporated, Cary, NC, 1996.
CropLife International (2005), Crop Protection Stewardship Activities of the Plant Science
Industry: A Stocktaking Report, p. 15 (http://www.croplife.org/librarypublications.aspx.)Cropnosis (2005), Outlook, September 2005, Croposis Ltd., Edinburgh, UK.Demeritt L (2006), ‘Behind the buzz: what consumers think of organic labeling’, Organic
Processing 3(1), 14–17.Dickerson WA, Brashear AL, Brumley JT, Carter FL, Grefenstelle WJ and Harris FA, eds,
(2001), Boll weevil eradication in the United States through 1999, Number Six, TheCotton Foundation Reference Book Series, The Cotton Foundation, Memphis, TN,USA.
Diehl R (2004), ‘Weaving preparation yesterday, today, tomorrow’, International Textile
Bulletin 3, 46–48.Dimitri C and Oberholtzer L (2005), ‘Market-Led Growth vs. Government-Facilitated
Growth: Development of the US and EU Organic Agricultural Sectors’, WRS-05-05,USDA, Economic Research Service, Aug 2005. http://www.ers.usda.gov/publications/WRS0505/wrs0505.pdf.
Dimitri C and Oberholtzer L (2006), ‘EU and US Organic Markets Face Strong DemandUnder Different Policies’, Amber Waves, USDA, Economic Research Service, Feb2006. http://www.ers.usda.gov/AmberWaves/February06/Features/feature1.htm.
EEC (2006), ‘Commission Regulation (EC) No. 780/2006, amending Annex VI to CouncilRegulation (EEC) No. 2092/91 on organic production of agricultural products’, Official
J European Union 25.5.2006, L137/9-L137/14 (http://eur-lex.europa.eu/LexUriServ/site/en/oj/2006/1_137/1_13720060525en00090014.pdf).
El-Lissy O and Grefensette W (2002), ‘Boll Weevil Eradication in the US 2001’, in Proc.
2002 Beltwide Cotton Conf., National Cotton Council, Memphis, TN, 2002.ETAD (1997), Handling Dyes Safely ETAD, Washington, DC.EU Directive 2002/61/EC of the European Parliament and of the Council of 19 July 2002,
‘amending for the 19th time Council Directive 78/769/EEC relating to restrictions onthe marketing and use of certain dangerous substances and preparations (azocolourants)(2002), Off J European Communities 11.9, L243/15-L243/18.
European Union (EU) (1991), ‘Regulations for organic production of agricultural products’,http://europa.eu.int/eur-lex/en/consleg/main/1991/en_1991R2092_index.html
EU (2000), ‘The organic logo’, (http://europa.eu.int/comm/agriculture/qual/organic/logo/index_en.htm)
EU (2002), Ecolabel for Textiles, (http://europa.eu.int/eur-lex/pri/en/oj/dat/2002/l_133/l_13320020518en00290041)
Farm Bill (1990), Food, Agriculture, Conservation, and Trade Act of 1990 (FACTA),Public Law 101-624, Title XVI, Subtitle A, Section 1603.
Fitt GP, Wakelyn PJ, Stewart JM, Roupakias D, Pages J, Giband M, Zafar Y, Hake K andJames C (2004), Report of the Second Expert Panel on Biotechnology in Cotton,
International Cotton Advisory Committee (ICAC), Washington, DC, USA, Nov. 2004.Fox SV (1994), ‘Organic Cotton’, in Proc. Int. Cotton Conf. Bremen, 1994, pp. 317–19.Garrott B (2006), Paul Reinhart AG, personal communication. Paul Reinhart AG is a
cotton merchant that sells organic cotton worldwide.Green Cotton Thailand Co., Ltd. (2006), www.greencotton.co.th.Greenfeet.com (2006), ‘The Truth About Cotton’, http://www.greenfeet.net/newsletter/
truthaboutcotton.shtml.

Organic cotton 167
Guerena M and Sullivan P (2003), ‘Organic Cotton Production’, ATTRA Current Topic,July 2003 (http://www.attra.ncat.org/attra-pub/PDF/cotton.pdf).
Hae Now, Organic Cotton Clothing (2006), ‘Why Choose Organic’, http://www.haenow.com/whyorganic.php.
Hake SJ, Kerby TA and Hake KD, eds, (1996), Cotton Production Manual, Pub. 3352,University of California, Division of Agriculture and Natural Resources, Oakland,CA.
Hardy, ML (1998), ‘Ecolabels and their effect on flame retardants and fire safety’, paperpresented at the Fire Retardant Chemical Association Meeting: Fire Safety and
Technology March 22–25, 1998.Howard A (1940), An Agricultural Testament. Oxford University Press, New York and
London.International Cotton Advisory Committee (ICAC) (1996), Growing Organic Cotton,
International Cotton Advisory Committee, 1629 K Street, Suite 702, Washington DC20006, USA. October 1996.
ICAC (1998), ‘The Cost of Producing Cotton. 1998’, The ICAC Recorder, Vol. XVI, No.4.
ICAC (2003), ‘Irrigation of cotton’, The ICAC Recorder, Vol. XXI, No. 4, pp. 4–9.ICAC (2005), ‘COTMAN: a growth monitoring system’, The ICAC Recorder, Vol. XXIII,
No. 3International Federation of Organic Agriculture Movements (IFOAM) (2005), http://
www.ifoam.org/ and http://www.ifoam.org/about_ifoam/standards/norms/ibsrevision/ibsrevision.html.
International Textile Manufacturers Federation (ITMF) (2005), Cotton Contamination
Surveys 1999, 2001, 2003, 2005.Kimmel LB and Day MP (2001), ‘New life for an old fiber: attributes and advantages of
naturally colored cotton’, AATCC Rev., 1(10), 32.King EG, Phillips JR and Coleman, RJ, eds, (1996), Cotton Insects and Mites:
Characterization and Management, The Cotton Foundation Book Series Number 3,The Cotton Foundation, Memphis, TN, USA.
Kuepper G and Gegner L (2004), Organic crop production overview, ATTRA, NationalCenter for Appropriate Technology (NCAT), Fayetteville, AR, USA.
Kuster B (1994), ‘Determination of Fibre Impurities and Contaminants in the CottonFinishing Process’, in Int. Cotton Conf Bremen, 1994, pp. 159–69.
Lee JA (1984), ‘Cotton as a World Crop’, Chapter 1, in Cotton, Kohel RJ and Lewis CF, eds,Agronomy Monograph No. 24, American Society of Agronomy, Crop Sciences Societyof America and Soil Science Society of America, Madison, WI, 1984, pp.1–25.
Le Guillou G and Scharpé A (2000), Organic Farming – Guide to Community Rules,Directorate General for Agriculture, European Commission, ISBN 92-894-0363-2.
Marquardt S (2003), ‘Organic Cotton: Production and Market Trends in the United Statesand Canada – 2001 and 2003’, in Proc. 2003 Beltwide Cotton Conf. National Cotton
Council, Memphis, TN, pp. 362–366.McWorter CG and Abernathy JR, eds, (1992), Weeds of Cotton: Characterization and
Control, The Cotton Foundation Book Series Number 2, The Cotton Foundation,Memphis, TN, USA.
Murray P and Coody LS (2003), ‘American Organic Standards, Fiber: Post HarvestHandling, Processing, Record Keeping, & Labeling’, Version 6.14: Dec 2003 (Approvedby OTA Board, Jan 2004) (Organic Trade Association’s Fiber Processing Standards,Organic Trade Association, Greenfield, MA, USA, 2004).
Cotton: Science and technology168
Myers D (1999), ‘The Problems with conventional cotton’, Chapter 2, Myers D andStolton S, eds, 1999, Organic Cotton – From Field to Final Product, IntermediateTechnology Publications, Intermediate Technology Development Group, 103/105Southampton Row, London, WC1B 4HH, UK. pp. 8–20.
Myers D and Stolton S., eds, (1999), Organic Cotton – From Field to Final Product,
Intermediate Technology Publications, Intermediate Technology Development Group,103/105 Southampton Row, London, WC1B 4HH, UK.
National Cotton Council (2006a), ‘Boll Weevil Eradication Update, 2004’, http://www.cotton.org/tech/pest/bollweevil/index.cfm.
National Cotton Council (2006b), ‘Nematode Management Practice’, http://www.cotton.org/tech/pest/nematode/practice.cfm?renderforprint=1.
National Organic Program (NOP) (2002), US Department of Agriculture (USDA),Agricultural Marketing Service. http://www.ams.usda.gov/nop/indexIE.htm.
National Organic Program (NOP) (2005), ‘Certification of agricultural products thatmeet NOP standards’, http://www.ams.usda.gov/nop/NOPPolicyMemo08_23_05.pdf.
Öktem T, Gürel A and Akdemir H (2003), ‘The characteristic attributes and performanceof naturally colored cotton’, AATCC Review 3(5), 24–27.
Organic Exchange (2006), http://organicexchange.org ; http://www.organicexchange.org/Documents/ocsymbiosis.pdf
Organic Exchange Blended Standard version 2/2005 (2005), http://www.organicexchange.org/(click OE Blended Standard).
Organic Exchange Guidelines, ‘Tracking and Documenting the Purchase, Handling andUse of Organic Cotton Fiber’ (2004), http://www.organicexchange.org/Documents/guidelines0605.doc.
Organic Essentials (2006), http://www.aboutorganiccotton.org/PDFs/OrganicCotton_legal.pdf.
Organic Trade Association (OTA) (2005), ‘Global Approaches to Organic Textiles’, inProc. 4th International Conference on Organic Textiles – INTERCOT, May 1–3, 2005.Organic Trade Association, PO Box 547, Greenfield, MA 01302, USA.
Organic Trade Association (OTA) (2005a), ‘American Organic Standards for Fiber: Post-Harvest Handling, Processing, Record Keeping & Labeling’ (Organic Fiber ProcessingStandards), http://www.ota.com/standards.fiberstandards.html.
Orgaz F, Mateos L and Fereres E (1992) Season length and cultivar determine the optimumevapotranspiration deficit in cotton, Agron. J., 84(4): 700–706.
Patagonia (2006), http://www.patagonia.com/enviro/organic_cotton.shtml.Paul Reinhart AG (2006), http://reinhart.com (click on organic cotton).Pick S and Givens H (2004), Organic Cotton Survey – 2003 US Organic Cotton Production
& the Impact of the National Organic Program on Organic Cotton Farming, OrganicTrade Association, Available at http://www.ota.com/2004_cotton_survey.html.
Ratter SG (2004), ‘Organic and Fair Trade Cotton in Africa’, EU Africa Cotton Forum:July 2004. Available at http://www.cotton-forum.org/docs/presentations/6.3-en.pdf
Ryser U (1999), ‘Cotton fiber initiation and histodifferentiation’, in Cotton Fibers,
Developmental Biology, Quality Improvement, and Textile Processing, Basra, AS, Ed.,The Haworth Press, Inc. Binghamton, NY, chap. 1, pp. 21–29.
Ryser U, Meier H and Holloway PJ (1983), ‘Identification and localization of suberin inthe cell walls of green cotton fibres (Gossypium hirsutium L., var. green lint)’,Protoplasma, 117, 196–205.
Schmidt M and Rehm G (2002), Fertilizing Cropland with Poultry Manure, University ofMinnesota Extension Service (http://www.extension.umn.edu/distribution/cropsystems/DC5881.html).

Organic cotton 169
Schmutz A, Jenny T, Amrhein N and Ryser U (1993), ‘Caffeic acid and glycerol areconstituents of the suberin layers in green cotton fibers’, Planta, 189, 453–460.
Smith WF (1996), ‘Precision farming overview’, Proc Beltwide Cotton Conf, Vol 1, 179–180.
Swezey SL (2002), ‘Cotton yields, quality, insect abundance, and cost of production oforganic cotton in northern San Joaquin Valley, California’, in Proc 14th IFOAM
Organic World Congress, Canadian Organic Growers, Ottawa, Ontario, Canada.Swezey SL and Goldman PH (1999), ‘Organic Cotton in California: Technical aspects of
production’, Myers, D and Stolton, S, eds, in Organic Cotton – From Field to Final
Product, Intermediate Technology Publications, Intermediate Technology DevelopmentGroup, 103/105 Southampton Row, London, WC1B 4HH, UK, pp. 125–132.
Traoré D (2005), ‘Promotion of organic cotton cultivation in Mali’, in Proc. 4th International
Conference on Organic Textiles – INTERCOT, May 1–3, 2005. Organic Trade Association,PO Box 547, Greenfield, MA 01302, USA.
Tripathi KS (2005), ‘Textile processing of the future: The state of the art’, in Proc. 4th
International Conference on Organic Textiles – INTERCOT, May 1-3, 2005. OrganicTrade Association, PO Box 547, Greenfield, MA 01302, USA.
US Department of Agriculture – NASS (2001), Agricultural Chemical Usage, 2000,Field Crop Summary.
US Department of Agriculture – NASS (2004), Agricultural Chemical Usage: 2003 Field
Crop Summary, p. 93.US Environmental Protection Agency (EPA) (1999), Assessing Health Risks from Pesticides,
US EPA 735-F-99-002, http://www.epa.gov/cgi-bin/epaprintonly.cgi.US EPA (2006), Worker Protection Standard, 40 Code of Federal Regulations Part 170.US EPA (2006a), Federal Insecticide, Fungicide, and Rodenticide Act (FIFRA), 7 US
Code 136; Federal, Food, Drug and Cosmetic Act (FFDCA) (1996) as amended by theFood Quality Protection Act (FQPA).
US EPA (2006b), Data Requirements for Registration, 40 CFR 158.US EPA (2006c), Pesticide Management and Disposal: Standards for Pesticide Containers
and Containment; Final Rule (40 CFR Parts 9, 156, 165), 71 Federal Register pages47329–47437, August 16 and Pesticides: Regulating Pesticides, Storage and Disposal(http://www.epa.gov/pesticides/regulating/storage.htm).
US EPA (2006d), ‘Sustainability’. http://www.epa.gov/sustainability/basicinfo.htm.US EPA (2006e), US Pesticides Safety Highest in World (http://epa.gov/cgi-bin/
epaprintonly.cgi)Van Elzakker, B and Caldas, T (1999), ‘Organic cotton production’, Myers, D and Stolton,
S, eds, in Organic Cotton – From Field to Final Product, Intermediate TechnologyPublications, Intermediate Technology Development Group, 103/105 SouthamptonRow, London, WC1B 4HH, UK, pp. 21–35.
Vreeland JM, Jr (1993), ‘Naturally colored and organically grown cottons: anthropologicaland historical perspectives’, in Proc. Beltwide Cotton Conf., National Cotton Council,Memphis, TN, pp. 1533–36.
Vreeland JM Jr (1999), ‘The revival of colored cotton’, Sci. Am., 280, 112, 1999.Wakelyn PJ (1994), ‘Cotton: environmental concerns and product safety’, in Proc. 22nd
Int. Cotton Conf., Bremen, Harig H and Heap SA, eds, Faserinstitut Bremen e.V.,Bremen, Germany, pp. 287–305.
Wakelyn PJ (1997), Cotton yarn manufacturing, in ILO Encyclopaedia of Occupational
Health and Safety, 4th end, Chapter 89, ‘Textile Goods Industry’, AL Ivester and JDNeefus, eds, International Labour Office, Geneva, Switzerland, pp. 89.9–89.11.
Cotton: Science and technology170
Wakelyn PJ and Gordon MB (1995), ‘Cotton, naturally’, Textile Horizons, 15(1), 36–38.Wakelyn PJ, Bertoniere NR, French AD, Thibodeaux DP, Triplett BA, Rousselle MA,
Goynes Jr. JR, Edwards JV, Hunter L, McAlister DD and Gamble GR (2006), ‘CottonFibers’, Chapter 9, in Handbook of Fiber Chemistry (3rd edition, revised and expanded).M Lewin and EM Pearce, eds, CRC Press, New York. 2006, in press.
Wakelyn PJ, May OL and Menchey EK (2004), ‘Cotton and biotechnology’, in Handbook
of Plant Biotechnology, Christou P and Klee H, eds, John Wiley and Sons, Ltd.,Chichester, West Sussex, UK, chap. 57, pp. 1117–1131.
Wakelyn PJ, Menchey K and Jordan AG (2000), ‘Cotton and environmental issues’, inCotton – Global challenges and the Future, papers presented at a Technical Seminarat the 59th Plenary Meeting of the International Cotton Advisory Committee (ICAC),Cairns, Australia, Nov. 9, pp. 3–11.
Wakelyn PJ, Thompson DW, Norman BM, Nevius CB and Findley DS (2005), ‘WhyCotton Ginning is Considered Agriculture’, Cotton Gin and Oil Mill Press 106(8),5–9.
Yafa S (2005), Big Cotton: how a humble fiber created fortunes, wrecked civilizations
and put America on the map, Viking Penguin, a member of Penguin Group (USA) Inc.pp. 290–301.
Zarb J, Ghorbani R, Koccheki A and Leifert C (2005), ‘The importance of microorganismsin organic production’, Outlooks Pest Manag., 16, 52–55.

Synthetic substances allowed for use in organic cropproduction (7 Code of Federal Regulations (CFR) Sec.205.601)
In accordance with restrictions specified in this section, the following syntheticsubstances may be used in organic crop production: Provided, That, use ofsuch substances does not contribute to contamination of crops, soil, or water.Substances allowed by this section, except disinfectants and sanitizers inparagraph (a) and those substances in paragraphs (c), (j), (k), and (l) of thissection, may only be used when the provisions set forth in Sec. 205.206(a)through (d) prove insufficient to prevent or control the target pest.
(b) As herbicides, weed barriers, as applicable
(1) Herbicides, soap-based – for use in farmstead maintenance roadways,ditches, right of ways, building perimeters) and ornamental crops.
(2) Mulches.(i) Newspaper or other recycled paper, without glossy or colored inks.
(ii) Plastic mulch and covers (petroleum-based other than polyvinylchloride (PVC)).
(c) As compost feedstocks
Newspapers or other recycled paper, without glossy or colored inks.
(d) As animal repellents
Soaps, ammonium – for use as a large animal repellent only, no contact withsoil or edible portion of crop.
Appendix 5.1The National list of Allowed and Prohibited
Substances (US National Organic Program)
171
Cotton: Science and technology172
(e) As insecticides (including acaricides or mite control)
(1) Ammonium carbonate – for use as bait in insect traps only, no directcontact with crop or soil.
(2) Boric acid – structural pest control, no direct contact with organic foodor crops.
(3) Copper sulfate – for use as tadpole shrimp control in aquatic riceproduction, is limited to one application per field during any 24-monthperiod. Application rates are limited to levels which do not increasebaseline soil test values for copper over a timeframe agreed upon by theproducer and accredited certifying agent.
(4) Elemental sulfur.(5) Lime sulfur – including calcium polysulfide.(6) Oils, horticultural – narrow range oils as dormant, suffocating, and
summer oils.(7) Soaps, insecticidal.(8) Sticky traps/barriers.
(f) As insect management
Pheromones.
(g) As rodenticides
(1) Sulfur dioxide – underground rodent control only (smoke bombs).(2) Vitamin D.
(i) As plant disease control
(1) Coppers, fixed – copper hydroxide, copper oxide, copper oxychloride,includes products exempted from EPA tolerance, provided, that, copper-based materials must be used in a manner that minimizes accumulationin the soil and shall not be used as herbicides.
(2) Copper sulfate – Substance must be used in a manner that minimizesaccumulation of copper in the soil.
(3) Hydrated lime.(4) Hydrogen peroxide.(5) Lime sulfur.(6) Oils, horticultural, narrow range oils as dormant, suffocating, and summer
oils.(7) Peracetic acid – for use to control fire blight bacteria.(8) Potassium bicarbonate.(9) Elemental sulfur.

(10) Streptomycin, for fire blight control in apples and pears only.(11) Tetracycline (oxytetracycline calcium complex), for fire blight control
only.
(j) As plant or soil amendments
(1) Aquatic plant extracts (other than hydrolyzed) – Extraction process islimited to the use of potassium hydroxide or sodium hydroxide; solventamount used is limited to that amount necessary for extraction.
(2) Elemental sulfur.(3) Humic acids – naturally occurring deposits, water and alkali extracts
only.(4) Lignin sulfonate – chelating agent, dust suppressant, floatation agent.(5) Magnesium sulfate – allowed with a documented soil deficiency.(6) Micronutrients – not to be used as a defoliant, herbicide, or desiccant.
Those made from nitrates or chlorides are not allowed. Soil deficiencymust be documented by testing.(i) Soluble boron products.
(ii) Sulfates, carbonates, oxides, or silicates of zinc, copper, iron,manganese, molybdenum, selenium, and cobalt.
(7) Liquid fish products – can be pH adjusted with sulfuric, citric or phosphoricacid. The amount of acid used shall not exceed the minimum needed tolower the pH to 3.5.
(8) Vitamins, B, C, and E.
(k) As plant growth regulators
Ethylene gas – for regulation of pineapple flowering.
(l) As floating agents in postharvest handling
(1) Lignin sulfonate.(2) Sodium silicate – for tree fruit and fiber processing.
(m) As synthetic inert ingredients
As classified by the Environmental Protection Agency (EPA), for use withnonsynthetic substances or synthetic substances listed in this section andused as an active pesticide ingredient in accordance with any limitations onthe use of such substances.(1) EPA List 4 – Inerts of Minimal Concern.(2) EPA List 3 – Inerts of unknown toxicity – for use only in passive
pheromone dispensers.
Appendix 5.1 173
Appendix 5.2Guidelines–Some Chemicals allowed and
prohibited for use in preparation, dyeing,
printing, and finishing of organic cotton
textiles (Organic Exchange Guidelines, 2004;
Organic Trade Association, 2005a)
(a) Synthetic chemicals allowed
Aluminum silicate (scouring agent, deflocculant, anticoagulant, dispersant)Aluminum sulfate (scouring or mordant agent)Fatty acids and their esters (softener)Hydrogen peroxide (bleaching agent)Oxalic acid
Ozone (bleaching agent)Polyethylene (restricted softener)Potassium hydroxide (mercerizing, scouring)Biodegradable soaps
Sodium hydroxide (mercerizing, scouring)Sodium silicate (bleaching and color brightener)Sodium sulfate (bleaching and color brightener)Surfactants (that are biodegradable) (scouring agent, emulsifier, wettingagent) (may not be silicon based, contain petroleum solvents or be alkylphenol ethoxylates)
(b) Non-synthetic chemicals allowed
Acetic acid
Chelating agents (stabilizers)Citric acid
Clay-based scours
Copper, iron, tin (for mordant dyeing)Natural dyes (animal and plant)Enzymes (non-GMO)Flow agents (natural)Mined minerals
Pigment dyes (natural indigo and clays only)Potassium acid tartrate
174

Sodium carbonate (soda ash) pH adjusterSodium chloride (salt) auxiliary
Tannic acid
Tartaric acid
(c) Chemicals prohibited
Ammonium soaps
Absorbable halogenated hydrocarbon (AOX)
Bluing agents (for bleaching and color brightening)Chelating agents
Chlorine compounds (bleaching)Dyes non-conformant with criteria
Formaldehyde
Synthetic fire retardants
Functional finishes for anti-crease, antifungal, anti-microbial, anti-pilling,
antistatic
(d) Conformant dyes
Natural dyes (animal and plant)Pigment dyes (natural indigo and clays only)Most fiber reactive dyesNot allowed: Benzidine and benzidine congener azo dyes; other azo dyesthat can undergo reduction decomposition to form carcinogenic aromaticamines (currently this includes the 24 amines classified as substances knownto be human carcinogens).Dyes should not contain heavy metals (restricted level of residues allowed)except iron, copper, tin (for mordant dyeing).Dyes should not contain chelated metals (residues >1 mg metal/kg textile).Dyes should not contain AOX – Absorbable halogenated hydrocarbon andsubstances that can cause their formation.Dyes should not contain formaldehyde.
Appendix 5.2 175
176
6.1 Introduction
Cotton possesses its highest fiber quality and best potential for spinningwhen the bolls are mature and freshly opened. Quality of the fiber in the baledepends on many factors including variety, weather conditions, culturalpractices, harvesting and storage practices, moisture and trash content, andginning processes. Genetics plays an important role in fiber quality, both inthe initial quality of the fiber as well as how well the fiber withstands ginprocesses. For example, varieties with high numbers of trichomes (planthairs) on the plant parts usually require additional cleaning equipment becauseit is more difficult to remove those trash particles. Harvesting practices fromhand-picked to machine-stripped dramatically impact the amount of trashentangled with the cotton and thus the amount of cleaning machinery requiredat the gin.
Fiber quality factors such as length, uniformity, micronaire, strength, shortfiber content, neps, and seedcoat fragments may differ dramatically for varietiesgrown under nearly identical conditions. Field weathering impacts mostquality factors by weakening and discoloring the fiber. The color is substantiallyaffected by weather and length of exposure to weather conditions after thebolls open. Abnormal color (light-spot, spotted, tinged, yellow-stained, etc.)indicates a deterioration in quality. Continued exposure to weather and theaction of micro-organisms can cause white cotton to lose its brightness andbecome darker in color. The weakened fibers cannot withstand the standardlint-seed separation or lint cleaning processes without additional damageand fiber loss. In fact, varieties and excessive weathering have a far greaterimpact on fiber quality than do the most rigorous of gin processes. Thequality aspects of cotton varieties, weathering, and the impact of gin machineryon fiber quality are available in numerous published references (Anthony,
6The harvesting and ginning of cotton*
W S A N T H O N Y, formerly United States Department ofAgriculture, USA
*Taken in part from the Handbook for cotton ginners, editors W Stanley Anthony andW D Mayfield (1994), Agricultural Handbook 503, United States Department of Agriculture.

The harvesting and ginning of cotton 177
1982, 1990a, b, c, d, 1994a, b, 1996, 1999; Anthony and Calhoun, 1997).Cotton gins are responsible for converting a raw agricultural product, seedcotton, into commodities such as bales of lint, cottonseed, motes, compost,etc. Gins are a focal point of the cotton community and their location, resources,and contributions to the economy are critical to the cotton industry.
Enormous differences exist across the worldwide spectrum of cottonproduction, harvesting and ginning. Harvest methods range from totally hand-harvested in some countries to totally machine-harvested in others, in fact,only the United States and Australia are fully mechanized. Cotton storageafter harvesting ranges from small piles of cotton on the ground in somecountries to mechanically made modules containing over 12 tons of cotton inothers. Gin machinery sequences vary from little more than a gin stand asshown in Fig. 6.1 to a complex arrangement of machines as shown in Fig.6.2. In a growing number of instances, gins are vertically integrated enterprisesthat include components that range from cotton production to marketingand/or spinning. Production of high quality cotton begins with the selectionof varieties and continues through the use of good production practices thatinclude harvesting, storage, and ginning. Gins can preserve fiber quality anddramatically improve market grade and value. Yield and market qualitiessuch as color, leaf, micronaire, length, length uniformity and strength areimportant characteristics of fiber as well as neps (fiber entanglements), shortfiber content (fibers shorter than 12.7 mm or 0.5 in.), and fragments from theseed coats.
The principal function of the cotton gin is to separate lint from seed andproduce the highest total monetary return for the resulting lint, seeds, etc.,
HeaterBalepress
Gin stand
Conditioner/feeder
Conveyor/distributor
Moistureremoval/addition
Separator
Feedcontrol
Seedcottoninput
6.1 Machine sequence used to process clean, hand-picked cotton.

Cotton: Science and technology178
under the marketing conditions that prevail. These marketing quality standardsmost often reward cleaner cotton and a certain traditional appearance of thelint. The gin then must also be equipped to remove a large percentage of theforeign matter from the cotton that would significantly reduce the value ofthe ginned lint, especially if the cotton is machine harvested. A ginner musthave two objectives: first, to produce lint of satisfactory quality for thegrower’s classing and market system, and secondly, to gin the cotton withminimum reduction in fiber spinning quality so that the cotton will meet thedemands of its ultimate users, the spinner and the consumer. Thus, qualitypreservation during ginning requires the proper selection and operation ofeach machine that is included in a ginning system. The ginner must alsoconsider the weight loss that occurs in the various cleaning machines. Oftenthe weight loss to achieve a higher grade results in a lower total monetaryreturn.
6.2 Harvesting
About 35% of the over 100 million bales of cotton produced globally isharvested by hand. Although 40 countries harvest some cotton by machine,only three (United States, Australia and Israel) harvest 100% by machine.Two types of mechanical harvesting equipment are used to harvest cotton:the spindle picker (Fig. 6.3) and the cotton stripper harvester (Fig. 6.4). Plantheight should not exceed about 1.21m (4 ft) for picked cotton and about0.91 m (3 ft) for stripped cotton because too much foreign matter will becollected. In fact, a height of 0.6 m (2 ft) is preferred for stripper harvesting.
Bale
Bale pressGin stand
Lintcleaners
Lint
Conditioner
Seed cottonConditionerModule feeder
Seedcotton
moduleCylinder cleaner Stick
machine
Cylindercleaner
6.2 Representative cross-sections of typical types of gin machineryarrayed in a sequence used for spindle-picked cotton.
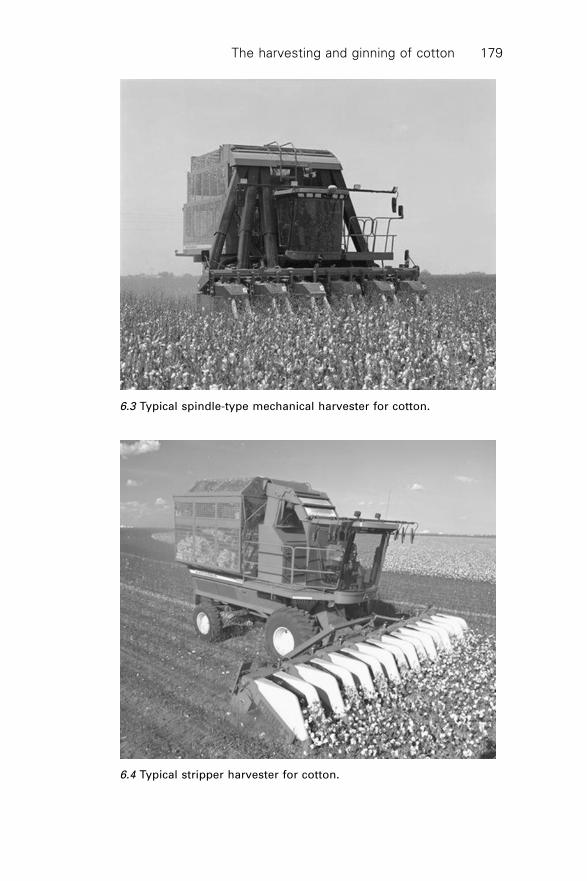
The harvesting and ginning of cotton 179
6.3 Typical spindle-type mechanical harvester for cotton.
6.4 Typical stripper harvester for cotton.
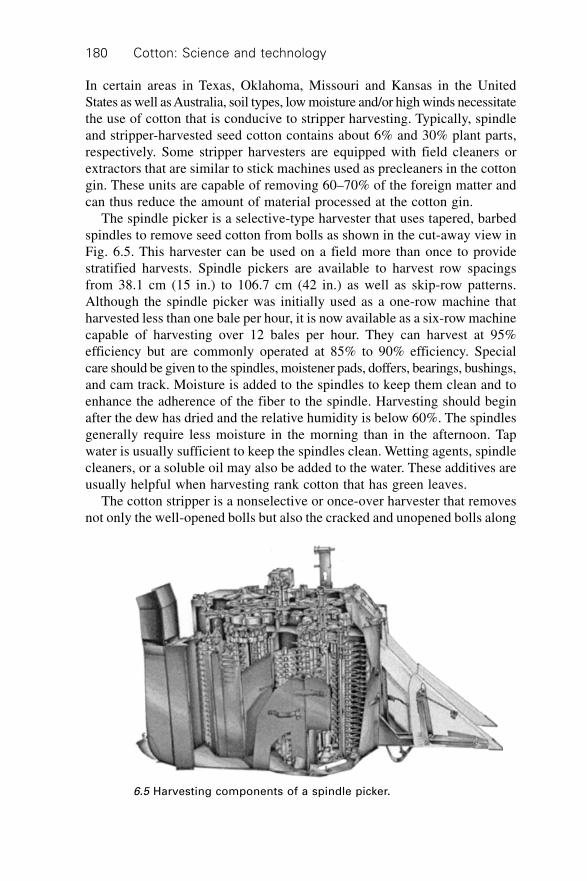
Cotton: Science and technology180
In certain areas in Texas, Oklahoma, Missouri and Kansas in the UnitedStates as well as Australia, soil types, low moisture and/or high winds necessitatethe use of cotton that is conducive to stripper harvesting. Typically, spindleand stripper-harvested seed cotton contains about 6% and 30% plant parts,respectively. Some stripper harvesters are equipped with field cleaners orextractors that are similar to stick machines used as precleaners in the cottongin. These units are capable of removing 60–70% of the foreign matter andcan thus reduce the amount of material processed at the cotton gin.
The spindle picker is a selective-type harvester that uses tapered, barbedspindles to remove seed cotton from bolls as shown in the cut-away view inFig. 6.5. This harvester can be used on a field more than once to providestratified harvests. Spindle pickers are available to harvest row spacingsfrom 38.1 cm (15 in.) to 106.7 cm (42 in.) as well as skip-row patterns.Although the spindle picker was initially used as a one-row machine thatharvested less than one bale per hour, it is now available as a six-row machinecapable of harvesting over 12 bales per hour. They can harvest at 95%efficiency but are commonly operated at 85% to 90% efficiency. Specialcare should be given to the spindles, moistener pads, doffers, bearings, bushings,and cam track. Moisture is added to the spindles to keep them clean and toenhance the adherence of the fiber to the spindle. Harvesting should beginafter the dew has dried and the relative humidity is below 60%. The spindlesgenerally require less moisture in the morning than in the afternoon. Tapwater is usually sufficient to keep the spindles clean. Wetting agents, spindlecleaners, or a soluble oil may also be added to the water. These additives areusually helpful when harvesting rank cotton that has green leaves.
The cotton stripper is a nonselective or once-over harvester that removesnot only the well-opened bolls but also the cracked and unopened bolls along
6.5 Harvesting components of a spindle picker.
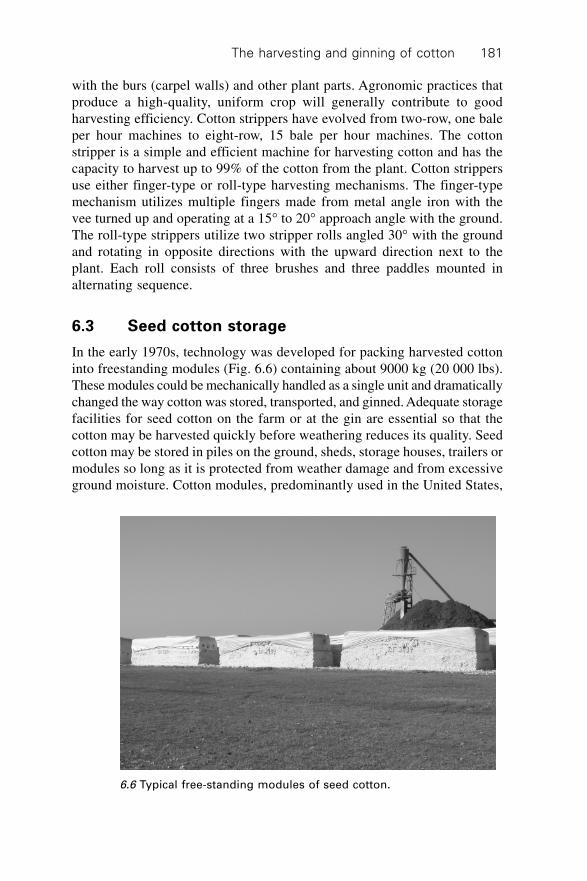
The harvesting and ginning of cotton 181
with the burs (carpel walls) and other plant parts. Agronomic practices thatproduce a high-quality, uniform crop will generally contribute to goodharvesting efficiency. Cotton strippers have evolved from two-row, one baleper hour machines to eight-row, 15 bale per hour machines. The cottonstripper is a simple and efficient machine for harvesting cotton and has thecapacity to harvest up to 99% of the cotton from the plant. Cotton strippersuse either finger-type or roll-type harvesting mechanisms. The finger-typemechanism utilizes multiple fingers made from metal angle iron with thevee turned up and operating at a 15∞ to 20∞ approach angle with the ground.The roll-type strippers utilize two stripper rolls angled 30∞ with the groundand rotating in opposite directions with the upward direction next to theplant. Each roll consists of three brushes and three paddles mounted inalternating sequence.
6.3 Seed cotton storage
In the early 1970s, technology was developed for packing harvested cottoninto freestanding modules (Fig. 6.6) containing about 9000 kg (20 000 lbs).These modules could be mechanically handled as a single unit and dramaticallychanged the way cotton was stored, transported, and ginned. Adequate storagefacilities for seed cotton on the farm or at the gin are essential so that thecotton may be harvested quickly before weathering reduces its quality. Seedcotton may be stored in piles on the ground, sheds, storage houses, trailers ormodules so long as it is protected from weather damage and from excessiveground moisture. Cotton modules, predominantly used in the United States,
6.6 Typical free-standing modules of seed cotton.

Cotton: Science and technology182
Australia, Israel and Brazil, are a freestanding stack of cotton produced bydumping harvested material into a form known as a module builder (Fig.6.7), where it is compacted to a density of about 193 kg/m3 (12 lb/ft3 ). Whenseed cotton is consolidated for storage, it should be in a covered storage areaor covered with a high-quality tarpaulin.
6.3.1 Monitoring temperatures during storage
Temperatures should be checked daily at several locations with a temperatureprobe for the first five to seven days, typically about 1.5 m (5 ft) apart. Afterthat, the temperature probing can be done every three to four days or as thetemperature dictates. The temperature probe should reach at least 0.8 m (2.5ft) into the seed cotton. The temperature of cotton harvested at safe storagemoisture will generally not increase more than 8 ∞C (15 ∞F) during the initialfive to seven days and will then level off and even cool down as storagecontinues. A rapid and continuing rise in temperature above 8 ∞C (15 ∞F) ormore during the first few days generally signifies a moisture problem. If atemperature of 49 ∞C (120 ∞F) is reached, or if the temperature increases bymore than 11 ∞C (20 ∞F), the cotton should be ginned immediately to avoiddamage to fiber and seed.
6.7 Spindle picker dumping into a module builder.
The harvesting and ginning of cotton 183
6.3.2 Quality changes during storage
Moisture content, length of storage, amount of high-moisture foreign matter,variation in moisture content throughout the stored mass, initial temperatureof the seed cotton, temperature of the seed cotton during storage, weatherfactors during storage (temperature, relative humidity, rainfall), and protectionof the seed cotton from rain and wet ground all affect seed and fiber qualityduring seed cotton storage. Some color degradation (spotting) occurs in seedcotton stored at a moisture level above 11%. At high moisture levels, bacterialaction causes temperature increases within 48 hours that result in discoloration.Moisture content levels above 13% cause yellowness to increase sharply,especially when the storage period exceeds 45 days. For long storage periods,moisture should be below 12%. Yellowing is accelerated at high temperatures.The rate of lint yellowing increases sharply at moistures above 13% and canincrease even after the temperature of a module drops.
6.3.3 Seed quality
When seed cotton is stored, the length of the storage period is important inpreserving seed quality and should be based on the moisture content of theseed cotton. Seed quality factors such as germination, free fatty acid contentand aflatoxin level can be degraded during storage. Seed cotton moisturecontent during storage is the most important variable affecting seed germinationand oil quality. Seed cotton moisture content should not exceed 10% forstorage when the seed will be saved for planting. Oil quality can be preservedat 12% moisture content during storage.
6.4 Gin machinery
The minimum machinery required to process clean, hand-harvested cottonconsists of a dryer and/or moisture restoration device followed by a feeder touniformly meter seed cotton into a gin stand. The ginner must be able toadjust the moisture of the cotton up or down, individualize the locules ofcotton, meter the locules uniformly into the gin stand to separate the fiberfrom the seed, and then package the fiber and seed for market. The simplifiedmachine sequence in Fig. 6.1 illustrates the minimum machinery necessaryto produce marketable fiber. This simplified sequence, however, does notprovide versatility to properly manage cotton that has excessive moisture ortrash, or cotton that must meet specialized textile needs. Since saw-type lintcleaning is not included in Fig. 6.1, the baled fiber will contain imperfectionssuch as motes and trash, and will not have a smooth appearance. A moreextensive machine sequence such as that shown in Fig. 6.2 provides theflexibility to meet almost any situation for hand or machine-picked cotton.
Cotton: Science and technology184
The sequence of gin machinery to dry and clean spindle-harvested Uplandcotton is as follows: dryer, cylinder cleaner, stick machine, dryer, cylindercleaner, extractor-feeder and saw-type gin stand followed by two stages ofsaw-type lint cleaning (Fig. 6.2). These gin machinery recommendations areapplicable worldwide, although they are used in varying amounts dependingupon the needs of the respective countries. Marketing system premiums anddiscounts as well as the cleaning efficiency and fiber damage resulting fromvarious gin machines serve as a starting point in determining how muchmachinery to use. Variation from these recommendations is necessary forstripper-harvested cotton as well as other special conditions. For strippercotton, at least one additional extractor is added to the sequence in Fig. 6.2prior to ginning. Moisture restoration equipment before and after fiber-seedseparation should also be included – before to maintain fiber length, andafter to reduce bale compression requirements.
Foreign-matter (carpel walls, leaves, stems, sticks, soil, etc.) levels inseed cotton before gin processing usually range from 1 to 5% for handharvested, from 5 to 10% for spindle-harvested, and from 10 to 30% forstripper-harvested cottons. The foreign matter level dictates the amount ofcleaning needed. The quality of ginned lint is directly related to the qualityof the cotton before ginning. High grades will result from cotton that comesfrom clean fields. Lower grades will result from cotton that comes fromgrassy, weedy fields in which poor defoliation or harvesting practicesare used.
When gin machinery is used in the recommended sequence, 75 to 85% ofthe foreign matter is usually removed from the cotton. Unfortunately, thismachinery also removes small quantities of good quality cotton in the processof removing foreign matter, so the quantity of marketable cotton is reducedduring cleaning. Cleaning cotton is a compromise between foreign matterlevel, and fiber loss and damage. The trash removal efficiency and fiberdamage are inversely related to the fiber moisture.
6.4.1 Seed cotton unloading
Unloading systems remove seed cotton from the transport vehicle andfeed cotton into the gin at a constant and uniform rate. An auxiliary functionis to remove rocks, metal, or other hazardous material and to remove wetgreen bolls and some sand and dirt. There are two types of seed cottonunloading systems associated with module storage: (i) pneumatic suctionthrough swinging telescopes that remove cotton directly from the trailer ormodule and (ii) module disperser systems that break up the modulemechanically and deposit the seed cotton onto a conveyor that delivers it toa fixed suction pickup point. For seed cotton stored on trailers, the suctionsystem is used.
The harvesting and ginning of cotton 185
6.4.2 Feed control
Cotton should be steadily and uniformly metered into the gin system. This isnormally accomplished by a feed control which consists of a small storagechamber as well as multiple rotating cylinders that may be manually orautomatically controlled. The efficiency of the drying, cleaning and conveyingsystems increases as the uniformity of flow increases.
6.4.3 Drying
The moisture content of seed cotton is very important in the ginningprocess. When seed cotton enters the gin plant with high moisture content,it should be exposed to as little machinery as possible (especially extractors)before entering the drying system. Seed cotton having too high a moisturecontent will not clean or gin properly and will not easily separate into singlelocks but will form wads that may choke and damage gin machinery orentirely stop the ginning process. Seed cotton with too much moisture willalso form tight twists known as ‘fish hooks’ that remain in the ginned lintand degrade appearance. Excess moisture is removed by exposing the cottonto heated, dry air. Drying systems include reel-type, tower, tower hybrid,fountain, hi-slip, combination drier-cleaners, and belt-type systems. Dryingsystems can seriously overdry cotton and must be used properly to avoidreducing cotton quality. Drying at low temperatures is much less harmfulthan drying at high temperatures. Larger volumes of drying air allow dryingat lower temperatures.
Both constituents of seed cotton – fiber and seed – are hygroscopic but atdifferent levels. Dry cotton placed in damp air for long periods will gainmoisture, and wet cotton placed in dry air will lose moisture. For everycombination of ambient air temperature and relative humidity, there arecorresponding equilibrium moisture contents for the seed cotton, fiber, andseed. For example, if seed cotton is placed in air of 50% relative humidityand 21 ∞C (70 ∞F), the fibers will tend to reach a moisture content (wet basis)of approximately 6%; the seed will tend to reach a moisture content of about9%; and the composite mass will approach a moisture content of 8%. Theequilibrium moisture content at a given relative humidity is also a functionof the temperature and barometric pressure.
The effects of atmospheric conditions, particularly relative humidity, mustbe considered when harvesting seed cotton. The effect of relative humidityon cotton moisture is relatively simple, useful, and easily understood forambient conditions. Cotton can be dried at gins by using either ambient orheated air. When ambient air is used, the relative humidity must be equal tothat necessary to achieve the desired equilibrium moisture content of thecotton fiber. Most of the drying in cotton gins is done with heated air. As the

Cotton: Science and technology186
air and seed cotton move through a dryer, the air temperature will dropbecause (i) heat is lost, (ii) heat is used to increase the temperature of thecotton, and (iii) moisture is vaporized from the cotton which causes by farthe greatest temperature drop. In addition, transport of cotton between machineswith moist or dry ambient air will change the moisture content of the fibersignificantly.
Drying cotton at high temperatures may damage the cotton fiber. Cottonshould be dried at the lowest temperature that will produce satisfactorymarket grades and allow satisfactory gin operation. Cotton will scorch at232 ∞C (450 ∞F), ignite at 460 ∞C (500 ∞F), and flash at 316 ∞C (600 ∞F). Inno case should the temperature in any portion of the drying system exceed177 ∞C (350 ∞F) because irreversible damage may occur. Temperatures over93 ∞C (200 ∞F) damage dry fiber and should not be used if at all possible.Figure 6.8 illustrates the impact of temperatures on fiber breakage. There isan optimum fiber moisture content for each process in the gin. The effortrequired to control moisture will pay dividends in gin operating efficiencyand market value of the baled cotton.
Cotton with too low a moisture content may stick to metal surfaces as aresult of static electricity generated on the fibers and cause machinery tochoke and stop. Fiber dried to very low moisture content becomes brittle andwill be damaged by the mechanical processes required for cleaning andginning. Dry cotton requires more force and power to compress thandoes moist cotton. When pressing and baling such low-moisture cotton, it isoften difficult to achieve the desired bale weight and density without addingmoisture. When two stages of seed cotton cleaning are employed, a seconddrying system should be used when high moisture cotton is processed. This
3 sec.30 sec.300 sec.
35
30
25
20
15
10
5
Bro
ke
n f
ibe
rs,
%
50 100 150 200 250 300 350 400 450 500Temperature, ∞F
6.8 When drying temperatures exceed 220 ∞F, the percentages ofbroken fibers increase.
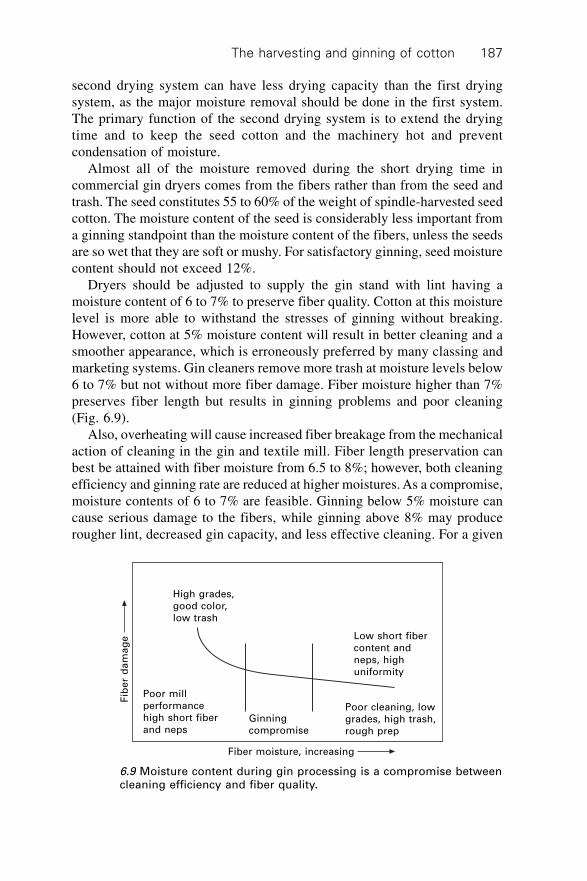
The harvesting and ginning of cotton 187
second drying system can have less drying capacity than the first dryingsystem, as the major moisture removal should be done in the first system.The primary function of the second drying system is to extend the dryingtime and to keep the seed cotton and the machinery hot and preventcondensation of moisture.
Almost all of the moisture removed during the short drying time incommercial gin dryers comes from the fibers rather than from the seed andtrash. The seed constitutes 55 to 60% of the weight of spindle-harvested seedcotton. The moisture content of the seed is considerably less important froma ginning standpoint than the moisture content of the fibers, unless the seedsare so wet that they are soft or mushy. For satisfactory ginning, seed moisturecontent should not exceed 12%.
Dryers should be adjusted to supply the gin stand with lint having amoisture content of 6 to 7% to preserve fiber quality. Cotton at this moisturelevel is more able to withstand the stresses of ginning without breaking.However, cotton at 5% moisture content will result in better cleaning and asmoother appearance, which is erroneously preferred by many classing andmarketing systems. Gin cleaners remove more trash at moisture levels below6 to 7% but not without more fiber damage. Fiber moisture higher than 7%preserves fiber length but results in ginning problems and poor cleaning(Fig. 6.9).
Also, overheating will cause increased fiber breakage from the mechanicalaction of cleaning in the gin and textile mill. Fiber length preservation canbest be attained with fiber moisture from 6.5 to 8%; however, both cleaningefficiency and ginning rate are reduced at higher moistures. As a compromise,moisture contents of 6 to 7% are feasible. Ginning below 5% moisture cancause serious damage to the fibers, while ginning above 8% may producerougher lint, decreased gin capacity, and less effective cleaning. For a given
Fib
er
da
ma
ge
Fiber moisture, increasing
High grades,good color,low trash
Low short fibercontent andneps, highuniformity
Ginningcompromise
Poor cleaning, lowgrades, high trash,rough prep
Poor millperformancehigh short fiberand neps
6.9 Moisture content during gin processing is a compromise betweencleaning efficiency and fiber quality.
Cotton: Science and technology188
cotton, fiber lengths of 2.97, 2.95, 2.90, and 2.84 cm (1.17, 1.16, 1.14 and1.12 in.) might result from processing at 9.4, 7.4, 4.9, and 3.7% fiber moisture,respectively (Anthony 1990d). The effects of ginning cotton below 5% moistureare decreased yarn strength and yarn appearance and increased short fibersin the card sliver.
6.4.4 Seed cotton cleaning
The term ‘seed cotton cleaning’ refers to the use of various types of cylindercleaners designed primarily for removal of dirt and small pieces of leaves,bracts, and other vegetative matter, as well as ‘extractors’ that are used toremove large trash, such as burs and sticks, from the seed cotton. Bur machines,stick machines, extractor-feeders, and combination bur and stick machinesare examples of extracting-type machinery. The cleaning and extracting systemserves a dual purpose. First, large trash components such as burs, limbs, andbranches, must be extracted from the seed cotton before they are broken upand embedded in the cotton and so that the gin stand will operate at peakefficiency and without excessive downtime. Second, seed cotton cleaning isoften necessary to obtain optimum grades and market values, especiallywhen ginning high-trash-content cotton. Also, cleaners and extractors helpopen the seed cotton for more effective drying, which is usually doneconcurrently with cleaning. The amount of cleaning and extracting machineryrequired to satisfactorily clean seed cotton varies with the trash content ofthe seed cotton, which depends in large measure on the method of harvest.
Cylinder cleaners
Cylinder cleaners are used for removing small trash particles and for openingand preparing the seed cotton for the drying and extraction processes. Thecylinder cleaner consists of a series of spiked cylinders, usually four to sevenin number that agitate and convey the seed cotton across cleaning surfacescontaining small openings or slots. In the impact or revolving screen cleaner,cotton is conveyed between a series of parallel, revolving serrated disks. Theimpact cleaner also includes a reclaimer section. It is also used as a lintcleaner in roller gins.
Air line cleaners are usually mounted in a horizontal position in theunloading-system air line. These installations normally permit both the airand seed cotton to pass through the cleaner. In some designs, an air linecleaner is combined with a separator in series to provide both cleaning andseed cotton/air separation. Air line cleaners have gained wide acceptance instripper-harvested areas as a means for removing soil particles from seedcotton and for opening partially closed bolls and wads of seed cotton forfurther cleaning.

The harvesting and ginning of cotton 189
Extractors
Stick machines utilize the sling-off action of high-speed, toothed cylindersthat hold the fiber while the seed cotton is beaten against grid bars to extractburs and sticks. Stick machines are usually preceded by one or two stages ofdrying and at least one stage of cleaning with a cleaner consisting of multiplespiked-tooth cylinders. The preceding cylinder cleaner will open cotton formore efficient cleaning by the stick machine and reduce seed cotton losses.A combination bur and stick machine (CBS), which is used for stripper-harvested cotton, is a hybrid type of extractor that combines the best featuresof the bur machine and the stick machine. The upper section of a CBSmachine resembles a bur machine in that it is equipped with an auger feedand trash extraction system and a large-diameter saw cylinder. Gin standfeeders may include extractor cylinders as well as spiked cylinders. Theprimary function of an extractor-feeder is to feed seed cotton to the gin standuniformly and at controllable rates, with extracting and cleaning as a secondaryfunction.
Cleaning and extracting efficiency
The efficiency of a cleaner or extractor depends on many factors, includingmachine design; cotton moisture level; processing rate; adjustments, speed,and condition of the machine; the amount and nature of trash in the cotton;distribution of cotton across the machine; and the cotton variety. The totaltrash removal efficiency of cylinder cleaners is generally low compared toextractors when measured by weight of trash, as the trash particles are small.However, they are usually used in combination with other machines.Cylinder cleaners perform a most useful function in opening the cotton andremoving fine trash. Studies using both machine-picked and machine-strippedcottons have shown that the total trash removal efficiency of a six-cylinderinclined cleaner with grid rods generally ranges from 10 to 40% as measuredby weight. Cylinder cleaners known as ‘hot air’ machines also separateconveying and drying air from the seed cotton and require a vacuum dropperto return the cotton to atmospheric pressure. In this case, air is dischargedwith the trash.
The cleaning efficiencies of extractors vary widely, depending on thecondition of the seed cotton and on machine design variables. Formachine-stripped cotton, a modern commercial stick machine can be expectedto remove about 65% of the burs, 50% of the sticks, and 10 to 35% of thefine trash. The total cleaning efficiency for stripped cotton is normally in the60% to 65% range. The total cleaning efficiency can range from about 20%for cleanly picked seed cotton to as high as 50% for picked cotton containingsignificant amounts of burs and sticks.

Cotton: Science and technology190
Extractor-feeders are efficient cleaners. Seed cotton is usually well dispersedwhen it enters an extractor-feeder, and the feed rate through this machine isoften lower than the feed rate of other seed cotton cleaning machinery.Studies wherein all seed cotton cleaners prior to the extractor-feeder werebypassed have indicated that the extractor-feeder removes 70% of the hulls,15% of the motes, and 40% of the remaining trash components and has anoverall cleaning efficiency of about 40% for machine-picked cotton.
Cleaning efficiencies for sequences of four seed cotton machines consistingof a cylinder cleaner, a stick machine, a second cylinder cleaner, and anextractor-feeder range from 40% to 80%, depending on the factors previouslydiscussed. The amount of each type of trash in cotton also varies substantially.Hand- or spindle-harvested cotton normally contains less than 10% foreignmaterial. Each type of seed cotton cleaner is designed to remove differenttypes of trash, and any calculation of machine efficiency is predicated on thetype of trash involved.
6.4.5 Gin stands
Saw gin stands typically have 30.5 to 45.7 cm (12 to 18 in.) diameter sawsspaced from 0.5 to 1 in. apart with as many as 198 saws stacked on a singlemandrel. Each of these saws project through ginning ribs, grasp the fiber andpull the fiber from the seed as they are too large to pass through the openingin the ginning ribs. The diameter of seed generally follows a normal bell-shaped distribution, and occasionally a small seed escapes the gin stand andis removed by the moting sections of the gin stand or by a subsequent lintcleaner. The capacity of a single gin stand has increased from less than onebale per hour to more than 15. In the United States, gin plants typically havethree or four gin stands per plant and process rates range from a few to over100 bales per hour.
The fiber-seed attachment force differs for varieties, field deterioration,moisture content, and other factors; but is typically about 55% of the breakingforce (Anthony and Griffin, 2001) suggesting that the fibers could be removedfrom the seed without breakage. The gin stand, whether saw (Fig. 6.10) orroller, removes (pulls) the fiber from the seed and is the heart of the ginningsystem. The capacity of the system and the quality and potential spinningperformance of the lint depend on the operating condition and adjustment ofthe gin stand. Gin stands must be properly adjusted, kept in good condition,and operated at or below design capacity. If gin stands are overloaded, thequality of the cotton may be reduced. Short fiber content increases as theginning rate increases above the manufacturer’s recommendation. Short fiberalso increases as saw speed increases. Increased ginning rate also increasesyarn imperfections. Seed damage can also result from increasing the ginningrate, especially when the seeds are dry. High ginning rate and low seed
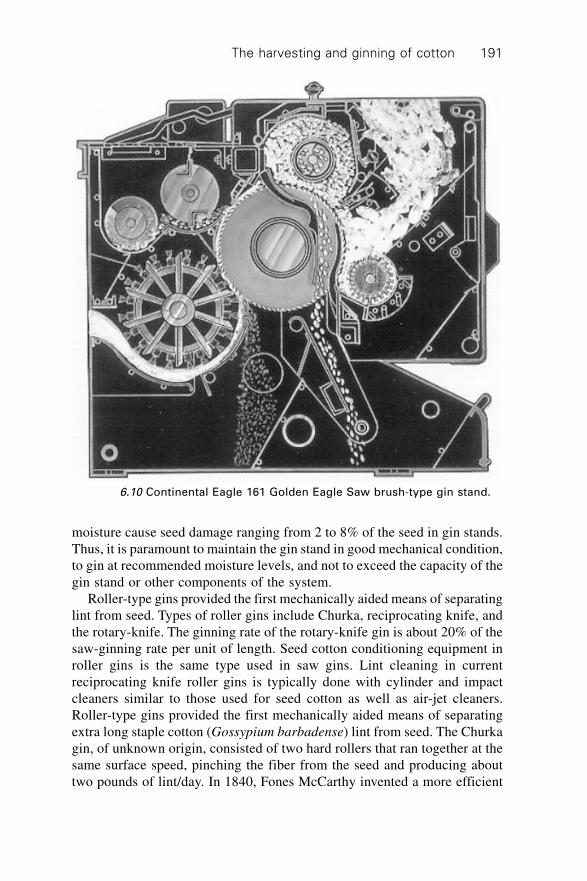
The harvesting and ginning of cotton 191
moisture cause seed damage ranging from 2 to 8% of the seed in gin stands.Thus, it is paramount to maintain the gin stand in good mechanical condition,to gin at recommended moisture levels, and not to exceed the capacity of thegin stand or other components of the system.
Roller-type gins provided the first mechanically aided means of separatinglint from seed. Types of roller gins include Churka, reciprocating knife, andthe rotary-knife. The ginning rate of the rotary-knife gin is about 20% of thesaw-ginning rate per unit of length. Seed cotton conditioning equipment inroller gins is the same type used in saw gins. Lint cleaning in currentreciprocating knife roller gins is typically done with cylinder and impactcleaners similar to those used for seed cotton as well as air-jet cleaners.Roller-type gins provided the first mechanically aided means of separatingextra long staple cotton (Gossypium barbadense) lint from seed. The Churkagin, of unknown origin, consisted of two hard rollers that ran together at thesame surface speed, pinching the fiber from the seed and producing abouttwo pounds of lint/day. In 1840, Fones McCarthy invented a more efficient
6.10 Continental Eagle 161 Golden Eagle Saw brush-type gin stand.

Cotton: Science and technology192
roller gin that consisted of a leather ginning roller, a stationary knife heldtightly against the roller, and a reciprocating knife that pulled the seed fromthe lint as the lint was held by the roller and stationary knife. In the late1950s, a rotary-knife roller gin was developed by the United States Departmentof Agriculture, Agricultural Research Service’s Southwestern Cotton GinningResearch Laboratory, gin manufacturers, and private ginneries. This gin iscurrently the only roller-type gin used in the United States.
6.4.6 Lint cleaners
Lint cleaners remove leaf particles, motes, grass, and bark that remain incotton after seed cotton cleaning, extracting, and ginning. Most gins thatprocess machine-harvested cotton have one or more stages of lint cleaning.The lint cleaners now being marketed for saw-ginned cotton are of twogeneral types; flow-through air type and controlled-batt saw type.
Flow-through air lint cleaner
The flow-through air lint cleaner, commercially known as the Air Jet/SuperJet‚, Centrifugal Cleaner‚, or Super Mote Lint Cleaner‚, has no saws,brushes, or moving parts. It is usually installed immediately behind the sawor roller gin stand. Air and cotton moving through the duct change directionabruptly as they pass across a narrow trash-ejection slot. Foreign matter thatis heavier than the cotton fibers and not too tightly held by fibers is ejectedthrough the slot by inertial force. Flow-through air lint cleaners are lesseffective in improving the grade of cotton than saw lint cleaners becausethese air lint cleaners do not comb the fibers. However, air lint cleaners doremove less weight from the bale. Fiber length, fiber strength, and neps areunaffected by the air lint cleaner. This type of cleaner is commonly used inboth saw and roller gins.
Controlled-batt saw lint cleaner
Lint from the gin stand or another lint cleaner is formed into a batt on acondenser screen drum. The batt is then fed through one or more sets ofcompression rollers, passed between a very closely fitted feed roller and feedplate or bar, and fed onto a saw cylinder. A typical saw-type lint cleaner isshown in Fig. 6.11. In addition to removing trash, lint cleaners comb andblend the cotton to produce a smooth appearance. They also degrade somedesirable mill qualities, especially at low moistures.
Lint fed to the cleaning machinery at high rates will result in decreasedcleaning efficiency and perhaps lower bale values. For efficient cleaning andminimum damage, feed rates should average about 750 kg/hr/m (500 lb/hr/
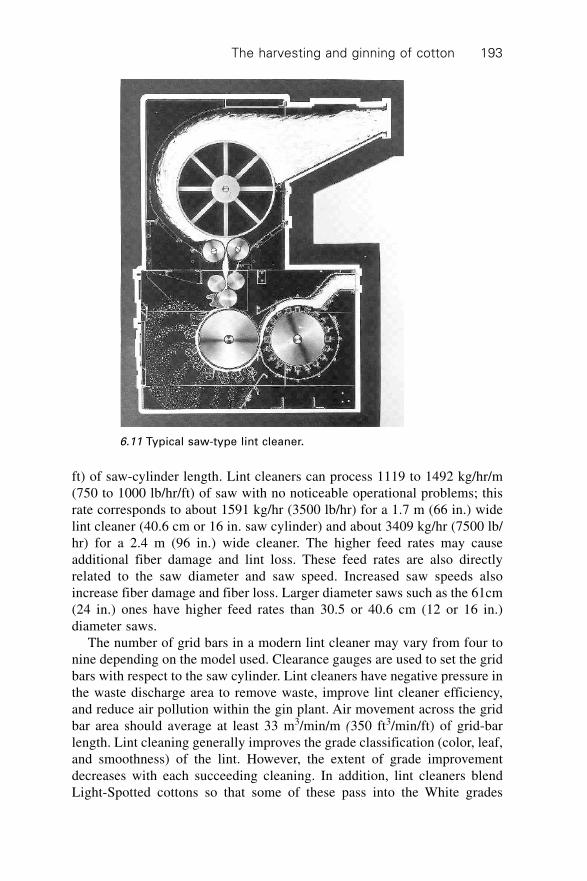
The harvesting and ginning of cotton 193
ft) of saw-cylinder length. Lint cleaners can process 1119 to 1492 kg/hr/m(750 to 1000 lb/hr/ft) of saw with no noticeable operational problems; thisrate corresponds to about 1591 kg/hr (3500 lb/hr) for a 1.7 m (66 in.) widelint cleaner (40.6 cm or 16 in. saw cylinder) and about 3409 kg/hr (7500 lb/hr) for a 2.4 m (96 in.) wide cleaner. The higher feed rates may causeadditional fiber damage and lint loss. These feed rates are also directlyrelated to the saw diameter and saw speed. Increased saw speeds alsoincrease fiber damage and fiber loss. Larger diameter saws such as the 61cm(24 in.) ones have higher feed rates than 30.5 or 40.6 cm (12 or 16 in.)diameter saws.
The number of grid bars in a modern lint cleaner may vary from four tonine depending on the model used. Clearance gauges are used to set the gridbars with respect to the saw cylinder. Lint cleaners have negative pressure inthe waste discharge area to remove waste, improve lint cleaner efficiency,and reduce air pollution within the gin plant. Air movement across the gridbar area should average at least 33 m3/min/m (350 ft3/min/ft) of grid-barlength. Lint cleaning generally improves the grade classification (color, leaf,and smoothness) of the lint. However, the extent of grade improvementdecreases with each succeeding cleaning. In addition, lint cleaners blendLight-Spotted cottons so that some of these pass into the White grades
6.11 Typical saw-type lint cleaner.
Cotton: Science and technology194
(Mangialardi, 1990, 1993, 1996). Lint cleaners can also decrease the numberof bales that are reduced in grade because of grass and bark content. Lintcleaners also reduce bale weights and may decrease staple length, thus affectingbale value. In some cases, the net effect of multiple stages of lint cleaning isa loss in bale sales value as well as an increase in neps and short fiber contentwhich decreases its spinning value (Mangialardi and Anthony, 1998).
Lint cleaning for roller ginned cotton
Cylinder cleaners, textile-type beaters, impact cleaners and airjet cleanersmay be used to remove motes, broken seed, fiber entanglements, andsmall trash not removed in seed cotton cleaning. There is no standardmachinery sequence for lint cleaning roller-ginned cotton. Lint cleaning inUnited States plants is mostly performed by an inclined cleaner, impactcleaner and one airjet cleaner in series. The controlled-batt saw cleaner is notused in roller gins because it changes the characteristic appearance of rollerginned cotton.
6.4.7 Moisture restoration
Adding moisture before fiber/seed separation and lint cleaning will helpmaintain fiber length and reduce the number of fibers that break in the ginstand and lint cleaners. For example, if moisture is restored to the seedcotton to raise the fiber moisture from 4% up to 6%, staple length will beincreased by 0.08 mm (1/32 in.) and short fiber content will be decreased by2%. Adding moisture to lint that has already been ginned and lint cleaned,however, will not increase fiber length. Other benefits resulting from moisturerestoration include reducing the static electricity level of the cotton, reducingthe volume of the cotton required to achieve a given bale size and reducingthe force required to press the bale. The resilient forces exerted on therestraining bale ties are also lower for the higher moisture cotton.
Many approaches have been used to restore moisture in cotton fiber.Moisture restoration may occur at several locations such as module feeder,feed control, dryers, above extractor feeders, moving-bed conditioners, pressbattery condensers, grids and other apparatus in the lint slide. There is apractical physical limit to the quantity of moisture that may be added to seedcotton. Wetting of the cotton by condensation within machinery and pipesmust be prevented, or choking will result. If liquid water is present on theseed cotton mass, gin stand operation will become irregular and may ceasealtogether. Cotton with fiber moisture of 9% or more may be rough inappearance and will not smooth out properly when processed through thelint cleaners. Thus, the recommended fiber moisture level of 6 to 7% isbased on production aspects as well as quality aspects. Lint moisture in the

The harvesting and ginning of cotton 195
bale must be uniform and not exceed 7.5% at any point in the bale to avoidfiber discoloration and weight loss during storage.
One approach is to use humid air to moisten cotton. The air must beheated to carry sufficient moisture to the cotton fiber. Air can carry ten timesas much water vapor at 54 ∞C (130 ∞F) (0.1118 lb/lb) as it can at 16 ∞C(60 ∞F) (0.01108 lb/lb). The air is first heated to high temperatures where itis exposed to atomized water droplets, which evaporate into the air. Theevaporation process lowers the air temperature and increases the ‘dew point’temperature of the air. The dew point temperature of the air must be wellabove the temperature of the cotton. This humid air is then blown throughthe cotton, which lowers the air temperature below its dew point causing finewater droplets to form on the cotton fibers throughout the cotton batt. Theamount of moisture restoration with this system is limited, especially athigher ginning rates. The cotton fibers lose some of their resilience, thusreducing compressive forces required in baling.
Another approach is to atomize water and spray it directly onto the cotton.Sometimes a wetting agent is added to the water to hasten its distributionthrough the cotton. Most gins that use this system spray water on the cottonat the lint slide as the cotton moves by gravity from the battery condenser tothe ball press. Care must be exercised to avoid wet spots in the bale, whichpromote bacterial and fungal growth and cause degradation of the fibertherefore this method is not recommended.
6.4.8 Packaging lint cotton
Bale packaging is the final step in processing cotton at the gin. The packagingsystem consists of a battery condenser, lint slide, lint feeder, tramper, balepress, bale covering, and bale tying systems. The basic tramping and pressingsystem may be supplemented with systems for bale conveying, weighing,and wrapping. The bale press consists of a frame, one or more hydraulicrams, and a hydraulic power system. Tying subsystems may be entirelymanual, semi-automated, or fully automated. Restraining ties are usuallysteel wire or flat, steel straps but may also be plastic straps. Six to ten ties aretypically spaced along the bale but a spirally wrapped continuous tie issometimes used. The stress on the ties after the bale is released from thepress is a function of the uniformity of the lint distribution, bale weight, baledimensions, density to which the bale was pressed, moisture content, tielength and other factors. Bale tie strength must be matched carefully to thebale press system to prevent tie breakage and subsequent contamination andhandling difficulties. In the United States, ties for gin universal density bales(227.3 kg or 500 lb confined in a 53.3 cm wide by 137.2 cm long by 76.2 cmthick (21 in. by 54 in. by 30 in.) package must have minimum breakingstrengths at the joint of 9.3 kN to 17.8 kN (2100 to 4000 lb), depending onthe type of tie.
Cotton: Science and technology196
Bales should be fully covered (including openings caused by sampling),and all bale covering material should be clean, in sound condition, and ofsufficient strength to adequately protect the cotton. Bales are covered innatural fibers such as cotton (preferably), burlap, and jute, and syntheticssuch as polypropylene and polyethylene. The material must not have salt orother corrosive materials added and must not contain sisal or other hard fiberor any other material that will contaminate or adversely affect cotton. Foroutside storage, bale coverings must include ultraviolet inhibitors commensuratewith the anticipated storage period.
6.5 Effect of gin machinery on cotton quality
Cotton quality is affected by every production step including variety selection,cultural practices, defoliation, harvesting, storing, and ginning. Certain qualitycharacteristics are highly influenced by genetics, while others are determinedmainly by environmental conditions, cultural practices, or by harvesting andginning practices. Problems during any step of production or processing cancause irreversible damage to fiber quality and reduce profits for the produceras well as the segments of the textile industry including spinning, weaving,dyeing, and finishing. After varietal and cultural practices are complete,fiber quality is highest the day the mature cotton boll opens. Weathering,mechanical harvesting, handling, ginning, and manufacturing can diminishthe natural quality. There are many measures of the overall spinning qualityof cotton fiber. The most important include strength, fiber length, short fibercontent, length uniformity, maturity, fineness, trash content, color, seedcoatfragment and nep content, and stickiness.
The ginning process can significantly affect fiber length, uniformity, andthe content of seedcoat fragments, trash, short fibers, and neps. The twoginning practices that have the most impact on quality are (i) the regulationof fiber moisture during ginning and cleaning, and (ii) the degree of gincleaning used. Figure 6.9 illustrates the impact of moisture on fiber qualitygenerally, and Fig. 6.12 illustrates the impact of cleaning on fiber quality.The extractor-feeder/gin stand shown in Fig. 6.1 and 6.2 represents the absoluteminimum machinery required to produce marketable fiber. The addition ofseed cotton cleaning machinery impacts some fiber quality parameters andsaw-type lint cleaners impact nearly all fiber quality parameters. Large andsmall trash particles are removed by gin machinery. In fact, particles commonlyknown as ‘pepper trash’ that are typically about 500 microns in diameter aredramatically reduced by all gin processes except gin stands. Saw-type lintcleaners are especially efficient at removing small trash particles.
Choosing the degree of gin cleaning is a compromise between fiber trashcontent and fiber quality. Lint cleaners are much more effective in reducingthe lint trash content than are seed cotton cleaners, but lint cleaners can also
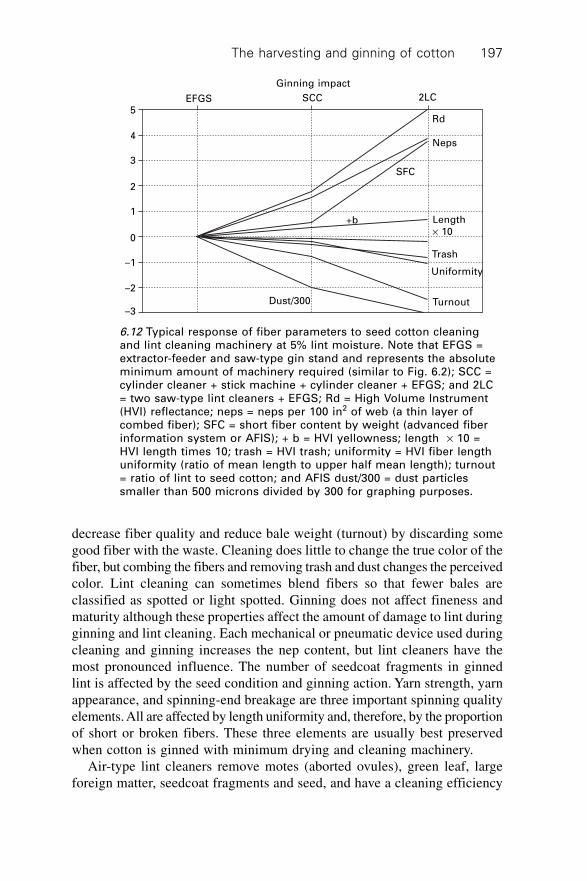
The harvesting and ginning of cotton 197
decrease fiber quality and reduce bale weight (turnout) by discarding somegood fiber with the waste. Cleaning does little to change the true color of thefiber, but combing the fibers and removing trash and dust changes the perceivedcolor. Lint cleaning can sometimes blend fibers so that fewer bales areclassified as spotted or light spotted. Ginning does not affect fineness andmaturity although these properties affect the amount of damage to lint duringginning and lint cleaning. Each mechanical or pneumatic device used duringcleaning and ginning increases the nep content, but lint cleaners have themost pronounced influence. The number of seedcoat fragments in ginnedlint is affected by the seed condition and ginning action. Yarn strength, yarnappearance, and spinning-end breakage are three important spinning qualityelements. All are affected by length uniformity and, therefore, by the proportionof short or broken fibers. These three elements are usually best preservedwhen cotton is ginned with minimum drying and cleaning machinery.
Air-type lint cleaners remove motes (aborted ovules), green leaf, largeforeign matter, seedcoat fragments and seed, and have a cleaning efficiency
Ginning impact
EFGS SCC 2LC
Dust/300
5
4
3
2
1
0
–1
–2
–3
+b
SFC
Rd
Neps
Turnout
Uniformity
Trash
Length¥ 10
6.12 Typical response of fiber parameters to seed cotton cleaningand lint cleaning machinery at 5% lint moisture. Note that EFGS =extractor-feeder and saw-type gin stand and represents the absoluteminimum amount of machinery required (similar to Fig. 6.2); SCC =cylinder cleaner + stick machine + cylinder cleaner + EFGS; and 2LC= two saw-type lint cleaners + EFGS; Rd = High Volume Instrument(HVI) reflectance; neps = neps per 100 in2 of web (a thin layer ofcombed fiber); SFC = short fiber content by weight (advanced fiberinformation system or AFIS); + b = HVI yellowness; length ¥ 10 =HVI length times 10; trash = HVI trash; uniformity = HVI fiber lengthuniformity (ratio of mean length to upper half mean length); turnout= ratio of lint to seed cotton; and AFIS dust/300 = dust particlessmaller than 500 microns divided by 300 for graphing purposes.

Cotton: Science and technology198
of about 10% by weight. Saw-type lint cleaners remove motes, small andlarge foreign matter, dust, seedcoat fragments and seed, and improve theperceived color. They have a cleaning efficiency of about 50% by weight.Saw-type lint cleaners also draft, comb and blend the fibers; they also increaseshort fiber content and neps, and decrease length as they improve marketcolor, grade and appearance. The typical impact of gin machinery on variousquality parameters is illustrated in Fig. 6.12 for reflectance, yellowness, leafgrade, high volume instrument (HVI) trash, uniformity, length, short fibercontent, neps, and seedcoat fragment weight, number of seedcoat fragments,trash and dust. Note that all parameters in Fig. 6.12 are determined bymachines except leaf grade.
6.6 Summary
Cotton possesses its highest fiber quality and best potential for spinningwhen the bolls are mature and freshly opened. The quality of baled cottondepends on many factors including variety, weather conditions, degree ofweathering, cultural, harvesting and storage practices, moisture and trashcontent, and ginning processes. Cotton gins are responsible for convertingseed cotton into bulk cottonseed and bales of lint. Gins can preserve fiberquality and improve market grade and value. Yield and market qualities suchas color, leaf, micronaire, length and strength are important characteristics offiber as well as neps, short fiber content, and seedcoat fragments.
A ginner must have two objectives: (i) to produce lint of satisfactoryquality for the grower’s classing and market system, and (ii) to gin the cottonwith minimum reduction in fiber spinning quality so that the cotton willmeet the demands of its ultimate users, the spinner and the consumer. Asingle ‘best ginning practice’ does not exist for all cottons – each lot ofcotton requires careful assessment of its needs, and thus different ginningpractices. Moisture content, length of storage, amount of high-moisture foreignmatter, variation in moisture content throughout the stored mass, initialtemperature of the seed cotton, temperature of the seed cotton during storage,weather factors during storage (temperature, relative humidity, rainfall), andprotection of the cotton from rain and wet ground all affect seed and fiberquality during seed cotton storage.
For long storage periods, moistures should be below 12%. The temperatureof cotton harvested at safe storage moisture will generally not increase morethan 8 ∞C (15 ∞F) during the initial five to seven days and will then level offand even cool down as storage continues. Foreign-matter levels in seedcotton before gin processing usually range from 1 to 5% for hand harvested,from 5 to 10% spindle-harvested, and from 10 to 30% for stripper-harvestedcottons. A simple gin machine sequence such as a dryer, extractor-feeder andgin stand is required for clean cotton; however, a more extensive machine

The harvesting and ginning of cotton 199
sequence is required for trashy cotton. The extensive sequence of gin machineryto dry and clean trashy cotton includes a dryer, cylinder cleaner, stick machine,dryer, cylinder cleaner, extractor-feeder and saw-type gin stand followed bytwo stages of saw-type lint cleaning. For stripper-harvested cotton, an additionalextractor is required. The quality of ginned lint is directly related to thequality of the cotton before ginning. High grades will result from cottonfrom clean fields and lower grades will result from cotton that comes fromgrassy, weedy fields.
When gin machinery is used in the recommended sequence, 75 to 85% ofthe foreign matter is usually removed from cotton. Drying cotton at hightemperatures may damage the cotton fiber. Cotton should be dried at thelowest temperature that will produce satisfactory market grades and allowsatisfactory gin operation. In no case should the temperature in any portionof the drying system exceed 177 ∞C (350 ∞F) because irreversible damagemay occur. Temperatures over 121 ∞C (250 ∞F) cause moderate fiber damageand should not be used if at all possible. Adding moisture before fiber/seedseparation and lint cleaning will help maintain fiber length and reduce thenumber of fibers that break in the gin stand and lint cleaners. The ginningprocess can significantly affect fiber length, uniformity, and the content ofseedcoat fragments, trash, short fibers, and neps. Choosing the degree of gincleaning is a compromise between fiber trash content and fiber quality. Lintcleaners are much more effective in reducing the lint trash content than areseed cotton cleaners, but lint cleaners can also decrease fiber quality andreduce bale weight (turnout) by discarding some good fiber with the waste.The best ginning practice is simply to use the minimum machinery for aparticular cotton to achieve the optimum market grade.
Ginners must determine the needs of their customers and select thedrying and cleaning processes that meet their needs. They must ensure thatfarmers are aware of the impact of varieties and cultural practices on thequality of the seed cotton brought to the gin, and thus, the amount of ginprocessing equipment required. Gin procedures must be well planned toensure timely and efficient processing. Operator and management personnelmust be well trained and skilled in all aspects of gin operations. Gin machinerymust be operated at the proper speeds and capacities, and must be wellmaintained. Moisture must be managed from harvesting through packaging.Cotton must not be harvested or stored at seed cotton moisture levelsabove 12% wet basis. Cotton should not be exposed to temperatures above121 ∞C (250 ∞F) and must not be exposed to temperatures above 177 ∞C(350 ∞F) unless it is wet. Fiber moisture at the gin stand should be 6 to 7%,and the fiber should be packaged at less than 7.5% moisture. Bales should bepackaged at the proper density and protected by high quality bale ties andbale coverings. Good gin operations use only the amount of drying, moisturerestoration, and cleaning required to meet customer demands. New, proven
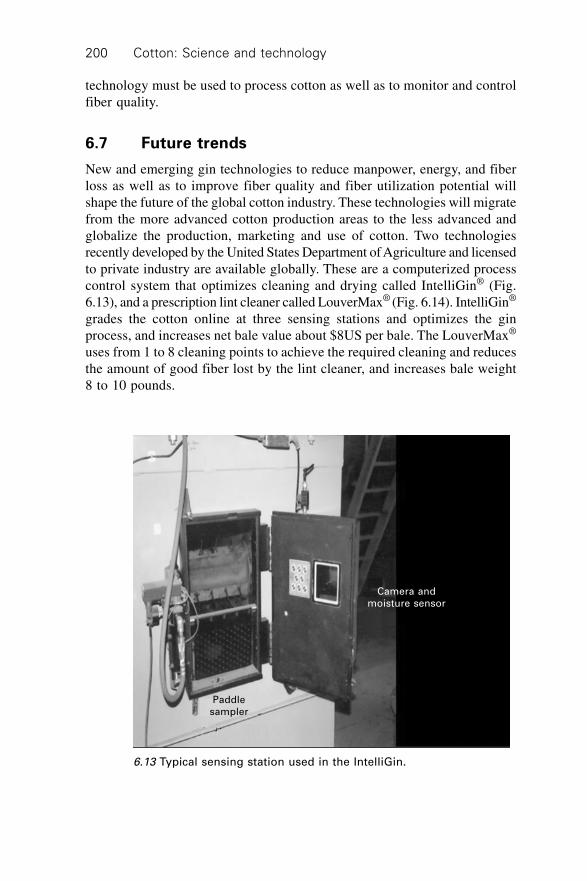
Cotton: Science and technology200
technology must be used to process cotton as well as to monitor and controlfiber quality.
6.7 Future trends
New and emerging gin technologies to reduce manpower, energy, and fiberloss as well as to improve fiber quality and fiber utilization potential willshape the future of the global cotton industry. These technologies will migratefrom the more advanced cotton production areas to the less advanced andglobalize the production, marketing and use of cotton. Two technologiesrecently developed by the United States Department of Agriculture and licensedto private industry are available globally. These are a computerized processcontrol system that optimizes cleaning and drying called IntelliGin® (Fig.6.13), and a prescription lint cleaner called LouverMax® (Fig. 6.14). IntelliGin®
grades the cotton online at three sensing stations and optimizes the ginprocess, and increases net bale value about $8US per bale. The LouverMax®
uses from 1 to 8 cleaning points to achieve the required cleaning and reducesthe amount of good fiber lost by the lint cleaner, and increases bale weight8 to 10 pounds.
Camera andmoisture sensor
Paddlesampler
6.13 Typical sensing station used in the IntelliGin.
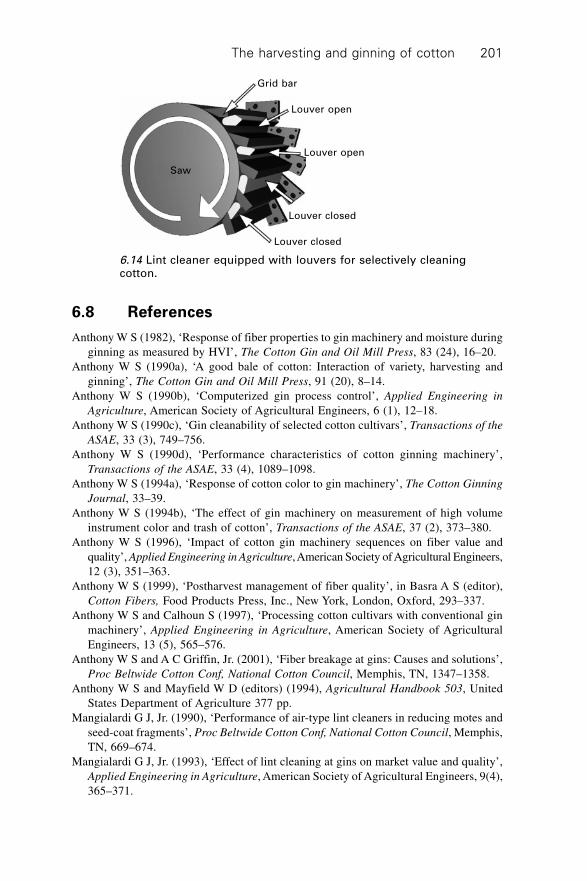
The harvesting and ginning of cotton 201
6.8 References
Anthony W S (1982), ‘Response of fiber properties to gin machinery and moisture duringginning as measured by HVI’, The Cotton Gin and Oil Mill Press, 83 (24), 16–20.
Anthony W S (1990a), ‘A good bale of cotton: Interaction of variety, harvesting andginning’, The Cotton Gin and Oil Mill Press, 91 (20), 8–14.
Anthony W S (1990b), ‘Computerized gin process control’, Applied Engineering in
Agriculture, American Society of Agricultural Engineers, 6 (1), 12–18.Anthony W S (1990c), ‘Gin cleanability of selected cotton cultivars’, Transactions of the
ASAE, 33 (3), 749–756.Anthony W S (1990d), ‘Performance characteristics of cotton ginning machinery’,
Transactions of the ASAE, 33 (4), 1089–1098.Anthony W S (1994a), ‘Response of cotton color to gin machinery’, The Cotton Ginning
Journal, 33–39.Anthony W S (1994b), ‘The effect of gin machinery on measurement of high volume
instrument color and trash of cotton’, Transactions of the ASAE, 37 (2), 373–380.Anthony W S (1996), ‘Impact of cotton gin machinery sequences on fiber value and
quality’, Applied Engineering in Agriculture, American Society of Agricultural Engineers,12 (3), 351–363.
Anthony W S (1999), ‘Postharvest management of fiber quality’, in Basra A S (editor),Cotton Fibers, Food Products Press, Inc., New York, London, Oxford, 293–337.
Anthony W S and Calhoun S (1997), ‘Processing cotton cultivars with conventional ginmachinery’, Applied Engineering in Agriculture, American Society of AgriculturalEngineers, 13 (5), 565–576.
Anthony W S and A C Griffin, Jr. (2001), ‘Fiber breakage at gins: Causes and solutions’,Proc Beltwide Cotton Conf, National Cotton Council, Memphis, TN, 1347–1358.
Anthony W S and Mayfield W D (editors) (1994), Agricultural Handbook 503, UnitedStates Department of Agriculture 377 pp.
Mangialardi G J, Jr. (1990), ‘Performance of air-type lint cleaners in reducing motes andseed-coat fragments’, Proc Beltwide Cotton Conf, National Cotton Council, Memphis,TN, 669–674.
Mangialardi G J, Jr. (1993), ‘Effect of lint cleaning at gins on market value and quality’,Applied Engineering in Agriculture, American Society of Agricultural Engineers, 9(4),365–371.
6.14 Lint cleaner equipped with louvers for selectively cleaningcotton.
Saw
Grid bar
Louver open
Louver open
Louver closed
Louver closed

Cotton: Science and technology202
Mangialardi G J, Jr. (1996), ‘Lint cleaning options to preserve fiber quality’, Applied
Engineering in Agriculture, American Society of Agricultural Engineers, 12(5), 555–562.
Mangialardi G J, Jr. and Anthony W S (1998), ‘Field evaluation of air and saw lintcleaning systems’, Journal of Cotton Science, 2 (1), 53–61.
Disclaimer
Mention of a trade name, proprietary product, or specific equipment doesnot constitute a guarantee or warranty by the United States Department ofAgriculture and does not imply approval of the product to the exclusion ofothers that may be available.

203
7.1 Introduction
When cotton and short-staple man-made fibres (MMFs) are delivered to aspinning mill, they are usually received in the form of compressed, highdensity bales of 1.5 m ¥ 0.5 m ¥ 0.5 m in dimensions, weighing 230–250 kg,and of 613 kg m–3 density. A typical production rate for, say, a medium sizemill would be of the order of 500 kg hr–1. This means that the equivalent ofone bale of fibre would need to be processed every 1/2 hour. Depending onthe fineness, length and density of the fibre type to be converted to yarn, thebale can comprise 1.5 to 50 ¥ 109 fibres (50 billion); this calculates toapproximately 30 million fibres per second removed from the baled stock.The most practical way of doing this is to remove clumps or tufts of fibresfrom the bale and then progressively reduce the size of these tufts intosmaller tufts or tuftlets ultimately reaching the state of a collection ofindividual fibres which can be subsequently spun to make the required yarn.Therefore, in preparing materials for spinning, the primary purpose of blowroomoperations is to convert the baled fibre mass into the individual fibre stateand assemble the fibres in a suitable form for subsequent processing by theintermediate processing stages to spinning. The individual fibres state isessential because these post-blowroom stages require the material to be alinear mass of disentangled fibres, so that fibres can be made to slide pasteach other in order to uniformly reduce the linear density of the mass.During this action fibre friction straightens and parallelises the fibres in thecross-section of the reduced linear mass prior to it being twisted to makeyarn.
The action of breaking the baled fibre mass down into initially large andthen smaller size tufts (tuflets) is termed opening (fibre opening) and theconverting of small size tufts into individual fibres is called carding. Withnatural fibres such as cotton, the baled fibre mass will contain impurities,such as leaf, seed, trash and dust particles. It is essential that as much aspossible of the impurities are removed so as to produce yarns of high quality.
7The opening, blending, cleaning, and
carding of cotton
C L A W R E N C E, University of Leeds, UK

Cotton: Science and technology204
Although certain of the post-blowroom processes can remove impurities, theopening and carding actions of the blowroom machines enable most of theimpurities to be extracted at these early stages. We therefore refer to the termcleaning as the removal of impurities from fibre tufts during opening andcarding.
When the baled fibre mass is to be opened into small tufts a sequence ofmachines is used to perform this task and as they can also carry out cleaningof the tufts, the machine sequence is called an opening and cleaning line;machines making up such a line are generally referred to as opening andcleaning machines. In the progressive opening of the fibre mass, tufts fromone machine are fed to the next in the series for further opening. This isachieved by airflow through pipe ducting linking the machines and is describedas pneumatic transport. The tufts are effectively blown from one machine tothe next in line, hence the term ‘the blowroom’.
As the tufts arrive at a machine they are collected in a bin or hopper toform a new assembled mass of tufts which is then worked on by themachine. The opportunity therefore arises for tufts to be mixed or blended asthey are being collected to form the assembled mass. Thus, tufts from differentbales and different parts of a bale can be blended. This is an essential part ofthe blowroom process, since fibres at different regions of a bale will havenoticeable differences in their properties, particularly natural fibres like cottonwhere maturity, length, strength and elongation may differ. Unless tufts arewell blended, the difference in fibre properties can result in poor processingperformance upstream from the blowroom, such as high end breakage ratesin spinning, and in a lower quality of the resultant yarn, e.g., lower yarnstrength and evenness. We speak therefore of blowroom blending as themixing of opened fibrous tufts to produce a homogeneous mass which facilitatesconsistent yarn quality. The word ‘facilitate’ is important here, because otherprocess factors can also cause lower yarn quality and reduced productionefficiency.
Once the fibre mass is suitably opened, cleaned and blended it arrives atthe carding machine and here the tufts are descretised into individual fibreswhich are reassembled into the form of a twistless rope of disentangledfibres, i.e. a linear mass of fibres held together largely by interfibre friction.This form of fibre mass is called a carded sliver and is coiled into large cans(card sliver cans) ready for the upstream processes. At one time the cardingprocess was housed separately from the earlier opening and cleaning machines.Then the fibre mass was fed in the form of laps to the card. Modern millsnow tend to have these machines in the same location with pneumatic transportof tufts to the cards. Figure 7.1 illustrates a typical machine sequence involvingopening, cleaning, blending and carding and Fig. 7.2 gives a flowchartindicating the function of each stage.
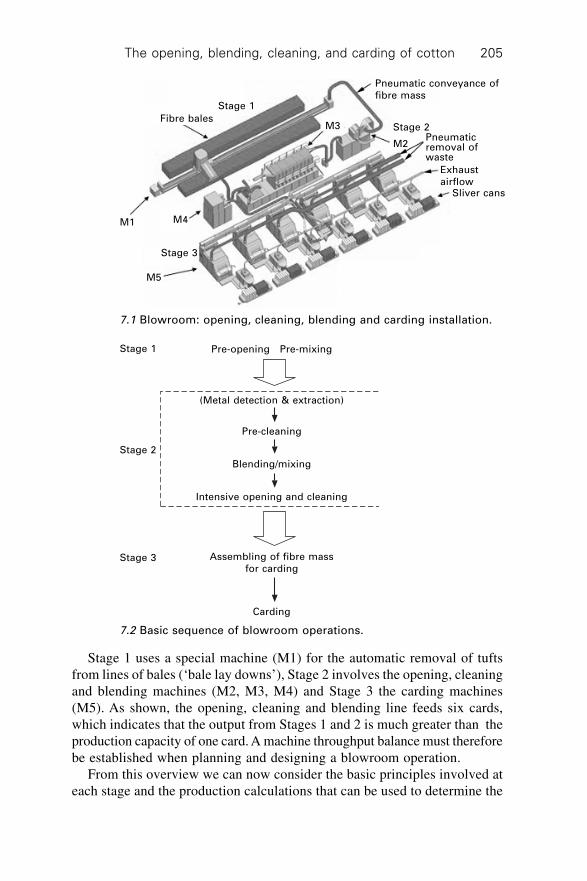
The opening, blending, cleaning, and carding of cotton 205
Stage 1 uses a special machine (M1) for the automatic removal of tuftsfrom lines of bales (‘bale lay downs’), Stage 2 involves the opening, cleaningand blending machines (M2, M3, M4) and Stage 3 the carding machines(M5). As shown, the opening, cleaning and blending line feeds six cards,which indicates that the output from Stages 1 and 2 is much greater than theproduction capacity of one card. A machine throughput balance must thereforebe established when planning and designing a blowroom operation.
From this overview we can now consider the basic principles involved ateach stage and the production calculations that can be used to determine the
Pre-opening Pre-mixing
(Metal detection & extraction)
Pre-cleaning
Blending/mixing
Intensive opening and cleaning
Assembling of fibre massfor carding
Carding
Stage 1
Stage 2
Stage 3
7.2 Basic sequence of blowroom operations.
Sliver cans
M2
M3 Stage 2
Stage 1
Fibre bales
M4M1
M5
Stage 3
7.1 Blowroom: opening, cleaning, blending and carding installation.
Pneumatic conveyance offibre mass
Pneumaticremoval ofwaste
Exhaustairflow
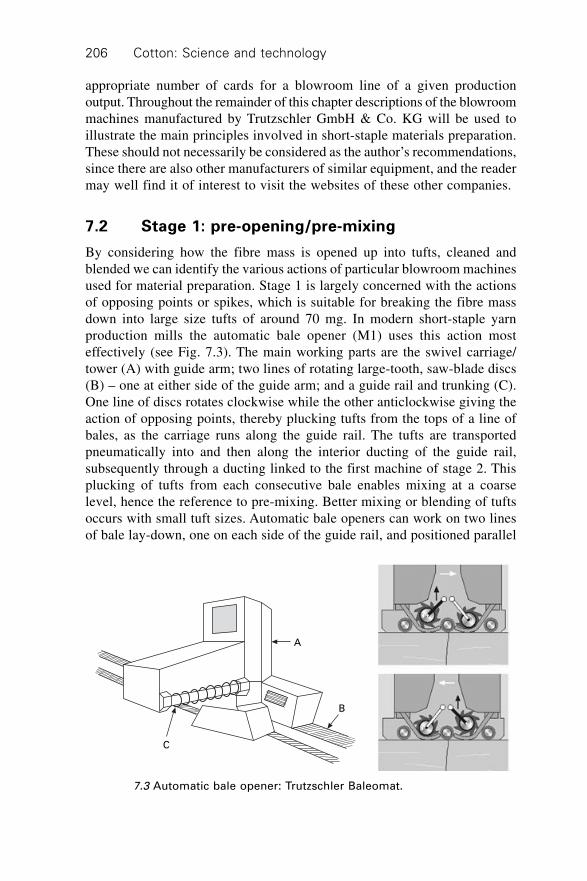
Cotton: Science and technology206
appropriate number of cards for a blowroom line of a given productionoutput. Throughout the remainder of this chapter descriptions of the blowroommachines manufactured by Trutzschler GmbH & Co. KG will be used toillustrate the main principles involved in short-staple materials preparation.These should not necessarily be considered as the author’s recommendations,since there are also other manufacturers of similar equipment, and the readermay well find it of interest to visit the websites of these other companies.
7.2 Stage 1: pre-opening/pre-mixing
By considering how the fibre mass is opened up into tufts, cleaned andblended we can identify the various actions of particular blowroom machinesused for material preparation. Stage 1 is largely concerned with the actionsof opposing points or spikes, which is suitable for breaking the fibre massdown into large size tufts of around 70 mg. In modern short-staple yarnproduction mills the automatic bale opener (M1) uses this action mosteffectively (see Fig. 7.3). The main working parts are the swivel carriage/tower (A) with guide arm; two lines of rotating large-tooth, saw-blade discs(B) – one at either side of the guide arm; and a guide rail and trunking (C).One line of discs rotates clockwise while the other anticlockwise giving theaction of opposing points, thereby plucking tufts from the tops of a line ofbales, as the carriage runs along the guide rail. The tufts are transportedpneumatically into and then along the interior ducting of the guide rail,subsequently through a ducting linked to the first machine of stage 2. Thisplucking of tufts from each consecutive bale enables mixing at a coarselevel, hence the reference to pre-mixing. Better mixing or blending of tuftsoccurs with small tuft sizes. Automatic bale openers can work on two linesof bale lay-down, one on each side of the guide rail, and positioned parallel
A
B
C
7.3 Automatic bale opener: Trutzschler Baleomat.

The opening, blending, cleaning, and carding of cotton 207
to the guide rail. Each line can be up to three bales wide and 100 or morebales in length. As the carriage reaches the end of a line, it swivels and startsplucking the bales in the other line. The carriage traverse can be 6–13 m perminute, giving a production rate of up to 1500 kg h–1.
It should be evident that bales of different cotton grades or fibre types(cotton + viscose or cotton + polyester) could be positioned to make up thelines and in so doing, get a useful pre-mixing for the eventual production of‘blended yarns’. Process waste with high fibre content (usually from theintermediate process to spinning, up-stream of the blowroom) may be recycledby feeding into the process line around 5% of waste with the virgin fibre. Awaste feeder is illustrated in Fig. 7.4. Here the fibrous waste is fed from thehopper by the spike lattice (A) and belt (B) to the fast rotating spike roller(C) which separates the fibre mass into tufts. Since the waste is usually madeup of fibres that have previously passed through the blowroom, it is importantto keep further mechanical treatment to a minimum, so as to reduce fibrebreakage. The waste tufts therefore may be fed directly to the blending unitof Stage 2 provided no heavy foreign particles are contained within it.
7.3 Stage 2 heavy particle detection and extraction
The first machine in stage – 2, called the multifunctional separator, is onewhich separates heavy foreign particles and dust from fibre tufts deliveredby the automatic bale opener and waste opener. These particles are liberatedfrom the fibre as the mass of the bale is broken down into tufts. The tufts areof a lower density than the heavy foreign particles, and fibres forming thetufts also have a greater surface area to weigh ratio. Therefore, the airflowtransporting the material through the machine can be used to effect theremoval of the unwanted particles; we may refer to this as the action of aircurrents. There are two approaches by which the action of air currents isutilised (see Fig. 7.5).
B C
D
A
Waste fibre
7.4 Waste fibre feeder.

Cotton: Science and technology208
Tufts (1) from the automatic bale opener and tufts (14) from the wasteopener are sucked into the multifunctional separator by a fan (2). The arrowsindicate the flow path of the tufts. The small black dashes represent theheavy trash particles and the black dots metallic fragments embedded insome tufts. These fragments may result from damaged machine parts duringthe harvesting and ginning of cotton.
The first action of air currents occurs at (3) where the flow path splits intotwo; the material being prevented from moving along the lower path. Sincethe airflow rate is constant through this section of the machine, the splittingof the path means a slower flow in the upper path. The bends of 90∞ anglegive a sudden change of direction to the airflow. The lift due to the combinedairflow from both flow paths is sufficiently larger than the momentum andgravitational force on each tuft to move tufts in the changed direction. However,the airdrag is not greater than the opposing momentum and gravitationalforce on the more dense foreign particles. Consequently these drop from theairflow and are collected via a trap door (9) into a waste bin (10), whilst theliberated dust and trash particles remain in the airflow.
The second action of air currents occurs at (5). Here a perforated metalsheet or wire mesh enables the dust particles in the flow to be removedthrough (13); the dusty exhausted air is fed to a filter installation. Smallpieces of metallic materials may remain trapped within some tufts, in which
8
7
10
12
11
6
13
5
42
14
1
3
9
10
7.5 Multifunction Separator.

The opening, blending, cleaning, and carding of cotton 209
case these are detected by sensors at (6), and a diverter (7) (a swing flap)momentarily changes the direction of flow so that these fufts can be ejectedto waste. The remaining fibre tufts subsequently exit through (8) to theopening/pre-cleaning unit.
With combustible materials, there is always the possibility of tufts beingignited from sparks caused by metal particles impacting on the sides of theair trunking. Burning or smouldering tufts will need to be removed beforereaching the opening/pre-cleaning stage. A detector (4) signals the diverter(7) to redirect any ignited material to the waste bin (10). A fire extinguisher(11) and heat sensor (12) are fitted safety provisions for any burning materialentering the waste container. Figure 7.6 shows the remaining sequence ofmachines in Stage 2 following the multifunctional separator.
7.3.1 Stage 2 pre-cleaning
The opener/pre-cleaner (see Fig. 7.7) is comprised of a wire-mesh cylindricaldrum, termed a condenser (1), a feed trunk (2), a cleaning compartment (3),beaters and grid bars (4), an exit suction trunking (5) and a waste removaldevice (6). The arrows indicate the flow of the tufts.
The condenser fulfils two functions. It removes dust particles in the airstream and from the surface of the tufts as they are ‘condensed’ onto it. Second,its rotation transports the tufts into the feed trunk, which is positioned toensure tangential feeding to the left beater or cleaning roll. The two beatersare basically cylindrical rolls with metal rods projecting from the roller surface.
When the fibre mass of a large tuft is opened into smaller tufts (approx.8 mg) by the beaters, fibres in one part of the mass will slide past fibres inanother part. The interfibre friction will liberate dust particles attached tofibre surfaces and importantly will move trash particles to the surface of thesmaller tufts. These particles cling to the surface fibres and to remove them,the tufts are thrown against (and pulled over) narrowly spaced bars (gridbars) so that the impact shakes the particles from the tufts and ejects them
6 5 4 3 2 1
1 Multifunctional separator2 Pre-cleaner3 Booster fan4 Stack blender5 Intensive opener/cleaner6 Foreign particle separator
7.6 Sequence of machines comprising Stage 2.
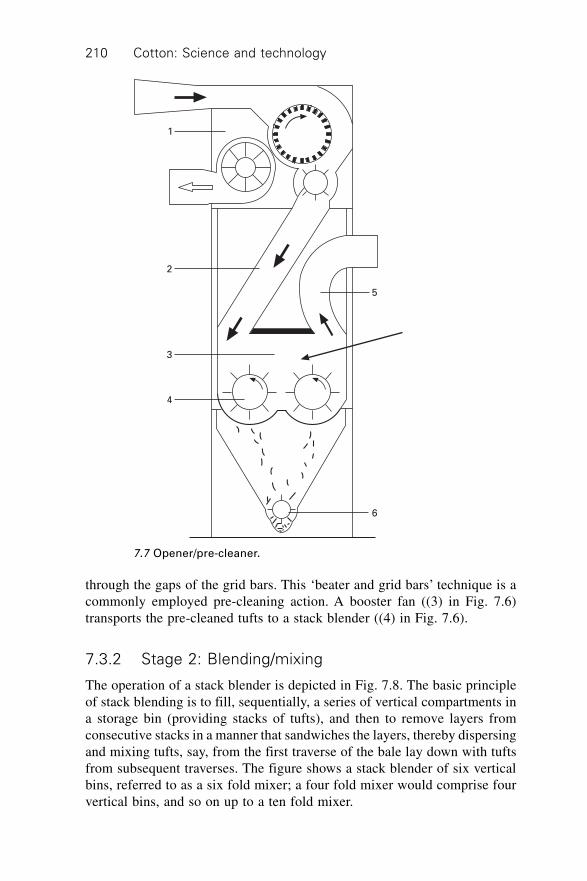
Cotton: Science and technology210
through the gaps of the grid bars. This ‘beater and grid bars’ technique is acommonly employed pre-cleaning action. A booster fan ((3) in Fig. 7.6)transports the pre-cleaned tufts to a stack blender ((4) in Fig. 7.6).
7.3.2 Stage 2: Blending/mixing
The operation of a stack blender is depicted in Fig. 7.8. The basic principleof stack blending is to fill, sequentially, a series of vertical compartments ina storage bin (providing stacks of tufts), and then to remove layers fromconsecutive stacks in a manner that sandwiches the layers, thereby dispersingand mixing tufts, say, from the first traverse of the bale lay down with tuftsfrom subsequent traverses. The figure shows a stack blender of six verticalbins, referred to as a six fold mixer; a four fold mixer would comprise fourvertical bins, and so on up to a ten fold mixer.
5
6
1
2
3
4
7.7 Opener/pre-cleaner.
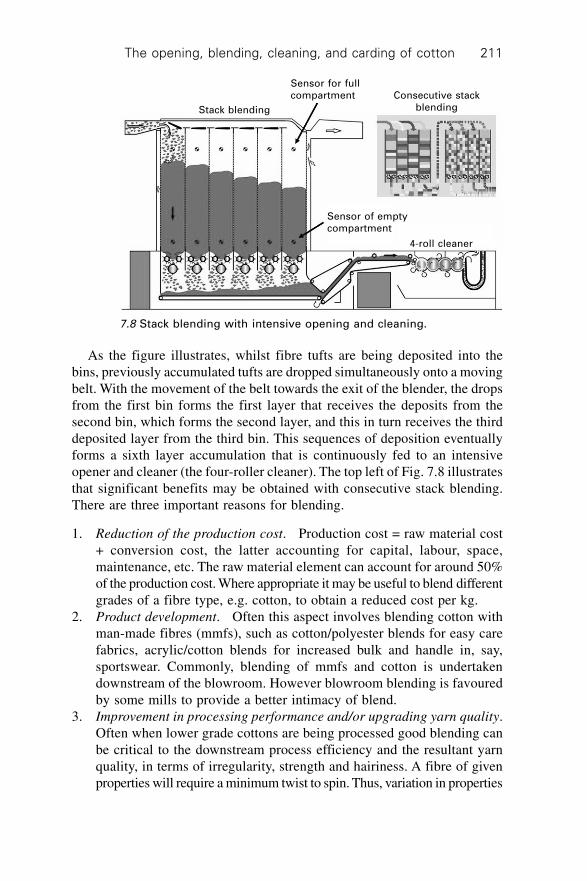
The opening, blending, cleaning, and carding of cotton 211
As the figure illustrates, whilst fibre tufts are being deposited into thebins, previously accumulated tufts are dropped simultaneously onto a movingbelt. With the movement of the belt towards the exit of the blender, the dropsfrom the first bin forms the first layer that receives the deposits from thesecond bin, which forms the second layer, and this in turn receives the thirddeposited layer from the third bin. This sequences of deposition eventuallyforms a sixth layer accumulation that is continuously fed to an intensiveopener and cleaner (the four-roller cleaner). The top left of Fig. 7.8 illustratesthat significant benefits may be obtained with consecutive stack blending.There are three important reasons for blending.
1. Reduction of the production cost. Production cost = raw material cost+ conversion cost, the latter accounting for capital, labour, space,maintenance, etc. The raw material element can account for around 50%of the production cost. Where appropriate it may be useful to blend differentgrades of a fibre type, e.g. cotton, to obtain a reduced cost per kg.
2. Product development. Often this aspect involves blending cotton withman-made fibres (mmfs), such as cotton/polyester blends for easy carefabrics, acrylic/cotton blends for increased bulk and handle in, say,sportswear. Commonly, blending of mmfs and cotton is undertakendownstream of the blowroom. However blowroom blending is favouredby some mills to provide a better intimacy of blend.
3. Improvement in processing performance and/or upgrading yarn quality.Often when lower grade cottons are being processed good blending canbe critical to the downstream process efficiency and the resultant yarnquality, in terms of irregularity, strength and hairiness. A fibre of givenproperties will require a minimum twist to spin. Thus, variation in properties
4-roll cleaner
Consecutive stackblendingStack blending
Sensor of emptycompartment
Sensor for fullcompartment
7.8 Stack blending with intensive opening and cleaning.
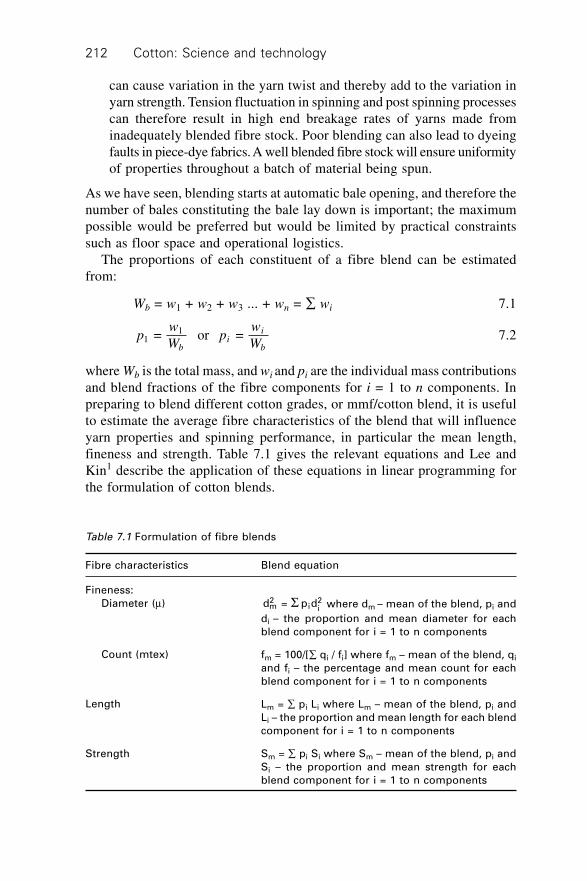
Cotton: Science and technology212
can cause variation in the yarn twist and thereby add to the variation inyarn strength. Tension fluctuation in spinning and post spinning processescan therefore result in high end breakage rates of yarns made frominadequately blended fibre stock. Poor blending can also lead to dyeingfaults in piece-dye fabrics. A well blended fibre stock will ensure uniformityof properties throughout a batch of material being spun.
As we have seen, blending starts at automatic bale opening, and therefore thenumber of bales constituting the bale lay down is important; the maximumpossible would be preferred but would be limited by practical constraintssuch as floor space and operational logistics.
The proportions of each constituent of a fibre blend can be estimatedfrom:
Wb = w1 + w2 + w3 ... + wn = Â wi 7.1
pw
Wp
w
Wbi
i
b1
1 = or = 7.2
where Wb is the total mass, and wi and pi are the individual mass contributionsand blend fractions of the fibre components for i = 1 to n components. Inpreparing to blend different cotton grades, or mmf/cotton blend, it is usefulto estimate the average fibre characteristics of the blend that will influenceyarn properties and spinning performance, in particular the mean length,fineness and strength. Table 7.1 gives the relevant equations and Lee andKin1 describe the application of these equations in linear programming forthe formulation of cotton blends.
Table 7.1 Formulation of fibre blends
Fibre characteristics Blend equation
d = p dm
2i i
2S where dm – mean of the blend, pi and
di – the proportion and mean diameter for each
blend component for i = 1 to n components
fm = 100/[Â qi / fi] where fm – mean of the blend, qi
and fi – the percentage and mean count for each
blend component for i = 1 to n components
Lm = Â pi Li where Lm – mean of the blend, pi and
Li – the proportion and mean length for each blend
component for i = 1 to n components
Sm = Â pi Si where Sm – mean of the blend, pi and
Si – the proportion and mean strength for each
blend component for i = 1 to n components
Fineness:
Diameter (m)
Count (mtex)
Length
Strength
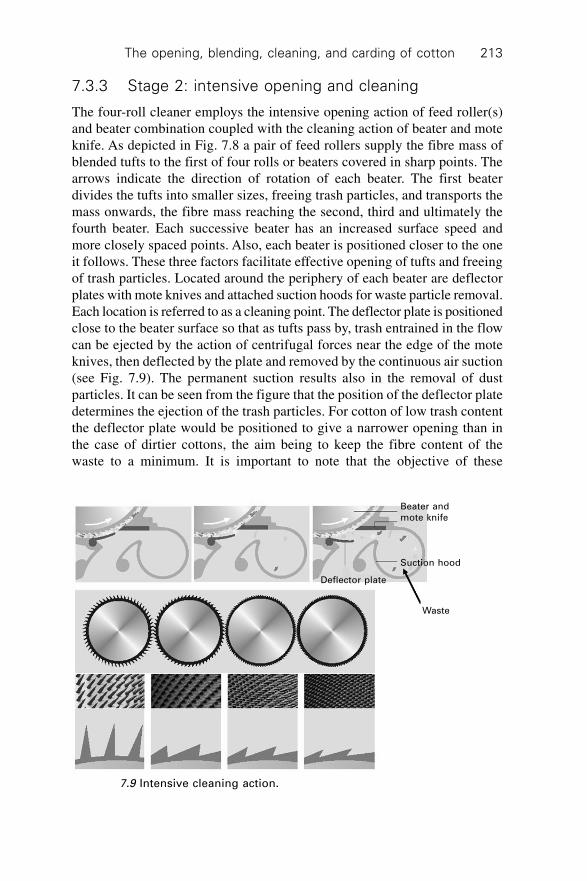
The opening, blending, cleaning, and carding of cotton 213
7.3.3 Stage 2: intensive opening and cleaning
The four-roll cleaner employs the intensive opening action of feed roller(s)and beater combination coupled with the cleaning action of beater and moteknife. As depicted in Fig. 7.8 a pair of feed rollers supply the fibre mass ofblended tufts to the first of four rolls or beaters covered in sharp points. Thearrows indicate the direction of rotation of each beater. The first beaterdivides the tufts into smaller sizes, freeing trash particles, and transports themass onwards, the fibre mass reaching the second, third and ultimately thefourth beater. Each successive beater has an increased surface speed andmore closely spaced points. Also, each beater is positioned closer to the oneit follows. These three factors facilitate effective opening of tufts and freeingof trash particles. Located around the periphery of each beater are deflectorplates with mote knives and attached suction hoods for waste particle removal.Each location is referred to as a cleaning point. The deflector plate is positionedclose to the beater surface so that as tufts pass by, trash entrained in the flowcan be ejected by the action of centrifugal forces near the edge of the moteknives, then deflected by the plate and removed by the continuous air suction(see Fig. 7.9). The permanent suction results also in the removal of dustparticles. It can be seen from the figure that the position of the deflector platedetermines the ejection of the trash particles. For cotton of low trash contentthe deflector plate would be positioned to give a narrower opening than inthe case of dirtier cottons, the aim being to keep the fibre content of thewaste to a minimum. It is important to note that the objective of these
7.9 Intensive cleaning action.
Waste
Deflector plate
Suction hood
Beater andmote knife

Cotton: Science and technology214
cleaning systems is the intensive, but gentle opening of the fibre tufts inorder to minimise fibre damage.
Gentle opening is achieved by having the first beater clothed in pinsangled ca. 10∞ from the vertical, and the remaining beaters having saw-toothclothing, the tooth angle increasing from roller to roller (e.g. 15∞, 30∞, 40∞).The teeth density (number of points per cm2) should also progressivelyincrease from beater 1 to 4, depending on fineness of the fibre being produced.Importantly, the beater speeds should progressively increase from beater 1 to4 (for example 300, 500, 800, 1200, rmin–1). Hence, the mean tuft size isdecreased (approximate figures) from 1 mg by the first beater to 0.7 mg,0.5 mg and 0.1 mg by the second, third and fourth beaters, respectively. It isonly the fourth beater that reaches a sufficiently high surface speed at whichthe finest trash particles are ejected.
The final cleaning machine in Stage 2, is the foreign particle separator,indicated as M4 in Fig. 7.1. Foreign particles often include pigment colouredpolypropylene bale straps, which get broken down into fine fibre fragmentsduring carding. This results in yarns produced being rejected owing to materialcontamination. At this part of the blowroom the aim is to significantly reducethe dust still present within the mass flow, but critically also, to detect andremove particle contamination of the fibre mass. Figure 7.10 illustrates howthis is achieved.
8
F
86
5
7
4
21
3
10
10
9
7.10 Foreign particle separator.

The opening, blending, cleaning, and carding of cotton 215
The white arrows indicate the direction of the airflow through the machine,and the black arrows depict the fibre mass flow. The dedusting section (1) isscreened by a large perforated metal sheet (2). Distribution flaps (3) spreadthe tufts over the surface area of (2) and the dust released is sucked away via(4). The tufts fall into a reserve chute and the mass of material is fed by a pairof sawtooth rollers to a beater (5) covered in fine pins. The tufts, whencaught by the beater, become lightly and uniformly spread over the beatersurface. Four fluorescent lamps (6) give high but uniform illumination of thebeater surface. Two digital cameras continuously scan the beater surface. Ondetection of a contaminated part of the fibre mass (F) a bank of compressedair nozzles (8) are selectively activated to blow the contaminated part of thefibre mass from the beater surface into a waste suction unit (9). The fibremass is therefore screened to be free of material contaminants. The tufts aretransported through the machine by airflow generated from two integratedfans (10), and the fan at the exit blows the screened tufts through the trunkingto the carding machines of Stage 2.
7.3.4 Estimation of the effectiveness of opening andcleaning systems
Intensity of opening, I
To assess the opening action of a beater we refer to its intensity of opening,I. This can be defined as the amount of fibrous mass in mg per one striker ofa beater for a preset production rate and beater speed.2 Thus,
IP
n Nb
= 10
60
6◊7.3
where I = intensity of opening (mg) P = production rate (kg hr–1);nb = beater speed (rmin–1); N = number of strikers.
The intensity of opening is an estimate of the tuft size produced by agiven beater and from the I value we can get an approximation of the numberof fibres, nf, comprising a tuft produced by a given beater.
nI
L Tff f
= 105◊◊ 7.4
where Lf = average fibre length (cm); Tf = average fibre linear density (millitex).An alternative to tuft size is the number of blows per kg, Nk.
NP
n Nk b = 1 [60 ]◊ ◊ 7.5
Although the I or Nk value gives an indication of the degree of treatment, inthat the more blows per kg of material the smaller the tuft size and the moretrash likely to be removed, the calculation does not take account of the effect
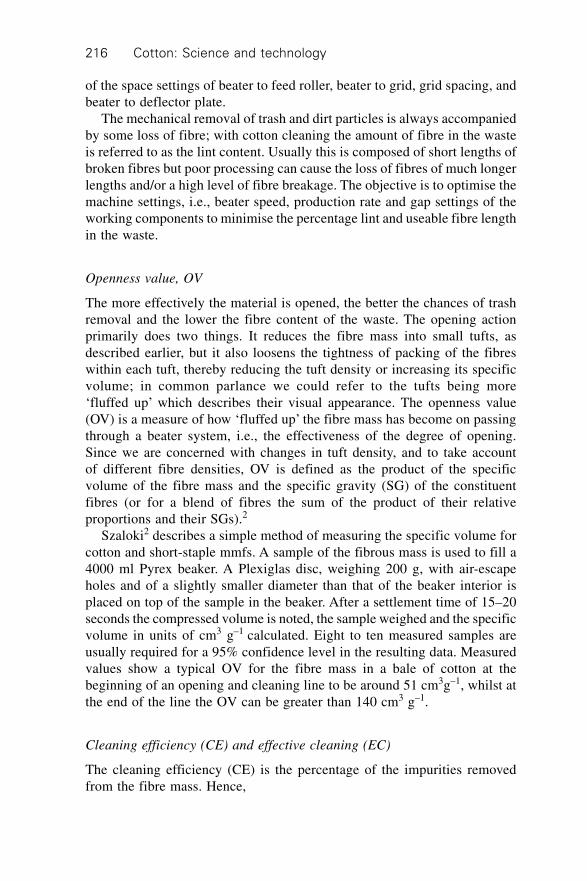
Cotton: Science and technology216
of the space settings of beater to feed roller, beater to grid, grid spacing, andbeater to deflector plate.
The mechanical removal of trash and dirt particles is always accompaniedby some loss of fibre; with cotton cleaning the amount of fibre in the wasteis referred to as the lint content. Usually this is composed of short lengths ofbroken fibres but poor processing can cause the loss of fibres of much longerlengths and/or a high level of fibre breakage. The objective is to optimise themachine settings, i.e., beater speed, production rate and gap settings of theworking components to minimise the percentage lint and useable fibre lengthin the waste.
Openness value, OV
The more effectively the material is opened, the better the chances of trashremoval and the lower the fibre content of the waste. The opening actionprimarily does two things. It reduces the fibre mass into small tufts, asdescribed earlier, but it also loosens the tightness of packing of the fibreswithin each tuft, thereby reducing the tuft density or increasing its specificvolume; in common parlance we could refer to the tufts being more‘fluffed up’ which describes their visual appearance. The openness value(OV) is a measure of how ‘fluffed up’ the fibre mass has become on passingthrough a beater system, i.e., the effectiveness of the degree of opening.Since we are concerned with changes in tuft density, and to take accountof different fibre densities, OV is defined as the product of the specificvolume of the fibre mass and the specific gravity (SG) of the constituentfibres (or for a blend of fibres the sum of the product of their relativeproportions and their SGs).2
Szaloki2 describes a simple method of measuring the specific volume forcotton and short-staple mmfs. A sample of the fibrous mass is used to fill a4000 ml Pyrex beaker. A Plexiglas disc, weighing 200 g, with air-escapeholes and of a slightly smaller diameter than that of the beaker interior isplaced on top of the sample in the beaker. After a settlement time of 15–20seconds the compressed volume is noted, the sample weighed and the specificvolume in units of cm3 g–1 calculated. Eight to ten measured samples areusually required for a 95% confidence level in the resulting data. Measuredvalues show a typical OV for the fibre mass in a bale of cotton at thebeginning of an opening and cleaning line to be around 51 cm3g–1, whilst atthe end of the line the OV can be greater than 140 cm3 g–1.
Cleaning efficiency (CE) and effective cleaning (EC)
The cleaning efficiency (CE) is the percentage of the impurities removedfrom the fibre mass. Hence,

The opening, blending, cleaning, and carding of cotton 217
CEW W
WIN O
IN
= 100[ – ]
7.6
where WIN and WO are the mass values of the impurities in the feedstock andthe processed material, respectively at the input and output to a machine ora sequence of machines, and CE is the cleaning efficiency.
As referred to earlier, some unavoidable fibre loss occurs during mechanicalcleaning. When considering this fibre loss we can refer to the effectivecleaning (EC) of a machine or a sequence of machines as
ECW W
WT F
T
= 100[ – ]
7.7
WT = mass of waste; WF = mass fibre in the waste.
7.4 Stage 3: carding
7.4.1 Basic principle of carding
Carding involves:
∑ dividing tufts into smaller sizes, termed tuflets∑ separating each tuftlet into individual fibres to form a filmy web, by
working the tuftlets between closely spaced surfaces covered in sharpopposing points
∑ consolidating the web into a continuous length having the form of anuntwisted rope, called a card sliver
∑ removing trash, fibre fragments, very short fibres and neps during thereduction of tufts into tuftlets and tuftlets into individual fibres.
7.4.2 Key features and operation of the revolving flatcard
Figure 7.11 illustrates the main working components of a revolving flat cardand Table 7.2 gives typical operational speeds and settings. The cardingmachine is comprised of four sub-systems or four zones.
∑ Zone I: the feed arrangement; commonly referred to as the chute feed, itcomprises an inlet chute, A, linked to the outlet of Stage 2 (i.e. thetrunking connecting the foreign particles separator); a feed roller andpin covered beater, B; and a pair of air outlet combs, C.
∑ Zone II: the taker-in and fibre mass transfer; this consists of a feed rollerand spring-loaded feed plate, three beaters, D, called a triple taker-insystem, and a fixed-flats cleaning system, F.
∑ Zone III: the carding zone; this includes the carding cylinder with its
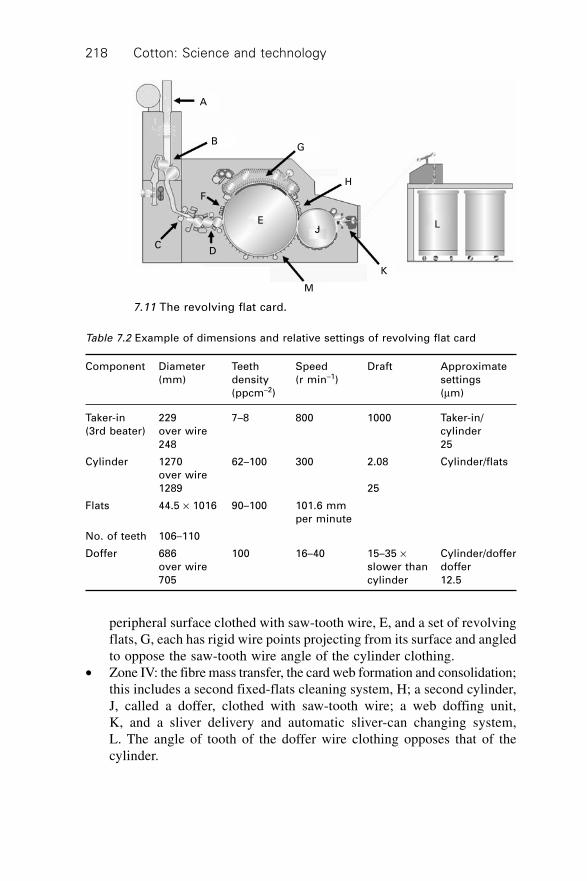
Cotton: Science and technology218
peripheral surface clothed with saw-tooth wire, E, and a set of revolvingflats, G, each has rigid wire points projecting from its surface and angledto oppose the saw-tooth wire angle of the cylinder clothing.
∑ Zone IV: the fibre mass transfer, the card web formation and consolidation;this includes a second fixed-flats cleaning system, H; a second cylinder,J, called a doffer, clothed with saw-tooth wire; a web doffing unit,K, and a sliver delivery and automatic sliver-can changing system,L. The angle of tooth of the doffer wire clothing opposes that of thecylinder.
Table 7.2 Example of dimensions and relative settings of revolving flat card
Component Diameter Teeth Speed Draft Approximate
(mm) density (r min–1) settings
(ppcm–2) (mm)
Taker-in 229 7–8 800 1000 Taker-in/
(3rd beater) over wire cylinder
248 25
Cylinder 1270 62–100 300 2.08 Cylinder/flats
over wire
1289 25
Flats 44.5 ¥ 1016 90–100 101.6 mm
per minute
No. of teeth 106–110
Doffer 686 100 16–40 15–35 ¥ Cylinder/doffer
over wire slower than doffer
705 cylinder 12.5
L
A
BG
H
K
M
JE
D
F
C
7.11 The revolving flat card.
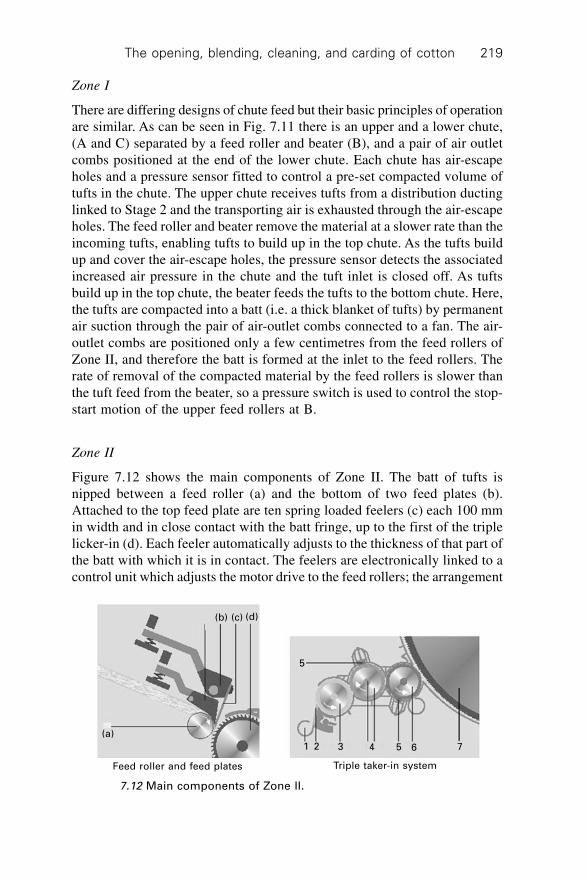
The opening, blending, cleaning, and carding of cotton 219
Zone I
There are differing designs of chute feed but their basic principles of operationare similar. As can be seen in Fig. 7.11 there is an upper and a lower chute,(A and C) separated by a feed roller and beater (B), and a pair of air outletcombs positioned at the end of the lower chute. Each chute has air-escapeholes and a pressure sensor fitted to control a pre-set compacted volume oftufts in the chute. The upper chute receives tufts from a distribution ductinglinked to Stage 2 and the transporting air is exhausted through the air-escapeholes. The feed roller and beater remove the material at a slower rate than theincoming tufts, enabling tufts to build up in the top chute. As the tufts buildup and cover the air-escape holes, the pressure sensor detects the associatedincreased air pressure in the chute and the tuft inlet is closed off. As tuftsbuild up in the top chute, the beater feeds the tufts to the bottom chute. Here,the tufts are compacted into a batt (i.e. a thick blanket of tufts) by permanentair suction through the pair of air-outlet combs connected to a fan. The air-outlet combs are positioned only a few centimetres from the feed rollers ofZone II, and therefore the batt is formed at the inlet to the feed rollers. Therate of removal of the compacted material by the feed rollers is slower thanthe tuft feed from the beater, so a pressure switch is used to control the stop-start motion of the upper feed rollers at B.
Zone II
Figure 7.12 shows the main components of Zone II. The batt of tufts isnipped between a feed roller (a) and the bottom of two feed plates (b).Attached to the top feed plate are ten spring loaded feelers (c) each 100 mmin width and in close contact with the batt fringe, up to the first of the triplelicker-in (d). Each feeler automatically adjusts to the thickness of that part ofthe batt with which it is in contact. The feelers are electronically linked to acontrol unit which adjusts the motor drive to the feed rollers; the arrangement
Feed roller and feed plates Triple taker-in system
(a)
(b) (c) (d)
5
7654321
7.12 Main components of Zone II.
Cotton: Science and technology220
is called an autoleveller. This means that if there is a variation in the battthickness (and therefore the fibre mass) across the width of the feed, this willbe detected and the speed of the feed roller adjusted (i.e. slowed for increasedthickness, speeded up for a thinner section) to allow the taker-in roller (d) tocontinuously remove a consistent fibre mass from the fringe of the battduring carding.
Figure 7.12 also shows the arrangement of the triple licker-in (3, 4 and 6)can be seen. The arrows indicate the direction of rotation of each licker-inbeater. The objective of the triple licker-in is similar to the four-roll cleanerdescribed above, but here the tufts are converted into very small tufts (i.e.tuftlets) and some individual fibres. That is to say, a higher degree of ‘gentle’opening, achieved by progressively increased beater speeds (up to say 1200rmin–1) as well as having finer and a higher density of pins on the first beater,followed by progressively finer and a higher density of saw-tooth wire clothingon the subsequent beaters. The result is tuftlet sizes of around 0.05 mgproduced by the first beater; 0.01 mg and 0.005 mg by the second and third;the latter may be referred to as micro-tuftlets. As shown in Fig. 7.12, thereare located around the periphery of each beater, deflector plates with moteknifes and attached suction hoods for waste particle removal, i.e., a series ofcleaning points. To assist the opening action of the beaters on the tuftlets andthereby the freeing of trapped fine trash particles, two plates (5) – termed‘combing segments or carding plates’ – fitted with a saw-tooth wire clothingare positioned so that the angle of the wire clothing opposes the rotatingsurfaces of the beaters.
The surface speed of the cylinder (7) in Zone 3 is usually twice thesurface speed of the third beater (6), and the saw-tooth wire clothing on thecylinder is of a greater working angle and a higher teeth density. The cylinderrotates in a clockwise direction to strip the tufts from the third beater, butsimultaneously reduces the tuft sizes to around 0.001 mg. The strippingaction is usually described as ‘point-of-tooth’ to ‘back-of-tooth’. That is, thepoint of a saw tooth on the cylinder (7) moving faster and past the back ofa saw tooth on the slower rotating third beater, thus stripping tuftlets fromthe latter (6).
The micro-tuftlets on the cylinder saw-tooth clothing now moves with therotation of the cylinder and meet the fixed flats cleaning system F (see Fig.7.11). These are called the back fixed flats and incorporated in the fixed flatsunit is a separator knife edge and suction unit, which has a similar purposeto a mote knife for removing dust and trash particles. They also tend toorientate and elongate the fibres of the micro-tuftlets along the direction ofcylinder rotation.3 This facilitates the individualisation of the fibres duringthe carding action in Zone III.
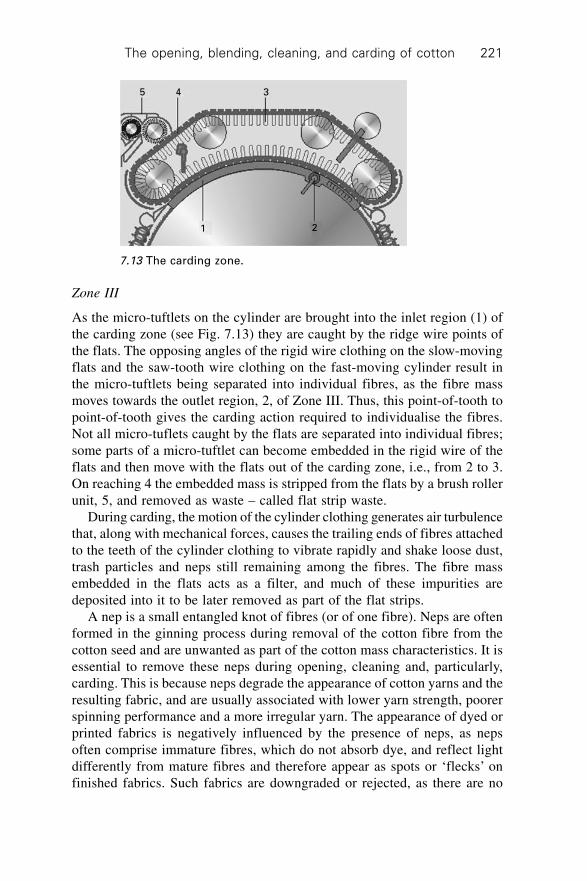
The opening, blending, cleaning, and carding of cotton 221
Zone III
As the micro-tuftlets on the cylinder are brought into the inlet region (1) ofthe carding zone (see Fig. 7.13) they are caught by the ridge wire points ofthe flats. The opposing angles of the rigid wire clothing on the slow-movingflats and the saw-tooth wire clothing on the fast-moving cylinder result inthe micro-tuftlets being separated into individual fibres, as the fibre massmoves towards the outlet region, 2, of Zone III. Thus, this point-of-tooth topoint-of-tooth gives the carding action required to individualise the fibres.Not all micro-tuflets caught by the flats are separated into individual fibres;some parts of a micro-tuftlet can become embedded in the rigid wire of theflats and then move with the flats out of the carding zone, i.e., from 2 to 3.On reaching 4 the embedded mass is stripped from the flats by a brush rollerunit, 5, and removed as waste – called flat strip waste.
During carding, the motion of the cylinder clothing generates air turbulencethat, along with mechanical forces, causes the trailing ends of fibres attachedto the teeth of the cylinder clothing to vibrate rapidly and shake loose dust,trash particles and neps still remaining among the fibres. The fibre massembedded in the flats acts as a filter, and much of these impurities aredeposited into it to be later removed as part of the flat strips.
A nep is a small entangled knot of fibres (or of one fibre). Neps are oftenformed in the ginning process during removal of the cotton fibre from thecotton seed and are unwanted as part of the cotton mass characteristics. It isessential to remove these neps during opening, cleaning and, particularly,carding. This is because neps degrade the appearance of cotton yarns and theresulting fabric, and are usually associated with lower yarn strength, poorerspinning performance and a more irregular yarn. The appearance of dyed orprinted fabrics is negatively influenced by the presence of neps, as nepsoften comprise immature fibres, which do not absorb dye, and reflect lightdifferently from mature fibres and therefore appear as spots or ‘flecks’ onfinished fabrics. Such fabrics are downgraded or rejected, as there are no
1 2
345
7.13 The carding zone.

Cotton: Science and technology222
cost-effective means of covering or removing the neps once they are presentin the fabric.
Zone IV
In the outlet region of Zone III, the individual fibres attached to the cylinderclothing collectively appear as a very lightweight web on the cylinder surface.This web moves with the cylinder rotation and comes into contact with thefront fixed flats cleaning system, H (Fig. 7.11), which further extracts nepsand fine trash particles. After the cleaning system, the web reaches the dofferclothing and this removes the fibres from the cylinder. Thus, the point-of-tooth to point-of-tooth of the cylinder and doffer wires gives a strippingaction. This cylinder-doffer area is called the transfer zone, as the objectiveis for fibres to be transferred from the cylinder to the doffer. Since thesurface speed of the cylinder is much faster than the doffer (see Table 7.2)there is a build up of fibres on the doffer, forming a thicker, heavier web offibres (the doffer web) than that on the cylinder. The rotation of the dofferbrings this web to the front of the card where it is removed (as the card web)by a wire-covered stripping roller (see Fig. 7.14) and passed through a pairof pressure rollers before being condensed into a sliver and wound into asliver can (see Fig. 7.11). The pressure rollers are used to crush trash particlessuch as seed coat fragments that still may be present, attached to fibres in theweb; the crushed particles would then be removed during subsequent processingof the sliver.
Not all the fibres are stripped on first contact with the doffer; some remainon the cylinder for several cylinder rotations before being removed. The
7.14 Sliver formation.
2 4 5 6 7 8
3
1
1 – Doffer2 – Web stripping rollers3 – Web guide4 – Crush rollers5 – Card web6 – Sliver forming unit7 – Funnel8 – Calender rollers
The opening, blending, cleaning, and carding of cotton 223
cylinder under screen, M (Fig. 7.11), controls the boundary air layer at thecylinder surface to prevent the un-doffed fibres being ejected from the cylinderclothing during their motion from the doffer/cylinder area to the taker-in/cylinder area. There appears to be an optimum number of times fibres gothrough the transfer zone before being stripped by the doffer; too short ortoo long a dwell time on the cylinder impairs the quality of the card web.4
The fibre layer remaining on the cylinder is referred to as the recycling layerand on passing the third beater of the taker-in, this layer will thereforereceive a deposited layer of microtufts. The combination of the two layersis referred to as the cylinder load. After the carding action the cylinderload will be missing a proportion removed by the flats; that remaining on thecylinder should be in the individual fibre state, and as this is what is operatedon by the doffer, it may be termed the operational layer. The amount of fibretransferred from the cylinder load to the doffer is dependent on the fibretransfer coefficient. Factors determining the transfer coefficient include thecylinder and doffer speeds, type of saw-tooth wire, the set gap between thetwo rolls and the type of fibre being carded. Detailed consideration of theseissues form part of the more advanced theory of carding and the reader isreferred to reference 6.
Despite the fact that not all fibres are removed from the cylinder ontheir first pass through the transfer zone, there is continuity of mass flowwithin a few minutes of running, i.e., the rate of batt feed to the first taker-in equals the sum of the rate of waste accumulation and sliver productionrate. Strictly speaking, the assumption is made that the moisture contentof the fibres remains constant throughout the process and that the amountdust particles and fly (i.e fibre fragments) which cannot be collected isnegligibly small.
Drafts equations
Consider now the surface speeds of the main components moving the fibremass through the card, which eventually forms the sliver that is coiled intothe can. We can for simplicity ignore the speed of the flats because this onlygoverns the rate of removal of the flat strips from the carding zone. Based onthe above description of the operating principles,
Vf << Vt < Vc > Vd < Vs < Vcr = Va Vsc 7.8
Vf – feed roller, Vt – taker-in (i.e. speed of the third beater), Vc – cylinder,Vd – doffer, Vs – stripping roller, Vcr – crushing rolls, Vca – calender rollers,Vsc – coiler rollers (Units: m min–1).
The relation of these surface speeds shows that the fibre mass is subjectedto a sequence of drafts as it moves through the card. This means that althoughthere is conservation of mass, so that in a given period of time the total mass
Cotton: Science and technology224
of materials fed into the card emerges from it, the fibre mass is neverthelessthinned out. This sequence of drafts therefore results in the mass per unitlength of the sliver being much smaller than the mass per unit length of thebatt fed into the card. The sequence of drafts is:
Dft = Vt / Vf; Dtc = Vc / Vt; Dcd = Vd / Vc; Dds = Vs/ Vd;
Dscr = Vcr / Vs; Dcrc = Vca / Vcr; Dcsc = Vsc / Vca 7.9
All drafts are > 1 except Dcd. The following are sufficiently close to unityto be ignored Dds, Dscr, Dcrc and Dcsc. The total draft for the card is, then,given by:
DTM = Dft · Dtc · Dcd = Vd / Vf 7.10
It should be evident that the width of doffer web or card web equals thewidth of the batt feed, and that in consolidating the doffer web into a sliver,the mass per unit length of the sliver equals the mass per unit length of thedoffer web, ignoring drafts Dds, Dscr, Dcrc and Dcsc. The ratio of the values ofthe input and output mass per unit length gives
DTF = ML/SL 7.11
ML – the mass per unit length (in g m–1) of the batt, and SL – sliver count inktex. Since eqn 7.11 deals only with the fibre that forms the sliver, we canrelate DTM and DTF by subtracting the percentage waste, W, from ML removedduring carding. Hence,
DTM = DTF (1 – 0.01W) 7.12
we may refer to DTM and DTF as the total mechanical draft and the total fibredraft.
The carding of fibres will generate heat, which may alter the moisturecontent of fibres. Therefore, in determining W from measurements of ML
and SL the effect of moisture regain must be controlled by conditioning thefibre mass in a standard atmosphere.5
Production equation
As described earlier, the last pair of rollers that moves the fibre mass are thecoiler rollers which place the sliver into the sliver-can. Therefore Vsc is theproduction speed. Hence the production rate (PC) in kg hr–1 is given by
PC = 60 · Vsc · SL · 10–3 7.13
This is usually much lower than the fibre mass flow from Stage 2. Forexample, in processing a cotton with not too high a trash content, on averagethe production rate for the opening and cleaning line would be 500 kgh–1,whilst the production rate of the card would be below 100 kgh–1. In certain

The opening, blending, cleaning, and carding of cotton 225
situations, production rates of 30 to 50 kgh–1 are used commercially. Thereason for this concerns the opening up of the fibre feed into suitable tuftsizes for the carding action. Equation 7.4 is applicable to the opening part ofthe card and with all other factors remaining constant, tuft size is thereforelargely dependent on the production rate and a modest rate will give smalltufts. To obtain small tufts at very high production rates would mean increasingthe beater speed, also the number of points on the beater surface may beincreased. The difficulty is that increased beater speed may result in fibrebreakage. This is therefore a limitation to the speed that would be suitable.Since the production rate of a card cannot match the blowroom output,several cards must be used, linked to the blowroom in such a way that thereis a uniform feed of the fibre mass to each card (see Fig. 7.1).
7.5 Sliver quality and quality control
The quality of a yarn is determined primarily in the processes prior to spinning,and card sliver quality parameters are fundamental to the resultant yarnquality. In carding technology parameters used as measures of card sliverquality are the trash and dust content (or the cleaning efficiency), the amountof neps and short fibre content due to fibre breakage, and the level of irregularityof the sliver. Yarn quality is directly related to these parameters. Also ofimportance, in respect of yarn quality and spinning performance, are howwell the micro-tuftlets have been separated into individual fibres (i.e. thedegree of fibre individualisation) and the shapes the fibres adopt in thesliver, i.e., trailing hooks, leading hooks, both ends hooked, etc.6 These,however, are not easily measured characteristics and therefore in generalpractice they are not used for monitoring quality.
7.5.1 Trash and dust content
With cotton fibres a low level of neps and trash particles in the sliver is amajor objective7 particularly as the impurity content of card slivers willincrease almost linearly with carding production rate.8 As explained earlier,the licker-in, the fixed and revolving flats, along with the cylinder, playimportant roles in the removal of trash particles and neps. Since the trashis embedded in the tufts comprising the batt, how well the licker-in opensthe fibre mass will largely determine how effectively trash particles areremoved from the flow of fibres through the card. Although there are anumber of devices fitted around the surface of the taker-in to improvecleaning, the impurities must be removed with a minimum of fibre loss andfor this the taker-in speed is the controlling factor. Figure 7.15(a) shows howfor different cylinder speeds the impurity level in the sliver decreases, butthe under card waste increases, with licker-in speed. Increasing the speed
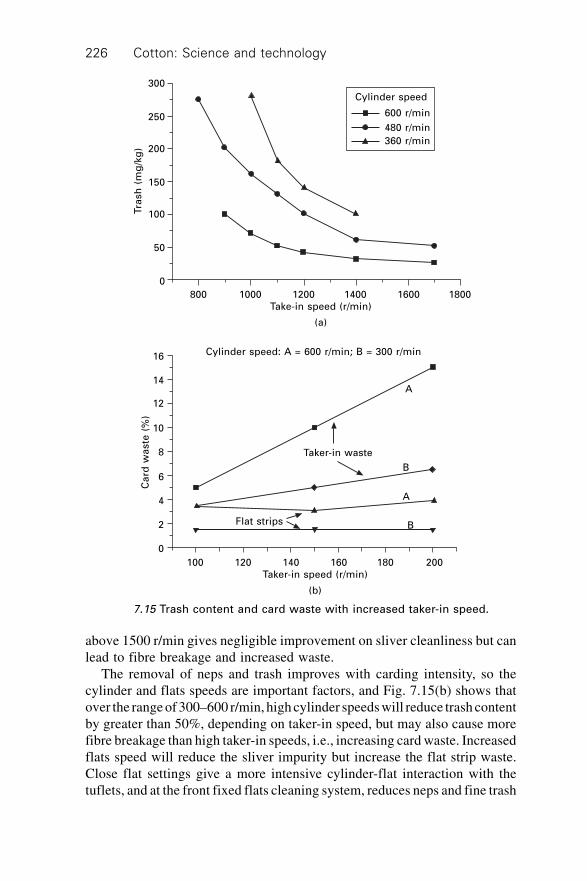
Cotton: Science and technology226
above 1500 r/min gives negligible improvement on sliver cleanliness but canlead to fibre breakage and increased waste.
The removal of neps and trash improves with carding intensity, so thecylinder and flats speeds are important factors, and Fig. 7.15(b) shows thatover the range of 300–600 r/min, high cylinder speeds will reduce trash contentby greater than 50%, depending on taker-in speed, but may also cause morefibre breakage than high taker-in speeds, i.e., increasing card waste. Increasedflats speed will reduce the sliver impurity but increase the flat strip waste.Close flat settings give a more intensive cylinder-flat interaction with thetuflets, and at the front fixed flats cleaning system, reduces neps and fine trash
600 r/min
480 r/min
360 r/min
Cylinder speed
800 1000 1200 1400 1600 1800Take-in speed (r/min)
(a)
300
250
200
150
100
50
0
Tra
sh
(m
g/k
g)
Cylinder speed: A = 600 r/min; B = 300 r/min
Taker-in waste
Flat strips B
A
B
A
100 120 140 160 180 200Taker-in speed (r/min)
(b)
16
14
12
10
8
6
4
2
0
Ca
rd w
aste
(%
)
7.15 Trash content and card waste with increased taker-in speed.

The opening, blending, cleaning, and carding of cotton 227
particles, referred to as pepper trash. Fibre breakage is evidently an importantquality parameter. Consequently, reduced trash and nep count on the one handand reduced fibre damage on the other are conflicting requirements.
The overall carding system has a cleaning efficiency of 95% (this iscalculated using eq. 7.6) which is much higher than the 45% for the openingand cleaning lines (i.e. Stage-2). Taking the carding zones individually, thecleaning efficiency of the licker-in on its own approximates to 30%, thecarding segments give 30% and the cylinder/flats 90%. The cylinder/flatscarding action therefore gives the highest cleaning effect. Carding efficiencyis better the higher the number of points, the closer the settings and thehigher the cylinder speed; the limitation on the values of these parameterswill be fibre breakage.
7.5.2 Neps
Figure 7.16 shows there to be a high correlation between neps in a card weband in the resulting yarn. Therefore, a sliver of low nep content is a pre-requisite for producing a good quality yarn. Earlier it was explained that anep is one or more fibres occurring in a tangled and unorganised mass.9
Whilst this is a useful general definition, in cotton processing there arevarious types of neps. Imperfections that have been identified as neps inspun yarns may be classified into the four categories L to H given in Table7.310,11 The table also gives typical figures for the relative proportions ofeach category determined with the use of an ‘inspection stop’ fitted to theUSTER® yarn irregularity tester.10 The number of neps per gram of slivercan be measured by an instrument known as the AFIS system.13,14 Also the
r = 0.944
0 5 10 15 20Card web neps/100 in2
2400
2000
1600
1200
800
Ya
rn n
ep
s/1
00
0 y
ds
7.16 Relation between neps propensity in cotton yarn and card web.
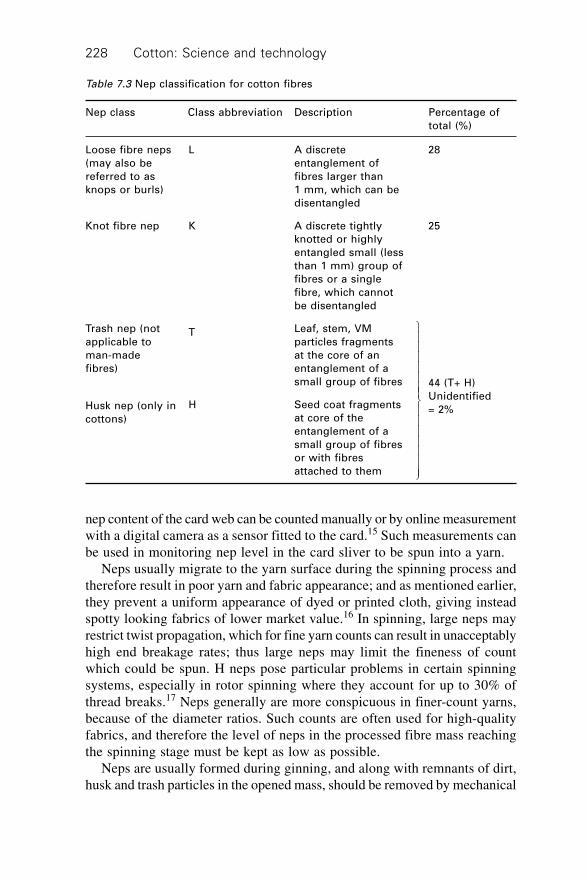
Cotton: Science and technology228
nep content of the card web can be counted manually or by online measurementwith a digital camera as a sensor fitted to the card.15 Such measurements canbe used in monitoring nep level in the card sliver to be spun into a yarn.
Neps usually migrate to the yarn surface during the spinning process andtherefore result in poor yarn and fabric appearance; and as mentioned earlier,they prevent a uniform appearance of dyed or printed cloth, giving insteadspotty looking fabrics of lower market value.16 In spinning, large neps mayrestrict twist propagation, which for fine yarn counts can result in unacceptablyhigh end breakage rates; thus large neps may limit the fineness of countwhich could be spun. H neps pose particular problems in certain spinningsystems, especially in rotor spinning where they account for up to 30% ofthread breaks.17 Neps generally are more conspicuous in finer-count yarns,because of the diameter ratios. Such counts are often used for high-qualityfabrics, and therefore the level of neps in the processed fibre mass reachingthe spinning stage must be kept as low as possible.
Neps are usually formed during ginning, and along with remnants of dirt,husk and trash particles in the opened mass, should be removed by mechanical
Table 7.3 Nep classification for cotton fibres
Nep class Class abbreviation Description Percentage of
total (%)
Loose fibre neps
(may also be
referred to as
knops or burls)
Knot fibre nep
Trash nep (not
applicable to
man-made
fibres)
Husk nep (only in
cottons)
L
K
T
H
28
25
44 (T+ H)
Unidentified
= 2%
A discrete
entanglement of
fibres larger than
1 mm, which can be
disentangled
A discrete tightly
knotted or highly
entangled small (less
than 1 mm) group of
fibres or a single
fibre, which cannot
be disentangled
Leaf, stem, VM
particles fragments
at the core of an
entanglement of a
small group of fibres
Seed coat fragments
at core of the
entanglement of a
small group of fibres
or with fibres
attached to them
¸
˝
ÔÔÔÔÔÔÔ
˛
ÔÔÔÔÔÔÔ

The opening, blending, cleaning, and carding of cotton 229
opening and cleaning processes, particularly at the card. However, dependingon fibre properties, machine settings and operating speeds, the L and K typeneps can be formed during opening, cleaning and carding, thereby reducingthe amount that is removed. This is because such neps result from brokenfibres or from the rolling up of fibres between too closely spaced surfaces.When a fibre breaks the release of tension can cause the shorter length torecoil and roll up into a loose knot, which subsequently tightens with furthermechanical action by the two closely spaced machine surfaces processingthe fibre mass.
The type of particulate impurity in the baled fibre mass can thereforeinfluence the nep level. Particles that are difficult to remove from tufts mayrequire very intensive beater action, leading to fibre damage and a high neplevel to be generated, and consequently greater sliver neppiness. Studies18
have shown that taker-in speeds below 700 min–1 have little influence ongenerating neps at the card, but above this value the nep count in the cardweb can increase significantly with speed. Generally, however, this increasewith speed is applicable only to low micronaire or immature cottons; forcoarser cottons high taker-in speed does not generate neps.19
The production rate employed in carding has a negative effect on nepremoval, this is particularly so when processing low micronaire cottons. It islikely that with increased production speed, the higher cylinder load resultsin a lower subdivision of neps entering the carding zone (Zone III Fig. 7.13)and in increased fibre breakage, thereby forming new neps.
The cylinder-doffer interaction gives an important carding effect as wellas a stripping action, and the intensification of the carding action here willproduce a cleaner less neppy web.18 A reduction in doffer surface speedincreases the carding action and was found to reduce the nep level. Withregard to wire specifications, the smaller the land area of tooth, the sharperwill be the wire points and therefore the lower the nep level, since the wirepoints can better penetrate neps to separate the fibres. Reduced neppinessalso occurs when the working angle of the doffer is smaller than the cylinder.The smaller doffer-wire angle gives a better transfer coefficient and therebyless fibre in the recycling layer on the cylinder; thus, a reduced cylinder loadand reduced potential for fibre breakage. The density of the wire points ofthe card clothing, especially the cylinder clothing, is an important factor inreducing the nep level of the card web.20 The point density of card wireclothing is governed by the spacing between rows of teeth, and the wider thespacing the greater the chance for neps to become lodged between rows ofteeth and, in the case of the cylinder, escape the carding action. However, asthe point density increases, the possibility of fibre breakage increases,consequently an optimum specification has to be reached depending onproduction rate and fibre type.

Cotton: Science and technology230
Husk and trash neps are most effectively removed by the carding actionand the combined actions of knife-edge and applied suction at the fixed flats.However, some escape removal and these are then subjected to the effect ofthe crush rolls, which dislodge them from their attachment to fibres. Theyare subsequently removed in the downstream processes.
Although cotton stickiness in carding, i.e., honeydew, is not a nep-formingcharacteristic it is a recurring problem that can have a disrupting effect onproduction and a degrading one on quality. Cottons contaminated withhoneydew are difficult to card because of the severe sticking and build up offibres on working components, particularly the crush rolls where the resultis frequent breakage of the card web. Stickiness is largely associated withfreshly cropped cotton and can become less problematic when the honeydewcotton is stored for 3–6 months.21 The honeydew cotton may then be processedby blending with uncontaminated fibre, but a suitable blend proportion hasto be determined by trials. A dust control additive or over-spray21 may beapplied to the stored cotton and this generally alleviates the effects of stickinessduring carding and in downstream processing. The additive on the cottoncontinuously coats the surfaces of the working components with a thin filmof lubricant to prevent the honeydew from gaining a purchase on the surfaces.
7.5.3 Short fibre content (SFC)
In spinning, the presence of short fibres can result in yarn breaks and pooryarn quality. It is important that during opening, cleaning and carding, fibrebreakage is kept to a minimum. It was explained above that nep formation isclosely linked to fibre breakage. It is therefore not surprising to find that atypical SFC profile for the process stages from cotton bale to sliver can besimilar to a typical nep propensity profile (see Fig. 7.17).
Cotton bolls have very few short fibres. A significant amount of fibrebreaking occurs in the harvesting and ginning of cottons, which results in thebaled fibre mass having an SFC of around 24%. Mechanical opening andcleaning can increase the %SFC and the total nep level, but the levels areusually reduced in the card sliver because most of the short fibres and nepsare caught in the flat-strip waste.
7.5.4 Sliver irregularity
The variation of the thickness of a yarn along its length and of the measuredyarn count are important yarn characteristics to the uniform appearance ofwoven and knitted fabric surfaces. The variation of the card sliver thicknessis a contributing factor to both yarn thickness and yarn count variation. Theterms used in referring to thickness variations along the length of the sliverand yarn are ‘levelness’, ‘evenness’, ‘regularity’, ‘unevenness’ or ‘irregularity’.
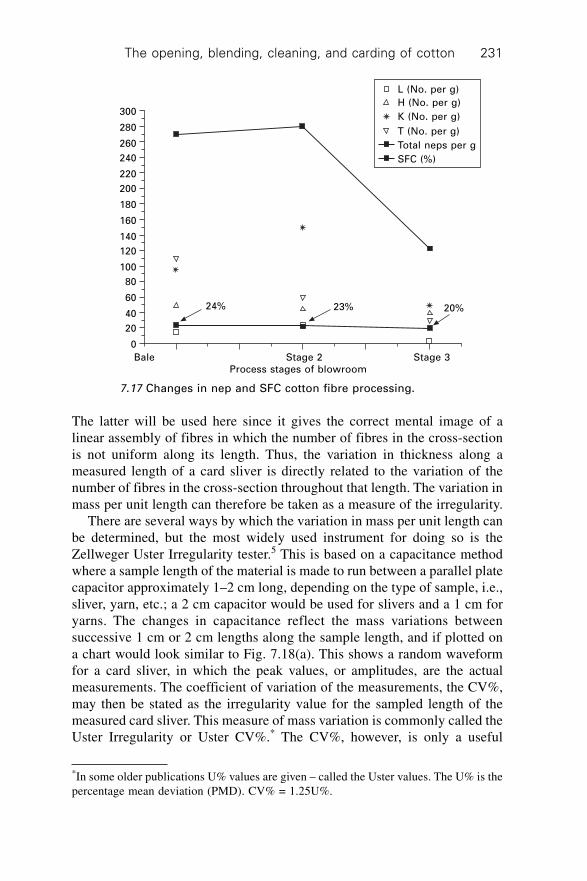
The opening, blending, cleaning, and carding of cotton 231
The latter will be used here since it gives the correct mental image of alinear assembly of fibres in which the number of fibres in the cross-sectionis not uniform along its length. Thus, the variation in thickness along ameasured length of a card sliver is directly related to the variation of thenumber of fibres in the cross-section throughout that length. The variation inmass per unit length can therefore be taken as a measure of the irregularity.
There are several ways by which the variation in mass per unit length canbe determined, but the most widely used instrument for doing so is theZellweger Uster Irregularity tester.5 This is based on a capacitance methodwhere a sample length of the material is made to run between a parallel platecapacitor approximately 1–2 cm long, depending on the type of sample, i.e.,sliver, yarn, etc.; a 2 cm capacitor would be used for slivers and a 1 cm foryarns. The changes in capacitance reflect the mass variations betweensuccessive 1 cm or 2 cm lengths along the sample length, and if plotted ona chart would look similar to Fig. 7.18(a). This shows a random waveformfor a card sliver, in which the peak values, or amplitudes, are the actualmeasurements. The coefficient of variation of the measurements, the CV%,may then be stated as the irregularity value for the sampled length of themeasured card sliver. This measure of mass variation is commonly called theUster Irregularity or Uster CV%.* The CV%, however, is only a useful
24% 23% 20%
Bale Stage 2 Stage 3Process stages of blowroom
L (No. per g)
H (No. per g)
K (No. per g)
T (No. per g)
Total neps per g
SFC (%)
300
280
260
240
220
200
180
160
140
120
100
80
60
40
20
0
7.17 Changes in nep and SFC cotton fibre processing.
*In some older publications U% values are given – called the Uster values. The U% is thepercentage mean deviation (PMD). CV% = 1.25U%.
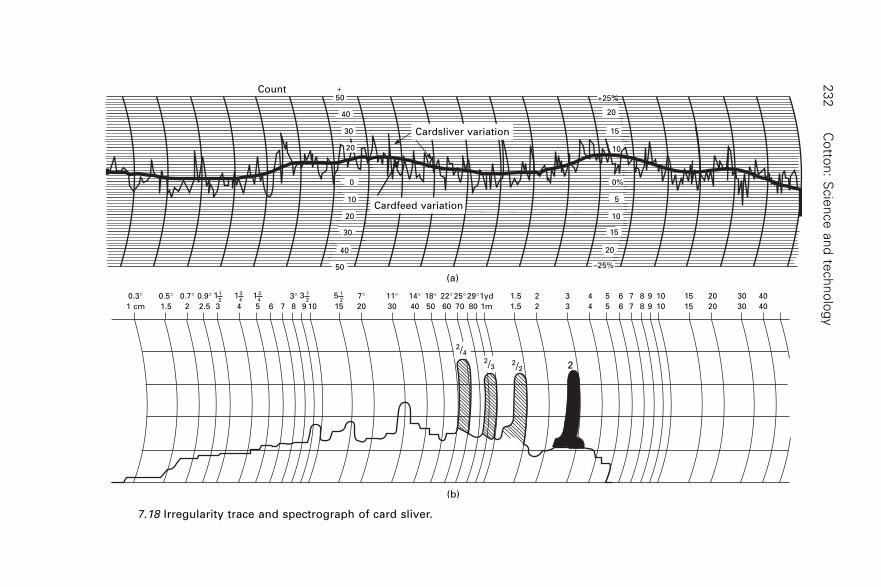
Co
tton
: Scie
nce
an
d te
ch
no
log
y2
32
22/22/3
2/4
0.3∞ 0.5∞ 0.7∞ 0.9∞ 11
2 13
4 13
43∞
3 1
2 5 1
27∞ 11∞ 14∞ 18∞ 22∞25∞29∞1yd 1.5 2 3 4 5 6 7 8 9 10 15 20 30 40
1 cm 1.5 2 2.5 3 4 5 6 7 8 9 10 15 20 30 40 50 60 70 80 1m 1.5 2 3 4 5 6 7 8 9 10 15 20 30 40
Cardsliver variation
Cardfeed variation
(b)
(a)
+25%
–25%
20
15
10
0%
5
10
15
20
Count50+
40
30
20
40
50
30
20
10
0
7.18 Irregularity trace and spectrograph of card sliver.

The opening, blending, cleaning, and carding of cotton 233
indicator of quality provided no machine faults or processing errors occurperiodically to add significantly to the measured value.
Owing to such faults, particular values of amplitude may reoccur withinthe random waveform. These values are denoted as periodic faults and thedistance between a particular reoccurring amplitude within the randomwaveform gives a measure of the periodic wavelength related to the fault.
Although there are steps that can be taken in post-carding processes toreduce a high CV% of a card sliver, little can be done post-carding to correctperiodic faults. Therefore, periodic faults of sizeable amplitudes are detrimentalto yarn quality and are very likely to result in seconds-quality fabrics. Thereader should note that periodic faults can also occur at process stages aftercarding, and therefore it is essential to identify the process at which they dooccur so that the problem can be rectified.
A graph of the periodic amplitudes plotted against their wavelength isused to highlight significant periodic faults. This wavelength spectrum iscalled a spectrograph or spectrogram and Fig. 7.18(b) shows an example ofthe spectrogram relating to the irregularity chart of Fig. 7.18(a) for a cardsliver. The irregularity chart shows several periodic amplitudes amongst therandom waveform, and the spectrogram depicts the amplitudes along theordinate and the wavelengths along the abscissa. The pronounced amplitudesare the significant periodic faults. Periodic faults may be classified accordingto their wavelength, using the fibre length as a unit length.22
∑ 1 to 10 times the fibre length: short-term variation∑ 10 to 100 times the fibre length: medium-term variation∑ 100 to 1000 times the fibre length: long-term variation.
The classification is important since it can be used to trace the source ofa periodic fault. For example, in the chart of Fig. 7.18(a) it can be seen thatthe centre line drawn through the random waveform also varies. This is amedium-term variation and indicates an inconsistency in the sliver count,which is attributable to variation in the feed to the first beater of the taker-in. The reader wishing for detailed information on the tracing of periodicfaults should consult references 23–7.
Short term irregularity
The Uster CV% of a sliver is a measure of the short-term irregularity of thesliver and is not therefore a useful predictive indicator for the Uster CV% ofthe yarn28 This is because the short-term irregularity for a yarn is moredependent on the short-term variations introduced during post-carding processesin which there is attenuation of the sliver count in order to obtain the yarncount. However, the yarn resulting from the further processing of a sliver isusually checked for count variation by measuring 100 m yarn lengths; such

Cotton: Science and technology234
would have originated from short lengths of the sliver. Thus the sliver UsterCV% is important to the measured count variation within, say, a given yarnpackage.
Medium and long-term irregularity
Figure 7.19 illustrates the medium- to longer-term variability of a sliver, thatis to say the irregularity of a sliver length that comprises a full can of sliverand the variation between cans of sliver. The Uster CV% is not a measure ofthis variability. The CV% of sliver count measurements, made at randomintervals during carding, is the appropriate indicator of such variations.
The importance of monitoring and controlling medium- and long-termvariability can be seen from Fig. 7.20. In the processes following carding,the short- and medium-term irregularities can be significantly reduced.However, these processes cannot readily correct for the long-term drift ofthe sliver count. The problem is particularly important where many cards areneeded to match the production of the opening and cleaning line of Stage 2.
The long-term drift associated with each card can result in unacceptablesliver count variations. Thus, at any given moment during production, themean sliver counts of each card may give a statistically widespread distributionfor the carding process (see Fig. 7.20). To overcome this difficulty autolevellersare usually fitted to the cards. As the name implies, autolevellers automatically
Time
Zone BZone A
Cans 1 2 3 4 5 6 7 8Cans 1 2 3 4 5 6 7 8
Long-term ‘drift
Desired mean level
Medium-termShort-term
Sliverweight
7.19 CV% of sliver count: short-, medium- and long-termirregularities.

The opening, blending, cleaning, and carding of cotton 235
level or reduce large changes in the medium- and long-term irregularity ofthe sliver.
Autolevelling at the card
The principles of autolevelling are based on the fundamentals of controltheory which is beyond the scope of this chapter. However, the reader wishingto study the theoretical aspects of autolevelling should find reference 29informative. Essentially, there are two methods of autolevelling that are usedat the card. The basis of one system is for a sensor to electronically monitorthe sliver irregularity and a control unit to interpret the electronic data interms of variations in the sliver count from the preset count required. Then,according to the size of any unacceptable differences and whether these aregreater or less than the preset value, modify the draft of the card by slowingor increasing the feed roller speed to ensure that there is only a minimum(negligible) deviation from the preset value. The time elapsed between changingthe feed roller speed and detecting its effect in the output sliver, is theresponse time of the carding process or the lag time due to the process. Withthe second method, the batt thickness at the feed roller is constantly monitored.When deviating from a preset value, the speed of the feed roller is deliberatelychanged with the intention of maintaining a minimum variation of the cardsliver count. The first method is referred to as closed-loop autolevelling andthe second as open loop autolevelling. Figure 7.21 depicts the main featuresof these two types of control system; S and A represent the locations of thesensors and actuators, the dotted lines the signal path and the solid lines thematerial flow.
Card 7
Card 6
Card 5
Card 4
Card 3
Card 2
Card 1
7.20 Count variations within and between cards.
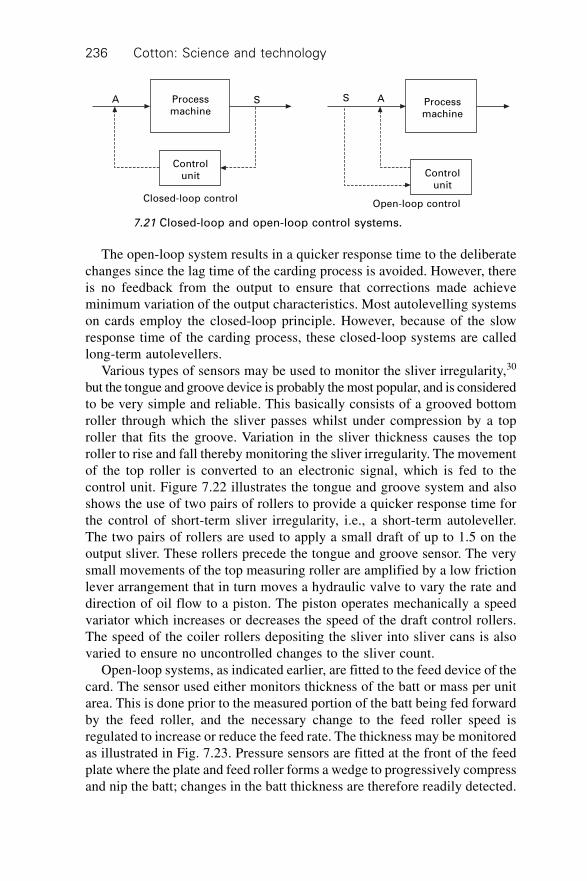
Cotton: Science and technology236
The open-loop system results in a quicker response time to the deliberatechanges since the lag time of the carding process is avoided. However, thereis no feedback from the output to ensure that corrections made achieveminimum variation of the output characteristics. Most autolevelling systemson cards employ the closed-loop principle. However, because of the slowresponse time of the carding process, these closed-loop systems are calledlong-term autolevellers.
Various types of sensors may be used to monitor the sliver irregularity,30
but the tongue and groove device is probably the most popular, and is consideredto be very simple and reliable. This basically consists of a grooved bottomroller through which the sliver passes whilst under compression by a toproller that fits the groove. Variation in the sliver thickness causes the toproller to rise and fall thereby monitoring the sliver irregularity. The movementof the top roller is converted to an electronic signal, which is fed to thecontrol unit. Figure 7.22 illustrates the tongue and groove system and alsoshows the use of two pairs of rollers to provide a quicker response time forthe control of short-term sliver irregularity, i.e., a short-term autoleveller.The two pairs of rollers are used to apply a small draft of up to 1.5 on theoutput sliver. These rollers precede the tongue and groove sensor. The verysmall movements of the top measuring roller are amplified by a low frictionlever arrangement that in turn moves a hydraulic valve to vary the rate anddirection of oil flow to a piston. The piston operates mechanically a speedvariator which increases or decreases the speed of the draft control rollers.The speed of the coiler rollers depositing the sliver into sliver cans is alsovaried to ensure no uncontrolled changes to the sliver count.
Open-loop systems, as indicated earlier, are fitted to the feed device of thecard. The sensor used either monitors thickness of the batt or mass per unitarea. This is done prior to the measured portion of the batt being fed forwardby the feed roller, and the necessary change to the feed roller speed isregulated to increase or reduce the feed rate. The thickness may be monitoredas illustrated in Fig. 7.23. Pressure sensors are fitted at the front of the feedplate where the plate and feed roller forms a wedge to progressively compressand nip the batt; changes in the batt thickness are therefore readily detected.
A S S A
Closed-loop controlOpen-loop control
Processmachine
Controlunit Control
unit
Processmachine
7.21 Closed-loop and open-loop control systems.

The opening, blending, cleaning, and carding of cotton 237
Speed variator
Piston
Web
Draft zone input
Drafting controlrollers
Measuringrollers
Correction made here
Sliver
Hydrauliccontrol valve
7.22 Tongue and groove device fitted for short-term closed-loopautolevelling at card.
7.23 Open-loop autoleveller on short-staple card.

Cotton: Science and technology238
In general autolevellers may be used to correct fluctuations in the monitoredfibre mass of up to +/– 30% and minimise deviations to within +/– 1–2%,based on the mass of five-metre lengths of sliver.
7.6 References
1. Lee, J. K. and Kin, Y. S., Linear Programming for Cotton Mixing: Computers in the
World of Textiles, The Textile Institute, Manchester, (1984) 90.2. Szaloki, S. Z., Opening, Cleaning and Picking, Vol. I, The Institute of Textile
Technology, Charlottesville, Virginia, USA, 1976, p 126.3. Dehghani, A., Lawrence, C. A., Mahmoudi, M., Greenwood, B. and Iype, C., Fibre
Dynamics in a Revolving-Flats Card: An Assessment of Changes in the State of theFibre Mass During the Early Stages of the Carding Process., J. Text. Inst, 91, 359,2000.
4. Feil, R. W., Fibre Separation and Cleaning on Cotton Card, Melliand Textilberichte
(eng. edn) September, (1980), 1207–1213.5. Saville, B. P., Physical Testing of Textiles, The Textile Institute and Woodhead
Publishing Ltd, Chapter 2, 26–43, 1999.6. Lawrence, C. A., Fundamentals of Spun Yarn Technology, Chap. 4, CRC Press,
2003.7. Leifeld, F., Meeting the challenge of the future: the holistic approach, International
Textile Bulletin, 4, 34–38, 1997.8. Van Alphen, W. F, The Card as Dedusting Machine, Melliand Textilberichte, (Eng.
edn) 12/80, 1523–1528, 1980.9. The Textile Institute, Textile Terms and Definitions, 10th Edition.
10. Frey, M. and Schleth, A., (Zellweger Uster AG), Examples of Data Acquisition for
Fibres and the Application in the Spinning Mill, 22nd International Cotton ConferenceBremen, 2–5 March, 1–30, 1994.
11. Liefield, F., The Importance of Card Sliver Quality for the Running Behaviour andYarn Quality in Unconventional Spinning Methods, International Textile Bulletin,Yarn Forming, 4, 1988.
12. Perkins, H. H. and Bargeron, J. D., Nep Forming on a Cotton Card – Honeydrew –Additives as a Means to Reduce Air-Borne Dust., Melliand Textilberichte, 2, 129–131, 1981.
13. Schleth, A., Uster AFIS Nep Measurement on the way to Standardization, ITMF
International Committee on Cotton Testing Methods, Meeting of Working Group onDust/Trash, March, 1–11, 1994.
14. Frey, Manfred, (Rieter Spinning Systems) Practical Experience with New Cotton
Measuring Methods, 20th International Cotton Conference, Bremen, March 15–17,1–16, 1990.
15. Leifeld, F., Meeting the challenge of the future: the holistic approach, International
Textile Bulletin, 4, 34–38, 1997.16. Uster News Bulletin, The Analysis of Faults in Yarns, No. 6, 1-7, August 1965.17. Liefield, F., The Importance of Card Sliver Quality for the Running Behaviour and
Yarn Quality in Unconventional Spinning Methods, International Textile Bulletin,
Yarn Forming, 4, 1988.18. Faufmann, D., Neps and Carding, Textil Praxis (English edn), 4, November, 151–
156, 1957.
The opening, blending, cleaning, and carding of cotton 239
19. Harrison, R. E. and Bargeron, J. D., Comparison of Several Nep DeterminationMethods, Textile Research Journal, February, 77–79, 1986.
20. Ashdown, T. W. G. and Townend, P. P., The Effect of the Density of Card Clothingon the Carding Process, Journal of Textile Institute, 52, T171, 1961.
21. Wyatt, B. G. and Ethridge, M. D., Combining the Use of Overspray and Blending forSuccesful Processing of Very Sticky Cotton, Textile Topics, International Textile
Centre, Texas Tech. University, 2–4, 1996.22. Booth, J. E., Principles of Textile Testing, Temple Press Books Ltd, London, 1964.23. Futer, R., (Zellweger Uster AG), Manual of Textile Technology, Evenness Testing in
Yarn Production Part I, The Textile Institute, (1982), ISBN 0 900739 48 7.24. Futer, R., (Zellweger Uster AG), Manual of Textile Technology, Evenness Testing in
Yarn Production Part II, The Textile Institute, (1982), ISBN 0 900739 49 5.25. Dyson, E., Some Observations on Yarn Irregularity, Journal of Textile Institute,
(1973), 215–217.26. Felix, E., Analysing the Irregularity of Yarns, Rovings and Slivers by means of the
Wave Length Spectrum, The Textile Manufacturer, August, (1955), 415–421.27. Uster News Bulletin, The Uster System of Evenness Testing, No. 28, July (1980), 1–
27.28. Crosrol Technical Bulletin, Ref. T 80/02.29. Catling, H. and Davis, I., Conservation of Mean Level in Autolevelling, Shirley
Institute Memoirs, Vol, XXXIX, (1966), 27–47.30. Szaloki, S. Z., High-Speed Carding and Continuous Card Feeding, The Institute of
Textile Technology, Charlottesville, Virgina, USA, Vol. II, (1977) 152–175.

240
8.1 Introduction
In 2005, approximately 62% of all textile fibres were processed into spunyarns (short and long staple), 8% into non-wovens and 30% into filamentyarns, short- staple spinning (up to about 50 mm) accounting for over 80%of all staple yarns spun, with cotton accounting for almost 70% of this. Thischapter covers the various processes and technologies involved in theconversion of a cotton card sliver into yarn on a package suitable for subsequentfabric manufacturing. This is often referred to as the yarn manufacturingstage of the textile pipeline and as the ‘cotton or short-staple system’.
Yarn manufacturing in essence involves the following actions andobjectives:
∑ sliver attenuation (drafting)∑ sliver evening (doubling, autolevelling)∑ fibre aligning and straightening∑ fibre blending∑ short fibre removal∑ removal of foreign particles (also dust) and neps∑ twist insertion∑ winding
– clearing (fault removal)– waxing/lubrication (knitting yarns).
Ultimately the purpose of the preparatory processes and spinning is to convertinto a yarn, as cost effectively as possible and with a minimum of waste, arelatively coarse cotton sliver, in which the fibres are individualised butfairly randomly arranged and also not always all that well blended and whichcontains undesirable short fibres, fibre hooks and foreign particles. The intentionis to produce a yarn in which the fibres are as straight, orderly arranged andwell aligned (parallel) as possible and which is as even as possible, both in
8Cotton spinning technology
L H U N T E R, CSIR and Nelson Mandela MetropolitanUniversity, South Africa
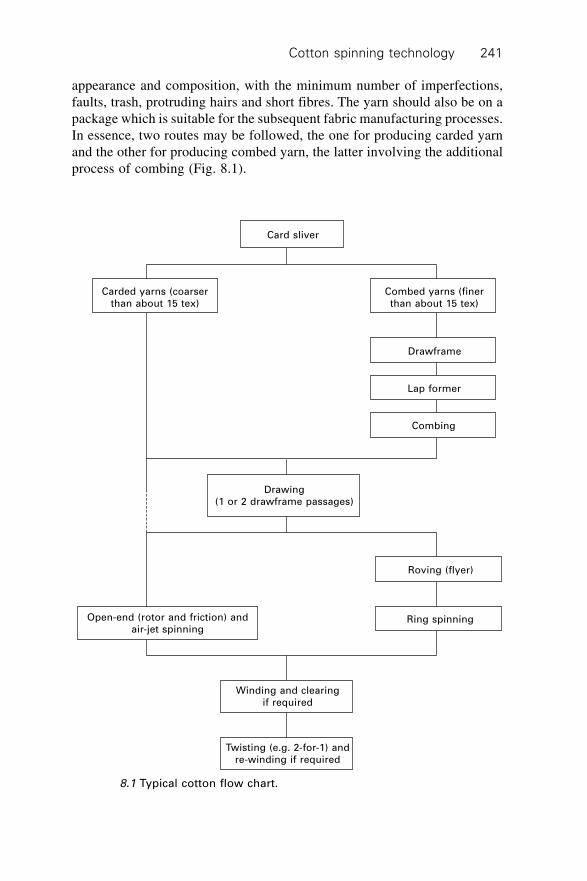
Cotton spinning technology 241
appearance and composition, with the minimum number of imperfections,faults, trash, protruding hairs and short fibres. The yarn should also be on apackage which is suitable for the subsequent fabric manufacturing processes.In essence, two routes may be followed, the one for producing carded yarnand the other for producing combed yarn, the latter involving the additionalprocess of combing (Fig. 8.1).
Drawing(1 or 2 drawframe passages)
Roving (flyer)
Ring spinning
Winding and clearingif required
Twisting (e.g. 2-for-1) andre-winding if required
Open-end (rotor and friction) andair-jet spinning
Card sliver
Carded yarns (coarserthan about 15 tex)
Combed yarns (finerthan about 15 tex)
Drawframe
Lap former
Combing
8.1 Typical cotton flow chart.
Cotton: Science and technology242
Of particular importance in all of the above is good fibre control andminimisation of waste. The above are achieved during the following processingstages which will now be discussed:
∑ drawing∑ combing (combed yarn)∑ spinning∑ winding.
For more in-depth information, the reader is referred to various textbooksand reviews.1–16
8.2 Preparation for spinning
8.2.1 Drawing
General
Drawing, on a drawframe, represents the first process (called a drawframepassage) applied to the card sliver (containing some 30,000 fibres in itscross-section), with the intention to reduce (attenuate) the sliver linear densityuntil the desired linear density for spinning (some 100 fibres in the yarncross-section) is achieved. The drawframe operation can also be either linkedto, or integrated with, the card, with coiler delivery speeds approaching500 m/min being possible in such cases, higher drafts (2 to 2.5) improvingfibre orientation (alignment). The process of sliver attenuation, is calleddrafting. Commonly two drawframe passages (single or twin delivery) occurbetween carding and spinning. Oxtoby4 defines ‘drawing’ as a series ofoperations using drafting and doubling, with the machines which work togetherfor this purpose being referred to as the ‘drawing set’. Nevertheless, theterms drawing and drafting are often used interchangeably. Drawing thereforeinvolves the processes of drafting and doubling, with good fibre controlbeing of the essence throughout. Doubling refers to the action of combiningtwo or more slivers during a process, such as drawing, doubling taking placeat the input to the drawing stage. Lateral fibre blending and evening(autolevelling) also take place during the drawing process. Individual drivesand sensors enable ‘self-learning’ and ‘self-adjusting’ drawing processes,with expert systems facilitating the detection of faults and the optimumsetting and operation of drawframes.
In general, two drafting stages are applied to the card sliver on thedrawframe, the first referred to as the ‘breaker drafting’ or ‘break-draft’ andthe second as final (or main) draft. From the cans, the slivers pass, via thepower creel, to the drawing zone, it being important that the slivers are notstretched or damaged in the process. Sliver output speeds are as high as1000 m/min, or even higher, coiling, for example, into rectangular cans
Cotton spinning technology 243
which can accommodate up to 65% (30 kg) more sliver. The fibre waste isaround 0.5 to 1.0%.
The reversal of the slivers, which automatically occurs during eachprocessing stage, from card sliver to spinning, assists in the randomisation ofthe fibre ends, and the correct direction of fibre hooks. Two drawframepassages are commonly applied after carding, the first being referred to as‘breaker drawing’ and the second as ‘finisher drawing’. In general, the fibresin the card sliver are not very well aligned (i.e. not very parallel) and one ofthe consequences of the drafting which takes place during the drawing processis that the fibres become better aligned and straighter. Furthermore, the cardsliver is not very even along its length, and this is overcome by combiningdoubling (as well as autolevelling) with the drafting process.
Drafting
Drafting will be discussed here in its wider context, i.e., not only withrespect to drawing but also with respect to those processes subsequent todrawing. It is possible to spin yarn directly from either a drawframe or cardsliver, and this is in fact accomplished in certain high draft sliver spinningsystems (drafts above 120) and often in rotor spinning. Nevertheless, it isdifficult to produce even ring-spun yarn, particularly fine yarn, in such away, the reasons being that it requires a very uniform input sliver and avery precise control of the feed sliver as well as very precise drafting andfibre control, since very high drafts are involved and the beneficial effectsof sliver feed reversal and doubling are eliminated. Good drafting isdifficult to achieve under such high draft conditions, there generally beingan optimum draft, and the total draft necessary to achieve the required sliverand yarn linear densities is normally accomplished by drafting in stages. Thesequence of processes, called drawing, is required to gradually and in acontrolled manner, through a process of drafting, reduce the sliver lineardensity while controlling the movement and alignment of the fibres. Draftingtakes place by:3
∑ fibre straightening (decrimping)∑ fibre elongation∑ fibre sliding (relative movement).
The latter effects the greatest change in sliver linear density.The first drafting zone, referred to as ‘break-draft’, is very low, of the
order of 1.1 to 1.4, while the second, the main or final draft, is much higher,the total draft being the product of the two, generally ranging from about 6to 30, the optimum often being determined by trial and error. The total draft(d t) is the product of the draft (d i) in the consecutive drawing zones asfollows: dt = d1, ¥ d2 ¥ …. di. It needs to be remembered, however, that,
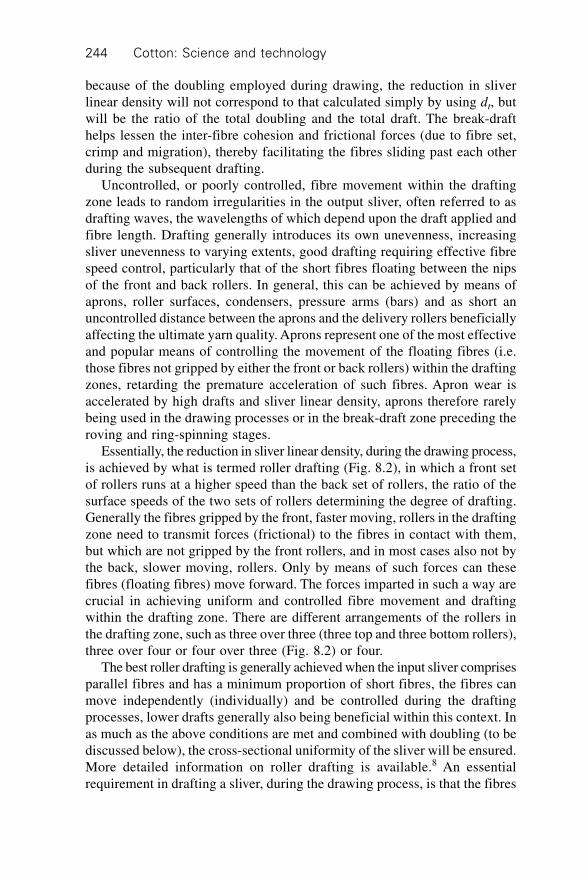
Cotton: Science and technology244
because of the doubling employed during drawing, the reduction in sliverlinear density will not correspond to that calculated simply by using dt, butwill be the ratio of the total doubling and the total draft. The break-drafthelps lessen the inter-fibre cohesion and frictional forces (due to fibre set,crimp and migration), thereby facilitating the fibres sliding past each otherduring the subsequent drafting.
Uncontrolled, or poorly controlled, fibre movement within the draftingzone leads to random irregularities in the output sliver, often referred to asdrafting waves, the wavelengths of which depend upon the draft applied andfibre length. Drafting generally introduces its own unevenness, increasingsliver unevenness to varying extents, good drafting requiring effective fibrespeed control, particularly that of the short fibres floating between the nipsof the front and back rollers. In general, this can be achieved by means ofaprons, roller surfaces, condensers, pressure arms (bars) and as short anuncontrolled distance between the aprons and the delivery rollers beneficiallyaffecting the ultimate yarn quality. Aprons represent one of the most effectiveand popular means of controlling the movement of the floating fibres (i.e.those fibres not gripped by either the front or back rollers) within the draftingzones, retarding the premature acceleration of such fibres. Apron wear isaccelerated by high drafts and sliver linear density, aprons therefore rarelybeing used in the drawing processes or in the break-draft zone preceding theroving and ring-spinning stages.
Essentially, the reduction in sliver linear density, during the drawing process,is achieved by what is termed roller drafting (Fig. 8.2), in which a front setof rollers runs at a higher speed than the back set of rollers, the ratio of thesurface speeds of the two sets of rollers determining the degree of drafting.Generally the fibres gripped by the front, faster moving, rollers in the draftingzone need to transmit forces (frictional) to the fibres in contact with them,but which are not gripped by the front rollers, and in most cases also not bythe back, slower moving, rollers. Only by means of such forces can thesefibres (floating fibres) move forward. The forces imparted in such a way arecrucial in achieving uniform and controlled fibre movement and draftingwithin the drafting zone. There are different arrangements of the rollers inthe drafting zone, such as three over three (three top and three bottom rollers),three over four or four over three (Fig. 8.2) or four.
The best roller drafting is generally achieved when the input sliver comprisesparallel fibres and has a minimum proportion of short fibres, the fibres canmove independently (individually) and be controlled during the draftingprocesses, lower drafts generally also being beneficial within this context. Inas much as the above conditions are met and combined with doubling (to bediscussed below), the cross-sectional uniformity of the sliver will be ensured.More detailed information on roller drafting is available.8 An essentialrequirement in drafting a sliver, during the drawing process, is that the fibres
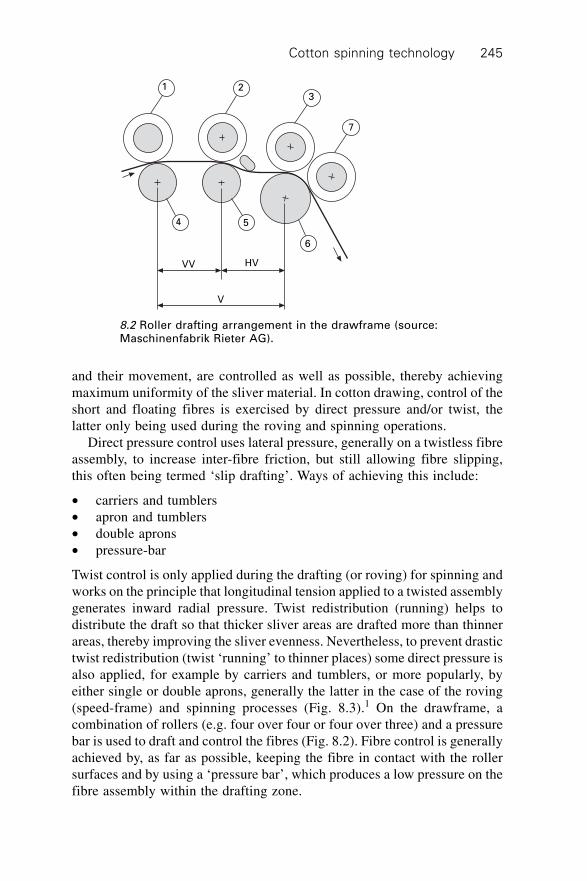
Cotton spinning technology 245
and their movement, are controlled as well as possible, thereby achievingmaximum uniformity of the sliver material. In cotton drawing, control of theshort and floating fibres is exercised by direct pressure and/or twist, thelatter only being used during the roving and spinning operations.
Direct pressure control uses lateral pressure, generally on a twistless fibreassembly, to increase inter-fibre friction, but still allowing fibre slipping,this often being termed ‘slip drafting’. Ways of achieving this include:
∑ carriers and tumblers∑ apron and tumblers∑ double aprons∑ pressure-bar
Twist control is only applied during the drafting (or roving) for spinning andworks on the principle that longitudinal tension applied to a twisted assemblygenerates inward radial pressure. Twist redistribution (running) helps todistribute the draft so that thicker sliver areas are drafted more than thinnerareas, thereby improving the sliver evenness. Nevertheless, to prevent drastictwist redistribution (twist ‘running’ to thinner places) some direct pressure isalso applied, for example by carriers and tumblers, or more popularly, byeither single or double aprons, generally the latter in the case of the roving(speed-frame) and spinning processes (Fig. 8.3).1 On the drawframe, acombination of rollers (e.g. four over four or four over three) and a pressurebar is used to draft and control the fibres (Fig. 8.2). Fibre control is generallyachieved by, as far as possible, keeping the fibre in contact with the rollersurfaces and by using a ‘pressure bar’, which produces a low pressure on thefibre assembly within the drafting zone.
V
VV HV
6
54
7
321
8.2 Roller drafting arrangement in the drawframe (source:Maschinenfabrik Rieter AG).
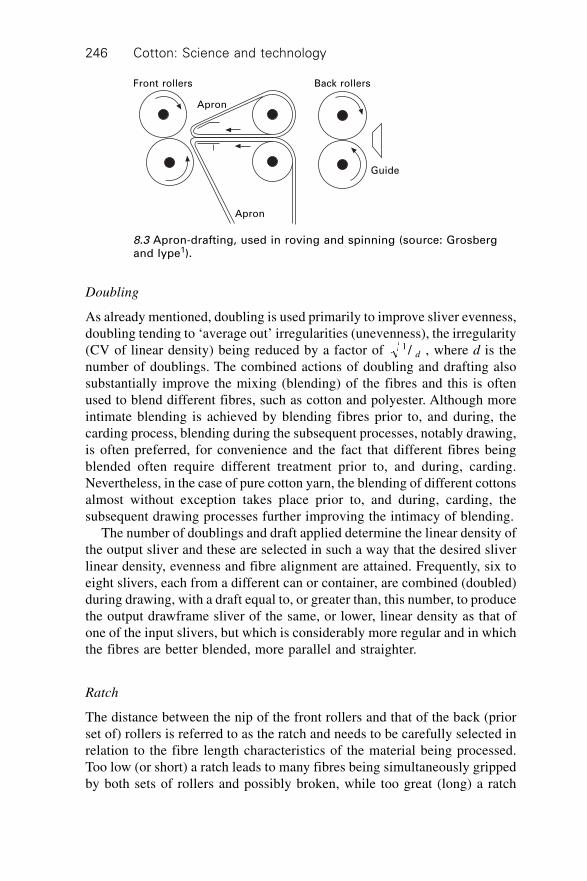
Cotton: Science and technology246
Doubling
As already mentioned, doubling is used primarily to improve sliver evenness,doubling tending to ‘average out’ irregularities (unevenness), the irregularity(CV of linear density) being reduced by a factor of 1/ d , where d is thenumber of doublings. The combined actions of doubling and drafting alsosubstantially improve the mixing (blending) of the fibres and this is oftenused to blend different fibres, such as cotton and polyester. Although moreintimate blending is achieved by blending fibres prior to, and during, thecarding process, blending during the subsequent processes, notably drawing,is often preferred, for convenience and the fact that different fibres beingblended often require different treatment prior to, and during, carding.Nevertheless, in the case of pure cotton yarn, the blending of different cottonsalmost without exception takes place prior to, and during, carding, thesubsequent drawing processes further improving the intimacy of blending.
The number of doublings and draft applied determine the linear density ofthe output sliver and these are selected in such a way that the desired sliverlinear density, evenness and fibre alignment are attained. Frequently, six toeight slivers, each from a different can or container, are combined (doubled)during drawing, with a draft equal to, or greater than, this number, to producethe output drawframe sliver of the same, or lower, linear density as that ofone of the input slivers, but which is considerably more regular and in whichthe fibres are better blended, more parallel and straighter.
Ratch
The distance between the nip of the front rollers and that of the back (priorset of) rollers is referred to as the ratch and needs to be carefully selected inrelation to the fibre length characteristics of the material being processed.Too low (or short) a ratch leads to many fibres being simultaneously grippedby both sets of rollers and possibly broken, while too great (long) a ratch
Back rollersFront rollers
Apron
Apron
Guide
8.3 Apron-drafting, used in roving and spinning (source: Grosbergand Iype1).

Cotton spinning technology 247
leads to excessive floating fibres and poor fibre control. Although the nominal,or theoretical, ratch is easy to calculate the actual or effective ratch is morecomplicated to derive, depending upon a number of factors, such as thesliver thickness (linear density), inter fibre-frictional forces and cohesion.
Drafting irregularities (waves)
Because floating fibres, are not positively controlled by either the front orback rollers, these fibres being acted upon, and movement imparted, byfrictional forces resulting from contact with adjacent fibres, perfect draftingis not possible, and drafting irregularities (waves), largely random in nature,are formed, with wavelengths varying from about half to twice the meanwavelength, the latter being about twice the maximum fibre length.
Mechanical defects
In contrast to drafting irregularities (drafting waves), which are largely random,mechanical defects tend to introduce periodic (regularly occurring) faults: Ifthe operating surfaces of the various rollers, gears and other circular elements,directly or indirectly involved in the drafting process, are not perfectly circularor eccentric, unevenness in the output sliver or yarn will result, generally inthe form of a periodic unevenness in linear density, the wavelength of whichis determined by roller/gear circumference, gear ratios and draft. Eccentricand fluted rollers and eccentric and worn gear wheels represent typicalmechanical defects.
Drafting force
The force required to draft a sliver, termed the drafting force, depends uponthe friction and cohesion of the fibres, which in turn are greatly influencedby any lubricants (finish) or chemical treatments, notably dyeing and bleaching,applied to the fibres. Drafting force is also greatly dependent upon sliverspecific factors, such as fibre entanglement, fibre crimp, fibre fineness, fibrealignments packing factor, fibre hooks and twists.17 The drafting force isalso affected by draft ratio, drafting speed and roller setting, beingapproximately inversely related to ratch and draft, except for relatively lowdrafts (1.2 to 1.6) where a maximum occurs in the drafting force vs. draft.Drafting force also increases with sliver thickness and bulk density. Sliverand yarn evenness and spinning performance are all related to drafting forceand its variation, the best quality yarns generally being produced with arelatively high break drafting force.7
Individual drives (motors) and sensor technologies enable a self-learningand a self-adjusting drafting process, draft optimisation taking place
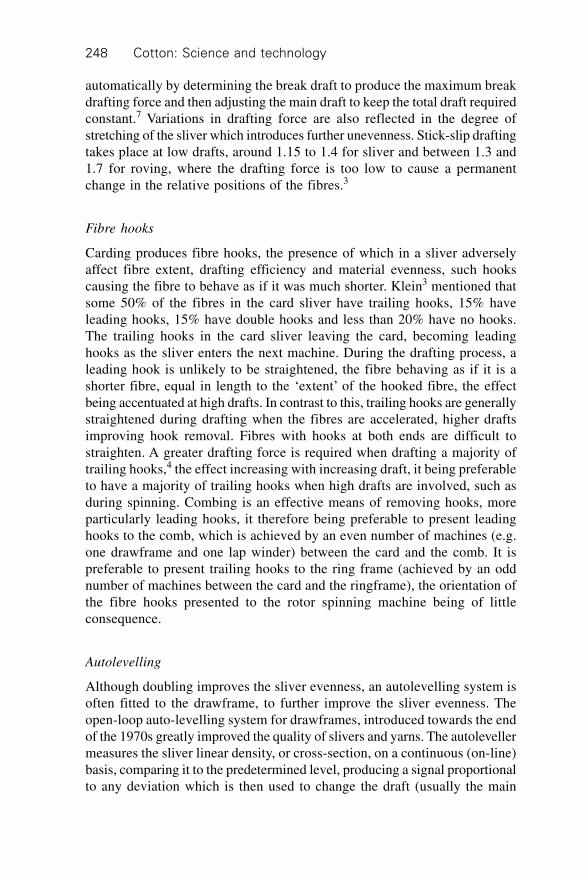
Cotton: Science and technology248
automatically by determining the break draft to produce the maximum breakdrafting force and then adjusting the main draft to keep the total draft requiredconstant.7 Variations in drafting force are also reflected in the degree ofstretching of the sliver which introduces further unevenness. Stick-slip draftingtakes place at low drafts, around 1.15 to 1.4 for sliver and between 1.3 and1.7 for roving, where the drafting force is too low to cause a permanentchange in the relative positions of the fibres.3
Fibre hooks
Carding produces fibre hooks, the presence of which in a sliver adverselyaffect fibre extent, drafting efficiency and material evenness, such hookscausing the fibre to behave as if it was much shorter. Klein3 mentioned thatsome 50% of the fibres in the card sliver have trailing hooks, 15% haveleading hooks, 15% have double hooks and less than 20% have no hooks.The trailing hooks in the card sliver leaving the card, becoming leadinghooks as the sliver enters the next machine. During the drafting process, aleading hook is unlikely to be straightened, the fibre behaving as if it is ashorter fibre, equal in length to the ‘extent’ of the hooked fibre, the effectbeing accentuated at high drafts. In contrast to this, trailing hooks are generallystraightened during drafting when the fibres are accelerated, higher draftsimproving hook removal. Fibres with hooks at both ends are difficult tostraighten. A greater drafting force is required when drafting a majority oftrailing hooks,4 the effect increasing with increasing draft, it being preferableto have a majority of trailing hooks when high drafts are involved, such asduring spinning. Combing is an effective means of removing hooks, moreparticularly leading hooks, it therefore being preferable to present leadinghooks to the comb, which is achieved by an even number of machines (e.g.one drawframe and one lap winder) between the card and the comb. It ispreferable to present trailing hooks to the ring frame (achieved by an oddnumber of machines between the card and the ringframe), the orientation ofthe fibre hooks presented to the rotor spinning machine being of littleconsequence.
Autolevelling
Although doubling improves the sliver evenness, an autolevelling system isoften fitted to the drawframe, to further improve the sliver evenness. Theopen-loop auto-levelling system for drawframes, introduced towards the endof the 1970s greatly improved the quality of slivers and yarns. The autolevellermeasures the sliver linear density, or cross-section, on a continuous (on-line)basis, comparing it to the predetermined level, producing a signal proportionalto any deviation which is then used to change the draft (usually the main
Cotton spinning technology 249
draft as opposed to the break draft) so as to correct for the deviation. Systemsused to measure the sliver linear density include tongue-and-groove, pneumatictrumpet, optical and capacitive. Such systems can be located at either theinput (open-loop) or output (closed-loop), or both, of the drawframe, theseoften being linked to computers for monitoring the state and performance ofthe drawframe, thereby enabling corrective action to be taken at the preciseposition in the sliver which needs to be corrected. The autoleveller drawframeis often used as the finisher passage in the drawing stages or as a singlepassage after the comber.
Open-loop autolevellers are largely aimed at correcting short- and medium-term deviations, measuring the sliver at the input side, i.e., at a point prior towhere corrective action (appropriate draft change) takes place, a time delaybeing used to delay the draft change until the deviation in sliver reaches thepoint where correction occurs. Closed-loop autolevellers correct medium-and long-term deviations, measuring the sliver after the point at which correctionhas taken place. Combined open- and closed-loop autolevellers, which correctshort, medium and long-term variations are also available.
8.3 Combing
Combing is used when high-quality fine cotton yarns (finer than approximately15 tex) are required, improving the fibre straightening and alignment andremoving short fibres, fibre hooks and any remaining neps and trash particles,thereby enabling finer, stronger, smoother and more uniform yarn to beproduced. Usually one, (sometimes two) drawframe passages are used priorto combing so as to straighten and orientate the fibre hooks, thereby enablingoptimum combing performance. The waste material removed duringcombing is referred to as noil (or sometimes as comber waste), the percentagenoil, which normally falls between about 5 and 15%, being calculated asfollows:
mass of noilmass of (noil + comb sliver)
100¥ 8.1
In preparation for combing, a number of drawframe slivers, are combinedin a ‘lap winder’ to produce a comber lap consisting of a closely spaced sheetof slivers wound onto a cylindrical holder. The speed of the lap winderexceeds 100 m/min, with a draft of between two and four, the high doublingcombined with the low draft result in a considerable improvement in theevenness of the lap. The correct tension is also required during the windingof the lap, too low a tension results in a soft lap, requiring more storagespace and which is also prone to damage during subsequent handling andtransport, while too high a tension makes it difficult to unwind the lap at thecomber, particularly the last few layers, sometimes leading to ‘split laps’.
Cotton: Science and technology250
The lap forms the input to the comber. Essentially the lap is combed anddrafted into fibre webs, which are layered at the comber table to form asandwich, which is drafted to form the combed sliver, the latter being coiledinto a can ready for the next stage, called ‘finisher’ drawing, using aconventional drawframe, with single or twin delivery and autolevelling. Thecombing machine can have some eight combing heads. Comb productionrates of up to 70 kg/hr, and nip speeds of up to 450 per min are not uncommon,with automatic lap change and transport and batt piecing and a self-cleaningtop comb.
Combing essentially entails the following actions (Fig. 8.4):4
∑ Feeding: fibres are fed so that a projecting fringe of fibres, held by nipjaws, are presented to the combing pins.
∑ Initial combing: the above fringe is combed by pins, which remove shortfibres not held, the longer ‘held’ fibres are straightened, with some fibrebreakage possible, broken fibre segments also being removed. The resultingfringe consists of aligned fibres and no entangled or short fibres.
∑ Final combing and drawing-off: the projecting fringe is gripped anddrawn through the pins, thereby eliminating any remaining entangledand short fibres.
∑ Sliver formation: the combed fibre fringes are overlapped to form acontinuous sliver.
∑ Noil removal: the short fibres, trash and imperfections are removedfrom the pins, by a rotating brush, with centrifugal forces releasing thenoil from the brush, the noil being transferred pneumatically to a container.
Since combing involves a number of doublings, the combed sliver iscorrespondingly much more even than the input drawframe slivers. In additionthe fibres are considerably more parallel, and there is a much reduced proportionof short fibres, fibre hooks and imperfections, such as neps and trash particles.Nevertheless, the sliver delivered by the combing head can have a periodicunevenness, with a wavelength between some 33 and 46 mm, due to theoverlapping of successive fibre tufts. Combing head slivers are fed into thecomb drawbox as doubling where they are drafted to produce slivers betweenabout 3 and 6 ktex in linear density. One or two drawframe passages (commonlysix doublings and a draft of six in each case), more often one, followed bythe roving operation, are applied subsequent to combing when producingcombed ring-spun yarn. Sliver condensing funnels, (e.g. off-set to one side),attention to fibre alignment and tuft-overlap distance, together with reversalof draft direction, all contribute to optimising sliver levelness. The efficiencyof combing is influenced by the number of hooks and the direction in whichthey are fed to the comb, slivers fed to the comb with a majority of leadinghooks being preferred, resulting in less noil and better hook removal, althoughat low detachment settings the reverse may hold.
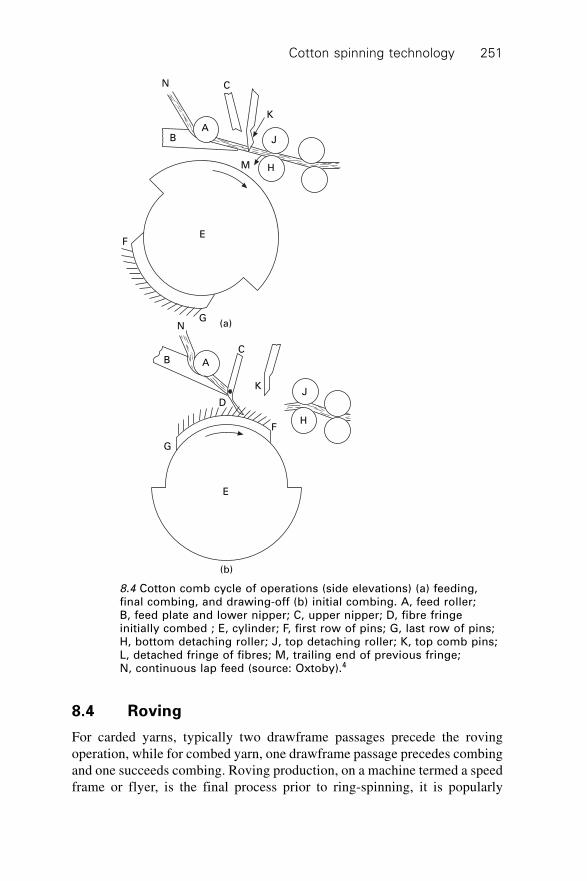
Cotton spinning technology 251
8.4 Roving
For carded yarns, typically two drawframe passages precede the rovingoperation, while for combed yarn, one drawframe passage precedes combingand one succeeds combing. Roving production, on a machine termed a speedframe or flyer, is the final process prior to ring-spinning, it is popularly
E
E
(b)
(a)
J
HF
G
D
K
C
AB
NG
F
J
HM
AB
N C
K
8.4 Cotton comb cycle of operations (side elevations) (a) feeding,final combing, and drawing-off (b) initial combing. A, feed roller;B, feed plate and lower nipper; C, upper nipper; D, fibre fringeinitially combed ; E, cylinder; F, first row of pins; G, last row of pins;H, bottom detaching roller; J, top detaching roller; K, top comb pins;L, detached fringe of fibres; M, trailing end of previous fringe;N, continuous lap feed (source: Oxtoby).4
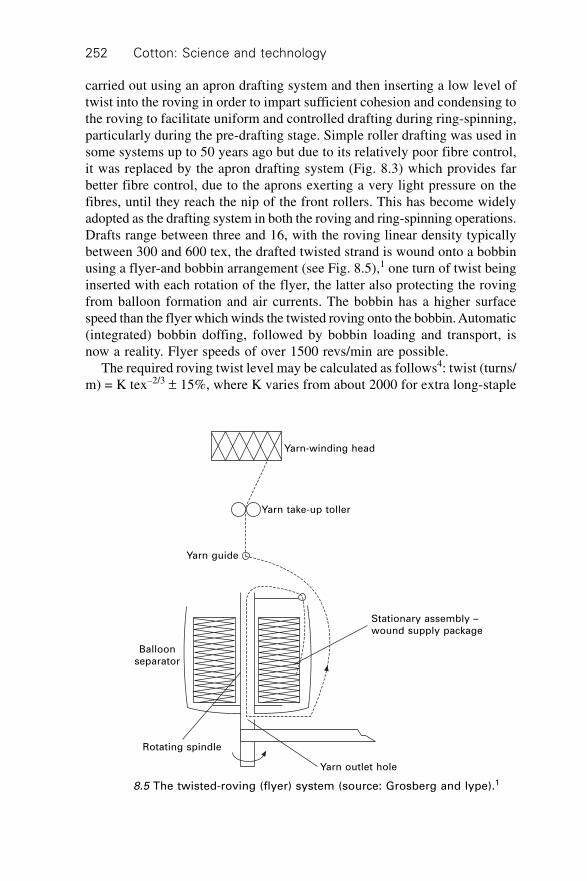
Cotton: Science and technology252
carried out using an apron drafting system and then inserting a low level oftwist into the roving in order to impart sufficient cohesion and condensing tothe roving to facilitate uniform and controlled drafting during ring-spinning,particularly during the pre-drafting stage. Simple roller drafting was used insome systems up to 50 years ago but due to its relatively poor fibre control,it was replaced by the apron drafting system (Fig. 8.3) which provides farbetter fibre control, due to the aprons exerting a very light pressure on thefibres, until they reach the nip of the front rollers. This has become widelyadopted as the drafting system in both the roving and ring-spinning operations.Drafts range between three and 16, with the roving linear density typicallybetween 300 and 600 tex, the drafted twisted strand is wound onto a bobbinusing a flyer-and bobbin arrangement (see Fig. 8.5),1 one turn of twist beinginserted with each rotation of the flyer, the latter also protecting the rovingfrom balloon formation and air currents. The bobbin has a higher surfacespeed than the flyer which winds the twisted roving onto the bobbin. Automatic(integrated) bobbin doffing, followed by bobbin loading and transport, isnow a reality. Flyer speeds of over 1500 revs/min are possible.
The required roving twist level may be calculated as follows4: twist (turns/m) = K tex–2/3 ± 15%, where K varies from about 2000 for extra long-staple
Yarn-winding head
Yarn take-up toller
Yarn guide
Yarn outlet hole
Rotating spindle
Balloonseparator
Stationary assembly –wound supply package
8.5 The twisted-roving (flyer) system (source: Grosberg and Iype).1
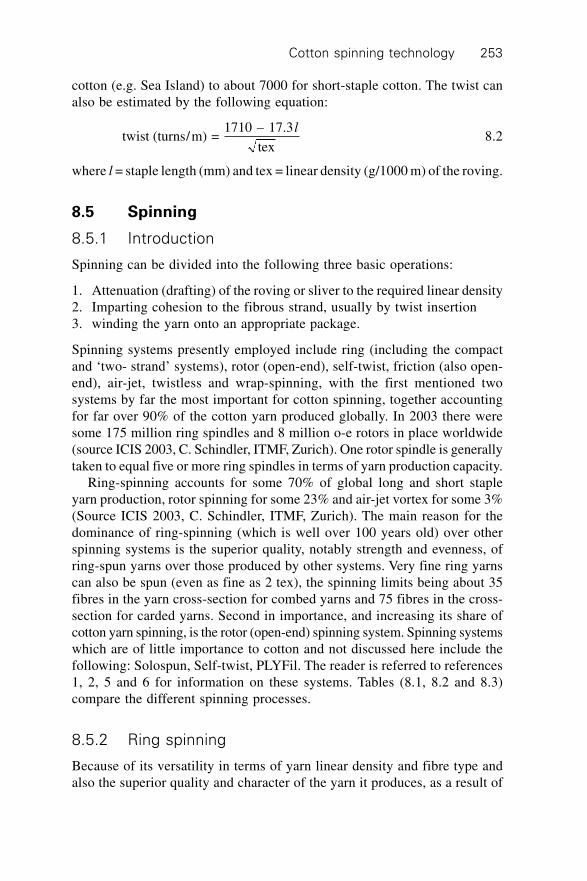
Cotton spinning technology 253
cotton (e.g. Sea Island) to about 7000 for short-staple cotton. The twist canalso be estimated by the following equation:
twist (turns/m) = 1710 – 17.3
tex
l8.2
where l = staple length (mm) and tex = linear density (g/1000 m) of the roving.
8.5 Spinning
8.5.1 Introduction
Spinning can be divided into the following three basic operations:
1. Attenuation (drafting) of the roving or sliver to the required linear density2. Imparting cohesion to the fibrous strand, usually by twist insertion3. winding the yarn onto an appropriate package.
Spinning systems presently employed include ring (including the compactand ‘two- strand’ systems), rotor (open-end), self-twist, friction (also open-end), air-jet, twistless and wrap-spinning, with the first mentioned twosystems by far the most important for cotton spinning, together accountingfor far over 90% of the cotton yarn produced globally. In 2003 there weresome 175 million ring spindles and 8 million o-e rotors in place worldwide(source ICIS 2003, C. Schindler, ITMF, Zurich). One rotor spindle is generallytaken to equal five or more ring spindles in terms of yarn production capacity.
Ring-spinning accounts for some 70% of global long and short stapleyarn production, rotor spinning for some 23% and air-jet vortex for some 3%(Source ICIS 2003, C. Schindler, ITMF, Zurich). The main reason for thedominance of ring-spinning (which is well over 100 years old) over otherspinning systems is the superior quality, notably strength and evenness, ofring-spun yarns over those produced by other systems. Very fine ring yarnscan also be spun (even as fine as 2 tex), the spinning limits being about 35fibres in the yarn cross-section for combed yarns and 75 fibres in the cross-section for carded yarns. Second in importance, and increasing its share ofcotton yarn spinning, is the rotor (open-end) spinning system. Spinning systemswhich are of little importance to cotton and not discussed here include thefollowing: Solospun, Self-twist, PLYFil. The reader is referred to references1, 2, 5 and 6 for information on these systems. Tables (8.1, 8.2 and 8.3)compare the different spinning processes.
8.5.2 Ring spinning
Because of its versatility in terms of yarn linear density and fibre type andalso the superior quality and character of the yarn it produces, as a result of
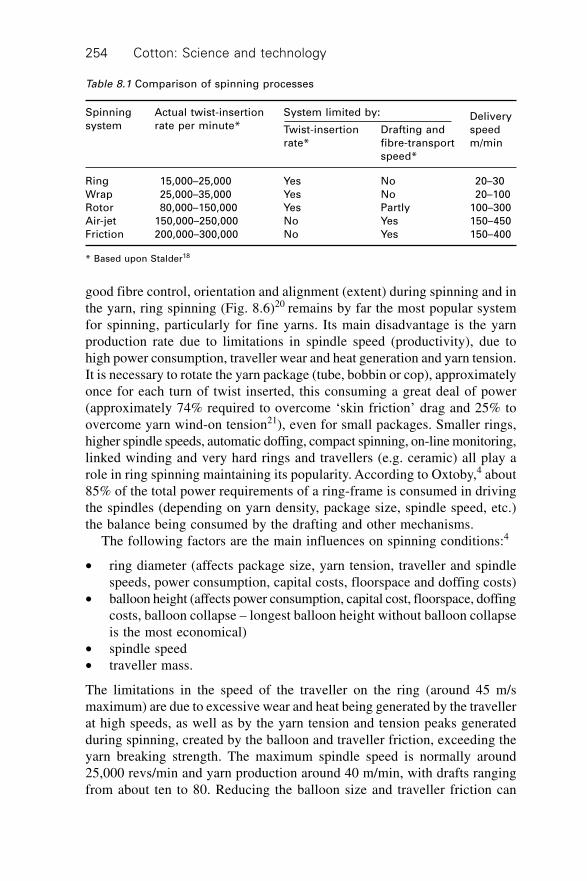
Cotton: Science and technology254
good fibre control, orientation and alignment (extent) during spinning and inthe yarn, ring spinning (Fig. 8.6)20 remains by far the most popular systemfor spinning, particularly for fine yarns. Its main disadvantage is the yarnproduction rate due to limitations in spindle speed (productivity), due tohigh power consumption, traveller wear and heat generation and yarn tension.It is necessary to rotate the yarn package (tube, bobbin or cop), approximatelyonce for each turn of twist inserted, this consuming a great deal of power(approximately 74% required to overcome ‘skin friction’ drag and 25% toovercome yarn wind-on tension21), even for small packages. Smaller rings,higher spindle speeds, automatic doffing, compact spinning, on-line monitoring,linked winding and very hard rings and travellers (e.g. ceramic) all play arole in ring spinning maintaining its popularity. According to Oxtoby,4 about85% of the total power requirements of a ring-frame is consumed in drivingthe spindles (depending on yarn density, package size, spindle speed, etc.)the balance being consumed by the drafting and other mechanisms.
The following factors are the main influences on spinning conditions:4
∑ ring diameter (affects package size, yarn tension, traveller and spindlespeeds, power consumption, capital costs, floorspace and doffing costs)
∑ balloon height (affects power consumption, capital cost, floorspace, doffingcosts, balloon collapse – longest balloon height without balloon collapseis the most economical)
∑ spindle speed∑ traveller mass.
The limitations in the speed of the traveller on the ring (around 45 m/smaximum) are due to excessive wear and heat being generated by the travellerat high speeds, as well as by the yarn tension and tension peaks generatedduring spinning, created by the balloon and traveller friction, exceeding theyarn breaking strength. The maximum spindle speed is normally around25,000 revs/min and yarn production around 40 m/min, with drafts rangingfrom about ten to 80. Reducing the balloon size and traveller friction can
Table 8.1 Comparison of spinning processes
Spinning Actual twist-insertion System limited by: Deliverysystem rate per minute* Twist-insertion Drafting and speed
rate* fibre-transport m/min
speed*
Ring 15,000–25,000 Yes No 20–30
Wrap 25,000–35,000 Yes No 20–100
Rotor 80,000–150,000 Yes Partly 100–300
Air-jet 150,000–250,000 No Yes 150–450
Friction 200,000–300,000 No Yes 150–400
* Based upon Stalder18

Co
tton
sp
inn
ing
tech
no
log
y2
55
Table 8.2 A general comparison of yarns spun by different spinning systems*
Property Ring-spun yarn Rotor-spun yarn Friction-spun yarn Air-jet-spun yarn
Tensile strength Good Lower than ring- Lower than ring- and Good
spun yarn rotor-spun yarn
Evenness Good Very good to good Satisfactory Good
Imperfections – – Fairly high –
Hairiness High – High –
Snarling tendency High Low Hign Low
Stiffness Low Higher than ring- Similar to rotor-spun High
spun yar yarn
Shrinkage – – – High
Twist structure Homogeneous Homogeneous except Inhomogeneous, with Inhomogeneous, along
across the length for the presence ring-spun-yarn the length with
and cross-section of systematically appearance in the untwisted core fibre
formed wrapper absence of bound in by the sheath
fibres systematically fibres
formed wrapper fibres
Fibre extent and – – Poorer than ring- –
orientation and rotor-spun yarn
* From Klein5,6

Cotton: Science and technology256
reduce the latter limitation. The tension on the yarn can be controlled by thetraveller, largely depending upon the frictional resistance of the travelleragainst the ring, which in turn is largely determined by the rotational speed.Requirements of the traveller include good heat dissipation, sufficient threadspace, matching of traveller size and shape to the ring flange and goodsliding properties.4
Table 8.3 Order of importance of fibre properties for different spinning systems19
Order of Ring Rotor (open-end) Air-jet Friction
importance
1 Length and Strength Fineness Strength
length
uniformity
2 Strength Fineness Cleanliness* Strength
3 Fineness Length and Strength Fineness
length uniformity
4 Cleanliness* Length and Length and
length length
uniformity uniformity
5 Fineness Cleanliness*
* Trash, dust, etc.
P
QT R
L
A
Yarn
To bobbin
Ring
Traveller T
8.6 The ringframe (source: Booth).20

Cotton spinning technology 257
The yarn tension (S) may be approximated as follows:22
Sm v
dL L L
R
sin
2
ªÈ
ÎÍ
˘
˚˙
ma 8.3
where mL = coefficient of friction between ring and traveller, mL = travellermass, a = angle between yarn from traveller to cop (tube) and a straight linefrom traveller to spindle axis, vL = traveller circumferential speed, and dR =ring diameter. The term in brackets represents the centrifugal force.
Yarn spinning tension is also affected by the length and diameter of theballoon, the use of balloon control or suppression devices (e.g. rings, andspindle attachments) enabling the yarn tensions in the balloon to be reducedby reducing the balloon, thereby allowing spinning speeds and/or packagesizes to be increased and power consumption to be reduced, traveller speedsas high as 45 m/s (or even 50 m/s) becoming possible when, for example,using sintered rings and nylon travellers. Rotating rings were explored asanother way to overcome traveller speed and yarn tension limitations butthey have not yet found wide application.
The input into the ring-frame can be twistless (rubbed) or twisted (flyer)rovings although in the case of cotton, it is virtually always the latter. Doubleapron drafting, optimum draft typically between 30 and 40 (break-draft around1.2), in some cases even as high as 60 for combed yarn,23 is generally usedin modern ring-frames, except in some of the high draft spinning systems,the drafting procedure and yarn formation determining the quality and structureof the yarn. Decreasing the width of the fibre ribbon at the exit of thedrafting system has been found to improve yarn quality and also to makehigher drafts feasible23 (see section 8.5.4).
Spinning production and cost are related to the level of twist inserted,which in turn is related to spinning efficiency (end breakage rate) and yarnproperties (notably tensile, bulk, hairiness and stiffness). The minimum twistrequired to produce acceptable spinning performance and yarn properties isnormally selected. Inserting twist into the yarn causes a reduction in the yarnlength, referred to as twist contraction, which is typically around 4% for a 20tex cotton yarn, but which depends upon the twist level. End breaks arecaused either by the yarn spinning tension exceeding the yarn strength, moreparticularly that of the yarn weak places, or by flaws, such as neps, vegetablematter and short fibres, in the input material. Krifa and Ethridge24 havereviewed research on cotton spinnability and developed a new spinningpotential definition which captures critical aspects of spinning performanceand yarn quality. It is generally held that surface fibres have the same angleof inclination to the yarn axis when yarns have the same twist factor (e.g.turns/cm tex ), and that such yarns therefore have a similar geometry.Typical twist factors for ring-spun cotton yarns are given in Table 8.4.3
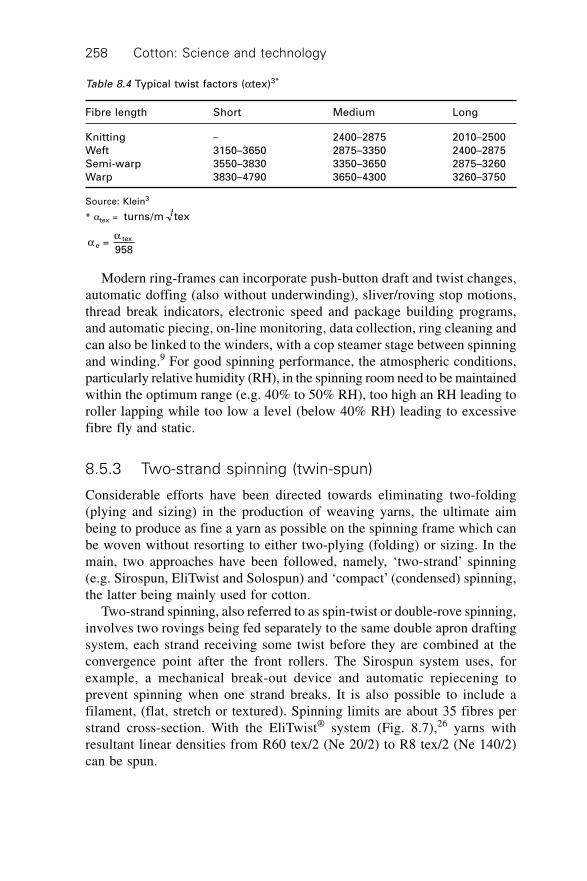
Cotton: Science and technology258
Modern ring-frames can incorporate push-button draft and twist changes,automatic doffing (also without underwinding), sliver/roving stop motions,thread break indicators, electronic speed and package building programs,and automatic piecing, on-line monitoring, data collection, ring cleaning andcan also be linked to the winders, with a cop steamer stage between spinningand winding.9 For good spinning performance, the atmospheric conditions,particularly relative humidity (RH), in the spinning room need to be maintainedwithin the optimum range (e.g. 40% to 50% RH), too high an RH leading toroller lapping while too low a level (below 40% RH) leading to excessivefibre fly and static.
8.5.3 Two-strand spinning (twin-spun)
Considerable efforts have been directed towards eliminating two-folding(plying and sizing) in the production of weaving yarns, the ultimate aimbeing to produce as fine a yarn as possible on the spinning frame which canbe woven without resorting to either two-plying (folding) or sizing. In themain, two approaches have been followed, namely, ‘two-strand’ spinning(e.g. Sirospun, EliTwist and Solospun) and ‘compact’ (condensed) spinning,the latter being mainly used for cotton.
Two-strand spinning, also referred to as spin-twist or double-rove spinning,involves two rovings being fed separately to the same double apron draftingsystem, each strand receiving some twist before they are combined at theconvergence point after the front rollers. The Sirospun system uses, forexample, a mechanical break-out device and automatic repiecening toprevent spinning when one strand breaks. It is also possible to include afilament, (flat, stretch or textured). Spinning limits are about 35 fibres perstrand cross-section. With the EliTwist® system (Fig. 8.7),26 yarns withresultant linear densities from R60 tex/2 (Ne 20/2) to R8 tex/2 (Ne 140/2)can be spun.
Table 8.4 Typical twist factors (atex)3*
Fibre length Short Medium Long
Knitting – 2400–2875 2010–2500
Weft 3150–3650 2875–3350 2400–2875
Semi-warp 3550–3830 3350–3650 2875–3260
Warp 3830–4790 3650–4300 3260–3750
Source: Klein3
* atex = turns/m tex
a
ae
tex = 958

Cotton spinning technology 259
8.5.4 Compact (condensed) and related spinningsystems
Following upon the two-strand spinning developments, further work wasundertaken to produce ring-spun singles yarns with superior properties (notablytensile, hairiness, abrasion and pilling). Considerable success has been achievedand compact spinning systems were commercially introduced in the 1990s,in some cases enabling combed yarns to be replaced by carded yarns andtwo-ply yarns by single yarns. Compact spinning has caused a revival in ringspinning, and compact yarns fetch a premium price. Examples of compact/condensed spinning systems include the EliTe spinning system of Suessen,ComforSpin® (Com4)® of Rieter, CompACT3 of Zinser and RoCoS ofRotorcraft.
The width of the fibre ribbon (±4 mm) in the drafting zone is wider thanthat of the spinning triangle, resulting in the fibres at the edge not beingintegrated into the yarn core or else not being properly integrated. The fibreribbon emerging from the front rollers of the spinning machine is twisted toform a yarn, forming a ‘spinning triangle’ in the process. During twist insertion,
Z
Tz
T2 T1
ACompacted
Lattice apron
Clamping line
8.7 Two-strand spinning EliTwist (source: Ramasubbu, SpindelfabrikSuessen GmbH).
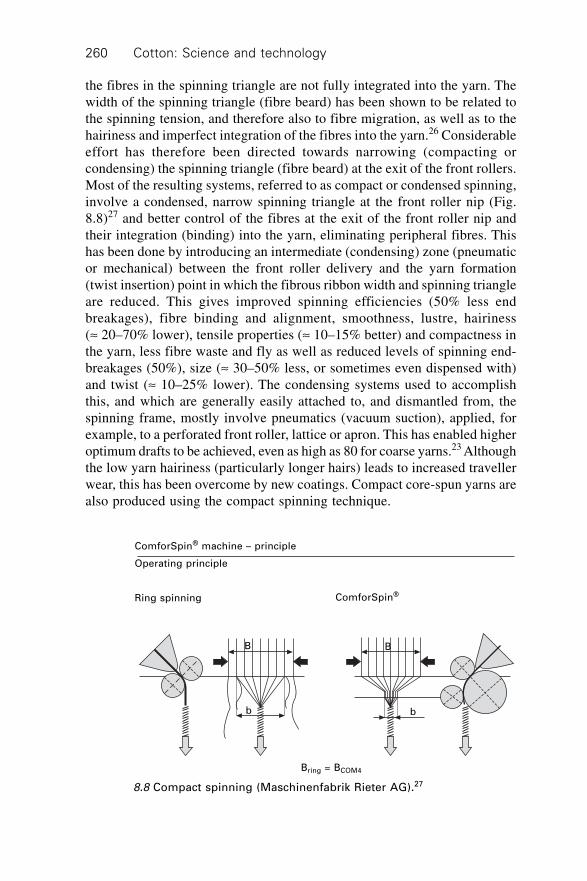
Cotton: Science and technology260
the fibres in the spinning triangle are not fully integrated into the yarn. Thewidth of the spinning triangle (fibre beard) has been shown to be related tothe spinning tension, and therefore also to fibre migration, as well as to thehairiness and imperfect integration of the fibres into the yarn.26 Considerableeffort has therefore been directed towards narrowing (compacting orcondensing) the spinning triangle (fibre beard) at the exit of the front rollers.Most of the resulting systems, referred to as compact or condensed spinning,involve a condensed, narrow spinning triangle at the front roller nip (Fig.8.8)27 and better control of the fibres at the exit of the front roller nip andtheir integration (binding) into the yarn, eliminating peripheral fibres. Thishas been done by introducing an intermediate (condensing) zone (pneumaticor mechanical) between the front roller delivery and the yarn formation(twist insertion) point in which the fibrous ribbon width and spinning triangleare reduced. This gives improved spinning efficiencies (50% less endbreakages), fibre binding and alignment, smoothness, lustre, hairiness(ª 20–70% lower), tensile properties (ª 10–15% better) and compactness inthe yarn, less fibre waste and fly as well as reduced levels of spinning end-breakages (50%), size (ª 30–50% less, or sometimes even dispensed with)and twist (ª 10–25% lower). The condensing systems used to accomplishthis, and which are generally easily attached to, and dismantled from, thespinning frame, mostly involve pneumatics (vacuum suction), applied, forexample, to a perforated front roller, lattice or apron. This has enabled higheroptimum drafts to be achieved, even as high as 80 for coarse yarns.23 Althoughthe low yarn hairiness (particularly longer hairs) leads to increased travellerwear, this has been overcome by new coatings. Compact core-spun yarns arealso produced using the compact spinning technique.
ComforSpin® machine – principle
Operating principle
Ring spinning ComforSpin®
Bring = BCOM4
b
BB
b
8.8 Compact spinning (Maschinenfabrik Rieter AG).27

Cotton spinning technology 261
8.5.6 Bicomponent spinning
Bicomponent yarns, also referred to as bound yarns, have a niche market,these generally combining pre-spun continuous filament yarns (sometimeseven staple yarns) with staple fibres to provide improved properties, such asstretch (e.g. Lycra), abrasion and strength. The filament yarn can either becovered by the cotton sheath (i.e. be in the core of the yarn) or be wrappedaround the outside of the yarn, the former being the more common, exceptin the case of wrapper yarns which are produced in a different way asdiscussed later in this chapter.
Bicomponent spinning (see Fig. 8.9)28 normally involves twistingtogether either a filament (sometimes water soluble) and a conventionallydrafted staple (cotton) strand during the spinning operation, and is particularlyattractive for the cost-effective production of superior yarns which can,for example, be woven or knitted without any further operations (i.e.eliminating plying, sizing and steaming). It also enables coarser fibres tobe spun into finer yarns, reduces spinning end breakages, allows higherwinding speeds and enables yarn and fabric properties to be engineered bysuitable selection of the two components and the way in which they arecombined. On the negative side, the filament is expensive and bicomponentyarns are generally not pure cotton or torque-balanced and producefabrics which are generally more streaky and air permeable and have moreconspicuous joints. A suitable type of ‘break-out device’ can be used toprevent the production of a single component yarn should one of thecomponents break.
Drafting zone
Ring spindle
Roving
Filament guide
Secondary component(filament or pre-spun yarn)
8.9 Bicomponent spinning (source: IWS Wool Profiles).28
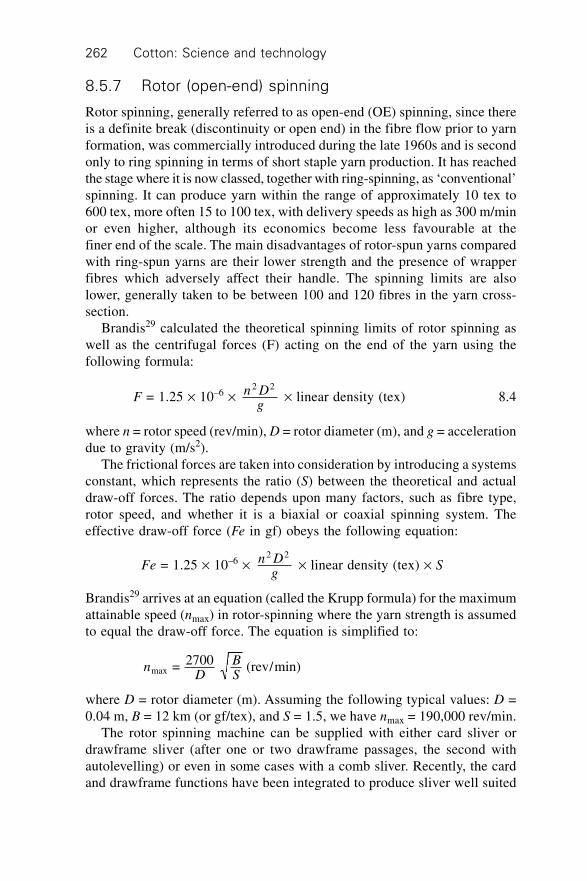
Cotton: Science and technology262
8.5.7 Rotor (open-end) spinning
Rotor spinning, generally referred to as open-end (OE) spinning, since thereis a definite break (discontinuity or open end) in the fibre flow prior to yarnformation, was commercially introduced during the late 1960s and is secondonly to ring spinning in terms of short staple yarn production. It has reachedthe stage where it is now classed, together with ring-spinning, as ‘conventional’spinning. It can produce yarn within the range of approximately 10 tex to600 tex, more often 15 to 100 tex, with delivery speeds as high as 300 m/minor even higher, although its economics become less favourable at thefiner end of the scale. The main disadvantages of rotor-spun yarns comparedwith ring-spun yarns are their lower strength and the presence of wrapperfibres which adversely affect their handle. The spinning limits are alsolower, generally taken to be between 100 and 120 fibres in the yarn cross-section.
Brandis29 calculated the theoretical spinning limits of rotor spinning aswell as the centrifugal forces (F) acting on the end of the yarn using thefollowing formula:
F = 1.25 ¥ 10–6 ¥ n Dg
2 2 ¥ linear density (tex) 8.4
where n = rotor speed (rev/min), D = rotor diameter (m), and g = accelerationdue to gravity (m/s2).
The frictional forces are taken into consideration by introducing a systemsconstant, which represents the ratio (S) between the theoretical and actualdraw-off forces. The ratio depends upon many factors, such as fibre type,rotor speed, and whether it is a biaxial or coaxial spinning system. Theeffective draw-off force (Fe in gf) obeys the following equation:
Fe = 1.25 ¥ 10–6 ¥ n Dg
2 2 ¥ linear density (tex) ¥ S
Brandis29 arrives at an equation (called the Krupp formula) for the maximumattainable speed (nmax) in rotor-spinning where the yarn strength is assumedto equal the draw-off force. The equation is simplified to:
nD
BSmax = 2700 (rev/min)
where D = rotor diameter (m). Assuming the following typical values: D =0.04 m, B = 12 km (or gf/tex), and S = 1.5, we have nmax = 190,000 rev/min.
The rotor spinning machine can be supplied with either card sliver ordrawframe sliver (after one or two drawframe passages, the second withautolevelling) or even in some cases with a comb sliver. Recently, the cardand drawframe functions have been integrated to produce sliver well suited
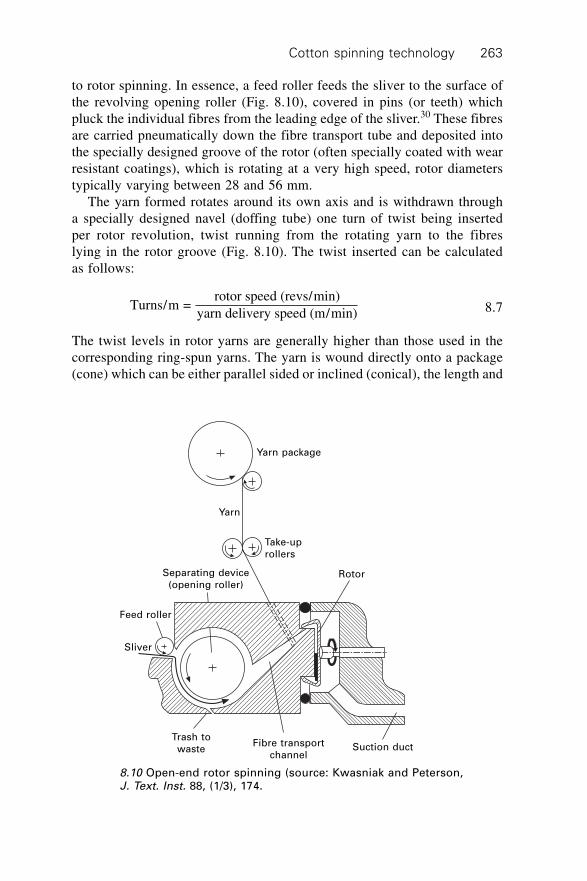
Cotton spinning technology 263
to rotor spinning. In essence, a feed roller feeds the sliver to the surface ofthe revolving opening roller (Fig. 8.10), covered in pins (or teeth) whichpluck the individual fibres from the leading edge of the sliver.30 These fibresare carried pneumatically down the fibre transport tube and deposited intothe specially designed groove of the rotor (often specially coated with wearresistant coatings), which is rotating at a very high speed, rotor diameterstypically varying between 28 and 56 mm.
The yarn formed rotates around its own axis and is withdrawn througha specially designed navel (doffing tube) one turn of twist being insertedper rotor revolution, twist running from the rotating yarn to the fibreslying in the rotor groove (Fig. 8.10). The twist inserted can be calculatedas follows:
Turns/m = rotor speed (revs/min)
yarn delivery speed (m/min) 8.7
The twist levels in rotor yarns are generally higher than those used in thecorresponding ring-spun yarns. The yarn is wound directly onto a package(cone) which can be either parallel sided or inclined (conical), the length and
Trash towaste
Fibre transportchannel
Suction duct
Rotor
Sliver
Feed roller
Separating device(opening roller)
Take-uprollers
Yarn
Yarn package
8.10 Open-end rotor spinning (source: Kwasniak and Peterson,J. Text. Inst. 88, (1/3), 174.

Cotton: Science and technology264
evenness of the yarn being monitored in the process. Yarns destined forknitting can also be waxed at this stage. The yarn structure comprises:
∑ a core, similar to ring spun yarns,∑ a sheath of fibres wrapped around the core and∑ wrapper fibres (Fig. 8.11)31 wrapped tightly around the yarn almost at
right angles to the yarn axis, these represent one of the main drawbacksof rotor-spun yarns.
The core of the yarn is largely responsible for its strength, the sheath largelydetermines the yarn bulk and handle, while the frequency of wrapper fibresaffects the yarn handle (harshness).
Drafts are normally of the order of 100 to 200, but could be as high as 400(higher drafts having some benefits in terms of yarn quality), with rotorspeeds ranging from about 40,000 revs/min to 150,000 revs/min, being inverselyrelated to the rotor diameter, the limiting speed being regarded as about180,000 revs/min.32 The yarn properties are affected by33 rotor groove shape(angle, radius, depth), rotor diameter, rotor speed, doffing tube (navel) propertiesand rotor wall inclination and friction. The navel material generally consistsof high quality ceramic. Efficient and automatic rotor cleaning and yarnpiecing are both critically important, input sliver relatively free of dust andtrash is also important.
(a) (b)
(c) (d)
IEIE
IE
IE
8.11 Wrapper fibres (source: Lünenschloss and Kampen).31

Cotton spinning technology 265
Automation (rotor cleaning, piecing and doffing) has reached highlevels in rotor spinning, with on-line yarn quality monitoring (includinglong-term yarn linear density variations) and fault classifying and clearing,using optical or capacitance systems, as well as waxing taking place duringspinning. Yarn packages of up to 6 kg, suitable for subsequent fabricmanufacturing, (e.g. 4∞20 conical packages) can be produced directly on therotor spinning machine. Systems, such as the Schlafhorst Corolab opticalmonitoring system, enable unwanted faults, including foreign fibres, to bemonitored classified and removed. Core-spun and elastic core-spun yarns(e.g. core entered through the rotor shaft) yarns as well as fancy yarns (e.g.by intermittent changing of sliver intake speed) are also produced on rotorspinning machines.
8.5.8 Air-jet spinning
Air-jet spinning, also termed Vortex spinning, introduced in the 1980s,produces yarn typically in linear densities from about 5 tex to 40 tex, atspeeds of up to 400 m/min or even higher. The processes prior to air-jetspinning are similar to those used for rotor-spinning, although combing ismore often used in preparation since dust and trash can obstruct the spinningjets. The yarn more closely resembles, but is weaker than, ring-spun yarns.Air storage (accumulator) systems are not suitable at such high speeds andthe yarn storage system of the machine is similar to that of a weavingmachine yarn storage feeder, which is self threading, and constantly storesand discharges yarn.7
Drawframe sliver (often combed) is supplied to the air-jet spinner, withtwist being inserted to the fibres, largely on the yarn surface, by the vortexcreated in one or two air-jet nozzles, generally only one when spinning100% cotton, the yarn structure therefore consisting of a core of largelyparallel fibres and a sheath of wrapped (twisted) fibres. The Muratec (Murata)true twist air jet (vortex) spinning process (MVS), introduced in 1997, hasproved to be the most successful for the spinning of pure cotton yarns, ahighly productive core-spinning version having also been introduced. TheMuratec MVS system (Fig. 8.1234) uses a four-line roller drafting systemwith a unique guide (spindle), a needle holder and a single air nozzle toimpart true (real) twist to the yarn.
Combing is generally advisable for spinning fine cotton air-jet yarns,generally higher fibre loss, mainly short fibres, occurs during air-jet spinningthan during ring-spinning Zeng et al.35 have reported on factors which affectthe twist inserted during air-jet spinning, this being a function of nozzlepressure, flow rate, jet orifice angle and diameter, also using neural networksto predict yarn tenacity.36

Cotton: Science and technology266
8.5.9 Friction spinning
Although cotton, either in 100% or in blends with other fibres, is spun on thefriction spinning system, the percentage is very low. The reason for this islargely to be found in the lower quality, strength in particular, of frictionspun cotton yarns compared with ring- and rotor-spun yarns due to the lowerefficiency of the yarn structure (relative low orientation, extent and packingof fibres), as well as in the fact that the fibre feed speed is too high and yarntensile force too low for fibre binding at the yarn end.37 Friction spun yarnare weaker and more twist lively than other yarns, although plying canreduce these drawbacks. Ishtiaque et al.5 have thoroughly reviewed publishedliterature on friction spinning. The spinning limits for friction spinning cottonare around 100 to 120 fibres in the yarn cross-section,38 although themanufacturers recommend 150 for the DREF-3 in order to avoid frequentend-breaks.
In friction spinning, twist is inserted into the yarn by a rolling action dueto frictional forces generated between, for example, two perforated rollersand the yarn surface, it being relatively easy to produce core-spun yarns byintroducing a filament yarn which is then wrapped by a sheath of staplefibres. Friction spinning can also be classified under the broad category of‘open-end spinning’, since the sliver feed is ‘broken’ (i.e. discontinuous)prior to yarn formation (twist insertion). The latter takes place as a result offrictional forces, produced aero-dynamically, acting on the fibres within thespinning zone. Examples of friction spinning systems are the DREF (FehrerAG) and Masterspinner (Platt-Saco-Lowell).
Package
Yarn clearing
Nozzle
Sliver
Drafting
8.12 Murata vortex spinning (source: Murata (Muratec)).34
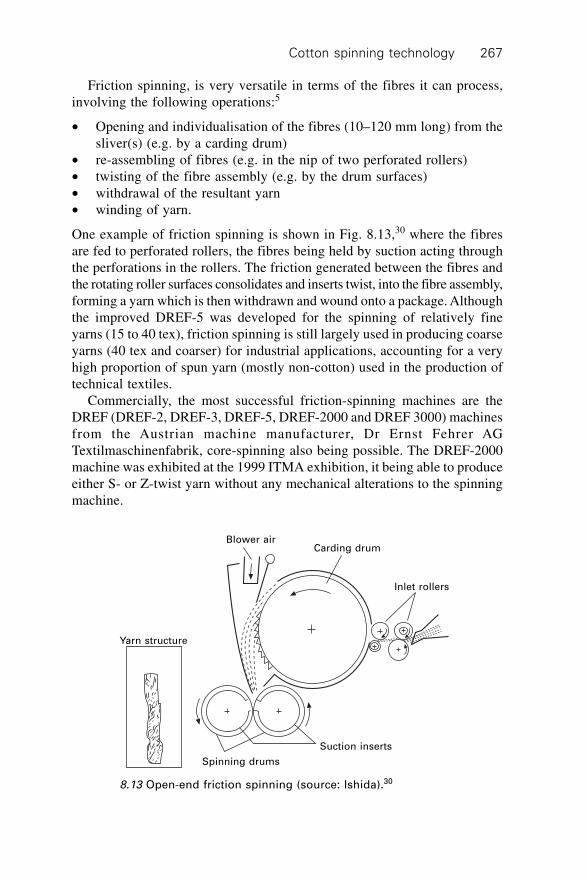
Cotton spinning technology 267
Friction spinning, is very versatile in terms of the fibres it can process,involving the following operations:5
∑ Opening and individualisation of the fibres (10–120 mm long) from thesliver(s) (e.g. by a carding drum)
∑ re-assembling of fibres (e.g. in the nip of two perforated rollers)∑ twisting of the fibre assembly (e.g. by the drum surfaces)∑ withdrawal of the resultant yarn∑ winding of yarn.
One example of friction spinning is shown in Fig. 8.13,30 where the fibresare fed to perforated rollers, the fibres being held by suction acting throughthe perforations in the rollers. The friction generated between the fibres andthe rotating roller surfaces consolidates and inserts twist, into the fibre assembly,forming a yarn which is then withdrawn and wound onto a package. Althoughthe improved DREF-5 was developed for the spinning of relatively fineyarns (15 to 40 tex), friction spinning is still largely used in producing coarseyarns (40 tex and coarser) for industrial applications, accounting for a veryhigh proportion of spun yarn (mostly non-cotton) used in the production oftechnical textiles.
Commercially, the most successful friction-spinning machines are theDREF (DREF-2, DREF-3, DREF-5, DREF-2000 and DREF 3000) machinesfrom the Austrian machine manufacturer, Dr Ernst Fehrer AGTextilmaschinenfabrik, core-spinning also being possible. The DREF-2000machine was exhibited at the 1999 ITMA exhibition, it being able to produceeither S- or Z-twist yarn without any mechanical alterations to the spinningmachine.
Yarn structure
Spinning drums
Suction inserts
Inlet rollers
Carding drumBlower air
8.13 Open-end friction spinning (source: Ishida).30

Cotton: Science and technology268
8.5.10 Wrap (hollow spindle) spinning
Hollow spindle wrap-spinning (Fig. 8.14)28 shown at the 1975 Milan ITMAin which continuous filament yarn, usually a fine one, on a hollow spindle,is wrapped around an untwisted staple core (the latter accounting for typically80 to 95% of the yarn composition) which has passed through a doubleapron drafting system. One revolution of the hollow spindle inserts one turn(wrap or twist) of the filament around the staple core.
In plain yarns, the number of wraps required per unit length is generallyvery similar to the number of turns (twists) per unit length used for theequivalent ring-spun yarns. Yarn delivery speeds of 200 m/min and lineardensities between about 20 tex and 500 tex are possible. The economics tendto favour wrap-spinning for yarns coarser than about 50 tex. Such yarn is nottwist lively and has a soft handle, the yarn being more suitable for coarsecount knitting than for weaving. Wrap-spun yarns tend to be less hairy andbulky and equal to, or better, in strength and evenness and can be spun finerthan the ring yarn equivalent. Spinning limits generally lie between about 40and 70 fibres in the yarn cross-section. The fine filament wrapper is expensive,however, representing a serious constraint.
8.5.11 Fibre migration
Fibre migration, more correctly lateral fibre migration, popularly refers tothe radial movement of a fibre within the yarn cross-section. Fibre migration
Draft zone
Hollow spindle
Delivery rollers
Silver input
Filament binder
Filament Cop
Take-off rollers
Take-up package
8.14 Wrap spinning (source: IWS Wool Profiles).28

Cotton spinning technology 269
(variable helix angle at different positions along the fibre length) determinesthe yarn structure and properties and can be characterised by:4
∑ mean fibre radial position∑ migration amplitude∑ mean migration intensity (i.e. rate of change of radial position).
Relatively highly tensioned fibres, or fibre segments, move (migrate) towardsthe yarn core or centre, while relatively low-tensioned fibres or fibre segmentsmove towards the outer layers or surface of the yarn. Similarly, coarse orstiff fibres migrate towards the yarn surface while fine or flexible fibresmigrate towards the yarn core. Also, as a consequence of the above, longerfibres tend to migrate towards the yarn core and shorter fibres towards theyarn surface.
8.6 Spinning limits and yarn irregularity
The raw material (fibre) represents between 50 and 75% of the cost ofproducing a cotton yarn, various studies having shown that fibre fineness isone of the most important fibre properties in terms of spinning performanceand limits and yarn quality. This is largely because of its effect on thenumber of fibres in the yarn cross-section when yarn linear density (count)is constant. Equally, if not more, important, is mean fibre length, followedby fibre strength, length distribution (CV and short fibres), fibre friction andcohesion (see Table 8.4). For cotton ring spinning, spinning limits are normallytaken to be about 50 fibres (average for carded and combed yarns) in theyarn cross-section although commercial spinning limits are often higher.Generally around 40 to 50 end breaks per 1000 spindle hours represent themaximum acceptable limits for commercial spinning of cotton.
The average number of fibres (n) in the yarn cross-section can be calculatedas follows:
n = 1000 yarn linear density (tex)
Fibre fineness (mtex)¥
8.8
According to Martindale,39 the limiting (or ideal) yarn irregularity (CVL),assuming completely random distribution of fibres, can be calculated asfollows:
CV (%) = 100
1 + 4CV100
L
D2
ÊË
ˆ¯
ÏÌÓ
¸˝˛
n8.9
where CVD is the coefficient of variation of fibre diameter.

Cotton: Science and technology270
An irregularity index (I), for yarns and slivers, is also often used to providea measure of the yarn unevenness relative to the fibre used. I can be calculatedas follows:
I = CV(%)
CVL8.10
For cotton this becomes:
In
= CV(%)
1068.11
where CV(%) = actual or measured yarn or sliver irregularity and n = thenumber of fibres in the yarn (or sliver) cross-section, calculated accordingto, e.g., equ 8.8.
8.7 Yarn twisting (folding)
Yarn twisting or folding is normally applied to improve yarn evenness (CV)
(by a factor of 1N
, where N is the number of yarns folded), strength,
extension and abrasion resistance and to reduce twist liveliness (torque) bybalanced twist, hairiness and fibre shedding (fly) and to produce speciality(fancy) yarns. Balanced twist is normally achieved when the plying (folding)twist is approximately two-thirds that of the singles yarn twist, and in theopposite direction.
The twisting operation, also referred to as plying or folding, is the processwhereby two (sometimes more) yarns are twisted to form a two-ply (ormulti-ply) yarn. Traditionally, this was done on a ring-frame (ring-twister)but today it is almost exclusively carried out on a two-for-one twistingmachine (Fig. 8.15),1 three-for-one twisting systems having also beendeveloped. Assembly winding is used to assemble two ends of yarn on onepackage in preparation for two-for-one twisting. It is particularly importantto ensure that the two yarns are wound at the same tension. The assemblywound package remains stationary, the yarn passing through a guide mountedon a rotating arm which can freely rotate, through the hollow rotating spindle,then through an eyelet (outlet hole) and from there via a yarn guide and yarntake-up rollers to the yarn winding head. One revolution of the spindleinserts one turn of twist into the yarn while the rotating eyelet simultaneouslyinserts a turn of twist in the yarn in the balloon. Thus two turns are insertedper spindle revolution. Spindle speeds as high as 13,500 revs/min and deliveryspeeds up to 60 m/min are possible, the unit can be with or without ballooncontrol. Lorenz40 has reviewed yarn twisting.

Cotton spinning technology 271
8.8 Winding, clearing and lubrication
Winding, re-winding as it is sometimes called, is aimed at transferring theyarn from the spinning packages (referred to as tubes, cops or bobbins),which normally hold relatively short lengths of yarn, into packages (cones,cheeses, etc.) which can hold considerably longer lengths of yarn moresuitable for the subsequent processes, such as yarn preparation, weaving,knitting, package dyeing, etc. The winding process also provides an opportunityfor unwanted yarn faults (e.g. slubs and thin or weak places, foreign fibres,trash, etc.) to be classified and removed (i.e. yarn clearing) and the yarnto be lubricated. The latter is often referred to as waxing in the case ofknitting since it entails the use of a solid wax disc for lubricating the yarn.Clearers may be either of the capacitance or optical types or even a combinationof these.
Splicing, for example, pneumatic (the most popular), thermal (mostly forwool and wool blends) and injection (small quantities of water), is widelyused today, giving joints of acceptable strength (over 90% of the yarn strength)and appearance. On-line monitoring of winding is carried out, mainly toprovide exact length measurement and control, yarn path and winding speedcontrol as well as to provide the necessary management information. On-line
8.15 Two-for-one twisting (source: Grosberg and Iype1).
Traverse
Flyer spinning
Cotton: Science and technology272
monitoring of yarn quality and tension, as well as tension regulating havealso been introduced.
Automation (package changing, yarn jointing, etc.), higher speeds (up to2000 m/min) and yarn monitoring and clearing systems characterise modernwinders, as well as electronic monitoring systems which enable simulationof the yarn appearance on a wrapping board or in a woven or knitted fabric.Automatic linkages between spinning machines and winders, together within-line steaming (setting) of yarn, are also increasingly being used. Maintainingyarn tension also enables twist-lively (i.e. unsteamed) yarn to be wound.
8.9 Yarn steaming (setting)
Yarn is steamed (heat set) in an autoclave after spinning so as to reduce oreliminate the twist liveliness (torque) and snarling tendency of the yarn andthereby facilitate the subsequent winding and twisting (folding) of the yarnand to avoid fabric distortion (e.g. spirality in knitted fabric). In-line steamingon conveyers has also been introduced while some modern winders enabletwist-lively yarn to be wound. Different steaming conditions can be employedto achieve the desired effect but it is important to regulate the setting temperatureand time, particularly the former, in order to avoid fibre yellowing anddamage and ensure consistency of steaming conditions. Longer steamingtimes, rather than higher temperatures, are preferred if the setting effect isnot adequate.
8.10 Conclusions
It is likely that within the near future, developments in spinning preparationand spinning will be incremental rather than revolutionary. Developmentsare likely to include further increases in production speeds as well as in thelinking, integration and automation of production processes. ‘Intelligent’and on-line monitoring and control, using expert and other advanced softwaresystems, are also expected to feature increasingly. Although ring spinning,followed in importance by rotor spinning, is expected to continue its dominantrole within the foreseeable future, unconventional spinning systems, such asair-jet and friction, are likely to be improved so that better quality cotton andcotton blend yarns can be spun, particularly in terms of the yarn structureand quality.
8.11 References
1. Grosberg, P. and Iype, C., Yarn Production: Theoretical Aspects, The Textile Institute,Manchester UK, 1999.
2. Lord, P.R., Handbook of Yarn Production: Technology, Science and Economics, TheTextile Institute, CRC Press and Woodhead Publishing Ltd, 2003.

Cotton spinning technology 273
3. Klein, W., Manual of Textile Technology: Short-staple Spinning Series, Vol 1 (2ndedn), The Technology of Short-staple Spinning, The Textile Institute, Manchester1998.
4. Oxtoby, E., Spun Yarn Technology, Butterworths & Co., London, 1987.5. Ishtiaque, K.R., Salhotra, K.K. and Gowda, R.V.M., Friction Spinning, Text. Progr.,
2003, 33 (2).6. Klein, W., Manual of Textile Technology: Short-staple Spinning Series, Vol 5, New
Spinning Systems, The Textile Institute, Manchester 1993.7. Artzt, P., Short Staple Spinning: Quality Assurance and Increased Productivity, ITB
Int. Text Bull, 2003, 49 (6), 10.8. Lord, P.R. and Grover, G., Roller Drafting, Text. Progr., 1993, 23 (4).9. Hunter, L., Wool: Science and Technology, (Simpson, W.S. and Crawshaw, G.H.
(eds)), The Textile Institute and Woodhead Publishing Ltd, 2002, Chapter 6, 160.10. Basu, A., Progress in Air-Jet Spinning, Text. Progr., 1997, 29 (3).11. Shaw, J., Short-staple Ring-spinning, Text. Progr., 1980, 12 (2).12. Lawrence, C.A. and Chen, K.Z., Rotor Spinning, Text. Progr., 1981, 13 (4).13. Hunter, L., The Production and Properties of Staple-fibre yarns made by Recently
Developed Techniques, Text. Progr., 1978, 10 (1/2).14. Barella, A. and Manich, A.M., Yarn Hairiness: A Further Update, Text. Progr., 2001,
31 (4).15. Rowe, T. (ed.), Busby, K.P., Halfpenny, J.R. and Holmes, D.A., An Introduction to
Textiles Volume II – Yarns, (Comett, Eurotex), School of Textile Studies, BoltonInstitute, UK.
16. Klein, W., Manual of Textile Technology: Short-staple Spinning Series: Vol 4, A
Practical Guide to Ring Spinning, The Textile Institute, Manchester.17. Das, A., Ishtiaque, S.M. and Kumar, R., Study on Drafting Force of Rovings: Part I
– Effect of Process Variables, Indian J. Fibre & Text. Res., 2004, 29 (2), 173 Part II– Effect of Material Variables, 2004, 29 (2), 179.
18. Stalder, H., Short Staple Spinning Systems: Possibilities and Limitations, Text Month,1984 Sept, 12.
19. Deussen, H., Cotton’s Role in the New Technologies, Text Month, 1984 Nov, 41.20. Booth, J.E., Textile Mathematics, Vol II, The Textile Institute, Manchester, UK,
1975, 350.21. Tang, Z-X, and Wang, X., Distribution of Power Requirements during Yarn Winding
in Ring Spinning, Text. Res. J., 2004, 74 (8), 735.22. Stalder, H., High Performance Ring Spinning, Mell. Textilber., 1991, 72 (8), E245, 585.23. Anon., The Long and the Short of it: Continuing the Search for ‘New’ Spinning
Systems, ITS Textile Leader, 1994, 15/94, 51.24. Krifa, M. and Ethridge, M., Dean, A Qualitative Approach to Estimating Cotton
Spinnability Limits, Text. Res. J., 2004, 74 (7), 611.25. Ramasubbu, S., EliTe® Compact Spinning System – A User’s View, Spinnovation,
03/2005, No. 21, 17.26. Stalder, H., ComforSpin® – A New Spinning Process, African Text., 2000 April/
May, 16.27. Anon., ComforSpin® Machine K44, Competence in Compacting, Rieter Brochure,
2005.28. Anon., IWS Wool Profiles, Training Programme, 1988.29. Brandis, C., Physical Limits to Spinning, Int. Text. Bull. Spinning, 1975, (2), 257.30. Ishida, T., Manual of Textile Technology (Series 2), JTN Monthly, 1996 Feb., No.
495, 108.
Cotton: Science and technology274
31. Lünenschloss, J. and Kampen, E., Einfluss von Zahl und Formierung der ‘Bauchbinden’auf die Eigenschaften rotorgesponnerer Garne, Text. Praxis Int., 1976 Nov., 31 (11),1274.
32. Egbers, G., The Future of Spinning and Weaving, Mell. Int., 1999, 5 (1), 8.33. Kadoglu, H., Influence of Different Rotor Types on Rotor Yarn Properties, Mell.
Textilber. (English), 1999, 80 (3), E36, 130.34. Murata (Muratec) Air-jet Spinning Brochure.35. Zeng, Y.C., Wan, Yu-Qin and Yu, C.W., Controlling the Air Vortex Twist in Air-Jet
Spinning, Text. Res. J., 2005, 75 (2), 175.36. Zeng, Y.C., Wang, K.F. and Yu, C.W., Predicting the Tensile Properties of Air-Jet
Spun Yarn, Text Res. J., 2004, 74(8), 689.37. Wulfhorst, B., Future Development of Textile Processes, Mell. Textilber. (English),
2000, 81 (11-12), E218, 923.38. Nierhaus, W., Theory and Practice of Modern Spinning Methods, Text Month, 1986
Dec., 18.39. Martindale, J.G., A New Method of Measuring the Irregularity of Yarns with Some
Observations of the Origins of Irregularities in Worsted Slivers and Yarns, J, Text.
Inst., 1945, 36, T35.40. Lorenz, R.R.C., Yarn-twisting, Text. Progr., 1984, 16 (1/2).
275
9.1 The development of knitting technology
Hand knitting is the foundation stone of today’s mechanical and electronicstitch formation. In 1589, W. Lee invented the mechanical stitch formationtechnique on the stocking frame. His frame was able to knit 16 stitches at thesame time. This technique is still used for today’s modern machines. In1758, J. Strutt invented the double knit technique, which consists of verticallyarranged needles between the horizontal needles. In 1798, M. Decroix,developed the circular knitting technique. In 1847, M. Townsend inventedthe latch needle, making stitch formation easier and increasing productionspeed. In 1878, D. Griswold invented the circular knitting machine, whichcan produce rib and plain fabric in any desired distribution by vertical cylinderand horizontal dial needles. In 1910, the interlock fabric was developed bythe firm R. W. Scott and then in 1918, the first double cylinder, small circularknitting machine with double hook needle was developed by the firm Wildt.In the 1920s, mechanical needle selection devices such as punched tapes andpattern wheels began to be widely used. In the 1960s, the era of electronicsbegan and the first electronic needle selection with film-tape was demonstratedby the firm Morat at ITMA, Hannover, in 1963.1,2
In the 1990s, the four needle bed technique with the flat knitting technologyby Shima-Seiki started to be widely used, making it possible to produce agarment from a flat knitting machine without any sewing operation. TheMayer & Cie firm demonstrated that it is possible to make an intarsiatechnique on a circular knitting machine (Intarsianit) which has three or sixtimes greater production capacity than a conventional flat knitting machine.With warp knitting technology, apart from conventional needle selection,it is now possible to individually select needles by the Piezo Jacquardsystem.2
9Cotton knitting technology
N U Ç A R, Istanbul Technical University, Turkey

Cotton: Science and technology276
9.2 Terms used in knitting technology
9.2.1 Terms used in weft knitting technology
Stitch: stitch is the smallest unit in knitted fabric. A knitted fabric surfaceis formed by repeating it, side to side and one on top of the other (see Fig.9.1). It consists of loop head, loop leg and loop feet (see Fig. 9.2).Plain stitch: this is the technical face side of stitch where loop legs areabove the neighbour stitch and loop head is below the neighbour stitch(see Fig. 9.3).Purl stitch (reverse stitch): this is the technical reverse of the stitch whereloop legs are below the neighbour stitch and the loop head is above theneighbour stitch (see Fig. 9.4). The reverse of a plain stitch (see Fig. 9.3)is the purl sititch (see Fig. 9.4).
9.1 Knitted fabric surface.
9.3 Plain stitch. 9.4 Purl stitch.
9.2 Loop. 1. loophead; 2. loopleg; 3. loop feet.
2
1
2
3 3

Cotton knitting technology 277
Needle loop: this is the part of the stitch which is composed of loop headand loop leg (see Fig. 9.5).Sinker loop: this is the part of the stitch which is composed of loop feetbelonging to neighbouring stitches (see Fig. 9.6).Tuck stitch: this is the stitch which has the reverse V shape. The loop headof a tuck stitch together with the previous loop head are held by the feetof the following stitch (see Fig. 9.7). Normally, a tuck stitch with morethan four successive tucks on the same needle should not be used due tohigh yarn tension and needle damage (not more than six adjacent tucksdue to freely floating and snagging). The tuck stitch reduces the length-wise elasticity of the fabric and the fabric length, while it increases the
9.6 Sinker loop.
9.7 Tuck stitch.
9.5 Needle loop.
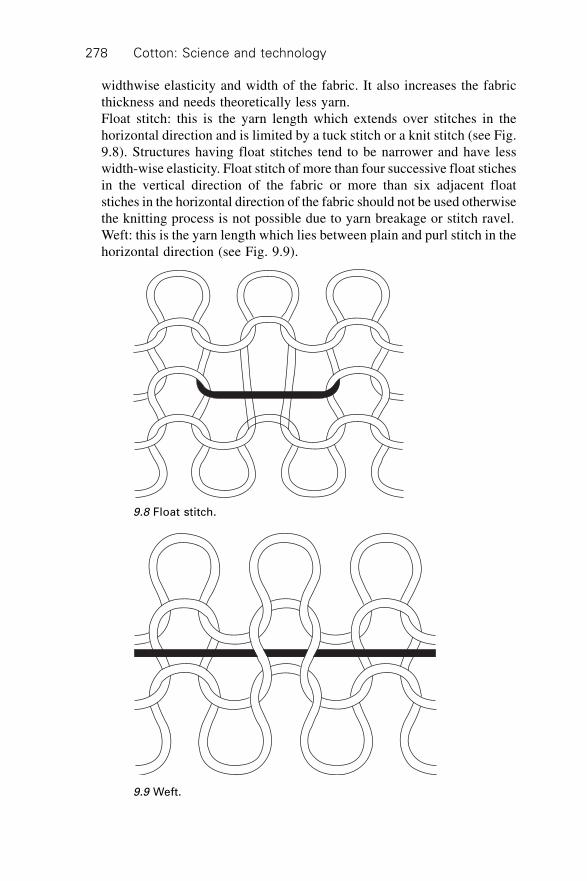
Cotton: Science and technology278
widthwise elasticity and width of the fabric. It also increases the fabricthickness and needs theoretically less yarn.Float stitch: this is the yarn length which extends over stitches in thehorizontal direction and is limited by a tuck stitch or a knit stitch (see Fig.9.8). Structures having float stitches tend to be narrower and have lesswidth-wise elasticity. Float stitch of more than four successive float stichesin the vertical direction of the fabric or more than six adjacent floatstiches in the horizontal direction of the fabric should not be used otherwisethe knitting process is not possible due to yarn breakage or stitch ravel.Weft: this is the yarn length which lies between plain and purl stitch in thehorizontal direction (see Fig. 9.9).
9.8 Float stitch.
9.9 Weft.
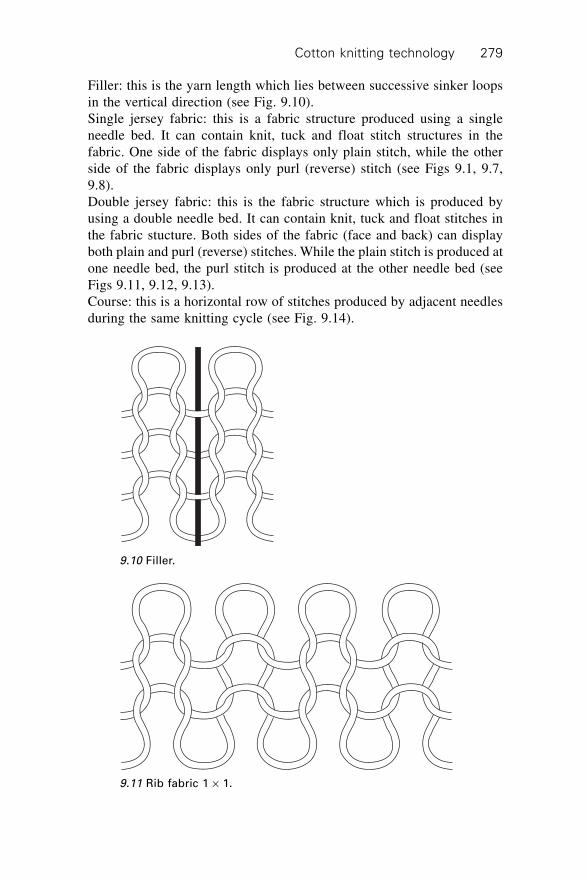
Cotton knitting technology 279
9.10 Filler.
9.11 Rib fabric 1 ¥ 1.
Filler: this is the yarn length which lies between successive sinker loopsin the vertical direction (see Fig. 9.10).Single jersey fabric: this is a fabric structure produced using a singleneedle bed. It can contain knit, tuck and float stitch structures in thefabric. One side of the fabric displays only plain stitch, while the otherside of the fabric displays only purl (reverse) stitch (see Figs 9.1, 9.7,9.8).Double jersey fabric: this is the fabric structure which is produced byusing a double needle bed. It can contain knit, tuck and float stitches inthe fabric stucture. Both sides of the fabric (face and back) can displayboth plain and purl (reverse) stitches. While the plain stitch is produced atone needle bed, the purl stitch is produced at the other needle bed (seeFigs 9.11, 9.12, 9.13).Course: this is a horizontal row of stitches produced by adjacent needlesduring the same knitting cycle (see Fig. 9.14).

Cotton: Science and technology280
Wale: this is a vertical column of stitches produced by same needle at thesuccessive knitting cycles (see Fig. 9.14).Number of courses per centimetre of fabric length (course density): this isthe number of horizontal rows composed of stitches per unit length offabric in the lengthwise direction (generally, one cm fabric length is taken).Figure 9.14 has a course density of 3.Number of wales per centimetre of fabric width (wale density): this is thenumber of vertical columns composed of stitches per unit length of fabricthrough the fabric width (generally, 1 cm of fabric is taken). Figure 9.14,has a wale density of 2.Stitch density: this is a product of course density and wale density. Itgives a total number of stitches in a square area of fabric. Stitch densitytends to give more accurate measurement for fabric dimensions compared
9.12 Interlock fabric 1 ¥ 1.
9.13 Purl fabric 1 ¥ 1.
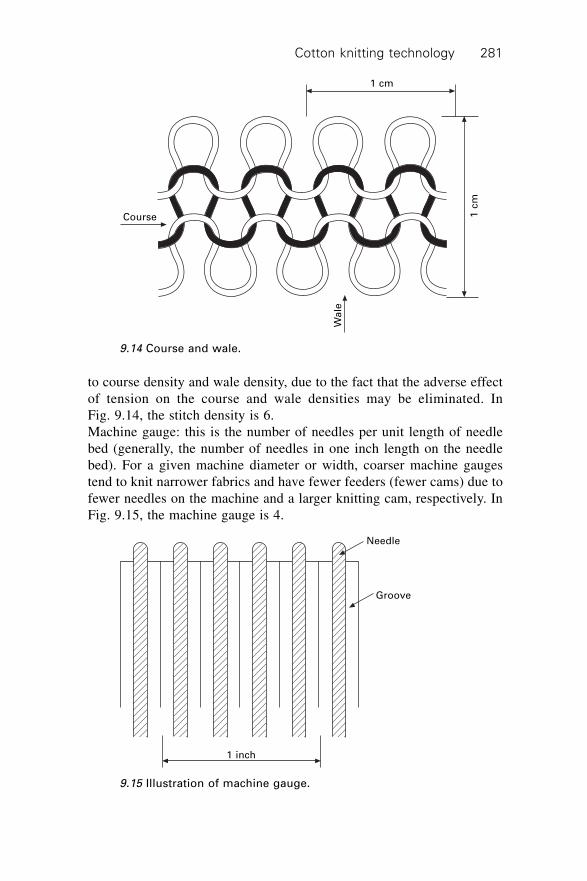
Cotton knitting technology 281
to course density and wale density, due to the fact that the adverse effectof tension on the course and wale densities may be eliminated. InFig. 9.14, the stitch density is 6.Machine gauge: this is the number of needles per unit length of needlebed (generally, the number of needles in one inch length on the needlebed). For a given machine diameter or width, coarser machine gaugestend to knit narrower fabrics and have fewer feeders (fewer cams) due tofewer needles on the machine and a larger knitting cam, respectively. InFig. 9.15, the machine gauge is 4.
1 cm
1 c
m
Wa
le
Course
9.14 Course and wale.
1 inch
Needle
Groove
9.15 Illustration of machine gauge.
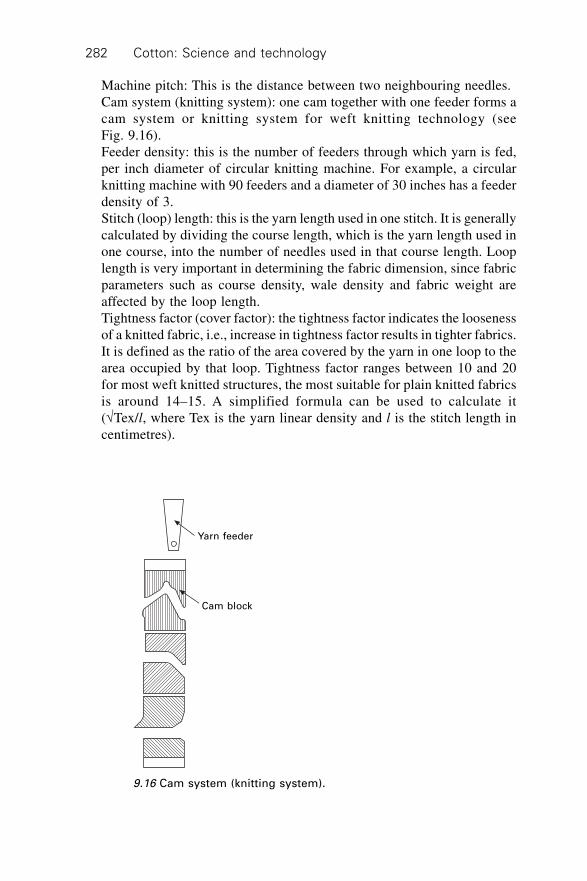
Cotton: Science and technology282
Yarn feeder
Cam block
9.16 Cam system (knitting system).
Machine pitch: This is the distance between two neighbouring needles.Cam system (knitting system): one cam together with one feeder forms acam system or knitting system for weft knitting technology (seeFig. 9.16).Feeder density: this is the number of feeders through which yarn is fed,per inch diameter of circular knitting machine. For example, a circularknitting machine with 90 feeders and a diameter of 30 inches has a feederdensity of 3.Stitch (loop) length: this is the yarn length used in one stitch. It is generallycalculated by dividing the course length, which is the yarn length used inone course, into the number of needles used in that course length. Looplength is very important in determining the fabric dimension, since fabricparameters such as course density, wale density and fabric weight areaffected by the loop length.Tightness factor (cover factor): the tightness factor indicates the loosenessof a knitted fabric, i.e., increase in tightness factor results in tighter fabrics.It is defined as the ratio of the area covered by the yarn in one loop to thearea occupied by that loop. Tightness factor ranges between 10 and 20for most weft knitted structures, the most suitable for plain knitted fabricsis around 14–15. A simplified formula can be used to calculate it(÷Tex/l, where Tex is the yarn linear density and l is the stitch length incentimetres).
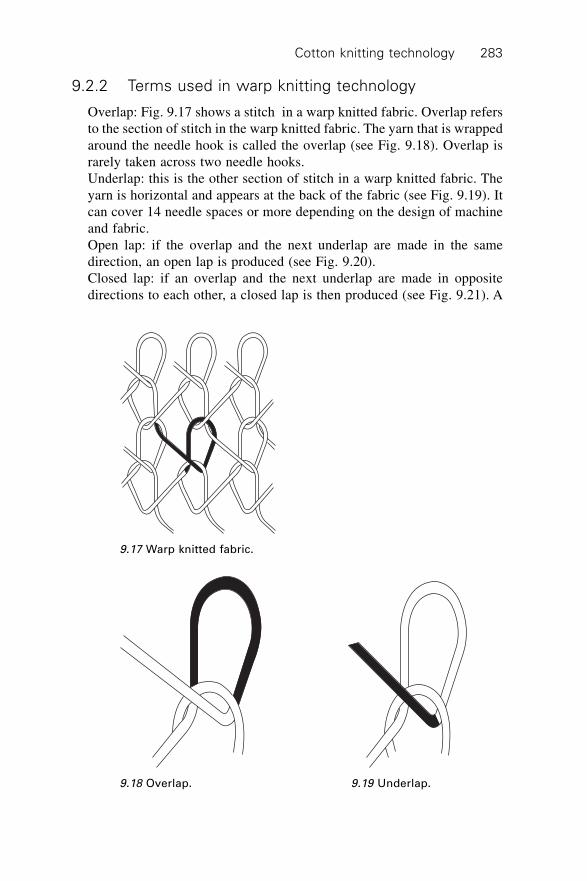
Cotton knitting technology 283
9.2.2 Terms used in warp knitting technology
Overlap: Fig. 9.17 shows a stitch in a warp knitted fabric. Overlap refersto the section of stitch in the warp knitted fabric. The yarn that is wrappedaround the needle hook is called the overlap (see Fig. 9.18). Overlap israrely taken across two needle hooks.Underlap: this is the other section of stitch in a warp knitted fabric. Theyarn is horizontal and appears at the back of the fabric (see Fig. 9.19). Itcan cover 14 needle spaces or more depending on the design of machineand fabric.Open lap: if the overlap and the next underlap are made in the samedirection, an open lap is produced (see Fig. 9.20).Closed lap: if an overlap and the next underlap are made in oppositedirections to each other, a closed lap is then produced (see Fig. 9.21). A
9.17 Warp knitted fabric.
9.18 Overlap. 9.19 Underlap.

Cotton: Science and technology284
9.20 Open lap.
9.21 Closed lap.
closed lap is heavier, less extensible and more compact than an open lap.Rack: this is the working cycle of 480 knitted courses of warp knitting.Run-in: this is the yarn consumpition of each guide bar at warp knittingand it is the length of each yarn knitted into fabric during 480 knittingcycles (one rack).Run-in ratio: this is the ratio of run-in value of different guide bars atwarp knitting.4–6
9.3 Classification of knitting technology
Knitting technology is classified into two main groups according to yarnpresentation and yarn processing, i.e., weft knitting technology and warpknitting technology. In weft knitting technology, one yarn end is horizontallyfed into all needles in the needle bed. Needles mostly are moved successively(individual needle motion as in circular knitting or V bed flat knitting) orsimultaneously (collective needle motion as in straight bar knitting and loop

Cotton knitting technology 285
wheel knitting). Yarn ends are mostly fed from a bobbin. Yarn ends in thefabric can easily be unravelled in a horizontal direction from the end knittedlast. Products obtained from weft knitting technology are widely used in theapparel industry for pull-overs, t-shirts, sweatshirts, etc. Materials used aremostly natural fibres or blends with synthetic fibres. Weft knitting machineshave relatively low investment cost, small floor space requirements, lowstock holding requirements and quicker pattern change capabilities than warpknitting machines.
In warp knitting technology, one yarn end is longitudinally fed into oneneedle in the needle bed. Needles are moved simultaneously and collectively.Yarn ends are mostly fed from a warp beam. A yarn end in a fabric can hardlybe unravelled in the vertical direction. Products obtained from warp knittingtechnology are widely used for household and technical textiles such asgeotextiles, laces, curtains, automotive, swimwear, towelling, nets, sportswear,bed linen, etc. Materials used are mostly synthetic fibres in filament form.Higher machine speeds (up to 3500 cpm), finer gauges (up to 40 needles perinch), wider machines (up to 260 inches) and a multiaxial structure fortechnical application are available with warp knitting technology, comparedto weft knitting technology. Generally, warp knit fabrics are less elastic thanmost weft knitted fabrics. They have a certain amount of elasticity in thewidth and a tendency to increase in a lengthwise direction after repeatedwearing and washing.3,4,6
9.4 Weft knitting technology
There are several different types of weft knitting machines, such as circularknitting machines (large diameter), hosiery machines, straight bar frames, Vbed flat knitting machines, flat bed purl machines, etc. However, especiallyfor outerwear and underwear, there are two main widely used weft knittingmachines, i.e., circular knitting machines (large diameter) and V bed flatknitting machine. Since these two types are widely used, these two technologiesare described here. The main differences between the two technologies aredescribed below:
∑ Machine frame of the circular knitting machine is of a cylindrical shape,while machine frame of the V bed flat knitting machine is flat with theneedle beds located approximately 90 degrees to each other.
∑ Products of the circular knitting machines have a tubular form, while flatform fabrics are produced by the V bed flat knitting machines.
∑ On V bed flat knitting machines, the needle bed is stationary and thecarriage, which contains a cam system, traverses the machine width andactivates the needles. In circular knitting, the needle bed generally rotatesand stationary cam blocks around the needle bed activate the needles.

Cotton: Science and technology286
∑ Production rates in circular knitting are generally higher than flat knitting,due to higher velocity and higher number of knitting (cam) systems.
∑ Flat knitting machines have more versatility than circular knitting machines.More complex fabric designs can be produced by flat knitting machines.
∑ Flat knitting machines have generally a coarser machine gauge than circularknitting machines, thus coarser fabric structures used mainly for outerwearin cold weather conditions such as pullovers, sweaters, etc., are produced.
9.4.1 Circular knitting machines
In circular knitting (Fig. 9.22), the machine gauges and the machine diametersrange from 4 to 32 needles per inch and 8 to 48 inches in diameter, respectively.They can run at the speeds of 76 rpm and may have up to 132 yarn feeders.1,2
Arrangement of machine parts
The machine frame of a circular knitting machine is of cylindrical form andfabric is produced in tubular form. Figure 9.23(a) and Fig. 9.23(c) show thearrangement of main machine parts of a plain circular knitting machine usedfor the production of single jersey fabrics. In most circular knitting machinesthe needle beds rotate while the cam blocks are stationary. During rotation,the needle butt contacts with the cam and produces a knit or a tuck stitch. Atevery knitting system (cam together with yarn feeder) on a circular machineframe, the needle can produce a knit, tuck or float stitch. Thus, for example,if a plain knitting machine has a 90 knitting system, at the end of one
9.22 Circular knitting machine.

Cotton knitting technology 287
revolution, one needle can produce 90 stitches (90 course). If the knittingmachine is interlock type (1 ¥ 1 interlock), two knitting systems produce onecourse, thus, at the end of one revolution, 45 courses are produced.
The other type of knitting machine used for the production of doublejersey fabrics is the rib knitting machine (see Fig. 9.23(b)). It also has asimilar arrangement to a plain circular knitting machine except for the dialwhich is set perpendicular to the cylinder and contains dial needles too. Inthis type of machine, there is no ‘holding down-knocking over sinker’ (seepage 291) since the dial needles (not available on a plain knitting machine)hold and support the fabric.
Stitch formation
The stitch formation with latch needle for a plain knitted fabric is illustratedin Figs 9.24 and 9.25. There are six main positions:
1. Rest position. The needle is in rest position with the needle positionedoutside the cam. The sinker moves towards the machine centre (1stposition in Figs 9.24 and 9.25).
123
4
89
11
10
76
535
4
12
5
67
3
21
84
(a) (b) (c)
1 Needle2 Needle latch3 Needle head4 Needle camblock5 Holding down knocking
over sinker6 Sinker cam block7 Feeder8 Needle butt
1 Needle2 Needle camblock3 Feeder4 Dial needle5 Dial needle cam block
1 Yarn creel2 Bobbin3 Yarn4 Yarn delivery system5 Feeder6 Cylinder needle7 Cylinder8 Cylinder needle cam9 Fabric
10 Fabric take-down roller11 Fabric winding system
9.23 Illustration of circular knitting machine (a) plain circular knittingmachine, (b) rib circular knitting machine, (c) schematic view of plaincircular knitting machine.
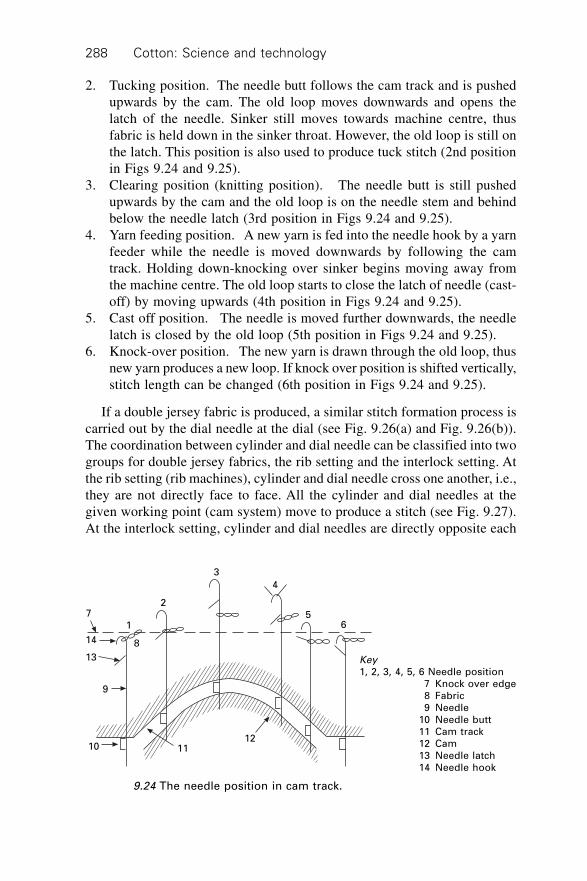
Cotton: Science and technology288
2. Tucking position. The needle butt follows the cam track and is pushedupwards by the cam. The old loop moves downwards and opens thelatch of the needle. Sinker still moves towards machine centre, thusfabric is held down in the sinker throat. However, the old loop is still onthe latch. This position is also used to produce tuck stitch (2nd positionin Figs 9.24 and 9.25).
3. Clearing position (knitting position). The needle butt is still pushedupwards by the cam and the old loop is on the needle stem and behindbelow the needle latch (3rd position in Figs 9.24 and 9.25).
4. Yarn feeding position. A new yarn is fed into the needle hook by a yarnfeeder while the needle is moved downwards by following the camtrack. Holding down-knocking over sinker begins moving away fromthe machine centre. The old loop starts to close the latch of needle (cast-off) by moving upwards (4th position in Figs 9.24 and 9.25).
5. Cast off position. The needle is moved further downwards, the needlelatch is closed by the old loop (5th position in Figs 9.24 and 9.25).
6. Knock-over position. The new yarn is drawn through the old loop, thusnew yarn produces a new loop. If knock over position is shifted vertically,stitch length can be changed (6th position in Figs 9.24 and 9.25).
If a double jersey fabric is produced, a similar stitch formation process iscarried out by the dial needle at the dial (see Fig. 9.26(a) and Fig. 9.26(b)).The coordination between cylinder and dial needle can be classified into twogroups for double jersey fabrics, the rib setting and the interlock setting. Atthe rib setting (rib machines), cylinder and dial needle cross one another, i.e.,they are not directly face to face. All the cylinder and dial needles at thegiven working point (cam system) move to produce a stitch (see Fig. 9.27).At the interlock setting, cylinder and dial needles are directly opposite each
Key1, 2, 3, 4, 5, 6 Needle position
7 Knock over edge8 Fabric9 Needle
10 Needle butt11 Cam track12 Cam13 Needle latch14 Needle hook
121110
13
14
9
8
1
2
3
4
56
7
9.24 The needle position in cam track.
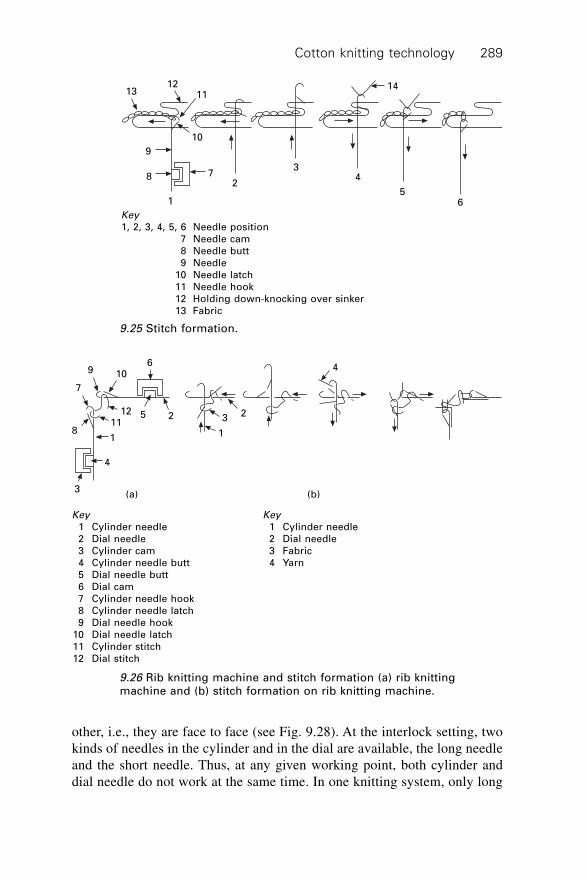
Cotton knitting technology 289
other, i.e., they are face to face (see Fig. 9.28). At the interlock setting, twokinds of needles in the cylinder and in the dial are available, the long needleand the short needle. Thus, at any given working point, both cylinder anddial needle do not work at the same time. In one knitting system, only long
65
43
2
1
8
9
1411
1213
7
10
Key1, 2, 3, 4, 5, 6 Needle position
7 Needle cam8 Needle butt9 Needle
10 Needle latch11 Needle hook12 Holding down-knocking over sinker13 Fabric
9.25 Stitch formation.
4
23
1
6
25
109
12
7
11
1
4
3(a) (b)
8
Key1 Cylinder needle2 Dial needle3 Cylinder cam4 Cylinder needle butt5 Dial needle butt6 Dial cam7 Cylinder needle hook8 Cylinder needle latch9 Dial needle hook
10 Dial needle latch11 Cylinder stitch12 Dial stitch
Key1 Cylinder needle2 Dial needle3 Fabric4 Yarn
9.26 Rib knitting machine and stitch formation (a) rib knittingmachine and (b) stitch formation on rib knitting machine.
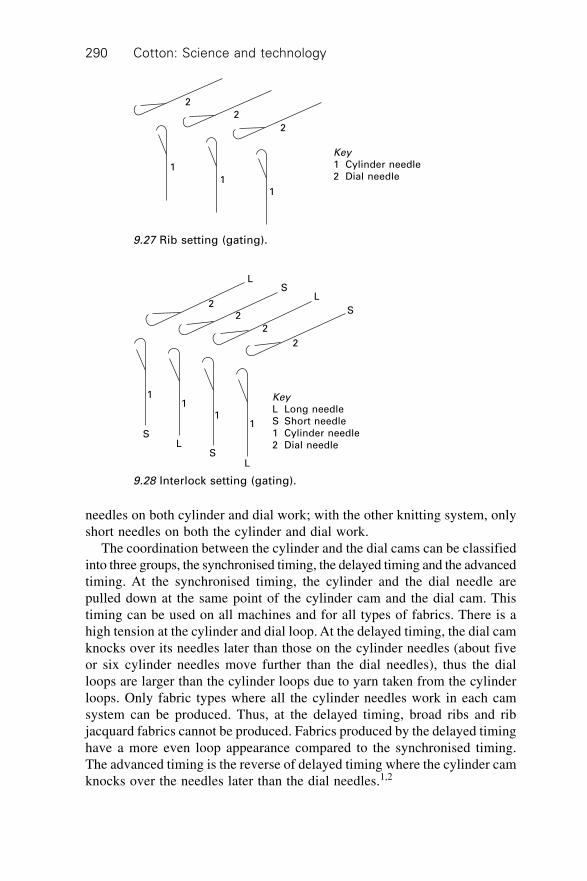
Cotton: Science and technology290
2
2
2
1
11
Key1 Cylinder needle2 Dial needle
9.27 Rib setting (gating).
needles on both cylinder and dial work; with the other knitting system, onlyshort needles on both the cylinder and dial work.
The coordination between the cylinder and the dial cams can be classifiedinto three groups, the synchronised timing, the delayed timing and the advancedtiming. At the synchronised timing, the cylinder and the dial needle arepulled down at the same point of the cylinder cam and the dial cam. Thistiming can be used on all machines and for all types of fabrics. There is ahigh tension at the cylinder and dial loop. At the delayed timing, the dial camknocks over its needles later than those on the cylinder needles (about fiveor six cylinder needles move further than the dial needles), thus the dialloops are larger than the cylinder loops due to yarn taken from the cylinderloops. Only fabric types where all the cylinder needles work in each camsystem can be produced. Thus, at the delayed timing, broad ribs and ribjacquard fabrics cannot be produced. Fabrics produced by the delayed timinghave a more even loop appearance compared to the synchronised timing.The advanced timing is the reverse of delayed timing where the cylinder camknocks over the needles later than the dial needles.1,2
SL
SL
11
11
22
2
2
L
LS
S
KeyL Long needleS Short needle1 Cylinder needle2 Dial needle
9.28 Interlock setting (gating).

Cotton knitting technology 291
Main machine parts
Needle: on circular knitting machines, latch and compound needles aregenerally used, while bearded needles are seldom used (see Fig. 9.29).They have different shapes and dimensions depending on the machinetype and the fabric design. They are generally controlled by the needlecam. The hook of a bearded needle is closed by a presser, while latch andclosing elements are used to close the hook of the needle for latch needleand compound needle, respectively. A bearded needle is less expensiveand produces more uniform stitches compared to other needle types. Itcan also be thinner than the other types of needles. However, it has alimitation with regard to the types of material and structure that can beknitted. The latch needle (Fig. 9.30) has an individual movement and thecompound needle has a short, smooth and simple action, thus it has ahigher producton rate compared to the other two types of needles.Sinker (holding down-knocking over): in textile terminology the sinkercommonly used on plain circular knitting machines is called a ‘holdingdown-knocking over’ sinker (see Fig. 9.31). Its main function is to holdthe sinker loop when the needle is moved from the rest position into theclearing position. It is controlled from the sinker butt by a sinker cam. Italso takes over the formation of a new loop across the knock over edge(the area of the machine that the sinker loop is formed) at the end of loopformation. They have different shapes and dimensions depending on themachine type and the fabric design.Cam: the cam controls the movement of the needle or sinker (holdingdown-knocking over). Basic and simple fabric designs can be producedby using just the cam block, however, complex fabric designs need differentneedle control systems such as pattern wheel, pattern drum or electronicselection devices, etc. There are different types and designs of cam structure
(a) (b) (c)
Key1 Hook2 Latch3 Closing element4 Butt
9.29 Needle types: (a) bearded needle, (b) latch needle,(c) compound needle.
1
2
1 1
3
4
4 4
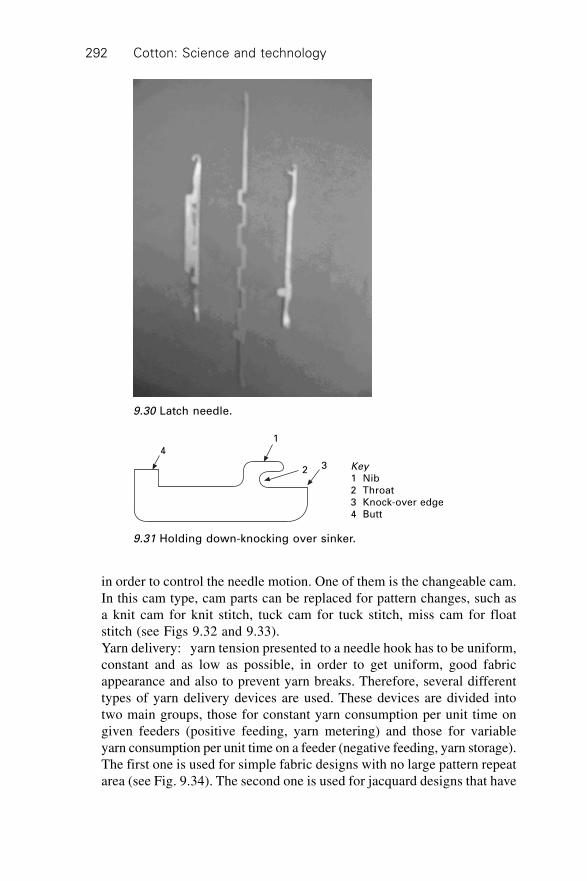
Cotton: Science and technology292
in order to control the needle motion. One of them is the changeable cam.In this cam type, cam parts can be replaced for pattern changes, such asa knit cam for knit stitch, tuck cam for tuck stitch, miss cam for floatstitch (see Figs 9.32 and 9.33).Yarn delivery: yarn tension presented to a needle hook has to be uniform,constant and as low as possible, in order to get uniform, good fabricappearance and also to prevent yarn breaks. Therefore, several differenttypes of yarn delivery devices are used. These devices are divided intotwo main groups, those for constant yarn consumption per unit time ongiven feeders (positive feeding, yarn metering) and those for variableyarn consumption per unit time on a feeder (negative feeding, yarn storage).The first one is used for simple fabric designs with no large pattern repeatarea (see Fig. 9.34). The second one is used for jacquard designs that have
4
32
1
Key1 Nib2 Throat3 Knock-over edge4 Butt
9.31 Holding down-knocking over sinker.
9.30 Latch needle.

Cotton knitting technology 293
9.33 Changeable cam.
Key1 Knit cam for stitch2 Tuck cam for tuck stitch3 Miss cam for float stitch4 Cam block
5, 6, 7 Needle with different butt position8 Cam track9 Needle butt (needle 5 moves
through cam 1 to produce a stitch,needle 6 moves through cam 2 toproduce tuck stitch and needle 7moves through cam 3 to producemiss stitch)
9.32 Illustration of changeable cam.
7 6 5
4
9 8
1
2
3
9 8
9 8

Cotton: Science and technology294
a large pattern area and most of the feeders have varying yarn consumptionsper unit time (see Fig. 9.35).
Fabric take down: fabric take down equipment has three main functions,fabric spreading, fabric tensioning and fabric winding. On circular knittingmachines, fabric is knitted into a tube form on needles. The fabric is thenstretched into a flat form by the spreader located above the take downsystem. The fabric is then pulled down by the fabric tensioning system(fabric take down roller) and wound into fabric roll by the fabric windingsystem (see Fig. 9.36).
7
8
5
6
3
1
2
4
Key1 Yarn2 Yarn brake system3 Yarn feeler (yarn knock-off device)4 Yarn winding roller5 Eyelet6 Yarn
7, 8 Drive roll
9.34 Positive yarn delivery system.
Key1 Yarn2 Yarn brake system3 Yarn feeler (yarn
knock-off device)4 Yarn coiler
1
2
3
4
9.35 Negative yarn delivery system.

Cotton knitting technology 295
Basic fabric types
There are many different types of fabric designs produced on circular knittingmachines, such as single jersey fabric or double jersey fabric. These areproduced by either the rib technique or interlock technique. In Fig. 9.37,stitch diagrams of several fabric designs have been illustrated; plain knitfabric, lacoste, double lacoste, 1 ¥ 1 purl fabric, 1 ¥ 1 interlock fabric,
1
2
3
4
Key1 Fabric2 Take-down roller3 Winding roller4 Fabric roll
9.36 Fabric take-down system.
(e)
(d)
(c)(b)
(a)
(g) (h) (j) (k)(f)
(m)
(n) (o)
1
2
3
1
2
3
4
1
2
3
4
1
2
1
2
1
2
1
2
1
2
1
2
3
1
2
3
4
1
2
3
4
9.37 Basic fabric types. (a) plain, (b) lacoste, (c) double lacoste,(d) purl, (e) rib (1 ¥ 1), (f) interlock (1 ¥ 1), (g) cross miss, (h) halfcardigan, (j) cardigan, (k) half Milano, (m) Milano rib, (n) interlockhalf Milano and (o) Swiss double pique.
Key1,2, 3, 4Number ofsystem used
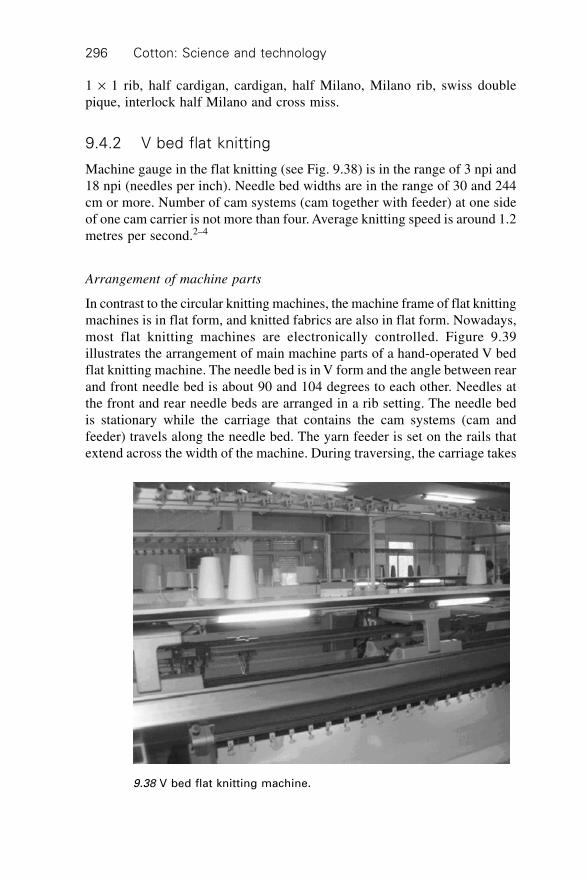
Cotton: Science and technology296
1 ¥ 1 rib, half cardigan, cardigan, half Milano, Milano rib, swiss doublepique, interlock half Milano and cross miss.
9.4.2 V bed flat knitting
Machine gauge in the flat knitting (see Fig. 9.38) is in the range of 3 npi and18 npi (needles per inch). Needle bed widths are in the range of 30 and 244cm or more. Number of cam systems (cam together with feeder) at one sideof one cam carrier is not more than four. Average knitting speed is around 1.2metres per second.2–4
Arrangement of machine parts
In contrast to the circular knitting machines, the machine frame of flat knittingmachines is in flat form, and knitted fabrics are also in flat form. Nowadays,most flat knitting machines are electronically controlled. Figure 9.39illustrates the arrangement of main machine parts of a hand-operated V bedflat knitting machine. The needle bed is in V form and the angle between rearand front needle bed is about 90 and 104 degrees to each other. Needles atthe front and rear needle beds are arranged in a rib setting. The needle bedis stationary while the carriage that contains the cam systems (cam andfeeder) travels along the needle bed. The yarn feeder is set on the rails thatextend across the width of the machine. During traversing, the carriage takes
9.38 V bed flat knitting machine.
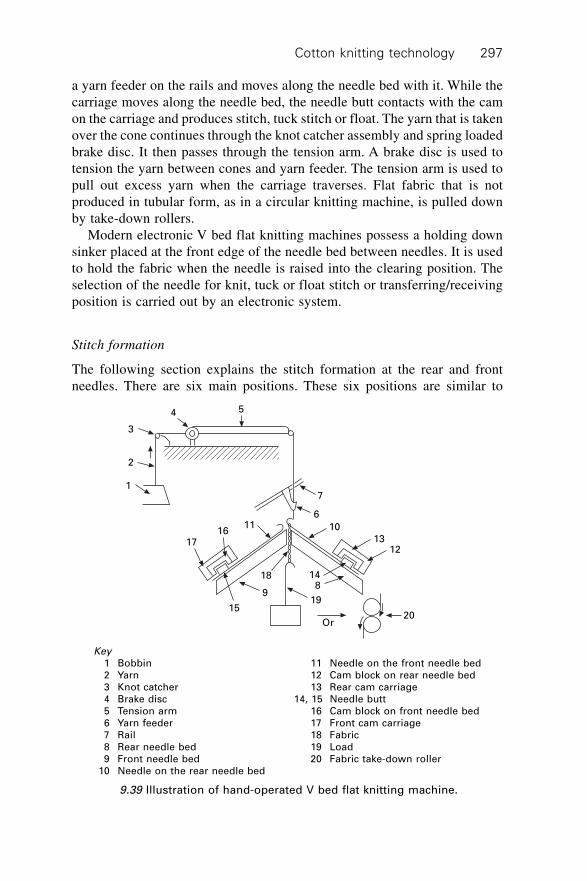
Cotton knitting technology 297
a yarn feeder on the rails and moves along the needle bed with it. While thecarriage moves along the needle bed, the needle butt contacts with the camon the carriage and produces stitch, tuck stitch or float. The yarn that is takenover the cone continues through the knot catcher assembly and spring loadedbrake disc. It then passes through the tension arm. A brake disc is used totension the yarn between cones and yarn feeder. The tension arm is used topull out excess yarn when the carriage traverses. Flat fabric that is notproduced in tubular form, as in a circular knitting machine, is pulled downby take-down rollers.
Modern electronic V bed flat knitting machines possess a holding downsinker placed at the front edge of the needle bed between needles. It is usedto hold the fabric when the needle is raised into the clearing position. Theselection of the needle for knit, tuck or float stitch or transferring/receivingposition is carried out by an electronic system.
Stitch formation
The following section explains the stitch formation at the rear and frontneedles. There are six main positions. These six positions are similar to
Or20
1213
19
814
10
6
7
54
3
2
1
1716
11
18
9
15
Key1 Bobbin2 Yarn3 Knot catcher4 Brake disc5 Tension arm6 Yarn feeder7 Rail8 Rear needle bed9 Front needle bed
10 Needle on the rear needle bed
11 Needle on the front needle bed12 Cam block on rear needle bed13 Rear cam carriage
14, 15 Needle butt16 Cam block on front needle bed17 Front cam carriage18 Fabric19 Load20 Fabric take-down roller
9.39 Illustration of hand-operated V bed flat knitting machine.
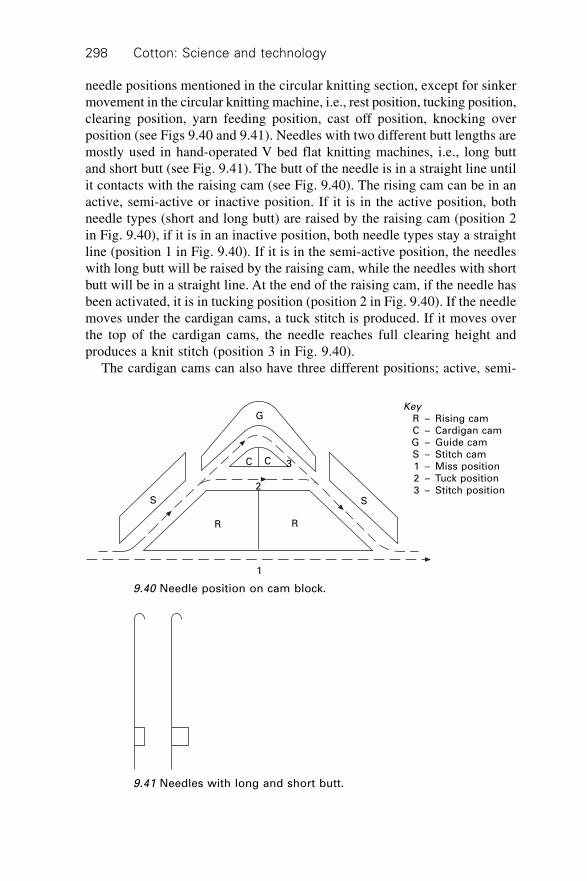
Cotton: Science and technology298
needle positions mentioned in the circular knitting section, except for sinkermovement in the circular knitting machine, i.e., rest position, tucking position,clearing position, yarn feeding position, cast off position, knocking overposition (see Figs 9.40 and 9.41). Needles with two different butt lengths aremostly used in hand-operated V bed flat knitting machines, i.e., long buttand short butt (see Fig. 9.41). The butt of the needle is in a straight line untilit contacts with the raising cam (see Fig. 9.40). The rising cam can be in anactive, semi-active or inactive position. If it is in the active position, bothneedle types (short and long butt) are raised by the raising cam (position 2in Fig. 9.40), if it is in an inactive position, both needle types stay a straightline (position 1 in Fig. 9.40). If it is in the semi-active position, the needleswith long butt will be raised by the raising cam, while the needles with shortbutt will be in a straight line. At the end of the raising cam, if the needle hasbeen activated, it is in tucking position (position 2 in Fig. 9.40). If the needlemoves under the cardigan cams, a tuck stitch is produced. If it moves overthe top of the cardigan cams, the needle reaches full clearing height andproduces a knit stitch (position 3 in Fig. 9.40).
The cardigan cams can also have three different positions; active, semi-
9.41 Needles with long and short butt.
1
R R
SS
2
3
G
C C
9.40 Needle position on cam block.
KeyR – Rising camC – Cardigan camG – Guide camS – Stitch cam1 – Miss position2 – Tuck position3 – Stitch position
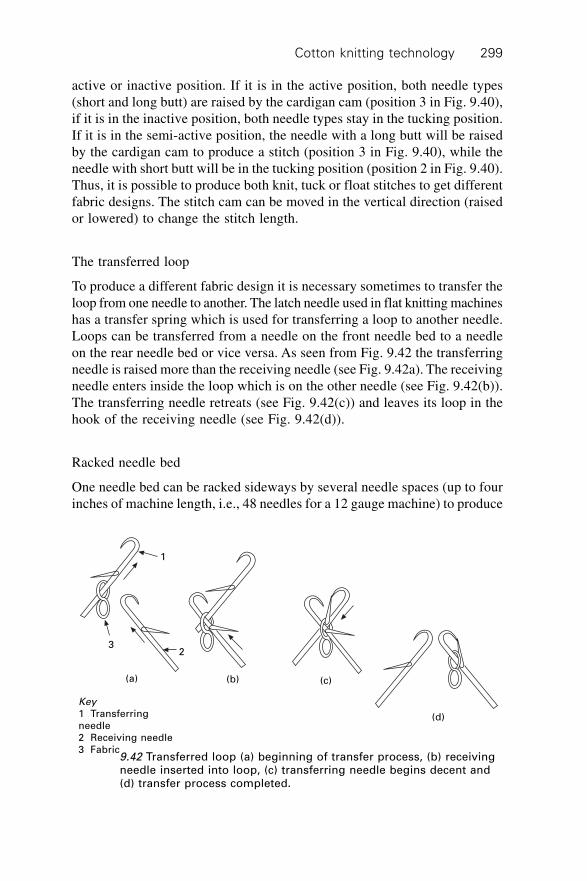
Cotton knitting technology 299
active or inactive position. If it is in the active position, both needle types(short and long butt) are raised by the cardigan cam (position 3 in Fig. 9.40),if it is in the inactive position, both needle types stay in the tucking position.If it is in the semi-active position, the needle with a long butt will be raisedby the cardigan cam to produce a stitch (position 3 in Fig. 9.40), while theneedle with short butt will be in the tucking position (position 2 in Fig. 9.40).Thus, it is possible to produce both knit, tuck or float stitches to get differentfabric designs. The stitch cam can be moved in the vertical direction (raisedor lowered) to change the stitch length.
The transferred loop
To produce a different fabric design it is necessary sometimes to transfer theloop from one needle to another. The latch needle used in flat knitting machineshas a transfer spring which is used for transferring a loop to another needle.Loops can be transferred from a needle on the front needle bed to a needleon the rear needle bed or vice versa. As seen from Fig. 9.42 the transferringneedle is raised more than the receiving needle (see Fig. 9.42a). The receivingneedle enters inside the loop which is on the other needle (see Fig. 9.42(b)).The transferring needle retreats (see Fig. 9.42(c)) and leaves its loop in thehook of the receiving needle (see Fig. 9.42(d)).
Racked needle bed
One needle bed can be racked sideways by several needle spaces (up to fourinches of machine length, i.e., 48 needles for a 12 gauge machine) to produce
1
23
(d)
(c)(b)(a)
Key1 Transferringneedle2 Receiving needle3 Fabric
9.42 Transferred loop (a) beginning of transfer process, (b) receivingneedle inserted into loop, (c) transferring needle begins decent and(d) transfer process completed.

Cotton: Science and technology300
(a) (b) (c) (d)
(e) (f) (g)
9.43 Racked needle bed (a) normal position of needle beds, (b) loopon last needle on front needle bed transferred into rear needle bed,(c) transfer complete, (d) rear needle bed (racked) sideways by oneneedle space, (e) loop on rear needle bed transferred into needle onfront needle bed, (f) two loops on needle at front of needle bed and(g) final appearance of fabric.
9.44 Racked and transferred stitch.
different fabric designs. As seen from Figs 9.43 and 9.44, a loop has beentransferred from the front needle bed into a needle on the rear needle bed(see Figs 9.43(b) and 9.43(c)). Then, the rear needle bed is racked sidewaysby one needle space (see Fig. 9.43(d)). A loop on the needle at the rearneedle bed is transferred into a needle on the front needle bed (see Fig.9.43(e)). Thus, there will be two loops on the needle at the front needle bed(see Fig. 9.43(f)). The final fabric appearance will be similar to Fig. 9.44.
Basic fabric types
Most of the basic fabric designs mentioned in circular knitting technologyare also widely used in V bed flat knitting machines. In addition to thesedesigns, many of the complex fabric designs which are impossible or hard toproduce on circular knitting machines, such as intarsia design, cable design,
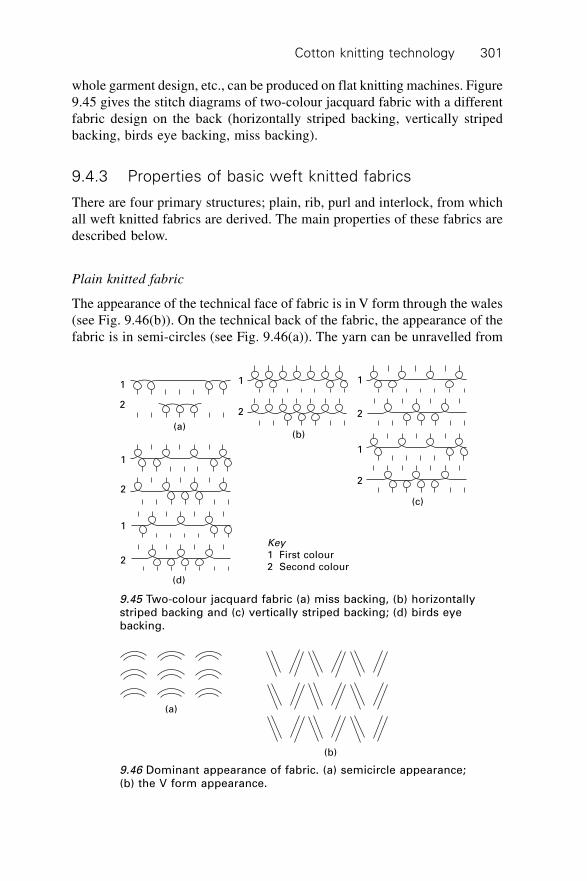
Cotton knitting technology 301
whole garment design, etc., can be produced on flat knitting machines. Figure9.45 gives the stitch diagrams of two-colour jacquard fabric with a differentfabric design on the back (horizontally striped backing, vertically stripedbacking, birds eye backing, miss backing).
9.4.3 Properties of basic weft knitted fabrics
There are four primary structures; plain, rib, purl and interlock, from whichall weft knitted fabrics are derived. The main properties of these fabrics aredescribed below.
Plain knitted fabric
The appearance of the technical face of fabric is in V form through the wales(see Fig. 9.46(b)). On the technical back of the fabric, the appearance of thefabric is in semi-circles (see Fig. 9.46(a)). The yarn can be unravelled from
(a)(b)
(c)
(d)
1
2
1
2
1
2
1
2
1
2
1
2
Key1 First colour2 Second colour
9.45 Two-colour jacquard fabric (a) miss backing, (b) horizontallystriped backing and (c) vertically striped backing; (d) birds eyebacking.
(a)
(b)
9.46 Dominant appearance of fabric. (a) semicircle appearance;(b) the V form appearance.

Cotton: Science and technology302
the last course or the first course of the fabric (see Figs 9.1 and 9.37(a)).Fabric curls from the sides and the top/bottom and has an approximaterecovery of 40% in width after stretching.2
Rib knitted fabric
Rib fabrics are described as 1 ¥ 1, 2 ¥ 2, 6 ¥ 3 rib, etc., and the most simpleone is the 1 ¥ 1 rib (see Figs 9.11 and 9.37(e)) (a ¥ b; a represents the numberof front stitches, b represents the number of back stitches). The 1 ¥ 1 ribfabric is thicker, narrower, heavier, warmer and more elastic and expensivethan plain knit fabric. It has higher width-wise recoverable stretch than plainknit fabric. It is also typically knitted using a finer yarn than a plain knitfabric. The yarn can be unravelled easily from the last course of the fabric.Balanced rib fabric such as 1 ¥ 1, 2 ¥ 2, 3 ¥ 3 rib does not curl from the sidesand the top/bottom.
Interlock knitted fabric
Like rib fabrics, there are several types of interlock fabrics such as 1 ¥ 1interlock, 2 ¥ 2 interlock. 1 ¥ 1 interlock fabrics are thicker, heavier, narrowerand more stable and expensive than plain and rib knit fabrics (see Figs 9.12and 9.37(f)). It has less width-wise recoverable stretch than plain and rib knitfabric. The V letter appearance is dominant on both sides of the fabric. Theyarn can be unroved easily from the last course of the fabric. 1 ¥ 1 interlockfabric does not curl from the sides and the top/bottom. However, it is lessproductive than rib and plain knitted fabrics.
Purl knit fabric
The semi-circular appearance is dominant on both sides of a fabric. Thereare several types of purl fabrics such as 1 ¥ 1, 5 ¥ 3, 4 ¥ 4 purl fabricsand the most simple one is the 1 ¥ 1 purl fabric (see Figs 9.13 and 9.37(d)).It is thicker, softer and warmer than a plain knit fabric and it has moreelasticity lengthwise than a plain knit fabric. It can be unroved from bothends of the fabric.
9.5 Warp knitting technology
There are two main warp knitting machine classifications (see Fig. 9.47),Tricot and Raschel. The main differences between them are describedbelow.
∑ Raschel machines are generally coarser and slower than Tricot machines
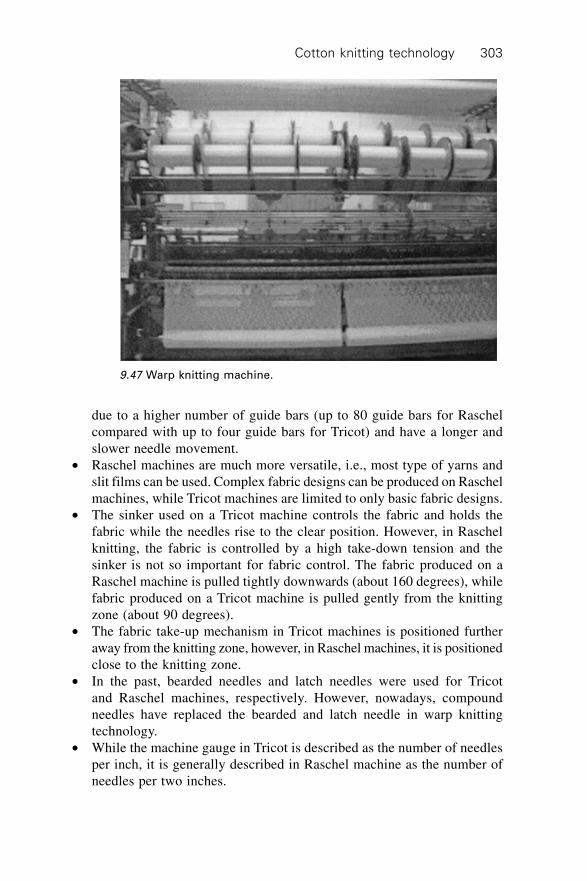
Cotton knitting technology 303
due to a higher number of guide bars (up to 80 guide bars for Raschelcompared with up to four guide bars for Tricot) and have a longer andslower needle movement.
∑ Raschel machines are much more versatile, i.e., most type of yarns andslit films can be used. Complex fabric designs can be produced on Raschelmachines, while Tricot machines are limited to only basic fabric designs.
∑ The sinker used on a Tricot machine controls the fabric and holds thefabric while the needles rise to the clear position. However, in Raschelknitting, the fabric is controlled by a high take-down tension and thesinker is not so important for fabric control. The fabric produced on aRaschel machine is pulled tightly downwards (about 160 degrees), whilefabric produced on a Tricot machine is pulled gently from the knittingzone (about 90 degrees).
∑ The fabric take-up mechanism in Tricot machines is positioned furtheraway from the knitting zone, however, in Raschel machines, it is positionedclose to the knitting zone.
∑ In the past, bearded needles and latch needles were used for Tricotand Raschel machines, respectively. However, nowadays, compoundneedles have replaced the bearded and latch needle in warp knittingtechnology.
∑ While the machine gauge in Tricot is described as the number of needlesper inch, it is generally described in Raschel machine as the number ofneedles per two inches.
9.47 Warp knitting machine.
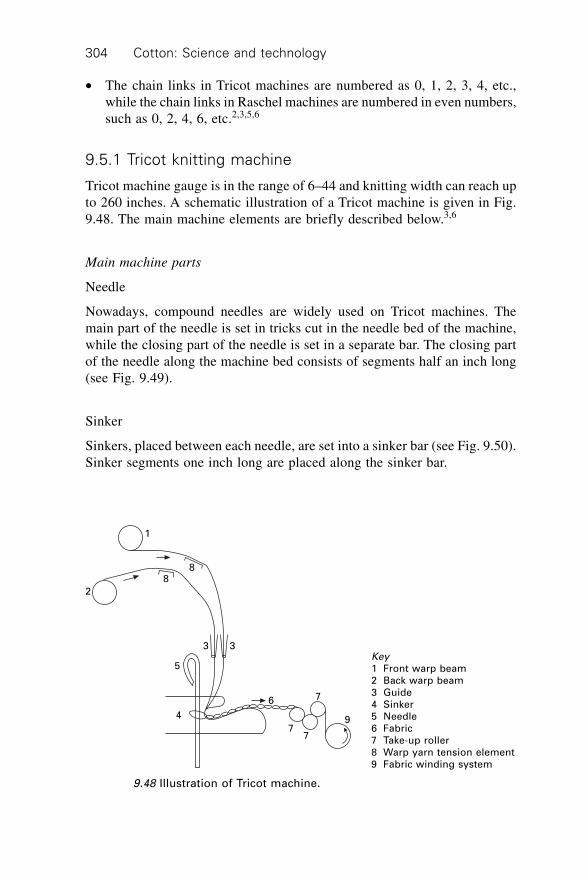
Cotton: Science and technology304
∑ The chain links in Tricot machines are numbered as 0, 1, 2, 3, 4, etc.,while the chain links in Raschel machines are numbered in even numbers,such as 0, 2, 4, 6, etc.2,3,5,6
9.5.1 Tricot knitting machine
Tricot machine gauge is in the range of 6–44 and knitting width can reach upto 260 inches. A schematic illustration of a Tricot machine is given in Fig.9.48. The main machine elements are briefly described below.3,6
Main machine parts
Needle
Nowadays, compound needles are widely used on Tricot machines. Themain part of the needle is set in tricks cut in the needle bed of the machine,while the closing part of the needle is set in a separate bar. The closing partof the needle along the machine bed consists of segments half an inch long(see Fig. 9.49).
Sinker
Sinkers, placed between each needle, are set into a sinker bar (see Fig. 9.50).Sinker segments one inch long are placed along the sinker bar.
Key1 Front warp beam2 Back warp beam3 Guide4 Sinker5 Needle6 Fabric7 Take-up roller8 Warp yarn tension element9 Fabric winding system
88
1
2
3 3
5
4
6
77
7
9
9.48 Illustration of Tricot machine.

Cotton knitting technology 305
Guide bar and guides
Each yarn end fed from a warp beam is passed through the eye of a guide.The guide segments are one inch long and placed into the guide bar (seeFig. 9.51). The guide bars have two motions, swing and shogging. The guidebars swing between needles and they also shog sideways to produceoverlap and underlap. Tricot machines are generally equipped with two tofour guide bars. The loops of the front bar will appear on the face of thefabric. Thus, any coloured thread in the front guide bar will appear on bothfabric surfaces.
Pattern drum and pattern disc
The shogging movement of the guide bar is generally produced by patterndrum or pattern disc. A chain with different height links is placed on thepattern drum. This pattern drum rotates and the rod of the guide barcontacts with the link, thus the guide bar shogs sideway. Different shogging
(a) (b)
9.49 Compound needle. (a) main part of needle and (b) closingelement of needle.
Key1 Sinker2 Sinker unit
2
1
1
1
1
9.50 Sinker unit.

Cotton: Science and technology306
3
2
11
1
1
Key1 Guide2 Guide unit3 Guide bar
9.51 Guide bar.
Key1 Pattern drum2 Chain3 Guide bar
3
2
1
9.52 Pattern mechanism.
movement distances are obtained by different height of links (see Fig. 9.52).Pattern disc (see Fig. 9.53) has a pre-cut for a certain design and it is usedinstead of a pattern drum, due to the very accurate, smooth and high-speedperformance.
Yarn feeding system
Each guide bar is supplied with yarns taken from each warp beam, however,it is possible to use two or three warp beams for one guide bar. The oppositesituation is also possible if equal yarn amounts are used. There are two mainyarn let-off mechanisms, negative and positive. With the negative yarn let-off mechanism, a restricting force is applied to the warp beam, thus its freeturning movement is restricted, i.e., the beam will not turn without being

Cotton knitting technology 307
pulled by yarns. There are two types negative yarn let-off mechanisms, oneis termed the cord let-off mechanism and the other is brake let-off mechanism.The cord let-off mechanism is inexpensive and simple, however, it has severaldisadvantages such as sensitivity to enviromental conditions and maintenanceof the yarn tension by the operator. With the positive yarn feeding system,the warp beam is positively driven and constant yarn feeding together withconstant yarn tensions are obtained. In this mechanism, the yarn is fed to theneedle, instead of the yarn being pulled against the brake as in the case of thenegative feeding system.
Stitch formation
The stitch formation in Tricot machines is schematically illustrated inFig. 9.54. A description of the stages is as follows:
(a) This is the starting position; the previous course has just been completedand the sinker moves forward to hold the fabric. A guide bar shogssideways to come to the position close to the needles.
(b) Needle starts to rise and shogging movement of the guide bar is nowcompleted.
(c) Needle is in the clearing position, sinker moves backwards. The guidebar starts to swing in between the needles
(d) The guide bar is shogged sideways for one needle space to warp the yarnonto the needle hook, thus an overlap is created.
(e) Guide bar swings back.(f) Needles continue to descend, sinker moves backward. The guide bar
starts to new shogging movement in order to produce a new underlap.An underlap movement is generally more than one needle space, dependingon the fabric design.
9.53 Pattern disc.
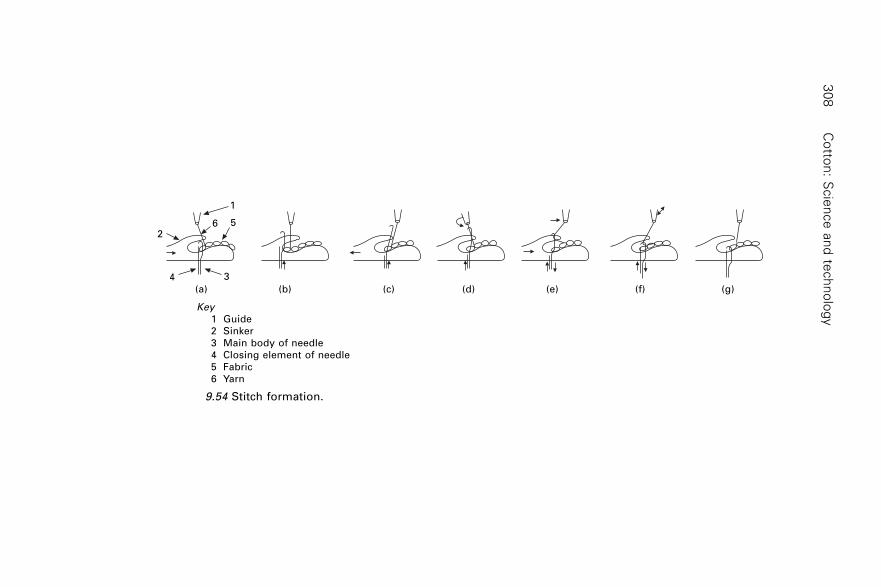
Co
tton
: Scie
nce
an
d te
ch
no
log
y3
08
34
256
1
(a) (b) (c) (d) (e) (f) (g)
9.54 Stitch formation.
Key1 Guide2 Sinker3 Main body of needle4 Closing element of needle5 Fabric6 Yarn
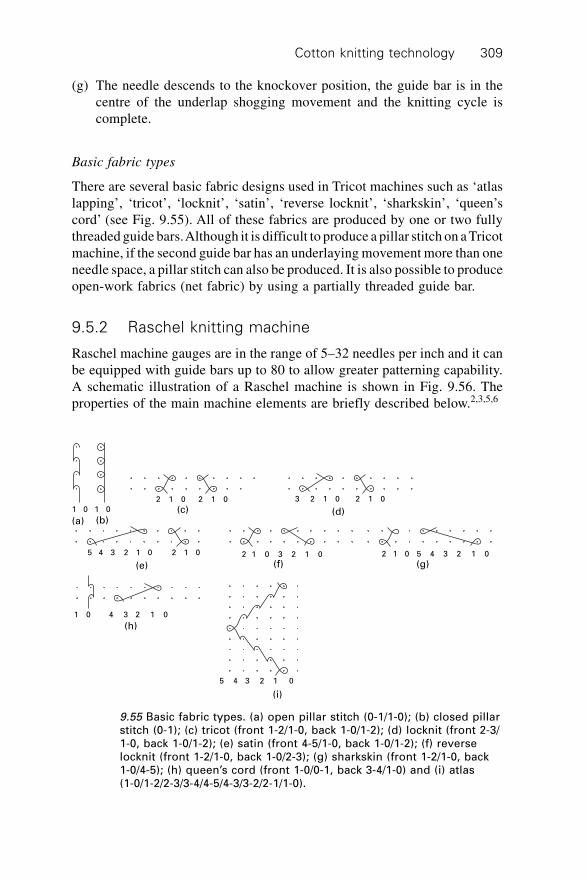
Cotton knitting technology 309
(g) The needle descends to the knockover position, the guide bar is in thecentre of the underlap shogging movement and the knitting cycle iscomplete.
Basic fabric types
There are several basic fabric designs used in Tricot machines such as ‘atlaslapping’, ‘tricot’, ‘locknit’, ‘satin’, ‘reverse locknit’, ‘sharkskin’, ‘queen’scord’ (see Fig. 9.55). All of these fabrics are produced by one or two fullythreaded guide bars. Although it is difficult to produce a pillar stitch on a Tricotmachine, if the second guide bar has an underlaying movement more than oneneedle space, a pillar stitch can also be produced. It is also possible to produceopen-work fabrics (net fabric) by using a partially threaded guide bar.
9.5.2 Raschel knitting machine
Raschel machine gauges are in the range of 5–32 needles per inch and it canbe equipped with guide bars up to 80 to allow greater patterning capability.A schematic illustration of a Raschel machine is shown in Fig. 9.56. Theproperties of the main machine elements are briefly described below.2,3,5,6
(a) (b)(c) (d)
(e) (f) (g)
(h)
(i)
1 0 1 0
2 1 0 2 1 0 3 2 1 0 2 1 0
5 4 3 2 1 0
1 0 4 3 2 1 0
5 4 3 2 1 0 2 1 0 2 1 0 3 2 1 0 2 1 0 5 4 3 2 1 0
9.55 Basic fabric types. (a) open pillar stitch (0-1/1-0); (b) closed pillarstitch (0-1); (c) tricot (front 1-2/1-0, back 1-0/1-2); (d) locknit (front 2-3/1-0, back 1-0/1-2); (e) satin (front 4-5/1-0, back 1-0/1-2); (f) reverselocknit (front 1-2/1-0, back 1-0/2-3); (g) sharkskin (front 1-2/1-0, back1-0/4-5); (h) queen’s cord (front 1-0/0-1, back 3-4/1-0) and (i) atlas(1-0/1-2/2-3/3-4/4-5/4-3/3-2/2-1/1-0).

Cotton: Science and technology310
Properties of machine elements
The original needle on a Raschel machine is a latch needle, however, mostmodern Raschel machines are built today with compound needles. Compoundneedles are set into Raschel machines as in a Tricot machine while the latchneedles in segment form one inch long are placed along the needle bar. Twotypes of guide bars are used in Raschel machines. One is similar to the oneused in Tricot, i.e., it consists of a guide unit one inch long and usually fullythreaded to produce the ground structure of fabric. Generally, one to threesuch guide bars are used to produce ground fabrics. Other types of guide barsare used for patterning onto ground fabrics. These bars usually require onethread for each patterning repeat, thus only a few yarns are threaded acrossthe whole width of a bar (see Fig. 9.57).
The knitting action of Raschel machines with compound needles is somehowdifferent from that of a Tricot machine with compound needles, i.e., thesinker bar is stationary, the guide bar does not swing and the swing movementis made by the needle bar. For pattern mechanism, the SU ‘summary drive’is replaced with traditional chain link patterning mechanism (pattern drumor pattern disc) due to its high pattern repeat length, greater accuracy, speedand less patterning cost (see Fig. 9.58). Every pattern bar is equipped with anSU unit and each unit consists of six eccentric cams with two electro-magnetsplaced an each side of the cam. Thus, each cam system can be active orinactive according to the transmitted electrical signal via a microprocessor.
5
4 32
1
7
7777
6
6
6 6
6
8
910
11
12
11
11
11
Key1, 2, 3, 4, 5 Warp beam
6 Warp yarn tension element7 Guide8 Needle9 Sinker
10 Fabric11 Take-up roller12 Winding system
9.56 Illustration of Raschel machine.
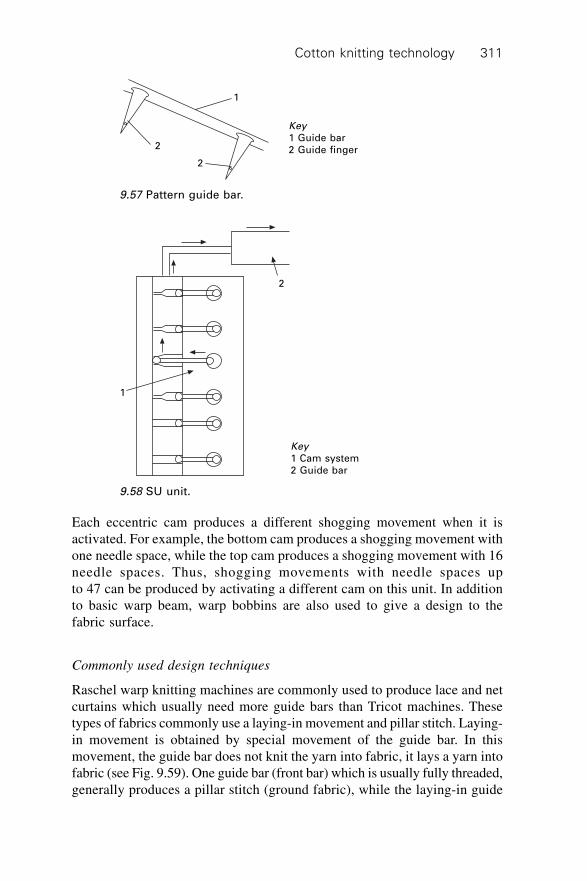
Cotton knitting technology 311
Each eccentric cam produces a different shogging movement when it isactivated. For example, the bottom cam produces a shogging movement withone needle space, while the top cam produces a shogging movement with 16needle spaces. Thus, shogging movements with needle spaces upto 47 can be produced by activating a different cam on this unit. In additionto basic warp beam, warp bobbins are also used to give a design to thefabric surface.
Commonly used design techniques
Raschel warp knitting machines are commonly used to produce lace and netcurtains which usually need more guide bars than Tricot machines. Thesetypes of fabrics commonly use a laying-in movement and pillar stitch. Laying-in movement is obtained by special movement of the guide bar. In thismovement, the guide bar does not knit the yarn into fabric, it lays a yarn intofabric (see Fig. 9.59). One guide bar (front bar) which is usually fully threaded,generally produces a pillar stitch (ground fabric), while the laying-in guide
1
2
2
Key1 Guide bar2 Guide finger
9.57 Pattern guide bar.
2
1
Key1 Cam system2 Guide bar
9.58 SU unit.
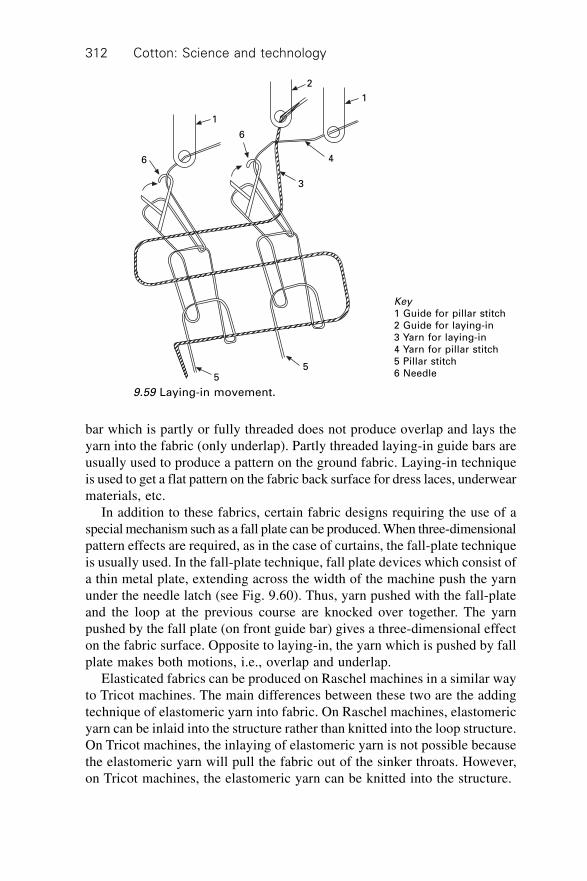
Cotton: Science and technology312
bar which is partly or fully threaded does not produce overlap and lays theyarn into the fabric (only underlap). Partly threaded laying-in guide bars areusually used to produce a pattern on the ground fabric. Laying-in techniqueis used to get a flat pattern on the fabric back surface for dress laces, underwearmaterials, etc.
In addition to these fabrics, certain fabric designs requiring the use of aspecial mechanism such as a fall plate can be produced. When three-dimensionalpattern effects are required, as in the case of curtains, the fall-plate techniqueis usually used. In the fall-plate technique, fall plate devices which consist ofa thin metal plate, extending across the width of the machine push the yarnunder the needle latch (see Fig. 9.60). Thus, yarn pushed with the fall-plateand the loop at the previous course are knocked over together. The yarnpushed by the fall plate (on front guide bar) gives a three-dimensional effecton the fabric surface. Opposite to laying-in, the yarn which is pushed by fallplate makes both motions, i.e., overlap and underlap.
Elasticated fabrics can be produced on Raschel machines in a similar wayto Tricot machines. The main differences between these two are the addingtechnique of elastomeric yarn into fabric. On Raschel machines, elastomericyarn can be inlaid into the structure rather than knitted into the loop structure.On Tricot machines, the inlaying of elastomeric yarn is not possible becausethe elastomeric yarn will pull the fabric out of the sinker throats. However,on Tricot machines, the elastomeric yarn can be knitted into the structure.
1
2
1
6
3
46
55
Key1 Guide for pillar stitch2 Guide for laying-in3 Yarn for laying-in4 Yarn for pillar stitch5 Pillar stitch6 Needle
9.59 Laying-in movement.

Cotton knitting technology 313
Jacquard mechanisms, weft insertion magazines and double needle bedsare also available on Raschel machines. In jacquard knitting, jacquard guidebars that take a yarn from a bobbin are used, in addition to other conventionalguide bars, which usually take yarn from a warp beam to produce a pillarstitch. The guides in the jacquard guide bar that are selected for deflectingsideways are long and flexible. The selection of each guide is carried outindependently. Selected guides on jacquard guide bars are deflected in orderto lay the yarn to a greater or lesser extent than undeflected guides at thatcourse. Thus, open, semi-solid or solid structures at that course can be obtained(see Fig. 9.61).6
Basic fabric types
There are many different types of fabric designs that can be produced onRaschel machines. One of them is net fabric. Net fabrics can be produced byvertical pillars or interlacing pillars. On net fabrics with vertical pillars, theguide bars are usually fully threaded and net appearance is obtained by usingtoo fine yarn compared to the machine gauge (see Fig. 9.62). At net fabricswith interlacing pillars, guide bars are partially threaded generally in a sequenceof 1 in and 1 out and net appearance is obtained by a partially threadedstructure, since certain wales are not connected at each courses. The openingin the fabric is obtained at these points as there are no side connectionsbetween adjacent wales (see Fig. 9.63).
3
1
2
Key1 Pattern yarn2 Thin metal of fall plate3 Ground yarn
9.60 Fall plate technique.

Cotton: Science and technology314
9.5.3 Properties of basic warp knitted fabrics
There are several basic warp knitted fabrics, such as m ¥ n lapping (mindicates the underlaying distance, n indicates overlap), atlas lapping, tricot,
(a) (b) (c) (d)
1 2 1 2 1 2 3 4
9.61 Deflection of guides (jacquard structure). (a) open structure, netopening is not covered by any underlap (b) semisolid structure,net opening is covered by two underlaps ; (c) solid structure, netopening is covered by four underlaps and (d) open, semisolidand solid structure.
Opening
(a) (b)
Ground Laying Laying
9.62 (a) Net fabric with vertical pillar and (b) fabric structure.
01232 1 01 0
9.63 (a) Net fabric with interlacing pillar and (b) fabric structure.
Opening
(b)
(a)
C
3 2 1 0A
3 2 1 0B
KeyA, B Stitch notationC Partially thread
notation

Cotton knitting technology 315
locknit, satin, sharkskin, queen’s cord. The main properties of these fabricsare briefly described below.
m ¥ n lapping fabrics
The most popular m ¥ n lapping fabrics are 1 ¥ 1, 2 ¥ 1 and 3 ¥ 1 lappingfabrics. An increase in the underlaying distance (m) leads to an increase infabric weight, fabric cover factor, smooth appearance at the technical backof the fabric, extensibility in the wale direction and stability in course directionand leads to a decrease in extensibility in the course direction. The mostpopular fabric designs (one or two fully threaded) which are also describedbelow are produced by this type of lapping.
Atlas lapping fabrics
The loops at the atlas lapping fabric incline towards the same direction fora few courses and then incline towards the opposite direction for another fewcourses. Thus, horizontal stripes or coloured zig-zag pattern effects willoccur on the technical face of the fabric.
Tricot fabric
It is produced by two fully threaded guide bars which have 1 ¥ 1 lappingmovement. The fabric has a light weight and it can be split very easily dueto short underlaying movement. The loop will not incline towards one direction,the wale therefore will remain vertical. The appearance of tricot fabrics maygenerally be improved by using a coloured yarn which gives vertical stripesin the fabric.
Locknit fabric
It is produced by two fully threaded guide bars. Splitting problem is less thanthat of Tricot fabrics. Locknit fabrics contract widthwise when leaving theknitting zone. It has a curling tendency. Coloured stripes can be obtained byusing coloured yarns. The front guide bar generally requires approximately30% more yarn than the back yarn.
Satin fabric
The technical face of a satin fabric is similar to the face of a locknit fabric.The technical back of the fabric is smoother and shinier due to longer underlapmovement of the front guide bar. It contracts in a widthwise direction whenleaving the knitting zone due to longer underlap movement of the front guidebar. It has a curling tendency and greater risk of snagging.
Cotton: Science and technology316
Sharkskin
It is more rigid and more stable in a lengthwise direction than satin fabricdue to shorter underlap movement of the front guide bar. The technical backof the fabric is rough due to short underlap movement of the front guide bar.
Queen’s cord
The fabric width changes very slightly when leaving the knitting zone. It isa very stable and rigid fabric.2,3,5,6
9.6 Faults in knitted fabrics
Weft knitted fabrics can generally possess two types of faults, which mayemanate from the knitting machine, i.e., faulty stripe placed on fabric inhorizontal direction and faulty stripe placed on fabric in vertical direction.
9.6.1 Faults in the horizontal direction
Faults in the horizontal direction generally come from settings of the machineor quality of yarn. If there are differences between each yarn tension, whichis fed into the needles, faults in the horizontal direction on the fabric willappear. These will be continuous and periodical in the course direction, sincethe loop length (stitch dimension) varies according to changes of yarn tension,i.e., an increase in yarn tension leads to a decrease in loop length. If thequality of the yarn on the feeding system is different from the others (suchas different yarn count, twist, raw material, etc.), again, a fault in the horizontaldirection of the fabric will appear. A simple way to determine the source offaults is to measure the course length in the faultless and faulty regions of thefabric. If there is course length differences between each region, the fault iscaused by the settings of the machine (differences between each yarn tension).If Uster values of the yarn (yarn evenness) from the creel are not suitable,again faults in the horizontal direction will appear, but will be in a discontinuousform in courseway and it will appear on the whole surface of the fabric(cloudiness). If the CV value of the yarn twist or yarn count is high, again,faults in the horizontal direction in discontinuous form will appear.1–3,7
9.6.2 Faulty stripes placed on fabric in vertical direction
Faults in the vertical direction generally come from defective needles andsinkers or faulty oiling system or quality of oil. Several factors also have tobe taken into consideration for quality of the weft knitted fabrics. Thesefactors are now briefly described. If the yarn used does not have enough
Cotton knitting technology 317
strength or has a big knot/splice or the knitting element (needle, sinker,etc.) is heavily worn, the yarn will be easily broken and a hole on the fabricwill appear. The twist value of the yarn should not be too high (not morethan 3.5 ae for cotton yarn), otherwise the fabric will not have a soft handleand serious spirality problems, where the angle between course and wale isnot 90 degrees will occur. If the twist value of the yarn is very low and theyarn consists of short staple fibres, pilling problems on the fabric surfacewill occur.
The yarns used for knitting should be more elastic and have less twistvalue than those used in weaving. This is very important, especially for thespecial designs, which contains tuck stitches. The humidity and the temperatureof the environment should be suitable for the process (around 65% humidityat 22 ∞C temperature), otherwise yarn breaks during production increase andincrease of temperature also leads to permanent paraffin migration.Insufficiently lubricated yarn causes drop stitches and holes in the fabric.However, excessive lubricant can increase frictional forces on the yarn andalso migrate into the yarn structure ruining its frictional and elasticproperties.
The settings (distance, dimensions) of the machine elements such as distancebetween feeder and needle, distance between cylinder and dial and camsetting have to be suitable for knitting conditions, otherwise several problemssuch as double stitch, etc. can take place. An increase in the number of fibresin the yarn or the percentage of synthetic fibres in the yarn or decrease infabric weight leads to an increase in pilling problems. Take-down tension offabric has to be suitable, otherwise it causes several problems such as hightake down tension leading to dimensional stability problems, however, lowtake down tension leads to a double stitch on the needle. Yarn tension aroundthe yarn feeder should not be more than 5 cN, otherwise broken yarn anddimensional stability problems increase. Fibre fly (fibre particles in the air)has to be avoided, otherwise it will settle into the fabric structure and, whendyed, will appear as a different colour from the fabric surface. The conicityof the feeding yarn bobbin should be around 3.5∞, 5∞, 9∞ for synthetic, cottonand wool, respectively, otherwise yarn take-off from the feeding bobbin willbe difficult.1–3,7
9.6.3 Comparison between ring and open-end yarn
Ring yarns typically have more strength and less extension than open-endyarns. Open-end yarns are typically better in terms of Uster evenness valuesand uniformity, and are cleaner than ring yarns. Open-end yarns also have aharsher handle because of their yarn structure (see Chapter 8), and are typicallybulkier than ring yarns. Open-end yarns result generally in more abrasion,dimensional change and greater recovery after compression and also cause
Cotton: Science and technology318
less pilling, less spirality, less compression and less wickability than ringyarns.1–3, 7–15
There are several fault types often observed in warp knitted fabrics
Faults arise from differences in yarn quality such as different yarn count,different fibre material or different number of fibres in yarn, etc., and fromdifferences in yarn tension. Each of these will cause a vertical stripe fault onthe fabric surface. Any defect on the needle or oiling system will also causevertical stripe faults on the fabric surface. Any defect in the patterning systemsuch as pattern disc or pattern chain causes faults in the horizontal direction.If the position of the guide bar or timing between the needle bar and theguide bar are not set correctly, this may cause a stitch-off.
The temperature and humidity of the environment and static have to betaken into consideration for warp knitting production because of the propertiesof the thermoplastic yarns and the expansion of the guides. When a knittingmachine is stopped, a defect in the horizontal direction can occur due to lowtension on the yarn arising from the stoppage. The amount of yarn fed intothe machine has to be suitable to fabric take-down, otherwise the fabric canbe tensioned or can be slack.
9.7 Physical and mechanical properties ofknitted fabrics
In this section, several important factors that affect the dimensional, aestheticaland mechanical properties of the knitted fabrics will be described.
Fabric relaxation reduces the internal forces and friction within the fabric.Generally, five cycles of washing and drying treatment are enough to obtainstable (relaxed) fabric. There is a linear relationship between loop length andfabric parameters such as course density, wale density and stitch density.Loop shape factor (course density/wale density) for fully relaxed cottonplain and 1 ¥ 1 rib fabric, which points out the dimension of fabric at therelaxed state is 1.3 and 1.1, respectively. Although all machine settings(thus, loop length) are kept constant, a change of fibre type (cotton, wool,etc.), yarn diameter, yarn twist level, yarn type or machine gauge results ina slight change in dimensional parameters at the fully relaxed fabric such ascourse and wale density (especially course density).
The constant values (kc and kw, dimensional parameters), which point outthe linear relationship between course density and stitch length and betweenwale density and stitch length, respectively, will change according to patternof the fabric such as plain, rib, cardigan, etc. For complex pattern designsuch as Punto-di-roma and Swiss double pique, dimensional parameters alsodepend on the run-in ratio (course length ratio for each course), in addition
Cotton knitting technology 319
to stitch length and other constant values, i.e., as the run-in ratio changes, thedimensional parameters also change.
The dimensional behaviour of fabrics depends on the pattern of the fabric,for example, while plain knit fabrics exhibit both width and length shrinkageafter relaxation treatment, rib and interlock fabrics generally exhibit widthexpansion and length shrinkage after relaxation treatment since the linkportion connecting the back and front loop, which is almost perpendicular tothe fabric plane, tries to come into the fabric plane resulting in widthwiseextension. As the tuck stitch at the successive courses increases, lengthwiseshrinkage after relaxation increases because of more distorted loop shapeand machine-imposed forces, thus, double half cardigan fabric generallyshrinks more than half or full cardigan fabric. Plain knit fabrics have moredimensional changes in the coursewise direction than the walewise direction,while lacoste knit fabrics present the opposite to plain knit fabrics duringrelaxation. Dimensional behaviour of the fabrics also depends on the fibretype used, for example, presence of lyocell fibre in yarn causes lengthwisedimensional shrinkage and widthwise dimensional extension after relaxation.An increase in the elasticity properties of the fabric leads generally to anincrease in dimensional change.7,9–25
Fabric thickness depends mostly on yarn diameter and little on stitchlength and yarn twist due to loop curvature. Presence of elastomeric yarnleads to an increase of fabric thickness due to an increase of loopcurvature.7,23,25,26
Tightness factor is proportional to the ratio of the yarn diameter to theloop length. Thus, an increase in yarn diameter or a decrease in loop lengthresults in an increase of the tightness factor. Change in stitch length generallyaffects course density more than wale density. An increase in tightness factorgenerally causes a reduction in effective yarn diameter at the loop interlockingregion and an increase in loop curvature.
Tighter fabrics generally exhibit less dimensional change due to less freemovement of the loops within the fabric structure. The tightness factor variesin the range 9–19 but the tightness factor between 11–17 is more practicalfor production. Tightness factor has to be around 14–15 for single jerseyfabrics and double jersey fabrics in order to decrease forces on yarn duringknitting (for optimum knitting).7,10,18–22,25,27–29
Technically, the wale in a knitted fabric is perpendicular to the course,however, the wale is not usually perpendicular to the course due to severalfactors such as twist liveliness of the yarn (yarn twist), number of knittingsystems (or yarn feeder) on machine, etc. These factors create a problemknown as spirality, i.e., an increase of yarn twist or number of knittingsystems lead to an increase of spirality. Spirality occurs when the twist valueof one loop leg is different from the other loop leg, leading to differences ofyarn diameter at each loop leg. These differences of twist cause a loop
Cotton: Science and technology320
rotation towards the third dimension, leading to spirality and skewness in thefabric. Spirality can be measured by the angle. The angle between the waleand line which is perpendicular to the course direction should not be morethan five degrees.
As the fabric tightness increases, the spirality decreases due to less spacerotation and higher inter-yarn friction. A decrease in machine gauge and anincrease in the number of knitting systems on a machine lead to an increasein spirality. After relaxation of the fabric, the spirality can increase or decreasedepending on the tightness value of the fabric. If the tightness value of thefabric is low, it is expected to have an increase in spirality. Spirality dependson the fibre type, for example, an increase of the amount of lyocell fibre inthe blend yarn results in an increase of spirality on the fabric.7–10,12,23,31
The behaviour of knitted fabrics under tensional loads depends on severalfactors such as fabric design, fabric tightness, yarn type, fibre type, appliedload, etc. When tensile loading is applied to the fabric, the yarn within thestructure moves until it jams and then the yarn elongates until it breaks.Under an applied load, plain knitted fabric has less elongation in the walewisedirection than that in coursewise direction due to widthwise jamming occurringsooner than coursewise jamming.
Slack fabrics generally exhibit more extension and growth than tight fabricsdue to easier yarn movement and decreased loop curvature (less spring-likebehaviour). However, this behaviour also depends on the pattern of thefabric, for example, simple fabric designs such as slack plain knit fabricsexhibit more residual bagging deformation than tighter ones, while tightcomplex design fabrics such as a cardigan fabric exhibit more residual baggingdeformation than slacker ones because of greater frictional resistance duringrecovery from deformation.27,45
Bending resistance and shear resistance of the fabric are generally higherin the course direction than in the wale direction due to the two loop legs.They generally decrease with a decrease in fabric tightness and with anincrease in fabric relaxation due to the reduction of inter-fibre and inter-yarnfrictions.
Bending rigidity for the negative curvature (the face of the fabric is on theconcave side) when the bending moment is applied around the axis parallelto the courses is lower than that of the positive curvature (the face of thefabric is on the convex side). However, the bending rigidity for positivecurvature when the bending momement is applied around the axis parallel tothe wales is lower than that of the negative curvature. Therefore, curlingproblems on unbalanced knit fabrics such as plain knit fabric occur, i.e., atthe top and bottom edges, curling occurs from the back to the front, at thesides of the fabric, curling occurs from the front to the back. Curling distanceat the top/bottom side is generally lower than that at the sides of the fabric,due to the higher bending rigidity of the fabric in the course direction although
Cotton knitting technology 321
there is a higher bending moment in the course direction. As the tightness ofthe fabric and bending rigidity of yarn increase, the curling tendency offabric increases.27–30,32,33
Air permeability of knitted fabrics depends on several factors such asthickness, fabric density, yarn properties, volume and arrangement of fibres,etc. Generally, the fabrics produced by the yarns with lower density fibresresult in lower air permeability due to greater tightness.12,14,15,17,34
Water absorption and wickability of the knitted fabrics generally dependson the gaps within the fabric structure, capillarity and absorption propertiesof the fibres. Increasing these factors results in an increase in water absorptionand wickability properties of the fabrics. As the ratio of the fibre with lowdensity in the blend increases, moisture absorption of the fabric decreases. Afabric knitted with fibres with less crimp and less fibre thickness has morewater absorption capacity than fabrics knitted with crimpy and thicker fibres,due to the number and dimension of pores within the fabric structure. Capillaryforces increase as the diameter of the fabric pores decreases, thus resultingin an increase in spreading of water or moisture. An increase in water absorptioncapacity leads to an increase in drying time. Thus, cotton fabrics spreadwater slower than polyamide or polyester fabrics and give less wet feelingon the skin than polyamide or polyester due to the higher water absoptionproperties of cotton. It needs more drying time than polyamide or polyesterfabric due to the higher water absoption properties of cotton.
The presence of elastomeric yarn in cotton knitted fabrics leads to adecrease in wickability due to an increase in stitch density. It also causes anincrease in water absorption due to an increase in the amount of cotton perunit area of fabric resulting from an increase in stitch density. An increase inhairiness of yarn on the fabric generally leads to an increase in drying timedue to an increase in dead-air volume (no air circulation). However, certainvalues of hairiness can also lead to a decrease in drying time due to theincrease in surface area through which evaporation occurs. Spreading water(wickability) in the wale direction is generally faster than the course directiondue to lower wale density.17,34–38
An increase in fabric thickness or decrease in packing factor and fibrethermal conductivity causes an increase in the thermal resistance of fabric.In knitted fabrics, conductive and convective heat transfer mechanisms aremore important than radiative type heat transfer, which is important especiallyfor structures with very low density. Thus, the fabric knitted with bulky yarnor finer and crimpier fibre provides better insulation due to more dead airwithin the fabric structure (conductivity of air is low). For example, anincrease in the number of the ribs on the rib fabric in extended form such as1 ¥ 1, 2 ¥ 2, 3 ¥ 3, etc., leads to an increase in heat loss, due to less airentrapped within the fabric.
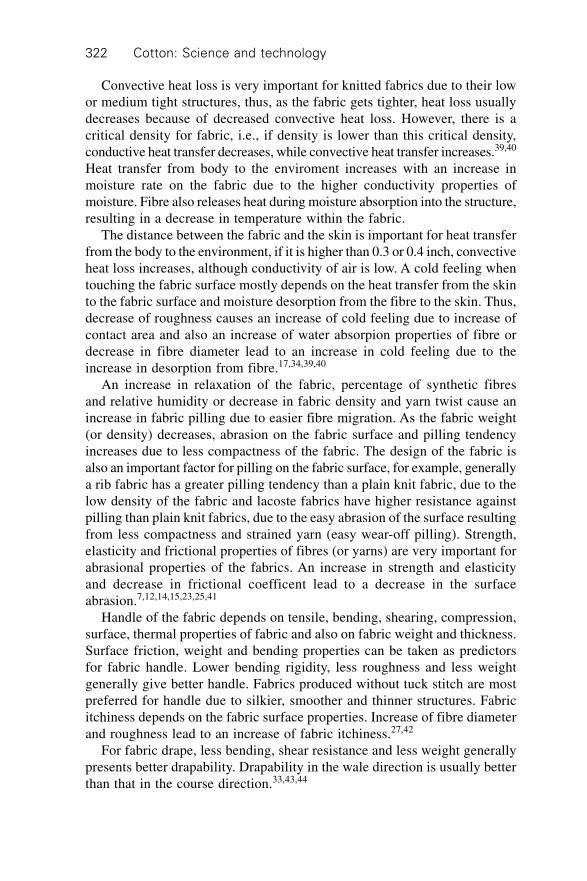
Cotton: Science and technology322
Convective heat loss is very important for knitted fabrics due to their lowor medium tight structures, thus, as the fabric gets tighter, heat loss usuallydecreases because of decreased convective heat loss. However, there is acritical density for fabric, i.e., if density is lower than this critical density,conductive heat transfer decreases, while convective heat transfer increases.39,40
Heat transfer from body to the enviroment increases with an increase inmoisture rate on the fabric due to the higher conductivity properties ofmoisture. Fibre also releases heat during moisture absorption into the structure,resulting in a decrease in temperature within the fabric.
The distance between the fabric and the skin is important for heat transferfrom the body to the environment, if it is higher than 0.3 or 0.4 inch, convectiveheat loss increases, although conductivity of air is low. A cold feeling whentouching the fabric surface mostly depends on the heat transfer from the skinto the fabric surface and moisture desorption from the fibre to the skin. Thus,decrease of roughness causes an increase of cold feeling due to increase ofcontact area and also an increase of water absorpion properties of fibre ordecrease in fibre diameter lead to an increase in cold feeling due to theincrease in desorption from fibre.17,34,39,40
An increase in relaxation of the fabric, percentage of synthetic fibresand relative humidity or decrease in fabric density and yarn twist cause anincrease in fabric pilling due to easier fibre migration. As the fabric weight(or density) decreases, abrasion on the fabric surface and pilling tendencyincreases due to less compactness of the fabric. The design of the fabric isalso an important factor for pilling on the fabric surface, for example, generallya rib fabric has a greater pilling tendency than a plain knit fabric, due to thelow density of the fabric and lacoste fabrics have higher resistance againstpilling than plain knit fabrics, due to the easy abrasion of the surface resultingfrom less compactness and strained yarn (easy wear-off pilling). Strength,elasticity and frictional properties of fibres (or yarns) are very important forabrasional properties of the fabrics. An increase in strength and elasticityand decrease in frictional coefficent lead to a decrease in the surfaceabrasion.7,12,14,15,23,25,41
Handle of the fabric depends on tensile, bending, shearing, compression,surface, thermal properties of fabric and also on fabric weight and thickness.Surface friction, weight and bending properties can be taken as predictorsfor fabric handle. Lower bending rigidity, less roughness and less weightgenerally give better handle. Fabrics produced without tuck stitch are mostpreferred for handle due to silkier, smoother and thinner structures. Fabricitchiness depends on the fabric surface properties. Increase of fibre diameterand roughness lead to an increase of fabric itchiness.27,42
For fabric drape, less bending, shear resistance and less weight generallypresents better drapability. Drapability in the wale direction is usually betterthan that in the course direction.33,43,44
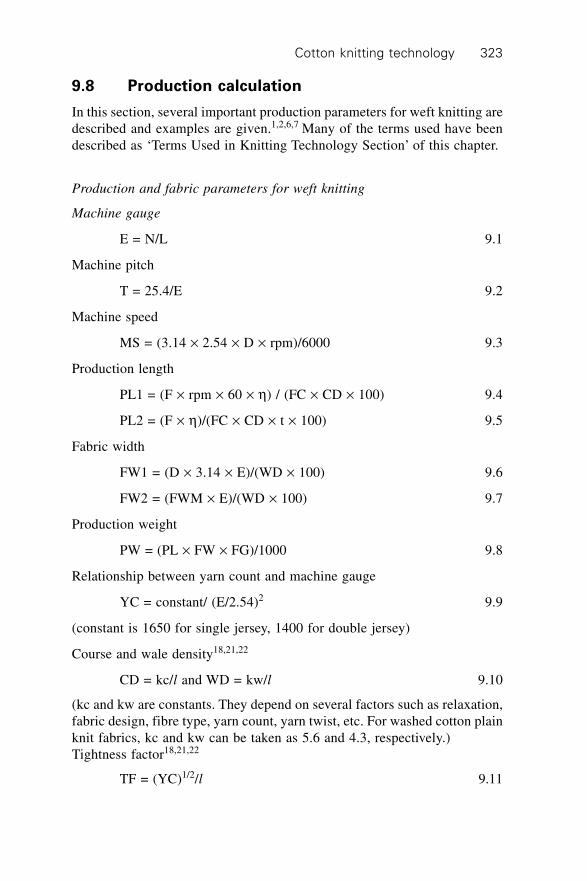
Cotton knitting technology 323
9.8 Production calculation
In this section, several important production parameters for weft knitting aredescribed and examples are given.1,2,6,7 Many of the terms used have beendescribed as ‘Terms Used in Knitting Technology Section’ of this chapter.
Production and fabric parameters for weft knitting
Machine gauge
E = N/L 9.1
Machine pitch
T = 25.4/E 9.2
Machine speed
MS = (3.14 ¥ 2.54 ¥ D ¥ rpm)/6000 9.3
Production length
PL1 = (F ¥ rpm ¥ 60 ¥ h) / (FC ¥ CD ¥ 100) 9.4
PL2 = (F ¥ h)/(FC ¥ CD ¥ t ¥ 100) 9.5
Fabric width
FW1 = (D ¥ 3.14 ¥ E)/(WD ¥ 100) 9.6
FW2 = (FWM ¥ E)/(WD ¥ 100) 9.7
Production weight
PW = (PL ¥ FW ¥ FG)/1000 9.8
Relationship between yarn count and machine gauge
YC = constant/ (E/2.54)2 9.9
(constant is 1650 for single jersey, 1400 for double jersey)
Course and wale density18,21,22
CD = kc/l and WD = kw/l 9.10
(kc and kw are constants. They depend on several factors such as relaxation,fabric design, fibre type, yarn count, yarn twist, etc. For washed cotton plainknit fabrics, kc and kw can be taken as 5.6 and 4.3, respectively.)Tightness factor18,21,22
TF = (YC)1/2/l 9.11
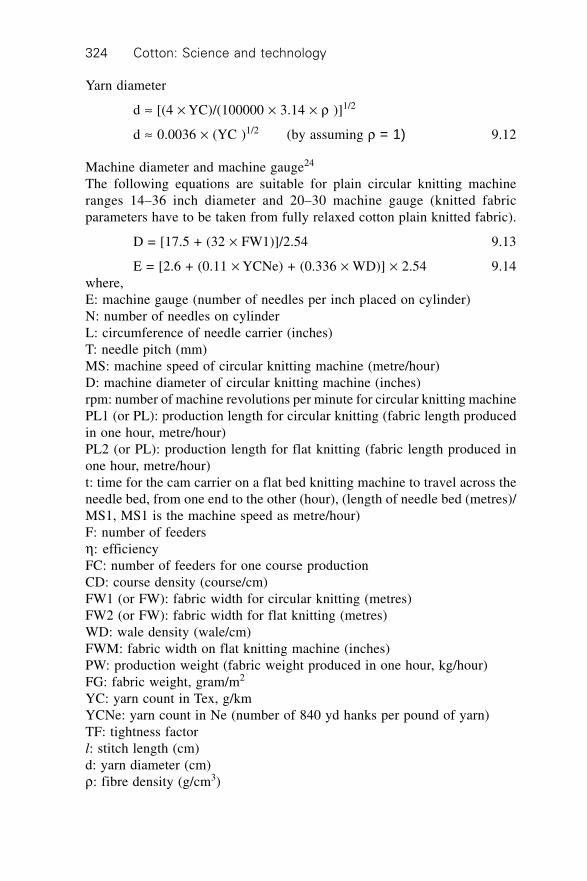
Cotton: Science and technology324
Yarn diameter
d ª [(4 ¥ YC)/(100000 ¥ 3.14 ¥ r )]1/2
d ª 0.0036 ¥ (YC )1/2 (by assuming r = 1) 9.12
Machine diameter and machine gauge24
The following equations are suitable for plain circular knitting machineranges 14–36 inch diameter and 20–30 machine gauge (knitted fabricparameters have to be taken from fully relaxed cotton plain knitted fabric).
D = [17.5 + (32 ¥ FW1)]/2.54 9.13
E = [2.6 + (0.11 ¥ YCNe) + (0.336 ¥ WD)] ¥ 2.54 9.14where,E: machine gauge (number of needles per inch placed on cylinder)N: number of needles on cylinderL: circumference of needle carrier (inches)T: needle pitch (mm)MS: machine speed of circular knitting machine (metre/hour)D: machine diameter of circular knitting machine (inches)rpm: number of machine revolutions per minute for circular knitting machinePL1 (or PL): production length for circular knitting (fabric length producedin one hour, metre/hour)PL2 (or PL): production length for flat knitting (fabric length produced inone hour, metre/hour)t: time for the cam carrier on a flat bed knitting machine to travel across theneedle bed, from one end to the other (hour), (length of needle bed (metres)/MS1, MS1 is the machine speed as metre/hour)F: number of feedersh: efficiencyFC: number of feeders for one course productionCD: course density (course/cm)FW1 (or FW): fabric width for circular knitting (metres)FW2 (or FW): fabric width for flat knitting (metres)WD: wale density (wale/cm)FWM: fabric width on flat knitting machine (inches)PW: production weight (fabric weight produced in one hour, kg/hour)FG: fabric weight, gram/m2
YC: yarn count in Tex, g/kmYCNe: yarn count in Ne (number of 840 yd hanks per pound of yarn)TF: tightness factorl: stitch length (cm)d: yarn diameter (cm)r: fibre density (g/cm3)

Cotton knitting technology 325
9.9 Conclusions
Knitting technology developed from a very primitive method to high-techmethods, such as computer controlled production and design. During the lasttwo decades, electronic control of knitting machines developed rapidly.
Different fibre types such as cotton, wool, polyester, acrylic, viscon, etc.,can be used on knitting machines. However, cotton and cotton blend yarn arewidely used on circular knitting machines for the apparel industry producingt-shirts, sweatshirts and underwear, due to their comfort and healthyproperties. Although different man-made fibres have been developed, notone could still attain the properties of cotton. It seems therefore that cottonand cotton blend yarn will be preferred for use in sports wear and underwear,for a long time.
9.10 References
1. Iyer C, Mammel B, Schach W, Circular Knitting: Technology, Process, Structures,
Yarns, Quality, Bamberg, Meisenbach GmbH, 1995.2. Spencer D J, Knitting Technology, Oxford, Pergamon Press, 1989.3. Horrocks A R, Anand S C, Handbook of Technical Textiles, Cambridge, Woodhead
Publishing, 2000.4. Raz S, Flat Knitting: The New Generation, Bamberg, Meisenbach GmbH, 1991.5. Paling D F, Warp Knitting Technology, London, Harlequin Press, 1952.6. Raz S, Warp Knitting Production, Heidelberg, Melliand, 1987.7. Uçar N, ‘Faults in Knitted Fabrics and Production Calculation’, Short Courses,
Istanbul, 1997.8. Araujo M D De, Smith G W, ‘Spirality of Knitted Fabric, Part I: The Nature of
Spirality’, Textile Research Journal, 1989 59(5) 247–256.9. Banerjee P K, Alaiban T S, ‘Geometry and Dimensional Properties of Plain Loops
Made of Rotor Spun Cotton Yarns, Part III: Spirality of Wale Line’, Textile Research
Journal, 1988 58(6) 287–290.10. Banerjee P K, Alaiban T S, ‘Geometry and Dimensional Properties of Plain Loops
Made of Rotor Spun Cotton Yarns, Part IV: The Shape of the Loop’, Textile Research
Journal, 1988 58(6) 365–369.11. Burnip M S, Abbas M S, ‘The Dimensional Behaviour of Weft Knitted Fabrics
Produced from Blended Fiber Yarns’, Journal of the Textile Institute, 1973 64(10)702–703.
12. Lord P R, Mohamed M H, Ajgaonkar D B, ‘The Performance of Open End, Twistlessand Ring Yarns in Weft Knitted Fabrics’, Textile Research Journal, 1974 44(6) 405–414.
13. McKinney M, Broome E R, ‘The Effects of Laundering on the Performance of OpenEnd and Ring Spun Yarns in Jersey Knit Fabrics’, Textile Research Journal, 197747(3) 155–162.
14. Sharma I C, Ghosh S, Gupta N K, ‘Dimensional and Physical Characteristics ofSingle Jersey Fabrics’, Textile Research Journal, 1985 55(3) 149–156.
15. Zurek W, Cislo R, Bialek U, Dziewiecka M, ‘Physical Properties of Weft KnittedFabrics’, Textile Research Journal, 1986 56(4) 241–248.
Cotton: Science and technology326
16. Heap S A, Greenwood P F, Leah R D, Eaton J T, Stevens J C, Keher P, ‘Predictionof Relaxed Dimensions of Cotton Knits – The Starfish Project, Part II: Shrinkageand The Reference State’, Textile Research Journal, 1985 55(4) 211–222.
17. Kaswell E R, Barish L, Lermond C A, ‘A Study of the Comparative Comfort Propertiesof Nylon Bulk-Yarn Knitted Fabrics with those Prepared from Cotton, Wool andContinuous Filament Man Made Fiber Yarn’, Journal of the Textile Institute, 196152(9) P508–P523.
18. Knapton J J F, Ahrens F J, Ingenthron W W, Fong W, ‘The Dimensional PropertiesWool Fabrics, Part I: The Plain Knitted Structures’, Textile Research Journal, 196838(10) 999–1012.
19. Knapton J J F, ‘Factors Affecting the Stable Dimensions of Double Jersey Structures’,Journal of the Textile Institute, 1974 65(6) 293–299.
20. Knapton J J F, Ahrens F J, Ingenthron W W, Fong W, ‘The Dimensional PropertiesWool Fabrics, Part II: 1 ¥ 1, 2 ¥ 2 Rib and Half Cardigan Structures’, Textile
Research Journal, 1968 38(11) 1013–1026.21. Postle R, Munden D L, ‘Analysis of the Dry-Relaxed Knitted Loop Configuration,
Part II: Three Dimensional Analysis’, Journal of the Textile Institute, 1967 58(8)352–365.
22. Postle R, ‘Dimensional Stability of Plain Knitted Fabrics’, The Journal of the Textile
Institute, 1968 59(2) 65–77.23. Uçar N, Karaka ş H C, ‘Effect of Lyocell Blend Yarn and Pile Type on the Properties
of Pile Loop Knit Fabrics’, Textile Research Journal, 2005 75(4) 352–356.24. Uçar N, Ertu ğ rul Ş , ‘Predicting Circular Knitting Machine Parameters for Cotton
Plain Fabrics Using Conventional and Neuro-Fuzzy Methods’, Textile Research
Journal, 2002 72(4) 61–366.25. Uçar N, Karaka ş H C, Sariünal S, ‘The Comparison of the Performance of Acrylic
Flat Knit Products of Different Fabric Designs’, 2nd International Textile Clothing
& Design Conference, Croatia, University of Zagreb 2004.26. Shinn W E, ‘An Engineering Approach to Jersey Fabric Construction’, Textile Research
Journal, 1955 25(3) 270–277.27. Uçar N, Realff M L, Radhakryshnaiah P, Uçar M, ‘Objective and Subjective Analysis
of Knitted Fabric Bagging’, Textile Research Journal, 2002 72(11) 977–982.28. Uçar N, ‘Prediction of Curling Distance of Dry Relaxed Cotton Plain Knitted Fabrics,
Part I: Theoretical Analysis of Moments on the Loop that Force the Fabric to Curl’,Journal of Textile Engineering, 2000 46(4) 109–117.
29. Uçar N, ‘Prediction of Curling Distance of Dry Relaxed Cotton Plain Knitted Fabrics,Part II: Experimental Study and Regression Analysis for Prediction of Curling Distance’,Journal of Textile Engineering, 2000 46(4) 118–122.
30. Hamilton R J, Postle R, ‘Bending and Recovery of Wool Plain Knitted Fabrics’,Textile Research Journal, 1974 44(5) 336–343.
31. Szomanski W M, Postle R, ‘Measurement of Torsion in Monofilament TextileStructures’, Textile Research Journal, 1970 40(8) 762–764.
32. Hamilton R J, Postle R, ‘Shear Properties of Wool Plain Knitted Fabrics’, Textile
Research Journal, 1976 46(4) 265–272.33. Uçar N, Kalao ğ lu F, Bahtiyar D, Bilaç O E, ‘Investigating the Drape Behavior of
Seamed Knit Fabric with Image Analysis’, Textile Research Journal, 2004 74(2)166–171.
34. Li Y, Zhu Q, Yeung K W, ‘Influence of Thickness and Porosity on Coupled Heat andLiquid Moisture Transfer in Porous Textiles’, Textile Research Journal, 2002 75(5)435–446.

Cotton knitting technology 327
35. Coplan M J, ‘Some Moisture Relations of Wool and Several Synthetic Fibers andBlends’, Textile Research Journal, 1953 12(11), 897–916.
36. Crow R, Osczevski R J, ‘The Interaction of Water with Fabric’, Textile Research
Journal, 1998 68(4) 280–288.37. Fourt L, Sookne A M, Frishman D, Harris M, ‘The Rate of Drying of Fabrics’,
Textile Research Journal, 1951 1(1), 26–33.38. Hsieh Y, ‘Liquid Transport in Fabric Structures’, Textile Research Journal, 1995
65(5) 299–307.39. Holcombe B V, Hoschke B N, ‘Dry Heat Transfer Characteristics of Underwear
Fabrics’, Textile Research Journal, 1983 53(6) 368–374.40. Uçar N, Yilmaz T, ‘Thermal Properties of 1 ¥ 1, 2 ¥ 2, 3 ¥ 3, Rib Knit Fabrics’,
Fibers & Textiles in Eastern Europe, 2004 12(3) 34–38.41. Uçar N, Boyraz P, ‘Measurement of Fuzz Fibers on Fabric Surface Using Image
Analysis Methods’, Fibers and Polymers, 2005 6(1) 79–81.42. Chen P L, Barker R L, Smith G W, Scruggs B, ‘Handle of Weft Knit Fabrics’, Textile
Research Journal, 1992 83(4) 200–210.43. Amirbayat J, Hearle J W S, ‘The Anatomy of Buckling of Textile Fabrics: Drape and
Conformability’, Journal of the Textile Institute, 1989 80(1) 51–69.44. Gaucher M L, King M W, Johnston B, ‘Predicting the Drape Coefficient of Knitted
Fabrics’, Textile Research Journal, 1983 53(5) 297–303.45. Ertu ğ rul Ş , Uçar N, ‘Predicting Bursting Strength of Cotton Plain Knitted Fabrics
Using Intelligient Techniques’, Textile Research Journal, 2000 70(10) 845–851.

328
10.1 Introduction
Fabric is generally defined as an assembly of fibres, yarns or combinationsof these. Fabrics are most commonly woven or knitted, but the term includesassemblies produced by lace making, tufting, felting, and knot making aswell as by the so-called non-woven processes. The raw materials used andthe machinery employed mainly govern the type of fabrics produced.
Of all the fabric formation procedures, weaving is the oldest method andit is probably as old as human civilization itself. Historical evidences showthat Egyptians made woven fabrics some 6000 years ago and Chinese madefine fabrics from silk over 4000 years ago. Woven fabric is produced byinterlacing of threads placed perpendicular to each other. The yarns that areplaced length-wise or parallel to the selvedges (edges) of the cloth are calledwarp yarns. The yarns that run cross-wise are called weft or filling yarns.There are numerous ways of interlacing yarns to produce a variety of fabricstructures.
In different civilizations, it is believed, various types of handlooms wereinvented for weaving cloth. Weaving was a cottage industry until John Kayinvented the hand-operated fly shuttle in the year 1733. Edmund Cartwrightinvented the power loom in 1785. Introduction of the electric power drivenloom opened up a new vista and particular emphasis was placed on increasingthe loom speeds and thereby achieving higher productivity. Besides,developments in science have significantly changed the technologies ofinserting weft yarns whereby not only productivity increased but also newerweaving processes and product developments took place. As a result of theseadvances, shuttleless and multiphase looms emerged in the 20th century. Inthis chapter a brief description of the weaving processes is presented to helpreaders understand how wonderfully fibres, individually small are made intocloth running into several metres in length.
The various weaving processes are dealt with in the same sequence asthey occur in the weaving of a fabric. Also, for better appreciation of the
10Cotton weaving technology
I D O R A I S W A M Y and A B A S U, The South IndiaTextile Research Association, India

Cotton weaving technology 329
basic principles of weaving, for most of the explanations, features of theearlier generations of machinery are also mentioned along with those ofcontemporary machines since the new generations of machines are, by andlarge, the technological upgrades of the preceding generations of machines.
The chapter is divided into seven sections, including this introductionwhich forms the first section. The Section 10.2 describes the various preparatoryprocesses for weaving whilst the Section 10.3 covers the weaving operationsand mechanisms. The Section 10.4 explains the significance of the importantfabric properties in relation to specific end uses. Modern weaving machinesare dealt with in Section 10.5. The concluding section gives some usefulstatistics on the installed capacities of looms in selected countries as well asproduction costs. An indication is also given of the likely growth scenario ofweaving in the developing and developed countries.
10.2 Preparatory processes for weaving
10.2.1 Warping
The objective of preparing a warp is to supply a sheet of yarns, of desiredlength to the succeeding processes, laid parallel to each other. Warping isdone by winding a number of yarns from a creel of single-end packages suchas cones or cheeses onto a beam or a section beam. The warp beam that isinstalled on a weaving machine is called a weaver’s beam. The two basicsystems of preparing warp are known as the direct system and the indirectsystem. Direct warping is used in two ways. First, it can be used to producedirectly the weaver’s beam in case of strong yarns and when the number ofwarp ends on the warp beam is relatively small. Second, it can be used toproduce smaller intermediate beams, and the warper’s beams are combinedlater at sizing stage to produce the weaver’s beam. Indirect warping isused to produce a section beam which facilitates a wide range of fabricconstructions that would require the use of multi-coloured yarns, fancy weavesand assortment of yarn counts. Warp yarn is wound onto the beam in sections,beginning with the tapered end of the beam. Because of the geometry of theconcentrically wound yarn sections, the end of the beam is tapered to ensurethe yarn on the beam is stable (Fig.10.1). After all the sections on the beam
µ
1 2 3 4…Yarn sections
10.1 Tapered section beam.
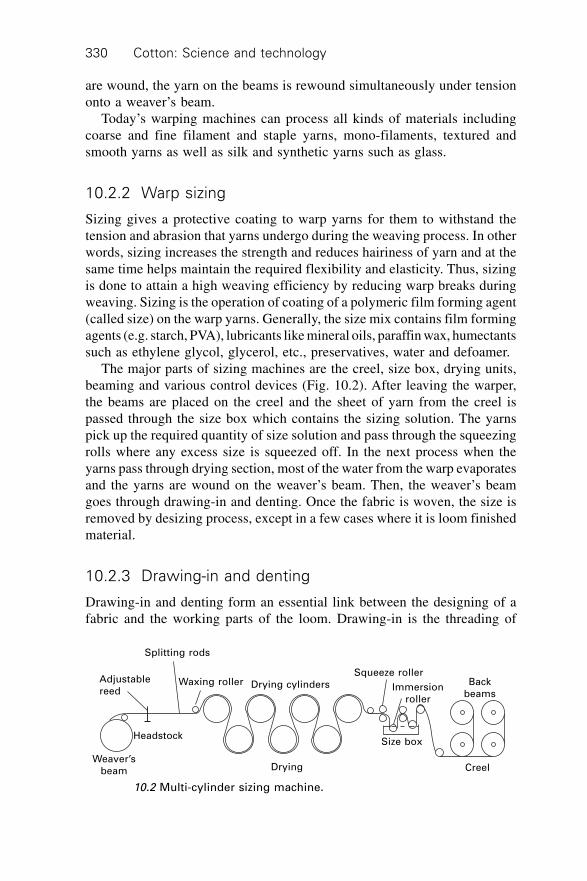
Cotton: Science and technology330
are wound, the yarn on the beams is rewound simultaneously under tensiononto a weaver’s beam.
Today’s warping machines can process all kinds of materials includingcoarse and fine filament and staple yarns, mono-filaments, textured andsmooth yarns as well as silk and synthetic yarns such as glass.
10.2.2 Warp sizing
Sizing gives a protective coating to warp yarns for them to withstand thetension and abrasion that yarns undergo during the weaving process. In otherwords, sizing increases the strength and reduces hairiness of yarn and at thesame time helps maintain the required flexibility and elasticity. Thus, sizingis done to attain a high weaving efficiency by reducing warp breaks duringweaving. Sizing is the operation of coating of a polymeric film forming agent(called size) on the warp yarns. Generally, the size mix contains film formingagents (e.g. starch, PVA), lubricants like mineral oils, paraffin wax, humectantssuch as ethylene glycol, glycerol, etc., preservatives, water and defoamer.
The major parts of sizing machines are the creel, size box, drying units,beaming and various control devices (Fig. 10.2). After leaving the warper,the beams are placed on the creel and the sheet of yarn from the creel ispassed through the size box which contains the sizing solution. The yarnspick up the required quantity of size solution and pass through the squeezingrolls where any excess size is squeezed off. In the next process when theyarns pass through drying section, most of the water from the warp evaporatesand the yarns are wound on the weaver’s beam. Then, the weaver’s beamgoes through drawing-in and denting. Once the fabric is woven, the size isremoved by desizing process, except in a few cases where it is loom finishedmaterial.
10.2.3 Drawing-in and denting
Drawing-in and denting form an essential link between the designing of afabric and the working parts of the loom. Drawing-in is the threading of
CreelDryingWeaver’s
beam
Splitting rods
Adjustablereed
Headstock
Waxing roller Drying cylindersSqueeze roller
Size box
Immersionroller
Backbeams
10.2 Multi-cylinder sizing machine.

Cotton weaving technology 331
warp yarns from the sized weaver’s beam into the eyes of the healds whichare mounted in the heald frames in the loom (Fig. 10.3). The threading ofyarns follows the desired pattern of the fabric. Each warp yarn end will bedrawn through the eye of one heald. Healds which are required to be raisedat the same time will be placed on the same heald frame, while healds thatlift differently will be placed on different heald frames. Healds control themovement of warp threads to separate themselves into two layers so as tomake a tunnel for filling or weft yarns to be inserted in the gap. This openingis called the shed. After the warp yarns in the beam are exhausted and if thereis no change in the design, then the corresponding ends of yarns of old andnew warp beams are tied together and this is called tying-in process.
Denting is the arrangement of warp ends in the reed space (Fig. 10.4). Thereed is made of flat metal strips fixed at uniform intervals on a frame to form
Heald frame
Slider bar
Heald
Heald eye
10.3 Heald frame and healds.
Dent wire
Dent (space)
10.4 Reed.

Cotton: Science and technology332
a closed comb-like structure. The spaces between the metal strips are knownas dents. Reeds are identified by a reed number which is the number of dentsper unit width. The reed holds one or more warp yarns in each dent. Dentingplans describe the arrangement of the warp ends in the reed which controlsthe warp yarn density in the fabric. Warp density is expressed as either endsper inch or ends per centimetre. The main functions of the reed are to holdthe warp yarns at uniform intervals, beat up the newly inserted weft andsimultaneously support the shuttle during its traverse motion.
10.3 Weaving process
10.3.1 Weaving operation
The weaver’s or loom beam stores warp yarns. It is placed at the back of theloom. The yarns from the beam pass round the back rest roller which ensuresthat the yarns are maintained at the same weaving angle as the weaver’sbeam decreases in size during weaving. The warp let-off mechanism unwindsthe warp yarns from the beam, as the yarns are woven into fabric, at thedesired rate and at constant tension as required. The schematic diagram(Fig. 10.5) illustrates how the warp yarns pass through a loom.
The yarns from the back rest roller are brought forward. Each end of theyarns from the beam is threaded through the eye of a drop wire. The drop
Roller reversing motion
Warp
Drop wire
Back rest
Left-off motion
Rocking shaftTreadle bowl
Treadle levers
Bottom shaft
Shedding cams
Weaver’s beam
Heald eye
Heald
Cloth roller
Sley
Heald frame
Reed
Shuttle
ClothFront rest
Take-uproller
Nip roller
Fell
Raceboard
10.5 A cross-section through the loom.
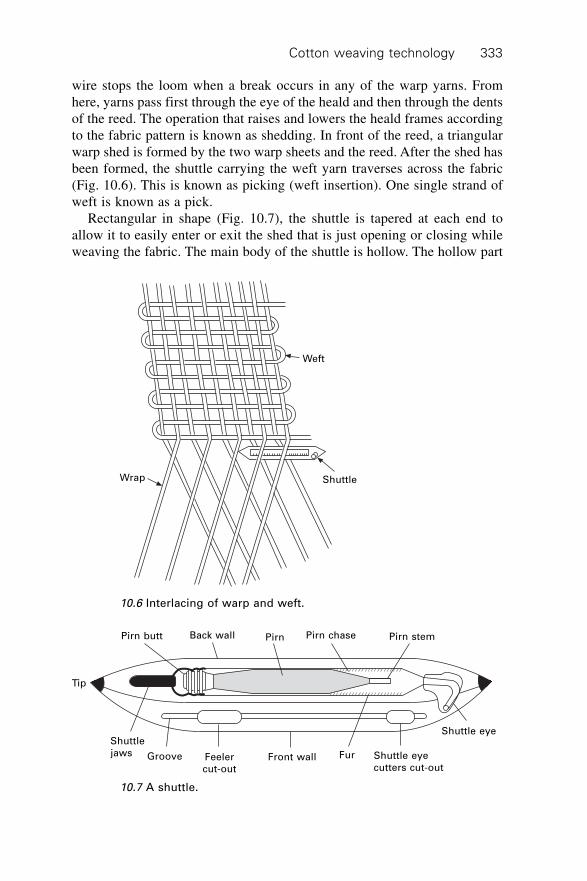
Cotton weaving technology 333
wire stops the loom when a break occurs in any of the warp yarns. Fromhere, yarns pass first through the eye of the heald and then through the dentsof the reed. The operation that raises and lowers the heald frames accordingto the fabric pattern is known as shedding. In front of the reed, a triangularwarp shed is formed by the two warp sheets and the reed. After the shed hasbeen formed, the shuttle carrying the weft yarn traverses across the fabric(Fig. 10.6). This is known as picking (weft insertion). One single strand ofweft is known as a pick.
Rectangular in shape (Fig. 10.7), the shuttle is tapered at each end toallow it to easily enter or exit the shed that is just opening or closing whileweaving the fabric. The main body of the shuttle is hollow. The hollow part
Weft
ShuttleWrap
10.6 Interlacing of warp and weft.
Pirn stemPirn chasePirnBack wallPirn butt
Tip
Shuttle eye
Shuttle eyecutters cut-out
FurFront wallFeelercut-out
Groove
Shuttlejaws
10.7 A shuttle.
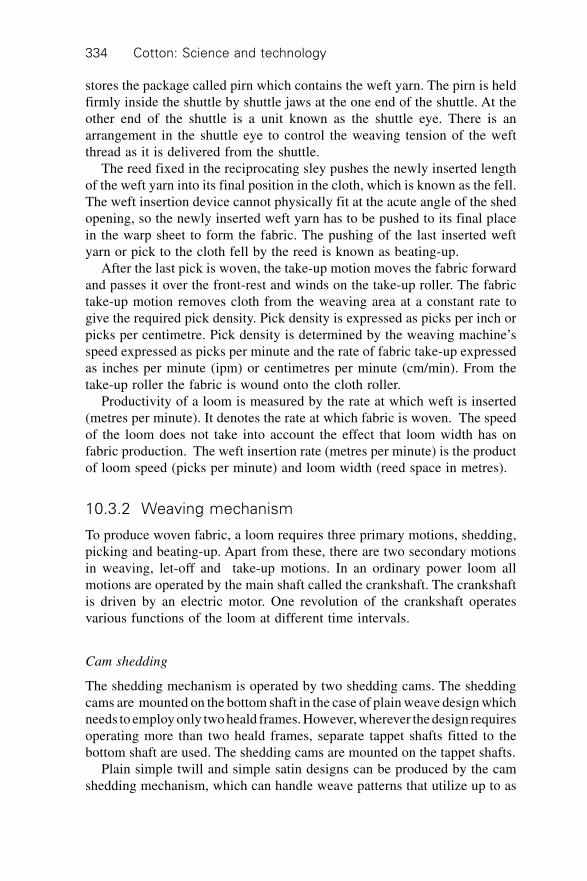
Cotton: Science and technology334
stores the package called pirn which contains the weft yarn. The pirn is heldfirmly inside the shuttle by shuttle jaws at the one end of the shuttle. At theother end of the shuttle is a unit known as the shuttle eye. There is anarrangement in the shuttle eye to control the weaving tension of the weftthread as it is delivered from the shuttle.
The reed fixed in the reciprocating sley pushes the newly inserted lengthof the weft yarn into its final position in the cloth, which is known as the fell.The weft insertion device cannot physically fit at the acute angle of the shedopening, so the newly inserted weft yarn has to be pushed to its final placein the warp sheet to form the fabric. The pushing of the last inserted weftyarn or pick to the cloth fell by the reed is known as beating-up.
After the last pick is woven, the take-up motion moves the fabric forwardand passes it over the front-rest and winds on the take-up roller. The fabrictake-up motion removes cloth from the weaving area at a constant rate togive the required pick density. Pick density is expressed as picks per inch orpicks per centimetre. Pick density is determined by the weaving machine’sspeed expressed as picks per minute and the rate of fabric take-up expressedas inches per minute (ipm) or centimetres per minute (cm/min). From thetake-up roller the fabric is wound onto the cloth roller.
Productivity of a loom is measured by the rate at which weft is inserted(metres per minute). It denotes the rate at which fabric is woven. The speedof the loom does not take into account the effect that loom width has onfabric production. The weft insertion rate (metres per minute) is the productof loom speed (picks per minute) and loom width (reed space in metres).
10.3.2 Weaving mechanism
To produce woven fabric, a loom requires three primary motions, shedding,picking and beating-up. Apart from these, there are two secondary motionsin weaving, let-off and take-up motions. In an ordinary power loom allmotions are operated by the main shaft called the crankshaft. The crankshaftis driven by an electric motor. One revolution of the crankshaft operatesvarious functions of the loom at different time intervals.
Cam shedding
The shedding mechanism is operated by two shedding cams. The sheddingcams are mounted on the bottom shaft in the case of plain weave design whichneeds to employ only two heald frames. However, wherever the design requiresoperating more than two heald frames, separate tappet shafts fitted to thebottom shaft are used. The shedding cams are mounted on the tappet shafts.
Plain simple twill and simple satin designs can be produced by the camshedding mechanism, which can handle weave patterns that utilize up to as
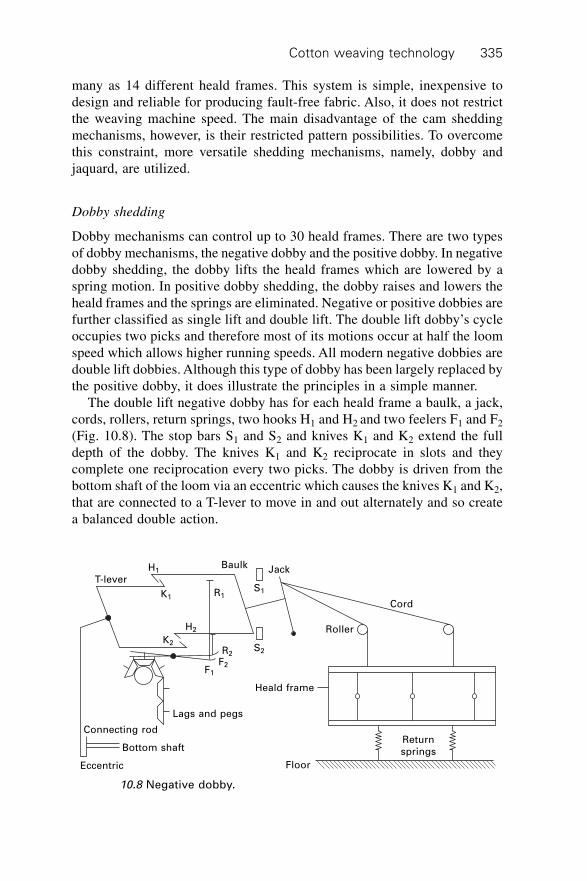
Cotton weaving technology 335
many as 14 different heald frames. This system is simple, inexpensive todesign and reliable for producing fault-free fabric. Also, it does not restrictthe weaving machine speed. The main disadvantage of the cam sheddingmechanisms, however, is their restricted pattern possibilities. To overcomethis constraint, more versatile shedding mechanisms, namely, dobby andjaquard, are utilized.
Dobby shedding
Dobby mechanisms can control up to 30 heald frames. There are two typesof dobby mechanisms, the negative dobby and the positive dobby. In negativedobby shedding, the dobby lifts the heald frames which are lowered by aspring motion. In positive dobby shedding, the dobby raises and lowers theheald frames and the springs are eliminated. Negative or positive dobbies arefurther classified as single lift and double lift. The double lift dobby’s cycleoccupies two picks and therefore most of its motions occur at half the loomspeed which allows higher running speeds. All modern negative dobbies aredouble lift dobbies. Although this type of dobby has been largely replaced bythe positive dobby, it does illustrate the principles in a simple manner.
The double lift negative dobby has for each heald frame a baulk, a jack,cords, rollers, return springs, two hooks H1 and H2 and two feelers F1 and F2
(Fig. 10.8). The stop bars S1 and S2 and knives K1 and K2 extend the fulldepth of the dobby. The knives K1 and K2 reciprocate in slots and theycomplete one reciprocation every two picks. The dobby is driven from thebottom shaft of the loom via an eccentric which causes the knives K1 and K2,that are connected to a T-lever to move in and out alternately and so createa balanced double action.
Floor
Returnsprings
Heald frame
Cord
Roller
Jack
S1
S2
R1
R2
F2F1
BaulkH1
K1
H2
K2
T-lever
Lags and pegs
Eccentric
Bottom shaft
Connecting rod
10.8 Negative dobby.
Cotton: Science and technology336
The heald frame is connected by cords, rollers and a jack to the centre ofthe baulk and it is raised by stretched springs when the top end of the baulkis away from its stop bar S1. The stop bar S2 acts as a fulcrum. This actionof moving the baulk away from S1 happens when the T-lever pulls the knifeK1 outward along with the hook H1. This was possible because K1 hadpreviously engaged hook H1. The interlocking between K1 and H1 was madewhen a peg in the lag forming part of the pattern chain had raised the left-hand end of the feeler F1 which thus allowed the rod R1 to lower the hook H1
and link onto the knife K1.In the next sequence of actions, as there is no peg to support the left-hand
end of the feeler F2, this end of F2 will not be lifted and the rod R2 willpush the hook H2 into a raised position and thereby no link will be formedbetween K2 and H2. As the action continues, the top end of the baulk will bereturned to its stop bar S1, and at the same time the bottom knife will moveto the left without disturbing the bottom end of the baulk. The heald framewill therefore be lowered and will remain down for the next pick. In theabsence of a peg, the frame remains down and both ends of the baulk are incontact with the stop bars.
The required pattern is represented in the pattern chain which has numberof lags linked to form a continuous chain. The lags are pegged using smallwooden pegs as per the pattern. Each lag corresponds to two picks. Thepattern chain is turned intermittently by a wheel.
The need for higher speeds to improve productivity coupled with thedemand for heavier lifts particularly on wider looms have led to the morewidespread use of the positive dobby. In this system of shedding, the healdframes are both raised and lowered by the dobby mechanism and the springsare eliminated. A later development employs a rotary, instead of reciprocatingaction, to generate the lift given to the heald frame.
Jacquard shedding
The Jacquard machine originally invented by Joseph Marie Jacquard servedas the prototype for a very wide range of weaving and knitting machines inthe textile industry as well as those in lace making. When a big or complicateddesign is to be made in weaving, jacquard shedding is used. In this sheddingthe warp ends are controlled individually by harness cords and there are noheald frames. There will be as many cords as there are ends in the warp,which enables unlimited patterns to be woven.
Jacquard machines can be mechanical or electronic with single or doublelift mechanisms. One of the simplest of these is the single lift single cylinderjacquard, with one needle and one hook for every end in the repeat. Commonconfigurations have 200, 400 or 600 needles. For example, a 600-needlejacquard generally has 12 horizontal rows of needles, with each row having

Cotton weaving technology 337
at least 50-needles plus a few extra needles. Each needle is kinked round avertical hook, which it controls. Figure 10.9 shows one short row of needlesand hooks.
Coil springs are provided to press the needles towards the pattern cylinder.Also, a lifting knife is provided for each long row of hooks. For a 600 needlemachine, there would thus be 12 knives. The knives are fixed in a framecalled a griffe. It reciprocates vertically once every pick and is normallydriven either by a crank or by chain and sprocket from the crankshaft. Thedesign is punched in pattern cards, one for each pick in the weave. The cardsare laced together to form a continuous chain, and are presented to theneedles by a card cylinder. After presenting a card to the needles, the cylindershifts to present the next card. If there is a hole in the card opposite aparticular needle, the needle will enter the hole (the cylinder being perforatedto receive it), and the needle spring will cause the hook to engage its knife.As a result, the hook and the warp it controls will be lifted by the knife whenthe griffe rises. On the other hand, if there is no hole opposite a particularneedle, it will be forced to the left as the cylinder moves inwards. The hooksit controls will be moved out of the path of its knife, so that the hooks andends it controls will not be lifted.
The double lift, single cylinder jacquard has two sets of knives, eachmounted in a griffe so that over a two-pick cycle the two griffes move up anddown in opposition. The cylinder still has to reciprocate and turn every pick,but only at half the rates of reciprocation of the knives. These changes givea more balanced movement and also allow higher speeds to be attained. Thedouble-lift double-cylinder machine represents a further advancement. Inthis machine, two needles and two hooks control each harness cord and each
Cylinder
Card
Grate
Neck cord
Needle boardGriffe
Knife
Hook
Needle
Spring box
10.9 Single-lift and single-cylinder jacquard.
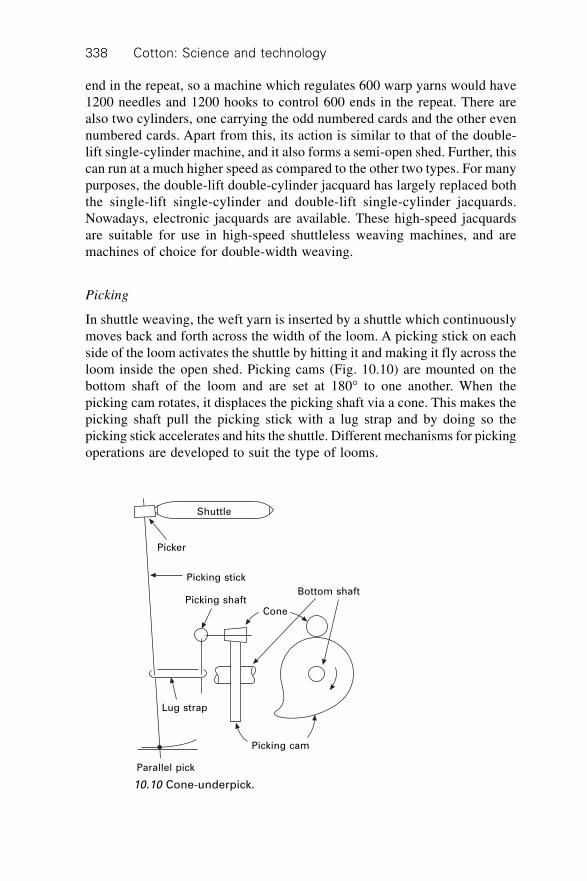
Cotton: Science and technology338
end in the repeat, so a machine which regulates 600 warp yarns would have1200 needles and 1200 hooks to control 600 ends in the repeat. There arealso two cylinders, one carrying the odd numbered cards and the other evennumbered cards. Apart from this, its action is similar to that of the double-lift single-cylinder machine, and it also forms a semi-open shed. Further, thiscan run at a much higher speed as compared to the other two types. For manypurposes, the double-lift double-cylinder jacquard has largely replaced boththe single-lift single-cylinder and double-lift single-cylinder jacquards.Nowadays, electronic jacquards are available. These high-speed jacquardsare suitable for use in high-speed shuttleless weaving machines, and aremachines of choice for double-width weaving.
Picking
In shuttle weaving, the weft yarn is inserted by a shuttle which continuouslymoves back and forth across the width of the loom. A picking stick on eachside of the loom activates the shuttle by hitting it and making it fly across theloom inside the open shed. Picking cams (Fig. 10.10) are mounted on thebottom shaft of the loom and are set at 180∞ to one another. When thepicking cam rotates, it displaces the picking shaft via a cone. This makes thepicking shaft pull the picking stick with a lug strap and by doing so thepicking stick accelerates and hits the shuttle. Different mechanisms for pickingoperations are developed to suit the type of looms.
Shuttle
Picker
Picking stick
Picking shaftCone
Bottom shaft
Picking cam
Parallel pick
Lug strap
10.10 Cone-underpick.

Cotton weaving technology 339
Beating-up
After it is picked, the shuttle travels on the race board. The lower portion ofthe warp yarns is in between the race board and the shuttle. The reed and raceboard are assembled together, and it is called a sley. The sley is mounted ontwo sley swords which are two levers that oscillate the sley back and forth(Fig. 10.11). The sley receives its motion from a crank on the crankshaft.The crank arm connects the crank to the sley by a sword pin mounted in therear of the sley so that the rotating action of the crankshaft is converted to anoscillating action of the sley on its rocking shaft. The sley operates onceevery weaving cycle for beating-up the weft yarn by the reed and performsa continuous harmonic motion.
Let-off motion
As the yarn is woven, a let-off mechanism releases the warp yarn from theweaver’s beam and at the same time maintains an optimum tension bycontrolling the rate of flow of warp yarns. If the tension of the warp yarn isnot controlled at the desired level, then warp breakage rates increase, whichwill affect the dimensional and physical properties of the fabric.
Let-off mechanisms can be classified as negative and positive. The negativelet-off mechanism is simple and less costly but suited only for non-automatic
Rocking shaft
90
180
270
0
Sley sword
Sley
Swordpin
Crankarm
270
180
90
Crankshaft
Crank
Reed
Raceboard
10.11 Sley mechanism.
Cotton: Science and technology340
looms as it may cause short, medium and long period variations in warptension when used in modern automatic looms. In the positive let-off mechanismthe warp beam is rotated at a rate which tends to maintain a constant lengthof warp sheet between the fell of the cloth and the beam. An additionalmechanism is used to maintain a constant tension on warp yarns as the warpis depleted. Modern weaving machines have electronic let-off mechanismswhich provide a positive and controlled release of warp yarn from full toempty beams. This results in a consistent warp tension which, in turn, resultsin the best performance of the loom and good quality fabric.
Take-up motion
Once the reed recedes after beating up the weft, the woven cloth is removedfrom the weaving area by the take-up motion. The take-up roller removes thecloth at a rate that controls weft density and the woven cloth is wound ontoa cloth roller. The take-up roller is covered with perforated steel fillet or hardrubber depending upon the type of fabric being woven. The drive to the take-up roller is by a series of gear wheels which control the pick density. Presently,many modern loom manufacturers use electronic take-up motion which givesbetter and more accurate control of the pick spacing by means of a servomotor.
Auxiliary functions
Apart from basic motions, in a loom there are many other auxiliary mechanismsthat are used to improve productivity and enhance quality. Warp and weftstop motions will stop the loom almost instantaneously when a warp or weftthread breaks. Automatic pick finding devices reduce the loom down-time incase of weft yarn breakage. There are other devices to stop the loom whena shuttle is trapped in the shed, to replace automatically the weft package inthe shuttle when weft yarn is exhausted in the package, and to select andinsert suitable weft yarns for multi-type filling patterns. Modern loomsincorporate a number of electronic devices that operate all the mechanismsof the loom with greater accuracy.
10.4 Woven fabric
10.4.1 Design and type
It is generally accepted that there are only three basic weave designs:(i) plain weave, (ii) twill weave and (iii) satin weave. Most of the otherweave designs like honeycomb, leno, crepe velvet, etc., are derived fromthese basic patterns. Woven fabrics can be differentiated in many ways. They

Cotton weaving technology 341
can be classified (i) by common names: denim, cheese-cloth, voile, etc., (ii)by weave type: plain, twill, satin, leno, etc. (iii) by weight: heavy fabrics andlight fabrics, and (iv) by the end use: apparel fabrics, home furnishings,industrial fabrics, medical textiles, etc.
10.4.2 Properties of fabric
Woven fabric technology is deeply rooted in geometry. A fabric consists ofmillions of fibres assembled together in a particular geometry. The fabricproperties depend on what raw material, fibre and yarn are used and thefabric structure. Some of the important fabric properties include fabric weight,cover factor, crimp, tensile strength, abrasion resistance, burst and impactresistance, and drape and hand. The test procedures for almost all cases havebeen standardized and testing instruments for all parameters are available.These tests are described in more detail in Chapter 12.
Fabric weight
Fabric weight is the weight of yarn per square metre in a woven fabric,which is the sum of the weight of the warp and the weight of the weft. Thefabric weight is expressed as grams per square metre (g/m2). This informationis useful to determine the frequency with which new weft supplies and newbeams will be required while weaving a fabric.
Cover factor
Cover factor is the area covered by yarn when compared to the total area ofthe fabric. The maximum cover factor is 1 when the yarns touch each other.Liquid and air permeability of the fabric depends on the cover factor to alarge extent.
Crimp
Crimp refers to the extent of bending that warp and weft yarns undergo whileweaving. The amount of warp and weft yarn tension maintained while fabricformation takes place governs the crimp of these yarns. Crimp affects thickness,weight, cover, flexibility and hand of the fabric.
Tensile strength
Tensile strength is an important property of fabric as it provides an indicationof fabric quality and durability. The jaws of the tensile testing machineclamp the sample on both ends and a tensile load is applied until fabric
Cotton: Science and technology342
breaks. Breaking strength and elongation at break are widely used for qualitycontrol.
Abrasion resistance
In certain end uses of fabric the abrasion resistance property plays an importantrole. Abrasion is the wearing away of any part of a material by rubbingagainst another surface. The twist level, yarn crimp, yarn structure and weavepattern together with raw material used affect the abrasion resistance of thefabric. The latest technology developments enable abrasion-resistant fibresto be arranged on the sheath, with high tensile strength fibres in the core.
Burst and impact resistance
Fabrics for some end uses like geotextiles, parachutes and filter fabrics mustoften withstand a high degree of pressure forces that act perpendicularly tothe fabric plane. The burst resistance depends on the stretchability of theyarns as well as their strength. The type of fibre and yarn used in the fabricsalso play a major role in bearing impact loading. Fabrics are designed tohave equal properties in warp and weft for better burst resistance.
Drape and hand
Drape can be described as the ability of a fabric, when held vertically, to fallinto pleats or folds under its own weight. This property is closely related tostiffness, one of the components of hand or handle. Hand or handle propertycomprises eight components, namely, flexibility, density, surface contour,thermal properties, surface friction, compressibility, extensibility and resilience.Drape and hand are extremely important for apparel fabrics.
10.5 Modern weaving machines
For centuries woven fabrics used to be made in shuttle looms. The adventof new technologies led to the development of shuttleless looms whichfulfilled the ever-increasing demand for better quality and higher productivity.In conventional shuttle looms, a shuttle weighing about 400 g is used forinserting the weft yarn which weighs only less than 1/1000th of the shuttleweight. The mechanism used to insert the weft in this system limits thespeed of the loom to 200–250 mpm. As a result, methods of weft insertionswithout a shuttle have been developed. They are air-jet, water-jet, projectileand rapier.
In practice these looms are named after their weft insertion system. Todistinguish from shuttle looms, these machines are called shuttleless looms
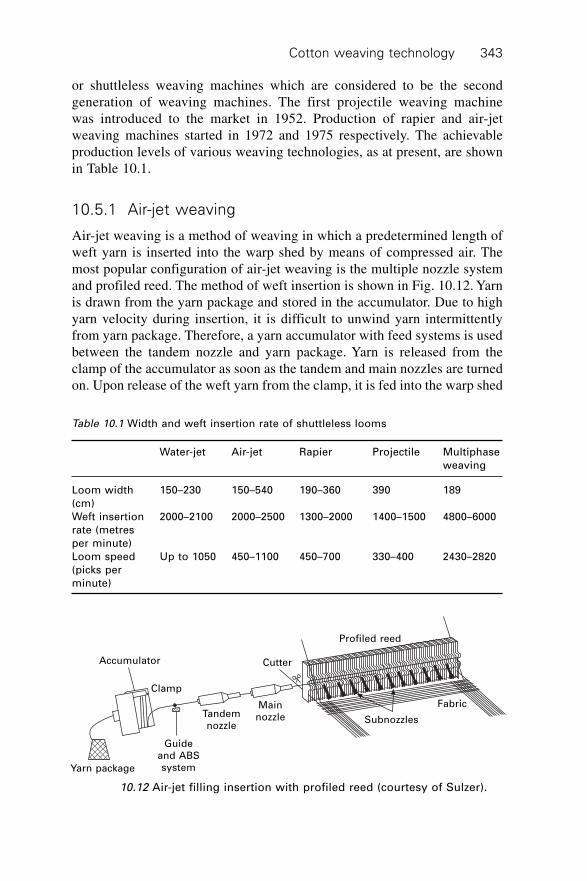
Cotton weaving technology 343
or shuttleless weaving machines which are considered to be the secondgeneration of weaving machines. The first projectile weaving machinewas introduced to the market in 1952. Production of rapier and air-jetweaving machines started in 1972 and 1975 respectively. The achievableproduction levels of various weaving technologies, as at present, are shownin Table 10.1.
10.5.1 Air-jet weaving
Air-jet weaving is a method of weaving in which a predetermined length ofweft yarn is inserted into the warp shed by means of compressed air. Themost popular configuration of air-jet weaving is the multiple nozzle systemand profiled reed. The method of weft insertion is shown in Fig. 10.12. Yarnis drawn from the yarn package and stored in the accumulator. Due to highyarn velocity during insertion, it is difficult to unwind yarn intermittentlyfrom yarn package. Therefore, a yarn accumulator with feed systems is usedbetween the tandem nozzle and yarn package. Yarn is released from theclamp of the accumulator as soon as the tandem and main nozzles are turnedon. Upon release of the weft yarn from the clamp, it is fed into the warp shed
Table 10.1 Width and weft insertion rate of shuttleless looms
Water-jet Air-jet Rapier Projectile Multiphase
weaving
Loom width 150–230 150–540 190–360 390 189
(cm)
Weft insertion 2000–2100 2000–2500 1300–2000 1400–1500 4800–6000
rate (metres
per minute)
Loom speed Up to 1050 450–1100 450–700 330–400 2430–2820
(picks per
minute)
Fabric
Subnozzles
Profiled reed
Cutter
MainnozzleTandem
nozzle
Guideand ABSsystemYarn package
Accumulator
Clamp
10.12 Air-jet filling insertion with profiled reed (courtesy of Sulzer).
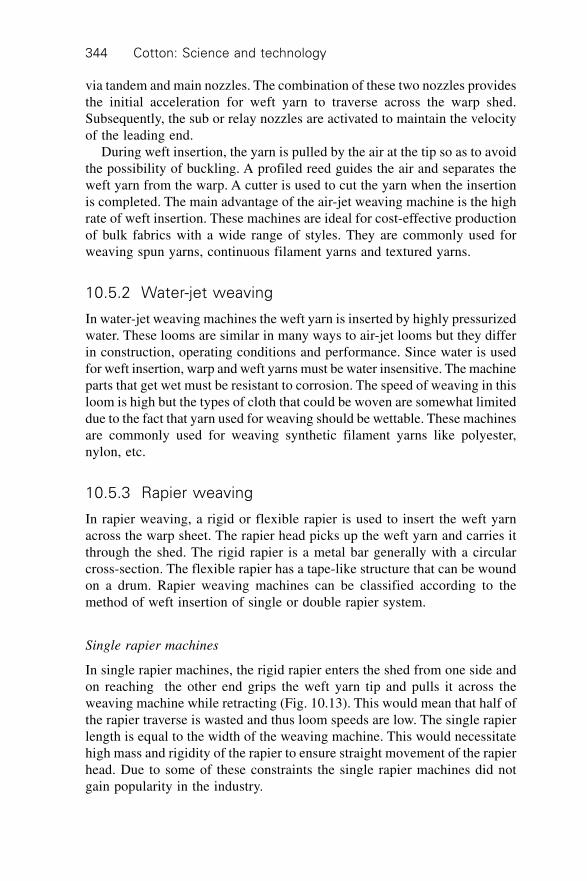
Cotton: Science and technology344
via tandem and main nozzles. The combination of these two nozzles providesthe initial acceleration for weft yarn to traverse across the warp shed.Subsequently, the sub or relay nozzles are activated to maintain the velocityof the leading end.
During weft insertion, the yarn is pulled by the air at the tip so as to avoidthe possibility of buckling. A profiled reed guides the air and separates theweft yarn from the warp. A cutter is used to cut the yarn when the insertionis completed. The main advantage of the air-jet weaving machine is the highrate of weft insertion. These machines are ideal for cost-effective productionof bulk fabrics with a wide range of styles. They are commonly used forweaving spun yarns, continuous filament yarns and textured yarns.
10.5.2 Water-jet weaving
In water-jet weaving machines the weft yarn is inserted by highly pressurizedwater. These looms are similar in many ways to air-jet looms but they differin construction, operating conditions and performance. Since water is usedfor weft insertion, warp and weft yarns must be water insensitive. The machineparts that get wet must be resistant to corrosion. The speed of weaving in thisloom is high but the types of cloth that could be woven are somewhat limiteddue to the fact that yarn used for weaving should be wettable. These machinesare commonly used for weaving synthetic filament yarns like polyester,nylon, etc.
10.5.3 Rapier weaving
In rapier weaving, a rigid or flexible rapier is used to insert the weft yarnacross the warp sheet. The rapier head picks up the weft yarn and carries itthrough the shed. The rigid rapier is a metal bar generally with a circularcross-section. The flexible rapier has a tape-like structure that can be woundon a drum. Rapier weaving machines can be classified according to themethod of weft insertion of single or double rapier system.
Single rapier machines
In single rapier machines, the rigid rapier enters the shed from one side andon reaching the other end grips the weft yarn tip and pulls it across theweaving machine while retracting (Fig. 10.13). This would mean that half ofthe rapier traverse is wasted and thus loom speeds are low. The single rapierlength is equal to the width of the weaving machine. This would necessitatehigh mass and rigidity of the rapier to ensure straight movement of the rapierhead. Due to some of these constraints the single rapier machines did notgain popularity in the industry.
Cotton weaving technology 345
Double rapier machines
Double rapier machines use two rapiers to insert the weft yarn and they canbe rigid or flexible. In these machines, two rapiers enter the shed fromopposite sides. One rapier takes the weft yarn from yarn accumulator on oneside of the weaving machine, carries it to the centre of the machine and
Supplypackage
Rigidrapier
Weft
Single rigid rapier
Double rigid rapier (Dewas system)
Double rigid rapier (Gabler system)
Double flexible rapier system
10.13 Schematic of rapier systems.
Cotton: Science and technology346
transfers it to the second rapier, which carries it to the opposite side of themachine. There are two types of double rapier, the Dewas system and theGabler system. In the Dewas system, one rapier grips the tip of the yarn,takes it to the centre and transfers it to the other. The second rapier grips theyarn when transfer takes place and retracts carrying the yarn to the oppositeside. In the Gabler system, one rapier from one end pushes the weft yarn intothe shed in the form of a loop to the centre of the machine. The loop that istransferred to the second rapier is straightened during the rapier’s reversetraverse. Double flexible rapier machines are more common in use than therigid rapier machines since they save space. The weft yarn is gripped both bythe giver and taker.
A very wide range of fabrics can be woven on rapier weaving machines.In these machines weft patterning is achieved more easily without reducingmachine speeds, so rapier weft insertion is very popular in fancy weaving,where frequent pattern changes have to be made or when different types ofyarn made from wool, cotton, man-made fibres, silk, etc., have to be used.
10.5.4 Projectile weaving
In a projectile weaving machine a projectile firmly holds the yarn by meansof a gripper and traverses across the warp sheet. This system of fillinginsertion enables all yarns, whether fine or coarse, to be used as weft yarns.A variety of yarns made from cotton, wool, multifilaments, jute, and linencan be used as weft filling. This capability enables a variety of fabrics to beproduced on these looms. The other important benefit in using a projectileweaving machine is that more than one width of fabric can be woven ata time.
The gripper projectile is picked across the warp shed at very high speed.The energy required for this operation is derived from the torsion rod whichis twisted at a predetermined amount and released to give the projectile ahigh rate of acceleration by means of a picking lever. The projectile isejected through the shed in a rake-shaped guide. It is stopped in the receivingunit and returned to its original position by a conveyor chain installed underthe shed. Picking always takes place from one side and several projectilesare employed. These weaving machines can be single colour or multi-colourmachines for any sequence of up to six different weft yarns.
The different phases of weft insertion are shown in Fig. 10.14. In positionsA to C, the projectile 1 moves to picking position, grips the weft yarn fromprojectile feeder 2 and draws the yarn through the shed. During picking, theweft tensioner lever 3 and weft brake 4 operate to minimize the tension ofthe weft yarn. In position D, the projectile brake 8 in the receiving unitapplies the brake, stops the projectile and pushes it back. In position E, theprojectile feeder 2 takes over the weft yarn while grippers 5 hold it at both
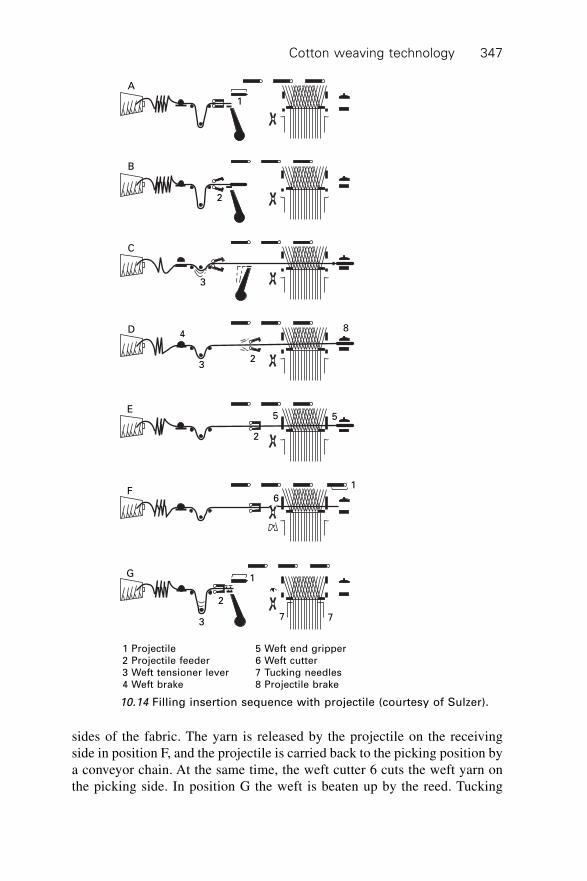
Cotton weaving technology 347
sides of the fabric. The yarn is released by the projectile on the receivingside in position F, and the projectile is carried back to the picking position bya conveyor chain. At the same time, the weft cutter 6 cuts the weft yarn onthe picking side. In position G the weft is beaten up by the reed. Tucking
1 Projectile2 Projectile feeder3 Weft tensioner lever4 Weft brake
5 Weft end gripper6 Weft cutter7 Tucking needles8 Projectile brake
A
B
C
D
E
F
G 1
2
37 7
1
6
55
2
8
23
4
3
2
1
10.14 Filling insertion sequence with projectile (courtesy of Sulzer).
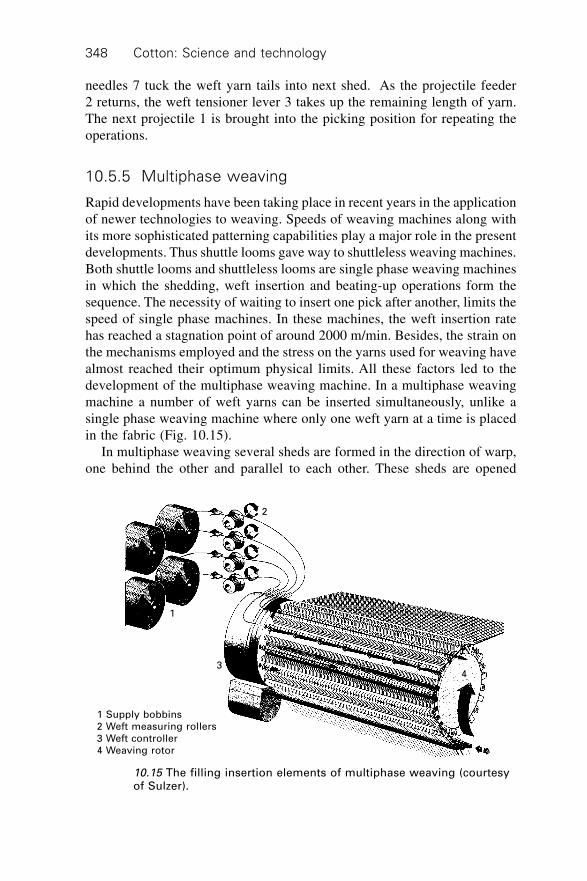
Cotton: Science and technology348
needles 7 tuck the weft yarn tails into next shed. As the projectile feeder2 returns, the weft tensioner lever 3 takes up the remaining length of yarn.The next projectile 1 is brought into the picking position for repeating theoperations.
10.5.5 Multiphase weaving
Rapid developments have been taking place in recent years in the applicationof newer technologies to weaving. Speeds of weaving machines along withits more sophisticated patterning capabilities play a major role in the presentdevelopments. Thus shuttle looms gave way to shuttleless weaving machines.Both shuttle looms and shuttleless looms are single phase weaving machinesin which the shedding, weft insertion and beating-up operations form thesequence. The necessity of waiting to insert one pick after another, limits thespeed of single phase machines. In these machines, the weft insertion ratehas reached a stagnation point of around 2000 m/min. Besides, the strain onthe mechanisms employed and the stress on the yarns used for weaving havealmost reached their optimum physical limits. All these factors led to thedevelopment of the multiphase weaving machine. In a multiphase weavingmachine a number of weft yarns can be inserted simultaneously, unlike asingle phase weaving machine where only one weft yarn at a time is placedin the fabric (Fig. 10.15).
In multiphase weaving several sheds are formed in the direction of warp,one behind the other and parallel to each other. These sheds are opened
10.15 The filling insertion elements of multiphase weaving (courtesyof Sulzer).
2
3
1
4
1 Supply bobbins2 Weft measuring rollers3 Weft controller4 Weaving rotor

Cotton weaving technology 349
across the entire weaving width. A weft yarn is simultaneously inserted intoeach of these open sheds. The weft is inserted into the sheds by low pressurecompressed air over the full width of the fabric. Relay nozzles are integratedin the shed forming elements at regular intervals. If four picks are insertedsimultaneously, each with a speed of 1250 m/min, then the weft insertionrate of the machine is 5000 m/min. The weft insertion rate is the product ofthe weft carrier velocity and the phase number. In a multiphase weavingmachine the stress and strain on warp and weft yarns are much lower than ina single phase weaving machine. This reduces lower end breaks both inwarp and weft yarns.
10.6 Looms installed and weaving costs in selectedcountries
The number and percentage of shuttle looms and shuttle-less looms installedin different countries are shown in Table 10.2. The table covers all thecountries that have looms accounting for over 2% of the world total. Eventhough India has the largest number of looms at over 38% of world total,shuttle-less looms make up around 1% of this total. In comparison, Chinahas an installed capacity of 20% of the looms in the world, of which 14% areshuttle-less looms.
The manufacturing costs of weaving in selected countries are shown inTable 10.3. The labour cost expressed as percentage of total manufacturingcost is highest in Italy at 49%, closely followed by USA at 48%. In comparisonthe labour cost is low in developing countries and it ranges between 7% and11% in China, Brazil, India and Turkey. The lower labour costs in China,India and Turkey are offset to some extent by the higher power cost whichis about 24% in these countries. The auxiliary material cost and interest are
Table 10.2 Number and percentage of shuttleless looms to total looms in selected
countries (2002)
Country Shuttle Shuttle-less Total as % of Shuttle-less
looms looms world total looms as %
of total
Russia 27,824 96,057 2.60 77.54
Brazil 93,500 38,794 2.78 29.32
Thailand 128,217 52,507 3.80 29.05
China 808,796 134,173 19.82 14.23
Japan 117,490 19,241 2.87 14.07
Indonesia 234,520 27,356 5.50 10.45
Pakistan 260,100 18,507 5.86 6.64
India 1,803,755 21,468 38.37 1.18
Source: ITMF (International Textile Machinery Shipment Statistics, 2002).
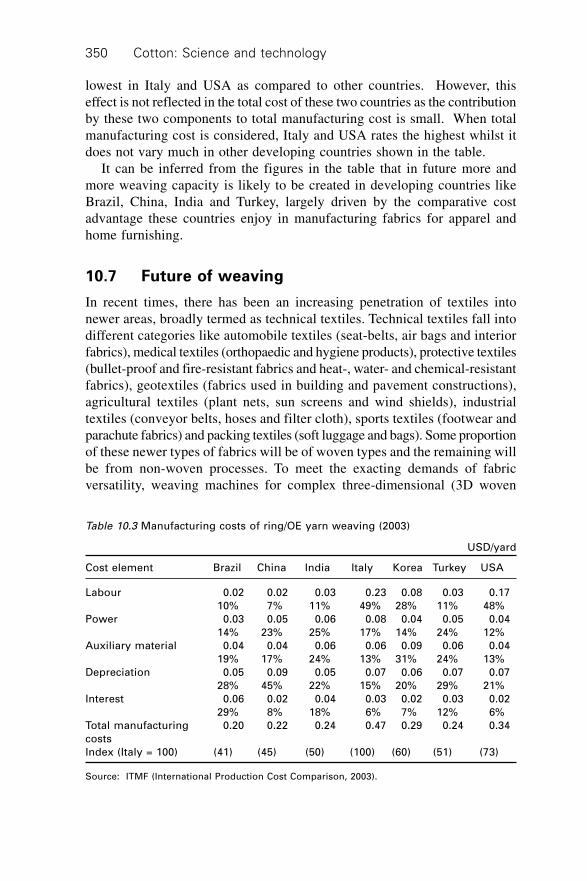
Cotton: Science and technology350
lowest in Italy and USA as compared to other countries. However, thiseffect is not reflected in the total cost of these two countries as the contributionby these two components to total manufacturing cost is small. When totalmanufacturing cost is considered, Italy and USA rates the highest whilst itdoes not vary much in other developing countries shown in the table.
It can be inferred from the figures in the table that in future more andmore weaving capacity is likely to be created in developing countries likeBrazil, China, India and Turkey, largely driven by the comparative costadvantage these countries enjoy in manufacturing fabrics for apparel andhome furnishing.
10.7 Future of weaving
In recent times, there has been an increasing penetration of textiles intonewer areas, broadly termed as technical textiles. Technical textiles fall intodifferent categories like automobile textiles (seat-belts, air bags and interiorfabrics), medical textiles (orthopaedic and hygiene products), protective textiles(bullet-proof and fire-resistant fabrics and heat-, water- and chemical-resistantfabrics), geotextiles (fabrics used in building and pavement constructions),agricultural textiles (plant nets, sun screens and wind shields), industrialtextiles (conveyor belts, hoses and filter cloth), sports textiles (footwear andparachute fabrics) and packing textiles (soft luggage and bags). Some proportionof these newer types of fabrics will be of woven types and the remaining willbe from non-woven processes. To meet the exacting demands of fabricversatility, weaving machines for complex three-dimensional (3D woven
Table 10.3 Manufacturing costs of ring/OE yarn weaving (2003)
USD/yard
Cost element Brazil China India Italy Korea Turkey USA
Labour 0.02 0.02 0.03 0.23 0.08 0.03 0.17
10% 7% 11% 49% 28% 11% 48%
Power 0.03 0.05 0.06 0.08 0.04 0.05 0.04
14% 23% 25% 17% 14% 24% 12%
Auxiliary material 0.04 0.04 0.06 0.06 0.09 0.06 0.04
19% 17% 24% 13% 31% 24% 13%
Depreciation 0.05 0.09 0.05 0.07 0.06 0.07 0.07
28% 45% 22% 15% 20% 29% 21%
Interest 0.06 0.02 0.04 0.03 0.02 0.03 0.02
29% 8% 18% 6% 7% 12% 6%
Total manufacturing 0.20 0.22 0.24 0.47 0.29 0.24 0.34
costs
Index (Italy = 100) (41) (45) (50) (100) (60) (51) (73)
Source: ITMF (International Production Cost Comparison, 2003).

Cotton weaving technology 351
fabrics) and circular weaving for tubular fabrics, have been developed. Theprocess of 3D-weaving is done through the shedding operation whereby itbecomes possible to interlace a grid-like multiple layer warp with verticaland horizontal sets of wefts to produce a fully interlaced 3D fabric. In circularweaving the warp is arranged in circular manner and there are continuouslycirculating shuttles running around the periphery in a weave.
The introduction of electronics in weaving has contributed to a greatextent to the increase in productivity of looms over the years. It is to beexpected that more advanced electronic devices than the existing ones willbe incorporated into many of the weaving operations. This will not onlyincrease the speeds and enhance productivity, but will also control and monitorthe various functions of weaving machines more closely and precisely. Effortsto reduce vibration, noise levels and energy requirements of weaving machineswill continue.
Advances in nanotechnology are also expected to give considerable pushto innovations of new products and processes in textiles. Research anddevelopment activities are going on all over the world to explore the possibilityof application of nanotechnology in the production of high-performancetextiles through modification of fibres, yarns or fabrics. Recent publicawareness of environment-friendly textiles will demand some changes in theexisting products and processes. As a beginning, biodegradable fibres, eco-friendly dyes and cleaner manufacturing technology are being introduced inthe industry.
In the present global market for textiles, two particularly different trendsin the manufacturing of textiles stand out. First, apparels and furnishingfabrics will be largely manufactured by developing countries, since the capitalinvestment required for machinery for these products will be at affordablelevels in developing countries. Second, the major portion of technical textiles,particularly those involving high technology, will be produced by developednations. The main reason for this is that the capital investment required formachinery and processes of such high technological levels and sophisticationwill be too prohibitive for developing countries.
As the use of textiles is becoming more and more diversified, thedevelopment of newer fibres, yarns, fabrics and suitable machinery formanufacturing them will expand business opportunities all over the world.
10.8 Sources of further information
Adanur S, 2001, Handbook of Weaving, Pennsylvania, USA, TechnomicPublishing Co. Inc.
Marks R. and Robinson A.T.C, 1976, Principles of Weaving, Manchester,UK, The Textile Institute.
Cotton: Science and technology352
Ormerod A, 1983, Modern Preparation and Weaving Machinery, UK,Butterworths & Co.
Talukdar M.K, Sriramulu P.K. and Ajgaonkar D.B., 1998, Weaving Machines,
Mechanisms & Management, India, Mahajan Publishers Pvt., Ltd.Vincent J.J, 1980, Shuttle-less Looms, UK, The Textile Institute, Manchester.

353
11.1 Introduction
The coloration of cotton textiles is a mature and highly efficient industrialtechnology. Worldwide the consumption of cotton dyes is some 360,000tonnes per year comprising a major part of the $6 billion dollar dye industry.Unlike other textile fibres, there is very little coloration of cotton prior tospinning and the great majority of cotton products are dyed and printed infabric form. A number of distinct cotton dyeing processes and classes ofcotton dye have been developed and are particularly suited to certain producttypes. This chapter discusses these different dyes and dyeing techniques.
11.2 General principles
There are a number of general scientific aspects of cotton dyeing which havea major influence on the dyeing process used. These will be discussed brieflybefore progressing to examine the technology of the dyeing process.
11.2.1 Equilibrium and dye structure
The absorption of dyes by cotton during the dyeing process can be describedas a chemical equilibrium as in eqn 11.1 below.
D Dbath fibreƨ 11.1
In this simplified model, dyes are generally described as substantive if at theend of the dyeing process Dfibre (the concentration of dye on the fibre) ismuch larger than Dbath (the concentration of dye in the dyebath). Substantivityis favoured by the formation of multiple dye-fibre bonds. This bonding inthe case of cotton dyes is hydrogen bonding between suitable hydrogendonor groups on the dyes and lone pairs on the oxygen atom of the cellulosichydroxyl group. The necessity for the formation of a number of these bonds
11Dyeing of cotton and cotton products
D K I N G, CSIRO Textile and Fibre Technology, Australia

Cotton: Science and technology354
combined with the highly crystalline structure of cotton, places very specificrequirements on the structure of cotton dyes, in particular on the highermolecular weight, direct and reactive dyes. In general the most useful dyesare found to be those that can adopt an elongated and coplanar configurationin which the number of hydrogen bonds is maximised and the cellulosecrystal structure is not disrupted (McCleary, 1953). Figure 11.1 shows typicalcotton dyes that demonstrate these structural properties. The hydrogen bondsformed between these dyes and the cellulose molecule confer a level ofdurability (fastness) of colour during the life of the cotton article and especiallyfastness to washing.
The alternative approaches to attaining acceptable fastness are theformation of an insoluble coloured complex within the fibre (azoic,sulphur and vat dyes) or the formation of dye-fibre covalent bonds (reactivedyes). These dyes will be discussed later in the chapter, however, the same
N N N N
SO2
SO3NaO
SO3NaSO2
O
NaO3S
HO NH2
NaO3S
SO3NaNaO3S
N N N N
O C2H5OH5C2
NaO3S SO3Na
SO3Na
CH
CH
CH
CH
CH
CH HN Cl
Cl
C
C
N
C
N
N
C
C
C
C
C
C
N
N
C
CHC
HC
Cl Reactive Red 1
Cl Direct Yellow 12
Cl Reactive Black 5
11.1 Typical cotton dyes.

Dyeing of cotton and cotton products 355
principles apply to the dye absorption process regardless of subsequent chemicalreactions.
11.2.2 Electrostatic effects and the use of salt
When textile fibres are immersed in an aqueous dyebath there is a rearrangementof charge groups at the interface between the fibre and the aqueous environment.This invariably leads to the fibre surface acquiring an initial negative charge,the so-called zeta potential (Ribitsch, 1998). Since most textile dyes aresulfonated to provide aqueous solubility they also have a negative charge insolution and there is an electrostatic barrier to overcome in order for the dyesto diffuse through the fibre-water interface.
In cotton dyeing, the only widely used method of overcoming thiselectrostatic barrier is the addition to the dyebath of large quantities of ‘salt’,generally sodium chloride or sodium sulphate. The presence of electrolyte iswell known to reduce the extent of the electrostatic field around a chargedsurface (Hunter, 1981). The mechanism of the salt effect is the dynamicadsorption of counterions (e.g. sodium), which leads to a reduction in theeffective surface charge of the fibre. Figure 11.2 shows the effect of saltaddition on the uptake by cotton of a typical dye.
It can be seen that there is an initial adsorption of dye, but dye uptakeapproaches approximately 20% asymptotically. The addition of salt resultsin rapid exhaustion of dye to yield a much higher and commercially practicaluptake. The addition of salt, as well as affecting the rate of dyeing by reducingthe electrostatic repulsion, increases the overall uptake of dye by reducingits solubility in the dyebath.
0.00 500.00 1000.00 1500.00 2000.00 2500.00 3000.00Time/seconds
1% Direct Blue 7180 ∞C
8 g/L salt added
100
80
60
40
20
0
% u
pta
ke
of
dy
e
11.2 Exhaustion of direct cotton dye – effect of salt addition.
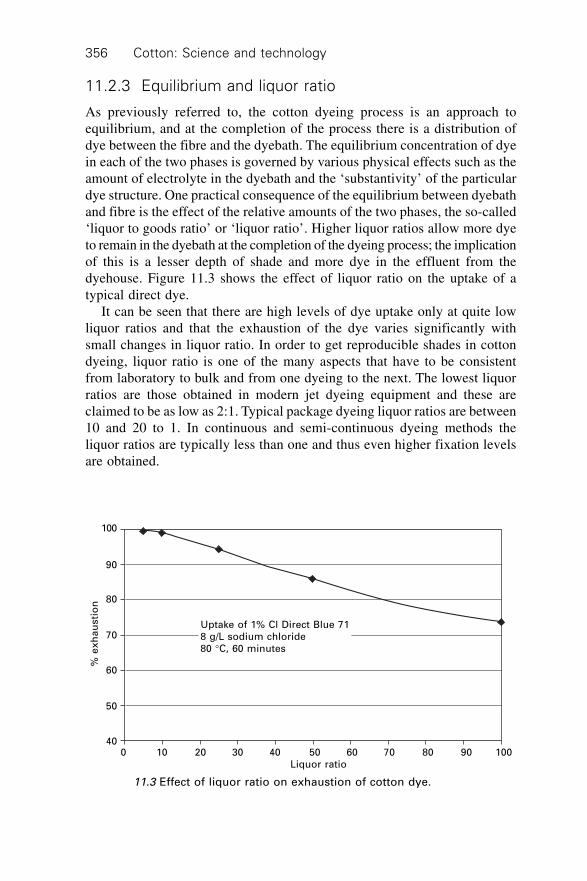
Cotton: Science and technology356
11.2.3 Equilibrium and liquor ratio
As previously referred to, the cotton dyeing process is an approach toequilibrium, and at the completion of the process there is a distribution ofdye between the fibre and the dyebath. The equilibrium concentration of dyein each of the two phases is governed by various physical effects such as theamount of electrolyte in the dyebath and the ‘substantivity’ of the particulardye structure. One practical consequence of the equilibrium between dyebathand fibre is the effect of the relative amounts of the two phases, the so-called‘liquor to goods ratio’ or ‘liquor ratio’. Higher liquor ratios allow more dyeto remain in the dyebath at the completion of the dyeing process; the implicationof this is a lesser depth of shade and more dye in the effluent from thedyehouse. Figure 11.3 shows the effect of liquor ratio on the uptake of atypical direct dye.
It can be seen that there are high levels of dye uptake only at quite lowliquor ratios and that the exhaustion of the dye varies significantly withsmall changes in liquor ratio. In order to get reproducible shades in cottondyeing, liquor ratio is one of the many aspects that have to be consistentfrom laboratory to bulk and from one dyeing to the next. The lowest liquorratios are those obtained in modern jet dyeing equipment and these areclaimed to be as low as 2:1. Typical package dyeing liquor ratios are between10 and 20 to 1. In continuous and semi-continuous dyeing methods theliquor ratios are typically less than one and thus even higher fixation levelsare obtained.
Uptake of 1% Cl Direct Blue 718 g/L sodium chloride80 ∞C, 60 minutes
0 10 20 30 40 50 60 70 80 90 100Liquor ratio
100
90
80
70
60
50
40
% e
xh
au
sti
on
11.3 Effect of liquor ratio on exhaustion of cotton dye.
Dyeing of cotton and cotton products 357
11.2.4 The effect of temperature on dyeing
Studies of dyeing have shown that the absorption of dyes by cotton is anexothermic process. The implication of this fact is that if dyeing is carriedout to equilibrium, then lower temperatures favour higher exhaustion ofdyes. One might conclude from this that dyeing should be carried out atroom temperature, however, the other effect of dyeing temperature is on therate of dye uptake; this kinetic effect has more practical significance, althoughthe thermodynamic effect should not be neglected. The rate of dye uptakeincreases appreciably with temperature and approximately doubles for everyten degree temperature rise. The dyeing temperature must be high enoughfor equilibrium and fixation to occur in a short enough time for practicaloperation of the dyehouse. An additional constraint is that if the rate ofdyeing is too rapid, severely unlevel dyeing can occur. This is due to the factthat timescale of dyeing will be similar to the time in which dye liquorcirculates in the dyeing machine. Thus the choice of dyeing temperature is acompromise (Perkins, 1996); all dye manufacturers provide recommendeddyeing temperature profiles for particular dyes based on studies in theirresearch laboratories and practical experience.
11.3 Direct dyes
In 1884 Bottiger discovered that the diazo dye, Congo Red, coloured cottonwithout the necessity for pre-treatment with a metal salt (a so-called ‘mordant’).This finding led to the synthesis of related dyes which were referred to as the‘direct’ dyes due to their ease of application. The dyes are generally sulfonatedpoly-azo compounds although other structures such as metal complexes andanthraquinones are utilised to complete the shade palette (Fig. 11.4).
The levels of wash-fastness achieved using direct dyes is generally not ashigh as the vat dyes (discussed later), but their ease of application andbroader palette led to this dye class being of great importance until thediscovery of the reactive dyes. The direct dyes generally have betterlightfastness than the corresponding reactive dyes (Esche, 2004) and so findparticular use in applications where laundering is infrequent but resistance tofading is desirable, e.g., curtains.
The direct dyes have differing affinities for cotton and as such requiredifferent dyeing conditions to ensure that sufficient colour yield is obtainedand the resultant dyeing is level. Manufacturers generally group direct dyesinto two or three groups, each group having a recommended dyeing procedure.Typically the dyeing process is commenced at 40 ∞C and after circulation ofthe dyebath for approximately ten minutes, the dyes are added and thetemperature raised to 100 ∞C over 45 minutes and held at that temperaturefor 30–45 minutes. The dyebath is cooled and drained and the goods are

Cotton: Science and technology358
rinsed. There are a number of possible stages at which salt can be added tothe dyebath during the dyeing process, generally either at the commencementof dyeing or during the high-temperature stage, depending on the affinity ofthe particular dye.
All manufacturers generally recommend an aftertreatment to improve thewet fastness of direct dyes. These aftertreatments consist of application ofproprietary compounds which are cationic in nature. The development andmechanism of these aftertreatment compounds has been discussed (Cook,1982). The main disadvantage of the use of these compounds is a tendencyto reduce the lightfastness of the shade.
11.4 Reactive dyes
Reactive dyes are dyes that form a covalent bond with cotton fibres. The keyparts of the dye molecule are the chromophore and the reactive group. ICIreleased the first range of reactive dyes, the Procions, in 1956 with dyesbased on the dichlorotriazinyl reactive group. This event was closely followedby Ciba’s monochlorotriazinyl based Cibacron dyes. These dyes wereenthusiastically embraced by cotton processors, and there followed an intenseresearch and development effort which led to all the major textile dyemanufacturers producing ranges of cotton reactive dyes.
These dyes combined ease of application, previously unobtainable shadesand very high levels of fastness. A representative reaction of dye and celluloseis shown in Fig. 11.5. The side-reaction with the hydroxyl ion is undesirableas the hydrolysed dye will have a lower fastness on the fibre, being the
SO3Na
N
SO3Na
N N
N N
N
NaO3S
HO
NH
NaO3S
N
N
N
N
H2N
SO3NaNaO3S
NH2
Cl Direct Red 28 (Congo Red)
Cl Direct Blue 73
11.4 Typical direct dye structures.
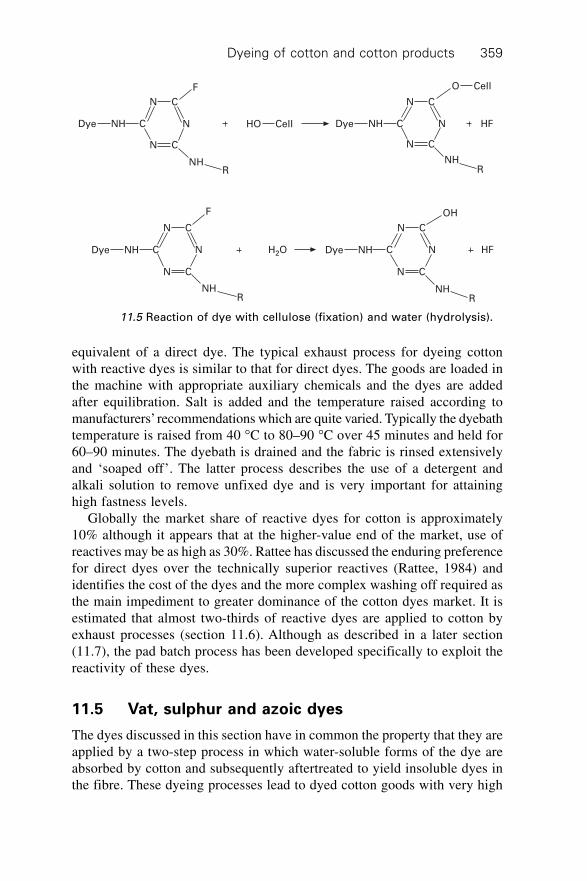
Dyeing of cotton and cotton products 359
equivalent of a direct dye. The typical exhaust process for dyeing cottonwith reactive dyes is similar to that for direct dyes. The goods are loaded inthe machine with appropriate auxiliary chemicals and the dyes are addedafter equilibration. Salt is added and the temperature raised according tomanufacturers’ recommendations which are quite varied. Typically the dyebathtemperature is raised from 40 ∞C to 80–90 ∞C over 45 minutes and held for60–90 minutes. The dyebath is drained and the fabric is rinsed extensivelyand ‘soaped off’. The latter process describes the use of a detergent andalkali solution to remove unfixed dye and is very important for attaininghigh fastness levels.
Globally the market share of reactive dyes for cotton is approximately10% although it appears that at the higher-value end of the market, use ofreactives may be as high as 30%. Rattee has discussed the enduring preferencefor direct dyes over the technically superior reactives (Rattee, 1984) andidentifies the cost of the dyes and the more complex washing off required asthe main impediment to greater dominance of the cotton dyes market. It isestimated that almost two-thirds of reactive dyes are applied to cotton byexhaust processes (section 11.6). Although as described in a later section(11.7), the pad batch process has been developed specifically to exploit thereactivity of these dyes.
11.5 Vat, sulphur and azoic dyes
The dyes discussed in this section have in common the property that they areapplied by a two-step process in which water-soluble forms of the dye areabsorbed by cotton and subsequently aftertreated to yield insoluble dyes inthe fibre. These dyeing processes lead to dyed cotton goods with very high
CNHDye HF
N C
N C
N
O Cell
NHR
CellHO
N C
C N
N C
NHDye
NHR
F
N C
N C
C NNHDye
F
NHR
CNHDyeH2O
N C
N C
N HF
OH
NHR
11.5 Reaction of dye with cellulose (fixation) and water (hydrolysis).
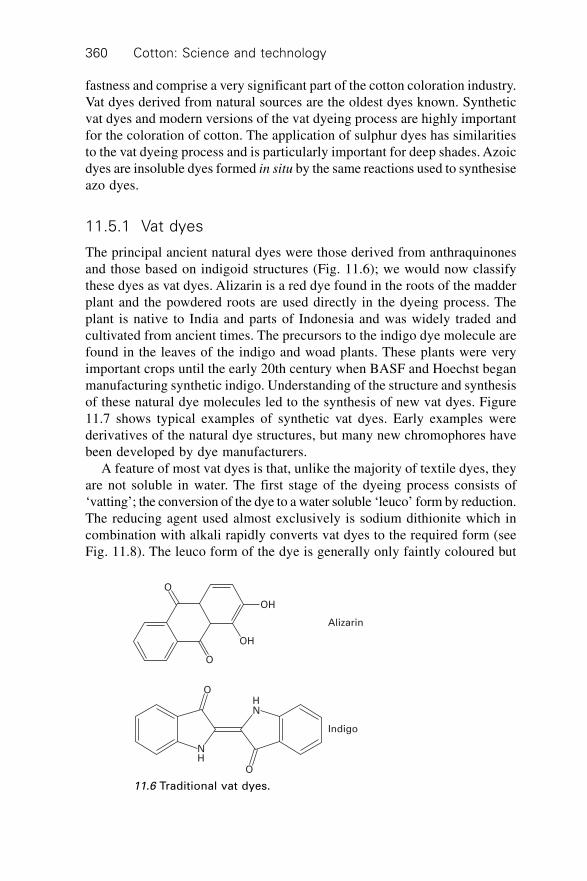
Cotton: Science and technology360
fastness and comprise a very significant part of the cotton coloration industry.Vat dyes derived from natural sources are the oldest dyes known. Syntheticvat dyes and modern versions of the vat dyeing process are highly importantfor the coloration of cotton. The application of sulphur dyes has similaritiesto the vat dyeing process and is particularly important for deep shades. Azoicdyes are insoluble dyes formed in situ by the same reactions used to synthesiseazo dyes.
11.5.1 Vat dyes
The principal ancient natural dyes were those derived from anthraquinonesand those based on indigoid structures (Fig. 11.6); we would now classifythese dyes as vat dyes. Alizarin is a red dye found in the roots of the madderplant and the powdered roots are used directly in the dyeing process. Theplant is native to India and parts of Indonesia and was widely traded andcultivated from ancient times. The precursors to the indigo dye molecule arefound in the leaves of the indigo and woad plants. These plants were veryimportant crops until the early 20th century when BASF and Hoechst beganmanufacturing synthetic indigo. Understanding of the structure and synthesisof these natural dye molecules led to the synthesis of new vat dyes. Figure11.7 shows typical examples of synthetic vat dyes. Early examples werederivatives of the natural dye structures, but many new chromophores havebeen developed by dye manufacturers.
A feature of most vat dyes is that, unlike the majority of textile dyes, theyare not soluble in water. The first stage of the dyeing process consists of‘vatting’; the conversion of the dye to a water soluble ‘leuco’ form by reduction.The reducing agent used almost exclusively is sodium dithionite which incombination with alkali rapidly converts vat dyes to the required form (seeFig. 11.8). The leuco form of the dye is generally only faintly coloured but
Indigo
NH
NH
O
O
Alizarin
O
OH
O
OH
11.6 Traditional vat dyes.
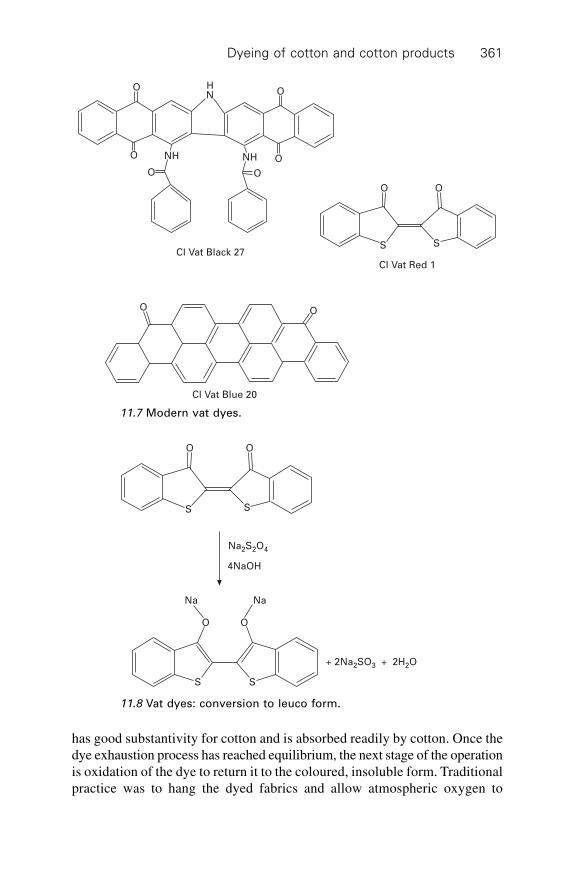
Dyeing of cotton and cotton products 361
Cl Vat Blue 20
Cl Vat Black 27
Cl Vat Red 1
SS
O O
OO
O
O
O
NHNH
O
O
ONH
11.7 Modern vat dyes.
4NaOH
Na2S2O4
SS
O O
S
O
S
O
Na Na
+ 2Na2SO3 + 2H2O
11.8 Vat dyes: conversion to leuco form.
has good substantivity for cotton and is absorbed readily by cotton. Once thedye exhaustion process has reached equilibrium, the next stage of the operationis oxidation of the dye to return it to the coloured, insoluble form. Traditionalpractice was to hang the dyed fabrics and allow atmospheric oxygen to
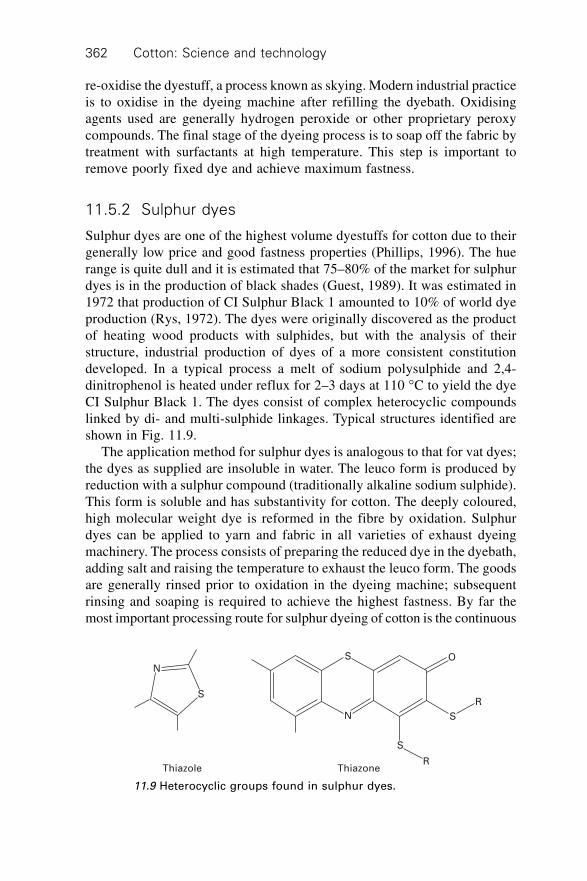
Cotton: Science and technology362
re-oxidise the dyestuff, a process known as skying. Modern industrial practiceis to oxidise in the dyeing machine after refilling the dyebath. Oxidisingagents used are generally hydrogen peroxide or other proprietary peroxycompounds. The final stage of the dyeing process is to soap off the fabric bytreatment with surfactants at high temperature. This step is important toremove poorly fixed dye and achieve maximum fastness.
11.5.2 Sulphur dyes
Sulphur dyes are one of the highest volume dyestuffs for cotton due to theirgenerally low price and good fastness properties (Phillips, 1996). The huerange is quite dull and it is estimated that 75–80% of the market for sulphurdyes is in the production of black shades (Guest, 1989). It was estimated in1972 that production of CI Sulphur Black 1 amounted to 10% of world dyeproduction (Rys, 1972). The dyes were originally discovered as the productof heating wood products with sulphides, but with the analysis of theirstructure, industrial production of dyes of a more consistent constitutiondeveloped. In a typical process a melt of sodium polysulphide and 2,4-dinitrophenol is heated under reflux for 2–3 days at 110 ∞C to yield the dyeCI Sulphur Black 1. The dyes consist of complex heterocyclic compoundslinked by di- and multi-sulphide linkages. Typical structures identified areshown in Fig. 11.9.
The application method for sulphur dyes is analogous to that for vat dyes;the dyes as supplied are insoluble in water. The leuco form is produced byreduction with a sulphur compound (traditionally alkaline sodium sulphide).This form is soluble and has substantivity for cotton. The deeply coloured,high molecular weight dye is reformed in the fibre by oxidation. Sulphurdyes can be applied to yarn and fabric in all varieties of exhaust dyeingmachinery. The process consists of preparing the reduced dye in the dyebath,adding salt and raising the temperature to exhaust the leuco form. The goodsare generally rinsed prior to oxidation in the dyeing machine; subsequentrinsing and soaping is required to achieve the highest fastness. By far themost important processing route for sulphur dyeing of cotton is the continuous
S
N
S
R
S
R
O
Thiazole Thiazone
N
S
11.9 Heterocyclic groups found in sulphur dyes.
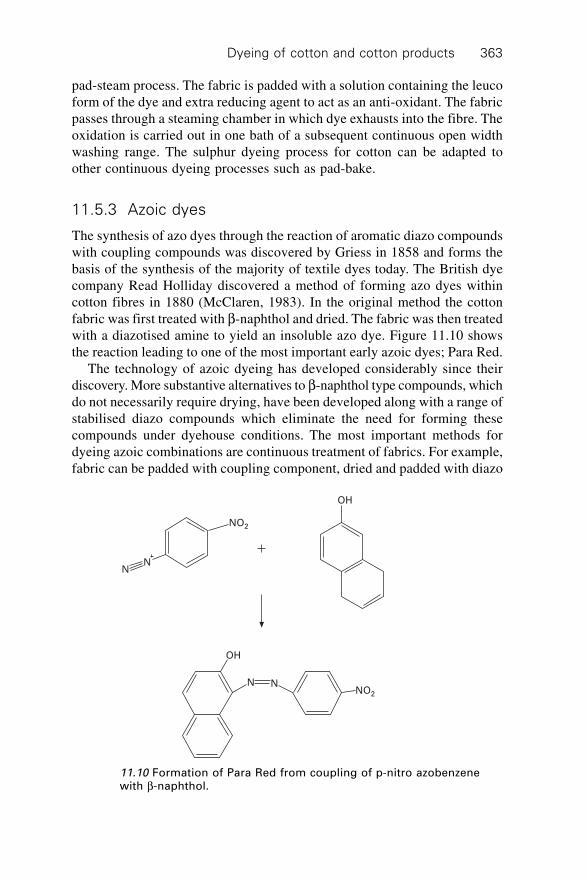
Dyeing of cotton and cotton products 363
pad-steam process. The fabric is padded with a solution containing the leucoform of the dye and extra reducing agent to act as an anti-oxidant. The fabricpasses through a steaming chamber in which dye exhausts into the fibre. Theoxidation is carried out in one bath of a subsequent continuous open widthwashing range. The sulphur dyeing process for cotton can be adapted toother continuous dyeing processes such as pad-bake.
11.5.3 Azoic dyes
The synthesis of azo dyes through the reaction of aromatic diazo compoundswith coupling compounds was discovered by Griess in 1858 and forms thebasis of the synthesis of the majority of textile dyes today. The British dyecompany Read Holliday discovered a method of forming azo dyes withincotton fibres in 1880 (McClaren, 1983). In the original method the cottonfabric was first treated with b-naphthol and dried. The fabric was then treatedwith a diazotised amine to yield an insoluble azo dye. Figure 11.10 showsthe reaction leading to one of the most important early azoic dyes; Para Red.
The technology of azoic dyeing has developed considerably since theirdiscovery. More substantive alternatives to b-naphthol type compounds, whichdo not necessarily require drying, have been developed along with a range ofstabilised diazo compounds which eliminate the need for forming thesecompounds under dyehouse conditions. The most important methods fordyeing azoic combinations are continuous treatment of fabrics. For example,fabric can be padded with coupling component, dried and padded with diazo
N
NO2
N
OH
N
OH
NO2
N
11.10 Formation of Para Red from coupling of p-nitro azobenzenewith b-naphthol.
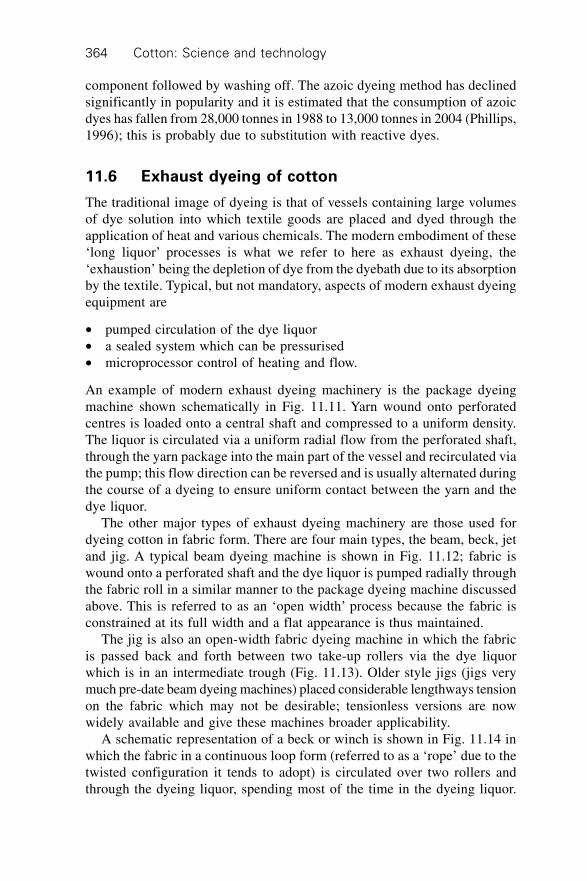
Cotton: Science and technology364
component followed by washing off. The azoic dyeing method has declinedsignificantly in popularity and it is estimated that the consumption of azoicdyes has fallen from 28,000 tonnes in 1988 to 13,000 tonnes in 2004 (Phillips,1996); this is probably due to substitution with reactive dyes.
11.6 Exhaust dyeing of cotton
The traditional image of dyeing is that of vessels containing large volumesof dye solution into which textile goods are placed and dyed through theapplication of heat and various chemicals. The modern embodiment of these‘long liquor’ processes is what we refer to here as exhaust dyeing, the‘exhaustion’ being the depletion of dye from the dyebath due to its absorptionby the textile. Typical, but not mandatory, aspects of modern exhaust dyeingequipment are
∑ pumped circulation of the dye liquor∑ a sealed system which can be pressurised∑ microprocessor control of heating and flow.
An example of modern exhaust dyeing machinery is the package dyeingmachine shown schematically in Fig. 11.11. Yarn wound onto perforatedcentres is loaded onto a central shaft and compressed to a uniform density.The liquor is circulated via a uniform radial flow from the perforated shaft,through the yarn package into the main part of the vessel and recirculated viathe pump; this flow direction can be reversed and is usually alternated duringthe course of a dyeing to ensure uniform contact between the yarn and thedye liquor.
The other major types of exhaust dyeing machinery are those used fordyeing cotton in fabric form. There are four main types, the beam, beck, jetand jig. A typical beam dyeing machine is shown in Fig. 11.12; fabric iswound onto a perforated shaft and the dye liquor is pumped radially throughthe fabric roll in a similar manner to the package dyeing machine discussedabove. This is referred to as an ‘open width’ process because the fabric isconstrained at its full width and a flat appearance is thus maintained.
The jig is also an open-width fabric dyeing machine in which the fabricis passed back and forth between two take-up rollers via the dye liquorwhich is in an intermediate trough (Fig. 11.13). Older style jigs (jigs verymuch pre-date beam dyeing machines) placed considerable lengthways tensionon the fabric which may not be desirable; tensionless versions are nowwidely available and give these machines broader applicability.
A schematic representation of a beck or winch is shown in Fig. 11.14 inwhich the fabric in a continuous loop form (referred to as a ‘rope’ due to thetwisted configuration it tends to adopt) is circulated over two rollers andthrough the dyeing liquor, spending most of the time in the dyeing liquor.

Dyeing of cotton and cotton products 365
Pump
Heatexchanger
Additiontank
Yarn packageswound on perforated centres
11.11 Package dyeing machine.
Heatexchanger
Pump
Fabric wound on perforated beam
11.12 Beam dyeing machine.
These machines are the original fabric dyeing equipment with much of theconstruction being made of wood prior to the advent of stainless steel.
The jet dyeing machine was developed in the early 1950s and is based onthe principle that the fabric rope is transported by the liquor which is circulatedthough a venturi nozzle and tube arrangement. Fortress and Ward list some15 advantages of jet dyeing machines over beck type machines (Fortress,

Cotton: Science and technology366
Take-uproller
Guide rollers
Dyeliquor
11.13 Jig dyeing machine.
Steam Fabric rope
Winchreel
11.14 Winch dyeing machine.
1962). The greater contact between fabric and liquor enables a lower liquorratio to be used which is important for good dye exhaustion on cotton.There is less mechanical action on the fabrics reducing the occurrence ofcreasing and similar deleterious effects. The penetration of the fabric by theliquor is more efficient which has benefits in even dye application and alsoin the rinsing and soaping of dyed fabrics which is crucial to attaining highfastness. A schematic diagram of a typical modern jet machine is shown inFig. 11.15. Jet dyeing machines have become very widespread with manyvariations on the original concept. The partially flooded versions find the
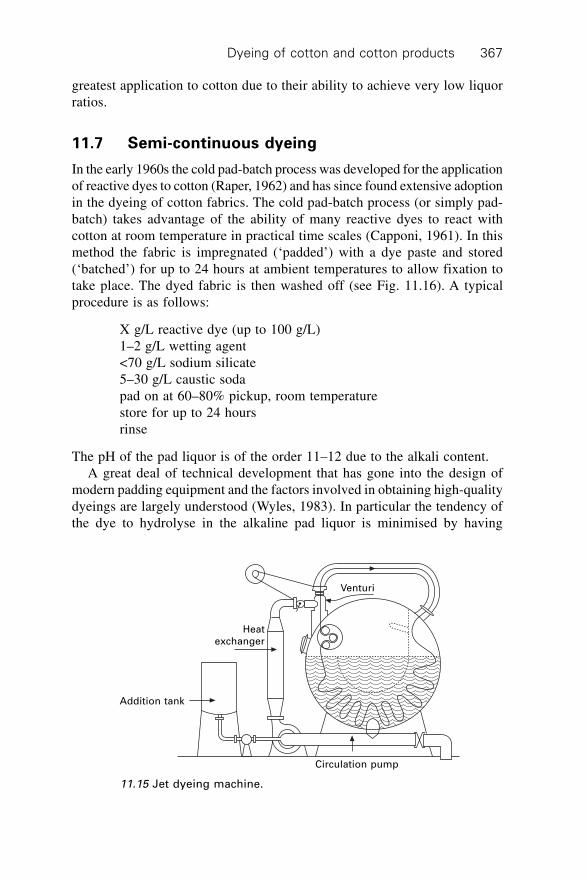
Dyeing of cotton and cotton products 367
greatest application to cotton due to their ability to achieve very low liquorratios.
11.7 Semi-continuous dyeing
In the early 1960s the cold pad-batch process was developed for the applicationof reactive dyes to cotton (Raper, 1962) and has since found extensive adoptionin the dyeing of cotton fabrics. The cold pad-batch process (or simply pad-batch) takes advantage of the ability of many reactive dyes to react withcotton at room temperature in practical time scales (Capponi, 1961). In thismethod the fabric is impregnated (‘padded’) with a dye paste and stored(‘batched’) for up to 24 hours at ambient temperatures to allow fixation totake place. The dyed fabric is then washed off (see Fig. 11.16). A typicalprocedure is as follows:
X g/L reactive dye (up to 100 g/L)1–2 g/L wetting agent<70 g/L sodium silicate5–30 g/L caustic sodapad on at 60–80% pickup, room temperaturestore for up to 24 hoursrinse
The pH of the pad liquor is of the order 11–12 due to the alkali content.A great deal of technical development that has gone into the design of
modern padding equipment and the factors involved in obtaining high-qualitydyeings are largely understood (Wyles, 1983). In particular the tendency ofthe dye to hydrolyse in the alkaline pad liquor is minimised by having
Circulation pump
Venturi
Heatexchanger
Addition tank
11.15 Jet dyeing machine.

Cotton: Science and technology368
separate alkali and dye solutions which are mixed in the padding trough. Thedesign of padding troughs and mechanisms to use minimum volumes ofliquor also reduces the risk of excessive hydrolysis. For batching, fabric isgenerally wound onto beams which are stored on an A-frame, a device whichslowly rotates the roll of fabric. This rotation avoids drainage effects inwhich the liquor settles under gravity producing unevenness. The fabric isusually wrapped in plastic to avoid the effects of the atmosphere on the dye-fibre reaction.
After an appropriate period the fabric is washed off to remove unfixeddyes and associated chemicals. In some cases the design of the A-framebeam will permit rinsing by connection of a water supply to the central shaft.In this method, referred to as ‘trickle washing’ the rinsing waters permeatethe fabric roll radially until dye and chemicals have been removed and themaximum fastness obtained. The alternative procedure is to wash off on acontinuous open width washing range. This procedure is more rapid andflexible. In an open width washing range the fabric is transported through aseries of chambers referred to as boxes. In each box the fabric makes multiplepasses through treatment liquor in the lower part of the box (Fig. 11.17). Thesuccessive dipping and expressing of the liquor leads to a very efficientwashing process.
11.8 Continuous dyeing of cotton fabrics
Continuous dyeing is a method of dyeing fabrics in which, in an uninterruptedsequence, they are first impregnated with dyes and chemicals followed by afixation step and rinsing and drying. The impregnation of fabric with dye isgenerally carried out in a padder as described in the previous section. Fixationcan occur by a number of mechanisms such as steaming, baking or simplyexposure to the atmosphere. Steaming is a very common component ofcontinuous dyeing ranges for cotton fabrics, the aqueous high-temperatureenvironment allowing the diffusion of dyestuff molecules into the fibre.
Continuous dyeing methods are suited to high production volumes andrespond quickly to the demands of fashion. Virtually all cotton dyes can be
Pad Batch Wash-off
A-frameTrough
Padmangle
11.16 Cold pad-batch process.

Dyeing of cotton and cotton products 369
applied by continuous methods and, as mentioned in previous sections, it isthe most important process for application of vats, sulphur dyes and azoiccombinations.
11.9 Printing of cotton fabrics
Printing has always been an important process for producing fashion effectson cotton fabrics. The total annual production of printed fabric is approximately15,000 million metres and it is estimated that around 50% of all printedfabric is 100% cotton (van Bergen, 1999). The technology of printing haschanged over the years and is currently experiencing a period of rapiddevelopment.
The use of carved wooden blocks for printing fabrics has been knownsince antiquity (Robinson, 1969). The technique was used on a craft or semi-industrial basis and techniques were highly varied and regional therefore itis difficult to make general statements about the methods used. Multi-stepprocesses included the printing of metal salts (mordants) or alternativelywaxes and other ‘dye resist’ compounds. Subsequent dyeing yielded a printin which the dye fixed to mordanted regions and areas printed with dye resistremained undyed. The technique of applying dyes onto fabrics to obtainprinted fabrics directly was a relatively late development. Block printing isvery slow and labour intensive by modern standards. Block printing was theprincipal technique used until the 18th century but declined rapidly withBell’s invention of the engraved roller printing machine.
Roller printing is a continuous method in which the fabric is passedbetween a pressure cylinder and a series of engraved rollers which pick updye pastes (also referred to as inks) of different colours (Fig. 11.18). Thetechnology of roller printing became highly refined, although the originalarrangement of rollers persisted as the dominant design. The roller printing
Rinse liquor level
Top pressing rollers
11.17 Wash-box.

Cotton: Science and technology370
process is capable of high productivity and the production of very finelydetailed designs. Disadvantages of the process are the expense and timerequired to engrave rollers and the machine downtime involved in changingdesigns. The use of engraved roller printing has declined to a very largedegree due to the advent of rotary screen printing.
Screen printing was introduced into the textile industry in the west duringthe early part of the twentieth century. The technique involves the use of astencil pattern supported on a tightly stretched screen. Dye paste is forcedthrough the design by the use of a squeegee. The original flat bed screensystem was largely carried out by hand for speciality products and shortruns. The efficiency and economy of the process gradually led to thedevelopment of industrial machinery with a greater level of automation.Automated flat bed screen printing is still an important part of the printingindustry but its successor, rotary screen printing, is now used for the majorityof printed cotton (Dawson, 2000).
Rotary screen printing is now the predominant technique and is estimatedto account for at least 60% of printed fabrics (van Bergen, 1999). The principleinvolved is shown in Fig. 11.19; the cylindrical screen is formed from aperforated nickel cylinder which has a pattern applied to it. The patterns areapplied by two main methods, in the former a polymer lacquer forms the
InkInk
Engravedroller
Steel pressure bowl
Absorbentfabric
Fabric forprinting
11.18 Two-colour roller printing machine.

Dyeing of cotton and cotton products 371
pattern and allows printing ink to flow through the perforations in the areasto be coloured. In the latter method the pattern is applied electrochemicallyas a fine metal coating. The printing ink is expressed from the part of thescreen in contact with the fabric by either a flexible stainless steel blade ora rod of circular cross-section.
Ink-jet printing was discovered more or less at the same time by Canonand Hewlett Packard (Gregory, 2000). In the process solutions of dyes orpigments are applied as droplets from printing heads which are scannedacross a moving substrate. The technique has become commonplace in homeand office computing for printing on paper. Since the mid-1990s there hasbeen an increasing interest in using ink-jet technology for textile printing.The potential benefits have led to a great deal of interest from the colorationindustry and many manufacturers are making machinery tailored to textileproduction. Some of the key advantages are:
∑ the ability to print runs of variable length, especially short print runs,economically
Fabric
Ink
Squeege
Patternedscreen
11.19 Rotary screen printing.
Cotton: Science and technology372
∑ rapid production with reduced time between computer-based design, samplepreparation and production
∑ less wastage of ink.
Ink-jet printing has become reasonably common for sample preparationand the printing of speciality items such as banners. It was estimated that in2003 some 300 million metres of fabric was printed by this method andgrowth was rapid (Owen, 2003). At the present time, the technology hasmade very little inroad into full-scale textile production. The prime reasonfor this is the slower production speed compared to rotary screen printing.
A further process used in printing of cotton is that of discharge printing.In this printing method, dyed fabric is printed with a chemical that destroysthe dye in printed regions to give a dark ground and an undyed figure. Thisprinted pattern is usually a bleached white, however if a resistant dye isincluded in the print paste then two colour (so-called ‘illuminated’) effectsare possible. The prints are steamed and washed off to remove reduceddyestuff as well as printing chemicals. Sodium formaldeheyde sulfoxylateand related salts are the most commonly used discharging chemical and thedyes used come from the reactive, direct and azoic classes. Dyestuffmanufacturers provide data about the ‘dischargeability’ of dyes indicatingtheir suitability for this process.
11.10 Environmental aspects of dyeing cotton
The management of waste and effluent is an integral part of modern dyehouseoperations. In the case of cotton dyeing the key issues are salt and unfixeddyes, so-called ‘colour in effluent’. As discussed previously, salt (sodiumchloride or sodium sulphate) is used in substantial quantities in dyeing ofcotton in order to improve dye uptake. It can be estimated that approximately2.8 million tonnes of salt is used in cotton dyeing each year to dye 21 milliontonnes of cotton worldwide. The use of large quantities of salt in cottondyehouses poses a major problem; dyehouses which discharge into freshwateror municipal sewage treatment plants are generally expected to meet quitestrenuous limits on the salinity of effluent. Typical salt levels allowed indyehouse effluent are between 1–2 g/L. Given that reactive dye processliquor can contain between 40 and 100 g/L salt, considerable dilution isrequired and this creates operational difficulties.
A substantial effort has been put into solving the problem of high saltconsumption in cotton dyeing. Within the bounds of the conventional exhaustdyeing process there are a number of straightforward approaches to reducingsalt consumption, they include:
∑ the use of low liquor ratios∑ the use of dye ranges optimised for their salt requirements∑ concentration and re-use of brine (Anon., 2005).

Dyeing of cotton and cotton products 373
As discussed previously, the use of low liquor ratios leads intrinsically tobetter uptake of dye. In addition to this the absolute quantity of salt requiredis less due to the lower liquor volumes. The major dye companies haveresponded to the concerns over salt usage by developing specific selectionsof reactive dyes that require less salt for the dyeing process. Ciba were thefirst to market such a range with their Cibacron LS dyes which were developedfor their substantivity and high fixation. Dystar have a range based on similarprinciples under the brand name Levafix OS and Clariant have recommendeddyes from their Drimarene range. Whilst the initial capital outlay is significant,the reuse of dyebaths can lead to a reduction in salt usage and discharge. Theadditional benefits of such a system are savings in water and energy.
The issue of colour in effluent is the other major issue facing many cottondyers. In a comparison of the degree of fixation of textile dyes (Easton,1995) the three dye classes with the lowest fixations were all cotton dyes,viz., the direct, reactive and sulphur dyes. The coloration industry worldwideis estimated to have to deal with 40,000 tonnes of waste dye per annum(Brown, 1987). It is generally accepted that most dyes have a low environmentaltoxicity and the major concern is the aesthetic problem posed by the presenceof unnatural colours in waterways. Accordingly most water authorities setdischarge limits on the basis of visible colour.
There are a range of approaches to managing colour in effluent and clearlythe best solution is to optimise dyeing processes to obtain the highest levelsof exhaustion. The use of dyeing methods which lead to high fixation ofdyes, such as pad-batch (Smith, 1989) or very low liquor ratio piece dyeingmachinery is one approach along with the use of high fixation dyes. Treatmentof coloured effluent is often required and there are a number of referencesthat discuss and compare the technologies available. Settling tanks with theuse of flocculants have been the traditional choice due to the additionalrequirement to reduce solids and biological oxygen demand (BOD) fromwaste water. Many firms have invested in more elaborate technologies includingmembrane filtration, oxidation based treatment plants and specific dyeadsorbents. Whilst these technologies generally involve a bigger capital outlay,there are savings involved in sludge disposal costs and big savings if theclean water produced is reused (Skelly, 2000).
11.11 Future trends
One of the main research avenues pursued in order to improve the affinity ofdyes for cotton (and to use less salt) has been pre-treatment with cationiccompounds. There have essentially been two approaches:
1. The use of low molecular weight chemicals which form covalent bondsto the cotton fibre.
2. The use of cationic resins.

Cotton: Science and technology374
Figure 11.20 shows a typical reactive agent used for introducing covalentlybound cationic groups into cotton. This chemical was marketed for a numberof years by Protex of France under the tradename Glytac A. The epoxidegroup undergoes cleavage by the nucleophilic celluloside anion formed underbasic conditions (Fig. 11.21).
The main benefit claimed was increased colour yield, and presumablyless colour in effluent, although normal levels of salt appear to have beenused (Rupin, 1970). One research group studied the use of this compound invarious cotton dyeing processes and found benefits, although they foundunacceptable performance of some of the resulting dyed cotton, particularlyin wet contact fastness tests (Herbert, 1983). Further problems with the useof such compounds have been identified (Evans, 1984), particularly therequirement to have a separate pad bake process to get the best cationisationresult and avoid the problems of precipitation of a dye-cationic complex inthe dyebath. Compounds (especially that shown in Fig. 11.22) that had structuralsimilarities to cotton reactive dyes have been investigated while thesecompounds were more easily applied, and gave good fastnesses, there was a
CH
CH2
CH3
H2C
O H3C
CH3
Cl–N+
11.20 N-2,3-epoxy propyl trimethylammonium chloride (Glytac).
Cell—O–
N+
CH3
Cell—O
CH3N+CH2
CH3
CH3
OH
CH2HC
CH3
CH3CH2
CH
OH2C
11.21 Reaction of Glytac compound with cellulose under alkalineconditions.
HC
C
CH
CHCH
C
CH3
N+
H3C
H3C
NH
N
C
N
CNHN
C
Cl
HC
C
CH
C
CH
CH NH N
N
C
N
C
C
HNC
CHCH
HC CCH N+
CH3
CH3
H3C
Cl
11.22 Cationic cotton dye analogue.
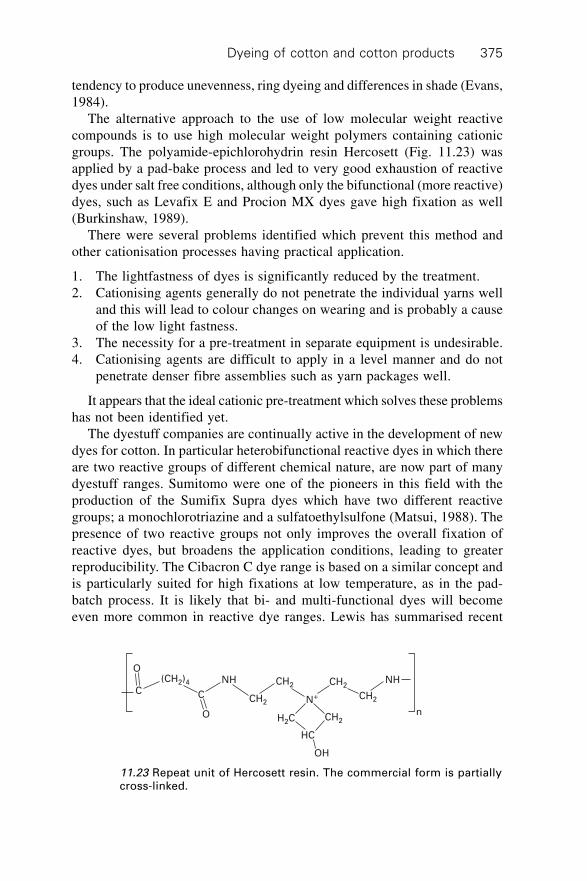
Dyeing of cotton and cotton products 375
tendency to produce unevenness, ring dyeing and differences in shade (Evans,1984).
The alternative approach to the use of low molecular weight reactivecompounds is to use high molecular weight polymers containing cationicgroups. The polyamide-epichlorohydrin resin Hercosett (Fig. 11.23) wasapplied by a pad-bake process and led to very good exhaustion of reactivedyes under salt free conditions, although only the bifunctional (more reactive)dyes, such as Levafix E and Procion MX dyes gave high fixation as well(Burkinshaw, 1989).
There were several problems identified which prevent this method andother cationisation processes having practical application.
1. The lightfastness of dyes is significantly reduced by the treatment.2. Cationising agents generally do not penetrate the individual yarns well
and this will lead to colour changes on wearing and is probably a causeof the low light fastness.
3. The necessity for a pre-treatment in separate equipment is undesirable.4. Cationising agents are difficult to apply in a level manner and do not
penetrate denser fibre assemblies such as yarn packages well.
It appears that the ideal cationic pre-treatment which solves these problemshas not been identified yet.
The dyestuff companies are continually active in the development of newdyes for cotton. In particular heterobifunctional reactive dyes in which thereare two reactive groups of different chemical nature, are now part of manydyestuff ranges. Sumitomo were one of the pioneers in this field with theproduction of the Sumifix Supra dyes which have two different reactivegroups; a monochlorotriazine and a sulfatoethylsulfone (Matsui, 1988). Thepresence of two reactive groups not only improves the overall fixation ofreactive dyes, but broadens the application conditions, leading to greaterreproducibility. The Cibacron C dye range is based on a similar concept andis particularly suited for high fixations at low temperature, as in the pad-batch process. It is likely that bi- and multi-functional dyes will becomeeven more common in reactive dye ranges. Lewis has summarised recent
11.23 Repeat unit of Hercosett resin. The commercial form is partiallycross-linked.
NH
CH2
CH2
CH2
N+
CH2
CH2
OH
nH2C
HC
NH
C
O
C
O(CH2)4

Cotton: Science and technology376
developments in the field of reactive dyes and gives an insight into theinnovation still occurring (Lewis, 2004).
Ink-jet printing will undoubtedly continue to grow in volume, but it appearsthat further innovation is required to bridge the big gap in production speedrequired to displace rotary screen printing.
11.12 Sources of further information
There are a number of useful reference books which provide more extensiveinformation than is possible in this chapter. In particular Shore’s book (Shore,1995) provides comprehensive information on the chemical aspects of cottondyeing, the final chapter of which provides a unique discussion of therelationship between textile product attributes and dye selection. Trotman’sbook (Trotman 1984) provides further information on dyeing of textilesincluding the mechanical design of dyeing equipment.
There are two important professional organisations dealing with coloration.The Society of Dyers and Colorists based in Bradford, England(www.sdc.org.uk) publishes the journal Coloration Technology (formerlyJournal of the Society of Dyers and Colorists) and the annual Review of
Progress in Coloration which are key sources of information. SDC publicationsalso have a range of specific textbooks concerning all aspects of the dyeingindustry. The American Association of Textile Chemists and Colorists(www.aatcc.org) which is based in Raleigh, North Carolina publishes theinformative monthly journal AATCC Review which was formed from themerger of two other magazines, the Textile Chemist and Colorist and American
Dyestuff Reporter. Both the AATCC and SDC run conferences and trainingprograms.
Key research groups in cotton dyeing include CSIRO Textile and FibreTechnology, Geelong Australia (www.tft.csiro.au), The Colour ChemistryDepartment at Leeds University England (www.colour.leeds.ac.uk) and theCollege of Textiles at North Carolina State University (www.tx.ncsu.edu).The major textile dye companies provide comprehensive support to customersfor their dye ranges through their technical information ‘pattern cards’ andother material.
11.13 References
Anon, (2005) ‘Affordable, environmentally sustainable dyeing’ Aust. Textiles & Fashion,25, 22-23, .
Brown D, (1987) ‘Effect of colorants in the aquatic environment’ Ecotox. Environ. Safety,13, 139.
Burkinshaw S M, Lei X P and Lewis D M, (1989) ‘Modification of cotton to improve itsdyeability – reactive resins’ J. Soc Dyers Colorists, 105, 391.
Capponi M, Metzger E, Giamara A, (1961) ‘The development of the Drimarene class ofreactive dyes’ American Dyest. Rep., 50, 505.

Dyeing of cotton and cotton products 377
Cook C C, (1982) ‘Aftertreatments for improving the fastness of dyes on textile fibres’Rev. Prog. Coloration 12, 73.
Dawson T L, Hawkyard C J, (2000) ‘A new millennium of textile printing’ Rev. Prog.
Coloration 30, 7.Easton J R, (1995) ‘The problem of colour – The dyemaker’s view’ in Colour in Dyehouse
Effluent, Cooper P ed. SDC Publications Bradford.Esche S P, (2004) ‘Direct dyes – their application and use’ AATC Review (Oct) 14.Evans G E, Shore J and Stead C V, (1984) ‘Dyeing behaviour of cotton after pretreatment
with reactive quaternary compounds’, J. Soc Dyers Colorists 100,304.Fortress F, Ward G C, (1962) ‘New advances in machinery for pressure dyeing of synthetic
fabrics’ American Dyest. Rep., 51, 400.Gregory P, (2000) ‘Colouring the Jet Set’, Chem. In Britain 36 (Aug) 39.Guest R A, Wood W E, (1989) ‘Sulphur Dyes’ Rev. Prog. Coloration 19, 63.Herbert D F, Barkhuysen F A, Van Rensburg N J J, (1983) SAWTRI Technical Report No
523 – August 1983.Hunter R J, (1981) Zeta Potential in Colloid Science Principles and Applications, Academic
Press, London.Lewis D M, (2004) ‘Modern Reactive Dyes’ in Kirk-Othmer Encyclopedia of Chemical
Technology Wiley, New York.Matsui M, Meyer U, Zollinger H, (1988) ‘Dye-fibre bond stabilities of dyeings of
Bifunctional reactive dyes containing a monochlorotriazine and a b-hydroxyethylsulphone sulphuric acid ester group’ J. Soc Dyers Colorists 104, 425.
McLaren K (1983) The colour science of dyes and pigments Hilger, Bristol.McCleary H R, (1953) ‘Fundamentals of the dyeing of cellulosic fibers’ Textile Research
Journal 23, 673.Owen P, (2003) ‘Digital Printing’ AATC Review 3(9), 10.Perkins W S, (1996) Textile Coloration and Finishing, Carolina Academic Press, Durham NC.Phillips D, (1996) ‘Environmentally friendly, productive and reliable; priorities for cotton
dyes and dyeing processes’ J. Soc Dyers Colorists 112, 183.Raper D P, (1962) ‘Future developments in Procion dyeing’ American Dyest. Rep. 51, 479.Rattee I R, (1984) ‘Reactive dyes for cellulose 1953–1983’ Rev. Prog. Coloration 14, 55.Ribitsch V, Stana-Kleinscheck K, (1998) ‘Characterising Textile Fibre Surfaces with
Streaming Potential Measurements’ Text. Res J. 68(10) 701–707.Robinson S, A History of Printed Textiles (1969) Studio Vista, London.Rupin M, Veaute G, Balland J, (1970) ‘Utilisation de composes reactifs epoxy- ammonium
quaternaries dans la teinture de la cellulose en colorants directs et reactifs’ Textilveredlung
5, 829.Rys P, Zollinger H, (1972) Fundamentals of the Chemistry and Application of Dyes
Wiley-Interscience London.Shore J, (ed.), (1995) Cellulosics Dyeing SDC Publications, Bradford, UK.Skelly K, (2000) ‘Cellulose reactive dyes: recent developments and trends’ Rev. Prog.
Coloration 30, 21.Smith B, (1989) ‘Pollution source reduction – Part III Process alternatives’ American
Dyest. Rep. 78(5) 32.Trotman E R, (1984) Dyeing and Chemical Technology of Textile Fibres, 6th edn Griffin,
High Wycombe, UKvan Bergen A, de Haas M, Kuster W, (1999) ‘Textile Printing Report’ Textile Chemist and
Colorist 31(7), 224.Wyles D H, (1983) ‘Functional design of coloration machines’ in Engineering in Textile
Coloration Duckworth C, ed., SDC Publications, Bradford.

Cotton: Science and technology378
Testing cotton yarns and fabrics 379
Part III
Quality and other issues

Cotton: Science and technology380

381
12.1 Introduction
In this highly competitive global market, the survival of a textile companywill greatly depend upon its ability to meet demanding quality specificationsthrough optimised manufacturing and testing regimes, within acceptable priceand delivery time frames. Textile testing forms an essential link in the qualityassurance and quality control chain and may be divided broadly into twomajor types, namely subjective and objective, Slater1,2 having reviewed both.This chapter deals largely with the objective or instrument testing of yarnand fabric physical and related properties inasmuch as they relate to theirsubsequent performance.
Clearly, the intended application of the yarn or fabric is critical in determiningwhich properties, and therefore tests, are important. For example, for fabricto be used in children’s nightwear, flammability (e.g. the Limiting OxygenIndex – LOI) would be of paramount importance, whereas for fabrics to beused in parachutes, bursting and tear strength, impact resistance and airpermeability would be critically important. Nevertheless, generic or generaltesting of yarns and fabrics is often carried out irrespective of their end-useso as to ensure consistency in the yarn and fabric and to detect any changessuggesting possible production problems. Ultimately, wearer (field) trialswould provide the most reliable measure of actual performance, but theseare expensive, time consuming and difficult to organise and design in sucha way that meaningful and accurate results are obtained.
In carrying out any tests it is important to as far as possible use acceptedtest methods ensuring that the correct sampling, sample preparation andhandling, atmospheric conditions (e.g. 20 ∞C ±2 ∞C and 65% ± 2% RH),conditioning time and instrument calibration are adhered to. ASTM D3777deals with the writing of specifications for textiles. Standards test methodorganisations include:
∑ AATCC (American Association of Textile Chemists and Colorists)∑ ASTM (American Society for Testing of Materials)
12Testing cotton yarns and fabrics
L H U N T E R, CSIR and Nelson Mandela MetropolitanUniversity, South Africa

Cotton: Science and technology382
∑ BSI (British Standards Institution)∑ BIS (Bureau of Indian Standards)∑ DIN (Deutsche Industrie Norm) German National Standards∑ EN (European Norm)∑ ISO (International Standards Organization)∑ JIS (Japanese Industrial Standards)
It should be noted that BS, EN and DIN standards now largely use ISOdesignations.
Ideally, there should be a written pre-agreement between the buyer(customer) and seller (supplier) as to the test method and specifications to beadhered to, thereby avoiding potential ambiguity and dispute. This shouldalso preferably include agreement as to which independent/arbitration testinghouse or laboratory should be used in the event of claims and disputes. Inaddition, and at the very least, there should be available for comparativetesting purposes, either a reference or ‘benchmark’ yarn/fabric sample, possiblythe yarn/fabric sample on the basis of which the purchase was agreed upon,or a similar yarn/fabric sample from the same source, previously used andfound to be acceptable. For more in-depth treatment of yarn and fabrictesting and quality related aspects, the reader is referred to various textbooksand reviews (see section 12.4).
12.2 Yarn testing
12.2.1 Introduction
The yarn represents the final outcome of the fibre processing or yarnmanufacturing part of the fibre to fabric textile pipeline. Prior to the yarn itis still possible, within certain limits, to take corrective action should problemsor mistakes have occurred during the earlier processing stages. Once theyarn has formed, any corrective action is limited to yarn clearing (i.e. removalof gross or unwanted faults), uptwisting and singeing. The properties of theyarn largely determine subsequent fabric manufacturing performance andefficiency (also sewing performance) as well as the properties, aesthetic andfunctional, of the fabric and end-product. Yarn quality control, and theassociated testing of those yarn properties which determine the yarn quality,are therefore crucial in ensuring that the yarn meets the requirements of thesubsequent fabric manufacturing stages as well as of the fabric and endproduct. Preferably the process should be one of quality assurance and totalquality management (TQM) rather than quality control only, so that the yarnmeets the necessary quality requirements cost-effectively without the needfor any corrective action or excessive rejects or waste. A further importantreason for the accurate measurement of yarn properties is that the yarn oftenchanges hands, i.e., is sold and therefore subject to buyer–seller contractual
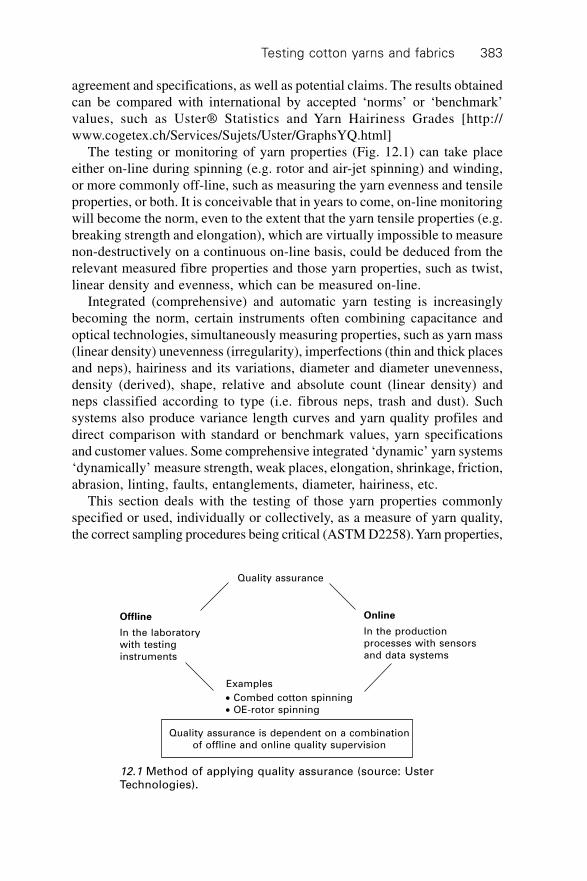
Testing cotton yarns and fabrics 383
agreement and specifications, as well as potential claims. The results obtainedcan be compared with international by accepted ‘norms’ or ‘benchmark’values, such as Uster® Statistics and Yarn Hairiness Grades [http://www.cogetex.ch/Services/Sujets/Uster/GraphsYQ.html]
The testing or monitoring of yarn properties (Fig. 12.1) can take placeeither on-line during spinning (e.g. rotor and air-jet spinning) and winding,or more commonly off-line, such as measuring the yarn evenness and tensileproperties, or both. It is conceivable that in years to come, on-line monitoringwill become the norm, even to the extent that the yarn tensile properties (e.g.breaking strength and elongation), which are virtually impossible to measurenon-destructively on a continuous on-line basis, could be deduced from therelevant measured fibre properties and those yarn properties, such as twist,linear density and evenness, which can be measured on-line.
Integrated (comprehensive) and automatic yarn testing is increasinglybecoming the norm, certain instruments often combining capacitance andoptical technologies, simultaneously measuring properties, such as yarn mass(linear density) unevenness (irregularity), imperfections (thin and thick placesand neps), hairiness and its variations, diameter and diameter unevenness,density (derived), shape, relative and absolute count (linear density) andneps classified according to type (i.e. fibrous neps, trash and dust). Suchsystems also produce variance length curves and yarn quality profiles anddirect comparison with standard or benchmark values, yarn specificationsand customer values. Some comprehensive integrated ‘dynamic’ yarn systems‘dynamically’ measure strength, weak places, elongation, shrinkage, friction,abrasion, linting, faults, entanglements, diameter, hairiness, etc.
This section deals with the testing of those yarn properties commonlyspecified or used, individually or collectively, as a measure of yarn quality,the correct sampling procedures being critical (ASTM D2258). Yarn properties,
Quality assurance is dependent on a combinationof offline and online quality supervision
∑ Combed cotton spinning∑ OE-rotor spinning
Offline
In the laboratorywith testinginstruments
Online
In the productionprocesses with sensorsand data systems
Quality assurance
Examples
12.1 Method of applying quality assurance (source: UsterTechnologies).
Cotton: Science and technology384
such as twist liveliness (residual torque) and stiffness, although of someimportance, are not widely tested and will therefore be referred to only inpassing.
12.2.2 Count (linear density)
Count (linear density) is a fundamental structural parameter of a yarn, andthe average count and its variations are of paramount importance in virtuallyall facets of textile performance and specifications, undue variations in yarncount, or off-specification count, leading to problems in terms of fabric massand barré, and often to claims. Traditionally, the average yarn count (lineardensity) and its variation (CV) are determined by weighing a number 100 mlengths of yarn (e.g. ASTM D861, ASTM D1059, ASTM D1907, ASTMD2260, BS2010, BS2865, ISO 1144, DIN 53830, part 1). Linear density(count) variations (CV), based upon the weighing of 100 m lengths, of lessthan 2% are generally considered acceptable. Ideally, 20 to 30 ¥ 100 metrelengths of yarn, preferably each coming from a different yarn bobbin orpackage, should be tested. The count of cotton yarn can be expressed in anyone of the following three systems:
1. Tex count (linear density): weight in grams of 1000 m of yarn (i.e.mg/m or g/km)
2. Cotton count (Ne): number of 840 yd lengths in a pound3. Metric count (Nm): number of 1000 m lengths of yarn in one kilogram.
The conversion from one system to the other is as follows:
tex = 590.6Ne
= 1000Nm
12.1
Today ‘relative count’ and count deviations, from the nominal (or set)value, can also be determined on optical or capacitance type instruments(DIN 53817, part 2), even on-line, although in the case of the latter, it couldbe influenced by variations in the fibre type (dielectric constant) and moisturecontent within the test length.
12.2.3 Twist
Twist is one of the fundamental constructional parameters for yarns. Averagetwist levels and twist variations are reflected in the yarn tensile properties,thickness, bulk, stiffness and handle. These, in turn, are reflected in the yarnperformance during the subsequent fabric manufacturing processes andultimately in the corresponding fabric properties.
Traditionally, twist was counted manually by the direct twist countingmethod (ASTM D1423, BS 2085) where the operator would clamp the yarntest length (popularly 25 mm for singles yarn and 500 mm for two-ply yarn)
Testing cotton yarns and fabrics 385
under a pre-determined tension, and then untwist the yarn, using a ‘dissectingneedle’ until all the twist is removed. Today, twist is more commonly measuredautomatically, using different test methods and techniques, for example,double-untwist-retwist test, untwist-retwist tests described in ASTM D-1422,multiple untwist-retwist and twist-to-break, the test length popularly being50 cm, typically 100 tests per yarn lot are measured, it also being possible tomeasure the twist (helix angle optically). The yarn twist is expressed interms of turns per metre (or turns per centimetre) and the CV of twist inpercentage, noting the gauge length. Standard test methods include BS 2864,DIN 53830-4, see also ASTM D1244. Twist results may be assessed using‘norms or standards’, such as the Testex Twist Statistics, variation in yarntwist being particularly important. Various instruments and test methods areavailable for testing yarn twist (e.g. Zweigle Automatic Twist Tester D 302and Semi-automatic Twist Tester D 314).
It is generally accepted that the twist in yarns of different counts (lineardensities) is comparable when the twist factor (and helix angle) is constant,twist factor or multiplier being defined as follows:
1. Tex twist factor = turns/m ÷tex or alternatively (atex) = turns/cm ÷tex2. Metric twist factor (am) = turns/m/÷ Nm
3. Cotton count twist factor (ae) = turns/inch/÷Ne
where Nm = metric count and Ne = English cotton count.Conversion from one unit (system) to the other can be done as follows:
ae = 0.033 am = 0.104 atex
atex = 0.0316 am = 9.57 ae
am = 3.16 atex = 30.3 ae
where atex = turns/cm tex
Because of their different structure, notably the presence of wrapper fibres,which cannot be untwisted, rotor (open-end) yarn twist is difficult to measureaccurately and specific test methods have been devised for this purpose. Thesingle untwist-retwist method is often applied, giving an indication of yarnstructure rather than of real twist per se.
12.2.4 Twist liveliness (torque)
Another fairly important yarn quality parameter is its twist or torque liveliness(residual torque) since this can be reflected in the snarling potential of theyarn and in fabric properties, such as knitted fabric spirality (see ISO 3343).In the main, twist liveliness is related to the twist level and unbalanced twist,and heat setting of the yarn. A low or balanced twist (in the case of pliedyarn) will produce a yarn with little, if any, inclination towards twist liveliness.Similarly, good heat setting can reduce, if not eliminate, twist liveliness,even in the case of highly unbalanced twist.
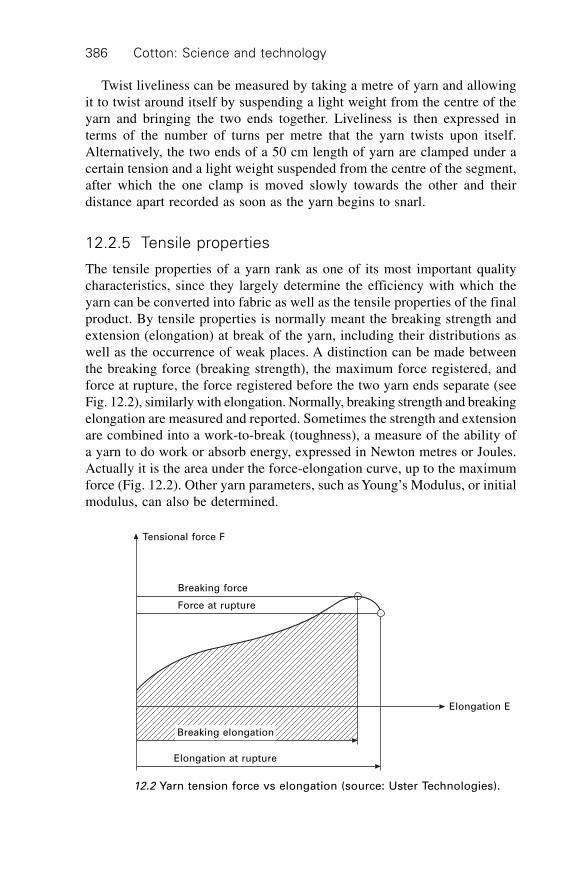
Cotton: Science and technology386
Twist liveliness can be measured by taking a metre of yarn and allowingit to twist around itself by suspending a light weight from the centre of theyarn and bringing the two ends together. Liveliness is then expressed interms of the number of turns per metre that the yarn twists upon itself.Alternatively, the two ends of a 50 cm length of yarn are clamped under acertain tension and a light weight suspended from the centre of the segment,after which the one clamp is moved slowly towards the other and theirdistance apart recorded as soon as the yarn begins to snarl.
12.2.5 Tensile properties
The tensile properties of a yarn rank as one of its most important qualitycharacteristics, since they largely determine the efficiency with which theyarn can be converted into fabric as well as the tensile properties of the finalproduct. By tensile properties is normally meant the breaking strength andextension (elongation) at break of the yarn, including their distributions aswell as the occurrence of weak places. A distinction can be made betweenthe breaking force (breaking strength), the maximum force registered, andforce at rupture, the force registered before the two yarn ends separate (seeFig. 12.2), similarly with elongation. Normally, breaking strength and breakingelongation are measured and reported. Sometimes the strength and extensionare combined into a work-to-break (toughness), a measure of the ability ofa yarn to do work or absorb energy, expressed in Newton metres or Joules.Actually it is the area under the force-elongation curve, up to the maximumforce (Fig. 12.2). Other yarn parameters, such as Young’s Modulus, or initialmodulus, can also be determined.
Elongation E
Tensional force F
Breaking force
Force at rupture
Breaking elongation
Elongation at rupture
12.2 Yarn tension force vs elongation (source: Uster Technologies).
Testing cotton yarns and fabrics 387
The mean breaking strength is important since it gives an indication ofoverall yarn strength which will be reflected in the fabric strength and it alsoprovides a measure, though not always a reliable one, of the strength of theweak places. Nevertheless, everyone is familiar with the saying ‘a chainbreaks at its weakest link’, indicating that it is the weak places in a yarn andnot the average yarn strength, which frequently determine a yarn’s performance,or breakage pattern, during winding, weaving and knitting. It is thereforeimportant to obtain a measure of the isolated weak places in a yarn, inaddition to the average strength, since the latter generally does not providea sufficiently accurate measure of the isolated weak places.
There are a number of different tensile testers on the market, both manualand automatic, and they can broadly be divided into single thread and multi-thread (skein or hank) testers, with the former far more popular and providinga great deal more valuable information than the latter. The single-threadtesters provide information on the average or mean strength as well as on thedistribution of strength, whereas the multi-thread testers give a more compositepicture of strength, with the values being affected by the weaker strands inthe skein e.g. ASTM D1578 and BS 6372. The single-thread strength testsalso provide values for the yarn extension at break which is very importantsince it provides a measure of the yarn brittleness, a property sometimeseven more important than the breaking strength itself. Various standard testmethods are available for testing yarn tensile properties, including BS 1932,DIN 53834, ASTM D2256, ASTM D1578.
Tensile testers can operate according to three different principles (seeASTM D76):
1. Constant rate of yarn extension (the most popular), where the yarn isextended at a constant rate, e.g., Uster® Tensorapid UTR 4, and Tensojet4, Instron and Premier Tensomaxx 7000.
2. Constant rate of load, where the load on the yarn is increased at aconstant rate.
3. Constant rate of traverse, which is a hybrid of the first two but is nolonger all that common except in the case of pendulum type multi-threadtesting instruments.
Because of the general variability of a staple fibre yarn, it is necessary tocarry out a relatively large number of tests so as to obtain a reliable averageor mean, about 100 tests per yarn sample generally being the absolute minimum,with 200 to 400 tests preferred, except where a reliable measure of theisolated weak places is also required in which case some 30,000 tests ormore may be required, a high correlation being found between isolated weakplaces (e.g. strength of the P0.01 percentile value) and the number of weftbreaks per 100,000 picks. The yarn is generally clamped under a pre-settension and at a pre-determined gauge length, typically 50 cm. Tests can take

Cotton: Science and technology388
place at a certain rate of extension, or at a certain average breaking time (e.g.20 s) or at very high speeds (e.g. 400 m/min).
An example of a high-speed tensile tester is the Uster® Tensojet 4 (Fig.12.3), testing at 30,000 breaks per hour (400 m/min), thereby providing anaccurate measure of the isolated weak places which play an important role indetermining weavability. It is important to remember that the different resultsobtained from the different types of testers can vary and even the resultsobtained on the same type of tester will vary, if, for example, the time tobreak or rate of strain is not kept constant. In general, the following parametersare used to provide an overall picture of the yarn tensile properties:
∑ mean breaking strength (e.g. cN or gf)∑ breaking tenacity (e.g. cN/tex or gf/tex)∑ CV of breaking strength (%)∑ mean extension (elongation) at break (%)∑ CV of extension (%)∑ work-to-break (cN.cm or N.m)∑ isolated weak places (for example, the percentage of breaks which have
a strength and/or elongation below a certain threshold level, such as 4cN/tex and 2%, respectively).
∑ skein strength is generally given as the count-strength-product (CSP)which represents the product of the force (e.g. pounds-force or kilograms-force) required to break the skein and the cotton count (Ne) or tex ofthe yarn.
12.3 Uster® Tensojet (source: Uster Technologies).
Testing cotton yarns and fabrics 389
To allow the strength of yarns differing in linear density (or count) to becompared and also to provide more universal strength standards, the breakingstrength of a yarn is often divided by its linear density (tex) to give what istermed ‘tenacity’ (e.g. cN/tex) and which is almost, but not entirely, independentof the actual yarn linear density. For quality control purposes, the tensilevalues obtained for a yarn can be compared with external standards (e.g.Uster® ISO) or internal (in-house) standards. Dynamic and integrated tensiletesting, where the running yarn is subjected to a predetermined constanttension, provides a measure of yarn strength, elongation, isolated weak places,friction, abrasion, hairiness and evenness and lint (fly) generation undersimulated manufacturing conditions, is also carried out.
12.2.6 Evenness
Introduction
The terms yarn evenness, unevenness, regularity and irregularity are oftenused interchangeably and taken to refer to the same yarn characteristic,namely the uniformity or evenness of the yarn mass per unit length (lineardensity), measured capacitively (ASTM D1425), or of the yarn cross-sectionalsize or diameter, measured optically. This characteristic is important fromtwo perspectives, namely from an aesthetic or appearance point of view andfrom a technical or functional (performance) point of view, since unevenness(i.e. thinner or thicker segments) in the yarn cross-section, is commonlyassociated with variations in the yarn strength and elongation. In practice,yarn evenness is most frequently measured using capacitance, as opposed tooptical, techniques which means that it is assessed in terms of changes insegment mass (linear density) rather than in terms of cross-sectional volume(bulk) or diameter, assuming the dielectric properties (notably moisture andfibre blend) of the yarn are constant. Nevertheless, recent evenness testersenable both capacitance and optical measurements to take place simultaneously,sometimes as an option. Examples of modern yarn evenness testers include:Uster® Tester 4-SX (Fig. 12.4) Keisokki KET 80, III/B and Premier iQQUAL1 CENTER. Optical testers include the Zweigle Yarn Detector G 580(using infra-red light) and the Keisokki Laserspot III Hairiness and Evenness(Diameter) Testing instrument which functions on the principle of Fresneldiffraction of a laser beam.
According to Basu,3 research has shown that some 42% of the total yarnirregularity is due to the raw material, some 40% due to the condition of theringframe and 18% due to the roving irregularity. The irregularity (unevenness)added by each processing stage in the yarn manufacturing process is additive,as follows:
CV = CV + CVR 12
22 12.2

Cotton: Science and technology390
where CVR is the resultant irregularity, say of the yarn; CV1 is the irregularityof the input material (the roving); CV2 is the irregularity added by the spinningprocess (ring frame).
Drafting waves introduced into the yarn during spinning have a wavelengthof approximately 2.8 times the staple length; while those in the yarn introducedduring the roving process will have a wavelength 3.2 ¥ the draft ¥ the staplelength. Greater random irregularity or drafting waves in the yarn produce‘cloudiness’ in the fabric, as opposed to the patterned (regular) or moiréeffect produced by regularly occurring (periodic) irregularity or faults.
In keeping with the conventional approach, the overall yarn evennesscharacteristics will be grouped and discussed under three headings, namelyunevenness (irregularity), imperfections (relatively small and frequent thinand thick places and neps) and faults (grosser and less frequent faults, suchas slubs, fly and very long or extreme thin and thick places). For more in-depth treatment of yarn irregularity the reader is referred to variouspublications.4
Unevenness
Enormous strides have been made in the measurement of yarn evenness,both in terms of the speed and the detail of the measurement. Modern evennesstesters, which incorporate both capacitance and optical measurementtechniques, enable the following yarn properties to be accurately measured,or derived, within one minute:
12.4 Uster® Tester 4 (source: Uster Technologies).

Testing cotton yarns and fabrics 391
∑ mass unevenness (short term (1 to 10 times fibre length)3, medium term(10 to 100 times fibre length)3 and long term (more than 100 times fibrelength)3, also spectrograms and variance length curves)
∑ imperfections (thin and thick places and neps)∑ hairiness∑ count (linear density), relative and absolute∑ diameter∑ density∑ surface structure∑ trash∑ dust.
It is also possible to diagnose periodic faults by means of gearing diagramsand ratios, using a database contained in the software of the tester. Furthermore,the appearance of the yarn and its faults, as it would appear on a taper boardor in a woven or knitted fabric, may be simulated and evaluated on a screen,and agreed upon quality properties can also be displayed in the form of a piechart for easy assessment of ‘off-quality’ properties.
Yarn unevenness (mass unevenness) can be numerically expressed interms of either the coefficient of variation (CVm in %) or linear irregularity(Um in %), commonly measured with an effective ‘cut’ or measurementlength of 8 mm. CVm (in %) is more commonly reported, being shortened toCV (%).
CV(%) = 100sx¥ 12.3
where s = standard deviation x ; x = mean (or average).
For continuous measurement: CV(%) = 100 1 ( – )0
I2
xL x x dl
L
ÚU(%) = 100 | – |
0x Lx x dl
L
iÚ 12.4
dl = an elemental length of material and L is the total length of yarn measured.For completely random variation CVm = 1.25 Um
The values obtained can then be compared with the appropriate specificationsor standard values (e.g. Uster Statistics at www.cogetex.ch/Services/Sujets/TechSpecs. html).
The limiting (or ideal) irregularity CVlim, of a cotton yarn, derived fromMartindale’s5 general equation, in which a completely random arrangementof fibres is assumed, may be calculated as follows:
CVlim(%) = 106/÷n 12.5
(although sometimes CVlim(%) = 100/÷n is also used)
Cotton: Science and technology392
= 106tex 1000
F¥
12.6
where F = fibre fineness (in mtex); tex = yarn linear density in mg/m (i.e. texunits); n is the average number of fibres in the yarn cross-section = tex ¥1000/F.
From this, the irregularity index I, a measure of the effectiveness withwhich the spinner has converted the available fibre into a yarn, can becalculated as follows:
I = CVactual/CVlim 12.7
CVactual being the actual (or measured) irregularity.
Imperfections
Imperfections (i.e. thin and thick places and neps) affect the appearance ofthe yarn and that of the subsequent fabric, while thin places, generally ofhigher twist (because of twist running into it), could also represent weakplaces in the yarn. Imperfections can be measured at different thresholdlevels, for example:
∑ Thin places: –30%, –40% and –50% i.e. either 30%, 40% and 50% belowthe average yarn linear density, or cross-section, more typically – 50%for both ring-spun and rotor-spun yarns.
∑ Thick places: 35%, 50%, 75% and a 100%, greater than the average yarnlinear density, more typically 50% for ring-spun and rotor-spun yarns.These thin and thick places are generally equal in length to the meanfibre length.
∑ Neps: 140%, 200%, 280% and 400% greater than the average yarn lineardensity, calculated on the basis of a 1 mm segment length, the maximumlength being limited to 4 mm, typically being 200% for ring-spun yarnsand 280% for rotor-spun yarns. The neps could be due to the raw material(e.g. immature fibres or vegetable matter) or to processing (e.g. duringginning and carding). It is also possible to optically classify neps as‘process neps’ or ‘seed coat neps’ (trash type).
The frequency of imperfections is normally expressed as the number per1,000 m. If the number is above 30, the frequency generally follows thenormal distribution, while if it is below 30 it follows a Poisson distribution.
Faults
Yarn faults, such as thick places and slubs, are generally due to poor drafting(e.g. a bundle of short fibres not being drafted and travelling into the yarn as

Testing cotton yarns and fabrics 393
a cluster or clump of fibres) or fly being caught in the fibrous strand. Inaddition to causing a fabric blemish or fault, the more severe yarn thickplaces and slubs can also cause yarn breakages during fabric manufacturing,either because they generally contain a relatively low twist and are thereforeintrinsically weak or if they get caught in yarn guides, e.g., heald eyes,knitting needles and sinkers, etc. It is therefore important in practice tomonitor and control yarn faults.
As already mentioned, yarn faults are generally more serious than yarnimperfections, and consist of thick places, slubs and thin places. Whereasimperfections are generally expressed as the number per 1000 metres, thegrosser faults as such are expressed per 100,000 m because of their relativelylow frequency. The more serious types of yarn faults, termed objectionablefaults, generally lead to a fabric defect (or fault) and therefore should beremoved by clearing during winding. Very thin places could also lead toeither a yarn break during winding or fabric manufacturing or to a thin place(line) in the fabric and should preferably also be removed during clearing. Itis commonly stated, however, that a very faulty yarn cannot be transformedinto a good quality yarn merely by clearing, as the clearing of excessivefaults in the yarn will adversely affect winding efficiency and economics andcould produce a yarn with an excessive number of knots or splices whichthemselves may lead to problems during fabric manufacturing and in thefabric itself. Yarn faults are generally classified according to both their lengthand cross-section.
As in the case of yarn irregularity and imperfections, yarn faults can bemeasured and cleared using either optical or capacitance systems. Both areused, although the capacitance systems, such as the Uster® Classimat Quantum,Premier Class i and Keisokki Classifault CFT are the most popular. Certainsystems, such as the Uster® Classimat Quantum (combining capacitanceand optical sensors), also enable foreign fibre classification and measurementof vegetable matter content as well as the simulation of the effects of faultsin the yarn and fabric and the determination of yarn count. On-line monitoringand classifying of yarn faults and count deviations on rotor-spining machinesis also provided using systems such as Corolab XQ (www.saurer.de).
12.2.7 Diameter
Various instruments optically measure the yarn diameter and its variation,including imperfections and faults (see also previous sections). For example,the two-dimensional optical diameter of yarns is measured on evenness testers,such as the Uster® Tester 4-SX fitted with digital-analog opto-electronicsensors (infra-red) together with a high-resolution line scan camera. Opticalyarn diameter unevenness can also be measured, the results not being influencedby the colour of the yarn; the effective measuring (field) length, for example,
Cotton: Science and technology394
being 0.3 mm. The results can provide much the same information and canbe analysed in much the same way as that for capacitance based yarn massresults.
The shape (roundness) of the yarn can also be determined. From the yarncount and cross-sectional area, the yarn density can be calculated, densitydepending upon the yarn type and twist. For example, the density of a combedring-spun yarn is of the order of 0.5 g/cm3, that of a carded ring-spun yarnof the order of 0.8 g/cm3 and that of a rotor-spun carded yarn of the order of0.4 g/cm3. Yarn diameter can also be monitored on-line during winding. TheZweigle Yarn Detector G580 uses an opto-electronic (infra-red) principle tomeasure the yarn diameter and its variation, including imperfections andmoiré. The Lawson-Hemphill Yarn Analysis Software (YAS) system alsomeasures the yarn diameter, imperfections and faults optically, using a camera(CCD array).
12.2.8 Hairiness
Hairiness normally refers to fibre ends, fibre loops and fibres of varyinglength (wild fibres) protruding from the surface (or body) of the yarn, frequentlyas fibre tails. Although hairiness is desirable in certain types of fabrics,notably soft knitteds, brushed fabrics and flannels, it is undesirable in otherfabrics, such as shirting. Yarn hairiness affects the fabric surface appearanceand properties, including fabric pilling, handle and comfort (thermal insulation).Yarn hairiness also plays an important role in weavability, since the protrudinghairs tend to catch on adjacent yarns causing yarn breakages and loomstoppages. It is particularly important in air-jet weaving. In fact, one of themain objectives of sizing is to smooth down the hairs on the yarn, i.e., toreduce yarn hairiness, thereby improving yarn weaving performance. Yarnhairiness positively affects the heat and wear generated when the yarn runsover metal or other surfaces, such as travellers and yarn guides. Variations inyarn hairiness can be particularly problematic, being reflected in variationsin fabric surface appearance, and can cause fabric barré and streakiness, ittherefore being important that yarn hairiness remains acceptably constantwithin a certain application and yarn consignment. It is now possible tomeasure yarn hairiness on-line, for example, on programmable yarn clearers,such as the Uster® Quantum, Yarn Hairiness Grades helping to visualisevarious levels of hairiness, e.g., (www.Uster.com).
Many different hairiness measuring instruments and test methods (e.g.ASTM D5647), as well as measures of hairiness are used, including a moduleon the Uster® Tester 4, Shirley Yarn Hairiness Tester and Zweigle G 566 andG 567 Hairiness Tester. In some cases, the number of hairs protruding beyonda certain distance (e.g. 3 mm) from the yarn surface or axis, are measured,while in other cases the overall hairiness of the yarn is measured and expressed
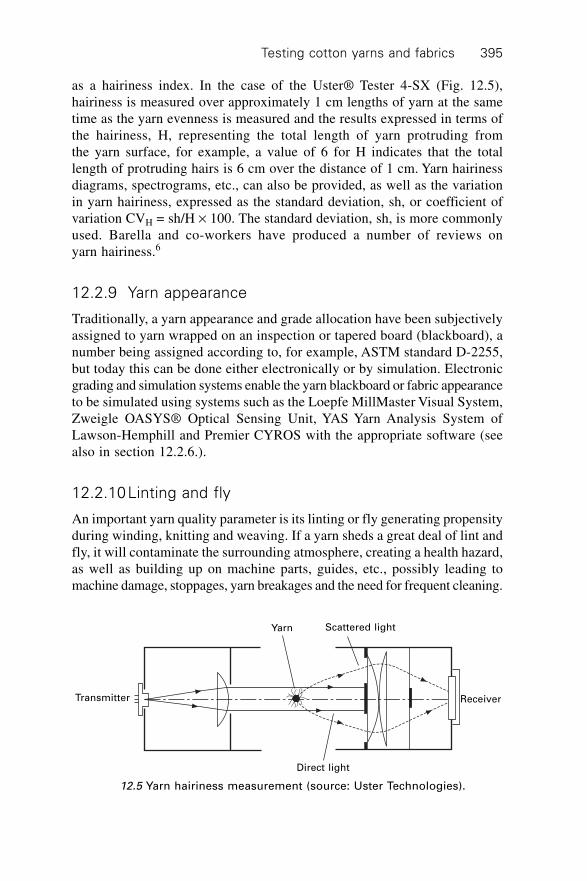
Testing cotton yarns and fabrics 395
as a hairiness index. In the case of the Uster® Tester 4-SX (Fig. 12.5),hairiness is measured over approximately 1 cm lengths of yarn at the sametime as the yarn evenness is measured and the results expressed in terms ofthe hairiness, H, representing the total length of yarn protruding fromthe yarn surface, for example, a value of 6 for H indicates that the totallength of protruding hairs is 6 cm over the distance of 1 cm. Yarn hairinessdiagrams, spectrograms, etc., can also be provided, as well as the variationin yarn hairiness, expressed as the standard deviation, sh, or coefficient ofvariation CVH = sh/H ¥ 100. The standard deviation, sh, is more commonlyused. Barella and co-workers have produced a number of reviews onyarn hairiness.6
12.2.9 Yarn appearance
Traditionally, a yarn appearance and grade allocation have been subjectivelyassigned to yarn wrapped on an inspection or tapered board (blackboard), anumber being assigned according to, for example, ASTM standard D-2255,but today this can be done either electronically or by simulation. Electronicgrading and simulation systems enable the yarn blackboard or fabric appearanceto be simulated using systems such as the Loepfe MillMaster Visual System,Zweigle OASYS® Optical Sensing Unit, YAS Yarn Analysis System ofLawson-Hemphill and Premier CYROS with the appropriate software (seealso in section 12.2.6.).
12.2.10Linting and fly
An important yarn quality parameter is its linting or fly generating propensityduring winding, knitting and weaving. If a yarn sheds a great deal of lint andfly, it will contaminate the surrounding atmosphere, creating a health hazard,as well as building up on machine parts, guides, etc., possibly leading tomachine damage, stoppages, yarn breakages and the need for frequent cleaning.
Transmitter
Direct light
Yarn
Receiver
Scattered light
12.5 Yarn hairiness measurement (source: Uster Technologies).

Cotton: Science and technology396
Accelerated wear on certain machine components can also result. In additionto this, fly can get caught up in the fabric, forming a blemish which resemblesa nep. Fly is generally due to excessive short fibres and possibly weak ordamaged fibres in the yarn and to the yarn structure.
An example of an instrument on the market for measuring fly or lintingpotential is the Zweigle Staff Tester G 556. This instrument also provides ameasure of the nepping potential of the yarn, i.e., the tendency for the yarnto form neps (fibre bundles or clusters) when it is abraded during knittingand weaving, since this could be reflected in knitting and weaving performanceand the appearance of the fabric. Basically, the yarn is drawn over a knifeedge and over itself (it is twisted with itself), and the amount of fly shed overa certain test length is then determined by catching and weighing the fly.Simultaneously, the number of neps is determined as the yarn enters the testzone and as it leaves again, the difference providing a measure of the neppingpropensity of the yarn. Fly or linting potential is expressed as a percentagebased upon the mass of yarn tested, while nepping potential is expressed asthe number of neps per unit length.
12.2.11Yarn abrasion
Although yarn abrasion resistance is an important property, particularly fromthe view of weavability, it is not all that commonly measured, mainly becauseit is not easy to measure this parameter accurately under conditions whichsimulate those which the yarn will experience during weaving. Anotherconsideration is that if the yarn is to be sized then it is really the abrasionresistance of the sized yarn which needs to be measured as this would bequite different from that of the unsized yarn, being greatly affected by thetype, level and levelness of the size applied. Examples of yarn abrasiontesters are on the market, include the Zweigle Staff Tester G 556 and G 552Abrasion Tester and Reutlingen Weaving Tester G 545, the latter working onthe principle that a tensioned yarn web is cyclically abraded and flexed overrods, with the number of cycles required to cause one or more yarns to breakor a certain change in the yarn appearance (or neppiness) being noted andused as a measure of the ability of the yarn to withstand abrasion.
12.2.12Friction
The friction of cotton yarns is mainly important when it comes to machineknitting, particularly when knitting relatively fine yarns on high-speed knittingmachines. By and large, two types of yarn friction, or a combination thereof,are measured, namely yarn-to-metal (or occasionally yarn-to-ceramic friction)and yarn-to-yarn (ASTM D3412), since these represent the types of frictionmostly encountered in practice. The yarn friction determines the frictional

Testing cotton yarns and fabrics 397
forces and tension developed by the yarn as, for example, it slides overyarn guides, tensioning devices, knitting needles and sinkers, the yarn itself,or other yarns. If the yarn friction is excessive, the tension generated inthe yarn could exceed its breaking strength, thereby causing yarn breakages,for example, during winding or knitting. The most effective, and widelyused, means for reducing friction is to apply a lubricant, for example, usinga solid paraffin wax disc, to the yarn as it is wound onto the package, duringwinding or during rotor-spinning. Sometimes a lubricant (or softener) isapplied to the dye-bath, subsequent to package dyeing, while in some casesan emulsion lubricant is applied during winding, for example, by means ofa lick-roller.
Various commercial friction testers and test methods (e.g. ASTM D3108)are available, most of these measuring the tension generated in the yarn as itpasses over a cylindrical or flat metal surface, or itself, the yarn-to-metalcoefficient of friction (m) can be estimated by measuring the yarn tension(T1) prior to the surface and that (T2) after the surface (Fig. 12.6) using thefollowing classical capstan equation:
T /T = e and T = T e2 1 2 1m mQ Q 12.8
q
T1 T2
(b)(a)
T1 T2
(d)(c)
T
W
12.6 Diagrams showing methods of applying tension to yarns:(a) flat plate; (b) capstan; (c) and (d) twin flat plate system (source:P.J. Kruger, Text. Month, Feb. 1970).
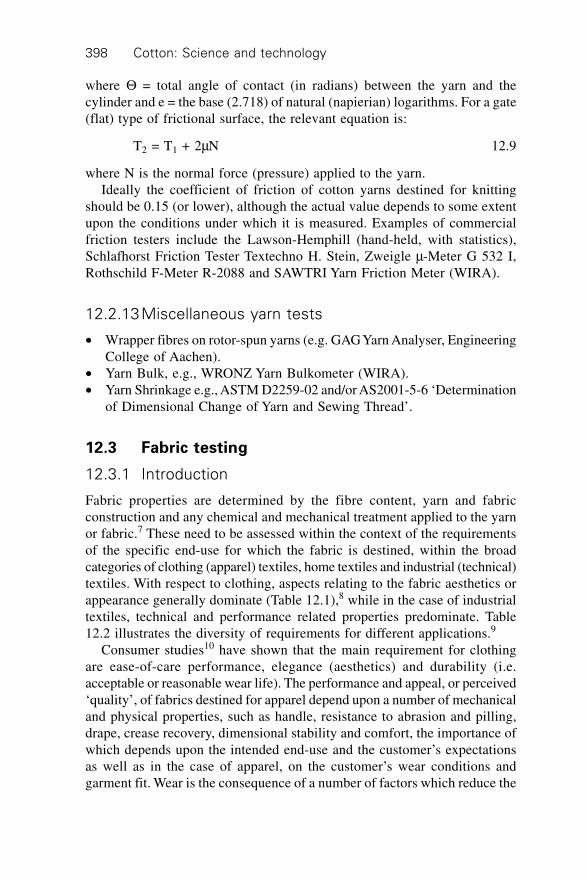
Cotton: Science and technology398
where Q = total angle of contact (in radians) between the yarn and thecylinder and e = the base (2.718) of natural (napierian) logarithms. For a gate(flat) type of frictional surface, the relevant equation is:
T2 = T1 + 2mN 12.9
where N is the normal force (pressure) applied to the yarn.Ideally the coefficient of friction of cotton yarns destined for knitting
should be 0.15 (or lower), although the actual value depends to some extentupon the conditions under which it is measured. Examples of commercialfriction testers include the Lawson-Hemphill (hand-held, with statistics),Schlafhorst Friction Tester Textechno H. Stein, Zweigle m-Meter G 532 I,Rothschild F-Meter R-2088 and SAWTRI Yarn Friction Meter (WIRA).
12.2.13Miscellaneous yarn tests
∑ Wrapper fibres on rotor-spun yarns (e.g. GAG Yarn Analyser, EngineeringCollege of Aachen).
∑ Yarn Bulk, e.g., WRONZ Yarn Bulkometer (WIRA).∑ Yarn Shrinkage e.g., ASTM D2259-02 and/or AS2001-5-6 ‘Determination
of Dimensional Change of Yarn and Sewing Thread’.
12.3 Fabric testing
12.3.1 Introduction
Fabric properties are determined by the fibre content, yarn and fabricconstruction and any chemical and mechanical treatment applied to the yarnor fabric.7 These need to be assessed within the context of the requirementsof the specific end-use for which the fabric is destined, within the broadcategories of clothing (apparel) textiles, home textiles and industrial (technical)textiles. With respect to clothing, aspects relating to the fabric aesthetics orappearance generally dominate (Table 12.1),8 while in the case of industrialtextiles, technical and performance related properties predominate. Table12.2 illustrates the diversity of requirements for different applications.9
Consumer studies10 have shown that the main requirement for clothingare ease-of-care performance, elegance (aesthetics) and durability (i.e.acceptable or reasonable wear life). The performance and appeal, or perceived‘quality’, of fabrics destined for apparel depend upon a number of mechanicaland physical properties, such as handle, resistance to abrasion and pilling,drape, crease recovery, dimensional stability and comfort, the importance ofwhich depends upon the intended end-use and the customer’s expectationsas well as in the case of apparel, on the customer’s wear conditions andgarment fit. Wear is the consequence of a number of factors which reduce the
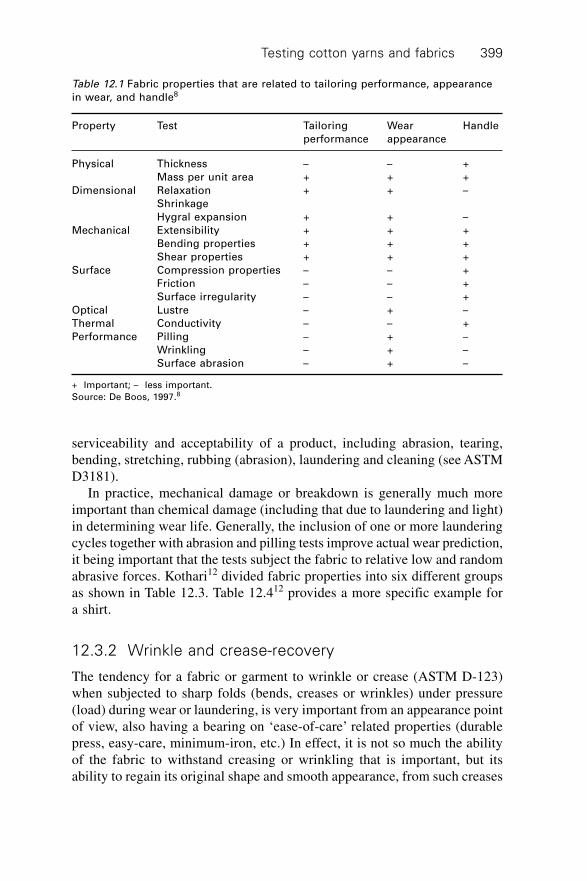
Testing cotton yarns and fabrics 399
Table 12.1 Fabric properties that are related to tailoring performance, appearance
in wear, and handle8
Property Test Tailoring Wear Handle
performance appearance
Physical Thickness – – +
Mass per unit area + + +
Dimensional Relaxation + + –
Shrinkage
Hygral expansion + + –
Mechanical Extensibility + + +
Bending properties + + +
Shear properties + + +
Surface Compression properties – – +
Friction – – +
Surface irregularity – – +
Optical Lustre – + –
Thermal Conductivity – – +
Performance Pilling – + –
Wrinkling – + –
Surface abrasion – + –
+ Important; – less important.
Source: De Boos, 1997.8
serviceability and acceptability of a product, including abrasion, tearing,bending, stretching, rubbing (abrasion), laundering and cleaning (see ASTMD3181).
In practice, mechanical damage or breakdown is generally much moreimportant than chemical damage (including that due to laundering and light)in determining wear life. Generally, the inclusion of one or more launderingcycles together with abrasion and pilling tests improve actual wear prediction,it being important that the tests subject the fabric to relative low and randomabrasive forces. Kothari12 divided fabric properties into six different groupsas shown in Table 12.3. Table 12.412 provides a more specific example fora shirt.
12.3.2 Wrinkle and crease-recovery
The tendency for a fabric or garment to wrinkle or crease (ASTM D-123)when subjected to sharp folds (bends, creases or wrinkles) under pressure(load) during wear or laundering, is very important from an appearance pointof view, also having a bearing on ‘ease-of-care’ related properties (durablepress, easy-care, minimum-iron, etc.) In effect, it is not so much the abilityof the fabric to withstand creasing or wrinkling that is important, but itsability to regain its original shape and smooth appearance, from such creases

Cotton: Science and technology400
Table 12.2 Some examples of special parameters for different end-uses of fabrics/
garments9
Item Special requirements
Garments for Australia Improved light fastness, UV protection
Swimwear/beachwear Chlorinated water/seawater fastness,
colourfastness to light.
Towels and napkins Absorbency.
Surgical gowns/apparel Anti-bacterial properties, colourfastness
to autoclaving, absorbency.
Woollen merchandise Moth proofing.
Fire-fighters apparel Flame proofing.
Defence textiles Rot proofing.
(Tents/Canvas, etc.) Protective textiles.
Parachute cloth Air permeability.
Soil-resistant products Soil-releasing fluorocarbon treatment.
Oil industry applications Oil-repellent finishes.
Household curtains & drapery Tensile strength, colourfastness to light,
flammability.
Bathmats/table mats Colourfastness: migration into PVC.
Upholstery Abrasion resistance.
Industrial uniforms Strength, oil/soil repellency, flammability.
Sportswear Abrasion resistance, seam strength &
colourfastness to perspiration.
Baby/children’s wear Colourfastness to saliva.
Nightwear Flammability.
Rainwear Water repellency, breathability.
Garments for arctic conditions Ability to withstand extreme cold:
flexing/strength at low temperatures.
and wrinkles, i.e., its wrinkle recovery or crease recovery that is important.Therefore, in testing a fabric for this important property, wrinkles or creases,more popularly the latter, are inserted into a fabric specimen under carefullycontrolled conditions of pressure and fold sharpness, the wrinkle recovery orcrease recovery being measured after the load has been removed and thefabric allowed a certain period to recover.
Wrinkle and crease recovery is particularly important for cotton, sinceuntreated cotton is notoriously poor in this respect and considerable researchand development work over many decades has been directed towardsdeveloping chemical treatments that improve this property without anunacceptable loss in other desirable properties, such as softness, comfort anddurability. There are various test methods for measuring fabric wrinkle andcrease recovery,13 it being possible to divide these into two broad categories,namely those which involve the insertion of a single sharp crease and thosewhich insert a family of largely random creases or wrinkles in the fabric. Inboth cases, the conditions of deformation, i.e., of wrinkle and crease insertion,as well as the conditions of recovery, are critically important and need to be
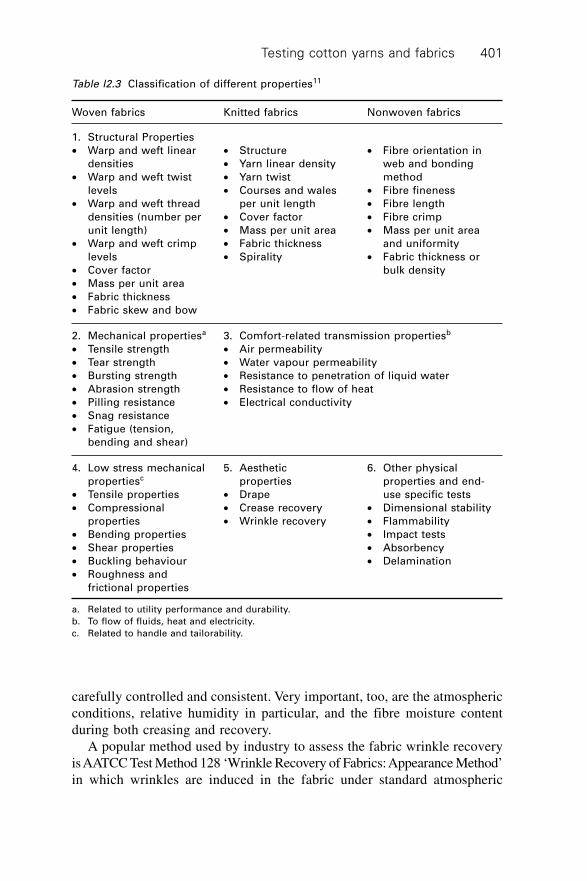
Testing cotton yarns and fabrics 401
carefully controlled and consistent. Very important, too, are the atmosphericconditions, relative humidity in particular, and the fibre moisture contentduring both creasing and recovery.
A popular method used by industry to assess the fabric wrinkle recoveryis AATCC Test Method 128 ‘Wrinkle Recovery of Fabrics: Appearance Method’in which wrinkles are induced in the fabric under standard atmospheric
Table l2.3 Classification of different properties11
Woven fabrics Knitted fabrics Nonwoven fabrics
1. Structural Properties
∑ Warp and weft linear ∑ Structure ∑ Fibre orientation in
densities ∑ Yarn linear density web and bonding
∑ Warp and weft twist ∑ Yarn twist method
levels ∑ Courses and wales ∑ Fibre fineness
∑ Warp and weft thread per unit length ∑ Fibre length
densities (number per ∑ Cover factor ∑ Fibre crimp
unit length) ∑ Mass per unit area ∑ Mass per unit area
∑ Warp and weft crimp ∑ Fabric thickness and uniformity
levels ∑ Spirality ∑ Fabric thickness or
∑ Cover factor bulk density
∑ Mass per unit area
∑ Fabric thickness
∑ Fabric skew and bow
2. Mechanical propertiesa 3. Comfort-related transmission propertiesb
∑ Tensile strength ∑ Air permeability
∑ Tear strength ∑ Water vapour permeability
∑ Bursting strength ∑ Resistance to penetration of liquid water
∑ Abrasion strength ∑ Resistance to flow of heat
∑ Pilling resistance ∑ Electrical conductivity
∑ Snag resistance
∑ Fatigue (tension,
bending and shear)
4. Low stress mechanical 5. Aesthetic 6. Other physical
propertiesc properties properties and end-
∑ Tensile properties ∑ Drape use specific tests
∑ Compressional ∑ Crease recovery ∑ Dimensional stability
properties ∑ Wrinkle recovery ∑ Flammability
∑ Bending properties ∑ Impact tests
∑ Shear properties ∑ Absorbency
∑ Buckling behaviour ∑ Delamination
∑ Roughness and
frictional properties
a. Related to utility performance and durability.
b. To flow of fluids, heat and electricity.
c. Related to handle and tailorability.

Cotton: Science and technology402
Table 12.4 The utility-value analysis graphics12
1st-level objective: long use of the shirt without losing its properties
2nd level objectives:
1. Fabric quality
1.1 The fabric should
not wrinkle easily
1.2 It should not pill
1.3 It should absorb
sweat
1.4 It should resist
stretching
1.5 It should not wear
out easily
Wrinkling angle (ISO 9867)
1.2.1 Pilling (ISO BS 5811–
1986)
1.3.1 Water penetration
(ISO 811–1992)
Tearing strength (BS
4304–1986)
1.5.1 Abrasion resistance
1.5.2 (BS 5690)
2. Sewing quality
3rd-level objectives:
2.1 The seams should
not open out
2.2 The seams should
not come off
Criteria
2.1.1 Seam slippage
(BS 3320)
2.2.1 Seam strength
(BS 3320)
3. Usage quality
3.1 The colours should
not fade after
washing
3.2 The colours should
not change in dry
cleaning
3.3 The colours should
not change in the
light
3.4 The colour purity
should be good
3.5 The size should not
change after
washing
3.6 The colours should
not pale after
ironing
3.7 The colours should
not change by
rubbing and should
not dye other
materials
3.8 The cloth should
not include toxic
materials
3.1.1 Colour fastness to
washing
(ISO 105 C06)
3.2.1 Colour fastness to
dry cleaning
(ISO D01)
3.3.1 Light fastness
(ISO 105 B02)
3.4.1 Dimensional stability
to washing
(DIN 53920)
3.5.1 Colour fastness to
ironing (ISO 105 B01)
3.6.1 Colour fastness to
perspiration
(ISO 105 EO4)
3.7.1 Colour fastness to
rubbing
(ISO 105 ¥ 12)
3.8.1 Aromatic amine test
(MAK Amin IIIA-1.2)

Testing cotton yarns and fabrics 403
conditions using a standard wrinkling device under a predetermined load fora prescribed period of time. The specimen is then reconditioned and rated forappearance by comparing it with three-dimensional reference standards(AATCC Wrinkle Recovery Replica). The viewing conditions are illustratedin Fig. 12.7. The same method has been adopted by the InternationalOrganisation of Standardisation (ISO 9867) and Japanese Industry.Nevertheless, this suffers from the disadvantage that it is subjective and thatfabric colour and pattern have a significant effect on the perception of wrinkles.Considerable research has led to the development of objective assessmenttechniques. Xiaobo et al.14 for example, reported on a new method basedupon computer vision (photometric stereo technology combined with ANFISadaptive neural fuzzy inference systems) for evaluating the fabric wrinklegrade objectively. Fan et al.15 have discussed various objective methods ofmeasuring and characterising wrinkle recovery, including stylus (contact),laser scanning and image analysis.
In the case of crease recovery testing (using, for example, a Shirley CreaseRecovery Tester) the fabric specimen (either wet or dry) is creased andcompressed under a specified load and atmospheric conditions for apredetermined period (e.g. 5 min) after which the load is removed and thespecimen allowed to recover, once again under specified conditions and time(e.g. 5 min), and the recovery angle (crease recovery angle) measured. Testmethods include AATCC 66, BS EN 22313, ISO 2313. This test is frequentlyused to assess durable-press and easy-care related properties of treated cottonfabrics.
Front2.40
Side0.62
Unit: m
Floor
2.3
5
2.2
Specimen
Standard forevaluation Lighting
lamp
1.8
5
0.64 0.16
5∞Viewingboard
12.7 Lighting equipment for viewing test specimens (source JISL1905: 2000).
1.5
0
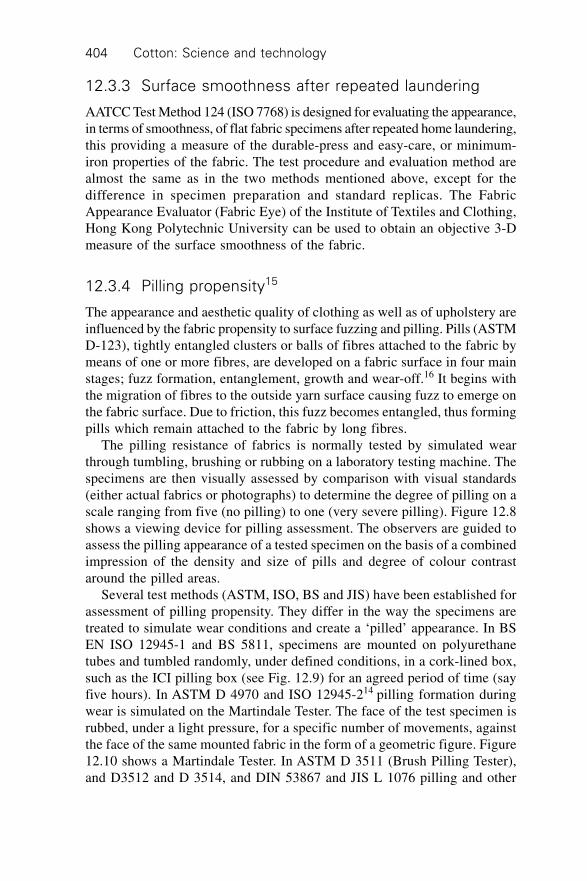
Cotton: Science and technology404
12.3.3 Surface smoothness after repeated laundering
AATCC Test Method 124 (ISO 7768) is designed for evaluating the appearance,in terms of smoothness, of flat fabric specimens after repeated home laundering,this providing a measure of the durable-press and easy-care, or minimum-iron properties of the fabric. The test procedure and evaluation method arealmost the same as in the two methods mentioned above, except for thedifference in specimen preparation and standard replicas. The FabricAppearance Evaluator (Fabric Eye) of the Institute of Textiles and Clothing,Hong Kong Polytechnic University can be used to obtain an objective 3-Dmeasure of the surface smoothness of the fabric.
12.3.4 Pilling propensity15
The appearance and aesthetic quality of clothing as well as of upholstery areinfluenced by the fabric propensity to surface fuzzing and pilling. Pills (ASTMD-123), tightly entangled clusters or balls of fibres attached to the fabric bymeans of one or more fibres, are developed on a fabric surface in four mainstages; fuzz formation, entanglement, growth and wear-off.16 It begins withthe migration of fibres to the outside yarn surface causing fuzz to emerge onthe fabric surface. Due to friction, this fuzz becomes entangled, thus formingpills which remain attached to the fabric by long fibres.
The pilling resistance of fabrics is normally tested by simulated wearthrough tumbling, brushing or rubbing on a laboratory testing machine. Thespecimens are then visually assessed by comparison with visual standards(either actual fabrics or photographs) to determine the degree of pilling on ascale ranging from five (no pilling) to one (very severe pilling). Figure 12.8shows a viewing device for pilling assessment. The observers are guided toassess the pilling appearance of a tested specimen on the basis of a combinedimpression of the density and size of pills and degree of colour contrastaround the pilled areas.
Several test methods (ASTM, ISO, BS and JIS) have been established forassessment of pilling propensity. They differ in the way the specimens aretreated to simulate wear conditions and create a ‘pilled’ appearance. In BSEN ISO 12945-1 and BS 5811, specimens are mounted on polyurethanetubes and tumbled randomly, under defined conditions, in a cork-lined box,such as the ICI pilling box (see Fig. 12.9) for an agreed period of time (sayfive hours). In ASTM D 4970 and ISO 12945-214 pilling formation duringwear is simulated on the Martindale Tester. The face of the test specimen isrubbed, under a light pressure, for a specific number of movements, againstthe face of the same mounted fabric in the form of a geometric figure. Figure12.10 shows a Martindale Tester. In ASTM D 3511 (Brush Pilling Tester),and D3512 and D 3514, and DIN 53867 and JIS L 1076 pilling and other
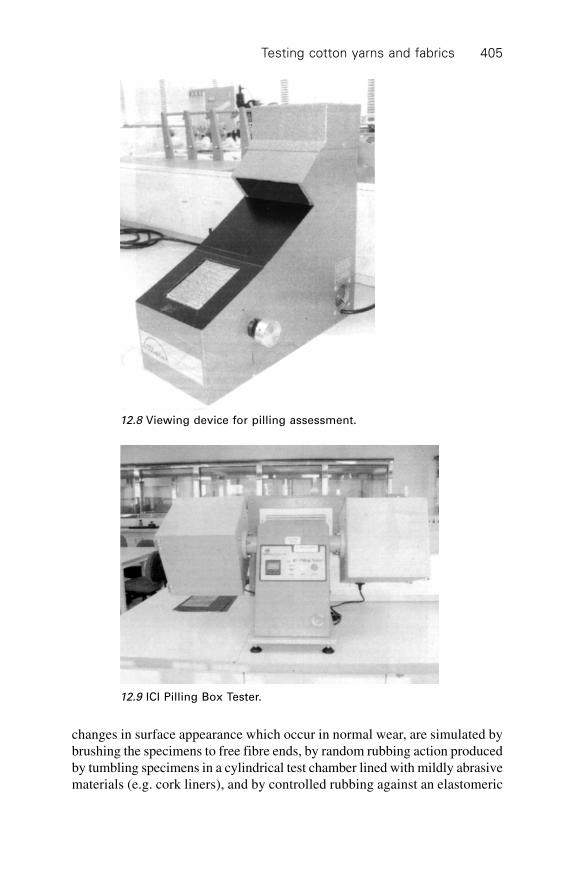
Testing cotton yarns and fabrics 405
changes in surface appearance which occur in normal wear, are simulated bybrushing the specimens to free fibre ends, by random rubbing action producedby tumbling specimens in a cylindrical test chamber lined with mildly abrasivematerials (e.g. cork liners), and by controlled rubbing against an elastomeric
12.8 Viewing device for pilling assessment.
12.9 ICI Pilling Box Tester.
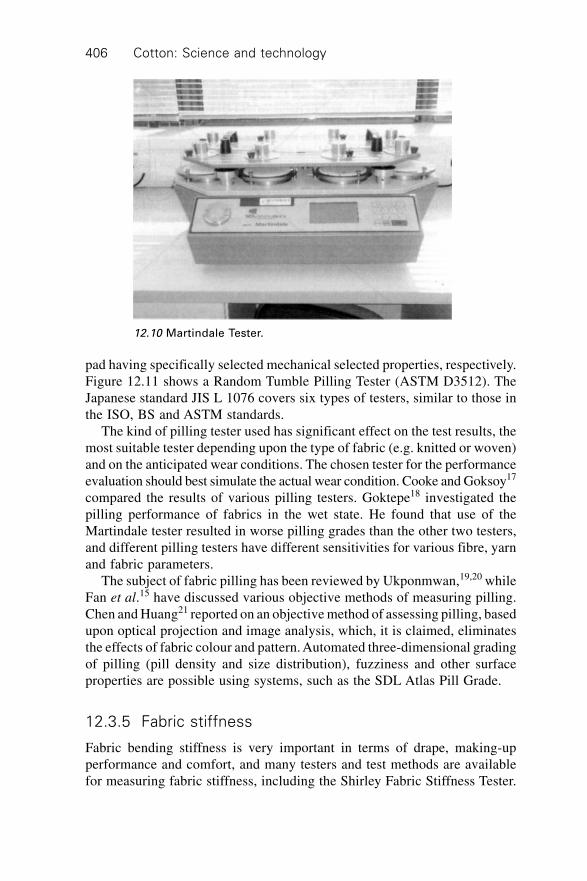
Cotton: Science and technology406
pad having specifically selected mechanical selected properties, respectively.Figure 12.11 shows a Random Tumble Pilling Tester (ASTM D3512). TheJapanese standard JIS L 1076 covers six types of testers, similar to those inthe ISO, BS and ASTM standards.
The kind of pilling tester used has significant effect on the test results, themost suitable tester depending upon the type of fabric (e.g. knitted or woven)and on the anticipated wear conditions. The chosen tester for the performanceevaluation should best simulate the actual wear condition. Cooke and Goksoy17
compared the results of various pilling testers. Goktepe18 investigated thepilling performance of fabrics in the wet state. He found that use of theMartindale tester resulted in worse pilling grades than the other two testers,and different pilling testers have different sensitivities for various fibre, yarnand fabric parameters.
The subject of fabric pilling has been reviewed by Ukponmwan,19,20 whileFan et al.15 have discussed various objective methods of measuring pilling.Chen and Huang21 reported on an objective method of assessing pilling, basedupon optical projection and image analysis, which, it is claimed, eliminatesthe effects of fabric colour and pattern. Automated three-dimensional gradingof pilling (pill density and size distribution), fuzziness and other surfaceproperties are possible using systems, such as the SDL Atlas Pill Grade.
12.3.5 Fabric stiffness
Fabric bending stiffness is very important in terms of drape, making-upperformance and comfort, and many testers and test methods are availablefor measuring fabric stiffness, including the Shirley Fabric Stiffness Tester.
12.10 Martindale Tester.
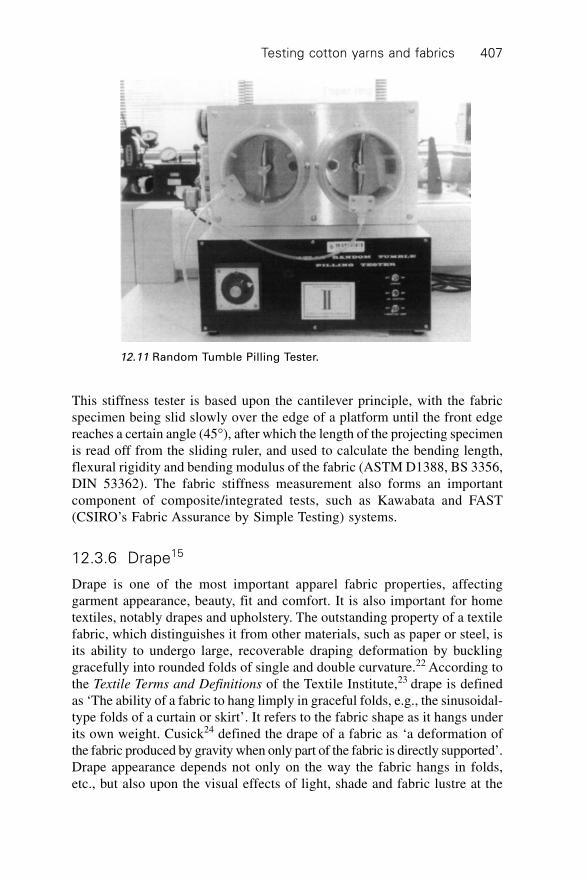
Testing cotton yarns and fabrics 407
This stiffness tester is based upon the cantilever principle, with the fabricspecimen being slid slowly over the edge of a platform until the front edgereaches a certain angle (45∞), after which the length of the projecting specimenis read off from the sliding ruler, and used to calculate the bending length,flexural rigidity and bending modulus of the fabric (ASTM D1388, BS 3356,DIN 53362). The fabric stiffness measurement also forms an importantcomponent of composite/integrated tests, such as Kawabata and FAST(CSIRO’s Fabric Assurance by Simple Testing) systems.
12.3.6 Drape15
Drape is one of the most important apparel fabric properties, affectinggarment appearance, beauty, fit and comfort. It is also important for hometextiles, notably drapes and upholstery. The outstanding property of a textilefabric, which distinguishes it from other materials, such as paper or steel, isits ability to undergo large, recoverable draping deformation by bucklinggracefully into rounded folds of single and double curvature.22 According tothe Textile Terms and Definitions of the Textile Institute,23 drape is definedas ‘The ability of a fabric to hang limply in graceful folds, e.g., the sinusoidal-type folds of a curtain or skirt’. It refers to the fabric shape as it hangs underits own weight. Cusick24 defined the drape of a fabric as ‘a deformation ofthe fabric produced by gravity when only part of the fabric is directly supported’.Drape appearance depends not only on the way the fabric hangs in folds,etc., but also upon the visual effects of light, shade and fabric lustre at the
12.11 Random Tumble Pilling Tester.

Cotton: Science and technology408
rounded folds of the fabric as well as on the visual effects of folding oncolour, design and surface decoration.25 A fabric is said to have good drapingqualities when it adjusts into folds or pleats under the action of gravity in amanner which is graceful and pleasing to the eye,26 the actual assessmentgreatly depending upon such factors as fashion, personal preference, humanperception, etc.
Drape is a complex combination of fabric mechanical and optical propertiesand of subjectively and objectively assessed properties. Furthermore, thereis frequently an element of movement, for example, the swirling movementof a skirt or dress, and therefore dynamic, as opposed to static, properties arealso involved. In recent years, therefore, a distinction has been made betweenstatic and dynamic drape.
Although drape is usually assessed subjectively, considerable researchhas been carried out with the view to its objective measurement, and to relatethe drape so measured to objectively measure fabric mechanical properties,notably bending and shear stiffness. The most widely adopted method is toallow a circular disc of fabric to drape into folds around the edges of asmaller circular platform or template. Such instruments are commonly referredto as ‘drapemeters’.
Cusick24,27 developed what has become known as Cusick’s drapemeter(Fig. 12.12)28 which has become the standard method of measuring drapecoefficient. It uses a parallel light source which causes the shape of thedraped fabric to be projected onto a circular paper disc. The drape of a fabricis popularly defined as the area of the flat annular ring covered by thevertical projection of the draped fabric expressed as a percentage of the arcof the flat annular ring of fabric, this being termed the drape coefficient.24 Inpractice, the contour of the fabric is often traced onto the paper and cut outfor weighing.29 Cusick29 defined the drape coefficient (DC%) as the weightof the paper of the drape shadow (W2) expressed as a percentage of the paperweight (W1) of the area of the full annular ring (Fig. 12.13).28 Test methodsinclude BS 5058/EN 9073. A measure of 100% on this instrument, indicatesa completely rigid (stiff) fabric while a value of 0% represents a completelylimp fabric, the values in practice ranging from about 30% for a loose, openweave rayon fabric to about 90% for a starched cotton gingham, and about95% for stiff nonwovens.30 Since different template sizes can be used, whichinfluence the drape coefficient, the diameter of the template must be giventogether with the drape result. Ideally, the template size should be such thatthe measured drape coefficient falls between 40 and 70%.
Table 12.5 gives drape coefficients given by Sudnik,31 using an improvedversion of Cusick’s drapemeter. Sudnik also concluded that the optimumdrape coefficient depends upon fashion and end-use. Typical examples of‘drapemeters’ include those of CUSICK, F.R.L., I.T.F. and the M.I.T. Drape-O-Meter. Other principles of drape measurement include the force to pull a

Testing cotton yarns and fabrics 409
Paper ring
Fabric
Transparent support
Supporting discs
Light source
Parabolic mirror
12.12 Cusick’s Drapemeter (source: Chung 1999).28
Table 12.5 Drape coefficients (%)31
End use Template A Template B Template C
(24) (30) (36)
Lingerie <80 <40 <20
Underwear 65–90 30–60 15–30
Dresswear 80–95 40–75 20–50
Suitings 90–95 65–80 35–60
Workwear, rainwear >95 75–95 50–85
Industrial >95 >95 >85
Source: Sudnik.31
12.13 Drape image (source: Chung 1999).28
Paper ring (W1)
Fabric shadow (W2)

Cotton: Science and technology410
circular fabric sample at a constant speed through a ring, the force beingtermed the ‘drape resistance’ of the fabric. Collier32 developed a digitaldrapemeter while Matsudaira et al.33 used an image analysis system to measurestatic and dynamic drape. Vangheluwe and Kiekens34 also used image analysis(video digital camera and computer-based image processing system) to measurethe drape coefficient, while Stylios et al.35 developed a new generation ofdrape-meters, enabling 3D static and dynamic drape to be measured bymeans of CCD camera as vision sensor. Image analysis enables manymeasurements to be made in a relatively short time.
Hunter and Fan15 have given a detailed review of drape, including itsprediction, dependence upon fabric bending and shear properties, as well asinternet-based and other modelling and dynamic, as opposed to static drape.Also included is the role of drape in 3D visualisation and CAD internetapparel systems. Various reviews on drape and related properties have beenpublished.15,30,36-40
12.3.7 Fabric objective measurement and handle15
Discerning and quality-conscious consumers require that their clothingsatisfy their requirements and expectations in terms of appearance, fit andcomfort, both when new and for an acceptable wear period thereafter.The clothing manufacturer, on the other hand, requires that the fabric is easyto tailor, passes through the making-up (garment manufacturing) processeasily and without undue problems and that the finished garment has a goodappearance. Traditionally, the quality of fabrics and ‘fitness for purpose’,including their performance during making-up (tailoring) and in thegarment, were assessed subjectively in terms of the fabric handle (referred toas fabric handle or hand), by experts (judges) in the clothing industry. Inassessing the fabric (e.g. AATCC Evaluation Procedure 5), these expertsused sensory characteristics, such as surface friction, bending stiffness,compression, thickness and small-scale extension and shear, all of whichplay a role in determining garment making-up (tailorability) and appearanceduring wear.
Because of the way handle was assessed, i.e. by tactile/touch/feel, and theterminology used, i.e., ‘fabric handle or hand’, it is sometimes incorrectlyassumed that the assessment was purely aimed at arriving at a subjectivemeasure of the fabric tactile-related properties (i.e. handle). In fact, in realitythe fabric handle, when so assessed by experts, provided a ‘composite’ measureof the overall garment-related quality of the fabric, including garment making-up, comfort, aesthetics, appearance and other functional characteristics (seeTable 12.1). Nevertheless, although such experts were highly skilled andtheir judgement sensitive and reliable, the end result was still subjective andqualitative by nature and suffered from the inherent weakness of all subjective
Testing cotton yarns and fabrics 411
assessments, being amongst other things dependent upon the skills, training,background (cultural and other) of the evaluator . In the light of the above,the need to develop an objective (i.e. instrument) measurement system forassessing fabric quality became apparent, fabric objective measurement (FOM)being such an integrated system of measurement. The FOM instrumentswere designed so as to measure the low deformation forces encounteredwhen the fabric is manipulated by hand and also during the garment making-up (tailoring) process and removes much of the guesswork from garmentmanufacturing. Two important FOM systems have appeared on the market,namely the Kawabata (KES-F and KES-FB) and CSIRO FAST (FabricAssurance by Simple Testing) systems.
It is largely the small-scale deformation properties, notably extensibility,shear stiffness, hysteresis, bending stiffness and hysteresis and lateralcompression that play a role in fabric making-up and appearance. Althoughoriginally developed essentially for wool and wool blend (worsted) fabrics,these systems are finding increasing application in other areas and fibres, forexample, cotton shirting fabrics. The reader is referred to Fan et al.15 for adetailed overview of the subject of FOM and to Yick et al.41 for details of itsapplication to cotton and cotton blend fabrics. Yick et al.41 concluding thatthe scientific basis for the application of fabric objective measurementtechniques (FAST and KES-F) can be extended to shirt production, enablingdifficulties during the manufacturing process to be predicted.
12.4 Colourfastness42
An important quality parameter of dyed and printed fabrics is the fastness ofthe colours (e.g. BS 1006, BS EN 20105), for example, to light, weathering,water (washing), chlorinated water (pool water), sea water, perspiration,rubbing, gas fumes, ozone and dry cleaning (e.g. AATCC TM 132 and ISO105-AO1), and various tests are used to measure colour fastness underconditions simulating those which the fabric is expected to encounter duringuse. Often the staining of or transfer of colour to, an adjacent (multifibre)fabric is measured together with the loss in colour of the test specimen, withstandard grey-scales commonly used as a means of assessment or colourchange can be measured instrumentally (AATCC 153 and ISO 150-A02). Onthe standard scale, five grades (5 to 1) are commonly used, 5 indicating novisible change and 1 substantial change. Eight grades (8 to 1) are commonlyused for light fastness, 8 representing the highest level of fastness.
12.4.1 Light (daylight)
This test is aimed at determining the potential change in colour when thefabric is exposed to daylight, ‘artificial’ or ‘simulated’ daylight, at different

Cotton: Science and technology412
temperatures and humidity, generally being used for testing purposes(AATCC 16, 177, 180, 181, ISO 105-BO1 and BO2. Test options includexenon-arc lamp (continuous or alternating light), carbon-arc (continuouslight) or daylight.
The test specimen is exposed, together with a standard specimen, and thecolourfastness assessed (rated) subjectively by comparing the colour change,using AATCC grey-scales under prescribed lighting and viewing conditions.Light fastness evaluation can also be done against a simultaneously exposedseries of AATCC Blue Wool Light Fastness Standards. Instrumental evaluation,using a spectrophotometer, is also possible.
12.4.2 Ozone
This test assesses the colourfastness to ozone in the atmosphere, under twodifferent sets of exposure, namely at room temperature and at a relativehumidity not exceeding 67% and at a higher temperature and relative humidity.In both cases, the test and control specimens are exposed to the ozone underthe pre-selected atmospheric temperature and relative humidity, until thecontrol specimen exhibits a change in colour corresponding to the standard,this cycle being repeated until a definite change in the colour of the testspecimen occurs or for a predetermined number of cycles. Examples of testmethods include AATCC 109 and 129 and ISO 105-G03
12.4.3 Rubbing (crocking)
The resistance to rubbing and cross-staining (colour transfer) of a colour canbe assessed under either wet or dry conditions using, for example, electronicor other crockmeters or rubbing fastness testers (BS 4655, BS 1006, ISO105, AATCC 8/165, AATCC 116, DIN EN ISO 105, JIS 0801, 0849, 1084).The fabric specimen is clamped on a base board, in such a way that nowrinkles are formed when rubbed against the rubbing device. There arevarious other rubbing and crockmeter testers and test methods as well aswhat is referred to as resistance to colour change due to flat abrasion (frosting),screen wire and emery (e.g. AATCC 119 and 120).
12.4.4 Water
The test specimen, backed by a multi-fibre test fabric, is immersed in waterat a specified temperature and for a specified time, occasional stirring ensuringcomplete wetting of the specimen. The specimen is then passed throughsqueeze rollers to remove excess liquor and placed between either glass orplastic plates in the perspiration tester under specified conditions of pressure,temperature and time. The specimen is heated in an oven and air-dried, after

Testing cotton yarns and fabrics 413
which the colour change and staining of the multi-fibre test fabric are assessed.Examples of test methods include DIN EN ISO 105-E01 and AATCC 107.
12.4.5 Chlorinated (pool) water
Tests, e.g., AATCC 162 and DIN EN ISO 105-E03, assess the fabriccolourfastness to chlorinated water, such as that which would be encounteredin a swimming-pool. The fabric specimen is agitated in a dilute chlorinesolution under pre-determined temperature, time, pH and water hardnessconditions. After drying, the specimen is assessed for colour change.
12.4.6 Seawater
The test measures the colourfastness of dyed or printed fabrics to seawater,using specially prepared (artificial) seawater of a specific composition.The test specimen, backed by a multi-fibre fabric, is soaked in theseawater solution, at room temperature, which is occasionally stirred.Squeeze rollers remove excess water from the specimen to bring its weightto within the required range, after which it is placed between glass or plasticplates in a perspiration tester. The change in the specimen fabric colour aswell as the staining of the multi-fibre test fabric provides a measure of thecolourfastness to seawater. Examples of test methods include DIN EN ISO105-E02, AATCC 106.
12.4.7 Domestic and commercial laundering
This test assesses colourfastness when the fabric undergoes domestic orcommercial laundering. Examples of test methods include DIN EN 105-C06, AATCC 61.
12.4.8 Perspiration
This test provides a measure of the colourfastness of a fabric to acid perspiration,such as could be encountered in the underarm areas of a shirt. The test, usingan AATCC perspiration tester, Perspirometer or other similar device, assessesthe colourfastness to acid perspiration. The test specimen is immersed in theperspiration solution which is occasionally stirred, after which the excesssolution is removed by squeeze rollers, so as to reduce the wet specimenweight. After this the fabric is placed between plates, subjected to the requiredpressure and dried at a raised temperature. The change in colour of the testspecimen is assessed after conditioning. Test methods include DIN EN ISO105-E04, AATCC 15.
Cotton: Science and technology414
12.4.9 Acids and alkalis
Specimens are steeped in, or spotted with, the required solutions and thentested for changes in colour with reference to the grey-scales (AATCC 6 andIS 105-E05 and E06).
12.5 Weathering test
Examples of accelerated weathering test instruments include the Weather-Ometer®, Fade-Ometer®, Xenotest® and Apollo Light and Weather FastnessTester (James Heal) enabling both weather fastness and light fastness to betested under controlled temperature and humidity conditions, water spraybeing included for weathering tests. Applicable test methods include:
∑ AATCC 111 and 186.∑ Fade-Ometer:® AATCC 16E, ASTM G 155 – cycle 4, ISO 105 B02/B06.∑ Weather-Ometer:® AATCC 16E, ASTM G 155 – Cycle 4, ISO 105 B02/
B04/B06.∑ Xenotest:® AATCC 16 Option H, ISO 105 B02/B04/B06.∑ Light-fastness testers (accelerated) e.g.,
– MercuryTungsten Lamp (BS 1006 UK/TN).– Xenon Arc Testers (BS 1006 UK/TN).
12.6 Dimensional stability
Excessive change, particularly shrinkage, in fabric dimensions can representa serious problem in virtually all textile applications, more particularly inclothing. Dimensional stability to laundering (washing), including drying,therefore forms an important quality and test requirement. Dimensional changehas been defined43 as a generic term for percentage changes in the length orwidth of a fabric specimen subjected to specific conditions.
Various test methods are used for testing the dimensional stability offabrics, the choice of test method often depending upon the particularapplication (end-use) of the fabric. Standardised washing machines and tests,to assess fabric or garment performance under repeated home launderingcycles, have been developed (e.g. AATCC 888C, 96, 124, 130, 135, 142,143, 150, 172 and 179). One example of a popular test method, whichincludes both washing and tumble drying (e.g. five cycles) is AATCC 135.44
An industry norm for such a test on cotton single jersey is, for example, nomore than 8% shrinkage in either length (wale) or width (course) direction.Automatic washing machines, such as the Whirlpool Washcator and theAATCC Launder-Ometer® (AATCC 61, 86, 132, 151 and 190), are speciallydesigned, constructed and programmed to carry out standard tests, such asBS EN 250 77/26 330 and ISO 5077/6330, DIN EN ISO 3759/26 330/

Testing cotton yarns and fabrics 415
25 077). More recently, accelerated washing and drying tests (in somethinglike 15 minutes, e.g. Quickwash PlusTM system) and the rapid measurementof shrinkage have been introduced, these tests also enabling colour fastness,pilling and finish durability to be measured (e.g. AATCC 187). Systems forautomatically measuring fabric dimensional change have also been developed(e.g. Vision and QuickviewTM).
The actual changes in fabric dimensions during a test depend upon anumber of factors, including the following:
∑ test medium (liquor), for example, solvent or water, more usually thelatter
∑ liquor to goods ratio∑ type and severity of mechanical agitation∑ liquor temperature∑ number of cycles∑ method of drying, for example, line drying, flat drying or tumble drying,
the latter generally causing the largest change in dimensions.
12.7 Abrasion resistance
12.7.1 Introduction
The useful life (wear durability) of a textile product is, in many cases, themost important quality factor and property to estimate, by means of laboratorytests. Many studies have been undertaken in an attempt to do so, and thesehave been discussed.43–50 During its use, whether it be in apparel, hometextiles or industrial textiles, a fabric can be subjected to various mechanical/physical (e.g. rubbing and flexing) actions and chemical actions which leadto changes in the fabric appearance and functionality and ultimately to it nolonger being acceptable, either from an appearance or functional point ofview. Various laboratory instruments and test methods, particularly fabricabrasion resistance, have been developed over many decades in an attemptto simulate, or at the very least estimate, wear performance and durability.Many of these have for various reasons, been discontinued, it being notoriouslydifficult to simulate the great variety and complexity of the conditions whicha fabric experiences in the diversity of possible end-use applications.Nevertheless, testing of abrasion resistance has remained an important measureof fabric durability since abrasion is one of the main factors involved infabric wear and failure.
Abrasion during use not only contributes to the failure of the fabric, it alsocontributes to changes in fabric appearance, such as fuzzing, pilling andfrosting (colour change), as well as to changes in fabric performance properties,long before mechanical fracture or rupture occurs. Frequently the consumerwill consider a fabric to have reached the end of its useful life on the basis

Cotton: Science and technology416
of such properties rather than on the basis of fabric mechanical failure,such as tearing, rupturing, etc. It is, however, generally not possible todraw a meaningful conclusion on the expected wear life (durability) of afabric based upon abrasion resistance only. During laundering, for example,both chemical and mechanical actions (damage) are involved in the fabricwear or damage.
One or more of three forms of abrasion occur most frequently, namely flat(or surface) abrasion, edge abrasion and flex (bending) abrasion. In practice,flat abrasion occurs as a result of a rubbing action of the fabric surface,either against itself or against another surface, the latter could be one ormore of many widely different materials. Edge abrasion, sometimes alsoreferred to as cuff abrasion, frequently takes place at collars and cuffs, andcan be a combination of flat and flex abrasion. Flex abrasion mostly occursas a result of flexing and bending during use, sometimes this also occurringover a sharp edge. It is also referred to as internal abrasion, where fibres rubagainst fibres or yarn against yarn within the fabric, although sometimes anexternal object, such as a sharp edge, is also involved, fabric surface propertiesand lubrication greatly affecting flex abrasion results.
Most abrasion test instruments and methods attempt to provide a measureof one or more of these three different types of abrasion. In practice, however,the fabric may be subjected to all three forms of abrasion. Stoll,46 for example,stated the wear of army uniforms comprised 30% plane (flat) abrasion, 20%edge and projection abrasion, 20% tear and 10% other mechanical actions.He defined a wear index (WI) as follows: WI = 0.50 (flex abrasion) + 0.20(flat abrasion) + 0.30 (tear resistance). Elder45 suggested the following forwear resistance (WR): WR = 0.3 (flat abrasion) + 0.2 (edge abrasion) + 0.3(flex abrasion) + 0.2 (tear resistance). Not only does the abrasion resistanceor durability of a garment or other textile product depend upon the propertiesof the fabric but it also depends upon the conditions it encounters duringwear (even the fit of a garment in the case of apparel).
In the main, three components are involved during abrasion, namely fibrebreakage or cutting, fibre removal and fibre attrition (or mechanical breakdownof the individual fibres, e.g. fibrillation), with the first-mentioned two generallythe main components of fabric failure. The abrasion resistance of the fabricis in practice quantified by the number of cycles required to produce eithera hole or a certain loss in strength or weight, change in colour (appearance),change in air permeability or a change in thickness.
∑ flat (or relatively flat) abrasion (usually the fabric is rubbed against afabric or other abradent, such as emery paper, under different pressures)
∑ flex abrasion∑ combination of flat and flex abrasion.
Testing cotton yarns and fabrics 417
12.7.2 Flat abrasion
Flat abrasion test results are greatly dependent upon variations in fabricsurface smoothness (including fabric structure) and friction, fabric thicknessand yarn diameter as well as on the ability of the fibres themselves to withstandmechanical forces. Flat abrasion tests therefore tend to provide a betterindication of wear performance in applications, such as upholstery and carpets,where the main wear action is a rubbing one, on the surface of the fabric heldin a flat position.
Examples of flat abrasion testers include Martindale (ASTM D4966, BS5690), Stoll (ASTM D3885 and D3880), Taber (ASTM D3884) and Schiefer(ASTM D4158). Probably one of the most popular flat abrasion testers is theMartindale Abrasion Tester (Fig. 12.10), also used for testing pilling propensity,in which a test specimen is rubbed against an abradant (usually an abradantfabric) at pre-determined pressure in a continuously changing direction.Rubbing is continued either for a pre-set number of cycles after which themass loss and change in appearance are determined or else it is continueduntil a pre-defined end point is reached, for example, until two fabric threadsare ruptured or a hole is formed; as per ASTM 4966 and 4970, BS 3424/5690, BS EN 530, BS EN ISO 12947 – 1, – 2, –3 and –4, ISO 5470 (rubberor plastic coated fabric) and JIS L 1096.
12.7.3 Edge abrasion
Edge abrasion takes place when the wear or abrasion occurs along the fabricedge, generally a folded edge, such as in the edge or fold of the collar of ashirt or the cuff of a sleeve. Tests include the AATCC ‘Accelerotor’, a rapidtumble test where the sample is folded and stitched prior to testing to accentuateabrasion of edges and laundering and tumble-drying of mock trouser cuffs.Evaluation of the fabric can then be done visually.
12.7.4 Flex abrasion
The Stoll-Flex Abrasion Tester applies uni-directional abrasion to a tensionedstrip of fabric drawn over an abrasion bar, the fabric being bent or flexed asit is rubbed against (over) the bar (ASTM D3885).
12.7.5 Tumble abrasion
Tumble abrasion, such as that occurring in the AATCC ‘Accelerotor’ test,tends to correlate best with that occurring in the use and laundering ofsheets. AATCC Accelerotor (AATCC 93) is used for both wet and dry abrasion,samples being tumbled in a circular cylinder, lined with an appropriate abrasion
Cotton: Science and technology418
material, a rapidly rotating impeller/propeller shaped rotor creating the tumblingaction, beating the sample against the drum wall.
12.8 Fabric strength
Fabric strength is generally regarded as one of the main propertiesdetermining wear performance and durability, although it is more importantin applications such as upholstery, sheeting and shirting material and industrialtextiles than in apparel textiles. Even if strength is not a specific requirementfor a certain end-use, for example in knitwear, such as cardigans, it isnonetheless still often used as a measure of fabric quality and deteriorationduring use. In the main, three types of strength tests are carried out, namelytensile, bursting, and tear, the specific test selected in practice dependingupon both the type of fabric (for example knitted or woven) and theintended end-use. Other tests carried out include the peel strength of bondedor laminated fabrics.
12.8.1 Tensile strength
Tensile testing refers to those cases where the force (load) is applied uni-directionally, usually on a strip of fabric, for example in either the warp orweft direction in the case of a woven fabric. The test could either be aravelled strip test (ASTM D5035) or grab test (ASTM D5034), carried outon what are generally referred to as ‘universal testers’ e.g., Instron, Micro-CX, Statimat M or ME, which enable the fabric extension (elongation) atbreak, elastic recovery, etc., to be measured as well. They generally operateon the constant rate of extension principle, with the rate of extension variableaccording to the test method and the requirements. Test methods includeASTM E-4, D5034, BS 1610/0.5, BS 2576, BS EN 10002-2, DIN 51221/1,DIN ISO BS EN 13934-1.
12.8.2 Bursting strength
Bursting strength represents a composite and simultaneous measure of thestrength of the yarns in all directions (biaxial) when the fabric is subjectedto bursting type forces, applied by a ball or elastic diaphragm. In certainapplications, such as in parachutes, filters and bags, the bursting strength ofa fabric (woven, knitted or non-woven) is important. The fabric specimen,usually circular in shape, is usually securely clamped over an elastic (rubber)diaphragm in a ring (annular) clamp and subjected to a hydraulic load, thepressure required to burst the fabric being recorded (ASTM D3786 andD3787, BS 3424-38 and BS 4768, and ISO 2758/2759/3303/3689).
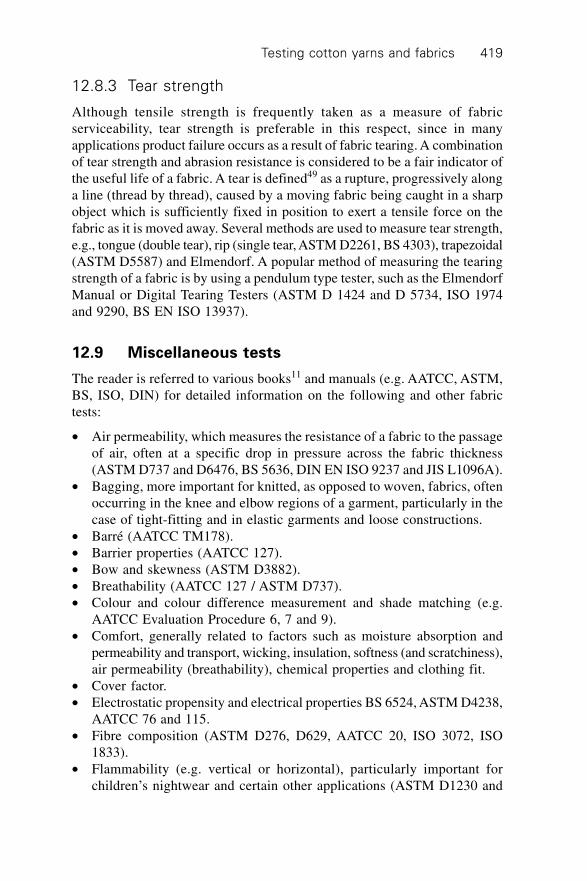
Testing cotton yarns and fabrics 419
12.8.3 Tear strength
Although tensile strength is frequently taken as a measure of fabricserviceability, tear strength is preferable in this respect, since in manyapplications product failure occurs as a result of fabric tearing. A combinationof tear strength and abrasion resistance is considered to be a fair indicator ofthe useful life of a fabric. A tear is defined49 as a rupture, progressively alonga line (thread by thread), caused by a moving fabric being caught in a sharpobject which is sufficiently fixed in position to exert a tensile force on thefabric as it is moved away. Several methods are used to measure tear strength,e.g., tongue (double tear), rip (single tear, ASTM D2261, BS 4303), trapezoidal(ASTM D5587) and Elmendorf. A popular method of measuring the tearingstrength of a fabric is by using a pendulum type tester, such as the ElmendorfManual or Digital Tearing Testers (ASTM D 1424 and D 5734, ISO 1974and 9290, BS EN ISO 13937).
12.9 Miscellaneous tests
The reader is referred to various books11 and manuals (e.g. AATCC, ASTM,BS, ISO, DIN) for detailed information on the following and other fabrictests:
∑ Air permeability, which measures the resistance of a fabric to the passageof air, often at a specific drop in pressure across the fabric thickness(ASTM D737 and D6476, BS 5636, DIN EN ISO 9237 and JIS L1096A).
∑ Bagging, more important for knitted, as opposed to woven, fabrics, oftenoccurring in the knee and elbow regions of a garment, particularly in thecase of tight-fitting and in elastic garments and loose constructions.
∑ Barré (AATCC TM178).∑ Barrier properties (AATCC 127).∑ Bow and skewness (ASTM D3882).∑ Breathability (AATCC 127 / ASTM D737).∑ Colour and colour difference measurement and shade matching (e.g.
AATCC Evaluation Procedure 6, 7 and 9).∑ Comfort, generally related to factors such as moisture absorption and
permeability and transport, wicking, insulation, softness (and scratchiness),air permeability (breathability), chemical properties and clothing fit.
∑ Cover factor.∑ Electrostatic propensity and electrical properties BS 6524, ASTM D4238,
AATCC 76 and 115.∑ Fibre composition (ASTM D276, D629, AATCC 20, ISO 3072, ISO
1833).∑ Flammability (e.g. vertical or horizontal), particularly important for
children’s nightwear and certain other applications (ASTM D1230 and

Cotton: Science and technology420
D4372, BS EN 13772, D5132,BS 5438,5722,5866, 5867,6249 and 6341,DIN 75200, DIN 66080 and ISO 6940 and 6941).
∑ Light fastness testers (accelerated) e.g.:– mercury-tungsten lamp (BS 1006 UK/TN).– xenon arc testers (BS 1006 UK/TN).
∑ Mass (weight) per unit area (e.g. BS 2471, BS 2866, ASTM D3776).∑ Mildew and rot resistance (AATCC 30, BS 6085).∑ Moisture content (ASTM D2654, D4920).∑ Oeko-Tex 100, global certification scheme, for textiles which are not
harmful to health and environment (www.oeko-tex.com).∑ Perspiration test (AATCC), used to measure fabric colour fastness to
water and perspiration (AATCC 15, 106 and 107, BS 1006, BS EN 20105and DIN EN ISO 105-E04).
∑ Seam failure/strength (ASTM D1683).∑ Seam slippage (ASTM D434, D4033 and D4034).∑ Seam smoothness (AATCC 88B / 88C, ISO 7770).∑ Sett (e.g. BS 2862, DIN 53 853, ASTM D3775).∑ Sewing damage (ASTM D1908).∑ Shearing (shear being one of the important factors affecting fabric drape)
and making-up (tailoring performance).∑ Snagging, mostly important for fabrics, particularly knitted fabrics with
a raised surface, containing continuous filament yarns (ASTM D5362and D3939).
∑ Soiling.∑ Spirality, mostly a problem in single jersey fabrics, knitted from twist
lively (usually highly twisted) yarns (ISO/CD 16322-1).∑ Stiffness, important in determining fabric drape and handle and generally
measured by the cantilever method (e.g. Shirley Bending Stiffness Tester)and incorporated in more comprehensive testing systems, such as Kawabataand FAST.
∑ Stretch and elastic recovery.∑ Thermal resistance and transmission (ASTM D1518, BS 4745).∑ Thickness test, various testers and test methods are available for testing
fabric thickness under different pressures and pressure plate/foot of differentsizes (ASTM D1777, BS 3424, ISO 3616/5084/9073).
∑ UV protection (AATCC 183, ASTM D6603-00, 6544-00, EN 13758, AS/NZS 4399).
∑ Water absorption (BS 3449).∑ Water penetration resistance under pressure, or hydrostatic head tester
(AATCC 127, BS EN 20811/3321/3424-24, ISO 811).∑ Water repellency rain test, used to measure the fabric resistance to simulated
rain, when the fabric is rubbed and rotated, the amount of water absorbedby the fabric specimen, determined by the increase in specimen weight,

Testing cotton yarns and fabrics 421
providing a measure of water penetration (BS/DIN EN 29865 and ISO9865). Certain tests (e.g. AATCC Rain Tester) enable the resistance offabrics to water penetration at different water impacts, simulating rain, tobe measured (AATCC 35 and 42, BS EN 20811). The WIRA ShowerTester (BS 5066) is also used to measure the fabric water absorption andpenetration of a fabric when subjected to an artificial shower. WaterRepellency (Spray) Test (AATCC TM 22 and ISO 4920) measures theresistance of a fabric to wetting by water.
∑ Water vapour permeability (BS 7209).∑ Weathering which attempts to simulate the exposure of a fabric to sunlight
(using fluorescent UV lamps), rain and dew, the fabric is exposed tocycles of light and moisture at elevated temperatures, water spray systemsalso being incorporated (ASTM D4329, JIS D0205, SAE Society ofAutomotive Engineers J2020).
∑ Weave (e.g. DIN EN 1049-02).∑ Wettability (BS EN 24920, BS 4554).∑ Whiteness (AATCC 110).∑ Yarn Crimp (ASTM D3883, BS 2863).
12.10 General
The following reviews and books relevant to this chapter have appeared:
∑ drape15,30,36-40
∑ pilling19,20,36
∑ abrasion and wear43,44,45,47,49,50
∑ consumer studies10
∑ fabric surface wear48
∑ general2,11,15,52
∑ wrinkling13
∑ stiffness and shearing37,38,39
∑ fabric strength50,53,54
∑ fabric quality assessment9,51
∑ UV protection55
∑ yarn irregularity3,4
∑ yarn hairness6.
12.11 Conclusions
Further technological developments in the area of yarn and fabric testing canbe expected to focus on the following:
∑ on-line monitoring and testing∑ integrated testing

Cotton: Science and technology422
∑ instrument measurement of yarn and fabric appearance-related properties∑ knowledge-based systems (e.g. expert and artificial neural network systems)
for prediction, diagnostic and trouble-shooting purposes∑ internet-based standard test methods and benchmark and reference values
and standards, also electronically linked to on-line and off-line testingsystems.
12.12 References
1. Slater, K., Subjective Textile Testing, J. Text. Inst., 1997, 88, Part 1, (No. 2), 79.2. Slater, K., Physical Testing and Quality Control, Text. Prog., 1993, 23, Nos 1/2/3.3. Basu, A., Unevenness of Yarns and Preparatory Materials, Part I: Concepts and
Causes, Asian Text. J., March, 1999, 34.4. Slater, K., Yarn Evenness, Text. Prog., 1986, 14, Nos 3/4.5. Martindale, J.G., A New Method of Measuring the Irregularity of Yarns with Some
Observations of the Origins of Irregularities in Worsted Slivers and Yarns, J. Text.
Inst., 1945, 36, T35.6. Barella, A. and Manich, A.M., Yarn Hairiness: A Further Update, Text. Progr., 2001,
31(4).7. Weissenberger, W., Yarn and Fabric Quality Requirements in the Weaving Shed,
Text. Techn. Int., 1994, 113.8. De Boos, A.G., ‘The Objective Measurement of Finished Fabric’, in Brady, PR (ed.),
Finishing and Wool Fabric Properties, A Guide to the Theory and Practice of Finishing
Woven Wool Fabrics, CSIRO, IWS, 1997, 44.9. Nimkar, U., Phalgumani, G.R., Varadarajan, S. and Bhajekar, R., Quality Control in
Textile and Clothing Industries, Colourage, Feb., 2001, XLVII.10. Jacob, M. and Subramaniam, V., A Review on Consumer Studies, Colourage, 1987,
34(23), 27.11. Kothari, V.K., Progress in Textiles: Science and Technology, Vol. I Testing & Quality
Management, IAFL Publications, 1999.12. Özcan, G., Product Evaluation in Textile and Exchange Value, ITB Int., Text. Bull.,
2003, No. 1, 50.13. Smuts, S., A Review of Wrinkling of Wool and Wool/Polyester Fabrics, South African
Wool & Text. Res. Inst. CSIR TexReport No. 1, July, 1989.14. Xiaobo, Y., Honggang, B. and Xiubao, H., Computer Vision Assessment of Fabric
Wrinkle Grade, Proc. Text. Inst. 83rd World Conf., May, 2004, 1392, Shanghai,China.
15. Fan, J., Yu, W. and Hunter, L., Clothing Appearance and Fit: Science and Technology,Woodhead Publishing Ltd., 2004.
16. Cooke, W.D., Pilling Attrition and Fatigue, Text. Res. J., 1985, 55(7), 409.17. Cooke, W.D. and Goksoy, M., Problem of Predicting Pilling Performance Using
Laboratory Test Method, Mell. Textilber., Eng. Ed., 1988, 69(4), 250, (E 34).18. Goktepe, O., Fabric Pilling Performance and Sensitivity of Several Testers, Text.
Res. J., 2002, 72(7), 625.19. Ukponmwan, J.O., Appraisal of Woven Fabric Performance, Text. Res. J., 1987,
57(8), 445.20. Ukponmwan, J.O., Mukhopadhyay, A. and Chatterjee, K.N., Text. Progr., 1998,
28(3).
Testing cotton yarns and fabrics 423
21. Chen, X. and Huang, X. Objective Assessment of Fabric Pilling Based on LightProjection and Image Analysis, Proc. Text. Inst. 83rd World Conference, 2004, 1275,China.
22. Stump, D.M. and Fraser, W.B., A Simplified Model of Fabric Drape Based on RingTheory, Text. Res. J., 1966, 66(8), 506.
23. Textile Terms and Definitions, (eleventh edition), Manchester, Textile Institute, 2002.24. Cusick, G.E., The Dependence of Fabric Drape on Bending and Shear Stiffness, J.
Text. Inst., 1965, 56, T596.25. Bishop, D.P., Fabrics: Sensory and Mechanical Properties: Textile Progress (Vol.
26, No. 3), Woodhead Publishing, 1996.26. Chu, C.C. Hamburger, W.J. and Platt, M.M., Determination of Factors which Influence
the Draping Properties of Cotton Fabrics, USDA ARS, Feb., 1963.27. Cusick, G.E., The Resistance of Fabrics to Shearing Forces, J. Text. Inst., 1961, 52,
T395.28. Chung, J., The Effect of Assembly Methods of a Garment on Fabric Drape, PhD
Thesis, Institute of Textiles and Clothing, The Hong Kong Polytechnic University,Jan., 1999.
29. Cusick, G.E., The Measurement of Fabric Drape, J. Text. Inst., 1968, 59, 253.30. Hu, J. and Chan, Y.F., Effect of Fabric Mechanical Properties on Drape, Text. Res.
J., 1998, 68(1), 57.31. Sudnik, Z.M., Objective Measurement of Fabric Drape: Practical Experience in the
Laboratory, Text. Inst. Ind., Jan., 1972, 10, 14.32. Collier, B.J., Measurement of Fabric Drape and Its Relation to Fabric Mechanical
Properties and Subjective Evaluation, Cloth. Text. Res. J., 1991, 10(1), 46.33. Matsudaira, M., Yang, M., Kinari, T. and Shintaku, S., Polyester ‘Shingosen’ Fabrics
Characterised by Dynamic Drape Coefficient with Swinging Motion, Text. Res. J.,
2002, 72(5), 410.34. Vangheluwe, L. and Kiekens, P., Time Dependence of the Drape Coefficient of
Fabrics. Int. J. Cloth. Sci. Technol., 1993, 5(5), 5.35. Stylios, G., Wan T.R. and Powell, N.J., Modelling the Dynamic Drape of Garments
on Synthetic Humans in a Virtual Fashion Show, Int. J. Cloth. Sci. Technol., 1996,8(3), 95.
36. Jacob, M. and Subramaniam, V., A Review of the Literature on Drape and PillingProperties of Textile Fabrics, Colourage, 8 Jan., 1987, 34(1), 21.
37. Subramaniam, V., Bending Properties of Textile Structures I, II and III, Indian Text.
J., Dec., 1980, 91(3), 93, Jan., 1981, 91(4), 95, Feb., 1981, 91(5), 87.38. Subramaniam, V., Non-linear Bending of Textile Materials, Man-made Text. India,
1981, 24(8), 409.39. Subramaniam, V., Chanchal, B., Vatsala, R. and Rajendran, B., Shearing Properties
of Fabrics – A Review, Part I: Test Methods, Man-Made Text. India, 1983, 26(6),259.
40. Anon., Fabric Drape (A Review), IWS F.A.C.T. Technical Information Letter, March,1981, 9.
41. Yick, K-L., Cheng, K.P.S., Dhingra, R.C. and How, Y.L., Material ObjectivelyMeasured, Text. Asia, Nov., 1995, 26, 65.
42. Sayed, U., and Pratap, M.R., Textile Testing: A Must for Production of QualityGoods – Part I. Colourage, March, 2002, 49, 19.
43. Jacob, M. and Subramaniam, V., A Review of the Literature on Durability Studies ofFabrics, Colourage, 1987, 34(5), 21.

Cotton: Science and technology424
44. Jacob, M. and Subramaniam, V., A Review of Literature on Wear Studies, Colourage,
April, 1988, 35, 17.45. Elder, H.M., Wear of Textiles, J. Consumer Studies Home Economics, Blackwell
Scientific Publ., 1978, 2, 1.46. Stoll, R.G., An Improved Mulipurpose Abrasion Tester and its Application for the
Evaluation of the Wear Resistance of Textiles, Text. Res. J., 1949, 19, 394.47. Galbraith, R.L., Abrasion of Textile Surfaces, Chapter 5, in Surface Characteristics
of Fibers and Textiles (ed. Schick, M. J.), 1975, page 193, Marcel Dekker, Inc. NewYork.
48. Sirikasemlert, A., Xiaoming, T. and Dhingra, R.C., Superficial Performance,Characterisation of the Surface Behaviour of Fabrics During Simulated Wear, Text.
Asia, March, 1996, 27, 73.49. Higginbotham, R.S., Deterioration of Textiles in Use, Textiles, 1976, 5, 40.50. Taylor, H.M., Wear testing – an appraisal of the more significant methods and
related equipment, Text. Month, June 1980, 71.
51. Vatsala, R. and Subramaniam, V., Assessment of Fabric Quality – Part I, Text. Dyer
Printer, 1991, 21 Aug., and Part II, 1992, 4 March, 23.52. Matsuo, T. and Suresh, M.N., The Design Logic of Textile Products, Text. Progr.,
1997, 27 (3).53. Ukponmwan, J.O., Fabric Strength, Colourage, June, 1990, 37, 19.54. Scelzo, W.A., Backer, S. and Boyce, M.C., Mechanistic Role of Yarn and Fabric
Structure in Determining Tear Resistance of Woven Cloth, Part I: UnderstandingTongue Tear, Text. Res. J., 1994, 64(5), 291.
55. Hatch, K.L., Solar Ultraviolet Protection Clothing: What’s Behind the Label? AATCC
Review, 5(8), Aug. 2005, 31.
425
13.1 Introduction
World cotton production and consumption are trending higher, and the industryis being transformed by new technologies, including biotechnology. Worldcotton production reached 26 million tons in 2004/05, and biotech varietiesaccounted for about one-third. The average cost of cotton production varieswidely across countries, but the cost of production for most producers isbetween 50 and 60 US cents per pound. While per capita consumption ofcotton at the retail level is highest in developed countries, the strongestgrowth in both retail consumption and mill use of cotton is occurring indeveloping countries, particularly China (mainland), India and Pakistan.
The elimination of quotas as of January 2005 that limited trade in textilesand apparel for more than 30 years is leading to a shift in textile and apparelproduction toward China and other low-income producing countries, and thecotton industry is benefiting from increased consumption caused by lowerretail prices of textile and apparel products. However, substantial distortionscaused by government measures still exist in the market for cotton itself.International cotton prices have declined in real terms over the last six decadesbecause of advances in technology, and this process is continuing. Duringthe 1970s, 1980s and 1990s, the average world price of cotton was 70 centsper pound, but the average international price during the current decade isexpected to be between 50 and 60 cents per pound, in line with the costs ofproduction for most producers. See the appendix on pages 256–9 for a tableshowing cotton supply and use since the 1920s.
13.2 The economic importance of cotton
Cotton is one of the most important and widely produced agricultural andindustrial crops in the world. Cotton is grown in more than 100 countries onabout 2.5% of the world’s arable land, making it one of the most significantin terms of land use after food grains and soybeans. Cotton is also a heavily
13Controlling costs in cotton production
T . T O W N S E N D, International Cotton AdvisoryCommittee, USA

Cotton: Science and technology426
traded agricultural commodity, with over 150 countries involved in exportsor imports of cotton.
More than 100 million family units are engaged directly in cotton production.When family labor, hired-on farm labor and workers in ancillary servicessuch as transportation, ginning, baling and storage are considered, totalinvolvement in the cotton sector reaches an estimated 350 million people. Italso provides employment to additional millions in allied industries such asagricultural inputs, machinery and equipment, cottonseed crushing and textilemanufacturing. Cotton cultivation contributes to food security and improvedlife expectancy in rural areas of developing countries in Africa, Asia andLatin America. Cotton played an important role in industrial developmentstarting in the 17th century and continues to play an important role today inthe developing world as a major source of revenue. The value of 26 milliontons of world cotton production in 2004/05 at an average world price of 52cents per pound of lint, or $1.15 per kilogram, was $30 billion.
Cotton, unique among agricultural crops, provides food and fiber. A cellulosicfiber about 96% pure, cotton is one of the world’s most important textilefibers, accounting for more than half of all the fibers used in clothing andhousehold furnishings. Cotton is also used in industrial fabrics, and the by-products derived from cottonseed and stalks provide edible oil for humanconsumption and soap, industrial products, firewood and paper and highprotein animal feed supplements. Cotton oil is the fifth largest edible oilconsumed in the world.
13.3 Production
The world cotton industry has experienced dramatic changes over the lastfive decades as production nearly quadrupled, rising from 6.6 million tons in1950/51 to a record of 26.3 million tons in 2004/05 (Fig. 13.1). The averageannual rate of growth in world production over the last five decades has beenabout 2.5% per year. Growth in cotton production was steady during the1950s and 1960s but slowed during the 1970s because of slower worldeconomic growth and limited gains in cotton yields. World cotton productionexploded from 14 million tons in the early 1980s to 19 million tons in 1984/85, as market incentives and the widespread use of better seed varieties andbetter methods of plant protection led to increased yields. World productionclimbed to a record of nearly 21 million tons in 1991/92 but leveled offduring the 1990s. With the commercial application of biotech cotton varietiesbeginning in 1996 and the expansion of cotton areas in Francophone Africa,Australia, central Brazil, western China, and Turkey, world production climbedto 26.2 million tons in 2004/05. The main cotton producers since the early1980s are shown in Fig. 13.2.
World area dedicated to cotton has fluctuated since 1950/51 between 28million hectares and 36 million hectares (Figs. 13.3 and 13.4). While there

Controlling costs in cotton production 427
1950/51 1960/61 1970/71 1980/81 1990/91 2000/01
30
25
20
15
10
5
0
Mil
lio
n t
on
s
13.1 World cotton production.
1950/51 1960/61 1970/71 1980/81 1990/91 2000/01
39
37
35
33
31
29
27
25
Mil
lio
n h
ecta
res
13.3 World cotton area.
China USA India Pakistan
8
6
4
2
01980/81 1985/86 1990/91 1995/96 2000/01 2005/06 2010/11
13.2 Main cotton producers.
Mil
lio
n t
on
s

Cotton: Science and technology428
have been dramatic reductions in cotton area in some regions since the1950s, particularly in the USA, North Brazil and North Africa, there havebeen equally dramatic increases in Francophone Africa, Australia, China,India, Pakistan and the Middle East. With total area showing no tendency torise, all the growth in world cotton production since the 1940s came fromimproved yields. The world cotton yield 50 years ago was 230 kilograms oflint per hectare. Yields rose steadily at an average rate of more than 2% peryear during the 1950s and 1960s, and then grew more slowly from the mid-1970s until the mid-1980s. During the 1980s the world cotton yield rosedramatically and reached a record of nearly 600 kilograms per hectare in1991/92. However, yields stagnated during the 1990s due to problemsassociated with diseases, resistance to pesticides, and disruption of productiondue to economic reasons. Yields began rising again in the late 1990s withimprovements in seed varieties and the use of biotech varieties, and theworld yield in 2004/05 reached more than 720 kilograms per hectare.
New technologies, more extensive use of existing technologies, and newareas dedicated to cotton cultivation have changed the structure of the worldcotton market since the mid-1990s (Fig. 13.5). Among the new technologies,the most visible is genetic engineering of cotton. It is estimated that 24% ofworld cotton area accounting for more than one-third of world productionwas planted to biotech varieties in 2004/05, up from just 2% in 1996/97.Biotech cotton lowers the use of insecticides and, although it does not guaranteethat cotton yields will be higher than with a non-biotech variety, it mightlower the cost of production.
Cotton is produced in about one hundred countries, but production hastraditionally concentrated in a few (Table 13.1). Over the last three decades,the four leading producing countries have accounted for an increasing shareof world production. China (mainland), the United States, India and Pakistanaccounted for 48% of world production in 1970/71 and 68% in 2004/05. The
1950/51 1960/61 1970/71 1980/81 1990/91 2000/01
3.0
2.8
2.6
2.4
2.2
2.0
13.4 World cotton area, as a percentage of arable land.

Controlling costs in cotton production 429
share of industrial countries (the USA, Australia, Spain and Greece) increasedfrom 19% of world production in 1980/81 to 24% in 2004/05. Developingcountries accounted for 61% of world production in 1980/81 and 66% in2004/05. Cotton production in the former USSR declined during the last twodecades, accounting for 19% of world production in 1980/81 and 7% in2004/05.
Production in China (mainland), the largest producer, increased at anaverage annual rate of 5% during the 1980s and fluctuated within a range of3.7 to 5.7 million tons during the 1990s. Production in China (mainland)rose to a record of 6.3 million tons in 2004/05. In the United States, cottonproduction increased from 2.4 million tons in 1980/81 to 3.3 million tons in1990/91, and fluctuated between 3 and 4.3 million tons during the 1990sbefore rising to 5.1 million in 2004/05. Cotton production in India rose from1.3 million tons in 1980/81 to 3.0 million in 1996/97. Thereafter, production
Table 13.1 Top ten producers 2004/05
Thousandtons
1 China (M) 6,320 24.2%2 USA 5,062 19.4%3 India 4,080 15.6%4 Pakistan 2,482 9.5%5 Brazil 1,318 5.0%6 Uzbekistan 1,150 4.4%7 Turkey 900 3.4%8 Australia 624 2.4%9 Greece 390 1.5%
10 Syria 331 1.3%Others 3,472 13.3%World 26,129 100.0%
1950/51 1958/59 1966/67 1974/75 1982/83 1990/91 1998/99 2006/07
800
600
400
200
Kil
og
ram
s p
er
he
cta
re
13.5 World cotton yields.
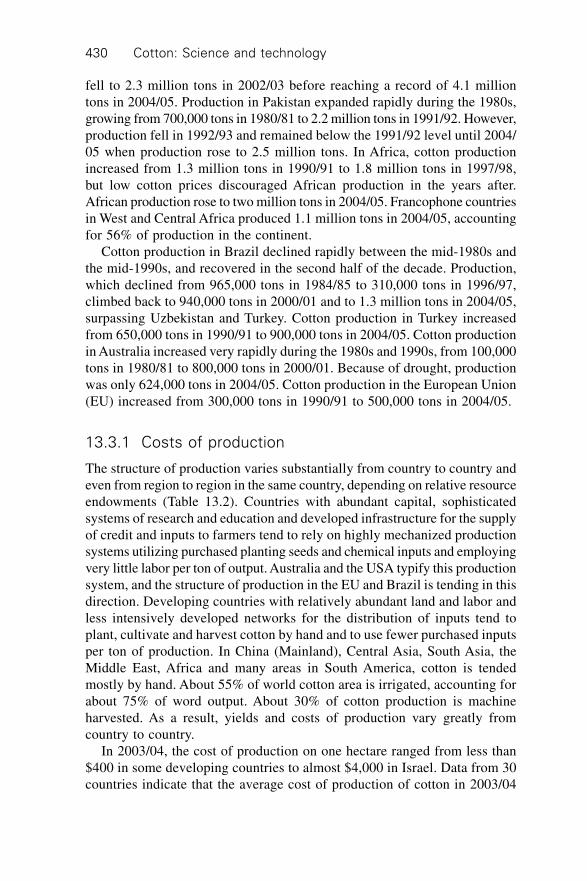
Cotton: Science and technology430
fell to 2.3 million tons in 2002/03 before reaching a record of 4.1 milliontons in 2004/05. Production in Pakistan expanded rapidly during the 1980s,growing from 700,000 tons in 1980/81 to 2.2 million tons in 1991/92. However,production fell in 1992/93 and remained below the 1991/92 level until 2004/05 when production rose to 2.5 million tons. In Africa, cotton productionincreased from 1.3 million tons in 1990/91 to 1.8 million tons in 1997/98,but low cotton prices discouraged African production in the years after.African production rose to two million tons in 2004/05. Francophone countriesin West and Central Africa produced 1.1 million tons in 2004/05, accountingfor 56% of production in the continent.
Cotton production in Brazil declined rapidly between the mid-1980s andthe mid-1990s, and recovered in the second half of the decade. Production,which declined from 965,000 tons in 1984/85 to 310,000 tons in 1996/97,climbed back to 940,000 tons in 2000/01 and to 1.3 million tons in 2004/05,surpassing Uzbekistan and Turkey. Cotton production in Turkey increasedfrom 650,000 tons in 1990/91 to 900,000 tons in 2004/05. Cotton productionin Australia increased very rapidly during the 1980s and 1990s, from 100,000tons in 1980/81 to 800,000 tons in 2000/01. Because of drought, productionwas only 624,000 tons in 2004/05. Cotton production in the European Union(EU) increased from 300,000 tons in 1990/91 to 500,000 tons in 2004/05.
13.3.1 Costs of production
The structure of production varies substantially from country to country andeven from region to region in the same country, depending on relative resourceendowments (Table 13.2). Countries with abundant capital, sophisticatedsystems of research and education and developed infrastructure for the supplyof credit and inputs to farmers tend to rely on highly mechanized productionsystems utilizing purchased planting seeds and chemical inputs and employingvery little labor per ton of output. Australia and the USA typify this productionsystem, and the structure of production in the EU and Brazil is tending in thisdirection. Developing countries with relatively abundant land and labor andless intensively developed networks for the distribution of inputs tend toplant, cultivate and harvest cotton by hand and to use fewer purchased inputsper ton of production. In China (Mainland), Central Asia, South Asia, theMiddle East, Africa and many areas in South America, cotton is tendedmostly by hand. About 55% of world cotton area is irrigated, accounting forabout 75% of word output. About 30% of cotton production is machineharvested. As a result, yields and costs of production vary greatly fromcountry to country.
In 2003/04, the cost of production on one hectare ranged from less than$400 in some developing countries to almost $4,000 in Israel. Data from 30countries indicate that the average cost of production of cotton in 2003/04

Co
ntro
lling
co
sts
in c
otto
n p
rod
uctio
n4
31
Table 13.2 Cost of production 2003/04 (US$)
Country/Region Cost of Seed : cotton1 Variable Cash Expenses2 Net Cost 3
Per Ha Per Kg Per Ha Per Kg Per Ha Per Kg
Argentina, Santiago del Estero (Irrigated) 410.11 0.21 427.06 0.65 498.01 0.75Argentina, Rainfed 328.97 0.22 336.60 0.67 392.48 0.78Australia, Irrigated Upland 886.84 936.49 0.66 1,936.64 1.37Bangladesh, G. hirsutum 406.61 0.25 214.07 0.36 238.14 0.40Benin, National Average 484.43 0.46 551.39 1.23 597.17 1.33Bolivia, National Average 457.27 0.28 547.83 1.01 666.45 1.22Brazil, Central West (Cerrado) 1,122.07 0.31 1,049.13 0.80 1,277.40 0.98Brazil, Northeast (Semi-arid, Rainfed) 354.06 0.24Bulgaria 436.26 0.36 619.59 1.40 674.24 1.52Cameroon, National Average 324.37 0.27 362.59 0.74 407.51 0.83China (Mainland), National Average 886.29 0.32 706.15 0.67 1,069.35 1.02Colombia, Cesar 869.93 0.38 924.12 1.12 984.64 1.19Colombia, Sinu 874.48 0.35 804.16 0.89 907.43 1.01Côte d’Ivoire, Manual Cultivation 356.90 0.29Côte d’Ivoire, Animal Powered 416.43 0.29Ethiopia, Afar 495.05 344.01 861.40India, North Zone, Irrigated 357.42 0.21India, Central Zone, Irrigated 394.35 0.27India, Central Zone, Rainfed 302.85 0.31India, South Zone, Rainfed 411.31 0.32Iran, National Average 892.05 0.36 782.66 0.98 1,001.29 1.25Israel, Upland/Pima 2,570.00 2,490.00 3,380.00Mali, National Average 388.18 0.34 545.97 1.15 626.94 1.32Mexico, Central (South of Chihuahua) 1,059.83Mexico, Sonora (South) 1,578.60 1,445.85 1,773.80Nigeria, National Average 466.92 375.88Pakistan, Punjab 742.03 0.37 564.91 0.85 638.63 0.96Paraguay 341.63 0.28
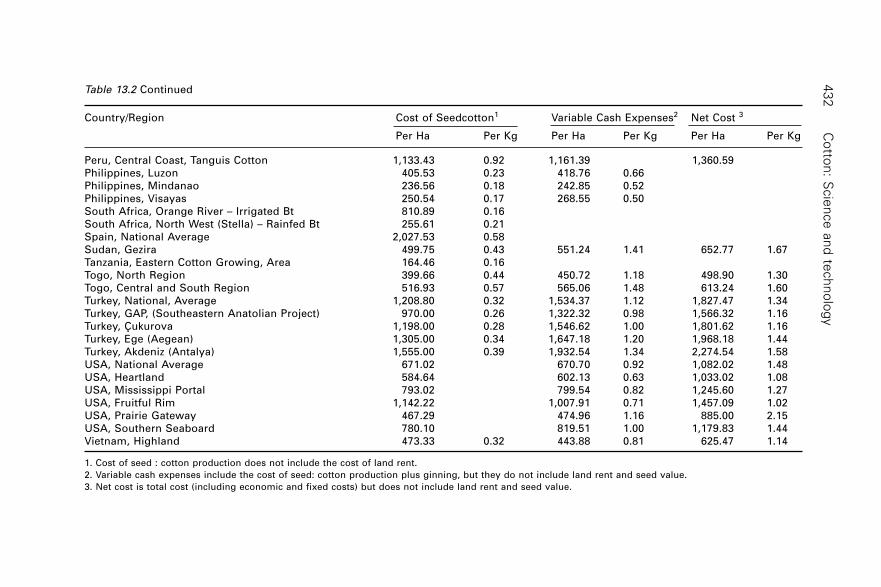
Co
tton
: Scie
nce
an
d te
ch
no
log
y4
32
Table 13.2 Continued
Country/Region Cost of Seedcotton1 Variable Cash Expenses2 Net Cost 3
Per Ha Per Kg Per Ha Per Kg Per Ha Per Kg
Peru, Central Coast, Tanguis Cotton 1,133.43 0.92 1,161.39 1,360.59Philippines, Luzon 405.53 0.23 418.76 0.66Philippines, Mindanao 236.56 0.18 242.85 0.52Philippines, Visayas 250.54 0.17 268.55 0.50South Africa, Orange River – Irrigated Bt 810.89 0.16South Africa, North West (Stella) – Rainfed Bt 255.61 0.21Spain, National Average 2,027.53 0.58Sudan, Gezira 499.75 0.43 551.24 1.41 652.77 1.67Tanzania, Eastern Cotton Growing, Area 164.46 0.16Togo, North Region 399.66 0.44 450.72 1.18 498.90 1.30Togo, Central and South Region 516.93 0.57 565.06 1.48 613.24 1.60Turkey, National, Average 1,208.80 0.32 1,534.37 1.12 1,827.47 1.34Turkey, GAP, (Southeastern Anatolian Project) 970.00 0.26 1,322.32 0.98 1,566.32 1.16Turkey, Çukurova 1,198.00 0.28 1,546.62 1.00 1,801.62 1.16Turkey, Ege (Aegean) 1,305.00 0.34 1,647.18 1.20 1,968.18 1.44Turkey, Akdeniz (Antalya) 1,555.00 0.39 1,932.54 1.34 2,274.54 1.58USA, National Average 671.02 670.70 0.92 1,082.02 1.48USA, Heartland 584.64 602.13 0.63 1,033.02 1.08USA, Mississippi Portal 793.02 799.54 0.82 1,245.60 1.27USA, Fruitful Rim 1,142.22 1,007.91 0.71 1,457.09 1.02USA, Prairie Gateway 467.29 474.96 1.16 885.00 2.15USA, Southern Seaboard 780.10 819.51 1.00 1,179.83 1.44Vietnam, Highland 473.33 0.32 443.88 0.81 625.47 1.14
1. Cost of seed : cotton production does not include the cost of land rent.
2. Variable cash expenses include the cost of seed: cotton production plus ginning, but they do not include land rent and seed value.
3. Net cost is total cost (including economic and fixed costs) but does not include land rent and seed value.
Controlling costs in cotton production 433
was $1,140 per hectare, including the costs of growing, harvesting and ginning.Out of the total cost, the average cost of land rent was $240, and the averagevalue of cottonseed sold after harvest per hectare of production was $166.Economic costs, such as management and administration, interest on capital,repairs and general farm overhead, and fixed costs, such as depreciation onequipment, averaged $115 per hectare. Consequently, the costs of production,net of land values, net of the value of cottonseed sales, and net of economicand fixed costs, averaged $620 per hectare in 2003/04.
Assuming an average total cost of production of $1,140 per hectare, thetotal cost of production of cotton on 32.1 million hectares in 2003/04 wasapproximately $37 billion. The value of world cotton production in 2003/04,20.7 million tons of lint at an average price of 68 cents per pound, was about$31 billion. Consequently, the value of world cotton production in 2003/04was about $6 billion less than the cost of production. Subsidies paid togrowers accounted for about $4 billion in 2003/04, and the remaining $2billion in economic losses would have been mostly accounted for bydepreciation on equipment and lost wages for management and administration.
Based on a world yield of 642 kilograms of lint per hectare in 2003/04,the average total cost of production, including land, the value of cottonseedand economic and fixed costs, was $1.77 per kilogram of lint ($0.80 perpound). Excluding the cost of land rent and subtracting the value of cottonseedsold after harvest, the net cost of production averaged $1.14 per kilogram oflint ($0.52 per pound), and if economic and fixed costs are excluded, theresulting cash costs of production averaged $0.96 per kilogram ($0.44 perpound). These data indicate that the average land owner, producing cotton ataverage cost and gaining average yields in 2003/04, will tend to maintain orexpand production when farm prices exceed 44 US cents per pound.
Costs of production vary substantially by region. Based on data from2003/04 and using exchange rates that prevailed at that time, cotton productioncosts per kilogram of lint are the highest in Europe and the USA and thelowest in Asia, South America and Australia. The net cost of production perkilogram of lint (excluding the cost of land and subtracting the value ofcotton seed; world average equal to $1.14) averaged $1.48 in the USA and$3.72 in Europe. Farmers in the USA, Greece and Spain are supported bygovernment measures.
The net cost of production in Africa averaged $1.40 per kilogram, whichis above the world average. An earlier study done using data from 2000/01indicated that costs of production in Africa were less than the world average,but between 2000 and 2003, the CFA (currency of Francophone Africa)strengthened by more than 30% against the US dollar, changing cost ofproduction measures. The net cost of production in South America averaged$1.09 per kilogram of lint in 2003/04, the average in Asia was $1.14 perkilogram and the average in Australia was $1.08 per kilogram.

Cotton: Science and technology434
The greatest source of variation in costs of production per kilogram of lintare caused by differences in the costs of ginning, economic costs and fixedcosts. The cost of producing seed cotton is relatively stable across mostcountries, averaging $0.33 per kilogram and with a variation of only 3 centsper kilogram between the highest-cost and lowest-cost producing countries.However, when costs of ginning, seed values, economic costs and fixedcosts are considered, variations among countries become apparent.
13.4 Consumption
World textile fiber consumption is driven by three major economic variables,income, population growth and fiber prices (Fig. 13.6). World final demandfor textile fibers has increased at an impressive pace since the 1950s. From7.6 million tons in 1950, textile fiber consumption increased to 56 milliontons in 2004. While about 50% of the increase was the result of populationgrowth, the remaining 50% was the result of higher income per capita,declines in real textile prices, and competition, which generated new uses fortextile fibers. However, the rate of growth of fiber consumption has deceleratedgradually. The average annual rate of growth of textile fiber consumptionwas 3.7% during the 1960s, 3.1% during the 1970s, 2.5% during the 1980sand 2.7% during the 1990s. Growth of the two major economic variablesthat determine textile consumption, income and population, decelerated duringthe 1990s compared with the 1960s.
An exogenous factor that has supported textile consumption in the lastfew years is the gradual integration of textile trade into World TradeOrganization (WTO) rules. (The WTO is an international economic organizationheadquartered in Geneva. The WTO serves as the forum for negotiation ofinternational trade rules among countries.) As of December 2004, just overhalf of world textile trade had already been gradually integrated, and on
1950/51 1958/59 1966/67 1974/75 1982/83 1990/91 1998/99 2006/07
30
25
20
15
10
5
0
Mil
lio
n t
on
s
13.6 World cotton mill use.

Controlling costs in cotton production 435
January 1 2005, all textile trade was integrated into WTO rules. Therefore,quotas agreed under the Multifiber Arrangement (MFA) no longer exist.Research by the Secretariat, using previous joint work with the Food andAgriculture Organization of the United Nations (FAO), suggests that becauseof textile quota elimination, the world would consume half a million tonsmore cotton by the end of 2005. A portion of the gains in cotton consumptiondue to quota elimination are likely to have occurred between 1995 and 2004,particularly since January 1 2002.
Consumer research and demand enhancement activities, especially thoseof Cotton Incorporated in the USA, have also supported cotton consumption.The budget of Cotton Incorporated is approximately $60 million per year,collected from US cotton producers and importers of textiles and apparel.Cotton Incorporated conducts textile research to enhance the quality of cottonproducts, and it spends about $38 million per year on direct consumeradvertising to enhance cotton consumption at the retail level. Research bythe Secretariat suggests that as a result of research and demand enhancementefforts, 300,000 tons more cotton per year has been consumed since 1998.
For cotton, competition with chemical fiber is an insidious challenge. Atthe start of the 20th century, cotton had a dominant share of the textilemarket. At the beginning of the 21st century, cotton is one of many fibersavailable and has been surpassed by polyester. Cotton consumption per capitahas been almost constant since 1960, while total textile fiber consumptionper capita more than doubled. Cotton’s share of world textile fiber use fellfrom 79% in 1950 to below 40% in 2004.
Most of the increase in world cotton consumption at the end-use levelduring the 1980s and 1990s took place in industrial countries. However,since 2000, most of the increase in cotton end use is taking place in developingcountries as consumers in China (mainland) and India accelerate their retailpurchases. The share of developing countries in world mill consumptionrose continuously from 61% in 1990/91 to 88% in 2004/05. Mill use indeveloped countries is headed lower.
The elimination of quotas will intensify competition, leading to lowerprices for textiles. (Quotas are quantitative limits on imports of textile andapparel products. Beginning in the late 1950s and continuing until the end of2004, the United States, Canada, and most countries in Europe limited importsof textiles and apparel by setting quotas on products from exporting countries.The quotas were designed to slow the growth of imports in order to protectdomestic manufacturing industries.) Final consumers of textile products willbenefit from increased supply and lower prices, which in turn could stimulateconsumption growth to the benefit of lower-cost cotton textile and apparelindustries. Cotton producers themselves will benefit from stronger demandfor cotton fiber.
Cotton: Science and technology436
Long-term projections of world gross domestic product (GDP, a measureof total economic activity) and population growth suggest that world textilefiber consumption can expand at an annual average rate of 4% to reach 75million tons in 2010. World cotton consumption is projected to expand at anannual average rate of 3.5% to reach 26 million tons in 2010. Cotton’s shareof the world textile fiber market is projected to decline to 37%. China(mainland), India, Pakistan and Turkey will remain major textile economies,with a dependency on cotton imports. Cotton consumption in China (mainland)is projected to surpass 10 million tons in 2009/10, 40% of world mill use.
13.4.1 Retail consumption
In 2003, developed countries as a group accounted for 44% of world cottonretail level consumption, and developing countries accounted for 52%. Atthe retail level, the USA is the largest consuming country, accounting for21% percent of total cotton use in 2004. Per capita cotton consumption in theUSA was 16 kilograms in 2004, compared with a world average of only3.5 kilograms. High consumer incomes, a history of cotton consumption,consumer preferences in favor of cotton bolstered by industry advertising,and fashion trends that favor cotton explain the high level of per capitacotton use in the USA.
Retail consumption of cotton in Latin America accounted for 9% of worldcotton use in 2000, and per capita consumption was 3.2 kilograms per year.Consumers in Brazil and Mexico account for two-thirds of Latin Americanretail level cotton use. Retail consumption in the EU-15 accounts for 16% ofworld cotton use, and per capita cotton consumption in Europe was about7 kilograms in 2000. The lower level of per capita consumption of cotton inEurope compared with the USA reflects lower average income levels, lessconsumer-oriented retail structures, and differences in tastes and preferencesbetween American and European consumers.
Retail consumption in Russia and other countries of the former USSRaccounted for 2% of world cotton use in 2000, and per capita cotton use wasbelow the world average at just 2.7 kilograms. Retail consumption in theMiddle East, including Turkey, accounted for 6% of world use in 2000, andper capita consumption was equal to the world average at 3.6 kilograms peryear. Africa, including South Africa and Egypt, accounts for only 2% ofworld cotton use at the retail level, and per capita consumption of cotton inAfrica is less than 1 kilogram per year.
Retail consumption in Japan equalled 6% of world cotton use in 2000,and per capita consumption in Japan was 9 kilograms, 2 kilograms higherthan the EU average, but lower than in the USA. Consumption in the rest ofEast Asia, including China, and in South Asia accounted for 31% of worldcotton use at the retail level in 2000, but per capita consumption averaged

Controlling costs in cotton production 437
just 1.8 kilograms because of low incomes and government policies thatfavor the use of polyester to conserve land devoted to cotton. One of thegreat challenges for the cotton industry is to raise per capita consumption inthe countries with the largest populations, including China where cotton useper capita was just 1.9 kilograms in 2000, India, with per capita cotton useof 1.7 kilograms and Indonesia, with per capita use of 1.4 kilograms. It ishoped that rising incomes in India, Indonesia and China (mainland) will leadto increases in per capita cotton consumption during the current decade.
13.4.2 Mill consumption
Mirroring end-use consumption, world mill consumption of cotton was stagnantduring the first half of the 1990s, growing by only 0.6% between 1990 and1997, but increased rapidly thereafter (Table 13.3). In the early 1990s, millconsumption of cotton declined dramatically in Eastern Europe and the formerUSSR, from 2.5 million tons in 1990/91 to 730,000 tons in 1998/99, offsettinggains elsewhere in the world. Mill consumption of cotton in the formerCouncil Mutual Economic Cooperation (COMECON) group of countriesrecovered to 900,000 tons in 2004/05. Mill consumption of cotton in industrialcountries remained at about 4 million tons during the early 1990s, but declinedrapidly after 1998/99 to 2.2 million tons in 2004/05. High cost structures andincreased import competition from developing countries caused the cottontextile industries in many industrial countries to reduce production beginningin the late 1990s.
Mill consumption of cotton in developing countries increased at an annualrate of 3.9%, from 8.5 million tons in 1980/81 to 12.3 million tons in 1990/91. Growth of mill consumption decelerated during first seven years of the1990s to an average annual rate of 2.7% reaching 14.3 million tons in 1997/
Table 13.3 Top ten cotton consumers
Thousandtons
1 China (M) 8,200 35.0%2 India 3,300 14.1%3 Pakistan 2,300 9.8%4 Turkey 1,550 6.6%5 USA 1,361 5.8%6 Brazil 935 4.0%7 Indonesia 490 2.1%8 Mexico 450 1.9%9 Thailand 450 1.9%
10 Bangladesh 394 1.7%Others 3,970 17.0%World 23,400 100.0%

Cotton: Science and technology438
98, but regained strength since 1998/99, growing at an average annual rateof 5% to reach 20 million tons in 2004/05. The bulk of the increase since1998 occurred in China (mainland), but important expansions were alsoregistered in India, Pakistan and Turkey. As a result, the processing of cottoncontinued to concentrate in developing countries, and their share of worldmill consumption rose from 67% in 1990/91 to 86% in 2004/05, comparedto 46% in 1970/71 and 28% in 1950/51.
For the past seven years, China (mainland) has been the driving force ofthe world textile industry. Between 1998/99 and 2004/05, the increase inmill consumption of cotton in China accounted for 91% of additionalconsumption worldwide. The Chinese industry processed 8.2 million tons ofraw cotton in 2004/05, an increase of 4.3 million tons since 1998/99, and35% of global mill use, up from 23% in 1998/99. The textile industry inChina (mainland) is highly dependent on the export market, and China(mainland) has increased its share of world textile and apparel exports in thelast six years. During the 1990s, mill consumption of cotton became moreconcentrated in the largest processing countries. In 1980/81, the six countriesthat are the largest processors today, China (mainland), India, Pakistan, theUnited States, Turkey, and Brazil, accounted for 51% of world millconsumption. These countries accounted for 57% of world mill consumptionin 1990/91, and 76% in 2004/05.
13.4.3 Inter-fiber competition
World consumption of all textile fibers, including cotton, chemical fibersand wool, increased at an impressive pace, from 9.6 million tons in 1950, to58 million tons in 2004 (Fig. 13.7 and Table 13.4). Several variables areassociated with changes in cotton consumption, including growth in incomeand population, changes in cotton prices relative to prices of competingfibers, consumer preferences and changes in fashion. Fibers competing with
CottonNon-cotton
40
30
20
10
0
Mil
lio
n t
on
s
1960 1970 1980 1990 2000
13.7 World fiber use.
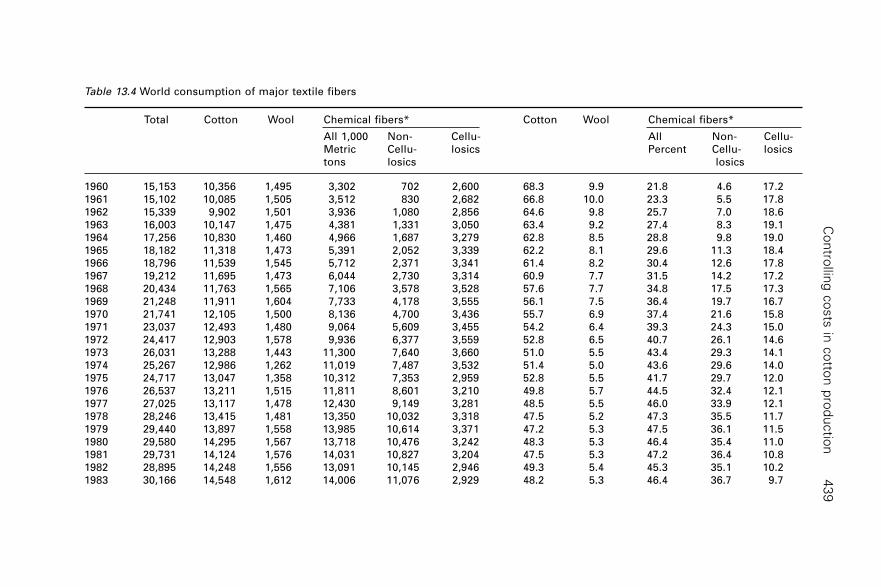
Co
ntro
lling
co
sts
in c
otto
n p
rod
uctio
n4
39
Table 13.4 World consumption of major textile fibers
Total Cotton Wool Chemical fibers* Cotton Wool Chemical fibers*
All 1,000 Non- Cellu- All Non- Cellu-Metric Cellu- losics Percent Cellu- losicstons losics losics
1960 15,153 10,356 1,495 3,302 702 2,600 68.3 9.9 21.8 4.6 17.21961 15,102 10,085 1,505 3,512 830 2,682 66.8 10.0 23.3 5.5 17.81962 15,339 9,902 1,501 3,936 1,080 2,856 64.6 9.8 25.7 7.0 18.61963 16,003 10,147 1,475 4,381 1,331 3,050 63.4 9.2 27.4 8.3 19.11964 17,256 10,830 1,460 4,966 1,687 3,279 62.8 8.5 28.8 9.8 19.01965 18,182 11,318 1,473 5,391 2,052 3,339 62.2 8.1 29.6 11.3 18.41966 18,796 11,539 1,545 5,712 2,371 3,341 61.4 8.2 30.4 12.6 17.81967 19,212 11,695 1,473 6,044 2,730 3,314 60.9 7.7 31.5 14.2 17.21968 20,434 11,763 1,565 7,106 3,578 3,528 57.6 7.7 34.8 17.5 17.31969 21,248 11,911 1,604 7,733 4,178 3,555 56.1 7.5 36.4 19.7 16.71970 21,741 12,105 1,500 8,136 4,700 3,436 55.7 6.9 37.4 21.6 15.81971 23,037 12,493 1,480 9,064 5,609 3,455 54.2 6.4 39.3 24.3 15.01972 24,417 12,903 1,578 9,936 6,377 3,559 52.8 6.5 40.7 26.1 14.61973 26,031 13,288 1,443 11,300 7,640 3,660 51.0 5.5 43.4 29.3 14.11974 25,267 12,986 1,262 11,019 7,487 3,532 51.4 5.0 43.6 29.6 14.01975 24,717 13,047 1,358 10,312 7,353 2,959 52.8 5.5 41.7 29.7 12.01976 26,537 13,211 1,515 11,811 8,601 3,210 49.8 5.7 44.5 32.4 12.11977 27,025 13,117 1,478 12,430 9,149 3,281 48.5 5.5 46.0 33.9 12.11978 28,246 13,415 1,481 13,350 10,032 3,318 47.5 5.2 47.3 35.5 11.71979 29,440 13,897 1,558 13,985 10,614 3,371 47.2 5.3 47.5 36.1 11.51980 29,580 14,295 1,567 13,718 10,476 3,242 48.3 5.3 46.4 35.4 11.01981 29,731 14,124 1,576 14,031 10,827 3,204 47.5 5.3 47.2 36.4 10.81982 28,895 14,248 1,556 13,091 10,145 2,946 49.3 5.4 45.3 35.1 10.21983 30,166 14,548 1,612 14,006 11,076 2,929 48.2 5.3 46.4 36.7 9.7
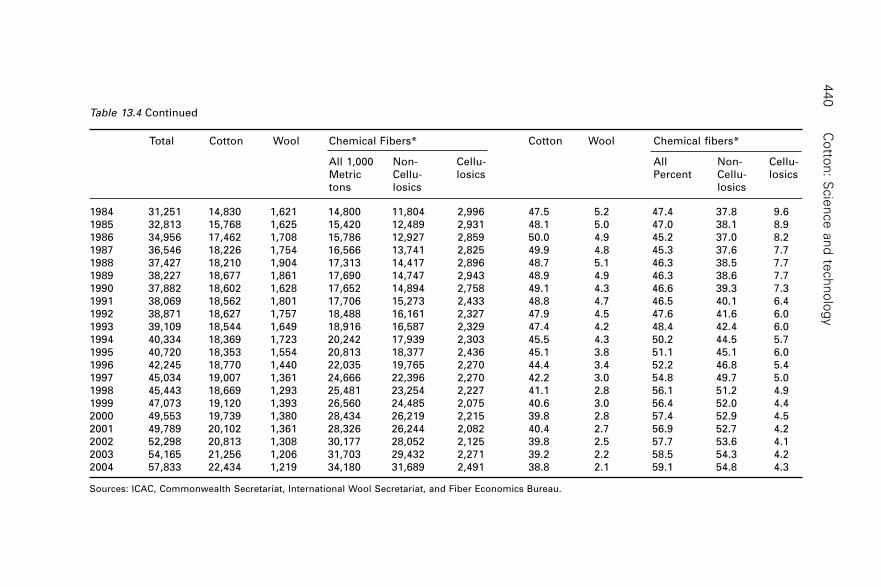
Co
tton
: Scie
nce
an
d te
ch
no
log
y4
40
Table 13.4 Continued
Total Cotton Wool Chemical Fibers* Cotton Wool Chemical fibers*
All 1,000 Non- Cellu- All Non- Cellu-Metric Cellu- losics Percent Cellu- losicstons losics losics
1984 31,251 14,830 1,621 14,800 11,804 2,996 47.5 5.2 47.4 37.8 9.61985 32,813 15,768 1,625 15,420 12,489 2,931 48.1 5.0 47.0 38.1 8.91986 34,956 17,462 1,708 15,786 12,927 2,859 50.0 4.9 45.2 37.0 8.21987 36,546 18,226 1,754 16,566 13,741 2,825 49.9 4.8 45.3 37.6 7.71988 37,427 18,210 1,904 17,313 14,417 2,896 48.7 5.1 46.3 38.5 7.71989 38,227 18,677 1,861 17,690 14,747 2,943 48.9 4.9 46.3 38.6 7.71990 37,882 18,602 1,628 17,652 14,894 2,758 49.1 4.3 46.6 39.3 7.31991 38,069 18,562 1,801 17,706 15,273 2,433 48.8 4.7 46.5 40.1 6.41992 38,871 18,627 1,757 18,488 16,161 2,327 47.9 4.5 47.6 41.6 6.01993 39,109 18,544 1,649 18,916 16,587 2,329 47.4 4.2 48.4 42.4 6.01994 40,334 18,369 1,723 20,242 17,939 2,303 45.5 4.3 50.2 44.5 5.71995 40,720 18,353 1,554 20,813 18,377 2,436 45.1 3.8 51.1 45.1 6.01996 42,245 18,770 1,440 22,035 19,765 2,270 44.4 3.4 52.2 46.8 5.41997 45,034 19,007 1,361 24,666 22,396 2,270 42.2 3.0 54.8 49.7 5.01998 45,443 18,669 1,293 25,481 23,254 2,227 41.1 2.8 56.1 51.2 4.91999 47,073 19,120 1,393 26,560 24,485 2,075 40.6 3.0 56.4 52.0 4.42000 49,553 19,739 1,380 28,434 26,219 2,215 39.8 2.8 57.4 52.9 4.52001 49,789 20,102 1,361 28,326 26,244 2,082 40.4 2.7 56.9 52.7 4.22002 52,298 20,813 1,308 30,177 28,052 2,125 39.8 2.5 57.7 53.6 4.12003 54,165 21,256 1,206 31,703 29,432 2,271 39.2 2.2 58.5 54.3 4.22004 57,833 22,434 1,219 34,180 31,689 2,491 38.8 2.1 59.1 54.8 4.3
Sources: ICAC, Commonwealth Secretariat, International Wool Secretariat, and Fiber Economics Bureau.
Controlling costs in cotton production 441
cotton include natural fibers and chemical fibers, primarily polyester. Cotton’sshare of world textile fiber use fell from more than 70% in the 1950s to lessthan 50% by the end of the 1970s. Cotton did better in the 1980s. However,cotton’s share of world textile fiber fell below 40% in 2002. Over the lastfive decades, cotton experienced an erosion of both price and non-pricecompetitiveness.
Cotton’s major advantages over its primary competitors in the chemicalfiber complex include wearing comfort, natural appearance, moistureabsorbency, its status as a renewable resource and the important economicrole of cotton in many producing countries. However, cotton also suffersfrom several disadvantages relative to chemical fibers, including contaminationintroduced during harvest, ginning and handling, annual fluctuations in thequantity and quality of production and consequent variability in prices. Cottonalso has difficulty meeting the needs of modern spinning equipment forstrength, uniformity and other quality parameters.
Relative fiber prices are extremely important in determining fiber marketshares. During most years in the 1980s and 1990s, cotton prices were higherthan prices of polyester, explaining much of the decline in fiber market sharefor cotton during those years. However, since 1998/99, cotton prices havebeen lower and polyester prices have been higher. As a consequence, cottonconsumption rose at an average rate of 4% per year during the period from1998 to 2004, compared to average growth of 1.5% per year in the twodecades prior to 1998.
One common area of misunderstanding is the relationship between oilprices and prices of polyester fiber. Many people assume that because polyesteris derived from chemicals refined from oil, that increases in crude oil priceslead to increases in polyester prices. However, the precursor chemicals usedto make polyester account for only a small fraction of oil consumption, andeach of the chemicals have multiple uses. As a consequence, there are separatemarkets for the chemicals used to make polyester, and those markets havelittle correlation with oil prices. Therefore, prices for polyester fiber are notdetermined by the price of oil, and in fact there is almost no statisticalcorrelation between oil prices and polyester fiber prices.
13.5 Trade
World trade in cotton rose from 2.6 million tons in 1950/51 to 4 million tonsin the early 1970s and reached 5.8 million tons in 1986/87. Cotton importsaveraged 5.9 million tons during the 1990s and climbed to a record of 7.3million tons in 2004/05 (Fig. 13.8). Among the top seven cotton producingcountries, only Uzbekistan does not rank among the top seven consumingcountries. Trade accounted for 28% of world cotton production in 2004/05,and the value of world exports was $8.4 billion.
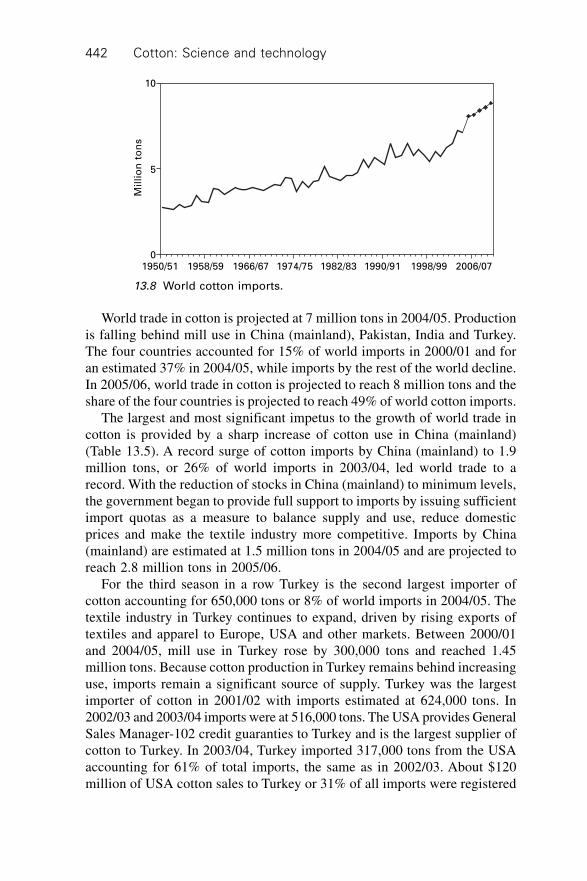
Cotton: Science and technology442
World trade in cotton is projected at 7 million tons in 2004/05. Productionis falling behind mill use in China (mainland), Pakistan, India and Turkey.The four countries accounted for 15% of world imports in 2000/01 and foran estimated 37% in 2004/05, while imports by the rest of the world decline.In 2005/06, world trade in cotton is projected to reach 8 million tons and theshare of the four countries is projected to reach 49% of world cotton imports.
The largest and most significant impetus to the growth of world trade incotton is provided by a sharp increase of cotton use in China (mainland)(Table 13.5). A record surge of cotton imports by China (mainland) to 1.9million tons, or 26% of world imports in 2003/04, led world trade to arecord. With the reduction of stocks in China (mainland) to minimum levels,the government began to provide full support to imports by issuing sufficientimport quotas as a measure to balance supply and use, reduce domesticprices and make the textile industry more competitive. Imports by China(mainland) are estimated at 1.5 million tons in 2004/05 and are projected toreach 2.8 million tons in 2005/06.
For the third season in a row Turkey is the second largest importer ofcotton accounting for 650,000 tons or 8% of world imports in 2004/05. Thetextile industry in Turkey continues to expand, driven by rising exports oftextiles and apparel to Europe, USA and other markets. Between 2000/01and 2004/05, mill use in Turkey rose by 300,000 tons and reached 1.45million tons. Because cotton production in Turkey remains behind increasinguse, imports remain a significant source of supply. Turkey was the largestimporter of cotton in 2001/02 with imports estimated at 624,000 tons. In2002/03 and 2003/04 imports were at 516,000 tons. The USA provides GeneralSales Manager-102 credit guaranties to Turkey and is the largest supplier ofcotton to Turkey. In 2003/04, Turkey imported 317,000 tons from the USAaccounting for 61% of total imports, the same as in 2002/03. About $120million of USA cotton sales to Turkey or 31% of all imports were registered
10
5
0
Mil
lio
n t
on
s
1950/51 1958/59 1966/67 1974/75 1982/83 1990/91 1998/99 2006/07
13.8 World cotton imports.
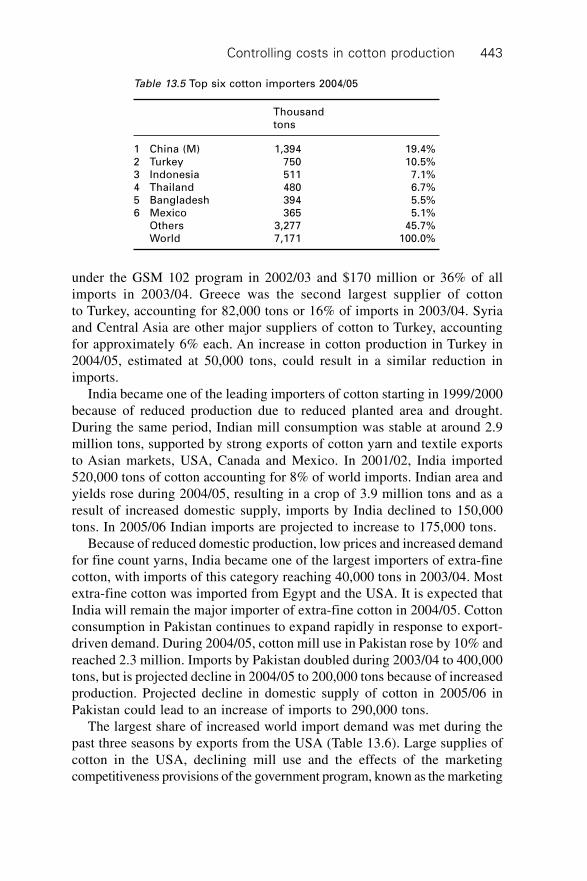
Controlling costs in cotton production 443
under the GSM 102 program in 2002/03 and $170 million or 36% of allimports in 2003/04. Greece was the second largest supplier of cottonto Turkey, accounting for 82,000 tons or 16% of imports in 2003/04. Syriaand Central Asia are other major suppliers of cotton to Turkey, accountingfor approximately 6% each. An increase in cotton production in Turkey in2004/05, estimated at 50,000 tons, could result in a similar reduction inimports.
India became one of the leading importers of cotton starting in 1999/2000because of reduced production due to reduced planted area and drought.During the same period, Indian mill consumption was stable at around 2.9million tons, supported by strong exports of cotton yarn and textile exportsto Asian markets, USA, Canada and Mexico. In 2001/02, India imported520,000 tons of cotton accounting for 8% of world imports. Indian area andyields rose during 2004/05, resulting in a crop of 3.9 million tons and as aresult of increased domestic supply, imports by India declined to 150,000tons. In 2005/06 Indian imports are projected to increase to 175,000 tons.
Because of reduced domestic production, low prices and increased demandfor fine count yarns, India became one of the largest importers of extra-finecotton, with imports of this category reaching 40,000 tons in 2003/04. Mostextra-fine cotton was imported from Egypt and the USA. It is expected thatIndia will remain the major importer of extra-fine cotton in 2004/05. Cottonconsumption in Pakistan continues to expand rapidly in response to export-driven demand. During 2004/05, cotton mill use in Pakistan rose by 10% andreached 2.3 million. Imports by Pakistan doubled during 2003/04 to 400,000tons, but is projected decline in 2004/05 to 200,000 tons because of increasedproduction. Projected decline in domestic supply of cotton in 2005/06 inPakistan could lead to an increase of imports to 290,000 tons.
The largest share of increased world import demand was met during thepast three seasons by exports from the USA (Table 13.6). Large supplies ofcotton in the USA, declining mill use and the effects of the marketingcompetitiveness provisions of the government program, known as the marketing
Table 13.5 Top six cotton importers 2004/05
Thousandtons
1 China (M) 1,394 19.4%2 Turkey 750 10.5%3 Indonesia 511 7.1%4 Thailand 480 6.7%5 Bangladesh 394 5.5%6 Mexico 365 5.1%
Others 3,277 45.7%World 7,171 100.0%
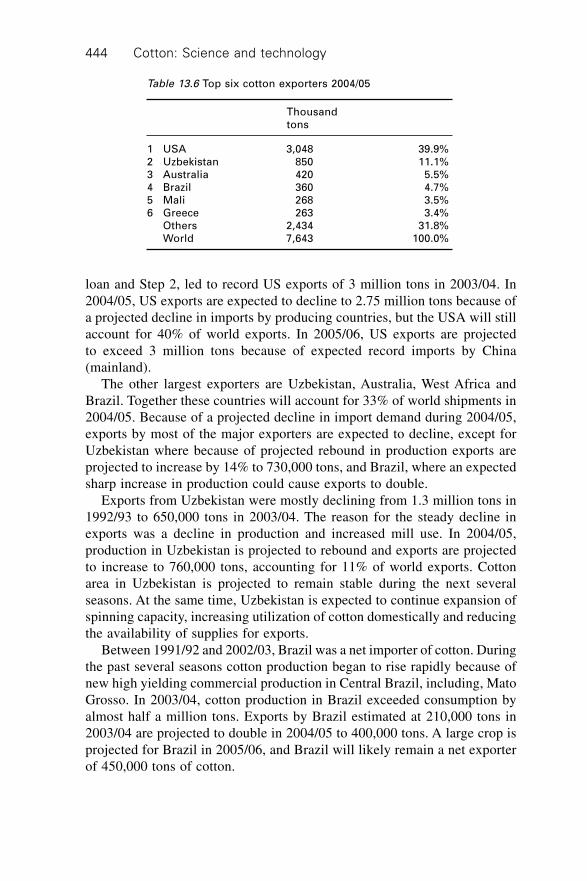
Cotton: Science and technology444
loan and Step 2, led to record US exports of 3 million tons in 2003/04. In2004/05, US exports are expected to decline to 2.75 million tons because ofa projected decline in imports by producing countries, but the USA will stillaccount for 40% of world exports. In 2005/06, US exports are projectedto exceed 3 million tons because of expected record imports by China(mainland).
The other largest exporters are Uzbekistan, Australia, West Africa andBrazil. Together these countries will account for 33% of world shipments in2004/05. Because of a projected decline in import demand during 2004/05,exports by most of the major exporters are expected to decline, except forUzbekistan where because of projected rebound in production exports areprojected to increase by 14% to 730,000 tons, and Brazil, where an expectedsharp increase in production could cause exports to double.
Exports from Uzbekistan were mostly declining from 1.3 million tons in1992/93 to 650,000 tons in 2003/04. The reason for the steady decline inexports was a decline in production and increased mill use. In 2004/05,production in Uzbekistan is projected to rebound and exports are projectedto increase to 760,000 tons, accounting for 11% of world exports. Cottonarea in Uzbekistan is projected to remain stable during the next severalseasons. At the same time, Uzbekistan is expected to continue expansion ofspinning capacity, increasing utilization of cotton domestically and reducingthe availability of supplies for exports.
Between 1991/92 and 2002/03, Brazil was a net importer of cotton. Duringthe past several seasons cotton production began to rise rapidly because ofnew high yielding commercial production in Central Brazil, including, MatoGrosso. In 2003/04, cotton production in Brazil exceeded consumption byalmost half a million tons. Exports by Brazil estimated at 210,000 tons in2003/04 are projected to double in 2004/05 to 400,000 tons. A large crop isprojected for Brazil in 2005/06, and Brazil will likely remain a net exporterof 450,000 tons of cotton.
Table 13.6 Top six cotton exporters 2004/05
Thousandtons
1 USA 3,048 39.9%2 Uzbekistan 850 11.1%3 Australia 420 5.5%4 Brazil 360 4.7%5 Mali 268 3.5%6 Greece 263 3.4%
Others 2,434 31.8%World 7,643 100.0%

Controlling costs in cotton production 445
Exports from the Currency of Francophone Africa (CFA) zone reached arecord of 1.1 million tons in 2003/04, an increase of more than 200,000 tonsfrom 2002/03. Cotton production in the CFA zone reached a record of 1.03million tons in 2001/02, an increase of 300,000 tons. Political difficulties inCote d’Ivoire impeded shipments from the region, leading to a build up oflarge stocks estimated at over 500,000 tons in 2002/03. Exports from theCFA zone are estimated at 790,000 tons in 2004/05, because of reducedimport demand, and at 1.1 million tons in 2005/06 accounting for 15% ofworld exports 2004/05.
Australian production suffered from severe drought during the past severalseasons leading to a sharp decline in exports. In 2004/05, Australian exportsfell to 420,000 tons compared with 850,000 tons in 2000/01. Australiancotton production in 2004/05 is projected to increase to 610,000 tons from350,000 tons in 2003/04. Exports from Australia are projected to increase to550,000 tons during 2005/06 as a result of increased production. Australiawill account for only 7% of world exports in 2004/05, compared with 14%during 2000/01.
13.5.1 Biotech cotton
Biotech cotton is entering the world textile trade pipeline in increasing volumesas a result of growing world production and exports from the USA andAustralia and textile exports from China (mainland) (Fig. 13.9). Based onthe production shares of biotech cotton in exporting countries, it is estimatedthat biotech cotton accounted for 34% of world exports in 2002/03 and 36%in 2003/04. In 2004/05 the share of biotech cotton in world exports is decliningto 31% because of an expected decline in export volumes from the USA andAustralia. A larger share of world production will be consumed domesticallyin China (mainland). In 2003/04, an estimated 64% of all exports of biotech
Pe
rce
nt
30
20
10
01996/97 1998/99 2000/01 2002/03 2004/05
13.9 GE cotton area.

Cotton: Science and technology446
cotton went to Asia and Oceania (not counting the Middle East) comparedwith 58% in 2002/03.
Based on domestically produced and imported biotech cotton, especiallyin China (mainland), it is estimated that 60% of mill use in Asia and Oceaniawere accounted for by biotech cotton in 2003/04 compared with 31% in2002/03. Taking into account that Asia and Oceania account for more than65% of world exports of cotton textiles, it is evident that the share of biotechcotton in textiles traded in major markets in Europe and America is rising.Despite an increasing share of biotech cotton traded in the world, there areno price differentials for biotech and non-biotech cotton fiber, or textilescontaining biotech cotton. There is no evidence of rejection of biotech cottonby any segment of the market or region. In practice, markets do not identifybiotech cotton content, but rather evaluate cotton properties based on qualitycharacteristics.
13.5.2 China (mainland)
Substantial impacts on world textile trade have been caused by the entryof China (mainland) into the World Trade Organization in late 2001.The textile industry in China (mainland) is highly dependent on the exportmarket, and can be sensitive to world affairs. Nonetheless, low labor costsand Chinese government policies have improved the country’s competitivenesscompared with other textile exporting developing countries, and China(mainland) has increased its share of world textile and apparel exports in thelast four years. China (mainland) became the leading supplier of textilemanufactures to the USA market, the largest retail market for textiles andapparel in the world.
China (mainland’s) success in the world textile market stems from anearly recognition that the development of its textile complex had to focus onwhere it was most competitive, in the apparel sector. China (mainland) hasa substantial labor cost and supply advantage compared with other majortextile and apparel producers. Development of the competitive apparelproduction sector served as a catalyst for expanded investments inmodernization of the capital-intensive textile sector. China (mainland) hasinvested heavily in the modernization of the textile and apparel sectors duringthe past ten years, and investments in the textile sector rose by 80.4% in2003 alone reaching $10.7 billion according to the National Bureau of Statistics.China (mainland) imported $11.8 billion worth of textile machinery between2000 and June 2003 according to International Textile Manufacturers Federation(ITMF) data. As a result, China (mainland) became the world’s largest textileeconomy, the largest exporter of textiles and clothing, the largest cotton andchemical fiber producer, with the textile sector generating 10% of GDP. Percapita fiber consumption in China (mainland) rose from 8.3 kg in 2000 to

Controlling costs in cotton production 447
10.8 kg in 2002, and the population is rising by 11–12 million annually toreach 1.32 billion in 2005. The rate of growth of retail apparel sales in China(mainland) reached 20% in January–February 2005 compared to a year earlierand the rate of growth in rural areas is outpacing urban sales. China (mainland)is positioned to increase its market share with the elimination of quotas.However, other developing countries could find new opportunities with opencompetition.
13.5.3 Turkey
A similar strategy of modernization and investments was implemented byTurkey, where combined exports of textiles and clothing rose from $474million in 1980 to $15.180 billion in 2003. During that period exports oftextiles rose by 1,428% while exports of apparel rose by 7,487% reaching$9.4 billion. In 2004 apparel output in Turkey rose by 5.5% in volumecompared to 2.8% growth recorded in 2003, while textile output rose by4.2% in 2004 after declining by 0.9% in 2003. Turkey’s top export marketis the EU, while exports of cotton apparel suffered a 4.3% decline inthe USA in 2004, losing to rising volumes from China (mainland), Indiaand Pakistan.
13.5.4 India
India has been developing its textile and apparel sectors at impressive growthrates. Between 1980 and 2003, exports by both sectors in India rose by647%. In India, the second largest cotton processing country, mill consumptionof cotton between 1990/91 and 1997/98 increased at an average annual rateof 4.3%, or seven times more rapidly than world consumption growth. Demandfor Indian textile products has been supported mainly by very strong exports,in particular exports of cotton yarn. Taking advantage of relatively low costsof cotton processing, Indian exports to other Asian markets increased fasterthan to other destinations between 1990/91 and 1997/98. In addition, promotionof exports to the USA, Canada and Mexico, as well as to Latin Americancountries has been developed since 1996. Nonetheless, Indian mill consumptionof cotton remained at 2.9 million tons between 1998/99 and 2003/04, due toincreased competition from China (mainland) and other textile exporters.However, Indian mill consumption of cotton is projected to rise by 12% in2004/05 to reach 3.4 million tons because of improved competitive advantageof cotton yarn and apparel production in India and the expansion of exportsof textiles and apparel.
In 2005/06 Indian cotton consumption is projected to reach 3.4 milliontons or 14% of world mill use. One of the important effects of lower cottonprices is an increase in the market share of cotton in India, and as a result a
Cotton: Science and technology448
decline in the output of man-made fibers. During most of 2004, cotton pricesin India were lower than cotton prices in China (mainland). In December2004 monthly output of man-made fibers was the lowest since February2004, while cotton yarn and fabric output reached a record rising by 7.4%during 2004. India has been one of the three top winners of the post-quotaera along with China (mainland) and Pakistan, exercising a competitiveadvantage in yarn and fabric production. India’s apparel production beganrising strongly during the second half of 2004 and by December 2004, rose38.2% in volume compared with December 2003.
13.5.5 Pakistan
In Pakistan, during the past 20 years, more emphasis was given to thedevelopment of the textile sector compared with clothing industries, and thecombined export growth between 1980 and 2003 was 770%. However, recentlyPakistan began to expand apparel and fabric production, while reducingexports of cotton yarn due to increased competition from Indian yarns andincreased domestic demand for yarns from weavers and knitters. Knitwearexports from Pakistan soared 35.8% during 2004.
13.5.6 Winners and losers
The elimination of quotas provided an opportunity for large competitivetextile producers like China (mainland), India and Pakistan to increasetheir market share. However, the elimination of quotas will also intensifycompetition in the open marketplace and will necessitate and stimulate anumber of developing countries to restructure their textile economies investingin the modernization of the sectors where their competitive advantage lies inan attempt to capture a larger share of the market. The end of quotas lowersthe barriers to entry by new exporters with a wider range of products andcould lead to lower prices for textiles. Countries enjoying a guaranteedquota earlier, or quota-free access to the most lucrative markets, could losemarket share if their products are of low quality and not competitive. Quality,product innovation, reliability, demand responsiveness, market proximity,quick turnover and preferential tariffs are become increasingly importantcompetition factors.
In 2005, Mexico lost its advantage of quota-free access to the US marketprovided by the North American Free Trade Agreement (NAFTA) traderegime, but will continue to have an advantage of market proximity andtariff-free access. As a result Mexico could lose market share to China(mainland). Similarly, countries of Central and Eastern Europe and theMediterranean will lose the advantage of quota-free access to the EU, butwill continue to benefit from market proximity and duty-free access.
Controlling costs in cotton production 449
Market shares in textile trade of countries with quota-free and duty-freeaccess to large markets in the USA or EU, but with relatively weak industriesor/and remote locations, such as Bangladesh (EU and USA agreements),Mauritius (EU agreement), Sub-Saharan Africa (African Growth andOpportunity Act, or AGOA, an agreement providing preferential access tothe USA market for textile and apparel products from Africa), Hong Kong(large quotas) and countries in similar positions could decline.
13.6 Government measures
An important factor explaining the location of cotton production in relativelyhigh-cost countries is government measures that distort production and trade(Table 13.7). Direct income and price supports for cotton worldwide rangedbetween $3.8 billion in 1997/98 and $5.8 billion in 2001/02. For 2004/05,direct income and price support programs for cotton are estimated at $4.7billion. Fourteen countries representing three-fourths of world cotton productionoffered direct income and price support programs to cotton growers in 2001/02, a season of record low prices, resulting in higher production and forcingthe burden of adjustment to low cotton prices onto growers in countries thatdid not provide similar measures of protection. Developed countries andChina (mainland) accounted for 86% of assistance provided worldwide.
In 2004/05, the greatest government assistance per pound of cottonproduction was provided by the European Union to producers in Greece andSpain, with support averaging 95 cents per pound of lint production, orapproximately $1.1 billion in total. Support in the EU is paid to cottonginners, and ginners are required to provide the support to farmers based onseed cotton deliveries adjusted for quality. The amount of support paid toeach farmer is based on the difference between market prices at the time ofharvest and a target price set by the EU. The EU does not try to restrictcotton imports in order to keep domestic prices above the world level. TheEU announced in 2004 that 65% of the value of support for cotton will bepaid to farmers directly and decoupled from current cotton production beginningin January 2006. This means that beginning in 2006, cotton farmers in Greeceand Spain will receive 65% of the support they used to receive whether theycontinue to produce cotton or not, and only 35% of government support willbe based on current production. This change, known as decoupling, will leadto lower production. The EU produced 500,000 tons in 2004/05, and cottonproduction is forecast to decline by one-fourth by 2006/07.
In 2004/05, direct support to cotton farmers in the USA averaged 20 centsper pound of production, about equal to the average since the early 1980s.The total value of direct support was $2.2 billion. Support in the USA includedpayments to farmers based on the difference between average farm pricesand a target price. US growers also received a fixed payment based on
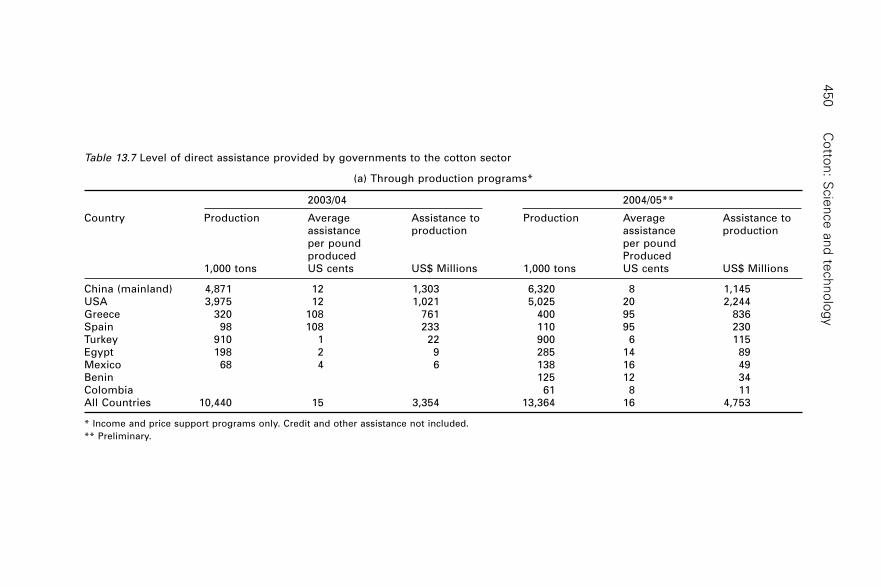
Co
tton
: Scie
nce
an
d te
ch
no
log
y4
50
Table 13.7 Level of direct assistance provided by governments to the cotton sector
(a) Through production programs*
2003/04 2004/05**
Country Production Average Assistance to Production Average Assistance toassistance production assistance productionper pound per poundproduced Produced
1,000 tons US cents US$ Millions 1,000 tons US cents US$ Millions
China (mainland) 4,871 12 1,303 6,320 8 1,145USA 3,975 12 1,021 5,025 20 2,244Greece 320 108 761 400 95 836Spain 98 108 233 110 95 230Turkey 910 1 22 900 6 115Egypt 198 2 9 285 14 89Mexico 68 4 6 138 16 49Benin 125 12 34Colombia 61 8 11All Countries 10,440 15 3,354 13,364 16 4,753
* Income and price support programs only. Credit and other assistance not included.
** Preliminary.

Co
ntro
lling
co
sts
in c
otto
n p
rod
uctio
n4
51
Table 13.7 Continued
(b) Through export program
2003/04 2004/05**
Country Exports Average Assistance to Exports Average Assistance toassistance exports Assistance exportsper pound per poundexported exported
1,000 tons US cents US$ Millions 1,000 tons US cents US$ Millions
USA 2,996 4 235 2,745 6 375Upland cotton 2,878 3 190 2,574 3 165Pima 118 17 45 171 56 210
Egypt 89 1 2 130 3 8India 150 2 7Total 3,085 3 237 2,875 6 383
* Preliminary.

Cotton: Science and technology452
historical production. As in Europe, the USA does not attempt to restrictcotton imports in an effort to bolster domestic prices. Elements of the UScotton program came under specific criticism from the international communityduring the Doha Round of trade negotiations under the auspices of the WTObecause of the unique roll played by cotton in the economies of manydeveloping countries. During the Doha Round talks, the USA agreed tolower or eliminate subsidies to cotton, but only within the context of anoverall agreement on agriculture.
The value of government support for the cotton sector of China (mainland)is estimated at 8 cents per pound in 2004/05, or about $1.1 billion. In contrastto Europe and the USA, China does not provide direct payments to cottongrowers but instead uses a complex system of import quotas and licenses torestrict trade and maintain domestic prices above the world level. TheGovernment of China claims in the WTO that it does not subsidize cotton,but the differential between international prices and equivalent domesticprices in China, adjusted for quality and common location, are persistent andsubstantial and well documented.
Government measures that boost cotton production have a negative impacton average international cotton prices in the short run. However, if subsidieswere eliminated, production would expand in other countries within two tothree seasons in response to higher prices, and many researchers feel that thelong run impact of government measures on cotton prices is probably small.Nevertheless, the distortions to cotton production caused by governmentmeasures are significant. In the absence of government support for cottonand other commodities, cotton production in the USA would decline by anestimated one-third over several seasons, and production in China (mainland)would probably fall by about one-tenth. As a consequence, between two andthree million tons of cotton production would shift from Europe, the USAand China toward lower cost producing countries if government measureswere eliminated.
13.7 Prices
International cotton prices have declined over time due to more efficientproduction practices. During the 1950s and 1960s, as production rose whileconsumption was affected by growth in the use of chemical fibers, cottonprices generally trended lower (Fig. 13.10). The Cotlook A Index, an indicatorof world cotton prices (method of calculation), dropped from more than 50cents per pound in 1950 to less than 30 cents by the end of the 1960s. Duringthe 1970s cotton prices were influenced by the same factors of inflation,rising demand, concerns about trade embargoes and increases in productioncosts that affected all commodity markets, and the Cotlook A Index rose tomore than 70 cents per pound. During the ten years to 1985/86 internationalcotton prices averaged 75 cents per pound. Between 1985/86 and 1994/95,
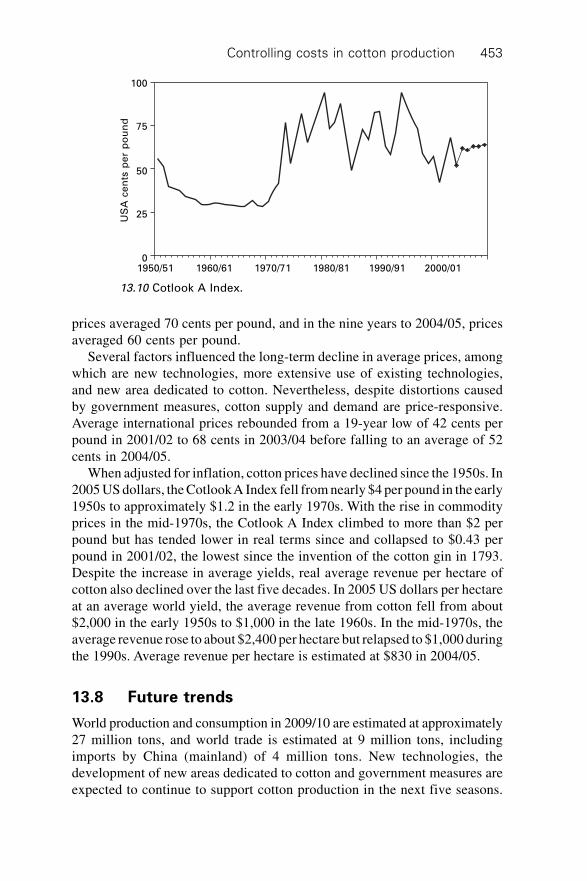
Controlling costs in cotton production 453
prices averaged 70 cents per pound, and in the nine years to 2004/05, pricesaveraged 60 cents per pound.
Several factors influenced the long-term decline in average prices, amongwhich are new technologies, more extensive use of existing technologies,and new area dedicated to cotton. Nevertheless, despite distortions causedby government measures, cotton supply and demand are price-responsive.Average international prices rebounded from a 19-year low of 42 cents perpound in 2001/02 to 68 cents in 2003/04 before falling to an average of 52cents in 2004/05.
When adjusted for inflation, cotton prices have declined since the 1950s. In2005 US dollars, the Cotlook A Index fell from nearly $4 per pound in the early1950s to approximately $1.2 in the early 1970s. With the rise in commodityprices in the mid-1970s, the Cotlook A Index climbed to more than $2 perpound but has tended lower in real terms since and collapsed to $0.43 perpound in 2001/02, the lowest since the invention of the cotton gin in 1793.Despite the increase in average yields, real average revenue per hectare ofcotton also declined over the last five decades. In 2005 US dollars per hectareat an average world yield, the average revenue from cotton fell from about$2,000 in the early 1950s to $1,000 in the late 1960s. In the mid-1970s, theaverage revenue rose to about $2,400 per hectare but relapsed to $1,000 duringthe 1990s. Average revenue per hectare is estimated at $830 in 2004/05.
13.8 Future trends
World production and consumption in 2009/10 are estimated at approximately27 million tons, and world trade is estimated at 9 million tons, includingimports by China (mainland) of 4 million tons. New technologies, thedevelopment of new areas dedicated to cotton and government measures areexpected to continue to support cotton production in the next five seasons.
13.10 Cotlook A Index.
1950/51 1960/61 1970/71 1980/81 1990/91 2000/01
100
75
50
25
0
US
A c
en
ts p
er
po
un
d

Cotton: Science and technology454
Area dedicated to biotech cotton varieties is expected to climb to 40% ofworld area accounting for 50% of cotton production. The average worldyield is expected to surpass 800 kilograms per hectare. Over the next fiveyears, cotton consumption is expected to expand at an annual rate of 3%.Consumption in China (mainland) is projected to climb to 11 million tons in2009/10, approximately 40% of world mill use. Cotton’s share of the worldtextile fiber market is projected to remain near 40%.
Because of the increasing importance of China (mainland) to the worldcotton market, net trade between China and the rest of the world will continueto play an important role in determining cotton prices. World endingstocks are projected to average 45% of global consumption over the nextfive years, down from 50% on average from 1997/98 to 2004/05. In contrast,the stocks-to-use ratio (the ratio of stock on 31 July each year (the end of theseason) divided by consumption during the season – a measure of how tightstocks are relative to demand (used as a key indicator of the direction ofprices)) outside China (mainland) is expected to average 70% over the nextfive seasons, sharply up from an average of 40% during the 1990s.
Year-to-year changes in cotton production are determined by marginalcosts, not by average production costs. Therefore, cotton prices tendtoward the marginal cost of the most efficient producers, not the worldaverage production cost. Costs of production worldwide are coming down.At current exchange rates, marginal production costs – and in the case ofmore efficient producers, total costs – are below 55 cents per pound inseveral countries. Competing chemical fibers will put additional pressure oncotton prices. The consequence will be lower average prices over the nextdecade compared to the 70 cent average of the last 30 years, and the CotlookA Index is expected to average between 45 and 55 cents per pound between2005 and 2015.
13.9 Sources of further information
Statistical information about the world cotton industry is available fromthree main sources. The International Cotton Advisory Committee providescomprehensive statistics on world cotton supply, use and prices by countryfrom the 1920s. The ICAC provides extensive information on fiber useand market share by country, government measures, trade by country oforigin and destination, and statistics on production and trade in cottonyarn and woven cotton fabric. In addition, the ICAC provides technicalinformation on cotton production practices, costs of production, and newtechnologies affecting cotton production. Information is available atwww.icac.org.
The US Department of Agriculture has several important web sites forcotton information. Data on area, yield and production by state, as well as

Controlling costs in cotton production 455
reports on input use in cotton are available from the National AgriculturalStatistics Service at www.USDA.Gov/Nass/. Data on consumption, marketshare, production and trade are available from the Economic ResearchService at www.ERS.USDA.gov/Briefing/cotton. Data on trade in cottonand reports from USA agricultural attaches in embassies around the worldare available from the Foreign Agriculture Service at www.FAS.USDA.gov/Cotton.
A private company in Liverpool, UK publishes an industry magazine andinformation service known as Cotton Outlook at www.cotlook.com. This isthe best source for data on cotton prices. The International Textile ManufacturersAssociation, ITMF, provides valuable statistics on industry capacity andtextile machinery shipments at www.ITMF.org. The International CottonAssociation in Liverpool provides data on arbitration of disputes that arisefrom trade in cotton. Their address is www.LCA.org.uk.
Several interesting books for general readership have been published inthe past year dealing with different aspects of cotton and providing insightinto the culture and workings of the international cotton industry. The bestfor objective information about the economics of the cotton industry is,The Travels of a T-Shirt in the Global Economy, by Pietra Rivoli.Another book, Big Cotton, by Stephen Yafa provides insights into the role ofcotton in the industrial revolution and how cotton has influenced the politicsof the United States. A third book, The King of California, looks at thehistory of one family in California that became the largest cotton producer inthe USA.
A number of magazines and industry journals provide in-depth reports onvarious subjects of national and international interest to the cotton industry.In addition to Cotton Outlook mentioned earlier, there is Cotton International
(CI) World Report from Meister Publishing. A free weekly newsletter isavailable at www.ciworldreport.com/newswire.
A magazine, Cotton Bangladesh, contains stories about the structure ofthe cotton textile industries in South Asia. Contact them at [email protected].
An excellent source of information about developments in the textileindustries of Asia, especially China (Mainland) is the magazine, Textile
Asia, published in Hong Kong. Contact them at www.textilasia-businesspress.com.
13.10 References
All statistics and information in this chapter were sourced from publicationsof the Secretariat of the International Cotton Advisory Committee.
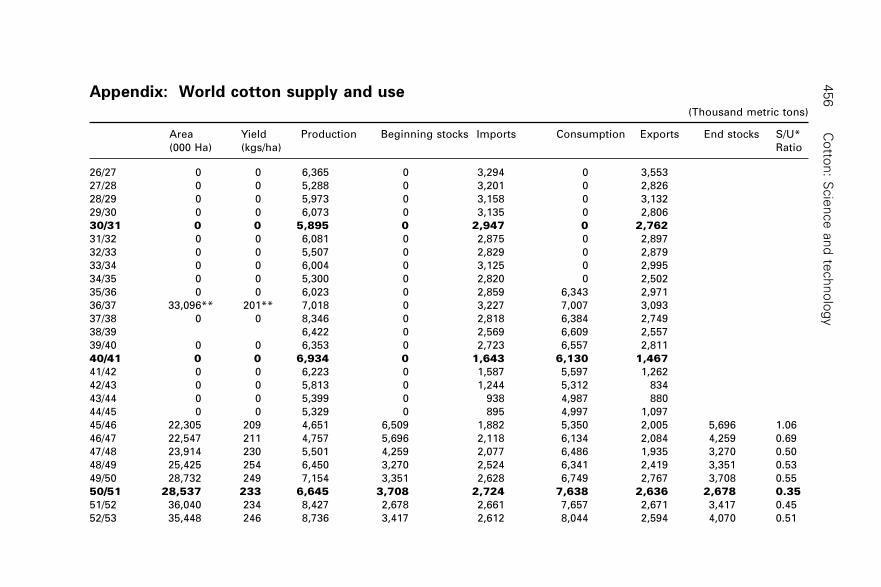
Co
tton
: Scie
nce
an
d te
ch
no
log
y4
56Appendix: World cotton supply and use
(Thousand metric tons)
Area Yield Production Beginning stocks Imports Consumption Exports End stocks S/U*
(000 Ha) (kgs/ha) Ratio
26/27 0 0 6,365 0 3,294 0 3,553
27/28 0 0 5,288 0 3,201 0 2,826
28/29 0 0 5,973 0 3,158 0 3,132
29/30 0 0 6,073 0 3,135 0 2,806
30/31 0 0 5,895 0 2,947 0 2,762
31/32 0 0 6,081 0 2,875 0 2,897
32/33 0 0 5,507 0 2,829 0 2,879
33/34 0 0 6,004 0 3,125 0 2,995
34/35 0 0 5,300 0 2,820 0 2,502
35/36 0 0 6,023 0 2,859 6,343 2,971
36/37 33,096** 201** 7,018 0 3,227 7,007 3,093
37/38 0 0 8,346 0 2,818 6,384 2,749
38/39 6,422 0 2,569 6,609 2,557
39/40 0 0 6,353 0 2,723 6,557 2,811
40/41 0 0 6,934 0 1,643 6,130 1,467
41/42 0 0 6,223 0 1,587 5,597 1,262
42/43 0 0 5,813 0 1,244 5,312 834
43/44 0 0 5,399 0 938 4,987 880
44/45 0 0 5,329 0 895 4,997 1,097
45/46 22,305 209 4,651 6,509 1,882 5,350 2,005 5,696 1.06
46/47 22,547 211 4,757 5,696 2,118 6,134 2,084 4,259 0.69
47/48 23,914 230 5,501 4,259 2,077 6,486 1,935 3,270 0.50
48/49 25,425 254 6,450 3,270 2,524 6,341 2,419 3,351 0.53
49/50 28,732 249 7,154 3,351 2,628 6,749 2,767 3,708 0.55
50/51 28,537 233 6,645 3,708 2,724 7,638 2,636 2,678 0.35
51/52 36,040 234 8,427 2,678 2,661 7,657 2,671 3,417 0.45
52/53 35,448 246 8,736 3,417 2,612 8,044 2,594 4,070 0.51

Co
ntro
lling
co
sts
in c
otto
n p
rod
uctio
n4
57
Appendix: (continued)
Area Yield Production Beginning stocks Imports Consumption Exports End stocks S/U*
(000 Ha) (kgs/ha) (Thousand metric tons) Ratio
53/54 33,422 271 9,068 4,070 2,877 8,443 2,916 4,626 0.55
54/55 33,445 267 8,930 4,626 2,756 8,678 2,686 4,862 0.56
55/56 34,078 279 9,508 4,862 2,882 8,972 2,830 5,349 0.60
56/57 33,417 275 9,183 5,349 3,409 9,352 3,438 5,124 0.55
57/58 32,032 283 9,053 5,124 3,092 9,343 3,061 4,810 0.51
58/59 31,657 308 9,760 4,810 3,043 9,942 2,937 4,609 0.46
59/60 32,326 318 10,286 4,609 3,788 10,531 3,772 4,407 0.42
60/61 32,445 314 10,201 4,407 3,804 10,231 3,667 4,551 0.44
61/62 33,057 297 9,832 4,551 3,463 9,982 3,367 4,532 0.45
62/63 32,633 320 10,444 4,532 3,638 9,845 3,450 5,260 0.53
63/64 32,968 330 10,877 5,260 3,879 10,362 3,910 5,845 0.56
64/65 33,366 345 11,504 5,845 3,811 11,165 3,721 6,312 0.57
65/66 33,133 359 11,898 6,312 3,809 11,429 3,712 6,879 0.60
66/67 30,915 350 10,836 6,879 3,934 11,618 3,974 6,032 0.52
67/68 30,670 351 10,780 6,032 3,828 11,752 3,805 5,068 0.43
68/69 31,692 374 11,856 5,068 3,718 11,772 3,640 5,240 0.45
69/70 32,658 348 11,379 5,240 3,932 12,010 3,880 4,724 0.39
70/71 31,778 369 11,740 4,656 4,086 12,173 3,875 4,605 0.38
71/72 33,024 392 12,938 4,681 4,031 12,721 4,111 4,799 0.38
72/73 33,818 402 13,595 4,851 4,528 13,034 4,640 5,358 0.41
73/74 32,558 418 13,615 5,434 4,408 13,469 4,294 5,727 0.43
74/75 33,285 418 13,926 5,727 3,734 12,641 3,814 7,373 0.58
75/76 30,001 390 11,706 7,352 4,188 13,336 4,183 5,770 0.43
76/77 31,513 393 12,385 5,770 3,951 13,122 3,806 5,232 0.40
77/78 34,966 396 13,860 5,232 4,250 13,133 4,239 5,963 0.45
78/79 34,000 380 12,933 5,963 4,320 13,703 4,346 5,257 0.38
79/80 33,100 425 14,084 5,255 5,093 14,127 5,073 5,257 0.37

Co
tton
: Scie
nce
an
d te
ch
no
log
y4
58
Appendix: (Continued)(Thousand metric tons)
Area Yield Production Beginning stocks Imports Consumption Exports End stocks S/U*
(000 Ha) (kgs/ha) Ratio
80/81 33,667 411 13,831 5,152 4,555 14,215 4,414 4,994 0.35
81/82 33,948 442 14,991 4,994 4,405 14,147 4,373 5,852 0.41
82/83 32,569 445 14,479 5,852 4,350 14,452 4,261 5,926 0.41
83/84 32,137 451 14,499 5,926 4,617 14,655 4,309 6,121 0.42
84/85 35,217 546 19,247 6,121 4,602 15,108 4,520 10,247 0.68
85/86 32,792 532 17,461 10,247 4,763 16,589 4,479 11,366 0.69
86/87 29,503 518 15,269 11,366 5,516 18,198 5,755 8,251 0.45
87/88 31,238 564 17,609 8,251 5,094 18,117 5,121 7,668 0.42
88/89 33,522 546 18,301 7,668 5,654 18,470 5,726 7,312 0.40
89/90 31,640 549 17,365 7,312 5,431 18,675 5,293 6,146 0.33
90/91 33,050 574 18,978 6,146 5,220 18,574 5,073 6,709 0.36
91/92 34,710 596 20,677 6,709 6,497 18,636 6,091 9,312 0.50
92/93 32,238 557 17,943 9,313 5,690 18,634 5,525 8,694 0.47
93/94 30,430 554 16,861 8,694 5,766 18,496 5,911 7,028 0.38
94/95 32,114 584 18,762 7,028 6,458 18,278 6,312 7,561 0.41
95/96 36,056 564 20,330 7,561 5,805 18,405 5,999 9,129 0.50
96/97 34,111 575 19,599 9,129 6,134 19,049 6,049 9,844 0.52
97/98 33,746 595 20,094 9,844 5,737 18,990 5,973 10,672 0.56
98/99 32,846 569 18,705 10,674 5,390 18,451 5,508 10,937 0.59
99/00 31,929 598 19,095 10,937 6,034 19,603 6,111 10,359 0.53
00/01 31,766 612 19,457 10,359 5,734 19,845 5,881 9,953 0.50
01/02 33,381 644 21,490 9,953 6,229 20,305 6,448 10,771 0.53
02/03 29,924 645 19,294 10,771 6,538 21,235 6,676 8,661 0.41
03/04 32,190 644 20,720 8,661 7,292 21,325 7,255 8,111 0.38

Co
ntro
lling
co
sts
in c
otto
n p
rod
uctio
n4
59
Appendix: (Continued)(Thousand metric tons)
Area Yield Production Beginning stocks Imports Consumption Exports End stocks S/U*
(000 Ha) (kgs/ha) Ratio
04/05 est. 35,757 733 26,219 8,111 7,171 23,400 7,643 10,450 0.45
05/06 proj. 35,238 689 24,272 10,450 8,078 23,925 8,078 10,795 0.45
06/07 proj. 35,490 699 24,814 10,795 8,191 24,609 8,191 11,001 0.45
07/08 proj. 35,657 709 25,286 11,001 8,313 25,090 8,313 11,197 0.45
08/09 proj. 36,011 716 25,787 11,197 8,482 25,575 8,482 11,409 0.45
09/10 proj. 36,421 718 26,165 11,409 8,788 26,084 8,788 11,491 0.44
* Stocks-to-use ratio equals ending stocks divided by consumption.
** Annual average during 1934–1938.
460
14.1 Introduction
Health and safety are key components of responsible production and processingof cotton and of a responsible management system for cotton operations.Workers handle and process cotton in many work operations from plantingthe cottonseed, to the finished cotton textile (i.e., from ‘field-to-fabric’ orfrom ‘dirt-to-shirt’) – production, harvesting, ginning, yarn and fabricmanufacturing, and preparation, dyeing and finishing. Each cotton industrysector has its own particular health and safety considerations. This chapteraddresses the more pertinent health and safety issues for each sector of thecotton industry.
In the USA, health and safety guidelines and regulations are issued orpromulgated and enforced by the US Occupational Safety and HealthAdministration (OSHA), which is part of the US Department of Labor (DOL).The purpose of OSHA is to ensure that the employers maintain a safe andhealthful workplace. In the UK, health and safety regulations and guidelinesare developed and enforced by the Health & Safety Executive (HSE). Themission of the HSE is to protect people’s health and safety by ensuring risksin the changing workplace are properly controlled. Australia incorporatesgovernment occupational health and safety legislation into a best managementpractice (BMP) approach (Chaudhry, 2004; Slack-Smith, 2000; AustralianCotton Industry, 2006) for cotton production. Adoption of the BMP systemis used by growers as a positive feature in marketing Australian cotton,because it demonstrates safe pesticide use and ecologically safer practicesfor workers and the surrounding communities.
In addition to regulations and guidelines by the individual countries, thereare voluntary standards for occupational health and safety developed byinternational organizations, such as the International Organization forStandardization (ISO) and the European Union (EU), European Committeefor Standardization (CEN). ISO standards are routinely adopted or incorporatedby reference by over 100 countries and include standards for agriculture,
14Health and safety issues in cotton
production and processing
P J W A K E L Y N, National Cotton Council, USA
Health and safety issues in cotton production and processing 461
(ISO ICS 65 Agriculture Standards (2006)), and textiles (ISO ICS 59 Textileand Leather Technology (2006)), as well as standards for quality management(ISO, 9000) and environmental management (ISO 14000) (ISO 9000and ISO 14000,2006), which are among ISO’s most widely knownstandards ever. ISO 9000 and ISO 14000 standards are implemented bysome 760,900 organizations in 154 countries. ISO 9000 has become aninternational reference for quality management requirements in business-to-business dealings, and ISO 14000 enables organizations to meet theirenvironmental challenges. The American Conference of GovernmentalIndustrial Hygienists (ACGIH), an independent standard setting organizationis the USA, has threshold limit values (‘TLVs’; worker/workplace exposurelimits) for hazardous substances and exposures (ACGIH, 2006) that somecountries (e.g., Canada) in the world routinely adopt or incorporate by referenceinto their regulations.
Most of the about 80 countries in the world where cotton is grown and/orprocessed have workplace health and safety regulations, procedures, andguidelines and routinely adopt international standards to help provide safeand healthful workplaces. The USA occupational health and safety standardsand guidelines are comprehensive and represent a good model for cottonindustry segments in other countries to consider. In this chapter, USA safetyand health regulations and guidelines are used, for the most part, as illustrationsof prudent occupational health and safety procedures for providing safe andhealthful workplaces in the various cotton industry segments.
US OSHA agriculture standards (29 Code of Federal Regulation [CFR]1928) apply to cotton production and ginning. US OSHA general industrystandards (29 CFR 1910) apply to post-harvest cotton operations (i.e.,warehouses and textile manufacturing and processing). In addition, the USOccupational Safety and Health Act (Sec. 5(a)(1) of the ‘OSH Act’) requiresthe employer to maintain a safe and healthful workplace.
Both hazard – anything that can cause harm (e.g., chemicals) – and risk –the chance, high or low, that someone will be harmed by the hazard – arediscussed. Hazard is the innate nature of the product, whereas risk is determinedby exposure. Thus a monomer or dye component may be a hazardous substancebut the insoluble polymer or dyed fabric (i.e., the final product) are not a riskbecause there is no exposure to the hazard.
When cotton is grown and processed (including yarn manufacturing andwet processing) in a responsible manner, the production and processing ofcotton should not have any adverse effects on the worker (because of acuteor chronic effects), the consumer (because of acute or chronic effects), or theenvironment (through crop protection product/chemical use, external emissions,wastewater effluents, and solid wastes) (Wakelyn, 1994).
Cotton: Science and technology462
14.2 Cotton production
The agricultural transitions to mechanized power, and from mechanical tochemical to genetically engineered tools, have increased farm productivity,but have not decreased the health and safety stresses upon farmers (Batie andHealy, 1980, 1983 (or the original publication in 1980); Martin and Olmstaed,1985). Since the early 1960s, agriculture has become one of the most hazardousoccupations (Batie and Healy, 1983; Mutal and Donham, 1983), mainly becauseof modern farm equipment. Cotton production potentially has most of thesame health and safety considerations as other row crops.
The production of cotton in the developed countries is heavily mechanizedand is dependent on chemical based production systems. The proper use andhandling of crop protection products is the most important health and safetyactivity in cotton production in developed as well as developing countries.Health hazards of pesticide/crop protection products application, disposal ofpesticide containers and many other aspects of pesticide storage, handlingand disposal have caused damage to human life and the environment in thepast and still do in some of the about 80 countries (59 countries grow at least5000 ha) where cotton is grown. The development of new crop protectionproducts, less persistent and less toxic to humans, has been helpful in reducingrisks to human life and the environment. Many countries like the USA havestrict regulations for approval of crop protection products (US EPA, 2006) aswell as strict worker protection standards for pesticide handlers and agriculturalworkers for application of crop protection products (US EPA, 2006a) andregulations for safe storage and disposal of used containers (US EPA, 2006b).These regulations, if followed, greatly reduce health risks to workers andthe environment.
There are occupational safety and health requirements for all mechanicalequipment (29 CFR 1928.51-53) and guides to protect workers from heatstress (US OSHA, 2002, 2006; US OSHA/EPA, 1993). Because of the hightemperatures, the state of California in 2006 finalized regulations for heatstress (CAL OSHA, 2006). There are also heat stress requirements in theworker protection standard (WPS) (US EPA 2006a).
14.2.1 Safety with agricultural equipment and machinery
Many farm accidents and fatalities involve mechanized farm equipment andmachinery. Many times these accidents and fatalities occur with children.There is a US OSHA standard for the protection of employees from thehazards associated with moving machinery parts of farm field equipment,farmstead equipment, and cotton gins used in any agricultural operation (29CFR 1928.57). Proper machine guarding and equipment maintenance accordingto manufacturers recommendations can help prevent accidents. Specificrequirements for cotton gins are discussed in section 14.3.
Health and safety issues in cotton production and processing 463
Tractor-related accidents are the leading cause of agricultural death in theUS. US OSHA has regulations for roll-over protective structures (ROPS) fortractors used in agricultural operations (29 CFR 1928.51) and for protectiveframes and enclosures for wheel type agricultural tractors (29 CFR 1928.52-53). Using protective equipment, such as seat belts on tractors, and personalprotective equipment (such as safety gloves, coveralls, boots, hats, aprons,goggles, face shields) also can significantly reduce farming injuries.
14.2.2 Worker protection standard for agriculturalpesticides
There are anecdotal stories of adverse effects of prolonged exposure ofpesticide use on cotton, such as a community reputed to have high levels ofthe chlorinated hydrocarbon, toxaphene, in fish. Dichlordiphenyltrichloroethane(DDT) is still found in soil samples and birds and small animals can bescarce in fields treated with agricultural chemicals. A much greater awarenessof potential harm to workers and the community and government regulationshas led the cotton industry in all developed countries and in mostdeveloping countries now to be very vigilant in regulating and monitoringpesticide use.
Overview of the WPS
The Australian BMP program (Chaudhry, 2004; Slack-Smith, 2000; AustralianCotton Industry, 2006) and the US Worker Protection Standard (‘WPS’, 40CFR 170) (US EPA, 2006a; NCC, 2004, 2005) are aimed at reducing the riskof pesticide poisonings and injuries among agricultural workers and pesticidehandlers. The US WPS contains requirements for
∑ pesticide safety training∑ notification of pesticide applications∑ use of personal protective equipment∑ restricted entry intervals (REI) following pesticide application (e.g., for
carbofuran, a broad spectrum insecticide, the REI is 48 hrs followingapplication)
∑ decontamination supplies∑ emergency medical assistance.
The WPS covers two types of employees on farms from occupational exposureto agricultural pesticides:
∑ Pesticide handlers – those who mix, load, or apply agricultural pesticides;clean or repair pesticide application equipment or assist with the applicationof pesticides in any way.
Cotton: Science and technology464
∑ Agricultural workers – those who perform tasks related to the cultivationand harvesting of plants on farms or in greenhouses, nurseries, or forests.Workers include anyone employed for any type of compensation (includingself-employed) doing tasks related to the production of agricultural plantson an agricultural establishment.
There are some WPS requirements that apply to all persons and some thatapply to anyone who handles pesticide application equipment or cleans orlaunders pesticide-contaminated personal protective equipment
Summary of WPS requirements
∑ Pesticide safety training and safety posters – training is required for allworkers and handlers, and a pesticide safety poster must be displayed.
∑ Access to labeling and site-specific information – Handlers and workersmust be informed of pesticide label requirements. Central posting ofrecent pesticide applications is required.
∑ Notification to workers – workers must be notified about treated areas sothey may avoid inadvertent exposures.
∑ Personal protective equipment – personal protective equipment must beprovided and maintained for handlers and early-entry workers.
∑ Protection during applications – applicators are prohibited from applyinga pesticide in a way that will expose workers or other persons. Workersare excluded from areas while pesticides are being applied.
∑ Restricted-entry intervals – restricted-entry intervals must be specifiedon all agricultural plant pesticide product labels. Workers are excludedfrom entering a pesticide-treated area during the restricted-entry interval,with only narrow exceptions.
∑ Decontamination supplies – Handlers and workers must have an amplesupply of water, soap, and towels for routine washing and emergencydecontamination.
∑ Emergency assistance – transportation must be made available to a medicalcare facility if a worker or handler may have been poisoned or injured.Information must be provided about the pesticide to which the personmay have been exposed.
WPS glove requirements for workers, handlers, and pilots
All agricultural pesticide handlers and early-entry workers covered by theWPS are permitted to wear separate glove liners beneath chemical-resistantgloves and agricultural pilots do not have to wear chemical-resistant gloveswhen entering or exiting aircraft. Handlers and early-entry workers maychoose whether to wear the liners. The liners may not be longer than the
Health and safety issues in cotton production and processing 465
chemical-resistant glove, and they may not extend outside the glove. Theliners must be disposed of after ten hours of use, or whenever the linersbecome contaminated. Lined or flocked gloves, where the lining is attachedto the inside of the chemical-resistant outer glove, remain unacceptable.Regulatory action was taken to reduce the discomfort of unlined chemicalresistant gloves, especially during hot or cold periods. Additionally, chemicallyresistant gloves do not add any appreciable protection against minimal pesticideresidues found around the cockpit of an aircraft.
Avoiding heat illness
The WPS requires employers to take any necessary steps to prevent heatillness (too much heat stress) while personal protective equipment is beingworn. The special clothing and equipment worn for protection from exposureto pesticides can restrict the evaporation of sweat. In addition, pesticides areabsorbed through hot, sweaty skin more quickly than through cool skin. Themany precautions against heat illness that employers should take aresummarized in section 14.2.3.
14.2.3 Heat stress
High air temperatures and humidities put agricultural workers at special riskof heat illness (CAL OSHA, 2006; US OSHA, 2006). In the US, workercompensation claims for heat illness among agricultural workers areamong the highest of any occupation. Pesticide handlers and early entryworkers are at even greater risk. As stress from heat becomes moresevere, there can be a rapid rise in body temperature and heart rate. Mentalperformance can be affected with an increase in body temperature of 2 ∞F(1.1 ∞C) above normal. An increase of 5 ∞F (2.8 ∞C) can result in seriousillness or death. EPA/OSHA’s A Guide to Heat Stress in Agriculture (USOSHA/EPA, 1993) offers practical, step-by-step guidance for non-technicalmanagers on how to set up and operate a heat stress control program. Theworker needs to be trained, the workload needs to be reduced, shade needsto be available as well as plenty of water (US OSHA, 2002 and 2006;California 2006).
As discussed above, the WPS also has requirements to prevent heat illness.Some of the requirements to prevent heat illness are:
∑ Training. Train workers and supervisors how to control heat stress andhow to recognize symptoms of heat illness.
∑ Monitoring and adjusting workloads. Take into account the weather,workload, and condition of the workers, and adjust work practicesaccordingly. Higher temperatures, high humidity, direct sun, heavy
Cotton: Science and technology466
workloads, older workers, and workers unaccustomed to heat are morelikely to become ill from heat. Things to do:– monitor temperature, humidity, and workers’ responses at least hourly
in hot environments;– schedule heavy work and PPE-related tasks for the cooler hours of the
day;– acclimatize workers gradually to hot temperatures;– shorten the length of work periods and increase the length of rest
periods;– give workers shade or cooling during breaks; and– halt work altogether under extreme conditions.
∑ Drinking. Make sure employees drink at least the minimum requiredamounts of water to replace body fluid lost through sweating. Thirst doesnot give a good indication of how much water a person needs to drink.
14.3 Harvesting and ginning
14.3.1 Harvesting
About 75% of world cotton production is hand picked and 25% is harvestedby machines. Hand harvesting can be a source of ergonomic problems. Thereshould be work practices in place that helps prevent such wrist and backinjuries. If the cotton is mechanically harvested, the US OSHA standard forthe protection of employees from the hazards associated with moving machineryparts of farm field equipment and farmstead equipment (29 CFR 1928.57) orsimilar practices should be followed. Proper machine guarding and equipmentmaintenance according to manufacturers recommendations can help preventaccidents.
14.3.2 Ginning
Since cotton ginning is essentially a continuation of harvesting, it is consideredto be an agricultural operation (Wakelyn et al., 2005). The only standardsthat US OSHA can apply to agricultural operations are the agriculture standardsin 29 CFR Part 1928 (US OSHA, 2002a) and the few general industrystandards referenced in 29 CFR 1928.21. The general industry standards thatapply to cotton gins include, the Hazard Communication Standard (29 CFR1910.1200) and temporary labor camps (29 CFR 1910.142). Machine guardingof cotton gins is covered by 29 CFR 1928.57. OSHA’s cotton dust standardat 29 CFR1910.1043(a)(2), specifically excludes cotton ginning from coverage.The dust in the cotton ginning workplace should be considered a ‘nuisance’dust or ‘particulate not otherwise regulated’ (29 CFR 1910.1000) not ascotton dust. In some countries cotton dust regulations may apply to ginning

Health and safety issues in cotton production and processing 467
and it is prudent health and safety practice to keep dust levels below1 mg/m3 respirable dust.
If hazards are found at cotton ginning operations that are not covered byspecific regulations, there should be practices in place to address all hazardsto workers. For example, standards for the control of hazardous energy(‘lockout/tag out’; 29 CFR 1910.147), confined space (29 CFR 1910.146),and noise (29 CFR 1910.95) do not specifically apply to cotton gins in theUS. However, the gin workplace should be monitored and, if there is risk ofthese hazards, consideration should be given to voluntarily complying withthese regulations in efforts to keep a safe and healthful workplace.
Machine guarding for cotton gins
Machine guarding (29 CFR 1928.57) is the only US agriculture standardspecifically for cotton gins. At the time of initial assignment and at leastannually thereafter, the employer should instruct every employee in the safeoperation and servicing of all covered equipment at the gin with which he isor will be involved, including at least the following safe operating practices:
1. Keep all guards in place when the machine is in operation.2. Stop the engine, disconnect the power source, and wait for all machine
movement to stop before servicing, adjusting, cleaning, or uncloggingthe equipment, except where the machine must be running to be properlyserviced or maintained, in which case the employer shall instruct employeesas to all steps and procedures which are necessary to safely service ormaintain the equipment.
3. Make sure everyone is clear of machinery before starting the engine,engaging power, or operating the machine.
4. Lock out electrical power before performing maintenance or service onfarmstead equipment.
5. Where guards are used to provide the protection required, they shall bedesigned and located to protect against inadvertent contact with thehazard being guarded.
14.4 Yarn and fabric manufacturing
The health and safety concerns for the processing of cotton into yarn andfabric are similar to those for the textile processing of most staple fibers(Wakelyn, 1997). Accidents can occur on all types of cotton textile machinery,though the frequency rate is low. Effective guarding and training of operatorsis important as is described below (section 14.4.1). Noise can also be aproblem, particularly in older textile mills (section 14.4.2). Since spinningsometimes requires high temperatures and high humidification of air, heat

Cotton: Science and technology468
stress can also be a problem for textile workers. Well designed andmaintained air-conditioned plants are replacing the primitive methods oftrying to control temperature and humidity, In addition, the worker needs tobe trained, the workload needs to be reduced, shade needs to be available aswell as plenty of water, as was discussed in section 14.2.3. Cotton dust canbe a major health and safety concern in yarn manufacturing of cotton (seesection 14.4.3).
14.4.1 Machinery guarding
Effective guarding of the moving parts presents problems and need constantattention. Training of operators in safe practices is essential and efforts needto prevent repairs to machinery while it is in motion. The facility shouldidentify energy sources, provide necessary equipment and train personnel toensure that all hazardous energy sources are turned off while working onequipment. Inspections should be performed on a regular basis to ensure thatall lockout/tagout procedures are followed and that workers do not removemachine guards while equipment is operating. The US OSHA standard fortextile safety, 29 CFR 1910.262, applies to the design, installation, processes,operation, and maintenance of textile machinery, equipment, and other plantfacilities in all plants engaged in the manufacture and processing of textiles,except those processes used exclusively in the manufacture of syntheticfibers. Other standards covering issues of occupational safety and health,which are of general application, are incorporated by reference in this rule.General safety requirements are in 29 CFR 1910.262 (c), including means ofstopping machines, machine guarding, housekeeping, identification of physicalhazards. 1910.262 (d) addresses openers; 1910.262 (e) cotton cards; 1910.262(h) slashers (where size is applied); and 1910.262 (j) drawing frames, roving,combers, spinning, and twisters.
14.4.2 Noise
Noise can be a problem in some yarn and fabric manufacturing operations,particularly in older yarn manufacturing operations and in weaving operationsthat do not use shuttleless looms. In most modern textile operations the noiselevels are below 90 dBA, the US standard (29 CFR 1910.95), and mostlikely below 85 dBA, which is when hearing conservation programs arerequired in the US and the noise standard in many countries. The US hearingconservation program (29 CFR 1910.95b), required when noise levels exceed85 dBA, includes noise-level monitoring, audiometric testing and makinghearing protection available to all employees when noise levels cannot beengineered below 90 dBA. The abatement efforts of machinery manufacturersand industrial noise engineers are continuing to decrease noise levels as

Health and safety issues in cotton production and processing 469
machinery speeds increase. The main solution for high noise levels is the useof more modern, quieter equipment.
14.4.3 Inhalation/respiratory disease (cotton dust)
Inhalation of cotton-related dust generated during the textile manufacturingoperations, where cotton fiber is converted into yarn and fabric, has beenshown to cause an occupational lung disease, byssinosis, in a small numberof textile workers (The Task Force for Byssinosis Prevention, 1995; USOSHA, 1985; Schilling and Rylander, 1994). It usually takes 15 to 20 yearsof exposure to higher levels of dust (above 0.5 to 1.0 mg/m3) for workers tobecome reactors.
Cotton dust is an airborne particulate matter released into the atmosphereas cotton is handled or processed in textile processing. It is a heterogeneous,complex mixture of botanical trash, soil, and microbiological material(i.e., bacteria and fungi), which varies in composition and biologicalactivity (Wakelyn et al., 1976). The etiological agent and pathogenesis ofbyssinosis are not known (The Task Force for Byssinosis Prevention, 1995;Nichols, 1991; Pickering, 1991; Rohrbach, 1991). Cotton plant trashassociated with the fiber and the endotoxin from gram-negative bacteriaon the fiber, plant trash, and soil are thought to be the causative or to containthe causative associated with worker reaction to dust. The cotton fiberitself, which is mainly cellulose, is not the causative, since cellulose is aninert dust that does not cause respiratory disease (Jacobs and Wakelyn, 1998).In fact, cellulose powder has been used as an inert control dust in humanexposure studies.
The US OSHA regulations for cotton dust apply to textile processing andweaving but do not apply to handling or processing of woven or knittedmaterials, harvesting, ginning, warehousing, classing/merchandizing, or knittingoperations. OSHA permissible exposure limits (PEL) for cotton dust measuredas an eight-hour time-weighted average with the vertical elutriator cottondust sampler are (US OSHA, 1985, 2006a):
1. yarn manufacturing, 200 mg/m3
2. textile mill waste house, 500 mg/m3
3. slashing and weaving, 750 mg/m3
4. waste processing (waste recycling and garneting), 1000 mg/m3.
The US OSHA cotton dust standard requires that these PELs be compliedwith using engineering controls and work practices. There are also requirementsfor monitoring, medical surveillance, and information and training for workers.Washed cotton may also be used to comply with the cotton dust standard. Amild water washing of cotton, by batch kier washing systems (The TaskForce for Byssinosis Prevention, 1995; Perkins and Olenchock, 1995) and

Cotton: Science and technology470
continuous batt systems (Wakelyn et al., 1986; US OSHA, 1985), reducesthe residual level of endotoxin in both lint and airborne dust to below levelsassociated with a zero percentage change in acute reduction in pulmonaryfunction as measured by forced expiratory volume in one second (FEV1)(The Task Force for Byssinosis Prevention, 1995).
Levels of endotoxin from Gram-negative bacteria generated during theprocessing of cotton are associated with the occupational respiratory diseasethat affects some textile workers (Glindmeyer et al., 1991, 1994; Castellan,et al., 1987; The Task Force for Byssinosis Prevention, 1995). Washed cottonis determined by levels of potassium and water-soluble reducing substances(WSRS) in the washed lint (Perkins and Olenchock, 1995). OSHA has acceptedseveral mild washing systems as qualifying as ‘washed cotton’ exemptionsunder the cotton dust standard (US OSHA, 1985, 2000):
1. Mild washing by the continuous batt system or a rayon rinse system iswith water containing a wetting agent, at not less than 60 ∞C, with water-to-fiber ratio of no less than 40:1, with bacterial levels in the wash watercontrolled to limit bacterial contamination of the cotton.
2. The batch kier washing system is with water containing a wetting agent,with a minimum of one wash cycle followed by two rinse cycles foreach batch, using fresh water in each cycle, and with bacterial levels inthe wash water controlled to limit bacterial contamination of the cotton.a. For low temperature, at not less than 60 ∞C, with water-to-fiber ratio
of no less than 40:1, orb. For high temperature, at not less than 93 ∞C, with a water-to-fiber
ratio of no less than 15:1.
Control studies in experimental cardrooms and a longitudinal study of alarge multi-mill population of workers processing cotton and synthetic fiberssuggest that, in today’s world, appropriate engineering controls in cottontextile processing areas, along with work practices, medical surveillance,and personal protective equipment for the most part can eliminate incidenceof workers’ reaction to cotton dust (Glindmeyer, 1991, 1994; The Task Forcefor Byssinosis Prevention, 1995). In US textile mills today, workers are notgetting respiratory disease due to exposure to cotton-related dust. This shouldbe true in all textile mills where dust exposures are controlled and workersare medically monitored.
14.5 Wet processing (preparation, dyeing, andfinishing)
Prior to dyeing, printing and finishing, cotton fibers, yarns, and fabrics requirepretreatments (referred to as ‘preparation’) to remove natural and otherimpurities (Cotton Incorporated, 1996). The common preparation processes

Health and safety issues in cotton production and processing 471
for cotton include singeing, desizing, scouring, bleaching, and mercerization.Cotton is dyeable in fiber form (raw stock), yarn, or fabric form with anextensive number of dye classes, including, azoic, direct, indigo, pigment,reactive, sulfur, and vat dyes. The selection of the appropriate dyes anddyeing processes for cotton is based on numerous factors depending on theapplication for which the dyed cotton fibers are to be used. Cotton finishingoperations include durable press/easy care, flame retardancy, soil release,water repellency and stain-resistance.
Many chemicals and processes are used in the preparation, dyeing andfinishing of cotton. Workers can be exposed to formaldehyde and otherfinishing chemicals such as flame retardants and strain-resistant/water repellentfinishes that can be of concern.
The safety standards for textile machinery also apply to preparation, dyeingand finishing operations: 29 CFR 1910.262 (p) covers bleaching equipmentfor cotton; (s) mercerizing ranges; (u)-(v) dyeing; (dd) printing; (oo) handlingcaustic soda and potash; and (rr) workroom ventilation for all workrooms inwhich potentially toxic chemicals are used.
14.5.1 Potential dye hazards
Dyes exist as powders, liquids, pastes, granules, pellets tablets, and otherforms. They all are a potential source of exposure to the worker that handlesthem. Some dyes pose a significant risk to health while others do not. Alldyes can be used safely as long as exposures are adequately controlled. Workpractices are one of the biggest factors determining exposure to dyes in theworkplace.
Powdered dyes can be an inhalation and sensitization problem and somedyes have been removed from use because of their potential to cause chronichealth effects (US National Institute of Occupational Safety and Health(NIOSH), 1997; UK Health and Safety Executive (HSE), 2005; Imada, 2005).To prevent some of the problems with powdered dyes, most dyes today aresold as a paste (already partially solublized) and work practices.
Control of dust from dye handling operations
The manual transfer of powder dyes from bulk containers to smaller processcontainers generates significant amounts of dust. Worker exposure to dyedust through breathing or skin contact can result in adverse health effectssuch as occupational asthma, eczema, and severe allergic reactions. In addition,benzidine, benzidine congener (o-tolidine and o-dianisidine) and some otherazo dyes, which by reductive cleavage of one or more azo groups mayrelease one or more aromatic amines, are recognized as potential occupationalcarcinogens because of their carcinogenic amine breakdown products (see
Cotton: Science and technology472
Table 14.1 and discussion below). Therefore, dye exposures should be limitedto the lowest feasible concentrations to prevent these health problems.
Workers in powder dye handling operations should be protected from dustexposure with the following combination of controls: hazard information,adequate ventilation, redesigned bulk containers, and appropriate work practices(US National Institute of Occupational Safety and Health (NIOSH), 1997;UK HSE, 2005; The Ecological and Toxicological Association of Dyes andOrganic Pigments Manufacturers (ETAD), 1997).
∑ Know the hazard: find out what happens if you get the dye on your skinor in your eyes; if you breath in dye dust, vapors, or mist; if you swallowthe dye; and the acute and chronic health effects from exposure to thedye. Read the material safety data sheet.
∑ Ventilation: semi-downdraft ventilation booths are recommended for useduring the manual transfer of dyes.
∑ Work practices: workers should use slow, smooth movements whenhandling dye to keep dust concentrations low. Dye transport distancesbetween the bulk and process containers should be kept to a minimum.The height at which the dye is dropped into a container should also bekept to a minimum. Workers should avoid skin contact with the dyes byusing protective clothing such as gloves, long-sleeved shirts, and aprons.
Reactive dyes
Reactive dyes have a high degree of water solubility and chemically bond tocotton. Fiber reactive dyes are brighter, longer-lasting, and easier-to-usethan other cotton dyes and are extensively used in women’s and other apparel.If they are ingested or inhaled they can react within the body (UK HSE,2005a). Sometimes this can affect the body’s immune system causing theperson to be sensitized to that dye. Sensitization may mean that that the nexttime a person is exposed to the same dye, their body could react dramatically,even if the amount is very small. Reactive dyes can be respiratory and/orskin sensitizers, however skin sensitization is rare.
Sensitization is unpredictable. Some may become sensitized, others maysuffer no adverse effects. There is no validated test procedure for assessingthe propensity of an individual reactive dye to cause respiratory sensitization.Thus, it is prudent to handle all reactive dyes as if they are respiratorysensitizers. All practicable steps should be taken to reduce exposure of employeeto reactive dyes, thereby reducing the risk of someone becoming sensitized.If someone does become sensitized, take steps to prevent their symptomsfrom becoming worse by avoiding any contact with that dye. The healthhazard from reactive dyes is only a concern before the application to thefabric – there is no known risk to anyone handling or wearing the dyedmaterials.
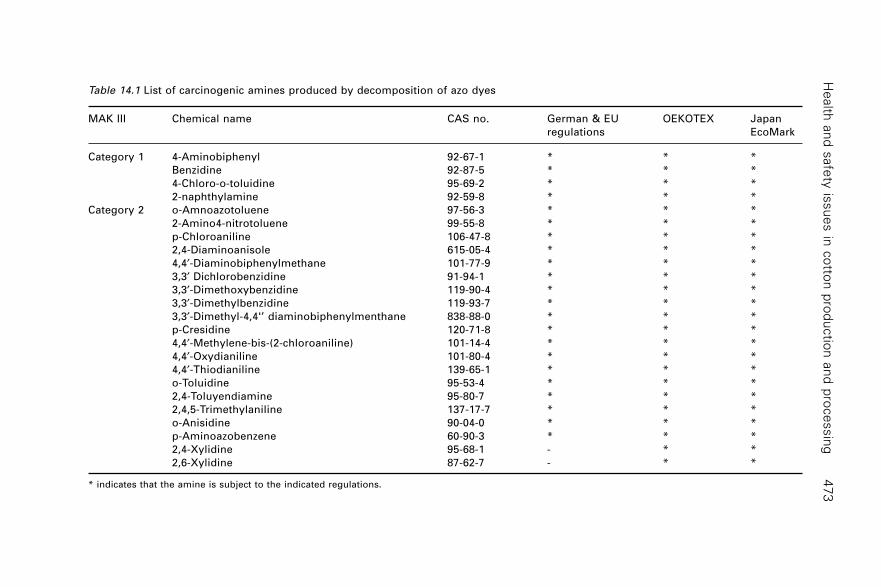
He
alth
an
d s
afe
ty is
su
es in
co
tton
pro
du
ctio
n a
nd
pro
ce
ssin
g4
73
Table 14.1 List of carcinogenic amines produced by decomposition of azo dyes
MAK III Chemical name CAS no. German & EU OEKOTEX Japan
regulations EcoMark
Category 1 4-Aminobiphenyl 92-67-1 * * *
Benzidine 92-87-5 * * *
4-Chloro-o-toluidine 95-69-2 * * *
2-naphthylamine 92-59-8 * * *
Category 2 o-Amnoazotoluene 97-56-3 * * *
2-Amino4-nitrotoluene 99-55-8 * * *
p-Chloroaniline 106-47-8 * * *
2,4-Diaminoanisole 615-05-4 * * *
4,4¢-Diaminobiphenylmethane 101-77-9 * * *
3,3¢ Dichlorobenzidine 91-94-1 * * *
3,3¢-Dimethoxybenzidine 119-90-4 * * *
3,3¢-Dimethylbenzidine 119-93-7 * * *
3,3¢-Dimethyl-4,4'’ diaminobiphenylmenthane 838-88-0 * * *
p-Cresidine 120-71-8 * * *
4,4¢-Methylene-bis-(2-chloroaniline) 101-14-4 * * *
4,4¢-Oxydianiline 101-80-4 * * *
4,4¢-Thiodianiline 139-65-1 * * *
o-Toluidine 95-53-4 * * *
2,4-Toluyendiamine 95-80-7 * * *
2,4,5-Trimethylaniline 137-17-7 * * *
o-Anisidine 90-04-0 * * *
p-Aminoazobenzene 60-90-3 * * *
2,4-Xylidine 95-68-1 - * *
2,6-Xylidine 87-62-7 - * *
* indicates that the amine is subject to the indicated regulations.

Cotton: Science and technology474
Benzidine and benzidine congener azo dyes
Many of the direct dyes that used to be used on cotton are benzidine-baseddyes. US OSHA, US NIOSH and other groups in the world have extensivelyreviewed the literature on benzidine-based dyes (US NIOSH, 1978, 1980,and 1980a). Available studies indicate that some benzidine-based dyes causecancer in experimental animals because they are converted in animals andhumans to benzidine. Benzidine-based dyes may contain residual amountsof benzidine as well as other substances such as 4-aminobiphenyl that areconsidered to be human and animal carcinogens. There is evidence fromanimal studies that o-tolidine, o-dianisidine, and dyes based on o-tolidine arecarcinogenic and that dyes based on o-tolidine and o-dianisidine, except formetalized dyes based on o-dianisidine, may be metabolically converted tothe parent compounds. Dyes manufactured from o-dianisidine and o-tolidinemay also contain residual amounts of the respective parent compounds.
From the accumulated evidence, US OSHA and US NIOSH conclude thatbenzidine-based dyes are potential human carcinogens. In a Special HazardReview, US NIOSH recommended that the commercial use of benzidine-based and benzidine congener dyes be discontinued and appropriate substitutesbe utilized. US OSHA also concluded that exposure of workers to the dyesshould be reduced to the lowest feasible levels. The use of dyes derived frombenzidine, o-tolidine, and o-dianisidine has been discontinued in the USAand the EU but could still be used in some developing countries.
Other azo dyes
Azo dyes make up 60–70% of all dyes used and are the most importantchemical class of dyes. Many of the dyes used on cotton are azo dyes (e.g.,fiber reactive, direct, azoic). Some azo dyes, if absorbed by the human body,can undergo reduction decomposition to form carcinogenic amines due toenzymes in the body that have reduction properties. Currently this includesthe 24 amines classified as substances known to be human carcinogens(Group III A 1 of the German MAK III list) and substances that are animalcarcinogens, i.e., potential human carcinogens (Group III A 2) that are shownin Table 14.1. (The number of amines varies according to the differentregulations because the regulations were drawn up at different times. Whenregulations are revised in the future, they will presumably cover all 24 amines.)
Azo dyes that produce carcinogenic amines due to reduction decompositionare subject to regulations in the European Union, the German government,through the German Goods Ordinance (ETAD, 1998), and the Oeko-TexStandard 100 (Austrian and German eco-label association; see Oeko-TexAssociation, 2006 and Oeko-Tex Initiative, 2006) and Japan Eco-label (Imada,2005). Not all azo dyes that are made using the amines listed in Table 14.1

Health and safety issues in cotton production and processing 475
as a raw material are regulated/banned, only the azo dyes that can breakdown producing these amines. Only about 5% of azo dye structures areaffected by these regulations and they are largely already phased out fortextiles in the EU and US. A dyeing facility should get verification from thesupplier or dyes manufacturer that the dyes they use are not subject to theEU and German restrictions (EC, 2002). Testing to verify that a dye is notsubject to regulation involves conducting reduction degradation tests withextracts of the dye and analyzing the amines that are produced. It is importantto note that different dyes with the same color index number can producedifferent results due to differences in the purity of the raw materials and intheir impurities.
14.5.2 Skin irritation/dermatitis
Handling or processing conventional US cotton does not cause skin irritation/dermatitis. Cellulose is essentially an inert substance and nothing on thefiber surface is known that could cause dermatitis problems. However, it isremotely possible that some very atypical cottons that have been treatedwith substances that are not approved for use or that are off-grade andperhaps are highly microbiologically damaged might cause skin irritation.These rare atypical cottons should be evaluated on a case-by-case basis, ifthey are to be used in a conventional way. The processes for preparation ofcotton for dyeing and finishing should remove anything that could causeskin irritation.
Some dyes used to color textiles are allergic contact dermatitis (ACD)allergens (Hatch et al., 2003). Hatch et al. (2003) showed by positive patch-test results that patients can have colored clothing ACD. They recommendthat the term ‘textile-dye ACD’ be used to name cases of ACD in which thepatient’s skin eruption is due to direct contact with dye molecules and theterm ‘colored-textile ACD’ for cases in which the patient’s skin eruption wasdue to transfer of dye from a textile to the skin.
14.5.3 Formaldehyde
Formaldehyde is a component of some finishes used on cotton (e.g.,formaldehyde and formaldehyde containing resins are used to impart easycare/durable press properties to cotton fabrics; the precondensate-ammoniaflame retardants). Dyeing and finishing operations potentially can exposeworkers to formaldehyde in concentrations that exceed workplace exposurelimits, if proper control procedures are not followed, since it can be releasedto the workplace during finishing operations and from some dyed and finishedcotton fabrics.

Cotton: Science and technology476
It was classified in 1987 by the US EPA as a ‘probable human carcinogen’(an animal carcinogen and limited evidence that it is a carcinogen in humans)under conditions of unusually high or prolonged exposure (US EPA, 1987).Since that time studies of industrial workers have suggested that formaldehydeis associated with nasopharyngeal cancer and possibly leukemia. In June2004, the International Agency for Research on Cancer (IARC) reclassifiedformaldehyde as a known human carcinogen for nasopharyngeal cancer (IARC,2004, 2004a; Anonymous, 2004). Non-cancer effects of exposure to lowairborne concentrations of formaldehyde are sensory irritation of the mucousmembranes of the eyes and the respiratory tract, and cellular changes in thenasal cavity (US EPA, 1987, 1991; IARC, 2004, 2004a).
The US OSHA workplace permissible exposure limit (PEL) forformaldehyde (29 CFR 1910.1048) is 0.75 ppm of air as an eight-hour time-weighted average concentration and 2 ppm of air as a 15-minute short-termexposure limit (STEL) (US OSHA, 2006b). These limits have to be met withengineering controls and work practices; there are also requirements formonitoring, medical surveillance, and information and training for workers.The ACGIH threshold limit value (TLV) for formaldehyde is 0.3 ppm shortterm exposure limit (STEL/ceiling) (ACGIH, 2006).
Exposure to formaldehyde from cotton textiles is controlled (i.e., reducedto an insignificant level) by the chemical technology low emitting formaldehyderesin technology and formaldehyde-free wrinkle resistance finishes (Welch,1990, 2000; Welch and Andrews, 1989) and by increased ventilation. Itshould be noted that in the 1980s, the US Consumer Product Safety Commission(US CPSC) studied the effects of various dyeing and finishing treatments,including durable-press finishing of cotton (US CPSC, 1984), and found noacute or chronic health problems of concern to consumers due to exposuresto formaldehyde or other finishing chemicals from textiles (Robbins, et al.,1984; Robbins and Norred, 1984).
14.5.4 Brominated flame retardants
The flame retardants of most concern are polybrominated diphenyl ethers(PBDE). Penta-BDE and octa-BDE are banned in Europe and some states inthe US. Deca-BDE, which is used along with antimony oxide to backcoatfabrics to meet the British flammability standard for upholstered furniture(BS 5852), has been thoroughly reviewed and is not considered toxic, althoughDenmark and some other EU countries want it banned also.Hexabromocyclododecane (HBCD), used to backcoat upholstery fabric, isalso under review in the EU. Antimony oxide, which is usually used withbrominated flame retardants to convey flame resistance is being reviewed inthe EU.

Health and safety issues in cotton production and processing 477
14.5.5 Perfluorinated chemicals
The degradation/breakdown of short-chain fluorinated alcohols (mixed short-chained perfluorinated telomers), used as finishes to make textiles resistantto water, stains, and grease, are thought to be sources in the environmentof perfluorooctanoic acid (PFOA). PFOA is persistent in the environment,it has been detected in low levels in wildlife and humans, and animalstudies conducted have indicated effects of concern. PFOA is underconsideration in the US to be classified as a ‘likely’ human carcinogen(Schultz and Dodd, 2005; Ritter, 2004). Eight US companies that make oruse PFOA and related chemicals were asked by the US EPA (Jan. 25, 2006)to voluntarily (voluntary initiative is the ‘2010/2015 PFOA StewardshipProgram’; http://www.epa.gov/opptintr/pfoa/pfoastewardship.htm) reducereleases of those chemicals and to limit the amount of PFOA in products by95% by 2010 and to work toward eliminating exposure to PFOA from otherchemicals by no later than 2015.
Perfluorooctyl sulfonate (PFOS), which was used in the 3M Scotchgardstain-resistant finish, and related compounds were voluntarily phased out ofuse in the US May 2000 (effective the end of 2002) following negotiationsbetween US EPA and 3M, because data showed it to be persistent,bioaccumulative, and toxic (Ritter, 2004). In 2002 the Organization forEconomic Cooperation and Development (OECD) found exposure to PFOScauses liver damage and death in laboratory animals (OECD, 2002). 3M hasfound substitutes for the specific PFOS chemicals of concern that were usedin a wide range of their products. These are smaller telomers that are notsulfonates. PFOS also is being considered for restricted use in the UK (UKDefra, 2005). Most companies no longer use these fluorinated chemicals forfear of liability. Most, if they use fluorinated chemicals, use ones that are notpotential sources of PFOA or PFOS.
14.5.6 Solvents
Millions of workers are exposed to solvents on a daily basis. Health hazardsassociated with solvent exposure include toxicity to the nervous system,reproductive damage, liver and kidney damage, respiratory impairment, cancer,and dermatitis. Solvents share many chemical, physical, and biologicalproperties that warrant attention be directed to them as a group. In addition,many solvent groups or individual substances have special properties requiringmore specialized control measures. US OSHA standards for permissibleexposure limits (PELs) (see below) and the hazard communication standard(HCS) (see section 14.5.5) would apply. Work practices and engineeringcontrols to limit exposures below the PEL (29 CFR 1910.1000) and materialsafety data sheets (MSDSs) are required.

Cotton: Science and technology478
14.5.7 Air contaminants
The air contaminants standards (29 CFR 1910.1000) are intended to reducethe risk of occupational illness for workers by reducing permissible exposurelimits (PEL) for chemicals. PELs are eight-hour time-weighted average (TWA)exposures. To achieve compliance with the PEL, administrative or engineeringcontrols must first be determined and implemented, whenever feasible. Whensuch controls are not feasible to achieve full compliance, personal protectiveequipment, work practices, or any other protective measures are to be usedto keep employee exposure below the PEL. ACGIH has TLVs for hazardoussubstances (ACGIH, 2006) as does HSE in the UK and ISO, the EU, andmost countries in the world. In the case of a mixture of contaminants, anemployer has to compute the equivalent exposure when the components inthe mixture pose a toxic effect on the same target organ to a worker’s health.
14.5.8 Hazard communication
The Hazard Communication Standard HCS (29 CFR 1910.1200) requires allemployers to provide information to their employees on the hazardouschemicals to which they are exposed through written hazard communicationprograms, labels and other forms of warning, material safety data sheets(MSDS), training programs, and recordkeeping. A substance is a ‘hazardouschemical’ if it is a ‘physical hazard’ or a ‘health hazard’ (29 CFR 1910.1200(c)). A flammable or explosive liquid is a ‘physical hazard’. A flammableliquid means ‘any liquid having a flashpoint below 110 ∞F (37.8 ∞C), exceptany mixture having components with flashpoints of 100 ∞F (37.8 ∞C) orhigher, the total of which make up 99% or more of the total volume of themixture’. ‘Health hazard’ means ‘a chemical for which there is statisticallysignificant evidence based on at least one valid study that acute or chronichealth effects may occur in exposed employees’.
Chemical manufacturers and importers are required to review the availablescientific evidence concerning the hazards of chemicals they produce orimport, and to report the information to manufacturing employers who usetheir products (29 CFR 1910.1200(b)). If a chemical mixture has not beentested as a whole to determine whether the mixture is a hazardous chemical,the mixture is assumed to present the same hazards as do the componentsthat comprise 1% or greater of the mixture or a carcinogenic hazard if itcontains a component in concentration of 0.1% or greater that is a carcinogen(29 CFR 1910.1200(a)(5)).
The globally harmonized system (GHS) of classification and labeling ofhazardous chemicals was adopted by the United Nations in 2003. The goalof the GHS is to promote common, consistent criteria for classifying chemicalsaccording to their health, physical and environmental hazards, and to develop
Health and safety issues in cotton production and processing 479
compatible labeling, material safety data sheets for workers, and otherinformation based on the resulting classifications.
Countries are now considering adoption of the GHS into their nationalregulatory systems. The goal is to have as many countries as possible implementthe GHS by 2008. This involves changing the criteria for classifying healthand physical hazards, adopting standardized labeling requirements, andrequiring a standardized order of information for MSDS. A harmonized systemwould lead to greater consistency among countries and thereby promotesafer transportation, handling and use of chemicals. Harmonized criteria,symbols and warnings will promote improved understanding of hazards andthus help to protect workers and other potentially exposed populations. Amore uniform, ‘harmonized’ system should also reduce costs for companiesinvolved in international trade.
14.6 Consumers
By the time cotton textiles reach the ultimate consumer, there should benothing known of or extractable from the original cotton fiber that wouldcause any health concerns to consumers (Wakelyn, 1994). However, variousdyeing and finishing treatments that cotton fabrics go through can leaveresidues on the fabric or release substances that could cause irritation toconsumers, if the treatments are not properly applied.
14.7 Future trends
In cotton production there most likely will continue to be more emphasis onenvironmental stewardship and less use of crop protection products. Theproducts used will be less persistent and less toxic to non-target species. Indyeing and finishing there will be stricter requirements for chemicals used.Also preparation, dyeing, and finishing processes will use less energy andwater. The image of cotton production and processing should be greatlyimproved and workers in cotton industry segments will be safer. We arealready seeing this with agricultural workers in areas where biotech cottonsare being grown.
14.8 References
American Conference of Industrial Hygienists (ACGIH) (2006), TLVs and BEIs.Anonymous (2004), ‘Formaldehyde, 2-Butoxyethanol and 1-tert-Butoxy-2-propanol’, IARC
Monographs on the Evaluation of Carcinogenic Risks to Humans, Vol. 88, 2–9 June2004, http://www-cie.iarc.fr/htdocs/announcements/vol88.htm.
Australian Cotton Industry (2006), Best Management Practices Manual (see http://www.cottonaustralia.com.au/bmpindex.html and http://www.crdc.com.au)

Cotton: Science and technology480
Batie SS and Healy RG eds (1980), The Future of American Agriculture as a Strategic
Resource, Washington DC, The Conservation Foundation.Batie SS and Healy RG (1983), ‘The Future of American Agriculture’, Scientific American,
248(2): 45–53.California Occupational Safety and Health Standards Board (CAL OSHA)(2006), Heat
illness prevention, effective 27 July 2006, General Industry Safety Order, Chapter 4,Subchapter 7, Article 10, New Section 3395 (http://www.dir.ca.gov/oshsb/heatillnessemergencytextbrdconsider.pdf).
Castellan RM, Olenchock SA, Kingsley KB and Hankinson JL (1987), ‘Inhaled endotoxinand decreased spirometric values: an exposure-response relationship for cotton dust’,New England J. of Medicine, 317, 605–610.
Chaudhry R (2004), ‘The Australian Best Management Practices Program’, ICAC Recorder,Vol. XXII, No. 1 March 2004, pp 14–17.
Cotton Incorporated (1996), Cotton Dyeing and Finishing: Technical Guide, CottonIncorporated, Cary, NC, 1996.
Ecological and Toxicological Association of Dyes and Organic Pigments Manufacturers(ETAD) (1997), Handling Dyes Safely.
Ecological and Toxicological Association of Dyes and Organic Pigments Manufacturers(ETAD) (1998), Information Notice No. 6, German ban of use of certain azo compoundsin some consumer goods (http://www.etad.com/information/information 6.html).
EC (2002), EU Directive 2002/61/EC of the European Parliament and of the Council of19 July 2002, ‘amending for the 19th time Council Directive 78/769/EEC relating torestrictions on the marketing and use of certain dangerous substances and preparations(azocolourants) (2002), Off J European Communities 11.9, L243/15-L243/18.
Glindmeyer HW, Lefants JJ, Jones RN, Rando RJ, Abdel HM and Weill H (1991),‘Exposure-relationship declines in lung function of cotton textile workers: relationshipto current workplace standards’, Am. Rev. Respir. Dis., 144, 675–683.
Glindmeyer HW, Lefants JJ, Jones RN, Rando RJ and Weill H (1994), ‘Cotton dust andacross-shift changes in FEV1 as predictors of annual change in FEV1’, Am. J. Respir.
Care Med., 149, 584–590.Hatch KL, Motschi H and Maibach HI (2003), ‘Textile-dye and colored-textile allergic
contact dermatitis’, Exog Dermatol 2, 206–209.IARC (2004a), ‘Formaldehyde’, 5. Summary of Data Reported and Evaluation (7 Sep
2004), http://www-cie.iarc.fr/htdocs/monographs/vol88/formal.htmlImada K (2005), ‘Regulations concerning azo dyestuffs’, http://textileinfo.com/en/tech/
imada/sennryou/page05.htmlInternational Agency for Research on Cancer (IARC) (2004), ‘IARC Classifies
Formaldehyde as Carcinogenic to Humans’, Press Release No. 153, 15 June 2004http://www.iarc.fr/ENG/Press_Releases/pr153a.html
International Organization for Standardization (ISO) ICS 65 Agriculture Standards (2006),http://webstore.ansi.org/ansidocstore/dept.asp?dept_id=440
International Organization for Standardization (ISO) ICS 59 Textile and Leather Technology(2006), http://webstore.ansi.org/ansidocstore/dept.asp?dept_id=420)
International Organization for Standardization (ISO 9000 (Quality Management) andISO 14000 (Environmental Management) (2006), (http://www.iso.org/iso/en/iso9000-14000/understand/inbrief.html)
Jacobs RR and Wakelyn PJ (1998), ‘Assessment of toxicology (respiratory risk) associatedwith airborne fibrous cotton-related dust’, in Proc. 1998 Beltwide Cotton Conf., NationalCotton Council, Memphis, TN, pp. 213–220.

Health and safety issues in cotton production and processing 481
Martin PL and Olmstead AL (1985), ‘The Agricultural Mechanization Controversy’,Science, 227: 601–606.
Mutel CF and Donham KJ (1983), Medical Practices in Rural Communities. Springer-Verlag, New York, pp. 77–78.
National Cotton Council/Progressive Farmer (2004), Be smart, be safe with farm chemicals,http://www.cotton.org/tech/safety/wps/upload/Be-Smart-Be-Safe-with-Farm-Chemicals.pdf
National Cotton Council (2005), Worker protection standard, http://www.cotton.org/tech/safety/wps/index.cfm
Nichols PJ (1991), ‘The search for the aetiological agent and pathogenic mechanisms ofbyssinosis: in vivo studies’, in Proc. of the 15th Cotton Dust Research Conference,Jacobs RR, Wakelyn PJ and Domelsmith, LN, eds, National Cotton Council, Memphis,TN, pp. 307–320.
Organization for Economic Cooperation and Development (OECD) (2002), ‘Hazardassessment of perflorooctane sulfonate (PFOS) and its salts’, http://www.oecd.org/dataoecd/23/18/2382880.pdf
Oeko-Tex Association (2006), http://www.oeko-tex.com/en/main.html.Oeko-Tex initiative (2006), International Association for Research and testing in the field
of Textile Ecology. (Eco-Tex Standard 100).Perkins Jr HH and Olenchock SA (1995), ‘Washing cotton by batch processes to control
dust and endotoxin’, Ann. Agric. Environ. Med., 2, 1.Pickering CAC (1991), ‘The search for the aetiological agent and pathogenic mechanisms
of byssinosis: a clinician’s view of byssinosis’, in Proc. of the 15th Cotton Dust
Research Conference, Jacobs RR, Wakelyn PJ, and Domelsmith LN, eds, NationalCotton Council, Memphis, TN, pp. 298–299.
Ritter SK (2004), ‘Polyfluorinated alcohols shown to be key source of bioaccumulatingperfluorocarboxylic acids’, Chem & Eng News, 82(24), 44–45.
Robbins JD and Norred WP (1984), ‘Bioavailability in Rabbits of Formaldehyde fromDurable Press Textiles’, Final Report on CPSC IAG 80-1397, USDA Toxicology andBiological Constituents Research Unit, Athens, GA, 1984.
Robbins JD, Norred WP, Bathija A, and Ulsamer AG (1984), ‘Bioavailability in rabbitsof formaldehyde from durable press textiles’, J. Tox. Environ. Health, 14, 453–463.
Rohrbach MS (1991), ‘The search for the aetiological agent and pathogenic mechanismsof byssinosis: a review of in vitro studies’, in Proc. of the 15th Cotton Dust Research
Conference, Jacobs RR, Wakelyn PJ and Domelsmith LN, eds, National Cotton Council,Memphis, TN, pp. 300–306.
Schilling R and Rylander R (1994), ‘Cotton dust’, in Organic Dusts, Exposure, Effects,
and Prevention, Rylander R and Jacobs RR, eds, CRC Press (Lewis Publishers), BocaRaton, FL, USA, pp. 177–191.
Schultz WG and Dodd JS (2005), ‘PFOA called likely human carcinogen’, Chem & Eng
News 83(27), 5.Slack-Smith P (2000), ‘Managing environmental issues in cotton production: Australian
Best Management Practices (BMP)’, Cotton – Global Challenges and the Future,Papers presented at a Technical Seminar, 59th Plenary Meeting of the InternationalCotton Advisory Committee (ICAC), Cairns, Australia, Nov. 9, 2000, p. 12.
The Task Force for Byssinosis Prevention (1995), ‘Washed cotton, a review andrecommendations regarding batch kier washed cotton’, Current Intelligence Bulletin,56, US Department of Health and Human Service, NIOSH, Aug. 1995.
Cotton: Science and technology482
UK, Dept for Environment, Food, and Rural Affairs (Defra) (2005), ‘Consultation onproposed national action to restrict the use of perfluorooctane sulphonate (PFOS) andsubstances that degrade to PFOS’. http://www.defra.gov.uk/corporate/consult/pfos/index.htm
UK Health and Safety Executive (HSE) (2005), Dyestuffs: safe handling in textile finishing,Dyeing and Finishing Information Sheet No. 3; Dust control in dyestuff handling,Dyeing and Finishing Information Sheet No. 6.
UK HSE (2005a), Reactive dyes: Safe handling in textile finishing, Dyeing and FinishingInformation Sheet No. 5.
US Consumer Product Safety Commission (CPSC) (1984), Status Report on Formaldehyde
in Textiles Portion of Dyes and Finishes Project, US Consumer Product SafetyCommission, Washington, DC, Jan. 3, 1984.
US Environmental Protection Agency (EPA) (1987), ‘Formaldehyde’, Integrated RiskInformation System (IRIS), http://www.epa.gov/iris/subst/0419.htm
US EPA (1991), Formaldehyde risk-assessment update, Office of Toxic Substances, USEnvironmental Protection Agency, Washington, DC, June 11, 1991.
US EPA (2006), Federal Insecticide, Fungicide, and Rodenticide Act (FIFRA), 7 USCode 136; Federal, Food, Drug and Cosmetic Act (FFDCA) (1996) as amended by theFood Quality Protection Act (FQPA).
US EPA (2006a), Worker protection standard, 40 Code of Federal Regulation Part 170(http://www.epa.gov/oppfead1/safety/workers/amendmnt.htm).
US EPA (2006b), Pesticide Management and Disposal: Standards for Pesticide Containersand containment, Final Rule (40 CFR Parts 9, 156, 165), 71 Federal Registerpage 47329–47437, 16 August 2006.
US National Institute of Occupational Safety and Health (NIOSH) (1978), ‘Direct Blue6, Direct Black 38, and Direct Brown 95 Benzidine Derived Dyes’, NIOSH Current
Intelligence Bulletin No. 24 (1978, April 17).US NIOSH (1980), Benzidine-Based Dyes, NIOSH criteria document, 80–109 (1980).US NIOSH (1980a), Health Hazard Alert: Benzidine-, o-Tolidine-, and o-Dianisidine-
Based Dyes, NIOSH Alert, 81-106 (1980, December).US NIOSH (1997), ‘Reduction of worker exposure to powdered dye through ventilation,
work practice controls and limiting bulk container height’, NIOSH Hazard Controls,HC13, Publication 97–107 (1997, June 26).
US OSHA (1985), ‘Occupational exposure to cotton dust, Final Rule’, Federal Register,50, pp. 51120–51179, Dec. 13, 1985.
US OSHA (2000), ‘Washed cotton, 29 CFR 1910.1043(n)’; Occupational exposure tocotton dust, Direct Final Rule’, Federal Register, 65, pp. 76563–76567, Dec. 7, 2000.
US OSHA (2002), Heat stress card, OSHA Publication 3154, http://www.osha.gov/Publications/osha3154.pdf
US OSHA (2002a), ‘Standards that apply to cotton gins, OSHA Standard Interpretation’h t tp : / /www.osha .gov/p l s /oshaweb/owadisp . show_document?p_table=INTERPRETATIONS&p_id=24189
US OSHA (2006), Heat stress, Hazards and possible solutions, http://www.osha.gov/SLTC/heatstress/recognition.html
US OSHA (2006a), ‘Standard for Occupational Exposure to Cotton dust’, US Code ofFederal Regulations, 29 CFR 1910.1043, (a) Scope and application and (c) Permissibleexposure limits and action levels.
US OSHA (2006b), ‘Standard for Occupational Exposure to Formaldehyde’, US Code ofFederal Regulations, 29 CFR 1910.1048.

Health and safety issues in cotton production and processing 483
US OSHA and the US Environmental Protection Agency (EPA) (1993), A Guide to Heat
Stress in Agriculture, http://are.berkeley.edu/heat/heat.stress.epa-98.guide.htm.Wakelyn PJ (1994), ‘Cotton: environmental concerns and product safety’, in Proc. 22nd
Int. Cotton Conf., Bremen, Harig H and Heap SA, eds, Faserinstitut Bremen e.V.,Bremen, Germany, pp. 287–305.
Wakelyn PJ, (1997), ‘Cotton Yarn Manufacturing’, ILO Encyclopaedia of Occupational
Health and Safety, 4th edn, Chapter 89, Textile Goods Industry, Ivester AL and NeefusJD, eds, International Labour Office. Geneva, Switzerland, pp 89.9–89.11.
Wakelyn PJ, Greenblatt GA, Brown DF and Tripp VW (1976), ‘Chemical properties ofcotton dust’, American Industrial Hygiene J., 37, 22–31.
Wakelyn PJ, Jacobs RR and Kirk IW, eds (1986), Washed Cotton; Washing Techniques,
Processing Characteristics and Health Studies, United States Department of Agriculture.New Orleans, LA.
Wakelyn PJ, Thompson DW, Norman BM, Nevius CB and Findley DS (2005),‘Why Cotton Ginning is Considered Agriculture’, Cotton Gin and Oil Mill Press
106(8), 5–9.Welch CM (1990), ‘Durable press finishing without formaldehyde’, Text. Chem. Color.,
22(5), 13–16.Welch CM (2000) ‘Formaldehyde – free durable press finishing’ in Surface Characteristics
of Fibers and Textiles, Pastore DM and Kiekens P, eds, Marcel Dekker, Ind., NewYork, NY, 2000, chap. 1, pp. 1–32.
Welch CM and Andrews BA (1989), ‘Ester crosslinks: a route to high performancenonformaldehyde finishing of cotton’, Text. Chem. Color., 21(2), 13–17.

484
15.1 Introduction
Cotton recycling fits into the broader scope of materials recovery from solidwaste generated by producers and consumers of a range of products. Thischapter looks at the issues surrounding recycling and the research into specificrecycling efforts involving cotton textile products. The stage is set by describingcurrent methods for dealing with textiles in the solid waste stream. Thepattern of recycling is then begun with a discussion of the sources of cottonfibers, followed by detailed descriptions of mechanical and chemical recyclingprocesses. The latter involve dissolution of cotton fibers and other cellulosicmaterials in environmentally safer solvents than those traditionally used toproduce regenerated cellulosic fibers. Future trends are discussed and furthersources of information given.
15.2 Textile life cycle and waste treatment choices
Environmental imperatives have induced researchers, producers, and consumersto examine and pay attention to the life cycle of products from raw materialto waste and disposal. This approach provides a framework for analyzingenvironmental issues and determining the role and economics of recyclingas a method for reducing waste and environmentally disadvantageousdisposal (Domina and Koch, 1997). It is understood in applying this approachthat much of the environmental impact of a textile product is determinedat the design stage by the materials and processes selected (Heely andPress, 1997).
Cotton, and indeed all textiles, require significant energy input for productionand processing, and also for laundering and dry cleaning in the consumer’shands. Once an article is no longer serviceable, its ultimate fate is thenconsidered. All these stages from raw material to final disposition are analyzedwhen a life cycle analysis is performed. The American Fiber ManufacturersAssociation conducted such an assessment for a polyester knit blouse that
15Recycling of cotton
B J C O L L I E R, J R C O L L I E R, Florida StateUniversity, USA, S P E T R O VA N, University of
Tennessee, USA and I I N E G U L E S C U,Louisana State University

Recycling of cotton 485
included energy requirements and emissions for each step from manufacturethrough consumer use, but did not consider environmental impacts ofdisposal (Smith and Barker, 1995). Cotton textiles would probably requiremore energy in processing and use, and there are additional environmentalcosts in growing cotton such as pesticides and fuel for large farm machinery.These costs can be balanced against the biodegradability of cotton in discardeditems and possibilities for using cotton as a cellulose source for otherproducts. As with all solid waste, there are three primary options for handlingtextile products no longer considered serviceable by the owner: reuse, disposal,and recycling.
15.2.1 Reuse
Governmental and private programs encourage the reuse of a number ofconsumer products, textiles among them. Textiles are in fact good candidatesfor reuse because there are so many options and outlets for clothing andhousehold items. In addition, the US Environmental Protection Agency (EPA)considers that reusing products is even better than recycling because they donot require reprocessing into new or different items (US EnvironmentalProtection Agency, 2005b).
Between 1990 and 2003, the US exported nearly 7 billion pounds of usedclothing and worn textile products around the world (World Trade Atlas,2005). Most of the recycling firms in developed countries are small, family-owned businesses (Rivoli, 2005). In the US the industry as a whole employsapproximately 10,000 semi-skilled and marginally employable workers atthe primary processing level, and creates an additional 7,000 jobs at the finalprocessing stage. Primary and secondary processors account for annual grosssales of $400 million and $300 million respectively. Industry members areable to recycle 93% percent of the waste they process without producing anynew hazardous waste or harmful by-products. Textile recyclers export 61%of their products, thus reducing the US trade deficit. Documented exportsales of recycled clothing from the US exceeded $217 million in 1999 (USCensus Bureau, 2005).
Worldwide, particularly in developed countries, there are many opportunitiesfor donating or selling used textile products (Chang et al., 1999). Second-hand stores offer sellers and buyers of used clothing and other textile itemsan exchange forum that keeps the items in the use channel and out of thewaste stream. Thrift stores and consignment stores are also outlets for usedtextiles. Non-profit charitable organizations and churches in various countriesaccept donations of such items as well, either for domestic distribution or forneeds around the world. These organizations and stores often however cannotuse all of the donated items and give or sell them to rag makers, or look tomaterials recovery facilities (MRFs) for reprocessing and recycling (Platt,
Cotton: Science and technology486
1997). The used textile items thus become the starting materials in the recyclingprocess.
Textile items that are reclaimed before disposal can be turned into useful,though low-value, products. All that is usually required is cleaning andcutting. Examples are rags cut from used cotton denim jeans (Denim,Reclaimed, 2005) and diapers retired from diaper services and sold as rags(100% Cotton Rags, 2005).
15.2.2 Disposal
Textile waste is generated by both producers and consumers. Scraps fromfiber production, spinning and weaving, and apparel manufacturing, the postproduction waste, can be collected and recycled into a variety of products.The fiber content in these waste streams is known, making it simpler totarget appropriate recycled products (Chang et al., 1999). In addition, it isusually clean and requires less processing during recycling. Post-consumerwaste, on the other hand, contains a mixture of fibers, and often dyes, finishesand other additives as well.
Textile waste is part of the solid waste stream that is dealt with in a varietyof ways by local government entities throughout the world. In developedcountries textiles account for about 4% of the municipal solid waste thatmust be dealt with in some fashion (Chang et al., 1999; US EnvironmentalProtection Agency, 2005b). The most common methods of solid waste disposalare landfilling and incineration. Recycling is a distant third, primarily becausethe economics of current recycling processes are not favorable. As the firsttwo disposal methods become less environmentally attractive however,recycling and reuse, the non-disposal alternative described above, becomeattractive (Grasso, 1995).
Landfilling
Landfilling or burying, a traditional method of dealing with solid waste,while subject to environmental toxicity concerns, was generally consideredsufficient for the volume of waste until the last century. Much of the wasteplaced in landfills was composed of natural materials, such as cotton, andwas therefore considered biodegradable. With the advent of synthetic materialsand the increase in consumption of both durable and non-durable goods,landfills are filling up, motivating a closer look at alternatives such as recycling.As reported by EPA, the number of US landfills decreased from 7,924 sitesin 1988 to 1,767 in 2002, indicating the problem with this disposal method(US Environmental Protection Agency, 2005b).
The biodegradability of cotton makes landfilling an appropriate disposalmethod for cotton textiles. Problems arise when the fiber is blended with
Recycling of cotton 487
synthetics that are not so easily decomposed. In a study of cotton/polypropylenenonwovens, Warnock found that the cotton core of the composite websdisintegrated when buried in soil, but the polypropylene fibers were notaffected after 16 weeks (Warnock and Ferguson, 1997). Landfilling is thereforenot as attractive for general textile waste, which is often a mixture of fibers.
Incineration
An alternative to burying solid waste in landfills is incinerating it in largecombustion facilities. This controlled burning process reduces the volumeof waste and can capture the water generated to convert to steam forheating systems or to generate electricity (US Environmental Protection Agency,2005b). The energy produced can in fact provide the fuel for the combustionprocess, decreasing the need for fossil fuels, and can also provide excessenergy for other uses such as steam generation. An obvious disadvantage is thegeneration of carbon dioxide and any volatile pollutants produced by the burning.
15.3 Cotton sources
Primary cotton sources for recycling into current products are cotton ragsand linters. Indeed, cotton rags and linters have been the main source offibers for papermaking dating from the first century and remain today thebest material for long lasting quality papers. These sources are high in alphacellulose, which is the cellulose in the fiber that is not dissolved in 17.5%sodium hydroxide. The higher the alpha cellulose content in the fiber, thebetter quality and longer lasting the paper that can be manufactured. Inaddition these sources do not contain any lignin and only require a mildcooking process to clean them for the ultimate paper or other products.
15.3.1 Linters and gin waste
Cotton linters are very short fibers that adhere to the cottonseed even afterginning (Mauney, 1984). Unlike cotton fibers, linters only grow to 5 mm orless and have a thicker secondary wall at the seed surface, accounting fortheir resistance to removal during ginning. They can however be removed ina subsequent mechanical delinting processes. Typical yield for cottonseed isabout 9% linters (Cherry and Leffler, 1984).
Before being converted into various products, linters are physically cleanedto remove seed hulls and other plant matter (Temming et al, 1973), and arethen bleached. The physical and chemical cleaning produces linters with theappropriate physical and chemical properties for the targeted end use. A lowviscosity, following from a reduced degree of polymerization, and the highpurity of the cellulose from the cleaning are desirable properties for higher

Cotton: Science and technology488
value products such as regenerated cellulose fibers and films. Clean fibersare also required for fine writing paper and filter paper. Uses for lower gradelinters are padding and stuffing for mattresses, upholstery, and pillows (Collierand Tortora, 2000).
Short fibers are also collected as waste from cotton gins and yarn spinners.About 4% by weight of gin waste, which includes these short fibers as wellas motes and trash, is generated for every bale of cotton fiber processed.With a worldwide production in 2004-2005 of 120 million bales (Collins,2005), there is a significant amount of short fibers that are recovered andsold to plants making padding, batting, and other coarse nonwovens (Bakerand Griffin, 1984). Such products are also made from short fibers combedfrom cotton slivers during the spinning process. These fibers, called noils,are collected by the spinner and resold.
15.3.2 Rags
Textile waste products that are all cotton have found use primarily in wipingcloths and rags. The absorbent nature of cotton is an advantage in suchproducts. They can also be made into rag rugs, although most of these nowuse new rather than recycled fabric.
Most of the rags recycled into paper products are new cotton clippingswhich come from various textile mills and garment factories. They are collectedby rag dealers and recycling organizations. The rags and cotton wastes aresorted and graded into over 140 different categories for reuse and recycling(Reading Textile Recycling Project, n.d.). The following grades are gradedin the top category for rag papers: unbleached muslins, white shirt cuttings,bleached underwear cuttings, bleached flannel cuttings, bleached shoe cuttings,blue denims, and fancy shirt cuttings. White or unbleached new rags arebetter than colored ones because they require milder cooking and bleaching,resulting in minor thermochemical degradation and ultimately higher durabilityand permanence in the manufactured papers.
The quality and durability of paper made from rags are necessary propertiesfor such specialty papers as:
1. banknotes and security papers2. life insurance policies and legal documents where permanence is of
primary importance3. technical papers, such as tracing paper, vellums, intermediate, blue print
and other reproduction papers4. high-grade bond letterheads for concerns where appearance is of great
importance5. light-weight specialties, such as cigarette, carbon and bible papers6. high-grade stationery paper, where beauty, softness, and fine texture are
demanding.
Recycling of cotton 489
The main steps from the cotton rags or wastes to the high-quality paper are:mechanical treatment to open the rags for easy dirt removal; removing offoreign matter; cutting for preventing roping in the boiler; dusting; removingof metallic items on magnetic rolls; chemical cooking and bleaching; beating;sizing; and finally paper formation. The cooking step is done using weaklime or caustic soda solutions to minimize chemical degradation of the alphacellulose. Bleaching is also done at low chlorine concentrations (~ 0.05%) inthe form of calcium or sodium hypochlorite. Sizing too should be done witha minimum amount of chemicals for the high-quality papers described abovethat are expected to last a long time. Chemicals and other additives should bekept at a minimum to prevent degradation of cellulose in time due to sidereactions and consequently reducing paper permanence.
15.4 Mechanical reprocessing
Pre- and postconsumer waste is subjected to solely mechanical action torender the textiles into a near fibrous form that can then be processed intoother, usually lower value, products.
15.4.1 Preparation
Sorting
Textile products that are recovered from the solid waste stream are usuallysorted before being directed to reuse or recycling. Most recycling businessesprefer to sort the waste themselves to assure that the textiles are separatedand graded by experienced workers capable of recognizing fiber contentsand categories of materials for subsequent destinations (Textile RecyclingAssociation, n.d.). A high percentage of textile products from this sortingstep will be directed to reuse or to high-quality papers as described above.Other items will enter the recycling stream, based on fiber content andpresence of dyes or finishes.
Shredding
A simple and often used mechanical process for recycling textile waste isshredding or tearing the item into very small pieces that can then be reformedinto nonwovens or can be used as padding or stuffing (Fig. 15.1). The advantageof these end uses is that mixed fiber waste is acceptable because the primaryfunction is a factor of bulk volume, not of specific fiber properties. In addition,the appearance of the products is not of primary importance because they areusually covered by other materials. Examples are car insulation, roofingfelts, loudspeaker cones, panel lining, and furniture padding (Textile RecyclingAssociation, n.d.).
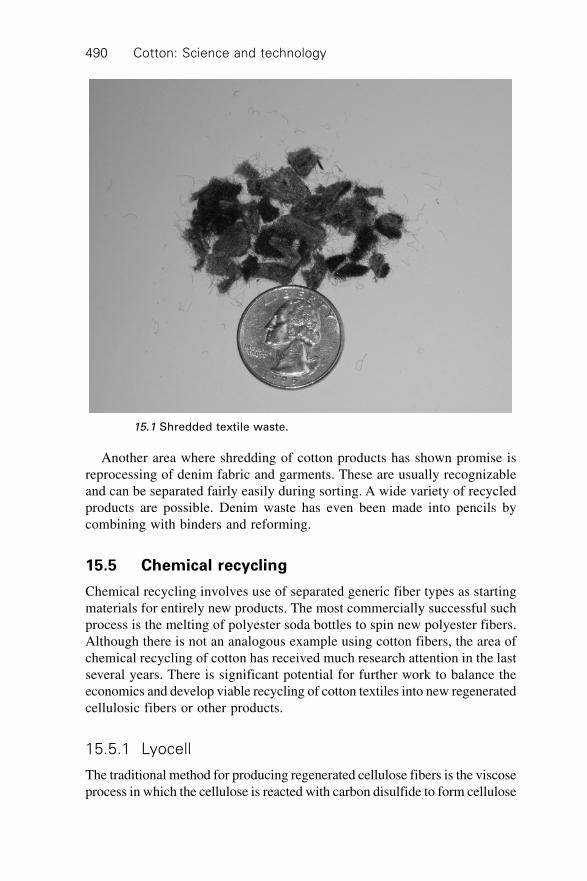
Cotton: Science and technology490
Another area where shredding of cotton products has shown promise isreprocessing of denim fabric and garments. These are usually recognizableand can be separated fairly easily during sorting. A wide variety of recycledproducts are possible. Denim waste has even been made into pencils bycombining with binders and reforming.
15.5 Chemical recycling
Chemical recycling involves use of separated generic fiber types as startingmaterials for entirely new products. The most commercially successful suchprocess is the melting of polyester soda bottles to spin new polyester fibers.Although there is not an analogous example using cotton fibers, the area ofchemical recycling of cotton has received much research attention in the lastseveral years. There is significant potential for further work to balance theeconomics and develop viable recycling of cotton textiles into new regeneratedcellulosic fibers or other products.
15.5.1 Lyocell
The traditional method for producing regenerated cellulose fibers is the viscoseprocess in which the cellulose is reacted with carbon disulfide to form cellulose
15.1 Shredded textile waste.
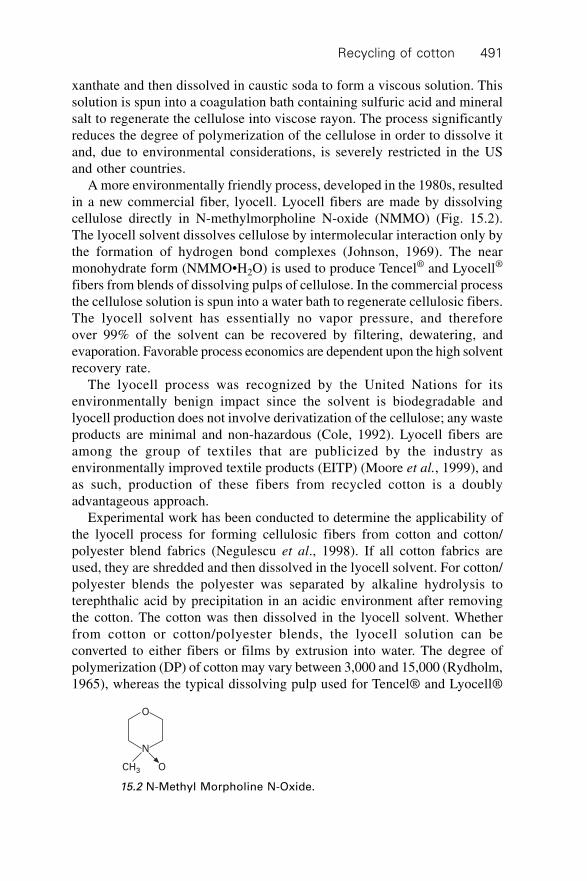
Recycling of cotton 491
xanthate and then dissolved in caustic soda to form a viscous solution. Thissolution is spun into a coagulation bath containing sulfuric acid and mineralsalt to regenerate the cellulose into viscose rayon. The process significantlyreduces the degree of polymerization of the cellulose in order to dissolve itand, due to environmental considerations, is severely restricted in the USand other countries.
A more environmentally friendly process, developed in the 1980s, resultedin a new commercial fiber, lyocell. Lyocell fibers are made by dissolvingcellulose directly in N-methylmorpholine N-oxide (NMMO) (Fig. 15.2).The lyocell solvent dissolves cellulose by intermolecular interaction only bythe formation of hydrogen bond complexes (Johnson, 1969). The nearmonohydrate form (NMMO•H2O) is used to produce Tencel® and Lyocell®
fibers from blends of dissolving pulps of cellulose. In the commercial processthe cellulose solution is spun into a water bath to regenerate cellulosic fibers.The lyocell solvent has essentially no vapor pressure, and thereforeover 99% of the solvent can be recovered by filtering, dewatering, andevaporation. Favorable process economics are dependent upon the high solventrecovery rate.
The lyocell process was recognized by the United Nations for itsenvironmentally benign impact since the solvent is biodegradable andlyocell production does not involve derivatization of the cellulose; any wasteproducts are minimal and non-hazardous (Cole, 1992). Lyocell fibers areamong the group of textiles that are publicized by the industry asenvironmentally improved textile products (EITP) (Moore et al., 1999), andas such, production of these fibers from recycled cotton is a doublyadvantageous approach.
Experimental work has been conducted to determine the applicability ofthe lyocell process for forming cellulosic fibers from cotton and cotton/polyester blend fabrics (Negulescu et al., 1998). If all cotton fabrics areused, they are shredded and then dissolved in the lyocell solvent. For cotton/polyester blends the polyester was separated by alkaline hydrolysis toterephthalic acid by precipitation in an acidic environment after removingthe cotton. The cotton was then dissolved in the lyocell solvent. Whetherfrom cotton or cotton/polyester blends, the lyocell solution can beconverted to either fibers or films by extrusion into water. The degree ofpolymerization (DP) of cotton may vary between 3,000 and 15,000 (Rydholm,1965), whereas the typical dissolving pulp used for Tencel® and Lyocell®
O
N
OCH3
15.2 N-Methyl Morpholine N-Oxide.

Cotton: Science and technology492
fibers is less than 1,000. Therefore, recycled cotton cellulose could be blendedwith cellulose from other sources to prepare lyocell solutions with appropriateproperties.
Cellulose from other sources such as cotton linters, as well as officewastes and agricultural residues could be blended with recovered cotton toform lyocell fibers. The behavior of lyocell solutions from these varioussources has been studied and compared to solutions formed with commercialdissolving pulps (Dever et al., 2003; Collier et al., 2000). Cotton linters canbe used to prepare lyocell solutions similar to those made with wood cellulosedissolving pulps. Due to the higher DP of cellulose from cotton linters, theviscosity is higher than that of dissolving pulp solutions (Fig. 15.3). Typicallycommercial lyocell solutions are prepared from dissolving pulps of differentDPs. Recycled cotton therefore offers an additional source for blending withother materials to achieve the desired viscosity for spinning.
In addition to spinning fibers, solvent systems for cellulose from varioussources were investigated for textiles and other products. Lyocell nonwovenwebs have been made using the meltblowing process (Luo et al., 2001)and work continues in this area. Wood pulp, rather than the purerdissolving pulp, was used, demonstrating the applicability of alternativecellulose sources for these processes. Solution viscosity is critical fornonwovens processing. Lyocell nonwoven webs have fibers equal to orsmaller than those of cotton, making them superior to air laid or water laidnonwovens for some applications. Since these nonwovens are 100% cellulosethey exhibit much higher absorbency than traditional melt processednonwovens composed of synthetic polymers.
DP 670
DP 932
DP 1195
DP 1457
DP 1720
Cotton linters
0.1 1 10 100Angular velocity, 1/s
104
103
102
Co
mp
lex
vis
co
sit
y,
Pa
s
15.3 Complex viscosity of lyocell solutions prepared from cottonlinters and wood dissolving pulps with different degrees ofpolymerization.

Recycling of cotton 493
15.5.2 Ionic liquids
A relatively new class of solvents, ionic liquids, has become available andlike the lyocell solvent, they have essentially no vapor pressure. The bulk ofthe work on ionic liquids has been reported in the last four years (Rogers,2005). They are considered to be green solvents with regard to a lack ofvapor formation, but their toxicity in aqueous environments is not yetdetermined (Seddon, 1997; Huddleston et al., 2001). Some of the ionicliquids are water soluble and others are not.
The ionic liquid 1,3,-dibutylimidazolium chloride ([C4mim]Cl) (Fig. 15.4)has been shown to be a good solvent for cellulose (Swatloski et al., 2002).Other ionic liquids that also dissolve cellulose are similar [C4mim] compoundswith the chloride ion replaced by other strong hydrogen bond acceptorsincluding Br, SCN, BF4, or PF6 (Swatloski et al., 2002). Apparently theanion disrupts the intramolecular hydrogen-bonding of the cellulose hydroxylgroups thereby enabling the cellulose to be dissolved. The strong chlorideactivity enables dissolution of up to at least 25 wt% of cellulose and at afaster rate than traditional cellulose solvents.
Contacting the cellulose solution in [C4mim]Cl with water, ethanol oracetone significantly reduces the cellulose concentration reportedly due tocompetition for hydrogen bonding with cellulose, causing separation of thecellulose and solvent (Swatloski et al., 2002). The [C4mim]Cl solvent isregenerated as in the lyocell process by filtration, dewatering and evaporation.Recovery and cost of solvent will dictate the economics of the process. Ifother water soluble ionic liquids are used, they can be recovered in the samefashion. If they are not water soluble, phase separation and recovery can beused. It should be possible to alter all ionic liquids and their properties by ionexchange.
In an initial examination of this ionic liquid solvent system, regeneratedcellulosic fibers from [C4mim]Cl were produced using bleached cotton fibers(DP 2000), rayon yarn (600 denier/98 filaments from North American RayonDP 700), and bleached wood pulp (International Paper DP 1056). The propertiesof these fibers were dependent upon processing conditions and cellulose
N
N
C4H9
CH3
Cl–
15.4 Chemical structure of 1-butyl-3-methylimidazolium chloride([C4mim]Cl).

Cotton: Science and technology494
source (Table 15.1). The solutions made with cotton fiber produced finerfibers because they were able to be drawn down without breaking. Theseregenerated fibers from cotton also had lower elongation than those fromother sources, but tenacities similar to the rayon source fibers.
Other applications of the regenerated cellulose from ionic liquids aremacroscopic particles (powders and nanoparticles); macromolecular inclusions(enzymes and other bioactive molecules and metal-oxide particles, andmolecular binding agents for metal); complexing, reactive dyes; and pHresponsive sensors (Rogers, 2005). Magnetite was dispersed in an ionicliquid-cellulose solution, coagulated with water, and reconstituted as flocs,washed, dried and milled. The resulting cellulose-encapsulated magnetiteexhibited magnetic properties (Rogers, 2005).
The biomolecule laccase from Rhus vernificera was used to demonstrateenzymatic activity of entrapped biomolecules in cellulose films preparedfrom ionic liquids solutions. This naturally occurring enzyme degrades ligninfor subsequent separation from cellulose and is used as a catalyst forpolyphenolic degradation of waste materials. Activity of the enzyme wasmaintained even though encapsulated (Turner et al., 2004). A mercury (II)sensitive membrane was prepared by encapsulating 1-(2-pyridylazo)-2-naphtholwithin a cellulose membrane cast from an ionic liquid solution (Rogers,2005). Homogeneous acetylation of cellulose has been accomplished in anionic liquid solution (Wu et al., 2004). Ionic liquids have also been used tosolution blend cellulose with polyacrylonitrile and with polyethylene glycol(Rogers, 2005; Anderson et al., 2002).
15.5.3 Conversion to chemicals
Cotton is the purest major cellulosic resource and can be considered as astarting material for the manufacture of a practically unlimited number ofchemical products, by derivatization, depolymerization, carbonization, orpurification. Cellulose derivatization is the most important route to variouschemical products which are then used as such or may be further convertedto regenerated cellulose products. Conversion of recycled cotton to cottonderivatives is based on the reaction of cellulose primary and secondary hydroxyl
Table 15.1 Properties of fibers spun from ionic liquid
Cellulose source Denier Tenacity Breaking
(g/den) elongation (%)
Cotton 11.3 3.38 3.8
Rayon 38.6 3.43 18.7
Dissolving pulp 27.3 4.41 7.6
Compiled from data in Rogers, 2005.

Recycling of cotton 495
groups by reacting with an array of reagents and may include furtherderivatization of obtained products.
Esterification is one of the most important substitution reactions on celluloseand is generally carried out in strongly acid medium to give cellulose esterssuch as cellulose nitrate, sulfate, phosphate, formate, acetate, propionate,butyrate, aceto-propionate, and aceto-butyrate. From a commercial standpoint,the most important derivatization reactions are nitration and acetylation,producing nitrocellulose and acetylcellulose which have been made intofibers and films. Nitrocellulose has been used for some time in manufacturingexplosives, plastics and lacquers. Acetylcellulose is also broadly used tomake products of various end-uses. The nitration reaction is performed in anitration medium consisting of nitric acid, sulfuric acid and water, whileacetylation is done in a mixture of acetic acid, acetic anhydride and anacid catalyst.
Etherification is the second cellulose derivatization route and is carriedout in alkaline medium with alkyl halides as etherifying agents, resulting inmany cellulose ethers such as methyl, ethyl, propyl, isopropyl, butyl, isobutyl,amyl, methyl-ethyl, methyl-hydroxyethyl, methyl-hydroxypropyl,carboxymethyl, benzyl, to name but a few. The end-use properties ofcellulose derivatives mainly depend on the esterification or etherificationagent, cellulose degree of polymerization, and the degree of substitution.The degree of substitution (DS) is defined as the average degree of substitutionper glucose unit from the derivative polymeric chain and may vary fromzero to a maximum of three, if all three hydroxyl groups from a structuralunit are substituted.
In a demonstration of derivatization of recycled cotton, nonwovens oflow apparent density were prepared by carding together recycled cottonfibers and cotton fibers previously carboxymethylated with chloroacetic acid(DS of 0.3) (Negulescu et al., 2005).
CELL(OH)3 + nClCH2CO2H
+ nNaOH Æ CELL(OH)3-n(OCH2CO2Na)n + nNaCl 15.1
where n reflects the degree of substitution, DS, which is the averagenumber of carboxymethyl [-CH2COO–] groups per anhydroglucose unit ofcellulose.
The resulting nonwoven webs were treated subsequently with aqueoussolutions of urea (U), saturated aqueous melamine (M) solution, or the adductof phosphoric acid with urea (A), and dried at 110 ∞C. The nitrogen contentdetermined from the add-on amounts of nonwovens was around 0.04–0.2gN/g fabric, depending upon the reagent and the type of nonwoven. Thecarboxymethylated bagasse/cotton nonwoven treated with the adduct solutionretained A corresponding to a nitrogen content of 0.053g/g nonwoven and toa phosphorus content of 0.059g/g nonwoven. Finally the treated nonwovens

Cotton: Science and technology496
were stabilized with a concentrated lyocell solution also obtained fromrecycled cotton fibers. The nonwoven products were aimed as fertilizingcomponents in nonwoven geotextiles or as filtering media for sequesteringheavy metals.
Cellulose depolymerization is another route to a broad class of cellulosicproducts. Cellulose in industrial products has a much lower DP than nativecotton and can be obtained from cotton and other natural sources usingmechanical and thermochemical methods to reduce the length of the polymericchains. Cotton and cotton waste are used to manufacture different grades ofcellulosic products, depending on the DP required. Dissolving pulps andcellulose grades to be used for chemical derivatization are prepared by amultistep chemical treatment process comprising prehydrolysis, pulping andbleaching to reduce the DP to a range between 350 and 800, depending onthe final product. The alpha-cellulose content should be 95% or higher.
Microcrystalline cellulose, or micronized cellulose, is the grade of cellulosewith the lowest DP, generally lower than 300. The best raw material for thistype of product is cotton or cotton waste, mainly when it comes to uses in thefield of medicine or as food additives.
Cellulose depolymerization can proceed to simple sugar or glucose byhydrolysis (chemical or enzymatic) and the product can be used as a chemicalor for making fuel by fermentation. Carbonization of cellulose from cottonwaste at about 700 ∞C results in activated carbon or carbon fibers with awide range of applications (Iwamoto and Nakamura, 1998; Nakamura andIwamoto, 1998).
Pure cellulose can be also manufactured from cotton waste. By a propercombination of prehydrolysis, alkaline pulping, and bleaching sequences,cellulose with a purity as high as 99.9% alpha-cellulose can be obtained(Abou-State, 1977; Abou-State and Abd El Megeid, 1977).
15.6 Future trends
As the economics of collecting and sorting textile waste become more favorable,and the pressure for environmentally friendly products spreads, recycling ofcotton and other textile waste will see increased interest. The technologiesand products categories have been developed and await successful marketingefforts and consumer interest. Lower value end uses, as described in sections15.3 and 15.4 above should see growth, much of which will be in the area ofnonwoven products. These are simple and easy to manufacture, not requiringsignificant capital or labor investment nor demanding a high price. One ofthe primary operations is the formation of composite webs by blendingtogether recycled cotton fibers with other cellulosic or synthetic fibers usinga carding machine (Fig. 15.5). The webs can be then stabilized in finalnonwoven products by melting the synthetic component (Negulescu et al.,
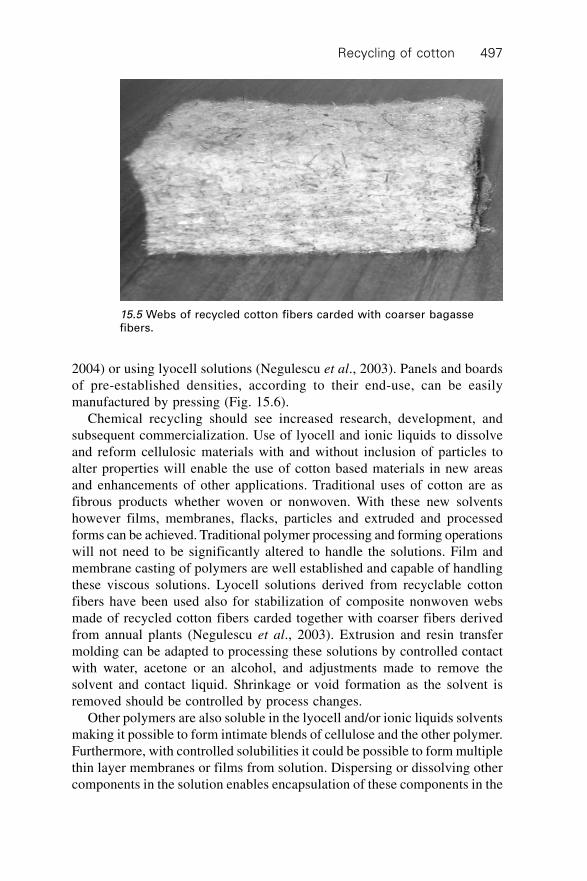
Recycling of cotton 497
2004) or using lyocell solutions (Negulescu et al., 2003). Panels and boardsof pre-established densities, according to their end-use, can be easilymanufactured by pressing (Fig. 15.6).
Chemical recycling should see increased research, development, andsubsequent commercialization. Use of lyocell and ionic liquids to dissolveand reform cellulosic materials with and without inclusion of particles toalter properties will enable the use of cotton based materials in new areasand enhancements of other applications. Traditional uses of cotton are asfibrous products whether woven or nonwoven. With these new solventshowever films, membranes, flacks, particles and extruded and processedforms can be achieved. Traditional polymer processing and forming operationswill not need to be significantly altered to handle the solutions. Film andmembrane casting of polymers are well established and capable of handlingthese viscous solutions. Lyocell solutions derived from recyclable cottonfibers have been used also for stabilization of composite nonwoven websmade of recycled cotton fibers carded together with coarser fibers derivedfrom annual plants (Negulescu et al., 2003). Extrusion and resin transfermolding can be adapted to processing these solutions by controlled contactwith water, acetone or an alcohol, and adjustments made to remove thesolvent and contact liquid. Shrinkage or void formation as the solvent isremoved should be controlled by process changes.
Other polymers are also soluble in the lyocell and/or ionic liquids solventsmaking it possible to form intimate blends of cellulose and the other polymer.Furthermore, with controlled solubilities it could be possible to form multiplethin layer membranes or films from solution. Dispersing or dissolving othercomponents in the solution enables encapsulation of these components in the
15.5 Webs of recycled cotton fibers carded with coarser bagassefibers.

Cotton: Science and technology498
fibers or films. The other components can be biocides, pigments, etc., anddue to incorporation into the fibers their effects should be more permanent.
15.7 Sources of further information
The research literature, as cited below, covers much of the work in chemicalrecycling. Current activities and players in the recycling area are easilyfound on the internet. The Council for Textile Recycling in the US(www.textilerecycle.org) and the Textile Recycling Association in Britain(www.textilerecyclingass.sageweb.co.uk) have general web pages that providelinks to other sources. These sources include buyers and sellers of textilewaste and used products, manufacturers of recycling equipment, and localgovernments with collection and recycling programs. EPA’s Jobs ThroughRecycling (JTR) program offers grants designed to expand recycling andreuse markets for commodities like textiles (US Environmental ProtectionAgency, 2005a).
15.8 References
100% Cotton Rags, (2005). Retrieved 8/23/2005 from http://www.tinytots.com/shopping/cotton_rags/rags.html.
Abou-State, M.A., (1977). Chemical Cotton with an Exceptional High Degree of Purityfrom Egyptian Cotton Waste Fibers, Chemistry and Industry, 18, 767–768.
15.6 Press used for forming nonwovens from composite webs.

Recycling of cotton 499
Abou-State, M.A. and Abd El-Megeid, F.F., (1977). Effect of Some Chemical Treatmentson the Reactivity of Purified Egyptian Cotton Waste Fibers Towards Xanthation,Fiber Science and Technology, 10(4), 273–280.
Anderson, J.L., Ding, J., Welton, T. and Armstrong, D.W., (2002). Characterizing IonicLiquids on the Basis of Multiple Salvation Interactions, Journal of the American
Chemical Society, 124, 14248–14254.Baker, R. and Griffin, Jr., A.C., (1984). Ginning, in Cotton, R.J. Kohel and C.F. Lewis
(eds), Madison, WI: American Society of Agronomy, Crop Science Society of America,and Soil Science Society of America, pp. 397–436.
Chang, Y., Chen, H.-L. and Francis, S., (1999). Market Applications for Recycled PostConsumer Fibers. Family and Consumer Sciences Research Journal, 27, 320–340.
Cherry, J.P. and Leffler, H.R., (1984). Seed, in Cotton, R.J. Kohel and C.F. Lewis (eds),Madison, WI: American Society of Agronomy, Crop Science Society of America, andSoil Science Society of America, pp. 511–569.
Cole, D.J., (1992). A New Cellulosic Fibre – Tencel, in Advances in Fibre Science, S.K.Mukhopadhyay (ed.), Manchester, UK: The Textile Institute.
Collier, B.J. and Tortora, P.G., (2000). Understanding Textiles, Upper Saddle River, NJ:Prentice-Hall.
Collins, Keith, (2005). Report to USDA Cotton Board, Charleston, SC, September 9,2005.
Denim, Reclaimed, (2005). Retrieved 8/23/2005 from http://www.allrags.com/denim.htm.Dever, M., Collier, B.J., Petrovan, S. and Collier, J.R., (2003). Lyocell Solutions from
Undervalued Cellulose Sources, Clothing and Textiles Research Journal, 21(4), 167–173.
Domina, T. and Koch, K., (1997). The Textile Waste Lifecycle, Clothing and Textiles
Research Journal, 15(2), 96–102.Grasso, M.M., (1995). Recycled Textile Fibers: The Challenge for the Twenty-First Century.
Textile Chemist and Colorist, 27(5), 16–20.Heely, J. and Press, M., (1997). Design and the Environment, Textiles Magazine, 4, 13,
23–24.Huddleston, J.G., Visser, A.E., Reichert, W.M., Willauer, H.D., Broker, G.A. and Rogers,
R.D. (2001). Characterization and Comparison of Hydrophilic and Hydrophobic RoomTemperature Ionic Liquids Incorporating the Imidazolium Cation, Green Chemistry,3, 156–164.
Iwamoto, M. and Nakamura, K., (1998). Carbon Fibers from Waste Cotton and ManufactureThereof. Patent Application JP 96-274820.
Johnson, D.L., (1969). Compounds Dissolved in Cyclic Amine Oxides, 3 June, USP3,447,939.
Luo, M., Roscelli, V.A., Camarena, S., Neogi, A.N., Yancey, M.J. and Gaddis, P.G.,(2001). Process for Melt Blowing Lyocell Fibers, USP 6,306,334 B1.
Mauney, J.R., (1984). Anatomy and Morphology of Cultivated Cottons, in Cotton, R.J.Kohel and C.F. Lewis (eds), Madison, WI: American Society of Agronomy, CropScience Society of America, and Soil Science Society of America, pp. 59–79.
Moore, M.A., Money, A. and Orzada, B., (1999). An Examination of EnvironmentalAwareness in the Textile Industry. Textile Chemist and Colorist, 31(4), 27–31.
Nakamura, K. and Iwamoto, M., (1998). Antibacterial Activated Carbon Fibers withGood Tensile Strength and Manufacture Thereof. Patent Application JP 96-328863.
Negulescu, I.I., Kwon, H., Collier, B.J., Collier, J.R. and Pendse, A., (1998). RecyclingCotton from Cotton/Polyester Fabrics, Textile Chemist and Colorist, 30(6), 31–35.
Cotton: Science and technology500
Negulescu, I.I., Chen, J., Robeck, J., Sun, L., Zhang, X., Parikh, D.V. and Yachmenev,V.G., (2003). Lyocell Stabilized Nonwoven Composites, Proceedings of the 13th
Annual International TANDEC Nonwovens Conference, November 18-20, Knoxville,TN (CD-ROM).
Negulescu, I.I., Chen, Y., Chiparus, O.I. and Parikh, D.V., (2004). Composite NonwovenMaterials Based on Kenaf and Other Natural Fibers, in International Development of
Kenaf and Allied Fibers, A. Liu (ed.), Minneapolis, MN: CCG International Inc., pp.84–98.
Negulescu, I.I., Chen, Y., Zhang, X., Sun, L. and Parikh, D.V., (2005). Chemistry ofCellulosic Nonwovens: Cotton-Bagasse Nonwovens Bearing Carboxylic and Amideor Amine Groups, Proceedings, 2005 Beltwide Cotton Conference, New Orleans, LA,Jan 4–7 (CD-ROM).
Platt, B., (1997). Weaving Textile Reuse into Waste Reduction. Washington, DC: Institutefor Local Self-Reliance.
Reading Community Enterprise Agency, (n.d.). Reading Textile Recycling Project, retrieved8/23/2005 from http://www.rdea.org/textilerecycling.htm.
Rivoli, P., (2005) The Travel of a T-shirt in the Global Economy, Hoboken, NJ: JohnWiley and Sons.
Rogers, R.D., (2005). Advanced Materials Utilizing ILs as Enabling Solvents. 10th NIChEConference: Ionic Liquids, South Bend, IN, February 21–22.
Rydholm, S.A., (1965). Pulping Processes, New York: Interscience Publishers, JohnWiley & Sons.
Seddon, K.R., (1997). Ionic Liquids for Clean Technology, Journal of Chemical Technology
and Biotechnology, 68, 351–356.Smith, G.G. and Barker, R.H., (1995). Life Cycle Analysis of a Polyester Garment.
Resources, Conservation and Recycling, 14, 233–249.Swatloski, R.P., Spear, S.K., Holbrey, J.D. and Rogers, R.D. (2002). Dissolution of Cellulose
with Ionic Liquid, Journal of the American Chemical Society, 124, 4974–4975.Temming, H., Grunert, H. and Huckfeldt, H. (1973). Temming-Linters, Germany: Peter
Temming AG.Textile Recycling Association, (n.d.). Textile Recycling, retrieved 8/23/2005 from http:/
/www.textilerecyclingass.sageweb.co.uk/recycling.htm.Turner, M.B., Holbrey, J.D., Spear, S.K. and Rogers, R.D., (2004). Production of Bioactive
Cellulose Films Reconstituted from Ionic Liquids, Biomolecules, 5, 1379–1384.US Census Bureau (2005). Secondary Materials and Recycled Textiles Association, Textile
Recycling Fact Sheet, retrieved 23/8/2005 from http://www.textile recycle.org/facts.pdf.US Environmental Protection Agency (2005a). Jobs Through Recycling, retrieved 23/8/
2005 from http://www.epa.gov/jtr/.US Environmental Protection Agency (2005b). Municipal Solid Waste: Reduce, Reuse,
and Recycle, retrieved 8/23/2005 from http://www.epa.gov/epaoswer/non-hw/muncpl/reduce.htm.
Warnock, M.M. and Ferguson, E.R., (1997). Effect of Soil Burial on Biodegradation ofSelected Nonwovens. Textile Chemist and Colorist, 29(11), 18–22.
World Trade Atlas (2005). Secondary Materials and Recycled Textiles Association, TextileRecycling Fact Sheet, retrieved 23/8/2005 from http://www.textile recycle.org/facts.pdf.
Wu, J., Zhang, J., Zhang, H., He, J.S. Ren, Q. and Guo, M. (2004). HomogeneousAcetylation of Cellulose in a New Ionic Liquid, Biomacromolecules, 5(2), 266–268.
501
Traditionally fabrics have been produced by weaving or knitting, whichinvolve conversion of fibers into yarns and subsequently arranging thecontinuous yarns into two-dimensional structures. In the past few decades,non-traditional fabrics, called nonwovens, have become more and more popular.Nonwovens are the fastest growing sectors of textile materials, and theycontinue to grow all over the world. A significantly large share of these areused as single use, or short life products, leading to disposability relatedproblems. Many of these disposable products are used in health and hygieneapplications. In such situations, cotton becomes the fiber of choice. Additionaladvantages of cotton include superior wet strength as well as a quick dryingsurface. Bleached cotton fibers have high levels of absorbency, are soft tothe touch, breathable and biodegradable. However, there are other issuessuch as quality, processability and cost, which have limited the share ofcotton to relatively low values among other fibers. With recent advances inscience and technology, it is possible to obtain cleaner cotton at a cheaperprice. Also, with increasing cost of petroleum products, and change in polymerand fiber supply market, synthetic fibers are becoming expensive, and thefuture looks brighter for cotton in nonwovens with increasing opportunitiesfor growth. The methods of producing nonwovens, especially those applicableto cotton fibers, their application potential, the nonwoven market, andrecent research in different areas for cotton nonwovens are discussed in thefollowing sections.
16.1 Nonwovens
Nonwoven fabrics are flat, porous sheets or web structures that are madedirectly from separate fibers or from molten plastics or from plastic films byentangling fibers or filaments mechanically, thermally or chemically. Accordingto the International Nonwovens and Disposables Association (INDA),1
‘Nonwovens are a sheet, web, or batt of natural and/or man-made fibers or
16Nonwoven technology for cotton
G B H A T, University of Tennessee, USA
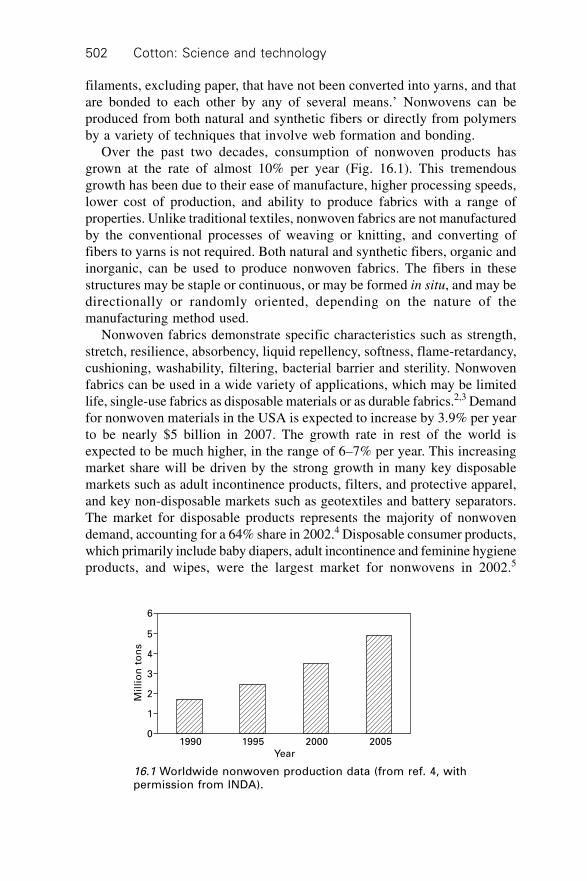
Cotton: Science and technology502
filaments, excluding paper, that have not been converted into yarns, and thatare bonded to each other by any of several means.’ Nonwovens can beproduced from both natural and synthetic fibers or directly from polymersby a variety of techniques that involve web formation and bonding.
Over the past two decades, consumption of nonwoven products hasgrown at the rate of almost 10% per year (Fig. 16.1). This tremendousgrowth has been due to their ease of manufacture, higher processing speeds,lower cost of production, and ability to produce fabrics with a range ofproperties. Unlike traditional textiles, nonwoven fabrics are not manufacturedby the conventional processes of weaving or knitting, and converting offibers to yarns is not required. Both natural and synthetic fibers, organic andinorganic, can be used to produce nonwoven fabrics. The fibers in thesestructures may be staple or continuous, or may be formed in situ, and may bedirectionally or randomly oriented, depending on the nature of themanufacturing method used.
Nonwoven fabrics demonstrate specific characteristics such as strength,stretch, resilience, absorbency, liquid repellency, softness, flame-retardancy,cushioning, washability, filtering, bacterial barrier and sterility. Nonwovenfabrics can be used in a wide variety of applications, which may be limitedlife, single-use fabrics as disposable materials or as durable fabrics.2,3 Demandfor nonwoven materials in the USA is expected to increase by 3.9% per yearto be nearly $5 billion in 2007. The growth rate in rest of the world isexpected to be much higher, in the range of 6–7% per year. This increasingmarket share will be driven by the strong growth in many key disposablemarkets such as adult incontinence products, filters, and protective apparel,and key non-disposable markets such as geotextiles and battery separators.The market for disposable products represents the majority of nonwovendemand, accounting for a 64% share in 2002.4 Disposable consumer products,which primarily include baby diapers, adult incontinence and feminine hygieneproducts, and wipes, were the largest market for nonwovens in 2002.5
1990 1995 2000 2005Year
6
5
4
3
2
1
0
Mil
lio
n t
on
s
16.1 Worldwide nonwoven production data (from ref. 4, withpermission from INDA).

Nonwoven technology for cotton 503
Nonwovens are used almost everywhere, in agriculture, construction, military,clothing, home furnishing, travel and leisure, healthcare, personal care, andhousehold applications. Whereas in some areas the nonwovens are replacingtraditional fabrics, because of their unique properties, they are finding manynew applications as well.
Cotton nonwovens are used as swabs, puffs, wipes, filters, waddings,personal care products such as diapers and feminine hygiene products, semi-durable segments like bedding, household furnishing, pillow fillers, etc.Some of the major uses are listed in Table 16.1. Additional advantages ofcotton and other natural fibers include superior wet strength as well as aquick drying surface, notably in wipes. Bleached cotton fibers have highlevels of absorbency and are soft to the touch, breathable and biodegradable.One quickly growing area, especially throughout Europe and Japan, is spunlacedcotton used for cosmetic wipes and other disposable products; these trendsare likely to spread to other markets as well.
16.2 Production of nonwovens
In most cases, the formation of nonwovens consists of two basic steps, webformation and bonding. The web formation in nonwoven production is acritical contributor of the end-use product performance. Three basic methodsare used to form a web: dry laid; wet laid; and polymer laid, the latter ofwhich consists of spun laid and melt blown web formations. Electrospinning,
Table 16.1 Products from cotton nonwovens
Personal care productsSwabs
Cosmetic pads
Tissues
Medical/dental – wipes, sponges, plugs
Diaper components – coverstock, acquisition layer, cores, back sheet
Feminine hygiene – pads, tampons
Adult continence
Baby and consumer wipes
Durable/semi/durable productsApparel – clothing, performance wear, outerwear, medical gown and drape,
interlinings
Home furnishings – bedding, mattress pads, wall coverings, decorative felts
Industrial productsFilter media
Geotextiles
Protective apparel
Absorbent media – oil and chemical
Insulation – thermal and acoustical
Packaging
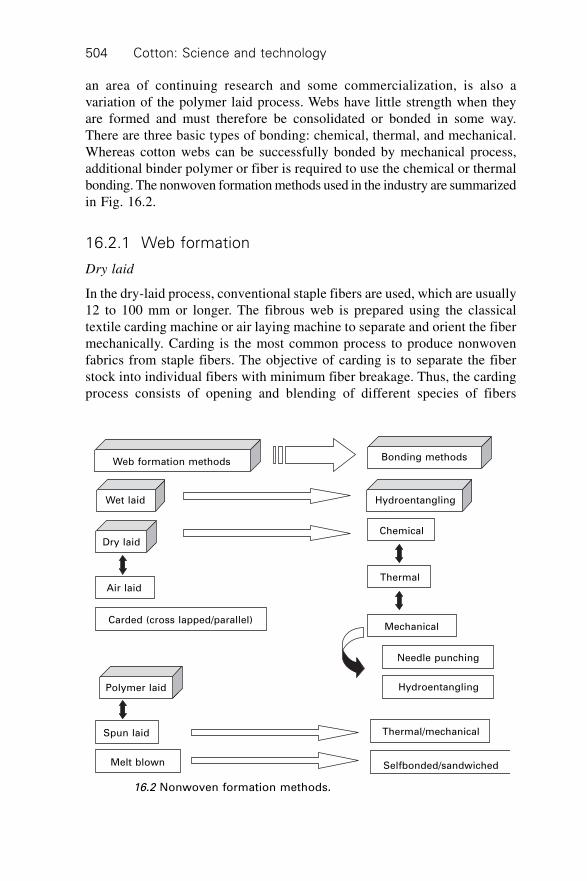
Cotton: Science and technology504
an area of continuing research and some commercialization, is also avariation of the polymer laid process. Webs have little strength when theyare formed and must therefore be consolidated or bonded in some way.There are three basic types of bonding: chemical, thermal, and mechanical.Whereas cotton webs can be successfully bonded by mechanical process,additional binder polymer or fiber is required to use the chemical or thermalbonding. The nonwoven formation methods used in the industry are summarizedin Fig. 16.2.
16.2.1 Web formation
Dry laid
In the dry-laid process, conventional staple fibers are used, which are usually12 to 100 mm or longer. The fibrous web is prepared using the classicaltextile carding machine or air laying machine to separate and orient the fibermechanically. Carding is the most common process to produce nonwovenfabrics from staple fibers. The objective of carding is to separate the fiberstock into individual fibers with minimum fiber breakage. Thus, the cardingprocess consists of opening and blending of different species of fibers
Web formation methods
Wet laid
Dry laid
Air laid
Carded (cross lapped/parallel)
Polymer laid
Spun laid
Melt blown
Bonding methods
Hydroentangling
Chemical
Thermal
Mechanical
Needle punching
Hydroentangling
Thermal/mechanical
Selfbonded/sandwiched
16.2 Nonwoven formation methods.

Nonwoven technology for cotton 505
thoroughly. Carding is performed by the mechanical action in which thefibers are held by one surface while the other surface combs the fibers,causing the separation of individual fibers, as described in earlier chapters.In a normal carding process, the fibers are more oriented along the machinedirection than the cross direction. More random web structures can be obtainedby cross lapping or a centrifugal dynamic random card system.
The orientation created by carding is improved by capturing fibers on ascreen from an air-stream (Fig. 16.3). Starting with a lap or plied card websfed by a feed roller, the fibers are separated by a licker-in or spiked roller andintroduced into an air stream. The total randomization excludes any preferredorientation when the fibers are collected on the condenser screen. The webis delivered to a conveyor for transporting to the bonding area. The length offibers used in air laying varies from 20 to 60 mm. Shorter fibre lengths allowhigher production speeds as they are transported easily in the air stream withlarger amount of fibers per unit volume of air and deposited on the collector.Longer fibers require higher air volume, i.e., a lower fiber density to avoidtangling. Problems associated with air laying are speed, web uniformity andweight limitations. Due to uniformity problems across the width due tovariation in air and fiber volume, it is not practical to make isotropic webslighter than 30 g/m2 by the air laid process.
Some advantages of air laying are the isotropic web structure, thatvoluminous webs can be produced and that a wide variety of fibers such asnatural, synthetic, glass, steel, carbon, etc., can be processed. This will allowthe production of webs from blends of cotton with other staple fibers. Some
Air flow
Feed rolls
Feed fibres
Ventilator
Spiked rollerPerforated cylinder
Web
16.3 Schematic of the air laid process.

Cotton: Science and technology506
of the disadvantages are the low level of opening fiber material by thelicker-in, the variation in web structure across the width of layer due toirregular air flow close to walls of the duct and possible entanglement offibers in the air stream.
The centrifugal dynamic random card forms a web by throwing off fibersfrom the cylinder onto a doffer with fiber inertia, which is subject to centrifugalforce, in proportion to the square of the rotary speed. This is different fromthe conventional card used in spinning systems, where the fibers arepreferentially oriented along the machine direction. The random card canproduce a 12 to 50 g/m2 web with fine fibers of 1.5 den and webs up to 100g/m2. Orientation in the web is three-dimensional and is random or isotropicwith no preferred orientation of the fibers in any particular direction. Productionof the random card is generally about 30 to 50% higher than conventionalcards. The machine direction versus the cross-direction strength is betterthan those produced in the conventional card, but is not as good as that of theair-laid webs.
Nonwovens can be made into the desired structure by the layering of thewebs from either the card or garnett. Garnetts are similar to roller topcards, with a group of rolls placed in an order and wire configuration totransport, comb and interlock fibers to form a web. Layering of webs can beaccomplished in several ways (i.e., longitudinal, perpendicular or cross) toachieve the desired weight and structure. Carded or air-laid webs usuallyhave basis weights ranging from 30 to 2500 g/m2. Typical end uses for dry-laid nonwoven fabrics are the fabrics for carpet backing, interlinings forgarments, apparel and upholstery backings, filter media, diaper coverstock,wipes, insulation, auto linings, medical fabrics, geotextiles and personalhygiene products.
Wet laid
Wet-laid nonwovens are webs made by a modified papermaking process.First, the fibers are mixed with chemicals and suspended in water to makethe slurry. Then, specialized paper machines are used to drain the water offthe fibers to form a uniform sheet of material, which is then bonded anddried. Thus, three steps are needed for the wet-laid process, the dispersion ofthe fiber in water, transporting the suspension onto a continuous travelingscreen to form the continuous web, and drying and bonding of the web.Short fibers, which are usually less than 10 mm, are needed for wet-laidprocessing and the resulting fabric has a basis weight ranging from 10 to 540g/m–2. The wet-laid process has advantages of high productivity, control oforientation of properties, and high uniformity at low basis weight whencompared with the air-laid process. Typical applications for wet-laid nonwovensinclude tea bags, wipes, surgical gowns and drapes, towels, etc.6
Nonwoven technology for cotton 507
Spun laid
Spun laid or spunbonding is a one-step process, which involves polymermelting, filament extrusion, drawing, laydown and bonding of the web toimpart strength, cohesiveness and integrity to it.7 The spinning process issimilar to the production of continuous filament yarns and similar extrusionconditions are used for a given polymer. Fibers are formed as the moltenpolymer exits the spinnerets and are quenched by cool air. Unlike in thetypical fiber spinning process, there is no positive take-up, and fibers aredirectly deposited on a moving collector to form a web. Before deposition ona moving belt or screen, the individual filaments must be attenuated to orientmolecular chains within the fibers to increase fiber strength and decreaseextensibility by rapidly stretching the plastic fibers immediately after exitingthe spinneret either mechanically or pneumatically. Then the web is formedby the pneumatic deposition of the filament bundles onto the moving belt.The fibers have to be distributed on the belt using some type of randomizationso that a fairly uniform random web is formed.
The formed webs are bonded either by mechanical, chemical, or thermalmethods depending on the ultimate fabric applications. Of the different options,thermal point bonding is the commercially popular method, wherein thebond area is about 15%. At these bond points fiber surfaces are partiallymelted to form fusion between neighboring fibers, thereby impartingstrength to the webs. Today spunbonded fabrics are widely used throughoutautomobiles as backing for tufted automobile floor carpets, trim parts,trunkliners, interior door panel, and seat covers, etc. For civil engineeringapplications, spunbond fabrics have been applied for erosion control, revetmentprotection, railroad bed stabilization, canal and reservoir lining protection,highway and airfield black top cracking prevention, roofing, etc.18 Spunbondedfabrics have also been widely used in sanitary, medical and packaging industries.Spunbonding is one of the fastest growing processes. Although spunlayinguses thermoplastic polymers and is not suitable for cotton, recently there hasbeen work done to produce cotton containing composites in a spunlay processas will be discussed later.
Melt blown
Melt blowing is one of the most popular processes of making super finefibers on the micron or sub-micron scale. In a melt-blowing process athermoplastic polymer is extruded through an extruder die which is rapidlyattenuated by the hot air stream to form the extremely fine diameter fibers.The attenuated fibers are then blown by high-velocity air to a collectorscreen to form a fine-fibered, self-bonded web. The combination of fiberentanglement and fiber-to-fiber bonding generally provides enough web
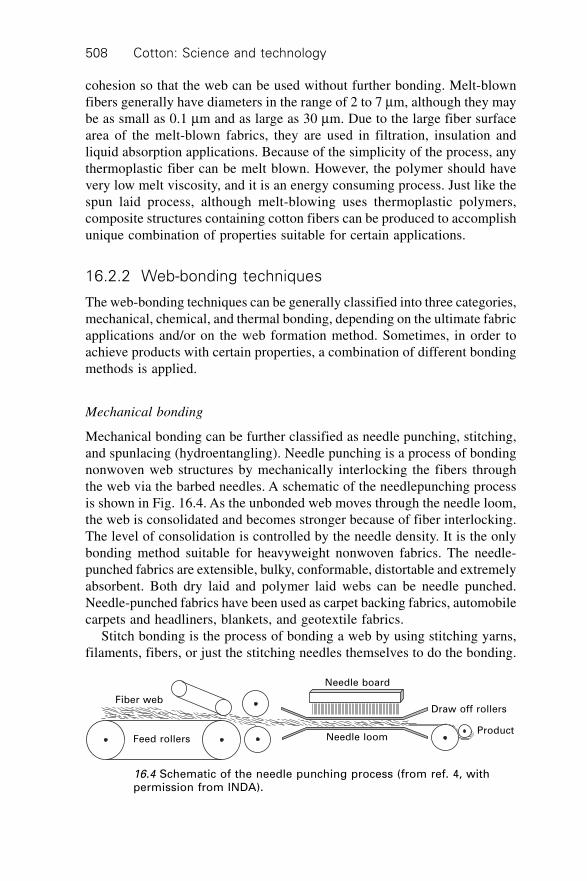
Cotton: Science and technology508
cohesion so that the web can be used without further bonding. Melt-blownfibers generally have diameters in the range of 2 to 7 mm, although they maybe as small as 0.1 mm and as large as 30 mm. Due to the large fiber surfacearea of the melt-blown fabrics, they are used in filtration, insulation andliquid absorption applications. Because of the simplicity of the process, anythermoplastic fiber can be melt blown. However, the polymer should havevery low melt viscosity, and it is an energy consuming process. Just like thespun laid process, although melt-blowing uses thermoplastic polymers,composite structures containing cotton fibers can be produced to accomplishunique combination of properties suitable for certain applications.
16.2.2 Web-bonding techniques
The web-bonding techniques can be generally classified into three categories,mechanical, chemical, and thermal bonding, depending on the ultimate fabricapplications and/or on the web formation method. Sometimes, in order toachieve products with certain properties, a combination of different bondingmethods is applied.
Mechanical bonding
Mechanical bonding can be further classified as needle punching, stitching,and spunlacing (hydroentangling). Needle punching is a process of bondingnonwoven web structures by mechanically interlocking the fibers throughthe web via the barbed needles. A schematic of the needlepunching processis shown in Fig. 16.4. As the unbonded web moves through the needle loom,the web is consolidated and becomes stronger because of fiber interlocking.The level of consolidation is controlled by the needle density. It is the onlybonding method suitable for heavyweight nonwoven fabrics. The needle-punched fabrics are extensible, bulky, conformable, distortable and extremelyabsorbent. Both dry laid and polymer laid webs can be needle punched.Needle-punched fabrics have been used as carpet backing fabrics, automobilecarpets and headliners, blankets, and geotextile fabrics.
Stitch bonding is the process of bonding a web by using stitching yarns,filaments, fibers, or just the stitching needles themselves to do the bonding.
Needle board
Needle loom
Draw off rollers
ProductFeed rollers
Fiber web
16.4 Schematic of the needle punching process (from ref. 4, withpermission from INDA).

Nonwoven technology for cotton 509
Stitch-bonded fabrics have taken the place of woven goods in many applicationssuch as decorative fabrics for home furnishing, shoe fabrics, backing fabricsfor artificial leather, etc.
Spunlacing is a process of entangling individual fibers with each otherusing high-pressure water jets, which cause the fibers to migrate and entangle.As shown in the schematic (Fig. 16.5), water jets push the fibers in theweb through the z-direction and the turbulence created causes enoughinterlocking between fibres to produce strong fabrics. The system requires agood water filtration system as clean water has to go through the finegauge water jets. Hydroentangled fabrics have more appealing propertiesthan the needle-punched fabrics. Spunlaced fabrics can be used as wipes,medical gowns, dust cloths, etc. Unlike needle punching the spunlace processhas no reciprocating mechanical part, which allows faster production speedsto be used.
Chemical bonding
Chemical or resin bonding is a generic term for bonding fibers by the applicationof a chemical binder. The chemical binders most frequently used to bondfiber webs today are water-borne binders made from vinyl materials, such aspolyvinyl acetate, polyvinylchloride, styrene/butadiene resin, butadiene, andpolyacrylic, or their combinations. Chemical binders are applied to webs inamounts ranging from about 5% to as much as 60% by weight on fiber. Thebinder solution is applied to the web and then cured thermally to obtainbonding. Several methods are used to apply binders including saturationbonding, spray bonding, print bonding, and foam bonding, etc. (Fig. 16.6).
Watersuction
Entangled web
Water jetUnbonded fiber web
16.5 Schematic of the hydroentangling process.

Co
tton
: Scie
nce
an
d te
ch
no
log
y5
10
1–Carrier screen2–Application roll3–Binder bath
Applicator roll methodSaturation bonding
Perforateddrum Nip rolls
Impregnation
To dryingand windup
Removingexcessadhesive
Web onscreen
From web forming
Webfeeding
To drying andwindup
Latex feed
Squeeze blade
Back up blade
Conveyor belt
From webforming
Latex bead
Rotary screen
Latex printing processSchematic of spray bonding process
Latex Air
From webforming
Todryingandwindup
Latexapplication
Webout
Webin
16.6 Various chemical bonding processes (from ref. 4, with permission from INDA).
3
21

Nonwoven technology for cotton 511
The type of bonding used depends on the web as well as the type ofbinder used.
Chemical bonded fabrics have been widely used as wipes and towels,apparel interlinings, automotive trim, filter media, etc. Use of the right chemicalbinder depending on the fiber and the intended application is important sincethe binder stays in the fabric. Also, environmental issues while applying orcuring of the binders also need to be considered. Chemical bonding allowsmore room for fabric designs and fiber selections. On the environmentalfront, increasingly strict regulations and guidelines are driving a trend towardsalternative products and technologies. Manufacturers and end-product suppliersalike are seeking ultra-low or formaldehyde-free binders.
Thermal bonding
Thermal bonding is the process of using heat to bond or stabilize a webstructure that contains a thermoplastic binder. It is the most popular methodof bonding used in nonwovens, because of the favorable process economics,the absence of chemical binders (that is, environmentally friendly), theavailability of new fibers and machinery, and process and product enhancement.The bonding is achieved by the direct action of heat and pressure by acalender, an oven, a radiant heat source, or an ultrasonic wave source. Thethermoplastic binder can be in the form of fiber, web, or powder. There arefour methods of thermal bonding. They are hot calendering, oven bonding,ultrasonic bonding, and radiant heat bonding. Hot calendering can be furtherclassified as area or point bond hot calendering, and embossing hot calendering.
Among the various types of thermal bonding methods, point bondingusing embossing rolls is the most desired method since this produces fabricswith desirable properties at very high speeds. A schematic diagram of thepoint bonding process is shown in Fig. 16.7. The process employs directcontact, with heat and pressure, to produce localized bonding in a nonwoven.Fabrics have additional softness and flexibility compared with fabrics producedusing smooth rolls in area bond hot calendering.
16.2.3 Technology and relative production rate
One of the reasons for the continuing growth of nonwovens is the highproduction rates that are possible with the new technologies. Typical productionrates are listed in Table 16.2. Compared to only a few meters per minutepossible with the woven or knitted fabrics, nonwovens can be produced atthe rate of a few hundred to thousand meters per minute. This high productionrate combined with the fact that the intermediate yarn formation is eliminatedhelps in keeping the cost of nonwovens very low. This low cost of roll goodsproduction has helped in the tremendous growth of nonwoven products.
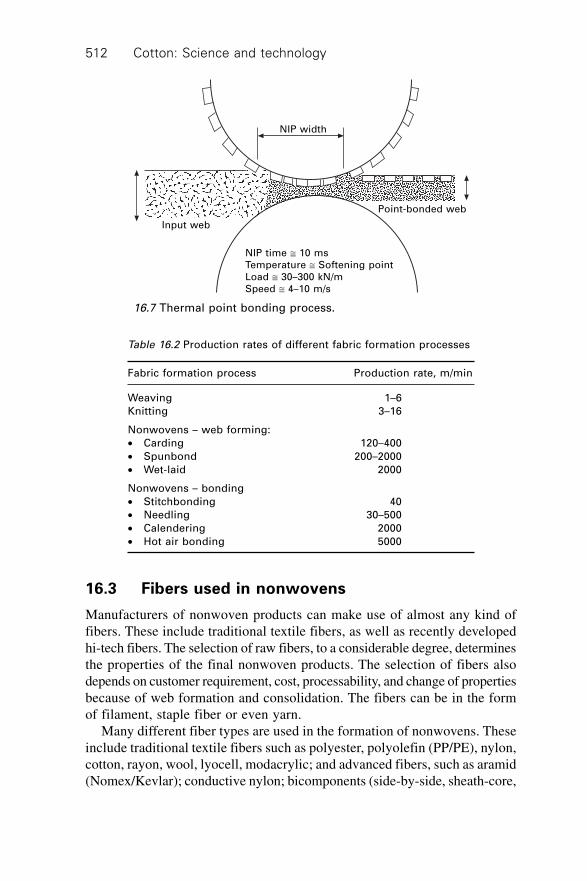
Cotton: Science and technology512
16.3 Fibers used in nonwovens
Manufacturers of nonwoven products can make use of almost any kind offibers. These include traditional textile fibers, as well as recently developedhi-tech fibers. The selection of raw fibers, to a considerable degree, determinesthe properties of the final nonwoven products. The selection of fibers alsodepends on customer requirement, cost, processability, and change of propertiesbecause of web formation and consolidation. The fibers can be in the formof filament, staple fiber or even yarn.
Many different fiber types are used in the formation of nonwovens. Theseinclude traditional textile fibers such as polyester, polyolefin (PP/PE), nylon,cotton, rayon, wool, lyocell, modacrylic; and advanced fibers, such as aramid(Nomex/Kevlar); conductive nylon; bicomponents (side-by-side, sheath-core,
Table 16.2 Production rates of different fabric formation processes
Fabric formation process Production rate, m/min
Weaving 1–6
Knitting 3–16
Nonwovens – web forming:
∑ Carding 120–400
∑ Spunbond 200–2000
∑ Wet-laid 2000
Nonwovens – bonding
∑ Stitchbonding 40
∑ Needling 30–500
∑ Calendering 2000
∑ Hot air bonding 5000
NIP width
Input web
Point-bonded web
NIP time @ 10 msTemperature @ Softening pointLoad @ 30–300 kN/mSpeed @ 4–10 m/s
16.7 Thermal point bonding process.
Nonwoven technology for cotton 513
segmented pie, and islands-in-the-sea); melamine (heat and flame resistant);hollow fibers (polyetherketone, polyaniline); Spandex fibers (polyether):fusible co-PET fiber; nylon 6 support/matrix fiber; glass micro-fiber;chlorofibre; antibacterial fiber; stainless steel; rubber thread;poly(tetrafluoroethylene) (PTFE); electrospun polymeric nanofibers.
16.3.1 Cotton fibers for nonwovens
The share of cotton in the nonwoven staple fibre market at present time isinsignificant, although the potential for growth is very high. Just about everyonecan recognize cotton as a durable, breathable and soft fiber. Whether it is acotton ball or hand wipe or favorite cotton T-shirt, cotton is well recognizedand widely accepted by consumers. Some of the advantages of cotton as wellas issues with nonwovens are listed in Table 16.3.9 A Cotton Incorporated,report, Cotton Nonwovens: Innovations & Solutions, sheds light on howpowerful the name cotton has become.10 In 2000, the global nonwovensmarket used the equivalent of 14.7 million bales of fibers. From 1996–2005,global consumption of bleached cotton fiber rose to 6% of total fiber used innonwovens, while cotton’s current share of the nonwovens market is 7.8%globally and 2.9% in North America. In major consumer markets of NorthAmerica, Western Europe and Japan, growth of cotton usage in nonwovensis projected to be 3–6% per year for the next few years.
A study,9 conducted by Cotton Incorporated in six cities across the USA,tested consumers’ perceptions of fiber content in nonwoven products andhow these perceptions affected purchasing preferences. The study was focusedwith four product categories: feminine napkins, tampons, baby wipes anddisposable diapers. In each category, the Cotton Seal significantly influencedconsumers’ purchasing preference. Moreover, 66% of consumers perceivedpersonal care products with the cotton seal to be of higher quality. To use the
Table 16.3 Cotton for nonwovens – advantages and issues
Advantages of Cotton Issues with cotton
∑ Softness ∑ Cost
∑ Absorbency ∑ Trash content
∑ Excellent wicking ∑ Color variations
∑ Breathability ∑ Fiber length variations
∑ Comfort ∑ Dusting and linting
∑ Biodegradability ∑ Nep formation
∑ Higher wet strength
∑ Low static potential
∑ Dyeable/printable
∑ Chemically modifiable
∑ Sterilizable by all industrial methods
Cotton: Science and technology514
cotton seal, products must have a minimum cotton content of 15% in someproducts and a higher level in some other products.
Many of the cotton absorbent products such as surgical sponges, sanitarynapkins, tampons and cosmetic pads and puffs can be satisfactorily madefrom by-product cotton fiber, i.e., gin motes, comber noils and other millwaste. Most of these products use bleached cotton coil (an oversized sliver)that needs little integrity (fiber-to-fiber cohesion). However, roll goods fromlightweight webs made by carding or air forming require textile grade fiber.Recommended fiber properties according to Cotton Incorporated and suggestedmethods of testing are:11
∑ micronaire: greater than or = 4.9∑ length: greater than or = 0.95 inches∑ uniformity: greater than or = 81.0 percent∑ strength: greater than or = 23.0 g/tex∑ non-lint content 0.8% maximum (MDTA-3)∑ fiber-to-fiber cohesion, 1700 g force maximum (ICI Fiber Cohesion Test)∑ fiber openness equal to 100 cc/gram minimum (ITT Test Method)
Fiber length and strength are important in the manufacture of lightweightnonwovens. However, good fabric appearance is more important than fabricstrength in certain nonwoven products, and fiber micronaire plays a majorrole in these items. Nep content is an undesirable component. High micronairecotton tends to have lower nep content after ginning and is less prone to formadditional neps in subsequent processing. A careful investigation10 of theeffect of micronaire showed that substantial increases in neps were noted forthe low micronaire cotton during bleaching and nonwoven web formation.There was a dramatic improvement in properties on using higher (> 4.5)micronaire cotton.
Bleached cotton
Many of the cotton nonwoven products that go into hygiene applicationsrequire bleached cotton. There is growing capacity to produce bleachedfibers targeting nonwovens, due to increasing interest in bleached fibers,among nonwoven manufacturers. Cotton, when bleached, is also moreaesthetically pleasing to consumers who appreciate the snow-white qualityof bleached cotton. Also, when a natural fiber such as cotton is dyed, thecolors tend to be softer and pastel, unlike synthetic fibers that produce muchshinier and usually glare-like effects. Cotton fibers give nonwoven fabricsunique characteristics that synthetic fibers cannot duplicate easily. Syntheticfibers are currently being used more in nonwoven fabrics than cotton becauseof misconceptions regarding cotton’s processability. With improved bleachingtechniques and the development of new finish applications, cotton can be
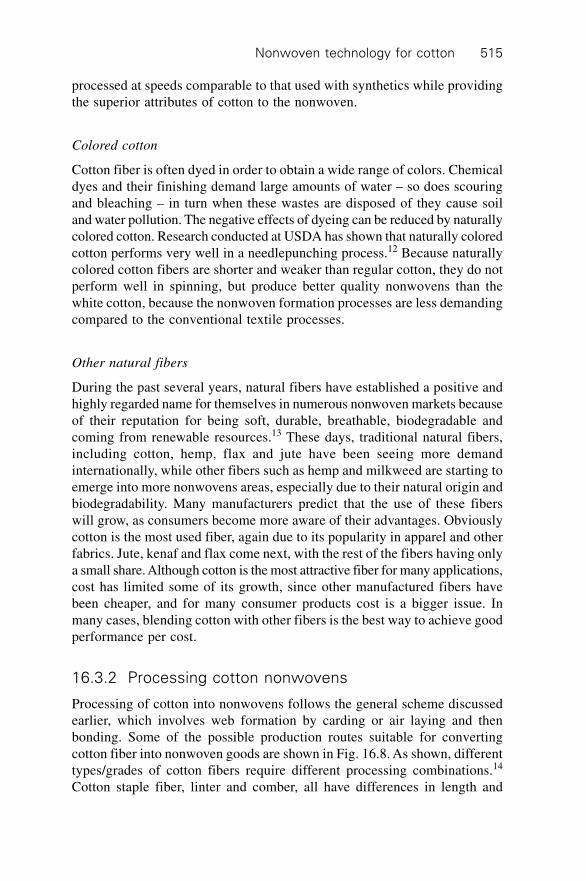
Nonwoven technology for cotton 515
processed at speeds comparable to that used with synthetics while providingthe superior attributes of cotton to the nonwoven.
Colored cotton
Cotton fiber is often dyed in order to obtain a wide range of colors. Chemicaldyes and their finishing demand large amounts of water – so does scouringand bleaching – in turn when these wastes are disposed of they cause soiland water pollution. The negative effects of dyeing can be reduced by naturallycolored cotton. Research conducted at USDA has shown that naturally coloredcotton performs very well in a needlepunching process.12 Because naturallycolored cotton fibers are shorter and weaker than regular cotton, they do notperform well in spinning, but produce better quality nonwovens than thewhite cotton, because the nonwoven formation processes are less demandingcompared to the conventional textile processes.
Other natural fibers
During the past several years, natural fibers have established a positive andhighly regarded name for themselves in numerous nonwoven markets becauseof their reputation for being soft, durable, breathable, biodegradable andcoming from renewable resources.13 These days, traditional natural fibers,including cotton, hemp, flax and jute have been seeing more demandinternationally, while other fibers such as hemp and milkweed are starting toemerge into more nonwovens areas, especially due to their natural origin andbiodegradability. Many manufacturers predict that the use of these fiberswill grow, as consumers become more aware of their advantages. Obviouslycotton is the most used fiber, again due to its popularity in apparel and otherfabrics. Jute, kenaf and flax come next, with the rest of the fibers having onlya small share. Although cotton is the most attractive fiber for many applications,cost has limited some of its growth, since other manufactured fibers havebeen cheaper, and for many consumer products cost is a bigger issue. Inmany cases, blending cotton with other fibers is the best way to achieve goodperformance per cost.
16.3.2 Processing cotton nonwovens
Processing of cotton into nonwovens follows the general scheme discussedearlier, which involves web formation by carding or air laying and thenbonding. Some of the possible production routes suitable for convertingcotton fiber into nonwoven goods are shown in Fig. 16.8. As shown, differenttypes/grades of cotton fibers require different processing combinations.14
Cotton staple fiber, linter and comber, all have differences in length and
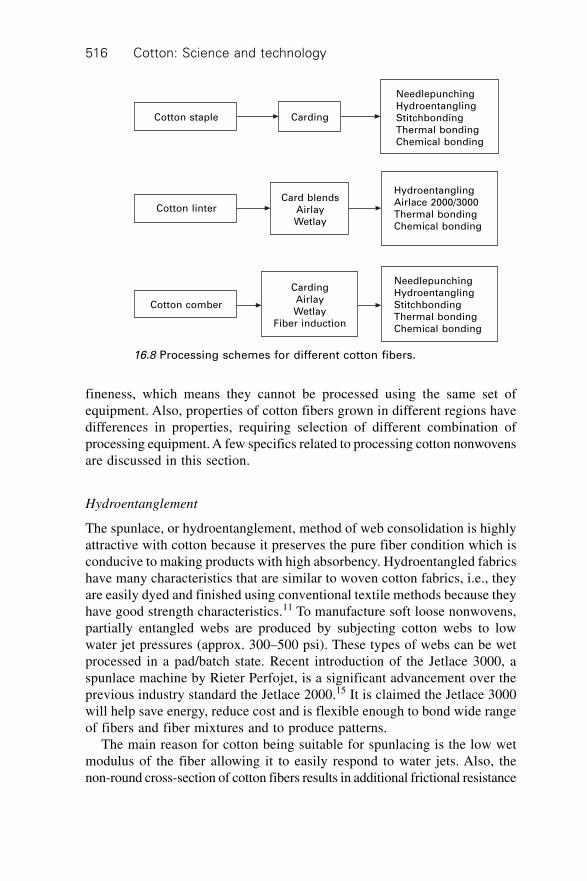
Cotton: Science and technology516
fineness, which means they cannot be processed using the same set ofequipment. Also, properties of cotton fibers grown in different regions havedifferences in properties, requiring selection of different combination ofprocessing equipment. A few specifics related to processing cotton nonwovensare discussed in this section.
Hydroentanglement
The spunlace, or hydroentanglement, method of web consolidation is highlyattractive with cotton because it preserves the pure fiber condition which isconducive to making products with high absorbency. Hydroentangled fabricshave many characteristics that are similar to woven cotton fabrics, i.e., theyare easily dyed and finished using conventional textile methods because theyhave good strength characteristics.11 To manufacture soft loose nonwovens,partially entangled webs are produced by subjecting cotton webs to lowwater jet pressures (approx. 300–500 psi). These types of webs can be wetprocessed in a pad/batch state. Recent introduction of the Jetlace 3000, aspunlace machine by Rieter Perfojet, is a significant advancement over theprevious industry standard the Jetlace 2000.15 It is claimed the Jetlace 3000will help save energy, reduce cost and is flexible enough to bond wide rangeof fibers and fiber mixtures and to produce patterns.
The main reason for cotton being suitable for spunlacing is the low wetmodulus of the fiber allowing it to easily respond to water jets. Also, thenon-round cross-section of cotton fibers results in additional frictional resistance
Cotton staple
Cotton linter
Cotton comber
Carding
Card blendsAirlayWetlay
CardingAirlayWetlay
Fiber induction
NeedlepunchingHydroentanglingStitchbondingThermal bondingChemical bonding
HydroentanglingAirlace 2000/3000Thermal bondingChemical bonding
NeedlepunchingHydroentanglingStitchbondingThermal bondingChemical bonding
16.8 Processing schemes for different cotton fibers.

Nonwoven technology for cotton 517
leading to better adhesion and entanglement. There are also advantages inusing unbleached cotton as it is cheaper and water jets can remove some ofthe oils or wax from the fiber. However, the drawback is the need for a betterwater filtration system.
Needle punching
Needle-punched cotton provides a highly efficient filter media based on theirregular fiber shape and absorption properties. Increased tenacity in the wetcondition can be an important advantage for cotton filters. To build strength,scrim materials can be needle punched and used in bed blankets and industrialfabrics. Needles of 36–42 gauges have been found appropriate for theproduction of cotton needle-punched nonwovens. For very heavy fabrics,use is made of gauge 32 and for finer fabrics 40–42 gauge needles are used.Needle fineness has probably the most effect on fabric properties. Generallywith finer needles there is an increase in web density and reduction in airpermeability.
Regular length staple cotton should be considered for needle punchingsince longer fibers perform better. Good length uniformity in a cotton sampleprovides enough long fiber to form strong fabrics. Fiber finish is critical inneedling. Bleached cotton with good lubricity is needed to prevent fiberdamage and needle breakage. Raw cotton (unbleached) also needles extremelywell with proper needle selection. As discussed earlier, choosing a fiber witha high micronaire allows the production of a stronger needle-punched fabric,providing all other factors remain equal. Recent studies have shown that theH1 needle technology with changes in needle zone contours and profileshelp improve the structural features of cotton nonwovens.16 In addition tothe fact that this development allows the production of superior qualitynonwovens with relatively less needling, processing speed can be increasedresulting in lower production cost.
Stitch bonded nonwovens
Cotton web is stitched as in sewing and the product performance dependson web weight, stitch/cm and type of sewing thread. Arachne and Maliwatttype warp knit machines are used to produce stitchbonded nonwovens.Typically, a filament type yarn is used for stitching purposes, but it has beendemonstrated that cotton yarn in counts from 18 to 30 Ne (295–177 denier)are suitable for stitching a cotton web. As with some of the other bondedwebs, stitchbonded cotton can be wet processed in fabric form much likeconventional textiles.10

Cotton: Science and technology518
Chemical bonding
Cotton webs can be bonded using aqueous binders that may be applied byspraying, foaming, gravure roll padding or printing. A wide range of chemicalbinders are available. Printed patterns provide fabric integrity without impartingobjectionable stiffness to the bonded material. Nonwovens for wipes areproduced using the print bonding technique.10
Thermal bonding
In this process cotton webs with blends of thermoplastic fibers are passedbetween two hot rollers (calender rollers). The thermoplastic fiber softens/melts and bonds the web. Lightweight fabrics suitable for coverstock, fabricused as a diaper top sheet, can be made by blending cotton with polyolefin,polyester or bicomponent fibers then subjecting the web to heat and pressureusing heated calender rolls. The exact bonding conditions are dependent onthe melting temperature of the binder fiber and the weight of the web. Thecalender pressure is increased with fabric weight to get efficient heat transfer.The calender temperatures are close to the melting temperature of the binderfiber. When sheath-core bicomponent binder fibers are used, the temperatureis above the melting temperature of the sheath, but well below that of thecore polymer. Typically a bonding temperature of about 160 ∞C is used withpolypropylene binder fiber and about 130 ∞C, for a sheath core fiber withpolyethylene sheath. In all the cases, the contact time is in the order ofmilliseconds, with production speeds of hundreds of m/min.
The strength of the webs varies with the binder fiber composition, asbinder fibers are generally stronger and with more binders, there is sufficientto cause melting and flow to form good bond points. Typically 30 to 50%binder fibers with rest cotton produce stronger webs. Whereas a bond area ofabout 15% is used for the majority of thermoplastic fiber nonwovens, anembossed calender roll with about 30% contact area is needed for blends ofcotton and thermoplastic binder fibers to achieve good tensile properties.10
Alternatively, one can use through air bonding, where the web containingthermoplastic binder is passed through an oven. Here residence time will bein the order of several seconds to minutes for achieving good bonding due tothe melting and flow of the binder around the cotton fibers.
Research on cotton-based nonwovens has been carried out at The Universityof Tennessee, Knoxville (UTK) using different kinds of biodegradablethermoplastic binder fibers through carding and thermal calenderingprocesses.17–20 The main objective is to have fully biodegradable componentsin the fiber mixtures, thus producing compostable products. Five differentkinds of biodegradable binder fibers were used. Cotton fiber was the basefiber, and binder fibers were, ordinary cellulose acetate (OCA), plasticizedcellulose acetate (PCA), Eastar Bio® copolyester unicomponent (Eastar),

Nonwoven technology for cotton 519
and Eastar Bio® copolyester bicomponent (Eastar/PP) and polylactic acid(PLA) fibers. These binder fibers have different melting temperatures, resultingin the use of different optimum bonding temperatures, ranging from 110 ∞Cfor the copolyester fiber to 230 ∞C for OCA. All these fibers showed goodbonding with cotton. The nonwoven fabrics in this research were producedby first carding of cotton and the binder fiber and then thermally bonding thecarded webs, as shown in Fig. 16.9.
The tensile strength of the nonwoven fabric made with a cotton/celluloseacetate nonwoven blend is quite low and is not suitable for consumerapplications when it is processed at the temperatures associated with celluloseacetate’s softening temperature (180–205 ∞C). Solvent treatment has beenintroduced in order to modify the softening temperature of cellulose acetatefiber and to lower the calendering temperature, while maintaining enhancedtensile properties. The results showed that these solvent treatments can decreasethe softening temperature of cellulose acetate fiber and produce comparativelystronger webs.
From the point of energy concern, it is better to make the whole processas simple as possible. So a plasticized cellulose acetate fiber, wherein aninternal plasticizer was added during fiber manufacture to lower the softeningtemperature of ordinary cellulose acetate and further lower the bondingtemperature during the thermal calendering process was investigated. It wasclearly seen that fabric strength was improved by using PCA instead ofOCA. A newly introduced Eastar Bio GP copolyester unicomponent (Eastar)fiber, which has a relatively low softening temperature (~80 ∞C), was furtherselected as a binder fiber instead of cellulose acetate fiber.21–22 Because ofthe low softening temperature of the binder fiber (Ts: ~80 ∞C), the bondingtemperatures used are lower.
Fiber mix
Nonwoven fabrics
Thermal calendering
Carding
Cotton fibers Binder fibers
16.9 Production scheme for cotton-based thermal bondednonwovens.

Cotton: Science and technology520
The tensile properties of cotton and two different bicomponent binderfibers with temperature and binder composition are shown in Fig. 16.10.Both the biodegradable (Eastar/PP) and the PET/PP bicomponent binderfibers show the trend of tensile strength initially increasing with bondingtemperature and then dropping off after an optimum value. Actual strengthvalues were much higher for the PET/PP bicomponent fiber compared toEastar/PP. The SEM photographs of bond points of both blends are shown inFig. 16.11. This indicates that bonding is comparable with both the binders,but the strength difference is due to the strength values of the binder fibers.Also, the bonding area, where there is contact between the embossed roll andthe smooth roll of the calenders, in this study was only 15% compared to the25 to 30% area that is desirable for cotton-based nonwovens. Further studieshave shown that PLA can be a very good binder for cotton-based nonwovens.With the production of PLA in large volumes, the cost is supposed to comedown and it is supposed to be comparable to that of or cheaper than bleachedcotton, making it an attractive binder fiber. Additional advantages of PLAare that it is from a renewable resource, and is biodegradable.
16.3.3 Laminated cotton nonwovens
Cotton surfaced and cotton core nonwovens with polypropylene spunbondedfabrics have been produced with cotton content varying from 40 to 75%.23,24
A schematic showing the introduction of a cotton/PP carded web with a spunlaid fabric to produce thermally bonded composite webs during the thermalbonding process is shown in Fig. 16.12. For achieving cotton surface on bothsides, another carded web is introduced from below, and for cotton corenonwovens, another spun laid web is combined from the top. The thermallybonded two or three layered laminates are soft but strong, and have a hand
Cotton/(PE/PET) = 70/30Cotton/PE/PET) = 50/50
Cotton/Eastar/PP = 70/30Cotton/(Eastar/PP) = 50/50
110 120 130 140 150Bonding temperature (C)
(a) Cotton/(PE/PET) nonwovens
2.5
2
1.5
1
0.5
0
Pe
ak l
oa
d (
kg
)
2.29
1.56
0.570.54
0.85
0.29
90 100 110 120 130Bonding temperature (C)
(b) Cotton/(Eastar/PP) nonwoven
1.21
0.85
1.15
0.54
0.65
0.56
Pe
ak l
oa
d (
kg
)
1.4
1.2
1
0.8
0.6
0.4
0.2
0
16.10 Effect of bonding temperature on (MD) strength of cotton-based nonwovens.
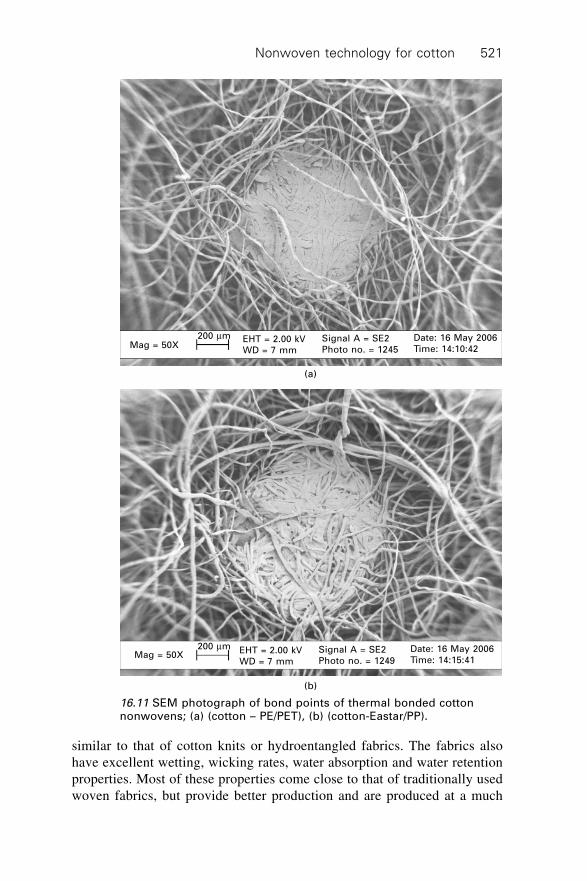
Nonwoven technology for cotton 521
Mag = 50X200 mm EHT = 2.00 kV
WD = 7 mm
Signal A = SE2Photo no. = 1245
Date: 16 May 2006Time: 14:10:42
(a)
Mag = 50X200 mm EHT = 2.00 kV
WD = 7 mm
Signal A = SE2Photo no. = 1249
Date: 16 May 2006Time: 14:15:41
(b)
16.11 SEM photograph of bond points of thermal bonded cottonnonwovens; (a) (cotton – PE/PET), (b) (cotton-Eastar/PP).
similar to that of cotton knits or hydroentangled fabrics. The fabrics alsohave excellent wetting, wicking rates, water absorption and water retentionproperties. Most of these properties come close to that of traditionally usedwoven fabrics, but provide better production and are produced at a much

Cotton: Science and technology522
lower cost. These fabrics exhibit minimum linting characteristics, and can befinished to impart stretchability. This study shows how cotton fibers/webscan be combined with other synthetic fiber webs to produce nonwovens witha unique combination of properties.
16.3.4 Cotton containing nonwovens for molded products
The natural feel of cotton, biodegradability and good adhesion to binderfibers, makes it a suitable candidate for molded composites. Molding ofpreformed nonwoven web simply using heat and pressure is a simple andpractical approach to produce shaped products. Natural fiber compositescontaining flax/kenaf are extensively used for many automotive moldedproducts. These show good thermal and acoustical insulation properties aswell. Cotton has properties comparable to these fibers and is a suitablecandidate except for its relatively high price. Recent studies by Kamath et
al.25–26 have shown that cotton when combined with flax or kenaf producesgood molded products that have acceptable physical properties and acousticalinsulation properties. In these studies waste or low quality cotton was used,and there was no need for bleaching, thus keeping the fiber cost low. Also,this is another good outlet for low-quality cotton fibers. Another advantagewas that using suitable biodegradable thermoplastic binders such as PLA,fully biodegradable/compostable products could be produced. Also, thesecan be fabricated with other fibers without need for any modification of theprocess. These molded composites can be good insulating materials inautomobiles as well as appliances. The acoustic measurements havedemonstrated that natural fiber-based nonwoven composites contribute tothe absorptive properties of the components, and are effective for noisereduction.27–28
16.12 Cotton surface nonwoven formation using a spunbondingmachine (from ref. 23, with permission from INDA).
Smooth calender
Laminated fabric
Diamond-patterned calender
Unbounded SBweb
Conveyor belt
SB extrusion die
Cotton/PPweb
Nonwoven technology for cotton 523
16.4 Finishing and treatment of cotton nonwovens
Finishing of nonwoven bonded fabrics can be classified in different ways,such as chemical, mechanical, or thermal-mechanical. Chemical finishinginvolves the application of chemical agents such as coatings to fabric surfacesor the impregnation of fabrics with chemical additives or fillers. Mechanicalfinishing involves altering the texture of fabric surfaces by physicallyreorienting or shaping fibers on or near the fabric surface. Thermal-mechanicalfinishing involves altering fabric dimensions or physical properties usingheat and pressure. Generally, finishing of nonwoven bonded fabrics is classifiedas dry finishing or wet finishing. The majority of finishing operations areapplicable to nonwovens. Some of the possible treatments given to cottonnonwovens to enhance their performance are:
∑ flame resistance∑ antibacterial∑ water repellency∑ resistance to biodegradation∑ dyeing/printing∑ cross linking for durability to washing∑ increased resiliency.
Cotton nonwovens can be treated like other cotton fabrics for manyapplications to achieve desired properties or to enhance performance. Thenonwoven fabric finishing is carried out either in tandem with web formationand consolidation or off-line as a separate operation. There are many examplesof particular methods and types of finishing equipment being used for bothkinds of fabrics. Nonwovens may be given one or more of a variety offinishing processes as a means of enhancing fabric performance or aestheticproperties. Performance properties include functional characteristics such asmoisture regain and transport, absorbency, or repellency; flame retardancy;electrical response; resistance; and frictional behavior. Aesthetic propertiesinclude various attributes such as appearance, surface texture, color, andodor. The specific property requirement is dependent on the application asthey vary widely from one product to another.
A significant amount of research on nonwoven fabric finishes is beingconducted at USDA laboratory in New Orleans, LA.29 One such example ofthe research was to carry out single-bath chemical finishing of perpendicular-laid (P-laid) high lofts to afford the composites’ improved flame resistance(FR) and physical resiliency. High loft nonwovens are low density fabricscharacterized by a high ratio of thickness to weight per unit area, whichmeans that high lofts contain considerable void volume. They are usuallymade of synthetic fibers. The major problems with using cotton in high loftsare cotton’s high flammability and lack of resiliency. Parikh et al. havedeveloped finishing formulations containing the flame retardants (i)

Cotton: Science and technology524
diammonium phosphate (DAP)/urea, and (ii) DAP and cyclic phosphonateester along with the crosslinking agent dimethyloldihydroxyethyleneureaDMDHEU.30 Both the formulations imparted flame resistance to the highlyflammable high lofts, protecting them completely. However, the formulationcontaining DAP/urea is preferred because it is of lower cost. The crosslinkingagent was effective in improving compressional resistance and recovery. So,the finishing treatment produced P-laid cotton blend highlofts that were bothFR and resilient. This is important for cotton fibers that are used in mattressesthat have good resiliency as well as flame retardancy to resist the open flame.
For many wound dressings, there is a need for high absorbency and abilityto retain moisture. Carboxy methylation was shown to be very effective inproducing a highly swellable, water retentive cotton fiber without any strengthloss. The carboxymethylation was accomplished by treating the nonwovenin alcoholic caustic and monochloroacetic acid using 90/10 ethanol water.Such a treated cotton nonwoven product is sterilizable and suitable for moistdressings, especially on burn wounds. Such a product is cheaper and competitivewith the traditionally used calcium/sodium alginate dressing. Also, cottondressings can be easily modified to improve healing of chronic wounds.31 Inaddition to some of these finishings, cotton nonwovens can be used as substratesfor coated/laminated products as well.
Another category of finishing is the conversion of roll goods into finalproducts. This involves cutting, slitting, folding, application of variouschemicals/agents, and packaging. Some of the conversions can include thermalfusing, welding and sewing. For some products, such as premoistened wipes,nonwovens are impregnated with lotions after folding in packaging. Medicaland surgical products are sterilized after the conversion of products. Thesterilization could be radiation type or the one using ethylene oxide andsteam. Unlike many other types of nonwovens, cotton nonwovens are easyto handle in many finishing operations.
16.5 Future trends
Cotton fiber nonwovens are already used in a variety of applications, but thepotential for growth is very high. Consumer demands for cotton are welldocumented, but because nonwovens are not required to list fiber content inproducts, consumers often do not know what they are purchasing. There isdefinitely an opportunity to increase market share by adding cotton to thefiber content since there is a consumer preference for cotton-containingproducts.11 Some of the recent developments leading to increased use ofcotton in nonwovens are:
∑ Cotton linters replacing the traditional 100% wood pulp fibers for producingabsorbent cores for disposable diapers and famine pads, as this improvessome properties as well as consumer appeal.32

Nonwoven technology for cotton 525
∑ Cotton is being blended with kenaf fibers to improve the softness andhand.33
∑ Buckeye Technologies has developed 100% natural cotton for tamponmanufacture.34
∑ Development of a ‘flexible cotton decontamination wipe’ for human andsensitive equipment decontamination at Texas Tech University.35 Thepurpose here is to use the natural fiber that is comfortable to use on thebody, but at the same time can be incorporated with decontaminant additivessuch as activated carbon and metal oxides.
Wipes are one of the largest application areas for cotton nonwovens. Becauseof its high absorbency, a good fabric-like structure, low linting tendency andhigh wet strength, spunlaced cotton nonwovens are highly suitable for hospital,medical, consumer, cosmetic and wet wipes. These are also suitable for specialapplications in the computer industry for cleaning lithographic plates, etc.
Spunlaced cottons are also used as semi-durable bed sheets, napkins andtable cloths. These can be washed 6–8 times without any problem.36 Theproducts obtained have the appearance and feel of linen and can be dyed andprinted for special effects. Cotton blankets, carpets and rugs also have beenproduced from needlepunched nonwovens. Thermal bonded nonwovens aresuitable for cover stock and other healthcare products therefore cottonnonwovens find application in many areas. The challenge is to make themeconomically competitive by appropriate selection of fibers and manufacturingmethods.
16.6 Conclusions
Although the current share of cotton in nonwovens is small, cotton has abright future in this growing sector of fabrics. Hygiene and other absorbentproducts are the major markets for bleached cotton fibers. Raw cotton can beused for many products such as moldable composites, furniture and beddingpads, and for several products produced through the hydroentangling process.Absorbency, wet strength and breathability of cotton give natural advantagesto many products. The biodegradability of the fiber as well as its renewableresource makes it an environmentally safe product to use. Cotton nonwovenscan be recycled, reused or disposed of by natural degradation conditions.Cotton is a readily renewable resource with long-term supply assurance.Extensive research to improve the bleaching process and nonwoven fabricationprocesses such as needling and hydroentangling make cotton nonwovensmore economical. The share of cotton in nonwovens will continue to increaseas cotton-containing items are preferred by consumers. Innovation is the keyto produce competitive products with superior performance to increase theshare of cotton in the growing nonwovens industry.
Cotton: Science and technology526
16.7 References
1. http://www.inda.org/category/nwn_index.html2. G. S. Bhat, ‘Future of Nonwoven Fabrics’, Speculations in Science and Technology,
Vol. 19, 149–155 (1996).3. S. K. Batra and F. L. Cook, The Nonwoven Fabrics Handbook 1992.4. Nonwovens Handbook, ed. Butler, I., INDA Publications, Cary, NC (2004).5. http://www.the-infoshop.com/study/fd16116_nonwovens.html6. S. M. Hansen, Nonwoven Engineering Principles, Nonwovens – Theory, Process,
Performance and Testing, Edited by A. F. Turbak, TAPPI Press, Atlanta, GA, 1993.7. G. S. Bhat and S. R. Malkan, ‘Extruded Continuous Filament Nonwovens: Advances
in Scientific Aspects’, J. of Appl. Polym. Sci., Vol. 83, 572–585 (2002).8. R. L. Smorada, Encyclopedia of polymer science and engineering, New York, 227–
253.9. G. S. Bhat, ‘Overview of Cotton-Based Nonwovens’, Beltwide Conference Proceedings,
New Orleans, LA, January 2005.10. Cotton for Nonwovens: A Technical Guide, Cotton Incorporated, http://
www.cottoninc.com/Nonwovens11. http://www.cottoninc.com/Nonwovens/CottonNonwovens/?S=Nonwovens&Sort=012. L. Kimmel, C. Delhom, W.R. Goynes, V.G. Yachmenev and T.A. Calmari Jr., ‘Superior
Nonwovens made from Naturally Colored Cottons’, Proceedings of the Beltwide
Cotton Conferences, Anaheim, CA, January 2001.13. G. Bhat and H. Rong, ‘Biodegradable Nonwovens’, in Biodegradable and Sustainable
Fibers, ed. by R. S. Blackburn, Woodhead Publishing Limited, Cambridge, UK,(2005) 310–342.
14. E. M. McLean, ‘Cotton Nonwoven Innovations’, Proceedings of the Beltwide Cotton
Conferences, Anaheim, CA, January 2001.15. http://www.expresstextile.com/20031009/productportfolio02.shtml16. S. Ramkumar and A. P. S. Sawhney, ‘Production of Cotton Nonwoven Fabrics using
H1 Technology Needleloom’, Proceedings of the 2001 Beltwide Cotton Conferences,1, 674–676 (2001).
17. H. Suh, K. E. Duckett and G. S. Bhat, ‘Biodegradable and Tensile Properties ofCotton/Cellulose Acetate Nonwovens’, Textile Research Journal, 66(4) 230–237(1996).
18. G. S. Bhat, K. E. Duckett, G. M. Heismeyer, X. Gao and Mac McLean, ‘Processingand Properties of Cotton-Based Nonwovens’, Proceedings of the 9th TANDEC
Conference, Knoxville, TN (1999).19. K. E. Duckett, G. S. Bhat and Hagen Suh, ‘Compostable/Biodegradable Nonwovens’,
U.S. Patent 5,783,505 (issued July 21, 1998).20. X. Gao, K. E. Duckett, G. S. Bhat and H. Rong, ‘Effects of water Treatment on
Processing and properties of Cotton/Cellulose Acetate Nonwovens’, International
Nonwovens Journal 10(2), 21–25 (2001).21. G. S. Bhat, H. M. Rong, and M. Mclean, ‘Biodegradable/Compostable Nonwovens
from Cotton-based Compositions’, INTC 2003 Proceedings, Baltimore, Maryland,September 15–18, 2003.
22. H. M. Rong and G. S. Bhat, ‘Preparation and Properties of Cotton-Eastar Nonwovens’,Int. Nonwovens J., 12(2), 53–57, 2003.
23. L. C. Wadsworth, H. Suh and H. C. Allen, ‘Cotton Surfaced Nonwovens for Short-Wear-Cycle Apparel’, International Nonwovens Journal, Summer 2000, pp. 13–17.
Nonwoven technology for cotton 527
24. L. C. Wadsworth, Proceedings of the Beltwide Cotton Conferences, Anaheim, CA,January 2001.
25. M. G. Kamath, G. S. Bhat, D. V. Parikh and D. Mueller, ‘Cotton Fiber NonwovensFor Automotive Composites’, International Nonwovens Journal, pp 34–40 (Spring2005).
26. M. G. Kamath, G. S. Bhat, D. V. Parikh and D. Mueller, ‘Biodegradable/CompostableComposites From Ligno-Cellulosic Fibers for Automotive Applications’, SAE
Proceedings, October 2005.27. D. V. Parikh, T. A. Calamari, ‘Performance of Nonwoven Cellulosic Composites For
Automotive Interiors’, Int. Nonwovens J., 9(2), 83–85, 2000.28. Yachmenev, V. G., Parikh, D. V. and Calamari, T. A. Jr., ‘Thermal Insulation Properties
of Biodegradable, Cellulosic-based Nonwoven Composites for AutomotiveApplication’, Journal of Industrial Textiles (2002), 31(4), 283–296.
29. T. A. Calamari and D. V. Parikh, ‘Cotton Nonwovens Research at the SouthernRegional Research Center’, Proceedings of the 2001 Beltwide Cotton Conferences,(2001).
30. D. V. Parikh and T. A. Calamari, ‘Flameretardant Highlofts Containing Cotton’,Proceedings of the 2001 Beltwide Cotton Conferences (2006).
31. J. V. Edwards, ‘Design, Preparation and Activity of Cotton-based Wound Dressingsfor Chronic Wounds’, Proceedings of the 2001 Beltwide Cotton Conferences, 1,674–676 (2006).
32. H. C. Allen, ‘Cotton in Absorbent Cores’, Nonwovens World, Aug.–Sept 1999, pp.71–78.
33. P. Bel-bieger et al., ‘Textile Technology, Cotton/Kenaf Fabrics’, The Journal of
Cotton Science, 3, 60–70 (1999).34. ‘Readers Service, Natural Cotton Fiber’, Nonwovens Industry, Jan. 1999, 74.35. http://www.cotton.org/foundation/2005-06/Projects/gen-new-products.cfm36. D. Gillespie, ‘Nonwovens and Lifestyle’, Proceedings of the 2001 Beltwide Cotton
Conferences, Anaheim, CA, Jan. 9–13 (2001).

528
abrasion resistance 342testing for fabrics 415–18testing for yarn 396
Accelerotor 417–18acetylcellulose 495acid catalysts 6acid delinted seed 155acidic oxycellulose 6acids 414Advanced Fibre Information System
(AFIS) 75advanced timing 290Africa 430, 433, 436, 445aftertreatments 358Agricultural Market Service (AMS)
160–1agriculture
harvesting see harvestinghealth and safety 462–6
equipment and machinery 462–3heat stress 465–6worker protection standard for
pesticides 463–5organic cotton see organic cottonUS NOP list of allowed and
prohibited substances 171–3Agrobacterium-mediated transformation
111, 112, 113air contaminants standards 478air-jet spinning 69, 254, 255, 256, 265–6air-jet weaving 343–4air-laid nonwovens 504, 505–6air line cleaners 188
air permeability 321air-type lint cleaners 192, 197–8algal-bacterial cellulose 25alizarin 360alkalis 414allergic contact dermatitis (ACD) 475allopolyploid Gossypium species 105allotetraploid cotton 104–5alpha cellulose 3, 5, 487American Conference of Governmental
Industrial Hygienists (ACGIH)461
amines, carcinogenic 471–2, 473, 474–5anhydroglucose units 5antimony oxide 476Aphis gossypii 90apparel see clothingappearance
fabric 399, 410yarn 395
applicator roll bonding method 510apron drafting 244, 245, 246, 252area under cotton 426–8, 456–9Asia 433, 436aspect ratios (length-to-width ratios) 9Atlas lapping fabrics 315Australia 429, 430, 433, 445
best management practice (BMP) 460autolevellers 219-20, 242, 248–9
autolevelling at the card 234–8automatic bale opener 206–7azo dyes 153, 363
health and safety 471–2, 473, 474–5
INDEX

Index 529
azoic dyes 359–60, 363–4
Bacillus thuriengis (Bt) cotton 113–14,120–1, 130, 155
bale packaging 195–6bale press 195bales 203bark 85batch kier washing system 470beam dyeing machine 364, 365bearded needles 291beating-up 334, 339beck (winch) dyeing machine 364–5,
366bed sheets 525Bemisia tabaci 89–90bending rigidity 50, 320–1benzidine-based dyes 474bicomponent binder fibres 518–20, 521bicomponent spinning 261bicomponent yarns (bound yarns) 261bifunctional dyes 375biodegradable binder fibres 518–20, 521biodiversity 121biodynamic agriculture 130biolistic bombardment 111biological agriculture 130biological control agents 146biological neps 86–8biotech cotton see genetic modificationbiphasic character 26–7birefringence 59–60bleached cotton 514–15bleaching 152blending 151, 204, 205, 210–12, 246
formulation of fibre blends 212proportions of a fibre blend 212
block printing 369blowroom 203–39
carding xviii, 203–5, 217–25heavy particle detection and extraction
205, 207–17blending/mixing 204, 205, 210–12effectiveness of opening and
cleaning systems 215–17intensive opening and cleaning
213–15
pre-cleaning 205, 209–10pre-opening/pre-mixing 205, 206–7sequence of operations 204–5sliver quality and quality control
225–38boll maturation 148–9boll weevil
eradication programme 154–5yield losses caused by 142
Bollgard 113–14Bollgard II 120, 121bonding 504, 508–11
chemical 504, 509–11, 518mechanical 504, 508–9, 516–17thermal 504, 511, 512, 518–20, 521
Brazil 350, 429, 430, 438, 444breaker drafting (break-draft) 242, 243,
244breaker drawing 243breaking elongation/extension 54, 83,
386, 387breaking force (breaking strength)
fibre 19, 20, 21–3, 54, 81–2and crystallinity 28–9
yarn 386–7Bremen Cotton Exchange 139broken fibre content (BFC) 77brominated flame retardants 476Bt cotton 113–14, 120–1, 130, 155bundle strength 18, 82–3bur machines 189burst resistance 342bursting strength 4181-butyl-3-methylimidazolium chloride
([C4mim]Cl) 493–4byssinosis 469–70
[C4mim]Cl 493–4calender rollers 518cam positions 298–9cam system (knitting system) 282cams
cam shedding 334–5knitting machines 291–2, 293
carbonisation 496carboxymethylation 524carcinogenic amines 471–2, 473, 474–5
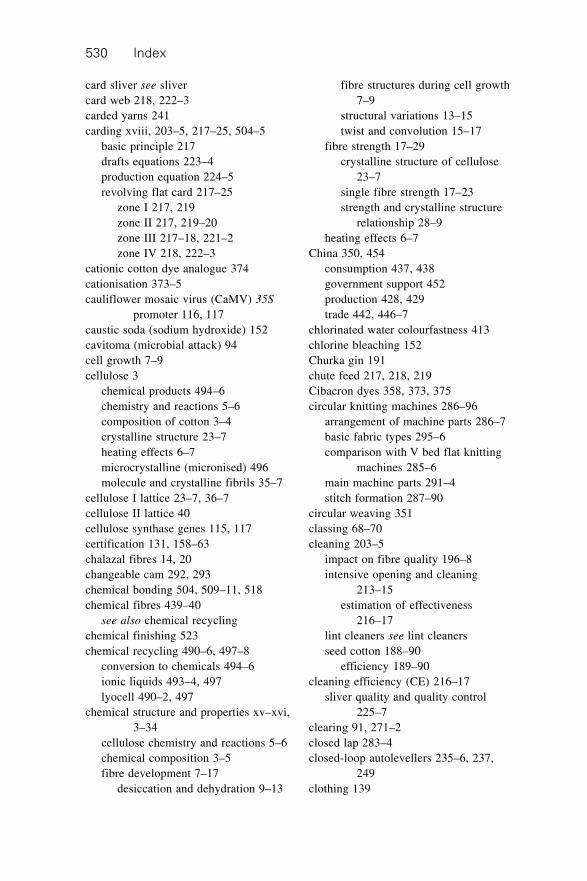
Index530
card sliver see slivercard web 218, 222–3carded yarns 241carding xviii, 203–5, 217–25, 504–5
basic principle 217drafts equations 223–4production equation 224–5revolving flat card 217–25
zone I 217, 219zone II 217, 219–20zone III 217–18, 221–2zone IV 218, 222–3
cationic cotton dye analogue 374cationisation 373–5cauliflower mosaic virus (CaMV) 35S
promoter 116, 117caustic soda (sodium hydroxide) 152cavitoma (microbial attack) 94cell growth 7–9cellulose 3
chemical products 494–6chemistry and reactions 5–6composition of cotton 3–4crystalline structure 23–7heating effects 6–7microcrystalline (micronised) 496molecule and crystalline fibrils 35–7
cellulose I lattice 23–7, 36–7cellulose II lattice 40cellulose synthase genes 115, 117certification 131, 158–63chalazal fibres 14, 20changeable cam 292, 293chemical bonding 504, 509–11, 518chemical fibres 439–40
see also chemical recyclingchemical finishing 523chemical recycling 490–6, 497–8
conversion to chemicals 494–6ionic liquids 493–4, 497lyocell 490–2, 497
chemical structure and properties xv–xvi,3–34
cellulose chemistry and reactions 5–6chemical composition 3–5fibre development 7–17
desiccation and dehydration 9–13
fibre structures during cell growth7–9
structural variations 13–15twist and convolution 15–17
fibre strength 17–29crystalline structure of cellulose
23–7single fibre strength 17–23strength and crystalline structure
relationship 28–9heating effects 6–7
China 350, 454consumption 437, 438government support 452production 428, 429trade 442, 446–7
chlorinated water colourfastness 413chlorine bleaching 152Churka gin 191chute feed 217, 218, 219Cibacron dyes 358, 373, 375circular knitting machines 286–96
arrangement of machine parts 286–7basic fabric types 295–6comparison with V bed flat knitting
machines 285–6main machine parts 291–4stitch formation 287–90
circular weaving 351classing 68–70cleaning 203–5
impact on fibre quality 196–8intensive opening and cleaning
213–15estimation of effectiveness
216–17lint cleaners see lint cleanersseed cotton 188–90
efficiency 189–90cleaning efficiency (CE) 216–17
sliver quality and quality control225–7
clearing 91, 271–2closed lap 283–4closed-loop autolevellers 235–6, 237,
249clothing 139

Index 531
fabric for 398–9, 410utility-value analysis graphics 402
cold pad-batch process 367–8, 369collapse 38–9colour 84, 176
colour in effluent 373dyeing see dyeingnaturally coloured cotton 163–4, 515
colourfastness 411–14comb-sorter arrays 73combed yarns 241comber 515–16combination bur and stick (CBS)
machine 189combing 241, 248, 249–51Commonwealth Scientific and Industrial
Research Organisation (CSIRO)81, 105
compact (condensed) spinning 258,259–60
composite webs 496–7, 498compound needles 291Conrad method for wax content 93conservation tillage 138constitutive promoters 117consumers 479consumption 434–41, 454, 456–9
inter-fibre competition 438–41mill consumption 434, 437–8retail consumption 436–7
contamination 91–2continuous batt system 470continuous dyeing 368–9continuous pad-steam process 362–3controlled-batt saw lint cleaner 192–4,
198convolution angle 15–16, 17, 53–4convolutions 9, 10, 15–17, 38–9
structural mechanics 53–4, 56cord let-off mechanism 307costs of production 138, 430–4, 454
lack of information and organicproduction 155–6
weaving 349–50Cotlook A index 452–3, 454cotton a-globulin promoter 116, 117cotton dust 469–70
Cotton Incorporated 435cotton/polyester blends 491cotton-ramie-wood cellulose 25Cotton Seal 513–14Cottonscan 81count (linear density) 384course 279, 281course density 280, 281, 323cover factor 282, 319, 323, 341coverstock 518crease recovery 399–403crimp 39, 341crockmeters 412crop protection products 135, 136–7, 140,
142–3US NOP list of allowed and
prohibited chemicals 171–3crop rotation 140, 146cross-section of fibre 12–13, 38–9cry toxin genes 113–14crystallinity 6–7, 23–7
cellulose molecule and crystallinefibrils 35–7
and fibre strength 28–9structural mechanics 55–6
crystallite size 25, 28–9cultivation see agriculturecurling 320–1Currency of Francophone Africa (CFA)
zone 445Cusick’s drapemeter 408, 409cylinder cleaners 188, 189
daylight test 411–12decomposition 6–7defoliation 148–9, 154degree of polymerisation (DP) 491–2,
496degree of substitution (DS) 495degree of thickening 79dehydration 6
fibre development 9–13delayed timing 290denim waste 490density 40, 394
change and swelling 43denting 331–2

Index532
depolymerisation 496derivatisation 494–6dermatitis 475desiccation 9–13developing countries
consumption 435, 437–8costs of production 430–3cotton production 426, 429
Dewas system 345, 346diameter, yarn 324, 393–4diammonium phosphate (DAP) 523–4o-dianisidine 474dichlorodiphenyltrichloroethane (DDT)
463dielectric constant 57–8digital cameras 89dimensional behaviour 318–19dimensional stability 414–15dimethyloldihydroxyethyleneurea
(DMDHEU) 524diploid Gossypium species 104direct dyes 357–8direct gene delivery systems 111direct pressure control 245direct warping 329directly absorbed water 44–5discharge printing 372disease 142
control/management 147, 172–3resistance 118
disposal 486–7DNA markers 106–7dobby shedding 335–6doffer 218, 222–3doffer web 222Doha Round 452double jersey fabric 279double-lift double-cylinder Jacquard
337–8double-lift negative dobby 335–6double-lift single-cylinder Jacquard 337double rapier weaving machines 345–6doubling 242, 246drafting 242–9drafting force 247–8drafting waves (irregularities) 244, 247,
390
drafts equations 223–4drape 322, 342, 407–10drape coefficients 408, 409drawing 242–9drawing-in 330–1DREF friction spinning machines 266,
267dried fibres 19Drimarene dyes 373drop wire 332–3drying of seed cotton 185–8dry-laid nonwovens 504–6dust 197, 198
content and sliver quality 225–7from dye handling operations 471–2inhalation/respiratory disease (cotton
dust) 469–70dyeing xviii, 353–77, 515
ACD allergens 475azoic dyes 359–60, 363–4chemicals allowed and prohibited
174–5continuous dyeing 368–9direct dyes 357–8environmental aspects 372–3exhaust dyeing 364–7future trends 373–6general principles 353–7
effect of temperature 357electrostatic effects and use of salt
355equilibrium and dye structure
353–5equilibrium and liquor ratio 356
organic cotton 152–3, 174–5potential hazards 471–5printing 369–72reactive dyes see reactive dyessemi-continuous dyeing 367–8sulphur dyes 359–60, 362–3vat dyes 359–62
E6 gene 118Eastar Bio fibres 518–20, 521Eastern Europe 437ECOCERT International 163ecolabels 139, 153

Index 533
Ecological and Toxicological Associationof Dyes and Organic PigmentsManufacturers (ETAD) 152
economics of cotton xix, 425–59consumption 434–41, 454, 456–9costs of production see costs of
productioneconomic importance of cotton
425–6future trends 453–4global cotton supply and use 456–9government measures xix, 433,
449–52prices xix, 425, 441, 447–8, 452–3,
454production xix, 131–3, 425, 426–34,
456–9trade 434–5, 441–9, 453, 454
edge abrasion 416, 417effective cleaning (EC) 217efficiency of cleaning and extraction
189–90effluent, colour in 373elastic recovery 48–9elasticated fabrics 312electrical properties 57–9electronics in weaving 338, 340, 351electro-optical assessment 89electrostatics 57–8
dyeing 355EliTwist system 258–9elongation (fibre development) 7, 8ending stocks, global 456–9environment 479
dyeing and 372–3dyeing and finishing of organic cotton
152–3life cycle analysis 484–5
environmentally improved textilesproducts (EITP) 491
equilibrium, dyeingand dye structure 353–5and liquor ratio 356
equipment safety 462–3esterification 5–6, 495etherification 5–6, 495Europe 433, 436
European Union (EU) 430regulation of organic cotton 159–60support for production 449
evenness see irregularityexhaust dyeing 364–7export programmes 451exporters 443–5exports 441, 456–9expressed sequence tags (ESTs) 108extension
breaking extension 54, 83, 386, 387fibril extension and fibre extension 55
extractor-feeders 189, 190extractors 188, 189
efficiency 189–90
fabric hand/handle 322, 342, 399,410–11
fabric objective measurement (FOM)410–11
fabric strength, testing 418–19fabric take-down system 294, 295fabric testing xix, 398–421
abrasion resistance 415–18colourfastness 411–14dimensional stability 414–15drape 407–10fabric stiffness 406–7fabric strength 418–19FOM and handle 410–11miscellaneous tests 419–21pilling propensity 404–6, 407surface smoothness after repeated
laundering 404weathering test 414wrinkle and crease recovery 399–403
fabric thickness 319fabric weight 341fabric width 323fabrics 139
faults in knitted fabrics 316–18manufacture 151–2
health and safety 467–70see also knitting; nonwovens;
weavingproperties 401
classification 399, 401

Index534
knitted fabrics 301–2, 314–16,318–22, 401
woven fabrics 341–2, 401requirements and end-uses 398, 400types of knitted fabrics
circular knitting machines 295–6Raschel knitting machines 313,
314Tricot knitting machines 309V bed flat knitting machines
300–1fall plate technique 312, 313FAST (Fabric Assurance by Simple
Testing) system 411fatigue 51–3faults
in knitted fabrics 316–18yarn 392–3
FbL2A gene 118feed control 185feed roller 217, 219feeder density 282fertilisation 137–8, 142–3, 144, 158, 173fibre development 7–17
desiccation and dehydration 9–13fibre structures during cell growth
7–9structural variations 13–15twist and convolution 15–17
fibre fineness 13, 15, 77–8, 212measurement 79–80separating maturity and fineness
80–1fibre hooks 248fibre length 13, 15, 40, 70–7, 197, 198,
212, 514and fibre strength 20–1measurement 72–5short fibre content 75–7uniformity 75
fibre migration 268–9fibre modulus 46, 55–6fibre quality xvi, 68–100, 176
colour 84cotton classing 69–70development of instrument test
methods 70
future trends 94–5impurities 85–92length properties 70–7microbial attack 94moisture 92tensile properties 81–3transverse properties 77–81wax content 92–4
fibre-specific promoters 118fibre strength 17–29, 46–8, 212, 514
relationship to crystalline structure28–9
single fibre strength 17–23time effects 50
Fibrogram 73–4Fibrograph Tester 70, 73–4field cleaners/extractors 180filler 279final (main) draft 242, 243fineness, fibre see fibre finenessfinger-type strippers 181finisher drawing 243finishing operations 471
health and safety 475–9nonwovens 523–4organic cotton 153
chemicals allowed and prohibited174–5
fish hooks 185fixed flats cleaning systems 217, 218,
220, 222flame retardants 523–4
health and safety 476flat abrasion 416, 417flat bed screen printing 370flax 515, 522flex abrasion 416, 417flexible cotton decontamination wipe
525flexural rigidity 50, 320–1float stitch 278flow-through air lint cleaner 192, 197–8fly potential 395–6folding (twisting) yarn 270–1force at rupture 386foreign matter see trashforeign particle separator 214–15
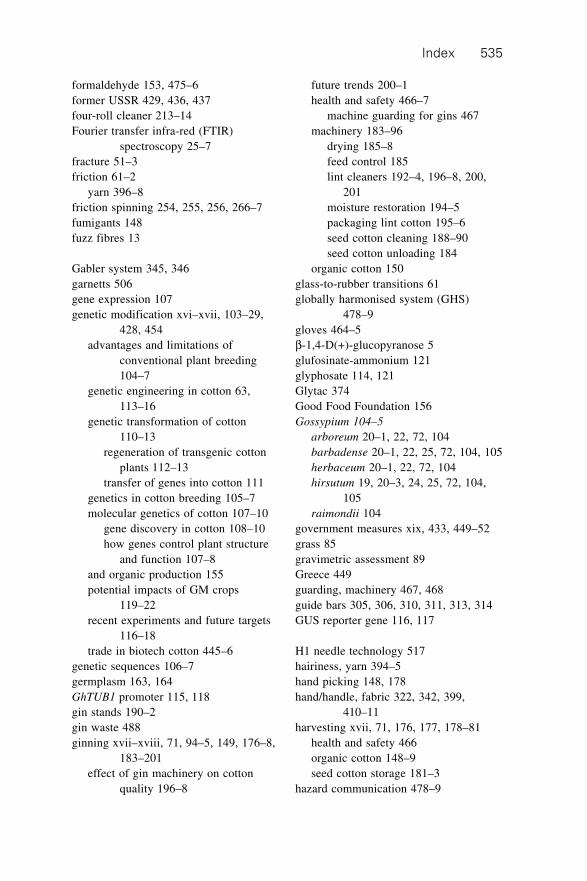
Index 535
formaldehyde 153, 475–6former USSR 429, 436, 437four-roll cleaner 213–14Fourier transfer infra-red (FTIR)
spectroscopy 25–7fracture 51–3friction 61–2
yarn 396–8friction spinning 254, 255, 256, 266–7fumigants 148fuzz fibres 13
Gabler system 345, 346garnetts 506gene expression 107genetic modification xvi–xvii, 103–29,
428, 454advantages and limitations of
conventional plant breeding104–7
genetic engineering in cotton 63,113–16
genetic transformation of cotton110–13
regeneration of transgenic cottonplants 112–13
transfer of genes into cotton 111genetics in cotton breeding 105–7molecular genetics of cotton 107–10
gene discovery in cotton 108–10how genes control plant structure
and function 107–8and organic production 155potential impacts of GM crops
119–22recent experiments and future targets
116–18trade in biotech cotton 445–6
genetic sequences 106–7germplasm 163, 164GhTUB1 promoter 115, 118gin stands 190–2gin waste 488ginning xvii–xviii, 71, 94–5, 149, 176–8,
183–201effect of gin machinery on cotton
quality 196–8
future trends 200–1health and safety 466–7
machine guarding for gins 467machinery 183–96
drying 185–8feed control 185lint cleaners 192–4, 196–8, 200,
201moisture restoration 194–5packaging lint cotton 195–6seed cotton cleaning 188–90seed cotton unloading 184
organic cotton 150glass-to-rubber transitions 61globally harmonised system (GHS)
478–9gloves 464–5b-1,4-D(+)-glucopyranose 5glufosinate-ammonium 121glyphosate 114, 121Glytac 374Good Food Foundation 156Gossypium 104–5
arboreum 20–1, 22, 72, 104barbadense 20–1, 22, 25, 72, 104, 105herbaceum 20–1, 22, 72, 104hirsutum 19, 20–3, 24, 25, 72, 104,
105raimondii 104
government measures xix, 433, 449–52grass 85gravimetric assessment 89Greece 449guarding, machinery 467, 468guide bars 305, 306, 310, 311, 313, 314GUS reporter gene 116, 117
H1 needle technology 517hairiness, yarn 394–5hand picking 148, 178hand/handle, fabric 322, 342, 399,
410–11harvesting xvii, 71, 176, 177, 178–81
health and safety 466organic cotton 148–9seed cotton storage 181–3
hazard communication 478–9

Index536
hazard information 472, 478heald frame 331healds 331health hazards 478health and safety xix, 460–83
consumers 479cultivation 462–6
agricultural equipment andmachinery 462–3
heat stress 465–6worker protection standard for
pesticides 463–5future trends 479ginning 466–7harvesting 466wet processing 470–9
air contaminants 478brominated flame retardants 476dye hazards 471–5formaldehyde 475–6hazard communication 478–9perfluorinated chemicals 477skin irritation/dermatitis 475solvents 477
yarn and fabric manufacturing 467–70inhalation/respiratory disease
469–70machinery guarding 468noise 468–9
Health and Safety Executive (HSE) 460heat setting 272heat of sorption 42heat stress 465–6heat transfer 321–2heat of wetting (integral heat of sorption)
42heating, effects of 6–7helical structure 37–8, 54–5, 56helix angle 38, 54–5hemp 515herbicide resistance 113, 114, 155Hercosett resin 375heritability 107–8heterobifunctional reactive dyes 375hexabromocyclododecane (HBCD) 476high dose/refuge strategy 120high loft nonwovens 523–4
high volume instrument (HVI) lines 70,71, 83, 86
holding down-knocking over sinker 291,292
hollow spindle (wrap) spinning 254, 268honeydew (stickiness) 89–91, 230horizontal direction faults 316hot air cylinder cleaners 189humid air 195humidity 47husk neps 228, 230hybridisation 119–20hydroentanglement (spunlacing) 504,
509, 516–17hydrogen bonds 5, 36, 44
dyeing 353–4hydrogen peroxide 152hydrolysis 496hydroxyl groups 5, 36, 44hysteresis
mechanical 48–9moisture absorption 41, 42, 46
ICI pilling box tester 404, 405immature fibres 11–12, 13, 38, 48, 77,
78impact (revolving screen) cleaner 188impact resistance 342imperfections 392importers 442–3imports 442, 456–9impurities 85–92
contamination 91–2neps see nepsstickiness 89–91, 230trash 85–6, 176, 184, 197, 198, 225–7
incineration 487income and price support programmes
449–52India 350
consumption 437, 438production 428, 429–30trade 443, 447–8
indigo 360indirect warping 329indirectly absorbed water 44–5Ingard 113–14

Index 537
inhalation, dust 469–70initiation (of fibres) 7, 8ink-jet printing 371–2, 376inorganics 4, 5insect resistance management (IRM)
strategies 120–1insecticides 135, 136–7, 172insects
control/management 146–7, 158, 172resistance to 113–14, 120–1, 130, 135,
155yield losses caused by 142
Instron tensile tester 18instrument testing methods 69, 70, 71integrated pest management (IPM)
systems 140, 147integrated yarn testing systems 383IntelliGin 200intensity of opening 215–16intensive opening and cleaning 213–15
estimation of effectiveness 215–17inter-fibre competition 438–41interlock knitted fabric 280, 302interlock setting 288–90International Cotton Congress 69International Cotton Genome Initiative
107International Federation of Organic
Agriculture Movements(IFOAM) 159
International Organization forStandardization (ISO) standards460–1
ISO 9000 461ISO 14000 461
ionic liquids 493–4, 497irregularity
sliver 230–5yarn irregularity
spinning limits and 269–70testing 389–92
irregularity index 270, 392irrigation 144–5Italy 350
jacquard guide bars 313, 314jacquard shedding 336–8
Japan 436jet dyeing machine 365–7Jetlace 3000 spunlace machine 516jig dyeing machine 364, 366jute 515
Kawabata fabric testing systems 411kenaf 515, 522, 525knitted fabric surface 276knitting xviii, 275–327
classification of knitting technology284–5
development of knitting technology275
faults in knitted fabrics 316–18production calculation 323–4properties of knitted fabrics 401
physical and mechanical properties318–22
terminology 276–84warp knitting 283–4weft knitting 276–82
warp knitting technology 302–16weft knitting technology 285–302
knitting oils 152knot fibre neps 228, 229Korea 350Krupp formula 262
laccase 494laevoglucosan 6, 7laminated cotton nonwovens 520–2landfilling 486–7lap winder 249–50latch needles 291, 292latex printing process 510Latin America 436laundering
surface smoothness after repeated 404testing colourfastness 413testing dimensional stability 414–15
laying-in movement 311–12leading hooks 248leaf shedding 149length, fibre see fibre lengthlength uniformity 75, 197, 198length utilisation efficiency (LUE) 77

Index538
let-off mechanisms 339–40leuco form (of dyes) 360–1, 362Levafix OS dyes 373licker-in speed 225–7life cycle analysis 484–5light test 411–12limiting yarn irregularity 269–70, 391–2linear density
fibre 20, 21–3, 40, 77yarn count 384
linkage maps 107lint cleaners 192–4
impact on quality 196–8LouverMax 200, 201
lint content 216lint cotton, packaging 195–6linters 487–8, 492, 515–16, 524linting propensity 395–6Lintronic Fibre Contamination Tester
(FCT) 89liquor ratio 356
low liquor ratios 372–3locknit fabric 315long-term sliver irregularity 233,
234–5loose fibre neps 228, 229LouverMax 200, 201lubrication 271–2, 397lumen 37–8lustre 60lyocell 490–2, 497
m ¥ n lapping fabrics 315machine diameter 324machine gauge 281, 323, 324machine pitch 282, 323machine speed 323machinery safety
agriculture 462–3guarding for machines 467, 468
magnetite 494Malva 105Mantis single fibre tester 18manual assessment 88–9manure 137–8, 144market instability 156Martindale tester 404, 406, 417
mass specific resistance 58–9maturity, fibre 15, 40, 77–8
immature fibres 11–12, 13, 38, 48, 77,78
maturation 7–9measurement 78–9separating maturity and fineness
80–1McCarthy roller gin 191–2mean lengths 74mechanical bonding 504, 508–9mechanical defects 247mechanical finishing 523mechanical harvesting 178–81mechanical neps 86, 87, 88mechanical properties 46–57
directional effects 50–1elastic recovery 48–9fracture and fatigue 51–3knitted fabrics 318–22spinning systems and 256structural mechanics 53–7tensile stress-strain relations 46–50time effects 49–50
mechanical reprocessing 489–90medial fibres 20medium-term sliver irregularity 233,
234–5melt-blown nonwovens 504, 507–8mercerisation 40, 152Mexico 448microcrystalline cellulose (micronised
cellullose) 496microfibrils 9–11, 37, 38Micronaire 70, 79–80, 514micro-organisms, damage by 94microprojectile bombardment 111micropylar fibres 14, 20microtubules 9–11Middle East 436mill consumption 434, 437–8module builder 182module disperser unloading systems 184modules 181–2moisture 92
absorption 40–6heat of sorption 42

Index 539
knitted fabrics 321RH-regain relations 40–2structural changes and theoretical
models 44–6swelling 43
equilibrium moisture contents for seedcotton, fibre and seed 185
and ginning 187–8, 194–5restoration 194–5structural mechanics 56–7
molecular markers 106–7molecular packing 12–13molecular weight 36moulded products 522Multifibre Arrangement (MFA) 435multifunctional separator 207–9multilayer absorption 44–5multinational corporations (MNCs) 122multi-peak resolution method 23–5multiphase weaving 343, 348–9Muratec (Murata) vortex spinning
process 265, 266
N-methylmorpholine N-oxide (NMMO)491
nanotechnology 351national markets 156–7natural dyes 152–3natural fibres 515, 522naturally coloured cotton 515
organic 163–4naturally resistant varieties 147, 148near-infra-red reflectance (NIR)
spectroscopy 81needle loop 277needle positions 287–8, 297–8, 307–9needle punching 504, 508, 517needles
circular knitting machines 291Raschel knitting machines 310Tricot knitting machines 304, 305
negative dobby shedding 335–6negative yarn delivery systems 292–4,
306–7, 339–40nematode control/management 147–8neps xviii, 11, 86–9, 197, 198, 221–2,
392, 514
biological 86–8changes in nep and cotton fibre
processing 230, 231measurement 88–9mechanical 86, 87, 88sliver quality and quality control
227–30net fabrics 313, 314Nickerson-Hunter colour diagram 84nitrocellulose 495nitrogen 144, 158noils (comber waste) 249, 488noise 468–9noncellulosics 3–5non-fumigants 148nonwovens 501–27
cotton fibres 513–15demand for 502fibres used in 512–13, 515finishing and treatments 523–4future trends 524–5global production 502laminated cotton nonwovens
520–2moulded products with cotton–
containing nonwovens 522processing cotton nonwovens
515–20products 503, 525properties of nonwoven fabrics 401recycling of cotton 495–7, 498relative production rate 511, 512web-bonding techniques 504, 508–11,
512, 516–20, 521web formation 503–8
North America Free Trade Agreement(NAFTA) 448
objectionable faults 393Occupational Health and Safety
Administration (OSHA) 460,461
oil prices 441on-line monitoring 383open-end friction spinning 266–7open-end (rotor) spinning 69, 253, 254,
255, 256, 262–5

Index540
open-end yarns compared with ringyarns 317–18
open lap 283, 284open-loop autolevellers 235–6, 237,
248–9opener/pre-cleaner 209–10opening xviii, 203–5
intensive opening and cleaning213–15
estimation of effectiveness215–16
openness value (OV) 216optical properties 59–60organic cotton xvii, 130–75
allowed and prohibited substances171–5
crop production 171–3textile production 174–5
certification 158–63cultivation 139–49
disease control/management 147,172–3
fertilisation 137–8, 142–3, 144,158, 173
harvesting 148–9historical background 140–3insect control/management 146–7,
158, 172methods to improve 157–8nematode control/management
147–8planting seed 143problems 154–5production technology 157soil/land preparation and planting
143water use 144–5weed control/management 138,
145–6global production 131–3limitations to organic production
154–7naturally coloured organic cotton
163–4post-harvest handling/processing
149–54fabric manufacturing 151–2
ginning 150preparation, dyeing and finishing
152–3, 174–5product assembly 154quality assurance 154yarn manufacturing 151
rationale 133–9fibre/fabric/apparel 139production/farming practices
considerations 135–8Organic Exchange (OE) 150, 159, 161–2,
174–5Organic Trade Association (OTA) 150,
159, 162–3, 174–5overlap 283oxidation 6
dyes 361–2ozone test 412
package dyeing machine 364, 365packaging of lint cotton 195–6pad-batch process 367–8, 369Pakistan 438
production 428, 429, 430trade 443, 448
papers 488–9Para Red 363particle detection and extraction 207–9pattern disk 306, 307pattern drum 305–6pectins 4–5pepper trash 85, 196, 226–7perfluorinated chemicals 477perfluorooctanoic acid (PFOA) 477perfluorooctyl sulphonate (PFOS) 477periodic faults 232, 233–5, 247permissible exposure limits (PELs) 469,
476, 478perspiration test 413pesticides 136–7, 139, 142–3
worker protection standard (WPS)463–5
Peyer Almeter AL-101 system 75phenotype 107phosphorus 5physical hazards 478physical standards 68, 69–70
Index 541
physical structure and properties xv–xvi,35–67
cotton morphology 35–40electrical properties 57–9friction 61–2future trends 63mechanical properties 46–57moisture absorption 40–6optical properties 59–60thermal properties 60–1
pick density 334picking (weft insertion) 333, 338pigment dyes 153pilling 322
testing pilling propensity 404–6, 407plain circular knitting machine 287–8,
289plain knitted fabric 301–2plain stitch 276plant breeding 103
advantages and limitations ofconventional plant breeding104–7
see also genetic modificationplant diseases see diseaseplanting 143plasticised cellulose acetate (PCA)
518–19pneumatic suction unloading systems
184polybrominated diphenyl ethers (PBDE)
476polyester 35, 491
prices 441poly-D(-)-3-hydroxybutyrate (PHB) 118polylactic acid (PLA) 519, 520polypropylene 487polyvinyl alcohol size 152positive dobby shedding 335, 336positive yarn delivery systems 292, 294,
307, 340powdered dyes 471power factor 57–8pre-cleaning 205, 209–10Premier aQura 75pre-opening/pre-mixing 205, 206–7preparation xvii–xviii
chemicals allowed and prohibited174–5
organic cotton 152, 174–5processes 470–1
Pressley Tester 82pressure sensors 236, 237price support programmes 449–52prices xix, 425, 427, 447–8, 452–3, 454
price premium of organic cotton 156relative to other fibres 441
primary wall 37, 38print bonding 510printing 369–72Procions 358product assembly 154production xix, 425, 426–34, 456–9
costs of see costs of productionorganic 131–3
production equation 224–5production length 323production rate 224–5, 511, 512production technology 157production weight 323projectile weaving 343, 346–8promoters 117–18proteins 4–5
gene expression 107protoplasts 111purification 496purl knit fabric 280, 302purl stitch 276pyramiding 120–1
qualitychanges during storage 183effect of gin machinery 196–8seed quality 183sliver quality and quality control
225–38quality assurance 154, 382–3Quality Assurance International (QAI)
163quality control
sliver 225–38yarn 382
quantitative trait loci (QTLs) 106–7queen’s cord 316
Index542
quotas 435, 448
rack 284racked needle bed 299–300rags 488–9random card 505–6random tumble pulling tester 406, 407rapier weaving 343, 344–6Rapunzel 156Raschel knitting machines 309–14
basic fabric types 313, 314commonly used design techniques
311–13, 314comparison with Tricot knitting
machines 302–4properties of machine elements
310–11ratch 246–7rayon rinse system 470reactive dyes 358–9, 375–6
dyes needing less salt 372–3health and safety 472
reciprocating knife roller gins 191recycling xix–xx, 484–500
chemical recycling 490–6, 497–8cotton sources 487–9future trends 496–8mechanical reprocessing 489–90textile life cycle 484–5waste treatment choices 485–7
reducing oxycellulose 6reeds 331–2reflectance 84, 197, 198refractive index 59–60regain (moisture regain) 40–6, 92relative humidity (RH) 185–6
RH-regain relations 40–2relative permittivity 57relaxation, fabric 318–19resin-treated cottons 40
breaks 52resistance 57–9resource endowments 430respiratory disease 469–70restraining ties 195retail consumption 436–7reuse
cotton 485–6dyebaths 372–3
reversals 9, 12, 16–17, 38, 39fracture and 51–2structural mechanics 55, 56
revolving flat card see cardingrib circular knitting machine 287,
288–90rib knitted fabric 279, 302rib setting 288, 290ring spinning 69, 253–8
ring yarns compared with open-endyarns 317–18
roll-type strippers 181roller drafting 244–5roller printing 369–70roller-type gins 191–2, 194rotary-knife roller gin 191, 192rotary screen printing 370–1rotor spinning see open-end (rotor)
spinningRoundup 114Roundup Ready cotton 114roving 251–3rubbing fastness tests 412run-in 284run-in ratio 284
salt 355dyeing and the environment 372–3
satin fabric 315saturation bonding 510saw gin stands 190–1saw-type lint cleaners 192–4, 198scanning, optical 85scouring 152screen printing 370–1seawater colourfastness test 413secondary wall 37–8
synthesis 7–11seed cotton 149
cleaning 188–90drying 185–8storage 181–3unloading 184
seed planting 143seed position 13–14

Index 543
and fibre strength 20seed quality 183semi-continuous dyeing 367–8sensitisation 472sequence tagged sites (STS) 107setting, yarn 272sharkskin fabric 316shear modulus 55–6shear strain 55shear strength 51shedding 333, 334–8
cam shedding 334–5dobby shedding 335–6jacquard shedding 336–8
Shirley fabric stiffness tester 406–7short fibre content (SFC) xviii, 75–7,
197, 198, 230–8autolevelling at the card 235–8medium and long-term irregularity
233, 234–5short term irregularity 233–4, 236,
237sliver irregularity 230–5
short fibre index (SFI) 76short-term sliver irregularity 233–4, 236,
237shredding 489–90shuttle 333–4, 342shuttle looms 332–40, 342
installed in selected countries 349shuttleless looms 342–9single fibre strength 17–23single jersey fabric 279single-lift single-cylinder Jacquard
336–7single rapier weaving machines 344, 345single-thread tensile testers 387sinker loop 277sinkers 291, 292, 304, 305SiroMat 81sizing 151–2, 330skin irritation 475skying 361–2sley 339slip drafting 245sliver 204, 217, 222, 242–3, 250
quality and quality control 225–38
neps 227–30SFC 230–8trash and dust content 225–7
sliver irregularity 230–5slubs 392–3smoothness, surface 404soaping off 359, 362sodium hydroxide 152soil
fertilisation 137–8, 142–3, 144, 158,173
preparation 143solvents 477somatic embryogenesis 112, 113somatic hybridisation 112–13sorting 489South America 433Spain 449span lengths 74specific heat 60spectrogram/spectrograph 232, 233spindle picker 178, 179, 180, 184spinning xviii, 69, 240–74
air-jet spinning 69, 254, 255, 256,265–6
bicomponent spinning 261combing 249–51compact systems 258, 259–60comparison of spinning processes 253,
254, 255, 256fibre migration 268–9friction spinning 254, 255, 256,
266–7preparation for 242–9ring spinning 69, 253–8ring yarns compared with open–end
yarns 317–18rotor (open-end) spinning 69, 253,
254, 255, 256, 262–5roving 251–3spinning limits and yarn irregularity
269–70two-strand spinning 258–9winding, clearing and lubrication
271–2wrap (hollow spindle) spinning 254,
268

Index544
yarn steaming (setting) 272yarn twisting 270–1
spinning limits 262, 266and yarn irregularity 269–70
spinning tension 257spirality 319–20spray bonding 510spring-loaded feelers 219–20spun-laid (spunbonded) nonwovens 504,
507spunlacing (hydroentanglement) 504,
509, 516–17stack blender 210–12‘stacked’ varieties 114staple cotton 515–16starch 151–2steaming 368
yarn 272Stelometer 82sterilisation 524stick machines 189stickiness 89–91, 230
measurement 90–1stiffness, fabric 406–7stitch bonding 508–9, 517stitch density 280–1stitch formation
circular knitting machines 287–90Tricot knitting machines 307–9V bed flat knitting machines 297–300
stitch length (loop length) 282stocks-to-use ratio 454, 456–9storage of seed cotton 181–3strain energy 55stress, and deconvolution 54stress-strain relations 46–50
structural mechanics 53–7stripper harvester 178–81, 184structural mechanics 53–7SU unit 310, 311subsidies xix, 433, 449–52substantive dyes 353sucrose synthase (SuSy) 116, 117sugars 89–90sulphur dyes 359–60, 362–3Sumifix Supra dyes 375‘superweeds’ 119–20
surface smoothness 404sustainable production 134–5swelling 43synchronised timing 290
table linen 525tailoring performance 399, 410take-up motion 340taker-in speed 255–7tampons 525tan d 61Tanzanian Cotton Board (TCB) 70taper, in fibres 14–15tear strength 419technical textiles 350temperature
drying and fibre breakage 186effect on dyeing 357monitoring during storage 182
tenacityfibre 20, 21–3, 46, 47–8, 81, 82
and crystallinity 29yarn 389
Tencel 491tensile modulus 46, 55–6tensile properties 46–57, 81–3
breaking extension 54, 83, 386, 387fracture and fatigue 51–3knitted fabrics 320stress-strain relations 46–50structural mechanics 53–7tensile measurement 81–3yarn 386–9
tensile strength 341–2, 418testing xix, 381–424
development of instrument testmethods 70
fabric testing xix, 398–421fibre quality see fibre qualitystandards organisations 381–2yarn testing xix, 382–98
tetraploid Gossypium species 104textile life cycle 484–5thermal bonding 504, 511, 512
cotton nonwovens 518–20, 521thermal-mechanical finishing 523thermal point bonding 507, 511, 512
Index 545
thermal properties 60–1knitted fabrics 321–2
thermoplastic binder fibres 518–20, 521thiazole 362thiazone 362thick places 392–3thin places 392–3three-dimensional (3D) weaving
350–1through air bonding 518tightness factor (cover factor) 282, 319,
323, 341tillage 138, 143time effects 49–50tissue-specific promoters 117o-tolidine 474tongue and groove irregularity sensors
236, 237torque liveliness 385–6torsional rigidity 50total draft 224, 243–4total fibre draft 224total mechanical draft 224total strain energy 55toughness (work of rupture) 46, 386tractors 463trade 434–5, 441–9, 453, 454
biotech cotton 445–6China 442, 446–7India 443, 447–8Pakistan 443, 448Turkey 442–3, 447winners and losers 448–9
trailing hooks 248transfer zone 222–3transferred loop 299, 300transgene introgression 119–20transgenic cotton 110–13
see also genetic modificationtransverse properties 77–81
fibre fineness 79–80fibre maturity 78–9separation of maturity and fineness
80–1trash 85–6, 176, 184, 197, 198
content and sliver quality 225–7trash neps 228, 230
traveller 254–6treatments 523–4
see also finishing operationstrehalulose 90trickle washing 368tricot fabric 315Tricot knitting machines 304–9
basic fabric types 309comparison with Raschel knitting
machines 302–4main machine parts 304–7stitch formation 307–9
triple licker-in 217, 218, 219, 220Truetzschler Nep Control (NCT) 89tuck stitch 277–8tumble abrasion 417–18Turkey 133, 156, 350, 429, 430, 438
trade 442–3, 447turnout 197twist
rotor spinning 263roving twist level 252–3testing 384–5
twist breaks 52–3twist control 245twist factor 385
ring-spun yarns 257–8twist liveliness 385–6twisting yarn 270–1twists (fibre development) 9, 10, 15–17two-for-one twisting 270–1two-strand spinning 258–9
underlap 283unevenness see irregularityuniformity, length 75, 197, 198uniformity index (UNI) 75, 76uniformity ratio (UNR) 75unit cells 36, 37United States (USA) 350
African Growth and Opportunity Act(AGOA) 449
Agricultural Market Service (AMS)160–1
consumption 436, 438Occupational Safety and Health Act
461
Index546
Occupational Safety and HealthAdministration (OSHA) 460,461
organic cotton 133, 156allowed and prohibited substances
171–3National Organic Program (NOP)
155, 161, 171–3National Organic Standards 160–1problems with organic production
practices 154–5production 141, 428, 429, 430, 433
government support 449–52reuse 485trade 443–4WPS 463–5
United States Department of Agriculture(USDA) xvi, 68, 69–70, 160–1,162
colour grades 84leaf grade 86
Universal Cotton Standards xvi, 70universal testers 418unloading systems 184upper-quartile length (UQL) 73Uster Irregularity/Uster CV% 231–3,
234Uster Tensojet 388Uzbekistan 430, 441, 444
V bed flat knitting machines 296–301arrangement of machine parts 296–7basic fabric types 300–1comparison with circular knitting
machines 285–6stitch formation 297–300
vacuum infiltration 112varieties 104–5, 176
fibre strength 20–3naturally resistant 147, 148staple length 72suitable for organic farming 157
vat dyes 359–62ventilation 472vertical direction faults 316–17viscose process 490–1visible foreign matter (VFM) see trash
volume 43vortex spinning (air-jet spinning) 69, 254,
255, 256, 265–6
wale 280, 281wale density 280, 281, 323warp density 332warp knitting technology 285, 302–16
comparison of Raschel and Tricotknitting machines 302–4
properties of warp knitted fabrics314–16
faults in warp knitted fabrics 318Raschel knitting machine 309–14terminology 283–4Tricot knitting machine 304–9
warp sizing 330warping 329–30wash boxes 368, 369washed cotton 469–70waste fibre feeder 207waste treatment 485–7
see also recyclingwater
irrigation 144–5testing for colourfastness 412–13see also moisture
water-jet weaving 343, 344water spraying moisture restoration
method 195water treatment technologies 373water use efficiency (WUE) 145waxes 4–5
wax content 92–4wear index 416wear resistance 416weathering 176weathering test 414weaver’s beam 329–30, 332weaving xviii, 151, 328–52
future trends 350–1looms installed in selected countries
349manufacturing costs 349–50modern weaving machines 342–9
air-jet weaving 343–4multiphase weaving 343, 348–9
Index 547
projectile weaving 343, 346–8rapier weaving 343, 344–6water-jet weaving 343, 344
preparatory processes 329–32drawing-in and denting 330–2warp sizing 330warping 329–30
weaving mechanism 334–40auxiliary functions 340beating-up 339cam shedding 334–5dobby shedding 335–6jacquard shedding 336–8let-off motion 339–40picking 338take-up motion 340
weaving operation 332–4woven fabric 340–2
design and type 340–1fabric properties 341–2, 401
web bonding see bondingweb formation 503–8
dry laid 504–6melt blown 504, 507–8spun laid 504, 507wet laid 504, 506
weed control/management 138, 145–6weft 278weft insertion rate 334weft knitting technology 284–302
circular knitting machines 285–96comparison of circular and V bed flat
knitting machines 285–6faults in knitted fabrics 316–18
comparison between ring andopen-end yarn 317–18
horizontal direction 316vertical direction 316–17
production calculation 323–4properties of weft knitted fabrics
301–2terminology 276–82V bed flat knitting machines 296–301
wet-laid nonwovens 504, 506wet processing
health and safety 470–9see also dyeing; finishing operations
wickability 321WideStrike 120wild species 105winch (beck) dyeing machine 364–5,
366winding 271–2wipes 503, 525wood pulps 492wool 439–40work-to-break (toughness) 46, 386work practices 472worker protection standard (WPS)
463–5World Trade Organization (WTO) 434–5,
446, 452wound dressings 524woven fabrics see weavingwrap (hollow spindle) spinning 254, 268wrapper fibres 264wrinkle recovery 399–403
X-ray diffraction 23–5
yarncomparison of yarns spun by different
systems 255manufacture 151
health and safety 467–70stages 240–2
spinning see spinningspinning limits and yarn irregularity
269–70steaming (setting) 272twisting (folding) 270–1winding, clearing and lubrication
271–2yarn count 323yarn diameter 324, 393–4yarn feeding systems 292–4, 306–7yarn fineness 15yarn-to-metal friction 397–8yarn testing xix, 382–98
count 384diameter 393–4evenness 389–93friction 396–8hairiness 394–5

Index548
linting and fly 395–6miscellaneous tests 398tensile properties 386–9twist 384–5twist liveliness 385–6yarn abrasion 396yarn appearance 395
yellow/blue plane 84yellowing 183, 197, 198yields 428, 429, 456–9
losses and their causes 142
zeta potential 355Zweigle Staff Tester G 556 396