The K2 parallel processor: architecture and hardware implementation
Upload
khangminh22Category
view
1download
0
International Institute For Cotton
Technical Research Division
Manchester
Research Record No. 114
Fabric Production For Projects K1 And K2
Jill C. Stevens & James T. Eaton
April 1980
Classification: Fabrics/Knitted/Production
Key Words: Single Jersey, Stitch Length
Digital version: November 2011


1
Contents
1. Introduction
2. Machinery And Instrumentation
3. Knitting Plan
4. Yarn
4.1. Preliminary Yarn Testing
4.2. Yarn Replacement
4.3. Fault Rate
4.4. Yarn Faults
4.5. General Yarn Performance & Quality
5. Fabric Production
5.1. Production Data and Quality Control
5.2. Piece Identification
5.3. Fabric Faults
5.4. General Comments
6. Comparison Of Stitch Length Measured On Machine And Measured In The Fabric InThe Laboratory
Tables 1 To 9
Figures 1 To 3
Appendix 1: IIC Methods Of Test - Yarn
Appendix 2: Yarn Fault Rate Analysis
Appendix 3: Illustration Of Typical Yarn Faults
Appendix 4: Production Data Charts
Appendix 5: IIC Methods Of Test - Stitch Length
Appendix 6: Yarn Test Results (Courtaulds)

2
1. Introduction
The information recorded in this report relates specifically to the production of the fabrics forthe projects Kl and K2. In addition, details of the yarns and a comparison between courselength measurements on the machines and grey stitch length as determined in the laboratoryhave been included. However, analysis of any other test data relating to the properties of thefabrics has been deliberately omitted as this will be reported separately.
2. Machinery And Instrumentation
Three single jersey sinker-top weft knitting machines were used to produce the fabric.
a) An 18 gauge Camber Velnit; 26" diameter, 36 feeders, 1500 needles, fitted with triptapepositive feed and side creels.
b) A 24 gauge Monarch XL-JS; 26" diameter, 60 feeders, 1920 needles, fitted with triptapepositive feed and side creels.
c) A 28 gauge Camber Twinit; 24" diameter, 68 feeders, 2112 needles, fitted with triptapepositive feed and side creels.
Course length (run-in) was measured using a Welmstar electronic course length / yarn speedmeter.
Yarn input tension was measured using the Schmidt yarn tension meter.
3. Knitting Plan
The basic knitting plan proposed in the document ‘Project Planning K1 and K2 - Knitting’was adhered to with the following two exceptions.
1. When knitting on the 24 gauge machine began it was found that the proposed tightestconstruction, i.e. Piece No. 24/2-48/291/1 with tightness factor K = 17.04, was in fact just onthe extreme physical/knittable limit of the machine. Therefore, although it would haveprobably just been possible to produce the fabric, the fault rate would have been high and thefabric would have been too tight to be considered commercially viable.
Consequently, it was decided to amend the entire 24 gauge knitting plan. This was achievedby increasing each stitch length by 5%. The revised plan is shown in Table 1, together withthe 18 and 28 gauge plans which were unchanged.
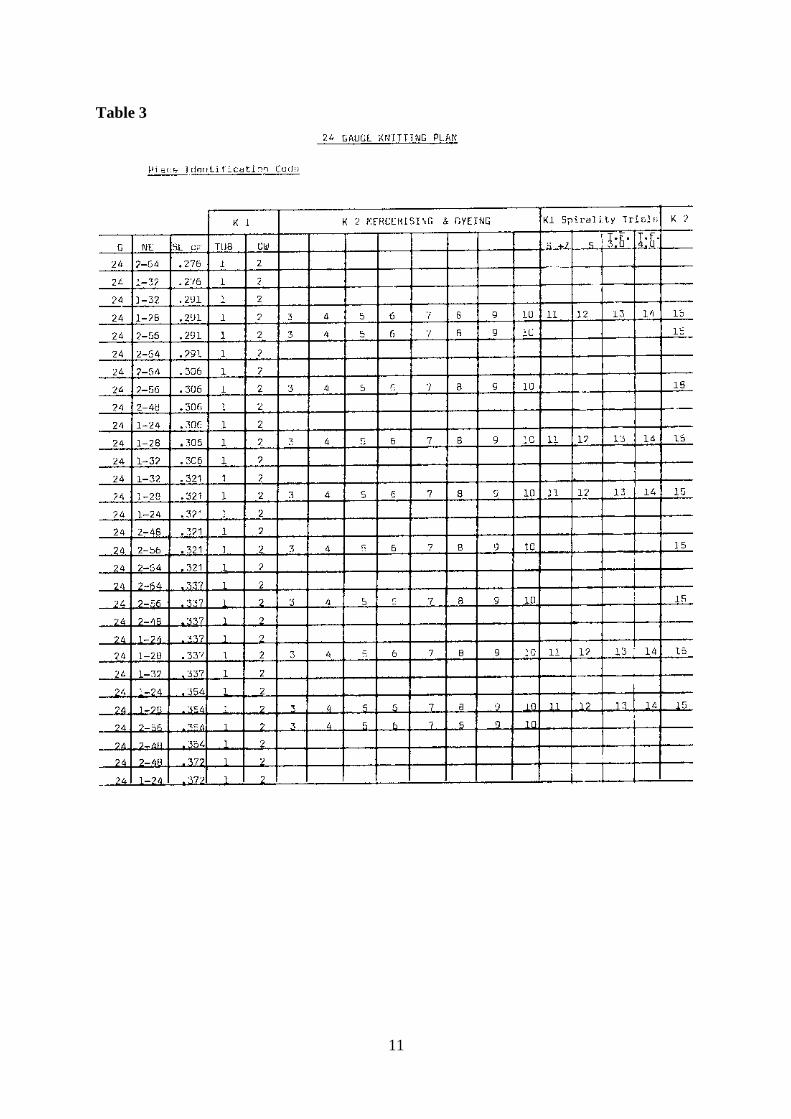
2. Towards the end of the planned fabric production it became apparent that after all thefabrics had been completed and an allowance had been made for further yarn testing, therewould be a small residue remaining of the four yarn counts, Ne 1-28, 2-56, 1-36, 2-72, whichare utilised in both projects. This being the case, it was felt desirable to have an extra pieceof each K2 construction in reserve, therefore the remaining yarn was utilised to produce anextra 20 pieces of approximately 70 metres length, one of each K2 variable on the 28 and 24gauge machines. All these pieces are numbered 15. The revised knitting plans for all threegauges are shown in Tables 2-4.
4. Yarn
The yarn was ordered from Courtaulds Northern Spinning Division, and delivered in the

3
quantities proposed in the preliminary plan.
For the basic plans Kl and K2
Machine Gauge, npi Nominal Yarn Count, Ne
18 1-16 2-32
1-20 2-40
1-24 2-48
24 1-24 2-48
1-28 2-56
1-32 2-64
28 1-32 2-64
1-36 2-72
1-40 2-80
All singles yarns were Courtaulds Combed KCW quality having a twist factor of 3.5 andstandard Z direction of twist. Twofold yarns were Courtaulds Super Combed Sudan quality.
For the supplementary trials (spirality) in Kl
Gauge, npi Count, Ne Twistdirection
Twist Factor
18 1-20 S 3.5
24 1-28 S 3.5
Z 3.0
Z 4.0
28 1-36 S 3.5
After the yarn had been delivered and before any knitting began all the yarn was checked inIIC's laboratories for count, twist factor, coefficient of friction against steel, and twistliveliness. Table 5 summarises the results obtained and the IIC methods of test used arecontained in Appendix 1.
4.1. Preliminary Yarn Testing
The preliminary yarn testing carried out by IIC was intended primarily as a quality controlcheck to try and identify any serious discrepancies in the yarn delivered from thespecifications, before knitting commenced. Full yarn testing including Uster strength andevenness measurements and Classimat readings are being carried out by Courtaulds now thatknitting is completed. These results will be reported separately.

4
The results obtained from the preliminary testing indicated that, on average, thecharacteristics of the yarn delivered were within acceptable tolerances.
Yarn Count: Resultant yarn count tested was in the main within 1 unit of Ne.
Twist Factor: Yarn twist factor was on average within 0.1 twist factor unit.
Twist Liveliness: Twist liveliness readings obtained using IIC’s experimental test methodare reported in Table 5, but will be discussed in detail in a separate report.
Coefficient of Friction (µ): It is generally accepted by the knitting industry that a yarnwith a coefficient of friction reading against steel of 0.20 or below will performadequately during knitting. As can be seen from the table of results, all the singles yarnsfell well within this general guideline; in fact, they all had readings of 0.1 or below.However, it can also be seen that all the twofold yarns had a coefficient of frictionreading of 0.2 and above. Examples of typical traces obtained on the yarns using the‘Shirley’ yarn friction recorder are shown in Figure 1.
On examination of these traces it is immediately noticeable that not only is the trace fortwofold yarn much larger in diameter (indicating the higher friction) but also that thenormal smooth line has become very irregular and variable. To establish whether or notthis was a typical result to obtain for twofold yarn, other twofold yarns from stock weretested, and similar results obtained. The test instrument manufacturers were contactedand also several twofold yarn suppliers to obtain their opinion. However, no clearconsensus of opinion emerged. Apparently twofold yarns are not generally tested forcoefficient of friction and therefore knowledge of typical results was limited. As yet,therefore, it has not been possible to establish whether or not the readings obtained aretypical. However, suffice is to say all the twofold yarns performed well in knitting withno discernable practical effect that could be directly related to a high friction coefficient.
It may be that, in fact, there should be two pass/fail levels for friction coefficients forcotton yarns; one for singles and one for twofold. However, the work necessary toestablish whether or not this is true would need to be the subject of a separateinvestigation - outside the scope of these projects.
4.2. Yarn Replacement
Although the initial limited yarn testing carried out prior to knitting did not indicate anyserious discrepancies or variations in the yarns, unfortunately, once knitting began, severalproblems became apparent.
4.2a. Ne 1-40
Almost immediately knitting of the Ne 1-40 yarn began on the 28 gauge machine, excessivestripiness in the fabric was apparent. Courtaulds were contacted and on examination of theproblem, which appeared to be caused by count variation within and between cones, theyagreed to re-spin the order. Fortunately, they were able to do so from the same fibre blendused for the original deliveries.
Subsequent testing of the returned yarn, by Courtaulds, discovered count variation within the1-40's delivery between 1-27 and 1-40 Ne.
4.2b. Ne 1-16
Shortly after knitting of the Ne 1-16's yarn began, a very high incidence of faults in the fabricwas noticed. The faults - mainly holes of various sizes - appeared to be caused by a highfrequency of periodic large impurities, neps and slubs in the yarn. Courtaulds were again

5
consulted and after investigation agreed to replace the order, although they were not able todo so from the original fibre blend. As one of the main considerations when planning theprojects was to keep the fibre blend constant, thus eliminating any additional possiblevariation due to changes in the fibre blend, it was decided that although the yarn wouldcommercially be unacceptable, because of the high number of impurities etc., it would bepossible in the context of these projects to persevere with the yarn in the interests of overallcontinuity.
4.2c. Ne 1-32
Unfortunately, some time after knitting of the 1-32's yarn on both 24 and 28 gauge machineswas well underway without significant problems, the 1-32's suddenly started causingexcessive striping in the fabric, again caused by count variation within and between cones.Courtaulds were again consulted and agreed to replace the complete order. Again a decisionhad to be made whether to replace the yarn with a yarn spun from a different fibre blend orpersevere with the faulty lot. In this case however so much of the programme on two gaugesof machine depended on consistent 1-32's yarn, and also it was felt count variation couldpossibly affect the determination of the physical structure etc., therefore, it was decided toreplace the whole delivery.
All the constructions were therefore re-knitted from the replacement yarn and identified bythe suffix 'A' after the piece code number on both the pieces and piece tickets. To enable acomparison to be made between the fabrics knitted from both deliveries, the pieces knittedfrom the first delivery are also included in the finishing plan for Kl. This has increased thetotal number of pieces to be finished in K1 by 8; 6 of 24G and 2 of 28G.
4.3. Fault Rate
To obtain a general idea of the performance of each yarn count during knitting and also to testfor an effect of tightness factor or machine gauge on the performance of the yarn, a fault rateanalysis was carried out. Every time a fault appeared in the fabric which could bespecifically related to the yarn as opposed to the machine or operative, a record was kept andthe totals for each piece are included on the production data charts.
The detailed analysis of fault rate, averaged to faults per 100,000 metres of yarn, for eachyarn count, stitch length and machine gauge can be found in Appendix 2. A summary of theaverage total faults for each yarn count/gauge is shown in Table 6.
Generally speaking more fabric faults were found to be caused by the singles yarn than thetwofold yarn and, on the evidence of the figures, the Ne 1-16's yarn would not appear to be ofa very high quality. However, on the average there is no conclusive evidence to suggest thatfor the yarns used in this project at the stitch lengths knitted there is any consistent orsystematic effect of stitch length/tightness factor or machine gauge on the incidence of yarnrelated fabric faults.
It would however be dangerous to deduce too much from the figures presented here because,although a substantial amount of yarn has been knitted, to arrive at reliable or meaningfulconclusions significantly larger quantities of yarn for each variable would need to have beentested.
4.4. Yarn Faults
During the course of the fabric production certain types of yarn faults regularly occurred. Asillustration, a typical selection of the faults were collected and are shown in Appendix 3.
Generally speaking, the types of faults occurring differed between the singles and twofold

6
yarn. The common faults experienced in the singles yarns are usually caused by slubs andloose fibres and less frequently by loose yarn. The common faults in the twofold yarnshowever are mainly caused by loose wrappings being caught up in the yarn.
4.5. General Yarn Performance & Quality
The general impression remaining after completing the knitting is that the overall quality andperformance of the singles yarn could have been better. Perhaps the fact that some of theyarn counts were non standard for the mill, and consequently frequent quality changes wererequired, could have contributed to the higher than average incidence of yarn faults.
In the main however, the twofold yarn gave little trouble during knitting and the generalquality was good, although some of the doubling faults illustrated in Appendix 3 would notnormally be expected.
5. Fabric Production
The pieces were produced according to the production plans in Tables 2-4.
5.1. Production Data/Quality Control
All quality control and production measurements recorded during the course of the knittingare listed on the production data charts, Appendix 4, which are arranged in machine gauge,yarn count order.
5.1a. Course Length
The course length target figure for each piece was calculated from the nominal stitch lengthmultiplied by the number of needles in the machine.
The course length figures quoted for the start and end of each piece are mean results fromseveral readings taken over at least five feeders, selected at random around the machine.
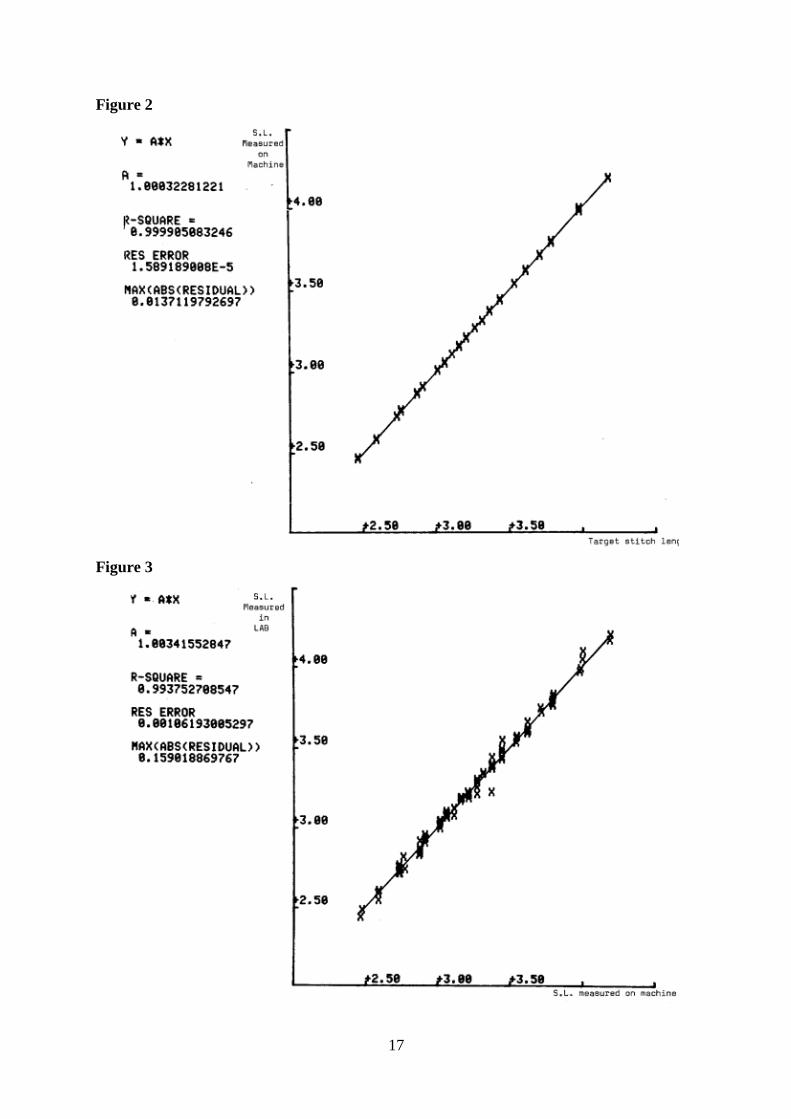
The accuracy of the Welmstar course length counter is quoted by the manufacturers as being±1% and therefore the production tolerance on course length measurements was also set at±1%, i.e. adjustments to the run-in would only be made, after a quality was initially set up, ifthe mean course length measurement deviated from the target figure by ±1% In fact, it wasnot found necessary to make any such adjustments, and an inspection of the figures will showthat in all cases the measurements were very much better than ±1% . Figure 2, which showsthe linear regression analysis, confirms this point.
5.1b. Courses/3cm off Machine
This measurement was intended only as a quick ready reckoner to enable the number ofmachine revolutions required to produce a length of 75 metres to be calculated. After eachquality/yarn change, a piece of the fabric was taken from the machine and allowed to relaxfree of tension for several minutes. Courses/3cm were measured and converted toCourses/cm, from which the required number of machine revolutions could be calculated.Thus, for a 75 metre piece,
Revs = C/cm x 100 x 75 / F
where F is the number of feeders.
5.1c. Courses/3Cm
As an additional production/quality control measurement, the courses/3cm were measured atthe beginning and end of each piece, centrally above the take-down rollers.

7
5.1d. Yarn Tension
At the beginning of each piece yarn input tension was checked, adjusted where necessary andmaintained throughout the total production at between 3-5 gms.
5.1e. Additional Information
Each piece includes a cutting line to facilitate fabric processing and handling duringfinishing.
At the end of each piece, the machines were thoroughly blown down to clear fly andcontamination from the guides and feeder holes.
Samples for fabric testing were removed from each piece 1 and from the specials 11-14.
5.2. Piece Identification
Each piece was marked at the beginning and end with a piece identification number.
e.g.
Code: 18/1-24/311/1
Decode: 18 gauge / Ne 1-24 / Stitch length 0.311cm / Piece No. 1
The piece number represents the project, i.e. K1 or K2 and the finishing route through whichthe piece will be processed.
For example, all pieces numbered 1 are project Kl, tubular finish.
In addition to the code which is written on each piece, each piece also has a piece ticketattached to it. On these are written the project number K1 or K2, the piece identificationcode, the weight of the piece and any knitting comments. For example, any faults in thefabric which need to be noted by the finishers.
The piece tickets are also colour coded according to gauge, for ease of identification.
All 18 gauge Pink tickets
All 24 gauge Blue tickets
All 28 gauge Green tickets
Pieces made from twofold yarn are further identified by a stripe through the ticket.
18G Ne 1-20 Pink ticket
18G Ne 2-40 Pink ticket + stripe
The ‘special’ pieces for Kl are further identified by a black 'X' on the back of the piece ticket.
5.3. Fabric Faults
Any holes created in the fabric during knitting were mended to avoid processing problemsduring finishing. The faults are recorded on the piece tickets.
5.4. General Comments
Apart from routine maintenance and general wear and tear repairs, all the machinesperformed well throughout the knitting. However, one or two general points were noticedwhich may deserve consideration.
1. The effectiveness of the stop motions on all three machines was generally good.

8
However, the particular type of bottom stop incorporated on the Monarch machine wasprone to sticking and therefore did not act as efficiently or effectively as the type of thebottom stop motion incorporated on the Camber machines.
2. The speed of the machine can sometimes have an effect on the efficiency of the stopmotions. For example, the 28 gauge machine has an average operating speed higher thanthe other two machines, and consequently the length of the yarn path from the bottomstop motion to the feeder is more critical if there is to be sufficient time for the stopmotion to actually stop the machine before a broken end reaches the feeder and casts off.
One of the main reasons for yarn breakages however is slubs and impurities on the yarncollecting in guide and feeder holes. If the break happens before the bottom stop motion,then path length is critical. If the break happens at the feeder however, there is little thatcan be done.
Two possible ways of alleviating this problem could be to either build slub catchers in themachines early in the yarn path to allow the bottom stop motions the maximum timepossible to activate, and/or changing the size of guide holes earlier in the yarn path to asize nearer that of the feeder, thereby catching the clubs etc. before they reach the feeder.
Recent discussions with Camber suggest that this is an area of machine design which theyare investigating.
6. Comparison Of Stitch Length Measured On Machine And MeasuredIn The Fabric In The Laboratory.
As one of the main objectives of these projects is to examine and identify physical changes inthe fabric brought about as a result of various different finishing routes and machinery, it isessential that stitch length, probably the most important single physical parameter of anyknitted structure, can be accurately determined. It is also important that the method ofmeasuring gives a consistent and reliable estimate of the stitch length from which the fabric isknown to have been knitted.
The results in Figure 2 confirm that the stitch length measured going into the fabriccorresponds with the target with a very high degree of correlation, therefore to test that thelaboratory is also predicting accurately the fabric stitch length, the two sets of data have beencompared. Initially the course length measurements were converted to stitch length in mmand the mean for each variant calculated. Mean stitch length in mm is quoted by thelaboratory.
Tables 7-9 contain the individual data for each machine gauge plus the confidence limits,although excluding measurements made on the 'special' fabrics.
Figure 3 shows the linear regression analysis of the data. The R2 figure of 0.99 reflects thehigh degree of correlation between the two sets of measurements and confirms that stitchlength measurements made in the laboratory can be accepted as reliably predicting actualfabric stitch length, within any practical discernable limits.
The IIC method of test for stitch length is included in Appendix 5.

9
Table 1

10
Table 2
11
Table 3

12
Table 4

13
Table 5

14
Table 6

15
Table 7
Table 8

16
Table 9
Figure 1
17
Figure 2
Figure 3
Copyright © 2022 FDOKUMEN