Energy Balance and Accounting for Boilers and Process House in Textile Industry Through Software...
42
1 | Page Introduction India is faced with the challenge of sustaining its rapid economic growth while dealing with the threat of global climate change. Minimisation of damage from the rising trend of global warming would warrant two kinds of action for a country like India: a) abatement of greenhouse gas emissions; and b) adaptation to climate change by way of infrastructural and other developments to reduce climate change related vulnerability of the people. The National Action Plan on Climate change released in 2008 recognises the need to maintain high growth rate for raising the living standards of the vast majority of its people since higher income and higher level of infrastructural development can only reduce vulnerability of the people to adverse impacts of climate change. India’s development agenda thus focuses on the need for high inclusive economic growth for eradicating poverty and improving standards of living and reducing climate change related vulnerability of its people. In such a context the target of low carbon economic growth in terms of declining energy and carbon intensity of GDP, therefore, assumes special significance. Of the different options for lowering carbon intensity of GDP, the option of energy conservation through reduced energy intensity of output (or value added) happens to be cheaper in most cases than the carbon free energy supply technology options. As the industrial sector has the largest sectoral share of final energy consumption in India accounting for about 47.6 per cent of the total commercial energy consumption in the country in 2007-08, the paper focuses on the assessment of the energy savings potential in this sector. More specifically the focus is on the seven major energy consuming industries namely, iron & steel, aluminium, paper & pulp, textiles, chlor- alkali, fertiliser, and cement. These industries are also the ones covered in the National Mission for Enhanced Energy Efficiency as part of the national initiative for addressing the problem of global climate change. These industries together account for about 46.5 per cent of final energy (measured in oil equivalent units) and 58.1 per cent of electricity (measured in kwh) consumed by the industrial sector, while their share in the industrial sector’s output and gross value addition is respectively 22.4 per cent and 27.6 per cent in 2007-08.
Transcript of Energy Balance and Accounting for Boilers and Process House in Textile Industry Through Software...

1 | P a g e
Introduction
India is faced with the challenge of sustaining its rapid economic growth
while dealing with the threat of global climate change. Minimisation of damage from
the rising trend of global warming would warrant two kinds of action for a country like
India: a) abatement of greenhouse gas emissions; and b) adaptation to climate change
by way of infrastructural and other developments to reduce climate change related
vulnerability of the people. The National Action Plan on Climate change released in
2008 recognises the need to maintain high growth rate for raising the living standards
of the vast majority of its people since higher income and higher level of infrastructural
development can only reduce vulnerability of the people to adverse impacts of climate
change. India’s development agenda thus focuses on the need for high inclusive
economic growth for eradicating poverty and improving standards of living and
reducing climate change related vulnerability of its people. In such a context the target
of low carbon economic growth in terms of declining energy and carbon intensity of
GDP, therefore, assumes special significance.
Of the different options for lowering carbon intensity of GDP, the option of energy
conservation through reduced energy intensity of output (or value added) happens to
be cheaper in most cases than the carbon free energy supply technology options. As the
industrial sector has the largest sectoral share of final energy consumption in India
accounting for about 47.6 per cent of the total commercial energy consumption in the
country in 2007-08, the paper focuses on the assessment of the energy savings
potential in this sector. More specifically the focus is on the seven major energy
consuming industries namely, iron & steel, aluminium, paper & pulp, textiles, chlor-
alkali, fertiliser, and cement. These industries are also the ones covered in the National
Mission for Enhanced Energy Efficiency as part of the national initiative for addressing
the problem of global climate change. These industries together account for about 46.5
per cent of final energy (measured in oil equivalent units) and 58.1 per cent of
electricity (measured in kwh) consumed by the industrial sector, while their share in
the industrial sector’s output and gross value addition is respectively 22.4 per cent and
27.6 per cent in 2007-08.

2 | P a g e
Energy savings potential for each of these seven industries is assessed using firm level
data from the Annual Survey of Industries (ASI) for the latest year available i.e., 2007-
08.
Demand for inputs by industry is essentially a derived demand. A firm’s demand for
inputs is derived from its output and factor prices. Since the firms prefer to choose
input quantities which minimise their total cost of producing a given level of output, the
derived demand for inputs would depend upon the substitution possibilities among
inputs allowed by the technology, and the relative prices of all inputs. Since there is
wide variation in energy consumption of individual industries caused partly by
differences in the level of output and partly by differences in energy intensity which
reflects variation in the underlying technology, it is reasonable to assume that the
response of industries to changes in prices would be different. The paper develops an
econometric model for inter-input and inter-fuel substitution using trans log cost
function for each of the seven selected industries and also for the manufacturing sector
of India as a whole to study the behavioural response of industries to changes in factor
prices and thereby analyses possible role of the market based price or fiscal policy
instruments for realising the assessed energy savings potential. In this assessment of
both potential of energy conservation and the industry behaviour in response to price
changes, we use time series data at the aggregate concerned industry level for the
period 1991-92 to 2008-09 to obtain the most updated scenario compared to what is
available in the literature.

3 | P a g e
Methodology
Our research topic deals with the energy conservation i.e,
" Energy Balance and Accounting for Boilers and Process House in Textile Industry Through Software Approach". To identify the various processes involved in energy conservation through look of
various steps taken at different countries is done keeping in mind the leading textile
giants of the world which are Bangladesh, Pakistan, China and USA.
This entire research is done for the development or initiatives that should be taken in
the field of energy conservation for textile industry in India through "Software
Approach".
Steps involved:
SECONDARY RESEARCH
The concept for doing this work is derived from the fact of shortage of energy
resources and improper conservation techniques involved. The software
approach will greatly help in minimising the energy consumption and keep an
account for the same.
We went through various journals, books, web pages, ebooks and patents related
to the new software technology developed and used in India. Basic
understanding of the topic is gathered and kept in mind to further carry out the
primary research.
PRIMARY RESEARCH
As a part of this regular visit to NITRA, Ghaziabad (Northern India Textile
Research Association ) is decided to study the present software technology used.
All the processes carried out and how far the approach is successful in dealing
with energy conservation and limitations present if any will be studied.
4 | P a g e
Review of Literature
A large body of literature exists that have analysed the role of energy
in the structure of production. They provide estimates of derived demand elasticities for
factor inputs using translog cost/production functions. Most have either used time series data
for a single country's manufacturing sector or time series data pooled by country or
manufacturing sub-sectors both in the developed and developing country context. Some of
these studies have attempted to estimate the input demand functions for the manufacturing
sectors of different countries by fitting aggregate translog cost function with three or four
inputs namely capital (K), labour (L), energy (E), and materials (M) while others have
attempted to estimate more disaggregated models with energy input disaggregated into
different fuels or with fixed and working capital as separate capital inputs. Studies which have
used energy as a single aggregate input include those by:
Berndt and Wood (1975), Hudson and Jorgenson (1974), Griffin and Gregory (1976),
Magnus (1979), Ozatalay and Grubaugh (1979), Field and Grebenstien (1980). Studies
by Fuss (1977), Griffin (1977), Halvorsen (1977) and Pindyck (1979) , on the other hand
have used energy in a disaggregated form and provide estimates of derived demand for
aggregate energy input as well as for its different fuel constituents. All these studies were
undertaken for developed countries. Absence of reliable data precluded similar type of
analysis for the developing countries. Some of the studies for the developing country are by
Pitt (1985) which uses firm-level cross-section data of manufacturing firms for Indonesia, and
Roy et.al. (2006) which uses pooled data for US and three developing countries South Korea,
Brazil, and India to estimate long-run substitution and price elasticities using factor inputs
(KLEM) for selected industries.
In the Indian context also a large number of studies have quantified the energy demand
function and have estimated energy price responsiveness. Studies that have estimated input
demand function using trans-log functions for Indian manufacturing sector include among
others by:
Uri (1979), Williams and Laumas (1981), Apte (1983), Murty (1986), Kar and
Chakraborty (1986), Roy (1992), Jha et al. (1993), Saha (1997). Although there are many
studies for India on inter-fuel and inter-factor substitution, not many have examined the bias
in technical change towards energy or other non-energy factor inputs. Jha et al. (1993) is one
of the first studies for India that examines technical change bias in the Indian manufacturing
sector. Other studies that have examined technical change bias with respect to energy input in
the Indian context are by Saha (1997) and Roy et al. (1999).

5 | P a g e
Secondary Research
The textile industry produces a wide range of products. The
production process includes four main activities: spinning, weaving and knitting, wet
processing and stitching(sewing). The production from fibers to spun yarn takes place
through the spinning process and constitutes the first stage. Then the yarn is weaved to
make fabrics in looms. Most woven fabrics retain the natural colour of the fibers from
which they are made and are called “grey fabrics” at this stage. These fabrics then
undergo several different processes including bleaching, printing, dyeing and finishing;
these are grouped under the category of wet processing. Finally, the stage from fabrics
to garments is done by stitching. The industry uses cotton, jute, wool, silk, man-made
and synthetic fibers as raw material.
Spinning: Spinning involves opening/blending, carding, combing, drawing, drafting
and spinning. It uses four types of technologies: ring spinning, rotor spinning, air jet
spinning and friction spinning. Ring spinning is the most used in India with its main
advantage being its wide adaptability for spinning different types of yarn. Rotor
spinning technology is also widely used.
Weaving: It uses two main technologies: Shuttle and shuttleless. Shuttleless has higher
productivity and produces better quality of output.
Wet processing: is the third stage. It covers all processes in a textile unit that involve
some form of wet or chemical treatment. The wet processing process can be divided
into three phases: preparation, coloration, and finishing. It uses different types of
technologies depending on the type of yarn or fabric that are dyed. Jigger, winch,
padding, mangle and jet-dyeing are some of the important dyeing machines. Similarly,
there are different types of printing: direct printing, warp printing, discharge printing,
resist printing, jet printing, etc..
In textile processing, major emphasis is usually laid upon productivity and quality, whereas energy is considered as a second priority. However, due to the alarming increase in energy cost, every effort should be given to minimize it. This not only helps to achieve lower cost, but also helps to achieve lower cost, but also helps to standardize a process and maintain the quality level. The total energy demand of any textile process depends on a few factors like machine used, process parameter, process sequences and fuel consumption. As we are aware that Boiler is main source of fuel consumption in any textile and non-textile industry. It is a matter of great concern to all

6 | P a g e
that boiler should run at its maximum efficiency with minimum indirect losses. For attaining maximum boiler efficiency, exact assessment of boiler efficiency and all indirect losses are very important. As only by this way one can get the idea about various areas where energy and there by precious fuel can be saved. Now, for similar quality, processing at different machine requires different energy levels, e.g. dyeing of cotton has a different energy demand in jigger, Jet dyeing or soft flow,. However, a mill processes the material, according to its own requirement, convenience and machine availability. This results in variation of energy need as well as the cost. Nowadays, there are many textile mills who are using jet dyeing (rapid jet dyeing) and soft flow machine for dyeing of polyester as well as cotton/ viscose fabric in order to utilise the machine and meet the schedule of production. This result in varying energy requirements compared to jigger dyeing of cotton/viscose. Now it is high time to have a systematic approach for the total cost benefit of using such a process, since the cost of utility will be different from case to case. So, it is equally important that efficiently generated steam should be distributed and utilized properly in process houses, and cost of steam, electricity, labour, maintenance etc. should also be calculated on lot to lot basis. So, it is equally important that efficiently generated steam should be distributed and utilized properly in process houses, and cost of steam, electricity, labour, maintenance etc. should also be calculated on lot to lot basis. Considering all these factors, NITRA has developed a user-friendly software for Energy Balance and accounting for Boiler and Process House. This software is divided into two Modules:
Process House Boiler House

7 | P a g e
I. PROCESS HOUSE Cost reduction in manufacturing is becoming increasingly important in these days of
tough competition especially after the dismantling of textile quotas from January 2005.
Utilities cost forms a significant portion of operating cost in textile manufacture, more
so for the textile process houses.
It is very important to advance energy conservation in the dyeing and finishing field,
which has a high energy consumption share in terms of both the amounts of money and
energy used.
The places where energy is mostly consumed and how energy can be conserved
in those areas are as follows:
(a) ENERGY CONSERVATION IN SIZING
Foam sizing : in this method foam is used for sizing. Hence considerably less water is
required as compared to the conventional sizing. This results is saving in energy and
time for evaporation of size. High pressure squeezing during sizing : this saves the
energy as well as the water. after sizing material is squeezed at high pressure to
remove maximum water from it. Because of this energy required for drying the
material is saved. Simultaneous dyeing and sizing: for denim warp yarns by using
rapio-dogen dyes and stabilizer with sizing formulation sizing and dyeing can be
carried out simultaneously. This saves energy and water.
(b) ENERGY CONSERVATION IN BLEACHING
Fast bleaching with VAPORLOC machine ,Mather and platt developed this machine. In
this machine, bleaching can be carried out in 90 to 120 seconds at a temperature of 135
degree C. and pressure 30-psi. for this process hydrogen peroxide, stabilizers and
suitable alkali is used. 50% energy can be saved with this process.
Novel method : This is a combined desizing scouring and bleaching of polyster/cotton
blend. This is carried out is which using material to liquors ratio1:25. the liquor
consists of hydrogen peroxide(35%w/v) magnesium sulphate heptahydrate (1.6gpl)
sodium hydroxide(4gpl) wetting agent (0.5gpl) EDTA(2gpl) and gluconic acide (2gpl)
at 95 degree C for one hour. The washing is giving at 95 degree C.

8 | P a g e
Potassium Permanganate method : cotton goods can be bleached with potassium
permanganate. This saves energy and water. It also gives eco-friendly effluent. Cold
pad-batch method : in this method peroxide bisulphate used as a bleaching agent. The
bath also contains some compounds which accelerate the bleaching reaction like urea
glucose sodium citrate methyl carbonate tetra acetyl ethylene diamine etc.
DSB process: in this process desizing scouring and bleaching takes place in a single
stage. The bath contains hydrogen peroxide peroxygen booster sodium silicate
peroxide sulphates etc. to this some compounds like urea glucose which accelerate the
peroxide reaction are added. This process saves energy water and labour.
(c) ENERGY CONSERVATION IN DYEING
Cost savings and quality improvement in dye house can be dine by some process
modifications and suitable replacement of processing machines.
Some of these processes are given bellow:
Energy saving by padding mangle: Cost savings and quality improvement in dye
house can be done by some process modifications and suitable replacement of
processing machines.
Some of these processes are given bellow.
Energy saving by padding mangle: Padding mangle mainly used for two purposes 1)
to impregnate any processing solution in fabric 2) to remove excess amount of
processing liquor from the fabric by squeezing. Kusters mangle is a modified from
which has uniform expression percentage with low wet pick-up. Expression percentage
can be changed by changing speed and pressure. On this machine uniform and accurate
results are obtained with the saving in energy.
Pad-jig method: This method can be used for dyeing with vat reactive azoic dyes with
this method. Dyeing quality is improved with respect to levelness and solidity of
shades. Dye penetration is also good. In this power & steam required is less.

9 | P a g e
II. Boiler House
A boiler is an enclosed vessel that provides a means for combustion heat to be transferred into water until it becomes heated water or steam. The hot water or steam under pressure is then usable for transferring the heat to a process. Water is a useful and cheap medium for transferring heat to a process. When water is boiled into steam its volume increases about 1,600 times, producing a force that is almost as explosive as gunpowder. This causes the boiler to be extremely dangerous equipment that must be treated with utmost care. The process of heating a liquid until it reaches its gaseous state is called evaporation. Heat is transferred from one body to another by means of (1) radiation, which is the transfer of heat from a hot body to a cold body without a conveying medium, (2) convection, the transfer of heat by a conveying medium, such as air or water and (3) conduction, transfer of heat by actual physical contact, molecule to molecule.
Boiler Systems
The boiler system comprises of: feed water system, steam system and fuel system. The
feed water system provides water to the boiler and regulates it automatically to meet
the steam demand. Various valves provide access for maintenance and repair. The
steam system collects and controls the steam produced in the boiler. Steam is directed
through a piping system to the point of use. Throughout the system, steam pressure is
regulated using valves and checked with steam pressure gauges. The fuel system
includes all equipment used to provide fuel to generate the necessary heat. The
equipment required in the fuel system depends on the type of fuel used in the system. A
typical boiler room schematic is shown in Figure 2.1.
2. Boilers
The water supplied to the boiler that is converted into steam is called feed water. The
two sources of feed water are:
(1) Condensate or condensed steam returned from the processes and
(2) Makeup water (treated raw water) which must come from outside the boiler room
and plant processes. For higher boiler efficiencies, the feed water is preheated by
economizer, using the waste heat in the flue gas.

10 | P a g e
Figure 2.1 Boiler Room Schematic
As per earlier process used in control and performance evaluation, all such works
were done manually. This has led to:
1. Increase in cost production of the textile as more labourers were required for
controlling and correcting the faults if arisen.
2. Data storage was very tiring and time consuming
3. Data acquired was not real time but taken manually from time to time.
4. Data acquiring precision was not up to the mark which has greatly affected the
energy consumption.
5. Due to inaccurate reading energy consumption was increased and as result so
was the cost of energy consumption.

11 | P a g e
Indian Standard for Boiler Efficiency Testing
Most standards for computation of boiler efficiency, including IS 8753 and BS845
are designed for spot measurement of boiler efficiency. Invariably, all these
standards do not include blow down as a loss in the efficiency determination
process.
Basically Boiler efficiency can be tested by the following methods:
1) The Direct Method: Where the energy gain of the working fluid (water and steam)
is compared with the energy content of the boiler fuel.
2) The Indirect Method: Where the efficiency is the difference between the losses
and the energy input.
The Direct Method Testing
Description
This is also known as ’input-output method’ due to the fact that it needs only the
useful output (steam) and the heat input (i.e. fuel) for evaluating the efficiency. This
efficiency can be evaluated using the formula:

12 | P a g e
Measurements Required for Direct Method Testing
Heat input
Both heat input and heat output must be measured. The measurement of heat input
requires knowledge of the calorific value of the fuel and its flow rate in terms of mass or
volume, according to the nature of the fuel.
For gaseous fuel: A gas meter of the approved type can be used and the measured
volume should be corrected for temperature and pressure. A sample of gas can be
collected for calorific value determination, but it is usually acceptable to use the
calorific value declared by the gas suppliers.
For liquid fuel: Heavy fuel oil is very viscous, and this property varies sharply with
temperature. The meter, which is usually installed on the combustion appliance, should
be regarded as a rough indicator only and, for test purposes, a meter calibrated for the
particular oil is to be used and over a realistic range of temperature should be installed.
Even better is the use of an accurately calibrated day tank.
For solid fuel: The accurate measurement of the flow of coal or other solid fuel is very
difficult. The measurement must be based on mass, which means that bulky apparatus
must be set up on the boiler-house floor. Samples must be taken and bagged
throughout the test, the bags sealed and sent to a laboratory for analysis and calorific
value determination.
In some more recent boiler houses, the problem has been alleviated by
mounting the hoppers over the boilers on calibrated load cells, but these are yet
uncommon.
Heat output
There are several methods, which can be used for measuring heat output. With steam boilers, an installed steam meter can be used to measure flow rate, but this must be corrected for temperature and pressure. In earlier years, this approach was not favoured due to the change in accuracy of orifice or venturi meters with flow rate. It is now more viable with modern flow meters of the variable-orifice or vortex-shedding types. The alternative with small boilers is to measure feed water, and this can be done by previously calibrating the feed tank and noting down the levels of water during the beginning and end of the trial. Care should be taken not to pump water during this period. Heat addition for conversion of feed water at inlet temperature to steam, is considered for heat output.

13 | P a g e
In case of boilers with intermittent blowdown, blowdown should be avoided during the trial period. In case of boilers with continuous blowdown, the heat loss due to blowdown should be calculated and added to the heat in steam.
Merits and Demerits of Direct Method Merits • Plant people can evaluate quickly the efficiency of boilers • Requires few parameters for computation • Needs few instruments for monitoring Demerits • Does not give clues to the operator as to why efficiency of system is lower • Does not calculate various losses accountable for various efficiency levels • Evaporation ratio and efficiency may mislead, if the steam is highly wet due to water carryover
The Indirect Method Testing
Description
The efficiency can be measured
easily by measuring all the losses
occurring in the boilers using the
principles to be described. The
disadvantages of the direct method
can be overcome by this method,
which calculates the various heat
losses associated with boiler. The
efficiency can be arrived at, by
subtracting the heat loss fractions
from 100.An important advantage
of this method is that the errors in
measurement do not make significant change in efficiency.
14 | P a g e
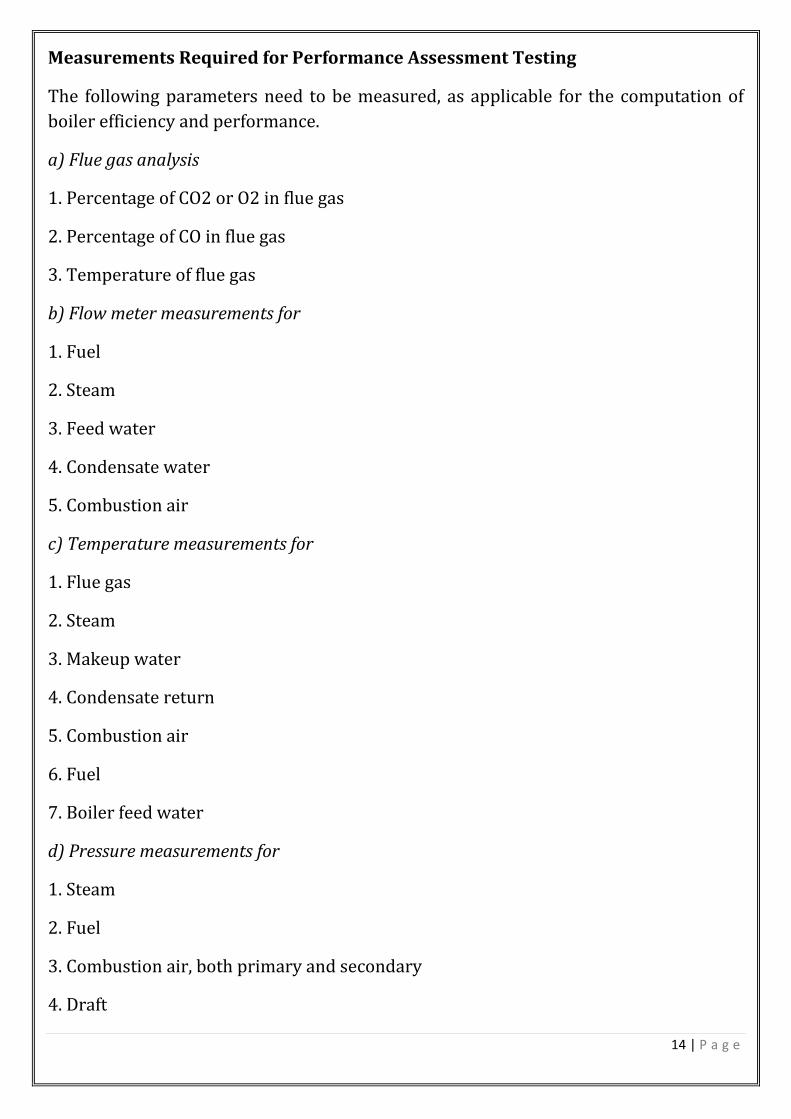
Measurements Required for Performance Assessment Testing
The following parameters need to be measured, as applicable for the computation of
boiler efficiency and performance.
a) Flue gas analysis
1. Percentage of CO2 or O2 in flue gas
2. Percentage of CO in flue gas
3. Temperature of flue gas
b) Flow meter measurements for
1. Fuel
2. Steam
3. Feed water
4. Condensate water
5. Combustion air
c) Temperature measurements for
1. Flue gas
2. Steam
3. Makeup water
4. Condensate return
5. Combustion air
6. Fuel
7. Boiler feed water
d) Pressure measurements for
1. Steam
2. Fuel
3. Combustion air, both primary and secondary
4. Draft

15 | P a g e
e) Water condition
1. Total dissolved solids (TDS)
2. pH
3. Blow down rate and quantity
Data Collection Format for Boiler Performance Assessment

16 | P a g e
Conclusion from Secondary Research
What we get from the secondary research is that manual energy balance and
accounting for boilers and process house in textile is tough and has lots of demerits.
These are :
1. Increase in cost production of the textile as more labourers were required for
controlling and correcting the faults if arisen.
2. Data storage was very tiring and time consuming
3. Data acquired was not real time but taken manually from time to time.
4. Data acquiring precision was not up to the mark which has greatly affected the
energy consumption.
5. Due to inaccurate reading energy consumption was increased and as result so
was the cost of energy consumption.

17 | P a g e
18 | P a g e
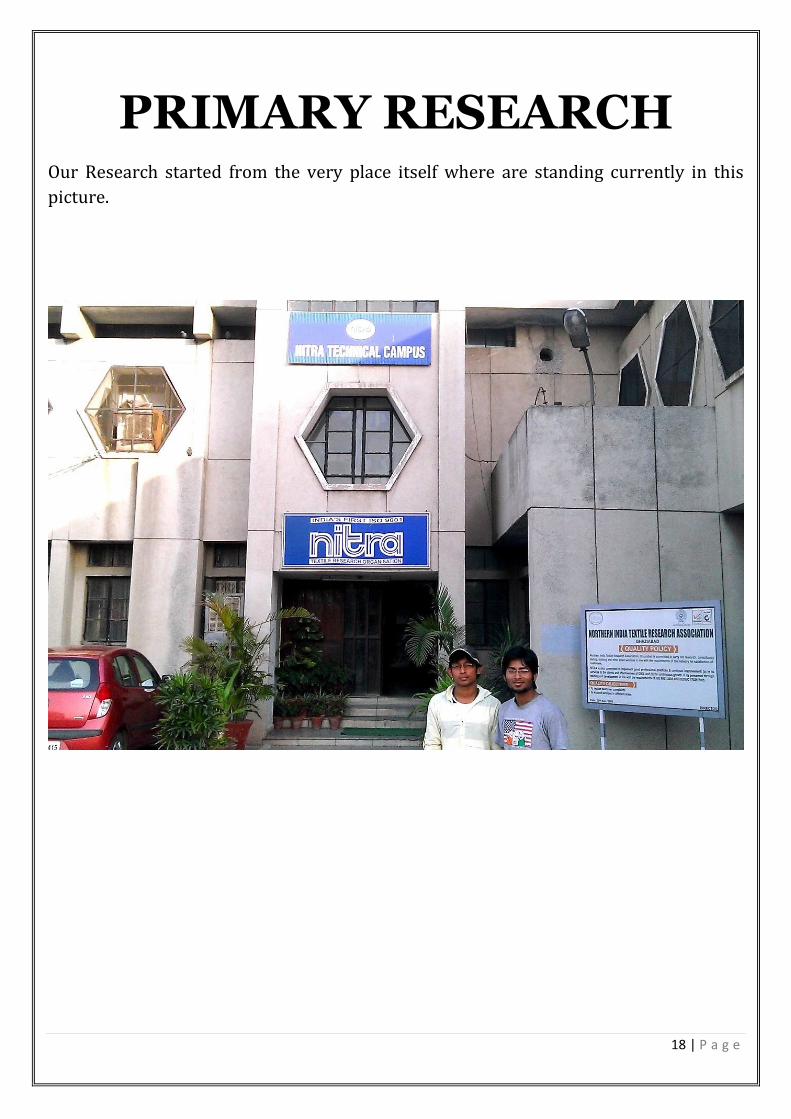
PRIMARY RESEARCH Our Research started from the very place itself where are standing currently in this
picture.

19 | P a g e
INTERVIEW This section includes the questions that we asked from Mr. Paurush Godhar, Project
Officer at NITRA, Ghaziabad.
Query: What is the on an average energy consumption in textile industries in India?
Reply: Textile industry is an energy intensive industry and more so is textile wet
processing. energy consumption during the various operation of spinning,
weaving and wet processing of textile for Indian textile industry is as follows:
- Spinning : 24%
- Weaving :28%
- Wet processing :48%
Query: How old is the software that NITRA developed for energy balance for boiler and
process house in Textile Industries?
Reply: The software developed by NITRA is approx. 15 years old but now days we
mostly use SCADA system for energy balance.
Query: Why SCADA and not the one that NITRA developed is preferred?
Reply: The main purpose of the software approach is to be feasible enough to reduce
labour, cost of energy, etc. which the earlier version was not able to fulfil.
Whereas, the SCADA system is more robust and user friendly. This system has
inculcated the features of real time data acquisition and processing. Moreover if
any faults arises the system automatically adjusts itself to maintain the
efficiency of the boilers and other equipment.
And, so the primary research started with the complete detail about the software
from the earlier version that NITRA developed to the SCADA system.

20 | P a g e
Inefficient Boilers are silently eroding your profits by guzzling more
fuel than they should. In absence of real-time "achievable" data, most plants resigned
themselves to this belief that they could do nothing more about this.
Not anymore!
NITRA brings back to life the efficiency optimization of Boiler house. Providing accurate
real-time efficiency data, Boiler house operators and managers can look forward to a
new way of running boilers!
Lower fuel bills, higher profits, greater plant efficiency. For the first time the benefits of
improving the boiler’s total efficiency are available in simple, cost-effective packages.
No more expensive DCS systems. No more guessing. No more tedious sampling
procedures or calculations.
I. Process House Software
A. Heat Utilization and consumption in Textile Processing
In textile manufacturing wet processing plays a crucial role and it is very
complicated as compared to other section of textile manufacturing. In process hose most of the machines can be utilized for different purposes and more than one quality can run together. The software performs energy balance on any processing machine, stores the data along with the information on the actual cost and theoretical cost of the performed operation along with the gradation of quality obtained. Records stored by this operation can be recalled at the later date to review weekly/ monthly/ yearly performance of the machine. Reviewing the records at a later day can helps us in assessing the deterioration in performance of the machine with an understanding of how to retrofit it to increase performance. The software is also helpful in comparing the energy demands between the machine processing the same production and shade. This can help in the selection of a machine required for a particular quantity, where the cost benefit will be more.

21 | P a g e
B. Basis of Energy Balance
Processing of fabric or yarn is a multi-stage process and involves heat and power
consumption in most of such steps. The main operations can be classified as scouring,
dyeing, washing and drying. While boiling is done at around 90o
C in Soft flow/ Jet dyeing/ Jigger the dyeing operation may be carried out at any temperature between
60o
to 130oC depending upon the type of fabric to be dyed and the machine to be used.
Depending upon the need, a few other operations are also carried out, which require hot water and the final product is dried by hot air in a stenter or in drying range. Heat is usually supplied through heat exchangers by steam or heating oil known as thermic fluid oil. Dyeing requires steam to heat the liquor to the requisite temperature and maintain the temperature for a specific period of time. Energy input is calculated by following ways:
(A) Amount of steam is calculated from pressure of entering steam and diameter of pipe to give flow rate.
(B) Amount of thermic fluid is calculated by actual electrical load, pump head and efficiency.
(C) Total heat input of the steam is calculated by value of pressure of steam, its flow rate and enthalpy chart.
(D) Total heat input of the thermic fluid is calculated by flow rate and its input and output temperature.
For output heat balance, the software calculates:
(a) The heat absorbed by the fabric. (b) The heat taken by the liquor. (c) The heat through radiation and convection by machine surface. (d) The heat in moisture in the fabric (e) Heat in exhaust air in drying. (f) Heat in the vapours.
The software calculates the theoretical and actual heat consumption component-wise and gives the costing of heat, power and water. A typical format is shown in Table1
C. General Structure of Energizer Software Module This software divided into four sections through which we can balance Energy in Textile Processing like machine details Lot Characteristics, Steam cost and Boiler ER calculators. Some input data screens are shown in figs. 1 and 2.

22 | P a g e
D. Benefits of the Software Module 1. Performance of machine for each lot can be evaluated incorporating quality as well as energy cost. 2. Deterioration in machine performance can be judged based on weekly/monthly/yearly performance evaluation of machine and recording. 3. Based on the performance evaluation and recording of the machine, understanding for performance improvement can be developed.

23 | P a g e

24 | P a g e
4. Background can be developed for design modification and minimization of steam consumption.
5. Cost of heat generation can be minimized and distribution and process steam wastages can be reduced.

25 | P a g e
7. processing similar type of cloth and best design of machine can be selected for
processing the cloth/yarn at minimum cost.
8. performance evaluation of machines of different manufacturers can be done by
incorporating energy cost along with quality.
26 | P a g e
I. Boiler House Software
Boiler consumes measure chunk of fuel in any processing industry.
Efficiency of any Boiler depends upon minimization of various indirect losses of the
boiler so that amount of energy input in the boiler by burning the fuel can be maximum
utilized for generation of steam and cost of steam can be minimized ultimately.
A. Basis of Software Considering the above factor software has been designed to calculate following
losses:
1. Dry Flue Gas Loss
2. Blow Down Loss
3. Fuel Moisture Loss
4. H2 Moisture Loss
5. Air Moisture Loss
6. Un-burnt Carbon Loss
7. Radiation and Convection Losses
8. Incomplete Combustion Loss.
After calculating all the above losses the software calculate indirect efficiency of the
boiler.
The direct efficiency of the boiler is calculated on the basis of fuel consumption and
steam generation for a particular time period as per standards.
B. Steam Cost Calculation Based on the Boiler efficiency and fuel cost per ton the cost per ton is
calculated through software.
Finally steam cost per ton is calculated by the software including cost of labour,
electricity, maintenance, chemicals etc. The Model Report Format for Steam Cost are
shown in Table 2.
27 | P a g e
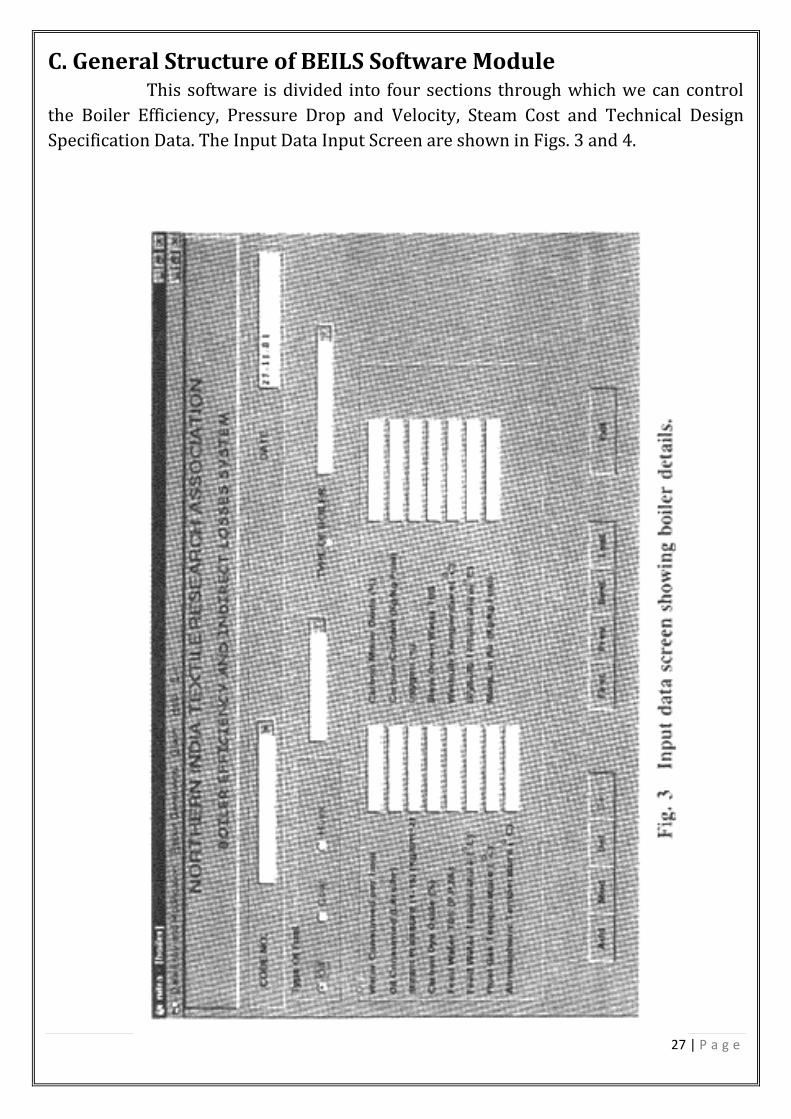
C. General Structure of BEILS Software Module This software is divided into four sections through which we can control
the Boiler Efficiency, Pressure Drop and Velocity, Steam Cost and Technical Design
Specification Data. The Input Data Input Screen are shown in Figs. 3 and 4.

28 | P a g e
D. Benefits of the Software Module
Calculation of Boiler efficiency on direct and indirect method on daily and
monthly basis. It also gives maximum, minimum and average efficiency.
Detailed calculation of all indirect losses and measures to check the losses for
efficiency improvement.
Calculation of steam for pressure drop and velocity.
Calculation of steam cost and wall losses. Minimum data requirement. Record facility and easy operational and user friendly.
Main advantage of this software is that after knowing the various heat losses it is
possible to take following action to improve boiler efficiency. A model report format of
the boiler efficiency is shown in Table 4 where all the input details can be fed to
computer, like fuel analysis, calorific value, steam pressure, enthalpy, % CO2, TDS etc.
Subsequently the boiler efficiency and the indirect losses are calculated and displayed.
Also we can get the total steam cost which includes fuel cost, maintenance and labour

29 | P a g e
cost etc. as shown in Table 2. Similarly it is possible to calculate steam pressure drop,
velocity etc. as shown in Table 3. Another feature of this software is that graphical
representation of Boiler efficiency can be displayed as shown in Fig. 5.
Similarly, we can view or print boiler efficiency of any type of fuel.

30 | P a g e
This software has been developed by NITRA itself for performance evaluation and
control in the boiler house. However, when we met with the Energy Auditor,
Mr. Paurush Godhar, he informed us that this software is a bit older in version and
currently using the software of SCADA for control and performance evaluation. So, now
we will be covering SCADA its structure and the way of its functioning. The goal of this
study is to apply waste heat recovery system (WHRS) to operation of a stenter machine
in a textile mill in order to optimize it’s energy consumption. The WHRS is controlled
and operated using SCADA.

31 | P a g e
SCADA Supervisory Control and Data Acquisition.
SCADA stands for Supervisory Control And Data Acquisition. As the name indicates, it is
not a full control system, but rather focuses on the supervisory level. As such, it is a
purely software package that is positioned on top of hardware to which it is interfaced,
in general via Programmable Logic Controllers (PLCs), or other commercial hardware
modules.
SCADA systems are used not only in industrial processes: e.g. steel making, power
generation (conventional and nuclear) and distribution, chemistry, but also in some
experimental facilities such as nuclear fusion. The size of such plants range from a few
1000 to several 10 thousands input/output (I/O) channels. However, SCADA systems
evolve rapidly and are now penetrating the market of plants with a number of I/O
channels of several 100 K: we know of two cases of near to 1 M I/O channels currently
under development.
SCADA systems used to run on DOS, VMS and UNIX; in recent years all SCADA vendors
have moved to NT and some also to Linux.
Supervisory Control and Data acquisition (SCADA) is a computer-based system for
gathering and analyzing real time data and making suitable decisions based on the
analysis. SCADA systems are used to monitor and control a plant or equipment in
industries such as telecommunications, water and waste control, fluid pressure and
level systems, industrial weighing and density systems, energy, oil and gas refining and
transportation.
A SCADA system gathers information, such as where a leak on a pipeline has occurred,
transfers the information hack to a central site, alerting the home station that the leak
has occurred, carrying out necessary analysis and control, such as determining if the
leak is critical, and displaying the information in a logical and organized fashion. SCADA
systems can be relatively simple, such as one that monitors environmental conditions
of a small office building, or incredibly complex, such as a system that monitors all the
activity in a nuclear power plant or the activity of a municipal water system. But
currently the approach is very much in demand by the textile industries.

32 | P a g e
Architecture
This section describes the common features of the SCADA products that have been
evaluated at CERN in view of their possible application to the control systems of the
LHC detectors [1], [2].
A) Hardware Architecture
One distinguishes two basic layers in a SCADA system: the "client layer" which caters
for the man machine interaction and the "data server layer" which handles most of the
process data control activities. The data servers communicate with devices in the field
through process controllers. Process controllers, e.g. PLCs, are connected to the data
servers either directly or via networks or fieldbuses that are proprietary (e.g. Siemens
H1), or non-proprietary (e.g. Profibus). Data servers are connected to each other and to
client stations via an Ethernet LAN. The data servers and client stations are NT
platforms but for many products the client stations may also be W95 machines. Fig.1.
shows typical hardware architecture.
Figure 1: Typical Hardware Architecture
33 | P a g e
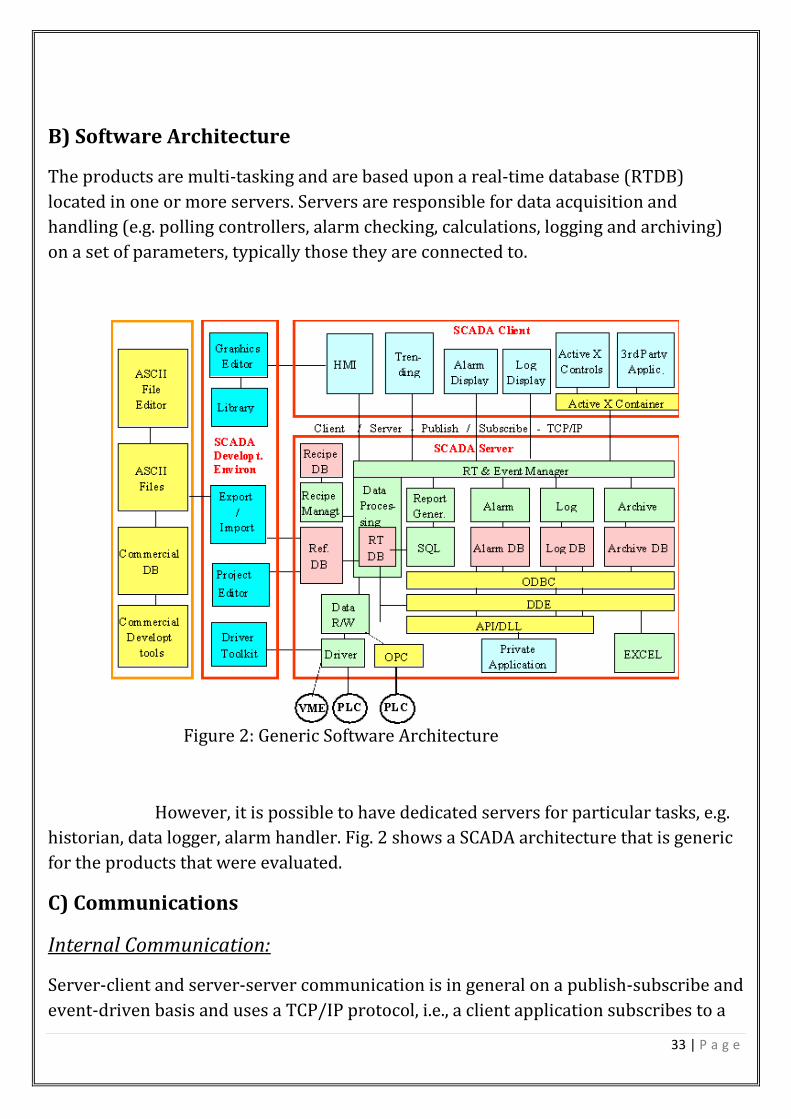
B) Software Architecture
The products are multi-tasking and are based upon a real-time database (RTDB)
located in one or more servers. Servers are responsible for data acquisition and
handling (e.g. polling controllers, alarm checking, calculations, logging and archiving)
on a set of parameters, typically those they are connected to.
Figure 2: Generic Software Architecture
However, it is possible to have dedicated servers for particular tasks, e.g.
historian, data logger, alarm handler. Fig. 2 shows a SCADA architecture that is generic
for the products that were evaluated.
C) Communications
Internal Communication:
Server-client and server-server communication is in general on a publish-subscribe and
event-driven basis and uses a TCP/IP protocol, i.e., a client application subscribes to a

34 | P a g e
parameter which is owned by a particular server application and only changes to that
parameter are then communicated to the client application.
Access to Devices:
The data servers poll the controllers at a user defined polling rate. The polling rate may
be different for different parameters. The controllers pass the requested parameters to
the data servers. Time stamping of the process parameters is typically performed in the
controllers and this time-stamp is taken over by the data server. If the controller and
communication protocol used support unsolicited data transfer then the products will
support this too.
The products provide communication drivers for most of the common PLCs and widely
used field-buses, e.g., Modbus. Of the three fieldbuses that are recommended at CERN,
both Profibus and Worldfip are supported but CANbus often not [3]. Some of the
drivers are based on third party products (e.g., Applicom cards) and therefore have
additional cost associated with them. VME on the other hand is generally not
supported.
A single data server can support multiple communications protocols: it can generally
support as many such protocols as it has slots for interface cards.
The effort required to develop new drivers is typically in the range of 2-6 weeks
depending on the complexity and similarity with existing drivers, and a driver
development toolkit is provided for this.
D) Interfacing
Application Interfaces / Openness
The provision of OPC client functionality for SCADA to access devices in an open and
standard manner is developing. There still seems to be a lack of devices/controllers,
which provide OPC server software, but this improves rapidly as most of the producers
of controllers are actively involved in the development of this standard. OPC has been
evaluated by the CERN-IT-CO group [4].
The products also provide
• an Open Data Base Connectivity (ODBC) interface to the data in the archive/logs,
but not to the configuration database,
• an ASCII import/export facility for configuration data,

35 | P a g e
• a library of APIs supporting C, C++, and Visual Basic (VB) to access data in the
RTDB, logs and archive. The API often does not provide access to the product's internal
features such as alarm handling, reporting, trending, etc.
The PC products provide support for the Microsoft standards such as Dynamic Data
Exchange (DDE) which allows e.g. to visualise data dynamically in an EXCEL
spreadsheet, Dynamic Link Library (DLL) and Object Linking and Embedding (OLE).
Database
The configuration data are stored in a database that is logically centralised but
physically distributed and that is generally of a proprietary format.
For performance reasons, the RTDB resides in the memory of the servers and is also of
proprietary format.
The archive and logging format is usually also proprietary for performance reasons, but
some products do support logging to a Relational Data Base Management System
(RDBMS) at a slower rate either directly or via an ODBC interface.
E) Scalability
Scalability is understood as the possibility to extend the SCADA based control system
by adding more process variables, more specialised servers (e.g. for alarm handling) or
more clients. The products achieve scalability by having multiple data servers
connected to multiple controllers. Each data server has its own configuration database
and RTDB and is responsible for the handling of a sub-set of the process variables
(acquisition, alarm handling, archiving).
F) Redundancy
The products often have built in software redundancy at a server level, which is
normally transparent to the user. Many of the products also provide more complete
redundancy solutions if required.

36 | P a g e

37 | P a g e
Functionality
A) Process Monitoring
Real-Time Data Collection and Dissemination
The <PCS Identifier> collects process data, as transmitted from process
instrumentation, and makes the process data available for any or all of the following:
• Basic Data Processing (i.e., conversion to digital data in engineering units),
• Process Alarm Detection and Alarm Management,
• Processing to accomplish control strategies,
• Display to PCS users, and
• Historical data collection.
Data from other sources (user inputs, recipes, tunable parameters,
intelligent devices, etc.) are combined with process data into a single logical database
that defines, in real time, the known state of the process. Control strategy algorithms
produce process control outputs that are also combined into the logical database to
complete the process state definition.
B) Basic Data Processing
All data monitored by the PCS shall be immediately converted to standard engineering
units prior to use in any comparison or control logic. This conversion should also
include normalization of discrete data values (e.g., so that “1” always represents the
“alarm” state for a discrete input alarm and the “open” state for a valve). Process
control outputs should undergo similar conversions immediately prior to transmittal.
C) Control
Unfortunately, our miniature SCADA system monitoring the widget fabricator doesn't include any control elements. So let's add one. Let's say the human operator also has a button on his control panel. When he presses the button, it activates a switch on the widget fabricator that brings more widget parts into the fabricator.
38 | P a g e
Now let's add the full computerized control of a SCADA master unit that controls the entire factory. You now have a control system that responds to inputs elsewhere in the system. If the machines that make widget parts break down, you can slow down or stop the widget fabricator. If the part fabricators are running efficiently, you can speed up the widget fabricator.
If you have a sufficiently sophisticated master unit, these controls can run completely automatically, without the need for human intervention. Of course, you can still manually override the automatic controls from the master station.
In real life, SCADA systems automatically regulate all kinds of industrial processes. For example, if too much pressure is building up in a gas pipeline, the SCADA system can automatically open a release valve. Electricity production can be adjusted to meet demands on the power grid. Even these real-world examples are simplified; a full-scale SCADA system can adjust the managed system in response to multiple inputs.
D) Alarm Handling
Alarm handling is based on limit and status checking and performed in the data servers.
More complicated expressions (using arithmetic or logical expressions) can be
developed by creating derived parameters on which status or limit checking is then
performed. The alarms are logically handled centrally, i.e., the information only exists
in one place and all users see the same status (e.g., the acknowledgement), and multiple
alarm priority levels (in general many more than 3 such levels) are supported.
It is generally possible to group alarms and to handle these as an entity (typically
filtering on group or acknowledgement of all alarms in a group). Furthermore, it is
possible to suppress alarms either individually or as a complete group. The filtering of
alarms seen on the alarm page or when viewing the alarm log is also possible at least on
priority, time and group. However, relationships between alarms cannot generally be
defined in a straightforward manner. E-mails can be generated or predefined actions
automatically executed in response to alarm conditions.
E) Logging/Archiving
The terms logging and archiving are often used to describe the same facility. However,
logging can be thought of as medium-term storage of data on disk, whereas archiving is
long-term storage of data either on disk or on another permanent storage medium.
Logging is typically performed on a cyclic basis, i.e., once a certain file size, time period
or number of points is reached the data is overwritten. Logging of data can be
performed at a set frequency, or only initiated if the value changes or when a specific

39 | P a g e
predefined event occurs. Logged data can be transferred to an archive once the log is
full. The logged data is time-stamped and can be filtered when viewed by a user. The
logging of user actions is in general performed together with either a user ID or station
ID. There is often also a VCR facility to play back archived data.
F) Report Generation
One can produce reports using SQL type queries to the archive, RTDB or logs. Although
it is sometimes possible to embed EXCEL charts in the report, a "cut and paste"
capability is in general not provided. Facilities exist to be able to automatically
generate, print and archive reports.
Advantages of SCADA System:
Runs on any Windows 95/98/ME/NT/2K/XP/Vista computer o requires NO third-party applications o system executable files are less than 1 megabyte
Intuitive, powerful, and flexible HMI
o learn to use the system quickly without expensive training classes
Fully customizable, interactive graphics o take advantage of the integrated Symbol Factory® (by Software Toolbox®) o Includes over 3000 icons spanning several industry categories.
Full editing capability without interruption of any system functions
o edit any database item while the system continues to run your plant (polling, logging, alarming, etc.)
o no need for an off-line development system or separate editing computer
Built-in, configurable data logging and reporting o automatically generate reports from logged historical data without costly
third-party applications
Built-in maintenance scheduling o automatically generate scheduled maintenance item reports without costly
third-party applications

40 | P a g e
Isolated subsystem testing o test/monitor/manipulate control strategies or individual database points
while the system continues to run
Global graphic colouring strategies o build customized graphic colouring schemes without scripting each
individual object
Intelligent tag database entry tool o add incremental tags (tags that differ 'incrementally' by name and address)
with a single click
Configurable real-time and historical trends o customize trends to include multiple scales, arbitrary sample rates, and
arbitrary time spans
Hot backup capability o automatically (no manual intervention or reboot) transfer polling and
logging control to a 'redundant host' computer if a problem is discovered at the host computer
Independent field device acquisition pollers o efficiently poll multiple stations simultaneously
Remote terminals via network and/or dialup
o view entire system and interact with database points from any networked computer or phone line
Full database testing functionality o instantly view any database inconsistencies
Remote alarm notification via customizable audio phone calls and/or alpha-
numeric pages o receive alarm notifications on your cell phone and/or pager while away
from the plant

41 | P a g e
CONCLUSION
In the present scenario, the energy cost is the highest among all other
cost component in the production of textile goods. So far there has not been much
efforts to evolve a systematic approach to analyse and monitor energy consumption in
each process and translate into financial terms. The proposed software(s) for process
house and boiler are a step forward towards those objectives. By proper use of these
software(s) it is possible to analyse various heat losses and draw a complete heat
balance and workout cost analysis from lot to lot and day-to-day basis. This may serve
as an important MIS tool for the management to exercise effective energy conservation
and cost control measures if used on a regular basis. In order to compete with
international products, there is no other alternative but to go for automation in near
future.
And, that future is SCADA System.
The ceaseless changes that are relentlessly taking place in the contemporary scenario
of the industrial segment, has led to the development of SCADA. Emphasis has been
given to the automation process that is now rapidly taking its place in all the power
plants across the globe.
The Paper has furnished itself to study the integral parts of the entire process involved,
their implementation and the problems that may show up have also been given their
due importance. The future work deals with the purification of water to the boiler and
the air circulation for the boiler to burn the fuel using same automation technique.

42 | P a g e
REFERENCES 1. R.S. Bhagwat, “Evaluation of Parameters of Textile Wet Processing – Jet
Dyeing Machine”, Colourage, Feb. 1992. 2. A. C. Walham, “Double Overflow Technology in Fabric Dyeing”, Asian Textile
Journal, Sep. 94. 3. M. Chakraborty, Amit Dayal and M.L. Gulrajani, “Processing of Knitted
Cotton Fabrics”, NITRA 4. M.L. Gulrajani and Sanjay Gupta, “Energy Conservation in Textile Wet
Processing”, Omega Publishers. 5. Ratna Prabhu, “Heat Economy in Textile Mills”, ATIRA. 6. A.C. Walham. “An Advance in Fabric Dyeing: Double Overflow Technology”,
Textile Industry and Trade Textile, June 94. 7. Super Tex + SQL Gaston County Dyeing Machine Company, P.O. 308, Stanley,
NC 28164, USA. 8. Research Paper, Intelligroup Asia Private Limited, ERP Implementation
Services, Hydrabad. 9. Galileo-Software Package for Dye House Planning and Management, Loris
Bellini.