Modeling of fire-tube boilers - Archive ouverte HAL
38
HAL Id: hal-00789870 https://hal.archives-ouvertes.fr/hal-00789870 Submitted on 19 Feb 2013 HAL is a multi-disciplinary open access archive for the deposit and dissemination of sci- entific research documents, whether they are pub- lished or not. The documents may come from teaching and research institutions in France or abroad, or from public or private research centers. L’archive ouverte pluridisciplinaire HAL, est destinée au dépôt et à la diffusion de documents scientifiques de niveau recherche, publiés ou non, émanant des établissements d’enseignement et de recherche français ou étrangers, des laboratoires publics ou privés. Modeling of fire-tube boilers F.J. Gutiérrez Ortiz To cite this version: F.J. Gutiérrez Ortiz. Modeling of fire-tube boilers. Applied Thermal Engineering, Elsevier, 2011, 31 (16), pp.3463. 10.1016/j.applthermaleng.2011.07.001. hal-00789870
-
Upload
khangminh22 -
Category
Documents
-
view
0 -
download
0
Transcript of Modeling of fire-tube boilers - Archive ouverte HAL
HAL Id: hal-00789870https://hal.archives-ouvertes.fr/hal-00789870
Submitted on 19 Feb 2013
HAL is a multi-disciplinary open accessarchive for the deposit and dissemination of sci-entific research documents, whether they are pub-lished or not. The documents may come fromteaching and research institutions in France orabroad, or from public or private research centers.
L’archive ouverte pluridisciplinaire HAL, estdestinée au dépôt et à la diffusion de documentsscientifiques de niveau recherche, publiés ou non,émanant des établissements d’enseignement et derecherche français ou étrangers, des laboratoirespublics ou privés.
Modeling of fire-tube boilersF.J. Gutiérrez Ortiz
To cite this version:F.J. Gutiérrez Ortiz. Modeling of fire-tube boilers. Applied Thermal Engineering, Elsevier, 2011, 31(16), pp.3463. �10.1016/j.applthermaleng.2011.07.001�. �hal-00789870�
Accepted Manuscript
Title: Modeling of fire-tube boilers
Authors: F.J. Gutiérrez Ortiz
PII: S1359-4311(11)00342-5
DOI: 10.1016/j.applthermaleng.2011.07.001
Reference: ATE 3627
To appear in: Applied Thermal Engineering
Received Date: 21 December 2010
Revised Date: 1 June 2011
Accepted Date: 2 July 2011
Please cite this article as: G. Ortiz. Modeling of fire-tube boilers, Applied Thermal Engineering (2011),doi: 10.1016/j.applthermaleng.2011.07.001
This is a PDF file of an unedited manuscript that has been accepted for publication. As a service toour customers we are providing this early version of the manuscript. The manuscript will undergocopyediting, typesetting, and review of the resulting proof before it is published in its final form. Pleasenote that during the production process errors may be discovered which could affect the content, and alllegal disclaimers that apply to the journal pertain.
MANUSCRIP
T
ACCEPTED
ACCEPTED MANUSCRIPT
1
Modeling of fire-tube boilers
F. J. Gutiérrez Ortiz
Departamento de Ingeniería Química y Ambiental, Universidad de Sevilla
Camino de los Descubrimientos, s/n. 41092 Sevilla, Spain
Phone: + 34 95 448 72 68 Fax: + 34 95 446 17 75
E-mail: “Francisco Javier Gutiérrez Ortiz” [email protected]
Abstract
In fire-tube boilers, the flue gas passes inside boiler tubes, and heat is transferred to water
on the shell side. A dynamic model has been developed for the analysis of boiler
performance, and Matlab has been applied for integrating it. The mathematical model
developed is based on the first principles of mass, energy and momentum conservations. In
the model, the two parts of the boiler (fire/gas and water/steam sides), the economizer, the
superheater and the heat recovery are considered. The model developed can capture the
dynamics of the boiler level and boiler pressure with confidence, and it is adequate to
approach the boiler performance and, hence, to design and test a control strategy for such
boilers. Furthermore, it gives insight of dynamics performance not only during nominal
operating conditions, or transient behavior when a parameter is changed, but also for the start-
up. The model proposed can be easily implemented and thus, it is useful to assist plant
engineers and even for training future operators. A case study of an 800 HP fire-tube boiler
burning fuel-oil has been simulated to test the boiler performance by varying operating
conditions using a pulse and a step change in fuel and steam flow-rate as well as simulating a
start-up form the beginning up to achieve the steady state. The results match qualitatively well
when compared to results from the literature.
Keywords
Fire tube boiler, modeling, simulation, heat transfer, steam, fuel
MANUSCRIP
T
ACCEPTED
ACCEPTED MANUSCRIPT
2
1. Introduction
The design of fire-tube boilers consists of a bundle of fire tubes contained in a shell and
the evaporating process takes place outside the fire tubes generating steam. Fire-tube boilers
are often characterized by their number of passes, referring to the number of times that the
flue gas flows along the length of the pressure vessel transferring heat to the water. Each pass
sends the flue gas through the tubes in the opposite direction. To make another pass, the gas
turns 180 degrees and passes back through the shell. The turnaround zones can be either dry-
back or water-back. In dry-back designs, the turnaround area is refractory lined. In water-back
designs, this turnaround zone is water-cooled, eliminating the need for the refractory lining.
Their characteristically large water capacity makes them somewhat slow in coming up to
operating pressure and temperature but, on the other hand, the large amount of heat stored in
the water provides some accumulator action that makes it possible to meet load changes
quickly.
There are several fire-tube boiler designs such as the horizontal return tubular boiler
(HRT), which is encased in a brickwork setting to contain the flame, so it was an externally
fired boiler and also two-pass boiler. By enlarging the diameter of the return flue and putting
the firing grating inside this enlarged flue the HRT boiler becomes internally-fired and the
furnace is placed inside the shell and completely surrounded by water. By this way, the boiler
has a large heating surface and a reasonably long gas travel, and does not require external
brickwork. Thus, by eliminating the external brickwork the design converts into a Scotch
Marine boiler since it was extensively used for marine service. Now, the hot gases flow from
the fire to the reversing chamber at the rear of the boiler and then forward again through the
fire tubes. All parts are inside the shell and completely surrounded by water. In earlier days,
the basic fire-tube boiler was manufactured at the factory, and the refractory, insulation, boiler
fittings, controls and firing equipment were installed by others. The modern fire-tube boiler is
marketed as a packaged unit, and now the majority of fire-tube boilers are packaged type fire-
tube boiler. The boiler as supplied by the manufacturer comes as a completely equipped unit
mounted on its own base, ready for operation as soon as it is placed in the boiler room and
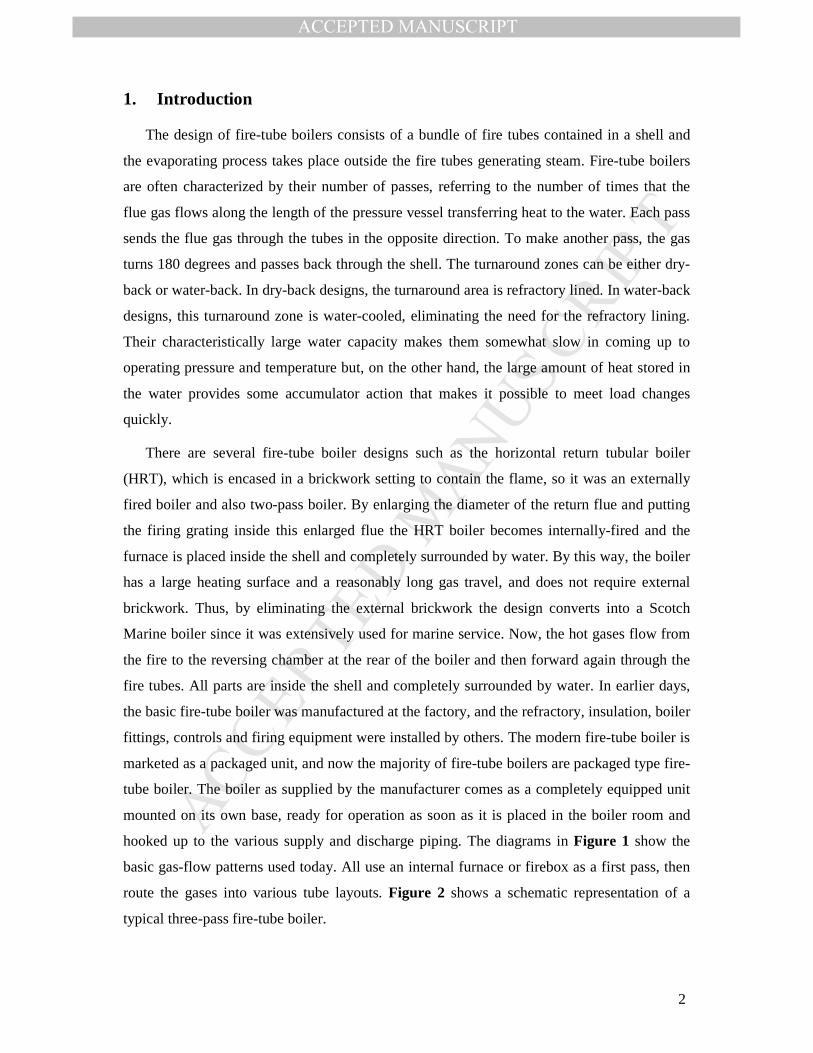
hooked up to the various supply and discharge piping. The diagrams in Figure 1 show the
basic gas-flow patterns used today. All use an internal furnace or firebox as a first pass, then
route the gases into various tube layouts. Figure 2 shows a schematic representation of a
typical three-pass fire-tube boiler.

MANUSCRIP
T
ACCEPTED
ACCEPTED MANUSCRIPT
3
Another type of fire-tube boiler is the vertical fire-tube boiler, which is similar in
construction to the horizontal fire-tube boiler. It is basically made of a round steel drum or
shell. Both ends of the shell are closed by flat plates called tube sheets. The combustion of the
fuel takes place in a furnace and the hot gases travel from the furnace through the fire tubes to
the chimney. The water in the boiler shell surrounds the fire tubes. The gases travel through
the boiler in one direction only and for this reason, this boiler can also be classed as a single-
pass boiler. Vertical fire-tube boilers have an advantage when floor space is limited as they
occupy only a small area.
Some recent papers have been published regarding with other aspects of fire-tube boilers
[1, 2]. Thus, effects of the addition of solid surface on carbon monoxide (CO) emission
reduction have been investigated in a combustion chamber of a three pass fire tube water
heater [1] and optimization of fire tube heat recovery steam generators through genetic
algorithm has been carried out by moving variables towards reducing the operational costs of
the HRSG, reducing thus the heat loss.
Dynamic modeling and simulation are becoming increasingly important in engineering to
analyze the unsteady operation of complex systems [3]. Several studies of modelling the
boiler evaporation system can be found in the literature, especially for water-tube boilers [4-
7], but barely for fire-tube boilers. In this work, the modeling of the heat transfer between flue
gas and water in a fire-tube boiler is considered. In the literature, a comprehensive modeling
for fire-tube boilers has not been treated. Generally, the few models found are focused to one
aspect of the fire-tube boiler performance as the gas/fire side or the water/steam side, and
normally centered on nominal operating conditions. However, a simulator must include the
gas/fire side and the water/steam side performance as well as both the nominal operation and
the start-up/shut-down of the fire-tube boiler.
CFD models are a powerful tool to model very complicated systems such as for instance
turbulent diffusion flames. CFD predicts flow, mixing, combustion, heat release and heat
transfer. There are some modelling works carried out using CFD code [8-12]. However, these
models are highly dependent on initial and boundary conditions as well as the arrangement of
grid nodes and turbulence model. Therefore, the results are only good as the input data, and
there are still limitations in the physical models in the codes. Thus, for instance, the empirical
k-ε model has been used for many years and has been widely used despite its many known
limitations. Indeed, in turbulence models the magnitudes of two turbulence quantities, the
turbulence kinetic energy k and its dissipation rate ε, are calculated from transport equations
MANUSCRIP
T
ACCEPTED
ACCEPTED MANUSCRIPT
4
solved simultaneously with those governing the mean flow behavior. Thus, new modeling
papers continuously present methods in order to overcome the assumptions and
simplifications followed in boiler modeling by preceding models. The reliability of CFD
analysis depends heavily on the turbulence model employed together with the wall functions
implemented. In order to resolve the abrupt fluctuations experienced by the turbulent energy
and other parameters (many times selected in a heuristic way, conferring to the modeling a
semi-empirical characteristic) located at near wall regions and shear layers a particularly fine
computational mesh is necessary which inevitably increases the computer storage and run-
time requirements. Moreover the dynamic response is very complex to address by CFD
modeling. Thus, the assessment of a fire-tube boiler may be simplified by a model such as
that described in this paper, for practical purposes.
In this work, the aim is to propose a model for simulating the performance of a horizontal
packaged fire-tube boiler in a realistic way, although with simplifications. A simulation tool
may be useful to approach the dynamic performance of a boiler in order to assist the plant
engineer and even to train the technical staff. Furthermore, a simplified model is better in
practice if a control system must be included. Detailed modelling of plants dynamics is not
normally efficient for control purposes, since the plant model should describe the plant
dynamics with sufficient accuracy and not describe the microscopic details occurring within
individual plant components [13]. However, in order to better understand the final model used
to simulate the fire-tube boiler performance, first it is convenient to establish a more rigorous
model in order to recognize the simplifications made after.
By means of simulations the plant engineer and operators can evaluate changes in
operating conditions and select in real-time the best way to operate the furnace and
evaporation system. Thus, simulation is useful both for training and assisting in making on-
line decisions. One of the aims of the dynamic model developed is to achieve reliable
predictions on the changes of the more relevant variables so it could be used, e.g., for the
design of the unit control.
2. Outline of the model
Description of the dynamic performance of a distributed parameters thermal system like a
fire-tube boiler needs to solve a set of partial differential equations. Furthermore, some
additional algebraic equations are required leading to an overall DAE mathematical system
that is very complex to solve. Additionally, some non-linearities arise when modeling heat
MANUSCRIP
T
ACCEPTED
ACCEPTED MANUSCRIPT
5
transfer mechanism such as radiation or even convection coupled with empirical correlations.
Temperature, pressure and flow rate of participating fluids are normally the independent
variables. Besides, some restrictions and interlocks should be taken into account to operate
the boiler in a safe way. Therefore, the real problem is very difficult to solve even
numerically. Hence, a comprehensive model is proposed and after simplified to reduce the
complexity and the computational time, but providing reasonable results.
The model is based on the mass, energy and momentum balances together with
constitutional equations. Two parts are distinguished in fire-tube boilers: the fire/gas side,
integrated by the combustion chamber as well as by the successive gas passes (through the
tube banks), and the water/steam side, which contents liquid water evaporating in the lower
zone and saturated vapor or steam in the upper zone, from which it is continuously
withdrawing to the points of use through a control valve.
In order to evaluate the energy usage of the boiler, the reaction chamber has been divided
in different zones (slices) as shown in Figure 3, with all the fuel and the air being fed into the
first zone. The reaction chamber is modeled as a series of continuous stirred tank reactors, and
the main reactions that take place into the chamber occur in a very fast way. The wall tubes
have been also discretized into slices in the direction of gas flow to facilitate the calculations
of the heat transfer. Figure 4 shows the heat transfer phenomena that occur in the boiler:
transfer by radiation and convection between the combustion gases and wall tubes,
conduction through wall tubes to water, transfer by convection from tubes to liquid-water
vapor mixture in the different passes. The gas phase is considered an ideal gas, and the
conduction in this phase is neglected. Heat transfer from the gas to the combustion chamber
wall is calculated by both radiation and convection. The axial component of radiation can be
reasonably neglected since it is relatively small compared to the radial component. All
quantities are the same in a cross-section of the tube, i.e., no fluid pressure and temperature
gradients occur in the radial and circumferential directions. Finally, since hydrodynamics
changes are much faster than thermal or gas composition changes, the hydrodynamics will be
solved as a steady state problem.
3. Model development
To build a model for a system by physical principles, it is necessary to define inputs and
outputs. For a fire-tube boiler, the inputs are design parameters (boiler geometry and elements
optionally incorporated as an economizer, a superheater or a degasifier) and operational
MANUSCRIP
T
ACCEPTED
ACCEPTED MANUSCRIPT
6
parameters, such as the feed water, fuel and air flow-rates and the steam valve position), fuel
and ambient temperature and pressure.
The outputs are performance parameters such as temperatures (boiler water, flue gas,
saturated and superheated steam), pressures (inside water phase boiler and steam phase
boiler), steam flow-rate, level or liquid volume, composition of flue gas and global boiler
efficiency. Moreover, there may be other outputs depending on the complementary elements
disposed as heat recovery by flashing of blowdown, degasifier, heat exchanger, conditioning
of the steam through a superheater or the feed water by an economizer. These other parts of
the fire-tube boiler are after taken into account. Next, the modeling will be focused on the
aforementioned two parts of the fire-tube boiler.
3.1. Fire/gas side
It is assumed that combustion is controlled by the mixing rate and thus all mixed is burnt.
Hence, combustion reactions are assumed to be very fast and shifted to the products side in
the reaction equations, due to the temperature conditions inside the combustion chamber.
Therefore, reactions kinetics are ignored by proposing that reactions are instantaneous and
proceed wherever gas and air coexist, to give a mixture of combustion products plus some
residual reactants. In this way, it can be avoided the enormous computational task required in
the modeling of many interconnected chemical reactions involved in the combustion of a fuel.
The fuel consumption is assumed to be constant in a nominal operation, but it is variable
once the system is under control. The air–fuel ratio is assumed to be constant, in a nominal
operation, but it is variable once the system is under control, where the oxygen concentration
in the flue gas can be set by the plant engineer. Heating value and moisture content of the fuel
are constant.
Heat transmission inside the combustion chamber takes place between a mixture of
moving gases and the tube walls. The calculation of this heat transfer requires to know the gas
composition, physical properties of the gas and temperature in both the combustion chamber
and walls. The furnace or combustion chamber is assumed to be filled of a grey emitting,
absorbing, and isotropically scattering medium and surrounded by grey walls. Turbulent heat
transfer is assumed throughout the process.
For the wall of furnace, a representative temperature is used as well as for the other tubes
of the gas passes. The assumption of uniform surface temperature is reasonable for predicting
heat transfer within the combustion chamber when compared with experimental results with
MANUSCRIP
T
ACCEPTED
ACCEPTED MANUSCRIPT
7
detailed mathematical models of the furnace [14]. Since the wall temperature will be quite
lower than the gas temperature, the radiation from the wall to the combustion products is very
much less that in the opposite direction.
As aforementioned, and according to the one-dimensional assumptions in the modeling,
the combustion chamber (first pass of gas) is discretized in NF slices. Thus, for all the
components, k, in each slice, i:
0,,1
,,,, =+−−=+−−= −genk
iconsk
ik
ik
igenk
iconsk
ioutk
iink
ik
i mmmmmmmmmdt
d&&&&&&&& [1]
VVVmmm Fggairfuel ===+ ;&&& [2]
The heat flux can be captured by using the lower heating value (LHV) of the fuel as
follows: LHVm fuel& (chemical energy of fuel)
Likewise, the variation of the fractional heat release due to combustion (Y) with axial
distance (or slice, in this case) from the jet orifice may be described by an exponential
expression where the constant 4.6 means that 99% of the heat release occurs at the end of the
flame (at the end of the furnace), as follows:
−−=
FL
xY 6.4exp1 [3]
From hence, the fractional heat release within zone or slice, i, results in the following:
−−
−−=−=∆ −FF
iii N
i
N
iYYY 6.4exp
16.4exp1 [4]
For the average convective film coefficient, it has been used the classical Dittus–Boelter
heat transfer correlation for fluids in turbulent flow. Likewise, the equation for the radiation
heat flow follows the suggestion of Hottel and Sarofim [15] under the assumption of grey
gases and grey wall. Since all participating surfaces behave as grey-Lambert surfaces are
assumed in the model, total emissivity and total absorptivity are equal. This consideration
simplifies the analysis of radiation transfer and it does not lead to significant predictive error.
Thus, in each slice i of the furnace:
( )
Fconvi
Fradi
iFg
iFgFgpg
FFfuel
iFgFgvHg
TTCmN
i
N
iLHVmTVC
dt
d
,,
,1
,,,,,,, )(6.4exp1
6.4exp
&&
&&
−−
−+
−−
−−=ρ −
[5]
where
MANUSCRIP
T
ACCEPTED
ACCEPTED MANUSCRIPT
8
∑=
==−π
=FN
i F
iFg
FgF
FgFcFwall
iFg
F
FFFcFconv
i
N
TT
R
khTT
N
LRhq
1
,,
4.08.0
int,
,,,,
int,,, ;PrRe
2023.0);(
2& [6]
)(2
12
)(2
4,
4
,,,int,
4,
4
,,,,,
,,int,,
Fwalli
FgFgFwall
F
FF
Fwalli
FgFgFwallFwallFg
FgFwall
F
FFFrad
i
TTN
LR
TTN
LRq
−ε+ε
σπ
≈
−εε−ε+ε
εεσ
π=&
[7]
Through a good burner design and control, the occurrence of soot in the flame is usually
avoided. Hence, the combustion from luminous radiation from these flames is small and it
could be disregarded. Furthermore, with a very poor mixing, some luminosity may be
produced, although this possibility is ignored since a good mixing is assumed. Nevertheless,
the model proposed may include the luminous radiation that is usually important with liquid
and solid fuels, although it is normally not significant for gaseous fuel. The soot emissivity may
be represented by a single grey gas expression because the soot radiation continuous across the
wavelength spectrum. The soot generated in a flame is highly dependent, among other things,
on the fuel composition. Talmor [16] correlated the flame emissivity with the fuel type. For
fuel gases with C/H weight ratio between 3.5 and 5.0 the data were correlated by either of two
correlations:
90020.0
LHV=ε [8]
where LHV is the lower heating value of the fuel in Btu/ft3, or
fuelMW048.0=ε [9]
where MWfuel is the molecular weight of the fuel.
For liquid fuels with C/H weight ratios between 5 and 15, the following correlation was
determined:
)/1.2exp(2.681 HC−−=ε [10]
where C/H is the weight ratio of carbon to hydrogen for the fuel.
Thus, the emissivity related to flames of hydrogen, natural gas, gas oil and residual fuel
oil are 0.17, 0.21, 0.61 and 0.85, respectively. This simplified approach allows to avoid the
addition of more coefficients to calculate a weighted overall emissivity of flame, in case of
accounting for any kind of flame related to a given fuel.
MANUSCRIP
T
ACCEPTED
ACCEPTED MANUSCRIPT
9
For the other gas passes (second and so on) through a given tube bank, j (j = 2, 3 and 4), a
number of tubes, nt,j, has to be considered:
( ) jconvii
gi
ggpjt
gjg
ijgjgvj
jt
qTTCn
mTCV
dt
d
n,
1,
,
,,,,,
)(1
&&
−−=ρ − [11]
Each tube of any pass (from the second pass of gas) may be also discretized in Nj slices
∑=
==−π
=jN
i j
ijg
jgj
jgjcjwall
ijg
j
jjjcjconv
i
N
TT
R
khTT
N
LRhq
1
,,
4.08.0
int,
,,,,
int,,, ;PrRe
2023.0);(
2& [12]
)(2
12 4,
4
,,,int,
, jwalli
jgjgjwall
j
jjjrad
i TTN
LRq −ε
+εσ
π=& [13]
The momentum balance for all the fire/gas side:
jfrjgout
outjg
jgoutjginin
jg
jgin hg
vz
g
P
g
vz
g
P,
2,,
,
,,2
,,
,
,,
22=
++
ρ−
++
ρ [14]
( )fanburner
j
jfr HHh +=∑∀
, [15]
Equation (11) represents the mechanical energy loss expressed in meters of w.c. and
Equation (12) represents the energy to be supplied by the burner blower and the flue-gas fan
Regarding with the metal section, the equations for the combustion chamber (first pass for
gases) are the following:
( )
−+= ∑
=waterF
N
i
Fconvi
Fradi
FwalltpFt qqqTdt
dCm
F
F ,
1
,,,,, &&& [16]
where
)(1
ln
2,
,int,
,
,
,
,, waterFwall
watercF
Fext
Ft
Fext
FFextwaterF TT
hR
R
k
R
LRq −
+
π=& [17]
Similarly, for the j-th gas pass:
( )
−+= ∑
=waterj
N
i
jconvi
jradi
jtjwalltpjt qqqnTdt
dCm
j
j ,
1
,,,,,, &&& [18]
)(1
ln
2,
,int,
,
,
,
,,, waterjwall
watercj
jext
jt
jext
jjextjtwaterj TT
hR
R
k
R
LRnq −
+
π=& [19]
MANUSCRIP
T
ACCEPTED
ACCEPTED MANUSCRIPT
10
3.2. Water/steam side
Figure 5 shows a scheme of a cross section of the boiler for the water/steam side. It has
one incoming stream, the feed water (fm& ). There are two outgoing streams: the drain/purge
water or blowdown ( pm& ) and the produced steam leaving the shell (vm& ). The shell space is
separated into two zones by the surface of water. The zone above this surface is called the
upper/steam zone. The other is called the lower/liquid zone. Hence, the mass balance
equations are written following the above hypotheses and the scheme shown in Figure 5.
Feed water temperature is assumed to be constant in a nominal operation, but it is variable
once the system is under control.
In the water side or boiler shell side, water is exposed to the heated surface of tubes.
Around this zone, the temperature is higher and, hence, with a lower density than the rest of
surrounding water. The density differences promote the natural circulation of water elements
that are heated and are lighter, conveying thus, by this way, the heat flux to the surroundings.
Therefore, water moves up and reaches the water surface and there evaporates. The boiling
two-phase mixture flows on the shell side, across the horizontal submerged tube bundle, while
the heating fluid flows inside the tubes. The natural circulation is governed by the density
differences between the mixture within the shell (lower void fraction and higher density) and
the boiling two-phase mixture in the bundle arrangement (higher void and lower density).
Although, the rigorous development of the boiling (pool boiling that considers consider the
two phases clearly defined under water) is outside the scope of the paper, in order to account
for the effective heat transfer due to boiling (much larger than those for simple natural convection
to the liquid), the Cooper pool boiling correlation [17] may be used for calculating the nucleate
pool boiling heat transfer coefficient, although the model does not consider the two phases
clearly defined under water. By taking a surface roughness of the boiling surface of 1 micron,
and applying to water, it results the following correlation to be used:
67.055.012.0 )/()ln4343.0(96.12 AQpph rrnb−−= [20]
The heat flux (Q/A) is in W/m2. For a range of pressures from 2 to 15 bar, and using fuel-
oil with the nominal fuel flow rate, h ranges from 4260 to 7419 W/m2K.
Initially, the model considers that liquid-vapor mixture in the overall system is not in
equilibrium, so the system pressure is not uniform and equal to the saturation pressure
MANUSCRIP
T
ACCEPTED
ACCEPTED MANUSCRIPT
11
corresponding to the mixture temperature. Thus, two pressure values (similar but not equal)
are taken into account.
The presence of steam bubbles below the liquid level in the drum may cause the water
level rapidly shrinks or swells due to collapse or expansion of steam bubbles below the water
level when, for instance, a sudden change in the steam flow rate occurs. This leads to a
change in the level in the sense intuitively reverse to what one would expect through the
transient size in the steam bubbles. Many modeling effort has been addressed to describe the
shrinks-swell phenomenon, due to the mechanics of the natural convection circulation of
water within the steam generator in water-tube boilers. However, in fire-tube boilers, with a
relatively large chamber shell, it may be assumed a complete separation of steam and water
inside the shell, and predict the water level reasonably if only a small amount of steam exists
below the water level because, in opposition to water-tube boilers, the steam bubbles do not
come from a riser where the rising rate of steam in water (calculated from the drift-flux type
equation) determines actual flow rate of steam under the water crossing the water surface to
the steam phase. Indeed, the drum behavior in water-tube boilers when the steam valve is
suddenly opened responds to a transient due the flow rate of the two-phase flow in the riser,
as a consequence of the large/small amount of boil-up from most of the tubes in the boiler.
Thus, for a fire-tube boiler model, it is not required to account for a condensation model of
steam in water under the water surface. Consequently, liquid temperature may be considered
to be equal to the saturation temperature corresponding to the shell pressure (initially, that in
the liquid zone); that is, instantaneous evaporation takes place in the liquid side when the shell
pressure changes.
• Vapor phase (dry steam) in the upper zone (phase +)
Mass balance: +−+++++++ −=ρ+ρ=ρ= vv mmdt
dVV
dt
dV
dt
dm
dt
d&&)( [21]
)(2
3
2 02
32232 ++
++
+++++ =
−
+−+−π≅= lfLlRl
lRllRRRLAV l [22]
dt
ldflf
dt
dllf
dt
dl
dl
dV
dt
dV )()(;)( 0
11
++++
+++
+
+
++
=== [23]
LlRl
lRl
lRlRllRRlRllRlR
lf2
2
3223222
1 22
)(2)3(2)36(
)( ++
++
++++++++
++
−
−
−+−+−−+−−= [24]
MANUSCRIP
T
ACCEPTED
ACCEPTED MANUSCRIPT
12
Energy balance: ++−−+++++++++ −=ρ+ρ=ρ hmhmVdt
duu
dt
dVuV
dt
dvv &&)()( [25]
By considering the steam mass flow rate crossing the water surface as a function of the
pressures difference between phases and a control valve for the steam leaving the boiler:
+++−−+−
+++++++++
ρ−−−=−
=ρ+ρ=ρ
)()()(
)()()( 01
sums
VSvv PPxfCKPPKmm
dt
dlfl
dt
dlfV
dt
d
&&
[26]
where Cs and fs(x) are a conversion factor of units and the inherent characteristic for the steam
control valve, respectively. From Equations (25) and (26), it results:
+++−++−−+
+ +−−= umumhmhmdt
dum vvvv &&&& [27]
( )( )
( )( )
ρ−−−=
λ+−
λ+ρ−
−λ−−λ+
=
+
++++−−−
++
+++
+++++
+++−−−−
+++
)()(
1
)()(
1
sumssVSvpv
v
v
p
sumss
VS
vpv
v
PPPxfCKTCTCm
Cm
TC
TCPPxfCK
TCTCm
CmT
dt
d
&
&
[28]
where it has been made an approach for the last term as +++++ ρ≅− /)( PCCT vp . As λ+ ≈ λ−:
( )
ρ−−−−
ρ= +
++++−−+−−
+++++ )(
)()()(
1
0
sumssVSvp
v
PPPxfCKTCTCPPK
ClfT
dt
d [29]
• Liquid phase (water) in the lower zone (phase -)
)(
)(
−−−
−−−−−−−
=
−−=ρ+ρ=ρ
TPP
mmmdt
dVV
dt
dV
dt
dvpf &&&
[30]
( )( )
+−−−
−−−−
−ρ=
∑=
−−−−+−−
−−−−−−
−++−− 4,3,2
1,
,
0 )()()(
)()())()((
))((
1
jwaterjv
lpffpf
vtotal qTuThPPK
TuThmTuThm
ClfVT
dt
d
&
&&
[31]
)(. dataconstm
mx v
v == −
−− [32]
−−−−−−
− +−==ρ vvlv vxvxvv
)1(;1
[33]
MANUSCRIP
T
ACCEPTED
ACCEPTED MANUSCRIPT
13
)();(;)1( −−−−−−−−−−− ==+−= ThhThhhxhxh vvllvvlv [34]
)();(;)1( −−−−−−−−−−− ==+−= TuuTuuuxuxu vvllvvlv [35]
4. Simplified model
The solution of the model equations is very difficult due to non-linearities and the DAE
nature of the model. Thus, the model will be simplified to numerically solve it, including the
boiler start-up, without consuming a long time. Once started the boiler and achieved the
nominal operating conditions (steady-state), the process must be kept under control in order to
provide the demanded vapor at the set pressure. The static model (without storage terms)
allows to obtain the nominal conditions, by specifying nominal inputs. These conditions must
be matched with those achieved at the end of the start-up of the boiler. The simulation of the
reduced model has been built by Matlab software.
4.1. Fire/gas side
The thermal capacity effect of the combustion gas is neglected taking into account the
rapid chemical combustion process with heat generation rate and a fast heat transfer process,
in such a way that the values of these two terms are quite higher than the energy storage rate
due to the thermal capacity effect of the combustion gas. Therefore, temperature changes are
assumed to take place instantaneously for the flue gas.
• Mass balance
Combustion chamber: .; constVVVmmm Hggairefuel ====+ &&& [36]
Gas pass through a given tube bank, j (j= 2, 3 y 4): .constmg =& [37]
• Energy balance: Heat released to the water
Maximum available: LHVm fuel& [38]
Heat release: LHVmQ fuelwg && η=→ [39]
• Dynamics
The changes in energy of the water and metal are the physical phenomena that dominate
the dynamics of the boiler [6]. For the metal, it will be used an average thermal capacitance
defined as
∑=
ρ=4,3,2
1
,,,,
j
jtpjtjt CVCTM [40]
MANUSCRIP
T
ACCEPTED
ACCEPTED MANUSCRIPT
14
The combustion chamber wall is exposed to very high temperatures. However, the metal
temperature at steady-state condition is close to the steam temperature [18]. In any case, it is
convenient to carry out an energy balance applied to the tubes of combustion chamber and the
different gas passes, as follows:
−= ∑→
j
waterjwgwall qQTdt
dCTM ,&& [41]
)()(1
ln,,
,,
, waterwallwaterwall
waterctext
text
t
text
eq
j
waterj TTTT
heR
R
k
R
Aq −ξ=−
+
−
=∑ & [42]
+⋅π= ∑
=
4
2
,,,2j
jjextjtHHexteq LRnLRA [43]
( )ξ
+=+ξ
⇒−ξ−= →→
wgwaterwallwallwaterwallwgwall
QTTT
dt
dCTMTTQT
dt
dCTM
&& )( [44]
In a cold start-up, wallT (t=0) will be the ambient temperature. In a hot start-up, an
updated temperature that accounts for the cooling, as T(ºC) = Tshut-down – rC × t(h), may be
used, if a cooling rate of rC ºC/h is assumed or determined.
4.2. Water/steam side
Two parts are considered, one for each phase: steam and water.
• Dry steam (phase +)
It is assumed that the liquid phase is a saturated liquid. The model considers that exist a
thermodynamic equilibrium between the liquid and vapor every time, i.e., vapor and liquid
temperatures are the same. Thus, it is not necessary to establish an energy balance for the
vapor phase. This hypothesis simplifies the problem although it remains close to the real case
due to the sensible heat of the vapor is normally low compared to the latent heat. On the other
hand, mass storage has a dynamics much faster than energy storage, because only steam is
involved, and thus mass storage may be ignored when considering temperature dynamics.
+−+−+ =⇒=−= vvvv mmmmmdt
d&&&& 0 [45]
The expression of the volume fraction V+ may be simplified as follows:
LRRLlLAV l2
2
)4(2
π−−≅= +++ � dt
dlRL
dt
dl
dl
dV
dt
dV ++
+
++
== 2 [46]
MANUSCRIP
T
ACCEPTED
ACCEPTED MANUSCRIPT
15
that is very exact if the water level is not far from the middle of the shell.
• Saturated liquid water (phase -)
+−−−−− −−=−−=ρ≈ρ vpfvpf mmmmmmVdt
dV
dt
d&&&&&&)( [47]
dt
dV
dt
dVconstVVVtotal
+−+− −=⇒=+= . [48]
From Equations (46) – (48), using Equation (26) and taking into account that P+ = P-:
Vsumss
VSpf PPxfCKmmldt
dRL ρ−−−=ρ− +− )()(2 && [49]
Rktl R==+ )0( (kR is a known constant corresponding to the initial steady-state level)
)()()()( 0 TFxfCKPPxfCKm ssVSVsum
ssVSv =ρ−=+
& [50]
since )();( TTPP ρ=ρ= , and
),()()()()()()( * ++−−++++−− =ρ≈ρ+ρ=ρ lTFlVTlVTlVTVtotal [51]
the global energy balance results in:
−
+λ−−
ρ≅
∑=
LossesHeatq
TFxfCKTTCm
CVT
dt
d
jwaterj
ssVSffpf
vtotal
4,3,2
1,
0, )()()((1
&
&
[52]
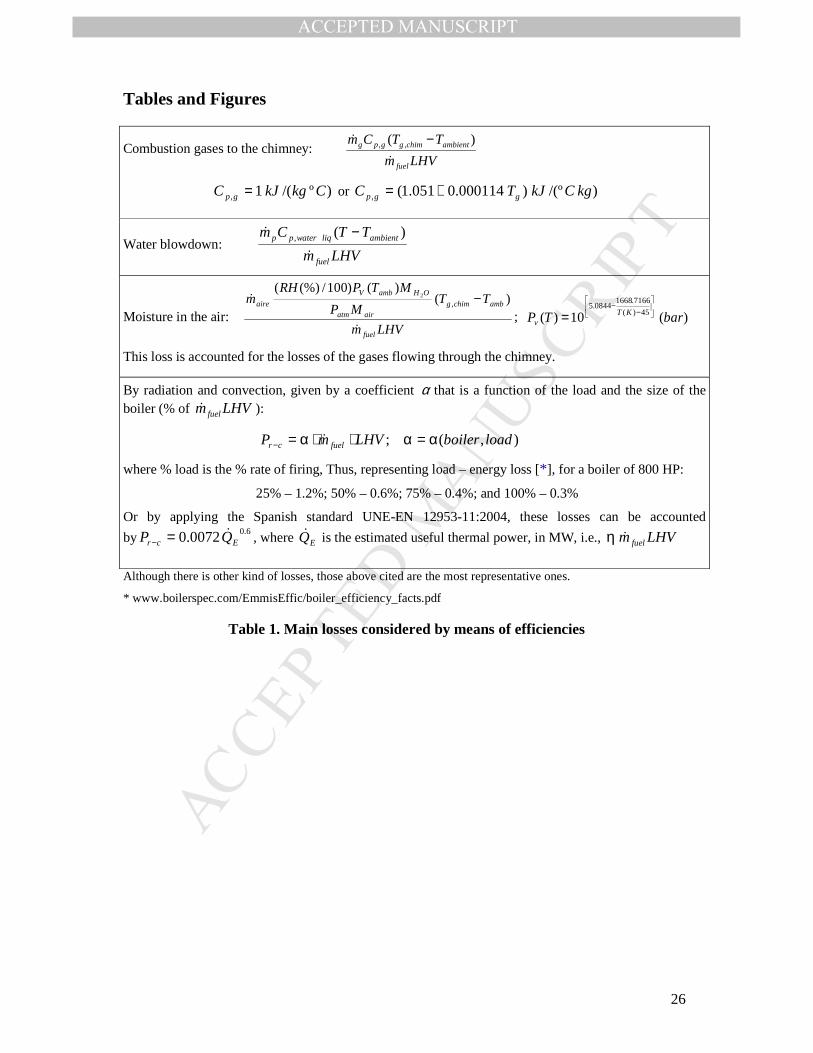
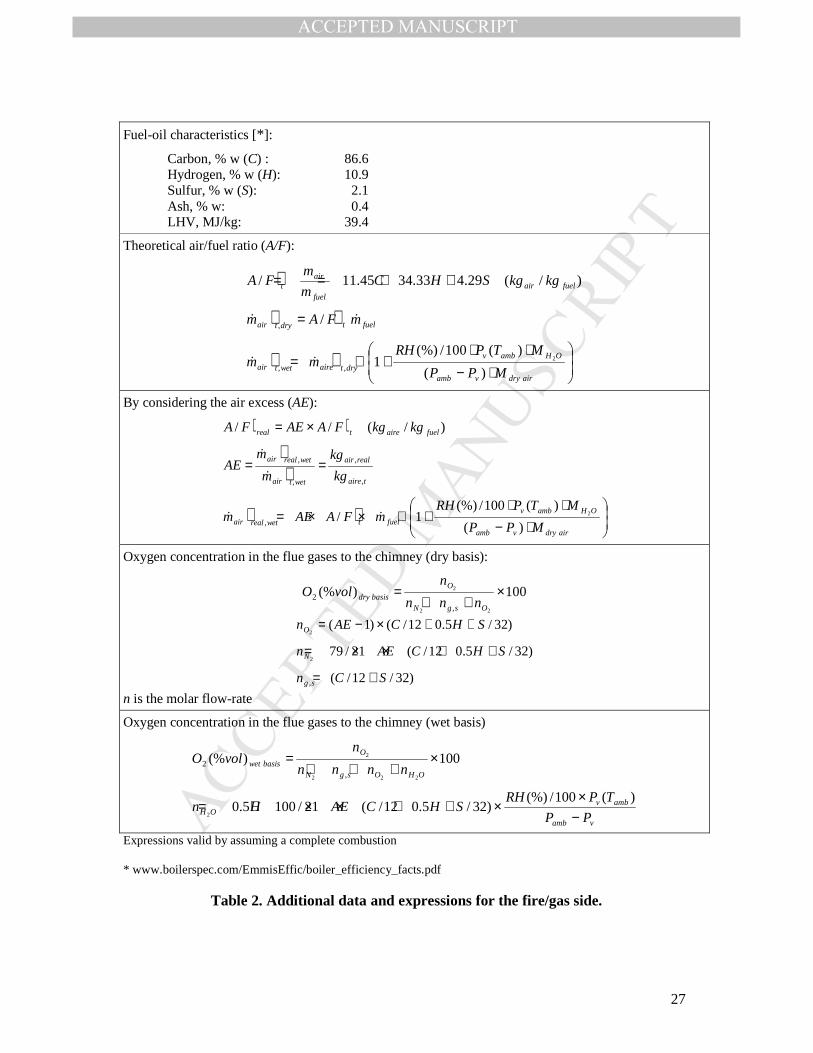
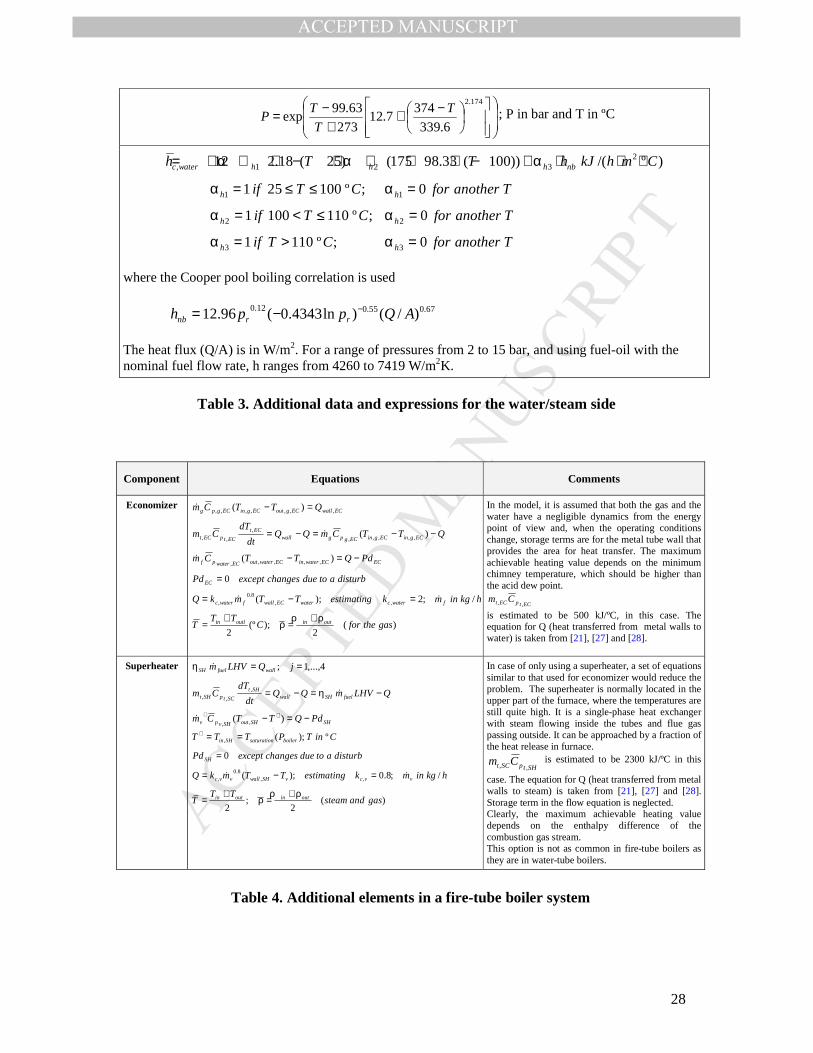
Table 1 exhibits the main energy/heat losses considered in the model expressed by
efficiencies. Tables 2 and 3 include some additional equations and data for the fire/gas side
and water/steam side, respectively, in order to solve the model.
4.3. Boiler start-up
It is assumed that the combustion begins just in the moment in which the fuel and air enter
the boiler furnace. The fire/gas side is assumed to have a negligible dynamics, so only
water/steam side is considered to be different respect to the model above described. With
regarding to previous sections, the main change affects to the heat transfer in the water side,
because the film coefficient for heat transfer is changing through the time. Therefore, this
parameter must be upgraded (thus continuously increasing) as the boiler heats up, and it is
shown in Table 3, where an ambient temperature of 20ºC and representative values normally
used for natural convection and boiling [19] are considered. The film coefficient depends on
MANUSCRIP
T
ACCEPTED
ACCEPTED MANUSCRIPT
16
latent heat, vapor density and temperature but, in line with that pointed out by other
researchers [20], the value is so high that the final value is not too much important to calculate
the wall temperature at a heat flux due to the corresponding resistance to heat transfer is very
low. According to this, the approach for the convective film coefficient at nominal conditions
(steady-state regime) has been taken.
For a hot start-up, i.e., when the temperature of shell is still high, it could be used the last
temperature if the shut-down occurred not much time ago (a few minutes). A normal value for
the cooling rate (rC) of a big boiler is 20ºC/h, which helps to estimate the initial temperature.
The operation must be started with the air venting valve open and the steam valve closed.
Next, the air venting valve will must be closed. This operation is not an easy task to model.
Thus, when a boiler starts-up the majority of the gas contained will be air, not steam. In every
moment, the boiler pressure will be the sum of that due to the air and the steam. This latter
will be increasingly higher as the temperature and evaporation increase, thus decreasing the
air pressure due to the air leaving the boiler through the venting and, hence, the shell pressure
will be approached to the saturation. This process is very complex of solving, so some
simplifications are adopted.
• Air - dry steam in the upper zone (phase +)
It is assumed that the air is vented by the vapor that is being generated during the start-up
and heat-up processes, although without losing steam. In any time, thermodynamic
equilibrium is considered between the lower and upper zones. When the venting valve is
open, f air(x) = 1. The steam valve is closed while the air venting valve is open. Likewise, the
steam valve should not be opened until achieving the operating pressure and temperature set.
)(00)(
)(11)(
1
1
upstartventingclosedxfIf
upstartventingopenxfIfair
air
−=β⇒⇒=
−=β⇒⇒=
o
o
)(10)(
)(00)(
2
2
nomupstartserviceonsteamxfIf
upstartserviceofoutsteamxfIfs
s
→−=β⇒⇒>
−=β⇒⇒=
o
o
pairvvvair mmmmmdt
dm
dt
d,21211 )1()1()( &&& β−⋅β−⋅β⋅β−−=+β= +−+ [53]
;;0)(01 21−+−+ =−=⇒=⇒−=β=β vvvvv mmmm
dt
dmupstartandIf &&&& [54]
pairair mmdt
dand ,)( &−= [55]
MANUSCRIP
T
ACCEPTED
ACCEPTED MANUSCRIPT
17
)0()0(
)0(=
+
=
+
===tg
airamb
tg
airairair TR
MVP
TR
MVPtmwith
0;0)(00 ,21 ==⇒−=β=β pairaire mmupstartandIf & [56]
−+−+ =−== vvvvv mmmmdt
dm &&&& ;0 [57]
+−+−+ =⇒=−=⇒→−=β=β vvvv mmmmmdt
dnomupstartandIf &&&& 0)(01 12 [58]
( )
),()()()(
)()()()()(
1
,
TmFxfCKV
mP
VM
TRmTPxfCK
PTPTPxfCKPPxfCKm
airairairair
VSair
ambair
gairairairairVS
airambairvairairair
VSaatmairairair
VSpair
=
−+=
ρ−+=ρ−=
++−
&
[59]
where C air and f air(x) are a conversion factor of units and the inherent characteristic for the
air venting valve, respectively. Likewise, Equation (50) is used for the steam, with a
constraint for 0: ≥− sumsum PPP .
The above expressions allow to obtain the mass flow-rates through the air venting valve
and the steam control valve. The logic sequence implies that first β1 must be 1 and β2 must be
0, and finally, once the boiler is providing steam to consumers, β1 must be 0 and β2 must be 1.
Thus,
pairvv mmmmdt
d,12 &&& ⋅β−⋅β−= +−+ [60]
Using equation (46):
While ( )dt
dT
dT
TdF
R
MVTF
dt
d
R
MVT
TPdt
d
R
MVm
g
OH
g
OHv
g
OHv
)()()(,0 2
22222
+++− ==
==β & [61]
• Saturated liquid in the lower zone (phase -)
−−−−− −−=ρ≈ρ vpf mmmVdt
dV
dt
d&&&)( [62]
dt
dV
dt
dV +−
−= ⇒ dt
dT
dT
TdF
R
MVmml
dt
dRL
g
OHpf ⋅⋅−−=ρ−
++− )(
2 22&& [63]
Rktl R==+ )0( (kR is a known constant corresponding to the initial steady-state level)
The global energy balance including the two zones is:

MANUSCRIP
T
ACCEPTED
ACCEPTED MANUSCRIPT
18
−−
+−
λ+ρ
β−β≅−
=
−
+−+−−
∑))()()(,()(
))()((
)()()(
)1(
1
4,3,2
1
,
2
21
2
ThThTmFxfCK
qThThm
dT
TdF
R
MVClVT
Tdt
d
aaairairairair
VS
j
waterjfff
g
OHv
&&
+−
λ+ρ
β−β−+ ∑=
−+
−+−−
4,3,2
1
,
2
21 ))()(()(
)()(
)1)(1(
2 j
waterjfff
g
OHv
qThThm
dT
TdF
R
MVClVT
&&
λ−+−
ρββ−+ ∑
=
−− )()())()(()1(
0
4
1
,21 TFxfCKqThThm
CVss
VS
j
waterjfffvtotal
&&
LossesHeatCV vtotalρ
+ 1 [64]
where it has been used Equation (51).
The water specific volume depends on the temperature [21]:
)/(1082.5001.01 393.19 kgmTv −−− ×+==ρ
So, by rearranging the energy balance equation, it turns out:
LossesHeatCV
TFxfCKqThThmCV
ThThTmFxfCK
qThThm
dT
TdF
R
MVClVT
Tdt
d
vtotal
ssVS
j
waterjconvfffvtotal
aaairairairair
VS
j
waterjfff
g
OHv
ρ+
λ−+−
ρββ−+
−β−
+−
λ+ρ
β−≅
∑
∑
=
−−
−−
=
−−
+−+−−
1
)()())()(()1(
))()()(,()(
))()((
)()()(
)1(
0
4
1
,,21
11
4,3,2
1
,
2
2
2
&&
&&
[65]
Thus, all the energy transferred by the gases will be used in heating the entering water and
to increase the temperature (and pressure) in the water side of the boiler until achieving the
wished value, just before opening the steam control valve, and the first term of the energy
balance is applied. When this situation is reached, the equations of the model corresponding
to the nominal operation will be valid again, and then it must be used the second term just as
it was shown in the previous section. Obviously, heat losses must be always accounted for.
Some additional elements may be included in the model as an economizer, superheater,
attemperator, energy use of blowdown and degasifier in order to complete the model as parts
of the fire-tube boiler. The modeling proposed for these components is shown in Table 4, in
order to condense the extent of this paper. In this table, it is considered that the energy content
MANUSCRIP
T
ACCEPTED
ACCEPTED MANUSCRIPT
19
of the water blowdown from the boiler may be recovered by flashing the blowdown in an
expansion tank and then using the generated saturated steam in a thermal degasifier as a heat
transfer fluid. Besides, the liquid water of the tank’s lower zone may be used for preheating
the water feeding through a heat exchanger.
5. A simulated case-study
The model proposed uses some assumptions to reduce the computational complexity but
still providing realistic results. Thus, it is necessary to check the accuracy of the predictions
against direct experimental data or literature references. For the verification of the rightness of
the model, at least qualitative results should be agree well with experimental values or
previously published values. The objective of the case-study simulation is to estimate the
suitability of the model qualitatively. There is a lack of published results of modeling and
experimental tests carried out in a fire-tube boiler, but finally some references have been
taken from the literature so as to contrast the model results.
The overall calculation scheme for the complete model is shown in Figure 6. The fire-
tube boiler model has been simulated using Matlab. Before running the simulation, all the
constants and parameters such as boiler geometry and configuration including valves and the
possible additional elements, or heating value and moisture content of the fuel and ambient
conditions, are set. The simulation starts once the boiler is ready and so the fuel and air are
entered as well as the feed water, following the model. When the convergence is achieved and
wished steady state is matched, some changes can be carried out to get the dynamic behaviour
of the boiler while a new steady state may be reached.
In order to validate the performance of the modeling approach, some running tests are
performed under various situations from a case study. Next, some simulation results will be
obtained and then compared with test results from the literature. As an example and case-
study, an 800 HP fire-tube boiler has been selected for testing the model. Table 5 shows the
data of the real boiler chosen for carrying the simulation and Table 6 includes the steady-state
operating conditions of the simulated boiler.
To make possible a comparison with available data the additional elements considered in
Table 4 are not taken into account, and thus only the boiler itself has been simulated: fire/gas
side and water/steam side.

MANUSCRIP
T
ACCEPTED
ACCEPTED MANUSCRIPT
20
The open loop transient response of the chosen boiler is simulated when a pulse change is
made to one of the two more relevant factors, but being the oxygen present in the flue gas
under control: the heating rate (fuel flow-rate) and the steam demand (steam flow-rate).
As aforementioned, the main input variables are fuel, air, feed water flow-rates and steam
valve opening, as well as fuel, air and feed water temperatures. Reaction of steam pressure,
steam flow-rate, water/steam side temperature and water volume will be illustrated.
The simulation process first runs until reaching a steady state. Then, for some time, the
steady state is represented, and at a given moment, fuel-oil flow-rate or steam valve opening
(and, hence, steam flow-rate) is suddenly increased (by a pulse or step change), and that value
is then maintained for some time. During this time, output variables are changing. Next, the
situation is replaced at its original state by performing another step opposite to the first one,
so as to output variables tend to their original steady state values.
Figure 7 gives the evolution curves of some main parameters in the water/steam of the
boiler for a pulse change in the heating rate (fuel flow-rate) as above described. The air flow
rate for combustion is manipulated in such a way that oxygen concentration at the outlet of
chimney to be about 4%vol. When the fuel-oil feed rate increases suddenly, more heat is
absorbed by the transfer walls, so the pressure of the steam inside the boiler increases
correspondingly as well as the steam flow-rate. The change in steam temperature is related to
heat transfer and steam flow rate. When the fuel-oil rate decreases suddenly, the opposite
phenomenon is observed.
Figure 8 gives the evolution curves of the same parameters shown in previous figure, but
changing the steam demand (steam flow-rate) by varying the steam valve opening. In this
case, the fuel flow-rate and the air flow rate are kept constant.
The results in Figures 7 – 8 show the dynamic behaviour of some boiler output variables,
and there is a good qualitative agreement between the model and the experimental data from
literature [22-24], except for the swell phenomenon not accounted for this kind of boiler as
aforementioned (± 3-4 cm measured variation). Huang and Ko [22] used a half-ton fire-tube
shell boiler installed in a laboratory for the experiment in their study. They pre-filtered data
before system identification since the testing signals could be corrupted by internal and
external disturbances or noises. In the present study, no noise has been considered. The tests
in [22] were run at six different operating conditions with the fuel flow-rate ranging from 14.6
to 37.9 kg/h; the water flow-rate ranging from 181 to 465 kg/hr; the steam pressure ranging
MANUSCRIP
T
ACCEPTED
ACCEPTED MANUSCRIPT
21
from 3.8 to 7.3 kg/cm2 gage. Sørensen at al [23] as well as Karstensen et al [24] used a boiler
applied for the experiments is an Aalborg Industries boiler type MissionTM OB, a bottom-fired
fire-tube boiler for light and heavy fuel oil. Sørensen at al [23] carried out a step-input on fuel
flow-rate from 80 to 230 kg/h during about 400 seconds. They got an almost linear increase in
the steam pressure from 6 to 8 bar, without a significant dead time. Besides, the steam flow-
rate increased from 750 to 1250 kg/h, in a nearly linear way. Karstensen et al [24] carried out
tests at 50 percent load with pressure at 7 bars. When a fuel flow-rate step was made the
steam pressure increased from 6 to 8 bar in 150 seconds and when a steam flow-rate was
changed by closing the steam valve, the steam pressure increased from 5.5 to 8.5 bar for about
700 seconds.
Rodriguez Vasquez et al [25] carried out an experiment with step-signal input in fuel
valve opening recording the output studied (steam pressure) with the aim of obtaining the
dynamic behaviour of the boiler regarding these two variables. They collected data from a
laboratory-scale fire-tube boiler. The main characteristics of this boiler are a total length of
2.65 m, body diameter of 1.10m height of 1.60 m, operation pressure of 250 kPa, generated
steam flow-rate of 80 kg/h and three passes of combustion gases passes. Figure 9 illustrates a
similar qualitative behaviour respect this previous work. During this step experiment, the feed
water must be fed into the boiler to match the production of steam so as to keep the level
under control. As it can be seen, firstly the steam pressure increases quickly, but the system is
self regulating and over the time the outputs achieve a new steady state, just as in the study of
these researchers.
Figure 10 illustrates the boiler performance during the start-up from the beginning until
reaching a steady state close to that shown in the Table 6. In this case, the final boiler
pressure is 14.67 bar, and the steam flow-rate is 3650 kg/h. The first stage is a boiler blown
with air, so the air flow-rate firstly increases when flame is established in boiler, for a fuel
flow-rate of 0.22 kg/s, but then it always goes down progressively in order to get an oxygen
concentration of about 4%vol. The results for the start-up simulation are close to those shown
by Krüger et al [26].
6. Conclusions
A complete dynamic model of a full-scale fire-tube boiler has been developed based on
the mass, energy, and momentum balances together with constitutional equations. Two parts
are distinguished in fire-tube boilers: the fire/gas side and the water/steam side. A first
MANUSCRIP
T
ACCEPTED
ACCEPTED MANUSCRIPT
22
nonlinear physical model has been presented and after reduced to shorten the computational
time, but providing reasonable results. The boiler start-up has been also taken into account.
Thus, it may allow to simulate the process as well as to design a multivariable controller.
Simulation is useful both for training and assisting in on-line decisions. A case study has been
simulated using an 800 HP fire-tube boiler and dynamic performances predicted by the model
are in good qualitative agreement with data taken from the literature.
The proposed modeling may be used as an effective way of undertaking a comparison
between the fire-tube boiler performances when running with different fuels, especially when
considering the firing of a new fuel in given equipment. Another application may be the tests
facilities used in research projects dealing with oxy-combustion process, since the model may
be easily adapted to those operating conditions. Anyway, continued efforts are required to
improve the model and to provide verification using more experimental data.
References
[1] Aydin, O., Erhan Boke, Y. An experimental study on carbon monoxide emission reduction at a fire tube water heater. Appl. Therm. Eng. 30 (2010) 2658-2662
[2] Behbahani-nia, A., Bagheri, M., Bahrampoury, R. Optimization of fire tube heat recovery steam generators for cogeneration plants through genetic algorithm. Appl. Therm. Eng. 30 (2010) 2378-2385
[3] Colonna, P, van Putten, H. Dynamic modeling of steam power cycles. Part I—Modeling paradigm and validation, Appl. Therm. Eng. 27 (2007) 467–480
[4] de Mello, F.P. Boiler models for system dynamic performance studies. IEEE Trans Power Syst. 6 (1991) 66–74.
[5] Adam E.J, Marchetti, L. Dynamic simulation of large boilers with natural recirculation. Comput Chem Eng 23 (1999) 1031–1040.
[6] Astrom, K.J., Bell, R.D. Drum-boiler dynamics. Automatica 36 (2000) 363–78.
[7] Kim, H., Choi, S. A model on water level dynamics in natural circulation drum-type boilers. Int. Commun. Heat Mass 32 (2005) 786–796
[8] Coelho, P.J., Novo, P.A., Carvalho, M.G. Modelling of a Utility Boiler Using Parallel Computing. J. Supercomput. 13 (1999) 211-232
[9] Westbrook,C.K., Mizobuchi, Y., Poinsot, T.J., Smith, P.J., Warnatz, J. Computational combustion. P. Combust. Inst. 30 (2005) 125–157
[10] Gómez, A, Fueyo, N., Díez, L.I. Modelling and simulation of fluid flow and heat transfer in the convective zone of a power-generation boiler. Appl. Therm. Eng. 28 (2008) 532–546
[11] Pezo, M., Stevanovic, V.D., Stevanovic, Z. A two-dimensional model of the kettle reboiler shell side thermal-hydraulics. Int. J. Heat Mass Tran. 49 (2006) 1214–1224
MANUSCRIP
T
ACCEPTED
ACCEPTED MANUSCRIPT
23
[12] Habibi, A., Merci, B., Heynderickx, G.J. Impact of radiation models in CFD simulations of steam cracking furnaces. Comput. Chem. Eng. 31 (2007) 1389–1406
[13] Weng, C.K., Ray, A., Dai, X. Modeling of power plant dynamics and uncertainties for robust control synthesis, Appl. Math. Model. 20 (1996) 501–512.
[14] Flynn, M.E., O’Malley, M.J. A Drum Boiler Model for Long Term Power System Dynamic Simulation. IEEE T. Power Syst. 14 (1999) 209–217
[15] Hottel, H.C., Sarofim, A.F. Radiative Transfer. Mc-Graw-Hill, New York (USA) 1967.
[16] Talmor, E. Combustion Hot Spot Analysis for Fired Process Heaters. Gulf Publishing, Houston, TX (USA) 1982
[17] Cooper, M.G. Heat flow rates in saturated nucleate pool boiling - A wide-ranging correlation using reduced properties. Adv. Heat Tran. 16 (1984) 158–239
[18] Chaibakhsh, A., Ghaffari, A., Moosavian, S.A.A. A simulated model for a once-through boiler by parameter adjustment based on genetic algorithms. Simul. Model. Pract. Th. 15 (2007) 1029–1051
[19] Incropera F. P., DeWitt, D.P. Fundamentals of Heat and Mass Transfer, 5th Edition. Wiley, NJ (USA) 2002
[20] Wei J. J., Yu, B., Wang, H.S.. Heat transfer mechanisms in vapor mushroom region of saturated nucleate pool boiling. Int. J. Heat Fluid Fl. 24 (2003) 210–222
[21] Babcock-Wilcox. Steam: Its Generation and Use. The Babcock & Wilcox Company, 40th Edition, New York (USA) 1992
[22] Huang, B.J., Ko, P.Y. A system dynamics model of fire-tube shell boiler. J Dyn Syst-T ASME 116 (1994) 745-754
[23] Sørensen, K., Karstensen, C.M.S., Condra, T., Houbak, N. Modelling and simulating fire tube boiler performance. Proceedings from SIMS 2003 - 44th Conference on Simulation and Modeling on September 18 -19, Session 2b, Lecture 7, 2003 in Västerås, Sweden (ISBN 91-631-4716-5)
[24] Karstensen, C.M.S., Sørensen, K. Modelling of a one pass smoke tube boiler. Proceedings of SIMS 2004 - 45th Conference on Simulation and Modeling on September 23–24, 2004. 365-372. Copenhagen, Denmark (ISBN 87-7475-316 9)
[25] Rodriguez Vasquez, J.R., Rivas Perez, R., Sotomayor Moriano, J., Peran Gonzalez, J.R. System identification of steam pressure in a fire-tube boiler. Comput. Chem. Eng. 32 (2008) 2839–2848
[26] Krüger, K., Franke, R., Rode, M.. Optimization of boiler start-up using a nonlinear boiler model and hard constraints. Energy 29 (2004) 2239–2251
[27] Mahlia T.M.I., Abdulmuin, M.Z., Alamsyah, T.M.I., Mukhlishien, D. Dynamic modeling and simulation of a palm wastes boiler. Renew. Energ. 28 (2003) 1235–1256
[28] Lu, S., Hogg, B.W. Dynamic nonlinear modelling of power plant by physical principles and neural networks. Int. J. Elec. Power 22 (2000) 67–78
[29] Truelove, J.S. Thermal and Hydraulic Design of Heat Exchangers, Furnace and Combustion Chamber, Heat Exchanger Design Handbook. Hemisphere Publishing Corporation, New York (USA) 1983
MANUSCRIP
T
ACCEPTED
ACCEPTED MANUSCRIPT
24
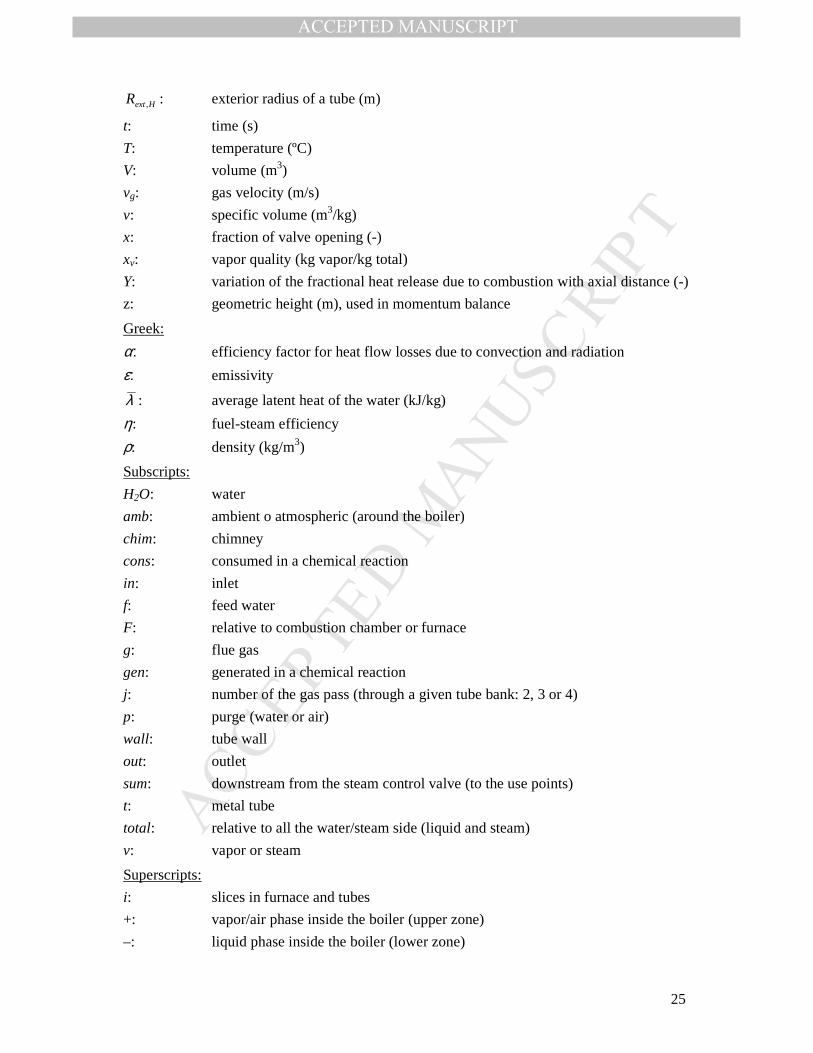
Nomenclature
A: transfer surface (m2)
A/F)t: air/fuel stoichiometric ratio (kg/kg)
A/F)real: air/fuel real ratio (kg/kg)
C: carbon content (weight fraction)
Cp: specific heat at constant pressure (kJ/(kg ºC))
Cv: specific heat at constant volume (kJ/(kg ºC))
CTM: global specific heat of the metal section (combustion chamber and tubes) (J/ºC)
e : average wall thickness of metal tube (m)
AE: air excess (fraction)
f(x): inherent characteristic of the control valve (linear: f(x) : x)
fc: condensed water fraction recycled (fraction)
RH(%): relative humidity in the inlet air (%)
h: specific enthalpy (kJ/kg)
waterch , : average convective heat transfer coefficient of the liquid water (kJ/(m2 ºC s))
Hburner: energy supplied by the burner fan to balance the mechanical energy loss (m)
Hfan: energy supplied by the flue-gas fan to balance the mechanical energy loss (m)
tk : average thermal conductivity of the metal (kJ/(m ºC s))
KVS: flow coefficient of the control valve
LHV: lower heat value (MJ/kg : 103 kJ/kg)
l: boiler height (horizontal cylinder) (m)
L: boiler length (m)
m : mass (kg)
) :,drytairm& mass flow rate of the theoretical dry air (kg/s)
) :,wettairm& mass flow rate of the theoretical wet air (kg/s)
:fuelm& mass flow rate of the fuel (kg/s)
:gm& mass flow rate of the flue gas (kg/s)
M: molecular weight (kg/kmol)
jtn , : number of tubes in the gas pass through a given tube bank, j
Pd: power losses (kW)
PV(T): vapor pressure at temperature T (bar)
P: pressure (bar)
:wgQ →& heat released to the water (kJ/s)
∑j
waterjq ,& heat gained by water (kJ/s)
Rg: perfect gases constant (0.082 (atm l)/(mol K))
MANUSCRIP
T
ACCEPTED
ACCEPTED MANUSCRIPT
25
HextR , : exterior radius of a tube (m)
t: time (s)
T: temperature (ºC)
V: volume (m3)
vg: gas velocity (m/s)
v: specific volume (m3/kg)
x: fraction of valve opening (-)
xv: vapor quality (kg vapor/kg total)
Y: variation of the fractional heat release due to combustion with axial distance (-)
z: geometric height (m), used in momentum balance
Greek:
α: efficiency factor for heat flow losses due to convection and radiation
ε: emissivity
λ : average latent heat of the water (kJ/kg)
η: fuel-steam efficiency
ρ: density (kg/m3)
Subscripts:
H2O: water
amb: ambient o atmospheric (around the boiler)
chim: chimney
cons: consumed in a chemical reaction
in: inlet
f: feed water
F: relative to combustion chamber or furnace
g: flue gas
gen: generated in a chemical reaction
j: number of the gas pass (through a given tube bank: 2, 3 or 4)
p: purge (water or air)
wall: tube wall
out: outlet
sum: downstream from the steam control valve (to the use points)
t: metal tube
total: relative to all the water/steam side (liquid and steam)
v: vapor or steam
Superscripts:
i: slices in furnace and tubes
+: vapor/air phase inside the boiler (upper zone)
–: liquid phase inside the boiler (lower zone)
MANUSCRIP
T
ACCEPTED
ACCEPTED MANUSCRIPT
26
Tables and Figures
Combustion gases to the chimney: LHVm
TTCm
fuel
ambientchimggpg
&
& )( ,, −
)º/(1, CkgkJC gp = or )/(º)000114.0051.1(, kgCkJTC ggp +=
Water blowdown: LHVm
TTCm
fuel
ambientliqwaterpp
&
& )(, −
Moisture in the air: LHVm
TTMP
MTPRHm
fuel
ambchimgairatm
OHambV
aire
&
& )()()100/(%)(
,2 −
; )(10)( 45)(
7166.16680844.5
barTP KTv
−−
=
This loss is accounted for the losses of the gases flowing through the chimney.
By radiation and convection, given by a coefficient α that is a function of the load and the size of the boiler (% of LHVm fuel& ):
),(; loadboilerLHVmP fuelcr α=α⋅⋅α=− &
where % load is the % rate of firing, Thus, representing load – energy loss [* ], for a boiler of 800 HP:
25% – 1.2%; 50% – 0.6%; 75% – 0.4%; and 100% – 0.3%
Or by applying the Spanish standard UNE-EN 12953-11:2004, these losses can be accounted
by6.00072.0 Ecr QP &=− , where EQ& is the estimated useful thermal power, in MW, i.e., LHVm fuel&η
Although there is other kind of losses, those above cited are the most representative ones.
* www.boilerspec.com/EmmisEffic/boiler_efficiency_facts.pdf
Table 1. Main losses considered by means of efficiencies
MANUSCRIP
T
ACCEPTED
ACCEPTED MANUSCRIPT
27
Fuel-oil characteristics [* ]:
Carbon, % w (C) : 86.6 Hydrogen, % w (H): 10.9 Sulfur, % w (S): 2.1 Ash, % w: 0.4 LHV, MJ/kg: 39.4
Theoretical air/fuel ratio (A/F):
)
) )
) )
⋅−⋅⋅
+⋅=
=
++==
airdryvamb
OHambv
drytairewettair
fueltdrytair
fuelairfuel
airt
MPP
MTPRHmm
mFAm
kgkgSHCm
mFA
)(
)(100/(%)1
/
)/(29.433.3445.11/
2
,,
,
&&
&&
By considering the air excess (AE):
) )))
) )
⋅−⋅⋅
+⋅××=
==
×=
airdryvamb
OHambv
fueltwetrealair
taire
realair
wettair
wetrealair
fuelairetreal
MPP
MTPRHmFAAEm
kg
kg
m
mAE
kgkgFAAEFA
)(
)(100/(%)1/
)/(//
2
,
,
,
,
,
&&
&
&
Oxygen concentration in the flue gases to the chimney (dry basis):
100)(%22
2
,2 ×
++=
OsgN
O
basisdry nnn
nvolO
)32/12/(
)32/5.012/(21/79
)32/5.012/()1(
,
2
2
SCn
SHCAEn
SHCAEn
sg
N
O
+=
++××=
++×−=
n is the molar flow-rate
Oxygen concentration in the flue gases to the chimney (wet basis)
vamb
ambvOH
OHOsgN
O
basiswet
PP
TPRHSHCAEHn
nnnn
nvolO
−×
×++××+=
×+++
=
)(100/(%))32/5.012/(21/1005.0
100)(%
2
222
2
,2
Expressions valid by assuming a complete combustion
* www.boilerspec.com/EmmisEffic/boiler_efficiency_facts.pdf
Table 2. Additional data and expressions for the fire/gas side.
MANUSCRIP
T
ACCEPTED
ACCEPTED MANUSCRIPT
28
−++
−=174.2
6.339
3747.12
273
63.99exp
T
T
TP ; P in bar and T in ºC
TanotherforCTif
TanotherforCTif
TanotherforCTif
CmhkJhTTh
hh
hh
hh
nbhhhwaterc
0;º1101
0;º1101001
0;º100251
)º/())100(33.98175()25(18.212
33
22
11
2321,
=α>=α
=α≤<=α
=α≤≤=α
⋅⋅⋅α+−⋅+⋅α+−⋅⋅α+=
where the Cooper pool boiling correlation is used
67.055.012.0 )/()ln4343.0(96.12 AQpph rrnb−−=
The heat flux (Q/A) is in W/m2. For a range of pressures from 2 to 15 bar, and using fuel-oil with the nominal fuel flow rate, h ranges from 4260 to 7419 W/m2K.
Table 3. Additional data and expressions for the water/steam side
Component Equations Comments
Economizer
)(2
);(º2
/;2);(
0
)(
)(
)(
,,8.0
,
,,,,,
,,,,,
,
,,
,,,,,,,
gastheforCTT
T
hkginmkestimatingTTmkQ
disturbatoduechangesexceptPd
PdQTTCm
QTTCmQQdt
dTCm
QTTCm
outinoutlin
fwatercwaterECwallfwaterc
EC
ECECwaterinECwateroutECwaterpf
ECginECginECgpgwallECt
ECtpECt
ECwallECgoutECginECgpg
ρ+ρ=ρ
+=
=−=
=
−=−
−−=−=
=−
&&
&
&
&
In the model, it is assumed that both the gas and the water have a negligible dynamics from the energy point of view and, when the operating conditions change, storage terms are for the metal tube wall that provides the area for heat transfer. The maximum achievable heating value depends on the minimum chimney temperature, which should be higher than the acid dew point.
ECtpECt Cm,,
is estimated to be 500 kJ/ºC, in this case. The equation for Q (heat transferred from metal walls to water) is taken from [21], [27] and [28].
Superheater
SHSHoutSHvpv
fuelSHwallSHt
SCtpSHt
wallfuelSH
PdQTTCm
QLHVmQQdt
dTCm
jQLHVm
−=−
−η=−=
==η
++ )(
4,...,1;
,,
,
,,
&
&
&
)(2
;2
/;8.0);(
0
º);(
,,8.0
,
,
gasandsteamTT
T
hkginmkestimatingTTmkQ
disturbatoduechangesexceptPd
CinTPTTT
outinoutin
vvcvSHwallvvc
SH
boilersaturationSHin
ρ+ρ=ρ
+=
=−=
=
==+
&&
In case of only using a superheater, a set of equations similar to that used for economizer would reduce the problem. The superheater is normally located in the upper part of the furnace, where the temperatures are still quite high. It is a single-phase heat exchanger with steam flowing inside the tubes and flue gas passing outside. It can be approached by a fraction of the heat release in furnace.
SHtpSCt Cm,,
is estimated to be 2300 kJ/ºC in this
case. The equation for Q (heat transferred from metal walls to steam) is taken from [21], [27] and [28]. Storage term in the flow equation is neglected. Clearly, the maximum achievable heating value depends on the enthalpy difference of the combustion gas stream. This option is not as common in fire-tube boilers as they are in water-tube boilers.
Table 4. Additional elements in a fire-tube boiler system

MANUSCRIP
T
ACCEPTED
ACCEPTED MANUSCRIPT
29
Attemperator
0
)(
)(
,)(
,,,
,,,
,
,,,,
,,
,
≈
≈
⋅−λ+
−=
⋅+
λ−+=
+=
+=
+
+
+
+
+
ATT
fspray
sprayfPATToutSHvp
ATToutSHoutSHvpv
spray
SHvpsprayv
spraysprayfPspraySHoutSHvpv
ATTout
sprayspraySHoutvoutATTout
sprayvATTout
Pd
TT
TCTC
TTCmm
orCmm
mTCmTCmT
hmhmhm
mmm
&
&
&&
&&&
&&&
&&&
The attemperation carried out by a water spray is a method to control the temperature for superheated steam, by atomizing liquid water that is evaporated inside. The water spray is modulated by a suitable valve. Because the attemperator has a relatively small volume, the mass and heat storages inside that are negligible. The value for Cpv,SH is evaluated at the average temperature between Tout,SC (at the attemperator inlet) and Tout,ATT (at the attemperator outlet). The spray is liquid water at temperature of feeding water, which is atomized and evaporated to obtain a wished superheated steam temperature. The sprayed water flow-rate will be the manipulated variable in order to control a wished outlet temperature for the steam.
Blowdown
heat recovery
Stage 1
Simple flash
)(;)(
0
:
:
,,
,,,,
,,
flashflashflashflashpLp
p
flashV
flash
flashflashLflashLflashVflashVpp
flashLflashVp
PTTTTC
m
m
disturbatoduechangeexceptPd
PdhmhmhmbalanceEnergy
mmmbalanceMass
=λ−
=
=
+⋅+⋅=⋅
+=
&
&
&&&
&&&
The blowdown water from the boiler can be addressed to an expansion tank where flash vapor is produced if the pressure is diminished. The minimum pressure at the outlet of the boiler can be set in 3 bar, so the pressure of the flash steam is of 1.5 bar, i.e., the water will expand from the boiler pressure to 1.5 bar. The tank normally has a small volume so the dynamics will be negligible relative to its heating (the value of mt,EC×Cpt,EC is quite lower than that of the boiler tubes and furnace). Besides, it is assumed that the blowdown enters the flash separator at pressure and temperature of the boiler, and the steam and water are in equilibrium at the temperature corresponding to the pressure at which the blowdown is expanded.
Blowdown
heat recovery
Stage 2
Water-water heat exchanger
)()()1(
)()(
,,,deg,,
,,,deg,,
,deg,,,,,
inupmakeoutupmakeLpupmakeflashLpflashLPd
inupmakeoutupmakeLpupmakeICflashLpflashL
ICoutupmakeupmakeLflashLinupmakeupmakeflashLflashL
TTCmTTCmf
TTCmPdTTCm
Pdhmhmhmhm
IC −−−
−−−
−−−−
−⋅⋅=−⋅⋅⋅−
−⋅⋅=−−⋅⋅
+⋅+⋅=⋅+⋅
&&
&&
&&&&
fupmake
upmake
flashflashLPd
inupmake
Lpupmake
flashLpflashLPd
inupmakeoutupmake
mm
m
TTmfT
Cm
TTCmfTT
IC
IC
&&
&
&
&
&
=
−⋅⋅−+≅
≅⋅
−⋅⋅⋅−+=
−
−−
−−−
)()1(
)()1(
deg,,
,
deg,,,,
The liquid water from the flash separator may be used for preheating the water feeding by a heat exchanger before going into the degasifier. In this case, it will be assumed that the dynamics of the heat exchanger walls can be neglected. The operation may be set so as to have a temperature of water discharge from the flash stage of 5ºC more than that of the water input, which is an input variable. Heat losses have been expressed as a fraction of the enthalpy difference for the heat fluid through the factor, fPdIC, which is a configuration parameter (input data of the model).
Degasifier
0
)()10(
)(
,
,,.,.,,.
,
,,.,.,,.
,,,,
deg,,
≈
=
++λ+⋅⋅+−⋅⋅+⋅⋅
=
=++
λ+⋅⋅+⋅⋅+⋅⋅=
⋅=⋅+⋅+⋅
+=++
−
−
−+
−−
−
−−−
−−
−
DEG
fupmake
flashVcondupmake
ICoutupmakeVpflashVvLpcondICoutupmakeLpupmake
flashVcondupmake
ICoutupmakeVpflashVcondLpcondICoutupmakeLpupmakef
ffflashVflashVcondcondICoutupmakeupmake
gasesfflashVcondupmake
Pd
mm
mmm
TCmTCmTCm
mmm
TCmTCmTCmT
hmhmhmhm
mmmmm
&&
&&&
&&&
&&&
&&&
&&&&
&&&&&
In the thermal degasifier, the dissolved gases in water are removed, especially oxygen and carbon dioxide that corrode the metal in the water side of the boiler. From all the phenomena occurring in the degasifier, only those related directly to the energy balance have been taken into account. The streams entering this equipment are the condensed water collected from those points in which saturated steam has been used, the make-up water and the steam coming from the flash separator. The outlet streams are the removed gases (neglected in the energy balance) and the feed water of the boiler. No heat losses to the ambient have been assumed. Although the model does not include the condensed vapor unit, it can be assigned a value of condensed water flow rate as a function of the feed water of the boiler. Condensed water is collected in a tank and from this it flows to the degasifier. As an approach, it may be assumed that condensed water has a temperature around 10-15 ºC less than operating temperature inside the boiler.
Table 4. Additional elements in a fire-tube boiler system (cont.)

MANUSCRIP
T
ACCEPTED
ACCEPTED MANUSCRIPT
30
Fire side Water side
Aeq (m2) 325.16 353.96
Boiler radius (m) 1.480
Length (m) 6
Max. operating pressure (bar) 20
Max. steam flow-rate (kg/h) 12602
Chimney temperature (ºC) boilerchimg PT ⋅+= 78.40.149,
ηFS (@1.7 bar) (%) 89.8
)7.1(35,0)25(027,0)3]([(%)(%) basis-dryout,2)7,1(@ −⋅−−⋅+−⋅−η=η boilerairbarFSFS PTOCo (*)
where: [O2]out, dry-basis: 0 - 3% v � Co = 0.33 [O2]out, dry-basis: 3 y 6% v � Co = 0.43 [O2]out, dry-basis: 6 y 8% v � Co = 0.60 [O2]out, dry-basis: 8 y 10% v � Co = 1.50 [O2]out, dry-basis: > 10% v � Co = 2.00
Tair (inlet) in ºC, and Pboiler (operating pressure) in bar.
CTM (kJ/ºC) 6503.2
ρt (kg/m3) 8000
Cp,t (kJ/(kg ºC)) 0.5
tk (kJ/(hm ºC)) 170
e (mm) 5
vaporVSK (**) 800
airVSK 5.0
Reference: www.boilerspec.com (many data have been taken from this Web link) (*) Fuel-To-Steam Efficiency, ηFS, is the fraction of available energy used to generate steam. Between 25 and 100% of the boiler load, the efficiency does not change significantly (about 0.2%), so ηFS will be considered as independent of the boiler load. This efficiency is (**) the maximum pressure drop (for an operating pressure of 21 bars) is 18.2 bars 10,)( ≤≤= xxxf ; x is the
valve opening
Table 5. Data of an 800 HP fire-tube boiler (horizontal packaged four-pass firetube
boiler)
),,,,( pressurevaporboilerTmfuelf ambairFS &=η
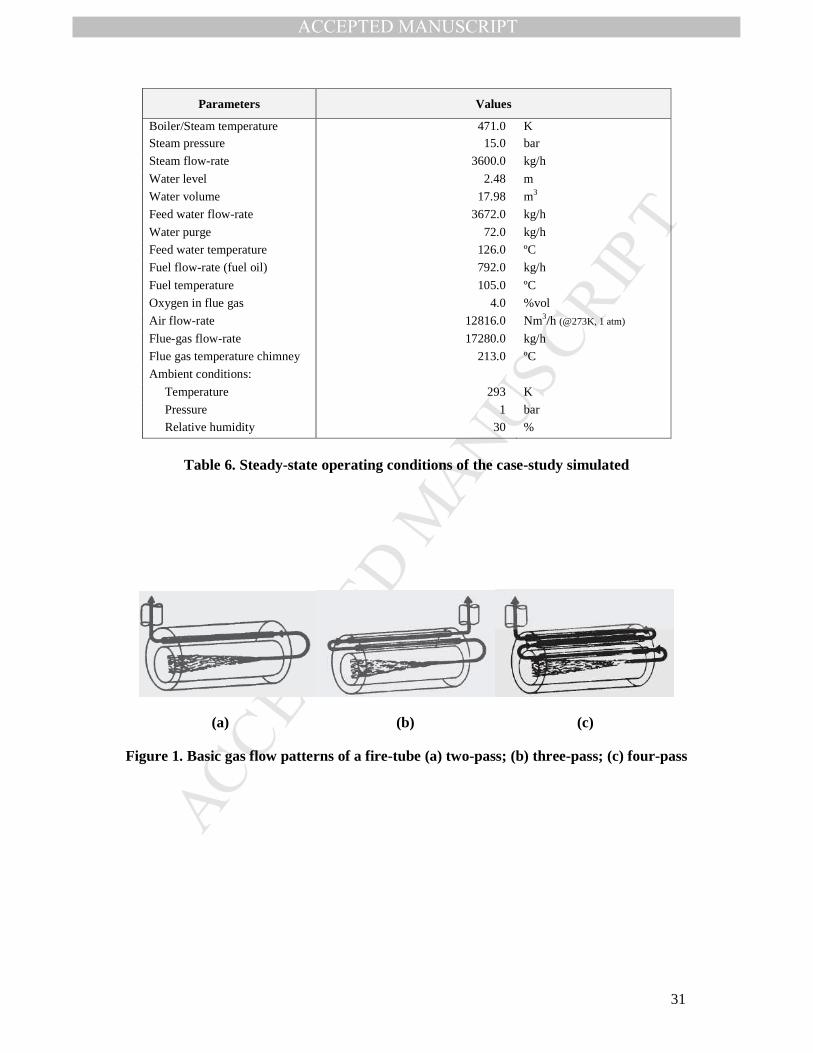
MANUSCRIP
T
ACCEPTED
ACCEPTED MANUSCRIPT
31
Parameters Values
Boiler/Steam temperature 471.0 K Steam pressure 15.0 bar
Steam flow-rate 3600.0 kg/h
Water level 2.48 m
Water volume 17.98 m3
Feed water flow-rate 3672.0 kg/h
Water purge 72.0 kg/h
Feed water temperature 126.0 ºC
Fuel flow-rate (fuel oil) 792.0 kg/h
Fuel temperature 105.0 ºC
Oxygen in flue gas 4.0 %vol
Air flow-rate 12816.0 Nm3/h (@273K, 1 atm)
Flue-gas flow-rate 17280.0 kg/h
Flue gas temperature chimney 213.0 ºC
Ambient conditions:
Temperature 293 K
Pressure 1 bar
Relative humidity 30 %
Table 6. Steady-state operating conditions of the case-study simulated
(a) (b) (c)
Figure 1. Basic gas flow patterns of a fire-tube (a) two-pass; (b) three-pass; (c) four-pass

MANUSCRIP
T
ACCEPTED
ACCEPTED MANUSCRIPT
32
Figure 2. Schematic representation of a typical three-pass fire-tube boiler [29]
Tg,N-1
gm&
Water (Liquid-vapor mixture)
ATEMP
Tube wall F
qcon,H,water qcon,1,water
qrad,F
Furnace
Flame Tg,F
Tube wall 1
qrad,1
Pass 1
qcon,1
qcon,N,water
Tube wall N
qrad,N
Pass Ngm&
Tg,1
gm&ECONOM. CHIM
Tg,N
gm&
Tg,EC
gm&
Tg,CH
gm&
Fuel-oilpreheating
λ,vaporm&
fuel
fuel
T
m&
air
air
T
m&ambfuel Tm ,&
ambg Tm ,&
Dry steam
fspray Tm ,&
vvv pTm ,,&
f
f
T
m&
qcon,N
p
p
T
m&
qcon,F
SUPERH.qSH
Figure 3. Scheme for the modeling of a fire-tube boiler
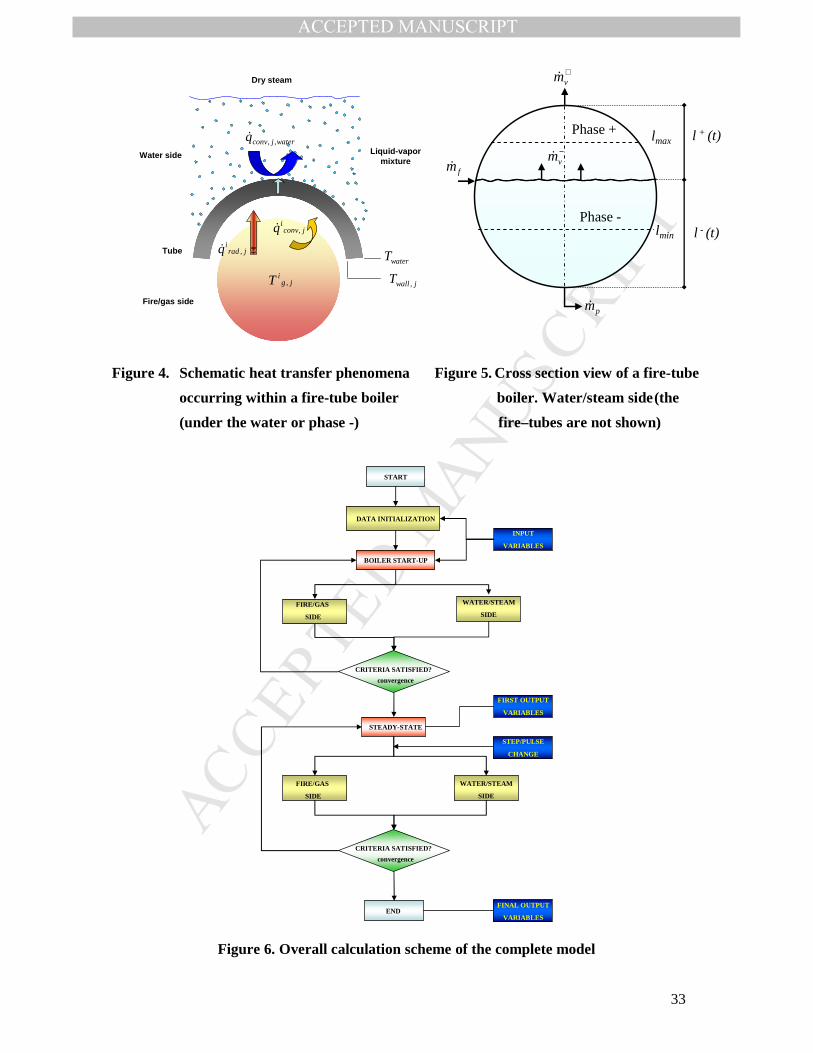
MANUSCRIP
T
ACCEPTED
ACCEPTED MANUSCRIPT
33
Figure 4. Schematic heat transfer phenomena Figure 5. Cross section view of a fire-tube
occurring within a fire-tube boiler boiler. Water/steam side (the
(under the water or phase -) fire–tubes are not shown)
Figure 6. Overall calculation scheme of the complete model
START
DATA INITIALIZATION
BOILER START-UP
STEADY-STATE
FIRE/GAS
SIDE
WATER/STEAM
SIDE
END
CRITERIA SATISFIED?
convergence
WATER/STEAM
SIDE
FIRE/GAS
SIDE
INPUT
VARIABLES
FIRST OUTPUT
VARIABLES
STEP/PULSE
CHANGE
FINAL OUTPUT
VARIABLES
CRITERIA SATISFIED?
convergence
jradiq ,&
jconviq ,&
waterjconvq ,,&
jgiT ,
waterT
jwallT ,
Water side
Tube
Fire/gas side
Dry steam
Liquid-vapormixture
l - (t)
Phase +
Phase -
lmax
+vm&
−vm&
lmin
fm&
pm&
l + (t)
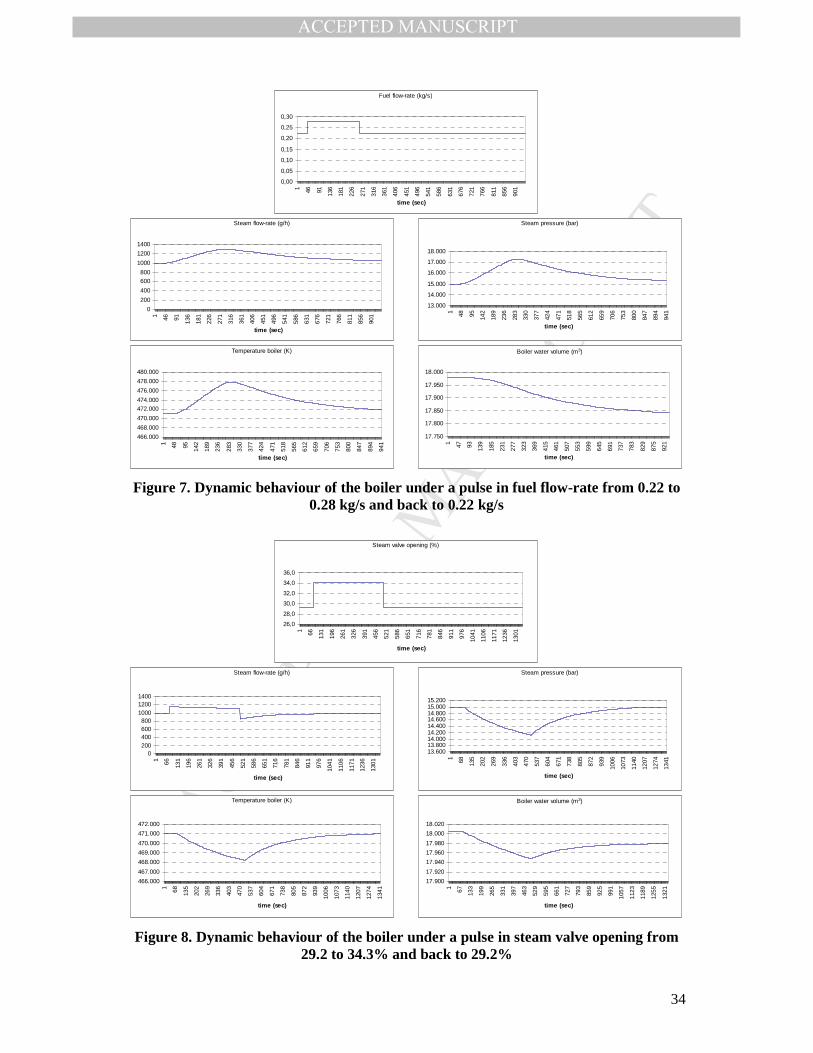
MANUSCRIP
T
ACCEPTED
ACCEPTED MANUSCRIPT
34
Fuel flow-rate (kg/s)
0,00
0,05
0,10
0,15
0,20
0,25
0,30
1 46 91 136
181
226
271
316
361
406
451
496
541
586
631
676
721
766
811
856
901
time (sec)
Steam flow-rate (g/h)
0
200
400
600800
1000
1200
1400
1 46 91 136
181
226
271
316
361
406
451
496
541
586
631
676
721
766
811
856
901
time (sec)
Steam pressure (bar)
13.000
14.000
15.000
16.000
17.000
18.000
1 48 95 142
189
236
283
330
377
424
471
518
565
612
659
706
753
800
847
894
941
time (sec)
Temperature boiler (K)
466.000
468.000
470.000
472.000474.000
476.000
478.000
480.000
1 48 95 142
189
236
283
330
377
424
471
518
565
612
659
706
753
800
847
894
941
time (sec)
Boiler water volume (m3)
17.750
17.800
17.850
17.900
17.950
18.000
1 47 93 139
185
231
277
323
369
415
461
507
553
599
645
691
737
783
829
875
921
time (sec)
Figure 7. Dynamic behaviour of the boiler under a pulse in fuel flow-rate from 0.22 to 0.28 kg/s and back to 0.22 kg/s
Steam valve opening (%)
26,0
28,0
30,0
32,0
34,0
36,0
1 66 131
196
261
326
391
456
521
586
651
716
781
846
911
976
1041
1106
1171
1236
1301
time (sec)
Steam flow-rate (g/h)
0200400600800
100012001400
1 66 131
196
261
326
391
456
521
586
651
716
781
846
911
976
1041
1106
1171
1236
1301
time (sec)
Steam pressure (bar)
13.60013.80014.00014.20014.40014.60014.80015.00015.200
1 68 135
202
269
336
403
470
537
604
671
738
805
872
939
1006
1073
1140
1207
1274
1341
time (sec)
Temperature boiler (K)
466.000
467.000
468.000
469.000
470.000
471.000
472.000
1 68 135
202
269
336
403
470
537
604
671
738
805
872
939
1006
1073
1140
1207
1274
1341
time (sec)
Boiler water volume (m3)
17.900
17.920
17.940
17.960
17.980
18.000
18.020
1 67 133
199
265
331
397
463
529
595
661
727
793
859
925
991
1057
1123
1189
1255
1321
time (sec)
Figure 8. Dynamic behaviour of the boiler under a pulse in steam valve opening from 29.2 to 34.3% and back to 29.2%

MANUSCRIP
T
ACCEPTED
ACCEPTED MANUSCRIPT
35
Fuel flow-rate (kg/s)
0,21
0,23
0,25
0,27
0,29
1
137
273
409
545
681
817
953
1089
1225
1361
1497
1633
1769
1905
2041
2177
2313
2449
2585
2721
2857
time (sec)
Steam pressure (bar)
10.000
12.000
14.000
16.000
18.000
20.000
22.000
1
117
233
349
465
581
697
813
929
1045
1161
1277
1393
1509
1625
1741
1857
1973
2089
2205
2321
time (sec)
Steam flow-rate (g/h)
600
800
1000
1200
1400
1600
1
115
229
343
457
571
685
799
913
1027
1141
1255
1369
1483
1597
1711
1825
1939
2053
2167
2281
time (sec)
Temperature boiler (K)
460.000
465.000
470.000
475.000
480.000
485.000
490.000
1
119
237
355
473
591
709
827
945
1063
1181
1299
1417
1535
1653
1771
1889
2007
2125
2243
2361
time (sec)
Figure 9. Dynamic behaviour of the boiler under a step in fuel flow-rate from 0.22 to 0.28 kg/s
Temperature boiler (K)
0
100.000
200.000
300.000
400.000
500.000
198
294
390
502
598
694
790
902
998
1094
1206
1302
1398
1510
1606
1702
1798
1894
2006
time (sec)
Steam pressure (mbar)
0
5000
10000
15000
20000
198
294
390
502
598
694
790
902
998
1094
1206
1302
1398
1510
1606
1702
1798
1894
2006
time (sec)
Steam flow-rate (kg/h)
00,2
0,4
0,6
0,8
1
1,2
198
278
374
454
550
646
726
822
902
998
1094
1174
1270
1366
1446
1542
1622
1718
1798
1894
1974
time (sec)
Air flow-rate (Nm3/h)
0
5000
10000
15000
20000
198
278
374
454
550
646
726
822
902
998
1094
1174
1270
1366
1446
1542
1622
1718
1798
1894
1974
time (sec)
Figure 10. Dynamic behaviour of the boiler during the start-up initiated at t=0
MANUSCRIP
T
ACCEPTED
ACCEPTED MANUSCRIPT
Highlights
• A dynamic model has been developed for the analysis of boiler performance.
• The mathematical model is based on the first principles.
• The model gives the dynamic performance during nominal operation and the
start-up.
• The model proposed is useful to assist plant engineers and for training operators.
• A case study of an 800 HP fire-tube boiler was simulated using pulse and step
changes.