Geographic Information System (GIS) What is GIS? - Connect ...
Upload
khangminh22Category
view
3download
0
CHAPTER 1
GIS DATABASE
Supporting Report 1

Chapter 1 GIS Database Supporting Report 1
CHAPTER 1 GIS DATABASE
This study involves all kinds of data on natural conditions (groundwater resources, geology,
topography, meteorology, etc.); socio-economic conditions (population, administrative division,
land use; etc.); water use (wells distribution, water demand, existing water services etc.); and
groundwater contamination, especially arsenic contamination. These data were collected from
various sources with different formats, however, most of the data has the feature of geographic
information.
Characteristics of the geographic information are usually presented as maps, and the
interrelation between different data has to be clarified by spatial distribution-based integration
and analysis.
To perform this kind of integration and analysis efficiently, the Geographic Information System
(GIS) has been developing in recent years as an independent technique. Many GIS software was
developed so that spatial information analysis involving display, query, transformation,
extraction and integration, can be performed promptly by computer.
The GIS has been built in this study for the following purposes:
Analysis of existing geographic information and creation of Base Map
Analysis of arsenic contamination situation
Support for other components in the study
The GIS in this study is also expected to improve the ability of DPHE, the counterpart agency,
in management of groundwater resources.
1-1

Chapter 1 GIS Database Supporting Report 1
1.1 Components of GIS The following concept chart shows the outline of the GIS constructed in this study. The GIS
consists of 3 main portions: a GIS database, GIS software and hardware.
GIS
Software Database Hardware
BaseMap Well Inventory Water Use Lithofacies
Compared with software and hardware, the specifications of which are attached in the appendix,
the database is the most important portion in the GIS, and the database in this study consists of
four (4) sub-databases:
1.1.1 Base Map Database The database is used for management and maintenance of fundamental information on natural
and socio-economic conditions relevant to this study. The database contains the following
location and shape information: administrative boundaries, topography, geology, rivers and
lakes, roads, urban areas, land use, location of meteorological observation stations, location of
JICA test wells, and so on.
The attribute data attached to these location and shape files included the area for administrative
unit up to Mouza level, population data from the previous census and predication, rainfall and
evaporation records, land use patterns, soil classification, lithofacies, and so on.
1.1.2 Well Inventory Well inventory is mainly created on the basis of the DPHE Well Register (WR). The results of
the 300 well survey in Phase I and II of this study, and the result of the well screening survey in
the supplementary survey were also contained in the well inventory. Moreover, well log data
and the water quality analysis results from previous surveys were also included in the database.
1.1.3 Simulation Data Base1 The database contains data relevant to the estimation of groundwater withdrawal for irrigation
and domestic water use, such as the paddy field ratio, population density and infiltration index
for each soil type in each mesh of the groundwater simulation model domain.
1-2

Chapter 1 GIS Database Supporting Report 1
1.1.4 Simulation Data Base 2 The database contains lithofacies data for each mesh of the same model domain as simulation
database 1.
1.2 Materials for GIS Database 1.2.1 Source Data for Base Map The map that is referred to as the “Base Map” contains fundamental information relevant to
natural and socio-economic information such as administration boundaries, roads, and rivers,
lakes, etc. Most kinds of thematic maps were created by overlaying the survey result onto the
Base Map. Therefore, the accuracy of thematic maps is restrained by the Base Map.
The accuracy of the Base Map depends on two factors: the source map and processing process.
The accuracy of the processing process can be ensured by a proper digitizing procedure and
strict quality control. However, nothing can be done to increase the accuracy of the source data.
The 1:50,000 scale Thana map created by LGED, is used as the source data. The Thana map
was published in 1994, as the result of an UNDP project (project number: ILO PROJECT BGD
and 89/041), and is believed as the most accurate map in Bangladesh now. The main data
sources and production process of the Thana map are as follows:
1989 to 1990 spot images
1983 to 1984 aerial photographs
Topographic maps
Thana maps
BBS
Field checking.
Since most data for the Thana map were collected about 10 years ago, it is beyond the capacity
of the Thana map to contain the change of the features within the past 10 years, such as the
change in administration boundary as the result of the re-division of administrative units, land
development, roads construction, and so on.
By comparing the Mouza names on the Thana map and the latest list from the Land Use Office,
more than a 10% difference was revealed. And actually the agreement between the Thana map
and BBS population census is also not so good as expected. Therefore, this Thana map has to be
considered a little out of date for the Base Map in this study.
However, no new map in Bangladesh has been published with a scale larger than that of the
Thana map. Although a newer map, which can respond to change of subsequent administration
classification reorganization etc. is in progress in Mouza unit, several more years are believed
necessary for its completion.
1-3

Chapter 1 GIS Database Supporting Report 1
Nevertheless, by comparison of the Thana map with the land satellite image of 2000, it was
confirmed that the main roads, swamps and rivers in the LGED Thana map are fundamentally in
agreement with the satellite image.
Therefore, the Thana map was used for creating files of the Base Map, such as administrative
boundaries, main urban areas, roads, rivers, lakes and ponds.
1.2.2 Data for Well Inventory In 18 DPHE Thana offices of the three districts, there is a Well Registers (WR) involving all
DPHE wells in the study area. The data in the WR was taken as the main portion of the well
inventory.
1) History and Characteristic of WR
The creation of WR was in the beginning of 1970’s in most Thanas. The data of wells created
far before the creation of WR is also included, and the date of well construction were as detail
as day.
WR is supposed just for the registration of a new well, but not for well and groundwater
management, because no data could found concerning the water level and quality monitoring.
Even the data about use conditions is absent from the WR, that is, there is no information in WR
for identifying if the well is still in use not. WR mainly consists of items on location, depth,
construction date, cost sharing, shape or size of platform, and so on.
2) Identification of Well Location The only address in WR is for indicating well location. Therefore, it is impossible to plot
accurately the wells onto the Base Map. The address for most wells in WR is as accurate as the
unit of village.
A big problem was encountered in the creation of the well inventory while matching WR data
into the Base Map, because the address system used in WR is quite different from the address
system of the LGED Thana map.
Mouzas were used as the minimum administration unit in previously published maps, and are
being used in current map preparation in Bangladesh. However, a Mouza is not common unit
for address identifying at least in the study area. Instead, villages or Paras (colony of the
residence contained in village) are used as convenient address units by local people and DPHE
staff.
For more than half of the total wells in WR, there is no difficulty in matching villages or Paras
into Mouzas because the pronunciation or spelling of them is quite similar. On the hand, for the
rest of the wells, the precise matching is actually impossible because of the completely different
pronunciation or spelling between WR and Thana map.
1-4

Chapter 1 GIS Database Supporting Report 1
As a result, the accuracy of well location identification for the well inventory database could not
be perfectly ensured, although all possible methods have been tried, such as to collect and make
use of the village list from the Assistance Land Office, or to check the villages one by one with
the help of DPHE Thana office staff.
3) Renewal of the Data
There is only one copy of the WR kept in the DPHE Thana office, and the data was written in
by hand. This situation impedes the renewal of data. It is not clear how or how many times the
WR has been updated within the approximately 30 years since WR was created. However, it is
believed that WR has not been renewed for a long time, and the renewal is very hard work in the
present situation.
Consequently, any changes carried out in the administrative units would render well locations
undeterminable. It is obvious that the data in WR are losing their availability unless the
inspiration was carried out on the basis of the well inventory created in this study.
Although, the renewal and/or restructure of WR are necessary to make it meet the needs of well
and groundwater management, WR played a great role as the basic data for the well inventory.
In spite of the problem of the minimum address unit, it is believed that the well location
identification at union level is accurate enough for groundwater use analysis, and analysis at this
level is believed as the most detailed one in the study area up to this study.
1.2.3 Data for Land Use Map The latest land use map is created using land satellite images taken by landsat No.5 in February
2000. The 1/50,000 scale SOB topography map was used for geometric compensation, and the
1992 to 1994 LGED land use map was used for the sample extraction of land use patterns.
1.2.4 Data for Geological Map The geological section and other figures for deep stratum were created on the basis of the survey
results such as core boring and geographical prospecting in this study. DPHE and BWDB well
log data also were used in lithofacies analysis.
On the other hand, the surface geological map is created using the data of the 1/1,000,000 scale
geology map from BGS.
1.2.5 Data for Soil Type Classification Soil can be classified by suing various criteria like the type of original rocks, the color of soils,
the climate and topography zoning, and so on. In this study, however, the soil classification was
carried out for the calculation of the recharge rate from rainfall to aquifer, and the infiltration
1-5

Chapter 1 GIS Database Supporting Report 1
rate from farmland; therefore, soil grain size is taken as the main criteria for the classification.
1/125,000 SRDI soil distribution map was used as the source data.
1.2.6 Demographic-statistics Data Demographic-statistics data is based on the population census of BBS (Bangladesh Bureau of
Statistics). The BBS population census was performed 3 times before this study in 1974, 1981
and 1991. The latest census was carried out during the study period in 2001, however, the result
has not published even at the Thana level. Therefore, the reliable population data in
administrative unit smaller than district is the census of 1991. For the 2001’s census, BBS has
published the preliminary report, in which the 2001 population at the district level is available.
Similar to WR, the problem was encountered when matching the population data to the Base
Map. Although the administrative unit for the population census in BBS agrees with the LGED
Thana map at the Thana level, more than 10% of union and Mouza are expressed in different
ways between these two kinds of data sources.
For the data with different address expression between the two sources, the matching was
carried out under the principle that the total population for each Thana has to be the same as it is
in BBS, and for those administrative units that were divided in different ways or presented by
different address, the population data were matched by taking the spelling and area of the
address as the judgment factors. As a result, all the population data was linked to the Base Map,
and the deviation was reduced to less than 10% in union level.
1.2.7 Meteorological Data Two kinds of meteorological data, rainfall and evapotranspiration, are essentially important for
hydrological analysis and groundwater simulation. BMD (Bangladesh Meteorology
Department) and BWDB (Bangladesh Water Development Board) carry out meteorological
observation respectively in the study area.
Besides the three Thanas, where the district offices are located, there are 5 more meteorological
observation stations in the Thanas of Sailkupa and Kaliganj in Jhenaidah District, and
Chuagachha, Sharsha and Keshabpur in Jessore District. Data covering a period of 11-years
(1988 to 1999) were collected, and the details of the data quality are as mentioned in the Main
Report.
1.2.8 Urban Area Water Service Out of the nine (9) Pourashavas in the study area, 7 have developed urban water services. The
sketch maps of water supply pipeline and other relevant facilities were collected from all the
Pourashavas. Georeferencing was carried out using control points selected from main roads and
rivers, for lack of direction indicator, scale and other necessary features in several sketch maps.
1-6

Chapter 1 GIS Database Supporting Report 1
1.3 Thematic Map 1.3.1 Location of the Study Area Figure 1.3.1 shows the location of the Study Area. The Study Area is located in southwestern
Bangladesh, covering 18 Thanas in the 3 districts of Chuadanga, Jhenaidah and Jessore.
1.3.2 Thematic Map on Natural Condition 1) Topography Map Topography around the study area is shown in Figure 1.3.2. Although the study area is basically
a flat plain, the elevation gently goes down from northwest to southwest with an average
gradient of about 1.6m against 10km2.
2) Geology map Figure 1.3.3 shows the geology map. There are 3 main sediments in the study area. Deltaic silt
is the most popular one covering about 82% in area. Next to deltaic silt are fine grain sediments
of clay and peat, covering about 16%. The remaining 12% is deltaic sand, which is distributed
in the northern part of the study area along rivers.
3) Surface Water System Figure 1.3.4 shows rivers, lakes and ponds in the Study Area.
4) Rainfall Distribution Figure 1.3.5 shows the average monthly rainfall distribution pattern in the study area. The
rainfall changes largely according to the seasons. In the dry season, which continues about half
a year from November to next April, the total rainfall is only about 10% of the yearly rainfall. In
contrast, the monthly rainfall in the rainy season from May to October is equivalent to and/or
more than the total rainfall during the whole dry season.
Table 1.3.1 shows the average monthly rainfall at each meteorological observation station.
Table 1.3.1 Average Monthly Rainfall
Station Jan Feb Mar Apr May Jun Jul Agu Sept Oct Nov DecJessore 17 35 55 61 158 313 294 265 241 115 40 11 Keshabpur 9 43 57 37 199 361 372 364 238 181 26 7 Benapole 9 43 57 37 199 361 372 364 238 181 26 7 Chuadanga 16 27 23 40 131 255 329 257 313 106 24 13 Jhenaidah 15 55 72 60 266 305 345 196 262 120 30 16 Kaliganj 9 43 57 37 199 361 372 364 238 181 26 7 Chuagachha 16 27 23 40 131 255 329 257 313 106 24 13 Sailkupa 8 30 28 60 221 287 342 264 285 102 39 18 Average 12 38 47 47 188 312 344 291 266 137 29 12
1-7

Chapter 1 GIS Database Supporting Report 1
5) Soil Classification Figure 1.3.6 shows the soil classification map. Silty clay loam is the most popular soil type all
over the study area. The second one is clayey soil distributed in the area from the southern to
northwest part. The roughest soil type is sandy loam, covering little area at the southern and the
southwest part of the study area.
Table 1.3.2 shows the area and percentage of each soil type. The permeability of soil changes
with the soil type, and then has an influence on the irrigation amount and groundwater recharge.
Table 1.3.2 Soil Classification by Grain Size Soil Type Area (km2) Percentage
Clay 670.3 11.8% Silty clay 957.7 16.9% Silt loam and silty clay 103.9 1.8% Silty clay loam 2542.5 44.9% Silt loam and Silty clay loam 50.9 0.9% Silt loam 1007.6 17.8% Silty loam 102.4 1.8% Sandy loam 231.2 4.1% Total 5666.6 100%
1.3.3 Thematic Maps on Social Economy Condition 1) Administrative Boundary
Figure1.3.7 shows the administrative boundary to union level.
Table 1.3.3 shows the fundamental information of each Thana.
Table 1.3.3 Basic Information of the Study Area
Thana Area (km2) Union # Mouza # Pop1991 Pop2001 Chuadanga District
Alamdanga 366.2 14 127 245,497 298,477 Chuadanga 305.97 8 141 223,247 273,157 Damurhuda 305.79 7 77 213,291 262,357 Jibannagar 196.35 4 70 125,102 153,391
Jhenaidah District Harinakunda 230.11 8 78 163,172 181,316 Jhenaidah 456.91 18 268 346,982 385,565 Kaliganj 312.32 12 194 219,950 244,408 Kotchandpur 164.24 6 81 108,769 120,864 Moheshpur 417.82 13 156 265,274 294,772 Sailkupa 375.92 15 182 294,808 327,590
Jessore District Abhoynagar 238.84 8 89 205,588 238,229 Bagherpara 267.4 9 156 170,707 197,810 Chuagachha 265.63 11 101 198,412 229,914 Jessore 425.26 16 242 503,208 583,102 Jhikargachha 298.87 11 162 238,478 276,341 Keshabpur 254.94 9 143 201,709 233,734 Manirampur 453.08 17 246 330,914 383,453 Sharsha 330.93 11 135 257,266 298,112
Total 5666.58 197 2648 4,312,748 4,982,593
1-8

Chapter 1 GIS Database Supporting Report 1
2) Road Map Figure 1.3.8 shows the road map.
3) Population Distribution Figure 1.3.9 shows the population density of each Thana in 2001, as well as a graph of
population change for each district in each census year.
Because the result of the 2001 population census has not been published, the population of each
Thana in 2001 was estimated using the following formula: Pop2001=Pop1991×Population increase ratio of the district with the estimated Thana in
it
In the above formula, Pop1991 was obtained from BBS data, and the population increase ratio
of district was calculated from the 1991 census and 2001 population census preliminary report.
Table 1.3.4 shows the population of each census year in the 3 districts, and the average yearly
population increase ratio between 1991 and 2001.
Table 1.3.4 Population in Each Census Year District 1974 1981 1991 2001 Ratio91-01 Chuadanga 56.2 67.7 80.8 98.7 2.0% Jhenaidah 117.5 130.8 139.9 155.5 1.1% Jessore 140 170.6 210.6 244.1 1.5% Unit: 10,000 persons
In the study area, Jessore Thana has the biggest population (583 thousands) and the highest
population density (more than 1,300 person/km2), where the biggest city Jessore is located. A
small population density appears in Bagherpara Thana of Jessore District and Moheshpur Thana
of Jhenaidah District. However, the small population density is also over 700 persons/km2.
In total, the population density in the northern part is relatively small, less than 900
perssons/km2. However, most Thanas in the southern part have a population density larger than
900 persons/km2, except Manirampur Thana in Jessore District.
Figures 1.3.10 to 1.3.12 shows the graphs of population change for each Thana, and 2001’s
population density of each union in Chuadanga, Jhenaidah and Jessore Districts, respectively.
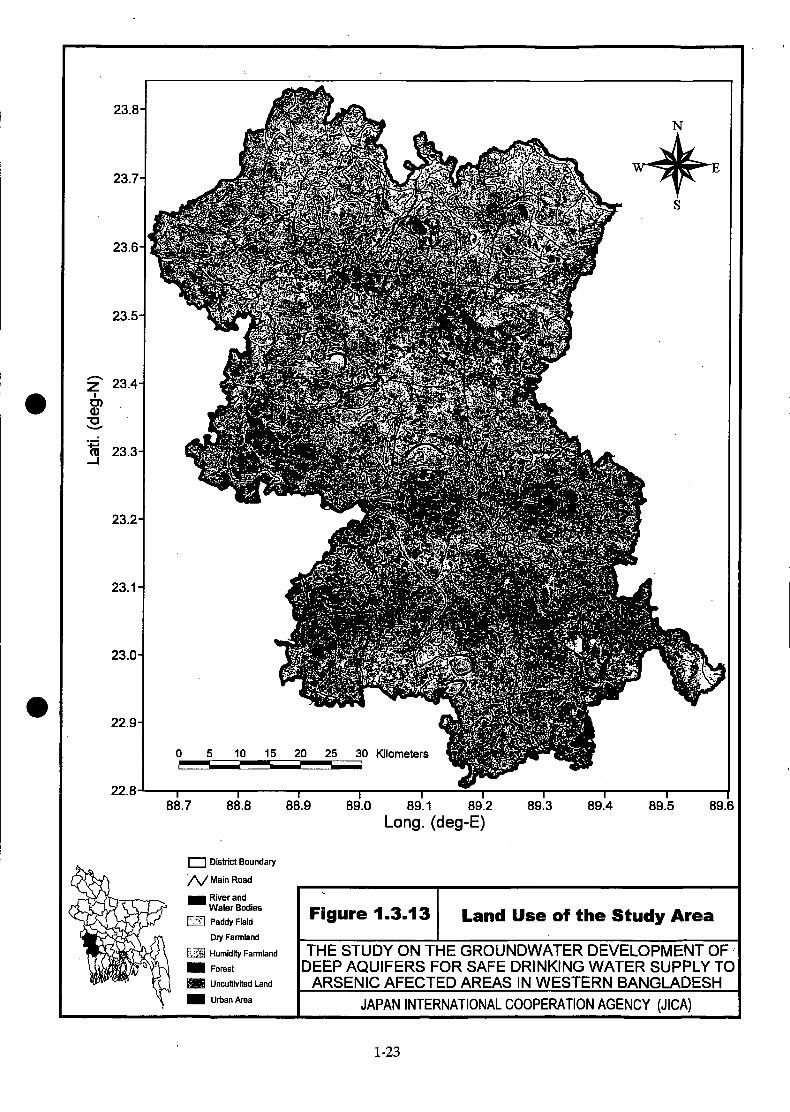
4) Land Use
Figure 1.3.13 shows the land use map.
According to the resolution of the landsat image, the pixel size of the land use map was set as
25m in both X (easting) and Y (nothing) directions.
Based on the characteristics of the land use in the study area, 7 kinds of land use patterns were
classified. The area and ratio of each land use pattern in the study area are shown in Table 1.3.5.
Table 1.3.5 Land Use Classification
1-9

Chapter 1 GIS Database Supporting Report 1
Code Item Area(ha) Area Ratio(%) 1 River, lake and other water bodies 16,798 3 2 Paddy field 178,558 31.5 3 Dry farm land 144,069 25.4 4 Humidity farm land 151,462 26.7 5 Forest 47,651 8.4 6 Uncultivated land 23,270 4.1 7 Urban Area 4,849 0.9 Total 566,657 100
5) Urban Area Water Service System Out of 9 Pourashavas in the study area, seven (7) have urban water services. Figure 1.3.14
shows the locations of the water supply systems in the study area, and Figure 1.3.15 to 1.3.21
show the sketches of them.
The main proportions of the water services in the study area are complied in Table 1.3.6.
Table 1.3.6 Outline of Water Services in the Study Area Thana S_Pop* Pump#** L_Pipe***
Jessore 96.2 17+2**** 101.7 Chuadanga 37.1 6+2 53.1 Jhenaidah 38.8 7+2 51.9 Kotchandpur 11.4 3 30.1 Sailkupa 12.7 3 24.1 Kaliganj 17 3 19.7 Moheshpur 4.9 2 11.7 Total 218.1 41+6 292.3
* : Service population X 1000 persons.
** : Number of pumps.
*** : Total length of pipeline in 1000 meters.
**** : 2 JICA test wells are going to be added into water services.
1-10


Chapter 1 GIS Database Supporting Report 1
1.4 Well Inventory 1.4.1 Structure of Well Inventory The well inventory was created on the basis of DPHE WR. Taking the convenience of utility
and management into consideration, the common database program ACCESS included in MS
Office was selected as the engine to set up the well inventory database.
The following tables are contained in the well inventory.
1) Main Table The main table on the well inventory contains about 20 items that indicate well address, type,
depth, filter type, date of construction, source of project involved, expense system and so on.
For lack of valid data, null value exists in the table. The items and the number of valid data in
the main table are as follows:
Structure for Main Table Field Name Content Number of Data WELL_ID Well ID based on administrative unit 43,771 Former_ID Well ID in DPHE well register 43,770 District District name 43,771 Thana Thana name 43,771 Union Union name 43,771 Mouza Mouza name 43,771 Village Village name 43,771 Care Taker Name of care taker 43,769 Date Construction date (up to Dec. 1999) 39,151 Depth Well depth in feet 43,079 Type Well Type 43,104 Und_Proj Under project 8,387 Exp_syst Expense system 20,782 Sink_TBWL Whether a tube well was sunk 41,346 Flt_Type Filter type 7,922 Flt_lngt Filter Length 7,922 Cement # of packs of cement used for platform 11,036 Lng_plt Length of platform 17,512 Wdt_plt Width of platform 17,512 Iron Iron measurement result 27,787 Chloride Chloride measurement result 13,668 Discharge Discharge data 9,650
2) Log Data Table Log data from 286 DPHE wells in the study area are contained in this table.
1-32

Chapter 1 GIS Database Supporting Report 1
3) Water Quality Data Table This table contains the arsenic analysis result from 779 wells in the study area. All of these data
were taken before this study.
4) 300 well Table 1 (Rain season) The table contains the results of a 300 well survey in the rainy season. The items in this table
include well code, groundwater level observation result, and water quality measurement result.
For general parameters of water quality there are water temperature, electricity conductivity, pH
and ORP. For special parameter, iron and arsenic are shown. The results of two kinds of
analysis for arsenic, field kit and AAS, are shown.
5) 300 well Table 2 (Base Information and Dry Season Survey Result) The table contains the results of a 300 well survey in the dry season. In addition to the items
contained in the 300 well table1, address, coordination, type of pump, depth and other
fundamental information about the surveyed wells were also included.
6) Result in Supplementary Survey In the supplementary survey, all the wells from 16 Mouzas in Keshabpur Thana were surveyed
for well screening. In total, data for more than 3,000 wells were collected, including address,
coordination, construction year, well depth, name of owner, and water quality measurement
results. Although the data were input into the well inventory, the majority of the wells in this
table are not DPHE wells.
1.4.2 General Characteristics of DPHE Wells 1) Well Density Figure 1.4.1 shows the Thana level DPHE well density. The DPHE well density changes largely
in the study area. The minimum density appears in Alamdanga Thana of Chuadanga District,
being only 2 well/km2. The maximum value is located in Sailkupa Thana of Jhenaidah, more
than 15 wells/km2.
In the southern part, DPHE wells density has a relatively uniform distribution, varying from 6 to
10 wells/km2. In the northern part, however, the density changes largely with each Thana.
2) Density of DPHE Well Against Population Figure 1.4.2 shows the Thana level DPHE well density to population.
The number of DPHE wells per 1,000 persons changes from 2 to about 20 in the study area.
This density distribution can be used to examine the reliance of residents on DPHE wells.
Most DPHE wells are shallow tube wells with a hand pump, considered suitable as a water
1-33


Chapter 1 GIS Database Supporting Report 1
1.5 Analysis by GIS Database 1.5.1 Analysis of Arsenic Contamination Situation 300 DPHE wells were selected all over the study area for water sampling and arsenic analysis to
make clear the distribution of arsenic in groundwater. Sampling and water quality analysis were
carried out twice in both the rainy and dry season. Based on the analysis results, arsenic contour
maps for each season have been created and shown in the main report.
In this study, GIS was used for supplementary analysis to examine the arsenic contamination
situation in geographic units.
1) Seasonal Change of Arsenic Level Figure 1.5.1 shows the seasonal change of arsenic, using the result of analysis by AAS. Arsenic
analysis results can be classified into 4 groups on the basis of Bangladesh drinking water
standard value, 0.05mg/l:
Group 1: The arsenic level was less than 0.05mg/l in both the rainy and dry seasons.
Wells within this group can be identified as meeting the Bangladesh
water quality standard, and were colored blue in the map.
Group 2: The arsenic level was over 0.05mg/l in both seasons. Wells within this
group can be ascertained as facing an arsenic problem, and were colored
red.
Group 3: The arsenic level was over 0.05mg/l only in the rainy season, but less
than the standard value in the dry season. Wells in this group were
colored green.
Group 4: The arsenic level was over 0.05 mg/l only in the dry season, but less than
the standard value in the rainy season. Wells in this group were colored
purple.
The majority of wells on the map were indicated in blue or red to give a relatively clear
indication of whether the water can be used for a drinking water supply or not.
On the hand, some wells were represented in green or purple, to indicate that the arsenic level
goes over the Bangladesh water standard value only in certain seasons. Although it still remains
necessary to confirm why this change occurred, the following reasons could be taken into
consideration.
The arsenic level in those wells is closely approaching the value of the Bangladesh
water quality standard. Therefore, the change could be caused by very small or
permissible analysis deviation, which exists in all kinds of chemical analysis because
of the limitation of the analysis equipment and other unavoidable reasons.
The arsenic level in those wells actually did change with seasons resulting from the
change of water quality caused by groundwater recharge, discharge and flow.
1-57

Chapter 1 GIS Database Supporting Report 1
Further monitoring and investigation are necessary to make sure where and which one
mentioned above would be the main reason for this kind of seasonal change in arsenic levels.
However, it could be suggested that the suitability of water from those wells is quite dubious,
because at the least the arsenic level there is as high as or near the Bangladesh water quality
standard value, even though the value might not be exceeded at times.
The following table gives the frequency of the 4 groups.
Group 1(Blue) 2(Red) 3(Green) 4(Purple) Frequency 186 94 10 8
Wells in groups 2 to 4 can be considered as having an arsenic problem. And the proportion of
dubious wells out of them is about 20%.
Generally, water quality standards are used for distinguishing whether the water could be used
for drinking purposes or not. For arsenic, however, WHO set a guideline value of 0.01mg/l,
which is stricter than the Bangladesh water quality standard value. These two standard values
were used for classification of surveyed wells to provide a reference for examining the
suitability of water there. The result of the classification is shown in Figure 1.5.2.
From all the Thanas in the study area, arsenic contaminated wells were ascertained, and arsenic
contamination is more serious in the western part than in the eastern part. If judging the
suitability of water quality by the present Bangladesh standard, 6 Thanas from Chuadanga、
Jibannagar, Chuagachha, Jhikargachha, Sharsha and Keshabpur can be identified as facing a
serious problem because more than 50% of the wells there are in excess of the standard value of
0.05mg/l in both the rainy and dry seasons. In contrast, the proportion of the same kind of wells
in 4 northeastern Thanas, Harinakunda, Jhenaidah, Kaliganj and Bagherpara, is less than 25%.
However, this proportion changes to over 50% if the applied standard is shifted to the WHO
guideline value.
2) Arsenic Affected Population Rather than the number of arsenic contaminated wells, the arsenic affected population is a more
important issue to heed. Based on the ratio of contaminated wells, the affected population was
estimated in each Thana, and the result is shown in Figure 1.5.3.
Two (2) numbers were expressed in each Thana to show the estimation results using different
contamination ratios. One of the numbers, Pop1, gives the population estimated by the ratio of
wells with arsenic level over 0.05mg/l in both seasons. The other number, Pop2, gives the
population estimated by the ratio of wells with an arsenic level over 0.05mg/l at least once in
either the rainy or dry season.
1-58

Chapter 1 GIS Database Supporting Report 1
There is no question that Pop2 is equal to or larger than Pop1, however, what needs to be made
clear about the difference between Pop1 and Pop2 is that this difference gives us an idea of the
population who uses groundwater with an arsenic level as high as or near the water quality
standard value, but possibly less than the value with the change of seasons.
Therefore, if Pop1 could be classified as facing a serious arsenic contamination problem, the
population corresponding to the difference between Pop1 and Pop2 could be considered as
under the risk of arsenic contamination, but the problem is not as serious as with Pop1.
The estimation result of arsenic affected population in 2001 is shown in Table 1.5.1.
Table 1.5.1 Estimated Population Affected by Arsenic Contamination Unit: Thousand persons
District Thana Affected Pop1* Affected Pop2** Alamdanga 47 110 Chuadanga 164 191 Damurhuda 87 109
Chuadanga
Jibannagar 96 96 Harinakunda 45 45 Jhenaidah 62 99 Kaliganj 26 26 Kotchandpur 33 33 Moheshpur 173 173
Jhenaidah
Sailkupa 16 16 Bagherpara 46 46 Chuagachha 131 181 Jessore 81 81 Jhikargachha 149 170 Keshabpur 162 162 Manirampur 133 167 Sharsha 149 199
Jessore
Bagherpara 46 46 Total 1,626 1,930
Affected Pop1*: Estimated by the percentage of wells with arsenic level over 0.05mg/l in both rainy and dry seasons.
Affected Pop2**: Estimated by the percentage of wells with arsenic level over 0.05mg/l at least once in rainy or dry season.
As a result of this estimation, 1,626 thousand people in the study area can be ascertained as
suffering from arsenic contamination. The total arsenic affected population increases to 1,930
thousand, including those who might be affected, or at least using water with arsenic levels near
0.05mg/l.
3) Arsenic Affected Population Density It seems difficult to solve at once the arsenic contamination problem for the entire affected
population and in the whole contaminated area. Countermeasures for the arsenic problem would
be formulated and implemented step by step in consideration of all related factors.
Therefore, it is necessary to make clear the priority of formulating and implementing
1-59

Chapter 1 GIS Database Supporting Report 1
countermeasures. From various factors, the arsenic affected population density is a factor
relevant to the efficiency of countermeasures; therefore, the density was calculated and shown
in Figure 1.5.4. Similar to the estimation of the affected population, two numbers are expressed
in the map.
Within the two densities given on the map, the one related to Pop1 would be taken into high
consideration because it is an index concerning the seriously affected population. By this index,
Keshabpur Thana has the highest priority, because the density of seriously affected people there
is the largest, over 600 persons/km2.
4) Arsenic Contamination Map An arsenic contour map has been created and shown in the main report to express the
distribution of arsenic concentration, and Figures 1.5.1 to 1.5.4 in above section were created to
show the arsenic distribution when examined by water quality standard.
A water quality standard is usually set on the basis of many factors, but not only on the subject
substance itself. Therefore, safety is not always ensured, even if the water quality standard is
met. Especially with arsenic, since it is not only unnecessary, but also harmful to human health,
the ingestion of arsenic should be reduced to as little as possible. On the one hand, because of
the restrictions of removal technology, cost of treatment, and so on, the standard value for
arsenic could not be set as low as “no detected”, even though this grade standard value has been
applied to many subjects such as pesticides.
Therefore, it is necessary to evaluate arsenic not only by water quality standard, but also by the
arsenic level itself.
Figure 1.5.5 shows one result of this kind of approach. The arsenic contamination situation was
classified by arsenic level, and shown in the pie graph for each Thana. Cool colors (blue and
green) give the ratio of the water samples with arsenic levels less than the Bangladesh water
quality standard value, and warm color (orange and red) show the ratio of samples over
0.05mg/l.
Obviously, those Thanas can be identified as facing a serious arsenic contamination problem, if
the ratio of warm color is large there showing that many samples have exceeded Bangladesh
water quality standard value. On the other hand, even if the ratio of warm colors is the same, the
arsenic contamination situation could be different.
The ratio of the warm colored portion is near 70% in 2 Thanas, Chuadanga and Keshabpur,
indicating a similar result of evaluation by the Bangladesh water quality standard. However, the
ratio of the red colored portion is quite different between the two Thanas, about 15% in
Chuadanga and 30% in Keshabpur. That is, the ratio of people in Keshabpur who are using
water with arsenic more than double the Bangladesh water quality standard value is about twice
the ratio in Chuadanga.
1-60

Chapter 1 GIS Database Supporting Report 1
The same case can also be found in Jibannagar and its adjacent Thana, Moheshpur. A similar
result would be obtained in evaluation by the Bangladesh water quality standard value in these
two Thanas, however, the ratio of people in Jibannagar using water with arsenic levels over
0.1mg/l is far larger than the ratio in Moheshpur. Therefore, from the viewpoint of the amount
of arsenic ingested, Jibannagar Thana should be considered as facing a more serious arsenic
contamination problem than Moheshpur.
5) Relationship between Arsenic and Lithofacies The result of 300 well survey was also overlain on the geology map (see Figure 1.3.3) to
examine the relationship between arsenic and lithofacies. The result of the examination is shown
in Figure 1.5.6 and Table 1.5.2. No significant correlation could be found between arsenic level
and lithofacies.
Table 1.5.2 Relation between Arsenic Level and Lithofacies
Lithofacies Now 05T Pct 01T Pct 05O Pct 01O Pct
Deltaic Sand 3 0 0.0 3 100 1 33.3 3 100
Deltaic Silt 264 84 31.8 169 64 141 53.4 217 82.2
Marsh Clay and Peat 31 8 25.8 17 54.8 16 51.6 26 83.9
Now : Number of surveyed wells 05T : Number of wells with arsenic level over 0.05 mg/l in both rainy and dry seasons 01T: Number of wells with arsenic level over 0.01 mg/l in both rainy and dry seasons 05O : Number of wells with arsenic level over 0.05 mg/l at least once in rainy or dry
seasons. 01O: Number of wells with arsenic level over 0.01 mg/l at least once in rainy or dry
seasons.
6) Relation between Arsenic and Soil Type The well survey results were also overlain on the soil type classification map (see Figure 1.3.6)
to examine the relation between arsenic and soil type. The result of the examination is shown in
Figure 1.5.7 and Table 1.5.3. Like lithofacies, the significant relation between soil type and
arsenic could not be identified.
Table 1.5.3 Relation between Arsenic Level and Soil Type Soil Type Now 05T Pct 01T Pct 05O Pct 01O Pct
Clay 16 5 31.3 8 50 8 50 13 81.3Silty clay 47 9 19.1 26 55.3 27 57.4 39 83 Silty loam and silty clay 10 6 60 8 80 7 70 9 90 Silty clay loam 145 50 34.5 96 66.2 79 54.5 121 83.4Silty loam & silty clay loam 5 1 20 2 40 3 60 4 80 Silty loam and silty clay 65 17 26.2 39 60 29 44.6 50 76.9Sandy loam 10 4 40 10 100 5 50 10 100
Now: Number of surveyed wells 05T: Number of wells with arsenic level over 0.05 mg/l in both rainy and dry seasons 01T: Number of wells with arsenic level over 0.01 mg/l in both rainy and dry seasons 05O: Number of wells with arsenic level over 0.05 mg/l at least once in rainy or dry
1-61

Chapter 1 GIS Database Supporting Report 1
seasons. 01O: Number of wells with arsenic level over 0.01 mg/l at least once in rainy or dry
seasons.
1.5.2 Basic Data for Groundwater Simulation 1) Groundwater Use for Irrigation The irrigation amount is basic data for groundwater simulation. And the data has to be prepared
according to the simulation period and simulation span. In this study, as mentioned in the main
report, the groundwater simulation period was specified as the 19 years from 1983 to 2001, and
the simulation span was set as one month.
There is no irrigation amount data in the study area; therefore, the irrigation amount was
estimated by using GIS.
For the irrigation amount estimation, 5 factors need to be taken into consideration. Each of the
factors was set as a layer. All layers were overlain in GIS. The outline of layer construction and
analysis flow is shown in Figure 1.6.1.
Basically, the irrigation amount QI can be calculated by the following formula:
QI = (E + I – R ) * Rp
E : Evaporation
I: Infiltration
R: Rainfall
Rp: Ratio of paddy field
a. Layer 1: Ratio of Paddy Field
Ratio of paddy field is the basic factor for irrigation, meaning the proportion of paddy field to
the whole calculated area. The ratio in the year of 2000 is shown in Figure 1.6.2, which was
obtained by overlaying the land use map (see Figure 3.1.3) into the simulation domain.
b. Layer 2: Irrigation Pattern by Soil Type
b.1. Irrigation Index
The irrigation amount depends on the consumption of water in paddy fields, which mainly
consists of evaporation and infiltration. Evaporation is a meteorological factor, which changes
little in plain areas such as the study area. On the other hand, the amount of infiltration depends
on soil type and changes largely for different soil.
Therefore, the soil classification map (see Figure 1.3.6) was overlain onto the simulation grid to
specify a representative soil type to each mesh of model mush. Figure 1.6.3 shows the resulting
soil type specification.
Another important issue is permeability for each soil type. The data from a previous study4) was
compiled for reference and shown in the following table.
1-62

Chapter 1 GIS Database Supporting Report 1
Irrigation Depth for Land Preparation and Land Soaking in mm Soil type # of
samples Maximum Minimum Average
Sandy loam 7 250 197 218 Loamy1 5 214 186 201 Loamy2 8 204 165 184 Clay loam 2 168 156 162 Clay 1 -- -- 120
Referring to the previous study, the irrigation index for all soil types in the study area was
specified as follows:
Soil Type in the Study Area Irrigation Index Sandy Loam 1.08 Silty loam 1 Silty loam and silty clay loam 0.94 Silty loam and silty clay 0.87 Silty clay loam 0.81 Silty Clay 0.7 Clay 0.6
b.2. Irrigation Unit
Because silty loam is the exact same soil type within the Base Map database and tested during
the previous study, it was taken as the basic soil type having an irrigation index value of one (1).
The irrigation amount for silty loam was then taken as the irrigation unit I and calculated as
follows:
I = D×H/A
D: Average pump Discharge (lps) =43.71 (lps)
H: Average operating hours (Hours) =1074 (Hr)
A: Irrigation area (ha) =18.07 (ha)
Therefore,
I = 9352.5 (m3/ha) 935.25 mm
b.3. Yearly Infiltration Unit (Qy)
Yearly infiltration unit Qy means the infiltration amount of basic type soil for one irrigation
period, and was calculated as follows: Qy = R + I - E
R: Rainfall = 315mm
I: Irrigation = 935mm
E: Evaporation = 498mm
Therefore,
Qy = 315 + 935-498 = 752 mm
1-63

Chapter 1 GIS Database Supporting Report 1
b.4. Daily Infiltration Unit (Qd)
The daily infiltration unit Qd means average the daily infiltration amount of basic type soil, and
was calculated as follows:
Qd = Qy / (Irrigation days)
= 752 / 212
= 3.547 (mm/day)
c. Layer 3: Monthly Irrigation Amount
It is well known that irrigation is carried out only in months when the recharge (rainfall) is less
than consumption (evaporation and infiltration). Based on the rainfall distribution data from
Figure 1.3.5, the irrigation period in the study area was ascertained as 7 months from October to
next April. The average irrigation amount for each month in the irrigation period is estimated as
follows:
Month Oct Nov Dec Jan Feb Mar Apr Evaporation 71.1 62.8 51.4 48.6 59.3 92.9 112 Infiltration 110 106.4 110 110 99.3 110 106.4 Rainfall 134.8 28.5 11.2 12.3 36.8 46.2 45.7 Irrigation 46.3 140.7 150.2 146.2 121.8 156.8 172.7
d. Layer 4: Irrigation Area and its Change
The paddy field ratio in the study area for 2000 was obtained on the basis of land use map;
however, the ratio in other years has to be estimated using agricultural statistics and previous
studies.
d.1. Farm Land Increase Ratio
Based on the data of GOB1), 2), the farmland area has increased since the 1970’s, and the average
yearly increase ratio is 0.56 %.
d.2. Irrigation Ratio
Irrigation is not carried out for all farmland, including paddy fields. To analyze and arrange the
data from GOB1)-3), an index of the irrigation ratio was specified and the change of the index is
shown in the following graph. The correlation formulas in the graph were used to estimate the
irrigation ratio in years later than 1997.
1-64

Chapter 1 GIS Database Supporting Report 1
DTW= 7.28x - 14330
R2 = 0.9386
STW= 30.27x - 59956R2 = 0.9768
0
100
200
300
400
500
600
1982 1987 1992 1997 2002
Irri
gatio
n In
dex
DTW and STW here refer to Deep Tube Well and Shallow Tube Well, respectively.
Based on the data and processing procedures mentioned above, the farmland index and
irrigation ratio for DTW and STW in the study area were estimated as follows:
Year Ratio DTW Ratio STW Farmland Index 1983 3.2 13.3 235 1984 3.6 16.6 236 1985 3.9 19.9 237 1986 4.2 20.1 238 1987 4.3 21.8 240 1988 4.7 25.3 241 1989 5.2 30.9 243 1990 5.2 33.5 244 1991 5 34.3 245 1992 5.9 39.6 247 1993 6 43.9 248 1994 5.5 45.4 249 1995 6.1 51.3 251 1996 6.1 54.6 252 1997 7 61.9 254 1998 6.9 60.5 255 1999 7.1 63.7 256 2000 7.4 67.2 258 2001 7.6 70.3 259
e. Layer 5: Grid Division of Simulation Model
Figure 1.6.4 shows the specification of grid division used for groundwater simulation.
The specification of the groundwater simulation model domain is as follows:
Boundary: BTM Easting 359000 to 456000
Northing 520000 to 638000
WGS84 Longitude 88.61 to 89.6
Latitude 22.7 to 23.84
Number of column = (BTM Easting 456000 – 359000) / 1000 = 97
Number of row = (BTM Northing 638000 – 520000) / 1000=118
1-65

Chapter 1 GIS Database Supporting Report 1
Number of mesh = 97 x 118 = 11,446
Number of mesh to cover the study area 6,018
f. Result of Irrigation Amount Estimation
All 5 layers mentioned above including relative parameters were overlain into GIS to estimate
the monthly irrigation amount for each simulation model mesh. The result of the estimation was
shown in Table 1.5.4 and Figure 1.6.5.
In the past 19 years, from 1983 to 2001, groundwater consumption in the study area increased
about 5 times from 666 to 3,148 million tons. Out of the total amount, irrigation by DTW
increased a little less than 3 times, from 129 to 306 million tons, whereas more than 5 times
from 537 to 2,842 million tons by STW.
Figure 1.6.6 shows the estimated monthly irrigation amount. Within an irrigation period from
October to the following April, the irrigation amount changes with rainfall and evaporation. The
largest irrigation amount appears in April, just before the rainy season, and the smallest one is in
October, just after the rainy season.
Figure 1.6.7 shows the distribution of the irrigation amount in 2001 all over the study area. The
irrigation amount by STW is as large as about 10 times the amount by DTW.
Figure 1.6.8 gives the irrigation amount by STW in April and October 2001, respectively. The
amount in April is as large as nearly twice the irrigation amount in October.
2) Groundwater Use for Domestic Water Supply Similar to groundwater use for irrigation, it is necessary to make clear groundwater withdrawal
for domestic use not only for groundwater simulation, but also for groundwater management.
In a certain period, groundwater use for domestic water supply can be estimated by the
following formula:
QD = Pop×Unit×Rario_GW
Pop : Service population
Unit : Amount of water use per day per capita
Rario_GW : Ratio of groundwater use in domestic water supply
Since no previous data on this issue could be collected in the study area, the domestic use of
groundwater was estimated on the basis of the data obtained in this study. The estimation was
carried out by the procedure shown in Figure 1.6.9.
a. Layer 1: Population
The most important factor for domestic use estimation is population. Within all collected
population data, that is the 1974, 1981, and 1991 population censuses and the 2001 census
preliminary report, the 1991 census was selected as base data from the criteria of particularity
1-66

Chapter 1 GIS Database Supporting Report 1
and accuracy.
The population in each year except 1991 was estimated on the basis of the 1991 census and the
average yearly population increase ratio calculated using the 1981 and 1991 censuses.
As mentioned in the previous section, the population data from BBS could not be perfectly
matched at the Mouza level because the difference of the minimum administrative unit used in
the two data sources. Therefore, the population estimation was carried out at the union level,
which is a minimum administration unit with reliable population data.
The yearly population increase ratio was calculated at the Thana level because of the lack of
unity between the 1981 and 1991censuses at the union level.
b. Layer 2: Land Use
Land use pattern is important for domestic water use estimation, because the water use unit, that
is, the water use amount per capita per day is largely different between urban and rural areas.
b1. Urban Area
As with the calculation of farmland distribution, the urban area was obtained by overlaying the
land use map (see Figure 1.3.13) on the simulation grid layer (see Figure 1.6.4)
b2. Water Use Unit in Rural Area
No previous survey could be referred to get the water use unit in the rural area. Therefore, the
unit was calculated on the basis of the data in the village survey in this study.
Three (3) model villages were selected from each district in the study area. And the water use
data from the survey was compiled as follows:
District Chuadanga Jhenaidah Jessore Unit(l/day/capita) 11.0 13.3 13.8
b.3 Water Use Unit in Urban Area
Different from the rural area, in some urban areas there exist a water service system as well as
private wells with an electricity power pump, therefore, the water use unit is larger than the rural
area. The water use unit in the urban area was specified as 30 liters per day per capita, which is
about 2.5 times that in the rural area.
c. Layer 3: Ratio of Groundwater Use
Domestic water use can be calculated just by overlaying layer 1 and layer 2. However, as
groundwater is not the unique source for domestic water supply, the ratio of groundwater
withdrawal in the whole domestic use is requested for this estimation.
The present ratio of groundwater withdrawal was set as 90% to be a base ratio of the estimation;
1-67

Chapter 1 GIS Database Supporting Report 1
the ratio for other years was estimated using the ratio of wells by the calculation year
multiplying to the base ratio.
For the same reason mentioned in the section on the well inventory data, although all wells in
DPHE well registers have been matched into Mouza unit, actually union is the minimum
administration unit in the well inventory with relatively reliable well location information.
Therefore, the ratio of wells of each calculation year to all present wells was calculated in union
unit, and the number of wells in union unit in each year were as shown in Figure 1.4.3 and
Table 1.4.2.
d. Layer 4: Grid Division of Simulation Model
Grid division of simulation model is the same as layer 5 for irrigation use estimation.
e. Yearly Groundwater Withdrawal for Domestic Use
Figure 1.6.10 and Table 1.5.5 show yearly groundwater withdrawal for domestic use in the
study area during the simulation period.
From 1983 to 2001, domestic water use increased with the increase in population in the study
area. On the other hand, contrasting to the average yearly increase ratio of population in this 19
year period, which is about 2%, the average yearly increase ratio of groundwater withdrawal for
domestic use is as large as 3 times, being about 6%, as a result of the rapid progress of
groundwater development from the second half of the 1970s to the first half of the 1990s.
Another tendency indicated by the estimation result is that the increase of groundwater
withdrawal for domestic use changed to a little slowly from the second half of the 1990s, in
comparison with former years.
f. Distribution of Groundwater Withdrawal for Domestic Use
Figure 1.6.11 shows the distribution of yearly groundwater withdrawal for domestic use
throughout the study area in 2001. For the majority of mesh, where the rural area is distributed,
yearly groundwater withdrawal for domestic use changes from 1,000 to 8,000 tons/km2/year. On
the other hand, yearly groundwater withdrawal for domestic use in the urban area changes from
15,000 to 58,000 tons/km2/year, far larger than that in the rural area.
g. Total Groundwater Use
Figure 1.6.12 shows the total groundwater use in the study area in years of 1983, 1991 and 2001.
In the study area, groundwater use can be generally classified into irrigation by shallow tube
well (STW) and deep tube well (DTW), and domestic use.
Out of these 3 groundwater use portions, STW holds the largest proportion and the most rapid
rate of increase. In contrast, domestic use holds the highest priority in water development;
1-68

Chapter 1 GIS Database Supporting Report 1
however, the proportion of it is the smallest, less than 1%.
3) Arrangement of Lithofacies Data The specification of aquifers is the basic requirement of groundwater simulation as mentioned
in the main report. The specification was performed on the basis of the result of the core boring
survey with reference to existing log data as mentioned in the main report. GIS was used in this
specification to assign the lithofacies data into each mesh of the simulation model.
Five (5) layers were specified in the model, however, several layers are combined into Figure
1.6.13 to 1.6.15 to show depth of top, thickness of combined layer, and thickness of
accumulated clay layer within the upper layer (layer A+B), middle layer (layer C) and lower
layer (layer C+D).
1.6 Basic Data for Priority Project Area Based on all the results in this study, a master plan was formulated for solving the problem of
arsenic contamination, as well as improving the condition of domestic water supply. According
to the seriousness of the arsenic problem, the arsenic affected area was classified into urgent
area and semi-urgent area, and the implementation of countermeasures was suggested step by
step according to the priority of urgent situation (refer to the main report).
Basic information about the area and population are compiled in Mouza unit for each urgent
situation group and shown in Tables 1.6.1 and 1.6.2.
The population in year 2001 was estimated by the same procedure and parameters as the
population estimation for domestic water use calculation. Populations for the 16 Mouzas within
the supplementary survey are obtained from the result of the socio-economic survey.
Reference Strategies and program framework for Agricultural Development in Bangladesh, GOB, 1996.
Agricultural Year Book. 1998.
Evolution of Irrigation Technology and Its Impact on the Development of Farming Systems and
Environment in Bangladesh, M.S.U Talukder and M.S.Alam, 1993.
Irrigation management for crop diversification in Bangladesh. M.R.Biswas, M.A.S.Mandal,
1993.
1-69


CHAPTER 2
SUBSURFACE HYDROGEOLOGICAL STRUCTURE
Supporting Report 1

Chapter 2 Subsurface Hydrogeological Structure Supporting Report 1
CHAPTER 2 SUBSURFACE HYDROGEOLOGICAL STRUCTURE 2.1 Geophysical Prospecting
2.1.1 Purpose of the survey A geophysical prospecting was carried out in the study area, which covers 3 districts
(Chuadanga District, Jhenaidah District and Jessore District), and is shown in Figure 2.1.1.
The primary objective of this survey was to determine the composition and distribution of
aquifers in the study area. The selection of the survey station was judged from the geographical
features, comparison of log data of wells, the precise site for a measurement and road condition,
etc.
On the basis of the general survey results, Electromagnetic Prospecting was decided by survey
areas. In this report we describe the outline of the transient electromagnetic (TEM) survey and
interpreted results of the data.
2.1.2 Outline of the survey 1) The TEM method
a) Physical principles
TEM is a transient electromagnetic method, often referred to as time-domain electromagnetic
method, in which the ground is energized by a man-made magnetic field and its response is
measured as a function of time to determine the resistivity of the earth beneath observation point
as a function of depth. In this method, a steady current is passed through a loop of wire usually
situated on or above the surface of the earth, which is inductively linked to the earth.
The fact that loop sources, which have no direct contact with the earth, can be used makes this
method suitable in areas where high surface resistivity prohibits the use of conventional direct
current methods. This would include regions covered by desert, sand dunes or extrusive
volcanic.
This direct current is abruptly interrupted and the secondary fields due to induced eddy currents
can be measured in the absence of the primary field. The currents migrate from the transmitter
into the earth and the pattern resembles a “smoke ring”. The rate of change of the magnetic field
depends upon the underground resistivity structure. For poor conductive medium, the receiver
coil output voltage, which is proportional to the time rate of change of the secondary magnetic
field, is initially large but decays rapidly. The response of a good conductor is initially lower but
the voltage decays more slowly. The time derivative of the transient magnetic field, which
results from these currents can be measured by a coil sensor (see Figure 2.1.2).
The decay of the secondary field measured at the surface can be analyzed to determine the
resistivity of the earth at a depth. The resistivity of geological materials is highly dependent
2-1

Chapter 2 Subsurface Hydrogeological Structure Supporting Report 1
upon porosity, saturation, and pore fluid resistivity information about water content and its
quality, and TEM resistivity measurements are a valuable structural mapping tool for
groundwater studies.
The TEM method was selected for this survey for the following reasons; (1) stability of the
transmitter signal, (2) lack of static shift, (3) no near field phenomena, (4) uniqueness of the
results, and (5) suitability of ungrounded source.
TRANSIENT CURVES current
Resistive medium magnetic field dB/dt sensor
time transmitter
Conductive medium dB/dt
eddy current time
Figure 2.1.2 TEM survey configurations and transient curves
b) Equipment
The specifications of the TEM measurement system manufactured by Geonics Corp., which was
used in this survey, are shown in Table 2.1.1.
The receiver console, a PROTEM 57 (D) unit, samples the coil response to the induced
magnetic field in the ground at a series of time intervals that are displayed by a prescribed
amount from each turn-off of the loop current. Through the use of two transmitter-waveform
base frequencies, namely 262.5 and 25 Hz, the decay voltage was recorded in two overlapping
time ranges of 0.00613-0.06959 ms and 0.08813-6.978 ms, respectively, after the current was
turned off. There are 20 gates in each time range. The channel positions, or gate times, of 20
geometrically spaced time gates are shown in Table 2.1.2.
The TEM Measurement system is shown in the photo below.
2-2

Chapter 2 Subsurface Hydrogeological Structure Supporting Report 1
2-3
TEM47 Coil TEM57 Coil
TEM47 Transmitter Receiver Protem57(D) TEM57 Transmitter
The TEM47 is an internal 12-volt rechargeable battery powered transmitter that can supply a 3A
at the maximum. The TEM57 is a 24 volt car-battery powered transmitter that can supply up to
20A at the maximum.
A reference cable is used to establish precise timing between transmitter and receiver. These
systems were applied to make high resolution sounding to the depths of a few 100m.
Table 2.1.1 Specifications of TEM survey equipment MODEL SPECIFICATIONS NUMBER
Receiver Measured Quantity: Rate of decay of induced 1
PROTEM57 (D) magnetic field in nV/m2
Base Frequencies: 0.3, 0.75, 3, 7.5, 30, 75 and 285 Hz
or 0.25, 0.625, 2.5, 6.25, 25, 62.5 and 262.5 Hz
Time Gates: 20 geometrically spaced time
for each base frequency (6 ms to 800 ms)
Dynamic Range: 23 bits (132 dB)
Integration Time: 2, 4, 8, 15, 30, 60, 120, 240 sec
Synchronization: Reference cable
or high stability quartz crystal
Coil Air-cored Coil 2
Effective Area: 31.4 square meters
Effective Area: 100 square meters

Chapter 2 Subsurface Hydrogeological Structure Supporting Report 1
Transmitter Current waveform: Bipolar rectangular current 2
TEM47 with 50% duty cycle
Frequencies: 30, 75, 285 Hz or 25, 62.5, 262.5 Hz
Maximum Current: 3 A
Output voltage: 0 to 9 V, continuously variable
Turn-off Time: 2.5 msec at 3 A into 40 × 40 m loop
Faster into smaller loop
TEM57 with 50% duty cycle
Frequencies: 3, 7.5, 30 Hz or 2.5, 6.25, 25 Hz
Maximum Current: 20 A
Output voltage: 20 and 40 V, continuously variable
Turn-off Time: 115µs at 20 A into 5 × 5 m 8 turn loop
Table 2.1.2 Sampling gate times
GATE BASE FREQUENCY
NO 262.5 Hz 62.5 Hz 25 Hz 6.25 Hz 2.5 Hz
1 6.813 35.25 88.13 352.5 881.3
2 8.688 42.75 106.9 427.5 1069
3 11.13 52.50 131.3 525.0 1313
4 14.19 64.75 161.9 647.5 1619
5 18.07 80.25 200.6 802.5 2006
6 23.06 100.3 250.6 1003 2506
7 29.44 125.8 314.4 1258 3144
8 37.56 158.3 395.6 1583 3956
9 47.94 199.8 499.4 1998 4994
10 61.13 252.5 631.3 2525 6313
11 77.94 319.8 799.4 3198 7994
12 99.38 405.5 1014 4055 10140
13 126.7 514.8 1287 5148 12870
14 166.4 654.3 1636 6543 16360
15 206.0 832.3 2081 8323 20810
16 262.8 1059 2648 10590 26480
17 335.2 1349 3373 13490 33730
18 427.7 1719 4297 17190 42970
19 545.6 2190 5475 21900 54750
20 695.9 2792 6978 27920 69780
UNIT: µsec
2-4

Chapter 2 Subsurface Hydrogeological Structure Supporting Report 1
c) Data processing
The following map shows a flow chart of data analysis used in this study.
FIELD DATA
EDITING OF DATA
CONVERSION TO APPARENT RESISTIVITIES
PRELIMINARY INVERSION ANALYSIS
OCCAM‘S INVERSION IMAGING SECTION
INVERSION ANALYSIS GEOLOGICAL INFORMATION
EQUIVALENCE ANALYSIS MAPPING
REINTERPRETATION LOG DATA OF WELLS
Figure 2.1.3 Flow chart of data analysis
In the first phase of data processing, the decay voltages are transformed into late-time apparent
resistivity values at each gate, after checking the measurement parameters (e.g. loop dimensions,
gains of receiver, current, station locations and so forth) of field data.
The voltages, V0 (in unit of mV), which are measured by the PROTEM57 (D) system are
converted to the magnetic field decay rate, dB/dt (nV/m2), by the following formula (Geonics,
1992).
dBdt
V
E n
0 19200
2
where E is the receiver coil moment (m2), and n is the amplitude gain setting. Apparent
resistivity ρa (t) (ohm-m) as a function of time are then given by,
ac c
tp t
Mt d B d t
( )
42
5
2 3
where m is magnetic permeability (*4p*10-7 in unit of H/m), tc is the measurement time or the
gate center time in s, and M is the transmitter moment, which is the product of loop area (m2)
2-5

Chapter 2 Subsurface Hydrogeological Structure Supporting Report 1
and current (A).
Occam’s inversion technique, named smooth inversion, was used to generate resistivity imaging
sections with models up to 15 layers. In this process, a candidate model is iteratively changed to
estimate the best fitting model to the observed data under restricted conditions in which the
resistivity of each layer changes smoothly. Imaging sections obtained by this technique can
visualize underground structures without artificial parameterization. The imaging results were
also used to estimate initial model parameters for the following one-dimensional inversion.
The one-dimensional inverse processing is used to obtain one-dimensional resistivity structures
where the layered model can be assumed to be from a geological point of view. In this process
we can estimate structural parameters (e.g., resistivities and thickness) of best fitting models
with up to 8 layers using the least squares method called automatic ridge regression.
Finally, equivalence analysis was done to estimate a set of equivalent models, that is, alternative
models that fit the data nearly as well as the best-fit model, but different from this model. The
forward calculations for each model are used; these are selected to determine the extent to
which modifications to the model can be made according to these guidelines without exceeding
a user-specified error. Equivalence analysis also indicates the allowable range of each of the
model parameters.
The program that we have used in this study is “TEMIX-GL” developed by Interpex Ltd.
2) Electric Prospecting
a) Physical principles
The electric prospecting method is used in the study of horizontal and vertical discontinuities in
the electrical properties of the ground. It is routinely used in hydrogeological investigations to
investigate the shallow subsurface geology.
In the electric method, artificially generated electric currents are introduced into the ground and
the resulting potential differences are measured at the surface. By knowing that current flowing
through the ground and the resulting potential differences of voltage between two potential
electrodes, it is possible to compute the resistivity of the earth materials.
In this study area, the Schlumberger method was used. This method throws the current into the
current electrode in two places set up on the measurement line, and measuring the potential
difference with a couple of potential electrodes installed inside (see Figure 2.1.4).
2-6

Chapter 2 Subsurface Hydrogeological Structure Supporting Report 1
ρa=π/4×((AB2-MN2)/MN)×(V/I) V: Measurement voltage between MN(V) I: Transmission current between AB(A) AB: Current electrode MN: Potential electrode ρa: Apparent resistivity (Ωm)
B N A M
AB/2
V
MN/2
I
Figure 2.1.4 Electrode configuration
The combination of the current electrode interval and the potential electrode interval is shown in
Table 2.1.3.
Table 2.1.3 Electrode Spaced (AB/2) 1 2 4 6 8 10 15 20 25 30 35
(MN/2) 0.2 0.2 0.2 0.2/1 1 1 1 1 1/5 5 5
(AB/2) 40 50 60 70 80 90 100 130 160 200 250
(MN/2) 5 5/10 10 10 10 10 10/20 20 20 20 20/50
(AB/2) 300 350 400 450 500 550 600 650 700
(MN/2) 50 50 50 50 50/100 100 100 100 100
AB/2: Electrode interval (m), MN/2: Potential interval (m)
b) Equipment
The equipment used in this survey, the Electric measurement system manufactured by BRGM
Corp. in France, is shown in the photo below and described in Table 2.1.4.
2-7

Chapter 2 Subsurface Hydrogeological Structure Supporting Report 1
2-8
Syscal R2 DC-DC Converter Battery
Table 2.1.4 Specifications of Electric survey equipment MODEL SPECIFICATIONS NUMBER
Receiver and Transmitter Syscal system R2 1
DC-DC 100W Converte 1
Input voltage: 24 V
Output voltage: 110 to 330 V, continuously variable
2.1.3 Investigation of the geophysical survey method The geophysical survey method is the Electromagnetic and Electric Prospecting. Though the
investigation uses one of these techniques, the techniques had been examined in several districts
before the investigation began to determine which one was more suitable. Measurements were
made at a total of 6 stations in the 3 districts, as show in Figure 2.1.5.
The measurement place was the same. Figure 2.1.6 shows a comparison of measured TEM data
and electric data. As a result, the major difference is the resistivity boundary.
But, the results of the resistivity inversion model are similar.
2.1.4 Measurements The total number of measurement stations is 200 stations by TEM prospecting, 38 stations in
Chuadanga, 67 stations in Jhenaidah, and 95 stations in Jessore. These measurements were
made at stations at random with a spacing of approximately less than ten kilometers (see Figure
2.1.7). And a drilling program was conducted at sites identified by TEM as strategic. This
program included core observations and geophysical logging.

Chapter 2 Subsurface Hydrogeological Structure Supporting Report 1
Measurements were then made at 14 stations (Chuadanga: TEM record numbers are CHU0071,
CHU0421 and CHU0731. Jhenaidah: JHE1931, JHE1531 and JHE1041. Jessore: JES0771 and
JES1021 to JES1027) on nearby drilling program sites. Table 5.1.6 shows the list of 200
stations surveyed by TEM prospecting.
1) Positioning and station spacing
The stations were plotted on the topographic maps on a scale of 1:50,000 and then located by
GPS (Global Positioning System).
2) Measurement configurations
The square transmitter loop 100m on a side was energized with a typical current of 2.5A for
high production rates by the TEM47 transmitter. The secondary transmitter, the TEM57, is a
typical current of about 12 A for low production rates. At each station, the receiver coil was
located inside the square transmitter loop 50m from one side. This configuration was used
instead of a central loop sounding to minimize the possibility of instrumental noise produced by
currents induced in the instrument case. By keeping the receiver coil close to the transmitter
loop, the sounding resembles a central induction measurement at all but the earliest times for the
earth resistivity encountered in the study area.
The TEM measurement system is shown in the photo below.
2-9

Chapter 2 Subsurface Hydrogeological Structure Supporting Report 1
Receiver side (TEM47) Transmitter side
Receiver side (TEM57)
3) Noise
Several stacks of measured voltages were averaged and noise statistics determined. However,
data with reversed polarity during transient were measured at several points where there were
transmission line or the other conductive materials. These stations were moved a few hundred
meters and usable data was obtained.
4) Result of Geophysical Prospecting
Most of the sounding data are interpreted with from five to six layers in most cases, In general
the estimated resistivity ranges from more than 10 to less than 70 ohm-m. At almost all stations,
resistivity structures consist of four to five layered models of LHML or LHLML (low, high,
middle and low, or LHML type) at about 80% of the stations. In Chuadanga and Jessore
Districts, LHLML type is at about 60% of the stations. The estimated resistivity structures are
listed in Table 2.1.6.
2-10


Chapter 2 Subsurface Hydrogeological Structure Supporting Report 1
2.2 Analysis of Hydrogeological structure 2.2.1 Results of Geophysical Prospecting Most of the sounding data are interpreted with from five to six layers in most cases. In general,
estimated resistivity ranges from more than 10 to less than 70 ohm-m. At almost all stations,
resistivity structures consist of four to five layered models of LHML or LHLML (low, high,
middle and low, or low, high, low, middle and low resistivity from the surface) type. In
Jhenaidah District, the LHML type is at about 80 % of the stations, In Chuadanga and Jessore
District, the LHLML type is at about 60 % of the stations. The estimated resistivity structures
are listed in Table 2.1.6.
1) Resistivity image sections
Resistivity image sections consist of seven profiles, A-A’, B-B’, C-C’, D-D’, E-E’, F-F’ and
G-G’, and are presented in Figures 2.2.1 to 5.2.7. The locations of these profiles are shown in
Figure 2.1.7.
1-1) Profile A-A’
This profile, which is composed of 21 stations, begins in the north of Alamdanga Thana, goes
through Moheshupur Thana and ends in the south of Sharsha Thana.
In Figure 2.2.1, low resistivity values are represented by reddish colors and high resistivity
values are shown in bluish colors.
Subsurface resistivity in the vicinities to the north of Chougacha Thana are high (more than 50
ohm-m), and high resistivity can be seen at depths of 100 and 300m, with a thickness commonly
of less than 100m.
The low resistivities of less than 20 ohm-m are deeply distributed in this image.
1-2) Profile B-B’
Profile B-B’ runs from north to south and is composed of 24 stations, as shown Figure 2.2.2. It
runs through Harinakunda Thana, Kaliganj Thana and Keshabupur Thana.
The high resistivity values are also in northern parts of the profile and at a depth of about 100m.
In Keshabprur Thana, it can be seen at 250m in depth with a thickness of less than 100m.
The low resistivity values are widely distributed from surface to depth in Keshabpur Thana.
1-3) Profile C-C’
This profile runs from west to east, crossing profile A-A’ and B-B’ as shown in Figure 2.2.3
This image was derived from data collected at 16 stations.
The high resistivity can be seen at 100m in depth in the western part of Sailkupa Thana, and
middle resistivity values of more than 20 to less than 50 ohm-m are widely distributed.
2-27

Chapter 2 Subsurface Hydrogeological Structure Supporting Report 1
1-4) Profile D-D’
The section of this profile, which runs from Moheshupur Thana, Kochandpur Thana and
Jhenaidah Thana, is composed of 14 stations (see Figure 2.2.4).
High resistivity in Kotchandpur Thana is also at 100m in depth and with thickness. The low to
middle resistivity values ranging from 20 to 50 ohm-m can be seen at a depth of more 150m.
1-5) Profile E-E’
As shown in Figure 2.2.5, this section of the profile runs from Mheshpur Thana to Bagarpara
Thana and is composed of 13 stations. This profile is the central part of the study area.
High resistivity can be seen slightly. Low to middle resistivity can be seen at a depth of more
than 150m.
1-6) Profile F-F’
This profile, composed of 10 stations, runs from Sharsha Thana to Abhaynagar Thana, as shown
in Figure 2.2.6. Profile F-F’ is similar to profile D-D’.
1-7) Profile G-G’
This profile runs through Sharsha Thana, Manirampur Thana and Abhaynagar Thana in the
southern part of the study area, as shown in the Figure 2.2.7.
High resistivity can be seen at the surface in Manirampur Thana. Middle resistivity can be seen
at a depth of 100m in the vicinities of Maniranpur Thana and at 300m in depth eastward from
Keshabpur Thana to Abhaynagar Thana.
Low resistivity can be seen at the surface in Abhaynagar Thana.
2) Resistivity sections
Resistivity sections along the seven profiles, from A-A’ to G-G’, are presented in Figures 2.2.8
to 2.2.14. The locations of these profiles are shown in Figure 2.1.7. The final inversion results
have been used as existing well data and geologic log data.
Resistivity is one of the most variable of physical properties. The resistivity range of rocks is as
follows (source in “Handbook of Physical Constants”).
2-28

Chapter 2 Subsurface Hydrogeological Structure Supporting Report 1
Table 2.2.1 Resistivity range of rocks
Geologic age
Marine sand, Shale,
Greywacke
Terrestrial sand,
Claystone, Arkose
Volcanic rocks
Granite Gabbro, etc
Limestone, Dolomite,
Anhydrite, Salt
Quaternary,Tertiary 1-10 15-50 10-200 500-2000 50-5000 Mesozoic 5-20 25-100 20-500 500-2000 100-10,000
Carboniferous 10-40 50-300 50-1,000 1000-2000 200-100,000 Pre- Carboniferous
Paleozoic 40-200 100-500 100-2,000 1000-5000 10,000-100,000
Precambrian 100-2000 300-5,000 200-5,000 5,000-20,000 10,000-100,000
Table 2.2.2 Summary of Lithological Interfaces in borehole Borehole Lithology Depth(m) Thickness(m)
Dudhpatila Silt 0.00-7.00 7.00 FS consists of clay 7.00-60.00 53.00 FS/MS 60.00-126.50 66.50 FS/MS(with little gravel) 126.50-166.00 39.50 FS/MS(with big gravel) 166.00-228.30 62.30 Silt/FS 228.30-241.00 12.70 FS/MS 241.00-276.78 35.78 Silt/FS 276.78-300.00 23.22 Chuadang / Silt 0.00-7.60 7.60 Hat Kaluganj FS consists of clay 7.60-42.62 35.20 FS/MS 42.62-121.00 78.38 FS/MS(with little gravel) 121.00-164.00 43.00 FS/MS(with big gravel) 164.00-232.20 68.20 Silt/FS 232.20-237.50 5.30 FS/MS 237.50-300.00 62.50 Krishna Chandpur Silt 0.00-6.00 6.00 VF/MS 6.00-60.00 54.00 FS/MS 60.00-102.00 42.00 CS 102.00-145.00 43.00 Arappur Chandpara Silt 0.00-4.62 4.62 VF/MS 4.62-23.35 18.73 FS 23.35-47.00 23.65 MS/CS/MS 47.00-70.50 23.50
VF:Very Fine Sand, FS:Fine Sand, MS:Medium Sand, CS:Coarse Sand
The subsurface geology is not fully understood in the study. In particular, there is no existing
deep tube well data for the Chuadanga District area. According to the existing geological data,
clay or silt is commonly found. The thickness is from a few meters to 30m. In Keshabpur Thana,
the clayey layer occurs below depths of 60 to 120m. Its thickness is about 200m. In the western
part of Jessore District, the existing wells often encounter a deep clayey layer at depths of 150
to 270m.
The objective of core boring was to obtain hydrogeological information on the study area. The
core boring is carried out at 4 locations of Dudpatila Mouza (near TEM record no.CHU0731
station) of Dhamurhuda Thana, Chuadanga Mouza (CHU0421) and Hat Kaluganj Mouza
2-29

Chapter 2 Subsurface Hydrogeological Structure Supporting Report 1
(CHU0071) of Chuadanga Thana, Krishna Chandpur Mouza (JHE1041) of Moheshupur Thana
and Arappur Chandpara (JHE1211) of Jhenaidah Thana.
A summary of the depth and thickness of lithology observed in boreholes is given in Table 2.2.2
on the basis of the above result, when interpreted in the context of the geological setting.
2-1) Profile A-A’
The layer models of this profile, shown in Figure 2.2.8, are almost of the LHML type.
Subsurface resistivity is low, and the overburden thickness is about 70m in the Jibannagare
Thana and about 50m in the other Thana. The high resistivity of the second layer is from 50m in
the south to 100m in the north. The middle of the third layer is thick, with a thickness of about
200m. The lowest resistivity values are found at from 200m in depth in the south to 400m in
depth in the north.
This profile is carried out core boring at 4 stations, TEM record no.CHU0421, CHU0071,
CHU0731 at a depth of 300m, and JHE1041 at a depth of 145m. Each station of TEM survey
was located more than 500m from core boring, for unfavorable survey location include noise
statistics determined by transmission line and the other conductive materials.
According to the lithological descriptions of core boring data, the silt and/or clay layer is
composed with a thickness of 40 to 60m from the ground surface. The layer below the silt
and/or clay layer, the thickness of the fine sand or medium sand layers.
The existing well data of Jikargacha Thana is as follows: TEM record no. JES0411, JES0301,
JES1091 and JES1271.
The existing wells were drilled to a depth of 190 to 250m close to JES0411, JES0301, JES1097,
JES1271 and JES1351. The clay layer exists at depths from the ground surface to 30m, and at
depths of 100 to 250m.
From this, it may be inferred that the sand layer contains gravel from 120 to 230m. The Low
resistivity zone (L) of this profile is regarded as silt and/or clay layer. The sand layer contains
gravel indicating that the high resistivity zone (H) is regarded as gravel. Most of the deepest
layer is regarded as the silt and/or clay layer.
2-2) Profile B-B’
The layer models of this profile are the LHML type in the Kaliganj and Jessore Thana area, and
the LHLML type is in the northern part and in the southern part (see Figure 2.2.9).
Subsurface resistivity is low, and the overburden thickness is about 30m in the southern part and
about 50m in the northern part. The thickness of the high resistivity layer is from 30m in the
south to 100m in the north. The middle layer is thick, with a thickness of about 200m. Low
resistivity is found at from 300 to 400 m in depth.
The existing well data of Kheshabpur Thana is characterized by a thick clayey layer of more
2-30

Chapter 2 Subsurface Hydrogeological Structure Supporting Report 1
than 40m, and the clay of the second layer occurs between 100 to 200m (near JES1024 station).
In Manirampur Thana, the clayey layer ranges in depth from 70 to 120m (near the JES1002). In
Kaliganj Thana, the clay exists at a depth of 30m from the ground surface (near the JHE0891).
Comparing the existing wells of this profile, the thickness of subsurface low resistivitiy (L) is
regarded as the clay layer and its clay layer has an approximate depth of more than 50m. And
moreover, in the Keshabupur area it is regarded as the sand with silt and/or clay layer from 80 to
200m in depth.
2-3) Profile C-C’
The layer models of this profile are the LHML type in the western part of the Chuadanga Thana
area, and the LHLML type in the southern part (see Figure 2.2.10).
A core boring was conducted in Chuadanga Thana (near CHU0421). According to the existing
well data of Sailkupa Thana, most of the sand layer is more than about 150m in depth (near the
JES0071).
From the viewpoint, resistivity is regarded as a clay/silt layer occurring at a depth less than 50m.
The sand layer containing gravel is regarded as in the high resistivity zone (H) to the middle
resistivity zone (M). The (M) is thin in the eastern part and thick in the western part.
2-4) Profile D-D’
The layer models of this profile are almost of the LHML type as show in Figure 2.2.11.
Subsurface resistivity values are overburden thin, about 50m. The high resistivity layer is from
50 to 100m. The middle layer is thick in Kochandpur Thana (more than 200m) and thin in
Moheshupur and Jhenaida Thana (about 100m). Low resistivity is found at a depth of 200m in
Jhenaidah Thana, and it is deeper in the Moheshupur area.
The existing well data shows an existing sand layer at a depth of more than about 150m (near
the JHE0151, JHE0281, JHE1041, JHE1511, JHE0452, JHE1111, JHE1531 and JHE2251). At
JHE1041 and JHE1111 there is a clay/silt layer occurring at a depth within 40m from the ground
surface.
Regarding the layers of this profile, the high resistivity layer is regarded as the sand layer
containing gravel. The middle resistivity layer is regarded as the sand layer, and the low
resistivity layer is regarded as the lower layer consisting of sand and silt.
2-5) Profile E-E’
The layer models of this profile are almost all of the LHML type, and in the middle part is the
LHLML type (see Figure 2.2.12).
The existing wells were drilled to a depth of 130m close to the JHE0151 and JHE0851. The clay
layer is about 10m from the ground surface. The layers below the clay layer are fine sand or
2-31

Chapter 2 Subsurface Hydrogeological Structure Supporting Report 1
medium sand and coarse sand. The existing wells near JES1352 are mainly in the sand layer,
drilled to a depth of 220m, and the clay layers are found sporadically in the sand layer.
The layer of this profile is regarded as depth less than 50m of probable clay layer. The other
layers are composed of the sand. The deepest layer is regard as the sand with silt and/or clay
layer.
2-6) Profile F-F’
The layer models of this profile are the LHLML type (see Figure 2.2.13).
The existing wells were drilled to depths ranging from 210 to 250m. The wells are JES0411,
JES0591, JES0771, JES2131 and JES0502.
This well data is characterized by the thickness of the clay layer. The clay exists at a depth of
35m from the ground surface, existing that the clay layer at a depth between 65 and 140m (at
JES0502 station). The well data from near the JES0411 station shows a clayer layer at 150 and
250m.
Comparing the existing wells of this profile, the thickness of the clay layer is regarded as less
than about 50m from the subsurface, and between 50 to 150m at the Abhaynagar Thana. In
Sharsha Thana, it is regarded as between 100 to 220m. Some other layer is composed of sand.
2-7) Profile G-G’
The layer model of this profile is almost of the LHLML type (Figure 2.2.14).
The existing 12 wells were drilled to depths ranging from 160 to 310m. The thickness of the
clay layer is from few 10 to 50m. The clay of the second layer occurs below depths of 70 to
200m. The TEM no JES0281 in Keshabpur Thana is particularly thick at more than 210m.
This profile of inversion models is similar to that of the existing well data.
3) Mapping of Resistivity layer depth
3-1) First layer depth (Low resistivity zone)
The map in Figure 2.2.15 shows the first layer depth generated from the inversion results.
In this figure, blue indicates low resistivity is shallow and yellow indicates its deep.
In general, the depth of the low resistivity increases from southeast to northwest, in the eastern
and western part of the study area where low resistivity is deep. The first layer depth is shallow
(less than 30m) around Keshabpur Thana and Sailkupa Thana. On the other hand, the layer is
deeper (more than 60m in depth) around Jibannagar Thana and Jhenaida Thana.
As mentioned before, these features of the first low resistivity depth probably result from the
clayey layer or sand layer.
3-2) Second layer depth (High resistivity zone)
2-32

Chapter 2 Subsurface Hydrogeological Structure Supporting Report 1
This map indicates the second layer depth of the high resistivity zone (see Figure 2.2.16).
The red on this map indicates it is deep and the blue indicates it is shallow.
The depths of the low resistivity increase from southeast to northwest. The depth to the low
boundary of the second layer in the area varies greatly from 30 to 200m below the ground
surface. The central part of the study area is deep at the north-south direction.
4) Summary
Transient electromagnetic (TEM) prospecting was successful in acquiring geology data for the
groundwater development in the study area. This survey was implemented to define the
distribution of layers composed of silt, clay and sand formations.
Since it may, however, be difficult to determine uniquely the contact of each layer from the
inversion results, calibration against test-well drilling and core-boring will be required to obtain
the most reliable and best results. Furthermore, based upon the calibration, extrapolation to the
other stations by a detail survey is necessary.
Reference Geonics limited, 1992, PROTEM 47 Operating Manual 2.1.
Geonics limited, 1993, PROTEM 57D (C) Operating Manual.
Geol.Soc.Am.Mem.97, 1966, Handbook of Physical Constants.
2-33


CHAPTER 3
DETAIL INFORMATION OF ARSENIC TESTING LABORATORY
Supporting Report 1

Chapter 3 Detail Information of Arsenic Testing Laboratory Supporting Report 1
CHAPTER 3 DETAIL INFORMATION OF ARSENIC TESTING LABORATORY
3.1 Objective of the laboratory In order to provide accurate data on the arsenic content in a sample, atomic absorption
spectrometer was installed in laboratory established within study area. The technical
specification of this equipment is determined considering technical aspects such as detection
limit, sample handling capacity as well as after-service availability in Bangladesh. To elaborate
on the above, a better detection limit can be provided by attaching a Hydride Vapor Generation
(HG) unit prior to AAS injection. Also to increase the capacity for the number of sample
analyses per day, a continuous flow-injection type HG unit was selected instead of a batch type
system.
3.2 Utility and infrastructure In order to install a testing laboratory in a rural area
such as Jhenaidah, which includes site selection, the
following are required.
Site requirement for laboratory installation.
Power requirements
Generally, testing equipment such as AAS requires stabilized voltage and a continual power
supply though these are fluctuant in developing countries. Therefore, a stabilizer, uninterruptible
power supply (UPS) and power generator are set in this laboratory.
UPS (including stabilizer function) Power generator
3-1

Chapter 3 Detail Information of Arsenic Testing Laboratory Supporting Report 1
Water supply requirements
Laboratory requires suitable water works, water outlet
and return water drain to supply tap water continuously
for preparing laboratory water, rinsing glass wares, etc.
However, the provision time of tap water is limited at
the laboratory site. So a reservoir tank is set to keep the
required water.
Sink
Gas requirements
In testing, only Argon, a carrier gas, is set for analysis
according to the specifications as follows:
Supply pressure 0.35MP
Purity ≧99.9%
Max. consumption 70ml/min
For safety, the gas cylinder is located and set according to
the following conditions:
Not exposed to heat sources such as direct sunlight, a
maffle furnace, or a water distillation device
Sufficiently ventilated
Place upright and chained tightly to prevent it from
tumbling Argon gas cylinder
Ventilation system
A ventilation duct with a hood is located above the
atomizer of AAS to keep the exhaust duct working
during the measurement to remove poisonous arsine
gas emitted from the device. The hood, duct, and
ventilation fans are all made of metal to prevent them
from being softened by heat.
Ventilator
3-2

Chapter 3 Detail Information of Arsenic Testing Laboratory Supporting Report 1
Free from dust
Since AAS is sensitive to dust, the laboratory requires a tiled
floor and is always to be cleaned with a vacuum cleaner.
Cleaning with a broom is not desirable.
Vacuum cleaner
Light intensity
The luminous intensity of the laboratory is set below
1300Lx (in case of fluorescent lamp) in order to
prevent influence by strong light in the laboratory.
Installation of air conditioner
Room temperature and humidity
The ambient temperature range is 10 to 35 and the humidity is 45 to 80%. Absorbance varies
0.005abs as the temperature changes 1 , therefore installation of an air conditioner is
necessary.
3-3

Chapter 3 Detail Information of Arsenic Testing Laboratory Supporting Report 1
Safety equipment
Safety equipment such as a safety shower, disposable gloves, goggles, and foot protection are
set in laboratory.
Facility design of laboratory
The laboratory facility design for testing arsenic takes workability and safety into consideration.
From this view point, the layout should be as shown in the following figure.
Sample store room
In order to safely keep a lot of samples cool and shaded, installation of a sample storeroom is
essential and all samples should be arranged in order in this room so that they can be taken out
immediately when required.
Samples to be individually numbered Shelves in the storeroom
3-4

Cha
pter
3
Det
ail I
nfor
mat
ion
of A
rsen
ic T
estin
g La
bora
tory
Su
ppor
ting
Rep
ort 1
Layo
ut o
f lab
orat
ory
equi
pmen
t
Foot
mat
Dis
tilla
t
Foot
mat
Refr
iger
ator
Elec
tric
bal
ance
Pers
onal
com
pute
r
Pers
onal
com
pute
r
Wor
k de
sk
Wor
k
desk
Wor
k de
sk
Wor
k de
sk
Wor
k
desk
Shel
f
Dei
oniz
e fil
ter
Pre
filte
r
Elec
tric
Wor
k de
sk
3-5

Chapter 3 Detail Information of Arsenic Testing Laboratory Supporting Report 1
3.3 Guideline for quality control of field sampling and testing In order to avoid problems such as mistakes in sample records, pretreatment, sample
mismanagement, and unreliable testing, a guideline was prepared (Annex 2). The guideline is
attached for reference and will be revised after discussion and the technical transfer to DPHE,
the counterpart of the project.
3.4 Training Sustaining the installed laboratory is one major task of this project. To do to this, technology
transfer and training for the DPHE chemists are essential. A series of technical transfer activities
is going on now.
(1) Preliminary training
A preliminary training program for the AAS system was provided in the form of a short training
course from August 2 to 3, 2000. Participants from DPHE for the course are as follows.
Mr. Fakhar Uddin Senior Chemist DPHE Mymensingh
Mr. Abdus Saltar Miah Senior Chemist DPHE Khulna
Mr. Siddique Amin Senior Chemist DPHE Rajshahi
Mr. Panna Lal Senior Chemist DPHE Comilla
Mr. Anisur Rahman Khan Junior Chemist DPHE Mymensingh
Mr. Mohammad Mustaque Junior Chemsit DPHE Comilla
Detail of the short course is given below.
2nd August 2000 Time Topics Resource Venue 9:00 am Reporting DPHE 9:15 am Introduction of JICA study M. Fukuda DPHE JICA expert 9:30 am Introduction to Atomic Adsorption T. Higo DPHE Spectroscopy for Arsenic Analysis JICA expert 10:45 am Break 11:00 am Introduction to QC in laboratory M. Fukuda DPHE JICA expert 12:00 am Lunch 2:30 pm Overview of SHIMSDZU AAS Engr. Nuruzzaman Plasma Plus for trace metal analysis Chief Engineer AQC KC Poddar Application Manager Plasma Plus 5:00 pm Close of day 1
3-6

Chapter 3 Detail Information of Arsenic Testing Laboratory Supporting Report 1
3rd August 2000 Time Topics Resource Venue 9:00 am Arsenic Analysis using AAS KC Poddar Plasma Plus Hand on practice 10:30 am Break 11:45 am Hand on practice (continue) KC Poddar Plasma Plus 12:00 am Lunch 1:30 pm Hand on practice (continue) KC Poddar Plasma Plus 3:00 pm Evaluation M. Fukuda Plasma Plus 3:30 pm Closing
(2) On the job training
The short training course is considered as an introduction to the subject. Following the course,
on the job training at the Khulna laboratory for pre-treatment and at the Jhenaidah JICA Study
Team laboratory using the AAS system was conducted. The participants and contents were as
follows:
14th February 2000 Participant Mr. Pawna lal Chowdhury Senior Chemist DPHE Khulna Mr. Sirajurl Haque Junior Chemist DPHE Khulna Date Topics Resource Venue 14th JICA Study Team Lab M. Fukuda Jhenaidah
opening ceremony JICA expert JICA Study Team Lab 12th Guidance for the laboratory T. Higo Jhenaidah Lab JICA expert JICA Study Team Lab
21-23 November 2000 Participant Mr. Abdus Saltar Miah Senior Chemist DPHE Khulna Mr. Sirajurl Haque Junior Chemist DPHE Khulna Date Topics Resource Venue 21st Guidance for pre-treatment T. Higo Khulna
of testing arsenic (digestion) JICA expert DPHE Lab 22nd Demonstration of pre-treatment T. Higo Khulna Lab
JICA expert DPHE Lab 23rd Demonstration of pre-treatment T. Higo Khulna
(continuation) JICA expert DPHE Lab
3-7

Chapter 3 Detail Information of Arsenic Testing Laboratory Supporting Report 1
7th, 12th February 2000 Participant Mr. Sirajurl Haque Junior Chemist DPHE Khulna Date Topics Resource Venue 7th Guidance for AAS system T. Higo Jhenaidah
of testing arsenic JICA expert JICA Study Team Lab 12th Arsenic Analysis using AAS T. Higo Jhenaidah Lab “Preparation of standard solution JICA expert JICA Study Team Lab and construction of calibration curve T. Higo Jhenaidah Lab
(Hand on practice)
3.5 Laboratory Business Plan In order to run the laboratory after the project finishes and to aim at effective use for arsenic
mitigation, a Laboratory Business Plan (Annex 1) was planned in May 2001 and samples from
NGOs have been already tested on demand.
Fifty samples have already been collected and tested at the Jhenaidah laboratory. However, 500
Tk/sample, the fixed price of DPHE, seems to be expensive for the villagers. If the price can be
decreased, more external samples will be collected from outside and will help the laboratory
business.
3.6 Recommendation for sustainable operation As for technical transfer of arsenic analysis and laboratory management, there are some
recommendations.
1. In this laboratory, not only data processing, but also analysis operation of AAS are
computerized. Basic computer operation and use of “WizAArd”, the operation software of
the AAS system, must be learned by all laboratory staff.
2. In addition to 1., the use of database software such as “Excel” will be desirable. It will
reduce calculation errors and speed up data processing.
3. In order to keep analysis quality, not only the QC systems for this laboratory, but also some
intercomparison test with all DPHE laboratories should be carried out. In this case, this
laboratory will be able to manage this system since it has some advantages over the other
DPHE laboratory such as the latest production devices of distilled water and so on.
3-8

Chapter 3 Detail Information of Arsenic Testing Laboratory Supporting Report 1
Annex 1
Jhenaidah lab business plan May 16, 2001
DPHE-JICA Study Team
Introduction
The JICA Study Team first started the survey of groundwater arsenic contamination and its
measure in Bangladesh from May, 2000. The JICA Study Team installed the laboratory for
arsenic analysis in Jheanaidah in November of the same year, and over 1800 groundwater
samples have been analyzed until now. Although the survey activities of the JICA Study Team
will continue, in order to transfer this laboratory to DPHE smoothly from now on and to aim at
effective use for arsenic mitigation, a business plan for future groundwater arsenic testing at the
laboratory has been prepared.
1. Capacity of the Lab
The number of samples in the lab is about 50 samples per day including a certain amount of
margin. It follows:
50 sample x 22 day x 12 month =13200 sample / year
If the present organization and condition are maintained, arsenic analysis of at least 10,000
samples per year can be analyzed. On the other hand, DPHE collects external arsenic analysis
samples for 500Tk/sample. Therefore, if this lab can collect about 3,000 samples from outside,
this lab can recover the cost required for one year of operation as shown in next page.
2. Expenditure Cost Concerning Lab Management
Although the JICA Study Team has outlaid all the costs concerning management of a lab now,
after this project ends, the lab should be cared for under the management of DPHE. DPHE
needs to be lectured on a budget measure for future lab management. The cost concerning
management of this lab is shown in table-1 based on the actual result in 2000 (JICA Study
Team’s actual expenditure result).
3-9

Chapter 3 Detail Information of Arsenic Testing Laboratory Supporting Report 1
Table-1 Annual cost for running AAS(In case of measuring 50samples/day) (TK)
unit price unit amount/year cost/year120,000
HCl 1,400 L 37 51,100KI 7 g 9,600 67,200NaOH 15 g 960 14,400NaBH4 150 g 1,200 180,000
24,000Absorption cell 24,600 pcs 12 295,200Hollow cathode lamp 34,700 pcs 10 347,000Deuterium lamp 36,000 pcs 5 180,000Pump tube(for sample) 8,900 packet 5 44,500Pump tube(for reagent) 8,900 packet 5 44,500
28,000 cylinder 2 56,0006,500 pcs 3 19,500
Total/year(10,000samples) 1,443,400Filter cartridge for deionization
Argon Gas
Others
ItemElectricity
Reagent
3. Required man power
The staff required to manage the lab are as follows.
Senior chemist 1 person
・ General manager of the lab
・ A chemist who has full knowledge not only about arsenic testing but also about
general water quality analysis.
・ Someone who has received sufficient operation training of AAS with the JICA Study
Team or other training organizations.
・ Part-time job.
Junior chemist 1 person
・ Manager of the lab
・ A chemist who has full knowledge not only about arsenic testing but also about
general water quality analysis.
・ Someone who has received sufficient operation training of AAS with the JICA Study
Team or other training organizations.
・ Full-time job.
3-10

Chapter 3 Detail Information of Arsenic Testing Laboratory Supporting Report 1
Analyst 1 person
・ Assistant to Junior chemist.
・ A chemist with basic knowledge not only about arsenic testing but also a certain
amount of general water quality analysis.
・ Someone who has actually experienced arsenic analysis by AAS using an
auto-sampler with the JICA Study Team or other analysis organizations.
・ Should not only be sufficiently experienced in analysis but also fieldwork such as
sampling.
・ Should be able to arrange analysis results with spreadsheet software, such as Excel.
Sample collector 1 person
・ Assistant to junior chemist.
・ Someone who has conducted arsenic contaminated groundwater sampling with the
JICA Study Team or other analysis organizations etc., should have sufficient fieldwork
experience.
・ Should also have experience in lab work, adjustment of a reagent, etc.; should be a man
with sufficient experience in auxiliary work.
Security guard 1 person
Messenger
4. Training and a lab taking over schedule
Training in this lab started from December of last year, and the chemist of Khulna is expected to
further the plan based on the previous training as follows from now on.
1st phase (May to June, 2001)
-OJT by JICA Study Team-
Technical instruction of lab analysis and sampling by the JICA Study Team is being done.
DPHE chemist masters the method of arsenic analysis using AAS through on the job training.
DPHE chemists shall participate in the OJT about 2 days a week continuously. Assistants are
provided from the JICA Study Team.
2nd phase (July to August, 2001)
-DPHE and JICA Study Team in cooperation-
In this stage, not only lab analysis and sampling but technology transfers other than analysis,
such as data arrangement, sample management, etc., are performed. Moreover, an external
3-11

Chapter 3 Detail Information of Arsenic Testing Laboratory Supporting Report 1
sample acceptance organization is prepared. DPHE chemists shall work in the lab about 4 days
in a week continuously. Assistants are provided from the JICA Study Team.
3rd phase (October to December, 2001)
-Launching lab work by DPHE-
DPHE performs lab analysis and a sampling. Although the JICA Study Team performs technical
instruction if needed, the management of business is transferred to DPHE. In this stage,
technology is transferred about lab management enterprises at large, such as the start of external
sample acceptance, and preparing a training program for other DPHE chemists. DPHE appoints
DPHE chemists to this lab as a full-time job. Assistants are also provided by DPHE.
5. Time schedule
Time DPHE JICA Study Team 1st phase (May to June, 2001)
Send DPHE chemist as a trainee about 2 days in a week Start budget measure for lab Start man power planning (stuff up assistants, arrange chemist)
Run OJT for AAS etc. Provide lab assistants
2nd phase (July to August, 2001)
Send DPHE chemist as a co-worker about 4 days in a week Start planning for external sample acceptance organization
Run OJT for other than analysis Provide lab assistants
3rd phase (October to December, 2001)
Arrange DPHE chemist as a full-time lab manager. Start lab management by DPHE Start an external sample acceptance Prepare training program to other DPHE chemist Provide lab assistants
Support lab management for DPHE
Bold letters show Chief Engineer’s matter
3-12

Chapter 3 Detail Information of Arsenic Testing Laboratory Supporting Report 1
6. Recommendation
Man power
While the lab work requires staff with special knowledge, availability of such staff with
experience of the AAS installed in this lab is very limited in Bangladesh. In such a situation, it
is considered to be most suitable for DPHE to re-employ two assistants of the lab currently
hired by the JICA Study Team.
Budget measure
In order to manage the lab fully operational, a large budget is required. However, if the contract
unit price of an external acceptance for 3000 samples is set for example, at 500TK / sample, all
costs required for this lab will be covered. Moreover, in order to operate this lab in a good state,
it is desirable to analyze a fixed quantity of the sample regularly.
The management income and outgo in the 2001 fiscal year
Since this fiscal year, the lab is still under the care of the JICA Study Team, it is expected that a
certain amount of consumables for analysis, such as existing reagents, will remains (Table-2)
although arsenic analysis is continuously performed. These items will help to launch this lab
management enterprise by DPHE to some extent.
Tab le-2 Stock of consum ab les for AAS
(as of May, 2001 )
Reagent HCl 75 L
KI 1960 g
NaOH 600 g
NaBH4 380 g
Absorp tion cel l 4 pcs
Ho llow cathode lam p 0 pcs
Pum p tube(for sam p le) 3 packet
Pum p tube(for reag ent) 3 packet
Item p resent am ount
3-13

Chapter 3 Detail Information of Arsenic Testing Laboratory Supporting Report 1
Annex 2
JICA Study Team Arsenic testing laboratory
Guideline for quality control of field sampling and laboratory testing
Documented February 2001
JICA Study Team
3-14

Chapter 3 Detail Information of Arsenic Testing Laboratory Supporting Report 1
Introduction This guideline is for field sampling and laboratory operation to get reliable data.
This guideline consists of summaries of testing, standard operation procedures (SOP), quality
control (QC) systems, and records.
QC programs include QC samples such as field blank, duplicate sample, spike sample,
calibration, as well as the procedure for determination of quantification limits. QC is essential
for laboratory operation.
Summaries of testing include associated documents such as testing method, procedures for
handling and receiving samples, major equipment, and maintenances of equipments, waste
treatment and disposal management, organizing laboratory for safety.
SOP describe the analytical methods to be used the laboratory.
Records include logbooks for testing, including preparation and analysis of each sample serial
No., associated standards and QC samples, date of preparation and analysis, analyst, volumes of
used, remarks.
1. Summaries of testing In this laboratory, the testing method of arsenic concentration is based on the Japanese Industrial
Standard: “Methods for the examination of water for industrial use (JIS-K-0101)” and American
Water Works Association: “Standard method for the examination of water and waste water, 20th
edition”.
In this laboratory, the arsenic concentration in groundwater is measured as total arsenic, the
concentration of arsenic tested on unfiltered samples, by atomic absorption photometry.
Digestion pre-treatment
Some pond water samples are also tested to determined arsenic. In this case digestion
pretreatment is essential to reduce interference by organic matter
Apparatus
・ Hot plate
・ Conical beakers, 300ml
3-15

Chapter 3 Detail Information of Arsenic Testing Laboratory Supporting Report 1
・ Watch glasses
・ Volumetric flasks, 25ml
Chemicals
・ Nitric acid, conc.
・ Sulfuric acid, conc.
Procedure
Transfer 25ml of sample to a conical beaker. Add 2ml of conc HNO3 and a few boiling chips.
Boil slowly on hot plate and evaporate to 10ml. Add 2ml of conc HNO3 again and 5ml of
H2SO4. Evaporate on a hot plate until dense white fumes of SO3 just appear. If solution doesn’t
clear, add 2ml of HNO3 and repeat evaporation to fumes of SO3. Heat to remove all HNO3
before continuing treatment. Cool and wash down beaker walls with a little laboratory water and
then filter if necessary. Transfer filtrate to a 25ml of volumetric flask with rinsing water to the
volumetric flask. Cool and dilute to mark, and mix thoroughly (see SOP).
Atomic absorption spectrometry
In order to provide accurate data on the arsenic content in the sample, the atomic absorption
spectrometer is installed in laboratory to be established within study area. Technical
specification of this equipment is determined considering technical aspects such as detection
limit, sample handling capacity as well as after-service availability in Bangladesh. To elaborate
the above, a better detection limit can be provided by attaching a Hydride Vapor Generation
(HG) unit prior to AAS injection. Also to increase the capacity for the number of sample
analyses per day, a continuous flow-injection type HG unit was selected instead of a batch type
system.
Principle
This equipment is applicable to the determination of arsenic through conversion to its hydrides
by sodium borohydride and aspiration into an atomic absorption atomizer.
As(III) is instantaneously converted by a sodium borohydride reagent in an acid solution to its
volatile hydrides. The hydrides are purged continuously by argon into an atomizer of an atomic
absorption spectrometer and converted to gas-phase atoms. The sodium borohydride reducing
agent by rapid generation of the hydrides in a reaction coil, minimizes dilution of the hydrides
3-16

Chapter 3 Detail Information of Arsenic Testing Laboratory Supporting Report 1
by the carrier gas and provides rapid, sensitive determinations of arsenic.
Absorption cell
Reaction coil Peristaltic Pump Sample HCl
NaBH4
Carrier gas (argon) Valve Flow diagram of cont
At room temperature and solution pH va
relatively slowly by sodium borohydride
arsine, The arsine atomic absorption pea
for As(v) when compared to As(III). De
arsenic compounds be in the As(III) s
previously to As(III).
Manifol
Gas/liquid separator
Drain s
Pressure
inuous hydride generation system
lues of 1 or less, the As(V) state of arsenic is reduced
to As(III), which is then instantaneously converted to
ks commonly are decreased by one fourth to one third
termination of total arsenic requires that all inorganic
tate. Therefore, it is necessary to reduce the sample
3-17

Chapter 3 Detail Information of Arsenic Testing Laboratory Supporting Report 1
Apparatus
・ Atomic absorption spectrometer
・ Hydride vapor generation unit
・ Muffle heater.
・ Absorption cell of cylindrical quartz cell
Reagent
Hydrochloric acid, HCl(1+1)
Sodium borohydride reagent: Dissolve 2.5gr sodium hydroxide and 2.0gr sodium
borohydride in laboratory water in this order and add water to 500ml.
20% W/V potassium iodide solution
Commercial standard solution of arsenic (1000ppm As)
Intermediate arsenic solution (100ppb As): Dilute 1ml of commercial standard solution to
100ml with laboratory water
Standard arsenic solution: Dilute 1, 2, 5ml of intermediate solution to 100ml with laboratory
water.
Certified reference material (CRM)TMDA-53.2: produced from the National Water Research
Institute,
Procedure
(a) Samples are required to be inorganic. Organic samples such as pond water are to be
digested as mentioned above.
(b) To get an As(III) sample, add 1ml of 20%W/V potassium iodide solution and 1ml of
hydrochloric acid to 10ml of the standard solution or the sample solution , and leave it
for about 15min. at room temperature( see SOP).
(c) Load reagents, set the aspiration rate of sample and reagents, then run the hydride
vapor generation unit for at least 15 min before instrument calibration.
3-18

Chapter 3 Detail Information of Arsenic Testing Laboratory Supporting Report 1
(d) Start-up atomic absorption spectrometer
(e) Set the samples, blanks, CRM and standard solution to auto sampler unit
(f) Start-up personal computer for measuring operation and data processing
Calculation
In this AAS system, construction of a calibration curve by plotting peak areas of standards
versus concentration of standards, measuring peak areas of samples and reading concentrations
from curve are computerized. Therefore, reported concentrations can be read directly after
standard calibration and actual concentrations are calculated by diluted factors.
Where:
Arsenic mg/L = reported concentrationdilution factor
Major equipment
In this laboratory, major equipment of AAS system consist of
1. Optical bench
2. MS-Windows based PC hardware and software
3. RS-232C cable
4. Installation kit
5. Hollow Cathode lamps for Arsenic
6. HVG-1 Hydride Vapor Generator
7. SARF-16C Atomic Muffle Electric Cell Heater
8. ASC-6100 Auto Sampler with Table Assembly
Including necessary spare parts and accessories and the specification is as follows:
3-19

Chapter 3 Detail Information of Arsenic Testing Laboratory Supporting Report 1
Technical specification of SHIMADZU AA-6800G, HVG-1 system
Measurement wavelength 193.7 nm Spectrophotometer Slit width 1.0 nm Lamp Lamp mode BGC-D2
Software environment in laboratory
Windows98
Concentration conversion mode
Calibration curve
Loading parameter Template function
Data processing
Result Print out or file export of summary report Power requirement AC100V (transformer is necessary)
Ambient temperature range 10-35 Ambient humidity range 45-80% Measurement mode Continuous hydride generation method Reducing reagent Sodium borohydride Sample aspiration 6ml/min Reagent aspiration 1ml/min Atomizer Thermoelectric heated absorption cell
Continuous hydride generator
Carrier gas Argon gas, supply pressure o.32Pa, consumption 70ml/min.
Procedures for handling and receiving samples
These procedures are based on American Water Works Association: “Standard method for the
examination of water and waste water, 20th edition”
1.Sample container and field treatment
The type of sample container used is important when sampling and testing a very low analyte
level. In this testing, the sample containers are made of polyethylene with a polyethylene cap.
Use only containers that have been acid rinsed. Samples are acidifyed immediately after
sampling by concentrated hydrochloric acid (HCl) to pH <2. Commercially available
high-purity HCl (As ≦ %) in Bangladesh is used for acidify.
After acidify, samples are stored in a cool-shady place. Laboratory water is used not only in
laboratory but also on sampling site for rinsing sampling equipment.
2.Field survey sheet and sample record format
3-20

Chapter 3 Detail Information of Arsenic Testing Laboratory Supporting Report 1
All information of field survey is recorded in the field survey sheets such as location of
sampling point, name and address of field and collector’s name. Sample code, sampling
procedure, collector’s name, sample shipper’s name, receive and identifier’s name, date of all
procedures mentioned above are all recorded in the sample record format. All sheets and
formats are kept in a safe place.(see attached sheet)
3.Sample delivery to the laboratory
Samples to the laboratory are delivered as soon as possible. The field sampler completes the
field work including sampling and notes required information in the field survey sheet and
sample record format. Laboratory personnel notes required information in the sample record
format when the samples are delivered to the laboratory (see attached format).
4.Receipt and logging of sample
In the laboratory, the laboratory personnel check the condition, label information, and seal of the
samples before the samples are accepted. After acceptance, the laboratory personnel assigns a
serial No., logs the samples in the computerized laboratory information system, and stores the
samples in the sample store room until they are tested .
5.Assignment of samples for analysis
The analyst assigns the samples for analysis. Once the samples are put in the laboratory, the
analyst is responsible for their care until they are returned to the storeroom.
6.Disposal of samples
Samples are held for the period of this project or until the data is reviewed and accepted. The
disposal is done in accordance with the Bangladesh approved method.
Maintenances of equipments
1.Lamp history
The lifetime of the hollow cathode lamp and deuterium lamp is essential for measuring arsenic.
3-21

Chapter 3 Detail Information of Arsenic Testing Laboratory Supporting Report 1
Check the lifetime of them frequently. This AAS system can count used time of these lamp
automatically by selecting this menu from the personal computer connected to AAS.
2.Pump tube replacement
As the pump tube is aged, the aspiration rate declines slowly with time. Therefore, the aspiration
rate is monitored by using a measuring cylinder once two weeks, and when the rate drops to
about 80% of the initial level, replace the tube with new one.
3.Absorption cell maintenance
The contamination of the absorption cell, made of transparent quartz glass is unavoidable even
when it is cleaned every day. If contaminated heavily, the surface of the absorption cell may be
activated to reduce the sensitivity. Soak the cell in about 25% acid solution for 1 night and rinse
with distilled water thoroughly at least once two weeks.
4.Gas/liquid separator maintenance
As in case of the absorption cell, heavy contamination may result in reduced sensitivity and
elevated noises. Soak the cell in about 25% acid solution for 1 night and rinse with distilled
water thoroughly at least once two weeks.
Waist treatment and disposal management
Treatment is essential to reduce toxicity of hazardous waste of laboratory. Even on a small scale,
treatment is required. Regulation in Bangladesh must be observed severely. In this laboratory,
mainly wastewater is required for treatment.
1.Chemical treatment
Drain water from AAS is acidic by hydrochloric acid. Therefore, in this laboratory,
neutralization of it using chemicals such as calcium hydroxide is regulated.
3-22

Chapter 3 Detail Information of Arsenic Testing Laboratory Supporting Report 1
2.Ultimate disposal
After wastewater treatment, only nonhazardous drain water can be discharged as wastewater.
2. Standard operating procedures Standard operating procedures (SOP) describe the analytical methods to be used the laboratory
operation. SOP includes as follows:(see attached references)
・ Title of test method
・ Date of documentation
・ Details on the actual test procedure
・ Sample preparation procedure
・ Calculations
・ Trouble shooting
3-23

Chapter 3 Detail Information of Arsenic Testing Laboratory Supporting Report 1
3. Records
Sample code and labels
Sample codes are set to prevent sample misidentification and include following information:
sample type, place of sampling, timing of sampling. Sample codes are labeled on the each
sample containers.
Sample record format and Log book
In this testing, trace ability is essential for sample identify from collection to data reporting.
Sample record format includes the ability to trace possession and handling of the sample from
the date of collection through testing. This process is required to demonstrate sample control
when the data are used for other purposes and also is useful for routine control of samples. A
sample is considered to be under a person’s custody or secured in sample storeroom restricted to
authorized personnel.
Data confirmation
Sometimes simple mistake such as miscalculation has occurred since a large number of samples
are measured in analyses. In order to prevent this, data confirmation sheet is installed (see
attached sheet). Laboratory staff except the analyst of the measuring must check the sheet to
confirm the result and sign it.
4. Quality control
Chemicals
All chemicals should be reasonable quality but some are critical in particular because AAS has
very high sensitivity. In case of using low-quality chemicals, it will result in unacceptable
testing data. In general, imported ones such as Wako, Kantou kagaku, Merck, Aldrich are to be
used.
1.Hydro chloric acid
It is very critical. HCl is used for acidify of samples and for the testing arsenic by Atomic
3-24

Chapter 3 Detail Information of Arsenic Testing Laboratory Supporting Report 1
Absorption Spectrophotometer (AAS). It is always running in the flow tube and easy to generate
contaminated arsenic. So maximum contains of arsenic is below 0.000001% for testing by AAS.
2.Potassium Iodide
Potassium iodide is used for pre-reduction of samples, standards, CRM and blank as a
pre-treatment of testing arsenic. It is used relatively high, so that laboratory grade is essential.
For preservation, it is kept in refrigerator.
3.Sodium Borohydride
Sodium borohydride is used for reduction of samples, standards, CRM and blank as a reduction
reagent of testing arsenic. Its sensitivity is directly affected, so that laboratory grade is required.
For preservation, it is kept in refrigerator.
Reagent
1.Laboratory water
Laboratory water is water with no detective concentration of arsenic to be analyzed by the
analytical method. To prepare high quality laboratory water is one of the most important factors
of analysis. Laboratory water is used for dilution of reagents, samples, and blank analysis. The
quality of Laboratory water is related directly to the analysis result. Therefore, the laboratory
water used our laboratory is produced by three steps procedures as, pre-filtration, distillation,
deionization and the water quality is set very high-class level (EC 0.1mS/m).
2.Laboratory blank
Laboratory blank consists of laboratory water and all reagents (HCl and NaBH4) that normally
are in contact with samples during the analytical procedure. The laboratory blank is used to
calculate the actual concentration of arsenic contained samples. Therefore, one laboratory blank
is tested with 20% basis of samples and if the concentration of it is higher than Quantitation
limit, take collective action.
3-25

Chapter 3 Detail Information of Arsenic Testing Laboratory Supporting Report 1
QC program
QC program consists of following parameters and is essential factor for generating good data.
1.Calibration
Perform initial calibration with a minimum of three concentrations of standards, and choose a
highest concentration at the upper end of the calibration range. Be sure that the calibration range
covers the analytical concentration values. In this testing arsenic by AAS, the calibration curve
includes some nonlinear portion of curve so that linear curve range is very narrow.
The minimum correlation of coefficient for the calibration curve must be specified. In this
testing, a minimum value for the correlation of coefficient is set 0.995. Compare each
calibration point to the curve and if any point is not within this criteria, identify the unsuitable
sources and correct before sample testing.
Calibration verification is also necessary, but initial and suitable interval confirmation is enough
because calibration curve has not change so significantly. Therefore, a verification of calibration
by analyzing a standard at a concentration near the midpoint of the calibration range is set, and
in this testing, Certified Reference Material (CRM) is used for this verification. In this testing,
the calibration verification is set by % recovery (75%≦R≦125%). If %recovery is out of
control, identify the unsuitable sources and correct before sample testing.
Where:
%100valuetruevaluefounderycovRe%
Calibration curve, itself, is not change so significantly, but sensitivity has changed continuously,
so the sensitivity correction of calibration curve is essential for testing sample. In this method,
reslope is set every 10samples by using the standard of highest concentration of calibration
curve.
2.Duplicate samples
3-26

Chapter 3 Detail Information of Arsenic Testing Laboratory Supporting Report 1
Duplicates are the two samples taken at the same time from one location. In this testing, the
maximum range is set within 20% of relative standard deviation (%RSD).
Where:
%100xsRSD%
n
i
i
nxx
1 )1(2)(S
n = total number of values,
3.Spike samples
Spike samples are used to evaluate measurement recovery in a sample matrix , As a minimum ,
one spike sample are set in one testing day. Spike samples are prepared from the known sample
and the standard solution that used for making calibration curve. Prepare different
concentrations of spike samples against one known sample, plot these concentration on the
graph, draw fitting linier line to y-axis, then read y-intercept of this fitting line and evaluate the
results obtained from these one set of spike samples. The standard of result for spike test is set
75%≦the original concentration of the sample≦125% in this laboratory.
4.Quantitation limit
Quantitation limit (QL) is one of the boundary values that can be quantified and all quantitative
measurement result must lie within this interval. Especially, minimum quantitation limit is
significant because different laboratories will produce different minimum quantitation limit
even though using the same analytical procedures. instruments, and sample matrices.
QL is set tentatively by Measuring laboratory blanks at least 20 times.
Where:
sQL 10 x S = standard deviation of laboratory blanks
n
i
i
nxxS
1 )1(2)(
x = average of laboratory blanks When tentative QL is set, measure the tentative QL concentration of laboratory standard at least
20 times. Compute %RSD and QL is finalized if the %RSD is within 10%. By this calculation,
the minimum QL is set 0.0005mg/l As in this laboratory and the maximum QL is set 0.005mg/l
that is the highest standard point of the calibration curve.
3-27

Chapter 3 Detail Information of Arsenic Testing Laboratory Supporting Report 1
Result of tentative minimum QL (by Measuring laboratory blanks)
Where: x = 0.000057292 = 7 S 0.00002084
No. As mg/l No. As mg/l
1 0.0000548 13 0.0000576
2 0.0000772 14 0.0000636
3 0.0000722 15 0.0000796
4 0.0000847 16 0.0000736
5 0.0000647 17 0.0000357
6 0.0000922 18 0.0000357
7 0.0000124 19 0.0000716
8 0.0000224 20 0.0000716
9 0.0000377 21 0.0000457
10 0.0000218 22 0.0000537
11 0.0000537 23 0.0000676
12 0.0000616 24 0.0000636
Tentative QL is
0.00020847×10+0.000057292 =0.000265762<0.0005mg/l
Result of minimum QL (by Measuring 0.0005mg/l of laboratory standard)
No. As mg/l No. As mg/l
1 0.0007173 11 0.0005795
2 0.0007303 12 0.0006194
3 0.0005817 13 0.0006394
4 0.0006617 14 0.0006794
5 0.0005862 15 0.0006305
6 0.0007288 16 0.0007154
7 0.0006216 17 0.0005544
8 0.0005945 18 0.0005686
9 0.0006016 19 0.0005565
10 0.0005442 20 0.0006193
Where: %RSD=9.6945<10% Therefore, minimum QL is set 0.0005mg/l
3-28

Chapter 3 Detail Information of Arsenic Testing Laboratory Supporting Report 1
Core Boring
CB - JS- - 0, 1~6 - As
ItemsAs ArsenicFeMn Fe and Mn(dissolved) MnHM other Heavy MetalOI other Items
Monthly monitoring time
Site code(Urban Rural)
Area code(JS, JD, CD)
Sample Type
3-29

Chapter 3 Detail Information of Arsenic Testing Laboratory Supporting Report 1
3-30
JICA Arsenic project Sample recording format between field and laboratoryArsenic (total) Arsenic (dissolved) Fe and Mn (dissolved) Heavy Metals Other Items
Sample CodeBottlecleaned Sample
Acidify byHCl
Bottleclenaed Sample
Filter andHCl
Bottleclenaed Sample
Filter andHNO3
BottelClenaed Sample
Acidify byHNO3
Bottleclenaed Sample
1 2 3 4 5 6 7 8 9
10 11 12 13 14 15 16 17 18
29 30
Field to JICA study office Sample packed by
date Sample shipped by
Sample received and confimed by
JICA study office to laboratory (except for Aresenic)Sample shipped by
dateSample received and confimed by

Chapter 3 Detail Information of Arsenic Testing Laboratory Supporting Report 1
3-31

Chapter 3 Detail Information of Arsenic Testing Laboratory Supporting Report 1
Data confirmation sheetTitle Date 03-Feb-01Summary ReportSample Conc. As:HVG dillution Actual Conc(ppb) Actual Conc(mg/l)CRM 3.7218 10 37.218 0.037218sample001 0.205 0 0sample002 1.7745 10 17.745 0.017745sample003 1.2606 100 126.06 0.12606sample004 0.5502 10 5.502 0.005502sample005 6.6473 10 66.473 0.066473sample006 2.0092 100 200.92 0.20092sample007 4.1984 10 41.984 0.041984sample008 4.3314 10 43.314 0.043314sample009 0.4479 0 0sample010 1.2932 100 129.32 0.12932sample011 ***** #VALUE! #VALUE!sample012 0.937 1.25 1.17125 0.00117125sample013 4.2665 10 42.665 0.042665sample014 ***** 10 #VALUE! #VALUE!sample015 0.5782 2.5 1.4455 0.0014455sample016 0.1448 0 0sample017 1.9659 100 196.59 0.19659sample018 2.079 100 207.9 0.2079sample019 0.8595 100 85.95 0.08595sample020 0.2697 0 0sample021 4.0559 100 405.59 0.40559sample022 1.7197 100 171.97 0.17197sample023 2.1325 100 213.25 0.21325sample024 1.1144 100 111.44 0.11144sample025 1.3611 100 136.11 0.13611sample026 0.7532 100 75.32 0.07532sample027 100 0 0sample028 100 0 0sample029 0.1502 1.25 0.18775 0.00018775sample030 0.1414 1.25 0.17675 0.00017675sample031 5.0451 0 0sample032 1.8207 20 36.414 0.036414sample033 3.1358 10 31.358 0.031358sample034 3.9094 100 390.94 0.39094sample035 2.6942 100 269.42 0.26942sample036 3.7923 20 75.846 0.075846sample037 3.8524 20 77.048 0.077048sample038 1.9516 20 39.032 0.039032sample039 0.3794 0 0sample040 0.4209 0 0sample041 1.1817 1.25 1.477125 0.00147713sample042 2.0278 50 101.39 0.10139sample043 2.2322 20 44.644 0.044644
0 00 00 00 00 00 00 00 00 00 0
Sample No. and Dillution are confirmed by
3-32

Chapter 3 Detail Information of Arsenic Testing Laboratory Supporting Report 1
SOP for starting AAS (Usual operation)
SOP written by Dated
1. Open argon gas cylinder 2. Switch on UPS, AAS main device, hydride vapor generator, atomic muffle, personal
computer. 3. Open “WizAArd”, software for operation of AAS, on the computer, then “WizAArd
Selection window” will be opened. Click “cancel”. 4. Fluorinated rubber tube (black rubber tube connected between absorption cell & the
gas/liquid separator) must be disconnected from the gas/liquid separator since absorption cell will move for setting up the position automatically.
5. Open “instrument parameter” menu, then click. Connect & wait for few minuets in order to
conform the connection between computer and AAS device. When the connection complete, click “OK”.
6. Open the file “Standard Operation for 60 samples”, already arranged file for operation,
MRT table for As analysis will be opened. 7. Open “Edit Parameters” and turn on hollow cathod lamp on it. After that do “Line Search” 8. Connect fluorinated rubber tube to gas outlet of Manifold to the gas/liquid separator 9. Start arsenic analysis and observe if it is working well.
3-33

Chapter 3 Detail Information of Arsenic Testing Laboratory Supporting Report 1
SOP Digestion pre-treatment for As measuring
SOP written by Dated
300ml conical beaker
Heat by hot plate until solution becomes about 10 ml
Filter if necessary
Be sure generation of white fume by H2SO4
2ml of Conc. HNO3 by 2-10ml variable digital pipette
If necessary, repeat for 2-3 times
5ml of H2SO4 (1+1) by 2-10ml variable digital pipette
25ml of sample by 25ml volumetric pipette
2ml of Conc. HNO3 by 2-10ml variable digital pipette
25ml volumetric flask
Fill up pure water to mark with rinsing filter paper
To pre-reduction
3-34

Chapter 3 Detail Information of Arsenic Testing Laboratory Supporting Report 1
SOP pre-reduction for As
SOP written by Dated
20ml test tube
Mixing by glass bar
R.T. in 15min.
1ml* of sample by 1ml fixed pipette
1ml of Conc. HCl by 1ml fixed pipette
1ml of 20w/v% KI by 1ml fixed pipette
Dilute to 10ml by 2-10ml variable digital pipette
AAS measuring * ・・・Depends on the As concentration
3-35

Chapter 3 Detail Information of Arsenic Testing Laboratory Supporting Report 1
SOP Shut down process of AAS
SOP written by Dated
1. When analysis has been completed, save analysis data file on computer. Open “Instrument”
menu and “disconnect” on WizAArd to disconnect between computer and AAS. About 20 seconds will be taken to finish it.
2. Turn off computer 3. Before switch off HVG, 3 aspiration tubes (two for reagents and one for sample) must be
rinsed thoroughly by distilled water at least 10 minuets. Remove the 3 tubes from water and push “Flush” to keep dry in the tubes.
4. Power off HVG. 5. Power off Muffle Heater 6. Finally turn off AAS and ASC 7. Power off UPS 8. Close argon gas cylinder
3-36

Chapter 3 Detail Information of Arsenic Testing Laboratory Supporting Report 1
SOP plan for starting AAS (in case of changing condition)
SOP written by
Dated
Setting
1: Power on UPS. Then turn on the table tap that is connected with a transformer and computers.
2: When UPS is running exactly, put on computer power. 3: Open the valve of argon gas cylinder and get its pressure with 0.32MPa. 4: Set up 3 delivery tubes* and 2 chemical reagents, that are 5M HCl and NaBH4. Next get
tubes tensioned with being revolved around a rotor in HGV. Then turn on HVG. If it does not work, give more pressure by adjusting an argon gas regulator or an adjuster screws suitably, not so tightly, behind a rotor.
* Yellow marked tube is for NaBH4. Blue marked tube is for HCl. No marked tube is for sample.
5: Fill up the rinse bottle with distilled-deionized water and place it under the arm of ASC. Then turn on ASC.
6: At this moment AAS itself can be turned on. After 3 minutes warming run, AAS will give beep sound. This proves that AAS is ready to go.
Parameters
7: Click “WizAArd” then you can see the window shown below. And click “element selection”, that is circled in red.
Element Selection
8: Select a target element and give checks in “flame” and “Using ASC”. Then choose “OK”.
3-37

Chapter 3 Detail Information of Arsenic Testing Laboratory Supporting Report 1
3-38

Chapter 3 Detail Information of Arsenic Testing Laboratory Supporting Report 1
9: Go to “Edit parameters”.
Edit Parameters
10: Open the window of “Repeat Measurement Conditions” and change some conditions shown in the table below.
11: Open the window of “Measurement parameters” and change parameters shown blow.
3-39

Chapter 3 Detail Information of Arsenic Testing Laboratory Supporting Report 1
3-40

Chapter 3 Detail Information of Arsenic Testing Laboratory Supporting Report 1
12: Open the window of “Calibration Curve Parameters”. Then choose “ppb” or ug/l as a concentration unit and 1st order of calibration curve. Eventually click “Zero Intercept” in order to let calibration curve start from zero.
13: Open the window of “ Atomizer/Gas Flow Rate Setup” and select “Atomizer Position” then set up the position like in images below. Click “OK” after every operation is done. Then Click “NEXT”
3-41

Chapter 3 Detail Information of Arsenic Testing Laboratory Supporting Report 1
14: Click “Edit” in the window of “Preparation Parameters”.
Click “Edit”.
15: Put in appropriate numbers to your STD solution and sequential analysis for blank samples. Then click “OK”.
3-42

Chapter 3 Detail Information of Arsenic Testing Laboratory Supporting Report 1
STD samples
Blank samples
16: Go to “Next” window. So far put in the number of samples, which you are going to analyze
Put in number
17: Go to “Next” window. If there are some elements to be analyzed, you can select samples to be measured in each element*
3-43

Chapter 3 Detail Information of Arsenic Testing Laboratory Supporting Report 1
* In case of this AAS all functions are specialized to analyze arsenicmeasure other elements. This means you have nothing to do in this win
18: Go to “Next” window. When all parameters are determined, ClickParameters”.
19: When “Connect/Send Parameters” is clicked, the diagram shown border to confirm each connection between your computer and devices.
3-44
Check samples tobe measured ineach element.
. So you cannot dow.
“Connect/Send
Click here.
elow appears in

Chapter 3 Detail Information of Arsenic Testing Laboratory Supporting Report 1
20: When connections are confirmed, hollow cathode lamp is turned on. Then line search should be done.
Lamp on
Line Search
3-45

Chapter 3 Detail Information of Arsenic Testing Laboratory Supporting Report 1
21: If Beam intension is weak, mafful heater should be adjusted in its direction and line search should be done again. When line search and beam balance are OK, click “Close”.
22: When everything is ready, click “finish” and start AAS measurement.
3-46

CHAPTER 4
ARSENIC REMOVAL EQUIPMENT
Supporting Report 1

Chapter 4 Arsenic Removal Equipment Supporting Report 1
CHAPTER 4 ARSENIC REMOVAL EQUIPMENT 4.1 Objective The objective of the arsenic removal experiment in this project is to provide the information
necessary to draw a master plan of arsenic mitigation, in case deep aquifer development cannot
be a solution for all the area. Such information shall be backed by hands-on field experience.
Therefore, instead of comparing and/or evaluating existing individual technologies of arsenic
removal, a more research and development oriented approach was taken.
Verification/authorization or rejection of any individual technology option is not expected.
The experiment was designed in such a way that problems and issues associated with arsenic
removal equipment and operation are identified and become clear.
The following issues will be studied, though it may be too ambitious to expect answers to all
under the project
Arsenic removal efficiency
Operation and maintenance
Cost
Waste management
Monitoring requirement
Operational risk
Household vs. community based system
Immediate-emergency vs. long-term option
Removal of other pollutants
4.2 Basic Approach for Arsenic removal experiment 4.2.1 Systematic categorization of the technologies When developing arsenic removal technologies, a systematical approach was employed.
Theoretical evaluation of each category of technology was done prior to evaluating independent
technology options. The approach will eliminate much of the confusion caused by the
evaluation of various independent technologies in one step. Here, all technology can be
categorized into four groups, namely co-precipitation, adsorption, membrane separation and
solar distillation.
A summary of the four categories is shown in the table below.
4-1

Chapter 4 Arsenic Removal Equipment Supporting Report 1
Table 4.1 Four categories of arsenic removal technologies Principle Individual
Technology Advantage Disadvantage
Co-precipitation ・ Alum ・ Iron ・ Lime Softening ・ Passive
sedimentation
・ Cost of equipment and consumable is relatively inexpensive
・ Difficult to remove As (III). ・ Required oxidation agent. ・ Required chemical to add.・ Complication in operation.・ Sludge generation.
・ Activated alumina・ Oxidized iron ・ Charcoal
・ Cost of equipment and consumable is relatively inexpensive.
・ Less waste generated compared to precipitation
・ Simple operation.
・ Difficult to remove As (III). ・ Required oxidation
agent. ・ Need to replace
adsorbent→ Waste generation.
・ Required periodical monitoring.
・ Influenced by other dissolved ion.
Adsorption
・ Ion exchanged resin
・ Some resin capable to remove As (III).
・ Regeneration process is possible for some resin
・ Simple operation.
・ Expensive consumable (resin)
・ Need to replace adsorbent→ Waste generation.
・ Required periodical monitoring.
・ Influenced by other dissolved ion.
Membrane separation
・ Reverse osmosis ・ Electrodialysis
・ Capable to treat large volume.
・ Difficult to remove As (III). ・ Required power for
pressurized pump. ・ Expensive consumable
・ Basin -type
・ Capacity is small. Solar distillation
・ Vacuum type, multi effect type
・ Capable to. Remove As (III).
・ Simple operation and maintenance.
・ No chemical and consumable.
・ No influence of other dissolved ions.
・ Efficiency is not yet demonstrated.
4.2.2 Analysis of technical issues Based on the categorization of arsenic removal technologies as noted, the following technical
issues were considered prior to planning the field experiment.
Arsenic species and pre-oxidation requirement
Arsenic is present in water in two different states of valence, namely As (III) and As (V). In the
case of groundwater under reducing - oxygen absent conditions, most, or nearly all arsenic is in
the form of As (III). As (III) is electrochemically near neutral while As (V) is a more charged
4-2

Chapter 4 Arsenic Removal Equipment Supporting Report 1
form. This makes As (III) more difficult to remove from water than As (V) by most of the
removal methods. In such a case, the pre-oxidation of As (III) to As (V) is required for effective
removal of arsenic from water.
The oxidation of As (III) to As (V) by oxygen or aeration takes place at a very slow rate.
Therefore, oxidation by oxygen only is not adequate for a removal process requiring quick
oxidation. A common oxidizing agent used is Potassium Permanganate or Chlorine. Use of such
chemicals may not be any problem in industrial nations but imposes operational problems in the
rural village conditions in Bangladesh. Problems include too little or over dosing which may
cause water quality deterioration and harmful by-product generation in the case of Chlorine.
It is clear that any removal technology that does not require the pre-oxidation of As (III) to As
(V) has an advantage in this aspect.
Based on the category discussed, the pre-oxidation requirement is summarized as follows.
Co-precipitation - Required
Adsorption - Required (Not required for some Ion exchange resin)
Membrane - Required
(Membrane cannot stand with an oxidizing agent)
Distillation - Not required
Waste management
All arsenic removal technology generates some sort of concentrated waste as a result of the
removal operation. How such waste shall be handled to avoid secondary environmental
problems is a difficult but important question when considering the nation-wide extension of the
technologies. To further discuss the issues the following may be considered.
1) What environmental problems are caused by arsenic concentrated waste? There is arsenic
already in the ground. What are the additional problems?
Since arsenic contamination of groundwater is already widespread, secondary environmental
problems shall be assessed in view of the additional risk it may impose on current conditions.
If the waste imposed only a similar level of risk comparable to the drainage of washing or the
use of contaminated tube wells for bathing and/or the use of contaminated groundwater for
irrigation, it is probably not worth considering the additional care and cost to handle such
waste. On the other hand, if the waste imposes a much higher risk by releasing higher levels
of arsenic to groundwater than at present, it should be handled with care. Therefore, the focus
of the problem is if certain waste can cause more serious groundwater contamination than at
present so that any arsenic removal equipment capable of reducing arsenic down to an
acceptable limit will fail once inlet concentrations of arsenic significantly increase because of
the waste.
4-3

Chapter 4 Arsenic Removal Equipment Supporting Report 1
2) Do leaching test results provide a guarantee for safe disposal of the waste?
The answer to this question is probably “NO” because of two considerations. Firstly, a
leaching test is a test done under oxidative conditions while underground conditions in
Bangladesh are mostly reducing. This is especially important as most waste is in the form of
oxide or hydroxide, which is stable in oxidative conditions but unstable in reducing
conditions. Secondly, once waste is dumped somewhere it is subject to weathering by heavy
rain, sunshine and biological activities. Stable results at the laboratory at limited duration do
not guarantee safe disposal.
3) What technologies generate what type / level of waste?
In general, all arsenic removal technologies generate the same amount of arsenic waste when
computing “volume of waste x concentration of arsenic in waste” per treated volume of water.
Therefore, now we are faced with the dilemma where a technology generating the minimum
volume of waste, thus the most efficient process, also generates waste of highest
concentration, thus the riskiest waste, while a technology generating waste of less
concentration generates a larger volume of waste.
Some generalizations on the type of waste for each category of technology are as follows.
Concentration of waste (in the order of high to low)
Adsorbent > Co-precipitation >> Membrane and distillation
Volume of waste (in the order of largest to smallest)
Distillation and membrane >> Co-precipitation > Adsorbent
Type of waste
Adsorbent - spent adsorbent
Co-precipitation - precipitated sludge
Membrane - concentrated water
Distillation - concentrated water
Control of waste concentration and volume
Adsorbent - by replacement period
Co-precipitation - by raw water concentration
Membrane - can be controlled by operation
Distillation - can be controlled by operation
To go one step further, it is necessary to consider the threshold concentration of waste. If the
concentration of waste is lower than such a threshold value, it will not present an additional risk
to the current environment and therefore waste management is not required. If somewhere in the
vicinity of such a threshold value, an effort shall be placed on lowering the concentration of
4-4

Chapter 4 Arsenic Removal Equipment Supporting Report 1
waste so that the total operation cost will be minimum. On the other hand, if the concentration
of waste is higher than the threshold value, an effort shall be placed on maximizing the
efficiency and minimizing the volume of waste to lower the waste management cost.
Determination of such a threshold value shall be based on a baseline study of current arsenic
contamination conditions such as the content of arsenic in soil and the fluctuation of arsenic
concentrations in tube well water. For example, if the soil content of arsenic in some baseline
study indicates an average of 50 mg/kg of arsenic, waste of a similar level does not give any
additional risk to that area. In the same way, if arsenic in tube well water fluctuates from 0.5 to
1.0 mg/l in some area, draining wastewater of 1.0 mg/l concentration does not provide any
additional risk.
Probably the most feasible strategy for waste management is not to generate waste higher than
such a threshold value. In this view, membrane and distillation technologies have a clear
advantage because they can control the concentration of wastewater.
Monitoring requirement
Arsenic removal efficiency may be changed during the continuous use of the equipment
depending on the nature of the technology. Therefore, periodical monitoring of the treated water
is necessary to ensure the good removal of arsenic. It is simple and easy to say so, however from
a practical viewpoint, it will be a very difficult task, if not impossible, considering the large
number of such monitoring locations. We have to take into account that initial screening of tube
wells by field test kits is still far from completion after many years of combined efforts of
various organizations. On the other hand, here we are talking about the periodical monitoring
(not one time measurement) by laboratory method (not by field test kit). By the nature of treated
water monitoring to accurately measure the water at 0.05mg/l of arsenic, a field test kit may not
be a reasonable option.
Now the focus of the problem is how to integrate such a monitoring requirement of the
technology into the overall evaluation process. A general summary and issues for each category
of technology are discussed below.
1) Co-precipitation
Co-precipitation based technology such as the double bucket system using alum is basically a
batch process. This means the efficiency of a removal process is independent from previous
operation. The only factor that influences the removal efficiency is change in the raw water
quality. As tube well water may not change significantly in a short time interval, the monitoring
requirement for this purpose is minimal.
On the other hand, the arsenic removal efficiency of the technology highly depends on the
operating condition of the process, such as accurate dosing, mixing, reaction time and proper
4-5

Chapter 4 Arsenic Removal Equipment Supporting Report 1
filtration. In this aspect, monitoring of the system is required.
2) Adsorption
Contrary to co-precipitation based technology, an adsorption-based process is a continuous
process. Arsenic removal efficiency is influenced by the cumulated operation record as well as
water quality. The key issue for adsorption-based technology is the breakthrough bed volume.
The breakthrough bed volume is defined as the volume of treatable water per unit volume of
adsorbent. For example, if the breakthrough volume of adsorbent A is 10,000, 1 liter of
adsorbent A can treat 10,000 liters of water before replacement. From an operational point of
view, the breakthrough volume directly relates to the replacement frequency.
There are two complicating factors. First, most adsorbent breakthrough volumes for As (III) and
As (V) significantly vary, i.e. low volume for As (III) and large volume for As (V). Only one
kind of adsorbent (READ-F) has a larger breakthrough volume for As (III) than As (V).
Depending on the composition of arsenic species As (III) and As (V), the breakthrough volume
fluctuates. To overcome this problem, most adsorbent processes employ a pre-oxidation process
prior to adsorption. Second, other ionic species in the groundwater often compete with arsenic
for the adsorption site. Such competition also influences the breakthrough bed volume.
As a result of the above noted complication, the breakthrough volume or replacement period
significantly varies depending on the local condition of the tube well water as well as the
operating condition of the adsorbent equipment. Therefore, a generalization of the replacement
period is difficult to determine. In such a case, periodical monitoring of the treated water is an
essential requirement.
3) Membrane
Membrane-based technology has a better removal efficiency for As (V) than As (III). However,
use of an oxidizing chemical as some of the adsorbent process is not feasible because, in general,
a membrane cannot stand with such an oxidizing agent. Therefore, the arsenic removal
efficiency of the membrane-based technology depends highly on the composition of As (III) and
As (V). In such a case, it may require more monitoring as such composition may vary by some
conditions.
4) Distillation
The distillation process removes arsenic almost completely, regardless of its compositional ratio
of As (III) and As (V). Further, its removal does not depend on other factors such as other
dissolved species in water nor the previous operating record of the equipment. Therefore, from a
theoretical viewpoint, the distillation process requires no monitoring.
In summary, the monitoring requirement for each category of technology can be summarized as
4-6

Chapter 4 Arsenic Removal Equipment Supporting Report 1
follows.
Co-precipitation - modest requirement
Adsorption - highest requirement
Membrane - modest requirement
Distillation - lowest requirement
Operational risk
Operational risk includes followings.
1) Misoperation resulting in inadequate removal of arsenic
2) Misoperation resulting in excessive chemical in water
3) Misoperation resulting in breakdown of equipment
4) Misoperation resulting in immediate health problems caused by chemical
Here we can list the possibility of such misoperations for each category of technology.
1) Co-precipitation
Underdosing of chemical - Inadequate removal of arsenic
Inadequate mixing or settlement - Inadequate removal of arsenic
Overdosing of chemical - Excessive chemical or immediate health
problems
2) Adsorption
Inadequate pre-oxidation - Inadequate removal of arsenic
No replacement of adsorbent - Inadequate removal of arsenic
3) Membrane
Lack of maintenance of pump - Breakdown of equipment
No replacement of membrane - Breakdown of equipment
4) Distillation
Inadequate operation - Low volume of treated water
From the above analysis, co-precipitation technology imposes the largest operational risk.
However, a more detailed analysis based on field observation is necessary to characterize the
risk of each technology.
Household vs. Community based system
Various arsenic removal systems can be grouped by their size/scale of operation. Some systems
were designed for household use only while others can produce larger volumes of treated water
and thus must be shared by the community. Hereunder, the advantages and disadvantages of
4-7

Chapter 4 Arsenic Removal Equipment Supporting Report 1
both systems will be discussed.
Household-based system
Advantages:
Easy to introduce socially as community consensus is not required.
Community cooperation is not required as each house takes own responsibility.
Easy to introduce physically as system is small and relatively inexpensive.
Disadvantages:
Waste management is difficult, if collection and management become necessary.
Monitoring of each system is almost impossible.
Community-based system
Advantages
Monitoring is relatively easy, compared with household-based system.
Waste management is relatively easy, compared with household-based system.
Disadvantages:
Community consensus is required for introduction.
Community cooperation and cost sharing is required.
The disadvantages of a community-based system as listed above are probably not real
disadvantages. In any case, community consensus and cooperation are desired and required for
mitigation work. Through the experiment, this community cooperation issue will be examined.
Immediate-emergency option vs. long-term option
The development and/or selection of arsenic removal technologies that can fulfill all the
technical as well as operational requirements, especially the waste management problem, will
be a very difficult task. Considering the potential scale of the problem of introducing inadequate
technology nationwide, it is rational to examine the technologies very carefully. Such
examination may take some time, as field level verification is mandatory.
On the other hand, there are people drinking arsenic contaminated water on a day-to-day basis.
Even before the complete examination of the technology options as noted above, some
countermeasures, for the time being, are desired. Such countermeasures shall not necessarily
eliminate but at least reduce the risk of drinking arsenic contaminated water. At the same time,
such immediate countermeasures shall not prevent the introduction of a long-term solution,
which may come at a later time. It also shall prevent and/or minimize duplicate expenditure and
investment. During the experiment, this issue will also be examined.
Removal of other pollutants
Pollutants other than arsenic are found to be present in some groundwater. Groundwater in
coastal areas is often contaminated by saline water. Now, the focus of the problem is on arsenic;
4-8

Chapter 4 Arsenic Removal Equipment Supporting Report 1
however, in future it may become necessary to consider the removal of other pollutants. For this
reason, we will briefly evaluate the capability of the technology for the removal of other
pollutants.
1) Co-precipitation
The technology may be able to remove some heavy metal pollutants. It is not possible to
remove nitrogen and organic pollutants or salinity either.
2) Adsorption
The capability to remove other pollutants depends on each adsorbent type. For example,
activated alumina can remove various ionic species in water.
3) Membrane
The technology can remove most the pollutants including salinity but excluding
electrochemically neutral species such as As (III).
4) Distillation
The technology can remove all other pollutants as well as salinity.
4.2.3 Evaluation criteria Establishing common evaluation criteria is important to avoid confusion, especially when
various agencies do their own testing and evaluation of arsenic removal technology. For this
purpose, activities were coordinated with other programs. Various discussions with BAMAWSP
to avoid duplication were held. In-depth discussions with CIDA-OCETA for ETV-AM were also
held to exchange ideas on evaluation criteria. A presentation of the evaluation criteria to be
applied under the study was made at the workshop of CIDA-OCETA on July 26 and 27, 2000 in
Dhaka.
The following is the evaluation criteria at this stage, taking the technical issues discussed above
into consideration. The final evaluation of arsenic removal equipment will be done after
completion of the field testing program as well as the survey of the technology testing program
done by other organizations.
In addition to the field testing program, other separate issues such as waste management and the
possible construction of a waste disposal site, monitoring cost, etc, shall be studied.
4-9

Chapter 4 Arsenic Removal Equipment Supporting Report 1
Table 4.2 Evaluation criteria of Arsenic Removal Equipment Aspect No. Criteria/Question Evaluation
1.1 Different removal efficiency for As(III) and As(V)? 1.2 Oxidation process required for removal of As(III)? 1.3 Removal efficiency depending on the initial raw water
concentration?
1.4 Removal efficiency changed by continued use? 1.5 Removal efficiency influenced by the other dissolved
ions?
Arsenic removal efficiency
1.6 Field test data (initial and treated concentration, ORP, pH, EC, other ions). Removal rate.
2.1 Household or community based? What is the capacity per unit?
2.2 What is daily operational procedure? Number of steps? Labor time required?
2.3 What is maintenance procedure? Weekly, monthly? Number of steps?
2.4 Consumable required? What? How often? Is that potentially hazardous?
2.5 Chemicals required? What? How often? Is that potentially hazardous?
2.6 Waste generated? How much /day, month 2.7 Monitoring requirement 2.7.1 1.3, 1.4, 1.5 is yes, monitoring required.
How often ?
2.7.2 Monitoring parameters? Arsenic? Other ions?
Operation and maintenance
2.8 Operational risk? 3.1 Equipment cost 3.1.1 cost/unit 3.1.2 cost/l of treated water over expected life time Expected
life time of the equipment
3.2 Operating cost 3.2.1 Manpower cost/day, month, cost/l of treated
water
3.2.2 Consumable cost/replacement cost/l of treated water. If regenerated, cost/ regeneration
3.2.3 Chemical cost/day, month, cost/l of treated water 3.2.4 Power or any other utility cost/day, month cost/ l
of treated water
3.2.5 Monitoring cost/month 3.2.6 Waste treatment disposal site construction, collection,
transportation
3.3 Use of locally available material 3.3.1 Equipment 3.3.2 Consumable
Cost
3.3.3 Chemical
4-10

Chapter 4 Arsenic Removal Equipment Supporting Report 1
4.3 Design of Arsenic Removal Equipment 4.3.1 Basic plan for experiment The currently tested technologies in Bangladesh were evaluated briefly as follows. A more
detailed description of the technology can be found in other reports such as the Rapid
Assessment Program by DfID. Special attention was given to the technologies being tested by
BAMWASP to avoid duplication of field testing.
Double Bucket System Oxidation by potassium permanganate and
co-precipitation by Alum followed by sand filter.
Steven Tech Field tested at BAMWASP. Developed at Stevens Inst. of Tech.
Co-precipitation by oxidized iron.
Activated Alumina (BUET) Developed by DPHE-BUET-UNICEF. Laboratory test
completed. Filed test under planning.
Activated Alumina (Alcan) Promoted activatde alumina combined with pre-sand
filtration unit.
SAFI filter Candle type filter made of aluminum hydroxide, Mn oxide, Fe
oxide. Developed at a university.
Kalshi filter Filtration by coarse sand and iron chip at first tank followed by
charcoal and fine sand at second tank.
AdsorbAs Field tested at BAMWSP. German technology. Adsorption by
granular oxidized iron.
Hybrid Field tested at BAMWSP. Three types of activated charcoal and
alum adsorption.
Arsen-X Field tested at BAMWSP. Adsorption by ion exchanged resin form
US.
TETRAHEDRON Field tested at BAMWSP. Adsorption by ion exchanged resin form
US.
READ-F Field tested at BAMWSP. Adsorption by ion exchanged resin form
Japan.
4-11

Chapter 4 Arsenic Removal Equipment Supporting Report 1
Double Bucket
Activated Alumina (BUET) Kolshi Filter
Steven Tech Tetrahedron
4-12

Chapter 4 Arsenic Removal Equipment Supporting Report 1
Activated Alumina (ALCAN)
AdsorbAs
Photo presented here were taken by courtesy of BETS, SIDKO, MAGC Technology and Shin Nihon Salt Co., Ltd.
READ-F
Based on the above, the experimental plan for the study was considered. The following points
were considered to be important conditions.
① To avoid duplication for technology under field test by BAMWSP. However, common
evaluation criteria shall be shared.
② Membrane technology is not appropriate for application in rural conditions in Bangladesh
because of its high operation and maintenance requirement.
③ Lime Softening does not have many technical advantages.
④ Technology will be considered for household and community based systems.
⑤ Technology will be considered for emergency-immediate options and long-term options.
4-13

Chapter 4 Arsenic Removal Equipment Supporting Report 1
After all consideration, it was decided in consultation with DPHE that the following five
technologies will be field tested.
Improvement of Double Bucket System
Aeration and passive sedimentation
Adsorption by activated alumina
Solar distillation(Basin-type)
Solar distillation(Vacuum-type)
The table below summarizes the five technologies and their category/scale/timing option.
Table 4.3 Summary of Arsenic Removal Experiment Plan Category Scale Timing Double bucket
Co-precipitation Household Immediate-emergency option
Aeration and passive sedimentation
Co-precipitation Community Immediate-emergency option
Adsorption by Activated Alumina
Adsorption Community Long-term option
Solar distillation (Basin)
Distillation Household
Long-term option
Solar distillation (Vacuum)
Distillation Household (or community)
Long-term option
Multiple units will be installed for the technologies that are influenced by variation of water
chemistry. The household-based units will also be tested at multiple locations to check operation
and maintenance conditions.
4.3.2 Double bucket system The system was developed under the DPHE/DANIDA project. The system applies arsenic
removal by co-precipitation with alum followed by sand filtration. The first bucket colored red
is used to mix arsenic contaminated water with an added oxidizing agent, i.e. potassium
permanganate (KMnO4), and alum. After precipitation, the treated water is fed to the second
bucket colored green for filtration by fine sand to provide drinking water. The system will
produce approx. 20 liters of drinking water per process. The system is designed for households.
Under the study, tablet-type chemicals were provided to observe the operational advantage. The
system is considered as an immediate option because the sludge problem is not yet solved.
4-14

Chapter 4 Arsenic Removal Equipment Supporting Report 1
Raw water + KmnO4 and Alum
Plastic bucket 20 liter
Sand filter
Drinking water
4.3.3 Passive sedimentation system In Bangladesh, it is said that groundwater kept for a while or overnight is less toxic than
groundwater just pumped up. In many cases, arsenic contaminated groundwater contains high
concentrations of dissolved iron.
Aeration shower
Sedimentation tank Contaminated groundwater
Sand filter
Aeration pump (manual type) Water
Dissolved iron when in contact with air, is oxidized and precipitated as iron oxide. Iron oxide is
known to co-precipitate with arsenic and also to adsorb arsenic at the surface. Furthermore,
arsenic itself is also oxidized from a more toxic trivalent species As (III) to a less toxic
pentavalent As (V), though the reaction is slow. It is considered that the arsenic concentration as
well as toxicity in the water kept for a while is reduced because of the reason noted above. The
system is a combination of active aeration and oxidation unit and filtration unit to remove
suspended particles of oxidized iron. The system can treat approx. 200l of water per process and
is expected to provide a water supply for few families.
The system is considered as immediate option because its removal efficiency is not yet
4-15

Chapter 4 Arsenic Removal Equipment Supporting Report 1
determined.
4.3.4 Activated alumina system Activated alumina is known to adsorb arsenic and other substances. The adsorption capacity of
activated alumina for arsenic is highly effective for pentavalent As (V) while it is less effective
for trivalent As (III). Therefore, the system is a combination of pre-treatment by
aeration/oxidation and an iron removal filter and adsorption unit of activated alumina. The
system is designed for treatment of approx. 1,000l/day for drinking water. Community-based
use is expected.
The system is considered as a long-term option.
Aeration
Contaminated groundwater
Drinking water tank
Oxidation- sediment tank
Gravel/sand filter for iron removal
Adsorption unit of
activated alumina
Water
4.3.5 Basin type solar still A basin-type solar still utilizes solar energy to heat water to produce distilled water. The basic
design of the system is shown in the figure below.
Solar distillation technology has perfect arsenic removal efficiency regardless of the original
arsenic content with no use of chemicals or consumables. Further, it will not generate waste
sludge. The only drawback is its small capacity. However, as shown in the table below, a
number of large-scale systems can be found elsewhere in the world, though their application is
focused on desalinization. Therefore, the test is focused on its capacity under climatic
4-16

Chapter 4 Arsenic Removal Equipment Supporting Report 1
conditions in Bangladesh. The system is considered as a long-term option.
Table 4.4 Large-scale solar distillation units
Country Site Construction year Efficiency (kg/m2d) Total capacity (kg/d)Australia Muresk 1963 2.26 833
Muresk 1966 2.26 833 Cooper Pedy 1966 2.03 6,359 Gaiguna 1966 2.11 776 Hamelin Pool 1966 2.19 1,211 Griffith 1967 2.22 908
Chili Quillagua 1968 4.05 401 Greece Symi 1964 2.85 7,570
Aegina 1964 2.87 4,239 Salamis 1965 2.85 1,098 Patmos 1967 3.05 26,117 Kimolos 1968 3.05 7,570 Nisiros 1969 2.99 6,056
India Bhavnagar 1965 2.23 833 Mexico Natividad Island 1969 4.02 379 Spain Las Marinas 1966 2.99 2,574 Tunisia Chakmou 1967 1.22 530
Mahdia 1968 3.23 4,164 USA Daytona Beach 1959 2.51 2,082
4.3.6 Vacuum-type solar still A vacuum-type solar still can produce distilled water with much higher efficiency than a
basin-type, as the boiling point of water is lower in vacuum. The basic design of the system is
shown in the figure below. The system is considered as a long-term option.
The arsenic removal efficiency of vacuum distillation was laboratory tested using tube well
water from Bangladesh. No arsenic was detected after the process for water with an original
4-17

Chapter 4 Arsenic Removal Equipment Supporting Report 1
arsenic concentration of 0.15mg/l.
Contam inated
4B
m
D
P
A
B
V
P
h
1
T
A
T
Solar panel
( 1mx2m ) Raw water tank
Vacuum pum p
Distill ed w ater tank
Condenser
groundw ater
Sedimentation
tank
.3.7 Manufacturing of arsenic removal equipment ased on the basic design of the arsenic removal equipment discussed above, equipment was
anufactured for field experiment. The following equipment was manufactured.
ouble bucket system 18 units (chemical in powder and tablet form)
assive sedimentation system 9 units
ctivated alumina system 3 units
asin-type solar still system 3 units
acuum-type Solar still system 1 unit
riority was given to the use of locally available, off-the-shelf components such as tanks, filter
ousing and valves as much as possible.
) Double bucket system
he components of the double bucket system are as follows.
Two 20-liter plastic buckets (one red and one green)
Two plastic taps
One plastic pipe
10” of 1/2” PVC pipe
5 kg of coarse sand
One stirring rod
ll materials are locally available and the total cost per unit is approximately 300 Taka.
he chemical required is a mixed reagent of alum and potassium permanganate. The dosage per
4-18

Chapter 4 Arsenic Removal Equipment Supporting Report 1
20-liter treatment is 4g of alum and 0.03g of potassium permanganate. The tablets were
fabricated with the same chemical composition in such a way that three tablets are equivalent to
one dosage per 20-liter treatment.
2) Passive sedimentation system
The passive sedimentation system is basically the same as or similar to any iron removal unit
based on an aeration mechanism. As discussed before, iron removal and pre-oxidation of the
water before arsenic removal treatment is common. Therefore, the system is designed in such a
way that use of the system as a pre-process unit is easy, if it becomes necessary in future.
The design of the unit is shown in Figure 4.1.
The components of the passive sedimentation system are as follows.
One 500-liter plastic tank
500-liter plastic water tank availablein market. Cost = 2,700 Tk/unit
One 60-liter ceramic filter housing
60-liter ceramic filter housing available in market.Cost = 2,500 Tk/unit
One bicycle air pump
Pipe, fitting, four valves and frame
All materials are locally available.
3) Activated alumina adsorption system
The activated alumina used for the experiment is ALCAN promoted activated alumina
AAFS-50. The system is composed of the following.
Pre-oxidation tank with aeration. Stainless steel 1,000-liter capacity.
4-19

Chapter 4 Arsenic Removal Equipment Supporting Report 1
1,000-liter stainless steel tank available in market. Cost = 10,200 Tk/unit
Sand filter using plastic airtight tank
le.
Airtight plastic tank (approx.50-liters) used for chemical storage. Not sold as product in market, but easily availab
Activated alumina adsorption unit. (Filter housing is the same as the one used or sand filter
of passive sedimentation unit.)
Reservoir tank, stainless steel 1,000-liter capacity. (same as pre-oxidation tank)
Pumping system to lift up water to pre-oxidation tank.
One H.P. suction pump for water lift up. Cost = 5,500Tk/unit
4-20

Chapter 4 Arsenic Removal Equipment Supporting Report 1
Solar cell powered pump unit for site without electricity Not available in local market.
Pipe, fitting, five valves and frame.
Details of the unit are shown in Figure 4.2. The unit was designed for universal application to
any adsorbent technology. In place of activated alumina, any adsorbent can be used for ceramic
filter housing.
4) Basin-type solar distillation system
Basin-type solar distillation can be made of locally available goods. It components are as
follows.
1 m x 2 m tray.
Glass cover 1 m x 2 m for the tray
Black silicon to cover the bottom of tray.
Black silicon to cover the bottom of tray.Cost = 200 / tube.
Styrofoam for insulation
Pipe, fitting, one valves and frame.
Details of the unit are shown in Figure 4.3.
5) Vacuum-type solar distillation system
The vacuum-type solar distillation system is still in an experimental stage. Therefore, the unit
used for the experiment is still pre-mature to consider its design detail for costing and local
goods availability. Figures 4.4 and 4.5 show the design of the vacuum solar distillation unit for
the experiment. It has a solar panel 1 m x 2 m in size but can be up-scaled easily by adding solar
panels at a fraction of the total cost.
4-21

Chapter 4 Arsenic Removal Equipment Supporting Report 1
The table below summarizes the cost information used for the manufacturing of the unit in the
experiment.
Table 4.5 Cost information of material and goods No. Description Unit Cost 1 Plastic water tank 500 litter each Tk 2,700 2 Stainless steel water tank 1,000 litter
(sheet t=0.5mm) each Tk 10,200
3 Filter (60 litter) housing ceramic each Tk 2,500 4 Activated alumina ALCAN AAFS-50 per kg US$ 12.0 5 Electric pump 1 H.P. each Tk 5,500 6 G.P. sheet tray (basin type solar distillation
unit) t = 1mm each Tk 4,000
7 Glass t = 6mm (2,130mm x 1,220 mm) each Tk 1,700 8 Black silicone per tube Tk 200 9 Styrofoam t = 12mm (2m x 1m) each Tk 210 10 M.S. Angle, flat bar per ton Tk 20,000 11 Colored C.I. sheet each Tk 426 12 Bicycle air pump each Tk 400
4-22

Chapter 4 Arsenic Removal Equipment Supporting Report 1
to airpump
air
C.G.I. sheet
2
1
Roof
3' PVC pipe to be connected to tube well head(with lifting platform)
Drain plug
outlet pipe at1/5 height frombottom
500 liter plastic tankOutside = 890mmHeight = 950mm
Ceramic filter
tap
platform 600x750Box with L38x38x6
125x125x6
1400
2800
7514
6512
60
450
Ceramic filter(60 liter)
tap
fine sandcoarse sand5mm ST chips10mm ST chips20mm ST chips
100
75
5050
50
600
460
pipe from plastic tankall L25x25x3
1400
2 Mid frameBox L38x38x6
Single L38x38x6
Hanger for filterFlat bar 38x6
withverticaframe
150
1 Roof frame
Figure 7.2.1 Passive sedimentation unitFigure 4.1 Passive Sedimentation Unit
4-23

Chapter 4 Arsenic Removal Equipment Supporting Report 1
4-24
1 Roof frameall L25x25x3
Mid frame
all box withL50x50x6
Bottom frame
all box withL50x50x6
from upper tank to lower tank
brass sieve
air tight sealing
plastic tank
ceramic tank(60 liter)
sand andgravel filter
activatedaluminafilter 20kg
air releasevalve
460
600
3
2
to air pump
1
2
3
2 x
1000
liter
S.S
. Tan
k
C.I. Sheet colored
Shower
960, t=0.5mm sheetHeight with original stand =1850
Single L 38x38x6
Tap
Box with L50x50x6
2 filter
pumpPlatform 1mx1m
1500
600
5180
965
1855
2285
75
1' p
ipe
from
tube
wel
l
165x165x6
1130
1500
withverticalframe
filter supporting frame
1370
L38x38x6
flatbar 38x6L=560
flatbar
355
100
Figure 7.2.2 Activated alumina adsorption unit Figure 4.2 Activated Alumina Adsorption Unit

Chapter 4 Arsenic Removal Equipment Supporting Report 1
L19x19x2
L25x25x3
flatbar 25x3
2000
3300
FRAMING PLAN
Box with L25x25x3
t=1mm G.P. Sheet tray2m x 1m
Water collection channel& outlet pipe
water inlet
drain outlet black silicon inside bottom
t=6mm glass2130 x 1220
t=12mmstyroforminsulationall outside
tap
635
100
375
50x50x3
Figure 7.2.3 Basin type solar distillation unitFigure 4.3 Basin Type Solar Distillation Unit
4-25

Chapter 4 Arsenic Removal Equipment Supporting Report 1
VP
AV
DV
DWV
WV
Solar Collector
Tube Connector
Pressure Gauge
Water Tank
Condenser Tank
Air Filter
2240
2300
2000
Figure 4.4 Vacuum type solar distillation unit
4-26

Chapter 4 Arsenic Removal Equipment Supporting Report 1
2240
440
305
1495
730 Figure 4.5 Vacuum type solar distillation unit - details of still
4-27

Chapter 4 Arsenic Removal Equipment Supporting Report 1
4.4 Site selection and installation 4.4.1 Site selection process Site selection for the arsenic removal equipment was done according to the following process.
Selection of model villages based on 300 existing well survey Aug. to Sept. 2000
Screening survey of all tube wells at the villages by field test kit Oct. 2000
Preliminary site consideration based on screening survey Oct. 2000
Discussion with DPHE district and thana offices Discussion with local NGO Oct. 2000
Workshop at Jessore inviting NGO and village committee member Explanation of arsenic removal technology and experiment Discussion of the proposed sites for experiment Nov. 2000
Joint site visits with DPHE, NGO and village committee member Final selection of the experimental sites and caretakers Nov. 2000
Negotiation with the caretakers for agreement Nov. 2000
Site selection process for arsenic removal experiment When selecting the sites, the following conditions were considered.
General conditions
Distribution of arsenic contaminated tube wells and concentration of arsenic.
Location of deep tube wells (existing and planned). Areas not covered by deep tube well
or areas far from deep tube well were given priority for arsenic removal experiment.
Technology-wise conditions
1) Double bucket system
Priority given to families with contaminated tube well that is isolated from others.
4-28

Chapter 4 Arsenic Removal Equipment Supporting Report 1
2) Passive sedimentation system
High iron concentration for precipitation purposes.
Approx. 10 families nearby to share the equipment.
3) Activated alumina system
Availability of electricity for pumping
Approx. 30 to 50 families nearby to share the equipment.
Willingness to provide replacement cost of activated alumina by the community.
Leadership of the caretaker in the community
4) Solar still (basin and vacuum type)
Good sunlight conditions (little shade in the site)
Because of the tight schedule for the experiment, site selection was done using field test kit data
only without laboratory analytical data. Some discrepancy between field data and laboratory
data was expected, but it was accepted as a reasonable risk.
Effort was spent to obtain consensus among all parties concerned for site selection. A series of
discussions were held with DPHE district offices, thana offices, NGO in charge and village
committee members. On November 5, a workshop for NGOs and village committee members
from three model villages was held. In the workshop, the basics of arsenic removal technology,
details of the field experimental plan as well as preliminary site selection were discussed. The
advantages and disadvantages of each type of arsenic removal equipment were explained
carefully, especially the operational and maintenance aspects including future cost bearing by
caretakers, to avoid any unnecessary confusion. For this purpose, a table to compare the five
types of arsenic removal equipment as well as a brief information sheet for each technology, as
shown in the following pages, were prepared. The same information was later translated into
Bengali and distributed to the participating NGOs and village members. The proposed care
taking agreement for arsenic removal experiment was presented and agreed on by concerned
DPHE, NGO and village committee members. An example of the agreement is also attached in
the following page.
4-29

Chapter 4 Arsenic Removal Equipment Supporting Report 1
4-30
Joint visit to Bara Dudpatila for siteselection with village committeemembers and NGO (ATMABISWAS)
Joint visit to Krishuna Chandrapur forsite selection with village committeemembers and NGO (AID)
Joint visit to Rajnagar Bankabarsi for siteselection with village committeemembers and NGO (KMMS)
Workshop of Nov. 5th , 2000 in Jessore

Chapter 4 Arsenic Removal Equipment Supporting Report 1
Sedimentation tank
Drinking waterTo well head
Sand filter
Hand aeration pump
Aeration/ Passive sedimentation/ Filter unit
General: Remove arsenic by iron in water by co-precipitation. Operation: Pump water into the unit in the morning. Aerate water by hand pump some time.
Collect water next day and drain the remaining water. Chemical: Not required. Consumable: Not required. Maintenance: Flush water in the unit dairy when draining water. Back flush sand filter once per few days Running cost: Zero. Removal: Removal depends on water quality. Yet to be studied Waste: No sludge Capacity: 200 to 300l/day
Figure 4.6 Information on passive sedimentation unit
4-31

Chapter 4 Arsenic Removal Equipment Supporting Report 1
Sedimentation tank
Sand filter
Adsorption unit
Treated water tank
Drinking water
From Well head
Adsorption unit by Activated Alumina
General: Adsorb arsenic by activated alumina Operation: Pump up water to sedimentation tank. Leave for one day.. Some aeration by pump may be required. Open valve at adsorption bed and keep clean water in tank. Chemical: Not required. Consumable: Activated alumina to be replaced after some time. Maintenance: Back flush the sand filter every day. Replace activated alumina few times/year. Running cost: Cost of activated alumina approx. 20,000Tk/year Removal : Down to below 0.05mg/l. If activated alumina is not replaced
at proper timing, arsenic will not be removedWaste: Spent activated alumina should be properly disposed off. Capacity: 1000l/day
.
Figure 4.7 Information on activated alumina adsorption unit
4-32

Chapter 4 Arsenic Removal Equipment Supporting Report 1
Glass cover
Distilled water
Basin-type solar still unit
General: Using solar heat to distill water. Operation: Pour water into the unit in the morning. Collect water in the evening and drain the remaining water. Chemical: Not required. Consumable: Not required. Maintenance: Flush water in the unit dairy when draining water. Keep glass cover clean and protect from breakage. Running cost: Zero. Removal: 100% removal of arsenic. Waste: No sludge Capacity: 3 to 10l/unit/day x 3 units Output depends on sunlight condition.
Figure 4.8 Information on basin-type solar distillation unit
4-33

Chapter 4 Arsenic Removal Equipment Supporting Report 1
Raw water tank
Solar Panel
Distilled water tankManual Vacuum Pump
Vacuum-type solar still unit
General: Using solar heat to distill water under vacuum. Operation: Pour water into the unit in the morning. Operate vacuum hand pump 10 min. twice a day. Collect water in the evening and drain the remaining water. Chemical: Not required. Consumable: Not required. Maintenance: Flush water in the unit dairy when draining water. Keep glass cover clean and protect from breakage. Running cost: Zero. Removal: 100% removal of arsenic. Waste: No sludge Capacity: 10 to 20l/unit/day Output depends on sunlight condition.
Figure 4.9 Vacuum-type solar distillation unit
4-34

Chapter 4 Arsenic Removal Equipment Supporting Report 1
Table 4.6 Sites Selected for Arsenic Removal Equipment, Krishna Chandrapur Type Unit House.No. Tube well
No. Arsenic
(AAS) mg/lNote
Double Bucket 7 units 209,210 211.212 213,214
TW-80 TW-81 TW-82 TW-83
0.57 0.63 0.64 0.46
Isolated six Muslim families in northern edge of the village.
Passive sedimentation
1 unit (PS1)
119,120 121,122 123,124 125,126
TW-79
0.52 Fe 5ppm
Small Hindu community in the eastern edge of the village along highway. New tube well was drilled for experiment
Passive sedimentation
1 unit (PS2)
198, 199 200, 201 202, 203 204,205 206,207
208
TW-84 0.16 Fe 10ppm
Small Hindu community in the northern edge of the village. New tube well was drilled for experiment
Passive sedimentation
1 unit (PS3)
23 ID no.120
TW-114 0.20 Fe 5ppm
Southern part of the village. New tube well was drilled for experiment
Activated alumina
1 unit 62A-E ID no.84
TW-94 0.74 Central part of the village. New tube well was drilled for experiment
Solar still vacuum type
1 unit
Solar still basin type
1 unit
24 ID no. 119
TW-109 0.19 Southern part of the village. New tube well was drilled for experiment
4-35

4-36
Figu
re 4
.10
Ope
ratio
nal f
low
of f
ive
arse
nic
rem
oval
equ
ipm
ent
Sola
r D
istil
latio
nVa
cuum
Typ
e So
lar
Dis
tilla
tion
Bas
in T
ype
Act
ivat
ed
Alu
min
aSe
dim
enta
tion
Pa
ssiv
e Se
dim
enta
tion
Dou
ble
Buc
ket
Vacu
um th
e un
it
Rea
dy fo
r use
Sola
r dis
tilla
tion
Con
dens
atio
n
Pum
p w
ater
into
uni
tlPo
ur w
ater
into
buc
ket
Rea
dy fo
r use
Sola
r dis
tilla
tion
Con
dens
atio
n
Pum
p w
ater
into
uni
tl
Rea
dy fo
r use
Ads
orpt
ion
by A
ctiv
ated
al
umin
a
Sand
filtr
atio
n
Ove
rnig
ht se
ttlem
ent
Pum
p w
ater
into
tank
full
Rea
dy fo
r use
Sand
filtr
atio
n
Ove
rnig
ht se
ttlem
ent
Pum
p ae
ratio
n
Pum
p w
ater
into
tank
full
Rea
dy fo
r use
Sand
filtr
atio
n
2 ho
urs s
ettle
men
t tim
e
Mix
ing
Raw
wat
erR
aw w
ater
Raw
wat
erR
aw w
ater
Add
ing
KM
nO4
and
Alu
m
Raw
wat
er

Chapter 4 Arsenic Removal Equipment Supporting Report 1
4.4.2 Bara Dudpatila, Damurhuda, Chuadanga Situation of arsenic contamination
As shown by the laboratory analytical data in Figure 6.3.5 (Main Report), arsenic contamination
of shallow tube wells is limited to the central part of the village. The eastern part and western
part of the village does not show arsenic contamination though some isolated tube wells are
contaminated. The southern edge of the village is also free from arsenic contamination.
Location of existing and planned deep tube wells
There was no deep tube well provided by DPHE. Improved deep tube wells under the JICA
project are planned at the central part of the village.
Site selection
Based on the above situation, the central part of the village was considered the priority area for
the arsenic removal experiment. Following the workshop on November 5th, 2000, a joint site
visit with DPHE engineer, NGO and village committee members was done on November 8th and
9th, 2000. The final sites for the experiment were determined as follows.
Table 4.7 Sites selected for arsenic removal equipment, Bara Dudpatila Type Unit I.D.No. Tube well
No. Arsenic
(AAS) mg/lNote
Double bucket 4 units 4,5 TW-168 0.19 Western edge of the village. Isolated contamination.
Double bucket 1 units 8 TW-166 0.14 Western edge of the village. Isolated contamination.
Double bucket 2 units Solar still basin type
1 unit 25 TW-43 0.12 Mid-western part of the
village. Isolated contamination. Solar still system to be placed on roof.
Passive sedimentation
1 unit (PS1)
45 TW-08 0.27 (Fe 1ppm)
Central part of the village.
Passive sedimentation
1 unit (PS2)
135 TW-158 0.089 (Fe 2ppm)
North-central part o the village.
Passive sedimentation
1 unit (PS3)
124 TW-155 0.23 (Fe 5ppm)
North-central part of the village. New tube well drilled for experiment.
Activated alumina
1 unit 144 TW-108 0.22 East-central part of the village. New tube well drilled for experiment.
Installation of the equipment
After the final selection of installation sites of the equipment, it was found that preliminary
work of constructing a lift-up platform for tube wells for the passive sedimentation units as well
4-37

Chapter 4 Arsenic Removal Equipment Supporting Report 1
as drilling a new tube well for the passive sedimentation units and activated alumina unit were
required. The lift-up platform was designed to provide easy filling of the water to the
sedimentation tank. The design of the platform is shown in the figure below.
30cm
25cm
115cm
50cm
150cm
25cm
265cm
5cm
270cm
115cm
80cm
30cm
5cm
Platform
Foundation
Stand
Sand FilterTubewell&
Hand Pump
Passive Sedimentat ion Tank
Side View
Top View
ImageConstruction Plan
Figure 4.11 Tube well platform for passive sedimentation unit
An electricity connection required to pump up water for activated alumina was also arranged
through the Rural Electrification Board.
Installation of the arsenic removal equipment was done as shown in the below table.
4-38

Chapter 4 Arsenic Removal Equipment Supporting Report 1
Table 4.8 Installation of arsenic removal equipment, Bara Dudpatila Date Work done
Nov.10- 21, 2000 Construction of three lift-up platforms for three passive sedimentation units. Drilling of two new tube wells for a passive sedimentation unit and an activated alumina unit.
Nov.25- 27, 2000 Installation of three passive sedimentation units Installation of activated alumina unit. Delivery of seven double bucket units
Dec. 2-4, 2000 Preparation of experiment
Dec. 12-14, 2000 Experiment of arsenic removal by passive sedimentation.
Dec.9 , 2000 Village training for arsenic removal units
Dec.15, 2000 Start routine operation of passive sedimentation and double bucket units .
Jan. 20 -31, 2001
Modification of passive sedimentation units (Inlet system and drainage improvement) Modification of activated alumina unit.(New inlet pipe system with 2 non-return valves. Upgrade of electric pump unit.) Experiment of arsenic removal for activated alumina and passive sedimentation units.
Feb. 1, 2001
Start routine operation of activated alumina unit
Feb.13-15, 2001 Installation of basin type solar still unit. Experiment of basin type solar still unit.
Figure 4.12 shows the map of arsenic removal equipment in Bara Dudpatila, Damurhuda,
Chuadanga.
Water quality by field measurement
Based on the field measurement, there was no indication showing any special feature of
groundwater quality. As seen in other areas, high iron was observed in most high arsenic water.
4-39

Loca
tion
Map
of
Ars
enic
Rem
oval
Equ
ipm
ent
in B
ara
Dud
patil
a Vi
llage
JAPA
N IN
TER
NAT
ION
AL C
OO
PER
ATIO
N A
GEN
CY
(JIC
A)
TH
E S
TU
DY
ON
TH
E G
RO
UN
DW
AT
ER
DE
VE
LO
PM
EN
T O
FD
EE
P A
QU
IFE
RS
FO
R S
AF
E D
RIN
KIN
G W
AT
ER
SU
PP
LY
TO
AR
SE
NIC
AF
FE
CT
ED
AR
EA
S IN
WE
ST
ER
N B
AN
GL
AD
ES
H
12
34
56
7
8
1112
1315
1617
1819
2021
2223
2425
2627
28
29
303132
33
3435
36 37
3839
4041
42
43
4445
46
47 48
49
5051
52
53
54
55
56 5758
5960
61
62
63
64
6566
67 68
6970
717273
7475
7677
78
7980
818283
84
8586
87
88
89
909192
9394
95
96
9798
99
100
101
102
103
104
105
106
107
108
109
110
111
112 11
3
114 11
5
116 11
7
118
119
120
121 12
2
123
124
125
126
127
128
129
130 13
1132 13
313
4
135
136
137
138
139
140
141
142
143
144
145
146
147
148
149
150
151
152
153
154
155
156
157
158
159
160
161 16
2
163
164
165
166
167
168
169
170
171
172
0 m
100
m20
0 m
172
Exis
ting
Wel
l with
TW
No.
Exis
ting
Wel
l whe
re
Gen
eral
Wat
er Q
ualit
y Sa
mpl
e C
olle
cted
Figu
re 4
.12
1 un
itD
oubl
e Bu
cket
sys
tem
4 un
itsD
oubl
e Bu
cket
sys
tem
2 un
its D
oubl
e Bu
cket
sys
tem
+
Basi
n ty
pe S
olar
Dis
tilla
tion
unit
Pass
ive
Sedi
men
tatio
n un
it(P
S1)
Activ
ated
Alu
min
a un
it
Pass
ive
Sedi
men
tatio
n un
it(P
S3)
Pass
ive
Sedi
men
tatio
n un
it(P
S2)
4-40

Chapter 4 Arsenic Removal Equipment Supporting Report 1
Md. Nawsar Ali Md. Siddik Md. Khalis Hossin
Caretakers of double bucket units
User training of double bucketsystem by JICA team
4-41

Chapter 4 Arsenic Removal Equipment Supporting Report 1
Care taker - Md. Asraful Alam
Site for passive sedimentation unit (PS1)Tube well no.08 Before installation (upper) Installed unit and initial experimentaloperation (right).
Caretaker - Md. Vasarul Islam
Site for passive sedimentation unit (PS2)Tube well no.158 Before installation (upper) Installed unit (right).
4-42

Chapter 4 Arsenic Removal Equipment Supporting Report 1
Caretaker - Md. Akbar Ali Malita
Site for passive sedimentation unit (PS3)Tube well no.155 Before installation (upper) Installed unit and initial experimentaloperation (right).
Caretaker - Md. Abudus Sattar
Site for activated alumina unit Near tube well no.108 Before installation (upper) Newly drilled tube well and installedunit (left).
4-43

Chapter 4 Arsenic Removal Equipment Supporting Report 1
Caretaker - Md. Khalis Hossin
Site for basin type solar still unit. Rooftop of the house. Near tube well no.43 Before installation (upper) Installed unit (right). Initial test distillation (lower)
4-44

Chapter 4 Arsenic Removal Equipment Supporting Report 1
4.4.3 Krishna Chandrapur, Mohespur, Jhenaidah Situation of arsenic contamination
As shown by the laboratory analytical data in Figure 6.3.9 (Main Report), arsenic contamination
of shallow tube well is widespread in most of the area. A fairly large area west of the school and
some wells at the southern edge of the village are not contaminated.
Location of existing and planned deep tube wells
The deep tube well currently installed by DPHE is situated in the central part of the village.
However, the well was contaminated by arsenic though the concentration is not so high.
Improved deep tube wells under the JICA project are planned at the school in the central part of
the village.
Site selection
Based on the above situation, the central and the northern parts of the village were considered as
the priority area for the arsenic removal experiment. Following the workshop on November 5th,
2000, joint site visits with NGO and village committee members were done on November 6th
and 7th, 2000. The final sites for the experiment were determined as follows.
4-45

Chapter 4 Arsenic Removal Equipment Supporting Report 1
Table 4.9 Sites selected for arsenic removal equipment, Krishna Chandrapur
Type Unit House.No. Tube well No.
Arsenic (AAS) mg/l
Note
Double Bucket 7 units 209,210 211.212 213,214
TW-80 TW-81 TW-82 TW-83
0.57 0.63 0.64 0.46
Isolated six Muslim families in northern edge of the village.
Passive sedimentation
1 unit (PS1)
119,120 121,122 123,124 125,126
TW-79
0.52 Fe 5ppm
Small Hindu community in the eastern edge of the village along highway. New tube well was drilled for experiment
Passive sedimentation
1 unit (PS2)
198, 199 200, 201 202, 203 204,205 206,207
208
TW-84 0.16 Fe 10ppm
Small Hindu community in the northern edge of the village. New tube well was drilled for experiment
Passive sedimentation
1 unit (PS3)
23 ID no.120
TW-114 0.20 Fe 5ppm
Southern part of the village. New tube well was drilled for experiment
Activated alumina
1 unit 62A-E ID no.84
TW-94 0.74 Central part of the village. New tube well was drilled for experiment
Solar still vacuum type
1 unit
Solar still basin type
1 unit
24 ID no. 119
TW-109 0.19 Southern part of the village. New tube well was drilled for experiment
Installation of the equipment
After the final selection of installation sites of the equipment, it was found that preliminary
work of constructing a lift-up platform for tube wells for the passive sedimentation units as well
as drilling a new tube well for all passive sedimentation units, activated alumina unit and solar
distillation units were required. The electricity supply required to pump up water for activated
alumina was not available at the site. Therefore, it is decided to provide a solar cell powered
system for the unit. Installation of the arsenic removal equipment was done as shown in the
below table.
4-46

Chapter 4 Arsenic Removal Equipment Supporting Report 1
Table 4.10 Installation of arsenic removal equipment, Krishna Chandrapur
Date Work done Nov.10- 21, 2000 Construction of four lift-up platforms for three passive sedimentation units
and a solar distillation unit. Drilling of five new tube wells for passive sedimentation units, activated alumina unit and solar distillation units.
Nov.22- 24, 2000 Installation of three passive sedimentation units Installation of activated alumina unit. Delivery of seven double bucket units
Dec. 1, 2000 Preparation of experiment
Dec. 3 - 4, 2000 Experiment of arsenic removal by passive sedimentation.
Dec.9 -10, 2000 Village training for arsenic removal units
Dec.10, 2000 Start routine operation of passive sedimentation and double bucket units .
Jan. 28 -30, 2001
Modification of passive sedimentation units (Inlet system and drainage improvement) Installation of solar cell powered pump for activated alumina unit.
Feb. 2-3, 2001
Experiment of arsenic removal for activated alumina and passive sedimentation units. Start routine operation of activated alumina unit
Feb.16-17, 2001 Installation of basin type solar still unit. Experiment of basin type solar still unit.
Late Feb. Installation and experiment of vacuum type solar still unit (planned)
Figure 4.13 shows the map of arsenic removal equipment in Krishna Chandrapur, Mohespur,
Jhenaidah
Water quality by field measurement
Based on the field measurement, there was no indication showing any special feature of
groundwater quality. As seen in other areas, high iron was observed in most high arsenic water.
4-47

Chapter 4 Arsenic Removal Equipment Supporting Report 1
4-48
JAPAN INTERNATIONAL COOPERATION AGENCY (JICA)
THE STUDY ON THE GROUNDWATER DEVELOPMENT OFDEEP AQUIFERS FOR SAFE DRINKING WATER SUPPLY TOARSENIC AFFECTED AREAS IN WESTERN BANGLADESH
Figure 4.13
12
3
4
5
67
89
10
11
12 13
14
151617
1819
20
2122232425
2627
28 293031
32
33
34
35 36
3738
3940
41 42 43
444546
47
48
49
50
5152
53
54
5556
57
58
59
606162
63
6465
66
67
6869
70
7172
73
747576
7778
79
8081
82
83
84
85 86
8788899091
9293 94
9596
9798
99100101
102
103
104105
106107108
109
110111 112
113
114
115
0 50 100 150 200m
Location Map of Arsenic Removal Equipment
in Krishna Chandrapur Village
115Existing Well with TW No.
Existing Well where General Water QualitySample Collected
5 units Double Bucket system
2 unitsDouble Bucket system
Passive Sedimemtaion unit(PS2)
Passive Sedimemtaion unit(PS1)
Passive Sedimemtaion unit(PS3)
ActivatedAluminaunit
Vacuum typeSolar Distillationunit
Basin typeSolar Distillationunit

Chapter 4 Arsenic Removal Equipment Supporting Report 1
Md. Kutubuddin Md. Abul Hossain Saine, wife of Md. Nizamuddin
Caretakers of double bucket system in Krishna Chandrapur
Sobi, wife of Md. Abul Kalam Papila, wife of Md. Azizur Rahman
User training of double bucket unitsby JICA team
User training of double bucket unitsby village committee member
4-49

Chapter 4 Arsenic Removal Equipment Supporting Report 1
4-50
(right).
Site for passive sedimentation unit (PS2)East of tube well no.84 Before installation (upper) Installation work of the unit andplatform construction
Caretaker - Jorina
Caretaker- Sree Sonzit Kuner
Site for passive sedimentation unit (PS1). Tube well No. 79 Before installation (upper). Units installed. New tube well drilled andplatform under construction (right)

Chapter 4 Arsenic Removal Equipment Supporting Report 1
Caretaker - Md. Shaha Jamal
Site for passive sedimentation unit (PS3)South of tube well no.114 Before installation (upper) Installed unit and initial experimentaloperation (right).
Caretaker - Mizan Rahman
Site for activated alumina unit tube well no.94 Before installation (upper) Installed unit with solar cell poweredpump system (right).
4-51

Chapter 4 Arsenic Removal Equipment Supporting Report 1
4-52
Vacuum type solar distillation unit to beinstalled by the late February (right)
Site for solar distillation units (both basinand vacuum type) House no.24, ID 119 near tube well no.109Site before installation (upper) New tube well and platform constructed(left) Basin type solar distillation unit installed(lower)
Caretaker - Md. Tokkel Doptary

Chapter 4 Arsenic Removal Equipment Supporting Report 1
4.4.4 Rajnagar Bankabarsi, Keshabpur, Jessore Situation of arsenic contamination
As shown by the laboratory analytical data in the Figure 6.3.9 (Main Report), arsenic
contamination of shallow tube well is widespread in all areas of the village except the eastern
edge of the village along the main highway.
Location of deep tube wells
The deep tube well currently installed by DPHE is situated at the eastern edge of the village
along the main highway. The improved deep tube wells installed under the JICA project are
located at the school in the southern part of the village. None of the deep tube wells are
contaminated by arsenic.
Site selection
Based on the above situation, the western and the northern parts of the village were considered
as priority areas for the arsenic removal experiment. Following the workshop on November 5th,
2000, joint site visits with NGO and village committee members were done on November 11th
and 12th, 2000. The final sites for the experiment were determined as follows.
Table 4.11 Sites selected for arsenic removal equipment, Rajnagar Bankabarsi Type Unit I.D.No. Tube well
No. Arsenic
(AAS) mg/lNote
Double Bucket 4 units 122 TW-01 02
0.33 0.32
Isolated families in northern edge of the village. Hindu families.
Passive sedimentation
1 unit (PS1)
135 TW-24 0.37 Fe 2.0ppm
Western side of the village along the highway
Passive sedimentation
1 unit (PS2)
145 TW-21 0.91 Fe 5.0ppm
Western side of the village along the highway
Passive sedimentation
1 unit (PS3)
NA TW-23 0.50 Fe 5.0ppm
Western side of the village along the highway
Activated alumina
1 unit 131 No 0.42 New tube well was drilled for experiment
Solar still basin type
1 unit NA TW-20 0.71
Installation of the equipment
After the final selection of installation sites of the equipment, it was found that preliminary
work of constructing a lift-up platform for tube wells for the passive sedimentation units as well
as drilling a new tube well for the activated alumina unit were required. As for activated
alumina, the electricity supply necessary to operate pump was limited to a small area inside the
village. Therefore, the site selected with an electricity supply has no existing tube well for this
purpose. A new tube well was drilled for the experiment. Installation of the arsenic removal
4-53

Chapter 4 Arsenic Removal Equipment Supporting Report 1
equipment was done as shown in the below table.
Table 4.12 Installation of arsenic removal equipment, Rajangar Bankabarsi
Date Work done Nov.18- 27, 2000 Construction of lift-up platform for three passive sedimentation units.
Drilling of new tube well for activated alumina unit.
Nov.28- 30, 2000 Installation of three passive sedimentation units Installation of activated alumina unit. Delivery of four double bucket units
Dec. 6, 2000 Preparation of experiment
Dec. 8 - 10, 2000 Experiment of arsenic removal by passive sedimentation. Village training for arsenic removal units
Dec.10 -17, 2000 Test operation for passive sedimentation. Start routine operation of double bucket units .
Jan. 24 -27, 2001 Modification of passive sedimentation units (Inlet system and drainage improvement) Modification of activated alumina unit. (New inlet pipe system with 2 non-return valves. Upgrade of electric pump unit.) Experiment of arsenic removal for activated alumina and passive sedimentation units. Start routine operation of activated alumina unit.
Feb. 4 - 6, 2001
Experiment of passive sedimentation units. (Use of KmnO4)
Feb.17-18 , 2001 Installation of basin type solar still unit. Experiment of basin type solar still unit.
Figure 4.14 shows the map of arsenic removal equipment in Rajnagar Bankabarsi, Keshabpur,
Jessore.
Water quality by field measurement
According to the field measurement data, shallow tube well water in Rajnagar Bankabarsi is
characterized by its high EC value, over 200 ms/m. This is approximately three times higher
than the other model villages. From its geographical location, an influence of saline water
intrusion is expected. The taste of water itself is also slightly salty, though the strong smell and
taste of dissolved iron dominates. Its water quality will be discussed in more detail in the next
section.
4-54

Chapter 4 Arsenic Removal Equipment Supporting Report 1
4-55
JAPAN INTERNATIONAL COOPERATION AGENCY (JICA)
THE STUDY ON THE GROUNDWATER DEVELOPMENT OFDEEP AQUIFERS FOR SAFE DRINKING WATER SUPPLY TOARSENIC AFFECTED AREAS IN WESTERN BANGLADESH
Figure 4.14Location Map of
Arsenic Removal Equipmentin Rajnagar Bankabarsi Village
74Existing Well with TW No.
Existing Well where General Water QualitySample Collected
1 23
4 567
8
910
11
12 13
141516
17
18
19
20 2122
23
24
2526
27
28
2930
31
323334
35
36
373839
40 4142
43 44
45 46
47
48
49
50
51
52
5455
56
57
5859
6061
62
6363
64
65
6667
68
69
70
71
72
73
74
m0 100 200 300 400
4 unitsDouble Bucket system
Activated Alumina unitNew tube well drilled
Passive Sedimentation unit (PS1)
PassiveSedimentation unit (PS3)
PassiveSedimentation unit (PS2)
Basin type Solar Distillation unit

Chapter 4 Arsenic Removal Equipment Supporting Report 1
Double bucket system 4 units Caretaker - Barum Kumar DebnathID No. 122 Tube well No. TW-01 and 02
Site before installation of passive sedimentation unit Care Taker - Abudul Latit DaffadanID. No.135 Tube well No. TW-24
After construction of platform andinstallation of passivesedimentation unit (PS1)
4-56

Chapter 4 Arsenic Removal Equipment Supporting Report 1
Caretaker- Moslam Uddin
Before and after installation. Site for passive sedimentaion unit (PS2) I.D. No. 145 Tube well no. TW-21
Caretaker - Mokam Kha
Before and after installation. Site for passive sedimentaion unit (PS3) I.D. No. ? Tube well no. TW-23
4-57

Chapter 4 Arsenic Removal Equipment Supporting Report 1
Caretaker - Ershadali Moral
Before and after installation. Site for activated alumina unit I.D. No. 131 New tube well drilled for experiment.
Before and after installation. Site for basin type solar distillation unit Near tube well no. 20
4-58

Chapter 4 Arsenic Removal Equipment Supporting Report 1
4.5 Field Test 4.5.1 Methodology After installation of the arsenic removal equipment, the performance was measured during the
duration of the project. For this purpose, raw tube well water before the treatment and the
treated water from the equipment were measured and sampled.
Field measurement parameters were as follows.
EC, ORP, pH, Temp. As (by AAN field kit) and Fe2+ (by pack test)
Two types of sampling programs were done. Comprehensive sampling was for 27 analytical
parameters. Arsenic sampling was for only arsenic testing by AAS. Detail of the parameters,
sampling procedure as well as quality control measures were the same as for tube well sampling
as discussed in Chapters 4 and 5 in Main Report.
During the test, operational and maintenance issues were also examined through communication
with NGO and the village caretakers. Data on the 27 parameters at the laboratory to investigate
the influence of water quality on arsenic removal will be discussed in detail in the supporting
report. The discussion in the main report will be focused on arsenic data. The table below
summarizes the water quality character of the three villages. The data consists of the statistics of
all raw water measurement during the arsenic removal experiment
Table. 4.13 Water quality of three villages Village Arsenic
mg/l EC
mS/m pH ORP
mV Fe2+ mg/l
Average 0.26 68 7.3 190 3.1 min. 0.045 39 7.1 81 0.5 Max 0.47 100 7.5 340 10 Bara Dudpatila
Standard deviation 0.14 21 0.11 77 2.4 Average 0.22 83 7.2 130 4.1 min. 0.041 40 7 -20 0.2 Max 0.43 130 7.5 270 10
Krishna Chandrapur
Standard deviation 0.13 21 0.15 71 2.7 Average 0.49 260 7.2 110 3.3 min. 0.29 230 7.1 89 1 Max 1.4 280 7.3 140 5
Rajnagar Bankabarsi
Standard deviation 0.28 12 0.072 16 1.7
The results of the test will be discussed in the following section for each type of arsenic removal
equipment.
4.5.2 Double bucket system The double bucket system is one of the most extensively used systems in the field, mainly under
the DPHE/DANIDA project at Noakhali district. Good removal of arsenic was reported.
Therefore, the operational aspect of the system was focused on in the experiment. Due to the
4-59

Chapter 4 Arsenic Removal Equipment Supporting Report 1
nature of household systems, complete monitoring of the whole unit is, from a practical
viewpoint, impossible. How to secure adequate operation by each household, especially the
handling of chemicals, may be a key issue for the system. Taking that into consideration, two
types of chemical forms, i.e. conventional powder form and tablet form, were prepared for
testing.
In the field test, samples from 2 units from each village were measured. In spite of the initial
idea as noted above to test the operational aspect of the system, the results from the field
experiment look quite confusing with regard to their arsenic removal efficiency.
The first testing was done immediately after the delivery and user training at each village in
December, 2000. Initially, only the powder form of the chemical was delivered. The results of
the field measurement as well as the laboratory data for arsenic are shown in the following
table.
Table 4.14 Initial field test of Double Bucket System Village Unit Chemical Water Date As (field)
Mg/l As
(AAS)mg/l
PH ORP(mv)
EC MS/m
Fe2+ mg/l
As removal
Raw 12/13/00 0.07 0.13 7.29 126 39.2 5 DB1 Powder Treated 12/13/00 0 0.0094 7.04 255 49.8 0
93%
Raw 12/13/00 0.6 0.18 7.13 157 53.5 5
Bara Dudpatila
DB2 Powder Treated 12/13/00 0.02 0.14 7.28 225 60.1 0
22%
Raw 12/10/00 1 0.29 7.13 164 89.2 5 DB1 Powder Treated 12/10/00 0.2 0.13 7.04 167 93.3 0
55%
Raw 12/10/00 1 0.43 7.14 93 100 5
Krishna Chandrapur
DB2 Powder Treated 12/10/00 0.3 0.25 7.21 156 101 0
42%
Raw 12/15/00 0.1 0.4 7.15 122 266 2 DB1 Powder Treated 12/15/00 0 0.36 7.25 321 266 0
10%
Raw 12/15/00 0.8 0.42 7.14 120 265 2
Rajanangar Bankabarsi
DB2 Powder Treated 12/15/00 0.03 0.41 7.14 319 268 0
2%
All units, except DB1 (Double Bucket No.1) unit in Bara Dudpatila, failed to reduce the
concentration of arsenic to below 0.05 mg/l. It seems that the EC value has a reverse correlation
with arsenic removal efficiency as shown in Figure 4.15, if excluding DB2 unit in Bara
Dudpatila.
4-60

Chapter 4 Arsenic Removal Equipment Supporting Report 1
0 50 100 150 200 250 300EC mS/m
0
20
40
60
80
100
As
rem
oval
%
Bara Dudpatila DB1
Krishna Chandrapur DB1
Krishna Chandrapur DB2
Rajnagar Bankabaris DB1
Rajnagar Bankabarsi DB2
Bara Dudpatila DB2
Fit Results (DB2 from Bara Dupadilla excluded from fitting)
Fit 1: LinearEquation Y = -0.33 * X + 90Number of data points used = 5Coef of determination, R-squared = 0.89
Figure 4.15 Correlation of EC and As removal %
If such a correlation exists, the DB2 data of Bara Dudpatila might reflect some sort of
misoperation during the initial testing.
The high EC value implies that there are more competing ion species in the water, which may
prevent the oxidation of arsenic and/or co-precipitation with alum. Keeping this possibility in
mind, the second round testing was done in January 2001 at Rajanargar Bankbarsi where arsenic
removal rates were lowest and EC values were highest. This time, the amount of chemical to be
added was increased 2 and 3 times from the original recommendation by DPHE/DANIDA.
Table 4.15 Test data of increased chemical dosing Village Unit Chemical Water Date As
(field)mg/l
As (AAS)mg/l
PH ORP(mv)
EC MS/m
Fe2+ mg/l
As removal
Raw 1/26/01 0.9 0.43 7.14 137 272 5 Powder Normal
Treated 1/26/01 0.2 0.19 7.18 118 270 0.2 56% DB1
Powder 3 times
Treated 1/26/01 0.06 0.042 6.69 307 290 0 90%
Raw 1/26/01 0.3 0.36 7.11 131 273 5
Rajnargar Bankbarsi
DB2 Powder 2 times
Treated 1/26/01 0.05 0.018 6.73 273 280 0 95%
From the data, two findings were observed. Firstly, arsenic removal of DB1 using a nominal
amount of chemical was improved from 10 to 56%. This may be due to the adequate operation
this time. The initial test was done under the operation by the caretakers while the test this time
4-61

Chapter 4 Arsenic Removal Equipment Supporting Report 1
was done by the project staff because of unusual the dosing of chemicals. The exact nature of
the misoperation in the initial test is not clear at this time, but may be one of the followings:
underdosing of chemical, inadequate mixing, inadequate settling time, and/or inadequate
filtration. Secondly, arsenic removal by increased dosing of chemical was greatly improved so
that the final concentration of arsenic was below 0.05 mg/l. The effect of the high dosages of
potassium permanganate on water quality was a concern. However, the resulting pH and ORP
were in the range of 6.69 to 6.73 and 273 to 307mV respectively, and the dose not seems to
impose an immediate health effect. However, a detailed chemical analysis of the water is now
underway to investigate the water quality issue of higher dosing of chemicals. In conclusion, the
data supported the hypothesis of the problem noted above as competing ion species prevent
arsenic removal either by preventing oxidation or co-precipitation.
In the next step, the tablet-form of the chemicals was introduced to two villages, i.e. Bara
Dudpatila and Krishna Chandrapur. The operation using tablets was done by the caretakers and
the project staff sampled water from the bucket. At first, there were complaints from the
caretakers that the tablet did not easily dissolve in the water and the caretakers had to mix the
contents of the bucket for long time. The analytical data also showed less arsenic removal than
the initial test with the powder form.
Table 4.16 Test data of tablet form Village Unit Chemical Water Date As
(field)mg/l
As (AAS)mg/l
pH ORP(mv)
EC MS/m
Fe2+ mg/l
As removal
Raw 1/31/01 0.02 0.14 7.45 262 41.6 2 DB1 Tablet Treated 1/31/01 0.03 0.075 6.99 177 44.3 0
46%
Raw 1/31/01 0.2 0.21 7.27 340 67 1
Bara Dudpatila
DB2 Tablet Treated 1/31/01 0.01 0.11 7.08 263 66.8 0
48%
Raw 2/3/01 0.2 0.21 7.08 NA 92.8 5 DB1 Tablet Treated 2/3/01 0 0.15 6.98 NA 91 1
29%
Raw 2/3/01 0.3 0.34 7.04 NA 98.9 2
Krishna Chandrapu
r
DB2 Tablet Treated 2/3/01 0 0.27 7.11 NA 100.4 0
21%
During the test period, neither the arsenic concentration nor total water quality represented by
EC value varied significantly as shown in Figure 4.16. Therefore, the lower removal rate cannot
be related to the change in the original water quality. Probably, the tablets were not completely
dissolved during the operation.
4-62

Chapter 4 Arsenic Removal Equipment Supporting Report 1
12/15
/00
1/26/0
1
2/5/01
12/10
/00
2/3/01
2/8/01
12/13
/00
1/31/0
1
Sampling date
0.01
0.1
1
0.02
0.03
0.040.050.060.070.080.09
0.2
0.3
0.40.50.60.70.80.9
Arse
nic
(mg/
l)
DB1 ArsenicDB2 ArsenicDB1 ECDB2 EC
0
50
100
150
200
250
300
EC m
S/m
Bara DudpatilaKrishuna Chadrapur
Rajnagar Bankabarsi
Figure 4.16 Variation of Arsenic and EC by sampling date
Some of the caretakers, at the moment, have started to refuse to use the tablet form of the
chemical. In spite of the initial aim for easier operation, the tablet form prepared for the
experiment failed to achieve its target.
Because of the successful result of increased chemical dosing at Rajnagar Bankabarsi, the tests
with increased dosing were continued at both Krishna Chandrapur and Rajnagar Bnakabarsi.
Table 4.17 Test data of increased chemical dosing -2-
Village Unit Chemical Water Date As (field)mg/l
As (AAS)mg/l
PH ORP(mv)
EC MS/m
Fe2+ mg/l
As removal
Raw 2/5/01 0.8 0.32 7.22 107 253 2 DB1 Powder
2 times Treated 2/5/01 0.03 0.078 6.8 295 283 0
76%
Raw 2/5/01 1 0.29 7.25 130 252 2
Rajnagar
Bankabarsi DB2 Powder
2 times Treated 2/5/01 0 0.04 6.73 296 291 0
86%
Raw 2/8/01 0.4 0.21 7.1 103 90.5 10 DB1 Powder
2 times Treated 2/8/01 0.08 0.072 6.91 280 93.5 0.5
66%
Raw 2/8/01 0.4 0.33 7.08 110 103.8 5
Krishna Chandrapu
r DB2
Powder 2 times
Treated 2/8/01 0.1 0.2 6.97 282 97 0.2 39%
At Rajnagar Bankabarsi, the result was not as good as the previous test. However, removal was
accomplished to below 0.05 mg/l for DB2. DB1 was at 0.078 mg/l, but it was not so far from
the target of 0.05 mg/l. In contrast, at Krishna Chandrapur, removal was not good at all. This
4-63

Chapter 4 Arsenic Removal Equipment Supporting Report 1
was surprising because the EC value, considered as an indicator of the arsenic removal
difficulty of the raw water quality, was much lower in Krishna Chandrapur than in Rajnagar
Bankabarsi. This result suggests that EC cannot be a universal indicator and also the increased
dosing of chemical cannot be a solution for all cases.
Some of the sample water from the treated bucket was found to be not so clear. In one case, the
inside of the bucket (green) was observed and leakage of alum sediment through sand filter was
found. It was probably because of a lack of washing of the sand filter. Such alum sediment
contains high arsenic, thus the treated water will also show a high arsenic value.
In order to evaluate the leakage problem, a filtration experiment was planned. Samples taken
from the treated bucket were further filtered by 0.45µm pore paper, so that any leaked alum
particles larger than 0.45µm would be removed from the samples. Then the samples were
compared with non-filtered samples. The test was done at Bara Dudpatila and Krishan
Chandrapur as shown in Table 4.18. The test of increased dosing was also combined.
Table 4.18 Test data of increased dosing of chemical and additional filtration
Village Unit Chemical Water Date As (field)Mg/l
As (AAS)mg/l
PH ORP(mv)
EC MS/m
Fe2+ Mg/l
As removal
Raw 2/15/01 0.6 0.24 7.51 122 51.9 2 Powder normal
Treated 2/15/01 0.5 0.14 7.23 230 66.2 0 42%
Powder normal
Treated + filtered
2/15/01 NA 0.12 NA NA NA NA 50%
Powder 2 times
Treated 2/15/01 0.05 0.072 7.15 218 68 0 70%
Bara Dudpatila DB2
Powder 2 times
Treated + filtered
2/15/01 NA 0.063 NA NA NA NA 74%
Raw 2/17/01 0.5 0.26 7.2 126 90.5 5 Powder 2 times
Treated 2/17/01 0.05 0.13 7.01 269 93.2 0.5 50% DB1
Powder 2 times
Treated + filtered
2/17/01 0.1 0.089 7.11 256 41(?) 0.2 66%
Raw 2/17/01 0.8 0.42 7.25 138 101.3 2 Powder 2 times
Treated 2/17/01 0.6 0.29 7.02 297 49(?) 1 31%
Krishna Chandrapu
r
DB2 Powder 2 times
Treated + filtered
2/17/01 0.6 0.26 7.24 273 29(?) 0.2 38%
The result showed slight but consistent improvement of arsenic removal by additional filtration.
At this stage, it is difficult to determine if the arsenic detected in the samples was a completely
dissolved species or particles smaller than 0.45µm. However, from an operational viewpoint, the
sand filter probably cannot remove particles smaller than 0.45µm. Therefore, the low arsenic
removal rate is due to a technical problem rather than misoperation by the caretakers.
As a hardware problem, several village caretakers reported leakage from cracking in the bucket.
Out of the 18 units delivered (36 buckets), 12 buckets has been replaced for this reason. Most of
the cracking was at the top/bottom of the valve connection area. Some improvement is required
4-64

Chapter 4 Arsenic Removal Equipment Supporting Report 1
for this problem.
Due to the problem of arsenic removal, use of the system was suspended after April, 2001.
In summary, the findings from the field test of the double bucket system are as follows.
Removal of arsenic is not consistent and varies by water quality.
Water quality varies not only between villages but also within villages.
One indicator of water quality preventing good removal is high EC.
Increased dosing of chemical improved the removal rate from high EC water at Rajnagar
Bankabarsi, but not from water at Krishna Chanrapur.
Tablet form of the chemical does not dissolve easily.
Possibility of leakage from sand filter exists.
Arsenic remained as a dissolved species or as particles smaller than 0.45µm.
Buckets are vulnerable to cracking.
4.5.3 Passive sedimentation system The passive sedimentation system can be the most economical arsenic removal technology.
Some reported on effectiveness of the method, but there is no solid technical information
regarding its effectiveness, limitations or pre-requisites for application. Therefore, the purpose
of the experiment is to define the effectiveness and limitations under given conditions. For this
purpose, three units per village were installed to observe various raw water quality conditions.
The major factors considered as control for arsenic removal was ORP (oxidation-reduction
potential), competing ion species, iron concentration and filtration. During the first testing
immediately after installation of the units, the continuous monitoring of ORP and pH in the
oxidation/sedimentation tank was conducted. Figure 4.17 shows the change of pH and ORP of
the units in Krishna Chandrapur and in Rajnagar Bankabarsi.
4-65

Chapter 4 Arsenic Removal Equipment Supporting Report 1
manual aeration by foot pump 15min.
0 100 200 300 400 500Krishna Chandrapur PS1 unit Time after tank filling (min.)
7
7.1
7.2
7.3
7.4
7.5pH
100
200
300
400
OR
P (m
V)
107
160 162
245284
341 340
LegendpHORP
0 100 200 300 400 500Rajnagar Bankabarsi PS2 unit Time after tank filling (min.)
7
7.1
7.2
7.3
7.4
7.5
pH
100
200
300
OR
P (m
V)
92 86109
140 145170
Figure 4.17 pH and ORP monitoring of passive sedimentation units
It was found that changes in pH were similar in the two villages, but changes in ORP were not.
The increase in pH at the initial stage may be due to the release of carbon dioxide and
subsequent change in the carbonate equilibrium in water. Approximately 8 hours after tank
filling, ORP of Krishna Chanrdapur village was as high as 340mV while that of Rajnagar
Bankabarsi was 170mV. The original (at time zero) ORP was almost the same for the two cases
(92 and 107mV). The slow oxidation in Rajnagar Bankabarsi may be due to its water quality
characterized by high EC values.
The ceramic housing for sand filtration has a diameter of 40cm. The thickness of the sand layer
in the filter housing was 175 mm. The initial flow rate with the tap valve fully opened was 6
liters per minute from the filter. This flow rate is equivalent to 92m/day speed in the sand layer,
which is within the normal rate for sand filtration.
Based on the data, the operating procedure for the test was set as follows.
1) Fill up the tank in the late afternoon near sunset with pumping aeration.
2) Leave water overnight.
3) Start using water after sand filtration in the morning.
This procedure will provide oxidation/sedimentation time longer that 12 hours.
4-66

Chapter 4 Arsenic Removal Equipment Supporting Report 1
Table 4.20 and Figure 4.18 show the test data of three villages. Figure 4.18 shows the arsenic
concentration of treated water in the bar chart with the scale in the right axis and removal % in
the line graph with the scale in the left axis. Concentrations of arsenic in treated water were
lower than standard for all units in Krishna Chandrapur and PS2 unit in Bara Dudpatila in most
of the testing. However, other units shows considerably high arsenic in treated water. Raw inlet
water from the tube wells for those units in Krishna Chandrapur and PS2 unit in Bara Dudpatila
were relatively low in arsenic compared with the others.
Arsenic removal efficiency varied considerably by village, by units within the same village and
by the date of sampling for the same unit. As discussed before for the variation in the removal
rate of the double bucket system, fluctuation of inlet water quality is not the reason. One of the
major reasons for such variation may be the different operating conditions of the units by the
caretakers as well as the project staff. Some of the possible misoperations are as follows:
Constant feeding of water into tank during daytime use. (refer to photo)
Water feeding from the top of the sand filter and disturbance of sand layer. Possible
short-cut in filtration. (refer to photo)
Lack of cleaning of sand filter and tank.
Operation of the units was left to the caretakers at the initial period. Then at a later period, care
was taken to assure the proper condition of the units at the time of sampling by the project staff.
A relatively stable and better removal rate (> 60%) of the test done after late January, except that
of Rajnagar Bankabarsi, supports the assumption. In such a case, the technical capability of the
system shall be evaluated using some of the better results when operation was adequate, while
variation in the results shall be considered as operational issues of the system.
4-67

Chapter 4 Arsenic Removal Equipment Supporting Report 1
4-68
ECS/m)
Fe2+mg/l
Asremoval
97.1 1102.8 066.1 155 01.1 55.9 0
100.9 21.4 0
49.5 550.2 044.8 54.8 0
97.9 0.55.6 0
65.3 265.8 073.1 20.5 0
65.4 24.2 0
89.9 0.20.2 0
86.2 582.2 01.2 2
49.6 091.2 28.2 060 5
60.8 06.3 258 0
90.7 28.8 00.5 29.9 04.3 00.2 54.6 09.2 0
NA NANA NA272 5250 071 5
269 0261 5259 0273 2271 0279 5272 0
76%
63%
91%
59%
46%
44%
10%
72%
24%
64%
59%
51%
66%
-9%
56%
85%
52%
36%
15%
73%
73%
64%
81%
48%
31%
Village Unit Water Date
As(field)mg/l
As(AAS)
mg/l pHORP(mV) (m
PS1 Raw 12/13/00 1 0.4 7.21 98Treated 12/13/00 0.03 0.15 7.38 273
PS2 Raw 12/13/00 0.03 0.17 7.46 81Treated 12/13/00 0 0.016 7.65 147
PS3 Raw 12/13/00 1 0.32 7.24 107 7Treated 12/13/00 0 0.13 7.43 264 5
PS1 Raw 1/15/01 0.1 0.41 7.13 174Treated 1/15/01 0 0.22 7.46 125 6
PS2 Raw 1/15/01 0.2 0.11 7.18 234Treated 1/15/01 0 0.062 7.64 119
PS3 Raw 1/15/01 0.03 0.31 7.37 190Treated 1/15/01 0 0.28 7.53 108 4
PS1 Raw 1/31/01 NA 0.39 7.22 291Treated 1/31/01 0 0.27 7.44 175 9
PS2 Raw 1/31/01 NA 0.1 7.28 181Treated 1/31/01 0 0.036 7.39 335
PS3 Raw 1/31/01 NA 0.41 7.2 259Treated 1/31/01 0 0.17 7.27 329 8
PS1 Raw 12/9/00 0.01 0.27 7.27 107Treated 12/9/00 0 0.13 7.37 341 6
PS2 Raw 12/9/00 0.01 0.11 7.27 110Treated 12/9/00 0 0.12 7.33 373 8
PS3 Raw 12/9/00 0.2 0.16 7.16 110Treated 12/9/00 0 0.071 7.33 324
PS1 Raw 1/15/01 0 0.19 7.5 266 5Treated 1/15/01 0 0.028 7.67 426
PS2 Raw 1/15/01 0 0.061 7.5 -20Treated 1/15/01 0 0.03 8.02 232 8
PS3 Raw 1/15/01 0 0.14 7.36 227Treated 1/15/01 0 0.048 8.38 270
PS1 Raw 2/3/01 0 0.13 7.14 NA 6Treated 2/3/01 0 0.047 7.35 NA
PS2 Raw 2/3/01 0.1 0.046 7.16 NATreated 2/3/01 0 0.0087 7.38 NA 8
PS3 Raw 2/3/01 0.2 0.11 7.28 NA 8Treated 2/3/01 0 0.03 7.46 NA 7
PS1 Treated 2/8/01 0 0.042 7.62 379.967 5PS2 Raw 2/8/01 NA 0.041 7.16 132.967 4
Treated 2/8/01 0 0.011 7.64 374.967 6PS3 Treated 2/8/01 0 0.031 7.3 141.967 7PS1 Raw 12/14/00 NA 1.2 NA NA
Treated 12/14/00 NA 0.29 NA NAPS2 Raw 12/14/00 1 1.4 7.12 92
Treated 12/14/00 0.3 0.39 7.3 220PS3 Raw 12/14/00 0.8 0.5 7.1 89 2
Treated 12/14/00 0.5 0.38 7.45 190PS1 Raw 1/27/01 0.9 0.4 7.09 91
Treated 1/27/01 0 0.21 7.51 211PS2 Raw 1/27/01 0.5 0.45 7.17 122
Treated 1/27/01 0.03 0.29 7.45 85PS3 Raw 1/27/01 1 0.4 7.15 98
Treated 1/27/01 0.2 0.34 7.52 307
RajnagarBankabarsi
BaraDudpatila
KrishnaChandrapur
Table 7.2.20 Test data of passive sedimentation in three villagesTable 4.19 Test Data of Passive Sedimentation in Three Villages

Chapter 4 Arsenic Removal Equipment Supporting Report 1
12/23/00 1/15/01 1/31/01Testing Date
0
20
40
60
80
100
Arse
nic
rem
oval
%
0
0.1
0.2
0.3
Arse
nic
intre
ated
wat
er (m
g/l)
PS1 arsenic mg/lPS1 removal %PS2 arsenic mg/lPS2 removal %PS3 arsenic mg/lPS3 removal %
Drinking waterstandard 0.05mg/l
12/9/00 1/15/01 2/3/01 2/8/01Testing Date
0
20
40
60
80
100
Arse
nic
rem
oval
%
0
0.1
0.2
0.3
Arse
nic
intre
ated
wat
er (m
g/l)
PS1 arsenic mg/lPS1 removal %PS2 arsenic mg/lPS2 removal %PS3 arsenic mg/lPS3 removal %
Drinking waterstandard 0.05mg/l
12/14/00 1/27/00Testing Date
0
20
40
60
80
100
Arse
nic
rem
oval
%
0
0.1
0.2
0.3
Arse
nic
intre
ated
wat
er (m
g/l)
PS1 arsenic mg/lPS1 removal %PS2 arsenic mg/lPS2 removal %PS3 arsenic mg/lPS3 removal %
Drinking waterstandard 0.05mg/l
Bara Dudpatila
Krishna Chandrapur
Rajnagar Bankabarsi
Figure 4.18 Result of passive sedimentation units
4-69

Chapter 4 Arsenic Removal Equipment Supporting Report 1
Figure 4.19 shown below is the histogram of the removal efficiency by the passive
sedimentation system. Distribution is almost normal with an average of 53% and standard
deviation of 24%. Considering the fact that most of the lower removal rate were caused by
misoperation, it is reasonable to expect (average + 1 standard deviation), that is approx. 75%, as
the removal rate for a properly operated unit for inlet water with suitable quality. If we
tentatively set the expected rate for the system at 75%, then the highest arsenic concentration
applicable is 0.2 mg/l to get 0.05 mg/l in the treated water. In fact, raw inlet water for all units in
Krishna Chandrapur and PS2 unit in Bara Dudpatila fell within these limits.
-10 0 10 20 30 40 50 60 70 80 90 100Arsenic removal %
0
1
2
3
4
5
Freq
uenc
y
Fit Results
Fit 1: NormalNumber of data points used = 25Average X = 53.16Standard Deviation = 24.0328
Figure 4.19 Histogram of removal rate by passive sedimentation units
Still, some of the units, such as PS3 unit in Rajnagar Bankabarsi, have very low removal rates,
even though operation was done properly. Water quality parameters that make removal difficult
were investigated and will be discussed later in the chapter. However, to improve the removal
rate from such difficult inlet water, testing of chemical oxidation in addition to the simple
aeration/passive sedimentation process was planned.
The test was conducted at PS1 and PS3 units in Bara Dudpatila and all units in Rajnagar
Bankabarsi. To enhance the oxidation of arsenic, potassium permanganate was added to the tank
when filled up (refer to photo re water in tank). Other operating conditions were the same as
usual. The amount of dosing was 1.0 mg/l at Bara Dudpatila, and 1.0 mg/l and 1.5 mg/l at
Rajnagar Bankabarsi. At Bara Dudpatila, additional filtration by 0.45µm pore filter was done to
examine the possibility of a filtration problem.
4-70

Chapter 4 Arsenic Removal Equipment Supporting Report 1
The results of test are shown in Table 4.20 below. PS3 unit in Bara Dudpatila showed a clear
improvement of over 80% removal. The other units did not show much improvement except
PS2 unit of Rajnagar Bankabarsi on the day of 2/4/01. ORP measurements for all cases are
above 300mV. We can assume that oxidation was completed for all cases. One factor making
PS2 unit in Bara Dudpatila different from the others is its high Fe2+ concentration (= 10mg/l).
From this point, the Fe2+ concentration in inlet water is the key factor for improvement by added
chemical oxidation. On the other hand, the reason for the excellent result of PS2 unit in
Rajnagar Bankabarsi on the day of 2/4/01 is not clear at this stage.
Added filtration does not provide significant improvement. This is the same case as the double
bucket experiment discussed before. Further discussion will not be repeated.
Table 4.20 Test data of passive sedimentation by chemical oxidation
Village Unit Water Date
As(field)mg/l
As(AAS)mg/l pH
ORP(mV)
EC(mS/m)
Fe2+mg/l
Asremoval
PS1 Raw 2/10/01 0.9 0.47 7.2 270 99.4 2Treated 2/10/01 0.2 0.28 7.48 320 97 0 40%Filtered 2/10/01 NA 0.27 NA NA NA NA 43%
PS3 Raw 2/10/01 0.7 0.43 7.19 121 72.9 10Treated 2/10/01 0.02 0.078 7.49 322 74.9 0 82%Filtered 2/10/01 NA 0.075 NA NA NA NA 83%
PS1 Raw 2/4/01 0.6 0.41 7.2 121 255 5Treated 2/4/01 0 0.26 7.53 331 261 0
PS2 Raw 2/4/01 0.4 0.49 7.15 101 276 2Treated 2/4/01 0.01 0.013 7.64 328 270 0
PS3 Raw 2/4/01 0.5 0.43 7.24 102 272 5Treated 2/4/01 0.01 0.26 7.6 332 265 0
PS1 Raw 2/4/01 0.5 0.35 7.12 125 262 2Treated 2/4/01 0.02 0.21 7.52 328 256 0
PS2 Raw 2/4/01 0.2 0.41 7.19 94 272 2Treated 2/4/01 0.06 0.25 7.62 332 275 0
PS3 Raw 2/4/01 0.6 0.44 7.31 99 271 1Treated 2/4/01 0.05 0.24 7.51 336 267 0
BaraDudpatila
RajnagarBankabarsi
40%
39%
45%
KMnO4 1mg/l added
KMnO4 1mg/l added
KMnO4 1.5mg/l added
37%
97%
40%
Water quality that controls the removal efficiency by the process was considered. In this process,
a raw water quality chemistry that can separate the PS1, 2 and 3 units in Krishna Chadrapur and
PS2 in Bara Dudpatila from others was searched for. A special effort was taken to find the
difference within the raw water quality of Bara Dudpatila. The graph below shows the result of
such a study. A combination of the Fe/As ratio and Cl concentration can separate Treatable -
Untreatable quality fairly well. The meaning of the Fe/As ratio is straightforward: an excess of
4-71

Chapter 4 Arsenic Removal Equipment Supporting Report 1
Fe ions is essential in the co-precipitation of arsenic. The Cl concentration may be a general
representative of the total dissolved ions. However a graph using Cl ions can separate the
samples better than the EC value. Considering the fact that three units in Bara Dudpatila village
are located only within a short distance, the factor shall be related to the localized water quality
issue. In this regard, the meaning of Cl may be human input by domestic waste to groundwater
quality.
1 10 100 1000Cl (mg/l)
0.1
1
10
100
Fe/A
s ra
tio (m
g ba
sis)
UntreatableTreatable
Figure 4.20 Water quality parameter for passive sedimentation
Based on the results, all passive sedimentation units in Rajanagar Bankabarsi and PS1 and PS2
units in Bara Dudpatila were suspended and caretakers were recommended not to use treated
water for drinking purposes after March, 2001.
Four units of passive sedimentation were monitored for their removal efficiency.
Table 4.21 Monitoring of Passive Sedimentation units Arsenic content in treated water (mg/l) and removal % Jan.2001 Feb. 2001 March 2001 April 2001 June 2001
PS1
0.064(66%) 0.042(68%) 0.052(81%) 0.061(70%) 0.043(83%)
PS2
0.030(51%) 0.0087(81%) 0.0057(98%) 0.01(93%) 0.04(70%)
Krishna Chandrapur
PS3
0.048(66%) 0.030(73%) 0.025(84%) 0.030(47%) 0.18(-)
Bara Dudpatila
PS2
0.036(64%) - 0.029(74%) 0.067(-) 0.13(61%)
Some samples showed arsenic concentrations above 0.05 mg/l. However, there is no general
trend of increasing concentrations over time. Therefore, it is assumed that the removal of arsenic
may be affected by some operational problem. Possible causes of the problem are shown in the
4-72

Chapter 4 Arsenic Removal Equipment Supporting Report 1
photos below.
Typical pump and use situation.This makes no oxidation /sedimentation time.
View from top of sand filter.At right side, sand layer wasdisturbed by bubblingcausing short cut pass.
A summary of the findings is as follows.
Removal of arsenic by passive sedimentation varied considerably by operating
condition.
If properly operated for suitable water quality, 75% removal can be expected. Therefore
0.2 mg/l is the limiting concentration for inlet water.
High Fe2+ /As ratio and low Cl ion concentration are indications of suitable water
quality.
Chemical oxidation by potassium permanganate is effective in improving the removal
rate only for water with high Fe2+ concentrations.
4-73

Chapter 4 Arsenic Removal Equipment Supporting Report 1
4.5.4 Activated alumina system Activated alumina adsorption is used widely for water treatment. Various technical reports were
also available regarding arsenic removal by activated alumina. Therefore, the focus of the
experiment was not just its removal efficiency, but the effect of water quality on the
breakthrough volume and the operational aspect as a community-based system.
Initially, each 20kg of promoted activated alumina was packed in the filter housing. As the bulk
density of the activated alumina used is 0.91g/cm3, 20 kg is equivalent to approx. 22 liters. The
breakthrough volume of normal activated alumina for As (V), reported in literature, is over
10,000. The manufacturer of promoted activated alumina (ALCAN) claims that the product is
five times more capable than normal activated alumina. Assuming the breakthrough volume as
10,000 for 22 liters of adsorbent, the unit can treat up to 220,000 liters of water. This is
equivalent to 220 days use at 1,000 liters per day. In the same way, if the breakthrough volume
is 20,000, the unit can be used for 440 days without replacement in theory.
The operating procedure is as follows.
1) Fill up the upper tank in the afternoon.
2) Leave water overnight.
3) Start filtration and adsorption in the morning. Keep water in the lower tank.
The procedure is similar to that of passive sedimentation. The water in the upper tank thus has at
least more than 12 hours of oxidation/sedimentation time. Sand filtration before activated
alumina shall remove all iron as well as some arsenic. The removal of iron is essential to ensure
the longer life of activated alumina as iron may plug the pores of the adsorbent. The filtration
rate is approximately 3 to 4 liters per minute from the upper tank to the lower tank. This will
provide 5 to 7 minutes contact time with the activated alumina bed. It will take over 4 hours to
complete the treatment of 1,000 liters in the upper tank. If filtration is started, all the water will
flow from the upper tank to the lower tank. Then, the upper tank is ready to receive new inlet
water for the next cycle.
Table 4.22 shows the results of the test in the three villages. The new tube well drilled for the
unit in Bara Dudpatila had an arsenic concentration lower than 0.05 mg/l before treatment. This
was not expected because the nearby tube well showed higher arsenic contamination. However,
the concentration in the new tube well may increase by continued use. The removal of arsenic
from the water in this unit was excellent so that the final concentration was 0.0015 mg/l. The
unit in Krishna Chandrapur also showed good removal of arsenic, but the final concentration of
the treated water was 0.083 mg/l for the first test and 0.051 mg/l for the second test. This is
slightly above the target of 0.05 mg/l. For this reason, 30 kg of activated alumina was added to
the unit instead of the original 20 kg. This will provide 50% more contact time for the water.
After this arrangement, the arsenic in the treated water was 0.035 mg/l.
4-74

Chapter 4 Arsenic Removal Equipment Supporting Report 1
Table 4.22 Test data of activated alumina
Village Unit Water Date
As(field)mg/l
As(AAS)mg/l pH
ORP(mV)
EC(mS/m)
Fe2+mg/l
Asremoval
Raw 1/31/01 0.01 0.045 7.28 241 67 2Treated 1/31/01 0 0.0015 7.05 235 58 0 97%
Raw 2/3/01 0.3 0.38 6.98 NA 127 5Treated 2/3/01 0 0.083 7.39 283 117 0 78%
Raw 2/8/01 NA 0.43 6.99 112 65(?) 10Treated 2/8/01 0 0.051 7.27 152 127 0 88%Treated 2/17/01 0 0.035 6.72 326 126 0 92%
Raw 1/27/01 0.9 0.42 7.19 132 262 2Treated 1/27/01 0 0.088 7.45 293 128 0 79%
Raw 2/5/01 0.7 0.36 7.32 125 226 5Treated 2/5/01 0.02 0.11 7.64 330 233 0 69%
Raw 2/6/01 0.6 0.42 7.32 100 255 1Treated 2/6/01 0.01 0.18 7.57 329 255 0 57%
RajnagarBankabarsi AA
BaraDudpatila AA
KrishnaChandrapur AA
In spite of the good results in Bara Dudpatila and Krishna Chandrapur, the unit in Rajnagar
Bnakabarsi had problems. As discussed, the raw water in Rajnagar Bankabarsi is characterized
by its high EC value. This means, in general, the water contains more competing ion species
than the others. In the first test, arsenic was reduced from 0.42 to 0.088 mg/l. However, the EC
value also was reduced from 262 to 128 mS/m after treatment. This suggests that activated
alumina had adsorbed various ion species. If so, such adsorbed ion species might occupy many
adsorption sites of the activated alumina. Obviously such occupation of the adsorption sites by
other ions will reduce the breakthrough volume for arsenic. As expected, the results from the
second and third tests show a gradual decrease in arsenic removal. This decrease in removal
efficiency had taken place in less than a two-week period. As a countermeasure, 40kg of
activated alumina was added to the unit instead of the original 20 kg on March 4, 2001. This
will provide 100% more contact time for the water. However, the effect of the improved arsenic
removal started to diminish within a month, as shown in Table 4.23.
Table 4.23 Effect of Increased Activated Alumina at Rajanagar Bankabarsi 3/4/01 3/27/01 4/30/01 5/9/01 5/22/01 6/1/01 7/1/01 Arsenic (mg/kg) in treated water
0.02 0.062 0.23 0.27 0.3 0.4 0.25
Removal % 96% 87% 55% 13% 47% 40% 45%
The result indicated the extreme variation of the breakthrough volume of the system depending
on the quality of raw water. It is concluded that replacement of activated alumina every one or
two months at Rajanagara Bankabarsi is not economically acceptable to the community.
Therefore, use of the system was suspended after July 2001. The table below showed the
monitoring data of activated alumina units at Krishna Chanrapur and Bara Dupatila. The arsenic
4-75

Chapter 4 Arsenic Removal Equipment Supporting Report 1
concentration of the treated water at Krishna Chanrapur increased up to 0.14 mg/kg in April. It
was not clear whether this is due to the breakthrough or inadequate maintenance of the unit
(back flushing) and subsequent iron plugging of the activated alumina. The caretaker of the unit
never back flushes the sand filter for iron removal. Also, the solar cell powered pumping system
at Krishna Chanrapur broke down in June, 2001. Replacement of activated alumina after repair
of the pump was done and operation started again in October 2001. The unit at Bara Dupatila
produced treated water with arsenic lower than 0.05 mg/kg. Here, the problem is the stability of
the electricity supply for running of the lift up pump. Due to a storm and other reasons, the
electricity supply was suspended from time to time. Therefore, an exact estimate of the
breakthrough volume of activated alumina has not been done, at this moment.
Table 4.24 Monitoring of Activated Alumina units 2/8/01 3/2/01 3/25/01 4/27/01 6/1/01 10/6/01
Arsenic (mg/kg) in treated water
0.051 0.068 0.073 0.14 - 0.0017 Krishna Chanrapur
Removal % 88% 85% 81% 22% - 99% Arsenic (mg/kg) in treated water
- - 0.0059 0.0024 0.0054 - Bara Dupatila
Removal % - - 85% 94% 92% -
Overall, the activated alumina unit is functioning as expected. However, the real challenge of
the technology is when the breakthrough takes place. Variation of the breakthrough volume
depending on the raw water quality is expected as seen at Rajanagar Bankabarsi. This indicates
the requirement for extensive monitoring of treated water is high.
A summary of the findings is as follows.
Activated alumina removes arsenic as expected from normal water (not saline and high
EC).
Saline water and water with high EC value reduce the performance.
Breakthrough volume varies depending on the raw water quality. Extensive monitoring
is required.
Operation was interrupted because of electricity problems.
4-76

Chapter 4 Arsenic Removal Equipment Supporting Report 1
4.5.5 Basin-type solar distillation system As for solar distillation, the arsenic removal efficiency is not an issue. Theoretically, it will
remove all dissolved species, except some of the volatile components. Table 4.25 shows the
result of testing of the unit in Bara Dudpatila. Arsenic was reduced to 0.001 mg/l, which is near
the detection limit of the analytical system. It is also noted that the EC value was reduced from
71.3 to 4.38 mS/m. This demonstrates the removal of all dissolved species. The common
problem found in other arsenic removal technologies, i.e. the influence of other dissolved ions,
is not a problem for the solar distillation technology.
Table 4.25 Test data of basin-type solar distillation Unit Water Date As (field)
mg/l As (AAS) mg/l
PH ORP (mV)
EC (mS/m)
Fe2+ mg/l
As removal
SSB Raw 2/15/01 0.6 0.099 7.32 286 71.3 2 99% Treated 2/15/01 0 0.0011 7 409 4.38 0
Instead, a major challenge of the unit is its yield. For this reason, a detailed experiment was
done to measure its distillation yield. The test was done at the unit in Bara Dudpatila on
February 14th and 15th and in Krishna Chandrapur on February 17th. Figures 4.20 and 4.21
show the results of the tests at Bara Dudpatila and Krishna Chadrapur, respectively.
In the figure, the bar chart shows the water yield per sampled time period and the symbol and
line graph shows the cumulated water yield. At Bara Dudpatila, approx.12 to 13 liters of water
were produced in a day. Since the unit has a basin size of 6 m2 (1 m x 2 m basin x 3), the
efficiency can be calculated as 2.0 to 2.2 liter / m2. This is in the same range as reported for the
efficiency of the basin type unit. It shall be noted that 0.7 to 1 liter of water was also produced
during the nighttime. The water vapor produced and condensed in the glass cover on the
previous day is the reason for such production. At Krishna Chandrapur, approx. 11 liters of
water were produced. As nighttime production was missing at Krishna Chnadrapur test, the
overall yield at the two villages is almost the same.
It is expected, with the increased temperature and stronger sunshine toward summer, that the
yield will further increase in the coming months.
4-77

Chapter 4 Arsenic Removal Equipment Supporting Report 1
overnight 6-10 10-11 11-12 12-13 13-14 14-15 15-16 16-17 17-18Time period
0
4,000
8,000
12,000
16,000W
ater
yie
ld (m
l)
1000 10601660
3060
5300
7750
10150
1159012490
13090LegendYield per periodCumulated yield
Basin type solar distillation unit experimental data of Feb. 14, 2001
overnight 6-10 10-11 11-12 12-13 13-14 14-15 15-16 16-17 17-18Time period
0
4,000
8,000
12,000
16,000
Wat
er y
ield
(ml)
700 1,0001,800
3,325
5,545
7,845
10,015
11,41512,215 12,665Legend
Yield per periodCumulated yield
Basin type solar distillation unit experimental data of Feb. 15, 2001
Figure 4.21 Yield of basin-type solar distillation at Bara Dudpatila
4-78

Chapter 4 Arsenic Removal Equipment Supporting Report 1
overnight 6-10 10-11 11-12 12-13 13-14 14-15 15-16 16-17 17-18Time period
0
4,000
8,000
12,000W
ater
yie
ld (m
l)
0 200900
2450
4450
6550
8550
975010450 10800
LegendYield per periodCumulated yield
Basin type solar distillation unit experimental data of Feb. 17, 2001 Figure 4.22 Yield of basin-type solar distillation at Krishna Chandrapur
Table 4.26 shows the monitoring data of basin type solar distillation units. As expected, arsenic
removal is very consistent and nearly 100% all the time. At Rajanagar Bankabarsi, pond water
was used for treatment instead of arsenic contaminated groundwater. This demonstrates the
all-round flexibility of the distillation process for any type of raw water.
Table 4.26 Monitoring of Basin-type Solar Distillation units Arsenic in treated water (mg/l) and removal % Feb. 2001 March 2001 May 2001 June 2001 Rajanagar Bankabarsi
- 0.00058 (100%) 0.00074 (*)
0.0027 (*)
Krishna Chandrapur
- <0.0005 (100%) 0.0056 (99%) 0.0021 (99%)
Bara Dupatila
0.001 (99%) - - -
(*) pond water was used for treatment. Arsenic removal % not applicable.
There were various engineering problems found during the test. The glass cover of the units at
Rajanagar Bankabarsi and Bara Dupatila broke for unknown reasons. It may be due to the stress
of the glass from the slight distortion of the frame of the unit. Another possibility is hail. In spite
of the sub-tropical climate, Bangladesh often has hail. Therefore, a fish net was installed over
the entire unit for protection of the glass cover. Secondly, there was more sediment and
precipitation in the bottom of the distillation chamber. Slow flushing of the water was not
adequate to remove the precipitation. A glass opening mechanism may be necessary. Fortunately,
the problems encountered could be solved by engineering improvements in the manufacturing
4-79

Chapter 4 Arsenic Removal Equipment Supporting Report 1
and do not impose a critical drawback on the system.
A summary of the findings is as follows.
Solar distillation completely removes arsenic as well as other potential pollutants dissolved
in water.
Basin-type solar distillation can produce approx. 2.0 to 2.2 liter/m2/day in Bangladesh
climate.
The unit shall be improved for glass protection and bottom cleaning feature.
4.5.6 Vacuum-type solar distillation system The vacuum-type solar distillation unit was installed at Krishna Chandrapur in late February.
The unit applies a solar cell powered vacuum to the water kept in the conventional solar panel to
enhance its distillation. Details of the structure of the unit and its function can be found in the
supporting report. The solar panel itself has a sunlight receiving area of approx. 1.8m2. This is
approximately 30% of the area of the basin-type unit, which is 6m2.
A test for its water distillation capacity was conducted from March 3 to 6, 2001. As a result, the
following quantities of water were obtained during each test.
March 3 8.30 liters (4.6 liters/m2/day)
March 4 8.07 liters (4.5 liters/m2/day)
March 5 9.45 liters (5.25 liters/m2/day)
Observation on the solar panel by hand touch indicated active boiling inside the panel. The
above noted yield seems far too low if active boiling took place in the panel. The temperature of
the cooling water for condensation was monitored. The temperature of the water increased fairly
quickly and reached a stable condition after a few hours of operation. This suggests that
bottlenecking to produce more water is not at the boiling process but at the condensation
process. The unit designed as a single effect (heat of evaporation was used only once in the
cycle) was not effective in the climatic conditions in Bangladesh. Nevertheless, the experiment
provided solid data for single effect units. The potential yield of a multiple effect system can be
estimated theoretically based on the data. K. Uda et al. (1994) reported approx. 4 times the yield
for a multiple effect system simulation. If we apply this case, a vacuum- multiple effect system
can produce approx. 20 liters /m2/day.
Table 4.27 Test data of Vacuum type Solar Distillation unit Water Date As (field)
mg/l As (AAS) mg/l
pH ORP (mV)
EC (mS/m)
Fe2+ mg/l
As removal
Raw 3/26/01 0.5 0.13 7.08 129 79.9 5.0 Treated 3/26/01 0.0 <0.0005 7.82 184 0.90 0.0
100%
Raw 5/21/01 0.3 0.12 7.08 109 81.3 4.0 100% Treated 5/21/01 0.0 <0.0005 7.56 397 1.25 0.0
4-80

Chapter 4 Arsenic Removal Equipment Supporting Report 1
Table 4.27 shows the results for water quality and arsenic removal. Arsenic removal was almost
perfect at 100%.
A summary of the findings is as follows.
Solar distillation completely removes arsenic as well as other potential pollutants dissolved
in water.
Vacuum-type solar distillation can produce approx. 4.5 to 5.0 liters/m2/day in the
Bangladesh climate.
If improved to a multiple effect system, theoretically, the unit can produce 4 times the
water or 18 to 20 liters/m2/day.
Vacuum-type
Basin-type
4-81

Chapter 4 Arsenic Removal Equipment Supporting Report 1
4.6 Evaluation and conclusion The original plan of evaluating arsenic removal technology was to compile the results of the
study with that of BAMWASP to provide a more comprehensive evaluation of the technology.
Therefore, the experiment of the study was designed to avoid any duplicate with the
BAMWASP project.
In spite of the original plan, BAMWASP renewed its original evaluation project of arsenic
removal technology. The OCETA/CIDA initiated ETV-AM (Environmental Technology
Verification - Arsenic Mitigation) project took the replacement role. However, the project
implemented at almost the same time as this study has not yet started any field experiments and
hence there is no official report available.
The DfID funded Rapid Assessment Program selected five arsenic removal technologies as
relevant, namely activated alumina by ALCAN, activated alumina by BUET, Stevens
technology, Tetrahedran, and Three Kolshi filter. BAMWASP recognized the report but still
considers the technologies to be used on an experimental and research basis only.
Under the circumstances, the report will summarize the evaluation of the technologies tested
only in this study. The evaluations of the arsenic removal devices were compiled using the
criteria as shown in Table 4.28. Criteria was categorized into 1) arsenic removal, 2) operation
and maintenance and 3) cost.
As far as arsenic removal efficiency is concerned, distillation technologies show almost
complete removal data. Activated alumina and aeration/passive sedimentation show acceptable
removal under the appropriate conditions.
The operation and maintenance aspect is more complicated. It is difficult to conclude any one of
the technologies has a clear advantage over the others. Solar distillation has an advantage in all
aspects except for the small quantities of produced water. The double bucket has more problems
in terms of operation and monitoring than the others.
Regarding the cost, some explanation of the figures in the table is necessary. The unit cost of the
system as well as the expected life time of the unit are approximate at this stage. Obviously
solar distillation has the highest cost/l as a small capacity. For operational cost, the manpower
cost was not quantified in this table as we assume all operation to be done by the users. The
consumable cost for activated alumina is based on 20,000 Tk/year and 1,000l/day capacity. For
monitoring, monthly monitoring is conducted at the cost of 500 Tk/analysis, which is standard
DPHE charge.
4-82

Chapter 4 Arsenic Removal Equipment Supporting Report 1
Table 4.28 Evaluation of five technologies
Aspect No. Criteria/Question Double bucket system
Aeration / Passive sedimentation
Activated alumina
Basin solar distillation
Vacuum solar distillation
Arsenic removal efficiency
1.1 Different removal efficiency for As(III) and As(V)?
Yes Yes Yes No No
1.2 Oxidation process required for removal of As(III)?
Yes Yes No No No
1.3 Removal efficiency changed by continued use?
No No Yes No No
1.4 Removal efficiency influenced by the other dissolved ions?
Yes Yes Yes No No
1.6 Field test data. Removal rate.
Not satisfactory
70-90% for adequate quality of raw water
85-95% before breakthrough
99-100% 100%
Operation and maintenance
2.1 Household or community based? What is capacity per unit?
Household 20l/day
Community 400l/day
Community 1000l/day
Household 12l/day
Household 9l/day
2.2 What is dairy operational procedure? Number of step? Labor time required?
3 step 10-20 min.
2 step 40min.
2 step 10-20min.
1 step 20min.
4 step 30 min
Refer to flow sheet. 2.4 What is maintenance
procedure? weekly, monthly? Number of step?
Cleaning bucket and sand filter daily
cleaning tank and sand filter weekly
back flushing every few days
flush bottom water daily
maintenance of vacuum pump once a year
2.5 Consumable required? What? How often? Is that potentially hazardous?
Yes, KMnO4 and alum, Hazardous
No Activated alumina
1-2 time/year
No No
2.6 Chemicals required? What? How often? Is that potentially hazardous?
Yes, Daily, KMnO4 and alum, Hazardous
No No No No
2.7 Waste generated? How much /day, month
Yes. Few gram/day
Yes, few gram/day
Yes, 20-80kg/year
No No
2.8 Monitoring requirement Modest Modest High No No 2.8-1 1.3, 1.4, 1.5 is yes,
monitoring required. How often ?
Minimum monthly
minimum monthly
minimum monthly
2.8-2 Monitoring parameters? Arsenic? Other ions?
Arsenic Arsenic and Iron
Arsenic not required
not required
2.9 Operational risk? Handling of chemical, miss operation, no arsenic removal, excess
No removal of arsenic if miss operated
No removal of arsenic if breakthrough occur
Less production of arsenic free water
Less production of arsenic free water
4-83

Chapter 4 Arsenic Removal Equipment Supporting Report 1
chemical
Cost 3.1 Equipment cost 3.1-1 cost/unit 500TK 15,000TK 100,000TK 100,000TK 500,000TK Expected life time of the
equipment 3 years 10 years 10 years 10 years 20 years
3.1-2 unit cost/l of treated water over expected life time (TK/l)
0.034 0.014 0.027 2.854 1.712
3.2 Operating cost (TK/l) 3.2-1 Manpower NA NA NA NA NA 3.2-2 Consumable 0 0 0.055 0 0 3.2-3 Chemical (TK/l) 0.002 0 0 0 0 3.2-4 Power or any other utility 0 0 0.003 0 0 3.2-5 Monitoring
( 500TK/analysis) 0.822 0.055 0.016 0 0
3.2-6 Waste treatment disposal site construction, collection, transportation
Required Required Required not required
not required
3.3 Use of locally available material 3.3-1 Equipment Yes Yes Yes Yes No 3.3-2 Consumable Yes NA No not
required NA
3.3-3 Chemical Yes NA NA NA NA
Ideally, the device shall be very easy to use and maintain, treat a sufficient quantity of water,
have less risk of misoperation or secondary hazardous accidents, have a consistent arsenic
removal efficiency down to 0.05 mg/l, require less monitoring, have less problem in waste
disposal, be economically feasible in both the initial and running cost, and be socially
acceptable.
Unfortunately, the study could not identify a single arsenic removal device or technology that
fulfills all of the requirements necessary to be used in the rural conditions of Bangladesh. Every
technology has an advantage in one aspect but a disadvantage in another aspect. Therefore, at
this stage, the choice of the device depends on the condition given to a specific site and
situation.
As a result, the following three technologies are recommended for the different conditions
assumed:
1. Aeration/passive sedimentation
2. Solar distillation combined with rainwater harvesting
3. Adsorption based arsenic removal device
4-84

Chapter 4 Arsenic Removal Equipment Supporting Report 1
1. Aeration / passive sedimentation
Technology description: As most of the arsenic contaminated tube well water also
contains high iron, aerated oxidation of water causes the precipitation of iron. Arsenic can
be removed together with iron once precipitated, by sand filtration.
Advantage: No chemical or consumable, capable of producing a sufficient volume of water,
easy operation and maintenance, low initial cost and negligible running cost, socially
acceptable.
Disadvantage: Arsenic removal efficiency depends on the raw water quality, not applicable
to water with high EC or Cl ion concentration, not applicable to water with a small Fe/As
ratio, not applicable to high arsenic concentrations above 0.2 mg/l.
Recommended situation: If raw water quality meets the applicable standard, removal
testing shall be conducted before installation of the device.
2. Solar distillation combined with rainwater harvesting
Technology description: Solar distillation utilizes solar heat to distill the water to remove
not only arsenic but also other pollutants completely. Solar distillation can work most
efficiently in the dry season while rainwater harvesting can collect the rain in other seasons.
A combination of the two technologies can be the most ideal and environmentally friendly
solution.
Advantage: Complete removal of arsenic and other pollutants, no effect by initial raw water
quality, no monitoring requirement, no chemical or consumable, easy operation and
maintenance, negligible running cost, socially acceptable.
Disadvantage: Requires a relatively large area, sunshine condition critical, high initial cost
Recommended situation: Recommended for hospitals or schools where the building roof is
available for rainwater collection as well as installation of a solar distillation unit. Donor
contribution for initial cost bearing is required.
3. Adsorption based arsenic removal device
Technology description: Removal of arsenic by adsorption media such as activated alumina,
ion exchange resin, cerium hydroxide, granular Fe oxide, etc.
Advantage: Stable arsenic removal in most cases, easy operation and maintenance,
relatively low initial cost, socially acceptable.
Disadvantage: Monitoring required for breakthrough, costly media for replacement,
replacement cycle depends on raw water quality, spent media as hazardous waste,
Recommended situation: Recommended for area where no other solution is available.
Community or users shall be aware of the periodical cost bearing for replacement of media.
4-85
Copyright © 2022 FDOKUMEN