
A pilot GIS database of active faults of Mt. Etna (Sicily): A tool for integrated hazard evaluation
17
A pilot GIS database of active faults of Mt. Etna (Sicily): A tool for integrated hazard evaluation Giovanni Barreca a , Alessandro Bonforte b, ⁎, Marco Neri b a Università degli Studi di Catania, Dipartimento di Scienze Biologiche, Geologiche ed Ambientali, Sez. Scienze della Terra, Italy b Istituto Nazionale di Geofisica e Vulcanologia, Sezione di Catania, Osservatorio Etneo, Italy abstract article info Article history: Received 18 November 2011 Accepted 19 August 2012 Available online 29 August 2012 Keywords: GIS-based system Hazard assessment Volcano-tectonics Flank dynamics Georeferenced arc-features Active fault database A pilot GIS-based system has been implemented for the assessment and analysis of hazard related to active faults affecting the eastern and southern flanks of Mt. Etna. The system structure was developed in ArcGis® environment and consists of different thematic datasets that include spatially-referenced arc-features and as- sociated database. Arc-type features, georeferenced into WGS84 Ellipsoid UTM zone 33 Projection, represent the five main fault systems that develop in the analysed region. The backbone of the GIS-based system is con- stituted by the large amount of information which was collected from the literature and then stored and properly geocoded in a digital database. This consists of thirty five alpha-numeric fields which include all fault parameters available from literature such us location, kinematics, landform, slip rate, etc. Although the system has been implemented according to the most common procedures used by GIS develop- er, the architecture and content of the database represent a pilot backbone for digital storing of fault param- eters, providing a powerful tool in modelling hazard related to the active tectonics of Mt. Etna. The database collects, organises and shares all scientific currently available information about the active faults of the volcano. Furthermore, thanks to the strong effort spent on defining the fields of the database, the structure proposed in this paper is open to the collection of further data coming from future improvements in the knowledge of the fault systems. By layering additional user-specific geographic information and managing the proposed database (topological querying) a great diversity of hazard and vulnerability maps can be pro- duced by the user. This is a proposal of a backbone for a comprehensive geographical database of fault systems, universally applicable to other sites. © 2012 Elsevier B.V. All rights reserved. 1. Introduction: the GIS tool in natural hazard Geographical Information Systems (GIS) are computer-based sys- tems used to store, manipulate and display geographic information. They are designed to “support the capture, management, manipulation, analysis, modelling and display of spatially referenced data for the solu- tion of complex planning and management problems” (Aranoff, 1989). The manipulation of data ranges from the simple overlay of differ- ent thematic maps for the identification of areas with specific required conditions to the more sophisticated use of mathematical operators or integrated numerical models for the prediction of the dy- namics of natural phenomena. GIS technology, when applied to land use planning and natural resource management and protection, is a tool that can support scientific research and decision making (Burrough, 1989). The role of GIS in natural hazard assessment was highlighted in several papers concerning the use of GIS tools for the study and analysis of geological (Salvi et al., 1999), seismological (Ganas and Papoulia, 2000), and volcanological data (Kauahikaua et al., 1995; Pareschi et al., 2000; Pareschi, 2002). The eastern and southern slopes of Mt. Etna volcano, that host about thirty municipalities for a total of about half a million inhabi- tants, were frequently invaded in the past by historical lava flows erupted from the NE-Rift and S-Rift, highlighting the exposure of these areas to such events (Behncke et al., 2005; Crisci et al., 2010). Moreover, the same portion of the Mt. Etna edifice is affected by a fairly continuous and roughly seawards sliding, occasionally acceler- ated during shallow magma intrusions in the central-upper part of the volcano (Acocella et al., 2003; Neri et al., 2004, 2009; Walter et al., 2005). In this paper, we present a pilot study using a GIS developed in ArcGis® framework, specifically designed for managing the hazard re- lated to the large-scale flank instability of Mt. Etna. The core of the developed GIS-system consists of spatially referenced arc-features (polylines representing the digital geo-referenced representation of fault segments and tectonic lineaments) collected in a digital map of ac- tive faults of the eastern and southern flanks of Mt. Etna. Each segment is linked to a spatial database which includes the main geo-structural and instrumental fault parameters. Hazard assessment can be obtained Journal of Volcanology and Geothermal Research 251 (2013) 170–186 ⁎ Corresponding author at: Istituto Nazionale di Geofisica e Vulcanologia, Osservatorio Etneo, Piazza Roma n°2, 95123 Catania, Italy. Tel.: +39 0957165800. E-mail address: [email protected] (A. Bonforte). 0377-0273/$ – see front matter © 2012 Elsevier B.V. All rights reserved. http://dx.doi.org/10.1016/j.jvolgeores.2012.08.013 Contents lists available at SciVerse ScienceDirect Journal of Volcanology and Geothermal Research journal homepage: www.elsevier.com/locate/jvolgeores
Transcript of A pilot GIS database of active faults of Mt. Etna (Sicily): A tool for integrated hazard evaluation

Journal of Volcanology and Geothermal Research 251 (2013) 170–186
Contents lists available at SciVerse ScienceDirect
Journal of Volcanology and Geothermal Research
j ourna l homepage: www.e lsev ie r .com/ locate / jvo lgeores
A pilot GIS database of active faults of Mt. Etna (Sicily): A tool for integratedhazard evaluation
Giovanni Barreca a, Alessandro Bonforte b,⁎, Marco Neri b
a Università degli Studi di Catania, Dipartimento di Scienze Biologiche, Geologiche ed Ambientali, Sez. Scienze della Terra, Italyb Istituto Nazionale di Geofisica e Vulcanologia, Sezione di Catania, Osservatorio Etneo, Italy
⁎ Corresponding author at: Istituto Nazionale di GeofisiEtneo, Piazza Roma n°2, 95123 Catania, Italy. Tel.: +39 0
E-mail address: [email protected] (A. Bo
0377-0273/$ – see front matter © 2012 Elsevier B.V. Allhttp://dx.doi.org/10.1016/j.jvolgeores.2012.08.013
a b s t r a c t
a r t i c l e i n f oArticle history:Received 18 November 2011Accepted 19 August 2012Available online 29 August 2012
Keywords:GIS-based systemHazard assessmentVolcano-tectonicsFlank dynamicsGeoreferenced arc-featuresActive fault database
A pilot GIS-based system has been implemented for the assessment and analysis of hazard related to activefaults affecting the eastern and southern flanks of Mt. Etna. The system structure was developed in ArcGis®environment and consists of different thematic datasets that include spatially-referenced arc-features and as-sociated database. Arc-type features, georeferenced into WGS84 Ellipsoid UTM zone 33 Projection, representthe five main fault systems that develop in the analysed region. The backbone of the GIS-based system is con-stituted by the large amount of information which was collected from the literature and then stored andproperly geocoded in a digital database. This consists of thirty five alpha-numeric fields which include allfault parameters available from literature such us location, kinematics, landform, slip rate, etc.Although the system has been implemented according to the most common procedures used by GIS develop-er, the architecture and content of the database represent a pilot backbone for digital storing of fault param-eters, providing a powerful tool in modelling hazard related to the active tectonics of Mt. Etna. The databasecollects, organises and shares all scientific currently available information about the active faults of thevolcano. Furthermore, thanks to the strong effort spent on defining the fields of the database, the structureproposed in this paper is open to the collection of further data coming from future improvements in theknowledge of the fault systems. By layering additional user-specific geographic information and managingthe proposed database (topological querying) a great diversity of hazard and vulnerability maps can be pro-duced by the user. This is a proposal of a backbone for a comprehensive geographical database of faultsystems, universally applicable to other sites.
© 2012 Elsevier B.V. All rights reserved.
1. Introduction: the GIS tool in natural hazard
Geographical Information Systems (GIS) are computer-based sys-tems used to store, manipulate and display geographic information.They are designed to “support the capture, management, manipulation,analysis, modelling and display of spatially referenced data for the solu-tion of complex planning and management problems” (Aranoff, 1989).
The manipulation of data ranges from the simple overlay of differ-ent thematic maps for the identification of areas with specificrequired conditions to the more sophisticated use of mathematicaloperators or integrated numerical models for the prediction of the dy-namics of natural phenomena. GIS technology, when applied to landuse planning and natural resource management and protection, is atool that can support scientific research and decision making(Burrough, 1989). The role of GIS in natural hazard assessment washighlighted in several papers concerning the use of GIS tools for thestudy and analysis of geological (Salvi et al., 1999), seismological
ca e Vulcanologia, Osservatorio957165800.nforte).
rights reserved.
(Ganas and Papoulia, 2000), and volcanological data (Kauahikaua etal., 1995; Pareschi et al., 2000; Pareschi, 2002).
The eastern and southern slopes of Mt. Etna volcano, that hostabout thirty municipalities for a total of about half a million inhabi-tants, were frequently invaded in the past by historical lava flowserupted from the NE-Rift and S-Rift, highlighting the exposure ofthese areas to such events (Behncke et al., 2005; Crisci et al., 2010).Moreover, the same portion of the Mt. Etna edifice is affected by afairly continuous and roughly seawards sliding, occasionally acceler-ated during shallow magma intrusions in the central-upper part ofthe volcano (Acocella et al., 2003; Neri et al., 2004, 2009; Walter etal., 2005).
In this paper, we present a pilot study using a GIS developed inArcGis® framework, specifically designed for managing the hazard re-lated to the large-scale flank instability of Mt. Etna. The core of thedeveloped GIS-system consists of spatially referenced arc-features(polylines representing the digital geo-referenced representation offault segments and tectonic lineaments) collected in a digitalmap of ac-tive faults of the eastern and southern flanks of Mt. Etna. Each segmentis linked to a spatial database which includes the main geo-structuraland instrumental fault parameters. Hazard assessment can be obtained

171G. Barreca et al. / Journal of Volcanology and Geothermal Research 251 (2013) 170–186
by the user by layering different geographic information (e.g. activefault with main lifelines), and by topological querying. Furthermore,in order to allow integrated hazard studies on an active volcanic envi-ronment, the kinematic relationships among these features and theeruptive activity are also considered, by indicating the volcanic struc-ture that could activate each segment, in order to help in defining thepossible scenarios of fault reactivations following eruptive events.
Taking into account that most of the fault traces affect man-madestructures (e.g. roads, railway, etc.), the active fault population (and
Fig. 1. A) Schematic structural map of central-eastern Sicily and Calabrian Arc, highlightingmap and kinematics (white arrows) of Mt. Etna with the sliding blocks indicated by the different colours) that constitute the geographic dataset in the proposed GIS-based system.; das
their associated effects) represents one of the most important risk el-ements to be considered in evaluating the hazard of the area. There-fore, the knowledge of all the fault characteristics (e.g. structural,seismological, etc.) must be, for this area, a starting point for hazardevaluation and a GIS system could represent the best way to organiseavailable data in a structured form.
The processed data represents the first digital geographic archiveof the active faults which affect the eastern and southern flanks ofMt. Etna. By using a GIS system, the large amount of information
the main structural features controlling the geodynamics of this region; B) Schematicferent colours (from Bonforte et al., 2011) and with the five active fault sets (with dif-hed boxes indicate the following figures showing, with higher detail, each fault system.

172 G. Barreca et al. / Journal of Volcanology and Geothermal Research 251 (2013) 170–186
can easily be stored, analysed and displayed in a great diversity ofhazard and vulnerability maps, starting from the backbone here pro-vided and implementing it with specific additional information as thesimple example we propose for the Pernicana Fault System (PFS),which is probably the best known tectonic hazardous element onMt. Etna (Azzaro et al., 1998).
2. Mt. Etna and its structural framework
Mt. Etna (Sicily, Italy) is the highest active basaltic volcano in Europe(3329.6 m above sea level in 2007; Neri et al., 2008). It is located at theintersection between the front of the Apennine–Maghrebian Chain andthe NNW–SSE Malta Escarpment fault belt, lying on clayish–sandyPliocene–Pleistocene foredeep deposits (Fig. 1A) (Lentini, 1982;Lanzafame et al., 1997a,b, and the references therein). The MaltaEscarpment (ME) is a regional tectonic lineament that controls the east-ern and southeastern edge of the Sicilian continental shelf, marking theboundary with the oceanic-affinity crust of the Ionian Basin to the east.The ME intersects the coast of Sicily on the eastern side of Mt. Etna, giv-ing rise to several active faults (the Timpe Fault System, TFS; Fig. 1B)with scarps up to 200 m-high (Monaco et al., 1997; Corsaro et al., 2002).
Mt. Etna activity is currently characterised by summit eruptionsfrom four craters, and by fissure eruptions clustered along three riftzones from the summit towards NE, S and W (Fig. 1; Neri et al.,2011a). During flank eruptions, the magmatic dikes laterally propa-gate from the central conduit feeding central–lateral eruptions but,in minor cases, magma may reach the flanks of the volcano bymeans of vertical dikes propagating from below, forming the eccen-tric (or peripheral) eruptions (Neri et al., 2011a, and the referencestherein).
The eastern and southern flanks of Mt. Etna are affected by lateralinstability, recently demonstrated also by GPS and InSAR measure-ments (for a comprehensive review, see Solaro et al., 2010; Bonforteet al., 2011; and the reference therein). To the north, the instability
Fig. 2. Georeferenced map (WGS84 Ellipsoid UTM zone 33 Projection) showing the spatialtraces (red lines) have been codified through an acronym (e.g. PFS1) which corresponds, in talong the fault segments indicate the downthrown side where dip–slip component of motioof motion is present.
is confined by the E–W striking Pernicana Fault System (PFS,Fig. 1B; Acocella and Neri, 2005) and, to the west, by the N–S RagalnaFault System (RFS, Fig. 1B; Neri et al., 2007). The entire sliding sectoris divided into several blocks by minor faults, such as the S. Venerina,Timpe Fault System, Trecastagni and Tremestieri-Mascalucia Faults(SV, TFS, TF and TMF respectively in Fig. 1; Solaro et al., 2010;Bonforte et al., 2011).
The motion of the mobile blocks has been measured and modelledby geodetic techniques since 1993 (Bonforte and Puglisi, 2003; Neriet al., 2009; and the references therein) and the increasing densityof monitoring networks has allowed to detail the ground deformationpattern in the eastern sector of the volcano, identifying several blocksshowing different ground velocities (Neri et al., 2004; Bonforte andPuglisi, 2006). More recently, the analysis of hypocentre distributionand focal mechanisms of the earthquakes occurring beneath the east-ern side of the volcano, compared with geodetic data, provided newinsights on the depth of the detachment of the sliding sector(Alparone et al., 2011). Remote sensing SAR studies imaged grounddisplacements in great detail, drawing the main discontinuitieswhere relative velocities of the different blocks produce sharp varia-tions in the ground motion field (Froger et al., 2001; Solaro et al.,2010; Bonforte et al., 2011). These discontinuities often correspondto known faults but sometimes they show no notable evidence onthe ground, especially if their kinematics is mainly transcurrent. Inany case, such sharp changes in ground velocities are able to produceruptures and creep on the roads, houses and sometimes on theground. Most of these features pass through densely urbanisedareas and must be considered as elements of hazard.
3. The GIS-based system for geo-structural assessment at Mt. Etna
A Geographic Information System (GIS) has been implementedwith the aim of providing a pilot tool to perform analysis of the struc-tural and volcanic hazards and risks related to a potential eruption on
distribution of the PFS and RNF segments on the north-eastern flank of Mt. Etna. Faulthe spatial database, to a univocal key field that identifies the linked fault segment. Ticksn is present; arrows indicate the transcurrent kinematics where strike–slip component

173G. Barreca et al. / Journal of Volcanology and Geothermal Research 251 (2013) 170–186
the eastern flank of Mt. Etna. As abovementioned, this area is affectedby active faulting and several fault reactivation processes are relatedto eruptive dynamics that occur in the upper zone of the volcano,especially along the NE rift system (Neri et al., 2004, 2005; Bonforteet al., 2007a; Siniscalchi et al., 2010, 2012). The slip movement onfault planes increases rapidly at the onset and during eruptive eventsand continues for a long time (several months) after (Acocella andNeri, 2005; Bonaccorso et al., 2006; Palano et al., 2006; Bonforte etal., 2007b).
The first step in constructing the GIS-based system consisted inthe collection of all available data from literature, both field andinstrumental ones, concerning the different fault systems which de-velop in the eastern and southern flanks of Etna. Collected geographicdata were successively assembled in digital form (basic spatialobjects), while the related numerical parameters were stored andproperly geocoded in a digital database.
We started from drawing the first-order lineaments traced by Neriet al. (2009), Solaro et al. (2010) and Bonforte et al. (2011) usingmainly SAR data, since they comprise most of the of structures pro-ducing active deformation. Then, we compared them to the geologicalmap of Mt. Etna (Branca et al., 2011) and to the volcano-tectonic mapof Etna by Azzaro et al. (2012). Finally, we adjusted some SAR (instru-mental) and/or hidden lineaments to fit field data where faults areexposed and have geological evidence or showed ground fracturing.After tracing all segments, we defined the data fields necessary tostore all available information about them (in terms of geometry, ki-nematics and behaviour), collecting all data from the available wideliterature and reporting the appropriate references in two dedicatedfields of the database for each segment (REFER_1 and REFER_2, inorder to have more space available for bibliography).
The final step in constructing the GIS-based system consisted inthe collection of all available data, both field and instrumental ones,concerning the different fault systems which develop in the easternand southern flanks of Etna. Collected geographic data were succes-sively assembled in digital form (basic spatial objects), while the re-lated numerical parameters were stored and properly geocoded in adigital database.
3.1. The geographic dataset
The geographic dataset consists of arc-type (vector) features whichcorrespond to five main fault systems (Fig. 1B) that were groupedaccording to their location, kinematics and stress regime, according toliterature (see Azzaro et al., 2012).
The fault systems include a various number of segments and aretermed: Pernicana Fault System (PFS), Ripe della Naca Faults (RNF),Timpe Fault System (TFS), South Fault System (SFS) and RagalnaFault System (RFS). A description of each of them follows.
3.1.1. The Pernicana Fault System (PFS)The PFS is a transtensive E–W trending complex tectonic structure,
which borders the northern mobile sector of the volcano (Fig. 1B). Thisfault system extends from the NE Rift to the coastline, over a length of~18 km. Along its western portion, the PFS is characterised by asouth-facing morphological scarp (up to 70–80 m-high), while towardsthe East it is characterised by right-stepping left-lateral faults (Fig. 2).Shallow (b2–3 km) seismic activity (2bMlb4.2) accompanies the mainsurface deformation along the western portion of the PFS (Alparone etal., 2013), while aseismic creep characterises the central and eastern por-tions of the fault system (Obrizzo et al., 2001; Acocella and Neri, 2005).
The PFS is kinematically connected, with a feedback mechanism,to the dynamics and eruptions of the entire upper NE flank, and espe-cially of the NE Rift (Tibaldi and Groppelli, 2002; Acocella and Neri,2003; Neri et al., 2004, 2005; Bonforte et al., 2007b,c).
Following Acocella and Neri (2005) and Azzaro et al. (2012), the PFSincludes 12 fault segments thatwere labelledwith progressive numbers
fromW to E in our database (Fig. 2). The PFS1 segment represents thewestern termination of the fault, connecting to the NE Rift with aNE–SW orientation, as modelled by ground deformation data andnamed Provenzana fault by Bonforte et al. (2007c); its motion occursmainly accompanied by seismic energy release. PFS2 represents themain E–W-trending western segment of the fault, defined by a pro-nounced south-facing fault scarp produced by the oblique left-lateral ki-nematics; fault slip occurs in a continuous aseismic way but it is oftenaccompanied by a significant seismicity. PFS3 is a short segmentrepresenting the eastern termination of the upper E–W portion of thefault in the “Rocca Campana” area; as well as for PFS2, InSAR and localGPS networks (Palano et al., 2006; Bonforte et al., 2011) provide detaileddata about its geometry (showing a variable azimuth from N105 toN120) and slip rates (highly variable from a continuous creep of about25 mm/y to a maximum of about 1000 mm/y measured for a short pe-riod during the 2002–2003 eruption). PFS4 starts off from the same areaas the previous segment, but with a WNW–ESE (N120) orientation; itrepresents the western part of the splay fault in which the PFS2-3(N105 trending) branches accommodating most of the deformation(mainly aseismic) of themain fault, as revealed by the local GPS network(Palano et al., 2006). PFS5 to PFS10 represent the en-echelon arrange-ment of the fault segments transferring the ground deformation fromthe Rocca Campana area towards the coastline; PSF 11 represents theeasternmost evidence of ground fracturing along the coastline; thesesegments (PSF5 to 11) were revealed by the exceptional ground defor-mation following the onset of the 2002 eruption, producing huge dis-placements and ground fracturing from the NE Rift to the sea (Neri etal., 2004). Finally, PFS12 represents the short E–W segment of theFiumefreddo fault, consisting in a mainly left-lateral structure revealedby a little south-facing scarp, whose discontinuous activity has beendocumented by episodic fracturing on man-made structures and byGPS measurements (Azzaro et al., 1998; Bonforte et al., 2008).
3.1.2. The Ripe della Naca Faults (RNF)In the Etna area, faults with NE–SW orientation are present at the
Ripa della Naca zone (1300–1400 m above sea level), where twomain faults and minor tectonic lines crop out. The two main faults(Fig. 2) cut the eastern flank of Etna for a length of about 4.5 kmand are characterised by vertical displacement a little over 130 m,with downthrown side to the east. The higher fault plain wasintercepted at 1375 m in elevation by the 1928 eruptive fissure, feed-ing a lava flow that in a few days almost reached the Ionian coast,destroying the village of Mascali.
The Ripe della Naca faults are active today, but their tectonic activ-ity seems much less significant if compared with other faults of Etna,as the lava flows belonging to the last 15 ka are characterised byminor tectonic dislocations.
3.1.3. The Timpe Fault System (TFS)The Timpe Fault System (TFS) is a NNW–SSE trending normal to
right-lateral fault system which develops along the E to SE side ofMt. Etna edifice (Fig. 3). The TFS has generally been regarded as theonshore continuation of the faulting associated with the MaltaEscarpment (Cristofolini et al., 1979; Ghisetti, 1979; Lo Giudice etal., 1982; Neri et al., 2011b; Siniscalchi et al., 2012), even if ground de-formation data (Bonforte and Puglisi, 2006; Puglisi et al., 2008) showthat this fault system is involved in the seaward motion of the flank,suggesting that the fault segments are probably second orderstructures with respect to the sliding dynamics. In the proposedGIS-system the TFS consists of 20 fault segments, as reported byBranca et al. (2011), which affect the Mt. Etna coastal domain fromthe Acireale area to the South to the Giarre–Macchia neighbouringvillages to the North.
Northwards, the TFS fault system includes a series of N–S toNNW–SSE oriented fault segments which are labelled in our databaseas TFS1 to 5. In particular, the TFS1 is a ~1.6 km long fault segment

174 G. Barreca et al. / Journal of Volcanology and Geothermal Research 251 (2013) 170–186

175G. Barreca et al. / Journal of Volcanology and Geothermal Research 251 (2013) 170–186
with right-lateral motion (Stewart et al., 1993), characterised by a no-table escarpment in the lava flows (~100 m) and by the occurrence oflarge triangular facets (Lo Giudice et al., 1982; Bousquet et al., 1988;Stewart et al., 1993). The 1971 Macchia earthquake (Mw=4.2) wasrelated to the reactivation of this fault segment (Riuscetti andDistefano, 1972). TFS2 (the Fondo Macchia fault, representing thenorthernmost part of the Moscarello fault) is a N–S trending~2 km-long segment with 1.4–2.7 mm/y slip-rate, responsible, forexample, for the seismic swarm (Mmax=3.6) that struck this part ofthe volcano in May 2009. TFS3 to TFS5 represent westward-dippingshort antithetic normal faults with respect to the TFS2, thus defininga NNW–SSE graben on the northernmost tip of the entire TFS.
The central portion of the TFS is composed of 5 fault segments(TFS6 to TFS10) trending NNW–SSE, consisting in the main part ofthe Moscarello fault (TFS6) and running through the small village ofSan Leonardello (San Leonardello Fault, TFS8). Fault traces arecharacterised by minor faults–scarps (generally not exceeding 10 min height) and dislocated historical lava flows creating a NNW–SSEtrending graben between the east-dipping TFS 8 (S. Leonardellofault) and the west-dipping TFS9 (Macchia fault). The geologicalactivity along these faults is testified to by deflected streams and bya number of recent shallow-focus earthquakes centred on the faultsystem (Cumin, 1954; Riuscetti and Distefano, 1972; Azzaro et al.,1989) but also instrumental evidence of active ground deformationhas been reported in Bonforte et al. (2011), who grouped this faultsystem as the “PSF2” (Permanent Scatterers Feature) family.
Southwards, in the nearby of Acireale village, the TFS is composed of8 fault segments (labelled as TFS11 to TFS17) which affect lava flowunits ranging in age from 143,000 to 70,000 years (Corsaro et al.,2002, and the references therein). Fault traces are generallycharacterised by marked breaks in slope with east-facing scarps thatreach 200 m in height (Capaldi et al., 1985) along the ~N–S striking S.Giovanni Bosco — la Timpa segment (Acireale fault, TFS12). About3 km northward, this fault changes its direction to a NW–SE strikeand splits into another fault strand, TFS11 (the Linera — S.M. degliAmmalati segment, known as S. Tecla fault), while a splay fault con-tinues NNW-wards (to S. Giovanni Bosco village), connecting to theTFS19 (S. Venerina fault). Although two seismic events over the pastcentury have been attributed to these faults (Azzaro, 1999), somecreep affects the area of S. Tecla village at the northern tip of theTFS13, and also in 2001 some seismicity affected this area before andafter an eccentric eruption on the southern flank, suggesting a stresstransfer from the upper to the lower SE flanks of the volcano (Acocellaet al., 2003; Bonforte et al., 2004; Neri et al., 2004, 2005; Bonforte andPuglisi, 2006; Puglisi et al., 2008; Bonforte et al., 2009; Neri et al., 2009).
The TFS16 and TFS17 segments consist in two normal faults,respectively westward-dipping and eastward-dipping, defining alocal active N–S graben in which the small S. Caterina village lies; inparticular, the TFS16 segment is well visible in the field due to thecontinuous creep producing evident fracturing in the main square ofthe village.
TFS18 and TFS19 represent respectively the northern portion ofthe Fiandaca fault and the S. Venerina fault that, together with theparallel TFS11 (S. Tecla fault) consist in highly seismogenic NW–SEstriking faults, north-eastwards dipping affected mainly by coseismicoblique right-lateral displacements (Acocella et al., 2003; Neri et al.,2005, 2011b; Azzaro et al., 2012). Finally, the northernmost TFS20segment represents the N–S oriented S. Alfio fault, westwards dippingand revealed by a scarp on its southern half, but buried by lava flowson its northern part (Lanzafame et al., 1997a,b).
Fig. 3. Georeferenced map (WGS84 Ellipsoid UTM zone 33 Projection) showing the spatial dhave been codified through an acronym (e.g. TFS1) which corresponds, in the spatial databasegments indicate the downthrown side where dip–slip component of motion is present; apresent.
3.1.4. The South Fault System (SFS)The South Fault System (SFS; Fig. 4) represents the southern bound-
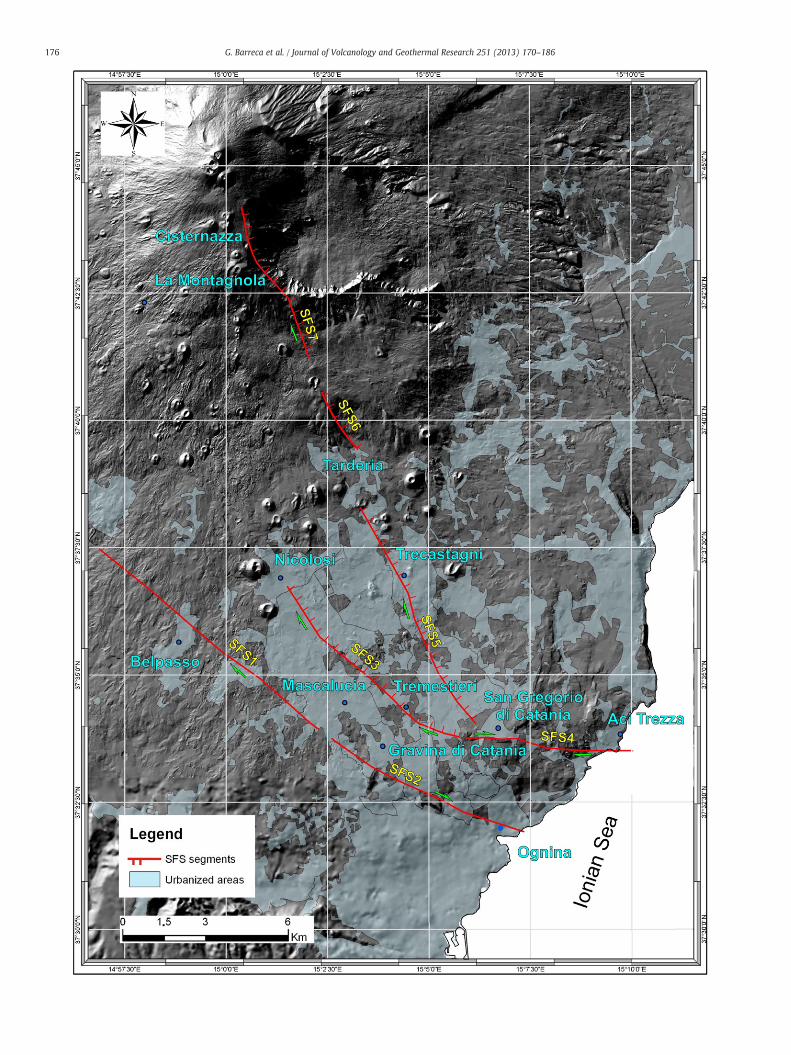
ary of the SE-ward sliding sector of Mt. Etna, as recently defined byseveral authors from geological and geochemical surveys (Borgia etal., 1992; Lo Giudice and Rasà, 1992; Acocella et al., 2003; Neri et al.,2004) and remote sensing data (Neri et al., 2009; Solaro et al., 2010;Bonforte et al., 2011, 2013). This fault system progressively reducesthe sliding motion from the SE to the S flanks of the volcano; it also ac-commodates the ESE-ward motion of the SE flank with respect to theS-ward motion of the southern one (Fig. 1B), as revealed also in theshort term by geodetic and seismic data during the 2001 eccentricintrusion (Gambino, 2004; Bonforte et al., 2009; Falsaperla et al.,2010). Only some short segments of these lineaments are known fromgeological surveys (Branca et al., 2011, and the references therein),while remote sensing data provided a more complete picture of thestructural framework of this densely inhabited side of the volcano,revealing the real extent of the main structures and detecting somenew hidden ones (Neri et al., 2009; Solaro et al., 2010; Bonforte et al.,2011). In addition, geochemical surveys reported in Bonforte et al.(2013) confirmed the existence of ground discontinuities carryingdeep gases, adding also further constraints to the location andgeometry of these features. The SFS is mainly composed of two mainparallel and long arc-shaped lineaments,(named PSF8 and PSF7 inBonforte et al., 2011 and known as the Belpasso-Ognina andMascalucia–Tremestieri faults after Bonforte et al., 2013), trendingNW–SE at their upper parts (SFS1 and SFS3) and gradually rotatingto almost an E–W azimuth at the coastline (SFS2 and SFS4).The SFS1–SFS2 lineament corresponds to the new fault detected bySAR data as PSF8 in Bonforte et al. (2011), and confirmed by in-situgeochemical surveys by Bonforte et al. (2013), who named it asBelpasso-Ognina lineament (BOL); the SFS3–SFS4 lineament,extending from Nicolosi to Acitrezza, represents the whole extentof the Tremestieri–Mascalucia, San Gregorio and Aci Trezza faults,known from geological data and revealed as a unique system bySAR data in Neri et al. (2009), Solaro et al. (2010) and Bonforte etal. (2011), who named it PSF7, and then confirmed by geochemicalsurvey in Bonforte et al. (2013).
In the proposed GIS, each of the two longer and arcuate linea-ments (corresponding to the PSF7 and PSF8 of Bonforte et al., 2011and to BOL and TMF of Bonforte et al., 2013, respectively) has beensplit into two segments, because of the different kinematics of thesestructures at different altitudes. Indeed, remote sensing data showedthat the dip–slip (normal) component of displacement gradually de-creases from upper to lower altitudes at both lineaments, changingtheir kinematics from oblique (normal and right-lateral) to purelytranscurrent (right-lateral).
In particular, SFS1 runs from Belpasso to Mascalucia villages whilethe SFS2 extends from Gravina to Ognina villages and is affected bylower slip rates.
Conversely, some parts of the SFS3 and SFS4 were previouslyknown due to active and significant ground fracturing and seismicity.In particular, SFS3 corresponds to the upper part of the PSF7 featuretracked by Bonforte et al. (2011), named Tremestieri Fault (TMF) bySolaro et al. (2010) and Bonforte et al. (2013), connecting theknown fault segments of Nicolosi and Mascalucia–Tremestieri; theSFS4 follows the lower track of the same TMF connecting the otherknown segment of S. Gregorio di Catania towards a wide fracturedarea affecting the southern part of the Acitrezza village.
Northwards, another feature (SFS5), represents the entire PSF6 ofBonforte et al. (2011), whose southern part was already known as the
istribution of the TFS segments on the eastern flank of Mt. Etna. Fault traces (red lines)se, to a univocal key field that identifies the linked fault segment. Ticks along the faultrrows indicate the transcurrent kinematics where strike–slip component of motion is
176 G. Barreca et al. / Journal of Volcanology and Geothermal Research 251 (2013) 170–186

177G. Barreca et al. / Journal of Volcanology and Geothermal Research 251 (2013) 170–186
Trecastagni fault (TF); it is affected by a continuous creep movement,sometimes producing a very shallow seismicity (Acocella et al., 2003;Neri et al., 2005); its motion is mainly characterised by a normal kine-matics accompanied by a minor right lateral motion, as confirmed byseveral in-situ and remote-sensing measurements (Rust et al., 2005;Neri et al., 2009; Solaro et al., 2010; Bonforte et al., 2011; Gambinoet al., 2011; Bonforte et al., 2013). Just a couple of km northwards,there is the short Tarderia fault (SFS6), with the same NNW–SSE azi-muth and extending towards another segment, SFS7, that has beentraced following the ground fracturing experienced in 1989, wherea similar structure was also detected by Gambino (2004) andBonforte et al. (2004) during the 2001 eruption and, more recently,by Falsaperla et al. (2010). This lineament does not show continuoustectonic activity but it seems to be occasionally activated by dykeintrusions occurring on the upper part of the S Rift. It was affectedin the past by dyke intrusion, as testified to by several craters, and itis known by the important ground fracturing occurring during the1989 eruption; more recently, the upper part of this fracture systemwas intruded by magma feeding the 1991–1993 eruption and showedactive kinematics just before and during the 2001 eruption (Bonforteet al., 2004; Gambino, 2004; Bonforte et al., 2009). The Trecastagniand Tarderia faults, together with the 1989 fracture form an almostcontinuous NNW–SSE lineament, suggesting a continuing and longerdislocation zone from the Trecastagni fault towards the summit of thevolcano.
3.1.5. The Ragalna Fault System (RFS)The Ragalna Fault System (RFS) is the final south-western bound-
ary of the flank affected by flank instability at Etna (Neri et al., 2007,2009). Indeed, while on the northern side the only PFS decouplesthe sliding sector from the stable flanks, on the southern side the slid-ing motion is progressively reduced from north to south by all faultsof SFS and the RFS definitively closes the southward motion of thesouthern flank, decoupling it from the western side of the volcano.This fault system is made up of a complex arrangement of four faultsegments with different orientation and kinematics (Fig. 5). Threedistinct fault segments are clearly visible near Ragalna village, oneN–S striking and two shorter segments striking SW–NE with oppos-ing senses of downthrow, isolating a triangular horst among them,named “Biancavilla wedge” by Bonforte et al. (2011). As for the SFS,remote sensing data revealed its real extent and provided geometricconstraints of the Ragalna Fault System, beyond the field evidences.
The GIS here proposed, makes use of the information provided bygeodetic, geological and geochemical investigations on the RFS (Neriet al., 2007; Solaro et al., 2010; Bonforte et al., 2011), dividing thefault system into four different fault segments (Fig. 5). The RFS1 rep-resents the fault located at highest altitude, NE–SW trending andextending towards the summit part of the volcano, mainly revealedby DInSAR data (labelled as “NE” by Neri et al., 2007; PSF 9b inBonforte et al., 2011); it is the main segment of this fault system,whose activity seems to be related to the eruptive activity such asin response to dyke intrusions on the upper part of the volcano.
Downslope, the RFS2 represents the continuation of the RFS1 atlower altitudes (labelled PSF9a in Bonforte et al., 2011 and knownas the Calcerana fault), while the RFS3 represents the main and bestknown segment (as Mass. Cavaliere fault) of this fault system(labelled as “C” in Neri et al., 2007; PSF9 in Bonforte et al., 2011).RFS3 shows an N–S azimuth and produces fresh east-facing faultscarps up to 20 m high, ground fracturing and slight damages to
Fig. 4. Georeferenced map (WGS84 Ellipsoid UTM zone 33 Projection) showing the spatial dihave been codified through an acronym (e.g. SFS1) which corresponds, in the spatial databasegments indicate the downthrown side where dip–slip component of motion is present; apresent.
man-made features, due to continuous aseismic creep; its slip rate(of about 3–4 mm/yr) has been defined from both geodetic and re-mote sensing investigations (Neri et al., 2007; Solaro et al., 2010;Bonforte et al., 2011). Both RFS2 and RFS3 show oblique opposingkinematics, downthrowing the external part of the “Biancavilla stablewedge” (Bonforte et al., 2011). The RFS4 is the lowermost segment ofthe RFS, labelled as “S” and “SW” segments by Neri et al. (2007). It ex-tends towards the SW periphery of the volcano and represents thesouthern boundary of the Biancavilla wedge, showing a mainlynormal kinematics, downthrowing its south-eastern site at a rate of2–3 mm/yr as resulting from the cross-sections of PS data in Bonforteet al. (2011).
3.1.6. Other information (lifelines)In order to show a simple example of application of the GIS for
hazard evaluation by adding various user-specific layers, the geo-graphic dataset was implemented with other vector layers consistingof major lifelines lying around the Pernicana Fault System, on thenorth-eastern flank of the volcano. These are represented by roads,railroads, cableways and supply lines (electric lines, water systems,gas pipelines) that can be used to evaluate induced risk too (Fig. 6).
These layers have not been produced in this work and are provid-ed only as an example of the potential of such a GIS of activevolcano-tectonic structures in highly urbanised areas; each user ofthis GIS can intersect the fault layers with any other specific layer toevaluate the hazard related to the fault systems. The digital captureof these sample data from maps was carried out by raster scanningand successively by manual digitising in ArcGis® environment. Thevector data was georeferenced into WGS84 Ellipsoid UTM zone 33Projection.
3.2. The alphanumeric dataset
The spatial database represents the core of the GIS system and ismade up of several thematic data sets defined according to the typeof information. The core of the work was the designing of the struc-ture of the database, providing all the necessary fields for the mostcorrect and complete definition of each fault. We considered all pos-sible elements characterising the faults, from their geographical andgeometrical information to their kinematic parameters. In addition,we added further elements, useful for a volcano-tectonic context,providing some more fields indicating the relations of the faultswith the eruptive activity. Then we compiled the database with all in-formation available from literature, citing in the last two fields(REFER_1 and REFER_2) all publications reporting the informationused to fill in the database of each fault segment; the database, as pro-vided in this work, represents the backbone, designed to hold all theinformation that will be made available in the future. The chosenstructure (Fig. 7) was conceived keeping in mind that all fault charac-teristics that contribute to hazard assessment can be grouped into thefollowing four main typologies that we describe in the following par-agraphs, reporting also the relevant sub-frame of the database (inform of a table) for each one, referring to the PSF2 structure as an ex-ample because it is the most complete fault segment.
3.2.1. Geographic location and source typeIn this set of attribute fields (Table 1), seven descriptive fields are in-
cluded; the first three are automatically generated and assigned to eachelement and concern (1) the unique ID for the database (FID); (2) the
stribution of the SFS segments on the southern flank of Mt. Etna. Fault traces (red lines)se, to a univocal key field that identifies the linked fault segment. Ticks along the faultrrows indicate the transcurrent kinematics where strike–slip component of motion is

178 G. Barreca et al. / Journal of Volcanology and Geothermal Research 251 (2013) 170–186

Fig. 6. Example of thematic map (layout) showing the PFS (red traces) with some lifelines overlaid. A digital photo archive is also hyperlinked to fault segments.
179G. Barreca et al. / Journal of Volcanology and Geothermal Research 251 (2013) 170–186
kind of graphical element (SHAPE); and (3) the length (LENGTH) of thefault segment as automatically calculated by the GIS; the followingfields are 4) the acronym (ACRONYM) used to identify the fault seg-ment given by the acronym of the fault system followed by a progres-sive number; 5) the location (LOCATION), generally indicated with atoponym;6) the elevation of tip points (TIP_ALTIT) indicating the eleva-tion a.s.l. of the two tips of each fault segment; and 7) the type of thesource (SOURCE_TYP) indicating if the segment has been detectedfrom field surveys (“geological”), or if it has been inferred from geo-physical data (“instrumental”), some segments (especially on the SFS)being only partially exposed and then classified with both categories.We chose to include the “SOURCE_TYP” field because it was necessaryto discriminate between those fault segments that were wellrecognisable and known from classic geological surveys and those,such as most of the SFS that were recently detected from geophysical(mainly remote sensing) data but having no ground evidence. Wepreferred to build a database able to include all the useful elementsfor hazard evaluation, comprising also those structures never (or notyet) detected in the field but showing an active kinematics representinga potential hazard; this field, in any case, gives the user informationabout the origin of the fault detection. All these characteristics includedin this set represent the basic information during emergencies bywhichthe user (e.g. civil protection department) can make appropriate evalu-ations and take actions. Strategy actions primarily depend on the geo-graphic location and elevation of the fault segment. Toponyms (andnot geographic coordinates) are used as a rapid way to identify regionsthat are or could be affected by ground deformations. Finally, faultlengths could provide suitable information for an empirical estimation
Fig. 5. Georeferenced map (WGS84 Ellipsoid UTM zone 33 Projection) showing the spatial di(red lines) have been codified through an acronym (e.g. RFS1) which corresponds, in the spathe fault segments indicate the downthrown side where dip–slip component of motion is prtion is present.
of the seismic potential of the source (e.g. Wells and Coppersmith,1994).
3.2.2. Geometrical and structural parametersThis set of attribute fields is the most crucial part of the database,
since we made much effort in order to design it as be able to hold allcurrent and future information about the geometric and kinematicparameters that are useful in characterising the sources and exploit-able to evaluate the related hazard. This set describes not only thesource position and geometry but also the type of displacement,how it occurs and its rate. In this set of attribute fields we designedseven fields (Table 2); the first one (1) indicates that if the fault seg-ment is recognisable in the field by permanent morphology or if it ishidden (LANDFORM); the following four are numerical fieldsconcerning the orientation of the fault plane, in terms of (2) itsmean strike (STRIKE) calculated as the average azimuth orientationof each segment and measured clockwise from North, (3) the direc-tion of the immersion of the fault plane (DIP_DIR) again measuredclockwise from North and (4) the immersion angle (DIP_ANGLE)measured from the horizontal plane (0 = horizontal, 90 = vertical);the subsequent field report, if known and (5) the width of the faultplane (WIDTH_M) measured in m from the surface to the bottom ofthe fault and usually inferred from analytical models; the last twofields indicate (6) the overall classification of the fault on the basisof its average kinematics (FAULT_TYPE) and 7) the pitch angle(PITCH) indicating the average motion of the hanging wall measuredcounter-clockwise on the fault plane from the horizontal followingthe Aki and Richards (1980) convention (e.g. 0 = left-lateral, 90 =
stribution of the RFS fault segments on the south-western flank of Mt. Etna. Fault tracestial database, to a univocal key field that identifies the linked fault segment. Ticks alongesent; arrows indicate the transcurrent kinematics where strike–slip component of mo-

180 G. Barreca et al. / Journal of Volcanology and Geothermal Research 251 (2013) 170–186

Table 2Geometrical and structural parameters.
Field Description Type
LANDFORM Field morphology String(exposed/buried/hidden)
STRIKE Average azimuth of thesegment (clockwise from N)
Numeric
DIP_DIR Direction of immersion(clockwise from N)
Numeric
DIP_ANGLE Angle of immersion(from horizontal)
Numeric
WIDTH_M Height of the fault plane(usually from modelling)
Numeric
FAULT_TYPE Kinematics of the segment String (strike–slip/dip–slip/transtensive/transpressive)
PITCH Motion of the hanging wall on the faultplane (counter-clockwise fromhorizontal)
Numeric
Table 1Geographic location and source type.
Field Description Type
FID Unique ID AutomaticSHAPE Geometric element type AutomaticLENGTH Length of the segment AutomaticACRONYM Unique 4-digit acronym
identifying the segmentString
LOCATION Toponym StringTIP_ALTID Altitude (a.s.l.) of the two
tips of the segmentString
SOURCE_TYP Indicates if the segment hasbeen detected from geologicalor geophysical surveys
String(geological/instrumental)
181G. Barreca et al. / Journal of Volcanology and Geothermal Research 251 (2013) 170–186
reverse;−90= normal; 180= right-lateral); this last value has beenmeasured on the slickenslides on the outcropping fault surface for theTFS (Lanzafame et al., 1996) or has been inferred measuring directlythe displacement of the blocks during deformation events for thePFS. All available data collected from the literature on fault geometryof deformation have been stored in this set of attribute fields with theaim of providing suitable information on the ground displacement as-sociated to fault segments. In particular, knowing fault plane move-ments during an earthquake is essential in emergency planning toidentify possible steps along road infrastructures, especially onthose intersected by normal faults. Furthermore, this set of informa-tion may also be useful to scientists wishing to study these faultssince it provides pertinent elements indicating what kind ofkinematics and field evidence they might expect to find during theirsurveys.
3.2.3. Volcano-tectonic related deformationIn this set of attribute fields we included eight descriptive fields
(Table 3) concerning the rupture styles and the documented relation-ship between fault rupture and seismo-volcanic activity. Each field isstructured mostly in a simple “yes/no” format and provides useful in-formation about a) interference of volcanic activity with displace-ment along fault segments and b) when and in what way thedisplacement occurs (e.g. creep).
There are faults that are possibly involved in eruptive processes,both actively (when they promote the upraise and propagation ofdikes), and passively (when the faults are intersected by the dikes,allowing the magma to rise along the fault planes) or, more frequently,they can accommodate the deformation induced by dyke intrusions.Some of these faults depart from the summit area of the volcano, serv-ing as preferred pathways for the emplacement of radial dikes feedingeruptions. Other faults can be intersected by the propagation of dikesdue to their position and orientation, hosting the passive emplacementof magma (i.e., the 1928 eruption; Neri et al., 2011a and the referencestherein). This is especially true for those faults which bound the unsta-ble blocks of the volcano (Solaro et al., 2010; Bonforte et al., 2011); theyoften represent the continuation of the main rift zones and might facil-itate the upraise and eruption of magma thorough “passive eruptions”(i.e., not determined simply by magmatic overpressure but mainly byexternal factors, such as the 2004–2005 eruption; Bonaccorso et al.,2006; Neri and Acocella, 2006). Alsowhen not involved in active or pas-sive magma intrusion, the faults accommodate the stress induced bydyke intrusions occurring at the higher part of the volcano on themain rift zones (Acocella et al., 2003; Walter et al., 2005; Palano et al.,2006; Bonforte et al., 2007a, 2008; Puglisi et al., 2008). The relationship
Fig. 7. Flow diagram showing the architecture of the database. The available data, collected frinformation regarding geographic location and fault type, geometrical and structural paramdatabase and layering with other spatial information, the user can extract specific data or t
between the fault and the eruptive and/or flank dynamics of the volca-no is classified by the six fields designed for this group taking into ac-count (1) if the deformation is mainly related (DEF_REL) to thevolcano dynamics (“volcano tectonic”) or rather to the regionalgeodynamics (“tectonic”); (2) if the displacement of the fault is relatedto the eruptive activity (ERUP_REL); and, if yes, (3) to what eruptivestructure (REL_STRUCTURE); (4) if the displacement of the fault(DISP_OCC) occurs continuously or episodically; (5) if the slip occursalso by creep (CREEP); (6) if the fault can be considered seismogenetic(SEISMOGEN) or not; and finally (7) the maximum EMS Intensity I0(I0_MAX) and (8) the maximum magnitude Ml (Ml_MAX) registeredfor that segment.
3.2.4. Fault slip parametersIn this set (Table 4) we included ten numeric plus one alphanumer-
ic descriptive fields concerning slip movement on fault planes availablefrom literature (reported in the two fields REFER_1 and REFER_2 previ-ously described) and obtained by field and instrumental data (e.g. GPS,SAR, etc.). The first four fields of this set are provided for the averagegeological slip rates (in mm/yr) for vertical (dip–slip) and horizontal(strike–slip) components, with minimum and maximum values(ZRATE_MIN, ZRATE_MAX and HRATE_MIN, HRATE_MAX respectively)in order to take into account the uncertainties related to theselong-term estimations or the different values often resulting for differ-ent periods; then, the subsequent fields describe (5) the average kine-matics of the fault segments (MOTION) based on geological and/orcurrent displacements, the (6) horizontal and (7) vertical slip rates (inmm/yr) measured by geodetic techniques (HGPS_MM_Y andZGPS_MM_Y respectively), mainly on GPS stations but also by othermethods (e.g. by levelling for the vertical rate of PSF2and SFS6;Obrizzo et al., 2001; Bonforte et al., 2013), the (8) horizontal and (9)vertical slip rates (in mm/yr) measured by SAR measurements(HSAR_MM_Y and ZSAR_MM_Y respectively) and, finally, the (10)hor-izontal and (11) vertical slip rates (in mm/yr) measured by extensom-eters and/or other in-situ direct measurements (HEXT_MM_Y andZEXT_MM_Y respectively).
Due to the continuous improvements in the knowledge and defi-nition of the structural framework of the volcano and the consequentavailability of new and more detailed information, the system wasdesigned and built in order to be ready to hold any new data withoutchanging the physical or logical structure of the database. Once the
om literature, have been organised into four major typologies, which include a series ofeters, volcano/tectonic related deformation and fault slip parameters. By querying onhematic maps useful for user-specific purposes.

Table 3Volcano-tectonic related deformation.
Name Description Type
DEF_REL Relationship to volcanicor regional dynamics
String(volcano-tectonic/tectonic)
ERUP_REL Relationship to eruptive activity Yes/noREL_STRUCTURE Volcanic structure
usually triggering the segmentString (NE Rift/S Rift)
DISP_OCC Occurrence of displacement StringCREEP Occurrence by aseismic creep Yes/noSEISMOGEN Occurrence of seismic activity Yes/noI0_MAX Maximum intensity recorded NumericMl_MAX Maximum magnitude recorded Numeric
Table 4Fault slip parameters.
Name Description Type
ZRATE_MIN Minimum vertical slip-rate fromgeological data
Numeric
ZRATE_MAX Maximum vertical slip-rate fromgeological data
Numeric
HRATE_MIN Minimum horizontal slip-rate fromgeological data
Numeric
HRATE_MAX Maximum horizontal slip-rate fromgeological data
Numeric
MOTION Average motion on the fault plane Normal/right-lateral/left-lateral/inverse)
HGPS_MM_Y Horizontal slip-rate from geodetic data NumericZGPS_MM_Y Vertical slip-rate from geodetic data NumericHSAR_MM_Y Horizontal slip-rate from remote
sensing dataNumeric
ZSAR_MM_Y Vertical slip-rate from remote sensing data NumericHEXT_MM_Y Horizontal slip-rate from in-situ data Numeric
182 G. Barreca et al. / Journal of Volcanology and Geothermal Research 251 (2013) 170–186
attribute tables for each fault system were compiled, they were com-bined with the georeferenced segments by univocal key fields, build-ing up the geodatabase of this GIS project.
ZEXT_MM_Y Vertical slip-rate from in-situ data Numeric
4. Discussion
The structure of a GIS database for active fault population is pro-posed to store, map and query all structural elements and associatedgeometric and kinematic information, useful to develop models formapping hazard on Mt. Etna volcano. Spatial modelling and data inte-gration of multi-layered information allows us to target potentialhazard zones and represent these in a digital form.
Fig. 8. Screenshot of ArcGis® view, showing simple querying, poi
First of all, the architecture of the GIS-based system allows fastaccess to geo-structural information through point-and-click identifi-cation of the spatially-oriented arc-features (Fig. 8).
Particular attention was paid to design the database in order tomake it ready to store every kind of available and future informationabout each fault segment. Mt. Etna is one of the most studied volca-noes in the world and the high level of knowledge makes it a goodsite for designing a database that can store all the information.
nt-and-click, on a fault segment (example on PFS2 segment).

183G. Barreca et al. / Journal of Volcanology and Geothermal Research 251 (2013) 170–186
Besides the usual geometric data about each fault segment, some ofwhich is not always so trivial, such as the width, the dip angle andthe pitch, we wished to store also the information about the kinemat-ics. This information can come from a number of techniques, geolog-ical and/or geodetic; so we provided several fields, in order to storethe available data coming from each technique in the appropriateone. Specific fields indicate that (when known) if the fault segmentcan be activated by volcanic activity and the volcanic structure thatusually activates it; this information allows, for example, queryingthe database highlighting all faults associated to a specific volcanicstructure as soon as an eruption starts, giving an immediate predic-tion of which faults could be activated. Then, other fields indicatethat if the faults are usually affected by creep or if they areseismogenetic, a fundamental information for defining different pos-sible hazard scenarios to be taken into account in case of faultactivation.
These represent basic information in decision making for emer-gency planning, risk prevention and mitigation. As an example, inFig. 9 we propose some analytical procedures based on topologicaloverlay (buffering) to identify areas that are most susceptible to therisk induced by secondary effects; considering that amplitude ofcoseismic shaking and its associated ground faulting are primarily afunction of the distance from a seismogenetic fault (attenuationlaw; Reiter, 1990), the identification of areas that are within a givendistance from a fault must represent one of the main steps in hazardevaluation. Thus, the execution of a buffer around an active faultsystem quickly permits to identify, in terms of spatial location, highrisk regions. Moreover, the users, by adding their own layers, can
Fig. 9. Thematic map showing an example of topological overlay (buffering) around somearea (250 mt, highlighted by the GIS) can be considered at higher risk.
intersect them with the fault database identifying and highlightingthe spatial objects (e.g. civil inhabitations, industrial sites, life-lines,etc.) lying within these regions and that can be considered (takinginto account their vulnerability degree) more susceptible to damagethan those located far from active faults.
A further simple hazard estimation can be obtained by layeringthe fault database with a Digital Elevation Model (surface modelling)using ArcGis® 3D analyst tool. In Fig. 10, starting from a simple10×10 grid resolution DEM (Tarquini et al., 2007), we derived aslope map of eastern flank of Mt. Etna and particularly for the PFSregion. The map was processed by using raster calculator function(spatial analyst tool) which permits extracting areas with slopeangle higher than 35°; then, a further operation consists in highlight-ing those areas that lie within a buffer (Fig. 10A) around an activefault producing a map of areas prone to rockfall and landslide. Evenif we applied in the example some empirical and arbitrary parameters(e.g. angle value and distance from active fault), some of thehighlighted areas around the PFS (Fig. 10B) appear in good agreementwith the observed slope instability occurring during earthquakes(see, for example, Rust et al., 2005; see Fig. 10C and D).
5. Conclusion and future development
We implemented an integrated geodatabase of Mt. Etna faults,containing all currently available geological and instrumental informa-tion. As afirst step, it is currently the first digital database and geographicdataset implemented for the structural hazard assessment on the flanksof the volcano. It is a starting point for seismo-volcanic risk mitigation,
fault segments of the PFS. The buildings (in light blue) entirely contained in the buffer

Fig. 10. A) Map of rockfall and landslide susceptibility obtained by surface modelling of 10×10 m grid resolution DEM. Yellow polygons indicate areas with slope angle higher than35° lying in a neighbourhood (within of 1 km) of active faults; B) zoom of rockfall and landslide susceptibility map in Presa/Vena area. The area highlighted by GIS analysis matcheswith the important landslide occurred in 1996, showed in C) and with the slope instability triggered during the 2002–2003 eruption showed in D) from Rust et al., 2005.
184 G. Barreca et al. / Journal of Volcanology and Geothermal Research 251 (2013) 170–186
territorial planning and a support to decision makers (i.e., National andLocal Civil Defence) during volcano-tectonic emergencies.
A major effort has been made in order to define any field that couldbe useful to characterise each active fault, with special attention tothose characteristics representing potential hazard elements andthose useful to depict hazard scenarios. The database contains geo-graphic information and geometric parameters in order to locate the el-ements on the ground, kinematic parameters in order to characterise
and quantify the activity of each element and volcano-tectonic relatedinformation in order to characterise the behaviour of each fault, alsoas a consequence of volcanic activity. This last aspect makes it possibleto prepare forecast scenarios, indicating the volcanic areas that couldactivate each tectonic element of the GIS. This means that, when aneruption starts on one of the volcano rifts, it is possible to highlightimmediately the tectonic elements that could be activated in the nearfuture. This kind of information is fundamental to prepare civil

185G. Barreca et al. / Journal of Volcanology and Geothermal Research 251 (2013) 170–186
protection actions, also looking at the characteristic behaviour of thefaults in order to be prepared to face a seismic crisis and/or creepingalong the structures.
The database is designed to store all geometric and kinematicparameters of all elements and to be continuously updated as new use-ful information about fault extensions and kinematics becomes avail-able; when new parameters are available from literature, the user hasonly to fill in a field that is already provided. A more complete hazardevaluation of Etna region can be obtained by implementing theGIS-based system with all user's thematic datasets that contribute tohazard definition such as social/public and economic activities.
GIS provides an unrivalled datasetwithwhich tomake informed de-cisions with regard to development, preparation and emergency plan-ning. The main effort of this work was focused in building a backbonefor a comprehensive geographical database of fault systems, identifyingand defining all the useful fields for fault characterization and hazardmanagement, universally applicable to other sites. The shapefiles ofthe implemented geodatabase are provided as supplementary electron-ic material and can constitute a unique and common starting platformfor future hazard and scientific investigations on the eastern flank ofMt. Etna. The GISwill also be published online through a specific sectionof the website of the Istituto Nazionale di Geofisica e Vulcanologia —
Osservatorio Etneo (www.ct.ingv.it), where all new information willbe integrated in order to keep the database constantly up-to-date.
Acknowledgements
Weare grateful to G. Puglisi andV. Acocella for soliciting the submis-sion of this manuscript. We also thank the three anonymous reviewersfor their very punctual and constructive comments. We wish to thankalso S. Conway for the fundamental improvement in the English lan-guage. This work was funded by the DPC-INGV project “Flank”.
Appendix A. Supplementary data
Supplementary data associated with this article can be found inthe online version, at http://dx.doi.org/10.1016/j.jvolgeores.2012.08.013. These data include Google maps of the most important areas de-scribed in this article.
References
Acocella, V., Neri, M., 2003. What makes flank eruptions? The 2001 Etna eruption andthe possible triggering mechanisms. Bulletin of Volcanology 65, 517–529. http://dx.doi.org/10.1007/s00445-003-0280-3.
Acocella, V., Neri, M., 2005. Structural features of an active strike–slip fault on the slid-ing flank of Mt. Etna (Italy). Journal of Structural Geology 27/2, 343–355. http://dx.doi.org/10.1016/j.jsg.2004.07.006.
Acocella, V., Behncke, B., Neri, M., D'Amico, S., 2003. Link between major flank slip anderuptions at Mt. Etna (Italy). Geophysical Research Letters 30, 2286. http://dx.doi.org/10.1029/2003GL018642.
Aki, K., Richards, P., 1980. Quantitative Seismology, Theory andMethods. Freeman . Vol. I, 557pp.
Alparone, S., Barberi, G., Bonforte, A., Maiolino, V., Ursino, A., 2011. Evidence of multiplestrain fields beneath the eastern flank of Mt. Etna volcano (Sicily, Italy) deducedfrom seismic and geodetic data during 2003–2004. Bulletin of Volcanology 73,869–885. http://dx.doi.org/10.1007/s00445-011-0456-1.
Alparone, S., Cocina, O., Gambino, S., Mostaccio, A., Spampinato, S., Tuvè, T., Ursino, A.,2013. Seismological features of the Pernicana–Provenzana Fault System and implica-tions for the dynamics of northeastern flank of the volcano. Journal of Volcanologyand Geothermal Research 251, 17–27 (this issue).
Aranoff, S., 1989. Geographic Information Systems: A Management Perspective. WDLPublications, Ottawa, p. 230.
Azzaro, R., 1999. Earthquake surface faulting at Mount Etna volcano (Sicily) and impli-cations for active tectonics. Journal of Geodynamics 28, 193–213.
Azzaro, R., Carveni, P., Lo Giudice, E., Rasa', R., 1989. Il Terremoto di Codavolpe (bassoversante orientale etneo) del 29 Gennaio 1989: campo macrosismico e fratturazionecosismica. Bollettino del Gruppo Nazionale per la Vulcanologia, CNR 1, 1–12.
Azzaro, R., Ferrelli, L., Michetti, A.M., Serva, L., Vittori, E., 1998. Environmental hazard ofcapable faults: the case of the Pernicana Fault (Mt. Etna, Sicily). Natural Hazards17, 147–162.
Azzaro, R., Branca, S., Gwinner, K., Coltelli, M., 2012. The volcano-tectonic map of Etnavolcano, 1:100.000 scale: an integrated approach based on a morphotectonic
analysis from high-resolution DEM constrained by geologic, active faulting andseismotectonic data. Italian Journal of Geosciences, 131, 153–170, http://dx.doi.org/10.3301/IJG.2011.29.
Behncke, B., Neri, M., Nagay, A., 2005. Lava flow hazard at Mt. Etna (Italy): new datafrom a GIS-based study. In: Manga, M., Ventura, G. (Eds.), Kinematics and Dynam-ics of Lava Flows. Geological Society of America, Special Paper 396, 187–205.http://dx.doi.org/10.1130/0-8137-2396-5.189.
Bonaccorso, A., Bonforte, A., Guglielmino, F., Palano, M., Puglisi, G., 2006. Compositeground deformation pattern forerunning the 2004–2005 Mount Etna eruption. Jour-nal of Geophysical Research 111, B12207. http://dx.doi.org/10.1029/2005jb004206.
Bonforte, A., Puglisi, G., 2003. Magma uprising and flank dynamics on Mount Etna vol-cano studied using GPS data (1994–1995). Journal of Geophysical Research 108(B3), 2153. http://dx.doi.org/10.1029/2002JB001845.
Bonforte, A., Puglisi, G., 2006. Dynamics of the eastern flank of Mt. Etna volcano (Italy)investigated by a dense GPS network. Journal of Volcanology and Geothermal Re-search 153, 357–369. http://dx.doi.org/10.1016/j.jvolgeores.2005.12.005.
Bonforte, A., Guglielmino, F., Palano, M., Puglisi, G., 2004. A syn-eruptive ground defor-mation episode measured by GPS, during the 2001 eruption on the upper southernflank of Mt Etna. Bulletin of Volcanology 66, 336–341. http://dx.doi.org/10.1007/s00445-003-0314-x.
Bonforte, A., Carbone, D., Greco, F., Palano, M., 2007a. Intrusive mechanism of the 2002 NE-rift eruption atMt Etna (Italy)modelled using GPS and gravity data. Geophysical JournalInternational 169, 339–347. http://dx.doi.org/10.1111/j.1365-246X.2006.03249.x.
Bonforte, A., Branca, S., Palano, M., 2007b. Geometric and kinematic variations alongthe active Pernicana fault: implication for the dynamics of Mount Etna NE flank(Italy). Journal of Volcanology and Geothermal Research 160, 210–222. http://dx.doi.org/10.1016/j.jvolgeores.2006.08.009.
Bonforte, A., Gambino, S., Guglielmino, F., Obrizzo, F., Palano, M.-., Puglisi, G., 2007c.Ground deformation modeling of flank dynamics prior to the 2002 eruption ofMt. Etna. Bulletin of Volcanology 69, 757–768. http://dx.doi.org/10.1007/s00445-006-0106-1.
Bonforte, A., Bonaccorso, A., Guglielmino, F., Palano, M., Puglisi, G., 2008. Feeding sys-tem and magma storage beneath Mt. Etna as revealed by recent inflation/deflationcycles. Journal of Geophysical Research 113, B05406. http://dx.doi.org/10.1029/2007jb005334.
Bonforte, A., Gambino, S., Neri, M., 2009. Intrusion of eccentric dikes: the case of the2001 eruption and its role in the dynamics of Mount Etna volcano. Tectonophysics471, 78–86. http://dx.doi.org/10.1016/j.tecto.2008.09.028.
Bonforte, A., Guglielmino, F., Coltelli, M., Ferretti, A., Puglisi, G., 2011. Structural assess-ment of Mt. Etna volcano from Permanent Scatterers analysis. Geochemistry, Geo-physics, Geosystems 12, Q02002. http://dx.doi.org/10.1029/2010GC003213.
Bonforte, A., Carnazzo, A., Gambino, S., Guglielmino, F., Obrizzo, F., Puglisi, G., 2013. TheTrecastagni Fault (Mt. Etna, Italy): a multidisciplinary study by continuous, dis-crete and satellite ground deformation measurements. Journal of Volcanologyand Geothermal Research 251, 42–50 (this issue).
Bonforte, A., Federico, C., Giammanco, S., Guglielmino, F., Liuzzo, M., Neri, M., 2013. Soilgases and SAR data reveal hidden faults on the sliding flank of Mt. Etna (Italy).Journal of Volcanology and Geothermal Research 251, 28–41 (this issue).
Borgia, A., Ferrari, L., Pasquarè, G., 1992. Importance of gravitational spreading in thetectonic and volcanic evolution of Mount Etna. Nature 357, 231–235.
Bousquet, J.C., Lanzafame, G., Paquin, C., 1988. Tectonic stresses and volcanism: in-situstress measurements and neotectonic investigations in the Etna area (Italy).Tectonophysics 149, 219–231.
Branca, S., Coltelli, M., Groppelli, G., Lentini, F., 2011. Geological map of Etna volcano,1:50,000 scale. Italian Journal of Geosciences 130 (3), 265–291, http://dx.doi.org/10.3301/IJG.2011.15.
Burrough, P.A., 1989. Principles of Geographical Information Systems for Land Re-sources Assessment. Clarendon Press, Oxford, p. 194.
Capaldi, G., Civetta, L., Gillot, P.Y., 1985. Geochronology of Plio-Pleistocene rocks fromsouthern Italy. Rendiconti della Società Italiana diMineralogia e Petrologia 40, 25–44.
Corsaro, R.A., Neri, M., Pompilio, M., 2002. Paleo-environmental and volcano-tectonic evolu-tion of the south-eastern flank of Mt. Etna during the last 225 ka inferred from volcanicsuccession of the “Timpe”, Acireale, Sicily. Journal of Volcanology and Geothermal Re-search 113, 289–306. http://dx.doi.org/10.1016/S0377-0273(01)00262-1.
Crisci, G.M., Avolio, M.V., Behncke, B., D'Ambrosio, D., Di Gregorio, S., Lupiano, V., Neri, M.,Rongo, R., Spataro, W., 2010. Predicting the impact of lava flows at Mount Etna. Jour-nal of Geophysical Research 115, B04203. http://dx.doi.org/10.1029/2009JB006431.
Cristofolini, R., Lentini, F., Patanè, G., Rasà, R., 1979. Integrazione di dati geologici,geofisici e petrologici per la stesura di un profilo crostale in corrispondenzadell'Etna. Bollettino della Societa Geologica Italiana 98, 239–247.
Cumin, G., 1954. Il terremoto di Codavolpe (versante orientale dell'Etna) dell'8 aprile1950. Bollettino delle sedute della Accademia Gioenia di Scienze Naturali in Cata-nia 2, 474–483.
Falsaperla, S., Cara, F., Rovelli, A., Neri, M., Behncke, B., Acocella, V., 2010. Effects of the1989 fracture system in the dynamics of the upper SE flank of Etna revealed by vol-canic tremor data: the missing link? Journal of Geophysical Research 115, B11306.http://dx.doi.org/10.1029/2010JB007529.
Froger, J.L., Merle, O., Briole, P., 2001. Active spreading and regional extension at Mount Etnaimaged by SAR interferometry. Earth and Planetary Science Letters 187, 245–258.
Gambino, S., 2004. Continuous dynamic response along a pre-existing structuraldiscontinuity induced by the 2001 eruption at Mt Etna. Earth, Planets andSpace 56, 447–456.
Gambino, S., Bonforte, A., Carnazzo, A., Falzone, G., Ferrari, F., Ferro, A., Guglielmino, F.,Laudani, G., Maiolino, V., Puglisi, G., 2011. Displacement across the TrecastagniFault (Mt. Etna) and induced seismicity: the October 2009–January 2010 episode.Annales Geophysicae 54, 414–423.

186 G. Barreca et al. / Journal of Volcanology and Geothermal Research 251 (2013) 170–186
Ganas, A., Papoulia, I., 2000. High-resolution, digital mapping of seismic hazardwithin theGulf of Evia Rift, central Greeceusing normal fault segments as line sources. NaturalHazards, 22. Kluwer Academic Publishers, Dordrecht, The Netherlands, pp. 203–223.
Ghisetti, F., 1979. Relazioni tra strutture e fasi trascorrenti e distensive lungo i sistemiMessina-Fiumefreddo, Tindari-Letojanni e Alia-Malvagna (Sicilia nord-orientale):uno studio microtettonico. Geologica Romana 18, 23–58.
Kauahikaua, J., Margriter, S., Moore, R.B., 1995. GIS-aided volcanic activity hazard anal-ysis for the Hawaii geothermal project environmental impact statement. NaturalHazards. Kluwer Academic Publishers, Dordrecht, The Netherlands, pp. 235–257.
Lanzafame, G., Neri, M., Rust, D., 1996. Active tectonics affecting the eastern flank ofMount Etna: structural interactions at a regional and local scale. In: Gravestock,P.J., McGuire, W.J. (Eds.), Etna: Fifteen Years On. ISBN: 1861740018, pp. 25–33.
Lanzafame, G., Leonardi, A., Neri, M., Rust, D., 1997a. Late overthrust of the Apennine–Maghrebian Chain at the NE periphery of Mt. Etna, Italy. Comptes Rendus del'Académie des Sciences de Paris 324, 325–332.
Lanzafame, G., Neri, M., Coltelli, M., Lodato, L., Rust, D., 1997b. North–south compres-sions in the Mt. Etna region (Sicily): spatial and temporal distribution. ActaVulcanologica 9 (1/2), 121–133.
Lentini, F., 1982. The geology of the Mt. Etna basement. Memorie della SocietàGeologica Italiana 23, 7–25.
Lo Giudice, E., Rasà, R., 1992. Very shallow earthquakes and brittle deformation in ac-tive volcanic areas: the Etnean region as example. Tectonophysics 202, 257–268.
Lo Giudice, E., Patané, G., Rasà, R., Romano, R., 1982. The structural framework of Mt.Etna. Memorie della Societa Geologica Italiana 23, 125–158.
Monaco, C., Tapponnier, P., Tortorici, L., Gillot, P.Y., 1997. Late Quaternary slip rates onthe Acireale–Piedimonte normal faults and tectonic origin of Mt. Etna (Sicily).Earth and Planetary Science Letters 147, 125–139.
Neri, M., Acocella, V., 2006. The 2004–05 Etna eruption: implications for flank deforma-tion and structural behaviour of the volcano. Journal of Volcanology and Geother-mal Research 158, 195–206. http://dx.doi.org/10.1016/j.jvolgeores.2006.04.022.
Neri, M., Acocella, V., Behncke, B., 2004. The role of the Pernicana Fault System in thespreading of Mt. Etna (Italy) during the 2002–2003 eruption. Bulletin of Volcanol-ogy 66, 417–430. http://dx.doi.org/10.1007/s00445-003-0322-x.
Neri, M., Acocella, V., Behncke, B., Maiolino, V., Ursino, A., Velardita, R., 2005. Contrast-ing triggering mechanisms of the 2001 and 2002–2003 eruptions of Mount Etna(Italy). Journal of Volcanology and Geothermal Research 144, 235–255. http://dx.doi.org/10.1016/j.jvolgeores.2004.11.025.
Neri, M., Guglielmino, F., Rust, D., 2007. Flank instability on Mount Etna: radon, radar in-terferometry and geodetic data from the southern boundary of the unstable sector.Journal of Geophysical Research 112, 1–15. http://dx.doi.org/10.1029/2006JB004756.
Neri,M., Mazzarini, F., Tarquini, S., Bisson,M., Isola, I., Behncke, B., Pareschi,M.T., 2008. Thechanging face of Mount Etna's summit area documented with Lidar technology. Geo-physical Research Letters 35, L09305. http://dx.doi.org/10.1029/2008GL033740.
Neri, M., Casu, F., Acocella, V., Solaro, G., Pepe, S., Berardino, P., Sansosti, E., Caltabiano,T., Lundgren, P., Lanari, R., 2009. Deformation and eruptions at Mt. Etna (Italy): alesson from 15 years of observations. Geophysical Research Letters 36, L02309.http://dx.doi.org/10.1029/2008GL036151.
Neri, M., Acocella, V., Behncke, B., Giammanco, S., Mazzarini, F., Rust, D., 2011a. Struc-tural analysis of the eruptive fissures at Mount Etna (Italy). Annales Geophysicae54 (5), 464–479. http://dx.doi.org/10.4401/ag-5332.
Neri, M., Giammanco, S., Ferrera, E., Patanè, G., Zanon, V., 2011b. Spatial distribution ofsoil radon as a tool to recognize active faulting on an active volcano: the exampleof Mt. Etna (Italy). Journal of Environmental Radioactivity 102, 863–870. http://dx.doi.org/10.1016/j.jenvrad.2011.05.002.
Obrizzo, F., Pingue, F., Troise, C., De Natale, G., 2001. Coseismic displacements andcreeping along the Pernicana fault (Etna, Italy) in the last 17 years: a detailedstudy of a tectonic structure on a volcano. Journal of Volcanology and GeothermalResearch 109, 109–131.
Palano, M., Aloisi, M., Amore, M., Bonforte, A., Calvagna, F., Cantarero, M., Consoli, O.,Consoli, S., Guglielmino, F., Mattia, M., Puglisi, B., Puglisi, G., 2006. Kinematicsand strain analyses of the eastern segment of the Pernicana Fault (Mt. Etna,Italy) derived from geodetic techniques (1997–2005). Annals of Geophysics 49,1105–1117.
Pareschi, M.T., 2002. Evaluation of volcanic fallout impact from Vesuvius using GIS. In:Briggs, D.J., et al. (Ed.), GIS for Emergency Preparedness and Health Risk Reduction.Kluwer Academic Publishers, Dordrecht, The Netherlands, pp. 101–114.
Pareschi, M.T., Cavarra, L., Favalli, M., Giannini, F., Meriggi, A., 2000. GIS and volcanicrisk management. Natural Hazards, 21. Kluwer Academic Publishers, Dordrecht,The Netherlands, pp. 361–379.
Puglisi, G., Bonforte, A., Ferretti, A., Guglielmino, F., Palano, M., Prati, C., 2008. Dynamicsof Mount Etna before, during, and after the July–August 2001 eruption inferredfrom GPS and differential synthetic aperture radar interferometry data. Journal ofGeophysical Research 113, B06405. http://dx.doi.org/10.1029/2006jb004811.
Reiter, L., 1990. Earthquake Hazard Analysis—Issues and Insights. Columbia UniversityPress, New York, p. 254.
Riuscetti, M., Distefano, R., 1972. Il terremoto di Macchia (Catania). Bollettino diGeofisica Teorica ed Applicata 14 (53–54), 150–164.
Rust, D., Behncke, B., Neri, M., Ciocanel, A., 2005. Nested zones of instability in theMount Etna volcanic edifice, Sicily. Journal of Volcanology and Geothermal Re-search 144, 137–153. http://dx.doi.org/10.1016/j.jvolgeores.2004.11.021.
Salvi, S., Quattrocchi, F., Brunori, C.A., Doumaz, F., Angelone, M., Billi, A., Buongiorno, F.,Funiciello, R., Guerra, M., Mele, G., Pizzino, L., Salvini, F., 1999. A multidisciplinaryapproach to earthquake research: implementation of a geochemical geographicalinformation system for the Gargano site, southern Italy. Natural Hazards, 20.Kluwer Academic Publishers, Dordrecht, The Netherlands, pp. 255–278.
Siniscalchi, A., Tripaldi, S., Neri, M., Giammanco, S., Piscitelli, S., Balasco, M., Behncke, B.,Magrì, C., Naudet, V., Rizzo, E., 2010. Insights into fluid circulation across thePernicana Fault (Mt. Etna, Italy) and implications for flank instability. Journal ofVolcanology and Geothermal Research 193, 137–142. http://dx.doi.org/10.1016/j.jvolgeores.2010.03.013.
Siniscalchi, A., Tripaldi, S., Neri, M., Balasco, M., Romano, G., Ruch, J., Schiavone, D.,2012. Flank instability structure of Mt Etna inferred by a magnetotelluric survey.Journal of Geophysical Research 117. http://dx.doi.org/10.1029/2011JB008657.
Solaro, G., Acocella, V., Pepe, S., Ruch, J., Neri, M., Sansosti, E., 2010. Anatomy of an un-stable volcano from InSAR: multiple processes affecting flank instability at Mt.Etna, 1994–2008. Journal of Geophysical Research 115, B10405. http://dx.doi.org/10.1029/2009JB000820.
Stewart, I., McGuire, W., Vita-Finzi, C., Firth, C., Holmes, R., Saunders, S., 1993. Activefaulting and neotectonic deformation on the eastern flank of Mount Etna, Sicily.Zeitschrift für Geomorphologie 94, 73–94.
Tarquini, S., Isola, I., Favalli, M., Mazzarini, F., Bisson, M., Pareschi, M.T., Boschi, E., 2007.TINITALY/01: a new triangular irregular network of Italy. Annales Geophysicae 50(3), 407–425.
Tibaldi, A., Groppelli, G., 2002. Volcano-tectonic activity along structures of the unsta-ble NE flank of Mt Etna (Italy) and their possible origin. Journal of Volcanology andGeothermal Research 115, 277–302.
Walter, T.R., Acocella, V., Neri, M., Amelung, F., 2005. Feedback processes betweenmagmatism and E-flank movement at Mt. Etna (Italy) during the 2002–2003 erup-tion. Journal of Geophysical Research 110, B10205. http://dx.doi.org/10.1029/2005JB003688.
Wells, D.L., Coppersmith, K.J., 1994. New empirical relationships among magnitude,rupture length, rupture width, rupture area and surface displacement. Bulletin ofthe Seismological Society of America 84, 974–1002.