Locating reflexivity in contemporary social and health care practice
Upload
khangminh22Category
view
1download
0
DETECTING AND LOCATING FAULTS IN THE ROTOR WINDINGS OF LARGE ELECTRICAL
GENERATOR ROTORS
This Reference manual describes some of the methods used to test the windings of large cylindrical rotors which generate the rotating magnetic fields in large turbo-alternators with particular emphasis on the RECURRENT SURGE (RSO) method. It is also a reference manual for the Rowtest TDR200 Rotor RSO Reflectometer.
Rowtest Ltd.,
64, Courthill House,Water Lane, Wilmslow, Cheshire. SK9 5AJ. UK Phone/Fax +44 - (0) - 1625 - 418722
Email: [email protected] Website: www.rowtest.com Copyright Rowtest Ltd. and Convex Design Ltd. 2020

0. OVERVIEW The cylindrical rotors used in large electricity generators are large rotating electromagnets. They contain magnetic field windings formed from a number of coils connected in series. Each individual coil contains a number of turns, also connected in series and the whole field winding carries a direct current of typically, a few thousand amps to produce the large rotating magnetic fields required to induce alternating voltages in the generator stator windings. As the cylindrical rotors rotate at typically 3000rpm, the field windings are subject to very large centrifugal forces which can damage the insulation between the turns, causing them to short-circuit to adjacent turns or to ground. This manual describes how these rotors are constructed and how they can be tested to detect faults in the the field windings. It is primarily intended as a reference document for the Rowtest range of Rotor winding test equipment, but can also be read as a stand-alone document. The two main Rotor winding test methods in current use are: 1. The Recurrent Surge Oscilloscope (RSO) test, which can be carried out with the generator off-line, with the rotor at rest or at speed. 2. The Magnetic Flux Probe test which can be carried out with the generator in-service at speed or off-line in a repair or test facility. We have included some information from relevant published technical reports etc., some of which we have included as appendices to this manual. We have tried to acknowledge the source of this information wherever possible and thank the authors for their permission to include these items. Please contact us if we have omitted any source references and we will include them in future updates to this manual. The manual contains a number of individual sections which are summarised below. 0.1 SECTION SUMMARIES The following numbered paragraphs summarise the contents of the main sections in this manual: Sections 1 to 3 give an introduction to the design and construction of the rotors of large electricity generators: 1. Describes the principle of operation of large electricity generators and gives some examples of different rotor types. 2. Detailed information about the construction of cylindrical rotors and the windings which generate the magnetic field. 3. Description of winding faults and summaries of the 2 main test methods.

Sections 4 to 12 give detailed information about the RSO test, including how it can be used to detect and locate winding faults under various operating regimes. 4. An introduction to the RSO test, giving examples of test waveforms under various fault conditions. 5. Simulation and modelling of a rotor winding using a simple electrical delay line. 6. Description of the Rowtest TDR200 Rotor Reflectometer. 7. Use of the RSO test for locating winding faults. 8. Practical details of RSO testing. 9. Testing a rotor at rest in the generator and recording the test results. 10. Testing a rotor at speed. 11. Testing laminated rotors. 12. Typical RSO test results. 13. This section gives information about the Magnetic Flux probe test which is normally carried out with the rotor at speed on generators which have a flux probe (search coil) installed in the air gap between the rotor and stator. It describes the principle of operation of the flux probe test and also gives information about how it can be used in a repair or test facility. 14. Information for plant operators. 15. References 16. Appendices including an RSO Test Result Template

CONTENTS 1. INTRODUCTION
1.1 OPERATING PRINCIPLES OF LARGE ELECTRICAL GENERATORS 1.2 TYPES OF ROTOR 1.3 TESTING ROTOR WINDINGS
2. CYLINDRICAL TURBO GENERATOR GENERATOR ROTORS
2.1 OVERVIEW 2.2 CONSTRUCTION OF CYLINDRICAL ROTOR WINDINGS 2.3 GENERATING THE MAGNETIC FIELD 2.4 WINDING AND INSULATION DETAILS FOR A SINGLE COIL
3. ROTOR WINDING FAULTS IN LARGE ELECTRICAL GENERATORS
3.1 TYPES OF WINDING FAULTS 3.1.1 Earth faults 3.1.2 Interturn faults
3.2 DETECTING AND LOCATING ROTOR WINDING FAULTS 3.2.1 The Recurrent Surge Oscillograph (RSO) test.
3.2.2 The Flux probe (search coil) test 3.3. IMPACT ON PLANT OPERATION OF SHORTED TURNS
4. AN INTRODUCTION TO THE RSO TEST
4.1. OVERVIEW 4.2. PRINCIPLE OF OPERATION 4.3 TEST DETAILS 4.4 TYPICAL RSO WAVEFORMS FOR A FAULT-FREE ROTOR
4.4.1 Checking for 2 waveforms using trace identify buttons 4.5 RSO WAVEFORMS FOR DIFFERENT RV2 VALUES
4.5.1 Measured waveforms 4.5.2 Idealised waveforms
4.6 EXAMPLES OF MEASURED RSO WAVEFORMS FOR WINDING FAULTS
4.6.1. Rotor winding with an earth fault 4.6.2. Rotor winding with an interturn fault 4.6.3 RSO pulse propagation at a shorted turn 4.6.4. Rotor winding with a high resistance joint 4.6.5. Rotor winding with a major winding fault 4.6.6. Other causes of non-identical RSO waveforms
4.6.7 Locating the position of winding faults. 4.6.8. Sensitivity of RSO test 4.6.9 Test conditions
5 SIMULATING A REAL ROTOR WINDING USING A DELAY LINE
5.1 OVERVIEW 5.2 PRINCIPLES OF ELECTRICAL DELAY LINES 5.3 THE DL100 DEMONSTRATION DELAY LINE 5.4 SIMULATED RSO WAVEFORMS OBTAINED USING DL100 DELAY LINE 5.5 USE OF THE TRACE IDENTIFIER BUTTONS
6. THE TDR200 ROTOR REFLECTOMETER MEASUREMENT SYSTEM
6.1 OVERVIEW 6.2 OPERATING PRINCIPLE 6.3 OPERATING MODES AND RSO WAVEFORMS 6.4. SETTING THE VALUES OF R1 AND R2
6.4.1. Overview
6.4.2. Measuring the rotor characteristic impedance (Z0) 6.5 MEASURING THE SINGLE-PASS TRANSIT TIME. 6.6. OPTIMISING THE VALUE OF R2.
7 LOCATING WINDING FAULTS
7.1 LOCATING FAULTS USING TIME SCALING 7.2 IMPROVING THE TRANSIT TIME ESTIMATE
7.2.1 The effects of waveform distortion 7.2.2 Improved transit time calculation
7.3 METHOD FOR FAULT LOCATION BY APPLYING MIRROR FAULTS. WITH ROTOR REMOVED FROM GENERATOR 7.4 PRACTICAL DETAILS FOR MIRROR FAULT METHOD
7.4.1.1. Locating Earth Faults 7.4.2. Locating Inter-turn faults
7.5 ESTIMATING THE SINGLE-PASS TRANSIT TIME FROM RSO WAVEFORMS FOR A ROTOR WINDING CONTAINING AN EARTH FAULT
8. PRACTICAL DETAILS OF RSO TESTING
8.1 OVERVIEW AND SAFETY WARNING 8.2 MEASUREMENT OPTIONS
8.3 PRELIMINARY CHECKS
9. METHOD FOR TESTING A ROTOR AT REST WHILE INSTALLED IN THE GENERATOR
9.1 OVERVIEW 9.2 PREPARING THE ROTOR FOR TESTING 9.3 CONNECTING THE REFLECTOMETER TO THE ROTOR WINDING
9.3.1 Rotor winding connection module and test leads 9.3.2 Making connections to the rotor winding
9.4 SETTING UP THE TEST EQUIPMENT 9.5 RECORDING THE RSO TEST RESULTS
9.5.1 Using a word template 9.5.2 As digital files
10. METHOD FOR TESTING ROTOR AT SPEED 10.1 CAUTION - SAFETY CONCERNS 10.2 WHY TEST AT SPEED ? 10.3 PRACTICAL DETAILS FOR TESTING A ROTOR AT SPEED
10.3.1. Preparing a set of insulated brushes 10.3.2. Making the earth connection 10.3.3. Test details
10.4 MINIMISING THE EFFECTS OF IMPERFECT BRUSH CONTACT 10.4.1 Testing a rotor at speed in analogue mode
10.4.2. Testing a rotor at speed in digital mode 10.4.2.1. Test results obtained with rotor at rest. 10.4.2.2 Test results obtained with rotor at 3000rpm.
10.4.3 Improving the results obtained at 3000 rpm using averaging. 10.4.4 Results at 3000 rpm obtained with improved brush contact.

11. TESTING LAMINATED ROTORS 11.1 CYLINDRICAL ROTORS 11.2 SLOW-SPEED SALIENT POLE ROTORS
12. WHAT TO EXPECT - SOME TYPICAL TEST RESULTS 12.1 DISCLAIMER 12.2 FAULT-FREE ROTOR WINDING 12.3 RESULTS FOR TYPICAL WINDING FAULTS 12.4 RESULTS OBTAINED FOR A ROTOR WINDING DURING REPAIR 12.5 TEST RESULTS FOR WINDING FAULTS IN ANALOGUE MODE
13. FLUX PROBE (SEARCH COIL) TESTS 13.1 INTRODUCTION 13.2 PRINCIPLE OF OPERATION 13.3 DETAILS OF FLUX PROBE WAVEFORMS
13.3.1 Tangential field flux probe 13.3.2 Radial field flux probe
13.4 EXAMPLE WAVEFORMS 13.4.1 Radial flux probe 13.4.2 Tangential flux probe
13.5 FLUX PROBE TESTING IN AN OVERSPEED PIT 13.6 EFFECTS OF RESIDUAL MAGNETISM 13.7 COMMENTS
14. SOME FURTHER INFORMATION FOR PLANT OPERATORS 14.1 HISTORICAL PERSPECTIVE 14.2 IMPACT OF SHORTED TURNS ON PLANT OPERATION 15. REFERENCES APPENDICES 1. RSO test report blank template 2. CEGB technical disclosure bulletin 201 A. E. Grant 3. A Standard approach to RSO interpretation G. A. Elsworth 4. Uilisation of Repetitive Surge Oscilloscope (RSO) in the Detectionj of Rotor Shorted-Turns in Large Turbine-Driven Generators. 5. Generator Field Winding Shorted Turn Detection Technology, Donald R. Albright, David J. Albright And James D. Albright, Generatortech, Inc. 6. Inter-turn Short-Circuit Detector for Turbine-Generator Rotor Windings, D.R. Albright.


1. INTRODUCTION 1.1 OPERATING PRINCIPLES OF LARGE ELECTRICAL GENERATORS A typical (500MW) large electricity generator (alternator) consists of a stationary 3-phase stator winding (the stator) which interacts with a rotating magnetic field produced by a rotating electromagnet (the rotor). It generates a high-voltage (typically 25kV) alternating current at 50 or 60Hz from insulated conductors located within the laminated stator core. The rotor is normally driven by a steam or gas turbine. The rotor is located inside the stator, with a radial air-gap of a few cm between them and rotates at high-speed (eg 3000rpm) in normal operation. The rotating magnetic field is produced by a direct current (typically 3000 Amps for a large generator) which flows through 100-200 turns of partially-insulated copper bars contained within coils located in pairs of radial slots machined into the solid cylindrical steel rotor forging. The direct current through the rotor winding is usually produced by a DC (or rectified-AC) generator known as the exciter, mounted on the rotor shaft. Typical exciter voltages are around 300V DC, so the rotor windings have only relatively low-voltage insulation when compared with the high-voltage (25KV) insulation required for the stator windings.
Internal magnetic field
3-phase output voltages
Figure 1.1 Principle of operation of a 2-pole generator.

1.2 TYPES OF ROTOR A rotor can have 2 or more magnetic poles and these determine the relationship between the rotor speed of rotation and the supply frequency generated. For example, the frequency generated by a 2-pole rotor will equal the number of rotations per second, while for a 4-pole rotor, the frequency generated will be 2 x the number of rotations per second etc. There are a number of different configurations of generator rotors. The 2 main types are cylindrical rotors for use with high-speed turbo generators and salient pole rotors, which are often used with lower-speed hydro-electric-generators. Examples of these rotor types are shown in the next figures.
Figure 1.2 Cylindrical turbo-alternator rotor Salient pole rotors in large hydro-electric generators have multiple pairs of magnetic poles as shown in figures 1.3 and 1.4 rotate at lower speeds.
Figure 1.3 Salient pole rotor type 1

Figure 1.4 Salient pole rotor type 2
1.3 TESTING ROTOR WINDINGS
This document describes methods which can be used to detect and locate winding faults in cylindrical rotors. In general, these methods are not suitable for use with salient pole rotors. However, in some limited cases, salient pole rotor windings can also be tested in a similar manner as described later.

2. CYLINDRICAL TURBO GENERATOR GENERATOR ROTORS 2.1 OVERVIEW Details of a typical turbo-generator rotor, together with an image of a typical large turbo-generator rotor with the end-rings removed are shown in the figures below.
This region shown in detailed cross-section below
Figure 2.1 Side view of a typical turbo- generator field rotor (courtesy of GE Power Systems)
Figure 2.2 Connection between ends of field winding and collector (slip) rings
The two ends of the rotor winding are connected to the exciter via insulated leads contained within slots or bores in the rotor shaft. In the above example, these upshaft leads are shown connected to conventional slip (collector) rings. In more modern designs, they are connected to rotating rectifier modules mounted on the shaft.

Figure 2.3 . View of a 2-pole cylindrical generator rotor with both end-rings removed
Large rotors are typically 16m long, 2m in diameter and weigh 80 tonnes.
The direct current through the rotor winding is usually produced by an exciter, mounted on the rotor shaft. The total magnetic field produced by the rotor winding is directly proportional to the product of the current and the number of turns in the winding. Cylindrical rotor windings normally have either a single or 2 pairs of magnetic poles, and these are known as 2 or 4-pole rotors. An important characteristic of all cylindrical rotor windings is that they are symmetrical when viewed from either slip-ring. A 2-pole rotor contains 2 identical half-windings, one for the North pole and one for the South pole, as shown below. Each half-winding is identical.
Figure 2.4 Representation of a 2-pole rotor winding showing the identical
North and South pole half-windings

2.2 CONSTRUCTION OF CYLINDRICAL ROTOR WINDINGS The rotor body is a solid steel forging containing radial slots for the coils which form the rotating electromagnet. The turns of the coils are normally rectangular copper bars insulated with an epoxy material. In a 2-pole rotor, there are typically 8 pairs of slots for each pole of the electromagnet, with each slot containing up to 20 conductor turns. A cross-section of a typical radial slot (in this case, containing 7 turns of insulated copper bar) is shown in figure 2.5.
Figure 2.5 Cross-sectional view of a radial slot containing the rotor field
winding. (courtesy of GE Power Systems)
The insulation between the turns is typically around 10 to 15 mils (0.3mm) thick and is made from Nomex paper or resin impregnated epoxy glass laminate.
At the ends of the rotor body, the turns pass from the end of one slot to its equivalent slot on the other side of the magnetic pole and are held in place in the end regions by steel end rings. The image below shows the end-winding regions of a rotor with the end-rings removed.
Figure 2.6 Cylindrical rotor winding with end (collector) rings removed

One consequence of this form of construction is that the rotor winding approximates to a high-frequency transmission line (similar to a coaxial cable) as the insulated conductors sit within enclosed slots in the metallic rotor forging. This means that if an electrical pulse is applied to one end of the winding, it will travel through the winding to the far end where it will emerge after a finite time delay. The RSO test method uses transmission line measurement techniques, as described later, to identify and locate any faults in the rotor winding. There is also a second mode of propagation through the winding caused by direct capacitive coupling between the insulated turns. In practice, this is a secondary (minor) mode of propagation, but its effects can complicate the location of rotor winding faults. 2.3 GENERATING THE MAGNETIC FIELD The Figure below shows a simplified representation of the magnetic field path, magnetic pole locations and conductor slots for a simplified 2-pole cylindrical turbogenerator rotor having a total of 8 coils (4 per half-winding). A direct current of typically 3000 amps flows through the rotor winding to produce the magnetic field, which is at right-angles to the axis of rotation, with clearly-defined north and south poles. There is a single pair of magnetic poles (1 and 2), which are located along the centre line of each set of coils. Poles 1 and 2 are often referred to as the north and south poles. The complete rotor magnetic field winding consists of 2 identical half-windings connected in series The return path for the magnetic field is via the stator laminations as shown below. The magnetic field has radial and tangential components, but no axial component.
Figure 2.7 Cross-section of a cylindrical rotor showing the magnetic poles and current flow in slots
Current direction towards viewer
Current direction away from viewer
------->-------
Magnetic field path
POLE 1
POLE2

The next figures show examples of 2 cylindrical rotors with the end rings removed to expose the copper bars in the end regions of the rotor winding. The locations of the magnetic poles are clearly marked.
Figure 2.8 Rotor end regions showing locations of magnetic poles
Figure 2.9 Typical field winding showing both the middle (slot) and end winding sections. *
(Some of the turns are shown lifted from the slots.)
* Content from EIC conference proceedings June 2011 paper by I. Kersenbaum PhD, PE

2.4 WINDING AND INSULATION DETAILS FOR A SINGLE COIL The next figures * show how a single coil of 7 turns is constructed.
Figure 2.10 Construction of a single coil in a rotor winding * * Content from EIC conference proceedings June 2011 paper by I. Kersenbaum PhD, PE
Most large generators use the strip turn insulation method where insulation only exists between the main faces of the rectangular bars. The small sides of the bars are exposed but are isolated from the slot walls by an insulated slot liner.. The left-hand image shows one half-winding for Pole 1, which contains 7 coils. All of the turns and coils are connected in series. So each half-winding contains typically 49 turns. The half-windings are connected in series as shown in figure 2.4. The length of individual turns will differ depending on the coil location because of the different circumferential separation of the rotor slot-pairs. In addtion, there will be variations in length between the turns within each coil because of the different radial depths of the turns. Using the above figures as an example, the normal winding configuration for each half-winding is as follows: Coil 1 is the smallest coil, and is located next to the magnetic pole. The first turn in this winding (turn 1) is at the bottom of the radial slot and is connected to the slip ring or diode rectifier wheel by one of the insulated upshaft leads. The coils are numbered sequentially outwards towards the ends of the rotor as shown in figure 2.8. The 2 half-windings are identical and they are connected together after the last coil in each half-winding (coil 7 in this case). For the rotors above, there will be a total of 49 x 2 = 98 turns in the complete rotor winding.

3. ROTOR WINDING FAULTS IN LARGE ELECTRICAL GENERATORS 3.1 TYPES OF WINDING FAULTS
Figure 3.1. Examples of coil insulation breakdown (courtesy of GE Power Systems)
A 2-pole rotor rotates at 3000/3600 rpm to produce a 50Hz or 60Hz alternating voltage in the (3-phase) stator windings. The rotor windings experience large centrifugal forces, which can damage the insulation, leading to either faults from the winding to the rotor body ('earth faults') or faults between parts of the winding ('inter-winding or inter-turn faults') as shown in the figure above. 3.1.1 Earth faults An earth fault is often detectable with a simple multimeter and it may be possible to continue to operate a rotor having a single earth fault (preferably with some form of protection system to detect the onset of a second earth fault). 3.1.2 Interturn faults A rotor winding with a serious inter-turn may suffer heat damage at the fault location because any short between turns will have a significant resistance compared with the very small resistance of a single turn in the winding. Consequently, large quantities of heat can be generated at the fault location and this can cause damage to the remaining insulation, resulting in severe damage to the rotor windings. This subject is discussed further in section 3.3. Inter-turn faults can also cause magnetic and thermal imbalance, giving rise to increased vibration levels. which may vary with the rotor (field) current and cause the generator to be taken out of service. They may also reduce the excitation capacity of the generator.

However, inter-turn faults often do not cause any obvious performance changes and are only found by monitoring or testing the generator as described later. The existence of an inter-turn or winding fault is not easily detected by simple electrical methods and specialised test methods are normally required. 3.2 DETECTING AND LOCATING ROTOR WINDING FAULTS It is currently normal practice to test generator rotors routinely to detect these types of fault, both during construction and also before and after routine generator maintenance. There are 2 standard methods in common use: 3.2.1 The Recurrent Surge Oscillograph (RSO) test. This is an off-line test which can detect and locate both inter-turn and earth faults. It is a form of time-domain reflectometry and is carried out using a custom test instrument (RSO reflectometer). This is a very sensitive test and will detect shorted turns which may not carry any significant current in normal operation. 3.2.2 The Flux probe (search coil) test This test can be used to monitor an on-line generator where a suitable magnetic flux probe (search coil) has been pre-installed in the air gap between the rotor and stator. It will only detect a current-carrying shorted turn and will indicate the coil number containing the fault and the fault magnitude can also be estimated. This test can also be used to test a rotor which has been removed from a generator following a repair. This is normally carried out at full speed during rotor balancing in an overspeed pit, using a temporary field current supply and slip rings. 3.3. IMPACT ON PLANT OPERATION OF SHORTED TURNS The RSO test is very sensitive and will detect shorts between turns which do not carry any significant current. Consequently, some rotors may have many shorts without any serious impact on their operation, while the operation of others is affected after developing a single fault. The total winding resistance for a large generator rotor is around 0.1 Ohms (100m Ω). As the rotor winding typically contains around 100 turns, the resistance around a single turn will be less than 1m Ω. Consequently, a short between turns of 1Ω will only carry 0.1% of the rated current. As typical large rotor currents are around 3000A, this will result in a current of only 3A through the short. If the short resistance value is 10 Ω, this current reduces to 0.3A. The power (heat) dissipated at the short is calculated using P = I2 x R where P is the power dissipated, I is the current through the short and R is the short resistance.

For a 1Ω/3A short, the power dissipated will be 9 watts, and this amount of heat may be significant enough to burn the insulation. For a 10Ω/0.3A short, the power dissipated will be 0.9 watts, which is unlikely to cause any problems on a large rotor winding. If a shorted turn is detected by an RSO test, further tests will normally be required to determine whether the short is severe enough to carry significant current. A suitable method is to use a magnetic flux probe (search coil) which will only detect current-carrying shorted turns.

4. AN INTRODUCTION TO THE RSO TEST 4.1. OVERVIEW The RSO (Recurrent Surge Oscillograph) test was developed to detect and locate inter-turn faults in the field windings of large turbo-alternator rotors. It is carried out with the generator off-line and with the rotor winding isolated from the excitation system. It can be done with the rotor at rest (and also at speed if slip rings are available). It is a safe low-voltage test and can be done with the rotor intact or partially dismantled during a repair. The test uses a modified form of time domain reflectometry to apply a D.C. low-voltage pulse between each end of the rotor winding and the rotor body in turn. The resultant waveforms are monitored and compared (eg with an oscilloscope). The test was first described in a paper by A.E Grant in 1973 and a copy of this paper is included in Appendix 2 of this manual.
The test method relies on 2 premises: 1. All rotor windings are symmetrical when viewed from each end of the winding. For example, a 2-pole rotor contains two nominally-identical half-windings, one for the North pole and the other for the South pole, both of which are connected in series. A four pole rotor is similarly symmetrical.
Figure 4.1 Representation of a 2-pole rotor winding showing the identical North and South pole half-windings
2. The rotor winding can be approximated as a high-frequency transmission line which has an overall characteristic or wave impedance (similar to a coaxial cable). This property results from the form of construction of the rotor winding, where insulated rotor conductor bars are located within enclosed slots in the metallic rotor forging. In practice, the wave impedance varies throughout the rotor winding, having different values in the slot and end winding regions. These 2 properties are used to compare the response of the 2 halves of the rotor winding to low-voltage pulses applied in turn between each end of the rotor winding and ground (the rotor body If there is a fault in the rotor winding, the wave impedance will change at the fault position and the 2 oscilloscope waveforms will diverge at the fault location.

4.2. PRINCIPLE OF OPERATION The RSO test makes use of the symmetry properties of the rotor windings together with transmission line measurement techniques to detect and locate any winding faults. The test method is based on injecting a low-voltage pulse between one end of the rotor winding and the rotor body (ground) as shown in Figure 4.2.1, which shows a rotor with 7 coils in each half-winding.
Figure 4.2.1 RSO test method showing half-windings and coils
If the RSO pulse is injected from the slip ring connected to the start of the Pole 1 half-winding (SR1), it will first propagate through coil 1, then coil 2 etc. and reach the end of the pole 1 half winding (after coil 7). It will then continue to travel on through the identical half-winding to the second slip ring (SR2), where it will emerge after a finite time delay. The RSO pulses are applied between each end of the rotor winding and ground in turn. The waveforms at the input and output ends of the winding are monitored as shown in Figure 4.3.1. If the rotor winding is fault-free, the waveforms observed at each end (slip ring) of the winding will be identical. However, if one half-winding contains a fault, the two waveforms will differ. It should be noted that even for a fault-free winding, there will be multiple reflections within the rotor winding at each change in impedance between the sections of conductors inside the radial slots and the sections in the cross-over end regions, which results in complex waveforms. However, the symmetry property ensures that 2 identical waveforms will always be produced by a fault-free rotor under normal test conditions. In Grant's original method, RV2 and C2 were omitted and it was necessary to use photography to record the oscilloscope traces. Later versions of the test used digital oscilloscopes instead. However both of these methods have the disadvantage that the RSO waveforms cannot be captured simultaneously. This is a particular problem when the test is carried out with the rotor at speed. The Rowtest TDR200 RSO Rotor Reflectometer test system overcomes this problem and displays both RSO waveforms simultaneously.
4.3 TEST DETAILS
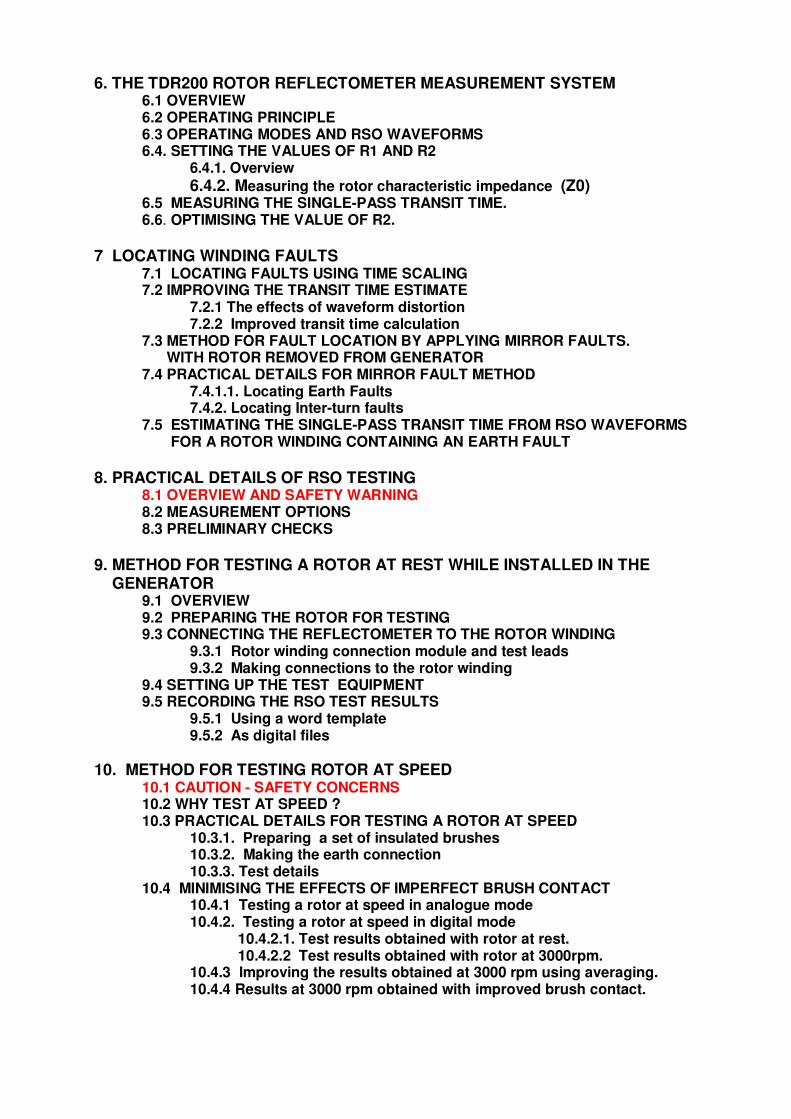
Figure 4.3.1 Basic RSO test method
This section describes the basic principles of the RSO test as used in the Rowtest TDR200 Rotor RSO Relectometer. The rotor winding is isolated from the excitation system and a low-voltage (12V) pulse is applied between one end of the rotor winding and ground (via the slip rings if these are available). The transmitted pulse received at the remote end of the rotor and the reflected pulse at the sending end are monitored as shown in figure 4.3.1, which is a simplified version of figure 4.2.1. A pair of adjustable resistors (RV1 and RV2) are set to match the pulse generator and terminating resistor to the characteristic impedance of the rotor winding (typically in the range 30 - 1000 Ohms). This ensures that the winding is tested under repeatable conditions and minimises multiple reflections of the pulse within the winding.
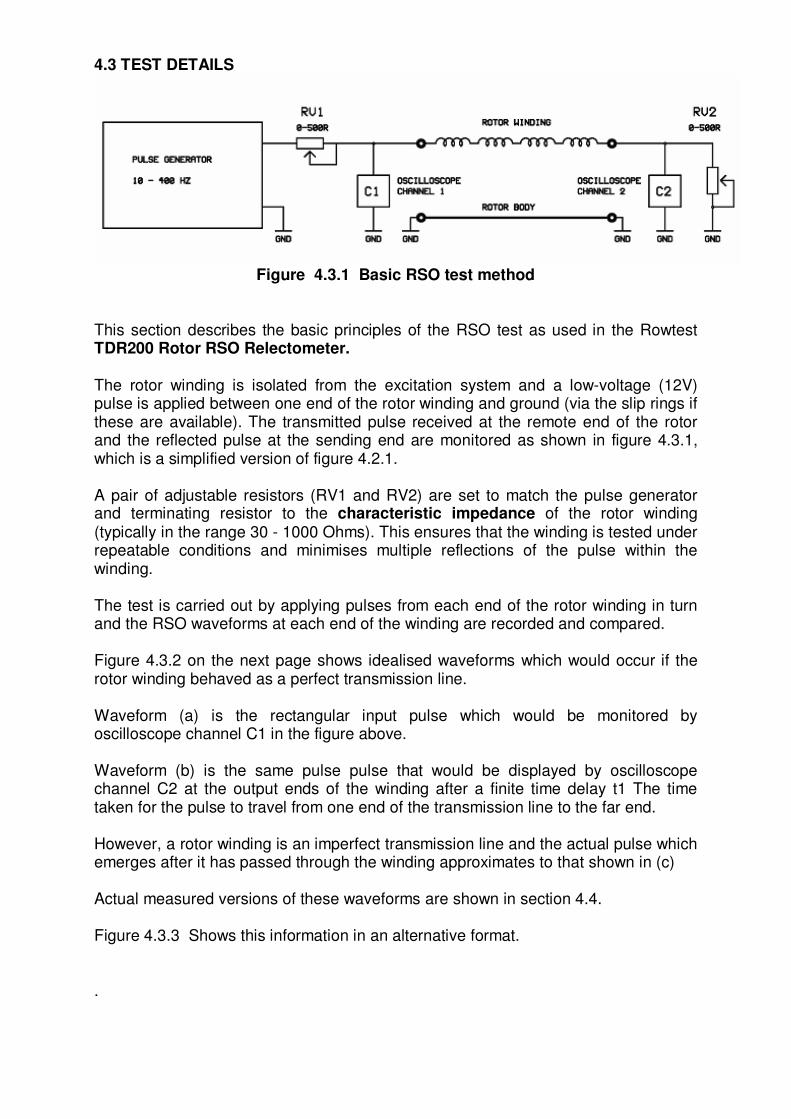
The test is carried out by applying pulses from each end of the rotor winding in turn and the RSO waveforms at each end of the winding are recorded and compared. Figure 4.3.2 on the next page shows idealised waveforms which would occur if the rotor winding behaved as a perfect transmission line. Waveform (a) is the rectangular input pulse which would be monitored by oscilloscope channel C1 in the figure above. Waveform (b) is the same pulse pulse that would be displayed by oscilloscope channel C2 at the output ends of the winding after a finite time delay t1 The time taken for the pulse to travel from one end of the transmission line to the far end. However, a rotor winding is an imperfect transmission line and the actual pulse which emerges after it has passed through the winding approximates to that shown in (c) Actual measured versions of these waveforms are shown in section 4.4. Figure 4.3.3 Shows this information in an alternative format. .
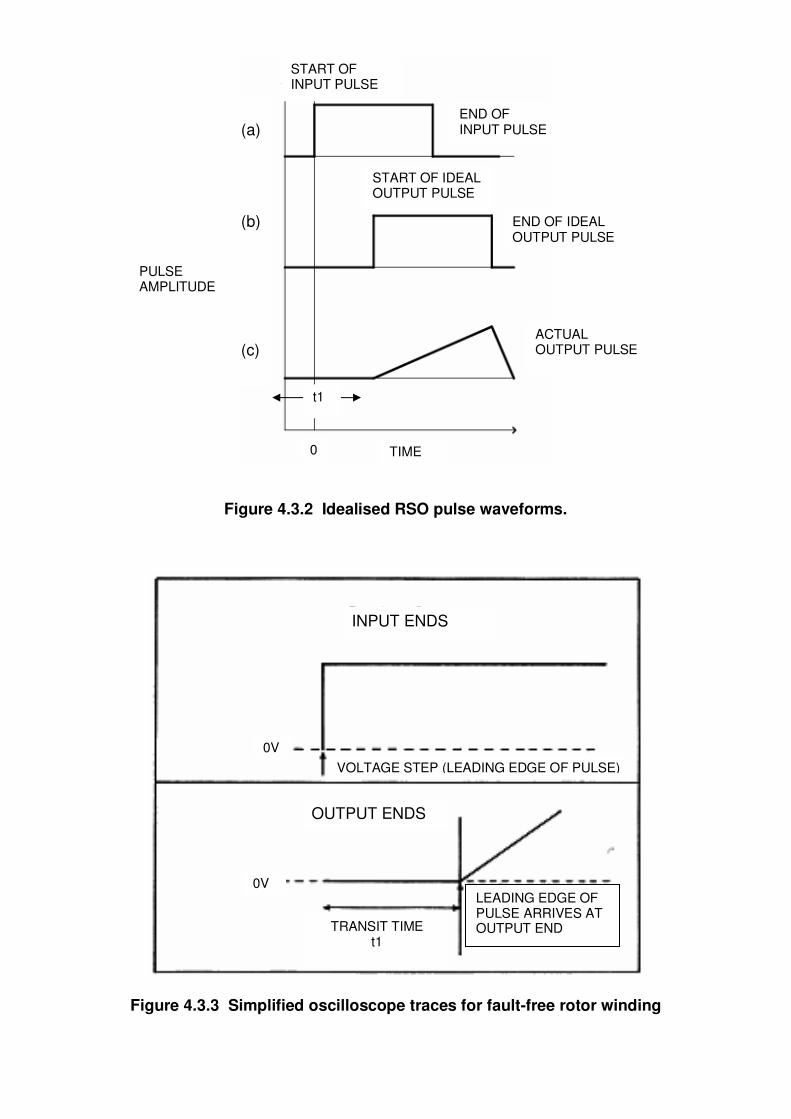
Figure 4.3.2 Idealised RSO pulse waveforms.
Figure 4.3.3 Simplified oscilloscope traces for fault-free rotor winding
START OF INPUT PULSE
END OF INPUT PULSE
START OF IDEAL OUTPUT PULSE
END OF IDEAL OUTPUT PULSE
PULSE AMPLITUDE
TIME
ACTUAL OUTPUT PULSE
t1
0
(a) (b) (c)
INPUT ENDS
OUTPUT ENDS
TRANSIT TIME t1
0V
VOLTAGE STEP (LEADING EDGE OF PULSE)
0V
LEADING EDGE OF PULSE ARRIVES AT OUTPUT END

4.4 TYPICAL RSO WAVEFORMS FOR A FAULT-FREE ROTOR Examples of measured RSO waveforms at the input and output ends of the rotor winding are shown in the following figures. These and subsequent waveforms were all measured using an analogue oscilloscope with the TDR200 unit operating in its analogue mode.
(a) Input ends (b) Output ends
Figure 4.4.1 Typical RSO waveforms for a fault-free rotor winding
Figure 4.4.1(a) shows the RSO waveforms at the input ends of the winding (the ends where the pulses are applied) for a fault-free rotor winding. The figures plot the pulse amplitude vertically and time horizontally. The original square input pulse is seen to be distorted by multiple reflections from impedance changes within the winding. Note that there are 2 perfectly superimposed RSO waveforms (until after the end of the pulse) for a fault-free rotor. A sound rotor will appear to be symmetrical with respect to either slip ring and therefore, the two waveform traces that either C1 or C2 monitor will be identical and will be superimposed on the oscilloscope screen. In each figure above, there are 2 superimposed waveforms. Figure (b) shows the RSO pulse viewed at the output ends of the winding. After passing through the winding, the original square pulse now has a very slow rising edge. The pulse will take a finite amount of time t1 (the single pass transit time) to travel from the input end of the rotor to the output end. As a result, the traces monitored by C2 will display zero voltage for this period and the pulse transit time can therefore be measured directly from the C2 traces.
A healthy rotor winding will have two identical traces. A rotor with a winding fault will have differing traces as described in section 4.6 and the positions of the fault can be deduced by scaling in the time domain. It should be noted that there is also a second mode of propagation through the winding caused by direct capacitive coupling between the insulated turns. In practice, this is a secondary (minor) mode of propagation, but its effects can complicate the location of any winding faults. The effects of this mode can be seen in figure 4.4.1(b) as a small pulse which precedes the main output signal.

4.4.1 CHECKING FOR 2 WAVEFORMS USING TRACE IDENTIFY BUTTONS In the RSO waveforms for a fault-free rotor shown in figure 4.4.1, there have been 2 superimposed waveforms. This can be confirmed by connecting a high value resistor (eg 1KOhm) across the selected winding end, which displaces the selected waveform vertically. On the TDR200 unit, this is done by temporarily depressing one of the trace identify buttons. In this way, the individual waveforms at each end of the winding can be identified, even for a fault-free winding.
Figure 4.4.2 Operation of trace identification buttons

4.5 RSO WAVEFORMS FOR DIFFERENT RV2 VALUES 4.5.1 MEASURED WAVEFORMS In all of the examples given so far, the RSO equipment has been operated with the impedance matching resistors RV1 and RV2 set to the characteristic wave impedance of the rotor winding Z0. The following figures show the effects on the RSO waveforms of varying the value of the terminating resistor RV2.
m
Figure 4.5.3 RSO waveforms for different values of RV2 Fig. 4.5.3 shows 2 cases: a) Input end waveforms with RV2 matched to Z0 (no reflection) b) Output end waveforms with RV2 matched to Z0 c) Input end waveforms with RV2 < Z0 (negative reflection d) Input end waveforms with RV2 > Z0 (positive reflection)
t1 (a) Healthy rotor, input ends, RV2 = Z0 (b) Healthy rotor, output ends, RV2 = Z0
I t2 I I t2 I
(c) Healthy rotor, input ends, RV2 = 0 (b) Healthy rotor. input ends, RV2 = ∞

4.5.3 (a) shows the RSO waveforms at the input ends of the rotor winding when the value of RV2 is set to equal the rotor wave impedance Z0. This is the normal mode of operation and there is no signal reflected from the far ends of the winding. Figure 4.5.3 (b) shows the the RSO pulse at the output ends of the winding for the same matched value of RV2. The original square pulse applied at the input ends has become a slowly-rising waveform at the output ends of the winding. The output end waveform starts after a time delay of t1 seconds (the single-pass transit time). Figures 4.5.3 (c) and (d) show that when RV2 does not match the rotor wave impedance Z0, there is a reflected signal from the output ends. This is seen at the input ends t2 seconds (the double=pass transit time) after the start of the voltage pulse, where t2 is approximately double the single pass transit time (t1). Note that when RV2 is less than Z0 (figure c), the reflected signal is negative (the pulse amplitude decreases after t2 seconds). When RV2 is more than Z0 (figure d), the reflected signal is positive (the pulse amplitude increases after t2 seconds). 4.5.2 IDEALISED WAVEFORMS All of these effects can be demonstrated using a delay line, as described in section 7 and are summarised in the figure below which shows idealised pulse waveforms for different terminating impedances (RV2) if the rotor winding was a perfect transmission line.
Figure 4.5.4 Simplified RSO waveforms for different terminating impedances (RV2)

4.6 EXAMPLES OF MEASURED RSO WAVEFORMS FOR WINDING FAULTS 4.6.1 ROTOR WINDING WITH AN EARTH FAULT When an earth fault occurs part way along the winding, the traces that occur are shown as measured, in Fig. 4.6.1 and in simplified form in Fig. 4.6.2.
Figure 4.6.1 Short circuit to rotor body at end of 5th coil slot
(16 coils in winding)
Figure 4.6.2 Simplified input end oscilloscope traces for rotor winding with
earth fault
If a full or partial earth fault occurs between the winding and the rotor body, the pulse which is injected from the end nearest the fault is seen to increase to a peak at the fault and then to decay rapidly. The RSO pulse injected from the end furthest from the fault increases and decays some time later, as the pulse injected from the remote end takes a longer time to reach the position of the fault. At the short circuit to earth, the input pulse is reflected with reverse polarity and when it returns to the input end, a decrease in voltage is observed. Assuming that the fault is not exactly in the centre of the winding, the reflection will occur at different positions for the two traces. The traces will therefore diverge as shown in Fig. 4.6.1. The trace that is deflected first corresponds to the end nearest to the fault.

Note that the sharpness and rate of decay of the second peak is considerably less than that for the first peak. This is an example of the general rule that the resolution of the RSO test is greatest near the point of injection of the voltage step (i.e. at the slip rings) and decreases as the position of the fault moves further into the winding. 4.6.2 ROTOR WINDING WITH AN INTERTURN FAULT If there is an interturn fault, the waveform at the end nearest the fault is characterised by a slight increase in voltage followed by a decrease down to a minimum, followed by a slow voltage rise. A similar effect occurs for the waveform at the end furthest from the fault (although to a lesser degree) and the two waveforms meet up again to produce an oscilloscope trace which contains a characteristic loop as shown below. The faulty winding corresponds to the waveform which gives rise to the lower part of the first major loop shown in figure 4.6.3 below.
Figure 4 6.3 Measured waveforms for a rotor winding with a single shorted turn.
Short circuit applied between outer 2 turns in 5th slot coil

4.6.3 RSO PULSE PROPAGATION AT A SHORTED TURN The shape of the RSO waveforms for an interturn fault can be explained by considering the effect on the incident pulse of a single shorted turn, as shown in the figure below.
Figure 4.6.4 Simple representation of a shorted turn
When the RSO pulse reaches the short circuit between the turns, it can take one of 3 paths in the forward direction, instead of a single path in the fault-free case. The impedance that the voltage step sees looking in the forward direction will therefore be Zo/3, where Zo is the characteristic impedance of the winding This causes the transmission line impedance to decrease at this point and a proportion of the pulse will be reflected with opposite polarity to the incident voltage step, leading to a decrease in voltage when observed at the input end. However, the rest of the pulse will propagate away from the short circuit and two of the three paths available (round the shorted turn) will return the pulse to the point of the short circuit. Part of this voltage will then be returned to the input end of the winding leading to an Increase in voltage. The part of the pulse which travels round the shorted turn will do so continuously, causing the energy to be returned to the main rotor winding over an extended period of time. Because there are always multiple reflections within the rotor winding caused by different characteristic impedances between the slot and end regions, the square pulse injected at the input ends of the winding becames distorted, resulting in a complex waveform, even when no faults are present. Consequently the relatively small effect of a shorted turn on the RSO pulses viewed at either end of the rotor windings would be difficult to observe. However, this is where the rotor symmetry helps. Unless the fault is at the centre of the winding, the pulse injected from end 1 will always encounter the fault at a different time from that injected from end 2. So by plotting and comparing the amplitudes of the RSO waveforms against time at the input ends of the rotor windings, it is possible to detect and locate the fault. Further information is given in the following examples of example RSO waveforms. A further effect results from the rotor winding geometry. If the time to an apparent inter-turn fault is plotted against the coil number containg the fault, the result is not a

straight line. This is because the length of each individual coil depends on its coil number and radial location within the coil. 4.6.4 ROTOR WINDING WITH A HIGH RESISTANCE JOINT
Figure 4.6.5 RSO waveforms for a high resistance joint at start of winding The effect of a high resistance joint at the start of one of the windings is shown in figure 4.6.5 above. The apparent characteristic impedance of the end of the winding nearest the fault is increased relative to that of the other end of the winding. Hence the upper trace corresponds to the end of the winding nearest the fault. It is possible that the fault may be caused by a high resistance joint at one slip ring. In this case,
the fault may be confirmed by placing a variable 0 - 500Ω resistor in series with the lead to the other slip ring and adjusting this variable resistor. If it is possible to make the traces coincide by these means, then the fault occurs very close to the first slip ring. 4.6.5 ROTOR WINDING WITH A MAJOR WINDING FAULT
Figure 4.6.6 RSO waveforms for a short between an upshaft lead and coil 5
It is possible for faults to occur between rotor slot coils and the upshaft leads which connect the slip rings to the ends of the rotor winding. Figure 4.6.6 shows an example of a fault of this type, in which the upshaft lead had shorted to the fifth coil in

the winding, effectively shorting out the first five coils in a total winding of sixteen coils. The lower trace corresponds to the slip ring nearest the shorted coils. 4.6.6 OTHER CAUSES OF NON-IDENTICAL RSO WAVEFORMS Apart from these common faults, there are circumstances where, in applying the test, problems occur which may indicate that a good rotor is faulty. These may be caused by: i) Poor contact between the slip rings and the test leads. If this occurs, the traces will resemble figure 4.6.5, the difference between the traces being dependent on the magnitude of the contact resistance. If this occurs, the contact between the test leads and the slip rings should be checked before assuming that the rotor winding is faulty. ii) Poor contact between the earth lead and the rotor shaft. Again, the cure is to re-check the contact resistance. iii) The characteristic impedance of both rotor half windings are not identical. On the face of it, this seems most improbable. However, it may be caused by a previous repair to one half winding using insulation different from that used during manufacture. Moreover, when the end rings are removed, the end windings expand radially in a non-uniform manner, causing the winding impedances to differ. Consequently, two slightly different traces are nearly always obtained when one or both end rings are removed. 4.6.7 LOCATING THE POSITION OF WINDING FAULTS. There are 2 basic methods for locating winding faults iusing the RSO test. 1. Using time scaling to compare the time for the pulse to travel to the point of divergence of the 2 input end waveforms with the time taken for it to pass through the entire winding. 2. Applying a shorted turn to the fault-free half-winding until the 2 half-winding waveforms are identical (or nearly so). These techniques are decribed in detail in section 7. 4.6.8 SENSITIVITY OF RSO TEST 1. The effect of shorting out a single turn produces a maximum difference in the input end waveforms when the shorted turn is close to the start of the winding. 2. As the location of the fault is moved towards the centre of the winding, the measurement sensitivity decreases. 3. The RSO test is particularly sensitive and will detect a relatively high resistance (a few ohms) interturn fault that may, in practice, not carry current in an operational state. Further tests involving measuring the voltage drop across adjacent turns by

passing a large direct current through the total winding or a flux coil test must be carried out to determine whether the fault is current-carrying or not. 4.6.9 TEST CONDITIONS For complete confidence in the integrity of a rotor winding, the RSO test should ideally be carried out with the rotor both at rest and at speed, because even if no winding faults are found on a stationary rotor, faults may still develop at speed. It is therefore prudent to test all rotors at speed as well as at rest if possible, to ensure the rotor is completely free from winding faults. In a perfect world, the RSO test waveforms will indicate that the rotor winding is fault-free (identical waveforms). However if this is not the case, careful consideration needs to be given to what, if any remedial action is taken. In general, the outcome will depend on whether the test has been carried out in a manufacturer or repairer’s works or whether the test is conducted in a Power Generation plant. One of the major advantages of the RSO technique is that it is a low-voltage test method and can be safely left running on a rotor winding while it is under repair. Consequently, it is particularly valuable when carried out in the premises of a manufacturer or repairer because any winding faults that are found can be quickly located and remedied. Moreover, many Plant Operators insist on witnessing RSO tests at manufacturers' premises before agreeing to take delivery of new or repaired rotors. In contrast, if a winding fault is detected on a rotor in service at a Power Utility company, the choices are more complex, because of the cost of lost generation as well as the cost and complexity of any repair work. It has been reported that as many as 50% of all rotors tested using the RSO test show evidence of winding faults.

5 SIMULATING A REAL ROTOR WINDING USING A DELAY LINE 5.1 OVERVIEW Before preparing to carry out an RSO test on a real rotor at a test site. it is helpful to be able to check that the RSO test equipment is functioning correctly. However, as it is usually not possible to access a real rotor for this purpose, an alternative test device is needed. Fortunately, the electrical characteristics of a rotor winding can be approximated using a simple electrical delay line. This can also be used for demonstrating the RSO test method in the absence of a real rotor. The Rowtest DL100 Delay line is a custom Delay line which has been designed specifically for this purpose. Note that the delay line is not used for measurements on rotors. It is intended for use for demonstration and calibration check purposes only. 5.2 PRINCIPLES OF ELECTRICAL DELAY LINES In its simplest form, an Electrical Delay line consists of a number of Inductor/capacitor sections as shown in the figure below. This delay line has 5 sections.
Figure 5.1 Simple 5 - section Delay line
In most delay lines, the individual inductors and capacitors have the same values eg L uH and C uF, where the units uH are microhenrys and uF are microFarads.
If an electrical pulse is applied between the input end terminals, it will emerge at the output end after a finite time delay T. The delay time through one section of the delay line is given by the equation:
t = √ (L.C) Seconds (1)
The delay line also has a well-defined characteristic or wave impedance Z0 which is given by the equation:
Z0 = √ (L/C) Ohms (2)
For example, if L = 100uH and C = 0.01uH and applying equations 1 and 2, the values of t and Z0 are: t = 1uS per section and Z0 = 100 Ohms.
INPUT OUTPUT

5.3 THE DL100 DEMONSTRATION DELAY LINE
The DL100 delay line unit is a 10 section lumped component L/C delay line with component values L = 100uH and C = 0.01uH. Consequently, the unit has a
characteristic impedance Z0 of 100Ω and the delay time for a single pass through the
unit is 10µS. The DL100 unit is shown in figure 5.2 below.
Figure 5.2 Delay line type DL100
The junctions between each section of the delay line are connected to a series of white 2mm sockets, enabling external connections to be made to these points using a patch lead. The input and output ends of the unit are connected to 4mm sockets as shown above. The equivalent electrical circuit is shown in figure 5.3.
The capacitor and inductor values must be carefully selected in matched pairs to retain the symmetry needed for the RSO test. That is, C1 = C13 exactly, C4 = C10 and L1 = L10 etc. This is very important, otherwise the 2 RSO waveforms will not be identical.
In use, the DL100 Delay line is connected to the Reflectometer using a 3-core colour-coded test lead. Simulated earth and inter-turn faults can be applied by using a patch lead to connect the junctions of the delay line sections to ground or by shorting out individual sections. The delay line can therefore be used to confirm that the RSO equipment is working correctly (only one visible waveform if no simulated faults are applied, or 2 different waveforms if an earth or inter-turn fault is applied). Examples of the RSO waveforms obtained obtained using a TDR200 reflectometer operating in its analogue mode using a DL100 delay line are shown in the next section.
GREEN GREEN
L1 L10
Figure 5.3 DL100 Delay line circuit

5.4 SIMULATED RSO WAVEFORMS OBTAINED USING A DL100 DELAY LINE The RSO waveforms shown in this section were all obtained using a TDR200 reflectometer operating in its analogue mode. In each case, both the waveforms at each end of the delay line are shown superimposed.
Figure 5.4.1 RSO Delay line Waveforms with R1 = R2 = 100 Ohms.
Figure 5.4.1 shows the waveforms at the input (a) and output (b) ends of the delay line when the input and output impedance-matching resistors R1 and R2 have been set equal to the characteristic impedance of the delay line (R1 = R2 = Z0 = 100 Ohms). In this case there is no reflection of the RSO pulse at the end of the delay line and the RSO pulse reaches the output ends of the delay line after t1 seconds.
Figure 5.4.2 RSO Delay line Waveforms with R2 mismatched. In contrast to the previous figure, fig. 5.4.2 (c) shows the input end traces when the delay line output ends are terminated in a near short circuit (RV2 = O). The RSO pulse starts to decrease in amplitude after a time t2 seconds, which is the time for the pulse to pass through the delay line winding once and then back again. Similarly, Figure 5.4.2(d) shows the input end traces when the output ends are terminated in an open circuit. In this case, the RSO pulse starts to increase after t2 seconds.
t1
t1
t2 t2
t2

Figures 5.4.2(c) and 5.4.2(d) show that the values of the input and output matching resistors R1 and R2 change the overall shape of the RSO waveforms, but that both superimposed waveform remain identical. It is not possible to produce two different input end waveforms for a healthy rotor by maladjustment of the Reflectometer or oscilloscope controls and hence the possibility of misinterpreting traces caused by operator error is greatly reduced.
Figure 5.4.3 RSO Delay line Waveforms with earth and interturn faults applied.
Figure 5,4,3 shows what happens when deliberate earth and interturn faults are applied to the delay line using the patch lead, This causes 2 non-identical RSO waveforms to be displaid under fault conditions. 5.5 USE OF THE TRACE IDENTIFIER BUTTONS As a healthy rotor will produce 2 identical superimposed waveforms, the trace identifier buttons on the test equipment should always be used to confirm the presence of both waveforms before recording test results.
Figure 5.5.1 RSO waveforms with no applied fault with one trace ID button pressed.
Further information about using the DL100 delay line is given in the TDR200 instruction manual.

6. THE TDR200 ROTOR REFLECTOMETER MEASUREMENT SYSTEM 6.1 OVERVIEW This section gives detailed information about the ROWTEST TDR200 Rotor RSO Reflectometer, which is an enhanced version of the original CDL TDR100 model which has been used for carrying out RSO tests for over 30 years. The RSO test method is based on injecting low-voltage pulses through impedance-matching resistors between each end of the rotor winding and ground and comparing the resulting waveforms at each end of the winding. These waveforms should be identical for a good rotor winding, but will differ if a winding fault is present.
The TDR200 unit operates under mains power, or alternatively from an internal rechargable battery which gives at least 8 hours of continuous operation of the unit between charges. It can be used in two alternative operating modes: 1. In Digital mode where the waveforms are controlled by and displayed on a Control PC. This is the default mode of operation
Figure 6.1(a) The TDR200 RSO Rotor Reflectometer measurement system in digital mode
In digital mode, the RSO waveforms are captured directly to a Laptop PC, where they can be saved as either bit-map images or as text files.
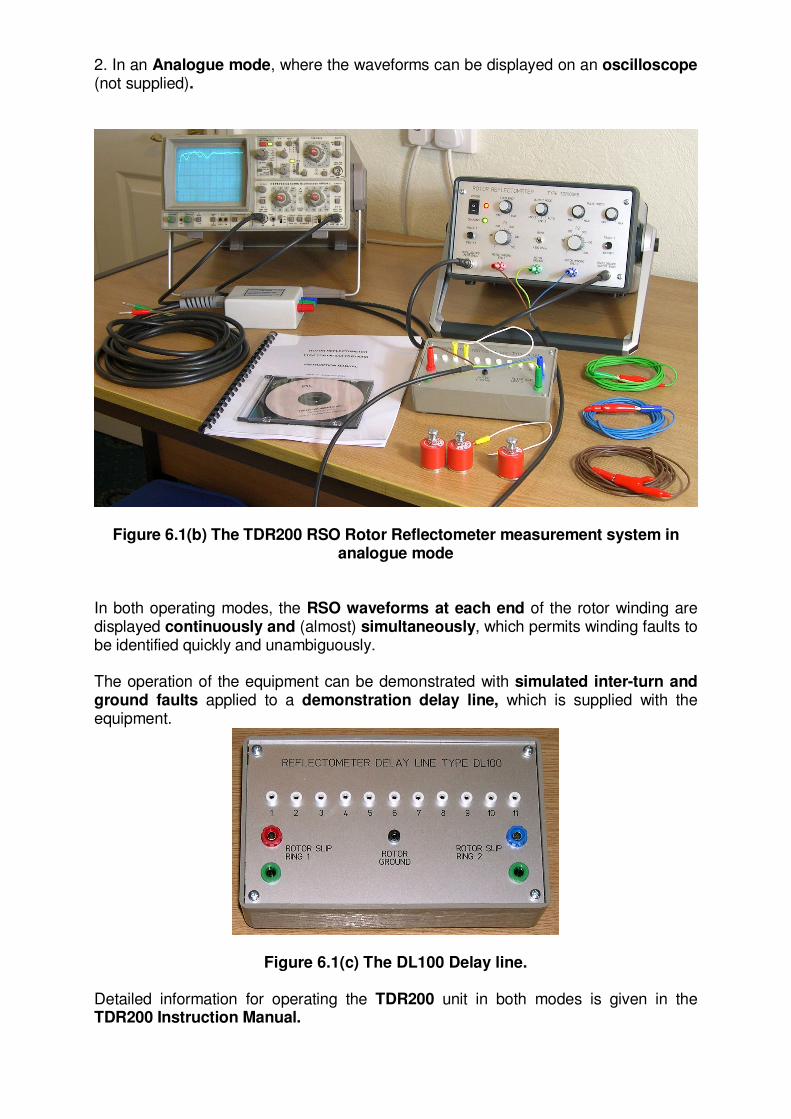
2. In an Analogue mode, where the waveforms can be displayed on an oscilloscope (not supplied).
Figure 6.1(b) The TDR200 RSO Rotor Reflectometer measurement system in analogue mode
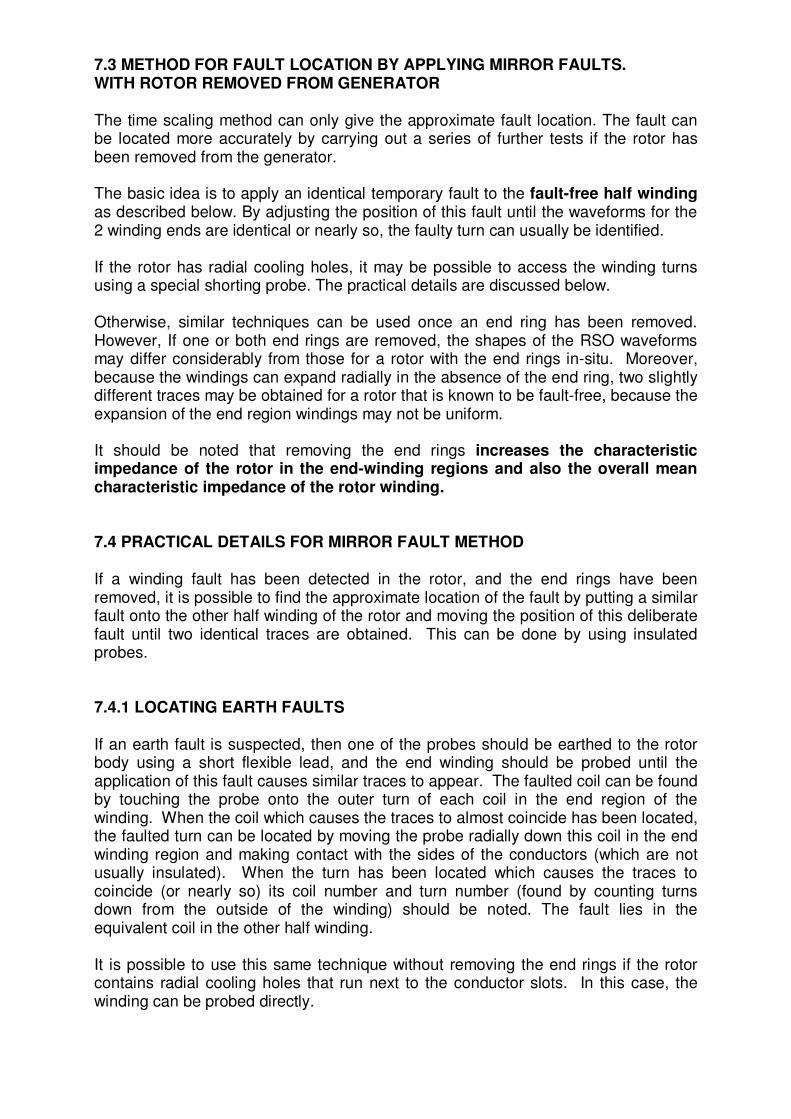
In both operating modes, the RSO waveforms at each end of the rotor winding are displayed continuously and (almost) simultaneously, which permits winding faults to be identified quickly and unambiguously. The operation of the equipment can be demonstrated with simulated inter-turn and ground faults applied to a demonstration delay line, which is supplied with the equipment.
Figure 6.1(c) The DL100 Delay line.
Detailed information for operating the TDR200 unit in both modes is given in the TDR200 Instruction Manual.

6.2 OPERATING PRINCIPLE The operating principle of the Rowtest TDR200 Rotor reflectometer is based on the method described in section 4.2. However, the TDR200 unit contains an additional fast double-pole electronic changeover switch which allows the RSO pulses to be injected alternatively at each end of the rotor winding as described below.
Figure 6.2 TDR200 Reflectometer operating principle
A 12V pulse generator having a variable pulse width and repetition rate is
connected via a 500ΩΩΩΩ variable resistor (R1) to an electronic changeover switch S1 synchronised to the pulse repetition rate. The changeover switch enables the rotor winding to be excited from each end of the winding in turn, with alternate pulses exciting the rotor from opposite ends of the winding. The pulse repetition rate and pulse length are adjustable. The rotor winding is terminated in a second variable resistor (R2) via the changeover switch. The values of R1 and R2 are chosen to match, approximately, the characteristic wave impedance of the rotor winding, to minimise reflections of the pulse at each end of the rotor. The synchronous changeover switch first excites the rotor via R1 at end 1 (the Input end) and the pulse propagates along the rotor winding, emerges at end 2 (the output end) and is absorbed by R2. The changeover switch then operates and the next pulse excites the winding at end 2 (again via R1), propagates through the winding to end 1 and is again absorbed in R2. The changeover switch returns to the first condition and this sequence is repeated continuously. Hence successive pulses from the pulse generator excite the rotor from each end in turn and the pulse is always supplied via R1 and absorbed by R2. The changeover switch is arranged to operate approximately half way in time between successive pulses so that the operation of the changeover switch does not adversely affect the leading edge of the pulse. The signal monitored between S1a and earth as shown in figure 6.2 will therefore display two alternating waveforms corresponding to the signals applied to each end of the rotor. These can be displayed as superimposed waveforms on an oscilloscope or PC screen as described later.

6.3 OPERATING MODES AND RSO WAVEFORMS In its normal Digital mode of operation, the TDR200 unit captures and digitises the RSO waveforms at 64-bit resolution and displays them on the screen of a Control PC. However, if required, the TDR200 can also be used in an alternative Analogue mode with an oscilloscope. Detailed information about these operating modes is given in the TDR200 instruction manual. Because the changeover switch operates at a relatively high speed (around 250Hz), the 2 superimposed RSO waveforms appear as continuous waveforms on the oscilloscope or PC screen, allowing any differences between these 2 waveforms to be viewed in real-time. The RSO waveforms at the input ends of the winding are used to detect and locate winding faults.
Figure 6.3.1 RSO waveforms at input ends of fault-free winding in digital mode
The waveforms at the output ends of the winding are used to measure the characteristic impedance of the rotor winding and the time taken for the RSO pulse to travel through the rotor winding from the input to the output ends (the single-pass transit time).
Figure 6.3.2 RSO waveforms at output ends of fault-free winding in digital mode

The Reflectometer is set up as follows: The width of the RSO pulse is first set to be greater than 2 x the single-pass transit time. The values of the pair of adjustable input and terminating impedance matching resistors (R1 and R2) are then set to match the characteristic (wave) impedance (Z0) of the rotor winding as described in section 6.4. Z0 is typically in the range 30 - 1000 Ohms and so an additional switch on the TDR200 front panel is provided which allows a pair of fixed 500 Ohm resistors to be switched in series with both R1 and R2 to extend the impedance matching range if required. This set-up procedure ensures that the rotor winding is tested under repeatable conditions and also minimises multiple reflections of the pulse within the winding. If the rotor winding is fault-free, two perfectly superimposed traces will be displayed. If this occurs (and the existence of 2 traces is confirmed by use of the Trace ID buttons, see below) then the rotor winding can be safely assumed to be fault-free. It is important to always check that 2 identical superimposed waveforms are displayed by depressing one of the trace identifier buttons on the TDR unit. This displaces one of the traces vertically downwards to confirm the existence of two separate waveforms as shown in figure 5.5.1. If two perfectly superimposed traces are not obtained, there may be a fault in the rotor winding. Section 4.6 explains in detail the waveforms to be expected for various types of faults. In normal use, it is almost impossible to incorrectly set the TDR100/200 Rotor Reflectometer hardware and software controls so that two non-identical RSO waveforms are generated for a fault-free rotor winding. However, as mentioned above, it is preferable to set these controls in a standard way, as this allows measurements carried out on similar rotor windings at different times to be easily compared. The following sections describe in detail how the impedance matching controls are set and optimised.

6.4. SETTING THE VALUES OF R1 AND R2
6.4.1. OVERVIEW When carrying out RSO measurements on an unknown rotor winding, it is important to measure the characteristic impedance of the rotor winding and also the single-pass transit time (SPT). Once these values are known, the RSO waveforms can be displayed and viewed in a standardised format which facilitates comparison with results obtained for other similar rotors.
Figure 6.4.1 Basic RSO measurement circuit
6.4.2. MEASURING THE ROTOR CHARACTERISTIC IMPEDANCE (Z0) The approximate rotor characteristic impedance value can be measured as follows: The details are given for the TDR200 unit in digital mode but are similarly applicable when it is operated in analogue mode, in which case, references to the PC screen should be replaced by "oscilloscope screen". The basic idea is to set the value of R1 (RV1 in the above figure) so that the height of the RSO pulse at the start of the waveform monitored at the input ends is approximately half its height when RV1 is set to zero. In this case, the value of RV1 will equal (approximately) the characteristic impedance of the rotor winding Z0. The controls on the TDR200 unit should be set as follows: Pulse width switch: minimum Pulse width potentiometer: maximum (fully clockwise) On the PC screen, set the Control window Measurement Channel to monitor the Input ends of the winding. With the Vertical scaling factor in the Control window set to a value of 1.6, adjust the R1 (input impedance) control on the TDR200 front panel so that the pulse displayed in the Plot window is approximately 80% of the Plot window height, as shown in figure 6.4.2. Note: In analogue mode, set the pulse frequency to maximum and adjust R1 so that the pulse height is approximately half its height when R1 = 0. In both modes, this value of R1 is the approximate characteristic impedance of the rotor winding in Ohms. Now set R2 to this same value.

Figure 6,4.2 shows the RSO waveforms at the input ends of the winding for a fault-free rotor winding with R1 and R2 set to the correct values. There are 2 perfectly superimposed red and blue waveforms. The green horizontal waveform plots the difference between these 2 waveforms.
Figure 6.4.2 RSO input end waveforms with R1 adjusted correctly 6.5 MEASURING THE SINGLE-PASS TRANSIT TIME. On the PC, set the Control window Measurement Channel to monitor the Output ends of the winding. Adjust the Control panel Plot window width and also the Pulse width controls on the front panel of the TDR200 unit until a waveform similar to that shown in figure 6.5.1 is obtained.
Figure 6.5.1 RSO waveform at output ends
Click on the Pause button in the Plot window, which will stop the scanning. Now click the mouse pointer at the point near the start of the output waveforms (where the waveform starts to increase). This will generate a white time cursor line as shown in figure 6.5.1 and the time at the cursor position will be displayed.

Note the time displayed for the cursor (in this case, 24.8uS). This is the time in microseconds for the pulse to pass through the rotor winding from one end to the other and is known as the Single-pass transit time (SPT). Note: In analogue mode, use the oscilloscope time base controls to measure the SPT. 6.6. OPTIMISING THE VALUE OF R2. The next step is to measure and set the correct value for the terminating impedance R2. This should be similar to that of the input impedance, R1. However, it is possible to measure it more accurately as described next. Reset the Control window Measurement Channel to monitor the Input ends of the winding. Set the Display width in the Plot window to be approximately 2 x SPT + 16 uS. So in the above case, where SPT is 24.8uS, this figure becomes 65.6 uS. The nearest settable value to this figure is 64 uS, so this value should be used. On the TDR200 front panel, set the value of R2 = 0.5 * R1 and set the PC to display the input end waveforms. (Note that R1 and R2 are shown as RV1 and RV2 in figure 6.4.1.) If necessary, adjust the pulse width controls on the TDR200 unit until the waveforms are similar to those shown in figure 6.6(a) below. Notice that the waveform amplitude decreases approximately 2 x SPT after the start of the input pulse. This is caused by the RSO pulse being reflected with negative polarity due to the impedance mismatch at the end of the winding.
Figure 6.6(a) Typical input end Figure 6.6(b) Typical input end end waveforms with R2 set to waveforms with R2 set to 2X set to half R1 value. R1 value. Now reset the value of R2 = 2 * R1 and display the input end waveforms. These should be similar to those shown in figure 6.6(b). In this case, the waveform amplitude increases because the pulse is reflected with positive polarity from the end of the winding.

Note that: If R2 is set to be > R1, the reflected signal is positive and adds to the input waveform. If R2 is set to be < R1, the reflected signal is negative and subtracts from the input waveform. Now adjust R2 so that there is no reflected signal after 2 x SPT. This is the correct setting for R2 and is the characteristic wave impedance of the rotor winding. If necessary, adjust the setting of R1 so that it is the same as R2 to finish the impedance matching at the input ends. This minimises the possibility of multiple reflections from one end of the rotor to the other. It may now be necessary to adjust the display vertical sensitivity controls to optimise the trace size relative to that of the screen. Finally, adjust the TDR200 pulse width control so that the waveforms resemble those shown in figure 6.7.
(a) Input end waveforms (b) Output end waveforms
Figure 6.7 Correct RSO waveforms for a fault-free rotor winding.

7 LOCATING WINDING FAULTS 7.1 LOCATING FAULTS USING TIME SCALING In principle, the location of the first fault (nearest to either slip ring) in any winding can be found by measuring the time to the point of waveform divergence (t3 in the simplified figure 7.1b below) and comparing this with t2 which is 2 X the single-pass transit time t1 (the time taken for the pulse injected at one end of the rotor winding to travel through the winding to the other end). t1 is measured by viewing the output end waveforms as described in sections, 4.4, 6.5 and figure 7.1(a) below
Figure 7.1(a) Measurement of single pass transit time t1
Figure 7.1(b) Measurement of time to fault (t3)
Figure 7.1 Approximate Location of fault by time scaling By linear scaling, the fault will be approximately t3 /( 2t1 ) x 100% of the winding from one end, However, this only gives a rough rough estimate of the position of the fault for the following reasons: The rotor winding is an imperfect transmission line in a number of respects. The characteristic impedance is relatively low in the slot regions and higher in the end ring regions. Consequently, the winding consists of multiple sections in series, each having differing characteristic impedances and propagation velocities. At each change in impedance, there will be a partial refelection of the RSO pulse and this results in a complex waveform observed at the input ends of the winding.
t3
t=0

The winding is also lossy at the RSO pulse frequencies, resulting in attenuation and distortion of the pulse. In addition other (non-transmission line) modes of propagation exist. The dominant one is caused by direct capacitive coupling between adjacent winding turns. These modes travel at different speeds from the main mode and further distort the output pulses. Consequently, it can often be unclear where to measure the time t3 at which the waveforms diverge at the fault location, 7. 2 IMPROVING THE TRANSIT TIME ESTIMATE 7.2.1 THE EFFECTS OF WAVEFORM DISTORTION The input and output end waveforms for a fault-free rotor winding are shown below.
(a) Input end waveforms (b) Output end waveforms
Figure 7.2 RSO Pulse distortion. The pulse applied by the TDR200 via R1 is a true square waveform. However, at the output of the impedance-matching resistor R1, it has become distorted because of reflections at the multiple impedance changes within the winding, as shown in figure 7.2(a) above. By the time it has travelled to the far end of the winding, it has become a pulse with a slowly-increasing leading edge, as shown in figure 7.2(b). Because of the progressive distortion of the pulse as it travels along the rotor winding and also because the winding lengths of the turns in the different coil slots are not equal, the effective pulse transit time through the rotor winding does not increase linearly with either the turn or coil number. This can be confirmed by measuring and comparing both the single-pass (SPT) and the double-pass (DPT) transit times. The DPT is the time taken for the pulse to travel through the winding and back again to the input end. It is measured by monitoring the input end waveforms and adjusting the value of the output end matching resistor to cause a deliberate impedance mismatch, as described in section 4.5. The Double-pass transit time t2 is normally longer than 2 x the Single - pass transit time, indicating that the effective pulse speed of propagation appears to slow down as the pulse travels further along the rotor winding.

The effect of this is that the pulse appears to travel further per unit time near the start of the winding and less far as it reaches the far ends of the winding. A method for compensating for this effect is described in the next section 7.2.2 IMPROVED TRANSIT TIME CALCULATION One method for dealing with the non-linear transit time problem was proposed by G.A. Elsworth* of the UK Central Electricity Generating Board (CEGB). The basis of the method is to approximate the relationship between the transit time t and the distance travelled through the winding d as a second-order polynomial of the form:
t = A.d + B.d2 (1) where A and B are constants for a specific rotor winding. The values of t and d can be measured for 2 specific values of t (the single and dual-pass transit times SPT and DPT), giving 2 simultaneous equations which can be solved to obtain the vaules of A and B as follows:
SPT = A.d1 + B.d12 (2)
DPT = A.d2 + B.d22 (3)
where d1 is the length of the rotor winding (d) and d2 = 2.d1 = 2.d So the equations become:
SPT = A.d + B.d2 (4)
DPT = 2.Ad + 4.B.d2 (5)
Solving for A and B we obtain:
A = (4.SPT - DPT ) / (2.d) (6)
B = ( DPT - 2.SPT ) / ( 2.d2 ) (7)
Re-arranging equation (1 )
B.d2 + A.d - t = 0 (8) which is a quadratic equation with solution:
d = df = - A +/- SQRT( A2 - 4.B.tf ) / (2.B) (9) So for any measured time to the fault tf, we can use equations 6, 7 and 9 to obtain the distance df of the fault from one end of the winding. In practice, the positive solution of equation 9 gives the correct value of df. * A copy of this paper is given in Appendix 3.
7.3 METHOD FOR FAULT LOCATION BY APPLYING MIRROR FAULTS. WITH ROTOR REMOVED FROM GENERATOR The time scaling method can only give the approximate fault location. The fault can be located more accurately by carrying out a series of further tests if the rotor has been removed from the generator. The basic idea is to apply an identical temporary fault to the fault-free half winding as described below. By adjusting the position of this fault until the waveforms for the 2 winding ends are identical or nearly so, the faulty turn can usually be identified. If the rotor has radial cooling holes, it may be possible to access the winding turns using a special shorting probe. The practical details are discussed below. Otherwise, similar techniques can be used once an end ring has been removed. However, If one or both end rings are removed, the shapes of the RSO waveforms may differ considerably from those for a rotor with the end rings in-situ. Moreover, because the windings can expand radially in the absence of the end ring, two slightly different traces may be obtained for a rotor that is known to be fault-free, because the expansion of the end region windings may not be uniform. It should be noted that removing the end rings increases the characteristic impedance of the rotor in the end-winding regions and also the overall mean characteristic impedance of the rotor winding. 7.4 PRACTICAL DETAILS FOR MIRROR FAULT METHOD If a winding fault has been detected in the rotor, and the end rings have been removed, it is possible to find the approximate location of the fault by putting a similar fault onto the other half winding of the rotor and moving the position of this deliberate fault until two identical traces are obtained. This can be done by using insulated probes. 7.4.1 LOCATING EARTH FAULTS If an earth fault is suspected, then one of the probes should be earthed to the rotor body using a short flexible lead, and the end winding should be probed until the application of this fault causes similar traces to appear. The faulted coil can be found by touching the probe onto the outer turn of each coil in the end region of the winding. When the coil which causes the traces to almost coincide has been located, the faulted turn can be located by moving the probe radially down this coil in the end winding region and making contact with the sides of the conductors (which are not usually insulated). When the turn has been located which causes the traces to coincide (or nearly so) its coil number and turn number (found by counting turns down from the outside of the winding) should be noted. The fault lies in the equivalent coil in the other half winding. It is possible to use this same technique without removing the end rings if the rotor contains radial cooling holes that run next to the conductor slots. In this case, the winding can be probed directly.

7.4.2. LOCATING INTER-TURN FAULTS The position of an inter-turn fault can be located using two probes connected via a length of insulated flexible lead. In this case, adjacent turns of the opposite half-winding are shorted together to locate the fault. The length of the lead connecting the insulated probes should be kept to a minimum to improve the measurement sensitivity. An alternative improved method is to make up a special two-pronged probe to apply the shorts between adjacent turns. An example of this type of probe is shown below.
Figure 7.3 Probe for locating shorted turns This type of probe minimises the impedance of the applied short and gives better measurement sensitivty,

7.5 ESTIMATING THE SINGLE-PASS TRANSIT TIME FROM RSO WAVEFORMS FOR A ROTOR WINDING CONTAINING AN EARTH FAULT
If a rotor winding contains an earth fault, it is not possible to measure the single-pass transit time directly, as the waveforms viewed at the output ends of the winding will be zero traces. It is, however possible to estimate this time by analysing the waveforms reflected from the earth fault at the input ends of the winding to obtain the double-pass transit time. An earth fault will cause the amplitude of the pulse monitored at the input ends of the winding to start to decrease in amplitude, after the time taken for the pulse to reach the earth fault and be reflected back to the input ends of the winding. The waveforms shown in figures 7.5.1 and 7.5.2 were obtained using the Rowtest DL100 demonstration delay line with a deliberate earth fault applied between terminal 4 and ground. The difference waveforms have been turned off in the figures for clarity. The figures display the input end waveforms reflected from the earth fault. and it is clear that the fault is nearest to the Red end (1) of the winding.
Figure 7.5.1 Delay line waveforms with Earth fault applied between terminal 4 and ground In figure 7.5.1, the cursor has been located at the point of divergence between the Red and Blue waveforms and this shows that for the Red waveform, the reflected signal from the fault occurs 5.9uS after the start of the RSO pulse injected at end 1.

Figure 7.5.2 Delay line waveforms with Earth fault applied between terminal 4 and ground In figure 7.5.2, the cursor has been moved to the point at which the Blue waveform starts to decrease in amplitude. This occurs 14.1uS after the start of the RSO pulse injected at the Blue end (2) of the winding . By summing these 2 values, the double-pass transit time will be 5.9 + 14.1 = 20uS. The single-pass transit time will therefore be approximately half this value, ie 10uS.
8. PRACTICAL DETAILS OF RSO TESTING
8.1 OVERVIEW
This and following sections give general information about the how the RSO test can be carried out under a range of scenarios and also the information which should be recorded, based on the use of a TDR200 Rotor Reflectometer.
Detailed specific information about carrying out RSO tests in both analogue and digital modes is given in the TDR200 Instruction Manual. 8.1 SAFETY WARNING The use of RSO test equipment on a rotor installed in an operational generator must be carried out with the explicit permission and under the supervision of the local plant operator. All local safety rules and procedures must be complied with. In particular, the equipment must only be connected to the generator rotor after the field supply has been disconnected and completely isolated from the rotor winding, in accordance with local safety regulations. Failure to comply with this instruction will damage the test equipment and may endanger both the plant and the operator. 8.2 MEASUREMENT OPTIONS There are several situations in which the RSO test can be used: 1) Stationary rotor installed in generator. 2) Rotor at speed in generator. 3) Rotor removed from generator. 4) Rotor under repair 8.3 PRELIMINARY CHECKS In all cases, the rotor winding should first be checked for any obvious problems using a basic low-voltage multimeter as follows: 1. Isolate the rotor winding from the excitation system 2. Measure the resistance between one end of the winding and ground. This should be at least 100K Ohms. Lower values indicate that there may be an earth fault. 3. Measure the resistance between both ends of the winding (eg between the slip rings or up-shaft leads). The resistance should be measured via the test leads to ensure good connections to the rotor winding and should be less than 0.5 Ohms. 4. Record both of these resistance values as described in section 9.5.

9. METHOD FOR TESTING A ROTOR AT REST WHILE INSTALLED IN THE GENERATOR 9.1 OVERVIEW The most straightforward case is when the rotor is at rest in the generator and the test method for this will be described in detail. The other test modes are based on this technique with suitable modifications. 9.2 PREPARING THE ROTOR FOR TESTING Before attempting to connect the Reflectometer to the rotor winding, the rotor winding must be completely isolated from the field supply, as described in the safety warning in section 8.1. If the rotor has slip-rings, it may be necessary to remove all of the brushes to ensure complete isolation of the rotor winding. For rotors without slip-rings, the links to the exciter/rectifier diode wheel must be removed to achieve full isolation. Low resistance connections must be made between the Reflectometer, each end of the rotor winding and also to the rotor shaft. Consequently, it will usually be necessary to clean both the rotor shaft and the slip rings adequately before making these connections. 9.3 CONNECTING THE REFLECTOMETER TO THE ROTOR WINDING 9.3.1 ROTOR WINDING CONNECTION MODULE AND TEST LEADS The connections between the Reflectometer and the Generator rotor winding are made using the Connection module supplied with the equipment. This consists of a 3-core 5m mains lead, terminated in 4mm insulated banana plugs at the Reflectometer end and a Connection box terminated in 4mm insulated terminals at the rotor end. The Connection module and test leads are shown in figure figure 9.1 below.
Figure 9.1 Rotor test leads and connection module

Note: The connection module provides simple 1:1 connectivity between the colour-coded banana plugs and terminals at the reflectometer end and the output terminals on the module. Three x 3m insulated single core leads terminated in insulated crocodile clips are used connect this module to the rotor winding. This arrangement has been used to allow connections to be made to the rotor windings of large generators, where there may be significant distances between the slip rings and the rotor shaft earthing point. It also allows damaged connecting leads to be repaired or replaced easily on-site, or for customers to use their own connecting leads if preferred. If the rotor has slip rings, the connections to the rotor slip rings and earthed shaft can be made by removing the circular steel keepers from the supplied contact magnets (figure 9.2) and placing the magnets onto the cleaned slip rings and the rotor shaft. The crocodile clips can then be attached to the screws on the magnets. 9.3.2 MAKING CONNECTIONS TO THE ROTOR WINDING 1. Isolate and make safe the generator stator winding according to the local site safety regulations. 2. Isolate the rotor winding from the excitation system as follows: Either isolate the field brushgear from the field supply (both sets of brushes), or remove all of the brushes from each brushgear cage, ensuring that none of the brushes touch the slip rings or cages. For a brushless generator, isolate the generator field winding from the rotating rectifier diode wheel unit (both leads). 3. Connect the banana plugs of the individual 3m leads to the output terminals of the Connection Module. Match the plug and terminal colours (red to red etc.). At this stage, do not connect the other end of the 5m test lead to the Reflectometer terminals.
Figure 9.2 Contact magnets and keepers. 4. Clean an area of rotor shaft adjacent to the slip rings with emery cloth, followed by a degreasing solvent and wipe off with a clean rag. Remove the magnetic keeper and attach one of the terminal magnets supplied (see figure 9.3 ) to the shaft at this point. 5. Connect the crocodile clip of the green conductor of the 3m Green test lead to the screw stud on this magnet.

6. Attach the crocodile clips of the brown and blue 3m test leads to each end of the rotor field winding as follows: If it has been possible to isolate the brushgear cages from the field supply, then simply connect these leads to each brushgear cage assembly (clip the crocodile clip on to one of the brush braids). If the brushes have been removed, clean a small area on each slip ring with degreasing solvent and attach the two remaining magnets to the slip rings. Attach the brown and blue leads to the terminal studs on these magnets using the crocodile clips. For the case of a brushless generator, clip the brown and blue leads directly to the up-shaft field winding leads after the isolating links have been removed. Figure 9.3 shows the TDR200 Reflectometer connected using magnets to the slip rings and earth shaft of a rotor which has been removed from its stator.
Figure 9.3 TDR200 Relectrometer connected to a rotor for a static RSO test

10. Using a low-voltage electrical test meter, measure the rotor winding resistance between the red and blue banana plugs at the Reflectometer end of the 5m rotor test lead. This should be typically less than one ohm, including the resistance of the leads. Note that the loop resistance of the supplied connecting lead set is approximately 0.25 Ohms. If the measured resistance is greater than one ohm, check the contact resistance between the clip ends of the brown and blue leads and the field winding. If magnets are being used, remove them and reclean the slip ring and magnet faces if necessary. Record the measured winding resistance. 8. Check the contact resistance of the earth magnet to the rotor shaft by measuring the resistance between the green banana plug at the Reflectometer end and a point on the rotor shaft near the magnet. If the resistance exceeds one ohm, reclean the shaft and the magnet face and repeat until a low contact resistance is obtained. 9. Using a low-voltage electrical test meter, measure the insulation resistance of the rotor between either one of the the red or blue banana plugs and the green
banana plug. A healthy rotor will have an insulation resistance in excess of 1MΩ,
although if the winding is damp, this may be reduced to 10KΩ or less. Record the insulation resistance. 10. Now connect the red and blue plugs of the 5m test lead to the same colour terminals on the Reflectometer front panel (slip ring 1 and 2 terminals) and connect the green plug to the green earth terminal on the Reflectometer (see figures 9.4 and 9.5). 11. Record the measured rotor winding resistance Rw Ohms and the insulation resistance Ri Ohms. Note that the delay line is not used for measurements on rotors. It is intended for use for demonstration and calibration check purposes only. 9.4 SETTING UP THE TEST EQUIPMENT Connect the rotor winding to the TDR200 using, the long connection lead and connection module as described above. The overall connection diagrams for operation in digital mode is shown in figure 9.4 and in analogue mode in figure 9.5. For detailed step-by-step instructions for carrying out an RSO test with the TDR200 unit in both analogue and digital modes please refer to the TDR200 Instruction manual. Once the RSO test has been completed, the results should be recorded as described in section 9.5.

Figure 9.4 Connection diagram for PC digital control mode
In analogue mode, the equivalent connection diagram is shown in figure 9.5.
Figure 9.5 Connection diagram for analogue mode

9.5 RECORDING THE RSO TEST RESULTS 9.5.1 USING A WORD TEMPLATE Figure 9.6 suggests one possible format for recording the test results which includes the above resistance measurements described in section 8.3. A blank template for this document is given in Appendix 1 and is also included as an MS Word document in the TDRPLot software supplied with each TDR200 system. The test results in .bmp format (see below) can then be copied and pasted into the word document (they will need to be resized). 9.5.2 AS DIGITAL FILES The input and output end waveforms shown in section 8.5 figure should be saved to both .bmp (bitmap) and .txt (text) files having unique file names which allow the rotor to be identified. This will happen automatically if the Rotor ID has been entered correctly in the TDRPlot Control window and the Save button has been used in the Plot window. These files should then be copied to a unique folder on the PC and transferred to a suitable PC filing system for future reference, along with the Word results file.

ROTOR WINDING RSO TEST REPORT
LOCATION: Wilmslow PS TEST DATE: 1-1-1999 ROTOR TYPE: Cylindrical RATING MW: 500MW MANUFACTURER: GEC DATE OF MANUFACTURE: 1966 NUMBER OF POLES: 2
(a) Input end waveforms (b) Output end waveforms
EXCITATION METHOD: SLIP RINGS? ROTATING RECTIFIER?
TEST CONDITIONS
IN STATOR AT REST AT SPEED REMOVED FROM STATOR
END RINGS: IN SITU REMOVED
MEASURED WINDING RESISTANCE: 0.4 OHMS MEASURED INSULATION RESISTANCE: 1.5 M OHMS SINGLE-PASS TRANSIT TIME (FROM OUTPUT END WAVEFORMS) T1 24.8 uS: DOUBLE-PASS TRANSIT TIME (FROM INPUT END WAVEFORMS) T2 51 uS: COMMENTS ON TEST RESULTS
No winding faults detected
FIGURE 9.6 ROTOR RSO TEST REPORT
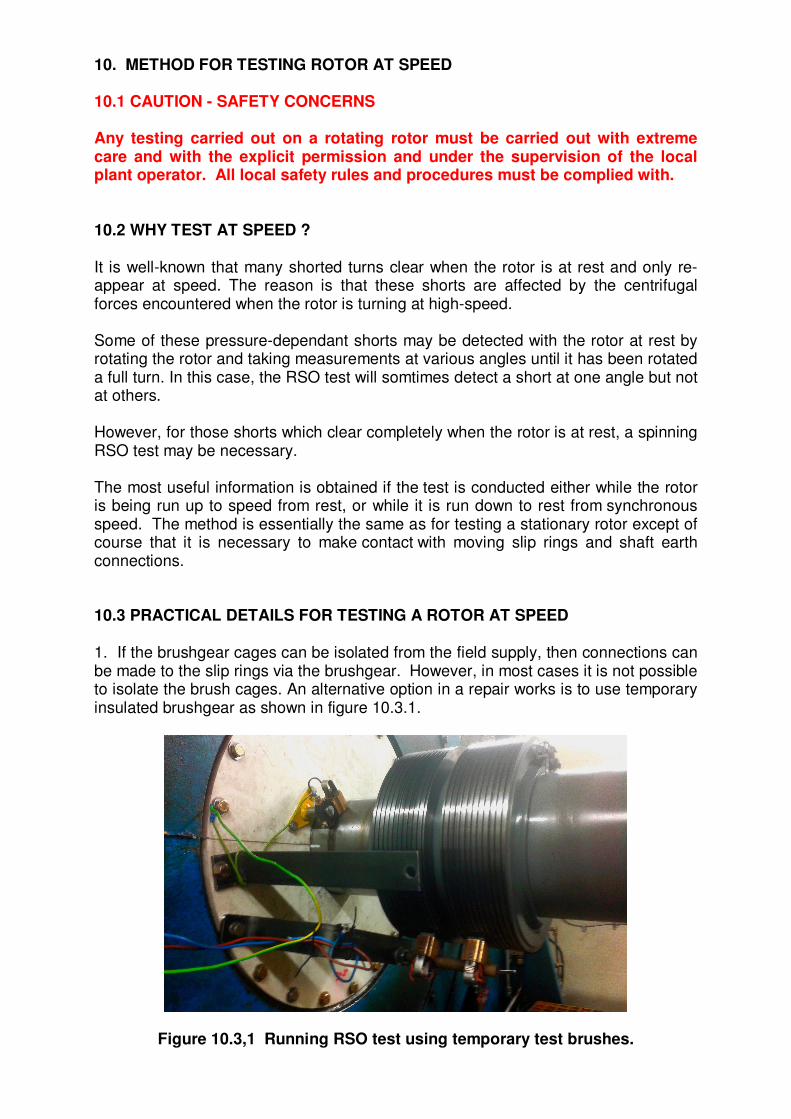
10. METHOD FOR TESTING ROTOR AT SPEED 10.1 CAUTION - SAFETY CONCERNS Any testing carried out on a rotating rotor must be carried out with extreme care and with the explicit permission and under the supervision of the local plant operator. All local safety rules and procedures must be complied with. 10.2 WHY TEST AT SPEED ? It is well-known that many shorted turns clear when the rotor is at rest and only re-appear at speed. The reason is that these shorts are affected by the centrifugal forces encountered when the rotor is turning at high-speed. Some of these pressure-dependant shorts may be detected with the rotor at rest by rotating the rotor and taking measurements at various angles until it has been rotated a full turn. In this case, the RSO test will somtimes detect a short at one angle but not at others. However, for those shorts which clear completely when the rotor is at rest, a spinning RSO test may be necessary. The most useful information is obtained if the test is conducted either while the rotor is being run up to speed from rest, or while it is run down to rest from synchronous speed. The method is essentially the same as for testing a stationary rotor except of course that it is necessary to make contact with moving slip rings and shaft earth connections. 10.3 PRACTICAL DETAILS FOR TESTING A ROTOR AT SPEED 1. If the brushgear cages can be isolated from the field supply, then connections can be made to the slip rings via the brushgear. However, in most cases it is not possible to isolate the brush cages. An alternative option in a repair works is to use temporary insulated brushgear as shown in figure 10.3.1.
Figure 10.3,1 Running RSO test using temporary test brushes.

2. If the brush cages cannot be isolated, or temporary test brushes as shown in figure 10.3.1 cannot be used, then it is necessary to remove all of the brushes from the cage and install insulated brushes that have been previously prepared. In anticipation of the test, three brushes per slip ring should be removed from the cages and marked so that they can be reinserted in the positions from which they have been removed. The removed brushes must be machined undersize and insulated as described in section 10.3.1 before being replaced in the brush cages. 3. Experience has shown that it is necessary to use brushes that have been in service in the machine and which have been passing current. This technique does not work if new brushes are used because these give very poor contact with the slipring for the low-voltage RSO pulses. The insulated brushes should therefore be installed in the machine a few days prior to the test. 10.3.1 PREPARING A SET OF INSULATED BRUSHES This work must be carried out several days before a running RSO test can be carried out. 1. Remove 3 brushes per slip-ring from the in-service generator to be tested, label them 1-6 and note their locations so that they can be replaced in the same positions in the brush cage. 2. Replace the missing brushes with new ones and continue to run the generator. 3. Obtain some suitable insulating material (eg Tufnol or epoxy sheet) which can be glued to the sides of the removed brushes. 4. Machine the brushes undersize (to suit the thickness of the insulating material) so that when the insulating material is glued to the sides of the brushes, the insulated brushes are slightly larger than the internal dimensions of the brush holders. 5. Cut the insulating material to size so that when it is assembled to the brush, the arrangement will be as shown in figure 10.3.2. 6. Glue the insulation to the sides of the undersize brush and let the epoxy adhesive set. 10. Fill the top section with epoxy adhesive as shown in figure 10.3.2. and let it set. This is to insulate the brush from the contact spring. 8. Machine the brush insulation so that the dimensions W1 and W2 in figure 10.3.2 allow the insulated brush to be a sliding fit inside the brush holder. 9. A few days before the RSO test, install the insulated brushes in the generator in their previous locations so that they carry current for a short period of time.

Figure 10.3.2 Side views of insulated brush
10.3.2 THE EARTH CONNECTION BRUSH It is necessary to make a separate earth connection to the rotor shaft. However, it has been found by experience that it is seldom satisfactory to use an existing shaft earth brush for this test because of the large amount of electrical noise generated by these devices. The most effective method is make a temporary earth brush and hold it against the a cleaned area of the rotor shaft. One form of temporary earth brush can be made by stripping off the last few centimetres of insulation from a length of stranded heavy-duty earthing cable and taping it to the end of a length of insulated material (eg a wooden broom handle). This temporary earth brush can then be held in contact with the rotating shaft. A connection should also be made from this temporary shaft earth brush to a static earth point on the frame of the generator for safety purposes and the green RSO ground test lead should also be connected to this point.

10.3.3 TEST DETAILS A running RSO test is often carried out as a generator is run down from synchronous speed following a period on load. The following test details assume the RSO test is to be carried out on a conventional rotor with slip (collector) rings. In this case, the rotor excitation system is normally connected directly to the brush cages and cannot easily be disconnected from them. Consequently, before carrying out the RSO test, all of the existing (non-insulated) brushes must be removed from the brush cages and either removed entirely or (in practice), just left dangling by their flexible tails (conecting conductor braids). Ensure that the brushes do not touch the brush cages (using some form of temporary insulation). At this point, there should be no electrical contact between the slip rings and the brush cages (check this with an electrical test meter). With the insulated brushes in the brush cages in their original positions (see section 10.3.1), the sets of insulated brush tails in each slip ring cage should be connected together to form 2 sets of tails (one set per slip ring). Measure the contact resistance between the slip rings via the sets of tails of the insulated brushes, which should be less than 1 Ohm. Next measure the insulation resistance between one set of insulated brushes and the rotor shaft, which should not be less than 100 K Ohms. Also measure the contact resistance between the temporary earth brush and the rotor shaft which should be less than 1 Ohm. Connect the brown and blue RSO test leads to the tails of each set of insulated brushes and the green test lead to the rotor earth brush. Figure 10.3.1 shows the RSO test lead connections for a running RSO test being carried out in a repair shop using a set of temporary test brush gear. With the modifications mentioned above, the RSO test can be carried out as the rotor speed is increased or decreased by holding the temporary earth brush against the rotor shaft. However, this operation must be carried out with great care and under approved supervision to avoid any possible harm to the person holding the temporary earth brush. The RSO equipment should be set to monitor the waveforms at the input ends of the rotor and should be watched carefully for any changes in either trace which may indicate a speed dependent fault. If a fault (or a change in the RSO waveforms) is noted, the waveforms should be recorded using the TDRPlot SAVE button or by digital photography if in analogue mode. If unusual or unexpected results are obtained, recheck the earth and insulation test lead continuity and also check that the RSO equipment is working correctly by connecting the remote ends of the test leads to the delay line instead of the rotor. If all is now OK, reconnect the test leads to the rotor and re-check all of the connections at the rotor. Then continue with the test as above.
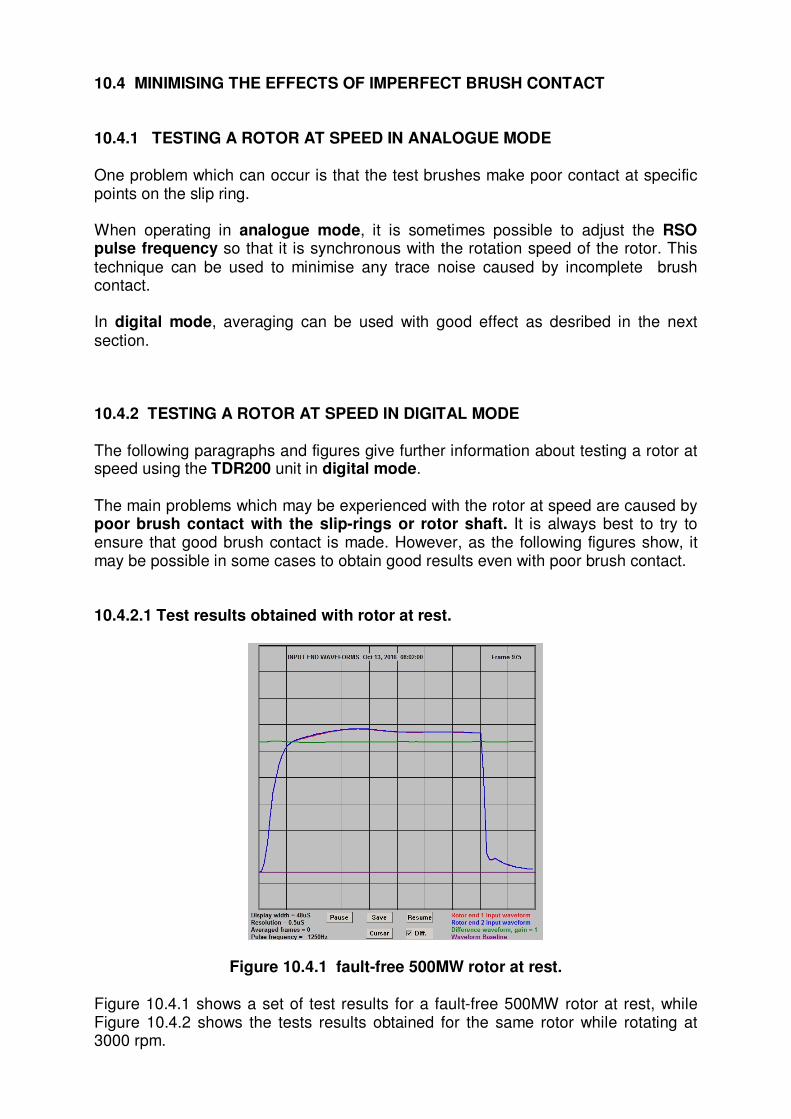
10.4 MINIMISING THE EFFECTS OF IMPERFECT BRUSH CONTACT 10.4.1 TESTING A ROTOR AT SPEED IN ANALOGUE MODE One problem which can occur is that the test brushes make poor contact at specific points on the slip ring. When operating in analogue mode, it is sometimes possible to adjust the RSO pulse frequency so that it is synchronous with the rotation speed of the rotor. This technique can be used to minimise any trace noise caused by incomplete brush contact. In digital mode, averaging can be used with good effect as desribed in the next section. 10.4.2 TESTING A ROTOR AT SPEED IN DIGITAL MODE The following paragraphs and figures give further information about testing a rotor at speed using the TDR200 unit in digital mode. The main problems which may be experienced with the rotor at speed are caused by poor brush contact with the slip-rings or rotor shaft. It is always best to try to ensure that good brush contact is made. However, as the following figures show, it may be possible in some cases to obtain good results even with poor brush contact. 10.4.2.1 Test results obtained with rotor at rest.
Figure 10.4.1 fault-free 500MW rotor at rest. Figure 10.4.1 shows a set of test results for a fault-free 500MW rotor at rest, while Figure 10.4.2 shows the tests results obtained for the same rotor while rotating at 3000 rpm.

10.4.2.2 Test results obtained with rotor at 3000rpm.
Figure 10.4.2 Rotor rotating at 3000 rpm. Poor brush contact
While the brush connected to end 1 of the winding (the red trace) is making reasonably good contact with the slip rings, the brush connected to end 2 (the blue trace) is making very poor contact, producing erratic results in the blue and the green (difference) waveforms. 10.4.3 Improving the results obtained at 3000 rpm using averaging. The next figure shows how the test results can be improved by the use of rolling averaging.
Figure 10.4.3 Improving the results using averaging.
Figure 10.4.3 was obtained by setting the Control window to average 100 frames of data on a rolling basis. The brush noise on the blue waveform has been almost

eliminated and appears instead as a slight vertical displacement of the blue trace, similar to the effects which would be caused by a high-resistance in series with the brush at end 2 of the winding. 10.4.4 Results at 3000 rpm obtained with improved brush contact. Finally, the results shown in figure 10.4.4 show the RSO waveforms at 3000 rpm after a new set of insulated carbon brushes had been fitted to the rotor. These results confirm that good results can be obtained when carrying out the RSO test at speed, as long as good brush contact is maintained with the rotor slip rings.
Figure 10.4.4 Improved brush contact

11. TESTING LAMINATED ROTORS 11.1 CYLINDRICAL ROTORS
Most rotors of large electrical turbogenerators are fabricated from solid steel cylindrical forgings. However, some smaller rotors (particularly exciter rotors) use a laminated construction (similar to that used for stators), One immediate consequence of this is that there is no longitudinal connectivity between the individual circular laminates of the rotor body and so the transmission line analogy is no longer valid.
Figure 11.1 RSO test on a laminated exciter rotor removed from stator
Figure 11.2 shows an example of the RSO test waveforms obtained for this rotor
Figure 11.2 RSO test waveforms obtained for a laminated rotor
The upper traces show the RSO waveforms at the input ends of the rotor and the lower traces show the waveforms at the output ends.

These results are not typical of those from a large main rotor in the following respects: 1. The rotor characteristic impedance is very high (> 1000 Ohms). 2. There is evidence of multiple mode propagation. Looking at the RSO image for the input ends results (upper waveforms), the red trace shows the waveform injected at the slip ring connected to the Red test lead and the Blue trace shows the similar waveform injected at the slip ring connected to the Blue lead. These waveforms are almost identical and there is no evidence of any winding fault. The green waveform is the difference between the red and blue traces. Looking at the results for the output ends (lower waveforms, the red/blue traces are unusual in that instead of a zero trace region before the pulse arrives at the output ends, there is a large oscillating waveform, which makes it difficult to measure the single-pass transit time accurately. This may be evidence of a second mode of propagation through the winding, possibly due to direct capacitive coupling between the conductors. This sometimes occurs with large rotors but at a much lower level. To summarise, the RSO test has confirmed that the rotor winding is probably fault-free. However, the results are not typical of those that would be expected from a large rotor forged cylindrical rotor and it would be difficult to locate any winding faults because of the imperfect transmission line properties of this type of rotor. 11.2 SLOW-SPEED SALIENT POLE ROTORS
Figure 11.3 A salient pole rotor
Another type of laminated rotor is used in slow-speed, multi-pole water-powered hydro-generators as shown in figure 10-3. These exhibit similar properties to laminated cylindrical rotors when RSO tests are carried out.

12. WHAT TO EXPECT - SOME TYPICAL TEST RESULTS
This section gives further information about the results from RSO (Recurrent Surge Oscillograph) tests carried out using the Rowtest TDR200 Rotor Reflectometer. 12.1 DISCLAIMER The information given here is offered in good faith and is for advisory purposes only. All users of the equipment must use their own professional experience and judgement or seek other expert advice before making any decisions following an RSO test. Rowtest and its associate companies will not be held responsible for any actions taken which are based on the results obtained using its equipment. A number of example RSO waveforms obtained from test results in both digital and analogue modes on real rotors are shown in the following sections, with comments on the results where appropriate. Some of the results have been shown in previous sections but are included here for completeness. 12.2 FAULT-FREE ROTOR WINDING The following pair of figures show typical RSO waveforms at the input and output ends of a large fault-free 660MW rotor. These waveforms were obtained by setting the input and output end impedance matching resisistors and the pulse and display widths to the correct values as described in sections 4 and 6. The test pulses are applied at each end of the rotor winding (designated red and blue for convenience) in turn and the resulting RSO waveforms are viewed at both the input and output ends of the rotor winding
(a) Input end waveforms (b) Output end waveforms
Figure 12.1. Typical RSO test results for a fault-free 660 mw 2-pole rotor winding

Figure 12.1(a) shows the RSO waveforms at the input ends of the rotor windings. There are two superimposed waveforms (red and blue) corresponding to the pulses injected at each end of the winding. These waveforms are compared and used to view and detect any winding faults. Note the two identical end1 (red) and end 2 (blue) waveforms and the horizontal (green) difference waveform. These are the results which should be obtained for a healthy rotor winding. Figure 12.1(b) shows the waveforms at the output ends of the winding. The cursor button has been used to measure the single-pass transit time (for the RSO pulse to travel from one end of the winding to the other end (in this case 24.8uS) for fault location purposes. These results are typical of those expected for a healthy rotor. The end1 (red) and end 2 (blue) waveforms should be identical and the (green) waveform, which displays the difference between the red and blue end waveforms, should be a horizontal straight line for a fault-free rotor winding.

12.3 RESULTS FOR TYPICAL WINDING FAULTS Section 4.5 showed results for some typical winding faults when the TDR200 unit was used in analogue mode. The results given in this section were obtained using the TDR200 unit in digital mode to test a large 2-pole 660 MW rotor which had been removed from the generator for maintenance. If there is a fault in the rotor winding, the red and blue end waveforms will not be identical and examples of typical RSO test results for rotor windings which contain an inter-turn, earth fault and a high-resistance joint are shown in figure 12.2 below.
(a) Input end waveforms (b) Input end waveforms
for a shorted coil for an earth fault
(c) Input end waveforms for a simulated high-resistance joint using a delay line
Figures 12.2. (a) and (b) show typical RSO test results for a 660 mw 2-pole rotor winding containing an interturn fault (a) and an earth fault (b). Figure (c) shows simulated results using a delay line with a high-resistance joint at the red end .

12.4 RESULTS OBTAINED FOR A ROTOR WINDING DURING REPAIR The following results were obtained from a 660MW rotor winding during repair. One end-ring had been removed, which allowed simulated faults to be applied to the half-winding connected to the end 1 slip ring (red waveforms).
(a) No fault (b) Short circuit applied to last coil before end of half-winding
Figure 12.3 Input end waveforms with end ring next to slip rings removed
Comments: (a) With one end ring removed, the characteristic impedance of the rotor winding changes at these end regions, resulting in a peak in the input end waveforms as shown above. However, note that both the red and blue waveforms remain identical as there is no winding fault.
(b) Shorting out a complete set of windings in a slot coil causes a characteristic loop to appear between the red and blue waveforms. Note that the applied fault is nearest to the end 1 (red waveform) and that the red waveform first increases, then decreases at the fault location.
The results on the next page show the resulting RSO waveforms for some other fault conditions.

(a) 1 shorted turn applied to first coil (b) Shorted turn applied to third from end 1 slip ring coil from end 1 slip ring
(c) Shorted turn applied to last (d) Earth fault applied to last coil coil in end 1 half-winding coil in end 1 half-winding
Figure 12.4 Input end waveforms with end ring next to slip rings removed
Comments: (a) The effect of shorting out a single turn produces a maximum difference in the input end waveforms when the shorted turn is close to the start of the winding. (b) As the location of the fault is moved towards the centre of the winding, the measurement sensitivity decreases.
(c) Although the measurement sensitivity has further decreased, it is still possible to detect a shorted turn close to the centre of the rotor winding. (d) An earth fault is easily detected and located using the RSO test. In this case, a fault has been applied to the half-winding closest to end 1 (red waveform).

12.5 TEST RESULTS FOR WINDING FAULTS IN ANALOGUE MODE Some similar test results obtained using analogue mode operation, with comments, are shown below.
Figure 12.5 Typical Traces for different types of winding faults Comments a) Fault between winding and rotor body (earth fault) A full or partial fault may occur between the winding and the rotor body. In fig, 12.5(a), the RSO pulse which is injected from the end nearest the fault is seen to increase to a peak at the fault and then to decay rapidly. The RSO pulse injected from the end furthest from the fault increases and decays some time later, as the pulse injected from the remote end takes a longer time to reach the position of the fault. Note that the sharpness and rate of decay of the second peak is considerably less than that for the first peak. This is an example of the general rule that the resolution of the RSO test is greatest near the point of injection of the voltage step (i.e. at the slip rings) and decreases as the position of the fault moves further into the winding. b) Interturn Fault Fig. 12.5(b) shows the type of trace obtained when a short circuit between adjacent turns occurs. The trace corresponding to the end nearest the fault increases slightly then decreases and finally increases to meet up again with the trace injected from the other slip ring end. The faulty trace is that which gives rise to the lower part of the first major loop shown in fig. 12.5(b). It should be noted that the test is particularly sensitive and will detect a relatively high resistance (a few ohms) interturn fault that may, in practice, not carry any significant current in an operational state. Further tests involving measuring the voltage drop across adjacent turns by passing a large direct current through the total winding, or by using a flux probe test (see section 13) must be carried out to determine whether the fault is current-carrying or not.

Figure 12.6 Typical Traces for different types of winding faults Comments c) High resistance joint in rotor The effect of a high resistance joint on the winding is shown in figure 12.6(c). The apparent characteristic impedance of the end of the winding nearest the fault is increased relative to that of the other end of the winding. Hence the upper trace shown in 12.6(c) corresponds to the end of the winding nearest the fault. It is possible that the fault may be caused by a high resistance joint at one slip ring. In
this case, the fault may be confirmed by placing a variable 0 - 500Ω resistor in series with the lead to the other slip ring and adjusting this variable resistor. If it is possible to make the traces coincide by these means, then the fault occurs very close to the first slip ring. d) Interwinding fault It is possible for faults to occur between rotor slot coils and the upshaft leads which connect the slip rings to the ends of the rotor winding. Figure 12.6(d) shows an example of a fault of this type, in which the upshaft lead had shorted to the fifth coil in the winding, effectively shorting out the first five coils in a total winding of sixteen coils. The lower trace corresponds to the slip ring nearest the shorted coils.

13. FLUX PROBE (SEARCH COIL) TESTS 13.1 INTRODUCTION The RSO test is very sensitive and will detect winding faults which do not carry any significant current in normal operation. An alternative test which will only detect current-carrying winding faults is known as the Magnetic Flux probe test and is carried out with the rotor excited and at speed. The test uses a flux probe (a small search coil) mounted in the air gap between the rotor and stator to monitor the magnetic field close to the rotor surface to detect current-carrying inter-turn and double earth faults. The test was first described by D.R. Albright, originally of the US General Electric Company and subsequently GeneratorTech Inc. The next 2 figures are taken from a GeneratorTech publication.
Figure 13.1.1 Cross-sectional representation of a cylindrical rotor. *
Figure 13.1.1 shows the cross section of a 2-pole cylindrical rotor with 6 coils per pole. It also shows the 2 magnetic poles A and B and a Flux Probe mounted on a stator slot wedge so that it protrudes into the air gap between the stator and rotor surfaces. As the rotor rotates at 3000 or 3600 rpm (anti-clockwise in the figure above) the rotating magnetic field generates a low-voltage signal, proportional to the rate of change of magnetic field in the stationary flux probe, as shown in figure.13.1.2. * From Generatortech publication.
Flux Probe

Figure 13.1.2 Output signal from flux probe *
In the polar regions (shown as Pole A and Pole B in figure 13.1.2 above), the rotor body is (relatively) uniform magnetically and the flux probe coil output varies only slowly as the rotor rotates. However in the coil slot regions between the poles, the magnetic field path is interrupted by each coil slot which has been cut into the rotor body. This causes a magnetic potential to exist between each slot "tooth" of the rotor body, and this generates a magnetic slot leakage flux, as shown in red in figure 13.1.1. The flux probe is located close to the rotor surface and the rapid changes in the magnetic flux between each subsequent coil slot induce a ripple signal at a typical frequency around 2kHz in the flux probe output as shown in figure 13.1.2. This flux probe waveform is typical of the case where there are no shorted turns in the rotor winding. The figure also shows which parts of the ripple signal result from each set of coil slots associated with the magnetic poles A and B and their designation as "leading" or "lagging slots". The lagging slots immediately follow the pole regions A and B in time, while the leading slots precede these same pole regions. The output signal from the flux probe installed in the alternator air gap (or a similar probe located close to the rotor surface for a rotor under test in an overspeed pit) can be processed by a custom instrument (such as the Rowtest RFM200 Rotor Flux Monitor) to produce a nulled waveform for a fault-free generator, as shown in figure 13.2.1. However, a field winding with a current-carrying inter-turn fault will display a series of peaks in the “nulled” waveform, where the peaks correspond to the position of the faulty coil slot as described later. The flux probe measurement technique has the further advantage over alternative methods in that continuous on-load monitoring of the generator is possible and only current- carrying winding faults are detected. In addition, a double earth fault (which is an extreme case of an inter-turn fault) will be detected directly if significant fault current flows. * From Generatortech publication.

13.2 PRINCIPLE OF OPERATION OF THE "DELAY AND ADD" TEST METHOD Figure 13.2.1 below, obtained from a fault-free generator having 8 coil slots per pole. It shows the voltage waveform induced in a flux probe located in the air gap between the generator rotor and stator, for one complete revolution of the rotor. The waveform contains 2 nominally symmetrical and sequential regions X and Y, corresponding to each half-circumference of the rotor centered on the North-South polar axis, together with the outputs over the polar regions A and B.
B X A Y B
Figure 13.2.1 Typical search coil waveform for a fault-free rotor
The waveform regions X and Y (containing higher-frequency ripple signals) correspond to the rotor field coil slots located either side of the magnetic poles A and B. The waveform sequence B-X-A-Y-B repeats once per revolution of the generator rotor (nominally 3000rpm for a 2-pole rotor generating a 50Hz output). Flux probes can be installed either in the air gap between the stator and rotor (for operational generators) or mounted on a test probe located near the rotor in an overspeed pit (in manufacturers' or repair works). The probes can be oriented to monitor either the radial or the tangential (circumferential) components of the magnetic leakage flux produced by the excited rotor winding. The waveform in figure 13.2.1 is from a radial field flux probe and in this case, the waveform Y has the opposite polarity to that of waveform X. The flux probe test equipment typically digitises and compares the search coil waveforms for the A and B regions and displays the difference between them on the screen of a computer. For both radial and tangential flux probes, this process is carried out by delaying the search coil waveform by 180 degrees and either adding or subtracting the delayed waveform to/from the undelayed one. For a perfect winding, the X and Y waveforms should be similar (although of opposite polarity depending on the type of search coil in use) so the difference or sum waveform should be zero. This is known as the "delay and add" method. The green waveform in figure 13.2.1 is the result of adding the A pole half-waveform to the B pole half-waveform delayed by one half revolution.
POLE B POLE A

13.3 DETAILS OF FLUX PROBE WAVEFORMS The flux probe waveforms have the following properties depending on which type of search coil is used in the probe. In the figures shown in this section, unless stated otherwise, the waveforms were synthesised using an electronic signal generator to approximate to typical real flux coil waveforms. 13.3.1 TANGENTIAL FIELD FLUX PROBE For a tangential magnetic field search coil, the group Y waveform is nominally identical to and has the same polarity as the is group X waveform and so the delayed waveform must be subtracted from the original waveform to produce cancellation (a nulled waveform). .
Figure 13.3.1 Simulated tangential search coil waveform
13.3.2 Radial magnetic field search coil. (Siemens type) For a radial magnetic field search coil, the group Y waveform is the inverse of the group X waveform and so the delayed waveform must be added to the original waveform to produce cancellation (nulled waveform).
Figure 13.3.2 Measured radial search coil waveform
In figure 13.3.2, the blue trace is the search coil waveform and the green trace is the difference waveform obtained after delaying and summing.
X Y
X Y

13.4 EXAMPLE WAVEFORMS 13.4.1 RADIAL FLUX PROBE The following examples show simulated flux probe waveforms for a fault-free rotor winding (a) and one containing a major interturn fault (b) (blue waveforms). Figure (c) shows the "nulled" (red) waveform.
Figure 13.4.1(a) Simulated radial flux probe waveform for a fault-free rotor.
Figure 13.4.1(b) Simulated radial flux probe waveform with shorted turns in 6th coil from one pole
Figure 13.4.1(c) Applying delay and add method to waveform in 13.4.1(b) to identify location of shorted coil

13.4.2 TANGENTIAL FLUX PROBE The following examples show simulated tangential flux probe waveforms for a fault-free rotor winding (a) and one containing a major interturn fault (b) (blue waveforms). Figure (c) shows the "nulled" (red) waveform.
Figure 13.4.2(a) Simulated tangential flux probe waveform for a fault-free rotor.
Figure 13.4.2(b) Simulated tangential flux probe waveform with shorted turns in 6th coil from one pole
Figure 13.4.2(c) Applying delay and subtract method to waveform in 13.4.2(b) to identify location of shorted coil Note that in this case, the nulled waveform is obtained by subtracting the delayed waveform, as the tangential flux probe produces the same polarity waveforms for both poles..

13.5 FLUX PROBE TESTING IN AN OVERSPEED PIT The flux probe test can be also carried out in a manufacturer or repairer's works with the rotor removed from its stator. In this case, only limited excitation can be applied to the rotor because of the high magnetic fields which would be produced. One problem which can occur results from the unwanted effects of any residual magnetism in the rotor core. These effects can be largely corrected as described in the next sections. 13.6 EFFECTS OF RESIDUAL MAGNETISM When a rotor is tested outside the stator (eg in an overspeed/balancing pit), only limited excitation can be applied to the rotor winding to avoid the magnetised rotor from interacting with local steel objects (bedplates etc.). Experience has shown that with no excitation, the rotor retains some residual magnetism and this affects the shape of the search coil waveforms obtained with low values of excitation current (<50A). These problems can be corrected by capturing the search coil waveform with the rotor winding unexcited as a reference (Residual magnetism) waveform and subtracting this waveform from the waveform obtained when the rotor is excited with a modest current (excited waveform). The waveforms in Figure 13.6.1 were obtained for a fault-free rotor (130 MW, 7 coils/pole) excited under test conditions with a restricted current of 27A at 3000 rpm..
Figure 13.6.1 Uncorrected search coil waveform
The search coil waveform is shown in (Blue) The Green difference trace is the result of using the delay and add technique described above. Note that this difference waveform has significant amplitude, even though the rotor winding is fault-free. This effect is caused by the residual magnetism in the rotor body.

In figure 13.6.2, the residual magnetism signal (obtained by running the rotor with no excitation) has been subtracted from the excited search coil waveform of figure 2.3. Note that the Green difference trace is now almost perfectly cancelled.
Figure 13.6.2 Search coil waveform corrected for residual magnetism
13.7 COMMENTS The RSO and Flux Probe tests are complementary test methods and both are widely used for testing the rotors of large electricity generators.

14. SOME FURTHER INFORMATION FOR PLANT OPERATORS * 14. 1 HISTORICAL PERSPECTIVE When the RSO test was first used routinely in the UK (from around 1980 onwards), many rotors were found to have winding faults, and these included some brand new rotors. However as manufacturers started to use the RSO test themselves, the number of new rotors delivered with winding faults rapidly reduced to zero. In current practice, it is reasonable for plant operators to expect that any new rotor will be delivered free from any winding faults. However, the situation for rotors currently in service is more complicated if the RSO test indicates winding faults. Symptoms which can be caused by shorted turns in large generators include increased vibration levels, thermal damage to the winding insulation and the need for increased excitation current for a given power output. If inter-turn faults detected by an RSO test are not causing any obvious operational problems, many plant operators will decide to continue to run the generator, while monitoring it regularly to determine whether the fault is stable or whether it is changing and/or worsening. If operational problems are being experienced, a flux-probe (search coil waveform) test can be carried out if a suitable search coil has been previously installed in the generator air-gap. This will determine whether the winding fault is current-carrying. 14.2 . IMPACT ON PLANT OPERATION OF SHORTED TURNS The RSO test is very sensitive and will detect shorts between turns which do not carry any significant current. Consequently, some rotors may have many shorts without any serious impact on their operation, while the operation of others is affected after developing a single fault. The winding resistance for a large generator rotor is around 0.1 Ohms (100m Ω). As the rotor winding typically contains around 100 turns, the resistance around a single turn will be less than 1m Ω. Consequently, a short between turns of 1Ω will only carry 0.1% of the rated current. As typical large rotor currents are around 3000A, this will result in a current of only 3A through the short. If the short resistance value is 10 Ω, this current reduces to 0.3A. The power (heat) dissipated at the short is calculated using P = I2 x R where P is the power dissipated, I is the current through the short and R is the short resistance. For a 1Ω/3A short, the power dissipated will be 9 watts, and this amount of heat may be significant enough to burn the insulation. For a 10Ω/0.3A short, the power dissipated will be 0.9 watts, which is unlikely to cause any problems on a large rotor winding. If a shorted turn is detected by an RSO test, further tests will normally be required to determine whether the short is severe enough to carry significant current. A suitable method is to use a magnetic flux probe (search coil) which will only detect current-carrying shorted turns.
* See Disclaimer in Section 12.1.

Comparison of the RSO waveforms between results obtained for similar rotors at the same generation site can also be helpful in making decisions for further action. If an earth fault is detected by the RSO test, it is likely that this will have already been detected by other on-line monitoring equipment. Most plant operators are reluctant to run a large generator with a single earth fault, as major damage can occur if a second earth fault occurs, as this may short out much of the rotor winding.

15. REFERENCES Additional information on testing generator rotors can be found in the following documents: 1. Turbo-Generator Winding Fault Detection by a Recurrent Surge Method, Grant, A.E., UK Central Electricity Generating Board Technical Disclosure Bulletin 201, 1973. (Copy in Appendix 2) 2. Rotor winding short detection, Wood, J.W. and Hindmarch, R.T., IEE Proceedings, Vol 133, Pt. B, No. 3, May 1986, pp 181-190. 3. GE Generator Rotor Design, Operational Issue, and Refurbishment Options, Ronald J. Zawoysky, Karl C. Tornroos, GER 4212, 08/01, GE Power Systems. Schenectady, NY 4. Application of repetitive surge oscillogram (RSO) technique. Kerszenbaum I Annapolis, VA, June 2011. 5. Utilisation of Repetitive Surge Oscilloscope RSO) in the Detection of Rotor Shorted-Turns in Large Turbine-Driven Generators., Kerrszenbaum, I and Maughan, C., 2011 IEEE Insulation conference proceedings. (Copy in Appendix 4). 6. Generator Field Winding Shorted Turn Detection Technology, Donald R. Albright, David J. Albright And James D. Albright, Generatortech, Inc. 7. Interturn Short-Circuit Detector for Turbine-Generator Rotor Windings, Albright, D.R., General Electric Company. 8. Rotor RSO Reflectometer type TDR200 Instruction Manuals, Operation in Analogue mode/ Operation in Digital mode, Rowtest Ltd. 2018 9. Modern Power Station Practice, Volume C, Chapter 6, The Generator, British Electricity International, 3rd Edition, 1991, Pergamon Press. ISBN 0-08-040513-4

APPENDI X 1 RSO TEST REPORT BLANK TEMPLATE
ROTOR WINDING RSO TEST REPORT
LOCATION: S TEST DATE: ROTOR TYPE: RATING MW: MANUFACTURER: DATE OF MANUFACTURE: NUMBER OF POLES:
(a) Input end waveforms (b) Output end waveforms EXCITATION METHOD: SLIP RINGS? ROTATING RECTIFIER? TEST CONDITIONS IN STATOR AT REST AT SPEED REMOVED FROM STATOR END RINGS: IN SITU REMOVED MEASURED WINDING RESISTANCE: MEASURED INSULATION RESISTANCE: SINGLE-PASS TRANSIT TIME (FROM OUTPUT END WAVEFORMS) T1 uS: DOUBLE-PASS TRANSIT TIME (FROM INPUT END WAVEFORMS) T2 uS: COMMENTS ON TEST RESULTS

APPENDIX 2 TURBO-GENERATOR WINDING FAULT DETECTION BY A RECURRENT SURGE
METHOD
CEGB TECHNICAL DISCLOSURE BULLETIN 201
A. E. GRANT 1973 This is a copy of the first paper describing the use of the RSO method for detecting winding faults in turbo-generator rotors. It was written by A.E. Grant of the UK Central Electricity Generating Board (CEGB) in 1973. Please accept our apologies for the print quality of this important document, and also the paper in Appendix 3. If anyone has better copies (particularly of Figure 8) please send them to [email protected]. Many thanks in advance.


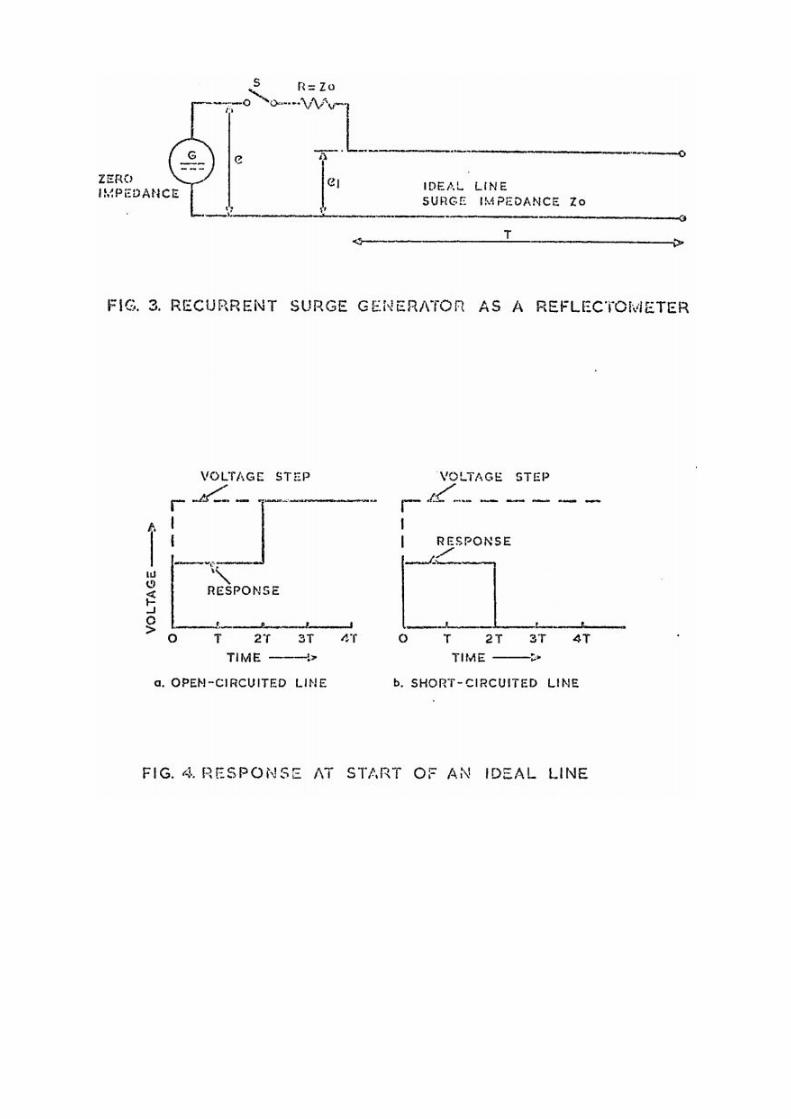


APPENDIX 3
A STANDARD APPROACH TO RSO INTERPRETATION
G.A. Elsworth 1986 This is an editted copy of a note describing how rotor winding faults can be identified and located using the RSO test. It was written by G.A. Elsworth of the UK Central Electricity Generating Board (CEGB) in 1986 and refers to the short-pulse excitation method as well as the long-pulse method used by Grant (and also by Rowtest). In particular, it explains how the location of a winding fault can be estimated using an approximate pulse propagation algorithm. .


Copyright © 2022 FDOKUMEN