Precision improved spot centroid-locating algorithm based on ...
8
Precision improved spot centroid-locating algorithm based on profile regularization Feng QIAN 1, a , Xiao-Pei ZHANG 2, b 1 University of Chinese Academy of Sciences, Beijing, 100049, China 2 Henry Samueli School of Engineering and Applied Science, University of California, Los Angeles, 405 Hilgard Avenue, Los Angeles, CA 90095, USA a Email: [email protected], b Email: [email protected] Keywords: centroid detection; profile regularization; center of weight Abstract. The spot centroid localization is one of the key problems in various fields of scientific research and engineering applications. This paper proposed a novel algorithm based on profile regularization of the detecting spots. The algorithm first roughly eliminates the background and random noise errors by an a priori statistically estimated threshold; then determines the profile edge of the spot region by using morphological filtering technique; last calculates the centroid position with a center of weight algorithm. The field experiments were performed to validate the presented algorithm. The experimental results have demonstrated the superiorities of the proposed centroid detection algorithm on precision, stability and repeatability. This study is of value in improving the precision of center location algorithms. Introduction Centroid detection of spot images acts as a key role in measuring wave-front distortion by Shack-Hartmann wave-front sensor for adaptive optics[1][2], optical testing[3][4] and many other area such as pattern recognition for point object[5], freeform surface measurement[6], lithography system[7], etc. The measuring precision of the centroid for each spot directly affects the accuracy of measurement or assessment in such cases. The conventional centroid detection algorithm is based on the gray level of the spot image[8]. However, when there is noise in the spot image and the noise is not negligible compared to the signals, the detection of an accurate center position becomes difficult by solely using the conventional algorithm. Considering that the background noise may have influence to detect the center position, the modified center of weight algorithms have been developed. The modified versions take power of the gray level of the spot image intensity[9] instead of the gray level itself as the weighting factor. The general method to eliminate the background noise is threshold method[10] and windowing algorithm[11]. In the threshold method, a threshold is used to determine the boundary between spot signal and noise. In the windowing algorithm, the size of a detection window is changed to reduce the influence of noises. Image filtering technique is also introduced to remove the noise, such as smoothing filter, high-frequency removal filter, etc. This study proposed a novel algorithm of locating spot centroids based on profile regularization. The algorithm estimates the profile edge of a pot more precisely based on the intrinsic spatial correlation of the spot, rather than an optimal estimated threshold, which is usually implied in segmentation algorithms. A center of weight algorithm is applied on the regularized spot region for centroid location. In the experiments section, the performance of the presented algorithm and its comparison with the reference method has been discussed. The conclusion is in the last section. Principles of Centroid Detection Center of Weight algorithms. The conventional center of weight algorithm and its modified versions can be uniformly expressed as 4th International Conference on Electrical & Electronics Engineering and Computer Science (ICEEECS 2016) Copyright © 2016, the Authors. Published by Atlantis Press. This is an open access article under the CC BY-NC license (http://creativecommons.org/licenses/by-nc/4.0/). Advances in Computer Science Research, volume 50 849
-
Upload
khangminh22 -
Category
Documents
-
view
0 -
download
0
Transcript of Precision improved spot centroid-locating algorithm based on ...

Precision improved spot centroid-locating algorithm based on profile regularization
Feng QIAN1, a, Xiao-Pei ZHANG2, b 1 University of Chinese Academy of Sciences, Beijing, 100049, China
2 Henry Samueli School of Engineering and Applied Science, University of California, Los Angeles, 405 Hilgard Avenue, Los Angeles, CA 90095, USA
aEmail: [email protected], bEmail: [email protected]
Keywords: centroid detection; profile regularization; center of weight
Abstract. The spot centroid localization is one of the key problems in various fields of scientific research and engineering applications. This paper proposed a novel algorithm based on profile regularization of the detecting spots. The algorithm first roughly eliminates the background and random noise errors by an a priori statistically estimated threshold; then determines the profile edge of the spot region by using morphological filtering technique; last calculates the centroid position with a center of weight algorithm. The field experiments were performed to validate the presented algorithm. The experimental results have demonstrated the superiorities of the proposed centroid detection algorithm on precision, stability and repeatability. This study is of value in improving the precision of center location algorithms.
Introduction
Centroid detection of spot images acts as a key role in measuring wave-front distortion by Shack-Hartmann wave-front sensor for adaptive optics[1][2], optical testing[3][4] and many other area such as pattern recognition for point object[5], freeform surface measurement[6], lithography system[7], etc. The measuring precision of the centroid for each spot directly affects the accuracy of measurement or assessment in such cases. The conventional centroid detection algorithm is based on the gray level of the spot image[8]. However, when there is noise in the spot image and the noise is not negligible compared to the signals, the detection of an accurate center position becomes difficult by solely using the conventional algorithm. Considering that the background noise may have influence to detect the center position, the modified center of weight algorithms have been developed. The modified versions take power of the gray level of the spot image intensity[9] instead of the gray level itself as the weighting factor. The general method to eliminate the background noise is threshold method[10] and windowing algorithm[11]. In the threshold method, a threshold is used to determine the boundary between spot signal and noise. In the windowing algorithm, the size of a detection window is changed to reduce the influence of noises. Image filtering technique is also introduced to remove the noise, such as smoothing filter, high-frequency removal filter, etc.
This study proposed a novel algorithm of locating spot centroids based on profile regularization. The algorithm estimates the profile edge of a pot more precisely based on the intrinsic spatial correlation of the spot, rather than an optimal estimated threshold, which is usually implied in segmentation algorithms. A center of weight algorithm is applied on the regularized spot region for centroid location. In the experiments section, the performance of the presented algorithm and its comparison with the reference method has been discussed. The conclusion is in the last section.
Principles of Centroid Detection
Center of Weight algorithms. The conventional center of weight algorithm and its modified versions can be uniformly
expressed as
4th International Conference on Electrical & Electronics Engineering and Computer Science (ICEEECS 2016)
Copyright © 2016, the Authors. Published by Atlantis Press. This is an open access article under the CC BY-NC license (http://creativecommons.org/licenses/by-nc/4.0/).
Advances in Computer Science Research, volume 50
849

where
intensity,
yc are the
of weight modified v
Error AThe erro
other. Theynoise errorarray in thsampling vincreases wof backgroimage as ra
Figure 1selected frocalled the Fig.1(b) frenhanced interest wisubfigure 1error elimicenter of thsome powbecomes vdeterminat
Fig. 1 Illustarget bo
intensity h
ijI is the i
ijx and yij
e detected ce
algorithm; versions. Analysis. ors in the spy generally r[12]. The she image acvalues; the while the poound noise, andom error1 shows a lom a bundlactive imag
rom Fig.1(aby intensitth laser spo1(e) shows,ination is dihe spot does
wer of its invery hard antion become
stration of lard, (b) anoas been stre
intensity of
are the po
enter positio
when
pot image minclude sam
sample errocquisition pother is on ower factor
photon nors. In this plaser spot pole of sequenge while tha), the diffy stretching
ots of Fig.1( the noise i
ifficult. Becs not sufficentensity. Pr
nd sensitive e a key prob
aser spot exother frame etched for a
,
,
xij
i jc
iji j
I x
I
f the pixel
osition coor
ons. When
is larger th
may be causmple error, bor is causedrocess. It cthe discret
r increaoise and reaaper, we caosition detential field exhe latter witference imag for bette(a), and Figs not neglig
cause the ede to make throper threshto the preci
blem to be s
xperiment. (without lasbetter visuthe 3D illu
yij
ic
x
of i-th col
rdinates of
equals
han 1 (such
sed by severbackground
d by the disconsists of tte spatial saases or the padout noise all them the ection experxperimentalthout spots age is geneer presentatg.1(e) is thegible compadge of the sphe random nhold selectision of sposolved.
(a) one framser spot. (c) ual effect. (dustration of
,
,
yij ijj
iji j
I
I
,
umn and j-
the pixels
1, Eq. (1)
h as 1.5, 2
ral reasons, d noise errocrete sampltwo aspects
ampling gridprofile size
are usuallynoise error.riment. Figul spot imagis called th
erated and tion. Fig.1(e 3D illustraared to the spot is intertwnoise negligion for the
ot centroid d
me in sequenthe differen
d) the zoomethis region.
-th row, in the calcu
comes to th
, 3, etc.), E
and they arr, photon noling of the s: one is onds. Accordiof the spot
y mixed, an ures 1(a) anes. The formhe passive ishown in
d) displaysation of thisspot signal. wined with gible by mee conventiodetection. Th
ntial imagesnce image oed region o
is the po
ulated regio
he conventi
Eq. (1) rep
re independoise error, aoptoelectro
n the discreingly, the sat decreases.nd reflects
nd 1(b) are mer with laimage. By Fig.1(c). I
s a zoomeds region of In this casrandom no
easuring its onal threshoherefore, th
s with laser of (a) and (bf the laser s
(1)
ower of the
on, xc and
ional center
presents the
dent of eachand readout
onic sensorsete intensityample error The errorsin the spot
two framesaser spots issubtracting
It has beend region ofinterest. Ase, the noiseise, and theintensity orold methodhe spot edge
spot on the b), and the spots and (e
)
e
d
r
e
h t s y r s t
s s g n f s e e r d e
e)
Advances in Computer Science Research, volume 50
850
Propose1) NoiseThe spo
roughly elmeticulousimages benon-zero pmax value threshold fas noise erthreshold, or smaller the erroneo
2) MorpDenoted
operator w
where operation[1
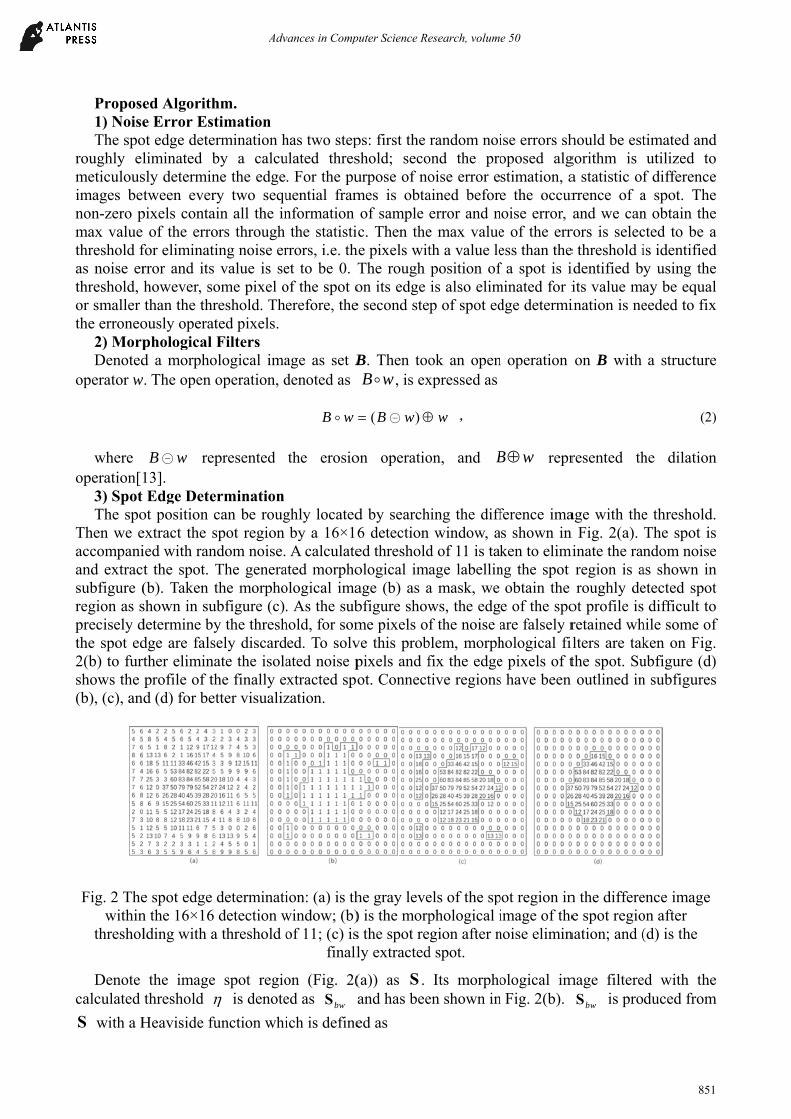
3) Spot The spo
Then we eaccompaniand extracsubfigure (region as sprecisely dthe spot ed2(b) to furshows the (b), (c), an
Fig. 2 Thewithin
threshol
Denote calculated
S with a H
ed Algorithe Error Est
ot edge deteliminated bsly determintween ever
pixels conta of the erro
for eliminatrror and its however, sothan the thr
ously operatphological d a morpho
w. The open
B w rep13]. Edge Dete
ot position cextract the sied with rant the spot. (b). Taken tshown in sudetermine bydge are falsrther eliminaprofile of thd (d) for be
e spot edge n the 16×16 lding with a
the imagethreshold
Heaviside fu
hm. timation
ermination hby a calcune the edgery two sequain all the inors through ing noise er value is seome pixel oreshold. Thted pixels. Filters
ological imaoperation, d
presented
ermination can be rougspot region ndom noise.The generathe morpho
ubfigure (c)y the threshsely discardate the isolahe finally e
etter visualiz
determinatidetection w
a threshold o
e spot regio is denote
function whi
has two stepulated thres. For the puuential framnformation the statisti
rrors, i.e. thet to be 0. Tof the spot oerefore, the
age as set Bdenoted as
B w
the erosio
ghly locatedby a 16×16 A calculate
ated morphoological ima. As the sub
hold, for somded. To solvated noise pxtracted spozation.
ion: (a) is thwindow; (b)of 11; (c) is
finall
on (Fig. 2(ed as bwS a
ich is define
ps: first the shold; secourpose of nomes is obtaof sample c. Then the
he pixels witThe rough on its edge e second ste
B. Then tooB w , is ex
( )B w
on operatio
d by search6 detection ed thresholdological image (b) as abfigure showme pixels ofve this probpixels and fot. Connect
he gray leve) is the morps the spot rely extracted
(a)) as S . and has bee
ed as
random noiond the prooise error eained beforeerror and ne max valueth a value leposition ofis also elimp of spot ed
ok an openxpressed as
w ,
on, and B
hing the diffwindow, a
d of 11 is takage labellina mask, we ws, the edgf the noise a
blem, morphfix the edgetive regions
els of the spphological i
egion after nd spot.
Its morphoen shown in
ise errors shoposed algstimation, ae the occur
noise error, e of the erress than thef a spot is iminated for idge determi
n operation
B w repr
ference imas shown in ken to elimi
ng the spot obtain the
e of the spoare falsely rhological file pixels of ts have been
pot region inimage of thenoise elimin
ological imn Fig. 2(b).
hould be estgorithm is a statistic ofrrence of aand we can
rors is selece threshold iidentified byits value maination is ne
on B with
resented th
age with then Fig. 2(a).
minate the ranregion is aroughly de
ot profile isretained whlters are takthe spot. Suoutlined in
n the differee spot regio
nation; and (
mage filtere
bwS is pro
timated andutilized to
f differencea spot. Then obtain thected to be ais identifiedy using theay be equaleeded to fix
a structure
(2)
he dilation
e threshold.The spot isndom noise
as shown inetected spot difficult to
hile some ofken on Fig.ubfigure (d)n subfigures
ence image on after (d) is the
ed with theduced from
d o e e e a d e l x
e
)
n
. s e n t o f . ) s
e m
Advances in Computer Science Research, volume 50
851

1, ,,
0, ,bw
i ji j
i j
SS
S , (3)
where ,bw i jS and ,i jS are the intensity of the pixel located in position ,i j in each of
them. The morphological image bwS is then taken open operation with a structure operator ,
and produces the filtered image bwS .
bw bw bw S S S , (4)
where the structure operator selects a diamond profile with radius of 1, which is as
0 1 0
1 1 1
0 1 0
. (5)
bwS is regarded as index image and indicates the precisely extracted spot profile. The filtered
spot region image S is generated by the index bwS with another Heaviside function which is
defined as
, , , 1,
0 , , 0bw
bw
i j i ji j
i j
S SS
S . (6)
S has been shown in Fig. 2(d).
Field Experiments and Discussions
The field experiments were performed in the laser testing range. The receiving camera was set fixed directing to the target board and captured the sequential video images. The laser emitter shot every 4~5 seconds. The laser spot shot on the target board lasted for more than 40 seconds and then began to disappear. We capture the multiple frames right after the occurrence of the spot on the target board for repeated tests. The frame sampling frequency of the commercial camera is usually between 24 to 30 frames/s, resulting in that the capture time cost of one frame is 0.03 to 0.04 second. Since the acquisition duration was much shorter than the time of a laser spot lasted until it began to disappear. We considered that the differences between every acquired sequential images were mainly due to sample error and noise error rather than the fading effect of the laser spot itself. Because the true positions of the spot centroids cannot be obtained, we defined an assessment criterion for evaluating the precision of the centroid detection.
Assessment Criterion. Take the procedure of locating the centroid position of spot as one detection test. The detected
position of spot on the -th test is denoted as , yc cx
, where 1 K , K is the number
of laser spots on the target board; 1 N , N is the number of total tests. The assessment criterion is defined as
21
1, y , y
N
c c c cM x xN
, (7)
Advances in Computer Science Research, volume 50
852

Where
the statisticis the statisvalue of th
ExperimTo valid
centroid polaser spot.
-
Fig. 3 Textracted
same
As showof noise wefirst row, aThe centroalgorithm. shown in F
Fig. 4 Th
M repres
cal mean vastical mean
he criterion imental Resdate the reposition for oSubfigures
shows th
The compard spot profie spot.
wn in Fig. 3ere still retaand no obvioid is calcu
The detectFig. 4.
he distributio
sents the ev
alue of the dvalue of th
indicates a bsults and Apeatability, one single s(S1) - (S4) w
he extracted
rison of the iles by using
- ar
3, the profilained. The sious noise plated by Eqted spot ce
on of the de
MK
valuation of
detected cenhe measurembetter precisnalysis. stability an
spot with mwere the ext
d spot region
threshold mg the convenre the detect
es of detectsecond row pixels wereq. (1) with entroids by
etected spot and re
Y P
ositi
on /
pix
el
1
1 K
MK
.
f the centro
ntroid positiments critersion of the r
nd precisiomultiple testxtracted spotn by our alg
method and ntional threted spot pro
ted spots inshowed mo
e retained. T the power the propos
centroids ineference me
id detection
ion in differrion for all tresults.
on of our ats. Figure 3 t region by
gorithm.
our proposeeshold methofiles by usi
n the first roore regular aThen we too
of 1, i.e. thsed algorith
n the repeatethod.
n result for
rent tests fortests of the
lgorithm, wshows foura threshold
ed algorithmod in four ding our prop
w were irreand compacok 20 tests he conventi
hm and the
ted tests by
spot . r the same sentire spots
we first calr of them foof 11 in dif
m. (S1) - (S4)different tesposed algor
egular and sct spot regiofor a statisional centerreference m
the propose
(8)
, yc cx
is
spot . Ms. A smaller
lculated theor the samefferent tests
) are the sts for the ithm. some pixelsons than thestical result.r of weightmethod are
ed method
)
s
r
e e s.
s e . t e
Advances in Computer Science Research, volume 50
853
As shown in Fig.4, the centroid distribution of our method is more compact than that of the reference method. It demonstrates that our method has superior stability for centroid positioning. The detected centroid positions with their confidence intervals ( 0.05 ) and assessment criterion are shown in Table 1.
Table 1 The statistical result of centroid detection for one certain spot. Method Centroid (α= 0.05) Mξ
Proposed Method (7.9296±0.0613,7.9495±0.0711) 0.1727 Reference Method (7.7134±0.0825,8.1669±0.0997) 0.5043
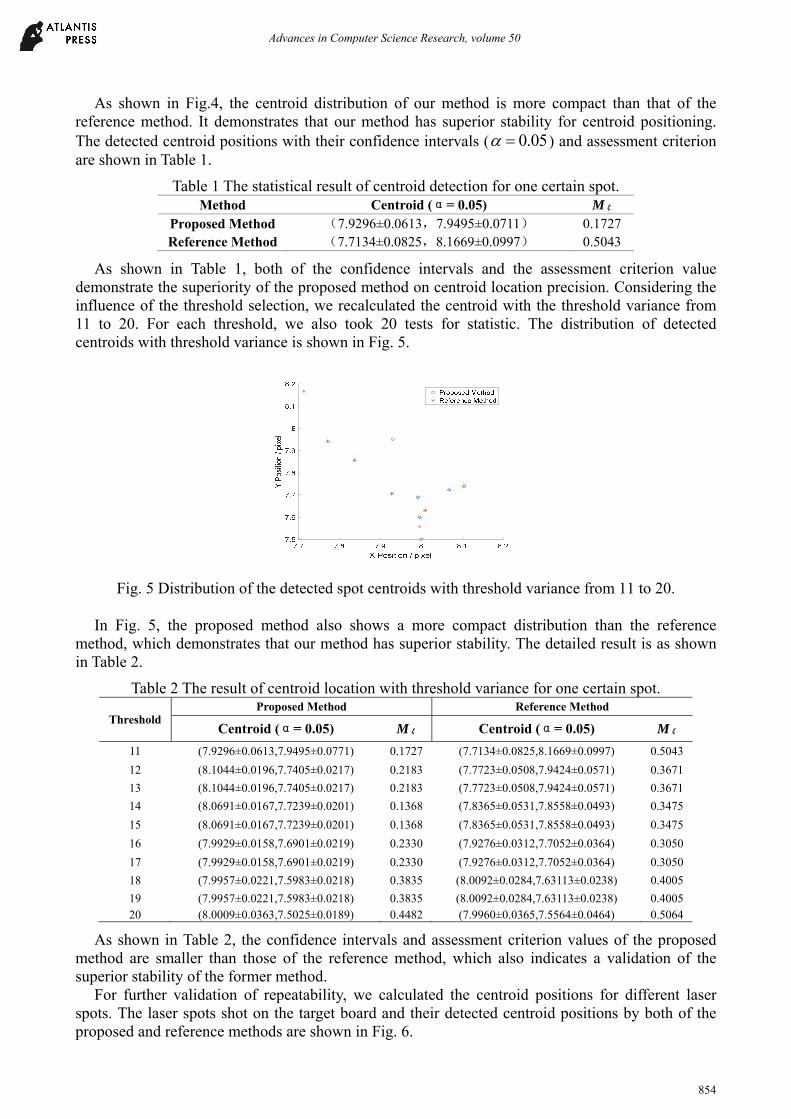
As shown in Table 1, both of the confidence intervals and the assessment criterion value demonstrate the superiority of the proposed method on centroid location precision. Considering the influence of the threshold selection, we recalculated the centroid with the threshold variance from 11 to 20. For each threshold, we also took 20 tests for statistic. The distribution of detected centroids with threshold variance is shown in Fig. 5.
Fig. 5 Distribution of the detected spot centroids with threshold variance from 11 to 20.
In Fig. 5, the proposed method also shows a more compact distribution than the reference method, which demonstrates that our method has superior stability. The detailed result is as shown in Table 2.
Table 2 The result of centroid location with threshold variance for one certain spot.
Threshold Proposed Method Reference Method
Centroid (α= 0.05) Mξ Centroid (α= 0.05) Mξ
11 (7.9296±0.0613,7.9495±0.0771) 0.1727 (7.7134±0.0825,8.1669±0.0997) 0.5043
12 (8.1044±0.0196,7.7405±0.0217) 0.2183 (7.7723±0.0508,7.9424±0.0571) 0.3671
13 (8.1044±0.0196,7.7405±0.0217) 0.2183 (7.7723±0.0508,7.9424±0.0571) 0.3671
14 (8.0691±0.0167,7.7239±0.0201) 0.1368 (7.8365±0.0531,7.8558±0.0493) 0.3475
15 (8.0691±0.0167,7.7239±0.0201) 0.1368 (7.8365±0.0531,7.8558±0.0493) 0.3475
16 (7.9929±0.0158,7.6901±0.0219) 0.2330 (7.9276±0.0312,7.7052±0.0364) 0.3050
17 (7.9929±0.0158,7.6901±0.0219) 0.2330 (7.9276±0.0312,7.7052±0.0364) 0.3050
18 (7.9957±0.0221,7.5983±0.0218) 0.3835 (8.0092±0.0284,7.63113±0.0238) 0.4005
19 (7.9957±0.0221,7.5983±0.0218) 0.3835 (8.0092±0.0284,7.63113±0.0238) 0.4005 20 (8.0009±0.0363,7.5025±0.0189) 0.4482 (7.9960±0.0365,7.5564±0.0464) 0.5064
As shown in Table 2, the confidence intervals and assessment criterion values of the proposed method are smaller than those of the reference method, which also indicates a validation of the superior stability of the former method.
For further validation of repeatability, we calculated the centroid positions for different laser spots. The laser spots shot on the target board and their detected centroid positions by both of the proposed and reference methods are shown in Fig. 6.
Advances in Computer Science Research, volume 50
854
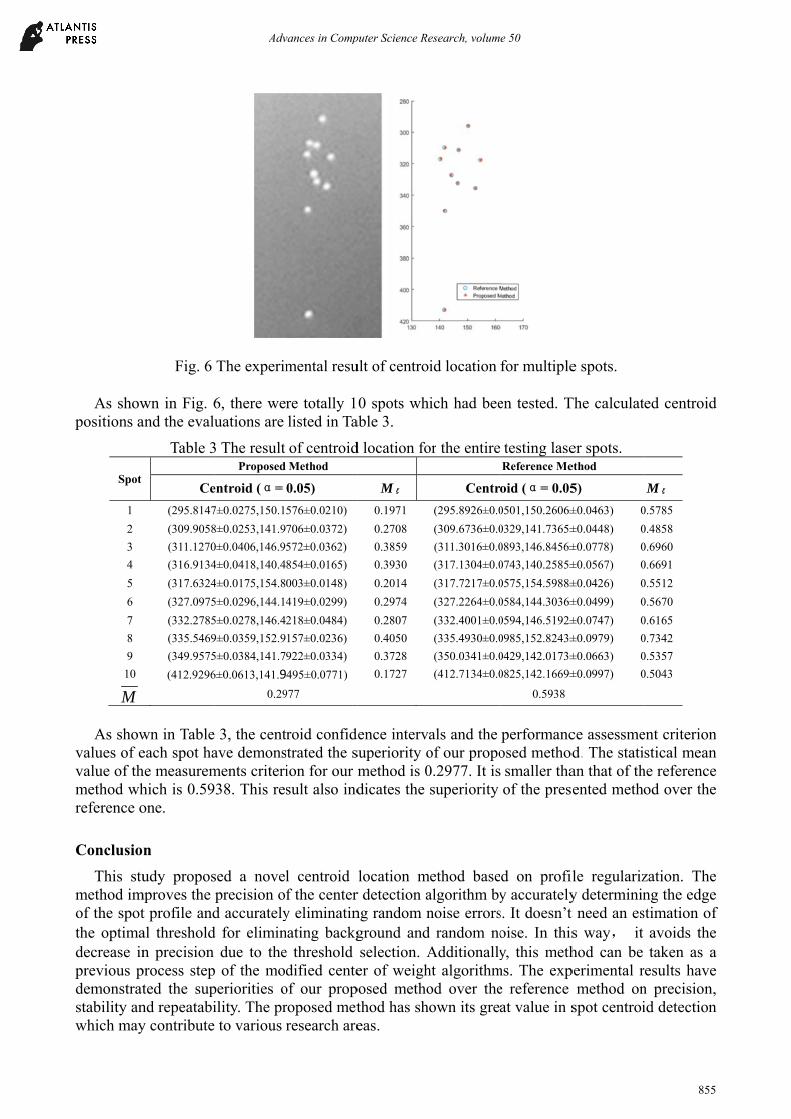
As showpositions a
Spot
1
2
3
4
5
6
7
8
9
10
M
As showvalues of evalue of thmethod whreference o
Conclusio
This stumethod imof the spotthe optimadecrease inprevious pdemonstratstability anwhich may
Fig. 6
wn in Fig. 6and the evalu
Table 3
Ce
(295.8147
(309.9058
(311.1270
(316.9134
(317.6324
(327.0975
(332.2785
(335.5469
(349.9575
(412.9296
wn in Tableeach spot hahe measuremhich is 0.59one.
n
udy proposmproves the
t profile andal thresholdn precision
process stepted the supnd repeatabiy contribute
The experim
6, there weuations are
3 The result Proposed
entroid (α=
7±0.0275,150.1
8±0.0253,141.9
0±0.0406,146.9
4±0.0418,140.4
4±0.0175,154.8
5±0.0296,144.1
5±0.0278,146.4
9±0.0359,152.9
5±0.0384,141.7
6±0.0613,141.9
0.29
3, the centave demonsments criteri38. This re
sed a novelprecision od accurately
d for elimindue to the
p of the moperiorities oility. The pr to various
mental resu
re totally 1listed in Ta
of centroidMethod
0.05)
576±0.0210)
706±0.0372)
572±0.0362)
854±0.0165)
003±0.0148)
419±0.0299)
218±0.0484)
157±0.0236)
922±0.0334)
495±0.0771)
977
troid confidstrated the sion for our msult also ind
l centroid f the centery eliminatinnating backge threshold dified cente
of our proproposed metresearch are
ult of centro
0 spots whable 3.
d location fo
Mξ
0.1971
0.2708
0.3859
0.3930
0.2014
0.2974
0.2807
0.4050
0.3728
0.1727
dence intervsuperiority omethod is 0dicates the
location mr detection ang random nground andselection. A
er of weighposed methothod has sheas.
id location
ich had bee
or the entire
Centr
(295.8926±0.0
(309.6736±0.0
(311.3016±0.0
(317.1304±0.0
(317.7217±0.0
(327.2264±0.0
(332.4001±0.0
(335.4930±0.0
(350.0341±0.0
(412.7134±0.0
als and the of our propo0.2977. It issuperiority
method basealgorithm bynoise errors
d random noAdditionallyht algorithmod over theown its grea
for multiple
en tested. T
testing laseReference Me
oid (α= 0.05
0501,150.2606±
0329,141.7365±
0893,146.8456±
0743,140.2585±
0575,154.5988±
0584,144.3036±
0594,146.5192±
0985,152.8243±
0429,142.0173±
0825,142.1669±
0.5938
performancosed methodsmaller thaof the prese
d on profily accuratelys. It doesn’t oise. In thisy, this meth
ms. The expe reference at value in s
e spots.
The calculat
er spots. ethod
5)
±0.0463) 0
±0.0448) 0
±0.0778) 0
±0.0567) 0
±0.0426) 0
±0.0499) 0
±0.0747) 0
±0.0979) 0
±0.0663) 0
±0.0997) 0
ce assessmed. The statian that of thented meth
le regularizy determinint need an ess way, it hod can be
perimental rmethod on
spot centroi
ted centroid
Mξ
0.5785
0.4858
0.6960
0.6691
0.5512
0.5670
0.6165
0.7342
0.5357
0.5043
ent criterionstical mean
he referenceod over the
zation. Theng the edgestimation of
avoids thetaken as a
results haven precision,id detection
d
n n e e
e e f e a e ,
n
Advances in Computer Science Research, volume 50
855

References
[1] Z. Jiang, S. Gong, and Y. Dai, “Numerical study of centroid detection accuracy for Shack-Hartmann wavefront sensor,” Optics & Laser Technology, vol. 38, 614-619, 2006.
[2] M. Nicolle, T. Fusco, G. Rousset, and V. Michau, “Improvement of Shack–Hartmann wave-front sensor measurement for extreme adaptive optics,” OPTICS LETTERS, vol. 29, no. 23, pp. 2743-2745, 2004.
[3] J. E. Greivenkamp, D. G. Smith, R. O. Gappinger, and G. A. Williby, “Optical Testing Using Shack-Hartmann Wavefront Sensors,” Proceedings of SPIE, vol. 4416, pp. 260-263, 2001.
[4] J. Schwiegerling, and E. DeHoog, “Problems testing diffractive intraocular lenses with Shack-Hartmann sensors,” Applied Optics, vol. 49, no. 16, pp. D62-D68, 2010/06/01, 2010.
[5] H. Chen, and C. Rao, “Accuracy analysis on centroid estimation algorithm limited by photon noise for point object,” Optics Communications, vol. 282, pp. 5, 2009.
[6] W. Guo, L. Zhao, C. S. Tong, C. I-Ming, and S. C. Joshi, “Adaptive centroid-finding algorithm for freeform surface measurements,” APPLIED OPTICS, vol. 52, no. 10, pp. D75-D83, 2013.
[7] D. W. Kang, M. Kang, and J. W. Hahn, “Measuring two-dimensional profiles of beam spots in a high-density spot array for a maskless lithography system,” APPLIED OPTICS, vol. 53, no. 36, pp. 8507-8513, 2014.
[8] X. Yu, D. Zhao, and L. Chen, “Adaptation of adaptive optics system.,” Proceedings of SPIE, vol. 3126, pp. 432, 1997.
[9] S.-H. Baik, S.-K. Park, C.-J. Kim, Y.-S. Seo, and Y.-J. Kang, “A new centroid algorithm for shack-hartmann wavefront sensor,” Proceedings of SPIE, vol. 4926, pp. 251-260, 2002.
[10] S.-K. Park, and S.-H. Baik, “A study on a fast measuring technique of wavefront using a Shack–Hartmann sensor,” Optics & Laser Technology, vol. 34, no 8, pp. 687-694, 2002.
[11] J. F. Ren, C. H. Rao, and Q. M. Li, “An Adaptive Threshold Selection Method for Hartmann-Shack Wavefront Sensor,” Opto-electronic Engineering, vol. 29, no. 1, 1-5, 2002.
[12] H. Li, H. Song, C. Rao, and X. Rao, “Accuracy analysis of centroid calculated by a modified center detection algorithm for Shack–Hartmann wavefront sensor,” Optics Communications, vol. 281, pp. 750-755, 2008.
[13] R. C. Gonzalez, and R. E. Woods, Digital image processing, p.^pp. 520-525, Beijing: Publishing House of Electronics Industry, 2007.
Advances in Computer Science Research, volume 50
856