Spot Speed Survey
11
CE 141 Transportation Engineering I Section: WFU GROUP EXERCISE NO.2:SPOT SPEED SURVEY Submitted by: Licerio, Arthel Rae Leobrera, Karen Lim, Ernest Lagason, Patria
-
Upload
up-diliman -
Category
Documents
-
view
1 -
download
0
Transcript of Spot Speed Survey

CE 141 Transportation Engineering ISection: WFU
GROUP EXERCISE NO.2:SPOT SPEED SURVEY
Submitted by:
Licerio, Arthel RaeLeobrera, Karen
Lim, ErnestLagason, Patria

De Leon, JodieDy, Edgene
Eliseo, Benjie
March 5, 2014I. Spot Speed Survey Report
II. Purpose of the Activity Perform a spot speed survey using the trap length
method on the west bound vehicles of Magsaysay StcorAgoncillo St.
Prepare the frequency histogram for the observedspot speed using the trap length method.
Use the speed gun to determine instantaneousspeeds of the vehicles.
Compare and analyze the results between the traplength method and the speed gun.
III.Description of the Survey Areaa. Location
The area of study is along Magsaysay AvecorAgoncillo St.
b. Date and TimeThe survey was conducted on January 22, 2013(10:41am – 11:41am)
c. WeatherThe weather on the day of the survey wassunny.
d. Traffic ControlThere were no traffic lights within thesurvey area. Only traffic signs were seensuch as guide signs and regulatory signs.
e. Road Condition
1

The road was in good condition. Also, smallamount of vehicles passed through the survey areaduring the time of survey.
f. Map
IV. Results and Data
Table 1: Speed of Vehicles based on Trap Length Methodand Speed Gun
ClockTime
(hh:mm)
VehicleType
TimeTaken(mm:ss)
Speed(kph) NOTE
%Error(T-A)/T
11:17 Car 3.4231.5789
5REU 702, 28kph
11.33333
Medium Truck 3.42
31.57895
Car 1.8558.3783
8XMC 870, 49kph
16.06481
11:18 Car 4.3624.7706
4
Car 2.4344.4444
4TIT 237, 36kph 19
Car 3.17 34.0694UOI 171, 31kph
9.009259
2
30 meters

Car 2.44 44.2623TBO 977, 37kph
16.40741
Motor 4.0226.8656
7 22kph18.111
11Car: Pick-up 4.11
26.27737
Car: Taxi 4.0126.9326
7
Motor 4.0526.6666
7
11:19 Car: Taxi 2.1550.2325
6TYM 203, 44kph
12.40741
Car 3.4531.3043
5ZFC 953, 32kph
2.222222
Medium Truck 3.88
27.83505
Car 3.5430.5084
7
11:20 Car: L300 3.1234.6153
8SKT 841, 34kph
1.777778
Car 3.2133.6448
6TSO 286, 32kph
4.888889
Car 2.70 40
11:21 Car 2.5841.8604
7
Car 3.3232.5301
2SJV 561, 32kph
1.62963
Motor 3.3732.0474
8
11:22 Car 3.8328.1984
3UNO 975, 25kph
11.34259
Car: Taxi 3.17 34.0694UVL 343, 33kph
3.138889
Motor 1.7462.0689
7
Car 3.2133.6448
6
The table above showed the speed of the vehicles thatpassed through the survey area based on a) trap length methodand b) speed gun. Here, one can see that the maximum percent
3

deviation between the two methods was about 19%. This may bebecause when the speed gun was used, the vehicles were about40m away from it and when they passed through the indicatedtrap length area, they may have slowed down a bit since anintersection can be found just a few meters away from the traplength.
Table 2: Data for Frequency Histogram
Bin Frequency5 0
10 015 020 325 730 2435 4640 5745 5250 2155 1160 565 670 0
More 1
Table 2 shows the data that is used to produce thefrequency histogram. The data in the table is from the datagathered during the survey (speed of the vehicles). The “More”bin is to denote the outlier which is excessively distant fromthe other observed value. It can be seen from the table that40 has the highest frequency, followed by 45 and then by 35.This means that 24.46% (57 out of 233) of the cars thattravels along the Magsaysay road is driving at the speed of 40kph.
Figure 1: Spot Speed Frequency Diagram
4

10 15 20 25 30 35 40 45 50 55 60 65 70 More0102030405060
Frequency Histogram
Speed (kph)
Freq
uenc
y
Based on the frequency histogram, one can see that duringthe entire duration of the survey, 155 cars (out of 233)travelled at a speed of 35-45kph which was larger than thespeed limit of 30kph. And in total, the amount of cars largerthan 30 kph is 199 and the amount of cars that complied withthe speed limit is only 34. Only 15% of cars that pass throughMagsaysay road comply with the speed limit between 10:00am and11:30am. It can also be observed in Figure 1 that the data isnormally distributed since it shows a bell shaped curve.
V. Method of Data Collection
A. Materials Used: (1) Analog Distance Measuring Wheel (2) Timers (1) Speed Gun (only used for 10 minutes) Markers (Masking Tape)
B. Procedure:Trap Length Method:
The Trap Length method was used in this
activity to determine spot speed. The length of road
5
for the survey was set to 30m which was measured using
the analog distance measuring wheel. Start and end
points were designated using the markers. For the
survey, the group chose to use two timers, two flagmen
and two recorders. This set up allows the group to
record the time spent of two simultaneous cars in the
trap length which was impossible for the original set
up. The additional data makes the survey more credible.
The trap length method was performed as follows:
Every time a car passes the start marker, the
flagman for the first timer raises his hand.
The first timerthen starts the digital timer
and ends it when the vehicle passed the end
marker. The timer then takes note of the time
and notifies the recorder of the value. If
there are two succeeding cars passing by, the
second flagman also raises his hand, and then,
the second timer takes note of the time. The
second timer then notifies the second recorder.
This went on for one hour with the two set of
timers alternate between the vehicles.
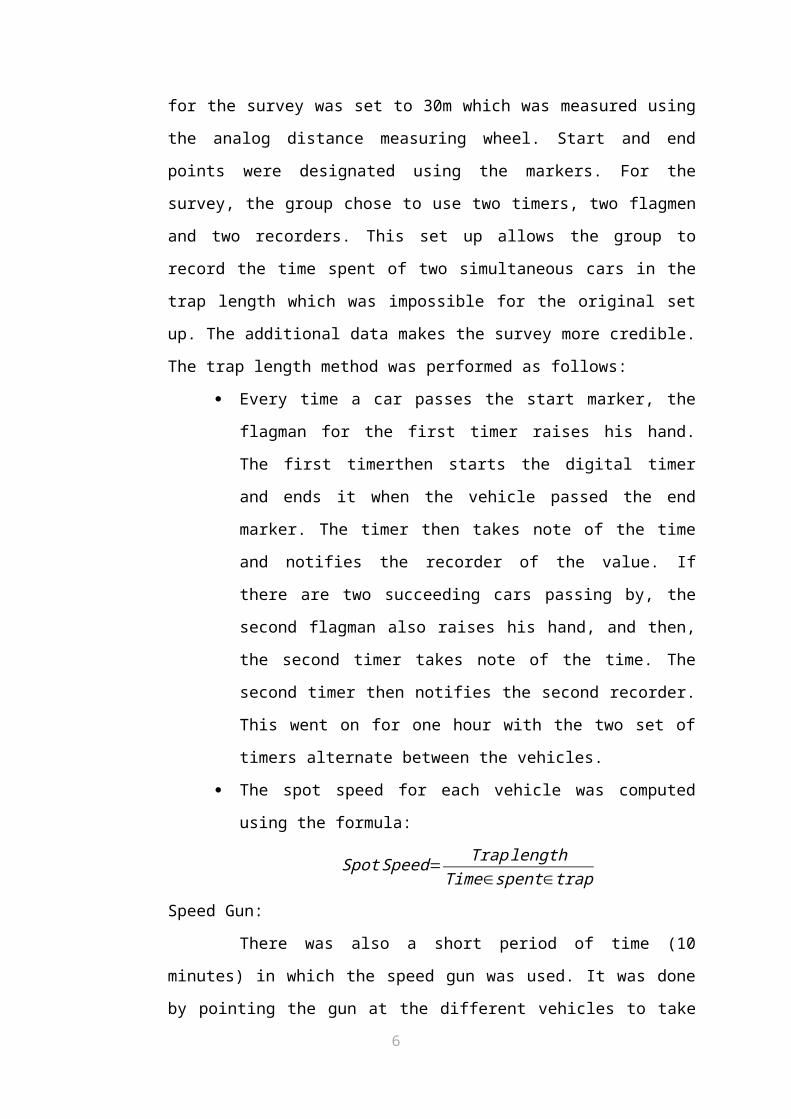
The spot speed for each vehicle was computed
using the formula:
SpotSpeed= TraplengthTime∈spent∈trap
Speed Gun:
There was also a short period of time (10
minutes) in which the speed gun was used. It was done
by pointing the gun at the different vehicles to take6

their instantaneous speeds. During the ten minutes
allotted, the speed gun was utilized along with the
trap length method. The plate numbers of cars that were
observed using both the trap length method and the
speed gun were also recorded along with the cars'
speed.
VI. Analysis and Discussions
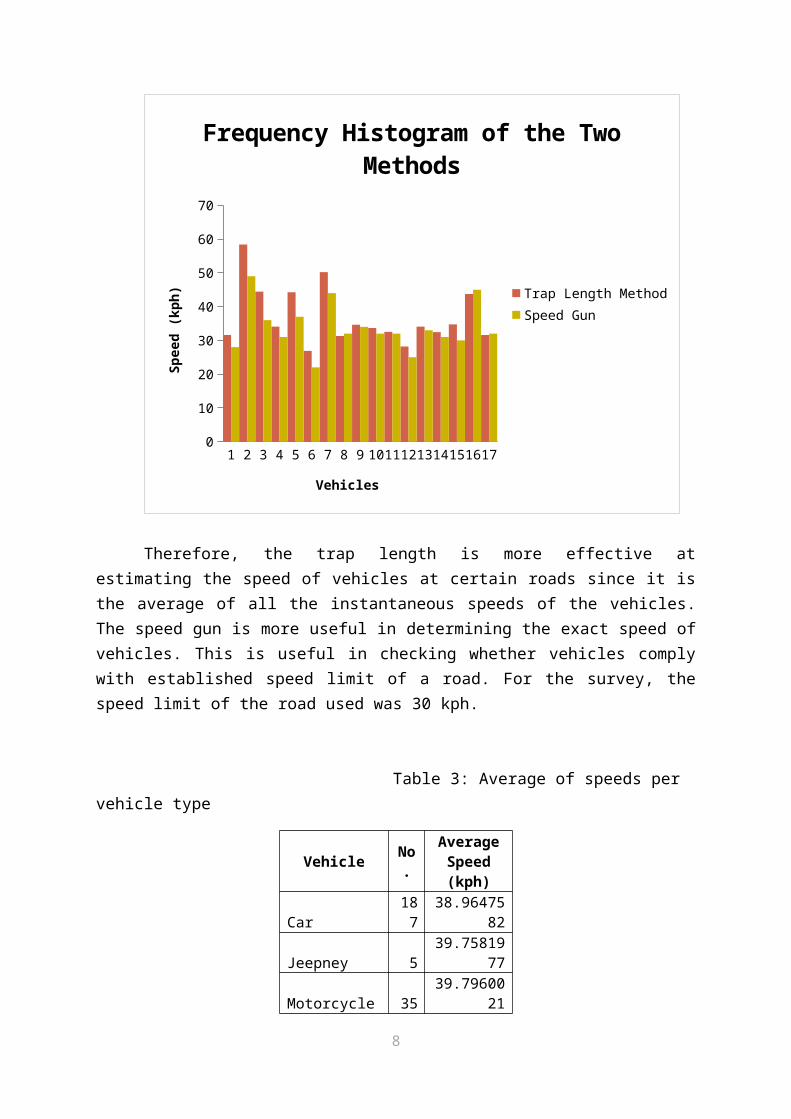
The survey was conducted using two methods; Trap LengthMethod and Speed Gun. The trap length method determines thespot speed using Equation (1). The speed determined by thetrap length is called the average speed. The average speed isthe estimated pace of an object moving from one point toanother at a certain period of time. Meanwhile, the speed gundetermines the instantaneous speed. This speed is the speed ofa moving object at that specific point in place and in time.This means that vehicles can have various instantaneous speedswhile passing through the trap length. The average speed isthe mean of all the instantaneous speeds of the vehiclepassing through the trap length. This was the reason that thetwo methods produced varying percentage of errors (rangingfrom 1% to 19% error from Table 1). Figure 2 (below) shows thefrequency histogram of the two methods and how much thedifference varies between the two methods.
Figure 2: Frequency Histogram of the Two Methods
7
1 2 3 4 5 6 7 8 9 10111213141516170
10
20
30
40
50
60
70
Frequency Histogram of the Two Methods
Trap Length MethodSpeed Gun
Vehicles
Speed (kph)
Therefore, the trap length is more effective atestimating the speed of vehicles at certain roads since it isthe average of all the instantaneous speeds of the vehicles.The speed gun is more useful in determining the exact speed ofvehicles. This is useful in checking whether vehicles complywith established speed limit of a road. For the survey, thespeed limit of the road used was 30 kph.
Table 3: Average of speeds per vehicle type
Vehicle No.
AverageSpeed(kph)
Car187
38.9647582
Jeepney 539.75819
77
Motorcycle 3539.79600
21
8

Bicycle 325.63515
75Medium Truck 3
30.9501771
TOTAL233
Table 3 shows the number of vehicles per vehicle typethat passed through the trap length along with theircorresponding mean speed. It can be observed that themotorcycles have the highest average speed with 39.8 kph andthat bicycles demonstrated the lowest speeds with an averageof 25.6 kph. From the table, It can be inferred that cars,jeepneys, motorcycles and medium-sized trucks generally havespeeds greater than 30kph (speed limit at the campus).
Table 4: Number of Vehicles that are Overspeeding and Non-overspeeding
No. Of Vehicles
%
No. of overspeedingvehicles 199
85.4077253
No. of vehicles thatdidn't overspeed 34
14.5922747
Figure 3: Number of Vehicles that are Overspeeding and Non-overspeeding
85%
15%No. of overspeeding vehicles
No. of vehicles that didn't overspeed
9

Table 4 and Figure 3 show the number of vehicles andpercentage that went overspeeding and those who complied tothe speed limit. 85% (199 vehicles) of the motorists areoverspeeding inside the campus and only 15% (34 vehicles)complies with the speed limit (as observed on the surveyarea).
10