Spot study
14
INTRODUCTION The traditional methods of conducting laboratory activities will not be able to provide the avenue for students to enhance independent learning activities and inculcate creativity and innovation. Level 0 is fully prescriptive where problem, ways & means and answers are provided to the students. However it is still necessary especially to first and second year students. In this laboratory activity, students are required to conduct a spot speed study by recording the speeds of sample of vehicles at a specified location in order to estimate the distribution of speeds of vehicles. Students are provided with the methodology and guidelines for results and analysis to be presented in their report. OBJECTIVES 1. To establish the speed distribution of a traffic at a specific site or called as basic speed data. 2. To determine vehicle speed percentiles via speed trend analysis, which are useful in speed related decision making. THEORETICAL BACKGROUND The distribution of speeds of vehicles in a traffic at a certain place on a road can be found through spot speed studies. The speed of a vehicle is defined as the rate of movement of the vehicle which be regarded in kilometers per
-
Upload
independent -
Category
Documents
-
view
0 -
download
0
Transcript of Spot study

INTRODUCTION
The traditional methods of conducting laboratory activities
will not be able to provide the avenue for students to enhance
independent learning activities and inculcate creativity and
innovation. Level 0 is fully prescriptive where problem, ways &
means and answers are provided to the students. However it is
still necessary especially to first and second year students.
In this laboratory activity, students are required to
conduct a spot speed study by recording the speeds of sample
of vehicles at a specified location in order to estimate the
distribution of speeds of vehicles. Students are provided with
the methodology and guidelines for results and analysis to be
presented in their report.
OBJECTIVES
1. To establish the speed distribution of a traffic at a
specific site or called as basic speed data.
2. To determine vehicle speed percentiles via speed trend
analysis, which are useful in speed related decision
making.
THEORETICAL BACKGROUND
The distribution of speeds of vehicles in a traffic at a
certain place on a road can be found through spot speed
studies. The speed of a vehicle is defined as the rate of
movement of the vehicle which be regarded in kilometers per

hour (km/h). A spot speed study is carried out by recording
the speeds of a sample of vehicles at a specified location.
However, speed characteristics identified by such a study will
be valid only for the traffic and environmental conditions
that exist at the time of the study. (Garber & Hoel, 2009)
Speed characteristics determined from a spot speed study
may be used to:
• Establish parameters for traffic operation and control, such
as speed zones, speed limits (85th-percentile speed is
commonly used as the speed limit on a road), and passing
restrictions.
• Evaluate the effectiveness of traffic control devices, such
as variable message signs at work zones.
• Monitor the effect of speed enforcement programs, such as
the use of drone radar and the use of differential speed
limits for passenger cars and trucks.
• Evaluate and or determine the adequacy of highway geometric
characteristics, such as radii of horizontal curves and
lengths of vertical curves.
• Evaluate the effect of speed on highway safety through the
analysis of crash data for different speed characteristics.
• Determine speed trends and determine whether complaints
about speeding are valid.
APPARATUS AND MATERIALS
1. Radar speed meter (Radar gun)

2. Safety vests
3. Measuring wheel
4. Clipboard and field data form
5. Stopwatch
PROCEDURES
1. The necessary preparations was performed such as
sufficient pen or pencils, radar meter spot speed study
data forms and clipboards, radar speed meters are in good
condition, the instructions were read for the used radar
gun, obtain power battery, safety vast and others.
2. The study location was decided. The selected site should
be a straight and level road sections that represents
different traffic conditions.
3. Enumerators should arrive 30 minutes earlier at side in
order to familiarize by visual survey with it prior to
select strategic location. The equipment was distributed,
the general information of the speed spot data recording
forms were filled that comprise the observer’s name,
time, date, name of site, posted speed limit and weather
condition and begin at the planned time.
4. The layout of the study area was sketch with the
description of chosen reference points, position of
observation, number of lanes and road class.
5. The enumerators, the radar unit and the station for speed
data collection should be inconspicuous where possible so

that vehicular speeds are significantly not effected by
the data collection activities.
6. The samples were randomly selected, for example the
observer recorded a speed reading for every third vehicle
or every fifth vehicle.
7. The radar meter should be made as direct a line with
oncoming traffic as possible, meaning to make it as close
to the roadway as possible (an exception when the
vehicles selected and radar unit tends to affect vehicles
speeds considerably.)
8. A slash was recorded on the speed data sheet
corresponding to the speed observed for each selected
vehicle under the appropriate vehicle-type
classifications.
9. The vehicle speeds were observed for the 100 samples.

RESULT
TABLE 1: THE FREQUENCY ACCORDING TO VEHICLE CLASSIFICATION
Speed
range
(km/h)
VEHICLE TYPES
Motorcycl
es
Cars Buses Lorries Vans
16 - 20 - 1 - - -
21 - 25 - 1 - - -
26 - 30 2 - - 1 2
31 - 35 4 14 2 4 -
36 - 40 9 14 - 2 -
41 - 45 8 19 - - -
46 - 50 9 5 - - -

51 - 55 1 1 - - -
56 - 60 1 - - - -
TOTAL 34 55 2 7 2
SPEED
RANGE
(km/h)
MID
SPEED
, U
(km/h
)
FREQUENCY,
F
F*U
FREQUENCY
PERCENTAGE
(%)
CUMULATIVE
FREQUENCY
(%)
F(U-
Ub)2
16-20 18 1 18 1 1 449.4421-25 23 1 23 1 2 262.4426-30 28 5 140 5 7 627.231-35 33 24 792 24 31 922.5636-40 38 25 950 25 56 36
41-45 43 27116
127 83 389.88

46-50 48 14 672 14 97 1084.1651-55 53 2 106 2 99 380.8856-60 58 1 58 1 100 353.44
TOTAL 100392
0 4506
16-20 21-25 26-30 31-35 36-40 41-45 46-50 51-55 55-600
5
10
15
20
25
30
1 1
5
24 2527
14
2 1
FREQUENCY HISTOGRAM
VEHICLE SPEED RANGE (km/h)
FREQUENCY OF VEHICLE
FIGURE 1: FREQUENCY HISTOGRAM
CALCULATION
1. Arithmetic Mean Speed, Ub = ∑FUF
= 3920100
= 39.2
2. Median Speed
From graph figure 3, P50 = 37 km/h

3. Modal Speed
From the Histogram in figure 1, the Modal Speed is at
range 41 – 45 km/h with the number of frequency of 27
vehicle.
4. Standard Deviation
S = √∑f (U−Ub)2
N−1
S = √ 4506100−1
= ± 6.75
5. Standard Error
D = SN
= 6.75100
= 0.675
Adequacy of data for 95 % confident significant level
95% mean + 1.96 D
= 32.9 + 1.96 (0.675)
= 31.59 to 34.22
6. From Graph;
P15 = 30.5 km/h
P85 = 43.5 km/h
P98 = 49.5 km/h

DISCUSSION
Our study was done along the road from Pejabat Bendahari
towards Dataran Cendekia. The study involved 100 number of
data which includes cars, buses, vans, lorry and motorcycles.
The road was chosen because it is often used by the road users
in UiTM. Apart from that, the road is straight and no
intersection at which the observation can be disturbed.
We have done the observation by shooting the vehicles
using the radar gun at 30o angle. This is to ensure the result
to be more accurate. It was done from 2.45 pm to 3.20 pm.
Based on Garber and Hoel, speed characteristics can be
found from the significant values during the observation.
These values are average speed, median speed, modal speed, the
ith-percentile spot speed, pace and standard deviation of
speed. (Garber & Hoel, 2009)
Based on the calculation done, it can be found that the
arithmetic mean speed is 39.2 km/h. Meanwhile, the median
speed is 37 km/h which is obtained from the cumulative
frequency distribution curve. The median speed is also known
as the 50th-percentile speed. At the 15th, 85th and 98th-perentile
speeds are 30.5 km/h, 43.5 km/h and 49.5 km/h respectively.
Next, the modal speed is 43 km/h according to the
frequency histogram. The standard deviation has been
calculated using its respective formula and found to be ±6.75km/h.
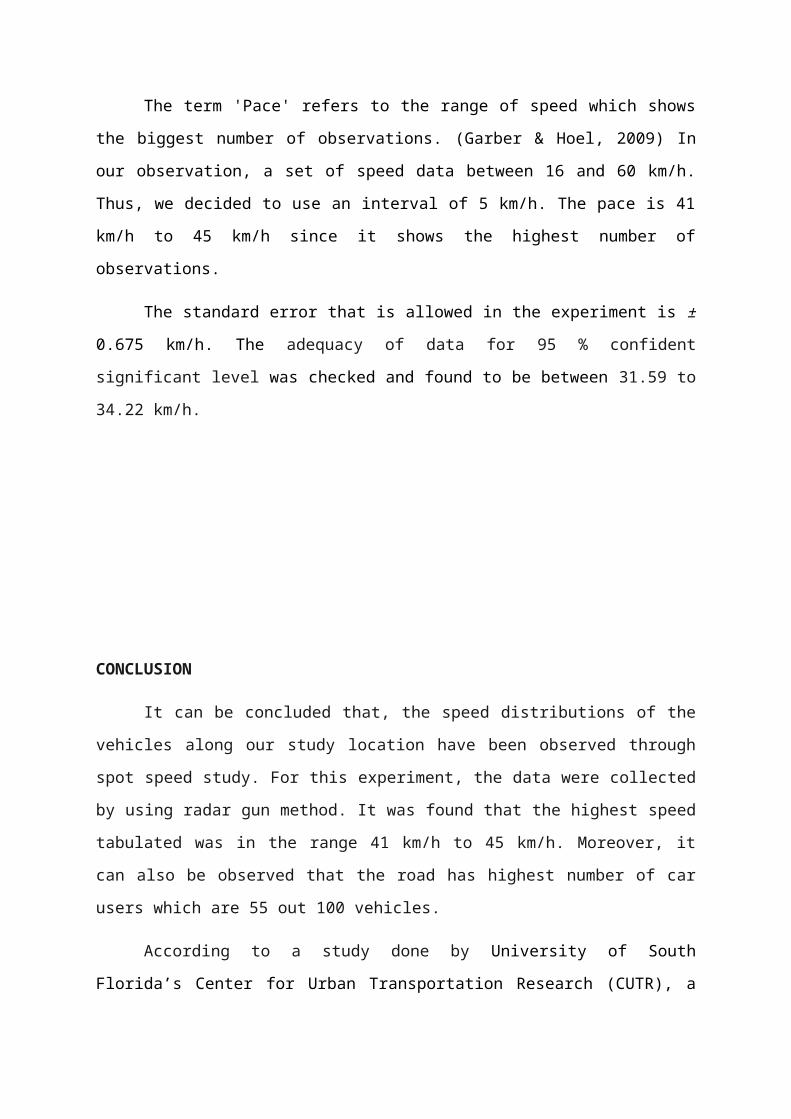
The term 'Pace' refers to the range of speed which shows
the biggest number of observations. (Garber & Hoel, 2009) In
our observation, a set of speed data between 16 and 60 km/h.
Thus, we decided to use an interval of 5 km/h. The pace is 41
km/h to 45 km/h since it shows the highest number of
observations.
The standard error that is allowed in the experiment is ±0.675 km/h. The adequacy of data for 95 % confident
significant level was checked and found to be between 31.59 to
34.22 km/h.
CONCLUSION
It can be concluded that, the speed distributions of the
vehicles along our study location have been observed through
spot speed study. For this experiment, the data were collected
by using radar gun method. It was found that the highest speed
tabulated was in the range 41 km/h to 45 km/h. Moreover, it
can also be observed that the road has highest number of car
users which are 55 out 100 vehicles.
According to a study done by University of South
Florida’s Center for Urban Transportation Research (CUTR), a

speed limit of 40 km/h was recommended for its campus area.
(USF Speed Limit Study, 2013)
If our campus were to use this recommended limit, it can
be seen that the mean speed found in our study is not
suitable. By implementing new speed limit, it can ensure more
safety especially for the pedestrians, bicycle users as well
as motorcycle users.
RECOMMENDATION
In addition, there are several factors that need to be
well taken to ensure the accuracy of the data such as the
location for the study, time of day, period of the study and
the minimum sample size necessary for the limit of acceptable
error. (Garber & Hoel, 2009)
The radar gun should be used to shoot the vehicle at 30o
angle and should not be obvious to the sight of the vehicles'
user.
Therefore, it can be suggested that our university should
implement a safe speed limit to increase safety and reduce the
number of accidents in the campus area.
REFERENCES
Garber, N. J., & Hoel, L. A. (2009). Traffic & Highway Engineering Fourth Edition. Toronto: Cengage Learning.
USF Speed Limit Study. (2013, 10 16). Retrieved from Center for Urban Transportation Research (CUTR):

http://www.cutr.usf.edu/2013/10/usf-speed-limit-study/
APPENDIX
Picture 1, 2 & 3: These are some of the apparatus and
materials used for the study.

Picture 4: The picture above shows our study location
which is in front of Pejabat Bendahari.
Picture 5: One of our group member used the measuring wheel to
measure the width of the road.

Picture 6: The radar gun was used to capture the vehicles'
speed and the other members will record the reading as well as
type of cars.
Picture 7 & 8: The pictures show some of the vehicles that
were included in our sample data.