Inflation Stabilisation and the Consumption of Durable Goods
Upload
khangminh22Category
view
7download
0
i
Breeding for Durable Resistance to Cercospora Leaf Spot Diseases in Groundnuts
(Arachis hypogaea L.) in Tanzania
By
Eliud Francis Kongola
BSc (Agronomy), MSc Crop Science (Crop Protection) Sokoine University of Agriculture,
Tanzania.
A thesis submitted in partial fulfilment of the requirements for the degree of
Doctor of Philosophy (PhD) in Plant Breeding
African Centre for Crop Improvement (ACCI)
School of Agricultural, Earth and Environmental Sciences
College of Agriculture, Engineering and Science
University of KwaZulu-Natal
Republic of South Africa
June 2018
ii
THESIS SUMMARY
Groundnut (Arachis hypogaea L.) is one of the most important legume crops in Tanzania. However,
production among smallholder farmers has declined in recent years. One of the constraints affecting
groundnut production are the Cercospora leaf spot diseases (CLD). Therefore, the main objective of
this study was to develop appropriate groundnut cultivars with resistance to CLD, combined with
other traits preferred by farmers, traders and processors, in order to improve food security, income
and livelihood of groundnut smallholder farmers in semi-arid parts of Tanzania.
The study had the following specific objectives: 1) to establish groundnut production constraints and
identify traits preferred by smallholder farmers’ and other stakeholders in the groundnut value chain
in Tanzania; 2) to evaluate the performance of Tanzanian germplasm and introduced groundnut
lines for yield and yield-related traits, and resistance to Cercospora leaf spot diseases in order to
select promising parents for breeding; 3) to determine the association between yield and yield-
related traits, and resistance to Cercospora leaf spot diseases through correlation coefficient, path
and cluster analyses to guide future groundnut breeding, 4) to determine gene action and heritability
of yield and resistance to Cercospora leaf spot diseases and to select promising parents and
crosses with enhanced yield and durable resistance to Cercospora leaf spot diseases in groundnut,
and 5) to determine performance of single cross parents versus double crosses and checks among
groundnut (Arachis hypogaea L.) intra botanical groups in multi-location trials.
.
A participatory rural appraisal (PRA) study was conducted in six villages of three selected groundnut
growing districts in the Dodoma region of Tanzania. The study identified several constraints facing
groundnut farmers such as drought, poor soil fertility, plant diseases, insect pests, availability of
seeds of improved varieties, unavailability of reliable market and a low market price. Constraints
facing groundnut traders included poor grain quality of mixed sizes and colour. On the other hand,
processors were constrained with low market price of their finished products (like peanut butter and
cooking oil), high cost of packaging materials, lack of investment capital, bureaucratic procedure in
business and brand registration, and the availability of other cheap sources of oil. The study
identified farmers’ trait preferences of groundnut varieties such as: an erect growth habit, high
yielding ability, a high oil content, tolerance to diseases and other environmental stresses, early
maturing, and with a large seed size, good taste, brown coloured seed and easy threshability.
Traders preferred groundnut varieties with a medium to large seed size with a brown seed colour.
Processors preferred groundnut varieties with a medium to large seed size, little pod constriction, a
sharp beak and a brown seed colour. A breeding programme aimed at improving groundnut
varieties for Cercospora leaf spot diseases resistance, and which specifically includes farmers’
iii
preference traits, may be the best option for developing new groundnut varieties that will be adopted
by the farmers.
To achieve the second objective, 84 groundnut genotypes from ICRISAT – Malawi, The Tanzania
National plant genetic resource centre, smallholder farmers and local market were evaluated in field
trials. The CLD was induced by inoculation of the fungi, which was cultured in the laboratory
following its isolation from infected leaves of groundnut. Genotypes evaluated revealed significant
variations in the CLD score and yield. Twenty one genotypes were identified with a significant
tolerance to CLD disease, a high number of pods per plant, relatively early maturity, and a high
number of mature pods per plant, pod yield, hundred seed weight and overall seed yield. In addition,
these genotypes had farmers’ preferred traits. The following groundnut genotypes; ICGV SM 96714,
ICGV 6057, TZA 2426, Local Makulu, ICG 6022, ICGV SM 07539, TZA 254, TZA 4280, KAKOMA,
ICGV SM 07508, TZA 2270, TZA 121, TZA 667, TZA 157, TZA 2498, TZA 3786, TZA 4390, TZA
4261, TZA 2444, TZA 534 and TZA 2518 were selected based on the above mentioned merits for
the inclusion in further breeding programmes.
The third objective of the study was to determine the association between yield and yield-related
traits, and resistance to Cercospora leaf spot diseases through correlation coefficient, path and
cluster analyses, in order to guide future groundnut breeding. Days to 50% flowering (DFL) was
positively correlated with days to maturity (DM) and Cercospora leaf spot diseases severity (CLDS).
The DFL was negatively correlated with the number of pods per plant (NPP), hundred seed weight
(HSW), number of seeds per pod (SPP) and seed yield (SY). The DM was positively correlated with
CLDS. The DM was negatively correlated with HSW, SPP and SY. The length of reproductive
branch (LRB) had no correlation with any of the traits studied. The CLDS was negatively correlated
with NPP, HSW, SPP and SY. The HSW was positively correlated with NPP, SPP and SY. The SPP
was positively correlated with SY. A positive direct effect on SY was depicted by SPP, CLDS, LRB
and DFL. A negative direct effect on SY was depicted by DM, NPP and HSW. An indirect effect on
SY via SPP was exhibited by HSW and NPP. Indirect effect on seed yield via CLDS was exhibited
by DFL, DM and LRB. An indirect effect on seed yield via DM was exhibited by NPP and HSW. Five
phenotypically diverse clusters were derived from the 84 groundnut genotypes sourced from
ICRISAT–Malawi, Tanzania National plant genetic resource centre, local market and smallholder
farmers. The five clusters had relatively different magnitude of means of yield and its related traits
ranging from low to high yielding. The five clusters had different reaction to Cercospora leaf spot
diseases ranging from tolerant to susceptible.
The fourth objective of this study was to determine the gene action and heritability of yield and
resistance to Cercospora leaf spot diseases, and to select promising parents and crosses with
iv
enhanced yield and resistance to Cercospora leaf spot diseases in groundnut. In this study it was
found that there were significant variations among genotypes for both yield and its components, and
Cercospora leaf spot disease severity (CLDS) in all three groundnut botanical groups (i.e. Valencia,
Virginia and Spanish). Good general combiners in the Valencia botanical group were Local Makulu,
TZA 121 and ICGV SM 96714; in the Virginia botanical group TZA 4280, TZA 4390 and ICGV 6022
and TZA 2518, while TZA 254 and ICGV SM 07508 were good general combiners in the Spanish
botanical group. The study identified crosses Local Makulu x ICGV SM 96714, TZA 121 x Kakoma,
TZA 3786 x Kakoma, TZA 157 x Kakoma, TZA 2498 x ICGV SM 96714 in the Valencia botanical
group; TZA 534 x ICGV 6057, TZA 4280 x ICGV 6022, TZA 4390 x ICGV 6022 and TZA 4261 x
ICGV 6057 for Virginia botanical group; and TZA 2444 x ICGV SM 07539, TZA 2518 x ICGV SM
07508, TZA 254 x ICGV SM 07508, TZA 2426 x ICGV SM 07539, TZA 2270 x ICGV SM 07539 and
TZA 2270 x ICGV SM 07508 in the Spanish botanical group with superior per se performance for
CLD resistance and yield. Both additive and non-additive gene effects were important in the
inheritance of CLD resistance and yield in all groundnut botanical groups. The dominance genetic
variance was larger than the additive genetic variance; therefore, inheritance of CLD resistance can
be transmitted to offspring by double cross mating design. Broad sense heritability was higher in
magnitude than narrow sense heritability indicating that these traits can be transmitted to progenies
through hybridization and selection can be conducted at later stages.
The last objective of this study was to determine performance of single cross parents versus double
cross hybrids and checks among groundnut (Arachis hypogaea L.) intra botanical groups in multi-
location trials. The study found out that, there were significant differences among evaluated
genotypes across environments and significant genotype x environment interaction for the studied
traits. In addition, there were significant G, E and GXE multiplicative terms for the studied traits. The
genotypes accounted for 61.67% of the treatment sum of squares, the environments and the
interaction between genotypes and the environment accounted for 18.95% and 19.38% of the
treatment sum of squares, respectively. The first and second IPCAs captured 41.33% and 25.96%
of the interaction sum of square and degree of freedom, respectively. The two IPCA axes jointly
accounted for 67.29% of the interaction sum of squares, leaving 32.71% of the variation due to G xE
interaction in the residual. The IPCA scores were both negative and positive for genotypes and
environments, whereby three environments were most discriminating, while the other three had high
correlation.

v
DECLARATION
I, Eliud Francis Kongola, declare that:
1. The research reported in this thesis, except where otherwise indicated, is my original work.
2. This thesis has not been submitted for any degree or examination at any other university.
3. This thesis does not contain other persons’ data, pictures, graphs or other information, unless
specifically acknowledged as being sourced from other persons.
4. This thesis does not contain other persons’ writing, unless specifically acknowledged as being
sourced from other researchers. Where other written sources have been quoted, then:
a. Their words have been re-written but the general information attributed to them has been
referenced.
b. Where their exact words have been used, then their writing has been placed in italics and inside
quotation marks, and referenced.
5. This thesis does not contain text, graphics or tables copied and pasted from the internet, unless
specifically acknowledged, and the source being detailed in the thesis and in the reference
section.
Signed:…..……………………………………Date: ..……………………………
Eliud Francis Kongola
As the candidate’s supervisors, we agree to the submission of the thesis for examination:
Signed:…………………………………………Date:.……….……………………
Prof. Rob Melis (Main supervisor)
Signed:…………………………………………Date:..…………………………….
Dr. Julia Sibiya (Co-supervisor)
vi
ACKNOWLEDGEMENT
First of all, I would like to thank the Almighty God for the opportunity to study and reach this far. It is
by His grace and mercies I live, move, and have my being. Indeed, nothing is impossible with God.
Father I give all the glory, honour, power and praise to you. Amen!
I am very grateful to the Alliance for a Green Revolution in Africa (AGRA) for funding this study
through the African Centre for Crop Improvement (ACCI) at the University of KwaZulu-Natal
(UKZN). I am also very grateful to my supervisors, Prof. Rob Melis and Dr. Julia Sibiya for their
guidance, academic input and encouragement throughout the research and final thesis write-up.
Special thanks also go to the entire ACCI academic team, particularly Mrs Lesley Brown and Mrs
Rowelda Donnelly, for tirelessly handling academic, administrative and financial.
My sincere thanks also go to Dr. Omary Mponda (in-country supervisor) for his guidance and
genuine advice. I am also grateful to Prof. Patrick Okori, Wills Munthali and Harvey Jay of ICRISAT-
Malawi and Dr. Mary Mollel of the Tanzania National Plant Genetic Resource Centre for their
assistance in providing me with germplasm used in this study.
Thanks are due to the permanent secretary of the Ministry of Agriculture, Food Security and
Cooperatives of the United Republic of Tanzania for granting me study leave. Also many thanks go
to the Central Zone Agricultural Research Director Mr. Leon Mrosso and the officer in charge of the
Hombolo Agricultural Research Institute Mr. Elias Letayo for granting me access to field, laboratory
and transport facilities during my entire study period. The entire staff of the Hombolo, Makutupora
and Tumbi Agricultural Research Institutes and the Bihawana Farmers’ Training Centre are thanked
for their support and technical advice during the period of my research work.
I would also like to thank the ACCI 2014 cohort: Prossy, Damien, Maurice, Ronald, Solomon,
Eduardo, Emmanuel and Filson without forgetting our classmates Lydia and Learnmore who were
under different scholarships. They have been wonderful friends and colleagues.
Last but not least, I am deeply thankful to my beloved wife, Upendo Mandia-Kongola, for taking care
of our children during their tender age, my son Festus and my daughter Ruth-Divine for the love,
support and patience they offered to me throughout the study period. My Dad and Mum, who have
always been my role models in life and to my siblings Moses, Maxmillian, Edwin, Melkzedeck,
Blandina and Alpha for their moral and material support and encouragement. God bless you all
abundantly.

vii
DEDICATION
This thesis is dedicated to my parents Francis Moses Kongola and Mary Zephania Massi who took
action to send me to school, my wife Upendo, my children Festus and Ruth-Divine Eliud Kongola for
their enduring love and patience during the whole period of my study.

viii
TABLE OF CONTENTS
THESIS SUMMARY .............................................................................................................. ii
ACKNOWLEDGEMENT ....................................................................................................... vi
DEDICATION ...................................................................................................................... vii
TABLE OF CONTENTS ...................................................................................................... viii
LIST OF TABLES ............................................................................................................... xiv
LIST OF FIGURES ............................................................................................................ xvii
Introduction to the Thesis ......................................................................................................1
1. Background ...................................................................................................................1
1.1 Importance of groundnut .....................................................................................1
1.2 Cercospora leaf spot disease and its control measures .....................................1
1.3 Constraints to groundnut production ...................................................................2
1.4 Research justification..........................................................................................2
2. Overall objective ............................................................................................................3
3. Specific objectives .........................................................................................................3
4. Thesis outline ................................................................................................................4
References ............................................................................................................................5
Chapter 1: Literature Review .................................................................................................7
1.1 Introduction .........................................................................................................7
1.2 Origin, botany and taxonomy of groundnut .........................................................7
1.2.1 Origin of groundnuts .................................................................................7
1.2.2 Botany and taxonomy ..............................................................................7
1.3 Historical background of groundnut production, research and breeding in
Tanzania .............................................................................................................9
1.4 Groundnut production and productivity ............................................................. 10
1.5 Importance and uses of groundnut ................................................................... 12
1.6 Constraints to groundnut production ................................................................. 13
ix
1.7 Cercospora leaf spot diseases ......................................................................... 14
1.7.1 Causative agent and symptoms of Cercospora leaf spot disease .......... 14
1.7.2 Components of Cercospora leaf spot disease resistance ...................... 15
1.8 Breeding for durable resistance against Cercospora leaf spot diseases in
groundnut ......................................................................................................... 15
1.9 Mating designs use in breeding programs ........................................................ 16
1.10 Combining ability studies in groundnut ............................................................. 17
1.11 Participatory plant breeding .............................................................................. 18
1.12 Factors influencing variety adoption ................................................................. 18
References .......................................................................................................................... 20
Chapter 2: Groundnut production constraints and traits preferred by stakeholders in
the groundnut value chain in semi- arid areas of Tanzania ......................................... 29
Abstract ....................................................................................................................... 29
2.1 Introduction ....................................................................................................... 30
2.2 Material and methods ....................................................................................... 31
2.2.1 Description of the study area and sampling method .............................. 31
2.2.2 Data collection........................................................................................ 33
2.3 Data analysis .................................................................................................... 34
2.4 Results .............................................................................................................. 34
2.4.1 Socio-economic characteristics of the households ................................. 34
2.4.2 Crops grown in the 2012/13 to 2014/15 production seasons ................. 34
2.4.3 Groundnut varieties and seed sources ................................................... 36
2.4.4 Seed sources of groundnut varieties ...................................................... 36
2.4.5 Groundnut production, consumption and marketing............................... 37
2.4.6 Constraints experienced by groundnut smallholder farmers, traders
and processors...................................................................................... 38
2.4.7 Groundnut variety characteristics preferred by small-holder farmers,
traders and processors .......................................................................... 39
x
2.4.8 Awareness on Cercospora leaf spot disease and adoption of
varieties by farmers ................................................................................ 40
2.5 Discussion ........................................................................................................ 43
2.6 Conclusion ........................................................................................................ 45
References .......................................................................................................................... 46
Chapter 3: Evaluation of Tanzanian and introduced groundnut germplasm for yield
and its component traits, and reaction to Cercospora leaf spot diseases ................... 50
Abstract ....................................................................................................................... 50
3.1 Introduction ....................................................................................................... 51
3.2 Material and methods ....................................................................................... 52
3.2.1 Plant materials ....................................................................................... 52
3.2.2 Inoculum preparation ............................................................................. 54
3.2.3 Inoculation of Cercospora leaf spot diseases in groundnut
genotypes .............................................................................................. 55
3.3 Study site, experimental design and trial management .................................... 55
3.4 Data collection ................................................................................................. 56
3.5 Data analysis .................................................................................................... 57
3.6 Results .............................................................................................................. 58
3.6.1 Analysis of variance for Cercospora leaf spot disease score, yield
and yield related traits ............................................................................ 58
3.6.2 Genetic variability among groundnut genotypes .................................... 62
3.7 Discussion ........................................................................................................ 62
3.8 Conclusion ........................................................................................................ 64
References .......................................................................................................................... 65
Chapter 4: Correlation, path-coefficient and cluster analyses of yield and yield-
related traits and resistance to Cercospora leaf spot diseases in groundnut .............. 69
Abstract ....................................................................................................................... 69
4.1 Introduction ....................................................................................................... 70
xi
4.2 Material and methods ....................................................................................... 70
4.2.1 Study site, experimental design and trial establishment ......................... 70
4.2.2 Data collection........................................................................................ 71
4.3 Data analysis .................................................................................................... 72
4.4 Results .............................................................................................................. 74
4.4.1 Correlation analysis ................................................................................ 74
4.4.2 Path analysis for seed yield ................................................................... 74
4.4.3 Path analysis for Cercospora leaf spot diseases.................................... 75
4.4.4 Cluster analysis based on agro-morphological traits in groundnut ......... 76
4.5 Discussion ........................................................................................................ 80
Correlation coefficient for Cercospora leaf spot disease and yield related
traits among groundnut genotypes ......................................................... 80
Path analysis for seed yield .............................................................................. 80
Path analysis for Cercospora leaf spot disease ................................................ 81
Cluster analysis for selected yield components and CLD in groundnut
genotypes. ............................................................................................. 81
4.6 Conclusion ........................................................................................................ 82
References .......................................................................................................................... 83
Chapter 5: Gene action and heritability of groundnut seed yield and resistance to
Cercospora leaf spot diseases .................................................................................... 86
Abstract ....................................................................................................................... 86
5.1 Introduction ....................................................................................................... 87
5.2 Material and methods ....................................................................................... 88
5.2.1 Study site and parental selection ........................................................... 88
5.2.2 Hybridization procedure ......................................................................... 89
5.2.3 Experimental design and field establishment ......................................... 89
5.3 Data collection .................................................................................................. 90
5.3.1 Yield and related parameters ................................................................. 90
xii
5.3.2 Cercospora leaf spot disease resistance ............................................... 90
5.4 Statistical analyses ........................................................................................... 90
5.4.1 Analysis of variance and estimation of combining ability ........................ 90
5.4.2 Estimation of heritability ......................................................................... 91
5.5 Results .............................................................................................................. 91
5.6 Discussion ...................................................................................................... 101
5.6.1 Combined analysis of variance for the different botanical groups ........ 101
5.6.2 General combining ability effects of parents for Valencia botanical
group .................................................................................................... 101
5.6.3 General combining ability effects of parents for Virginia botanical
group .................................................................................................... 102
5.6.4 General combining ability effects of Spanish parents ........................... 103
5.6.5 Specific combining ability effects for Valencia botanical group ............ 103
5.6.6 Specific combining ability effects for Virginia botanical group .............. 104
5.6.7 Specific combining ability for Spanish groundnut botanical group ....... 104
5.6.8 Heritability for yield, yield components and Cercospora leaf spot
disease in different groundnut botanical groups ................................... 105
5.7 Conclusion ...................................................................................................... 105
References ........................................................................................................................ 107
Chapter 6: Performance of single cross parents versus double crosses and checks
among groundnut (Arachis hypogaea L.) intra botanical groups in multi-
location trials ............................................................................................................. 110
Abstract ..................................................................................................................... 110
6.1 Introduction ..................................................................................................... 111
6.2 Materials and methods ................................................................................... 112
6.2.1 Study site and parental selection ......................................................... 112
6.2.2 Experimental design and field establishment ....................................... 112
6.3 Data collection ................................................................................................ 114
xiii
6.4 Statistical analysis .......................................................................................... 114
6.5 Results ............................................................................................................ 115
6.5.3 Combined analysis of variance ............................................................ 115
6.6 Discussion ...................................................................................................... 120
6.7 Conclusion ...................................................................................................... 121
References ........................................................................................................................ 122
Chapter 7: An overview of the research findings ............................................................... 124
7.1 Introduction and objectives of the study.......................................................... 124
7.2 Research findings in brief ............................................................................... 125
7.2.1 Groundnut production constraints and traits preference by
smallholder farmers’ and other stakeholders in the groundnut value
chain in Central Tanzania. ................................................................... 125
7.2.2 Evaluation of Tanzanian germplasm and introduced groundnut lines
for resistance to Cercospora leaf spot diseases, yield and yield-
related traits and selection of promising parents for further
breeding. .............................................................................................. 126
7.2.3 Association of yield and yield-related traits and resistance to
Cercospora leaf spot diseases through correlation, path and cluster
analysis to guide future groundnut breeding. ....................................... 127
7.2.4 To determine gene action and heritability of yield and resistance to
Cercospora leaf spot diseases and to select promising parents and
crosses with enhanced yield and durable resistance to Cercospora
leaf spot diseases in groundnut............................................................ 128
7.2.5 Performance of single cross parents versus double crosses and
checks among groundnut (Arachis hypogaea L.) intra botanical
groups in multi-location trials. ............................................................... 129
xiv
LIST OF TABLES
Table 1.1. Released groundnut varieties in Tanzania. ........................................................ 10
Table 1.2: World groundnut production (unshelled) 2010 to 2014. ...................................... 11
Table 1.3: Groundnut production (unshelled) in Africa from 2010 to 2014 .......................... 11
Table 1.4: Groundnut productions (unshelled) in Tanzania from 2010 to 2014 ................... 11
Table 1.5: Constraints of groundnut production in Tanzania. .............................................. 13
Table 1.6: Comparisons of symptoms of early and late leaf spot of groundnut ................... 14
Table 2.1: Household socio-economic characteristics district wise ..................................... 34
Table 2.2: Crops grown in the study area in three seasons across districts. ....................... 35
Table 2.3: Groundnut varieties grown in two seasons by district ......................................... 36
Table 2.4: Sources of groundnut seed (percentage) in two seasons in three districts ....... 37
Table 2.5: Mean production, consumption and sales district wise in 2013/14 season. ...... 38
Table 2.6: Groundnut characteristics preferred by smallholder farmers, traders and
processors in the study area. ............................................................................ 40
Table 2.7: Farmers’ awareness and control measures of Cercospora leaf spot diseases. .. 41
Table 2.8: Cercospora leaf spot disease survey in the study area. ..................................... 42
Table 3.1: List and sources of eighty-four groundnut genotypes used in the study. ............ 53
Table 3.2: Cercospora leaf spot disease scale. ................................................................... 57
Table 3.3: Analysis of variance for Cercospora leaf spot disease severity, yield and
selected yield related traits across sites and seasons. ..................................... 59
Table 3.4: Means of agro-morphological characters and Cercospora leaf spot disease
severity for groundnut genotypes evaluated across sites and seasons. ........... 59
Table 3.5: Genetic variability, heritability and genetic advance among groundnut genotypes.
......................................................................................................................... 62
Table 4.1: Description of Cercospora leaf spot disease rating scale (1-9). ......................... 71
Table 4.2 : Means of yield related traits and Cercospora leaf spot disease severity of eighty-
four genotypes. ................................................................................................. 72
Table 4.3: Phenotypic correlation coefficients among selected yield characters and
Cercospora leaf spot disease severity. ............................................................. 74
Table 4.4: Direct (diagonal) and indirect (non-diagonal) effects of selected yield contributing
characters on seed yield among 84 groundnut genotypes. .............................. 75
xv
Table 4.5: Direct (diagonal) and indirect (non-diagonal) effects of Cercospora leaf spot
disease severity on selected yield contributing characters among 84 groundnut
genotypes. ........................................................................................................ 76
Table 4.6: Cluster means and ranges for seed yield and its component traits, and reaction
to Cercospora leaf spot disease among 84 groundnut genotypes. ................... 78
Table 5.1: List of parental material used in the Line x Tester mating design to develop
single crosses. .................................................................................................. 89
Table 5.2: Mean squares and significance tests for yield, selected yield related traits and
Cercospora leaf spot disease severity of parents and crosses derived from the
Valencia groundnut botanical group evaluated in three sites in Tanzania. ...... 92
Table 5.3: Mean squares, significant tests of yield, selected yield related traits and
Cercospora disease severity of crosses derived from the Virginia groundnut
botanical group evaluated in three sites in Tanzania. ....................................... 93
Table 5.4: Mean squares and significant tests of yield, yield related traits and Cercospora
leaf spot disease severity of crosses derived from the Spanish groundnut
botanical group evaluated in three sites in Tanzania. ....................................... 94
Table 5.5: Estimates of the General Combining Ability effects of Valencia groundnut
genotypes used as parents for yield, yield related traits and resistance to
Cercospora leaf spot disease. .......................................................................... 95
Table 5.6 : Estimates of the General Combining Ability effects of Virginia groundnut
genotypes used as parents for yield, yield related traits and resistance to
Cercospora leaf spot disease. .......................................................................... 95
Table 5.7: Estimates of the General Combining Ability effects of Spanish groundnut
genotypes used as parents for yield, yield related traits and resistance to
Cercospora leaf spot disease. .......................................................................... 96
Table 5.8: Estimates of Specific Combining Ability effects of the hybrids of Valencia
groundnut botanical group for days to flowering, Cercospora leaf spot disease
severity number of mature pods per plant, hundred seed weight and seed yield
evaluated in three sites. .................................................................................... 97
Table 5.9: Estimates of Specific Combining Ability effects of the hybrids of Virginia
groundnut botanical group for days to flowering, Cercospora leaf spot disease
severity, number of mature pods per plant, hundred seed weight and seed yield
evaluated in three sites. .................................................................................... 98
xvi
Table 5.10: Estimates of Specific Combining Ability effects of the hybrids of Spanish
groundnut botanical group for days to flowering, Cercospora leaf spot disease
severity, number of mature pods per plant, hundred seed weight and seed yield
in three sites. .................................................................................................... 99
Table 5.11: Estimates of the variance components and heritability for yield and its related
traits and Cercospora leaf spot disease score for the Valencia groundnut
botanical group. .............................................................................................. 100
Table 5.12: Estimates of the variance components and heritability for yield and its related
traits and Cercospora leaf spot disease score for Virginia botanical group. ... 100
Table 5.13: Estimates of the variance components and heritability for yield and its related
traits and Cercospora leaf spot disease score for Spanish botanical group. .. 101
Table 6.1: List of 24 groundnut genotypes evaluated for CLD tolerance and, yield and yield
related traits across six sites in Tanzania. ...................................................... 113
Table 6.2a: Crossing scheme of single crosses to obtain double crosses for Cercospora
leaf spot disease resistance and yield in groundnuts. .................................... 113
Table 6.2b: Crossing scheme of single crosses to obtain reciprocal double crosses for
Cercospora leaf spot disease resistance and yield in groundnuts......…114
Table 6.3: Combined analysis of variance for CLDS, SY and yield related traits over six
environments. ................................................................................................. 115
Table 6.4: Mean performance of groundnut CLDS, seed yield and yield related traits across
six environments. ............................................................................................ 116
Table 6.5: Analysis of variance based on the AMMI model for Cercospora leaf spot disease
severity of 24 genotypes over six environments. ............................................ 117
Table 6.6: The IPCA1 and IPCA 2 scores for 24 groundnut genotypes evaluated in six
evironments. ................................................................................................... 118
Table 6.7: The IPCA1, IPCA2 scores of six environments based on environmental mean
CLD ................................................................................................................ 118
xvii
LIST OF FIGURES
Figure 2.1 Interview with groundnut processors during Nane nane Agricultural show at .... 32
Figure 2.2: A=Groundnut shelling at Kigwe village, Bahi district; B = Cercospora leaf ...... 32
Figure 2.3: Interview with farmers during PRA ................................................................... 33
Figure 2.4: A= Groundnut in monoculture and B= Intercropped with maize ...................... 33
Figure 2.5: Constraints facing groundnut farmers in the different districts. ......................... 39
Figure 3.1: Field identification of symptoms of Cercospora leaf spot diseases ................... 55
Figure 3.2: Cercospora fungi inoculation in the field trial .................................................... 55
Figure 3.3: Screening plots: A is Makutupora research station; B is Hombolo research
station; C is Bihawana farmers’ training centre ................................................. 56
Figure 3.4: A= Early leaf spot; B= Late leaf spot disease symptoms ................................. 56
Figure 4.1: Dendrogram of 84 genotypes based on hierarchical cluster analysis using Ward
Linkage Methods and Squared Euclidean
Distance Measure as distance measure. 79
Figure 6.1: Cercospora leaf spot disease severity Bi-plot of GE based on AMMI2 for the
first two interactions principal component scores. .......................................... 119
1
Introduction to the Thesis
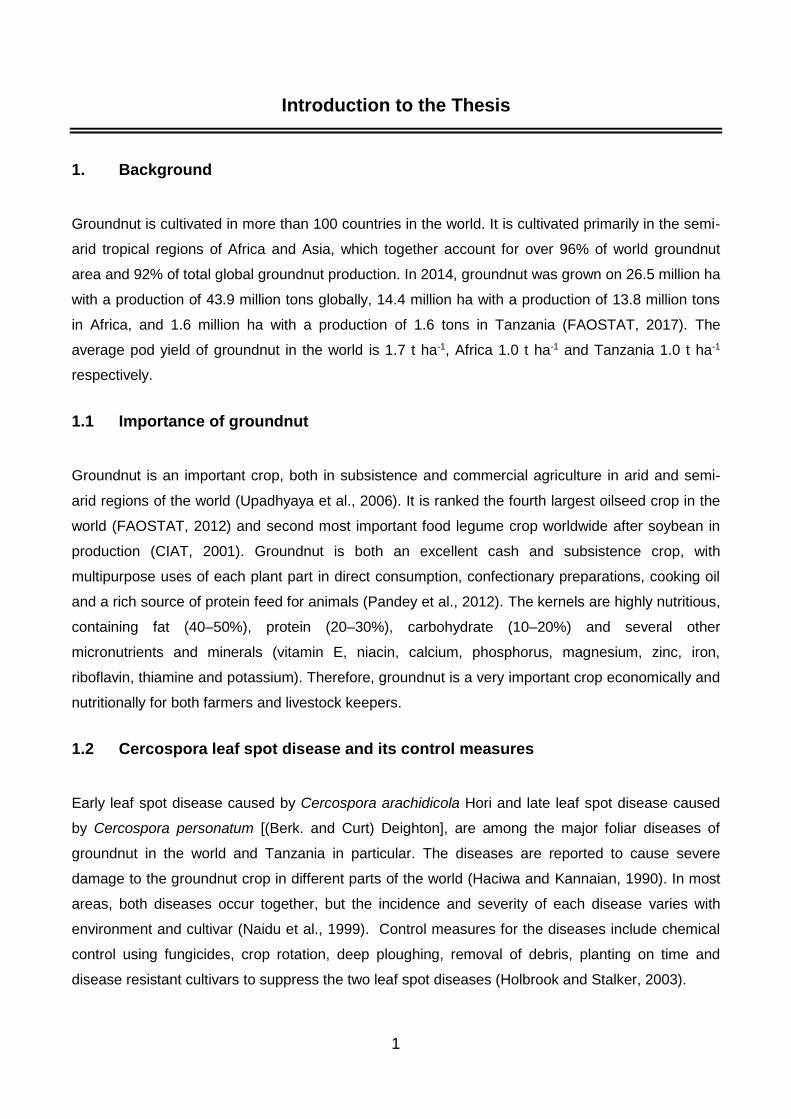
1. Background
Groundnut is cultivated in more than 100 countries in the world. It is cultivated primarily in the semi-
arid tropical regions of Africa and Asia, which together account for over 96% of world groundnut
area and 92% of total global groundnut production. In 2014, groundnut was grown on 26.5 million ha
with a production of 43.9 million tons globally, 14.4 million ha with a production of 13.8 million tons
in Africa, and 1.6 million ha with a production of 1.6 tons in Tanzania (FAOSTAT, 2017). The
average pod yield of groundnut in the world is 1.7 t ha-1, Africa 1.0 t ha-1 and Tanzania 1.0 t ha-1
respectively.
1.1 Importance of groundnut
Groundnut is an important crop, both in subsistence and commercial agriculture in arid and semi-
arid regions of the world (Upadhyaya et al., 2006). It is ranked the fourth largest oilseed crop in the
world (FAOSTAT, 2012) and second most important food legume crop worldwide after soybean in
production (CIAT, 2001). Groundnut is both an excellent cash and subsistence crop, with
multipurpose uses of each plant part in direct consumption, confectionary preparations, cooking oil
and a rich source of protein feed for animals (Pandey et al., 2012). The kernels are highly nutritious,
containing fat (40–50%), protein (20–30%), carbohydrate (10–20%) and several other
micronutrients and minerals (vitamin E, niacin, calcium, phosphorus, magnesium, zinc, iron,
riboflavin, thiamine and potassium). Therefore, groundnut is a very important crop economically and
nutritionally for both farmers and livestock keepers.
1.2 Cercospora leaf spot disease and its control measures
Early leaf spot disease caused by Cercospora arachidicola Hori and late leaf spot disease caused
by Cercospora personatum [(Berk. and Curt) Deighton], are among the major foliar diseases of
groundnut in the world and Tanzania in particular. The diseases are reported to cause severe
damage to the groundnut crop in different parts of the world (Haciwa and Kannaian, 1990). In most
areas, both diseases occur together, but the incidence and severity of each disease varies with
environment and cultivar (Naidu et al., 1999). Control measures for the diseases include chemical
control using fungicides, crop rotation, deep ploughing, removal of debris, planting on time and
disease resistant cultivars to suppress the two leaf spot diseases (Holbrook and Stalker, 2003).
2
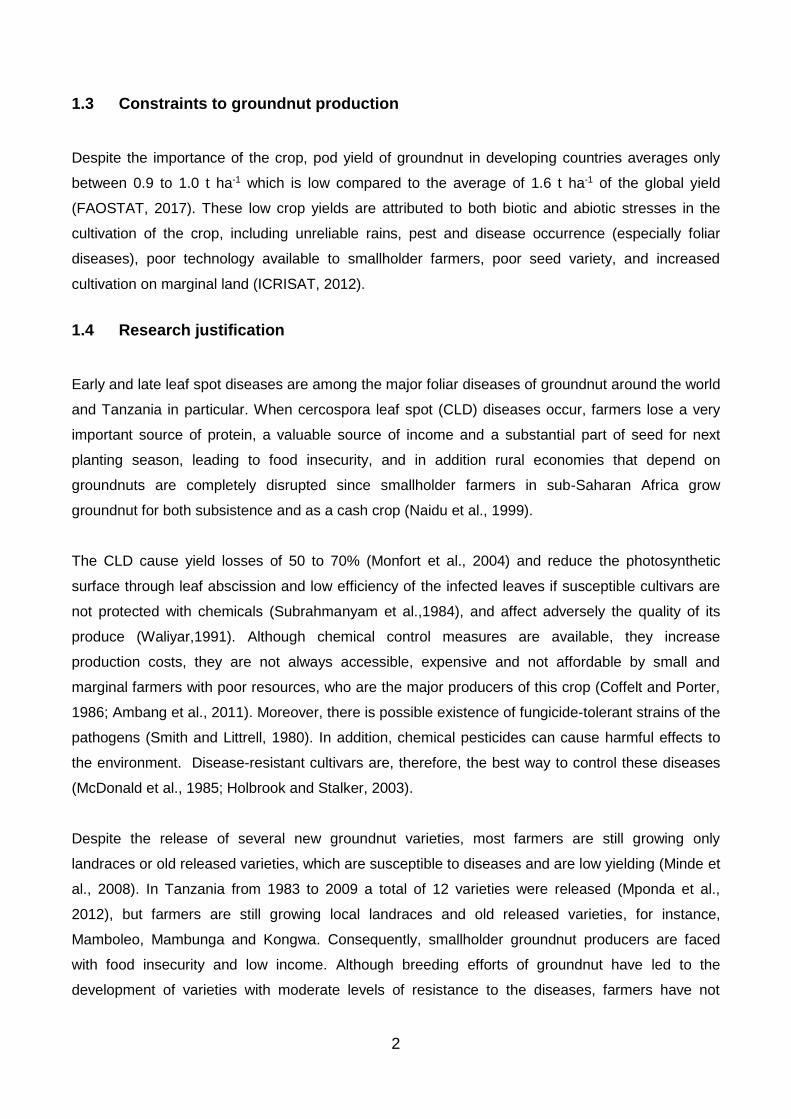
1.3 Constraints to groundnut production
Despite the importance of the crop, pod yield of groundnut in developing countries averages only
between 0.9 to 1.0 t ha-1 which is low compared to the average of 1.6 t ha-1 of the global yield
(FAOSTAT, 2017). These low crop yields are attributed to both biotic and abiotic stresses in the
cultivation of the crop, including unreliable rains, pest and disease occurrence (especially foliar
diseases), poor technology available to smallholder farmers, poor seed variety, and increased
cultivation on marginal land (ICRISAT, 2012).
1.4 Research justification
Early and late leaf spot diseases are among the major foliar diseases of groundnut around the world
and Tanzania in particular. When cercospora leaf spot (CLD) diseases occur, farmers lose a very
important source of protein, a valuable source of income and a substantial part of seed for next
planting season, leading to food insecurity, and in addition rural economies that depend on
groundnuts are completely disrupted since smallholder farmers in sub-Saharan Africa grow
groundnut for both subsistence and as a cash crop (Naidu et al., 1999).
The CLD cause yield losses of 50 to 70% (Monfort et al., 2004) and reduce the photosynthetic
surface through leaf abscission and low efficiency of the infected leaves if susceptible cultivars are
not protected with chemicals (Subrahmanyam et al.,1984), and affect adversely the quality of its
produce (Waliyar,1991). Although chemical control measures are available, they increase
production costs, they are not always accessible, expensive and not affordable by small and
marginal farmers with poor resources, who are the major producers of this crop (Coffelt and Porter,
1986; Ambang et al., 2011). Moreover, there is possible existence of fungicide-tolerant strains of the
pathogens (Smith and Littrell, 1980). In addition, chemical pesticides can cause harmful effects to
the environment. Disease-resistant cultivars are, therefore, the best way to control these diseases
(McDonald et al., 1985; Holbrook and Stalker, 2003).
Despite the release of several new groundnut varieties, most farmers are still growing only
landraces or old released varieties, which are susceptible to diseases and are low yielding (Minde et
al., 2008). In Tanzania from 1983 to 2009 a total of 12 varieties were released (Mponda et al.,
2012), but farmers are still growing local landraces and old released varieties, for instance,
Mamboleo, Mambunga and Kongwa. Consequently, smallholder groundnut producers are faced
with food insecurity and low income. Although breeding efforts of groundnut have led to the
development of varieties with moderate levels of resistance to the diseases, farmers have not
3
adopted them because they lack farmers’ and market preferred traits. This study therefore, focused
on determining the reaction of different groundnut germplasm to CLD in order to create a basis for a
resistance breeding programme for CLD in Tanzania
2. Overall objective
The overall goal of this study is to improve groundnut productivity in order to improve food security,
income and livelihood of groundnut growers in Central Tanzania.
.
3. Specific objectives
The study had the following specific objectives:
i. To establish groundnut production constraints and identify traits preferred by smallholder
farmers and other stakeholders in the groundnut value chain in Central Tanzania.
ii. To evaluate the performance of Tanzanian germplasm and introduced groundnut lines for
yield and yield-related traits, and the resistance to Cercospora leaf spot diseases, in order to
select promising parents for breeding.
iii. To determine the associations between yield and yield-related traits, and resistance to
Cercospora leaf spot diseases through correlation, cluster and path analysis in order to
guide future groundnut breeding.
iv. To determine gene action and heritability of yield and resistance to Cercospora leaf spot
diseases, and to select promising parents and crosses with enhanced yield and durable
resistance to Cercospora leaf spot diseases in groundnut.
v. To determine the performance of single cross parents versus double crosses and checks
among groundnut (Arachis hypogaea L.) intra botanical groups in multi-location trials.
4
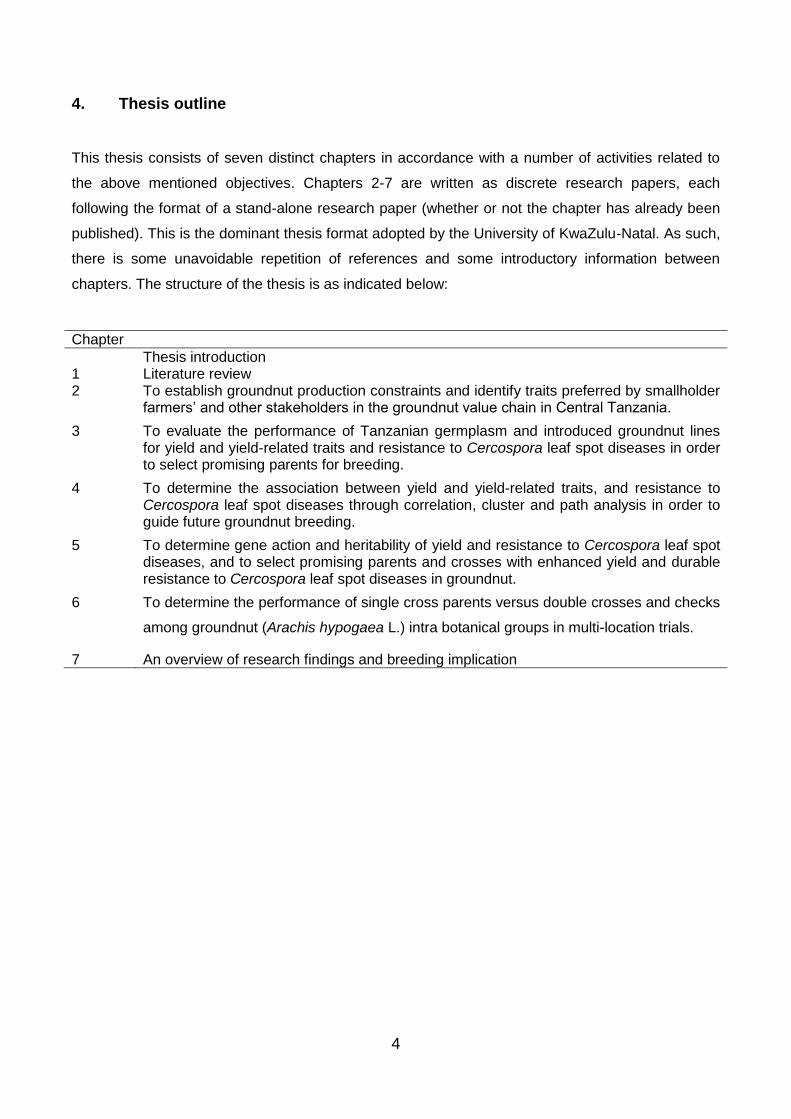
4. Thesis outline
This thesis consists of seven distinct chapters in accordance with a number of activities related to
the above mentioned objectives. Chapters 2-7 are written as discrete research papers, each
following the format of a stand-alone research paper (whether or not the chapter has already been
published). This is the dominant thesis format adopted by the University of KwaZulu-Natal. As such,
there is some unavoidable repetition of references and some introductory information between
chapters. The structure of the thesis is as indicated below:
Chapter
Thesis introduction 1 Literature review 2 To establish groundnut production constraints and identify traits preferred by smallholder
farmers’ and other stakeholders in the groundnut value chain in Central Tanzania.
3 To evaluate the performance of Tanzanian germplasm and introduced groundnut lines for yield and yield-related traits and resistance to Cercospora leaf spot diseases in order to select promising parents for breeding.
4 To determine the association between yield and yield-related traits, and resistance to Cercospora leaf spot diseases through correlation, cluster and path analysis in order to guide future groundnut breeding.
5 To determine gene action and heritability of yield and resistance to Cercospora leaf spot diseases, and to select promising parents and crosses with enhanced yield and durable resistance to Cercospora leaf spot diseases in groundnut.
6 To determine the performance of single cross parents versus double crosses and checks
among groundnut (Arachis hypogaea L.) intra botanical groups in multi-location trials.
7 An overview of research findings and breeding implication
5
References
Ambang, Z., Ndongo, B., Essono, G., Ngoh, J.P., Kosma, P. and Chewachong, G.M. (2008).
Control of Leaf Spot Disease Caused by Cercospora sp on Groundnut (Arachis hypogaea L.)
Using Methanolic Extracts of Yellow Oleander (Thevetia peruviana) seeds. Australian
Journal of Crop Science 5:227-232.
CIAT. (2001). Annual Bean Report, Bean Program. CIAT, Cali, Colombia.
Coffelt, T.A. and Porter, D.M. (1986). Field Screening of Reciprocal Chico x Florigiant Peanut
Populations for Resistance to Leaf Spot in Virginia. Peanut Science 13:57-60.
FAOSTAT. (2012). Food and Agriculture Organization of the United Nations, Statistics division,
FAOSTAT database.
FAOSTAT. (2017). Food and Agriculture Organization of the United Nations, Statistics division,
FAOSTAT database.
Haciwa, H.C. and Kannaiyan, J. (1990). Prevalence of groundnut diseases and extend of yield
losses due to leaf spot diseases in Zambia. Proceedings of the 4th Regional Groundnut
Workshop for Southern Africa, 19th-23rd March, 1990, Arusha, Tanzania. ICRISAT,
Patancheru, India.
Holbrook, C.C. and Stalker, H.T. (2003). Peanut breeding and genetic resources. In: Janick, J.
(Editor). Plant Breeding Reviews. John Wiley and Sons, Inc. New York. Pp. 297-356.
ICRISAT. (2012). Groundnut Crop, International Crops Research Institute for the Semi-Arid Tropics.
McDonald, D., Subrahmanyam, P., Gibbons, R.W. and Smith, D.H. (1985). Early and late leaf spots
of groundnut. Information Bulletin no. 21. Patancheru, A.P. 502324, India: International
Crops Research Institute for the Semi-Arid Tropics. Pp.24.
Minde, I., Madzonga, O., Kantithi, G., Phiri, K. and Pedzisa, T. (2008). Constraints, Challenges and
Opportunities in Groundnut Production and Marketing in Malawi, International Crops
Research Institute for the Semi - Arid Tropics, Bulawayo, Zimbabwe.
Monfort, W.S., Culbreath, A.K., Stevenson, K.L., Brenneman, T.B., Gorbet, D.W. and Phatak, S.C.
(2004). Effects of Reduced Tillage, Resistant Cultivars, and Reduced Fungicide Inputs on
Progress of Early Leaf Spot of Peanut (Arachis hypogaea L.). Plant Disease 88:858-864.
6
Mponda, O., Kafiriti, E., Mfaume, J., Daudi, H. and Mashamba, P. (2012). TL-I Groundnut breeding
status report for Tanzania. Presented at Annual Meeting -Tropical Legumes I-Phase 2
Generation Challenge Programme. 7th-11th May 2012, Addis Ababa, Ethiopia.
Naidu, R.A., Kimmins, F.M., Deom, C.M., Subrahmanyam, P., Chiyembekeza, A.J. and Van der
Merwe, P.J.A. (1999). Groundnut Rosette: A Virus Disease Affecting Groundnut Production
in Sub-Saharan Africa. Plant Disease 83:700-709.
Pandey, M.K., Monyo, E., Ozias-Akins, P., Liang, X., Guimarães, P. and Nigam, S.N.
(2012). Advances in Arachis Genomics for Peanut Improvement. Biotechnology Advances
30:639–651.
Smith, D.B. and Littrell, R.H. (1980). Management of Peanut Foliar Diseases with Fungicides. Plant
Disease 64:356-361.
Subrahmanyam, P., McDonald, D. and Hammons, R.O. (1984). Rust. In: Compendium of Peanut
Diseases. Porter, D.M., Smith, D.H. and Rodriguez-Kabana, R. (Editors). St. Paul, Minnesota,
USA. American Phytopathological Society, Pp. 7-9.
Waliyar, F. (1991). Evaluation of yield losses due to groundnut leaf diseases in West Africa.
Proceedings of the 2nd ICRISAT Regional Groundnut Meeting for West Africa, 11-14th
September, 1991. Niamey, Niger. ICRISAT, Patancheru, India, Pp. 32-33.
7
Chapter 1: Literature Review
1.1 Introduction
In this chapter the literature on groundnut is reviewed to cover information relevant to the research
focus in order to provide the theoretical basis for the research, and provide an insight into the
following topics: botany, origin and taxonomy, importance, historical background; production,
research and breeding of groundnut in Tanzania, and the productivity and importance of groundnut.
In addition, literature on Cercospora leaf spot diseases (CLD), components of CLD disease
resistance, breeding for durable resistance to CLD diseases, mating designs, combining ability
study in groundnuts and factors influencing adoption of new varieties are reviewed.
1.2 Origin, botany and taxonomy of groundnut
1.2.1 Origin of groundnuts
The study on the origin of groundnuts (Arachis hypogaea L.) by Isleib and Wynne (1983) grouped
lines using principal component analyses and found that most morphological differences are
observed between subspecies. Six centres of diversity evolved in South America, including the
geographic regions of (1) Guarani (Paraguay-Paraná), (2) upper Amazon and the west coast of
Peru, (3) Goiás and the Minas Gerais region of Brazil, (4) Rondonia and the north west Mato
Grosso regions of Brazil, (5) south west Amazon region in Bolivia, and (6) north eastern Brazil.
Although A. hypogaea is believed to have originated east of the Andes mountains, the oldest
archaeological findings are in Peru, dated ca. 1500 BCE (Banks et al., 1993) where groundnut
predates the remains of maize (Zea mays L.) in the region of the Casma valley. This Peruvian site
may be the oldest simply because of good preservation conditions of pods in the dry climate, or
there could have been a secondary domestication event; although recent molecular data indicates a
single origin of A. hypogaea (Kochert et al., 1996).
1.2.2 Botany and taxonomy
Groundnut is an annual leguminous crop. It is an allotetraploid (AABB, 2n = 4x = 40 chromosomes)
with ‘A’ and ‘B’ genomes, contributed by diploid progenitors, Arachis duranensis and Arachis
ipaensis, respectively. The botanical name of groundnut is Arachis hypogaea derived from the
Greek word Arachis meaning ‘legume’ and hypogaea meaning ‘below ground’, referring to the

8
formation of pods in the soil (Pattee and Stalker, 1995). Groundnut is a member of the family
Leguminosae, tribe Aeschynomeneae, sub-tribe Stylosanthinae of genus Arachis.
Arachis hypogaea is an annual herb of indeterminate growth habit, and can be divided into two sub-
species, hypogaea and fastigiata, each with several botanical cultivars (Holbrook and Stalker,
2003). Sub-specific and varietal classifications are mostly based on the location of flowers on the
plant, patterns of reproductive nodes on branches, number of trichomes and pod morphology
(Krapovickas and Gregory, 1994). The hypogaea sub-species do not flower on the main stem and,
in general terms, mature later, have a high water requirement, have alternate branching patterns,
and produce large seed. The fastigiata sub-species produce flowers on the main stem, have
sequential branching, and, relative to the other sub-species, mature earlier, have a lower water
requirement and produce smaller seed. These sub-species are further sub-divided into four types:
Virginia, runner, Spanish, and Valencia. Virginia and runner types are in the hypogaea sub-species,
while Spanish and Valencia are in the fastigiata sub-species (Krapovickas and Gregory, 1994).
The groundnut plant produces flowers within four to six weeks after emergence and continues to
flower until late in the growing season, depending on the genotype and the environment (Stalker,
1997). Although flowering occurs above ground, seeds are produced underneath the soil surface.
Flower colour varies from light yellow to deep orange and sometimes white. Flowers are borne in
the axil of leaves, usually with three flowers per inflorescence, but only one of these flowers opens
at a given time (Stalker, 1997). The groundnut plant produces more flowers than its photosynthetic
capacity to fill the pods, and even under ideal conditions less than 20% produce mature pods (Rao
and Murty, 1994).
The flowers are self-pollinated. However, at locations where insect activities are high, some cross-
pollination may occur (Nigam et al., 1983). After fertilization of the ovule, an intercalary meristem
becomes active and a pointed carpophore or gynophore, commonly known as a peg, is formed. The
peg exhibits positive geotropism and grows downward into the soil where it becomes diageotropic
and ceases to elongate, and develops into a pod (Shokes and Melouk, 1995). The pods are
elongated spheres with various amount of reticulation on the surface and/or constriction between
seeds. Although pods usually develop below ground aerial pods can occur (Holbrook and Stalker,
2003). The pods may grow up to 80 mm x 27 mm and normally contain two to five seeds. Although
the number of seeds per pod depends on the cultivar, it can also be influenced by season and other
factors (Stalker, 1997).
9
Seeds are either round or elliptical with pointed or flattened ends and range in their colours from off
white to deep purple. Each seed consists of two large cotyledons, an epicotyl, and a primary root.
The cotyledons comprise nearly 96% of the seed weight and are the major storage tissue for the
developing seedling (Holbrook and Stalker, 2003).
1.3 Historical background of groundnut production, research and breeding in
Tanzania
The history of groundnuts in Tanzania dates back to 1946. At that time, mainland Tanzania, the then
Tanganyika, was a colony under British rule. Frank Samuel, the then head of the United Africa
Company, a subsidiary of Unilever, came up with an idea for the colony to cultivate groundnuts, so
as to produce vegetable oils. Both the idea and priority to introduce the groundnut production
scheme in the colony were exclusively based on the interests of colonial government. Largely, the
need was to have an exclusive large scale commercial production sector that would be state
managed for export; although a smallholder production of the crop, which could be expanded and/or
improved for household food and income earning, was already present
The first sites for cultivation were in Kongwa (Dodoma), Urambo (Tabora) and Nachingwea
(Mtwara) where local people had already been cultivating groundnuts before (Ramadhan et al.,
2002). The groundnut scheme failed in late 1950s and after independence in 1961 and up to 1970s
research on groundnuts lacked cohesion. In 1978, the Oilseeds Research Project was started which
included groundnuts, sesame and sunflower. Twelve varieties of groundnuts have been released to
date, of which three varieties, namely Mangaka 09, Mnanje 09 and Masasi 09, are tolerant to early
leaf spot but susceptible to late leaf spot, while Nachingwea 09 and Naliendele 09 are susceptible to
both CLD (Mponda et al., 2012). Table 1.1 below summarizes the released varieties.
Today, smallholder farmers do the groundnut production in Tanzania. Major groundnut producing
regions in Tanzania are Dodoma, Mtwara, Shinyanga, Tabora and Mbeya (NBS, 2012). It is the
chief crop rotation component in many Sub-Saharan countries, Tanzania inclusive (Gbèhounou and
Adango, 2003). It is one of several oilseed crops produced in the country, even though, edible oil
production in the country is dominated by sunflower and cotton seed.
Groundnuts are a nutritional source of vitamin E and several minerals for human health including
niacin, falacin, calcium, phosphorus, magnesium, zinc, iron, riboflavin, thiamine and potassium.
Groundnut is useful in the treatment of haemophilia, and can cure stomatitis, prevent diarrhoea and
is beneficial for growing children, and for both pregnant and nursing mothers (Akobundu, 1998).
Kernels are consumed directly as raw, roasted or boiled nuts and vines are used as fodder for cattle
(Pompeu, 1980; Hong et al., 1994). The crop is used as industrial materials for producing oil-cakes
10
and fertilizer. Extracted oil from kernel is used as culinary oil and other crop-extracts are used as
animal feeds. Almost each part of the crop is used in some way. These multiple uses of groundnuts
plant make it important for both food and cash-crop for the available domestic, or worldwide external
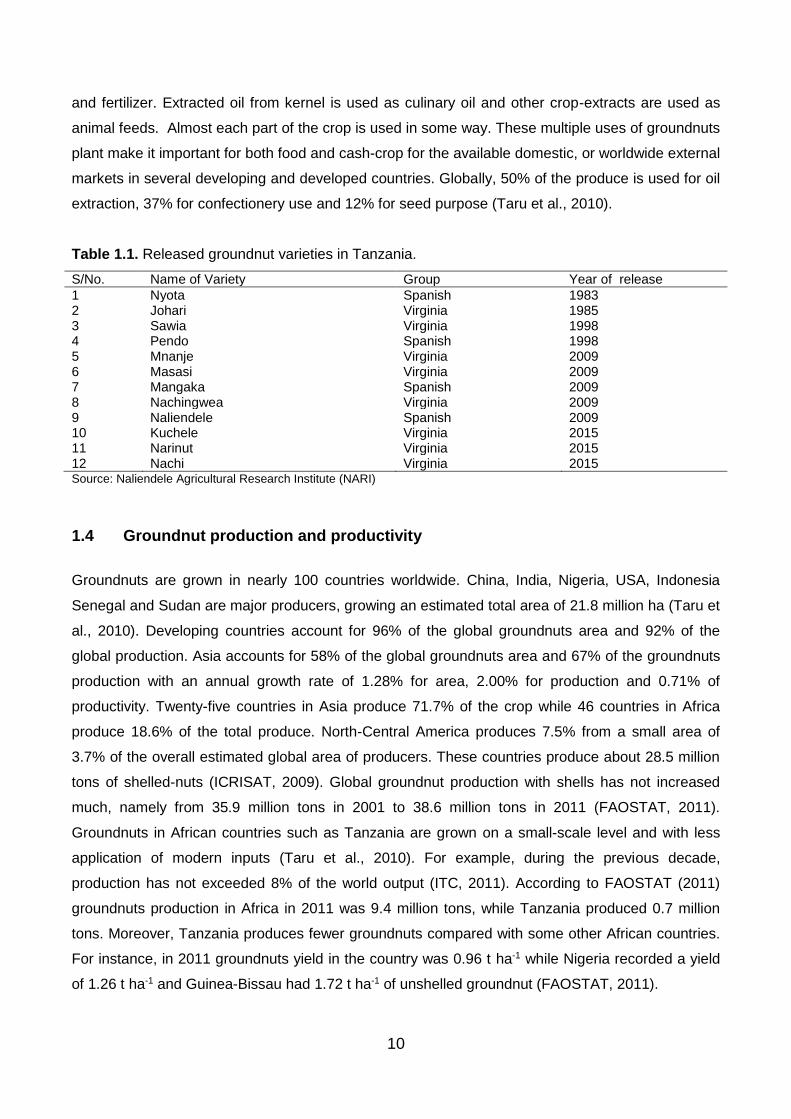
markets in several developing and developed countries. Globally, 50% of the produce is used for oil
extraction, 37% for confectionery use and 12% for seed purpose (Taru et al., 2010).
Table 1.1. Released groundnut varieties in Tanzania.
S/No. Name of Variety Group Year of release
1 Nyota Spanish 1983 2 Johari Virginia 1985 3 Sawia Virginia 1998 4 Pendo Spanish 1998 5 Mnanje Virginia 2009 6 Masasi Virginia 2009 7 Mangaka Spanish 2009 8 Nachingwea Virginia 2009 9 Naliendele Spanish 2009 10 Kuchele Virginia 2015 11 Narinut Virginia 2015 12 Nachi Virginia 2015 Source: Naliendele Agricultural Research Institute (NARI)
1.4 Groundnut production and productivity
Groundnuts are grown in nearly 100 countries worldwide. China, India, Nigeria, USA, Indonesia
Senegal and Sudan are major producers, growing an estimated total area of 21.8 million ha (Taru et
al., 2010). Developing countries account for 96% of the global groundnuts area and 92% of the
global production. Asia accounts for 58% of the global groundnuts area and 67% of the groundnuts
production with an annual growth rate of 1.28% for area, 2.00% for production and 0.71% of
productivity. Twenty-five countries in Asia produce 71.7% of the crop while 46 countries in Africa
produce 18.6% of the total produce. North-Central America produces 7.5% from a small area of
3.7% of the overall estimated global area of producers. These countries produce about 28.5 million
tons of shelled-nuts (ICRISAT, 2009). Global groundnut production with shells has not increased
much, namely from 35.9 million tons in 2001 to 38.6 million tons in 2011 (FAOSTAT, 2011).
Groundnuts in African countries such as Tanzania are grown on a small-scale level and with less
application of modern inputs (Taru et al., 2010). For example, during the previous decade,
production has not exceeded 8% of the world output (ITC, 2011). According to FAOSTAT (2011)
groundnuts production in Africa in 2011 was 9.4 million tons, while Tanzania produced 0.7 million
tons. Moreover, Tanzania produces fewer groundnuts compared with some other African countries.
For instance, in 2011 groundnuts yield in the country was 0.96 t ha-1 while Nigeria recorded a yield
of 1.26 t ha-1 and Guinea-Bissau had 1.72 t ha-1 of unshelled groundnut (FAOSTAT, 2011).
11
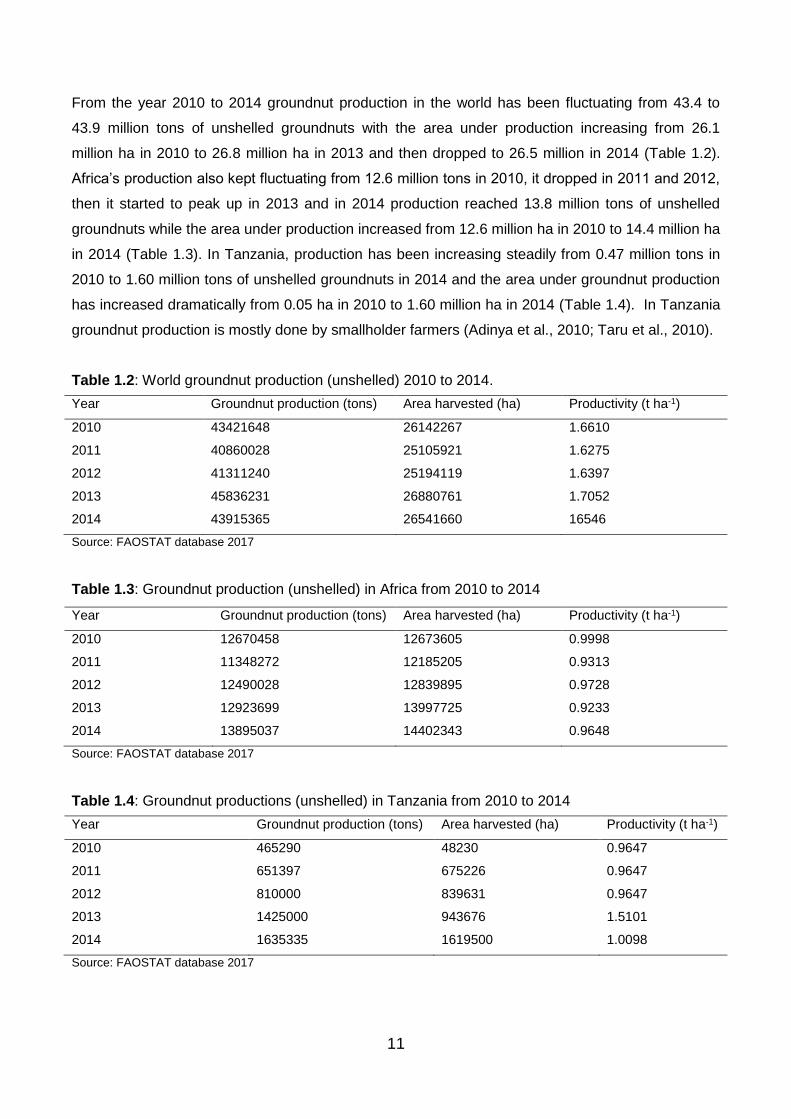
From the year 2010 to 2014 groundnut production in the world has been fluctuating from 43.4 to
43.9 million tons of unshelled groundnuts with the area under production increasing from 26.1
million ha in 2010 to 26.8 million ha in 2013 and then dropped to 26.5 million in 2014 (Table 1.2).
Africa’s production also kept fluctuating from 12.6 million tons in 2010, it dropped in 2011 and 2012,
then it started to peak up in 2013 and in 2014 production reached 13.8 million tons of unshelled
groundnuts while the area under production increased from 12.6 million ha in 2010 to 14.4 million ha
in 2014 (Table 1.3). In Tanzania, production has been increasing steadily from 0.47 million tons in
2010 to 1.60 million tons of unshelled groundnuts in 2014 and the area under groundnut production
has increased dramatically from 0.05 ha in 2010 to 1.60 million ha in 2014 (Table 1.4). In Tanzania
groundnut production is mostly done by smallholder farmers (Adinya et al., 2010; Taru et al., 2010).
Table 1.2: World groundnut production (unshelled) 2010 to 2014.
Year Groundnut production (tons) Area harvested (ha) Productivity (t ha-1)
2010 43421648 26142267 1.6610
2011 40860028 25105921 1.6275
2012 41311240 25194119 1.6397
2013 45836231 26880761 1.7052
2014 43915365 26541660 16546
Source: FAOSTAT database 2017
Table 1.3: Groundnut production (unshelled) in Africa from 2010 to 2014
Year Groundnut production (tons) Area harvested (ha) Productivity (t ha-1)
2010 12670458 12673605 0.9998
2011 11348272 12185205 0.9313
2012 12490028 12839895 0.9728
2013 12923699 13997725 0.9233
2014 13895037 14402343 0.9648
Source: FAOSTAT database 2017
Table 1.4: Groundnut productions (unshelled) in Tanzania from 2010 to 2014
Year Groundnut production (tons) Area harvested (ha) Productivity (t ha-1)
2010 465290 48230 0.9647
2011 651397 675226 0.9647
2012 810000 839631 0.9647
2013 1425000 943676 1.5101
2014 1635335 1619500 1.0098
Source: FAOSTAT database 2017

12
1.5 Importance and uses of groundnut
The crop is mainly grown for oilseed, food, and animal feed (Pande et al., 2003; Upadhyaya et al.,
2006). It is the world’s 13th most important food crop, 4th most important source of edible oil and 3rd
most important source of vegetable protein (Taru et al., 2010). Since groundnut is one of the key
sources of ingredients of household nutritional foods, women are mostly involved in producing the
crop. In many developing countries, Tanzania inclusive, groundnut is the principal source of
digestible protein and vitamins (25-34%) such as thiamine, riboflavin, and niacin (Naidu et al.,
1999), 40-50% fats, 20-50% protein and 10-20 % carbohydrates (Sorrensen et al., 2004).
Groundnut seeds are consumed fresh, as roasted kernels or as boiled pods, and can be processed
by grinding into powder for use as ingredients in vegetable, other food stuffs and confectionary
products, and can also be ground to produce peanut butter (Sibuga et al., 1992). Generally, oil is
the most important product of the crop and more than half of all groundnuts grown in the world are
used to produce oil (Stalker, 1997). The groundnut oil content and quality varies depending on the
cultivar, geographical location, season and growing conditions (Asibuo et al., 2008). The oil
pressings, seeds and straw are also used in many countries as fuel and animal feed in the form of
groundnut cakes and haulms (Wesche-Ebeling et al., 2002).
Groundnut is also a source of income to smallholder farmers in the developing countries of Asia and
Sub-Saharan Africa, and therefore significantly contributes to food security and improvement of
household livelihood (Naidu et al., 1999). In many sub-Saharan African countries, women
predominantly grow and manage the crop; hence its production has a direct bearing on the overall
economic and nutritional status of the household (Naidu et al., 1999).
According to Cox and Sholar (1995), groundnut is a legume crop with root nodules that can fix
nitrogen in the soil, improving soil fertility, hence benefitting the productivity of the crop companion
crops and subsequent crops in rotations. Studies show a range from 25 to 64% of plant N which can
be derived from fixation by groundnuts (Sprent, 1994). Groundnut is also a relatively drought
tolerant crop (Stalker, 1997) and grows well despite minimal inputs, making it suitable for low input
agriculture practiced by smallholder farmers in the sub-Saharan Africa (Naidu et al., 1999).
13
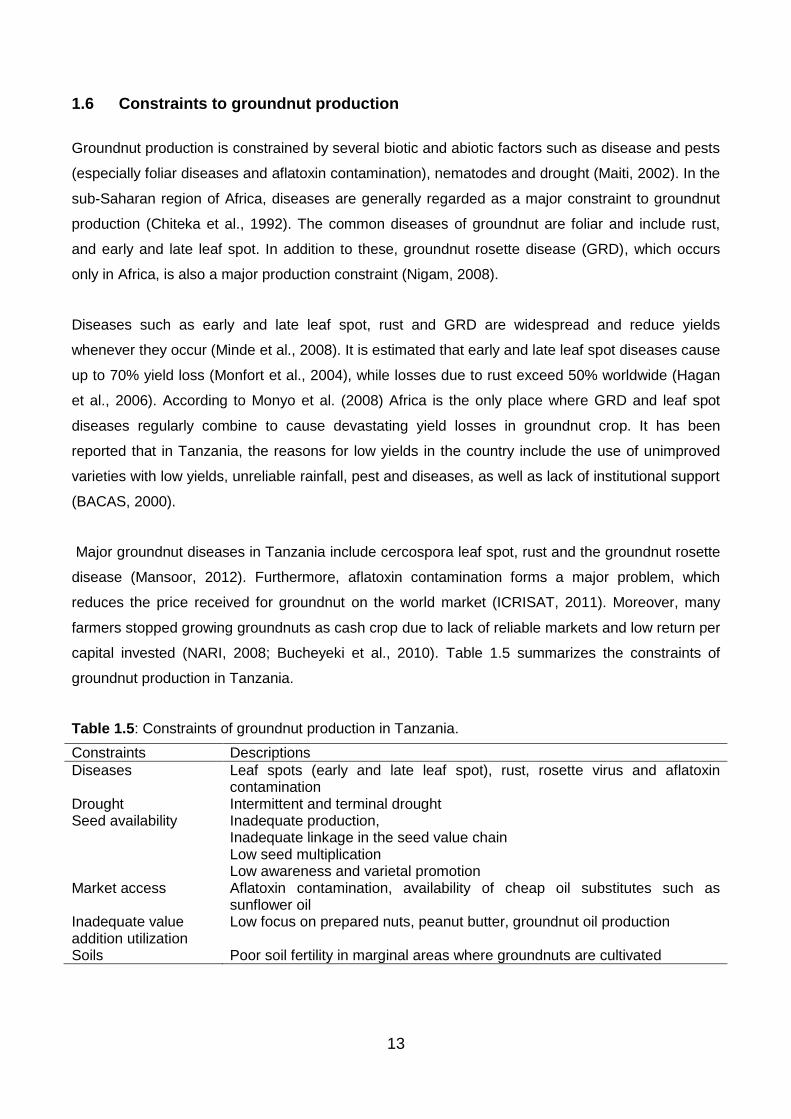
1.6 Constraints to groundnut production
Groundnut production is constrained by several biotic and abiotic factors such as disease and pests
(especially foliar diseases and aflatoxin contamination), nematodes and drought (Maiti, 2002). In the
sub-Saharan region of Africa, diseases are generally regarded as a major constraint to groundnut
production (Chiteka et al., 1992). The common diseases of groundnut are foliar and include rust,
and early and late leaf spot. In addition to these, groundnut rosette disease (GRD), which occurs
only in Africa, is also a major production constraint (Nigam, 2008).
Diseases such as early and late leaf spot, rust and GRD are widespread and reduce yields
whenever they occur (Minde et al., 2008). It is estimated that early and late leaf spot diseases cause
up to 70% yield loss (Monfort et al., 2004), while losses due to rust exceed 50% worldwide (Hagan
et al., 2006). According to Monyo et al. (2008) Africa is the only place where GRD and leaf spot
diseases regularly combine to cause devastating yield losses in groundnut crop. It has been
reported that in Tanzania, the reasons for low yields in the country include the use of unimproved
varieties with low yields, unreliable rainfall, pest and diseases, as well as lack of institutional support
(BACAS, 2000).
Major groundnut diseases in Tanzania include cercospora leaf spot, rust and the groundnut rosette
disease (Mansoor, 2012). Furthermore, aflatoxin contamination forms a major problem, which
reduces the price received for groundnut on the world market (ICRISAT, 2011). Moreover, many
farmers stopped growing groundnuts as cash crop due to lack of reliable markets and low return per
capital invested (NARI, 2008; Bucheyeki et al., 2010). Table 1.5 summarizes the constraints of
groundnut production in Tanzania.
Table 1.5: Constraints of groundnut production in Tanzania.
Constraints Descriptions
Diseases Leaf spots (early and late leaf spot), rust, rosette virus and aflatoxin contamination
Drought Intermittent and terminal drought Seed availability Inadequate production,
Inadequate linkage in the seed value chain Low seed multiplication Low awareness and varietal promotion
Market access Aflatoxin contamination, availability of cheap oil substitutes such as sunflower oil
Inadequate value addition utilization
Low focus on prepared nuts, peanut butter, groundnut oil production
Soils Poor soil fertility in marginal areas where groundnuts are cultivated

14
1.7 Cercospora leaf spot diseases
As indicated in section 1.6 above, the cercospora leaf spot diseases are very destructive and can
lower crop yield up to 70%. This section elaborates on the causative agents, disease symptoms and
management options.
1.7.1 Causative agent and symptoms of Cercospora leaf spot disease
Among the foliar diseases, cercospora leaf spots (CLD), caused by Cercospora arachidicola Hori,
causing early leaf spot, and Cercospora personatum [(Berk. and Curt) Deighton] causing late leaf
spot are the most common, widespread, destructive and consistent in occurrence. The two
pathogens are similar; they often form necrotic lesions on leaves and petioles and less frequently on
stems, stipules and pegs. Symptoms of late leaf spot (LLS) are similar to those of early leaf spot
(ELS), but yellow halos are not usually produced in LLS. Under field conditions, however, yellow
halos may be altered by the genetic or nutritional status of the host or weather conditions, therefore
under field conditions, both the diseases are generally considered as one (Holiday, 1980).
The CLD occur wide spread wherever groundnut is cultivated. The host range of C. arachidicola and
C. personatum is confined to the genus Arachis (Stalker and Simpson, 1995). Conidia of CLD of
groundnut produced on crop residues in the soil are the main cause of initial inoculum. Mycelia in
spots on stems, petioles, and pegs are more likely to survive between seasons than those on
leaflets and, therefore, initiate disease epidemics in the subsequent seasons (Shokes and
Culbreath, 1997). Epidemics of CLD have frequently led to yield losses of 50% on unsprayed
peanuts (Shokes and Melouk, 1995). The diseases cause damage to the plant by reducing the
available photosynthetic area, by lesion formation and by stimulating leaflet abscission. In areas
where rust disease is also present, a combined attack of the foliar diseases can cause yield losses
of up to 70% (McDonald et al., 1985). Symptoms of the CLD are summarized in Table 1.6 below.
Table 1.6: Comparisons of symptoms of early and late leaf spot of groundnut
Character Early leaf spot Late leaf spot
Stage of occurrence Early infection Usually late infection Shape of spot Circular to irregular Usually circular Leaf surface on which most Spores are produced and arrangement
Upper surface, random Lower surface, in concentric rings
Colour of spot on upper leaf surface Light brown to black, tending towards brown with some yellow halo
Brown to black, tending towards black
Colour of spot on lower leaf surface Brown Black
15
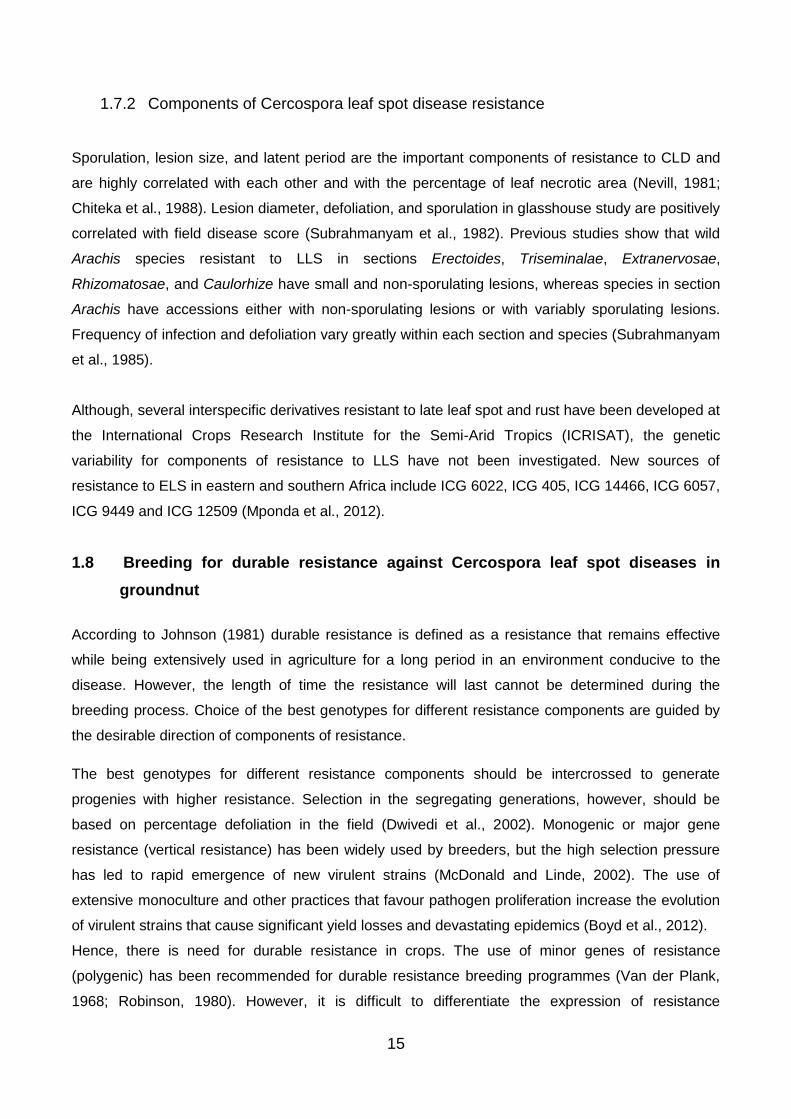
1.7.2 Components of Cercospora leaf spot disease resistance
Sporulation, lesion size, and latent period are the important components of resistance to CLD and
are highly correlated with each other and with the percentage of leaf necrotic area (Nevill, 1981;
Chiteka et al., 1988). Lesion diameter, defoliation, and sporulation in glasshouse study are positively
correlated with field disease score (Subrahmanyam et al., 1982). Previous studies show that wild
Arachis species resistant to LLS in sections Erectoides, Triseminalae, Extranervosae,
Rhizomatosae, and Caulorhize have small and non-sporulating lesions, whereas species in section
Arachis have accessions either with non-sporulating lesions or with variably sporulating lesions.
Frequency of infection and defoliation vary greatly within each section and species (Subrahmanyam
et al., 1985).
Although, several interspecific derivatives resistant to late leaf spot and rust have been developed at
the International Crops Research Institute for the Semi-Arid Tropics (ICRISAT), the genetic
variability for components of resistance to LLS have not been investigated. New sources of
resistance to ELS in eastern and southern Africa include ICG 6022, ICG 405, ICG 14466, ICG 6057,
ICG 9449 and ICG 12509 (Mponda et al., 2012).
1.8 Breeding for durable resistance against Cercospora leaf spot diseases in
groundnut
According to Johnson (1981) durable resistance is defined as a resistance that remains effective
while being extensively used in agriculture for a long period in an environment conducive to the
disease. However, the length of time the resistance will last cannot be determined during the
breeding process. Choice of the best genotypes for different resistance components are guided by
the desirable direction of components of resistance.
The best genotypes for different resistance components should be intercrossed to generate
progenies with higher resistance. Selection in the segregating generations, however, should be
based on percentage defoliation in the field (Dwivedi et al., 2002). Monogenic or major gene
resistance (vertical resistance) has been widely used by breeders, but the high selection pressure
has led to rapid emergence of new virulent strains (McDonald and Linde, 2002). The use of
extensive monoculture and other practices that favour pathogen proliferation increase the evolution
of virulent strains that cause significant yield losses and devastating epidemics (Boyd et al., 2012).
Hence, there is need for durable resistance in crops. The use of minor genes of resistance
(polygenic) has been recommended for durable resistance breeding programmes (Van der Plank,
1968; Robinson, 1980). However, it is difficult to differentiate the expression of resistance
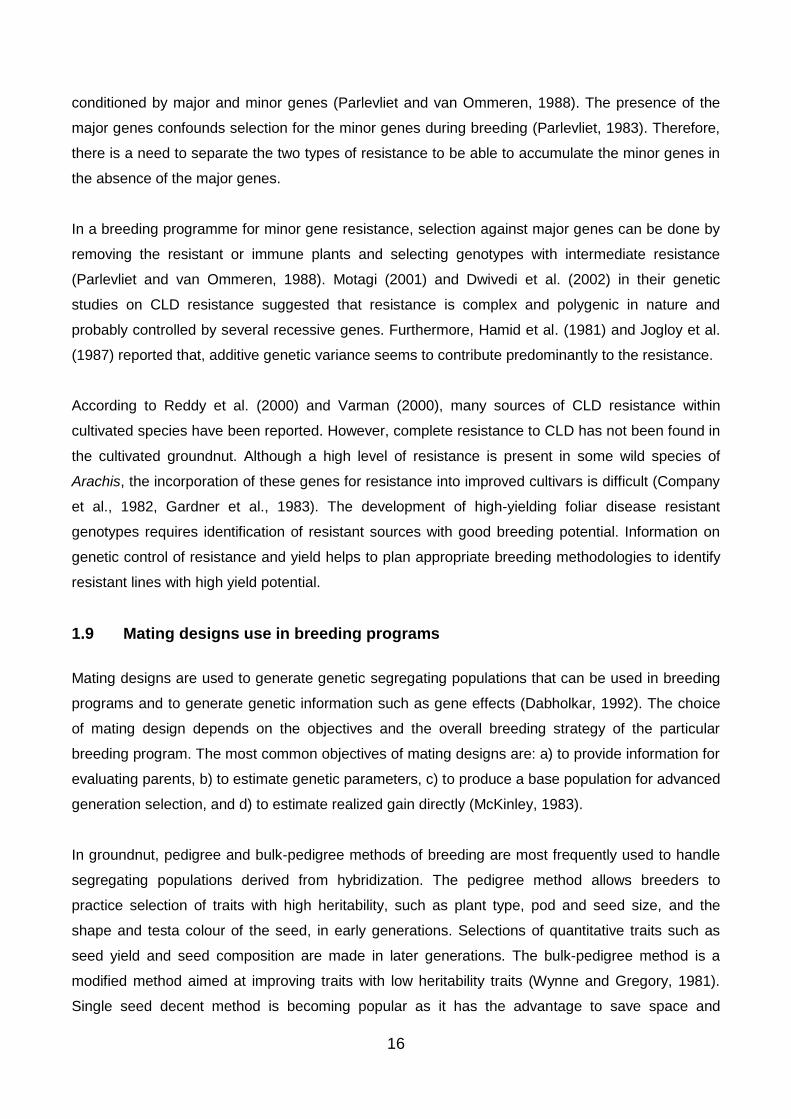
16
conditioned by major and minor genes (Parlevliet and van Ommeren, 1988). The presence of the
major genes confounds selection for the minor genes during breeding (Parlevliet, 1983). Therefore,
there is a need to separate the two types of resistance to be able to accumulate the minor genes in
the absence of the major genes.
In a breeding programme for minor gene resistance, selection against major genes can be done by
removing the resistant or immune plants and selecting genotypes with intermediate resistance
(Parlevliet and van Ommeren, 1988). Motagi (2001) and Dwivedi et al. (2002) in their genetic
studies on CLD resistance suggested that resistance is complex and polygenic in nature and
probably controlled by several recessive genes. Furthermore, Hamid et al. (1981) and Jogloy et al.
(1987) reported that, additive genetic variance seems to contribute predominantly to the resistance.
According to Reddy et al. (2000) and Varman (2000), many sources of CLD resistance within
cultivated species have been reported. However, complete resistance to CLD has not been found in
the cultivated groundnut. Although a high level of resistance is present in some wild species of
Arachis, the incorporation of these genes for resistance into improved cultivars is difficult (Company
et al., 1982, Gardner et al., 1983). The development of high-yielding foliar disease resistant
genotypes requires identification of resistant sources with good breeding potential. Information on
genetic control of resistance and yield helps to plan appropriate breeding methodologies to identify
resistant lines with high yield potential.
1.9 Mating designs use in breeding programs
Mating designs are used to generate genetic segregating populations that can be used in breeding
programs and to generate genetic information such as gene effects (Dabholkar, 1992). The choice
of mating design depends on the objectives and the overall breeding strategy of the particular
breeding program. The most common objectives of mating designs are: a) to provide information for
evaluating parents, b) to estimate genetic parameters, c) to produce a base population for advanced
generation selection, and d) to estimate realized gain directly (McKinley, 1983).
In groundnut, pedigree and bulk-pedigree methods of breeding are most frequently used to handle
segregating populations derived from hybridization. The pedigree method allows breeders to
practice selection of traits with high heritability, such as plant type, pod and seed size, and the
shape and testa colour of the seed, in early generations. Selections of quantitative traits such as
seed yield and seed composition are made in later generations. The bulk-pedigree method is a
modified method aimed at improving traits with low heritability traits (Wynne and Gregory, 1981).
Single seed decent method is becoming popular as it has the advantage to save space and
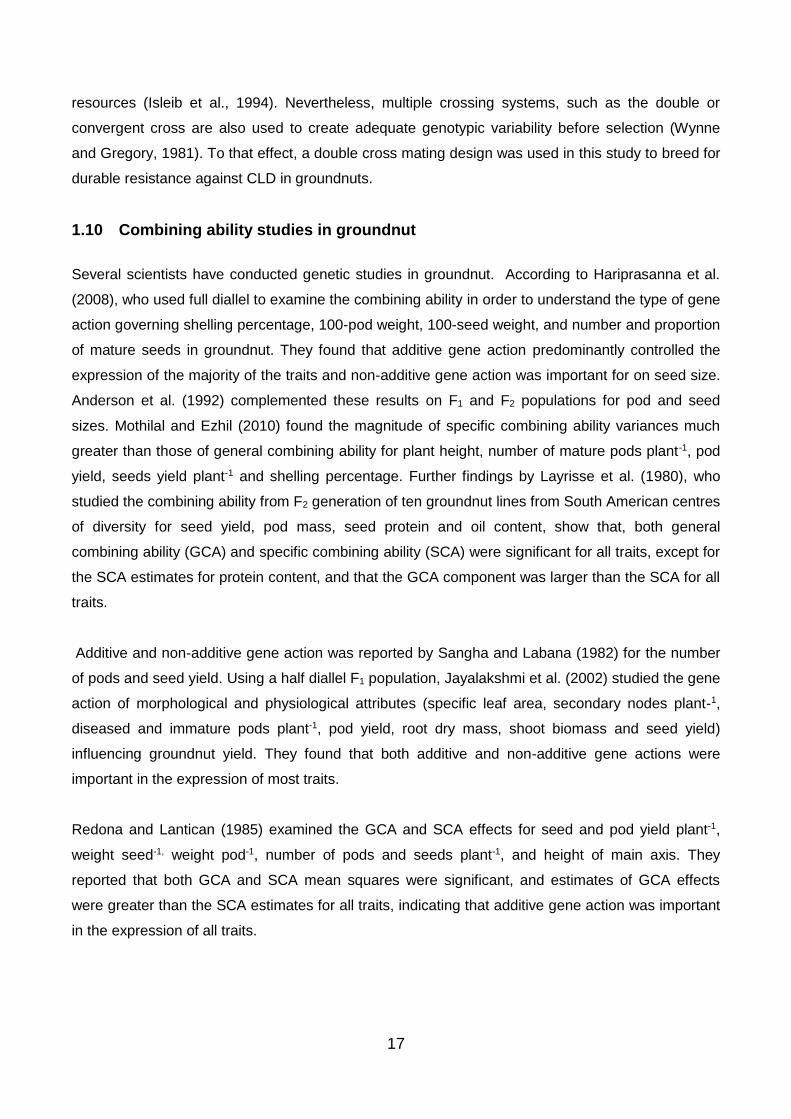
17
resources (Isleib et al., 1994). Nevertheless, multiple crossing systems, such as the double or
convergent cross are also used to create adequate genotypic variability before selection (Wynne
and Gregory, 1981). To that effect, a double cross mating design was used in this study to breed for
durable resistance against CLD in groundnuts.
1.10 Combining ability studies in groundnut
Several scientists have conducted genetic studies in groundnut. According to Hariprasanna et al.
(2008), who used full diallel to examine the combining ability in order to understand the type of gene
action governing shelling percentage, 100-pod weight, 100-seed weight, and number and proportion
of mature seeds in groundnut. They found that additive gene action predominantly controlled the
expression of the majority of the traits and non-additive gene action was important for on seed size.
Anderson et al. (1992) complemented these results on F1 and F2 populations for pod and seed
sizes. Mothilal and Ezhil (2010) found the magnitude of specific combining ability variances much
greater than those of general combining ability for plant height, number of mature pods plant-1, pod
yield, seeds yield plant-1 and shelling percentage. Further findings by Layrisse et al. (1980), who
studied the combining ability from F2 generation of ten groundnut lines from South American centres
of diversity for seed yield, pod mass, seed protein and oil content, show that, both general
combining ability (GCA) and specific combining ability (SCA) were significant for all traits, except for
the SCA estimates for protein content, and that the GCA component was larger than the SCA for all
traits.
Additive and non-additive gene action was reported by Sangha and Labana (1982) for the number
of pods and seed yield. Using a half diallel F1 population, Jayalakshmi et al. (2002) studied the gene
action of morphological and physiological attributes (specific leaf area, secondary nodes plant-1,
diseased and immature pods plant-1, pod yield, root dry mass, shoot biomass and seed yield)
influencing groundnut yield. They found that both additive and non-additive gene actions were
important in the expression of most traits.
Redona and Lantican (1985) examined the GCA and SCA effects for seed and pod yield plant-1,
weight seed-1, weight pod-1, number of pods and seeds plant-1, and height of main axis. They
reported that both GCA and SCA mean squares were significant, and estimates of GCA effects
were greater than the SCA estimates for all traits, indicating that additive gene action was important
in the expression of all traits.

18
1.11 Participatory plant breeding
The main breeding goals should meet the requirements of growers, processors and consumers. A
grower requires high yield, disease resistance and tolerance to environmental stresses, and yield
stability. A processor requires uniform maturity and processing characteristics. The consumer
requires good quality oil and groundnut seeds with acceptable shape, size, colour and taste for
confectionery purposes (Wynne and Gregory, 1981). Consequently, a participatory rural appraisal
was conducted in the study area to obtain the views of farmers, traders and consumers on the
variety preferences, and opportunities and challenges in groundnut production, marketing and
processing.
1.12 Factors influencing variety adoption
Different factors determine the adoption of agricultural innovations and technologies. Much empirical
adoption literature focuses on farm size as the first and probably the most important determinant
(Doss and Morris, 2001; Daku, 2002). This is because farm size can affect, and in turn be affected
by, the other factors influencing adoption. With small farms, it has been argued that large fixed costs
become a constraint to technology adoption (Abara and Singh, 1993), especially if the technology
requires a substantial amount of initial set-up cost.
Education is thought to create a favourable mental attitude for the acceptance of new practices,
especially information-intensive and management-intensive practices (Caswell et al., 2001).
According to Rogers (1995) and Ehler and Bottrell (2000), technology complexity has a negative
effect on the adoption and this could only be dealt with through education. According to Weir (1999)
education produces non-cognitive changes in attitudes, beliefs and habits which in turn may lead to
a greater willingness to accept risk, adopt innovations, save for investment, and generally to
embrace productive practices in a modernizing or rapidly changing environment. Further, findings by
Mugisha et al. (2004), in their study on the adoption of IPM groundnut production technologies in
Eastern Uganda, revealed that adoption was significantly influenced by education, family size,
membership of associations, extension visits, access to credit, and household income.
Gender issues in agricultural production and technology adoption have been investigated for a long
time. Most of such studies show mixed evidence regarding the different roles men and women play
in technology adoption. Studies by Doss and Morris (2001) on factors influencing improved maize
technology adoption in Ghana, and Overfield and Fleming (2001) studying coffee production in
Papua New Guinea, there were insignificant effects of gender on adoption. A study by Kimmins et
al. (1999) proved that in many Sub-Sahara African countries, women were predominantly growing
19
and managing groundnut crops. Therefore, cultivation of the crop has a direct bearing on the overall
economic, financial and nutritional status of women and children in the household.
Age is an important factor that influences the probability of adoption of new technologies because it
is said to be a primary latent characteristic in adoption decisions. However, there is contention on
the direction of the effect of age on adoption. Age was found to positively influence adoption of
sorghum in Burkina Faso (Adesiina and Baidu-Forson, 1995), IPM on groundnuts in Georgia
(McNamara et al., 1991) and chemical control of rice stinkbug in Texas (Harper et al., 1990). In
contrast, age has been found to be either negatively correlated with adoption, or not significant in
farmers’ adoption decisions. In studies on adoption of land conservation practices in Niger (Baidu-
Forson, 1999), rice in Guinea (Adesiina and Baidu-Forson, 1995), fertilizer in Malawi (Green and
Ng'ong'ola, 1993), IPM sweep nets in Texas (Harper et al., 1990), hybrid cocoa in Ghana (Boahene
et al., 1999), age was either not significant or was negatively related to adoption.
Furthermore, access to funds including credit is expected to increase the probability of adoption. For
instance, it has been reported that most small scale farmers in Tanzania are unable to afford basic
production technologies such as fertilizers and other agrochemicals resulting in low crop yields due
to poverty and limited access to credit (MAFC, 2010). From the above, it is concluded that though a
number of studies have been conducted across the world on technology adoption, there is dearth of
literature on the specific factors that influence the adoption of modern agricultural production
technologies, especially among small scale farmers in Tanzania. This serious gap must be bridged
if the problem of low technology adoption among farmers is to be addressed and agricultural
productivity improved.
20
References
Abara, I.O.C. and Singh, S. (1993). Ethics and Biases in Technology Adoption: The Small
Farm Argument. Technological Forecasting and Social Change 43:289-300.
Adesiina, A.A. and Baidu-Forson, J. (1995). Farmers’ Perceptions and Adoption of New Agricultural
Technology: Evidence from Analysis in Burkina Faso and Guinea, West Africa. Journal of
Agricultural Economics 13:1-9.
Adinya, I.B., Enun, E.E. and Ijoma, J.U. (2010). Exploring Profitability Potentials in Groundnuts
(Arachis hypogea L.) Production Through Agroforestry Practices: A Case Study in Nigeria.
Journal of Animal and Plant Sciences 20:123-131.
Akobundu, E. (1998). Farm-household analysis of policies affecting groundnut production in
Senegal. Thesis submitted to the Faculty of the Virginia Polytechnic Institute and State
University in partial fulfilment of the requirements for the degree of Master of Science in
Agricultural and Applied Economics, Virginia, USA.
Anderson, W.F., Fitzner, M.S., Isleib, T.G., Wynne, J.C. and Phillips, T.D. (1992). Combining Ability
for Large Pod and Seed Traits in Peanut. Peanut Science 20:49-52.
Asibuo, J.Y., Akromah, R., Adu-Dapaah, H.K. and Safo-Kantanka, O. (2008). Evaluation of
Nutritional Quality of Groundnut (Arachis hypogaea L.) from Ghana. African Journal of Food,
Agriculture, Nutrition and Development 8:133-150.
Baidu-Forson, J. (1999). Factors Influencing Adoption of Land-Enhancing Technology in the
Sahel: Lessons from a Case Study in Niger. Journal of Agricultural Economics 20:231-239.
Banks, D.J., Pozorski, T., Pozorski, S. and Donnan, C.B. (1993). Origin and evolution of peanut
from archaeological evidence. Proceedings of American Peanut Resource Education Society
25:34.
Boahene, K., Snijders, T.A.B. and Folmer, H. (1999). An Integrated Socio-Economic Analysis of
Innovation Adoption: The Case of Hybrid Cocoa in Ghana. Journal of Policy Modelling 21:167-
184.
Boyd, L.A., Ridout, C, O’Sullivan, D.M., Leach, J.E. and Leung, H. (2012). Plant-Pathogen Interactions:
Disease Resistance in Modern Agriculture. Trends in Genetics 29:233-240.
21
Bucheyeki, T.L., Shenkalwa, M.E., Mapunda, T. and Matata, W.L. (2010). The Groundnut Client
Oriented Research in Tabora, Tanzania. In: African Journal of Agricultural Research 5:356-
362.
Bureau for Agricultural Consultancy and Advisory Services (BACAS). (2000). Final report. baseline
survey on the agricultural research system under the department of research and training;
volume 1, Western zone. Synthesis of main findings and recommendations, Sokoine University
of Agriculture, Morogoro, Tanzania.
Caswell, M., Fuglie, K., Ingram, C., Jans, S. and Kascak, C. (2001). Adoption of agricultural
production practices: Lessons learned from the US. Department of agriculture area
studies project. US Department of agriculture, resource economics division, Economic
research service, Agriculture economic report No. 792. Washington DC, USA.
Chiteka, Z.A., Cole, D.L., Freire, M.J., Mamba, Z.I., Mande, H.K., Marais, D.J.M., Mayeux, A.,
Moima, S.S., Mwenda, F.F., Rao, Y.P., Sibuga, K.P., Syamasonta, M.B., Schmidt,
G.,Hilderbrand, G.L. and Subrahmanyam, P. (1992). Groundnut research in the SADCC
region, 1980-1990, in: Nigam S.N. (Editor). Proceedings of an international workshop, 25-29
November 1991, ICRISAT Centre, India, International Crops Research Institute for the Semi-
Arid Tropics, Patancheru, Andhra Pradesh 502 324, India, Pp.113-129.
Chiteka, Z.A., Gorbet, D.W., Knauft, D.A., Shokes, F.M. and Kucharek, T.A. (1988). Components of
Resistance to Late Leaf Spot in Peanut. Correlations Among Components and Their
Significance in Breeding for Resistance. Peanut Science 15:76–81.
Company, M., Stalker, H.T. and Wynne, J.C. (1982). Cytology and Leaf Spot Resistance in Arachis
hypogaea × Wild Species Hybrids. Euphytica 31:885–893.
Cox, F.R. and Sholar, J.R. (1995). Site selection, land preparation, and management of soil fertility,
in: H. A. Melouk and F.M. Shokes (Editors.), Peanut Health Management, The American
Phytopathological Society, Minnesota, USA. Pp.7-10.
Dabholkar, R.R. (1992). Elements of Biometrical Genetics. Ashok Kumar Mittal Concept Publishing
Company. New Delhi, India.
Daku, L. (2002). Assessing farm-level and aggregate economic impacts of olive integrated
pest management programs in Albania. PhD. Dissertation, Virginia Polytechnic Institute and
State University, David, Lynne Riener Publishers.
22
Doss, C.R. and Morris, M.L. (2001). How Does Gender Affect the Adoption of Agricultural
Innovation? The Case of Improved Maize Technologies in Ghana. Journal of Agricultural
Economics 25:27-39.
Dwivedi, S.L., Pandey, S., Rao, J.N. and Nigam, S.N. (2002). Components of Resistance to Late
Leaf Spot and Rust Among Interspecific Derivatives and Their Significance in a Foliar Disease
Resistance Breeding in Groundnut (Arachis hypogaea L.). Euphytica 125:81–88.
Ehler, L.E. and Bottrell, D.G. (2000). The illusion of integrated pest management. Issues in science
and technology. Bell and Howell Information and Learning Company, Pp. 61-64.
FAOSTAT. (2011). Food and Agriculture Organization of the United Nations. Statistics Division,
FAOSTAT database.
FAOSTAT. (2012). Food and Agriculture Organization of the United Nations, Statistics Division,
FAOSTAT database.
FAOSTAT. (2017). Food and Agriculture Organization of the United Nations, Statistics Division,
FAOSTAT database.
Gardner, M.E.B. and Stalker, H.T. (1983). Cytology and Leaf Spot Resistance of Section Arachis
amphidiploids and Their Hybrids with Arachis hypogaea L. Crop Science 23:1069–1074.
Gbèhounou, G. and Adango, E. (2003). Trap Crops of Striga hermonthica: In Vitro Identification and
Effectiveness In Situ. Crop Protection 22:395-404.
Green, D.A.G. and Ng’ong’ola, D.H. (1993). Factors Affecting Fertilizer Adoption in Less Developed
Countries: An application of Multivariate Logistic Analysis in Malawi. Journal of Agricultural
Economics 44:99-109.
Hagan, A.K., Campbell, H.L., Bowen, K.L. and Pegues, M. (2006). Evaluation of calendar and AU
Peanut fungicide schedules for the control of late leaf spot and rust on peanut in south west
Alabama. Auburn University, Alabama, USA.
Hamid, M.A., Isleib, T.G., Wynne, J.C. and Green, C.C. (1981). Combining Ability Analysis of
Cercospora Leaf Spot Resistance and Agronomic Traits in Arachis hypogaea L. Oleagineux
36:605–612.
Hariprasanna, K., Lal, C., Radhakrishnan, T., Gor, H.K. and Chikani, B.M. (2008). Analysis of Diallel
Cross for Some Physical-Quality Traits in Peanut (Arachis hypogaea L.). Euphytica 160:49-57.
23
Harper, J.K., Rister, M.E., Mjelde, J.W., Drees, B.M. and Way, M.O. (1990). Factors Influencing the
Adoption of Insect Management Technology. American Journal of Agricultural Economics
72:997-1005.
Holbrook, C.C. and Stalker, H.T. (2003). Peanut breeding and genetic resources. In: Janick, J.
(Editor). Plant Breeding Reviews. John Wiley and Sons, Inc. New York, USA. Pp. 297-356.
Holiday, P. (1980). Fungal diseases of tropical crops. Cambridge Uni. Press London, UK. Pp. 270-
274.
Hong, N.X., Mehan, V.K., Ly, N.T. and Vinh, M.T. (1994). Status of groundnut bacterial wilt research
in Vietnam. V. K. Mehan and D. McDonald (Editors). In: Groundnut bacterial wilt in Asia. Pp.
135-141.
IBPGR, ICRISAT. (1985). Descriptors for Groundnut (Revised). International Board for Plant
Genetic Resources, Rome, Italy and International Crop Research Institute for the Semi-Arid
Tropics, Patancheru, India, Pp. 25.
ICRISAT. (2009). International Crops Research Institute for the Semi-Arid Tropics. Groundnut crop.
www.icrisat.org/crop-groundnut.html
ICRISAT. (2011). International Crops Research Institute for the Semi-Arid Tropics. A profile of
tropical legumes in Tanzania. Bulletin of Tropical Legumes, September, 2011.
International Trade Centre (ITC). 2011. Exporting Groundnuts. International Trade Forum Magazine.
Isleib, T.G. and Wynne, J.C. (1983). Heterosis in Test Crosses of 27 Exotic Peanut Cultivars. Crop
Science 23:832-841.
Isleib, T.G., Wynne, J.C. and Nigam, S.N. (1994). “Groundnut breeding,” In: The groundnut crop: A
scientific basis for improvement, Smartt, J. (Editor). London: Chapman and Hall, Pp. 552–623.
Jayalakshmi, V., Reddy, C.R., Reddy, P.V. and Reddy, G.L. (2002). Combining Ability Analysis of
Morphological and Physiological Attributes in Groundnut (Arachis hypogaea L.). Indian Journal
of Agricultural Resources 36:177-181.
Jogloy, S., Wynne, J.C. and Beute, M.K. (1987). Inheritance of Late Leaf Spot Resistance and
Agronomic Traits in Peanut. Peanut Science 14:86–90.
Johnson, R. (1981). Durable Resistance: Definition of, Genetic Control, and Attainment in Plant
Breeding. Phytopathology 71:567–568.

24
Kimmins, F.M., Deom, C.M., Subrahmanyam, P., Chiyembekeza, M. and van der Merwe, P.J.A.
(1999). Groundnut rossete: A virus affecting groundnut production in Sub-Saharan Africa. In:
Plant disease. Robertson, A.E. (Editor). The American Phytopathological Society St. Paul
Minnesota, USA.
Kochert, G., Stalker, H.T., Ginenes, M., Galgaro, L. and Moore, K. (1996). RFLP and Cytogenetic
Evidence for the Progenitor Species of Allotetraploid Cultivated Peanut, Arachis hypogaea L.,
(Leguminosae). American Journal of Botany 83:1282–1291.
Krapovickas, A. and Gregory, W.C. (1994). Taxonomía del género Arachis (Leguminosae).
Bonplandia 8:1–186.
Layrisse, A.J., Wynne, J.C. and Isleib, T.G. (1980). Combining Ability for Yield, Protein, and Oil of
Peanut Lines from South American Centres of Diversity. Euphytica. 29:561- 570.
Maiti, R.K. (2002). About the peanut crop in: R. K. Maiti and P. Wesche-Ebeling (Editors.), The
Peanut Crop (Arachis hypogaea L.), Science Publishers, Inc, Enfield, Pp.1-11.
Mansoor, H. (2012). Grain legumes strategy for Tanzania. Presented at N2 Africa workshop
Tanzania, 6 – 7th November, 2012.
McDonald, B.A. and Linde, C. (2002). Pathogen Population Genetics, Evolutionary Potential, and
Durable Resistance. Annual Review of Phytopathology 40:349-379.
McDonald, D., Subrahmanyam, P., Gibbons, R.W. and Smith, D.H. (1985). Early and late leaf spots
of groundnut. Information Bulletin no. 21. Patancheru, A.P. 502324, India: International Crops
Research Institute for the Semi-Arid Tropics. Pp. 24.
McKinley, C.R. (1983). Objectives of progeny tests. S-23 workshop on progeny testing of forest
trees, 1982, Southern Cooperative Series Bulletin, Auburn, Alabama.
McNamara, K.T., Wetzstein, M.E. and Douce, G.K. (1991). Factors Affecting Peanut Producer
Adoption of Integrated Pest Management. Review of Agricultural Economics 13:129-139.
Melouk, H.A. and Shokes, F.M. (1995). Peanut health management. The American
Phytopathological Society, St. Paul, USA. Pp. 65-70.
Minde, I., Madzonga, O., Kantithi, G., Phiri, K. and Pedzisa, T. (2008). Constraints, Challenges and
Opportunities in Groundnut Production and Marketing in Malawi, International Crops Research
Institute for the Semi - Arid Tropics, Bulawayo, Zimbabwe.

25
Ministry of Food and Agriculture (MAFC). (2010). Agriculture in Ghana: “Facts and figures."
Government of Ghana Publications, Pp. 1-41.
Monfort, W.S., Culbreath, A.K., Stevenson, K.L., Brenneman, T.B., Gorbet, D.W. and Phatak, S.C.
(2004). Effects of Reduced Tillage, Resistant Cultivars, and Reduced Fungicide Inputs on
Progress of Early Leaf Spot of Peanut (Arachis hypogaea L.). Plant Disease 88:858-864.
Monyo, E.S., Osiru, M., Mponda, O., Harvey, C. and Munthali, W. (2008). Rosette and early leaf
spots resistant groundnut varieties for eastern and southern Africa, Third international
conference for peanut genomics and biotechnology on advances in Arachis through genomics
and biotechnology (AAGB-2008) 4-8th November 2008, ICRISAT, Hyderabad, Andhra
Pradesh, India, Pp.20.
Motagi, B.N. (2001). Genetic analysis of resistance to late leaf spot and rust vis-à-vis productivity in
groundnut (Arachis hypogaea L.). Dissertation, University of Agricultural Sciences, Dharwad,
India.
Mothilal, A. and Ezhil, A. (2010). Combining Ability Analysis for Yield and Its Components in
Groundnut (Arachis hypogaea L.). Electronic Journal of Plant Breeding 1:162-166.
Mponda, O., Kafiriti, E., Mfaume, J., Daudi, H. and Mashamba, P. (2012). TL-I Groundnut Breeding
Status Report for Tanzania. Presented at Annual Meeting - Tropical Legumes I- Phase 2
Generation Challenge Programme. 7-11th May 2012, Addis Ababa, Ethiopia.
Mugisha, J., Ogwal, R., Ekere, O.W. and Ekiyar, V. (2004). Adoption of IPM Groundnut Production
Technologies in Eastern Uganda. African Crop Science Journal 12:383-391.
Naidu, R.A., Kimmins, F.M., Deom, C.M., Subrahmanyam, P., Chiyembekeza, A.J. and Van der
Merwe, P.J.A. (1999). Groundnut Rosette. A Virus Disease Affecting Groundnut Production in
Sub-Saharan Africa. Plant Disease 83:700-709.
Naliendele Agricultural Research Institute (NARI). (2008). Report of oilseeds research program in
Tanzania.
National Bureau of Statistics Tanzania (NBS). (2012). National sample census of agriculture
2007/2008. Smallholder agriculture, volume II: Crop sector - national report.
Nevill, D.J. (1981). Components of Resistance to Cercospora arachidicola and Cercosporidium
personatum in Groundnuts. Annals of Applied Biology 99:77-86.
26
Nigam, S.N. (2008) Strides in groundnut crop improvement and new challenges, Third International
Conference of the peanut research community on advances in Arachis through genomics and
biotechnology (AAGB – 2008) 4th-8th November 2008, ICRISAT, Hyderabad, Andhra Pradesh,
India. Pp.1.
Nigam, S.N., Ramanatha, R.V. and Gibbons, R.W. (1983). Utilization of Natural Hybrids in the
Improvement of Groundnuts (Arachis hypogaea L.). Experimental Agriculture 19:355-359.
Overfield, D. and Fleming, E. (2001). A Note on the Influence of Gender Relations on the Technical
Efficiency of Smallholder Coffee Production in Papua New Guinea. Journal of Agricultural
Economics 153-156.
Pande, S., Bandyopadhyay, R., Blümmel, M., Narayana Rao, J., Thomas, D. and Navi, S.S. (2003).
Disease Management Factors Influencing Yield and Quality of Sorghum and Groundnuts Crop
Residues. Field Crops Research 84:89-103.
Parlevliet, J.E. (1983). Can Horizontal Resistance Be Recognized in the Presence of Vertical
Resistance in Plants Exposed to a Mixture of Pathogen Races? Phytopathology 73:379.
Parlevliet, J.E. and van Ommeren, A. (1988). Accumulation of Partial Resistance in Barley to Barley
Leaf Rust and Powdery Mildew Through Recurrent Selection Against Susceptibility. Euphytica
37:261-274.
Pattee, H.E. and Stalker, H.T. (1995). Advances in peanut science. American Peanut Research and
Education Society, Inc., Stillwater, UK.
Pompeu, A.S. (1980). Groundnut production, utilization, research problems and further research
needs in Brazil. In Proceedings of the international workshop on groundnut. ICRISAT centre,
13-17th October 1980, Patancheru, India. Pp. 244-246.
Ramadhan, T., Otsyina, R. and Franzel, S. (2002). Improving Household Incomes and Reducing
Deforestation Using Rotational Woodlots in Tabora District, Tanzania. Agriculture Ecosystem
Environment 89:229-239.
Rao, V.R. and Murty, U.R. (1994). Botany - Morphology and Anatomy. In: Smartt, J. (Editor). The
Groundnut Crop: A Scientific Basis for Improvement. Chapman and Hall. London, UK. Pp. 42-
95.
27
Reddy, L.J., Nigam, S.N., Subrahmanyam, P., Ismael, F.M., Govinden, N. and Van der Merwe,
P.J.A. (2000). Registration of groundnut cultivar venus (ICGV 87853). International Arachis
Newsletter 20:29–31.
Redona, E.D. and Lantican, R.M. (1985). Genetic Analysis of Some Quantitative Traits in Peanut,
(Arachis hypogaea L.) I. General and Specific Combining Ability Estimates. Philippines Journal
of Crop Science 10:81-86.
Robinson, R.A. (1980). New Concepts in Breeding for Disease Resistance. Annual Review of
Phytopathology 18:189-210.
Rogers, E.M. (1995). Diffusion of innovations 3rd Edition. The Free Press, New York, USA.
Sangha, A.S. and Labana, K.S. (1982). Diallel Analysis in Groundnut (Arachis hypogaea L.).
Theoretical and Applied Genetics. 64:59-63.
Shokes, F.M. and Culbreath, A.K. (1997). Early and Late Leaf Spots. In: Compendium of Peanut
Diseases, Kokalis-Burelle, N., D.M. Porter, R. Rodriguez-Kabana, D.H. Smith and P.
Subrahmanyam (Editors.), 2nd Edition., American Phytopathological Society, St. Paul,
Minnesota, USA. Pp. 17-20.
Shokes, F.M. and Melouk, H.A. (1995). Plant health management in peanut production, In: H. A.
Melouk and F.M. Shokes (Editors). Peanut Health Management. The American
Phytopathological Society, Minnesota, USA. Pp.1-6.
Sibuga, K.P., Kafiriti, E.M and Mwenda, F.F. (1992). A Review of Groundnut Agronomy in Tanzania:
Current Status and Existing Gaps. Fifth regional groundnut workshop for Southern Africa,
Lilongwe, Malawi, Pp. 47-52.
Smith, D.B. and Littrell, R.H. (1980). Management of Peanut Foliar Diseases with Fungicides. Plant
Disease 64:356-361.
Sorrensen, R., Butts, C., Lamb, M. and Rowland, D. (2004). Five years of sub-surface drip
irrigation on Peanut, UGA/CPES Research and Extension Bulletin No.2004.
Sprent, J. (1994). Nitrogen fixation, in: J. Smartt (Editor), The Groundnut Crop - A Scientific Basis
for Crop Improvement, Chapman and Hall, London, UK. Pp. 255-280.
Stalker, H.T. (1997). Peanut (Arachis hypogaea L.). Field Crops Research 53:205-217.

28
Stalker, H.T. and Simpson, C.E. (1995). Germplasm Resources in Arachis, In: H.E. Pattee and
H.T. Stalker (Editors). Advances in Peanut Science, American Peanut Research Education
Society Inc., Stillwater, Oakland, Pp.14-53.
Subrahmanyam, P., McDonald, D., Gibbons, R.W., Nigam, S.N. and Nevill, D.J. (1982). Resistance
to Rust and Late Leaf Spot in Some Genotypes of Arachis hypogaea. Peanut Science 9:6-10.
Subrahmanyam, P., McDonald, D., Waliyar, F., Reddy, L.J., Nigam, S.N., Gibbons, R.W.,
Ramanatha Rao, V., Singh, A.K., Pande, S., Reddy, P.M. and Subba Rao, P.V. (1995).
Screening methods and sources of resistance to rust and late leaf spot of groundnut.
Information Bulletin no. 47. ICRISAT, Patancheru 502 324, Andhra Pradesh, India, Pp.1-20.
Subrahmanyam, P., Moss, J.P., McDonald, D., Subba Rao, P.V. and Rao, V.R. (1985). Resistance
to Leaf Spot Caused by Cercosporidium personatum in Wild Arachis species. Plant Diseases
69:951–954.
Taru, V.B., Kyagya, I.Z. and Mshelia, S.I. (2010). Profitability of Groundnuts Production in Michika
Local Government Area of Adamawa State, Nigeria. Journal of Agricultural Science 1:25-29.
Upadhyaya, H.D., Reddy, L.J., Gowda, C.L.L. and Singh, S. (2006). Identification of Diverse
Groundnut Germplasm: Sources of Early Maturity in a Core Collection. Field Crops Research
97:261-271.
Van der Plank, J.E. (1968). Disease resistance in plants. Academic Press, New York, USA.
Varnam, P.V., Raveendran, T.S. and Ganapathy, T. (1989). Genome and Plasm Effects on Rust in
Groundnut (Arachis hypogaea L.). Philippines Journal of Crop Science14:11-13.
Weir, S. (1999). The effects of education on farmer productivity in Rural Ethiopia. Centre for the
Study of African Economies, Department of Economics, University of Oxford. Oxford, UK.
Wesche-Ebeling, P., Welti-Chanes, J., Santos-Garcia, J., Maiti, R.K. and Heredia-Garcia, N. (2002).
Food and feed science, in: R.K. Maiti and P. Wesche-Ebeling (Editors). The Peanut Crop
(Arachis hypogaea L.), Science Publishers, Inc., Enfield (New Hampshire), Pp. 243-283.
Wynne, J. C. and Coffelt, T. A. (1982). Genetics of Arachis hypogaea L. In: H.E. Pattee and C. T.
Young (Editors). Peanut science and technology. America Peanut Resource Education
Society, Yoakum, TX, Pp. 50–94.
Wynne, J.C. and Gregory, W.C. (1981). Peanut Breeding. Advances in Agronomy 34:39–72.
29
Chapter 2: Groundnut production constraints and traits preferred by
stakeholders in the groundnut value chain in semi- arid areas of
Tanzania
Abstract
Groundnut (Arachis hypogaea L.), a self-pollinating legume, is an important crop cultivated on
24 million ha across the world for the extraction of edible oil and food uses. However, yields
have remained low in most sub-Saharan Africa countries, Tanzania inclusive, regardless of the
availability of improved varieties. The objectives of this study were to investigate the major crops
grown, farmers’ groundnut variety selection criteria, cropping systems, groundnut production
constraints, and farmers’ awareness of Cercospora leaf spot disease. Furthermore, the study
intended to investigate preferences and challenges facing groundnut traders and processors.
The study was conducted in Bahi, Dodoma municipal and Kongwa districts in the Dodoma
region in the central zone of Tanzania. Semi-structured questionnaires were administered to
obtain detailed information on groundnut production in the region. The study established that the
main crops grown in the region were maize, groundnut, sunflower and sorghum. Groundnut was
the most commonly grown crop, followed by maize, sunflower and sorghum, respectively. The
major constraints for groundnut production were drought, diseases, insect pests, lack of suitable
improved cultivars and reliable markets. About 85% of the farmers were growing local
landraces, and 15% were growing improved varieties. Further findings identified four seed
sources for the varieties used by the farmers, namely; farmer saved seed, seed purchase from
fellow farmers, from the local market, or obtained from the government through researchers or
extension workers. Farmers in this region preferred erect, brown seeded groundnut cultivars
that have medium to large seed size, are early maturing, have a high yielding potential, high oil
content, and are tolerant to drought, diseases and insect pests. While Cercospora leaf spot
diseases infected over 70% of the fields evaluated in the region, farmers were not taking any
action, thinking that leaf defoliation was a sign of maturity. There is, thus, a need to develop
groundnut cultivars that are tolerant to biotic and abiotic stresses, and with characteristics
preferred by the farmers and other stakeholders in the groundnut value chain.
Keywords: Cercospora leaf spot disease, groundnut (Arachis hypogaea L.), participatory rural
appraisal, stakeholders, Tanzania, value chain.
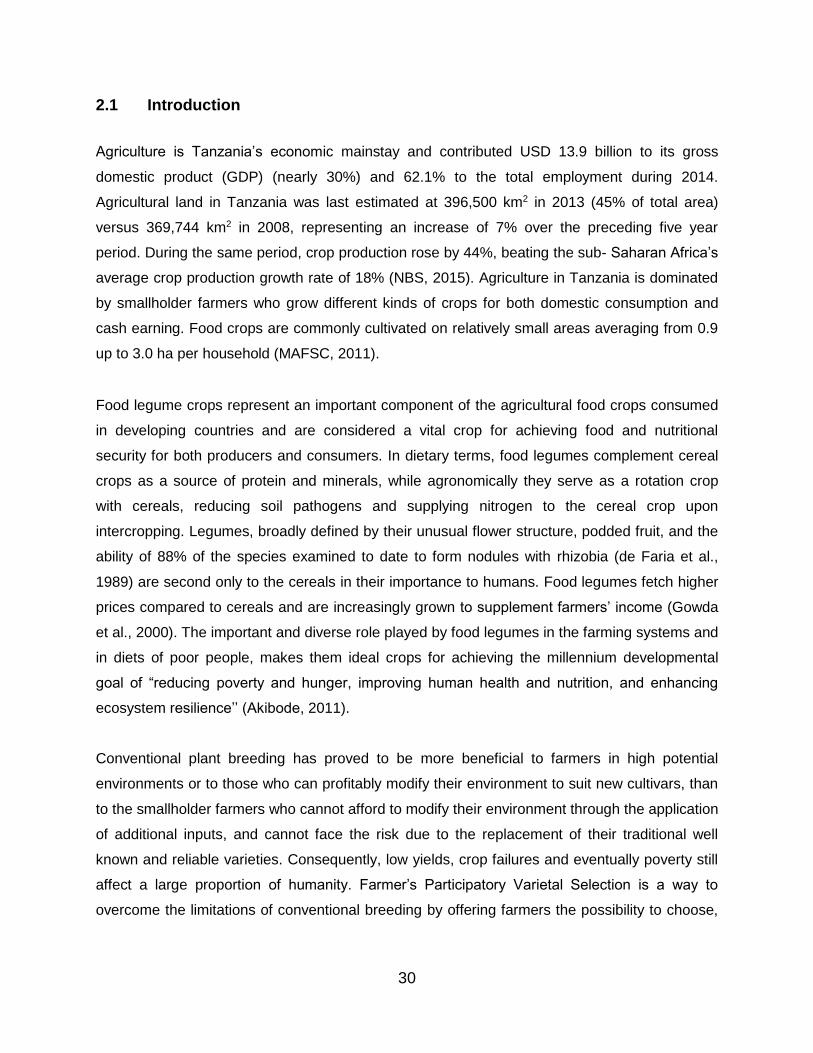
30
2.1 Introduction
Agriculture is Tanzania’s economic mainstay and contributed USD 13.9 billion to its gross
domestic product (GDP) (nearly 30%) and 62.1% to the total employment during 2014.
Agricultural land in Tanzania was last estimated at 396,500 km2 in 2013 (45% of total area)
versus 369,744 km2 in 2008, representing an increase of 7% over the preceding five year
period. During the same period, crop production rose by 44%, beating the sub- Saharan Africa’s
average crop production growth rate of 18% (NBS, 2015). Agriculture in Tanzania is dominated
by smallholder farmers who grow different kinds of crops for both domestic consumption and
cash earning. Food crops are commonly cultivated on relatively small areas averaging from 0.9
up to 3.0 ha per household (MAFSC, 2011).
Food legume crops represent an important component of the agricultural food crops consumed
in developing countries and are considered a vital crop for achieving food and nutritional
security for both producers and consumers. In dietary terms, food legumes complement cereal
crops as a source of protein and minerals, while agronomically they serve as a rotation crop
with cereals, reducing soil pathogens and supplying nitrogen to the cereal crop upon
intercropping. Legumes, broadly defined by their unusual flower structure, podded fruit, and the
ability of 88% of the species examined to date to form nodules with rhizobia (de Faria et al.,
1989) are second only to the cereals in their importance to humans. Food legumes fetch higher
prices compared to cereals and are increasingly grown to supplement farmers’ income (Gowda
et al., 2000). The important and diverse role played by food legumes in the farming systems and
in diets of poor people, makes them ideal crops for achieving the millennium developmental
goal of “reducing poverty and hunger, improving human health and nutrition, and enhancing
ecosystem resilience’’ (Akibode, 2011).
Conventional plant breeding has proved to be more beneficial to farmers in high potential
environments or to those who can profitably modify their environment to suit new cultivars, than
to the smallholder farmers who cannot afford to modify their environment through the application
of additional inputs, and cannot face the risk due to the replacement of their traditional well
known and reliable varieties. Consequently, low yields, crop failures and eventually poverty still
affect a large proportion of humanity. Farmer’s Participatory Varietal Selection is a way to
overcome the limitations of conventional breeding by offering farmers the possibility to choose,
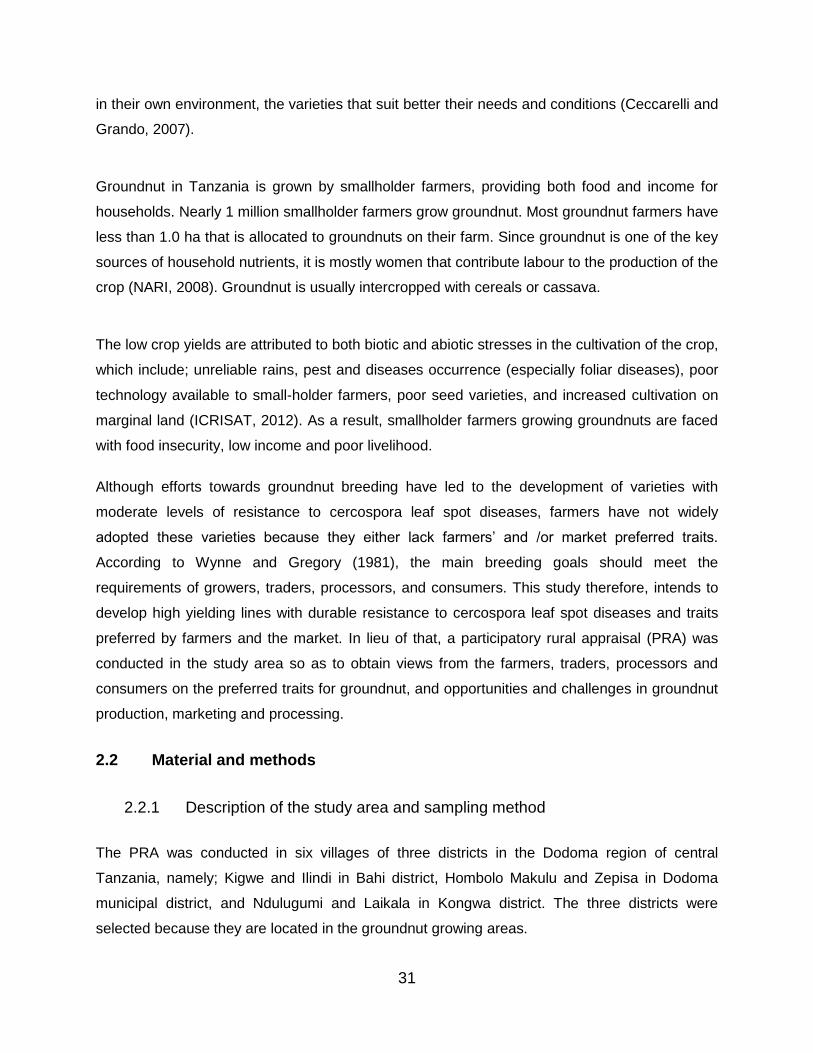
31
in their own environment, the varieties that suit better their needs and conditions (Ceccarelli and
Grando, 2007).
Groundnut in Tanzania is grown by smallholder farmers, providing both food and income for
households. Nearly 1 million smallholder farmers grow groundnut. Most groundnut farmers have
less than 1.0 ha that is allocated to groundnuts on their farm. Since groundnut is one of the key
sources of household nutrients, it is mostly women that contribute labour to the production of the
crop (NARI, 2008). Groundnut is usually intercropped with cereals or cassava.
The low crop yields are attributed to both biotic and abiotic stresses in the cultivation of the crop,
which include; unreliable rains, pest and diseases occurrence (especially foliar diseases), poor
technology available to small-holder farmers, poor seed varieties, and increased cultivation on
marginal land (ICRISAT, 2012). As a result, smallholder farmers growing groundnuts are faced
with food insecurity, low income and poor livelihood.
Although efforts towards groundnut breeding have led to the development of varieties with
moderate levels of resistance to cercospora leaf spot diseases, farmers have not widely
adopted these varieties because they either lack farmers’ and /or market preferred traits.
According to Wynne and Gregory (1981), the main breeding goals should meet the
requirements of growers, traders, processors, and consumers. This study therefore, intends to
develop high yielding lines with durable resistance to cercospora leaf spot diseases and traits
preferred by farmers and the market. In lieu of that, a participatory rural appraisal (PRA) was
conducted in the study area so as to obtain views from the farmers, traders, processors and
consumers on the preferred traits for groundnut, and opportunities and challenges in groundnut
production, marketing and processing.
2.2 Material and methods
2.2.1 Description of the study area and sampling method
The PRA was conducted in six villages of three districts in the Dodoma region of central
Tanzania, namely; Kigwe and Ilindi in Bahi district, Hombolo Makulu and Zepisa in Dodoma
municipal district, and Ndulugumi and Laikala in Kongwa district. The three districts were
selected because they are located in the groundnut growing areas.
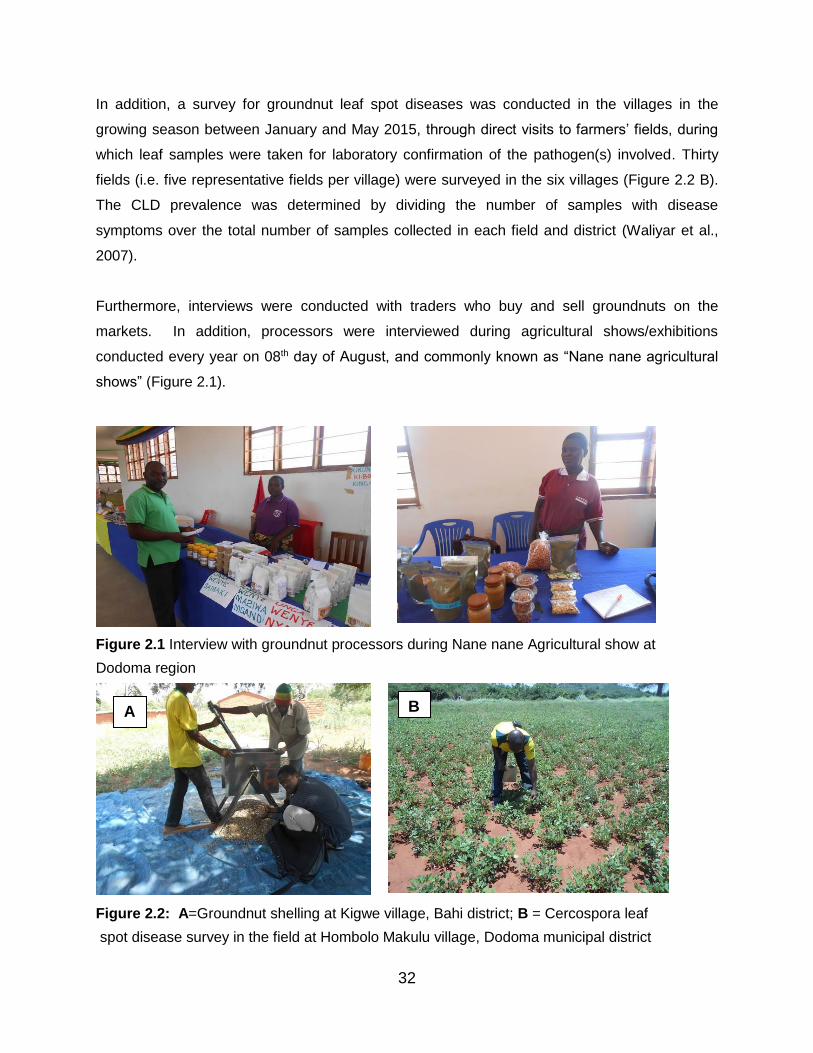
32
In addition, a survey for groundnut leaf spot diseases was conducted in the villages in the
growing season between January and May 2015, through direct visits to farmers’ fields, during
which leaf samples were taken for laboratory confirmation of the pathogen(s) involved. Thirty
fields (i.e. five representative fields per village) were surveyed in the six villages (Figure 2.2 B).
The CLD prevalence was determined by dividing the number of samples with disease
symptoms over the total number of samples collected in each field and district (Waliyar et al.,
2007).
Furthermore, interviews were conducted with traders who buy and sell groundnuts on the
markets. In addition, processors were interviewed during agricultural shows/exhibitions
conducted every year on 08th day of August, and commonly known as “Nane nane agricultural
shows” (Figure 2.1).
Figure 2.1 Interview with groundnut processors during Nane nane Agricultural show at
Dodoma region
Figure 2.2: A=Groundnut shelling at Kigwe village, Bahi district; B = Cercospora leaf
spot disease survey in the field at Hombolo Makulu village, Dodoma municipal district
A B
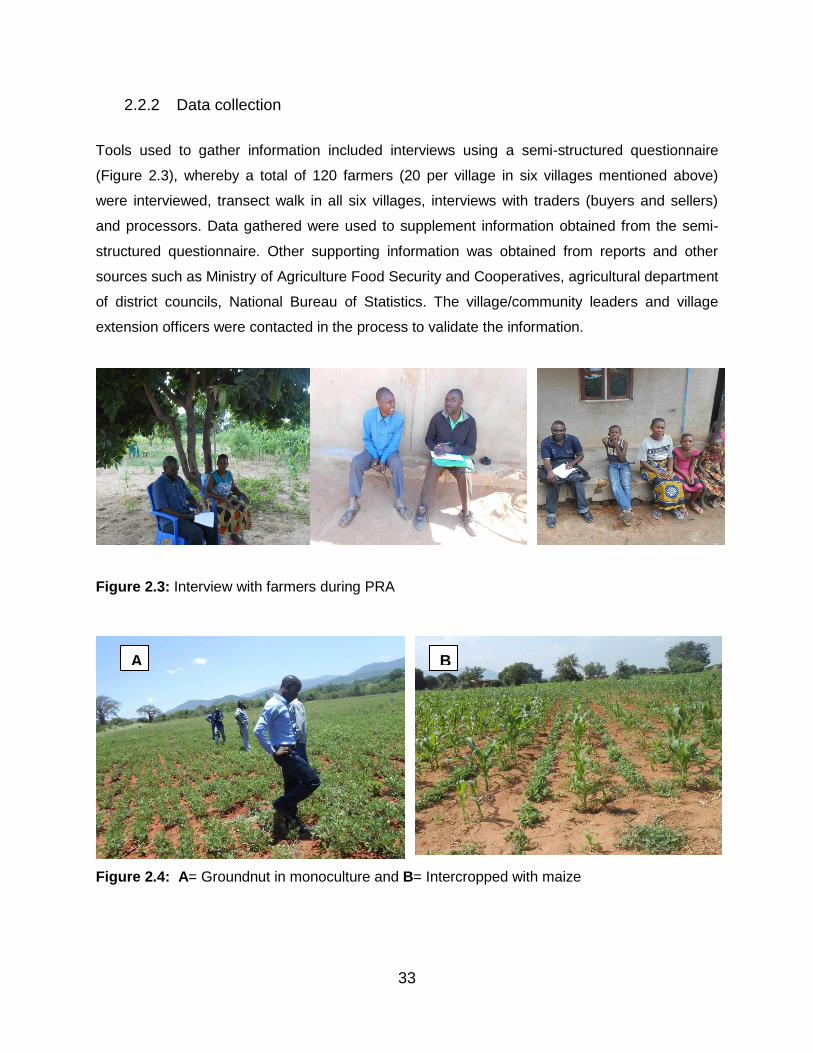
33
2.2.2 Data collection
Tools used to gather information included interviews using a semi-structured questionnaire
(Figure 2.3), whereby a total of 120 farmers (20 per village in six villages mentioned above)
were interviewed, transect walk in all six villages, interviews with traders (buyers and sellers)
and processors. Data gathered were used to supplement information obtained from the semi-
structured questionnaire. Other supporting information was obtained from reports and other
sources such as Ministry of Agriculture Food Security and Cooperatives, agricultural department
of district councils, National Bureau of Statistics. The village/community leaders and village
extension officers were contacted in the process to validate the information.
Figure 2.3: Interview with farmers during PRA
Figure 2.4: A= Groundnut in monoculture and B= Intercropped with maize
A B

34
2.3 Data analysis
Statistical analyses for both quantitative and qualitative data were performed using the
Statistical Package for Social Sciences (SPSS) (Release 21) computer package. Data were
classified as nominal or ordinal when entered into the SPSS spreadsheet. For exploring
relationships, frequencies, descriptive statistics and cross tabulation were computed; Charts
were drawn in Microsoft Office Excel 2010 version.
2.4 Results
2.4.1 Socio-economic characteristics of the households
The majority (83.9%) of the household heads who engaged themselves in groundnuts
production were aged between 21 to 60 years old, while very few (16.1%) were over 60 years
old (Table 2.1). The data also revealed that, to a large extent groundnuts production in the study
area was dominated by the male individuals (72.6%). The majority (96.8 %) of farmers had
attended primary and secondary school education and were literate.
Table 2.1: Household socio-economic characteristics district wise
Age group of farmers Bahi Kongwa Dodoma Municipal
Total Percentage
21-30 years old 5 4 4 13 10.5 31-40 years old 13 13 13 39 31.4 41-50 years old 10 9 8 27 21.8 51-60 years old 8 10 7 25 20.2 above 60 years old 5 4 11 20 16.1
Total 41 40 43 124 100
Gender category of famers
Male 33 24 33 90 72.6
Female 8 16 10 34 27.4
Total 41 40 43 124 100
Education level Primary 34 30 39 103 83.1 Secondary 7 6 4 17 13.7 Illiterate 0 4 0 4 3.2 Total 41 40 43 124 100
Source: Household survey data.
2.4.2 Crops grown in the 2012/13 to 2014/15 production seasons
Table 2.2 presents the various crops grown by smallholder farmers in the study area in the three
consecutive production seasons, namely 2012/13, 2013/14 and 2014/15. The findings revealed
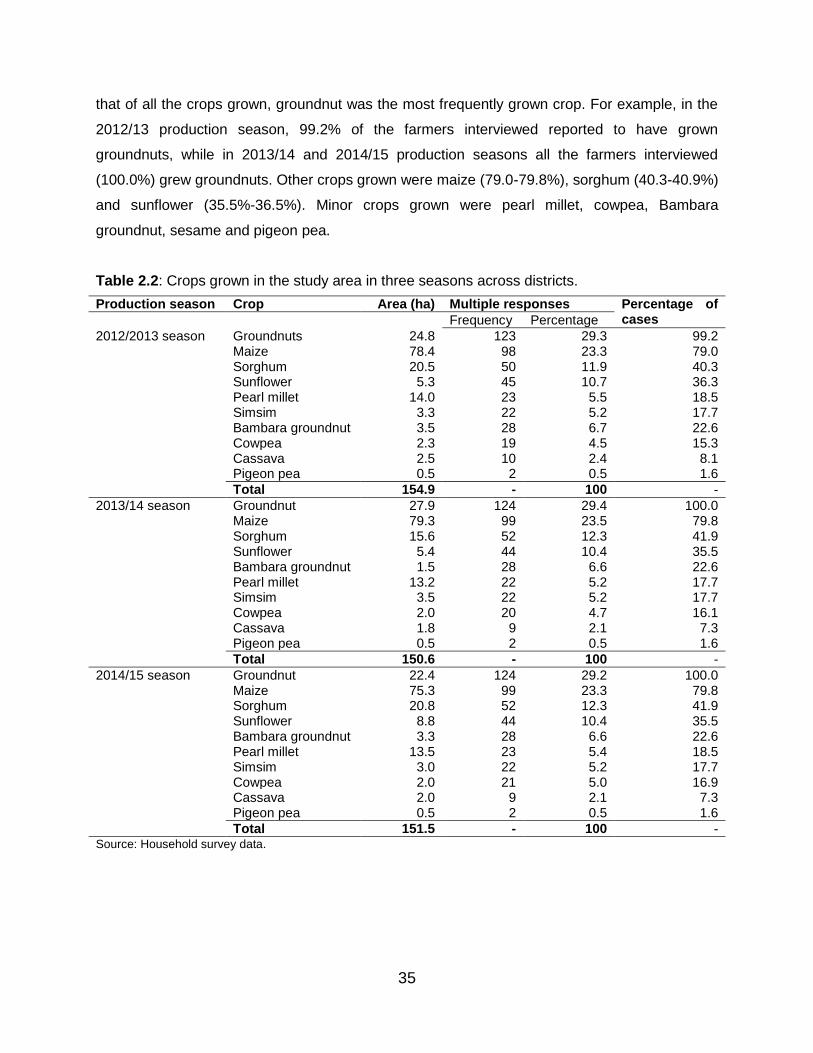
35
that of all the crops grown, groundnut was the most frequently grown crop. For example, in the
2012/13 production season, 99.2% of the farmers interviewed reported to have grown
groundnuts, while in 2013/14 and 2014/15 production seasons all the farmers interviewed
(100.0%) grew groundnuts. Other crops grown were maize (79.0-79.8%), sorghum (40.3-40.9%)
and sunflower (35.5%-36.5%). Minor crops grown were pearl millet, cowpea, Bambara
groundnut, sesame and pigeon pea.
Table 2.2: Crops grown in the study area in three seasons across districts.
Production season Crop Area (ha) Multiple responses Percentage of cases Frequency Percentage
2012/2013 season Groundnuts 24.8 123 29.3 99.2 Maize 78.4 98 23.3 79.0 Sorghum 20.5 50 11.9 40.3 Sunflower 5.3 45 10.7 36.3 Pearl millet 14.0 23 5.5 18.5 Simsim 3.3 22 5.2 17.7 Bambara groundnut 3.5 28 6.7 22.6 Cowpea 2.3 19 4.5 15.3 Cassava 2.5 10 2.4 8.1 Pigeon pea 0.5 2 0.5 1.6
Total 154.9 - 100 -
2013/14 season Groundnut 27.9 124 29.4 100.0 Maize 79.3 99 23.5 79.8 Sorghum 15.6 52 12.3 41.9 Sunflower 5.4 44 10.4 35.5 Bambara groundnut 1.5 28 6.6 22.6 Pearl millet 13.2 22 5.2 17.7 Simsim 3.5 22 5.2 17.7 Cowpea 2.0 20 4.7 16.1 Cassava 1.8 9 2.1 7.3 Pigeon pea 0.5 2 0.5 1.6
Total 150.6 - 100 -
2014/15 season Groundnut 22.4 124 29.2 100.0 Maize 75.3 99 23.3 79.8 Sorghum 20.8 52 12.3 41.9 Sunflower 8.8 44 10.4 35.5 Bambara groundnut 3.3 28 6.6 22.6 Pearl millet 13.5 23 5.4 18.5 Simsim 3.0 22 5.2 17.7 Cowpea 2.0 21 5.0 16.9 Cassava 2.0 9 2.1 7.3 Pigeon pea 0.5 2 0.5 1.6
Total 151.5 - 100 - Source: Household survey data.
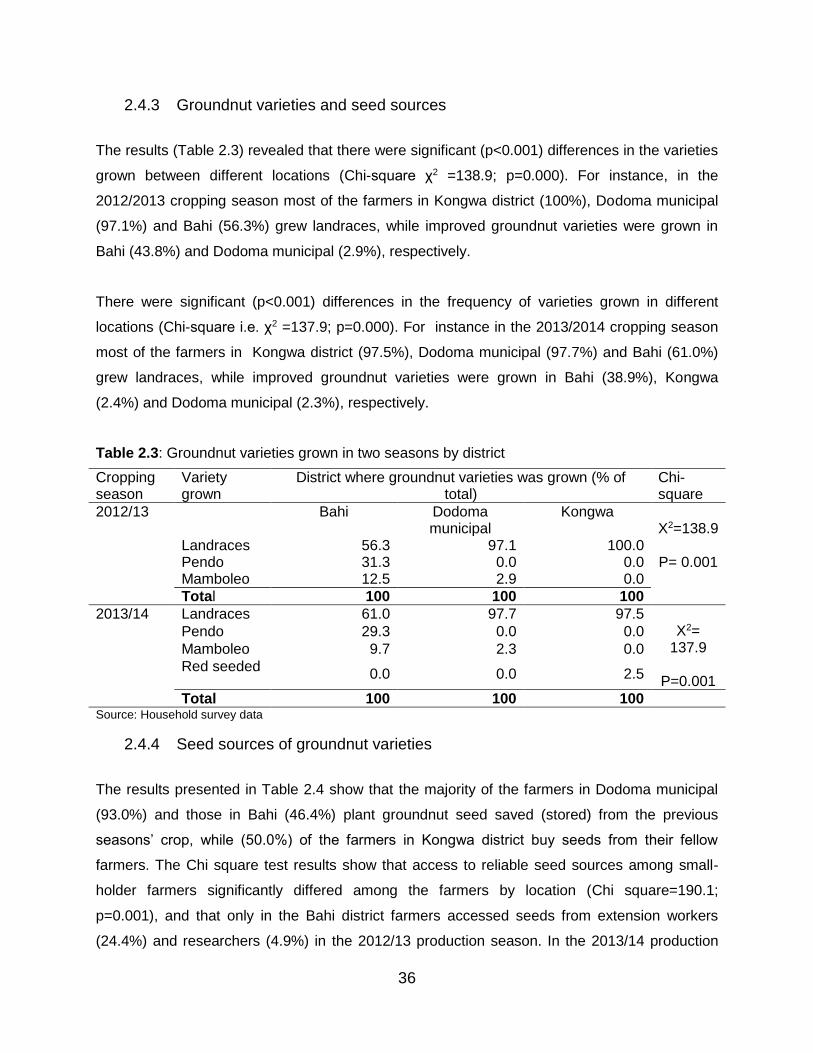
36
2.4.3 Groundnut varieties and seed sources
The results (Table 2.3) revealed that there were significant (p<0.001) differences in the varieties
grown between different locations (Chi-square χ2 =138.9; p=0.000). For instance, in the
2012/2013 cropping season most of the farmers in Kongwa district (100%), Dodoma municipal
(97.1%) and Bahi (56.3%) grew landraces, while improved groundnut varieties were grown in
Bahi (43.8%) and Dodoma municipal (2.9%), respectively.
There were significant (p<0.001) differences in the frequency of varieties grown in different
locations (Chi-square i.e. χ2 =137.9; p=0.000). For instance in the 2013/2014 cropping season
most of the farmers in Kongwa district (97.5%), Dodoma municipal (97.7%) and Bahi (61.0%)
grew landraces, while improved groundnut varieties were grown in Bahi (38.9%), Kongwa
(2.4%) and Dodoma municipal (2.3%), respectively.
Table 2.3: Groundnut varieties grown in two seasons by district
Cropping season
Variety grown
District where groundnut varieties was grown (% of total)
Chi- square
2012/13 Bahi Dodoma municipal
Kongwa X2=138.9
P= 0.001
Landraces 56.3 97.1 100.0 Pendo 31.3 0.0 0.0 Mamboleo 12.5 2.9 0.0
Total 100 100 100
2013/14 Landraces 61.0 97.7 97.5 X2=
137.9
P=0.001
Pendo 29.3 0.0 0.0
Mamboleo 9.7 2.3 0.0
Red seeded 0.0 0.0 2.5
Total 100 100 100 Source: Household survey data
2.4.4 Seed sources of groundnut varieties
The results presented in Table 2.4 show that the majority of the farmers in Dodoma municipal
(93.0%) and those in Bahi (46.4%) plant groundnut seed saved (stored) from the previous
seasons’ crop, while (50.0%) of the farmers in Kongwa district buy seeds from their fellow
farmers. The Chi square test results show that access to reliable seed sources among small-
holder farmers significantly differed among the farmers by location (Chi square=190.1;
p=0.001), and that only in the Bahi district farmers accessed seeds from extension workers
(24.4%) and researchers (4.9%) in the 2012/13 production season. In the 2013/14 production
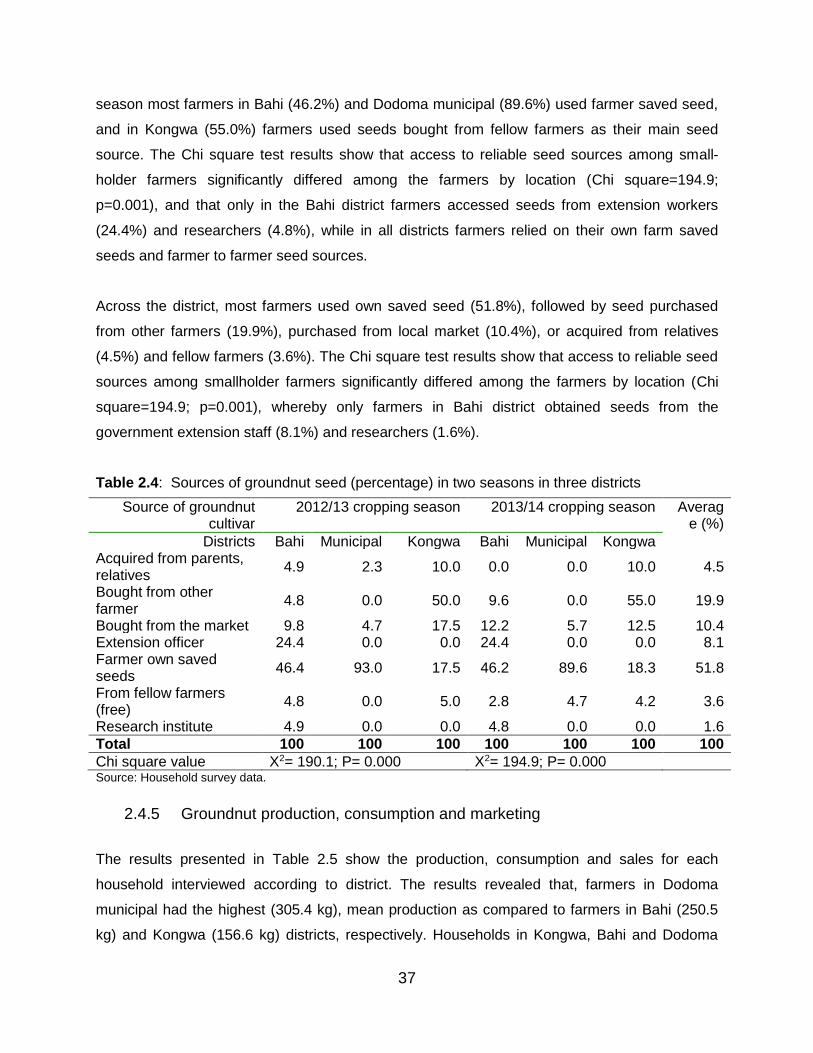
37
season most farmers in Bahi (46.2%) and Dodoma municipal (89.6%) used farmer saved seed,
and in Kongwa (55.0%) farmers used seeds bought from fellow farmers as their main seed
source. The Chi square test results show that access to reliable seed sources among small-
holder farmers significantly differed among the farmers by location (Chi square=194.9;
p=0.001), and that only in the Bahi district farmers accessed seeds from extension workers
(24.4%) and researchers (4.8%), while in all districts farmers relied on their own farm saved
seeds and farmer to farmer seed sources.
Across the district, most farmers used own saved seed (51.8%), followed by seed purchased
from other farmers (19.9%), purchased from local market (10.4%), or acquired from relatives
(4.5%) and fellow farmers (3.6%). The Chi square test results show that access to reliable seed
sources among smallholder farmers significantly differed among the farmers by location (Chi
square=194.9; p=0.001), whereby only farmers in Bahi district obtained seeds from the
government extension staff (8.1%) and researchers (1.6%).
Table 2.4: Sources of groundnut seed (percentage) in two seasons in three districts
Source of groundnut cultivar
2012/13 cropping season 2013/14 cropping season Average (%)
Districts Bahi Municipal Kongwa Bahi Municipal Kongwa Acquired from parents, relatives
4.9 2.3 10.0 0.0 0.0 10.0 4.5
Bought from other farmer
4.8 0.0 50.0 9.6 0.0 55.0 19.9
Bought from the market 9.8 4.7 17.5 12.2 5.7 12.5 10.4 Extension officer 24.4 0.0 0.0 24.4 0.0 0.0 8.1 Farmer own saved seeds
46.4 93.0 17.5 46.2 89.6 18.3 51.8
From fellow farmers (free)
4.8 0.0 5.0 2.8 4.7 4.2 3.6
Research institute 4.9 0.0 0.0 4.8 0.0 0.0 1.6
Total 100 100 100 100 100 100 100
Chi square value X2= 190.1; P= 0.000 X2= 194.9; P= 0.000 Source: Household survey data.
2.4.5 Groundnut production, consumption and marketing
The results presented in Table 2.5 show the production, consumption and sales for each
household interviewed according to district. The results revealed that, farmers in Dodoma
municipal had the highest (305.4 kg), mean production as compared to farmers in Bahi (250.5
kg) and Kongwa (156.6 kg) districts, respectively. Households in Kongwa, Bahi and Dodoma
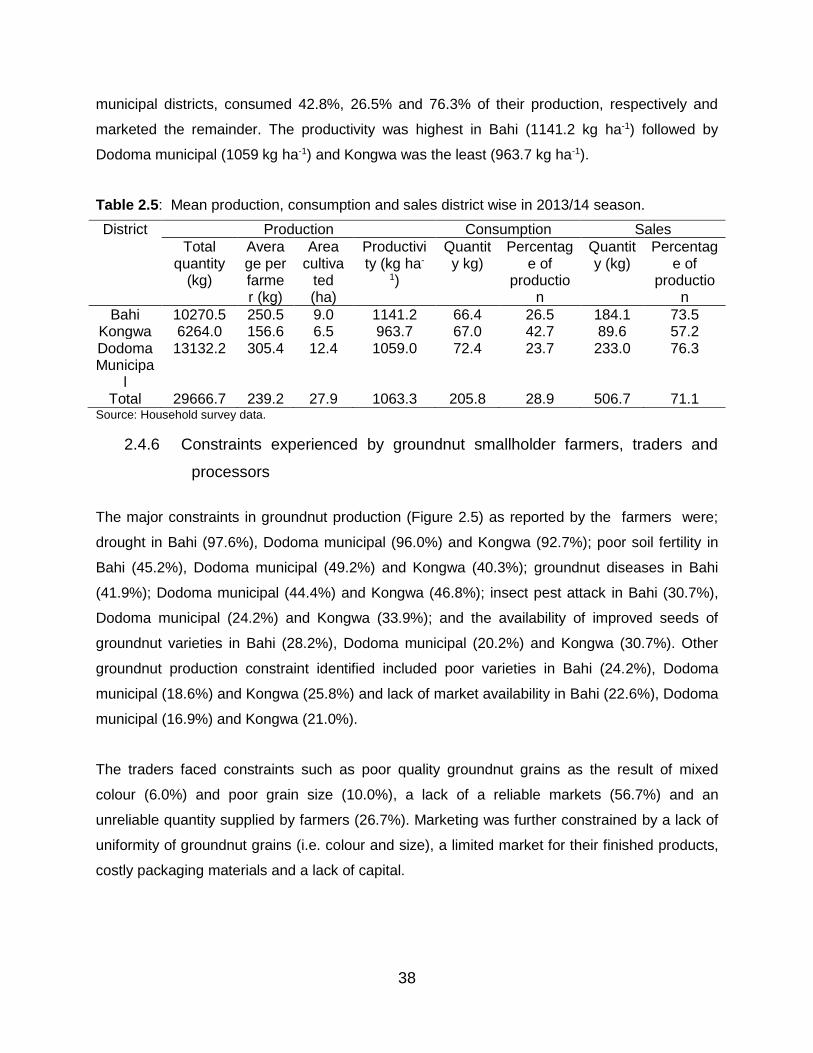
38
municipal districts, consumed 42.8%, 26.5% and 76.3% of their production, respectively and
marketed the remainder. The productivity was highest in Bahi (1141.2 kg ha-1) followed by
Dodoma municipal (1059 kg ha-1) and Kongwa was the least (963.7 kg ha-1).
Table 2.5: Mean production, consumption and sales district wise in 2013/14 season.
District Production Consumption Sales
Total quantity
(kg)
Average per farmer (kg)
Area cultiva
ted (ha)
Productivity (kg ha-
1)
Quantity kg)
Percentage of
production
Quantity (kg)
Percentage of
production
Bahi 10270.5 250.5 9.0 1141.2 66.4 26.5 184.1 73.5 Kongwa 6264.0 156.6 6.5 963.7 67.0 42.7 89.6 57.2 Dodoma Municipa
l
13132.2 305.4 12.4 1059.0 72.4 23.7 233.0 76.3
Total 29666.7 239.2 27.9 1063.3 205.8 28.9 506.7 71.1 Source: Household survey data.
2.4.6 Constraints experienced by groundnut smallholder farmers, traders and
processors
The major constraints in groundnut production (Figure 2.5) as reported by the farmers were;
drought in Bahi (97.6%), Dodoma municipal (96.0%) and Kongwa (92.7%); poor soil fertility in
Bahi (45.2%), Dodoma municipal (49.2%) and Kongwa (40.3%); groundnut diseases in Bahi
(41.9%); Dodoma municipal (44.4%) and Kongwa (46.8%); insect pest attack in Bahi (30.7%),
Dodoma municipal (24.2%) and Kongwa (33.9%); and the availability of improved seeds of
groundnut varieties in Bahi (28.2%), Dodoma municipal (20.2%) and Kongwa (30.7%). Other
groundnut production constraint identified included poor varieties in Bahi (24.2%), Dodoma
municipal (18.6%) and Kongwa (25.8%) and lack of market availability in Bahi (22.6%), Dodoma
municipal (16.9%) and Kongwa (21.0%).
The traders faced constraints such as poor quality groundnut grains as the result of mixed
colour (6.0%) and poor grain size (10.0%), a lack of a reliable markets (56.7%) and an
unreliable quantity supplied by farmers (26.7%). Marketing was further constrained by a lack of
uniformity of groundnut grains (i.e. colour and size), a limited market for their finished products,
costly packaging materials and a lack of capital.

39
Figure 2.5: Constraints facing groundnut farmers in the different districts.
2.4.7 Groundnut variety characteristics preferred by small-holder farmers, traders
and processors
The farmers prefer groundnut varieties with an erect growth type, that are high yielding, early
maturing, have a high oil content, are highly tolerant to diseases and drought, have large seed
size, seed with a good taste and the plants must be easy to thresh (Table 2.6). These were
among the main groundnut varieties’ good characteristics, which were reported by the farmers.
On the other hand, some farmers mentioned late maturity and a runner growth habit as their
preference. The majority (80.0%) of traders preferred medium to large groundnut seed size,
while only a few (20.0%) of them preferred small sized groundnut seed (Table 2.6). The majority
(66.7%) of processors (shelling and peanut butter makers) preferred medium to large seed size,
less pod constriction and sharp beaked groundnut, while 33.3% of the respondents preferred
small sized seed groundnut.

40
Table 2.6: Groundnut characteristics preferred by smallholder farmers, traders and processors in the study area.
Stakeholders in value chain
Good characteristics of cultivar Bahi Dodoma Municipal
Kongwa Total frequency
Percentage of frequency
Farmers (producers)
high yield 27 30 32 89 71.8
high oil content 27 30 32 89 71.8
disease resistance 27 30 32 89 71.8
erect growth habit 27 30 32 89 71.8
drought tolerance 27 30 32 89 71.8
early maturity 12 10 4 26 21.0 large grain size 12 10 4 26 21.0 good taste 12 10 4 26 21.0 many seeds per pod 12 10 4 26 21.0 good threshability 12 10 4 26 21.0
late maturity 12 10 4 26 21.0 runner growth habit 12 10 4 26 21.0 good market 0 0 1 1 0.8 easily available 2 3 3 8 6.4 easy to weed and uproot 2 3 3 8 6.4 Total 41 43 40 124 100.0
Traders medium to large seed size, brown colour
5 12 7 24 80
small seed size and brown colour
0 2 4 6 20
Total 5 14 11 30 100 Processors medium to large seed size, less
pod constriction, sharp beak and brown colour
2 2 0 4 66.7
small seed size, brown colour 0 0 2 2 33.3 Total 2 2 2 6 100
Source: Household survey data
2.4.8 Awareness on Cercospora leaf spot disease and adoption of varieties by
farmers
All the farmers interviewed experienced CLD in their fields. However, farmers generally were
not aware that the symptoms were caused by a disease, but considered the symptoms as a
sign of maturity. The majority (94.4%) of the farmers interviewed reported that they took no
action to control the disease, while a few farmers reported that they uprooted the infected plants
at the early stage and/or sometimes applied wood ashes or dried ground neem leaves. Most
farmers (99.2%) interviewed were ready to adopt new varieties.
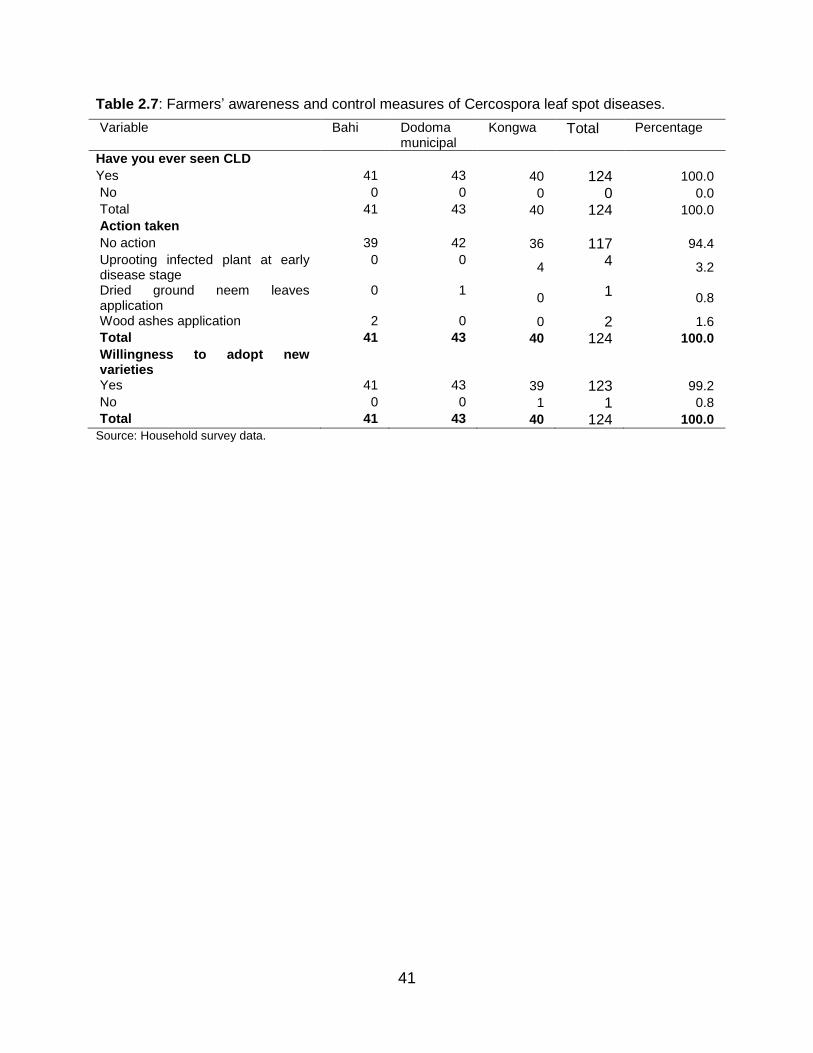
41
Table 2.7: Farmers’ awareness and control measures of Cercospora leaf spot diseases.
Variable Bahi Dodoma municipal
Kongwa Total Percentage
Have you ever seen CLD
Yes 41 43 40 124 100.0
No 0 0 0 0 0.0
Total 41 43 40 124 100.0
Action taken
No action 39 42 36 117 94.4
Uprooting infected plant at early disease stage
0 0 4
4 3.2
Dried ground neem leaves application
0 1 0
1 0.8
Wood ashes application 2 0 0 2 1.6
Total 41 43 40 124 100.0
Willingness to adopt new varieties
Yes 41 43 39 123 99.2
No 0 0 1 1 0.8
Total 41 43 40 124 100.0
Source: Household survey data.
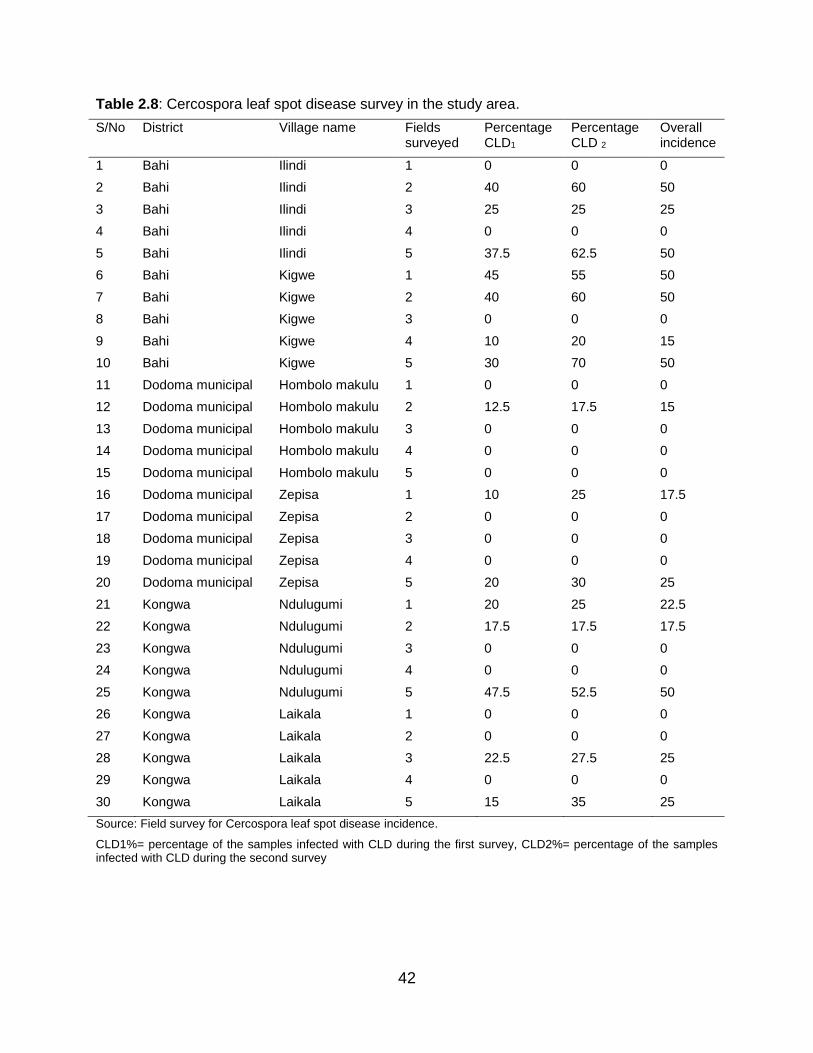
42
Table 2.8: Cercospora leaf spot disease survey in the study area.
S/No District Village name Fields surveyed
Percentage CLD1
Percentage CLD 2
Overall incidence
1 Bahi Ilindi 1 0 0 0
2 Bahi Ilindi 2 40 60 50
3 Bahi Ilindi 3 25 25 25
4 Bahi Ilindi 4 0 0 0
5 Bahi Ilindi 5 37.5 62.5 50
6 Bahi Kigwe 1 45 55 50
7 Bahi Kigwe 2 40 60 50
8 Bahi Kigwe 3 0 0 0
9 Bahi Kigwe 4 10 20 15
10 Bahi Kigwe 5 30 70 50
11 Dodoma municipal Hombolo makulu 1 0 0 0
12 Dodoma municipal Hombolo makulu 2 12.5 17.5 15
13 Dodoma municipal Hombolo makulu 3 0 0 0
14 Dodoma municipal Hombolo makulu 4 0 0 0
15 Dodoma municipal Hombolo makulu 5 0 0 0
16 Dodoma municipal Zepisa 1 10 25 17.5
17 Dodoma municipal Zepisa 2 0 0 0
18 Dodoma municipal Zepisa 3 0 0 0
19 Dodoma municipal Zepisa 4 0 0 0
20 Dodoma municipal Zepisa 5 20 30 25
21 Kongwa Ndulugumi 1 20 25 22.5
22 Kongwa Ndulugumi 2 17.5 17.5 17.5
23 Kongwa Ndulugumi 3 0 0 0
24 Kongwa Ndulugumi 4 0 0 0
25 Kongwa Ndulugumi 5 47.5 52.5 50
26 Kongwa Laikala 1 0 0 0
27 Kongwa Laikala 2 0 0 0
28 Kongwa Laikala 3 22.5 27.5 25
29 Kongwa Laikala 4 0 0 0
30 Kongwa Laikala 5 15 35 25
Source: Field survey for Cercospora leaf spot disease incidence.
CLD1%= percentage of the samples infected with CLD during the first survey, CLD2%= percentage of the samples infected with CLD during the second survey
43
2.5 Discussion
The majority (83.8%) of the respondents engaged in groundnuts production were aged between
21- 60 years old, while very few were above 60 years old (Table 2.1). These findings are similar
to what was reported by Akudugu et al. (2012). The majority (72.6%) of the groundnut farmers
were males. Furthermore, results show that, most of the respondents (96.8%) had attended
school. This implies that, the level of education of these farmers allows the extension service
providers to communicate new technology both orally and in written documents. Generally,
education is thought to create a favourable mental attitude for the acceptance of new practices,
especially information and management-intensive practices (Caswell et al., 2001; Ehler and
Bottrell, 2000). Groundnut was the leading crop among other crops grown by farmers in the
study area for three consecutive production seasons from 2012 to 2015 (Table 2.2). Other crops
grown were maize and sorghum. The current study findings are in accordance with a study by
Upadhyaya et al. (2006) which found that groundnut is one of the important crops for both
subsistence and commercial agriculture in semi-arid areas such as the Dodoma region.
The majority of the farmers in the study area grow primarily landraces from seeds, which they
saved from previous seasons. Only a few farmers from Bahi, Dodoma municipal and Kongwa
districts respectively, were growing improved cultivars of groundnuts for two consecutive
production seasons from 2012 to 2014 (Table 2.3). The high rate of use of landraces can
probably be attributed to the unavailability of improved groundnut cultivars with farmers’
preferred traits. The low level of adoption of improved groundnut cultivars could also be
attributed to lack of an efficient extension service. The seed sources commonly used by farmers
in the study area were farmers’ own saved seed, seed purchased from other farmers, seed
purchased from local market, acquired free from relatives or fellow farmers, or from research
institutions (Table 2.4). The results indicate that an informal seed system dominates the area.
Only farmers in the Bahi district accessed seeds from extension staff and researchers, while in
other districts farmers relied entirely on informal community seed system. This could have been
due to lack of extension and the absence of a good seed multiplication system for the improved
cultivars. FAOSTAT (2011) reported that seed recycling leads to a decline in groundnut
production. Mangasini et al. (2014) reported that, most of the groundnut farmers have limited
access to extension services and high yielding groundnut varieties.
44
Drought was the major constraint in groundnut production as was reported by most (95.4%) of
the smallholder farmers. This finding agrees with a study by Kimmins et al. (1999), which found
that drought and climatic variability contributing to declining groundnut productivity. Poor soil
fertility was the second major constraint in groundnut production reported.
Diseases were mentioned by many farmers as one of the main constraints. Diseases of
groundnut reduce yield and quality of grains and increase the cost of production in many
groundnut growing areas (Wynne et al., 1992). A high disease pressure accounts for large yield
losses, food insecurity and a reduction of the farm households’ income. Additional constraints
reported included seed availability (26.4%) and poor cultivars (22.9%). The limited availability of
improved seeds to the farmers results in low productivity levels and emphasizes the need for a
strong crop improvement program and a well-managed groundnut seed system.
Farmers mentioned the lack of good markets for their groundnut as one of their constraints and
mentioned that they are often forced to use middlemen, resulting in lower prices for their product
The traders, on the other hand, faced constraints such as poor quality groundnut grains, lack of
a reliable market and the fluctuation in the quantity supplied by farmers. The processors were
often constrained by the lack of seeds (i.e. colour and size), the low quantity supplied by
farmers, the small and unreliable market for their finished products the cost of packaging and
the lack of capital.
Farmers mentioned high yield, high oil content, tolerance to diseases and drought as important
variety traits. In addition, characteristics such as early maturity, good taste, large seed size,
threshability and high number of seeds per pod were also mentioned. Birru et al. (2005)
reported that farmers’ variety selection criteria largely depend on the importance of the crop in
the farming system and their uses. Bucheyeki et al. (2008) reported that, in Tabora, Tanzania,
farmers prefer groundnut varieties with high yield, large seed size and resistance to diseases.
Furthermore, Ndjeunga et al. (2010) reported in their study on farmer preferences for groundnut
traits in West Africa, that yield related traits were very important in varieties preferred by
farmers.
All farmers interviewed had seen Cercospora leaf spot disease (CLD) in their fields. This implies
that the disease was very common and rampant in the study area. A similar observation was
made by Brandenburg (2003) who stated that, CLD incidence was 100% in all groundnut
45
growing regions in northern Ghana. A high disease pressure accounts for great losses in crop
production, food insecurity and lowering of farming households’ income.
The majority of the farmers reported that they took no action even if they observed CLD in their
farms, though a few reported that they uprooted the infected plants at an early stage, or applied
wood ashes to infected plants. However, it seems that the farmers have no efficient ways of
controlling the disease within the study area. These findings are similar to earlier report by
Nutsugah et al. (2007.) in their study on control measures of CLD in northern Ghana.
The majority of the farmers were ready to adopt new varieties if developed. This implies that,
many farmers are aware of the problems and effects of not using improved technologies in
solving the groundnut production problems, which have been the cause of low outputs and
income. The study findings are in accordance to what was reported by Bucheyeki et al. (2008)
namely that, farmers are receptive to new technologies that have an added advantage over their
current existing technologies.
2.6 Conclusion
The study found out that, smallholder famers in the study area prefers groundnut varieties with
erect growth habit because of the easiness of harvesting as compared to runner type of
groundnut varieties which needs a lot of digging during harvesting. The farmers prefer brown
coloured seeds because they do not stain the food in which it is used as an ingredient as
opposed to red coloured seeds which if not removed the testa it will stain the food red and make
it unattractive. Farmers prefer groundnut varieties with high oil content because the higher the
oil content the softer the groundnut and vice versa. In addition, the farmers prefer groundnut
varieties, which are high yielding, resistant to diseases and tolerant to drought and other abiotic.
On the other hand traders and processors prefer groundnut varieties with medium to big sized
seeds, resistant to disease, pests and tolerant to drought to have good market and processing
quality and thereby, fetch a high.
46
References
Akibode, C.S. (2011). Trends in the production, trade, and consumption of food-legume crops in
Sub-Saharan Africa. A paper submitted for the award of degree of Master of Science in
Agricultural, Food, and Resource Economics. Michigan State University, USA.
Akudugu, M.A., Guo, E. and. Dadzie, S.K. (2012). Adoption of Modern Agricultural Production
Technologies by Farm Households in Ghana. Journal of Biology, Agriculture and
Healthcare 2:1-14.
Birru, G.A., Assefa, T., Hussen, H.,Tewodrose, M. and Al Tawaha, A.R. (2005). Participatory
selection of drought tolerant maize varieties using mother and baby methodology: A Case
Study in the Semi Arid Zones of the Central Rift Valley of Ethiopia. African Crop Science
Conference Proceedings, Volume 7. Pp. 1479-1485.
Brandenburg, R.L. (2003). Improving Production Efficiency Through Standardized, Integrated,
and Enhanced Research and Technology. Journal of Biology, Agriculture and Healthcare
4:1-28.
Bucheyeki, T.L., Shenkalwa, E.M., Mapunda, T.X. and Matata, L.W. (2008). On-Farm
Evaluation of Promising Groundnut Varieties for Adaptation and Adoption in Tanzania.
African Journal of Agricultural Research 3:531-536.
Caswell, M., Fuglie, K., Ingram, C., Jans, S. and Kascak, C. (2001). Adoption of agricultural
production practices: Lessons learned from the USDA, Area Studies Project. US
Department of Agriculture, Resource Economics Division, Economic Research Service,
Agriculture Economic Report No. 792. Washington DC, USA.
Ceccarelli, S. and Grando, S. (2007). Decentralized Participatory Plant Breeding: An Example of
Demand Driven Research. Euphytica 155:349-360.
de Faria, S.M., Lewis, G.P., Sprent, J.I. and Sutherland, J.M. (1989). Occurrence of Nodulation
in the Leguminosae. The New Phytologist 111:607-619.
Eastern and Southern Africa Small Scale farmers' Forum (ESSAF). (2013). Seeds and
Agriculture Research Processes in Tanzania: The case of small-scale farmers’
participation in setting research agenda. A scoping study report Supported under the EU
funded INSARD project. Pp. 42.
47
Ehler, L.E. and Bottrell, D.G. (2000). The Illusion of Integrated Pest Management. Issues in
Science and Technology 16:61–64.
Food and Agriculture Organization of United Nations (FAO). (2011). Food and Agriculture
Organization of the United Nations, Division of statistics, FAOSTAT database.
Food and Agriculture Organization of United Nations (FAO). (2012). Food and Agriculture
Organization of the United Nations, Division of statistics, FAOSTAT database.
Frimpong, A., Padi, F.K. and Kombiok, J. (2006). Registration of foliar disease resistant and
high-yielding groundnut varieties ICGV 92099 and ICGV 90084. International Arachis
Newsletter. No. 26.
Gowda, C.L.L., Ali, M., Erskine, W., Halila, H., Johansen, C., Kusmenoglu, I., Mahmoud, S.A.
and Malik, B.A. (2000). Trends in Support for Research and Development of Cool Season
Food Legumes in the Developing Countries. Current Plant Science and Biotechnology in
Agriculture 34:47-58.
International Crops Research Institute for the Semi-Arid Tropics (ICRISAT). (2012). Groundnut
crop. www.icrisat.org/crop-groundnut.html
Kimmins, F.M., Deom, C.M., Subrahmanyam, P., Chiyembekeza, M. and van der Merwe, P.J.A
(1999). Groundnut Rossete: A Virus Affecting Groundnut Production in Sub-Saharan
Africa. In: Plant Disease. Robertson, A.E. (Editor). The American Phytopathological
Society.
Malithano, A.D., Ramanaiah, K.V., Monjana, A.M., Chilengue, B.S. and Uaiene, R.N. (1984).
Factors Affecting Groundnut Production in Mozambique. In: D. McDonald (Editor.).
Regional Groundnut Workshop for Southern Africa, International Crops Research Institute
for the Semi-Arid Tropics, Lilongwe, Malawi. Pp. 61-67.
Mangasini , A.K., Mhina, M.L., Mbeiyererwa, A.G. and Kumburu, N.P. (2014). Socio-economic
factors limiting smallholder groundnut production in Tabora region. REPOA research report
14/1, Dar es Salaam, Tanzania.
Ministry of Agriculture, Food Security and Cooperatives (MAFSC). (2011). Basic data,
Agriculture sector, Dar es Salaam, Tanzania.

48
Mofya-Mukuka, R. and Shipekesa, A.M. (2013). Value chain analysis of the groundnuts sector
in the eastern province of Zambia. Working paper No. 78.
Naliendele Agricultural Research Institute (NARI). (2000). Report of oilseeds research program
in Tanzania.
National Bureau of Statistics Tanzania (NBS). (2015). Second quarter gross domestic
product (April - June) 2015.
Ndjeunga, J., Ntare, B., Abdoulaye, A., Ibro, A., Zarafi, M., Cisse, Y., Moutari, A., Kodio, O. et
al. (2010). Farmer preferences for groundnut traits and varieties in West Africa: Cases of
Mali, Niger and Nigeria. Working paper series No. 27. Socio Economics and Policy.
Nutsugah, S.K., Abdulai, M., Oti-Boateng, C., Brandenburg, R.L. and Jordan, D.L. (2007).
Management of Leaf Spot Diseases of Peanut with Fungicides and Local Detergents in
Ghana. Plant Pathology Journal 6:248-253.
Pandey, M.K., Monyo, E., Ozias-Akins, P., Liang, X., Guimarães, P., Nigam, S., Upadhyaya,
H.D, Janila, P. et al. (2012). Advances in Arachis Genomics for Peanut Improvement.
Biotechnology Advances 3:639–651.
Soleri, D., Smith, S.E. and Cleveland, D.A. (2000). Evaluating the Potential for Farmer and Plant
Breeder Collaboration: A Case Study of Farmer Maize Selection in Oaxaca, Mexico.
Euphytica 116:41-57.
The World Bank, Food and Agriculture Organization, and International Fund for Agricultural
Development. (2009). Gender in Agriculture: Sourcebook: World Bank Publications,
Washington D.C, USA.
Tsigbey, F.K., Brandenburg, R.L. and Clottey, V.A. (2003). Peanut production methods in
northern Ghana and some disease perspectives. World Geography of the Peanut
Knowledge Base website: Pp.1-10.
Upadhyaya, H.D., Reddy, L.J., Gowda, C.L.L. and Singh, S. (2006). Identification of Diverse
Groundnut Germplasm: Sources of Early Maturity in a Core Collection. Field Crops
Research 97:261-271.
49
Vigneri, M. and Holmes, R. (2009). When being more productive still doesn’t pay: Gender
inequality and socio-economic constraints in Ghana’s cocoa sector. Paper presented at
the FAO-IFAD-ILO workshop on gaps, trends and current research in gender dimensions
of agricultural and rural employment, Rome, Italy.
Wynne, J.C. and Gregory, W.C. (1981). Peanut Breeding. Advances in Agronomy 34:39–72.
50
Chapter 3: Evaluation of Tanzanian and introduced groundnut
germplasm for yield and its component traits, and reaction to
Cercospora leaf spot diseases
Abstract
Groundnuts cultivated in the semi-arid tropics are often exposed to both biotic and abiotic
stresses such as diseases, low rainfall and high temperatures during the critical stages of
flowering and pod development. These harsh growing conditions affect the productivity of
the crop. This study evaluated 84 groundnut genotypes from the Tanzania gene bank,
ICRISAT-Malawi, smallholder farmers and the local market for yield and Cercospora leaf
spot disease resistance in order to select promising parents for further breeding. The
experiment was conducted in two growing seasons, namely 2014/2015 and 2015/16, at
three sites viz. the Hombolo and Makutupora agricultural research stations, and the
Bihawana farmers training centre, in Dodoma, Tanzania. The groundnut genotypes were
planted in an alpha lattice design (12x7) with two replications. Inoculation to induce
Cercospora leaf spot diseases was done at 10 and 45 days after emergence. The study
revealed significant seasonal differences among groundnut genotypes for days to 50%
flowering (DFL), number of mature pods per plant (NPP) and hundred seed weight (HSW).
Genotypes differed significantly across sites for DFL and seed yield (SY). The significant
season by site interactions were observed for NPP. Further, Cercospora leaf spot disease
severity among genotypes was significantly different across sites and seasons. Furthermore,
the results from broad sense heritability and genetic advance studies showed the
preponderance of additive genes effect, and thus selection in early generations can be used
in improving groundnut SY and CLD tolerance. Therefore, the current study recommended
genotypes ICGV SM 96714, ICGV 6022, ICGV 6057, TZA 2426, Local Makulu, ICGV SM
07539, TZA 245, TZA 4280, KAKOMA, ICGV SM 07508, TZA 534, TZA 2444, TZA 2270,
TZA 121, TZA 157, TZA 2498, TZA 3786, TZA 4390, TZA 4261, TZA 667 and TZA 2518 for
use in further breeding programme due to their early days to flowering, high number of
mature pods per plant, pod yield, hundred seed weight, seed yield and low Cercospora leaf
spot disease score.
Key words: Cercospora leaf spot, broad sense heritability, genetic advance, groundnut
(Arachis hypogea L.), yield, yield components.
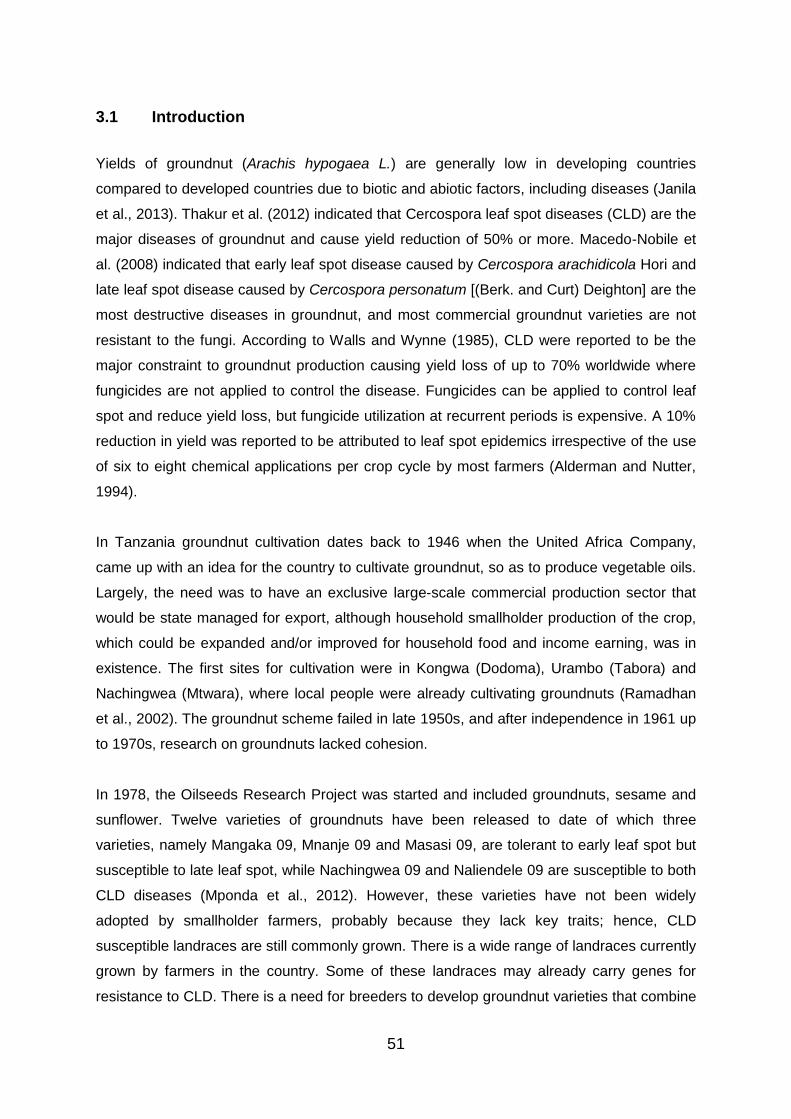
51
3.1 Introduction
Yields of groundnut (Arachis hypogaea L.) are generally low in developing countries
compared to developed countries due to biotic and abiotic factors, including diseases (Janila
et al., 2013). Thakur et al. (2012) indicated that Cercospora leaf spot diseases (CLD) are the
major diseases of groundnut and cause yield reduction of 50% or more. Macedo-Nobile et
al. (2008) indicated that early leaf spot disease caused by Cercospora arachidicola Hori and
late leaf spot disease caused by Cercospora personatum [(Berk. and Curt) Deighton] are the
most destructive diseases in groundnut, and most commercial groundnut varieties are not
resistant to the fungi. According to Walls and Wynne (1985), CLD were reported to be the
major constraint to groundnut production causing yield loss of up to 70% worldwide where
fungicides are not applied to control the disease. Fungicides can be applied to control leaf
spot and reduce yield loss, but fungicide utilization at recurrent periods is expensive. A 10%
reduction in yield was reported to be attributed to leaf spot epidemics irrespective of the use
of six to eight chemical applications per crop cycle by most farmers (Alderman and Nutter,
1994).
In Tanzania groundnut cultivation dates back to 1946 when the United Africa Company,
came up with an idea for the country to cultivate groundnut, so as to produce vegetable oils.
Largely, the need was to have an exclusive large-scale commercial production sector that
would be state managed for export, although household smallholder production of the crop,
which could be expanded and/or improved for household food and income earning, was in
existence. The first sites for cultivation were in Kongwa (Dodoma), Urambo (Tabora) and
Nachingwea (Mtwara), where local people were already cultivating groundnuts (Ramadhan
et al., 2002). The groundnut scheme failed in late 1950s, and after independence in 1961 up
to 1970s, research on groundnuts lacked cohesion.
In 1978, the Oilseeds Research Project was started and included groundnuts, sesame and
sunflower. Twelve varieties of groundnuts have been released to date of which three
varieties, namely Mangaka 09, Mnanje 09 and Masasi 09, are tolerant to early leaf spot but
susceptible to late leaf spot, while Nachingwea 09 and Naliendele 09 are susceptible to both
CLD diseases (Mponda et al., 2012). However, these varieties have not been widely
adopted by smallholder farmers, probably because they lack key traits; hence, CLD
susceptible landraces are still commonly grown. There is a wide range of landraces currently
grown by farmers in the country. Some of these landraces may already carry genes for
resistance to CLD. There is a need for breeders to develop groundnut varieties that combine

52
resistance to CLD with agronomic traits preferred by stakeholders in the groundnut value
chain, such as erect growth habit, high yield, medium to large seed size, early maturity and
high oil content, in addition to other traits. Because most groundnut smallholder farmers in
Tanzania are relatively poorly resourced, they do not use any form of fungicide to control leaf
spot diseases. Host plant resistance has been preferred to other methods in leaf spots
management due to its cost effectiveness and environmental friendliness (Jordan et al.,
2013). However, reports indicate that disease resistance in groundnut is mostly associated
with low yield, poor pod formation, poor kernel characteristics and late maturity, making
breeding for leaf spot resistance difficult (Singh et al., 1997; Subrahmanyam et al., 1995).
Groundnut genotypes, which combine tolerance to the diseases, with a high yield potential
are beneficial to growers and can be used by breeders for further improvement through
breeding (Gaikpa et al., 2015). Consequently, the identification of good sources of resistance
to CLD and high yield is of paramount importance for groundnut breeding programmes.
Therefore, this study evaluated a large germplasm collection for yield and yield related traits
under Cercospora leaf spot disease infection (both early and late combined).
3.2 Material and methods
3.2.1 Plant materials
The study included 84 groundnut genotypes comprising of local and introduced varieties.
The genotypes were collected from various sources, namely, farmers’ fields in Tanzania,
local markets, the Tanzania National Plant and Genetic Resource Centre (NPGRC), and the
International Crop Research Institute for Semi-arid Tropics (ICRISAT-Malawi) as shown in
Table 3.1. The germplasm acquired from ICRISAT was reported to be CLD resistant. The
Nachingwea groundnut variety, which is widely grown in Tanzania, was used as a
susceptible control. Local varieties were included because of their wide adaptability to
various growing environments, and because they have agronomic and other traits preferred
by farmers.

53
Table 3.1: List and sources of eighty-four groundnut genotypes used in the study.
Entry number
Accession number
Botanical group
source Entry
number Accession
number Botanical
group Source
1 BAKA Spanish ICRISAT-
Malawi 43 TZA 2270 Spanish NPGRC
2 CG 7 Virginia ICRISAT-
Malawi 44 TZA 230 Spanish NPGRC
3 CHITALA Spanish ICRISAT-
Malawi 45 TZA 241 Spanish NPGRC
4 ICG 405 Valencia ICRISAT-
Malawi 46 TZA 2417 Spanish NPGRC
5 ICG 6022 Virginia ICRISAT-
Malawi 47 TZA 2421 Valencia NPGRC
6 ICGV 07533 Spanish ICRISAT-
Malawi 48 TZA 2426 Spanish NPGRC
7 ICGV 07544 Spanish ICRISAT-
Malawi 49 TZA 2444 Spanish NPGRC
8 ICGV 6057 Virginia ICRISAT-
Malawi 50 TZA 2471 Spanish NPGRC
9 ICGV SM 01706
Virginia ICRISAT-
Malawi 51 TZA 248 Spanish NPGRC
10 ICGV SM 03557
Virginia ICRISAT-
Malawi 52 TZA 2485 Spanish NPGRC
11 ICGV SM 03560
Virginia ICRISAT-
Malawi 53 TZA 2488 Valencia NPGRC
12 ICGV SM 05521
Valencia ICRISAT-
Malawi 54 TZA 2497 Valencia NPGRC
13 ICGV SM 07504
Valencia ICRISAT-
Malawi 55 TZA 2498 Valencia NPGRC
14 ICGV SM 07508
Valencia ICRISAT-
Malawi 56 TZA 2518 Spanish NPGRC
15 ICGV SM 07510
Valencia ICRISAT-
Malawi 57 TZA 254 Spanish NPGRC
16 ICGV SM 07512
Valencia ICRISAT-
Malawi 58 TZA 2737 Spanish NPGRC
17 ICGV SM 07518
Valencia ICRISAT-
Malawi 59 TZA 285 Spanish NPGRC
18 ICGV SM 07536
Valencia ICRISAT-
Malawi 60 TZA 3222 Spanish NPGRC
19 ICGV SM 07539
Valencia ICRISAT-
Malawi 61 TZA 3406 Spanish NPGRC
20 ICGV SM 07556
Valencia ICRISAT-
Malawi 62 TZA 3783 Valencia NPGRC
21 ICGV SM 07558
Valencia ICRISAT-
Malawi 63 TZA 3786 Valencia NPGRC
22 ICGV SM 09511
Valencia ICRISAT-
Malawi 64 TZA 3806 Spanish NPGRC
23 ICGV SM 95714
Spanish ICRISAT-
Malawi 65 TZA 3817 Spanish NPGRC
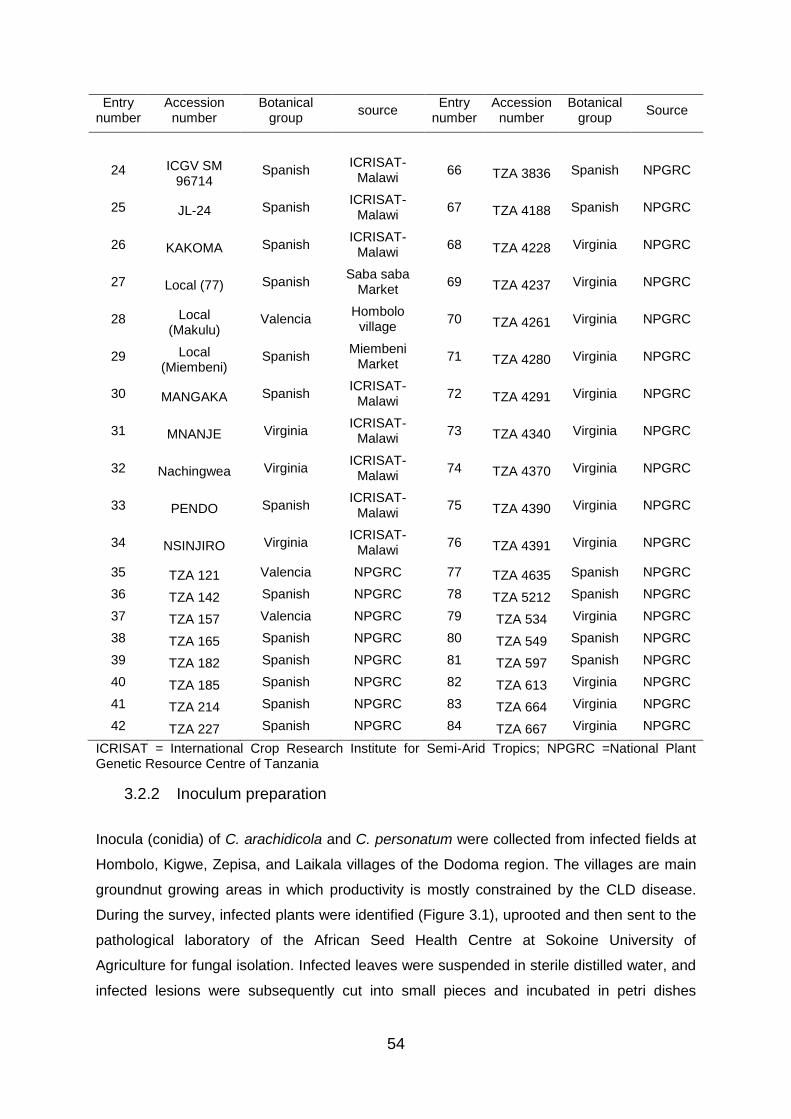
54
Entry number
Accession number
Botanical group
source Entry
number Accession
number Botanical
group Source
24 ICGV SM 96714
Spanish ICRISAT-
Malawi 66 TZA 3836 Spanish NPGRC
25 JL-24 Spanish ICRISAT-
Malawi 67 TZA 4188 Spanish NPGRC
26 KAKOMA Spanish ICRISAT-
Malawi 68 TZA 4228 Virginia NPGRC
27 Local (77) Spanish Saba saba
Market 69 TZA 4237 Virginia NPGRC
28 Local (Makulu)
Valencia Hombolo
village 70 TZA 4261 Virginia NPGRC
29 Local (Miembeni)
Spanish Miembeni
Market 71 TZA 4280 Virginia NPGRC
30 MANGAKA Spanish ICRISAT-
Malawi 72 TZA 4291 Virginia NPGRC
31 MNANJE Virginia ICRISAT-
Malawi 73 TZA 4340 Virginia NPGRC
32 Nachingwea Virginia ICRISAT-
Malawi 74 TZA 4370 Virginia NPGRC
33 PENDO Spanish ICRISAT-
Malawi 75 TZA 4390 Virginia NPGRC
34 NSINJIRO Virginia ICRISAT-
Malawi 76 TZA 4391 Virginia NPGRC
35 TZA 121 Valencia NPGRC 77 TZA 4635 Spanish NPGRC
36 TZA 142 Spanish NPGRC 78 TZA 5212 Spanish NPGRC
37 TZA 157 Valencia NPGRC 79 TZA 534 Virginia NPGRC
38 TZA 165 Spanish NPGRC 80 TZA 549 Spanish NPGRC
39 TZA 182 Spanish NPGRC 81 TZA 597 Spanish NPGRC
40 TZA 185 Spanish NPGRC 82 TZA 613 Virginia NPGRC
41 TZA 214 Spanish NPGRC 83 TZA 664 Virginia NPGRC
42 TZA 227 Spanish NPGRC 84 TZA 667 Virginia NPGRC
ICRISAT = International Crop Research Institute for Semi-Arid Tropics; NPGRC =National Plant Genetic Resource Centre of Tanzania
3.2.2 Inoculum preparation
Inocula (conidia) of C. arachidicola and C. personatum were collected from infected fields at
Hombolo, Kigwe, Zepisa, and Laikala villages of the Dodoma region. The villages are main
groundnut growing areas in which productivity is mostly constrained by the CLD disease.
During the survey, infected plants were identified (Figure 3.1), uprooted and then sent to the
pathological laboratory of the African Seed Health Centre at Sokoine University of
Agriculture for fungal isolation. Infected leaves were suspended in sterile distilled water, and
infected lesions were subsequently cut into small pieces and incubated in petri dishes

55
containing V8 juice as the growth media for Cercospora spp under aseptic condition on a
laminar flow bench. The petri dishes were then incubated in a growth chamber for seven
days, thereafter inocula (conidia) were collected from the petri dishes by washing the conidia
with sterile distilled water, after which a few drops of a wetting agent (Tween 80) were added
to the culture to improve its sticking capacity when inoculating.
3.2.3 Inoculation of Cercospora leaf spot diseases in groundnut genotypes
Before inoculation, the inoculum concentration was adjusted to approximately 50 000 conidia
per ml- 1 of solution. Inoculations (Figure 3.2) were carried out at 10 days and 45 days after
emergence to capture both early and late Cercospora leaf spot disease infestation.
Figure 3.1: Field identification of symptoms of Cercospora leaf spot diseases
Figure 3.2: Cercospora fungi inoculation in
the field trial
3.3 Study site, experimental design and trial management
Trials were established at three sites in the Dodoma region, central Tanzania, namely the
Hombolo (50 54’ S, 350 57’ E) and the Makutupora (50 58’ S, 350 46.033’ E) research
stations, and the Bihawana (60 2’ 717’’ S, 350 6’ 397’’ E) farmers training centre (Figure 3.3).
The experiments were laid out in an alpha lattice design (12 x 7) with two replications in two
consecutive growing seasons of 2014/15 and 2015/16. The groundnuts were grown in plots
of 1.5 x 1 m long with inter-row and intra-row spacing of 0.5 and 0.1 m, respectively.
Conventional tillage was done before planting, and this was followed by regular hand
weeding. During prolonged dry spells, watering was done to supplement moisture, no
fertilizer was used. Ridging, harvesting and post-harvest practices were done as
recommended.
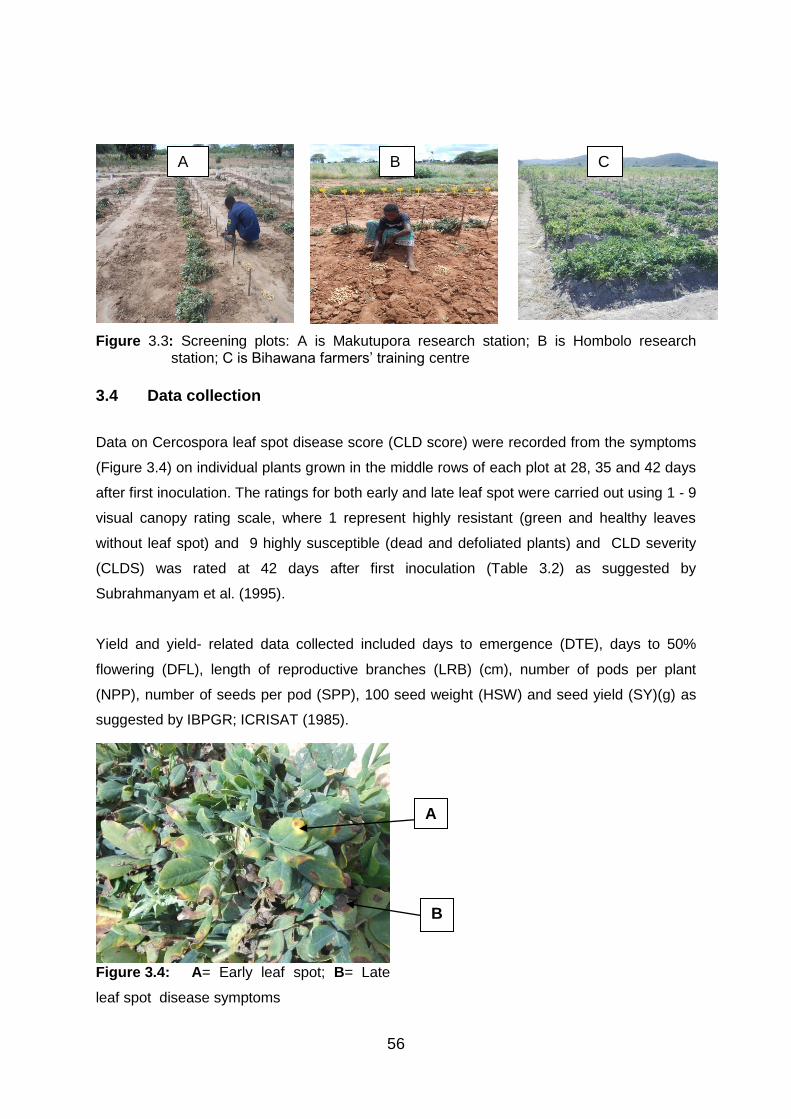
56
Figure 3.3: Screening plots: A is Makutupora research station; B is Hombolo research station; C is Bihawana farmers’ training centre
3.4 Data collection
Data on Cercospora leaf spot disease score (CLD score) were recorded from the symptoms
(Figure 3.4) on individual plants grown in the middle rows of each plot at 28, 35 and 42 days
after first inoculation. The ratings for both early and late leaf spot were carried out using 1 - 9
visual canopy rating scale, where 1 represent highly resistant (green and healthy leaves
without leaf spot) and 9 highly susceptible (dead and defoliated plants) and CLD severity
(CLDS) was rated at 42 days after first inoculation (Table 3.2) as suggested by
Subrahmanyam et al. (1995).
Yield and yield- related data collected included days to emergence (DTE), days to 50%
flowering (DFL), length of reproductive branches (LRB) (cm), number of pods per plant
(NPP), number of seeds per pod (SPP), 100 seed weight (HSW) and seed yield (SY)(g) as
suggested by IBPGR; ICRISAT (1985).
Figure 3.4: A= Early leaf spot; B= Late
leaf spot disease symptoms
C
D A
A
A B C
A
B
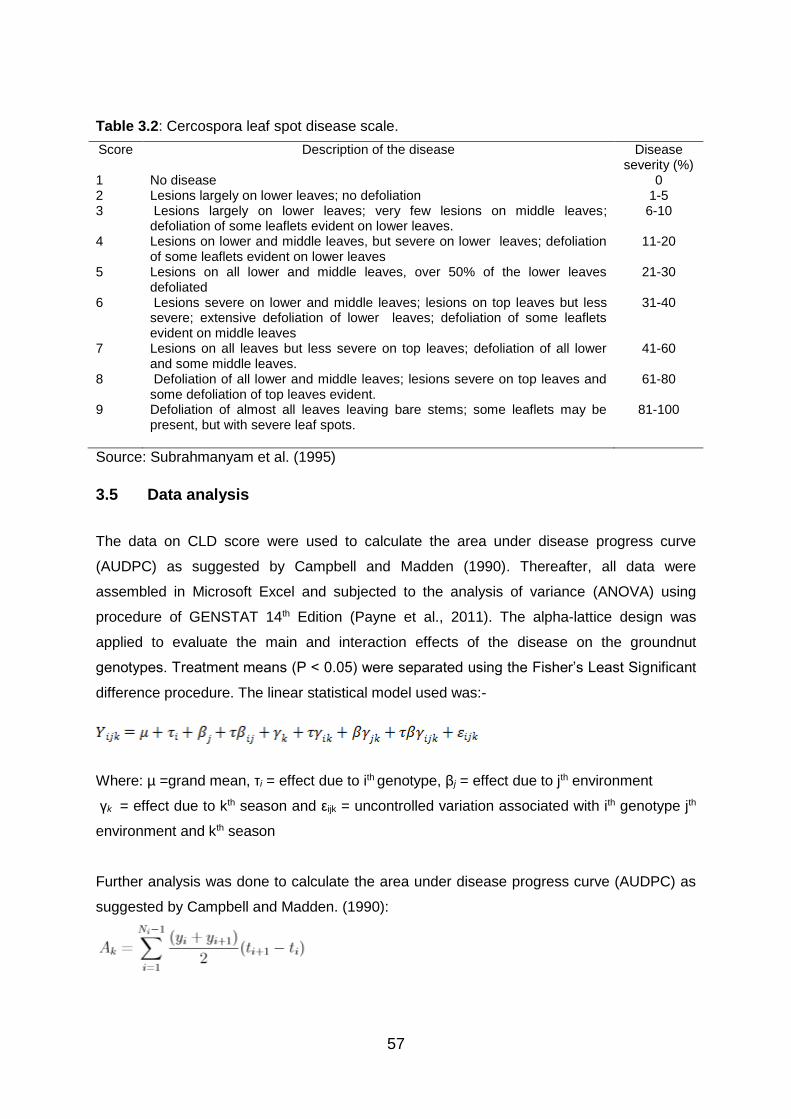
57
Table 3.2: Cercospora leaf spot disease scale.
Score Description of the disease Disease severity (%)
1 No disease 0 2 Lesions largely on lower leaves; no defoliation 1-5 3 Lesions largely on lower leaves; very few lesions on middle leaves;
defoliation of some leaflets evident on lower leaves. 6-10
4 Lesions on lower and middle leaves, but severe on lower leaves; defoliation of some leaflets evident on lower leaves
11-20
5 Lesions on all lower and middle leaves, over 50% of the lower leaves defoliated
21-30
6 Lesions severe on lower and middle leaves; lesions on top leaves but less severe; extensive defoliation of lower leaves; defoliation of some leaflets evident on middle leaves
31-40
7 Lesions on all leaves but less severe on top leaves; defoliation of all lower and some middle leaves.
41-60
8 Defoliation of all lower and middle leaves; lesions severe on top leaves and some defoliation of top leaves evident.
61-80
9 Defoliation of almost all leaves leaving bare stems; some leaflets may be present, but with severe leaf spots.
81-100
Source: Subrahmanyam et al. (1995)
3.5 Data analysis
The data on CLD score were used to calculate the area under disease progress curve
(AUDPC) as suggested by Campbell and Madden (1990). Thereafter, all data were
assembled in Microsoft Excel and subjected to the analysis of variance (ANOVA) using
procedure of GENSTAT 14th Edition (Payne et al., 2011). The alpha-lattice design was
applied to evaluate the main and interaction effects of the disease on the groundnut
genotypes. Treatment means (P < 0.05) were separated using the Fisher’s Least Significant
difference procedure. The linear statistical model used was:-
Where: µ =grand mean, τi = effect due to ith genotype, βj = effect due to jth environment
γk = effect due to kth season and εijk = uncontrolled variation associated with ith genotype jth
environment and kth season
Further analysis was done to calculate the area under disease progress curve (AUDPC) as
suggested by Campbell and Madden. (1990):
A
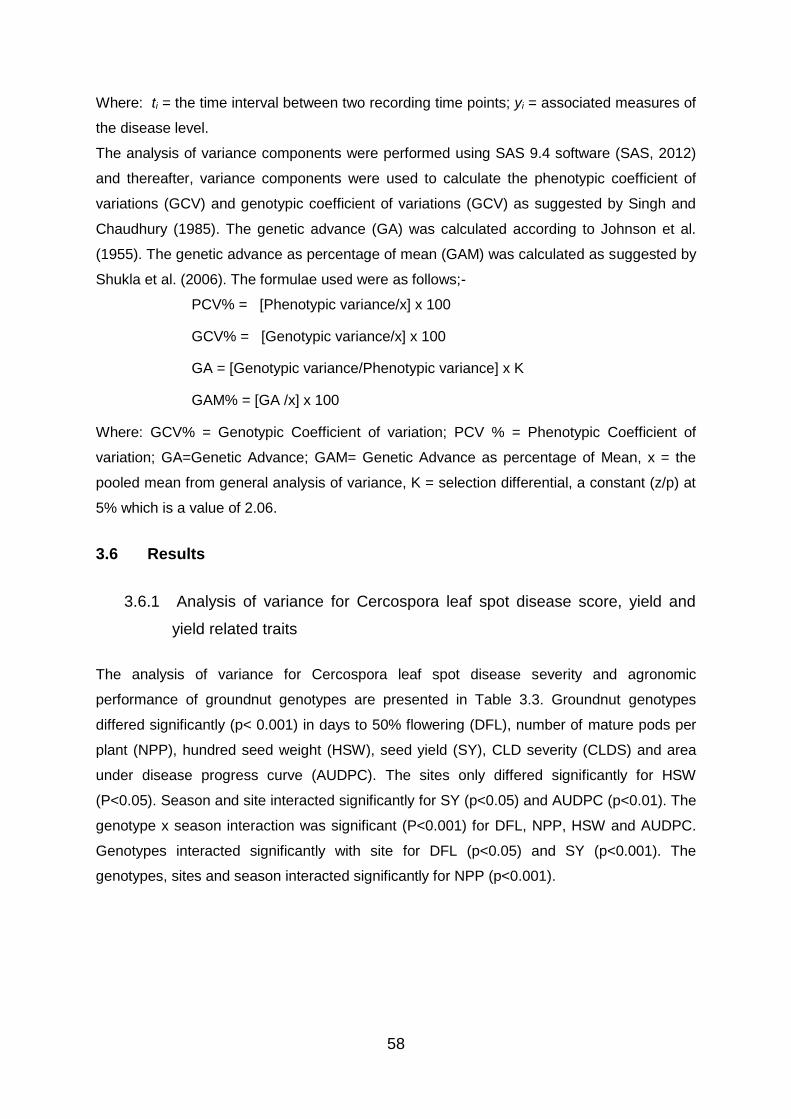
58
Where: ti = the time interval between two recording time points; yi = associated measures of
the disease level.
The analysis of variance components were performed using SAS 9.4 software (SAS, 2012)
and thereafter, variance components were used to calculate the phenotypic coefficient of
variations (GCV) and genotypic coefficient of variations (GCV) as suggested by Singh and
Chaudhury (1985). The genetic advance (GA) was calculated according to Johnson et al.
(1955). The genetic advance as percentage of mean (GAM) was calculated as suggested by
Shukla et al. (2006). The formulae used were as follows;-
PCV% = [Phenotypic variance/x] x 100
GCV% = [Genotypic variance/x] x 100
GA = [Genotypic variance/Phenotypic variance] x K
GAM% = [GA /x] x 100
Where: GCV% = Genotypic Coefficient of variation; PCV % = Phenotypic Coefficient of
variation; GA=Genetic Advance; GAM= Genetic Advance as percentage of Mean, x = the
pooled mean from general analysis of variance, K = selection differential, a constant (z/p) at
5% which is a value of 2.06.
3.6 Results
3.6.1 Analysis of variance for Cercospora leaf spot disease score, yield and
yield related traits
The analysis of variance for Cercospora leaf spot disease severity and agronomic
performance of groundnut genotypes are presented in Table 3.3. Groundnut genotypes
differed significantly (p< 0.001) in days to 50% flowering (DFL), number of mature pods per
plant (NPP), hundred seed weight (HSW), seed yield (SY), CLD severity (CLDS) and area
under disease progress curve (AUDPC). The sites only differed significantly for HSW
(P<0.05). Season and site interacted significantly for SY (p<0.05) and AUDPC (p<0.01). The
genotype x season interaction was significant (P<0.001) for DFL, NPP, HSW and AUDPC.
Genotypes interacted significantly with site for DFL (p<0.05) and SY (p<0.001). The
genotypes, sites and season interacted significantly for NPP (p<0.001).
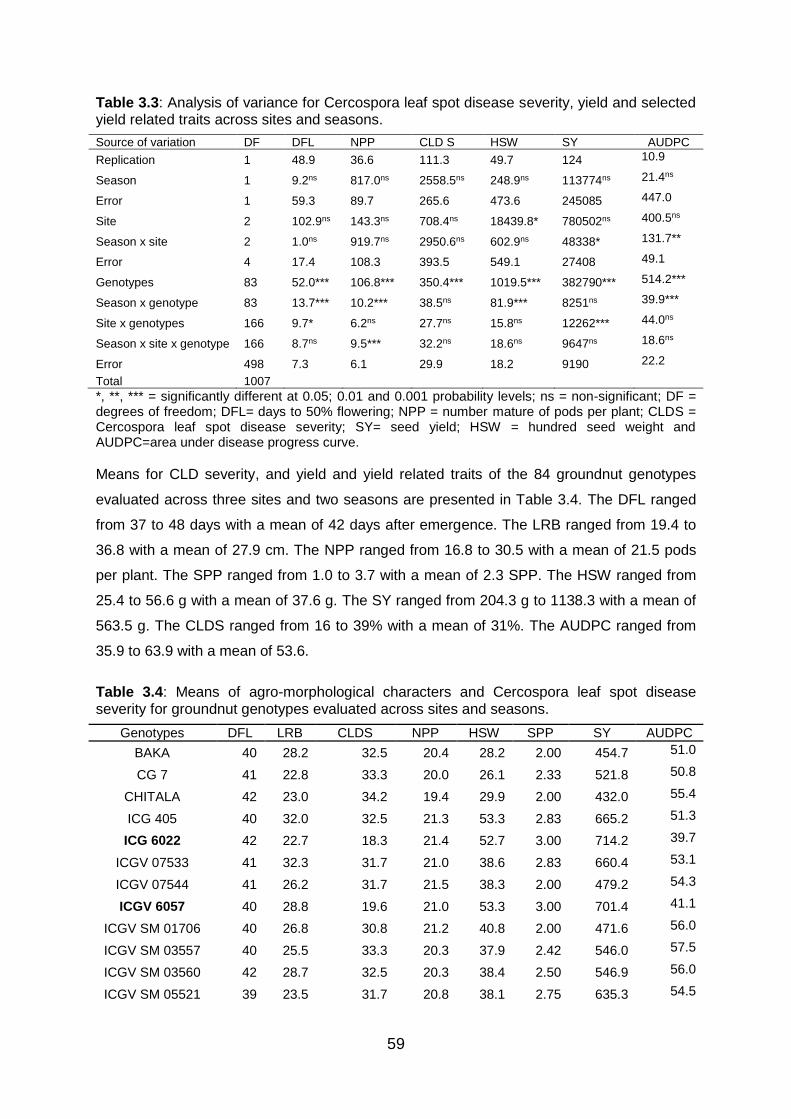
59
Table 3.3: Analysis of variance for Cercospora leaf spot disease severity, yield and selected yield related traits across sites and seasons.
Source of variation DF DFL NPP CLD S HSW SY AUDPC
Replication 1 48.9 36.6 111.3 49.7 124 10.9
Season 1 9.2ns 817.0ns 2558.5ns 248.9ns 113774ns 21.4ns
Error 1 59.3 89.7 265.6 473.6 245085 447.0
Site 2 102.9ns 143.3ns 708.4ns 18439.8* 780502ns 400.5ns
Season x site 2 1.0ns 919.7ns 2950.6ns 602.9ns 48338* 131.7**
Error 4 17.4 108.3 393.5 549.1 27408 49.1
Genotypes 83 52.0*** 106.8*** 350.4*** 1019.5*** 382790*** 514.2***
Season x genotype 83 13.7*** 10.2*** 38.5ns 81.9*** 8251ns 39.9***
Site x genotypes 166 9.7* 6.2ns 27.7ns 15.8ns 12262*** 44.0ns
Season x site x genotype 166 8.7ns 9.5*** 32.2ns 18.6ns 9647ns 18.6ns
Error 498 7.3 6.1 29.9 18.2 9190 22.2
Total 1007
*, **, *** = significantly different at 0.05; 0.01 and 0.001 probability levels; ns = non-significant; DF = degrees of freedom; DFL= days to 50% flowering; NPP = number mature of pods per plant; CLDS = Cercospora leaf spot disease severity; SY= seed yield; HSW = hundred seed weight and AUDPC=area under disease progress curve.
Means for CLD severity, and yield and yield related traits of the 84 groundnut genotypes
evaluated across three sites and two seasons are presented in Table 3.4. The DFL ranged
from 37 to 48 days with a mean of 42 days after emergence. The LRB ranged from 19.4 to
36.8 with a mean of 27.9 cm. The NPP ranged from 16.8 to 30.5 with a mean of 21.5 pods
per plant. The SPP ranged from 1.0 to 3.7 with a mean of 2.3 SPP. The HSW ranged from
25.4 to 56.6 g with a mean of 37.6 g. The SY ranged from 204.3 g to 1138.3 with a mean of
563.5 g. The CLDS ranged from 16 to 39% with a mean of 31%. The AUDPC ranged from
35.9 to 63.9 with a mean of 53.6.
Table 3.4: Means of agro-morphological characters and Cercospora leaf spot disease severity for groundnut genotypes evaluated across sites and seasons.
Genotypes DFL LRB CLDS NPP HSW SPP SY AUDPC
BAKA 40 28.2 32.5 20.4 28.2 2.00 454.7 51.0
CG 7 41 22.8 33.3 20.0 26.1 2.33 521.8 50.8
CHITALA 42 23.0 34.2 19.4 29.9 2.00 432.0 55.4
ICG 405 40 32.0 32.5 21.3 53.3 2.83 665.2 51.3
ICG 6022 42 22.7 18.3 21.4 52.7 3.00 714.2 39.7
ICGV 07533 41 32.3 31.7 21.0 38.6 2.83 660.4 53.1
ICGV 07544 41 26.2 31.7 21.5 38.3 2.00 479.2 54.3
ICGV 6057 40 28.8 19.6 21.0 53.3 3.00 701.4 41.1
ICGV SM 01706 40 26.8 30.8 21.2 40.8 2.00 471.6 56.0
ICGV SM 03557 40 25.5 33.3 20.3 37.9 2.42 546.0 57.5
ICGV SM 03560 42 28.7 32.5 20.3 38.4 2.50 546.9 56.0
ICGV SM 05521 39 23.5 31.7 20.8 38.1 2.75 635.3 54.5
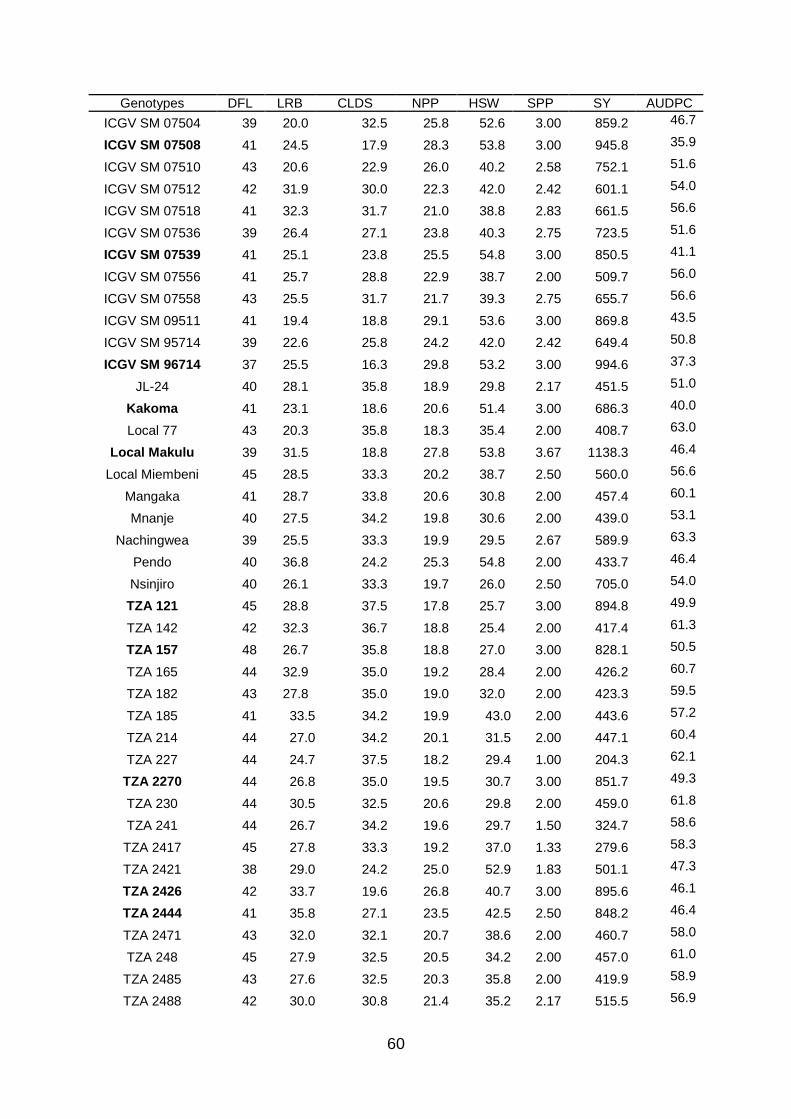
60
Genotypes DFL LRB CLDS NPP HSW SPP SY AUDPC
ICGV SM 07504 39 20.0 32.5 25.8 52.6 3.00 859.2 46.7
ICGV SM 07508 41 24.5 17.9 28.3 53.8 3.00 945.8 35.9
ICGV SM 07510 43 20.6 22.9 26.0 40.2 2.58 752.1 51.6
ICGV SM 07512 42 31.9 30.0 22.3 42.0 2.42 601.1 54.0
ICGV SM 07518 41 32.3 31.7 21.0 38.8 2.83 661.5 56.6
ICGV SM 07536 39 26.4 27.1 23.8 40.3 2.75 723.5 51.6
ICGV SM 07539 41 25.1 23.8 25.5 54.8 3.00 850.5 41.1
ICGV SM 07556 41 25.7 28.8 22.9 38.7 2.00 509.7 56.0
ICGV SM 07558 43 25.5 31.7 21.7 39.3 2.75 655.7 56.6
ICGV SM 09511 41 19.4 18.8 29.1 53.6 3.00 869.8 43.5
ICGV SM 95714 39 22.6 25.8 24.2 42.0 2.42 649.4 50.8
ICGV SM 96714 37 25.5 16.3 29.8 53.2 3.00 994.6 37.3
JL-24 40 28.1 35.8 18.9 29.8 2.17 451.5 51.0
Kakoma 41 23.1 18.6 20.6 51.4 3.00 686.3 40.0
Local 77 43 20.3 35.8 18.3 35.4 2.00 408.7 63.0
Local Makulu 39 31.5 18.8 27.8 53.8 3.67 1138.3 46.4
Local Miembeni 45 28.5 33.3 20.2 38.7 2.50 560.0 56.6
Mangaka 41 28.7 33.8 20.6 30.8 2.00 457.4 60.1
Mnanje 40 27.5 34.2 19.8 30.6 2.00 439.0 53.1
Nachingwea 39 25.5 33.3 19.9 29.5 2.67 589.9 63.3
Pendo 40 36.8 24.2 25.3 54.8 2.00 433.7 46.4
Nsinjiro 40 26.1 33.3 19.7 26.0 2.50 705.0 54.0
TZA 121 45 28.8 37.5 17.8 25.7 3.00 894.8 49.9
TZA 142 42 32.3 36.7 18.8 25.4 2.00 417.4 61.3
TZA 157 48 26.7 35.8 18.8 27.0 3.00 828.1 50.5
TZA 165 44 32.9 35.0 19.2 28.4 2.00 426.2 60.7
TZA 182 43 27.8 35.0 19.0 32.0 2.00 423.3 59.5
TZA 185 41 33.5 34.2 19.9 43.0 2.00 443.6 57.2
TZA 214 44 27.0 34.2 20.1 31.5 2.00 447.1 60.4
TZA 227 44 24.7 37.5 18.2 29.4 1.00 204.3 62.1
TZA 2270 44 26.8 35.0 19.5 30.7 3.00 851.7 49.3
TZA 230 44 30.5 32.5 20.6 29.8 2.00 459.0 61.8
TZA 241 44 26.7 34.2 19.6 29.7 1.50 324.7 58.6
TZA 2417 45 27.8 33.3 19.2 37.0 1.33 279.6 58.3
TZA 2421 38 29.0 24.2 25.0 52.9 1.83 501.1 47.3
TZA 2426 42 33.7 19.6 26.8 40.7 3.00 895.6 46.1
TZA 2444 41 35.8 27.1 23.5 42.5 2.50 848.2 46.4
TZA 2471 43 32.0 32.1 20.7 38.6 2.00 460.7 58.0
TZA 248 45 27.9 32.5 20.5 34.2 2.00 457.0 61.0
TZA 2485 43 27.6 32.5 20.3 35.8 2.00 419.9 58.9
TZA 2488 42 30.0 30.8 21.4 35.2 2.17 515.5 56.9

61
Genotypes DFL LRB CLDS NPP HSW SPP SY AUDPC
TZA 2497 43 32.9 30.8 21.1 34.4 2.00 469.6 61.5
TZA 2498 41 29.8 35.8 19.6 35.2 2.83 820.0 58.3
TZA 2518 37 25.8 22.3 28.9 56.6 3.00 964.6 44.3
TZA 254 41 31.5 23.6 27.7 52.7 3.00 923.2 44.6
TZA 2737 43 25.3 29.2 21.8 31.8 1.67 404.5 55.7
TZA 285 43 26.4 31.7 20.8 30.9 2.00 461.7 55.7
TZA 3222 43 30.6 35.0 19.1 27.8 2.00 425.7 59.8
TZA 3406 43 27.5 35.8 18.9 27.5 2.00 421.6 60.1
TZA 3783 42 28.0 35.0 19.3 29.0 2.17 460.5 58.0
TZA 3786 43 28.3 33.3 19.9 30.1 2.67 795.4 51.0
TZA 3806 45 32.3 34.2 19.8 28.9 2.00 441.6 59.8
TZA 3817 44 32.6 34.2 19.9 28.9 1.50 341.4 57.8
TZA 3836 43 29.5 31.7 20.3 30.2 2.00 452.5 47.8
TZA 4188 43 30.8 32.5 20.8 36.2 2.00 463.4 58.3
TZA 4228 44 25.1 32.5 19.7 35.0 2.00 437.5 58.0
TZA 4237 46 27.5 33.3 20.4 36.7 2.00 455.1 60.7
TZA 4261 40 27.1 23.8 24.4 53.0 2.50 879.1 46.7
TZA 4280 38 33.1 22.3 30.5 55.2 2.50 943.3 45.5
TZA 4291 42 29.9 27.9 23.2 38.6 2.00 515.7 55.1
TZA 4340 42 26.0 29.6 22.0 37.6 2.00 489.8 56.9
TZA 4370 43 31.5 29.2 21.6 37.4 2.00 447.0 60.1
TZA 4390 43 30.7 28.8 22.6 37.9 3.00 753.5 47.0
TZA 4391 45 26.9 30.0 21.7 38.5 2.00 483.4 53.4
TZA 4635 45 21.2 30.0 21.8 35.2 2.00 492.9 56.3
TZA 5212 44 27.4 37.5 18.8 27.0 2.00 417.8 60.1
TZA 534 40 30.8 26.7 22.9 51.6 2.00 534.5 47.8
TZA 549 42 27.2 33.3 19.7 29.0 2.00 437.8 54.5
TZA 597 43 20.7 37.5 18.7 30.1 2.00 416.1 53.1
TZA 613 44 27.0 39.2 16.8 27.9 2.00 374.4 63.9
TZA 664 45 34.2 37.5 18.5 28.8 2.00 412.6 60.7
TZA 667 45 30.6 35.8 18.8 27.8 3.00 726.5 51.3
LSD 2.2 2.4 4.4 2.0 3.4 0.2 76.9 5.6
CV % 4.4 10.7 17.8 11.5 11.4 12.7 17.0 8.8
Grand mean 42.0 27.9 30.8 21.5 37.6 2.3 563.5 53.6
Minimum 37.0 19.4 16.3 16.8 25.4 1.0 204.3 35.9
Maximum 48.0 36.8 39.2 30.5 56.6 3.7 1138.3 63.9
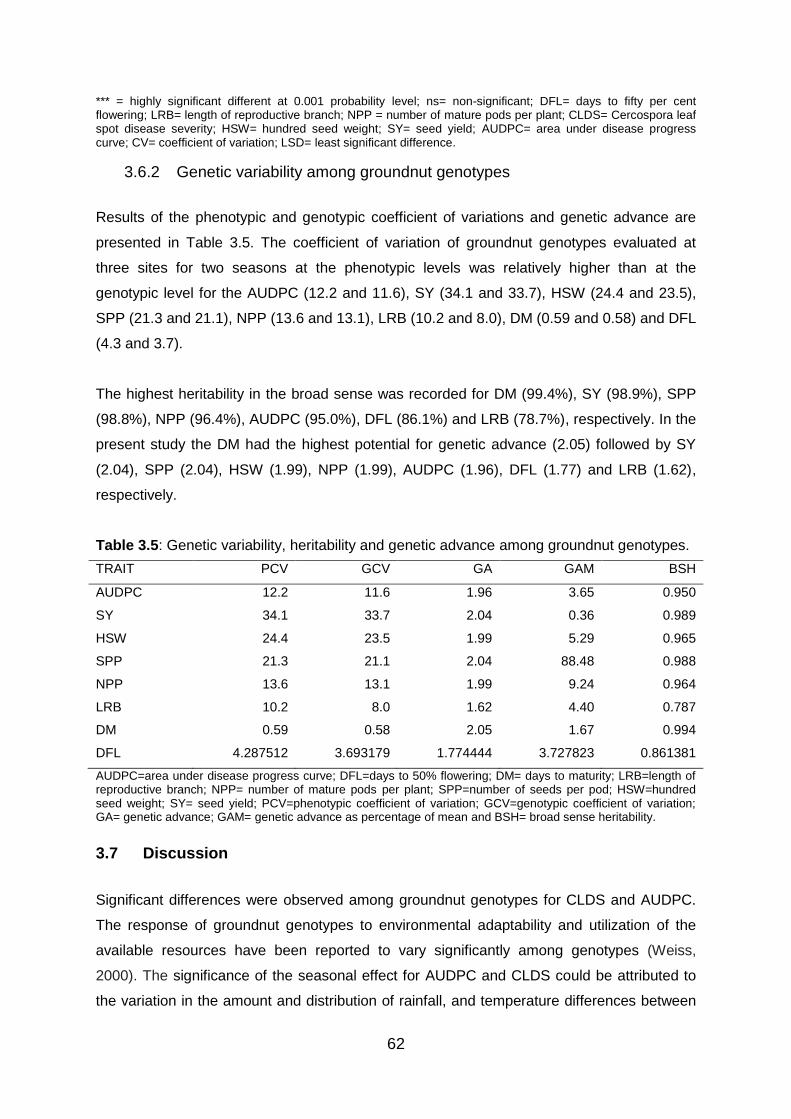
62
*** = highly significant different at 0.001 probability level; ns= non-significant; DFL= days to fifty per cent flowering; LRB= length of reproductive branch; NPP = number of mature pods per plant; CLDS= Cercospora leaf spot disease severity; HSW= hundred seed weight; SY= seed yield; AUDPC= area under disease progress curve; CV= coefficient of variation; LSD= least significant difference.
3.6.2 Genetic variability among groundnut genotypes
Results of the phenotypic and genotypic coefficient of variations and genetic advance are
presented in Table 3.5. The coefficient of variation of groundnut genotypes evaluated at
three sites for two seasons at the phenotypic levels was relatively higher than at the
genotypic level for the AUDPC (12.2 and 11.6), SY (34.1 and 33.7), HSW (24.4 and 23.5),
SPP (21.3 and 21.1), NPP (13.6 and 13.1), LRB (10.2 and 8.0), DM (0.59 and 0.58) and DFL
(4.3 and 3.7).
The highest heritability in the broad sense was recorded for DM (99.4%), SY (98.9%), SPP
(98.8%), NPP (96.4%), AUDPC (95.0%), DFL (86.1%) and LRB (78.7%), respectively. In the
present study the DM had the highest potential for genetic advance (2.05) followed by SY
(2.04), SPP (2.04), HSW (1.99), NPP (1.99), AUDPC (1.96), DFL (1.77) and LRB (1.62),
respectively.
Table 3.5: Genetic variability, heritability and genetic advance among groundnut genotypes.
TRAIT PCV GCV GA GAM BSH
AUDPC 12.2 11.6 1.96 3.65 0.950
SY 34.1 33.7 2.04 0.36 0.989
HSW 24.4 23.5 1.99 5.29 0.965
SPP 21.3 21.1 2.04 88.48 0.988
NPP 13.6 13.1 1.99 9.24 0.964
LRB 10.2 8.0 1.62 4.40 0.787
DM 0.59 0.58 2.05 1.67 0.994
DFL 4.287512 3.693179 1.774444 3.727823 0.861381
AUDPC=area under disease progress curve; DFL=days to 50% flowering; DM= days to maturity; LRB=length of reproductive branch; NPP= number of mature pods per plant; SPP=number of seeds per pod; HSW=hundred seed weight; SY= seed yield; PCV=phenotypic coefficient of variation; GCV=genotypic coefficient of variation; GA= genetic advance; GAM= genetic advance as percentage of mean and BSH= broad sense heritability.
3.7 Discussion
Significant differences were observed among groundnut genotypes for CLDS and AUDPC.
The response of groundnut genotypes to environmental adaptability and utilization of the
available resources have been reported to vary significantly among genotypes (Weiss,
2000). The significance of the seasonal effect for AUDPC and CLDS could be attributed to
the variation in the amount and distribution of rainfall, and temperature differences between
63
the seasons. The variation in AUDPC and CLDS among the genotypes could be attributed to
the virulence of the pathogen, environmental conditions and the variation in the ability of the
genotype to resist the infection. The significant interaction of groundnut genotypes with
season for DFL, NPP and HSW and between genotypes with site for DFL and SY could be
attributed to the combination effect of the differences in soil types, rainfall and temperatures
across the sites.
Variation in DFL, NPP, DFL, HSW and SY among groundnut genotypes across sites has
been reported in earlier studies (Janamatti et al., 1986; Prasad et al., 2000; Weiss, 2000;
Chandrika et al., 2008; Patel et al., 2010; Bapuji et al., 2011; Narh et al., 2014; Zhao et al.,
2015). Their results reported a synergistic effect of the amount and distribution of rainfall,
and variations of temperature and soil types on groundnut yield and yield related
components. They further reported variations in influence of these factors among groundnut
genotypes. These variations suggest the possibility of selecting groundnut genotypes based
on their performance across the environment or in a specific environment.
The selection criteria was based on the farmers’ preference of groundnut variety which
indicated brown coloured seed coat, erect growth habit, tolerance to diseases and drought,
high yielding ability and early maturity as their major preferred traits (Chapter 2). From the
study, the following genotypes; local Makulu, TZA 2518, TZA 4280, TZA 254, TZA 2426,
TZA 121, TZA 4261, TZA 2270, TZA 2444, TZA 534, TZA 157, TZA 2498, TZA 3786, TZA
4390 and TZA 667 were selected for further breeding due to their early DFL, larger number
of SPP and higher SY. Genotypes ICGV SM 07508, ICGV SM 96714, ICGV SM 09511,
ICGV 6022, ICGV 6057, Kakoma and ICGV SM 07539 were selected for their tolerance to
CLD and CLDS and used as the male parents (Chapter 5).
Comparison of seed yield and CLD resistance levels among Valencia, Virginia and Spanish
showed significant variation. This indicated a variation in the genetic constitution for CLD
resistance and SY performance. Comparison of the best ten CLD tolerant and high yielding
genotypes found out that several Valencia (Local Makulu, ICGV SM 07508, TZA 121, ICGV
SM 09511) and Spanish (ICGV SM 96714, TZA 2518, TZA 254 and TZA 2426) varieties
combine a good tolerance to CLD and a high SY. Virginia varieties ICG 6022 and TZA 4261
had good CLD resistance and a high SY (Table 3.4).

64
The phenotypic coefficient of variation was relatively higher than the genotypic coefficient of
variation for AUDPC, SY, HSW, SPP, NPP, LRB, DM and DFL. This was probably attributed
to the dominant influence of the environmental condition on the expression of these traits.
The influence of environments on expression of similar traits was also reported on chickpea
(Joshi, 1972; Chandra, 1968) and in bambara groundnut (Makanda et al., 2009).
The high broad sense heritability and genetic advance for DM, SY, SPP, NPP, AUDPC,
DFL, HSW and LRB indicated the predominance high genetic control. This indicated the
possibility of improving these traits through selection in early generations. The traits may be
used as the selection criteria for yield and CLD resistance improvement. The need of
associating heritability and genetic advance in selection has been suggested by Katiyar et al.
(1974) and Johnson et al. (1955).
3.8 Conclusion
The present study found significant variation in CLD tolerance, yield and yield related
components among groundnut genotypes evaluated across the environments. Groundnut
genotypes; ICGV SM 96714, ICGV 6057, TZA 2426, TZA 2444, TZA 121, TZA 157, TZA
2270, TZA 667, Local Makulu, ICG 6022, ICGV SM 07539, TZA 254, TZA 4280, TZA 4390,
TZA 4261, Kakoma, ICGV SM 07508, TZA 534, TZA 2498, TZA 3786 and TZA 2518 were
selected for their good performances on DFL, low CLDS, larger NPP, heavy HSW, small
AUDPC and high SY. These are recommended as parents in future breeding programme.
The outcome from broad sense heritability and genetic advance studies showed the
preponderance of additive genes effect, and thus selection in early generations can be used
in improving groundnut SY and CLD tolerance. Furthermore, evaluation of these genotypes
in other agro-ecologies infected with CLD is required in developing lines with durable
resistance to CLD and high yield.

65
References
Alam, M.S., Rahman, A.R.M.S. and Khair, A.B.M.A. (1985). Genetic Variability and
Character Association in Groundnut (Arachis hypogaea L.). Bangladesh Journal of
Agriculture 10:9-16.
Alderman, S.C. and Nutter, F.J. (1994). Effect of Temperature and Relative Humidity on
Development of Cercosporidium personatum on Peanut in Georgia. Plant Disease
78:690-694.
Bapuji Rao, B., Ramana Rao, B.V., Subba Rao, A.V.M., Manikandan, N., Narasimha Rao,
S.B.S., Rao, V.U.M. and Venkateswarlu, B. (2011). Assessment of the impact of
increasing temperature and rainfall variability on crop productivity in drylands-An
illustrative approach. Research Bulletin 1/2011, Central Research Institute for Dryland
Agriculture, Santoshnagar, Hyderabad, Andhra Pradesh, India. Pp. 1-32.
Campbell, C.L. and L.V. Madden. (1990). Introduction to plant disease epidemiology. John
Wiley and Sons, New York, USA.
Chandra, S. (1968). Variability in Gram. Indian Journal of Genetics and Plant Breeding
28:205-210.
Chandrika, V., Parameswari, P. and Sreenivas, G. (2008). Effect of Sowing Time and
Rainfall Distribution on Yield of Rainfed Groundnut (Arachis hypogaea L.) in Southern
Agroclimatic Zone of Andhra Pradesh. Legume Research 3:54-56.
Gaikpa, D.S., Akromah,R., Asibuo, J.Y., Appiah-Kubi, Z. and Nyadanu, D. (2015). Evaluation
of Yield and Yield Components of Groundnut Genotypes Under Cercospora Leaf Spots
Disease Pressure. International Journal of Agronomy and Agricultural Research
7:66-75.
IBPGR, ICRISAT. (1985). Descriptors for groundnut (Revised). International Board for Plant
Genetic Resources, Rome, Italy and International Crop Research Institute for the Semi-
Arid Tropics, Patancheru, India. Pp. 25.
Jain, P.K. and Ramgir, S.R. (2000). Genetic Variability of Some Quantitative Characters of
Soybean. Annals of Agricultural Research 15:45-49.
66
Janamatti, V.S., Sashidahar, V.R., Prasad, I.G. and Sastry, K.S.K. (1986). Effects of Cycles
of Moisture Stress on Flowering Pattern, Flower Production, Gynotyphore Length and
Their Relationship to Pod Yield in Bunch Types of Groundnut. Narendra Development
Journal of Agricultural Research 1:136-142.
Janila, P., Ramaiah, V., Rathore, A., Upakula, A., Reddy, R.K., Waliyar, F. and Nigam, S.N.
(2013). Genetic Analysis of Resistance to Late Leaf Spot in Inter Specific Groundnuts.
Euphytica 193:13-25.
Johnson, H.W., Robinson, H.F. and Comstoks, R.E. (1955). Estimates of Genetics and
Environmental Variability in Soybean. Agronomic Journal 45:374-82.
Jones, D. (1998). The Epidemiology of plant diseases. Kluwer Academic Publishers. Boston.
USA
Jordan, D.L., Brandenburg, R.L., Brown, A.B., Bullen, S.G., Roberson, G.T. and Shew, B.
(2013). Peanut information. North Carolina cooperative extension service. College of
agriculture and life sciences, North Carolina State University, USA.
Joshi, S.N. (1972). Variability and Association of Some Yield Components in Gram (Cicer
arietinum L.). Indian Journal of Agricultural Science 42:397-399.
Katiyar, R.P., Mishra Singh, S.N. and Chauhan, Y.S. (1974). Genetic Variability, Heritability
and Genetic Advance of Yield and Its Components in Indian mustard. Indian Journal of
Agricultural Science 44:291-93.
Macedo-Nobile, P.M., Lopes, C.R., Cavallari, C.B., Quecinia, V., Coutinhod, L.L., Hoshino,
A.A. and Gimenesc, M.A. (2008). Peanut Genes Identified During Initial Phase of
Cercosporidium personatum Infection. Plant Science 174:78-87.
Mponda, O., Kafiriti, E., Mfaume, J., Daudi, H. and Mashamba, P. (2012).TL-I Groundnut
breeding status report for Tanzania. Presented at annual meeting - Tropical Legumes I
phase 2 generation challenge programme. 7th-11th May 2012, Addis Ababa, Ethiopia.
Narh, S., Boote, K.J., Naab, J.B., Abudulai, M., Bertin, Z.M., Sankara, P., Burow,
M.D., Tillman, B.L., Brandenburg, R.L. and Jordan, D.L. (2014). Yield Improvement and
Genotype × Environment Analyses of Peanut Cultivars in Multi-location Trials in West
Africa. Crop Science Society of America 54:2413-2422.
67
Patel, G.G., Patel, H.R., Pandey, V., Shekh, A.M., Patel, J.S., Vadodaria, R.P., Bhatt, B.K.
and Shroff, J.C. (2010). Influence of Weather Parameters on Pod Yield of Groundnut in
Middle Gujarat Agro-Climatic Region. Journal of Agrometeorology 12:77-80.
Payne, R.W., Murray, D.A. and Harding, S.A. (2011). An introduction to the GenStat
command language (14th Edition). VSN International, Hemel Hempstead, UK.
Prasad, P.V.V., Craufurd, P.Q., Summerfield, R.J. and Wheeler, T.R. (2000). Effects of Short
Episodes of Heat Stress on Flower Production and Fruit-Set of Groundnut ( Arachis
hypogaea L.). Journal of Experimental Botany 51:777–84.
Ramadhan, T., Otsyina, R. and Franzel, S. (2002). Improving Household Incomes and
Reducing Deforestation Using Rotational Woodlots in Tabora District, Tanzania.
Agriculture Ecosystem Environment 89:229-239.
Singh, A., Mehan, V.K. and Nigam, S.N. (1997). Source of resistance to groundnut fungal
and bacterial diseases: An update and appraisal. API information bulletin 50.
Patancheru, Andhra Pradesh: International Crops Research Institute for the Semi-Arid
Tropics. Pp. 48.
Subrahmanyam, P., McDonald, D., Waliyar, F., Reddy, L.J., Nigam, S.N., Gibbons, R.W.,
Ramanatha Rao, V., Singh, A.K., Pande, S., Reddy, P.M. and Subba Rao, P.V. (1995).
Screening methods and sources of resistance to rust and late leaf spot of groundnut.
Information Bulletin no. 47. ICRISAT, Patancheru 502 324, Andhra Pradesh, India. Pp.
1-20.
Thakur, S.B., Ghimire, S.K., Chaudhary, N.K., Shrestha, S.M. and Mishra, B. (2012).
Resistance in Groundnut Genotypes to Cercospora Leaf Spot Disease and Its Relation
with Yield. Nepal Agricultural Research Journal 12:63-70.
Van der Plank, J.E. (1975). Principles of plant infection. New York: Academic Press, USA.
Walls, S.B. and Wynne, J.C. (1985). Combining Ability for Resistance to Cercosporidium
personatum for Five Late Leaf Spot-Resistant Peanut Germplasm Lines. Oléagineux
40:389-394.
Weiss, E.A. (2000). Oilseed crops. Blackwell Science. London, UK.
68
Zhao, C.X., Jia, L.H., Wang, Y.F., Wang, M.L. and McGiffen, M.E. (2015). Effects of Different
Soil Texture on Peanut Growth and Development. Communications in Soil Science and
Plant Analysis 46:2249-2257.

69
Chapter 4: Correlation, path-coefficient and cluster analyses of
yield and yield-related traits and resistance to Cercospora leaf spot
diseases in groundnut
Abstract
Groundnut (Arachis hypogaea L.) is one of the most important oilseed crops in Tanzania for
food security and income generation. Despite its importance, the productivity of the crop is
low. Information on the nature and magnitude of trait association between yield contributing
characters and overall yield is a pre-requisite for crop improvement programmes. Hence, the
present study was conducted to investigate correlation, path-coefficient and cluster analyses
of yield, its related traits and the resistance to Cercospora leaf spot diseases. Eighty-four
groundnut genotypes were planted in three locations for two seasons in Dodoma, Tanzania,
to evaluate yield potential and reaction to Cercospora leaf spot diseases (CLD). Data on
yield, yield contributing traits and CLD severity (CLDS) were collected and subjected to IBM
SPSS to compute correlation coefficients, while MS Excel was used to calculate the direct
and indirect effects of yield contributing characters via yield (path analysis). A cluster
analysis to group genotypes according to their genetic similarities was performed by IBM
SPSS following the Ward Linkage and Squared Euclidean Distance methods. The results
showed a positive and significant association between days to 50% flowering (DFL) and
days to maturity (DM). Furthermore, there was a positive association between days to
maturity (DM) and CLDS and between CLDS with DFL. The number of mature pods per
plant (NPP) was positively associated with seed yield (SY). The SY was positively correlated
with DFL, DM, CLDS, length of reproductive branch (LRB), NPP and number of seeds per
pod (SPP). The cluster analysis provided five different clusters, suggesting a high
phenotypic diversity among groundnut genotypes, showing its usefulness in future
hybridization and selection programmes for various agronomic traits and CLD resistance.
Several genotypes from Cluster I (five genotypes), II (eight genotypes), III (seven genotypes)
and IV (one genotype), with the lowest DFL, highest NPP and SY and lowest CLDS were
selected for use in future breeding programmes.
Key words: Cercospora leaf spot disease, cluster analysis, correlation coefficient,
groundnut, path coefficient.
70
4.1 Introduction
Yield is complex, quantitative character with low heritability and greatly influenced by
environmental conditions. Various yield related components contribute to yield. As a result,
indirect selection for yield using the yield related secondary traits could assist the breeder in
improving productivity of the crop. Knowledge of the degree of association existing between
yield and the yield components is very important during selection of genotypes for further
breeding (Gomes and Lopes, 2005). In groundnuts, the pods are formed underground and
unless association between external plant characteristics and yield are established, it may
not be possible to effect proper selection of plants prior to harvest (Gomes et al., 2007).
The correlations can be better understood using a path analysis, which allows the
partitioning of the correlations into direct and indirect effects, and is therefore a valuable tool
in breeding programs of various crops (Vieira et al., 2007). Several studies have
demonstrated the utility of a correlation analysis in groundnut selection (Santos et al., 2000).
Furthermore, genetic diversity is the pre-requisite for a hybridization programme to obtain
desirable genotypes. An understanding of the genetic diversity is essential to meet the
diverse goals in plant breeding such as increased yield (Joshi and Dhawan, 1966), wider
adoption, desirable quality and pest resistance (Nevo et al., 1982). According to Tomooka
(1991), the evaluation of diversity is important in order to identify the sources of genes for
particular traits within the available germplasm. Therefore, it is essential to know the genetic
diversity of the existing genotypes before undertaking any crop improvement programme by
grouping them according to genetic similarities. A cluster analysis is an appropriate method
to be used in this study. The present study undertook correlation, path-coefficient and cluster
analyses of yield, yield-related traits and resistance to Cercospora leaf spot diseases in
groundnut.
4.2 Material and methods
4.2.1 Study site, experimental design and trial establishment
Trials were established at three sites namely the Hombolo (50 54’ S, 350 57’ E) and
Makutupora (50 58’ S, 350 46.033’ E) research stations, and the Bihawana (40 12’ S, 350 24’
E) farmers training centre situated in Dodoma, central Tanzania. The experiment was laid
out in an alpha lattice design (12 x 7) with two replications in two consecutive seasons of
2014/15 and 2015/16. The groundnuts were grown in the field plots of 1.5 x 1 m size with
inter-row and intra-row spacing of 0.5 and 0.1 m respectively. Each plot had three rows each
with 10 plants. Conventional tillage was done before planting; this was followed by regular
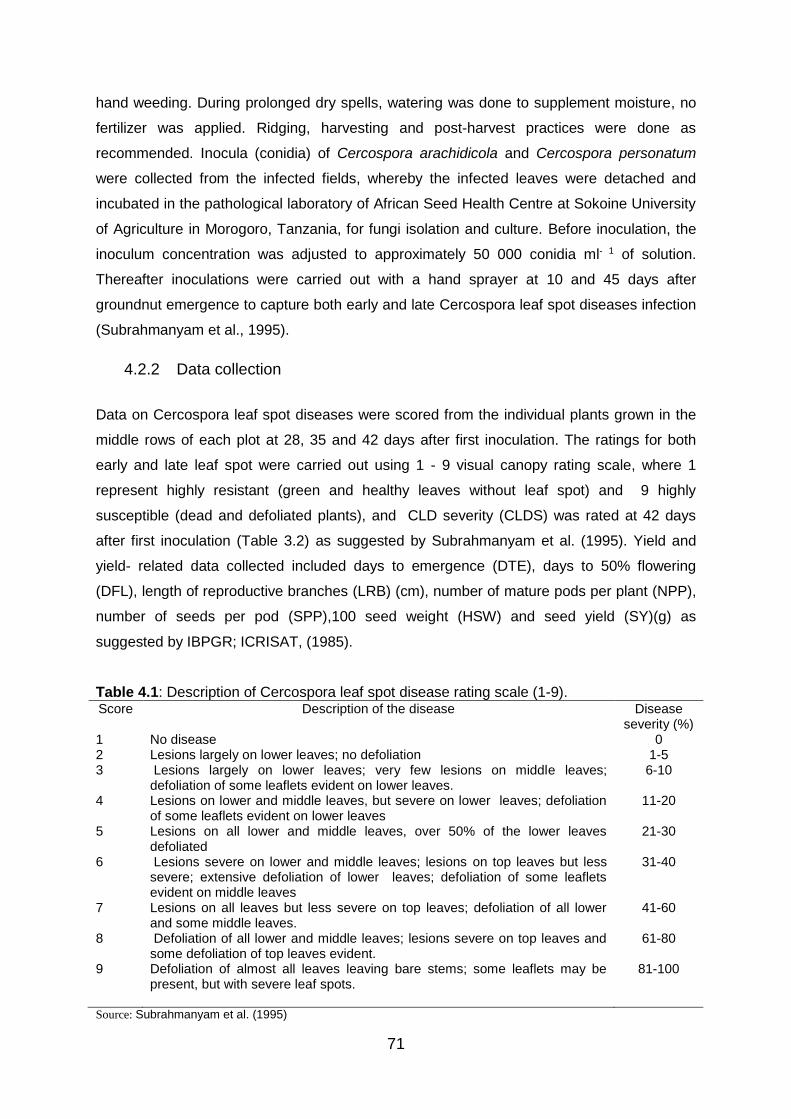
71
hand weeding. During prolonged dry spells, watering was done to supplement moisture, no
fertilizer was applied. Ridging, harvesting and post-harvest practices were done as
recommended. Inocula (conidia) of Cercospora arachidicola and Cercospora personatum
were collected from the infected fields, whereby the infected leaves were detached and
incubated in the pathological laboratory of African Seed Health Centre at Sokoine University
of Agriculture in Morogoro, Tanzania, for fungi isolation and culture. Before inoculation, the
inoculum concentration was adjusted to approximately 50 000 conidia ml- 1 of solution.
Thereafter inoculations were carried out with a hand sprayer at 10 and 45 days after
groundnut emergence to capture both early and late Cercospora leaf spot diseases infection
(Subrahmanyam et al., 1995).
4.2.2 Data collection
Data on Cercospora leaf spot diseases were scored from the individual plants grown in the
middle rows of each plot at 28, 35 and 42 days after first inoculation. The ratings for both
early and late leaf spot were carried out using 1 - 9 visual canopy rating scale, where 1
represent highly resistant (green and healthy leaves without leaf spot) and 9 highly
susceptible (dead and defoliated plants), and CLD severity (CLDS) was rated at 42 days
after first inoculation (Table 3.2) as suggested by Subrahmanyam et al. (1995). Yield and
yield- related data collected included days to emergence (DTE), days to 50% flowering
(DFL), length of reproductive branches (LRB) (cm), number of mature pods per plant (NPP),
number of seeds per pod (SPP),100 seed weight (HSW) and seed yield (SY)(g) as
suggested by IBPGR; ICRISAT, (1985).
Table 4.1: Description of Cercospora leaf spot disease rating scale (1-9). Score Description of the disease Disease
severity (%) 1 No disease 0 2 Lesions largely on lower leaves; no defoliation 1-5 3 Lesions largely on lower leaves; very few lesions on middle leaves;
defoliation of some leaflets evident on lower leaves. 6-10
4 Lesions on lower and middle leaves, but severe on lower leaves; defoliation of some leaflets evident on lower leaves
11-20
5 Lesions on all lower and middle leaves, over 50% of the lower leaves defoliated
21-30
6 Lesions severe on lower and middle leaves; lesions on top leaves but less severe; extensive defoliation of lower leaves; defoliation of some leaflets evident on middle leaves
31-40
7 Lesions on all leaves but less severe on top leaves; defoliation of all lower and some middle leaves.
41-60
8 Defoliation of all lower and middle leaves; lesions severe on top leaves and some defoliation of top leaves evident.
61-80
9 Defoliation of almost all leaves leaving bare stems; some leaflets may be present, but with severe leaf spots.
81-100
Source: Subrahmanyam et al. (1995)
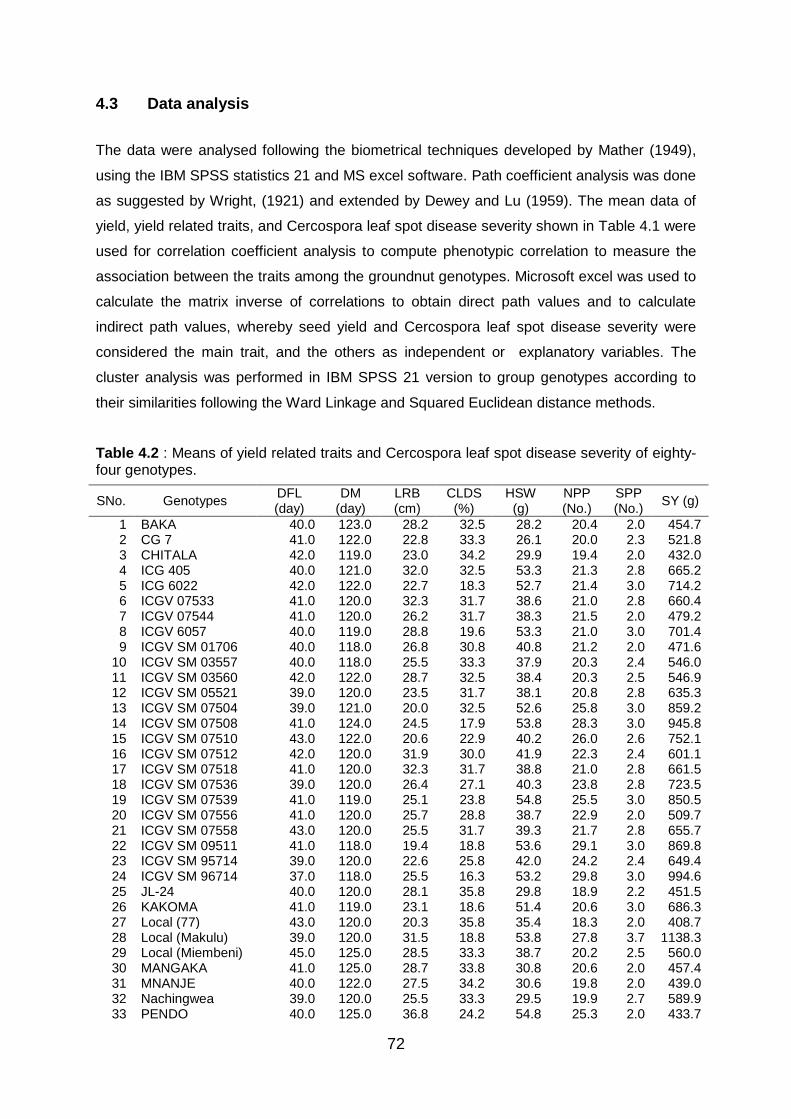
72
4.3 Data analysis
The data were analysed following the biometrical techniques developed by Mather (1949),
using the IBM SPSS statistics 21 and MS excel software. Path coefficient analysis was done
as suggested by Wright, (1921) and extended by Dewey and Lu (1959). The mean data of
yield, yield related traits, and Cercospora leaf spot disease severity shown in Table 4.1 were
used for correlation coefficient analysis to compute phenotypic correlation to measure the
association between the traits among the groundnut genotypes. Microsoft excel was used to
calculate the matrix inverse of correlations to obtain direct path values and to calculate
indirect path values, whereby seed yield and Cercospora leaf spot disease severity were
considered the main trait, and the others as independent or explanatory variables. The
cluster analysis was performed in IBM SPSS 21 version to group genotypes according to
their similarities following the Ward Linkage and Squared Euclidean distance methods.
Table 4.2 : Means of yield related traits and Cercospora leaf spot disease severity of eighty-four genotypes.
SNo. Genotypes DFL (day)
DM (day)
LRB (cm)
CLDS (%)
HSW (g)
NPP (No.)
SPP (No.)
SY (g)
1 BAKA 40.0 123.0 28.2 32.5 28.2 20.4 2.0 454.7 2 CG 7 41.0 122.0 22.8 33.3 26.1 20.0 2.3 521.8 3 CHITALA 42.0 119.0 23.0 34.2 29.9 19.4 2.0 432.0 4 ICG 405 40.0 121.0 32.0 32.5 53.3 21.3 2.8 665.2 5 ICG 6022 42.0 122.0 22.7 18.3 52.7 21.4 3.0 714.2 6 ICGV 07533 41.0 120.0 32.3 31.7 38.6 21.0 2.8 660.4 7 ICGV 07544 41.0 120.0 26.2 31.7 38.3 21.5 2.0 479.2 8 ICGV 6057 40.0 119.0 28.8 19.6 53.3 21.0 3.0 701.4 9 ICGV SM 01706 40.0 118.0 26.8 30.8 40.8 21.2 2.0 471.6
10 ICGV SM 03557 40.0 118.0 25.5 33.3 37.9 20.3 2.4 546.0 11 ICGV SM 03560 42.0 122.0 28.7 32.5 38.4 20.3 2.5 546.9 12 ICGV SM 05521 39.0 120.0 23.5 31.7 38.1 20.8 2.8 635.3 13 ICGV SM 07504 39.0 121.0 20.0 32.5 52.6 25.8 3.0 859.2 14 ICGV SM 07508 41.0 124.0 24.5 17.9 53.8 28.3 3.0 945.8 15 ICGV SM 07510 43.0 122.0 20.6 22.9 40.2 26.0 2.6 752.1 16 ICGV SM 07512 42.0 120.0 31.9 30.0 41.9 22.3 2.4 601.1 17 ICGV SM 07518 41.0 120.0 32.3 31.7 38.8 21.0 2.8 661.5 18 ICGV SM 07536 39.0 120.0 26.4 27.1 40.3 23.8 2.8 723.5 19 ICGV SM 07539 41.0 119.0 25.1 23.8 54.8 25.5 3.0 850.5 20 ICGV SM 07556 41.0 120.0 25.7 28.8 38.7 22.9 2.0 509.7 21 ICGV SM 07558 43.0 120.0 25.5 31.7 39.3 21.7 2.8 655.7 22 ICGV SM 09511 41.0 118.0 19.4 18.8 53.6 29.1 3.0 869.8 23 ICGV SM 95714 39.0 120.0 22.6 25.8 42.0 24.2 2.4 649.4 24 ICGV SM 96714 37.0 118.0 25.5 16.3 53.2 29.8 3.0 994.6 25 JL-24 40.0 120.0 28.1 35.8 29.8 18.9 2.2 451.5 26 KAKOMA 41.0 119.0 23.1 18.6 51.4 20.6 3.0 686.3 27 Local (77) 43.0 120.0 20.3 35.8 35.4 18.3 2.0 408.7 28 Local (Makulu) 39.0 120.0 31.5 18.8 53.8 27.8 3.7 1138.3 29 Local (Miembeni) 45.0 125.0 28.5 33.3 38.7 20.2 2.5 560.0 30 MANGAKA 41.0 125.0 28.7 33.8 30.8 20.6 2.0 457.4 31 MNANJE 40.0 122.0 27.5 34.2 30.6 19.8 2.0 439.0 32 Nachingwea 39.0 120.0 25.5 33.3 29.5 19.9 2.7 589.9 33 PENDO 40.0 125.0 36.8 24.2 54.8 25.3 2.0 433.7

73
SNo. Genotypes DFL (day)
DM (day)
LRB (cm)
CLDS (%)
HSW (g)
NPP (No.)
SPP (No.)
SY (g)
34 NSINJIRO 40.0 125.0 26.1 33.3 26.0 19.7 2.5 705.0 35 TZA 121 45.0 120.0 28.8 37.5 25.7 17.8 3.0 894.8 36 TZA 142 42.0 120.0 32.3 36.7 25.4 18.8 2.0 417.4 37 TZA 157 48.0 125.0 26.7 35.8 27.0 18.8 3.0 828.1 38 TZA 165 44.0 125.0 32.9 35.0 28.4 19.2 2.0 426.2 39 TZA 182 43.0 125.0 27.8 35.0 32.0 19.0 2.0 423.3 40 TZA 185 41.0 125.0 33.5 34.2 43.0 19.9 2.0 443.6 41 TZA 214 44.0 125.0 27.0 34.2 31.5 20.1 2.0 447.1 42 TZA 227 44.0 125.0 24.7 37.5 29.4 18.2 1.0 204.3 43 TZA 2270 44.0 125.0 26.8 35.0 30.7 19.5 3.0 851.7 44 TZA 230 44.0 120.0 30.5 32.5 29.8 20.6 2.0 459.0 45 TZA 241 44.0 125.0 26.7 34.2 29.7 19.6 1.5 324.7 46 TZA 2417 45.0 125.0 27.8 33.3 37.0 19.2 1.3 279.6 47 TZA 2421 38.0 118.0 29.0 24.2 52.9 25.0 1.8 501.1 48 TZA 2426 42.0 120.0 33.7 19.6 40.7 26.8 3.0 895.6 49 TZA 2444 41.0 122.0 35.8 27.1 42.5 23.5 2.5 848.2 50 TZA 2471 43.0 125.0 32.0 32.1 38.6 20.7 2.0 460.7 51 TZA 248 45.0 125.0 27.9 32.5 34.2 20.5 2.0 457.0 52 TZA 2485 43.0 125.0 27.6 32.5 35.8 20.3 2.0 419.9 53 TZA 2488 42.0 125.0 30.0 30.8 35.2 21.4 2.2 515.5 54 TZA 2497 43.0 125.0 32.9 30.8 34.4 21.1 2.0 469.6 55 TZA 2498 41.0 125.0 29.8 35.8 35.2 19.6 2.8 820.0 56 TZA 2518 37.0 118.0 25.8 22.3 56.6 28.9 3.0 964.6 57 TZA 254 41.0 120.0 31.5 23.6 52.7 27.7 3.0 923.2 58 TZA 2737 43.0 125.0 25.3 29.2 31.8 21.8 1.7 404.5 59 TZA 285 43.0 125.0 26.4 31.7 30.9 20.8 2.0 461.7 60 TZA 3222 43.0 125.0 30.6 35.0 27.8 19.1 2.0 425.7 61 TZA 3406 43.0 125.0 27.5 35.8 27.5 18.9 2.0 421.6 62 TZA 3783 42.0 125.0 28.0 35.0 29.0 19.3 2.2 460.5 63 TZA 3786 43.0 125.0 28.3 33.3 30.1 19.9 2.7 795.4 64 TZA 3806 45.0 125.0 32.3 34.2 28.9 19.8 2.0 441.6 65 TZA 3817 44.0 125.0 32.6 34.2 28.9 28.9 1.5 341.4 66 TZA 3836 43.0 125.0 29.5 31.7 30.2 30.2 2.0 452.5 67 TZA 4188 43.0 125.0 30.8 32.5 36.2 36.2 2.0 463.4 68 TZA 4228 44.0 125.0 25.1 32.5 35.0 35.0 2.0 437.5 69 TZA 4237 46.0 125.0 27.5 33.3 36.7 36.7 2.0 455.1 70 TZA 4261 40.0 122.0 27.1 23.8 53.0 53.0 2.5 879.1 71 TZA 4280 38.0 119.0 33.1 22.3 55.2 55.2 2.5 943.3 72 TZA 4291 42.0 124.0 29.9 27.9 38.6 38.6 2.0 515.7 73 TZA 4340 42.0 125.0 26.0 29.6 37.6 37.6 2.0 489.8 74 TZA 4370 43.0 125.0 31.5 29.2 37.4 37.4 2.0 447.0 75 TZA 4390 43.0 125.0 30.7 28.8 37.9 37.9 3.0 753.5 76 TZA 4391 45.0 125.0 26.9 30.0 38.5 38.5 2.0 483.4 77 TZA 4635 45.0 125.0 21.2 30.0 35.2 35.2 2.0 492.9 78 TZA 5212 44.0 125.0 27.4 37.5 27.0 27.0 2.0 417.8 79 TZA 534 40.0 118.0 30.8 26.7 51.6 51.6 2.0 534.5 80 TZA 549 42.0 125.0 27.2 33.3 29.0 29.0 2.0 437.8 81 TZA 597 43.0 125.0 20.7 37.5 30.1 30.1 2.0 416.1 82 TZA 613 44.0 125.0 27.0 39.2 27.9 27.9 2.0 374.4 83 TZA 664 45.0 125.0 34.2 37.5 28.8 28.8 2.0 412.6 84 TZA 667 45.0 125.0 30.6 35.8 27.8 27.8 3.0 726.5
DFL= days to 50% flowering, DM= days to maturity, LRB= length of reproductive branch, NPP = number of
mature pods per plant, HSW= hundred seed weight, SPP= number of seeds per pod, CLDS = Cercospora leaf
spot disease severity and SY= seed yield.
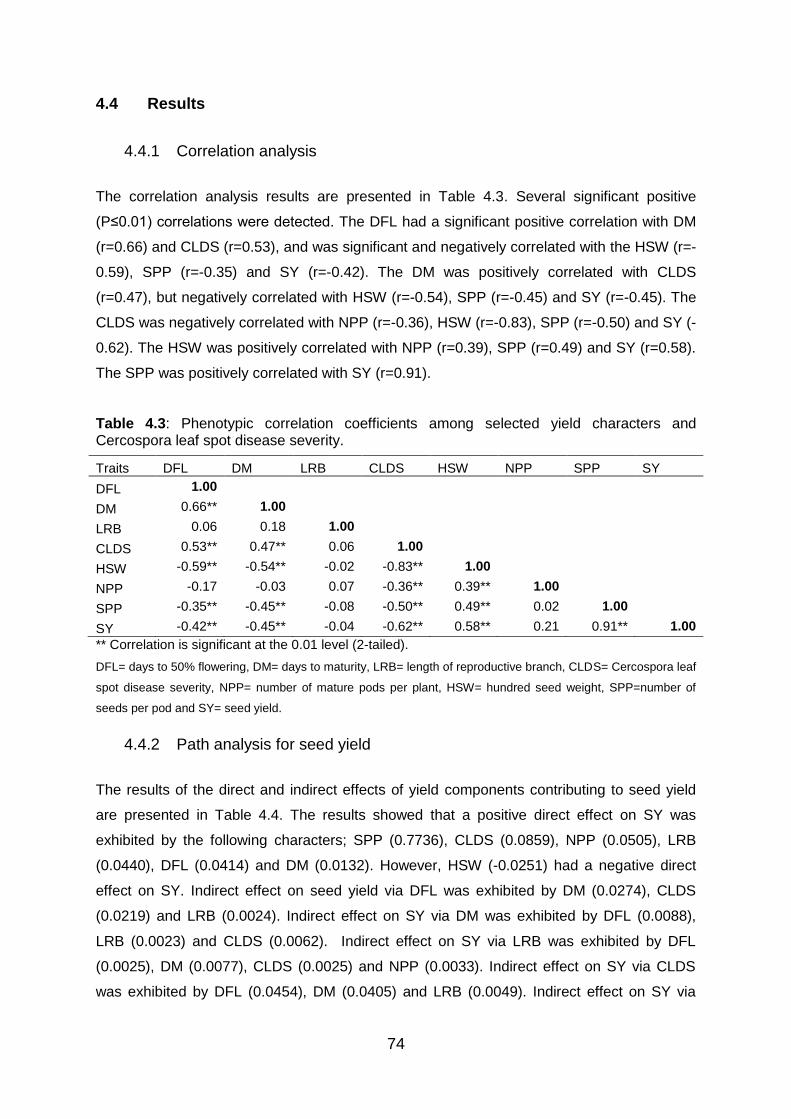
74
4.4 Results
4.4.1 Correlation analysis
The correlation analysis results are presented in Table 4.3. Several significant positive
(P≤0.01) correlations were detected. The DFL had a significant positive correlation with DM
(r=0.66) and CLDS (r=0.53), and was significant and negatively correlated with the HSW (r=-
0.59), SPP (r=-0.35) and SY (r=-0.42). The DM was positively correlated with CLDS
(r=0.47), but negatively correlated with HSW (r=-0.54), SPP (r=-0.45) and SY (r=-0.45). The
CLDS was negatively correlated with NPP (r=-0.36), HSW (r=-0.83), SPP (r=-0.50) and SY (-
0.62). The HSW was positively correlated with NPP (r=0.39), SPP (r=0.49) and SY (r=0.58).
The SPP was positively correlated with SY (r=0.91).
Table 4.3: Phenotypic correlation coefficients among selected yield characters and Cercospora leaf spot disease severity.
Traits DFL DM LRB CLDS HSW NPP SPP SY
DFL 1.00
DM 0.66** 1.00
LRB 0.06 0.18 1.00
CLDS 0.53** 0.47** 0.06 1.00
HSW -0.59** -0.54** -0.02 -0.83** 1.00
NPP -0.17 -0.03 0.07 -0.36** 0.39** 1.00
SPP -0.35** -0.45** -0.08 -0.50** 0.49** 0.02 1.00
SY -0.42** -0.45** -0.04 -0.62** 0.58** 0.21 0.91** 1.00
** Correlation is significant at the 0.01 level (2-tailed).
DFL= days to 50% flowering, DM= days to maturity, LRB= length of reproductive branch, CLDS= Cercospora leaf
spot disease severity, NPP= number of mature pods per plant, HSW= hundred seed weight, SPP=number of
seeds per pod and SY= seed yield.
4.4.2 Path analysis for seed yield
The results of the direct and indirect effects of yield components contributing to seed yield
are presented in Table 4.4. The results showed that a positive direct effect on SY was
exhibited by the following characters; SPP (0.7736), CLDS (0.0859), NPP (0.0505), LRB
(0.0440), DFL (0.0414) and DM (0.0132). However, HSW (-0.0251) had a negative direct
effect on SY. Indirect effect on seed yield via DFL was exhibited by DM (0.0274), CLDS
(0.0219) and LRB (0.0024). Indirect effect on SY via DM was exhibited by DFL (0.0088),
LRB (0.0023) and CLDS (0.0062). Indirect effect on SY via LRB was exhibited by DFL
(0.0025), DM (0.0077), CLDS (0.0025) and NPP (0.0033). Indirect effect on SY via CLDS
was exhibited by DFL (0.0454), DM (0.0405) and LRB (0.0049). Indirect effect on SY via
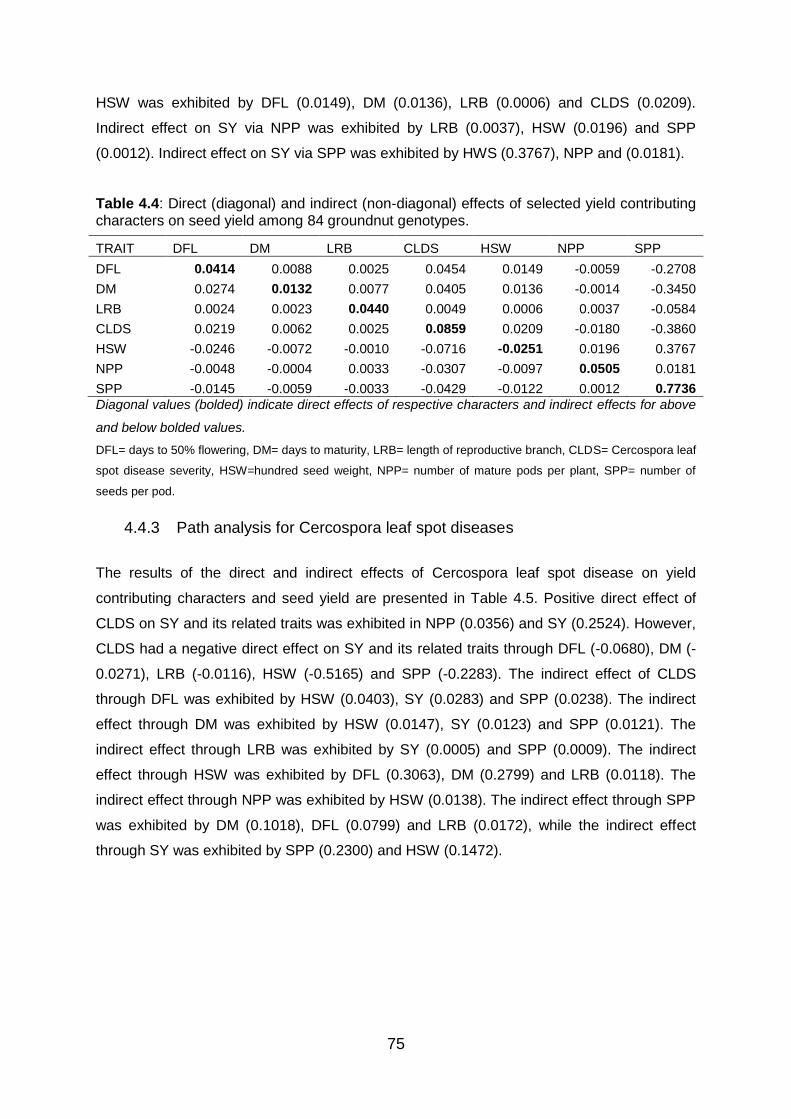
75
HSW was exhibited by DFL (0.0149), DM (0.0136), LRB (0.0006) and CLDS (0.0209).
Indirect effect on SY via NPP was exhibited by LRB (0.0037), HSW (0.0196) and SPP
(0.0012). Indirect effect on SY via SPP was exhibited by HWS (0.3767), NPP and (0.0181).
Table 4.4: Direct (diagonal) and indirect (non-diagonal) effects of selected yield contributing characters on seed yield among 84 groundnut genotypes.
TRAIT DFL DM LRB CLDS HSW NPP SPP
DFL 0.0414 0.0088 0.0025 0.0454 0.0149 -0.0059 -0.2708
DM 0.0274 0.0132 0.0077 0.0405 0.0136 -0.0014 -0.3450
LRB 0.0024 0.0023 0.0440 0.0049 0.0006 0.0037 -0.0584
CLDS 0.0219 0.0062 0.0025 0.0859 0.0209 -0.0180 -0.3860
HSW -0.0246 -0.0072 -0.0010 -0.0716 -0.0251 0.0196 0.3767
NPP -0.0048 -0.0004 0.0033 -0.0307 -0.0097 0.0505 0.0181
SPP -0.0145 -0.0059 -0.0033 -0.0429 -0.0122 0.0012 0.7736
Diagonal values (bolded) indicate direct effects of respective characters and indirect effects for above
and below bolded values.
DFL= days to 50% flowering, DM= days to maturity, LRB= length of reproductive branch, CLDS= Cercospora leaf
spot disease severity, HSW=hundred seed weight, NPP= number of mature pods per plant, SPP= number of
seeds per pod.
4.4.3 Path analysis for Cercospora leaf spot diseases
The results of the direct and indirect effects of Cercospora leaf spot disease on yield
contributing characters and seed yield are presented in Table 4.5. Positive direct effect of
CLDS on SY and its related traits was exhibited in NPP (0.0356) and SY (0.2524). However,
CLDS had a negative direct effect on SY and its related traits through DFL (-0.0680), DM (-
0.0271), LRB (-0.0116), HSW (-0.5165) and SPP (-0.2283). The indirect effect of CLDS
through DFL was exhibited by HSW (0.0403), SY (0.0283) and SPP (0.0238). The indirect
effect through DM was exhibited by HSW (0.0147), SY (0.0123) and SPP (0.0121). The
indirect effect through LRB was exhibited by SY (0.0005) and SPP (0.0009). The indirect
effect through HSW was exhibited by DFL (0.3063), DM (0.2799) and LRB (0.0118). The
indirect effect through NPP was exhibited by HSW (0.0138). The indirect effect through SPP
was exhibited by DM (0.1018), DFL (0.0799) and LRB (0.0172), while the indirect effect
through SY was exhibited by SPP (0.2300) and HSW (0.1472).
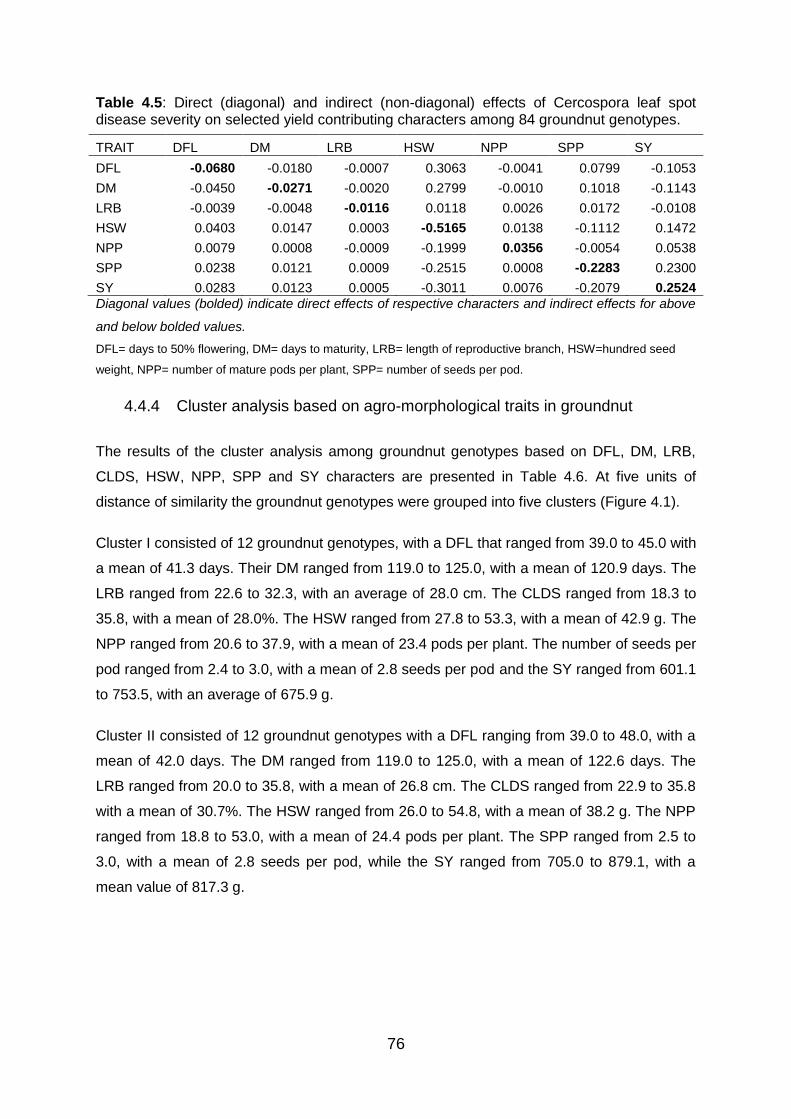
76
Table 4.5: Direct (diagonal) and indirect (non-diagonal) effects of Cercospora leaf spot disease severity on selected yield contributing characters among 84 groundnut genotypes.
TRAIT DFL DM LRB HSW NPP SPP SY
DFL -0.0680 -0.0180 -0.0007 0.3063 -0.0041 0.0799 -0.1053
DM -0.0450 -0.0271 -0.0020 0.2799 -0.0010 0.1018 -0.1143
LRB -0.0039 -0.0048 -0.0116 0.0118 0.0026 0.0172 -0.0108
HSW 0.0403 0.0147 0.0003 -0.5165 0.0138 -0.1112 0.1472
NPP 0.0079 0.0008 -0.0009 -0.1999 0.0356 -0.0054 0.0538
SPP 0.0238 0.0121 0.0009 -0.2515 0.0008 -0.2283 0.2300
SY 0.0283 0.0123 0.0005 -0.3011 0.0076 -0.2079 0.2524
Diagonal values (bolded) indicate direct effects of respective characters and indirect effects for above
and below bolded values.
DFL= days to 50% flowering, DM= days to maturity, LRB= length of reproductive branch, HSW=hundred seed
weight, NPP= number of mature pods per plant, SPP= number of seeds per pod.
4.4.4 Cluster analysis based on agro-morphological traits in groundnut
The results of the cluster analysis among groundnut genotypes based on DFL, DM, LRB,
CLDS, HSW, NPP, SPP and SY characters are presented in Table 4.6. At five units of
distance of similarity the groundnut genotypes were grouped into five clusters (Figure 4.1).
Cluster I consisted of 12 groundnut genotypes, with a DFL that ranged from 39.0 to 45.0 with
a mean of 41.3 days. Their DM ranged from 119.0 to 125.0, with a mean of 120.9 days. The
LRB ranged from 22.6 to 32.3, with an average of 28.0 cm. The CLDS ranged from 18.3 to
35.8, with a mean of 28.0%. The HSW ranged from 27.8 to 53.3, with a mean of 42.9 g. The
NPP ranged from 20.6 to 37.9, with a mean of 23.4 pods per plant. The number of seeds per
pod ranged from 2.4 to 3.0, with a mean of 2.8 seeds per pod and the SY ranged from 601.1
to 753.5, with an average of 675.9 g.
Cluster II consisted of 12 groundnut genotypes with a DFL ranging from 39.0 to 48.0, with a
mean of 42.0 days. The DM ranged from 119.0 to 125.0, with a mean of 122.6 days. The
LRB ranged from 20.0 to 35.8, with a mean of 26.8 cm. The CLDS ranged from 22.9 to 35.8
with a mean of 30.7%. The HSW ranged from 26.0 to 54.8, with a mean of 38.2 g. The NPP
ranged from 18.8 to 53.0, with a mean of 24.4 pods per plant. The SPP ranged from 2.5 to
3.0, with a mean of 2.8 seeds per pod, while the SY ranged from 705.0 to 879.1, with a
mean value of 817.3 g.

77
Cluster III consisted of eight genotypes with a DFL ranging from 37.0 to 42.0, with a mean of
39.5 days. The DM ranged from 118.0 to 120.0, with a mean of 119.6 days. The LRB ranged
from 19.4 to 33.7, with a mean of 28.1 cm. The CLDS ranged from 16.3 to 23.6, with a mean
of 19.9%. The HSW ranged from 40.7 to 56.6, with a mean of 52.4 g. The NPP ranged from
26.8 to 55.2, with a mean of 31.7 pods per plant. The SPP ranged from 2.5 to 3.7, with a
mean of 3.0 seeds per pod and the SY ranged from 869.8 to 1138.3, with a mean of 959.4 g.
Cluster IV consisted of 17 genotypes with a DFL ranging from 38.0 to 45.0, with a mean of
41.7 days. The DM ranged from 118.0 to 125.0, with a mean of 122.0 days. The LRB and
the CLDS ranged from 21.2 to 32.9 and 22.1 to 33.3, with mean values of 27.5 cm and
30.4%, respectively. The HSW ranged from 26.1 to 52.9, with a mean of 38.2 g and NPP
ranged from 19.9 to 51.6 with a mean of 27.8 pods per plant. The SPP ranged from 1.8 to
2.7, with a mean of 2.1 seeds per pod and the SY ranged from 447.0 to 589.9, with a mean
of 510.3 g.
Cluster V consisted of 35 genotypes with a DFL that ranged from 40.0 to 46.0, with a mean
of 43.0 days. The DM ranged from 119.0 to 125.0, with a mean of 124.1. The LRB ranged
from 20.7 to 36.8, with a mean of 28.4 cm. The CLDS ranged from 24.2 to 39.2, with a mean
of 34.0%. The HSW ranged from 25.4 to 54.8, with a mean of 32.0 g. The NPP ranged from
18.2 to 36.7, with a mean of 23.1 pods per plant. The SPP ranged from 1.0 to 2.2, with a
mean of 1.9 seeds per pod and the SY ranged from 204.3 to 463.4, with a mean of 419.0 g.
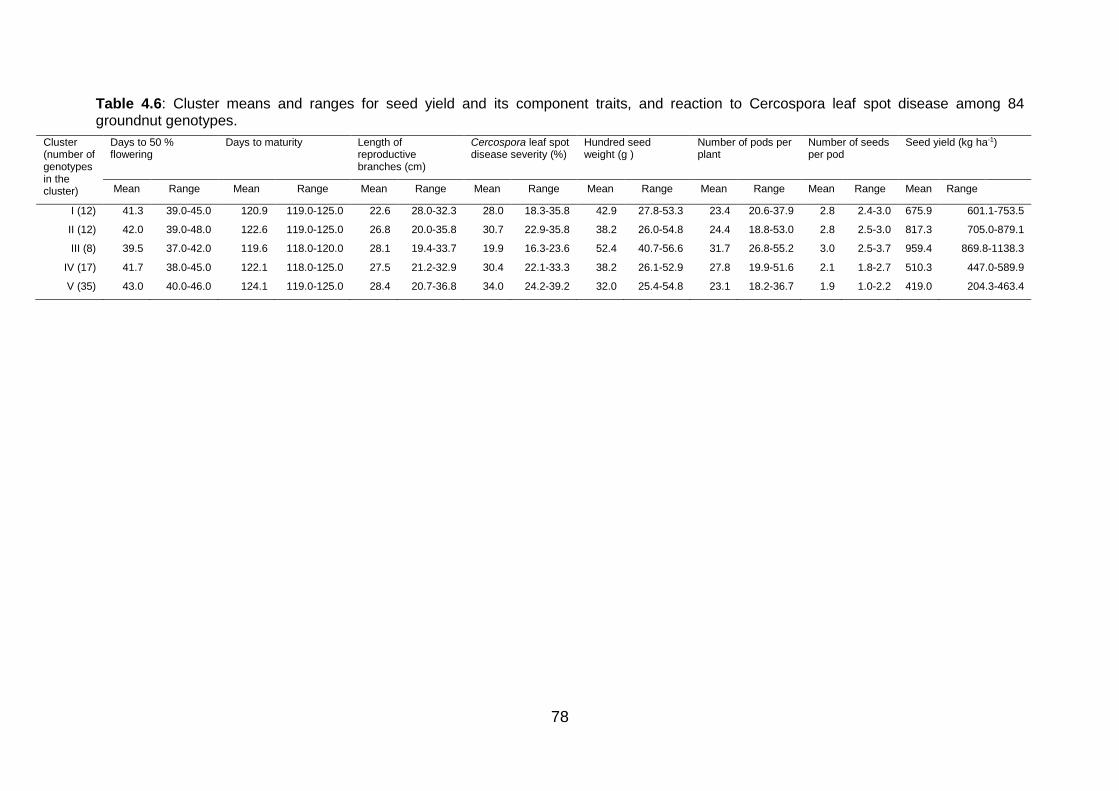
78
Table 4.6: Cluster means and ranges for seed yield and its component traits, and reaction to Cercospora leaf spot disease among 84 groundnut genotypes.
Cluster (number of genotypes in the cluster)
Days to 50 % flowering
Days to maturity Length of reproductive branches (cm)
Cercospora leaf spot disease severity (%)
Hundred seed weight (g )
Number of pods per plant
Number of seeds per pod
Seed yield (kg ha-1)
Mean Range Mean Range Mean Range Mean Range Mean Range Mean Range Mean Range Mean Range
I (12) 41.3 39.0-45.0 120.9 119.0-125.0 22.6 28.0-32.3 28.0 18.3-35.8 42.9 27.8-53.3 23.4 20.6-37.9 2.8 2.4-3.0 675.9 601.1-753.5
II (12) 42.0 39.0-48.0 122.6 119.0-125.0 26.8 20.0-35.8 30.7 22.9-35.8 38.2 26.0-54.8 24.4 18.8-53.0 2.8 2.5-3.0 817.3 705.0-879.1
III (8) 39.5 37.0-42.0 119.6 118.0-120.0 28.1 19.4-33.7 19.9 16.3-23.6 52.4 40.7-56.6 31.7 26.8-55.2 3.0 2.5-3.7 959.4 869.8-1138.3
IV (17) 41.7 38.0-45.0 122.1 118.0-125.0 27.5 21.2-32.9 30.4 22.1-33.3 38.2 26.1-52.9 27.8 19.9-51.6 2.1 1.8-2.7 510.3 447.0-589.9
V (35) 43.0 40.0-46.0 124.1 119.0-125.0 28.4 20.7-36.8 34.0 24.2-39.2 32.0 25.4-54.8 23.1 18.2-36.7 1.9 1.0-2.2 419.0 204.3-463.4
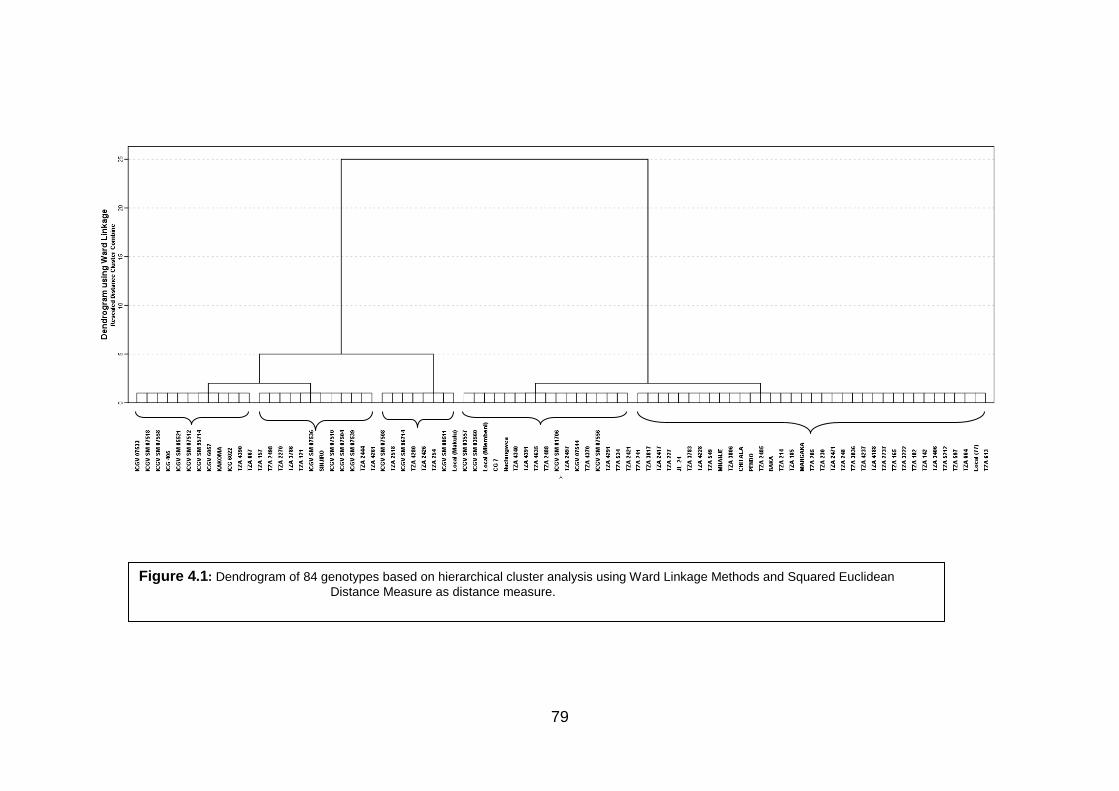
79
Figure 4.1: Dendrogram of 84 genotypes based on hierarchical cluster analysis using Ward Linkage Methods and Squared Euclidean
Distance Measure as distance measure.
80
4.5 Discussion
Correlation coefficient for Cercospora leaf spot disease and yield related traits among
groundnut genotypes
The significant (P≤0.01) negative correlation of CLDS with SY was attributed to the negative
effect of the disease on NPP, HSW and SPP, which are yield related traits. Groundnut
genotypes severely infected by CLD usually suffer excessive leaf abscission, which lowers
photosynthetic efficiency, and ultimately reduces dry matter production thus lowering SY. The
CLD causes damage to the plant by reducing the available photosynthetic area, due to leaf
lesion formation and abscission as reported by McDonald et al. (1985). Yield losses of 50% in
groundnut due to leaf defoliation caused by CLD has been reported by Melouk and Shokes
(1995).
The significant (P≤0.01) positive correlation of NPP with HSW was expected since vigorous
plants often produce many pods containing heavy seeds and hence high SY. The significant
(P≤0.01) positive correlation of SPP with SY was probably attributed to the large SPP, which
increases SY. Furthermore, SY was positively correlated with HSW and SPP, indicating that the
higher the SPP and HSW the higher the SY. The significant correlation between these traits in
groundnut yield was also reported by Jogloy et al. (2011). Yield improvement in groundnut,
therefore, may be achieved through selection of genotypes with early DFL and DM, as they will
escape the dry spell that occurs during the growing season especially in the study area, which is
characterized by semi-arid climate, high NPP, low CLDS, large SPP and HSW, and high SY.
Path analysis for seed yield
The positive direct effect on SY was depicted by DFL, LRB, CLDS and SPP (Table 4.4). Early
flowering genotypes with long LRB, many SPP and low CLDS tend to have a higher SY. In
order to directly improve yield of groundnuts these characters can be taken into consideration
during selection of parents for further breeding in addition to CLD resistance. Pavankumar et al.
(2014) and Thirumala et al. (2014) reported that the highest direct positive effect of seed yield,
days to maturity, number of pods per plant and hundred seed weight was revealed on pod yield
which is similar to findings in this study. Indirect effect on SY via SPP was exhibited by NPP and
HSW. This is because the higher the NPP, the higher the PY and HSW and therefore, the
81
overall SY. The SY was indirectly influenced by DM via HSW and NPP; this is because
genotypes with high NPP have high HSW.
Path analysis for Cercospora leaf spot disease
The positive direct effect of CLDS on seed yield and its contributing traits was exhibited in NPP
and SY (Table 4.5). This shows the effect of Cercospora leaf spot disease on the pod
production, which is a very important yield determinant and, therefore, yield of the groundnut
genotypes infected with the disease will have low seed yield. This is because CLD is associated
with leaf defoliation which causes low dry matter production and therefore low pod production.
However, CLDS had no direct influence on DFL, DM, LRB, HSW and SPP. Therefore, selection
of genotypes for resistance breeding may be done considering NPP and SY of the genotypes.
The indirect effect of CLD through DFL exhibited by HSW, SY and SPP can be attributed to
excessive defoliation inflicted by the diseases which cause poor photosynthesis, poor pod
formation, poor pod filling leading to shrivelled seeds with less weight. The indirect effect of CLD
through DM exhibited by HSW, SY and SPP might have been attributed to late maturity, which
coincides with harsh growing conditions leading to poor pod and seed yield, increased number
of immature pods causing low weight seeds per pod. The indirect effect of CLD through LRB
exhibited by SY and SPP could have been caused by a reduced length of reproductive
branches, which leads to a reduction in NPP, SY and damaged seeds, which reduces SPP. The
indirect effect of CLD through HSW and SPP exhibited by DFL, DM and LRB was probably due
to shrivelled infected seeds due to late flowering, maturity and reduced length of reproductive
branches. The indirect effect of CLD through SY exhibited by SPP and HSW can be due to
unfilled pods with a low number of seeds per pod and low seed weight.
Cluster analysis for selected yield components and CLD in groundnut genotypes.
The five clusters derived from the cluster analysis of the 84 groundnut genotypes suggest the
availability of a high-level phenotypic diversity among the groundnut genotypes. The selection
and hybridization can be effective for CLD resistance because the genotypes ranged from
susceptible to tolerant, and for yield because genotypes ranged from low to high yielding. These
findings are in accordance with an earlier report by Swamya et al. (2003). From the present
study, several genotypes from clusters I (ICGV 6057, Kakoma, ICGV 6022, TZA 4390 and TZA
667), II(TZA 157, TZA 2498, TZA 2270, TZA 3786, TZA 121, ICGV SM 07539, TZA 2444 and

82
TZA 4261), III(ICGV SM 07508, TZA 2518, ICGV SM 96714, TZA 4280, TZA 2426, TZA 254
and Local Makulu) and IV(TZA 534) were selected for further breeding programme due to their
low CLDS, large NPP, HSW and overall high SY. Therefore, simultaneous selection of
genotypes for high yield contributing characters and low CLDS can be achieved in groundnut
improvement breeding programmes (Venkataravana et al., 2000).
4.6 Conclusion
The current study has revealed that, there were significant and positive associations between
yield and its yield components. The CLDS was negatively associated with yield contributing
characters. The study also observed the direct and positive effects of yield contributing
characters on yield. Furthermore, the study grouped the genotypes into five clusters according
to their genetic similarities, which will be of value to the breeding programme aimed at improving
Cercospora leaf spot disease resistance and enhanced yield in groundnuts. Furthermore, the
study has shown the importance of establishing the associations between Cercospora leaf spot
disease, yield and its contributing characters, and their direct and indirect effect on the overall
seed yield as a prerequisite for parental selection.

83
References
Arunachalm, V. (1981). Genetic Distances in Plant Breeding. Indian Journal of Genetics and
Plant Breeding 4:226-236.
Dewey, D.I. and Lu, K.H. (1959). A Correlation and Path Coefficient Analysis of Components of
Created Wheat Grass Seed Production. Agronomy Journal 52:515-518.
Gomes, L.R., Santos, R.C., Anunciação Filho, C.J. and Melo Filho, P.A. (2007). Adaptabilidade
e estabilidade fenotípica de genótipos de amendoim de porte ereto. Pesquisa
Agropecuária Brasileira. 42:985-989.
Gomes, R.L.F. and Lopes, A.C.A. (2005). Correlations and Path Analysis in Peanut. Crop
Breeding and Applied Biotechnology 5:105-112.
Hassan, M., Atta, B.M., Shah, T.M., Haq, M.A., Syed, H. and Alam, S.S. (2005). Correlation and
Path Coefficient Studies in Induced Mutants of Chick pea (Cicer arietinum L.). Pakistan
Journal of Botany 37:293-298.
IBPGR, ICRISAT. (1985). Descriptors for groundnut (Revised). International Board for Plant
Genetic Resources, Rome, Italy and International Crop Research Institute for the Semi-
Arid Tropics, Patancheru, India. Pp. 25.
Jogloy, C., Jaisil, P., Akkasaeng, C., Kesmala, T. and Jogloy, S. (2011). Heritability and
Correlation for Maturity and Pod Yield in Peanut. Journal of Applied Sciences Research
2:134-140.
Joshi, A.H. and Dhawan, N.L. (1966). Genetic Improvement of Yield with Special Reference to
Self-Fertilizing Crops. Indian Journal of Genetics and Plant Breeding 26:101-113.
Mather, K. (1949). Biometrical genetics, Dover publication. Inc. New York, USA.
McDonald, D., Subrahmanyam, P., Gibbons, R.W. and Smith, D.H. (1985). Early and late leaf
spot disease of groundnut. Information Bulletin No. 21. Patancheru, Adhra Pradesh.
502324, India: International Crops Research Institute for the Semi-Arid Tropics. Pp. 24.
84
Melouk, H.A. and Shokes, F.M. (1995). Peanut health management. The American
Phytopathological Society. St. Paul, USA. Pp. 65-70.
Nagda, A.K., Dahora, A. and Jain, D.K. (2001). Character Association in Parents and Hybrids of
Groundnut (Arachis hypogaea L.). Crop Research 22:463-468.
Nevo, E., Golenberg, E., Beilies, A., Brown, A.H.D. and Zohary, D. (1982). Genetic Diversity
and Environmental Associations of Wild Wheat, in Israel. Theoretical and Applied Genetics
62: 241-254.
Pavankumar, C., Rekha, R., Venkateswarlu, O. and Vasanthi, R.P. (2014). Correlation and Path
Coefficient Analysis in Groundnut (Arachis hypogaea L.). International Journal of Applied
Biology and Pharmaceutical Technology 5:8-11.
Santos, R.C., Custodio, R.J.M. and Santos, V.F. (2000). Eficiência reprodutiva em genótipos de
amendoim e correlação fenotípica entre caracteres ligados ao ginóforo. Ciência e
Agrotecnologia 24:617-622.
Singh, R.K. and Chaudhary, B.D. (1977). Biometrical methods in quantitative genetic analysis
.Kalnani publishers, New Delhi, India. Pp. 39-68.
Subrahmanyam, P., McDonald, D., Waliyar, F., Reddy, L.J., Nigam, S.N., Gibbons, R.W.,
Ramanatha Rao, V., Singh, A.K., Pande, S., Reddy, P.M. and Subba Rao, P.V. (1995).
Screening methods and sources of resistance to rust and late leaf spot of groundnut.
Information Bulletin No.47. ICRISAT, Patancheru 502 324, Andhra Pradesh, India. Pp. 1-
20.
Swamya, B.P.M., Upadhyaya, H.D., Goudara, P.V.K., Kullaiswamya, B.Y. and Singh, S. (2003).
Phenotypic Variation for Agronomic Characteristics in a Groundnut Core Collection for
Asia. Field Crops Research 84:359-371.
Thirumala, R.V., Venkanna, V., Bhadru, D. and Bharathi, D. (2014). Studies on Variability,
Character Association and Path Analysis on Groundnut (Arachis hypogaea L.).
International Journal of Pure and Applied Bioscience 2:194-197.
85
Tomooka, N. (1991). Genetic diversity and landrace differentiation of mung bean, (Vigna radiata
L) Wilezek and evaluation of its relatives (The sub-genus Ceratotrophics) as breeding
materials. Technical Bulletin of Tropical Research Centre, Japan No. 28. Ministry of
Agriculture Forestry and Fisheries, Japan.
Venkataravana, P., Sheriff, R.A., Kulkarni, R.S., Shankaranarayana, V. and Fathima, P.S.
(2000). Correlation and Path Analysis in Groundnut (Arachis hypogaea L.). Mysore Journal
of Agricultural Sciences 34:321-325.
Vieira, E.A., Carvalho, F.I.F., Oliveira, A.C., Martins, L.F., Benin, G., Silva, J.A.G., Coimbra, J.,
Martins, A.F., Carvalho, M.F. and Ribeiro, G. (2007). Análise de trilha entre os
componentes primários e secundários do rendimento de grãos em trigo. Revista Brasileira
de Agrociência 13:169-174.
Wright, S. (1921). Correlation and Causation. Journal of Agriculture Research 20:557-585.
86
Chapter 5: Gene action and heritability of groundnut seed yield and
resistance to Cercospora leaf spot diseases
Abstract
Groundnut (Arachis hypogaea L.) is a highly self-pollinated crop grown in tropical and
subtropical areas. The crop has a narrow genetic base, and therefore, it is essential to create
more variability in the segregating materials. The effectiveness of selection is dependent upon
the magnitude of genetic variability present in the material, nature of gene action and the extent
to which it is heritable. This study was conducted, to determine the gene action and heritability
of resistance to Cercospora leaf spot diseases (CLD) and seed yield (SY) in groundnuts, and to
select promising parents and crosses with durable resistance to CLD and enhanced yield. The
study involved three groundnut botanical groups, (Valencia, Virginia and Spanish) crossed in a
line x tester mating design and evaluated at three sites (the Hombolo and Makutupora
agricultural research stations, and the Bihawana farmers’ training centre), in Tanzania. The
results revealed that, parents Local Makulu, TZA 121 and ICGV SM 96714 in the Valencia
botanical group; TZA 4280, TZA 4390 and ICGV 6022 in the Virginia botanical group and TZA
2518, TZA 254 and ICGV SM 07508 in the Spanish botanical group had good general
combining ability (GCA) for CLD resistance and SY and contributed to significant specific
combining ability (SCA) in the crosses they were involved. The F1 crosses; Local Makulu x
ICGV SM 96714, TZA 121 x Kakoma, TZA 3786 x Kakoma, TZA 157 x Kakoma, TZA 2498 x
ICGV SM 96714 in the Valencia group; TZA 534 x ICGV 6057, TZA 4280 x ICGV 6022, TZA
4390 x ICGV 6022 and TZA 4261 x ICGV 6057 in the Virginia group, and TZA 2444 x ICGV SM
07539, TZA 2518 x ICGV SM 07508, TZA 254 x ICGV SM 07508, TZA 2426 x ICGV SM
07539, TZA 2270 x ICGV SM 07539 and TZA 2270 x ICGV SM 07508 in the Spanish group
had significant negative SCA for CLD resistance and positive for SY which is desirable for
individual selection. Further, the study revealed, both additive and non-additive gene effects
were important in the inheritance of CLD resistance and SY. In addition, additive genetic
variance (GVA) was larger than dominance genetic variance (GVD) in Valencia group however,
in Virginia and Spanish group, GVD was larger than GVA thus, selection of genotypes from initial
generations for resistance to CLD may be difficult due to high influence of dominance effects in
the expression of the total phenotypic variance. Furthermore, broad sense heritability was
87
higher than narrow sense heritability on the studied traits for all the three botanical groups
implying that these traits can be transmitted from parents to progenies through hybridization.
Key words: additive genetic variance, broad sense heritability, dominance genetic variance,
gene action, general combining ability, groundnuts, narrow sense heritability, specific combining
ability.
5.1 Introduction
Cultivated groundnut (Arachis hypogaea L.) belongs to the family Fabaceae. Botanically,
cultivated groundnut is classified into two sub-species, which differ in their branching patterns
(sub-species hypogaea with alternate branching habit and sub-species fastigiata with sequential
branching habit). Each sub-species is divided into two botanical varieties, sub-species
hypogaea into var. hypogaea (Virginia) and var. hirsuta; and sub-species fastigiata into var.
fastigiata (Valencia) and var. vulgaris (Spanish). The Virginia bunch seeds are richest in oil and
chemical contents, followed by Spanish bunch type. The protein content and oil quality is
highest in the Valencia types, while soluble sugars are highest in hirsuta. Groundnut is an
important oilseed crop. The groundnut kernel is a rich source of energy because of its high oil
(44-50%) and protein content (25-33%). It contains 18% carbohydrates, and is rich in minerals
(calcium, magnesium and iron) and vitamins (B1, B2 and Niacin) (Naidu et al., 1999). The crop
is grown for food security and cash in most of the semi-arid tropics including Tanzania
(Upadhyaya et al., 2006).
The low productivity of the crop in Tanzania and several other African countries is ascribed to
many biotic and abiotic stresses. Among the biotic factors, Cercospora leaf spot diseases (CLD)
is one of the most economically important foliar diseases of groundnut, which can cause yield
losses of up to 80% (Grichar et al., 1998). The development of resistant or tolerant cultivars to
these diseases could be effective in decreasing the production costs associated with chemical
application, in improving the production in terms of quantity and quality, and in reducing the
detrimental effects of chemicals on our ecosystem. The development of high-yielding CLD
resistant genotypes requires the identification of resistant sources with good breeding potential
(Bhailalbhai, 2012). The partitioning of genetic effects into general combining ability (GCA) and
specific combining ability (SCA) is essential for understanding the types of gene action
governing the important quantitative traits. Estimates of combining ability effects are essential in

88
identifying superior parents as this indicates the ability of pure line to transmit desirable
performance to its hybrid progenies. The GCA is associated with the genes which are additive in
effects and are fixable, while the SCA is more dependent on genes with dominance and
epistasis and is non-fixable (Rojas and Sprague, 1952; Sprague and Federer, 1952). Several
mating designs including complete diallel, half diallel, line x tester, one way and three way
crosses are used to partition genetic variability into portions due to GCA and SCA effects.
The success of crop improvement programmes depends on the choice of parents for
improvement of any plant character through hybridization. It is therefore, necessary to
understand the nature of gene action and the genetic architecture of the donor parents for a
particular character. Information on the combining ability status of the genotypes will give an
indication of how well they combine with a given genotype to produce potential and productive
populations, and on the nature of gene action involved. This helps the breeder to decide upon
the choice of parents for hybridization. Therefore, this study was undertaken (i) to estimate the
general combining ability (GCA) and specific combining ability (SCA) effects for CLD resistance,
and seed yield and its component traits in groundnut, (ii) to study the nature and magnitude of
gene action for quantitative characters in groundnuts and (iii) to estimate the heritability for CLD
resistance and yield.
5.2 Material and methods
5.2.1 Study site and parental selection
The selection of parents was done based on the results of the screening experiments conducted
at the Hombolo and Makutupora agricultural research stations, and the Bihawana farmers
training centre in the Dodoma region (Chapter three). Twenty-one genotypes were selected
from the genotype evaluation experiments (Table 3.1). The parents included three sets of seven
entries each from the Valencia, Virginia and Spanish types with either tolerance to CLD disease
or high yield potential and farmers’ preferred traits. The 21 selected parents were planted in a
screen house for crossing. The parents in each set were crossed in a line x tester mating design
involving five lines and two testers to produce ten single cross hybrids for each botanical group.
The single cross lines were evaluated for combining ability, heritability and gene action
governing the inheritance of yield and CLD resistance. The crossing scheme of single crosses
for CLD resistance and parental material are summarized in Table 5.1.
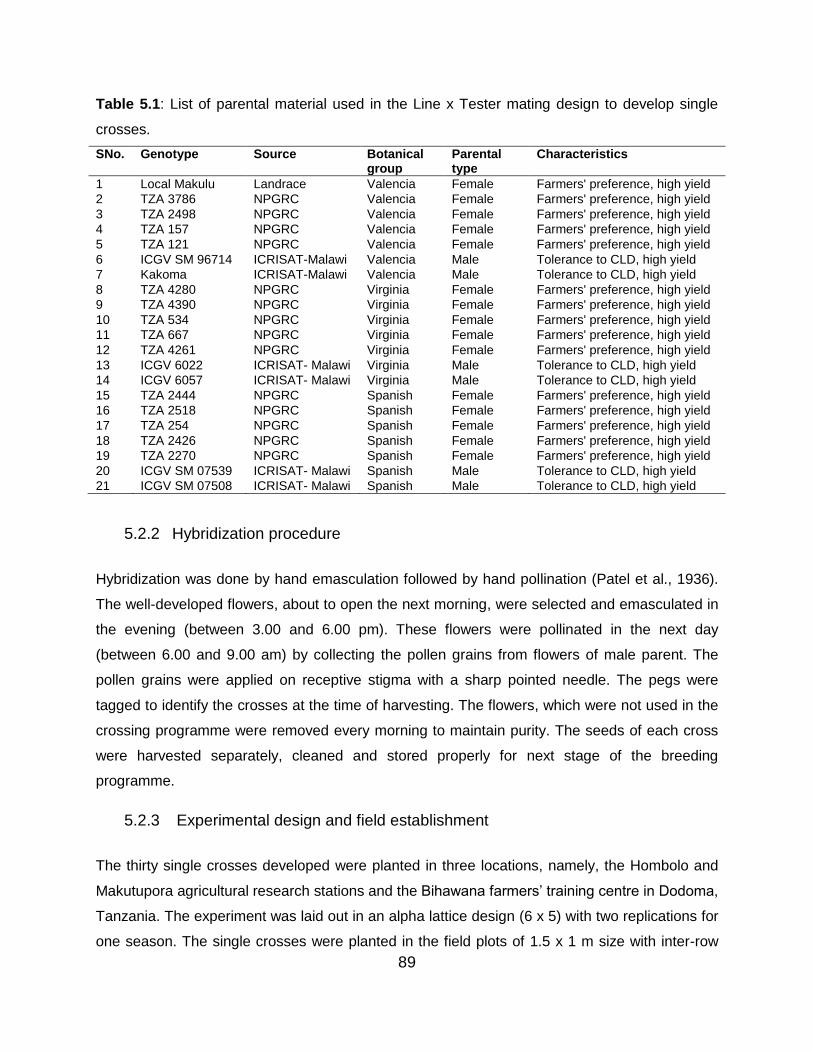
89
Table 5.1: List of parental material used in the Line x Tester mating design to develop single
crosses.
SNo. Genotype Source Botanical group
Parental type
Characteristics
1 Local Makulu Landrace Valencia Female Farmers' preference, high yield
2 TZA 3786 NPGRC Valencia Female Farmers' preference, high yield
3 TZA 2498 NPGRC Valencia Female Farmers' preference, high yield
4 TZA 157 NPGRC Valencia Female Farmers' preference, high yield
5 TZA 121 NPGRC Valencia Female Farmers' preference, high yield
6 ICGV SM 96714 ICRISAT-Malawi Valencia Male Tolerance to CLD, high yield
7 Kakoma ICRISAT-Malawi Valencia Male Tolerance to CLD, high yield
8 TZA 4280 NPGRC Virginia Female Farmers' preference, high yield
9 TZA 4390 NPGRC Virginia Female Farmers' preference, high yield
10 TZA 534 NPGRC Virginia Female Farmers' preference, high yield
11 TZA 667 NPGRC Virginia Female Farmers' preference, high yield
12 TZA 4261 NPGRC Virginia Female Farmers' preference, high yield
13 ICGV 6022 ICRISAT- Malawi Virginia Male Tolerance to CLD, high yield
14 ICGV 6057 ICRISAT- Malawi Virginia Male Tolerance to CLD, high yield
15 TZA 2444 NPGRC Spanish Female Farmers' preference, high yield
16 TZA 2518 NPGRC Spanish Female Farmers' preference, high yield
17 TZA 254 NPGRC Spanish Female Farmers' preference, high yield
18 TZA 2426 NPGRC Spanish Female Farmers' preference, high yield
19 TZA 2270 NPGRC Spanish Female Farmers' preference, high yield
20 ICGV SM 07539 ICRISAT- Malawi Spanish Male Tolerance to CLD, high yield
21 ICGV SM 07508 ICRISAT- Malawi Spanish Male Tolerance to CLD, high yield
5.2.2 Hybridization procedure
Hybridization was done by hand emasculation followed by hand pollination (Patel et al., 1936).
The well-developed flowers, about to open the next morning, were selected and emasculated in
the evening (between 3.00 and 6.00 pm). These flowers were pollinated in the next day
(between 6.00 and 9.00 am) by collecting the pollen grains from flowers of male parent. The
pollen grains were applied on receptive stigma with a sharp pointed needle. The pegs were
tagged to identify the crosses at the time of harvesting. The flowers, which were not used in the
crossing programme were removed every morning to maintain purity. The seeds of each cross
were harvested separately, cleaned and stored properly for next stage of the breeding
programme.
5.2.3 Experimental design and field establishment
The thirty single crosses developed were planted in three locations, namely, the Hombolo and
Makutupora agricultural research stations and the Bihawana farmers’ training centre in Dodoma,
Tanzania. The experiment was laid out in an alpha lattice design (6 x 5) with two replications for
one season. The single crosses were planted in the field plots of 1.5 x 1 m size with inter-row
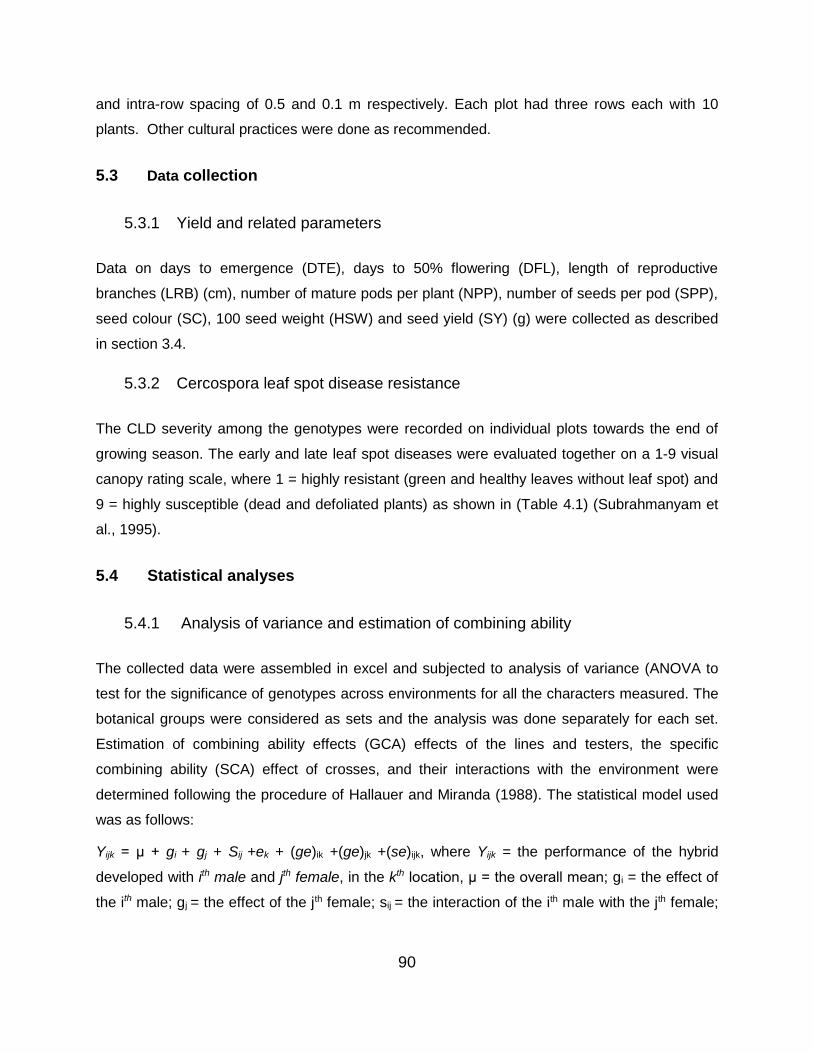
90
and intra-row spacing of 0.5 and 0.1 m respectively. Each plot had three rows each with 10
plants. Other cultural practices were done as recommended.
5.3 Data collection
5.3.1 Yield and related parameters
Data on days to emergence (DTE), days to 50% flowering (DFL), length of reproductive
branches (LRB) (cm), number of mature pods per plant (NPP), number of seeds per pod (SPP),
seed colour (SC), 100 seed weight (HSW) and seed yield (SY) (g) were collected as described
in section 3.4.
5.3.2 Cercospora leaf spot disease resistance
The CLD severity among the genotypes were recorded on individual plots towards the end of
growing season. The early and late leaf spot diseases were evaluated together on a 1-9 visual
canopy rating scale, where 1 = highly resistant (green and healthy leaves without leaf spot) and
9 = highly susceptible (dead and defoliated plants) as shown in (Table 4.1) (Subrahmanyam et
al., 1995).
5.4 Statistical analyses
5.4.1 Analysis of variance and estimation of combining ability
The collected data were assembled in excel and subjected to analysis of variance (ANOVA to
test for the significance of genotypes across environments for all the characters measured. The
botanical groups were considered as sets and the analysis was done separately for each set.
Estimation of combining ability effects (GCA) effects of the lines and testers, the specific
combining ability (SCA) effect of crosses, and their interactions with the environment were
determined following the procedure of Hallauer and Miranda (1988). The statistical model used
was as follows:
Yijk = μ + gi + gj + Sij +ek + (ge)ik +(ge)jk +(se)ijk, where Yijk = the performance of the hybrid
developed with ith male and jth female, in the kth location, μ = the overall mean; gi = the effect of
the ith male; gj = the effect of the jth female; sij = the interaction of the ith male with the jth female;

91
ek = the effect of the kth environment; (ge)ik = the interaction of the gi and ek; (ge)jk = the
interaction of the gj and ek; (se)ijk = the interaction of sij and ek.
The GCA and SCA effects were calculated using the relationships: gi Ý i.- Ý.., g j Ý j. - Ý ..,
and s ij Ýij - Ýi. - Ý.j Ý..
Where, gi = GCA of ith female, g j = GCA of jth male, s ij = SCA of jth male parent with all females
in hybrid combinations, Ýij = mean performance of hybrid combination with ith female and jth
male, Ýi. = mean performance of ith female parent with all males in hybrid combinations, Ý.j =
mean performance of jth male parent with all females in hybrid combinations, and Ý.. = overall
mean performance of hybrids.
5.4.2 Estimation of heritability
The broad sense and narrow sense heritability were determined following (Burton, 1952) using
the relationships: VP = VG + VE, VP = VA + VD + VE, H2 = VG/VP, and h2 =VA/VP
Where: VP = phenotypic variance, VA =additive variance, VD = dominance variance, and VE
=environmental variance, H2=broad sense heritability, and h2= narrow sense heritability.
5.5 Results
In the Valencia botanical group, the environments and females were significant for all the
evaluated traits at different levels; males were significant for all the measured traits except
CLDS. The environment x female were significant for CLDS and SY at p<0.05 and p<0.001
respectively. The interaction between environment x female x male was significant (p<0.05) for
SY. The percentage contributions of SSF were found to be the highest for all measured traits
followed by SSM and the lowest contribution was by the SSFM (Table 5.2).
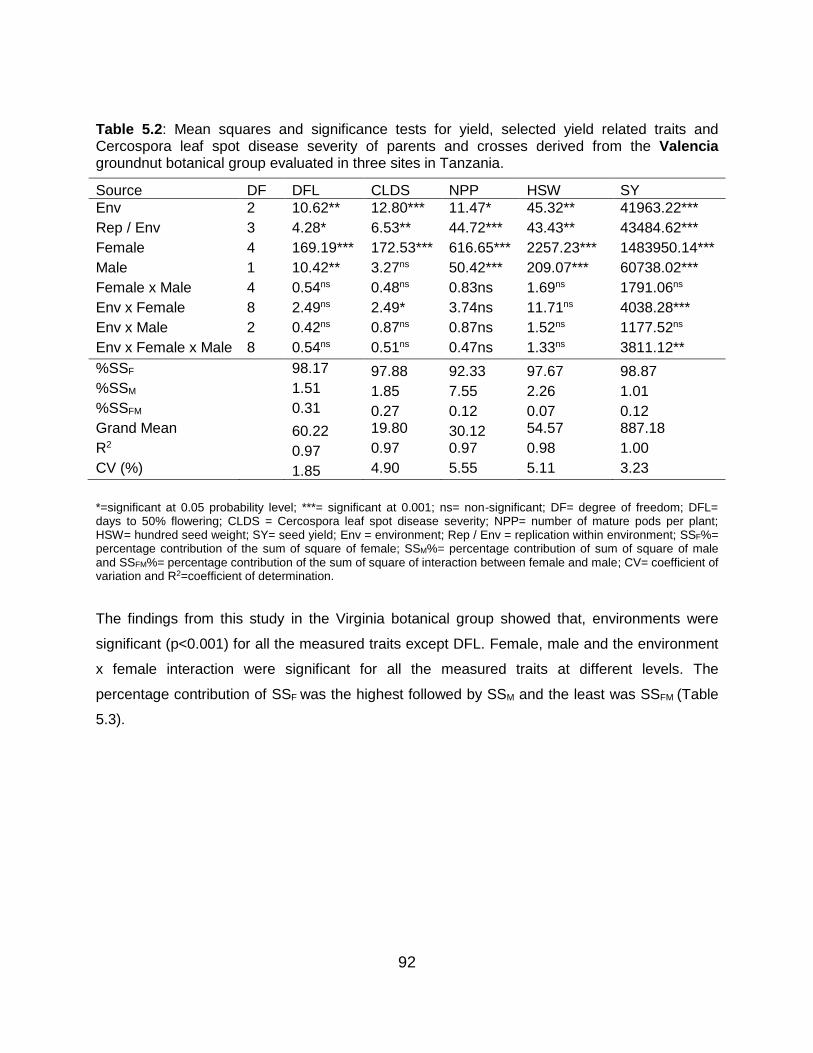
92
Table 5.2: Mean squares and significance tests for yield, selected yield related traits and Cercospora leaf spot disease severity of parents and crosses derived from the Valencia groundnut botanical group evaluated in three sites in Tanzania.
Source DF DFL CLDS NPP HSW SY
Env 2 10.62** 12.80*** 11.47* 45.32** 41963.22***
Rep / Env 3 4.28* 6.53** 44.72*** 43.43** 43484.62***
Female 4 169.19*** 172.53*** 616.65*** 2257.23*** 1483950.14***
Male 1 10.42** 3.27ns 50.42*** 209.07*** 60738.02***
Female x Male 4 0.54ns 0.48ns 0.83ns 1.69ns 1791.06ns
Env x Female 8 2.49ns 2.49* 3.74ns 11.71ns 4038.28***
Env x Male 2 0.42ns 0.87ns 0.87ns 1.52ns 1177.52ns
Env x Female x Male 8 0.54ns 0.51ns 0.47ns 1.33ns 3811.12**
%SSF
98.17 97.88 92.33 97.67 98.87 %SSM
1.51 1.85 7.55 2.26 1.01 %SSFM
0.31 0.27 0.12 0.07 0.12 Grand Mean
60.22 19.80 30.12 54.57 887.18
R2
0.97 0.97 0.97 0.98 1.00
CV (%)
1.85 4.90 5.55 5.11 3.23
*=significant at 0.05 probability level; ***= significant at 0.001; ns= non-significant; DF= degree of freedom; DFL= days to 50% flowering; CLDS = Cercospora leaf spot disease severity; NPP= number of mature pods per plant; HSW= hundred seed weight; SY= seed yield; Env = environment; Rep / Env = replication within environment; SSF%= percentage contribution of the sum of square of female; SSM%= percentage contribution of sum of square of male and SSFM%= percentage contribution of the sum of square of interaction between female and male; CV= coefficient of variation and R2=coefficient of determination.
The findings from this study in the Virginia botanical group showed that, environments were
significant (p<0.001) for all the measured traits except DFL. Female, male and the environment
x female interaction were significant for all the measured traits at different levels. The
percentage contribution of SSF was the highest followed by SSM and the least was SSFM (Table
5.3).
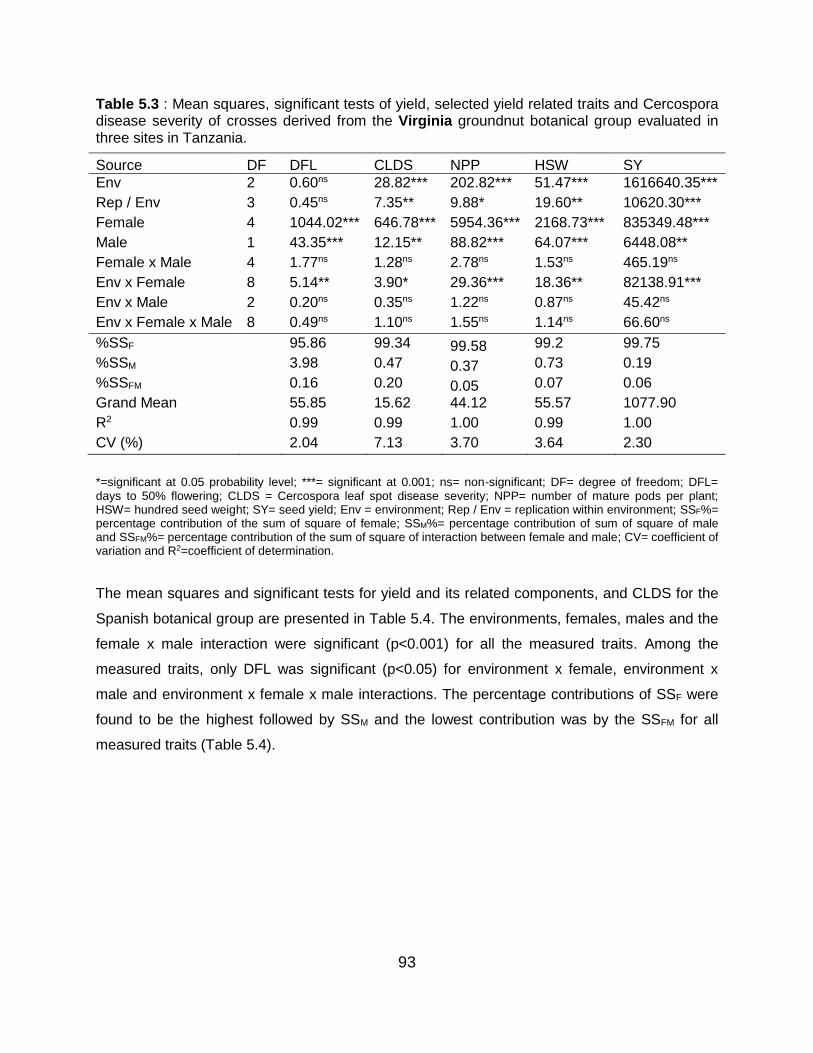
93
Table 5.3 : Mean squares, significant tests of yield, selected yield related traits and Cercospora disease severity of crosses derived from the Virginia groundnut botanical group evaluated in three sites in Tanzania.
Source DF DFL CLDS NPP HSW SY
Env 2 0.60ns 28.82*** 202.82*** 51.47*** 1616640.35***
Rep / Env 3 0.45ns 7.35** 9.88* 19.60** 10620.30***
Female 4 1044.02*** 646.78*** 5954.36*** 2168.73*** 835349.48***
Male 1 43.35*** 12.15** 88.82*** 64.07*** 6448.08**
Female x Male 4 1.77ns 1.28ns 2.78ns 1.53ns 465.19ns
Env x Female 8 5.14** 3.90* 29.36*** 18.36** 82138.91***
Env x Male 2 0.20ns 0.35ns 1.22ns 0.87ns 45.42ns
Env x Female x Male 8 0.49ns 1.10ns 1.55ns 1.14ns 66.60ns
%SSF
95.86 99.34 99.58 99.2 99.75
%SSM
3.98 0.47 0.37 0.73 0.19
%SSFM
0.16 0.20 0.05 0.07 0.06
Grand Mean
55.85 15.62 44.12 55.57 1077.90
R2
0.99 0.99 1.00 0.99 1.00
CV (%)
2.04 7.13 3.70 3.64 2.30
*=significant at 0.05 probability level; ***= significant at 0.001; ns= non-significant; DF= degree of freedom; DFL= days to 50% flowering; CLDS = Cercospora leaf spot disease severity; NPP= number of mature pods per plant; HSW= hundred seed weight; SY= seed yield; Env = environment; Rep / Env = replication within environment; SSF%= percentage contribution of the sum of square of female; SSM%= percentage contribution of sum of square of male and SSFM%= percentage contribution of the sum of square of interaction between female and male; CV= coefficient of variation and R2=coefficient of determination.
The mean squares and significant tests for yield and its related components, and CLDS for the
Spanish botanical group are presented in Table 5.4. The environments, females, males and the
female x male interaction were significant (p<0.001) for all the measured traits. Among the
measured traits, only DFL was significant (p<0.05) for environment x female, environment x
male and environment x female x male interactions. The percentage contributions of SSF were
found to be the highest followed by SSM and the lowest contribution was by the SSFM for all
measured traits (Table 5.4).
94
Table 5.4: Mean squares and significant tests of yield, yield related traits and Cercospora leaf spot disease severity of crosses derived from the Spanish groundnut botanical group evaluated in three sites in Tanzania.
Source DF DFL CLDS NPP HSW SY
Env 2 21.80*** 5.22*** 15.20*** 31.52*** 14842.717***
Rep / Env 3 3.33ns 0.15ns 2.73ns 4.57ns 1526.35ns
Female 4 171.07*** 98.11*** 234.96*** 732.02*** 315058.64***
Male 1 308.27*** 170.02*** 308.27*** 1382.40*** 593418.15***
Female x Male 4 71.93*** 23.48*** 45.56*** 169.73*** 66404.69***
Env x Female 8 6.97* 0.45ns 2.28ns 4.20ns 2414.53ns
Env x Male 2 8.87* 0.42ns 3.47ns 4.85ns 3683.15ns
Env x Female x Male
8 5.53* 1.06ns 1.13ns 2.75ns 816.63ns
%SSF
53.45 59.79 65.71 58.69 59.47
%SSM
24.08 25.9 21.55 27.71 28.00
%SSFM
22.47 14.31 12.74 13.61 12.53
Grand Mean
57.80 22.22 26.50 40.27 610.98
R2
0.96 0.98 0.97 0.98 0.99
CV (%)
2.54 3.25 4.81 4.28 5.64
*=significant at 0.05 probability level; ***= significant at 0.001; ns= non-significant; DF= degree of freedom; DFL= days to 50% flowering; CLDS = Cercospora leaf spot disease severity; NPP= number of mature pods per plant; HSW= hundred seed weight; SY= seed yield; Env = environment; Rep / Env = replication within environment; SSF%= percentage contribution of the sum of square of female; SSM%= percentage contribution of sum of square of male and SSFM%= percentage contribution of the sum of square of interaction between female and male; CV= coefficient of variation and R2=coefficient of determination.
The GCAF effects for Valencia parents (Table 5.5) Local Makulu and TZA 121 were significant
(p<0.01) and negative for DFL, CLDS, NPP, HSW and SY. The parent TZA 3786 had significant
(p<0.01) and positive GCA for HSW and SY. The parents TZA 157 and TZA 2498 had
significant (p<0.01) and positive GCA for DFL and CLDS, and significant (p<0.01) and negative
GCA for NPP, HSW and SY. The GCAM was significant (p<0.01) and positive for NPP, HSW
and SY for parent ICGV SM 96714 and negative for parent Kakoma for NPP, HSW and SY.
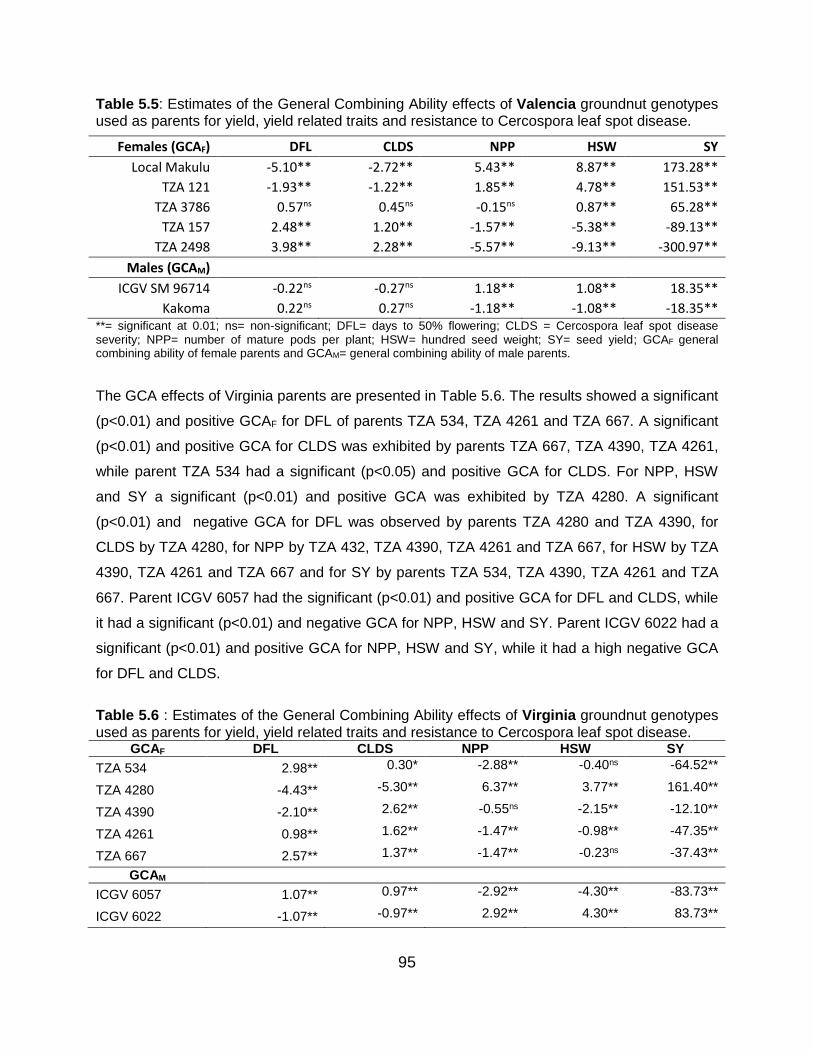
95
Table 5.5: Estimates of the General Combining Ability effects of Valencia groundnut genotypes used as parents for yield, yield related traits and resistance to Cercospora leaf spot disease.
Females (GCAF) DFL CLDS NPP HSW SY
Local Makulu -5.10** -2.72** 5.43** 8.87** 173.28**
TZA 121 -1.93** -1.22** 1.85** 4.78** 151.53**
TZA 3786 0.57ns 0.45ns -0.15ns 0.87** 65.28**
TZA 157 2.48** 1.20** -1.57** -5.38** -89.13**
TZA 2498 3.98** 2.28** -5.57** -9.13** -300.97**
Males (GCAM)
ICGV SM 96714 -0.22ns -0.27ns 1.18** 1.08** 18.35**
Kakoma 0.22ns 0.27ns -1.18** -1.08** -18.35** **= significant at 0.01; ns= non-significant; DFL= days to 50% flowering; CLDS = Cercospora leaf spot disease severity; NPP= number of mature pods per plant; HSW= hundred seed weight; SY= seed yield; GCAF general combining ability of female parents and GCAM= general combining ability of male parents.
The GCA effects of Virginia parents are presented in Table 5.6. The results showed a significant
(p<0.01) and positive GCAF for DFL of parents TZA 534, TZA 4261 and TZA 667. A significant
(p<0.01) and positive GCA for CLDS was exhibited by parents TZA 667, TZA 4390, TZA 4261,
while parent TZA 534 had a significant (p<0.05) and positive GCA for CLDS. For NPP, HSW
and SY a significant (p<0.01) and positive GCA was exhibited by TZA 4280. A significant
(p<0.01) and negative GCA for DFL was observed by parents TZA 4280 and TZA 4390, for
CLDS by TZA 4280, for NPP by TZA 432, TZA 4390, TZA 4261 and TZA 667, for HSW by TZA
4390, TZA 4261 and TZA 667 and for SY by parents TZA 534, TZA 4390, TZA 4261 and TZA
667. Parent ICGV 6057 had the significant (p<0.01) and positive GCA for DFL and CLDS, while
it had a significant (p<0.01) and negative GCA for NPP, HSW and SY. Parent ICGV 6022 had a
significant (p<0.01) and positive GCA for NPP, HSW and SY, while it had a high negative GCA
for DFL and CLDS.
Table 5.6 : Estimates of the General Combining Ability effects of Virginia groundnut genotypes used as parents for yield, yield related traits and resistance to Cercospora leaf spot disease.
GCAF DFL CLDS NPP HSW SY
TZA 534 2.98** 0.30* -2.88** -0.40ns -64.52**
TZA 4280 -4.43** -5.30** 6.37** 3.77** 161.40**
TZA 4390 -2.10** 2.62** -0.55ns -2.15** -12.10**
TZA 4261 0.98** 1.62** -1.47** -0.98** -47.35**
TZA 667 2.57** 1.37** -1.47** -0.23ns -37.43**
GCAM
ICGV 6057 1.07** 0.97** -2.92** -4.30** -83.73**
ICGV 6022 -1.07** -0.97** 2.92** 4.30** 83.73**
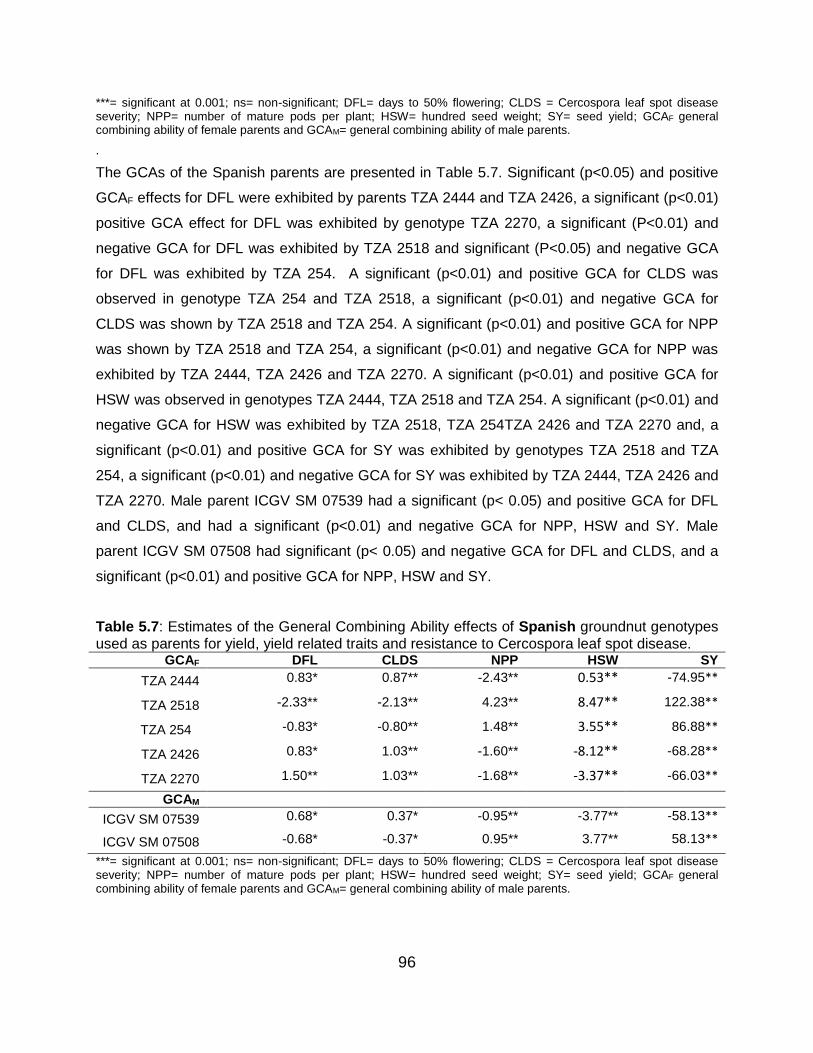
96
***= significant at 0.001; ns= non-significant; DFL= days to 50% flowering; CLDS = Cercospora leaf spot disease severity; NPP= number of mature pods per plant; HSW= hundred seed weight; SY= seed yield; GCAF general combining ability of female parents and GCAM= general combining ability of male parents.
.
The GCAs of the Spanish parents are presented in Table 5.7. Significant (p<0.05) and positive
GCAF effects for DFL were exhibited by parents TZA 2444 and TZA 2426, a significant (p<0.01)
positive GCA effect for DFL was exhibited by genotype TZA 2270, a significant (P<0.01) and
negative GCA for DFL was exhibited by TZA 2518 and significant (P<0.05) and negative GCA
for DFL was exhibited by TZA 254. A significant (p<0.01) and positive GCA for CLDS was
observed in genotype TZA 254 and TZA 2518, a significant (p<0.01) and negative GCA for
CLDS was shown by TZA 2518 and TZA 254. A significant (p<0.01) and positive GCA for NPP
was shown by TZA 2518 and TZA 254, a significant (p<0.01) and negative GCA for NPP was
exhibited by TZA 2444, TZA 2426 and TZA 2270. A significant (p<0.01) and positive GCA for
HSW was observed in genotypes TZA 2444, TZA 2518 and TZA 254. A significant (p<0.01) and
negative GCA for HSW was exhibited by TZA 2518, TZA 254TZA 2426 and TZA 2270 and, a
significant (p<0.01) and positive GCA for SY was exhibited by genotypes TZA 2518 and TZA
254, a significant (p<0.01) and negative GCA for SY was exhibited by TZA 2444, TZA 2426 and
TZA 2270. Male parent ICGV SM 07539 had a significant (p< 0.05) and positive GCA for DFL
and CLDS, and had a significant (p<0.01) and negative GCA for NPP, HSW and SY. Male
parent ICGV SM 07508 had significant (p< 0.05) and negative GCA for DFL and CLDS, and a
significant (p<0.01) and positive GCA for NPP, HSW and SY.
Table 5.7: Estimates of the General Combining Ability effects of Spanish groundnut genotypes used as parents for yield, yield related traits and resistance to Cercospora leaf spot disease.
GCAF DFL CLDS NPP HSW SY
TZA 2444 0.83* 0.87** -2.43** 0.53** -74.95**
TZA 2518 -2.33** -2.13** 4.23** 8.47** 122.38**
TZA 254 -0.83* -0.80** 1.48** 3.55** 86.88**
TZA 2426 0.83* 1.03** -1.60** -8.12** -68.28**
TZA 2270 1.50** 1.03** -1.68** -3.37** -66.03**
GCAM
ICGV SM 07539 0.68* 0.37* -0.95** -3.77** -58.13**
ICGV SM 07508 -0.68* -0.37* 0.95** 3.77** 58.13**
***= significant at 0.001; ns= non-significant; DFL= days to 50% flowering; CLDS = Cercospora leaf spot disease severity; NPP= number of mature pods per plant; HSW= hundred seed weight; SY= seed yield; GCAF general combining ability of female parents and GCAM= general combining ability of male parents.

97
Estimates of the SCA effects of the crosses derived from Valencia botanical group are
presented in Table 5.8. The results showed that the SCA for all the crosses were non-significant
for DFL, except TZA 157 x Kakoma and TZA 2498 x Kakoma, which had a significantly (p<0.01)
negative SCA and TZA 2498 X ICGV SM 96714 with a significant (p<0.01) and positive SCA.
The crosses Local Makulu x ICGV SM 96714, TZA 121 x Kakoma, TZA 3786 x Kakoma, TZA
157 x Kakoma and TZA 2498 x ICGV SM 96714 had a negative non-significant SCA for the
CLDS. All crosses were non–significant for NPP, except TZA 2498X ICGV SM 96714 which had
significant (p<0.01) positive SCA and TZA 2498 x Kakoma with significant (p<0.01) negative
SCA. The SCA for all crosses were non-significant for HSW. The SCA for SY was significant
(p<0.01) and positive for Local Makulu x ICGV SM 96714 and TZA 121 x Kakoma, while it was
significant (p<0.01) and negative Local Makulu x Kakoma and TZA 121 x ICGV SM 96714.
Table 5.8: Estimates of Specific Combining Ability effects of the hybrids of Valencia groundnut botanical group for days to flowering, Cercospora leaf spot disease severity number of mature pods per plant, hundred seed weight and seed yield evaluated in three sites.
Crosses (SCA) DFL CLDS NPP HSW SY
Local Makulu x ICGV SM 96714 0.13ns -0.32ns -0.10ns 0.17ns 29.98**
Local Makulu x Kakoma -0.13ns 0.32ns 0.10ns -0.17ns -29.98**
TZA 121 x ICGV SM 96714 -0.20ns 0.02ns -1.35ns -0.25ns -16.43**
TZA 121 X Kakoma 0.20ns -0.02ns 1.35ns 0.25ns 16.43**
TZA 3786 X ICGV SM 96714 -0.20ns 0.35ns -1.02ns 0.00ns -0.85ns
TZA 3786 X Kakoma 0.20ns -0.35ns 1.02ns 0.00ns 0.85ns
TZA 157 x ICGV SM 96714 0.22ns 0.27ns 0.23ns 0.08ns -2.60ns
TZA 157 X Kakoma -0.22** -0.27ns -0.23ns -0.08ns 2.60ns
TZA 2498X ICGV SM 96714 0.05** -0.32ns 2.23** 0.00ns -10.10ns
TZA 2498 X Kakoma -0.05** 0.32ns -2.23** 0.00ns 10.10ns
***= significant at 0.001; ns= non-significant; DFL= days to 50% flowering; CLDS = Cercospora leaf spot disease severity; NPP= number of mature pods per plant; HSW= hundred seed weight; SY= seed yield and SCA=specific combining ability.
Estimates of the SCA effects of crosses derived from Virginia botanical group are presented in
Table 5.9. The results showed that the SCA effects for DFL of all crosses were significant
(p<0.01) except TZA 534 x ICGV 6057, TZA 4280 x ICGV 6057, TZA 4390 x ICGV 6022 and
TZA 4261 x ICGV 6022 which had significant negative SCA value, TZA 4280 x ICGV 6057 and
TZA 4280 x ICG 6022 were significant (p<0.05) while, TZA 667 x ICGV 6057 and TZA 667 x
ICG 6022 were non-significant. The SCA effects for CLDS were significant (p<0.01) for all
crosses except TZA 4280 x ICGV 6057, TZA 4261 x ICGV 6022 and TZA 667 x ICGV 6057
which had non-significant and negative SCA, TZA 4280 x ICGV 6022, TZA 4261 x ICGV 6057,
and TZA 667 x ICGV 6022 which had non-significant and positive SCA. The SCA effects for
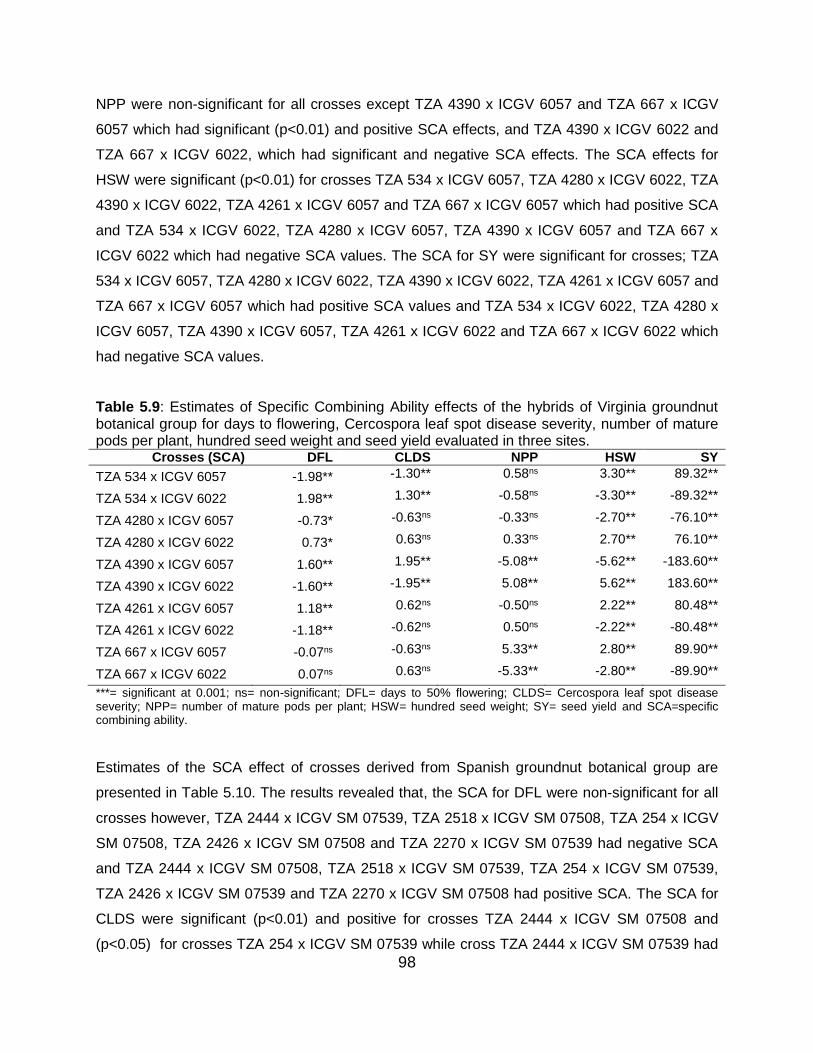
98
NPP were non-significant for all crosses except TZA 4390 x ICGV 6057 and TZA 667 x ICGV
6057 which had significant (p<0.01) and positive SCA effects, and TZA 4390 x ICGV 6022 and
TZA 667 x ICGV 6022, which had significant and negative SCA effects. The SCA effects for
HSW were significant (p<0.01) for crosses TZA 534 x ICGV 6057, TZA 4280 x ICGV 6022, TZA
4390 x ICGV 6022, TZA 4261 x ICGV 6057 and TZA 667 x ICGV 6057 which had positive SCA
and TZA 534 x ICGV 6022, TZA 4280 x ICGV 6057, TZA 4390 x ICGV 6057 and TZA 667 x
ICGV 6022 which had negative SCA values. The SCA for SY were significant for crosses; TZA
534 x ICGV 6057, TZA 4280 x ICGV 6022, TZA 4390 x ICGV 6022, TZA 4261 x ICGV 6057 and
TZA 667 x ICGV 6057 which had positive SCA values and TZA 534 x ICGV 6022, TZA 4280 x
ICGV 6057, TZA 4390 x ICGV 6057, TZA 4261 x ICGV 6022 and TZA 667 x ICGV 6022 which
had negative SCA values.
Table 5.9: Estimates of Specific Combining Ability effects of the hybrids of Virginia groundnut botanical group for days to flowering, Cercospora leaf spot disease severity, number of mature pods per plant, hundred seed weight and seed yield evaluated in three sites.
Crosses (SCA) DFL CLDS NPP HSW SY
TZA 534 x ICGV 6057 -1.98** -1.30** 0.58ns 3.30** 89.32**
TZA 534 x ICGV 6022 1.98** 1.30** -0.58ns -3.30** -89.32**
TZA 4280 x ICGV 6057 -0.73* -0.63ns -0.33ns -2.70** -76.10**
TZA 4280 x ICGV 6022 0.73* 0.63ns 0.33ns 2.70** 76.10**
TZA 4390 x ICGV 6057 1.60** 1.95** -5.08** -5.62** -183.60**
TZA 4390 x ICGV 6022 -1.60** -1.95** 5.08** 5.62** 183.60**
TZA 4261 x ICGV 6057 1.18** 0.62ns -0.50ns 2.22** 80.48**
TZA 4261 x ICGV 6022 -1.18** -0.62ns 0.50ns -2.22** -80.48**
TZA 667 x ICGV 6057 -0.07ns -0.63ns 5.33** 2.80** 89.90**
TZA 667 x ICGV 6022 0.07ns 0.63ns -5.33** -2.80** -89.90**
***= significant at 0.001; ns= non-significant; DFL= days to 50% flowering; CLDS= Cercospora leaf spot disease severity; NPP= number of mature pods per plant; HSW= hundred seed weight; SY= seed yield and SCA=specific combining ability.
Estimates of the SCA effect of crosses derived from Spanish groundnut botanical group are
presented in Table 5.10. The results revealed that, the SCA for DFL were non-significant for all
crosses however, TZA 2444 x ICGV SM 07539, TZA 2518 x ICGV SM 07508, TZA 254 x ICGV
SM 07508, TZA 2426 x ICGV SM 07508 and TZA 2270 x ICGV SM 07539 had negative SCA
and TZA 2444 x ICGV SM 07508, TZA 2518 x ICGV SM 07539, TZA 254 x ICGV SM 07539,
TZA 2426 x ICGV SM 07539 and TZA 2270 x ICGV SM 07508 had positive SCA. The SCA for
CLDS were significant (p<0.01) and positive for crosses TZA 2444 x ICGV SM 07508 and
(p<0.05) for crosses TZA 254 x ICGV SM 07539 while cross TZA 2444 x ICGV SM 07539 had

99
significant (p< 0.01) and negative SCA and TZA 254 x ICGV SM 07508 had significant (p<0.05)
and negative SCA, respectively. The SCA for NPP were significant (P< 0.01) and positive for
crosses TZA 2444 x ICGV SM 07539, TZA 2518 x ICGV SM 07508 and (p<0.05) for crosses
TZA 254 x ICGV SM 07508 and significant (p<0.01) negative for crosses TZA 2444 x ICGV SM
07508, TZA 2518 x ICGV SM 07539 and (p<0.05) for crosses TZA 254 x ICGV SM 07539. The
SCA for HSW were significant (p<0.01) and positive for crosses TZA 2444 x ICGV SM 07539,
TZA 254 x ICVG SM 07508 and TZA 2426 x ICGV SM 07508 and negative for crosses TZA
2444 x ICGV SM 07508, TZA 254 x ICGV SM 07539, TZA 2426 x ICGV SM 07539 and TZA
2270 x ICGV SM 07539. The SCA for SY were significant (p<0.01) and positive for crosses TZA
2444 x ICGV SM 07539, TZA 2518 x ICGV SM 07508, TZA 254 x ICGV SM 07508, TZA 2426 x
ICGV SM 07539 and TZA 2270 x ICGV SM 07539 and negative for crosses TZA 2444 x ICGV
SM 07508, TZA 2518 x ICGV SM 07539, TZA 254 x ICGV SM 07539, TZA 2426 x ICGV SM
07508 and TZA 2270 x ICGV SM 07508.
Table 5.10: Estimates of Specific Combining Ability effects of the hybrids of Spanish groundnut botanical group for days to flowering, Cercospora leaf spot disease severity, number of mature pods per plant, hundred seed weight and seed yield in three sites.
SCA DFL CLDS NPP HSW SY
TZA 2444 x ICGV SM 07539 -0.77ns -1.20** 3.37** 7.60** 78.72**
TZA 2444 x ICGV SM 07508 0.77ns 1.20** -3.37** -7.60** -78.72**
TZA 2518 x ICGV SM 07539 0.73ns 0.30 ns -1.97** -0.07ns -84.78**
TZA 2518 x ICGV SM 07508 -0.73ns -0.30 ns 1.97** 0.07ns 84.78**
TZA 254 x ICGV SM 07539 0.57ns 0.80* -1.38* -1.48** -95.12**
TZA 254 x ICGV SM 07508 -0.57ns -0.80* 1.38* 1.48** 95.12**
TZA 2426 x ICGV SM 07539 0.07ns -0.20 ns 0.70 ns -1.82** 52.05**
TZA 2426 x ICGV SM 07508 -0.07ns 0.20 ns -0.70 ns 1.82** -52.05**
TZA 2270 x ICGV SM 07539 -0.60ns 0.30 ns -0.72 ns -4.23** 49.13**
TZA 2270 x ICGV SM 07508 0.60ns -0.30 ns 0.72 ns 4.23** -49.13**
***= significant at 0.001; ns= non-significant; DFL= days to 50% flowering; CLDS= Cercospora leaf spot disease severity; NPP= number of mature pods per plant; HSW= hundred seed weight; SY= seed yield and SCA=specific combining ability.
The estimates of the genetic variance components and heritability for the Valencia botanical
group are presented in Table 5.11. The additive genetic variance was larger than the
dominance genetic variance and the broad sense heritability was higher than the narrow sense
heritability in CLDS, NPP and SY, while the narrow sense heritability was higher in DFL and
HSW.

100
Table 5.11: Estimates of the variance components and heritability for yield and its related traits and Cercospora leaf spot disease score for the Valencia groundnut botanical group.
Parameter DFL CLDS NPP HSW SY
Additive genetic variance 3.209 0.959 3.909 13.563 9591.534
Dominance genetic variance 0.375 0.016 3.419 -0.280 637.064
Phenotypic variance 5.6244 2.2707 9.556 15.0308 10233.1268
H2 0.6372 0.4294 0.7668 0.8837 0.9996
h2 0.5705 0.4223 0.4091 0.9023 0.9373
DFL=days to 50% flowering; CLDS = Cercospora leaf spot disease severity; NPP= number of pods per plant; HSW= hundred seed weight; SY= seed yield; Sed GCAF=Standard error of difference of females’ general combining ability; Sed GCAM= Standard error of difference of males’ general combining ability; Sed SCA= Standard error of difference of specific combining ability; H2 = broad sense heritability and h2 = narrow sense heritability.
The estimates of genetic variance components and heritability for the Virginia botanical group
are presented in Table 5.12. The dominance genetic variance was larger than the additive
genetic variance and the broad sense heritability was higher than the narrow sense heritability
for all the traits.
Table 5.12: Estimates of the variance components and heritability for yield and its related traits and Cercospora leaf spot disease score for Virginia botanical group.
Parameter DFL CLDS NPP HSW SY
Additive genetic variance 2.195 2.205 1.667 2.113 522.346
Dominance genetic variance 4.126 3.230 27.093 31.114 31016.942
Phenotypic variance 7.2472 6.4357 30.6862 34.3115 31543.2192
H2 0.8722 0.8445 0.9372 0.9684 0.9998
h2 0.3029 0.3426 0.0543 0.0616 0.01656
DFL=days to 50% flowering; CLDS= Cercospora leaf spot disease severity; NPP= number of pods per plant; HSW= hundred seed weight; SY= seed yield; Sed GCAF=Standard error of difference of females’ general combining ability; Sed GCAM= Standard error of difference of males’ general combining ability; Sed SCA= Standard error of difference of specific combining ability; H2 = broad sense heritability and h2 = narrow sense heritability.
The estimates of genetic variance components and heritability for the Spanish botanical group
are presented in table 5.13. The dominance genetic variance was larger than the additive
genetic variance, while the broad sense heritability was higher than the narrow sense heritability
for all the traits.

101
Table 5.13: Estimates of the variance components and heritability for yield and its related traits and Cercospora leaf spot disease score for Spanish botanical group.
Parameter DFL CLDS NPP HSW SY
Additive genetic variance 0.606 0.362 0.818 8.076 1207.421
Dominance genetic variance 0.626 1.031 8.729 40.306 13775.667
Phenotypic variance 2.8428 2.4438 11.3004 50.0150 14987.2092
H2 0.4333 0.5700 0.8448 0.9673 0.9997
h2 0.2132 0.1481 0.0724 0.1615 0.0806
DFL=days to 50% flowering; CLDS = Cercospora leaf spot disease severity; NPP= number of pods per plant; HSW= hundred seed weight; SY= seed yield; Sed GCAF=Standard error of difference of females’ general combining ability; Sed GCAM= Standard error of difference of males’ general combining ability; Sed SCA= Standard error of difference of specific combining ability; H2 = broad sense heritability and h2 = narrow sense heritability.
5.6 Discussion
5.6.1 Combined analysis of variance for the different botanical groups
The significant difference of mean squares of sites, genotypes and interaction (Table 5.2-5.4)
for the studied traits of the Valencia, Virginia and Spanish botanical groups revealed the
responses of the genotypes across the testing sites were different and there were existence of
genetic variability among genotypes, which can be exploited in breeding programmes. The
percentage contribution of sum of square of females were greater than that of males and of the
interaction effects of females to males, for all traits studied, indicating that additive genetic
variance played a preponderant role in the inheritance of traits studied viz DFL, CLDS, NPP,
HSW and SY. Therefore, hybridization and or selection in early generation may be
recommended for breeding. These findings conform with earlier reports by Ali et al. (1995) who
observed that the magnitude of GCA was greater than SCA for all the traits recorded, indicating
that additive genetic variance was more important than non-additive genetic variance.
5.6.2 General combining ability effects of parents for Valencia botanical group
The GCA effects for Valencia female parents (Table 5.5) revealed that, genotype Local Makulu
and TZA 121 had significant negative GCA for DFL; the parents are good combiners for
earliness because negative GCA value will reduce number of days to maturity of the cross
derived from such parents. The parents are also good combiners for CLD resistance because
the negative GCA value indicates high resistance to the disease. Female parent TZA 3786 had
significant positive GCA for HSW and SY, which was in a desirable direction; therefore, the

102
parent is a good combiner in breeding for yield improvement. Genotypes TZA 157 and TZA
2498 had significant positive GCA for DFL and CLDS and significant negative GCA for NPP,
HSW and SY, these parents are not good combiners because positive GCA for DFL and CLDS
will lead to increased number of days to maturity and susceptibility to CLD. General combining
ability for male parents was significant and positive for NPP, HSW and SY, and significant
negative for DFL and CLD in parent ICGV SM 96714. The GCA values were in a desirable
direction; therefore, this male parent is a good combiner. On the other hand, it was significantly
negative in Kakoma for NPP, HSW and SY and positive for DFL and CLDS; therefore, Kakoma
was not a good general combiner.
5.6.3 General combining ability effects of parents for Virginia botanical group
Genotypes TZA 4280 and TZA 4390 had the lowest GCA values for DFL in a desirable direction
(Table 5.6). Therefore, these parents are good general combiners when breeding for early
maturity. Early maturity is a desirable trait for groundnuts because they can easily escape harsh
environmental conditions such as drought and diseases including CLD. All female parents had
low significantly positive GCA effects for CLDS except genotype TZA 4280. Low and negative
GCA effects are desirable for disease resistance breeding. Therefore, genotype TZA 4280 is a
good combiner for CLD resistance. Positive GCA is desirable for breeding of high NPP;
therefore, genotype TZA 4280, which had positive GCA is a good general combiner. Farmers in
Tanzania prefer high yielding groundnut varieties for both food security and income earning.
Genotypes TZA 4390 and TZA 4261 had negative GCA effects for HSW, implying that using
these genotypes as parents in breeding for yield improvement reduce seed weight of the
crosses derived from them and consequently lower the overall yield. On the other hand, the
female parent TZA 4280, which had positive significant GCA effects for seed yield is a good
general combiner for yield improvement breeding programmes. Significant and negative GCA
values for CLDS and positive GCA for seed yield were observed in male parent ICGV 6022,
which could be useful for resistance breeding or direct production.
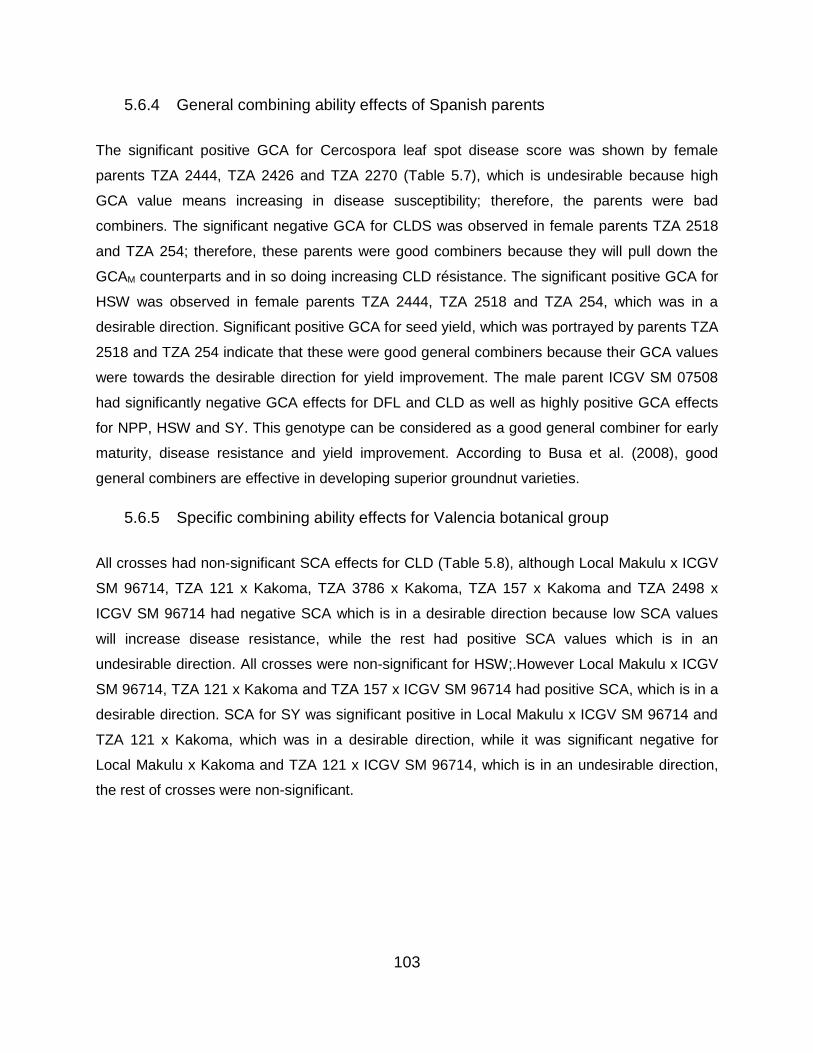
103
5.6.4 General combining ability effects of Spanish parents
The significant positive GCA for Cercospora leaf spot disease score was shown by female
parents TZA 2444, TZA 2426 and TZA 2270 (Table 5.7), which is undesirable because high
GCA value means increasing in disease susceptibility; therefore, the parents were bad
combiners. The significant negative GCA for CLDS was observed in female parents TZA 2518
and TZA 254; therefore, these parents were good combiners because they will pull down the
GCAM counterparts and in so doing increasing CLD résistance. The significant positive GCA for
HSW was observed in female parents TZA 2444, TZA 2518 and TZA 254, which was in a
desirable direction. Significant positive GCA for seed yield, which was portrayed by parents TZA
2518 and TZA 254 indicate that these were good general combiners because their GCA values
were towards the desirable direction for yield improvement. The male parent ICGV SM 07508
had significantly negative GCA effects for DFL and CLD as well as highly positive GCA effects
for NPP, HSW and SY. This genotype can be considered as a good general combiner for early
maturity, disease resistance and yield improvement. According to Busa et al. (2008), good
general combiners are effective in developing superior groundnut varieties.
5.6.5 Specific combining ability effects for Valencia botanical group
All crosses had non-significant SCA effects for CLD (Table 5.8), although Local Makulu x ICGV
SM 96714, TZA 121 x Kakoma, TZA 3786 x Kakoma, TZA 157 x Kakoma and TZA 2498 x
ICGV SM 96714 had negative SCA which is in a desirable direction because low SCA values
will increase disease resistance, while the rest had positive SCA values which is in an
undesirable direction. All crosses were non-significant for HSW;.However Local Makulu x ICGV
SM 96714, TZA 121 x Kakoma and TZA 157 x ICGV SM 96714 had positive SCA, which is in a
desirable direction. SCA for SY was significant positive in Local Makulu x ICGV SM 96714 and
TZA 121 x Kakoma, which was in a desirable direction, while it was significant negative for
Local Makulu x Kakoma and TZA 121 x ICGV SM 96714, which is in an undesirable direction,
the rest of crosses were non-significant.
104
5.6.6 Specific combining ability effects for Virginia botanical group
The significant positive SCA effects for Cercospora leaf spot disease score was observed in
crosses TZA 534 x ICGV 6022 and TZA 4390 x ICGV 6057, while it was significantly negative in
crosses TZA 534 x ICGV 6057, TZA 4280 x ICGV 6057 and TZA 4390 x ICGV 6022, which is in
the desirable direction (Table 5.9). The significant positive SCA effects for the number of mature
pods per plant was exhibited by crosses TZA 4390 x ICGV 6022 and TZA 667 x ICGV 6057,
therefore, were considered to be superior as they recorded positively significant SCA effect for
number of pods per plant. A significant positive SCA effects for hundred seed weight was
portrayed by crosses TZA 534 x ICGV 6057, TZA 4280 x ICGV 6022, TZA 4390 x ICGV 6022,
TZA 4261 x ICGV 6057 and TZA 667 x ICGV 6057, which were in a desirable direction.
Significant positive SCA effects for seed yield were observed on crosses TZA 534 x ICGV 6057,
TZA 4280 x ICGV 6022, TZA 4390 x ICGV 6022, TZA 4261 x ICGV 6057 and TZA 667 x ICGV
6057, which were in a desirable direction.
5.6.7 Specific combining ability for Spanish groundnut botanical group
The significant negative SCA for Cercospora leaf spot disease score was portrayed by cross
TZA 2444 x ICGV SM 07539 and significant negative by cross TZA 254 x ICGV SM 07508,
which was in a desirable direction (Table 5.10). However, crosses TZA 2518 x ICGV SM 07508,
TZA 2426 x ICGV SM 07539 and TZA 2270 x ICGV SM 07508 were non-significant but with
negative SCA value for Cercospora leaf spot disease score which was in a desirable direction.
The low and negative SCA value is desirable for disease resistance breeding because as it
becomes low the level of disease resistance increases. The significant positive SCA for hundred
seed weight was observed in crosses TZA 2444 x ICGV SM 07539, TZA 2270 x ICGV SM
07508, TZA 2426 x ICGV SM 07508 and TZA 254 x ICGV SM 07508; therefore, these crosses
are potential high yielding genotypes. The cross TZA 2518 x ICGV SM 07508 was non-
significant but with positive SCA, which is a desirable value for high yielding; therefore is a
potential candidate for further breeding programme. Significant positive SCA for seed yield was
exhibited by crosses TZA 254 x ICGV SM 07508, TZA 2518 x ICGV SM 07508, TZA 2444 x
ICGV SM 07539, TZA 2426 x ICGV SM 07539 and TZA 2270 x ICGV SM 07539, which is a
desirable trait to farmers and therefore can be useful in their fields because they can tolerate
Cercospora leaf spot disease and yield high. These crosses can be advanced for further
selection to obtain high yielding segregants in the segregating generation (Manivannan et al.,
2008).

105
5.6.8 Heritability for yield, yield components and Cercospora leaf spot disease in
different groundnut botanical groups
Significant estimates of genetic variance components and heritability presented in Tables 5.11,
5.12 and 5.13 for Valencia, Virginia and Spanish groundnut botanical groups respectively
revealed that, additive genetic variance were larger than dominance genetic variance in
Valencia group. However, in Virginia and Spanish group dominance genetic variance was
larger than additive genetic variance. Broad sense heritability was higher than narrow sense
heritability on DFL, CLDS, NPP, HSW and SY for all the three botanical groups. Implying that
these traits can be transmitted from parents to progenies through hybridization. Low narrow
sense heritability observed in all the crosses were due to larger dominance or environmental
effects on the trait than the additive gene effects. The increase in magnitude of dominance
component of the variance implies a decrease in narrow sense heritability (Kearsey and Pooni,
1996). Thus, selection of genotypes from initial generations for resistance to CLD may be
difficult due to high influence of dominance effects in the expression of the total phenotypic
variance (Kormsa-art et al., 2002). For this reason, selection based on individual plants for CLD
resistance would be more effective when carried out on later generations. In this way, the
occurrence of heterozygotes is reduced and the available additive variance for selection is
increased, thereby providing higher possibilities of selection gains for the trait. Jinks and Pooni
(1984) reported that if selection were delayed there would be an increase in narrow sense
heritability and hence, increase in response to selection. However, if selection is based on early
generations for characters with low narrow sense heritability estimates, Oeveren and Stam
(1993) and Kearsey and Pooni (1996) recommended that bulk and single seed descent (SSD)
breeding methods, followed by selection on family mean can ensure high genetic gain among
the progenies.
5.7 Conclusion
The analysis of variance across sites revealed significant differences among genotypes for both
yield and its components, and CLDS for all the three groundnut botanical groups (Valencia,
Virginia and Spanish). Significant differences were detected among parents, crosses, parents x
crosses interaction for CLD resistance, SY and its traits. These sources of variations had
significant interactions with the testing sites for DFL, CLDS, NPP, HSW and SY. The
significance of the mean squares of the GCA effects of females and males, and SCA effects of

106
female x male indicated the importance of both additive and non-additive gene effects for
inheritance of CLD resistance and seed yield in all groundnut botanical groups respectively.
Dominance genetic variance was larger than additive genetic variance, and broad sense was
higher in magnitude than narrow sense heritability, respectively, in DFL, CLDS, NPP, HSW and
SY; indicating that these traits can be transmitted to progenies through hybridization and
selection.

107
References
Ali, N., Wynne, J.C. and Murphy, J.P. (1995). Combining Ability Estimates for Early Maturity and
Agronomic Traits in Peanut (Arachis hypogaea L.). Pakistan Journal of Botany 27:111-119.
BhailalbhaI, N.D. (2012). Heterosis and combining ability study for yield and its components in
groundnut (Arachis hypogaea L.). A thesis submitted to the Anand Agricultural University
for the award of the degree of Master of Science (Agriculture) in Genetics and Plant
Breeding.
Burton, G.W. (1952). Quantitative inheritance in grasses. Proceeding of 6th International
Grassland Congress. Pennsylvania State College, PA, USA. 1:227-83.
Busa, N.G., Dhaduk, L.K. and Vachhani, J.H. (2008). Combining Ability Analysis in Groundnut.
Journal of Bioscience Reporter 6:357-362.
Grichar, W.J., Besler, B.A. and Jaks, A.J. (1998). Peanut (Arachis hypogaea L.) Cultivar
Response to Leaf Spot Disease Development Under Four Disease Management
Programs. Peanut Science 25:35-39.
Gupta, R.P., Vachhani, J.H., Kachhadia, V.H., Vaddoria, M.A. and Reddy, P. (2015). Genetic
Variability and Heritability Studies in Virginia Groundnut (Arachis hypogaea L.). Journal of
Plant Breeding 6:253-256.
Husted, L. (1936). Cytological Studies of the Peanut Arachis II. Chromosome Number,
Morphology and Behavior and Their Application to the Origin of Cultivated Forms.
Cytologia 7:396-423.
Jinks, J.L. and Poon, H.S. (1984). Comparison of Inbred Lines Produced by Single Descent and
Pedigree Inbreeding. Heredity 53:299-308.
Kawakami, J. (1930). Chromosome numbers in leguminosae. Botany Magazine (Tokyo) 44:319-
328.
Kearsey, J.M. and Pooni, S.H. (1996). The genetic analysis of quantitative traits. 1st Edition.
Chapman and Hall, London UK.
108
Kempthorne, O. (1957). An introduction to genetic statistics. John Wiley and Sons Inc.,
Chapman and Hall Ltd. London, UK.
Kormsa-art, T., Jogloy, S., Wongkaew, S. and Lertrat, K. (2002). Heritabilities and Correlations
for Late Leaf Spot Resistance and Agronomic Traits in Groundnut (Arachis hypogaea L.)
Songklanakarin Journal of Science and Technology 24:555-560.
Kushman, L.J. and Beattie, J.H. (1946). Natural Hybridization in Peanut. Journal of American
Society of Agronomy 38:755-756.
Manivannan, N., Muralidharan, V. and Mothilal, A. (2008). Combining Ability Analysis in
Groundnut (Arachis hypogaea L.). Madras Agricultural Journal 95:14-17.
Oeveren, A.J.V. and Stam, P. (1993). Comparative Simulation Studies on the Effect of Selection
for Quantitative Traits in Autogamous Crops: Early Selection versus Single Seed Descent.
Heredity 69:342-351.
Panse, V.G. and Sukhatme, P.V. (1985). Statistical methods for agricultural workers. 3rd Edition,
I.C.A.R., New Delhi, India.
Patel, J.S., John, C.M. and Seshadri, C.R. (1936). The inheritance of character in groundnut
(Arachis hypogaea L.). Proceedings of Indian Academic and Science 3:214-223.
Payne, R.W., Murray, D.A. and Harding, S.A. (2011). An introduction to the GenStat command
language (14th Edition). VSN International, Hemel Hempstead, UK.
Raman, V.S. (1959). Studies in the genus Arachis VI. Investigation on 30 Chromosomes Inter-
specific Hybrids. Indian Oilseeds Journal 3:157-161.
Raman, V.S. (1965). Progress of Cytogenetic Research in Madras State to Advances in
Agricultural Sciences and Their Applications. Madras Agricultural Journal, Coimbatore Pp.
122-143.
Rojas, B.A. and Sprague, G.F. (1952). A Comparison of Variance Components in Corn Yield
Trails. III. General and Specific Combining Ability and Their Interaction with Location and
Years. Agronomy Journal 44:462-466.
109
Sprague, G.F. and Federer, W.T. (1952). A Comparison of Variance Components in Corn Yield
Trails. II. Error, Year x Variety, Location x Variety and Variance Components. Agronomy
Journal 44:535-554.
Sprague, G.F. and Tatum, L.A. (1942). General versus Specific Combining Ability in Single
Crosses in Corn. Journal of American Society of Agronomy 34:923-932.
Subrahmanyam, P., McDonald, D., Waliyar, F., Reddy, L.J., Nigam, S.N., Gibbons, R.W.,
Ramanatha Rao, V., Singh, A.K., Pande, S., Reddy, P.M. and Subba Rao, P.V. (1995).
Screening methods and sources of resistance to rust and late leaf spot of groundnut.
Information Bulletin no. 47. ICRISAT, Patancheru 502 324, Andhra Pradesh, India. Pp. 1-
20.

110
Chapter 6: Performance of single cross parents versus double
crosses and checks among groundnut (Arachis hypogaea L.) intra
botanical groups in multi-location trials
Abstract
Lack of high yielding groundnut cultivars tolerant to Cercospora leaf spot disease (CLD) and
stable across different environments is one of the challenges to groundnut production by
smallholder farmers in Tanzania. This makes selection of adaptable high yielding stable
varieties under the different agro-ecological zones before release a very important part of the
breeding program as this has an impact on the adoption and productivity of the cultivar. The
objectives of this study were to evaluate and select genotypes that are tolerant to CLD, high
yielding and identify environments that can be used for selection. A total of 24 groundnut
genotypes comprising of six double cross population, twelve single cross parents and six
checks from the three botanical groups (Valencia, Virginia and Spanish) were evaluated over six
environments (viz Tumbi in Tabora region, Mlali, Ilindi and Hombolo in Dodoma region, Njoro in
Manyara region and Ikhanoda in Singida region in Tanzania in the 2016/17 cropping season.
The experiment was laid out in a 6x4 alpha lattice design replicated twice. Additive main effect
and multiplicative interaction (AMMI) model was used in analysis. The study result revealed
that, Tumbi (E1) was the most discriminating environment followed by Ilindi (E3), Mlali (E2),
Hombolo (E4), Njoro (E5) and Ikhanoda (E6) respectively. The Hombolo (E4), Njoro (E5) and
Ikhanoda (E6) environments showed a high correlation, therefore, indirect selection can be
applied across the environments. The existence of such unique correlation among test
environments has the advantage of reducing the number of sites used for evaluation and thus
reducing cost of evaluating the genotypes. Using the first and second interaction principal
component axis (IPCA1 and IPCA 2) genotype G2, G5, G11, G7, G3 and G8 was identified as
the best performing genotypes however, G7 had relative stability and adaptability across the
testing environments. These crosses will be advanced through selfing and selection of CLD
tolerant progenies that are yielding high.
Key words: AMMI, Cercospora leaf spot disease, Environments, Groundnuts, IPCA1, IPCA2,
Stability, Adaptability.
111
6.1 Introduction
The interaction between the performance of the genotype as determined by its genetic
composition and the environment can greatly influence the performance of the genotype (Yan
and Wu, 2008). Testing of genotypes across different locations over years and seasons has
been used by many breeders to evaluate the stability of genotypes across different
environments. This helps to develop breeding strategies that can assist in breeding superior
cultivars for the target environments (Kang, 2002). Over the years, many terminologies have
been used to refer to the genotype by environment interaction (GEI) analysis, for instance,
specific adaptation, stability studies, and mega environments (Yan and Hunt, 2002). For each
specific environment the mean genotype`s performance and stability over different
environments have been used to evaluate the genotypes and mega environments were
classified and identified (Casanoves et al., 2005).
The best varieties are those with good stability in terms of performance across a wide range of
different environments, they exhibit small GEI effects as opposed to the unstable varieties with a
large GEI effects. Such varieties make the breeder`s work of selecting the best varieties for the
farmers very difficult (Yusuf, 2009). The performance of any cultivar is a combination of the
cultivar and the environment in which it is grown over seasons (Bernardo, 2002), and the
interaction that exists between the genotype and the environments GEI (Hallauer et al., 2010).
Other factors that play part in the GEI and can be source of the variation observed includes
temperature, duration of the growing season, lack of enough water, sub-soil pH, rainfall and
social economic factors (Bänziger et al., 2006). Other factors include the biotic factors (Butron et
al., 2004).
In this study, the stability and adaptability of the genotypes were analysed using additive main
effects and multiplicative interaction (AMMI) model (Rad et al., 2013) in multi-environment
(MET) two-way data matrices. The GEI has been the main area of focus in AMMI analysis,
leaving out the component of the effect of the genotype. AMMI model are useful for
understanding GEI (Kaya et al., 2002).
112
6.2 Materials and methods
6.2.1 Study site and parental selection
The selection of F1 hybrids was done based on evaluation of single cross hybrids for their
combining ability, heritability and gene action governing the inheritance of yield, yield related
traits and CLD resistance conducted at three sites in the Dodoma region (Chapter five). The two
best performing F1 hybrids were selected from each botanical group based on CLD tolerance
and farmers’ preferred traits, and were inter-crossed to produce double cross populations.
Thereafter, the six heterogametic double cross populations (i.e. with reciprocals), the twelve F1
hybrids and six checks were evaluated in six locations viz Ilindi, Mlali and Hombolo in Dodoma
region, Ikhanoda in Singida region, Njoro in Manyara region and Tumbi in Tabora region, to
determine GEI of the double crosses compared with their single cross parents and checks and
to select populations with improved CLD tolerance.
6.2.2 Experimental design and field establishment
The twelve F1 hybrids, six standard checks and six double cross populations from the three
groundnut botanical groups (i.e. Valencia, Virginia and Spanish) as shown in Table 6.1 were
planted in six locations, viz Ilindi (60 1’ 0’’ S, 350 34’ 0’’ E) on 8th January, 2017, Mlali (60 17.791’
S, 360 44.938’ E) on 17th January, 2017 and Hombolo (50 54’ S, 350 57’ E) on 10th January,
2017 in the Dodoma region, Ikhanoda (60 37.10’ S, 340 57. 5’ E) on 23rd December, 2016 in
Singida region, Njoro (50 15.237’ S, 360 28.454’ E) on 1st February, 2017 in the Manyara region
and Tumbi (50 07.32’ S, 320 6.913’ E) on 30th November, 2016 in the Tabora region. The
experiment was laid out in an alpha lattice design (6 x 4) with two replications in one cropping
season namely, 2016/17. The double crosses were planted in the field plots of 1.5 x 1 m size
with inter-row and intra-row spacing of 0.5 and 0.1 m respectively. Each plot had three rows
each with 10 plants. Other cultural practices were done as recommended. The crossing
schemes of single crosses to obtain double crosses and their reciprocals are summarized in
table 6.2a and 6.2b.
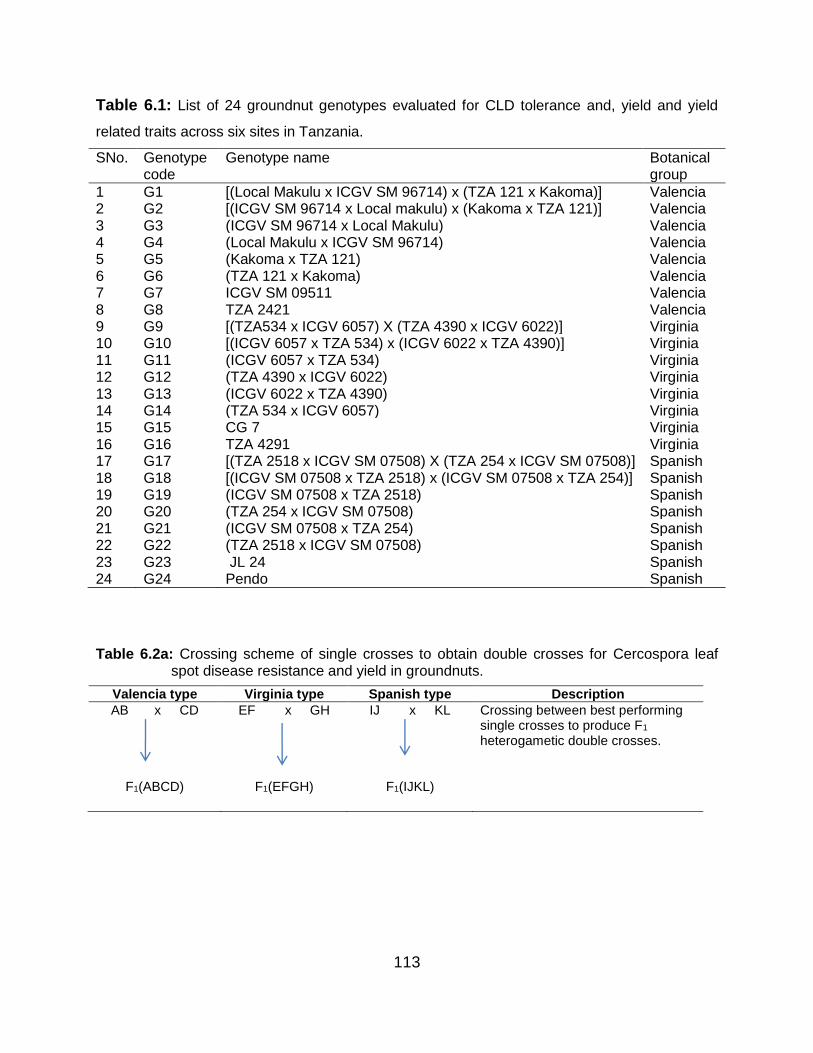
113
Table 6.1: List of 24 groundnut genotypes evaluated for CLD tolerance and, yield and yield
related traits across six sites in Tanzania.
SNo. Genotype code
Genotype name Botanical group
1 G1 [(Local Makulu x ICGV SM 96714) x (TZA 121 x Kakoma)] Valencia 2 G2 [(ICGV SM 96714 x Local makulu) x (Kakoma x TZA 121)] Valencia 3 G3 (ICGV SM 96714 x Local Makulu) Valencia 4 G4 (Local Makulu x ICGV SM 96714) Valencia 5 G5 (Kakoma x TZA 121) Valencia 6 G6 (TZA 121 x Kakoma) Valencia 7 G7 ICGV SM 09511 Valencia 8 G8 TZA 2421 Valencia 9 G9 [(TZA534 x ICGV 6057) X (TZA 4390 x ICGV 6022)] Virginia 10 G10 [(ICGV 6057 x TZA 534) x (ICGV 6022 x TZA 4390)] Virginia 11 G11 (ICGV 6057 x TZA 534) Virginia 12 G12 (TZA 4390 x ICGV 6022) Virginia 13 G13 (ICGV 6022 x TZA 4390) Virginia 14 G14 (TZA 534 x ICGV 6057) Virginia 15 G15 CG 7 Virginia 16 G16 TZA 4291 Virginia 17 G17 [(TZA 2518 x ICGV SM 07508) X (TZA 254 x ICGV SM 07508)] Spanish 18 G18 [(ICGV SM 07508 x TZA 2518) x (ICGV SM 07508 x TZA 254)] Spanish 19 G19 (ICGV SM 07508 x TZA 2518) Spanish 20 G20 (TZA 254 x ICGV SM 07508) Spanish 21 G21 (ICGV SM 07508 x TZA 254) Spanish 22 G22 (TZA 2518 x ICGV SM 07508) Spanish 23 G23 JL 24 Spanish 24 G24 Pendo Spanish
Table 6.2a: Crossing scheme of single crosses to obtain double crosses for Cercospora leaf spot disease resistance and yield in groundnuts.
Valencia type Virginia type Spanish type Description
AB x CD
F1(ABCD)
EF x GH
F1(EFGH)
IJ x KL
F1(IJKL)
Crossing between best performing single crosses to produce F1 heterogametic double crosses.
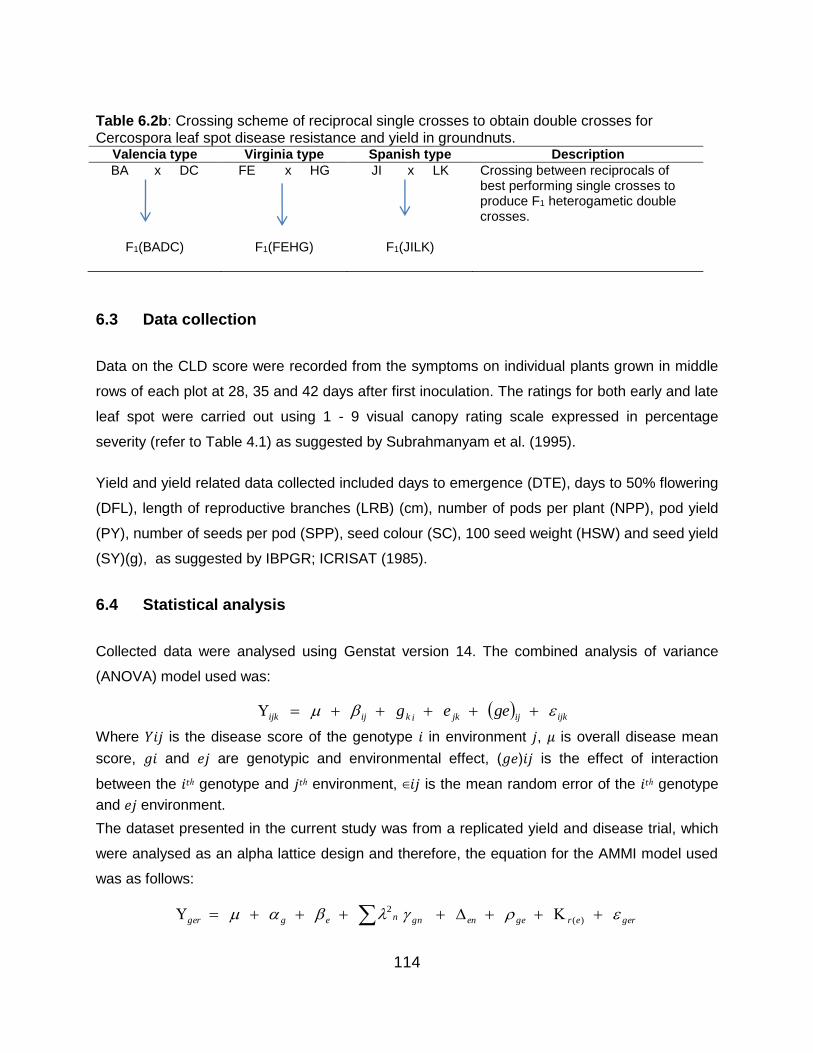
114
Table 6.2b: Crossing scheme of reciprocal single crosses to obtain double crosses for Cercospora leaf spot disease resistance and yield in groundnuts.
Valencia type Virginia type Spanish type Description
BA x DC
F1(BADC)
FE x HG
F1(FEHG)
JI x LK
F1(JILK)
Crossing between reciprocals of best performing single crosses to produce F1 heterogametic double crosses.
6.3 Data collection
Data on the CLD score were recorded from the symptoms on individual plants grown in middle
rows of each plot at 28, 35 and 42 days after first inoculation. The ratings for both early and late
leaf spot were carried out using 1 - 9 visual canopy rating scale expressed in percentage
severity (refer to Table 4.1) as suggested by Subrahmanyam et al. (1995).
Yield and yield related data collected included days to emergence (DTE), days to 50% flowering
(DFL), length of reproductive branches (LRB) (cm), number of pods per plant (NPP), pod yield
(PY), number of seeds per pod (SPP), seed colour (SC), 100 seed weight (HSW) and seed yield
(SY)(g), as suggested by IBPGR; ICRISAT (1985).
6.4 Statistical analysis
Collected data were analysed using Genstat version 14. The combined analysis of variance
(ANOVA) model used was:
ijkijjkikijijk geeg
Where 𝑌𝑖𝑗 is the disease score of the genotype 𝑖 in environment 𝑗, 𝜇 is overall disease mean
score, 𝑔𝑖 and 𝑒𝑗 are genotypic and environmental effect, (𝑔𝑒)𝑖𝑗 is the effect of interaction
between the 𝑖𝑡ℎ genotype and 𝑗𝑡ℎ environment, ∈𝑖𝑗 is the mean random error of the 𝑖𝑡ℎ genotype
and 𝑒𝑗 environment.
The dataset presented in the current study was from a replicated yield and disease trial, which
were analysed as an alpha lattice design and therefore, the equation for the AMMI model used
was as follows:
gerergeengnnegger )(
2
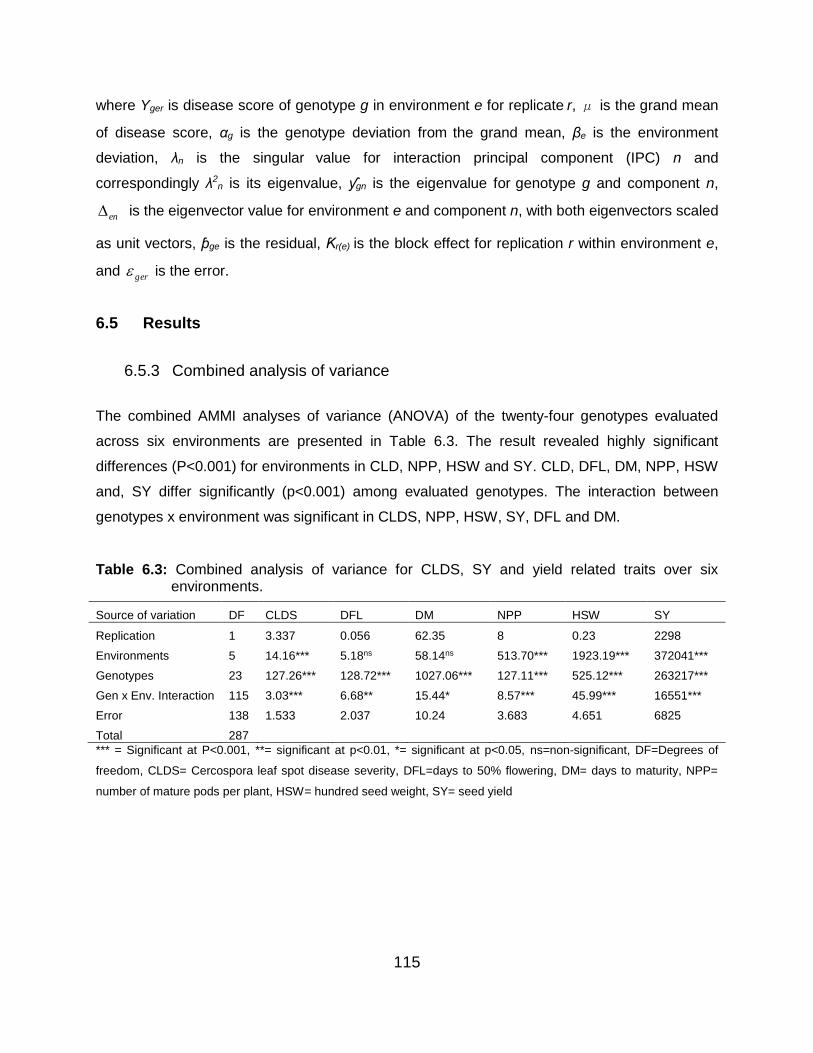
115
where Yger is disease score of genotype g in environment e for replicate r, μ is the grand mean
of disease score, αg is the genotype deviation from the grand mean, βe is the environment
deviation, λn is the singular value for interaction principal component (IPC) n and
correspondingly λ2n is its eigenvalue, ƴgn is the eigenvalue for genotype g and component n,
en is the eigenvector value for environment e and component n, with both eigenvectors scaled
as unit vectors, ƥge is the residual, Ƙr(e) is the block effect for replication r within environment e,
and ger is the error.
6.5 Results
6.5.3 Combined analysis of variance
The combined AMMI analyses of variance (ANOVA) of the twenty-four genotypes evaluated
across six environments are presented in Table 6.3. The result revealed highly significant
differences (P<0.001) for environments in CLD, NPP, HSW and SY. CLD, DFL, DM, NPP, HSW
and, SY differ significantly (p<0.001) among evaluated genotypes. The interaction between
genotypes x environment was significant in CLDS, NPP, HSW, SY, DFL and DM.
Table 6.3: Combined analysis of variance for CLDS, SY and yield related traits over six environments.
Source of variation DF CLDS DFL DM NPP HSW SY
Replication 1 3.337 0.056 62.35 8 0.23 2298
Environments 5 14.16*** 5.18ns 58.14ns 513.70*** 1923.19*** 372041***
Genotypes 23 127.26*** 128.72*** 1027.06*** 127.11*** 525.12*** 263217***
Gen x Env. Interaction 115 3.03*** 6.68** 15.44* 8.57*** 45.99*** 16551***
Error 138 1.533 2.037 10.24 3.683 4.651 6825
Total 287
*** = Significant at P<0.001, **= significant at p<0.01, *= significant at p<0.05, ns=non-significant, DF=Degrees of
freedom, CLDS= Cercospora leaf spot disease severity, DFL=days to 50% flowering, DM= days to maturity, NPP=
number of mature pods per plant, HSW= hundred seed weight, SY= seed yield
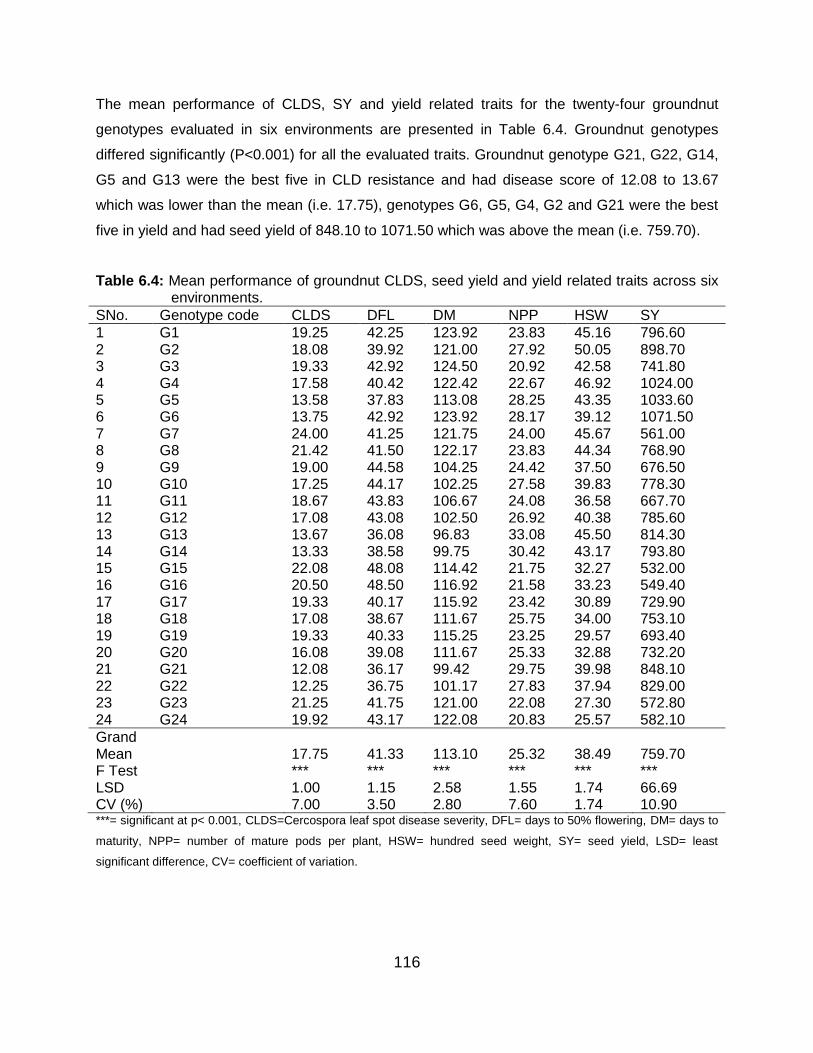
116
The mean performance of CLDS, SY and yield related traits for the twenty-four groundnut
genotypes evaluated in six environments are presented in Table 6.4. Groundnut genotypes
differed significantly (P<0.001) for all the evaluated traits. Groundnut genotype G21, G22, G14,
G5 and G13 were the best five in CLD resistance and had disease score of 12.08 to 13.67
which was lower than the mean (i.e. 17.75), genotypes G6, G5, G4, G2 and G21 were the best
five in yield and had seed yield of 848.10 to 1071.50 which was above the mean (i.e. 759.70).
Table 6.4: Mean performance of groundnut CLDS, seed yield and yield related traits across six environments.
SNo. Genotype code CLDS DFL DM NPP HSW SY
1 G1 19.25 42.25 123.92 23.83 45.16 796.60 2 G2 18.08 39.92 121.00 27.92 50.05 898.70 3 G3 19.33 42.92 124.50 20.92 42.58 741.80 4 G4 17.58 40.42 122.42 22.67 46.92 1024.00 5 G5 13.58 37.83 113.08 28.25 43.35 1033.60 6 G6 13.75 42.92 123.92 28.17 39.12 1071.50 7 G7 24.00 41.25 121.75 24.00 45.67 561.00 8 G8 21.42 41.50 122.17 23.83 44.34 768.90 9 G9 19.00 44.58 104.25 24.42 37.50 676.50 10 G10 17.25 44.17 102.25 27.58 39.83 778.30 11 G11 18.67 43.83 106.67 24.08 36.58 667.70 12 G12 17.08 43.08 102.50 26.92 40.38 785.60 13 G13 13.67 36.08 96.83 33.08 45.50 814.30 14 G14 13.33 38.58 99.75 30.42 43.17 793.80 15 G15 22.08 48.08 114.42 21.75 32.27 532.00 16 G16 20.50 48.50 116.92 21.58 33.23 549.40 17 G17 19.33 40.17 115.92 23.42 30.89 729.90 18 G18 17.08 38.67 111.67 25.75 34.00 753.10 19 G19 19.33 40.33 115.25 23.25 29.57 693.40 20 G20 16.08 39.08 111.67 25.33 32.88 732.20 21 G21 12.08 36.17 99.42 29.75 39.98 848.10 22 G22 12.25 36.75 101.17 27.83 37.94 829.00 23 G23 21.25 41.75 121.00 22.08 27.30 572.80 24 G24 19.92 43.17 122.08 20.83 25.57 582.10
Grand Mean
17.75 41.33 113.10 25.32 38.49 759.70
F Test *** *** *** *** *** *** LSD 1.00 1.15 2.58 1.55 1.74 66.69 CV (%) 7.00 3.50 2.80 7.60 1.74 10.90 ***= significant at p< 0.001, CLDS=Cercospora leaf spot disease severity, DFL= days to 50% flowering, DM= days to
maturity, NPP= number of mature pods per plant, HSW= hundred seed weight, SY= seed yield, LSD= least
significant difference, CV= coefficient of variation.

117
Additive main effect and multiplicative interaction analysis of variance for CLD severity
The AMMI analysis of variance is presented in Table 6.5. The analysis revealed that G, E and
GXE multiplicative terms were significant (p<0.001). The genotypes accounted for 61.67% of
the treatment sum of squares. The environments and the interaction between genotypes and
the environment however, contributed significantly lower to the variations and accounted for
18.95% and 19.38% of the treatment sum of squares, respectively. The mean square for the
first IPCA axis was larger than the residual indicating that, the partitioning of the interaction sum
of squares by AMMI was very effective. The first and second IPCAs captured 41.33% and
25.96% of the interaction sum of square and degree of freedom, respectively. The two IPCA
axes jointly accounted for 67.29% of the interaction SS, leaving 32.71% of the variation due to
G x E interaction in the residual.
Table 6.5: Analysis of variance based on the AMMI model for Cercospora leaf spot disease severity of 24 genotypes over six environments.
Source DF SS MS TVE GEE (%)
Cumulative (%)
Block 6 45985 7664 Treatments 143 9817519 68654*** Genotypes 23 6053995 263217*** 61.67
Environments 5 1860206 372041*** 18.95 Interactions 115 1903318 16551*** 19.38 IPCA 1 27 1098024 40668***
41.33 41.33
IPCA 2 25 549057 21962***
25.96 67.29
Residuals 63 256237 4067 Error 138 941857 6825 Total 287 10805361 37649 ***, ** Significant at 0.001 and 0.05 probability levels respectively, DF=Degrees of freedom, SS=Sum of squares,
MS=Mean Square, IPCA=Interaction Principal Component Axis, TVE = Total Variation explained, GEE = explained G
x E interaction.
The AMMI analysis data with IPCA1 and IPCA2 scores for the groundnut genotypes and the
test environments are shown in Tables 6.6 and 6.7, respectively. The IPCA scores were both
negative and positive for genotypes and environments. The Tumbi (E1) was the most
discriminating environment as it had the largest IPCA1 score and the longest vector, followed by
Ilindi (E3), Mlali (E2), Hombolo (E4), Njoro (E5) and Ikhanoda (E6) respectively (Table 6.7). The
environments Hombolo (E4), Njoro (E5) and Ikhanoda (E6) had high correlation (Figure 6.1)

118
Table 6.6: The IPCA1 and IPCA 2 scores for 24 groundnut genotypes evaluated in six evironments.
Genotype code Genotype name
Botanical group
IPCAg1 score
IPCAg2 score
G1 [(Local Makulu x ICGV SM 96714) x (TZA 121 x Kakoma)]
Valencia -7.23 -6.05
G2 [(ICGV SM 96714 x Local makulu) x (Kakoma x TZA 121)]
Valencia -10.44 2.57
G3 (ICGV SM 96714 x Local Makulu) Valencia -8.26 -4.47 G4 (Local Makulu x ICGV SM 96714) Valencia -5.05 -8.65 G5 (Kakoma x TZA 121) Valencia 3.67 -11.18 G6 (TZA 121 x Kakoma) Valencia
-3.93 -2.54 G7 ICGV SM 09511 Valencia -15.32 10.68 G8 TZA 2421 Valencia -1.02 -7.54 G9 [(TZA534 x ICGV 6057) X (TZA 4390 x ICGV 6022)] Virginia 0.27 -0.96
G10 [(ICGV 6057 x TZA 534) x (ICGV 6022 x TZA 4390)] Virginia 4.18 0.56 G11 (ICGV 6057 x TZA 534) Virginia 0.67 -0.85 G12 (TZA 4390 x ICGV 6022) Virginia 4.92 2.09 G13 (ICGV 6022 x TZA 4390) Virginia 6.25 1.95 G14 (TZA 534 x ICGV 6057) Virginia 5.79 1.79 G15 CG 7 Virginia 4.82 1.77 G16 TZA 4291 Virginia 4.04 1.79
G17 [(TZA 2518 x ICGV SM 07508) X (TZA 254 x ICGV SM 07508)]
Spanish -2.23 2.05
G18 [(ICGV SM 07508 x TZA 2518) x (ICGV SM 07508 x TZA 254)]
Spanish 2.09 -0.01
G19 (ICGV SM 07508 x TZA 2518) Spanish 1.91 1.07 G20 (TZA 254 x ICGV SM 07508) Spanish 2.47 1.80 G21 (ICGV SM 07508 x TZA 254) Spanish 1.56 4.16 G22 (TZA 2518 x ICGV SM 07508) Spanish 1.79 4.42 G23 JL 24 Spanish 3.76 4.08 G24 Pendo Spanish 5.30 1.46
Table 6.7: The IPCA1, IPCA2 scores of six environments based on environmental mean CLD
Environment Environment name IPCAe1 IPCAe2
1 Tumbi 12.33 3.19
2 Mlali 5.49 -2.11
3 Ilindi 7.77 -5.91
4 Hombolo 5.01 6.77
5 Njoro -16.86 13.64
6 Ikhanoda -13.75 -15.58
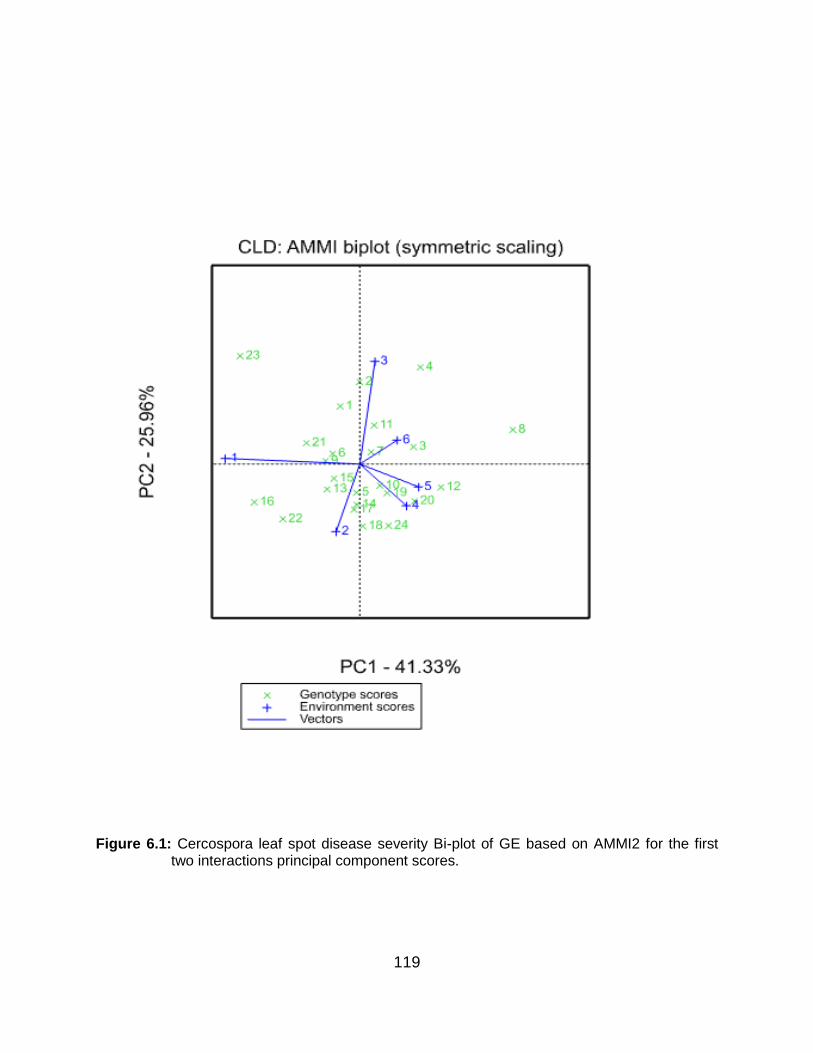
119
Figure 6.1: Cercospora leaf spot disease severity Bi-plot of GE based on AMMI2 for the first two interactions principal component scores.

120
6.6 Discussion
Significant differences in genotypes performances across environments and their interaction in
all evaluated traits indicated their variation in genetic composition and ability to adapt to various
environmental conditions. The G+E+GEI variation was explained in three proportions, which
are genotype (G), the environment (E) and the genotype by environment interactions (GEI)
(Table 6.5). The genotype had the biggest contribution to the variation with 61.67% of the total
treatment sum of squares while GEI contributed 19.39% with environment contributing only
18.95%. Similarly, Sewagegne et al. (2013) and Negash et al. (2013) reported lower
environmental contribution to the total variation than GEI contribution. The high genotype
percentage contribution was a result of variation in genotypes performance across
environments, referred to as crossover. The difference in contribution due to G, E and GEI from
the AMMI analysis meant that the environments were diverse and caused a great variation in
CLD tolerance. The variations amongst environments indicated the importance of multi-
environment trials. The large differences in performance due to change in environment is
applicable to genotype assessment and mega environment analysis (Gauch and Zobel, 1996).
The Tumbi (E1) was the most discriminating environment as it had the largest IPCA1 score and
the longest vector, followed by Ilindi (E3), and Mlali (E2). They could be used for culling inferior
genotypes and selection of specifically adapted genotypes (Yan and Tinker, 2006). Hombolo
(E4), Njoro (E5) and Ikhanoda (E6) showed high correlation, indicating the possibility of using
indirect selection. The existence of such correlation has the advantage of reducing the number
of sites without affecting the results. The Njoro (E5), Hombolo (E4) and Ikhanoda (E6) were the
most representative. They had smaller angle with the average environment axis and could be
used for selecting generally adapted genotypes (Yan and Tinker, 2006).
Using the first and second interaction principal component axis (IPCA1 and IPCA2), genotypes
G2, G11, G7, G3 and G8 were relative stable and adaptable across the testing environments.
Therefore, can be advanced as transgressive segregants up to later generations and selected
for CLD tolerance and seed yield before utilization in crop improvement or commercial
cultivation. There were more genetic diversity in double crosses as compared to single crosses
indicating the powerfulness of double crossing as compared to single crossing mating design.
121
6.7 Conclusion
The Tumbi, Mlali and Ilindi sites were most discriminating sites while Hombolo, Njoro and
Ikhanoda were highly correlated therefore only one of the sites could be selected for further
screening of the genotypes to reduce cost of running the experiment. The double cross hybrid
G2 and single cross hybrids G4, G5, G6, G13, G14, G21 and G22 performed the best across
environments in terms of CLD tolerance and seed yield therefore, are recommended for further
segregation in the breeding programme. In order to develop high yielding CLD resistant
varieties.
122
References
Bänziger, M., Setimela, P.S., Hodson, D. and Vivek, B. (2006). Breeding for Improved Abiotic
Stress Tolerance in Maize Adapted to Southern Africa. Agricultural Water Management
80:212-224.
Bernardo, R. (2002). Breeding for quantitative traits in plants. Stemma Press: Woodburry,
Minnesota, USA.
Butron, A., Velasco, P., Ordás, A. and Malvar, R. (2004). Yield Evaluation of Maize Cultivars Across
Environments with Different Levels of Pink Stem Borer Infestation. Crop Science 44:741-
747.
Casanoves, F., Baldessari, J. and Balzarini, M.. (2005). Evaluation of Multienvironment Trials of
Peanut Cultivars. Crop Science 45:18-26.
Gauch, H. and Zobel, R. (1996). AMMI analysis of yield trials. In ‘Genotype by environment
interaction’. MS Kang, HG Gauch (Editors). CRC Press: Boca Raton, FL, USA. Pp. 85–122.
Hallauer, A.R., Carena, M.J. and Filho, J.B.M. (2010). Quantitative genetics in maize breeding. 6th
edition. Springer, Iowa, USA.
IBPGR, ICRISAT. (1985). Descriptors for groundnut (Revised). International Board for Plant
Genetic Resources, Rome, Italy and International Crop Research Institute for the Semi-Arid
Tropics, Patancheru, India. Pp. 25.
Kang, M.S. (2002). Genotype-environment interaction: Progress and prospects. Quantitative
Genetics. Genomics and Plant Breeding. Pp. 221-243.
Kaya, Y., Palta, Ç. and Tanar, S. (2002). Additive Main Effects and Multiplicative Interactions
Analysis of Yield Performances in Bread Wheat Genotypes Across Environments. Turkish
Journal of Agriculture and Forestry 26:275-279.
Makinde, S. and Ariyo, O. (2011). Analysis of Genotype x Environment Interaction of Groundnut
(Arachis hypogaea L.). Malaysian Journal of Applied Biology 40:19-26.
123
Mengesha, W.A. (2013). Genetic diversity, stability, and combining ability of maize genotypes for
grain yield and resistance to nclb in the mid-altitude sub-humid agro-ecologies of Ethiopia.
University of KwaZulu-Natal, Pietermaritzburg.
Negash, A.W., Mwambi, H., Zewotir, T. and Taye, G. (2013). Additive Main Effects and
Multiplicative Interactions Model (AMMI) and Genotype Main Effect and Genotype by
Environment Interaction (GGE) Biplot Analysis of Multi-environmental Wheat Variety Trials.
African Journal of Agricultural Research 8:1033-1040.
Rad, M.N., Kadir, M.A. Rafii, M., Jaafar, H.Z, Naghavi, M. and Ahmadi, F. (2013). Genotype
Environment Interaction by AMMI and GGE Biplot Analysis in Three Consecutive
Generations of Wheat (Triticum aestivum) Under Normal and Drought Stress Conditions.
Australian Journal of Crop Science 7:956.
Sewagegne, T., Taddesse, L., Mulugeta, B. and Mitiku, A. (2013). Genotype by Environment
Interaction and Grain Yield Stability Analysis of Rice (Oryza sativa L.) Genotypes Evaluated
in North Western Ethiopia. Net Journal of Agricultural Science 1:10-16.
Subrahmanyam, P., McDonald, D., Waliyar, F., Reddy, L.J., Nigam, S.N., Gibbons, R.W.,
Ramanatha Rao, V., Singh, A.K., Pande, S., Reddy, P.M. and Subba Rao, P.V. (1995).
Screening methods and sources of resistance to rust and late leaf spot of groundnut.
Information Bulletin no. 47. ICRISAT, Patancheru 502 324, Andhra Pradesh, India. Pp. 1-20.
Yan, W. and Hunt, L. (2002). Biplot analysis of multi-environment trial data. quantitative genetics,
genomics, and plant breeding. CABI Publishing, New York. Pp. 289-303.
Yan, W. and Tinker, N.A. (2006). Biplot Analysis of Multi-environment Trial Data: Principles and
applications. Canadian Journal of Plant Science 86:623-645.
Yan, W. and Wu, H. (2008). Application Of GGE Biplot Analysis To Evaluate Genotype (G),
Environment (E), and G× E Interaction On Pinus radiata: A Case Study New Zealand
Journal of Forestry Science 38:132-142.
Yusuf, M. (2009). Genotype-by-Environment Interaction and Stability Analysis of Quality Protein
Maize Genotypes Evaluated in Northern Guinea Savanna Zone of Nigeria. African Crop
Science Society, Kampala. Pp. 451-457.

124
Chapter 7: An overview of the research findings
7.1 Introduction and objectives of the study
Groundnut (Arachis hypogaea L.) belongs to genus Arachis in the subtribe Stylosanthinae of the
tribe Aeschynomeneae of the family Leguminosae and originates from South America (Naidu et
al., 2006). It is the most important summer season cash crop as well as oil seed crop in the
world (Mensah and Obadoni, 2007). Various fungal diseases reduce groundnut yield but
Cercospora leaf spot disease (CLD is the most detrimental one causing yield loss of up to 70%
(Waliyar, 1990). Use of chemicals for the control of CLD has been practiced for a long time
having varying degrees of success (Backman et al., 1977). In most countries, chemical control
of CLD of groundnut is not widely practiced due to high costs of chemicals, the detrimental
effect to the environment and farmers lack of knowledge on the use of these chemicals. The
development of CLD resistant cultivars is the most appropriate strategy to reduce yield loss
caused by the fungi. The current study identified promising genotypes that can be used by
farmers either directly or by breeders to develop resistant varieties to improve productivity of
groundnuts, especially under the smallholder farming system. This chapter presents the
highlights of the objectives of the study and gives a concise summary of the core findings of
each objective. Finally, the implications of the study findings to plant breeding against
Cercospora leaf spot diseases are inferred.
The study had the following specific objectives:
i. To establish groundnut production constraints and identify traits preferred by smallholder
farmers’ and other stakeholders in the groundnut value chain in Central Tanzania.
ii. To evaluate the performance of Tanzanian germplasm and introduced groundnut lines
for yield and yield-related traits and resistance to Cercospora leaf spot diseases to
select promising parents for breeding.
iii. To determine association of yield and yield-related traits, and resistance to Cercospora
leaf spot diseases through correlation and path analysis to guide future groundnut
breeding.
iv. To determine gene action and heritability of yield and resistance to Cercospora leaf spot
diseases and to select promising parents and crosses with enhanced yield and
durable resistance to Cercospora leaf spot diseases in groundnut.
125
v. To determine the performance of single cross parents versus double crosses and
checks among groundnut (Arachis hypogaea L.) intra botanical groups in multi-
location trials.
7.2 Research findings in brief
7.2.1 Groundnut production constraints and traits preference by smallholder
farmers’ and other stakeholders in the groundnut value chain in Central Tanzania.
This study was conducted in three districts and six villages involving 124 farmers in Central
Tanzania. Furthermore, interviews with groundnut traders and processors were conducted
based on semi-structured questionnaire and observations following transect walk were used to
gather data. The main findings of the study were:
83.9% of the groundnut growers were aged between 21 to 60 years old.
72.6% of the groundnut growers were males.
96.8% of the groundnut growers were able to read and write..
Main crops grown were groundnuts, maize, sorghum and sunflower.
84.5% of groundnut growers planted landraces and had not adopted newly released
varieties, and only 10.4 and 5.1% of the farmers from Bahi and Dodoma municipal
respectively, grew improved varieties.
51.8% of the farmers used own saved seed, 19.9% purchased seed from fellow farmers,
10.4% purchased seed from the local market, and 9.8% purchased seed from
government research and extension services.
71.1% of groundnut produced were sold, while 28.9% was for consumption and seed for
the next season.
Constraints facing farmers include drought, poor soil fertility, plant diseases, insect pest,
availability of seeds of improved varieties and, unavailability of reliable and low market
price.
Constraints facing groundnut traders include poor grain quality with mixed size and
colour.
Constraints to processors include low market of finished products, high cost of
packaging materials, lack of investment capital, bureaucratic procedure in business and
brand registration, availability of other cheap sources of oil.
126
Farmers preferred groundnut varieties with erect growth habit, high yield, a high oil
content, tolerant to diseases and other environmental stresses, early maturing, with
large seed size, good taste, brown coloured seed and easy threshability.
Traders preferred groundnut varieties with medium to large seed size with brown colour.
Processors preferred groundnut varieties with medium to large seed size, less pod
constriction, sharp beak and brown colour.
94.4% of groundnut farmers do not apply any control measure against Cercospora leaf
spot diseases thinking that the yellow and dark spots on leaves are signs of maturity.
7.2.2 Evaluation of Tanzanian germplasm and introduced groundnut lines for
resistance to Cercospora leaf spot diseases, yield and yield-related traits and
selection of promising parents for further breeding.
Eighty-four groundnut genotypes sourced from ICRISAT–Malawi, the Tanzanian National plant
genetic resource centre, local market and smallholder farmers were evaluated across three
sites for two seasons. Data on Cercospora leaf spot diseases score was collected using a 1-9
visual canopy scale. In addition, data on yield and yield components were. The main findings of
the study were:
There were significant variations among groundnut genotypes evaluated.
Twenty-one genotypes were identified with significant tolerance to CLD disease, a high
number of pods per plant, relatively early maturity, high number of mature pods per plant
and pod yield, higher seed weight and seed yields, and with farmer preferred agronomic
traits.
The following groundnut genotypes; ICGV SM 96714, ICGV 6057, TZA 2426, Local
Makulu, ICG 6022, ICGV SM 07539, TZA 254, TZA 4280, KAKOMA, ICGV SM 07508,
TZA 2270, TZA 121, TZA 667, TZA 157, TZA 2498, TZA 3786, TZA 4390, TZA 4261,
TZA 2444, TZA 534 and TZA 2518 were selected based on the above mentioned merits.
The coefficient of variation at phenotypic levels was relatively higher than genotypic
variation for Cercospora leaf spot disease resistance and seed yield.
There were small differences between the genotypic and phenotypic coefficient of
variations among the studied traits.
The broad sense heritability was higher than the narrow sense heritability.
The interaction between the performance of the genotype as determined by its genetic
composition and the environment can greatly influence the performance of the genotype
127
The present study demonstrated the significance of screening genotypes before
selecting parental material for further breeding.
7.2.3 Association of yield and yield-related traits and resistance to Cercospora leaf
spot diseases through correlation, path and cluster analysis to guide future
groundnut breeding.
Eighty-four groundnut genotypes were evaluated in the field at three sites for two seasons in
Central Tanzania. Data on Cercospora leaf spot disease score was collected using 1-9
visual canopy scale, also data on seed yield and yield related components were collected as
per ICRISAT groundnut descriptors. The study was conducted to investigate correlation,
path-coefficient and cluster analyses of yield and its related traits and CLDS in groundnut, in
order to investigate the nature and magnitude of trait association between CLDS, seed yield
and its contributing characters as the pre-requisite for selection of parental material for
breeding for CLD resistance. The main findings were:
Days to 50% flowering (DFL) was negatively correlated with days to maturity
(DM) and Cercospora leaf spot diseases severity (CLDS).
Number of mature pods per plant (NPP) was positively correlated with hundred
seed weight (HSW).
Number of seeds per pod was positively correlated with hundred seed weight
(HSW) and seed yield (SY).
Seed yield was positively correlated with hundred seed weight and number of
seeds per pod
Hundred seed weight was negatively correlated with days to maturity and
Cercospora leaf spot diseases severity.
Pod yield was negatively correlated with days to 50% flowering, days to maturity
and Cercospora leaf spot diseases severity.
Positive direct effect on seed yield was depicted by the number of seeds per pod,
pod yield, Cercospora leaf spot diseases severity, length of reproductive branch
and days to 50% flowering.
Negative direct effect on seed yield was depicted by days to maturity, number of
mature pods per plant and hundred seed weight.
Indirect effect on seed yield via SPP was exhibited by HSW and NPP.
Indirect effect on seed yield via CLD was exhibited by DFL, DM and LRB.

128
Indirect effect on seed yield via DM was exhibited by NPP and HSW.
Five phenotypically diverse clusters were derived from 84 groundnut genotypes
sourced from ICRISAT–Malawi, the Tanzanian National plant genetic resource
centre, local market and smallholder farmers.
The five clusters had relatively different magnitude of means of yield and its
related traits, ranging from low to high yielding.
The five clusters had different reaction to Cercospora leaf spot diseases ranging
from tolerant to susceptible.
7.2.4 To determine gene action and heritability of yield and resistance to Cercospora
leaf spot diseases and to select promising parents and crosses with enhanced
yield and durable resistance to Cercospora leaf spot diseases in groundnut.
Twenty-one parents were selected from screening experiment for yield potential and
tolerance to Cercospora leaf spot disease. The parents included seven Valencia,
Virginia and Spanish types with either tolerance to Cercospora leaf spot disease or a
high yield potential. The 21 selected parents were planted in the screen house. The
parents were crossed using (3x7) line x tester mating design each botanical group were
crossed separately to produce single crosses. The single cross hybrids were evaluated
for combining ability estimates and gene action governing inheritance of yield and CLD
tolerance in three locations for one season. The main findings of the study were:
There were variation among genotypes for both yield and its components, and
Cercospora leaf spot disease severity (CLDS) for all three groundnut botanical
groups (Valencia, Virginia and Spanish).
Good general combiners for the Valencia botanical group were Local Makulu,
TZA 121 (females) and ICGV SM 96714 (male); for the Virginia botanical group
these were TZA 4280, TZA 4390 (females) and ICGV 6022 (male) and TZA
2518, TZA 254 (females) and ICGV SM 07508 (male) were good general
combiners for the Spanish botanical group.
The study identified crosses; Local Makulu x ICGV SM 96714, TZA 121 x
Kakoma, TZA 3786 x Kakoma, TZA 157 x Kakoma, TZA 2498 x ICGV SM
96714 for Valencia group; TZA 534 x ICGV 6057, TZA 4280 x ICGV 6022, TZA
4390 x ICGV 6022 and TZA 4261 x ICGV 6057 for Virginia group, and TZA 2444
129
x ICGV SM 07539, TZA 2518 x ICGV SM 07508, TZA 254 x ICGV SM 07508,
TZA 2426 x ICGV SM 07539, TZA 2270 x ICGV SM 07539 and TZA 2270 x
ICGV SM 07508 for Spanish group with superior per se performance for CLD
resistance and yield.
Both additive and non-additive gene effects were predominantly important in the
inheritance of CLD resistance and yield in all groundnut botanical groups.
Dominance genetic variance was larger than additive genetic variance; therefore,
inheritance of CLD and, yield and its components can be transmitted to offspring
by hybridization and selection at later stages in the segregating populations.
Broad sense heritability was higher in magnitude than narrow sense heritability,
indicating that these traits can be transmitted to progenies through hybridization,
and selection can be conducted at later stages in the segregating populations.
7.2.5 Performance of single cross parents versus double crosses and checks among
groundnut (Arachis hypogaea L.) intra botanical groups in multi-location trials.
The two best performing F1 single cross hybrids (section 6.5.4) were selected from each
botanical group based on CLD tolerance and farmers’ preferred traits, and were inter-crossed to
produce double cross populations. Thereafter, the six double cross populations (i.e. with
reciprocals), the twelve F1 single cross hybrids and six checks were evaluated in six locations
viz Ilindi, Mlali and Hombolo in the Dodoma region, Ikhanoda in the Singida region, Njoro in the
Manyara region and Tumbi in the Tabora region, to determine GEI of the double crosses
compared with their single cross parents and checks and to select populations with improved
CLD tolerance. The experiment was laid out in an alpha lattice design (6 x 4) with two
replications in one cropping season (2016/17). The main findings of the study were:
There were significant differences among evaluated genotypes across environments for
the studied traits.
There were significant G, E and GXE multiplicative terms for the studied traits.
The genotypes accounted for 61.67% of the treatment sum of squares, the environments
and the interaction between genotypes and the environment accounted for 18.95% and
19.38% of the treatment sum of squares, respectively.
The first and second IPCAs captured 41.33% and 25.96% of the interaction sum of
square and degree of freedom, respectively.
130
The two IPCA axes jointly accounted for 67.29% of the interaction sum of squares,
leaving 32.71% of the variation due to G x E interaction in the residual.
The IPCA scores were both negative and positive for genotypes and environments, and
three environments were most discriminating while the other three had high correlation.
Copyright © 2022 FDOKUMEN