Strength of spot-welded steel sheets in corrosive environment
9
Strength of spot-welded steel sheets in corrosive environment G. Mukhopadhyay, S. Bhattacharya and K. K. Ray * The load bearing capacity (LBC), often referred to as strength, of spot-welded joints on as-received and pre-strained sheets of an interstitial free (IF) steel has been examined under 3.5% sodium chloride solution using tensile-shear (TS) specimens. These tests have been carried out under three different test conditions: (i) after immersing the samples in the solution for various duration of time, (ii) at various slow strain rates by keeping the samples in solution, and (iii) at slow strain rate under in situ hydrogen charging. Analyses of the results infer that (i) increased duration of immersion of the samples in aggressive environment decreases their LBC but increases their extension corresponding to the maximum load (EML), (ii) slow strain rate tests in the solution indicate marginal decrease of LBC and EML of the spot-welds, (iii) the LBC and EML of the spot-welds of pre-strained sheets decrease considerably with cathodic hydrogen charging while EML of the spot-welded joints on the as-received sheets is found to improve, and finally, (iv) the detrimental effect of corrosive environment increases with increased pre-strain of the investigated sheets. These observations have been discussed together with post-failure examinations of the broken fractured surfaces, which have assisted in understanding their failure mechanism. 1 Introduction Spot-welded sheets are widely used for assembling auto-body panels which undergo various corrosive environments during their service period. Especially in the coastal regions, automotives face the corrosive environment of marine atmosphere and hence corrosion of its components is a well-recognized problem [1]. It is, therefore, required to gain knowledge related to the effect of saline environment on the mechanical behavior of spot-welds in order to understand their load bearing capacity (LBC) in an aggressive environment. Somervuori et al. [2] and Alenius et al. [3, 4] have studied corrosion behavior of the spot-welded joints of austenitic stainless steel, but literature related to the effect of saline environment on the strength of spot-welds made on interstitial free (IF) steel which is extensively used in the fabrication of current automobiles, is almost non-existent. Hydrogen atoms can get generated during aqueous corrosion and this is known to degrade mechanical properties of iron-base alloys like automotive steels. Generally, IF steel is considered susceptible to hydrogen embrittlement due to the high diffusivity and permeability of hydrogen in its ferritic microstructure. The effect of hydrogen on strength and toughness has been widely studied in pure iron as well as in steels of various compositions; the reported results are diverse and, at times, contradictory in nature. The effect of hydrogen absorption in spot-welds of automotive steel sheets is non-available in the open literature. It would, therefore, be worthwhile to study the mechanical response of the spot-welded joints made on IF steel sheets to hydrogen permeation. Further, manufacturing of automotives involve press-forming of body panels prior to assembling through spot-welding, which induces varied amount of pre-strain in the sheet metals. The effect of corrosive environment on the spot- welds of pre-strained sheets is, thus, of practical importance, on which emphasis has not been laid so far. The major objective of this report is to investigate the effect of 3.5% sodium chloride solution (equivalent to synthetic sea water) on the strength behavior of spot-welds made on as-received and pre-strained IF steel sheets under three different test conditions: (i) tests on spot-welded steel specimens after 398 DOI: 10.1002/maco.200905427 Materials and Corrosion 2010, 61, No. 5 G. Mukhopadhyay, K. K. Ray Department of Metallurgical and Materials Engineering, Indian Institute of Technology, Kharagpur-721302 (India) E-mail: [email protected] G. Mukhopadhyay On study leave from R&D and Scientific Services, Tata Steel, Jamshedpur-831001 (India) S. Bhattacharya R&D and Scientific Services, Tata Steel, Jamshedpur-831001 (India) ß 2010 WILEY-VCH Verlag GmbH & Co. KGaA, Weinheim www.matcorr.com
Transcript of Strength of spot-welded steel sheets in corrosive environment

398 DOI: 10.1002/maco.200905427 Materials and Corrosion 2010, 61, No. 5
Strength of spot-welded steel sheets in corrosiveenvironment
G. Mukhopadhyay, S. Bhattacharya and K. K. Ray*
The load bearing capacity (LBC), often referred to as strength, of spot-welded
joints on as-received and pre-strained sheets of an interstitial free (IF) steel has
been examined under 3.5% sodium chloride solution using tensile-shear (TS)
specimens. These tests have been carried out under three different test
conditions: (i) after immersing the samples in the solution for various duration of
time, (ii) at various slow strain rates by keeping the samples in solution, and
(iii) at slow strain rate under in situ hydrogen charging. Analyses of the results
infer that (i) increased duration of immersion of the samples in aggressive
environment decreases their LBC but increases their extension corresponding to
the maximum load (EML), (ii) slow strain rate tests in the solution indicate
marginal decrease of LBC and EML of the spot-welds, (iii) the LBC and EML of the
spot-welds of pre-strained sheets decrease considerably with cathodic
hydrogen charging while EML of the spot-welded joints on the as-received
sheets is found to improve, and finally, (iv) the detrimental effect of corrosive
environment increases with increased pre-strain of the investigated sheets.
These observations have been discussed together with post-failure
examinations of the broken fractured surfaces, which have assisted in
understanding their failure mechanism.
1 Introduction
Spot-welded sheets are widely used for assembling auto-body
panels which undergo various corrosive environments during
their service period. Especially in the coastal regions, automotives
face the corrosive environment of marine atmosphere and hence
corrosion of its components is a well-recognized problem [1]. It is,
therefore, required to gain knowledge related to the effect of
saline environment on the mechanical behavior of spot-welds in
order to understand their load bearing capacity (LBC) in an
aggressive environment. Somervuori et al. [2] and Alenius et al. [3, 4]have studied corrosion behavior of the spot-welded joints of
austenitic stainless steel, but literature related to the effect of
saline environment on the strength of spot-welds made on
G. Mukhopadhyay, K. K. Ray
Department of Metallurgical and Materials Engineering, Indian
Institute of Technology, Kharagpur-721302 (India)
E-mail: [email protected]
G. Mukhopadhyay
On study leave from R&D and Scientific Services, Tata Steel,
Jamshedpur-831001 (India)
S. Bhattacharya
R&D and Scientific Services, Tata Steel, Jamshedpur-831001 (India)
� 2010 WILEY-VCH Verlag GmbH & Co. KGaA, Weinheim
interstitial free (IF) steel which is extensively used in the
fabrication of current automobiles, is almost non-existent.
Hydrogen atoms can get generated during aqueous corrosion
and this is known to degrade mechanical properties of iron-base
alloys like automotive steels. Generally, IF steel is considered
susceptible to hydrogen embrittlement due to the high diffusivity
and permeability of hydrogen in its ferritic microstructure. The
effect of hydrogen on strength and toughness has been widely
studied in pure iron as well as in steels of various compositions;
the reported results are diverse and, at times, contradictory in
nature. The effect of hydrogen absorption in spot-welds of
automotive steel sheets is non-available in the open literature. It
would, therefore, be worthwhile to study themechanical response
of the spot-welded joints made on IF steel sheets to hydrogen
permeation. Further, manufacturing of automotives involve
press-forming of body panels prior to assembling through
spot-welding, which induces varied amount of pre-strain in the
sheet metals. The effect of corrosive environment on the spot-
welds of pre-strained sheets is, thus, of practical importance, on
which emphasis has not been laid so far.
The major objective of this report is to investigate the effect
of 3.5% sodium chloride solution (equivalent to synthetic sea
water) on the strength behavior of spot-weldsmade on as-received
and pre-strained IF steel sheets under three different test
conditions: (i) tests on spot-welded steel specimens after
www.matcorr.com
Materials and Corrosion 2010, 61, No. 5 Strength of spot-welded steel sheets 399
Table 1. Chemical composition of the investigated EIF steel (in weight percentage)
Steel C Mn S P Si Al Cr Ni Ti Nb N Fe
EIF 0.0025 0.05 0.008 0.007 0.012 0.037 0.023 0.014 0.06 0.001 0.0027 Balance
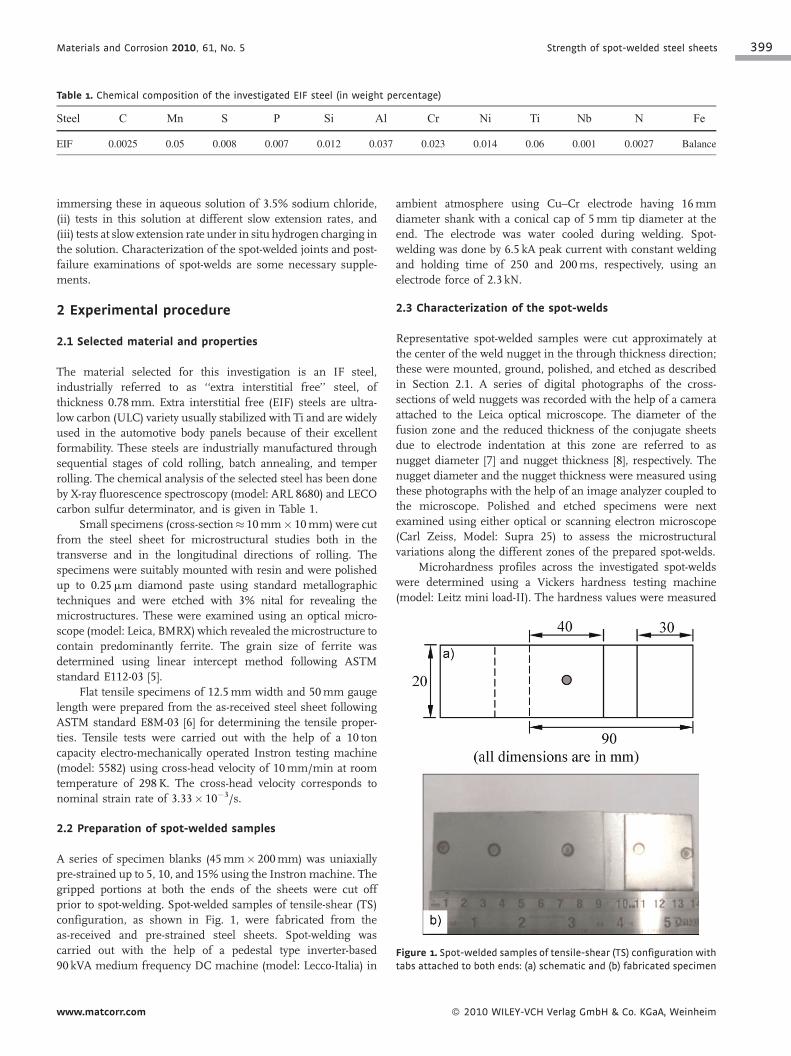
Figure 1. Spot-welded samples of tensile-shear (TS) configuration with
tabs attached to both ends: (a) schematic and (b) fabricated specimen
immersing these in aqueous solution of 3.5% sodium chloride,
(ii) tests in this solution at different slow extension rates, and
(iii) tests at slow extension rate under in situ hydrogen charging in
the solution. Characterization of the spot-welded joints and post-
failure examinations of spot-welds are some necessary supple-
ments.
2 Experimental procedure
2.1 Selected material and properties
The material selected for this investigation is an IF steel,
industrially referred to as ‘‘extra interstitial free’’ steel, of
thickness 0.78mm. Extra interstitial free (EIF) steels are ultra-
low carbon (ULC) variety usually stabilized with Ti and are widely
used in the automotive body panels because of their excellent
formability. These steels are industrially manufactured through
sequential stages of cold rolling, batch annealing, and temper
rolling. The chemical analysis of the selected steel has been done
by X-ray fluorescence spectroscopy (model: ARL 8680) and LECO
carbon sulfur determinator, and is given in Table 1.
Small specimens (cross-section� 10mm� 10mm) were cut
from the steel sheet for microstructural studies both in the
transverse and in the longitudinal directions of rolling. The
specimens were suitably mounted with resin and were polished
up to 0.25mm diamond paste using standard metallographic
techniques and were etched with 3% nital for revealing the
microstructures. These were examined using an optical micro-
scope (model: Leica, BMRX) which revealed themicrostructure to
contain predominantly ferrite. The grain size of ferrite was
determined using linear intercept method following ASTM
standard E112-03 [5].
Flat tensile specimens of 12.5mm width and 50mm gauge
length were prepared from the as-received steel sheet following
ASTM standard E8M-03 [6] for determining the tensile proper-
ties. Tensile tests were carried out with the help of a 10 ton
capacity electro-mechanically operated Instron testing machine
(model: 5582) using cross-head velocity of 10mm/min at room
temperature of 298K. The cross-head velocity corresponds to
nominal strain rate of 3.33� 10�3/s.
2.2 Preparation of spot-welded samples
A series of specimen blanks (45mm� 200mm) was uniaxially
pre-strained up to 5, 10, and 15% using the Instron machine. The
gripped portions at both the ends of the sheets were cut off
prior to spot-welding. Spot-welded samples of tensile-shear (TS)
configuration, as shown in Fig. 1, were fabricated from the
as-received and pre-strained steel sheets. Spot-welding was
carried out with the help of a pedestal type inverter-based
90 kVA medium frequency DC machine (model: Lecco-Italia) in
www.matcorr.com
ambient atmosphere using Cu–Cr electrode having 16mm
diameter shank with a conical cap of 5mm tip diameter at the
end. The electrode was water cooled during welding. Spot-
welding was done by 6.5 kA peak current with constant welding
and holding time of 250 and 200ms, respectively, using an
electrode force of 2.3 kN.
2.3 Characterization of the spot-welds
Representative spot-welded samples were cut approximately at
the center of the weld nugget in the through thickness direction;
these were mounted, ground, polished, and etched as described
in Section 2.1. A series of digital photographs of the cross-
sections of weld nuggets was recorded with the help of a camera
attached to the Leica optical microscope. The diameter of the
fusion zone and the reduced thickness of the conjugate sheets
due to electrode indentation at this zone are referred to as
nugget diameter [7] and nugget thickness [8], respectively. The
nugget diameter and the nugget thickness were measured using
these photographs with the help of an image analyzer coupled to
the microscope. Polished and etched specimens were next
examined using either optical or scanning electron microscope
(Carl Zeiss, Model: Supra 25) to assess the microstructural
variations along the different zones of the prepared spot-welds.
Microhardness profiles across the investigated spot-welds
were determined using a Vickers hardness testing machine
(model: Leitz mini load-II). The hardness values were measured
� 2010 WILEY-VCH Verlag GmbH & Co. KGaA, Weinheim
400 Mukhopadhyay, Bhattacharya and Ray Materials and Corrosion 2010, 61, No. 5
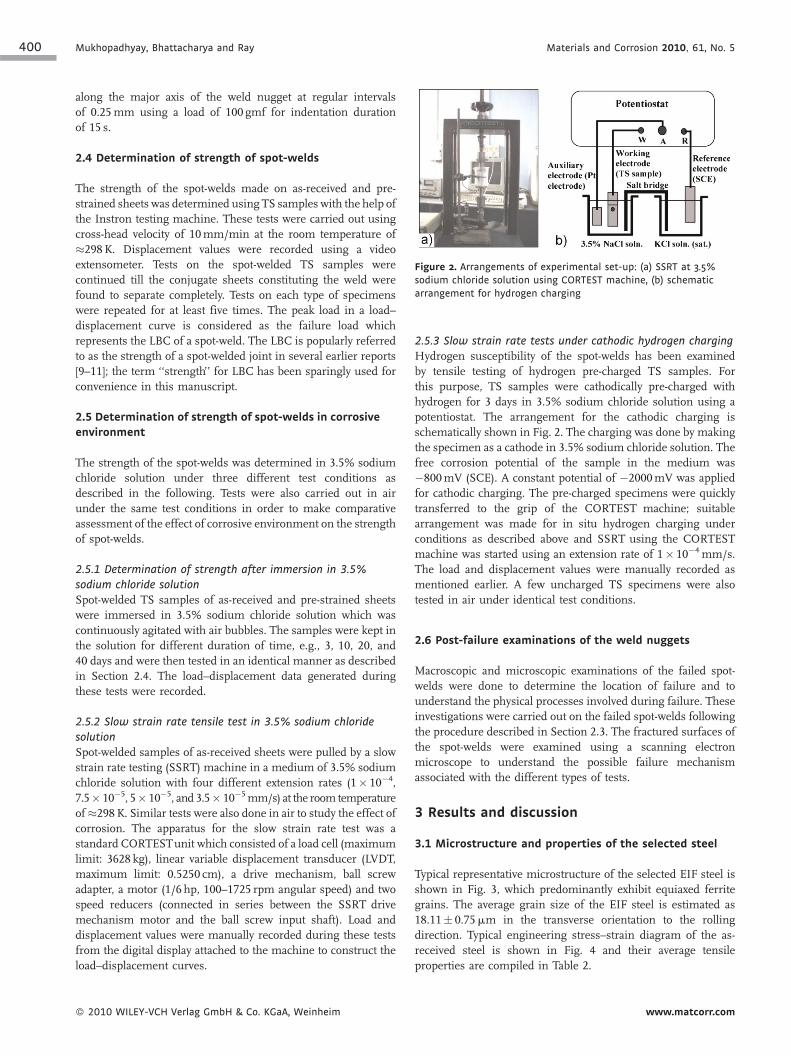
Figure 2. Arrangements of experimental set-up: (a) SSRT at 3.5%
sodium chloride solution using CORTEST machine, (b) schematic
arrangement for hydrogen charging
along the major axis of the weld nugget at regular intervals
of 0.25mm using a load of 100 gmf for indentation duration
of 15 s.
2.4 Determination of strength of spot-welds
The strength of the spot-welds made on as-received and pre-
strained sheets was determined using TS samples with the help of
the Instron testing machine. These tests were carried out using
cross-head velocity of 10mm/min at the room temperature of
�298K. Displacement values were recorded using a video
extensometer. Tests on the spot-welded TS samples were
continued till the conjugate sheets constituting the weld were
found to separate completely. Tests on each type of specimens
were repeated for at least five times. The peak load in a load–
displacement curve is considered as the failure load which
represents the LBC of a spot-weld. The LBC is popularly referred
to as the strength of a spot-welded joint in several earlier reports
[9–11]; the term ‘‘strength’’ for LBC has been sparingly used for
convenience in this manuscript.
2.5 Determination of strength of spot-welds in corrosive
environment
The strength of the spot-welds was determined in 3.5% sodium
chloride solution under three different test conditions as
described in the following. Tests were also carried out in air
under the same test conditions in order to make comparative
assessment of the effect of corrosive environment on the strength
of spot-welds.
2.5.1 Determination of strength after immersion in 3.5%
sodium chloride solution
Spot-welded TS samples of as-received and pre-strained sheets
were immersed in 3.5% sodium chloride solution which was
continuously agitated with air bubbles. The samples were kept in
the solution for different duration of time, e.g., 3, 10, 20, and
40 days and were then tested in an identical manner as described
in Section 2.4. The load–displacement data generated during
these tests were recorded.
2.5.2 Slow strain rate tensile test in 3.5% sodium chloride
solution
Spot-welded samples of as-received sheets were pulled by a slow
strain rate testing (SSRT) machine in a medium of 3.5% sodium
chloride solution with four different extension rates (1� 10�4,
7.5� 10�5, 5� 10�5, and 3.5� 10�5mm/s) at the room temperature
of�298K. Similar tests were also done in air to study the effect of
corrosion. The apparatus for the slow strain rate test was a
standard CORTESTunit which consisted of a load cell (maximum
limit: 3628 kg), linear variable displacement transducer (LVDT,
maximum limit: 0.5250 cm), a drive mechanism, ball screw
adapter, a motor (1/6 hp, 100–1725 rpm angular speed) and two
speed reducers (connected in series between the SSRT drive
mechanism motor and the ball screw input shaft). Load and
displacement values were manually recorded during these tests
from the digital display attached to the machine to construct the
load–displacement curves.
� 2010 WILEY-VCH Verlag GmbH & Co. KGaA, Weinheim
2.5.3 Slow strain rate tests under cathodic hydrogen charging
Hydrogen susceptibility of the spot-welds has been examined
by tensile testing of hydrogen pre-charged TS samples. For
this purpose, TS samples were cathodically pre-charged with
hydrogen for 3 days in 3.5% sodium chloride solution using a
potentiostat. The arrangement for the cathodic charging is
schematically shown in Fig. 2. The charging was done by making
the specimen as a cathode in 3.5% sodium chloride solution. The
free corrosion potential of the sample in the medium was
�800mV (SCE). A constant potential of �2000mV was applied
for cathodic charging. The pre-charged specimens were quickly
transferred to the grip of the CORTEST machine; suitable
arrangement was made for in situ hydrogen charging under
conditions as described above and SSRT using the CORTEST
machine was started using an extension rate of 1� 10�4mm/s.
The load and displacement values were manually recorded as
mentioned earlier. A few uncharged TS specimens were also
tested in air under identical test conditions.
2.6 Post-failure examinations of the weld nuggets
Macroscopic and microscopic examinations of the failed spot-
welds were done to determine the location of failure and to
understand the physical processes involved during failure. These
investigations were carried out on the failed spot-welds following
the procedure described in Section 2.3. The fractured surfaces of
the spot-welds were examined using a scanning electron
microscope to understand the possible failure mechanism
associated with the different types of tests.
3 Results and discussion
3.1 Microstructure and properties of the selected steel
Typical representative microstructure of the selected EIF steel is
shown in Fig. 3, which predominantly exhibit equiaxed ferrite
grains. The average grain size of the EIF steel is estimated as
18.11� 0.75mm in the transverse orientation to the rolling
direction. Typical engineering stress–strain diagram of the as-
received steel is shown in Fig. 4 and their average tensile
properties are compiled in Table 2.
www.matcorr.com
Materials and Corrosion 2010, 61, No. 5 Strength of spot-welded steel sheets 401
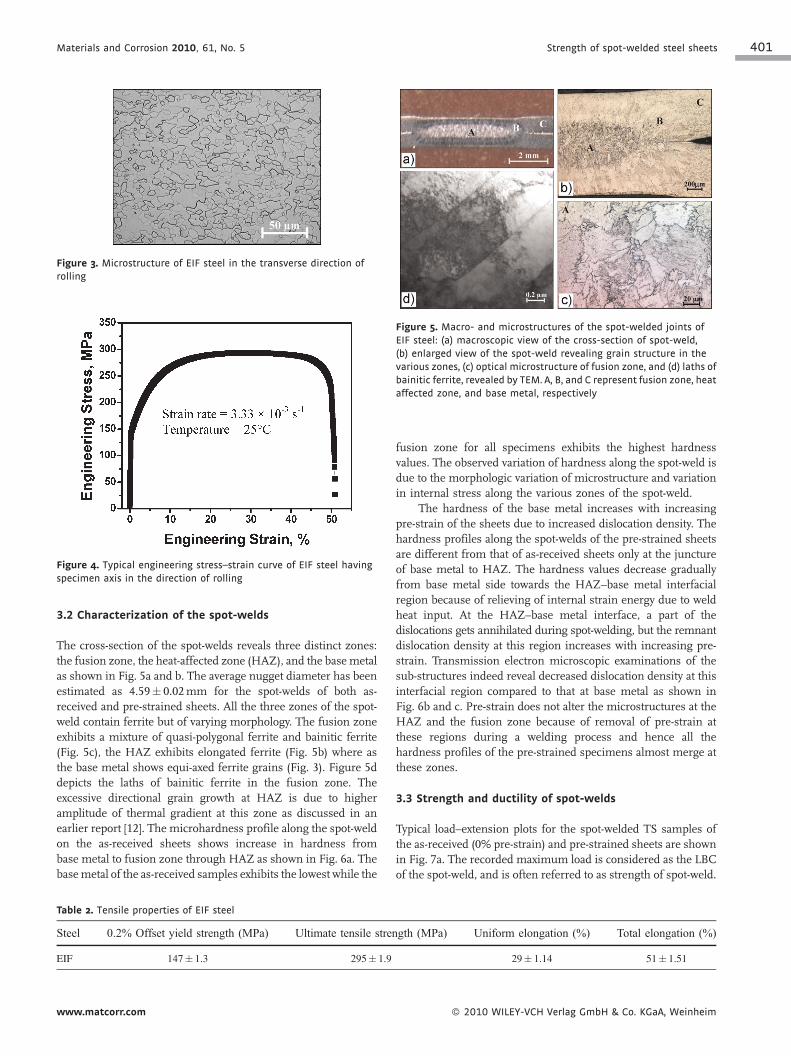
Figure 3. Microstructure of EIF steel in the transverse direction of
rolling
Figure 4. Typical engineering stress–strain curve of EIF steel having
specimen axis in the direction of rolling
Figure 5. Macro- and microstructures of the spot-welded joints of
EIF steel: (a) macroscopic view of the cross-section of spot-weld,
(b) enlarged view of the spot-weld revealing grain structure in the
various zones, (c) optical microstructure of fusion zone, and (d) laths of
bainitic ferrite, revealed by TEM. A, B, and C represent fusion zone, heat
affected zone, and base metal, respectively
3.2 Characterization of the spot-welds
The cross-section of the spot-welds reveals three distinct zones:
the fusion zone, the heat-affected zone (HAZ), and the base metal
as shown in Fig. 5a and b. The average nugget diameter has been
estimated as 4.59� 0.02mm for the spot-welds of both as-
received and pre-strained sheets. All the three zones of the spot-
weld contain ferrite but of varying morphology. The fusion zone
exhibits a mixture of quasi-polygonal ferrite and bainitic ferrite
(Fig. 5c), the HAZ exhibits elongated ferrite (Fig. 5b) where as
the base metal shows equi-axed ferrite grains (Fig. 3). Figure 5d
depicts the laths of bainitic ferrite in the fusion zone. The
excessive directional grain growth at HAZ is due to higher
amplitude of thermal gradient at this zone as discussed in an
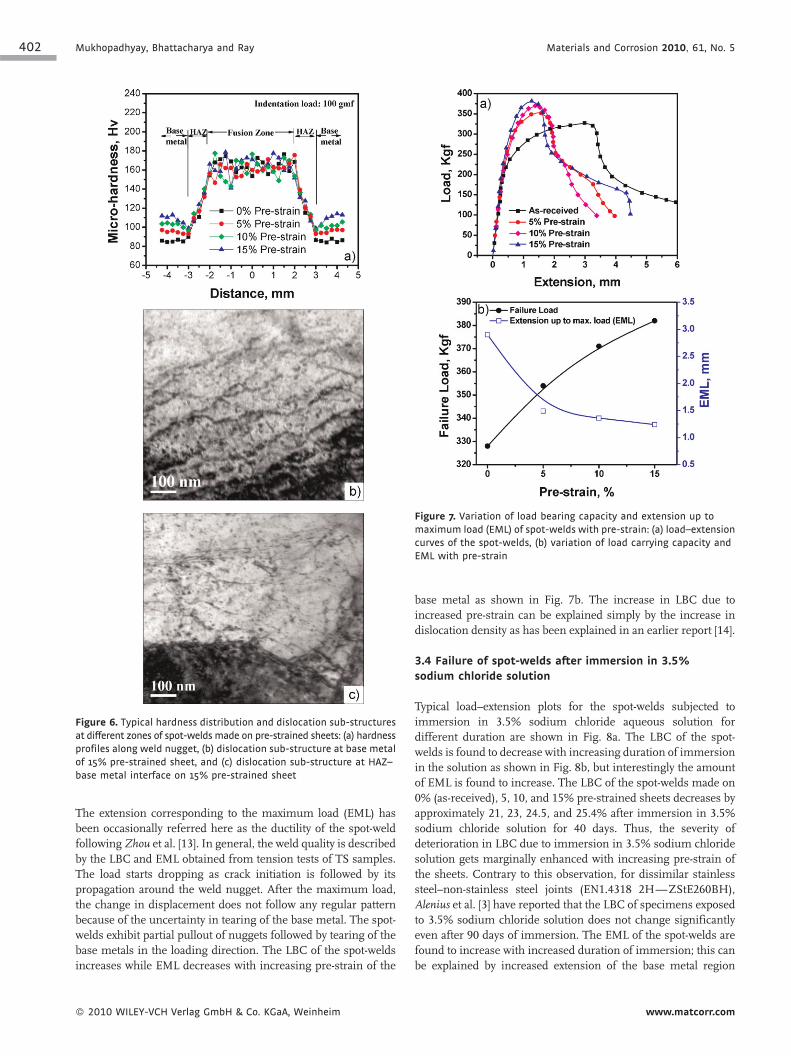
earlier report [12]. The microhardness profile along the spot-weld
on the as-received sheets shows increase in hardness from
base metal to fusion zone through HAZ as shown in Fig. 6a. The
basemetal of the as-received samples exhibits the lowest while the
Table 2. Tensile properties of EIF steel
Steel 0.2% Offset yield strength (MPa) Ultimate tensile stren
EIF 147� 1.3 295� 1.9
www.matcorr.com
fusion zone for all specimens exhibits the highest hardness
values. The observed variation of hardness along the spot-weld is
due to the morphologic variation of microstructure and variation
in internal stress along the various zones of the spot-weld.
The hardness of the base metal increases with increasing
pre-strain of the sheets due to increased dislocation density. The
hardness profiles along the spot-welds of the pre-strained sheets
are different from that of as-received sheets only at the juncture
of base metal to HAZ. The hardness values decrease gradually
from base metal side towards the HAZ–base metal interfacial
region because of relieving of internal strain energy due to weld
heat input. At the HAZ–base metal interface, a part of the
dislocations gets annihilated during spot-welding, but the remnant
dislocation density at this region increases with increasing pre-
strain. Transmission electron microscopic examinations of the
sub-structures indeed reveal decreased dislocation density at this
interfacial region compared to that at base metal as shown in
Fig. 6b and c. Pre-strain does not alter the microstructures at the
HAZ and the fusion zone because of removal of pre-strain at
these regions during a welding process and hence all the
hardness profiles of the pre-strained specimens almost merge at
these zones.
3.3 Strength and ductility of spot-welds
Typical load–extension plots for the spot-welded TS samples of
the as-received (0% pre-strain) and pre-strained sheets are shown
in Fig. 7a. The recorded maximum load is considered as the LBC
of the spot-weld, and is often referred to as strength of spot-weld.
gth (MPa) Uniform elongation (%) Total elongation (%)
29� 1.14 51� 1.51
� 2010 WILEY-VCH Verlag GmbH & Co. KGaA, Weinheim
402 Mukhopadhyay, Bhattacharya and Ray Materials and Corrosion 2010, 61, No. 5
Figure 6. Typical hardness distribution and dislocation sub-structures
at different zones of spot-welds made on pre-strained sheets: (a) hardness
profiles along weld nugget, (b) dislocation sub-structure at base metal
of 15% pre-strained sheet, and (c) dislocation sub-structure at HAZ–
base metal interface on 15% pre-strained sheet
Figure 7. Variation of load bearing capacity and extension up to
maximum load (EML) of spot-welds with pre-strain: (a) load–extension
curves of the spot-welds, (b) variation of load carrying capacity and
EML with pre-strain
The extension corresponding to the maximum load (EML) has
been occasionally referred here as the ductility of the spot-weld
following Zhou et al. [13]. In general, the weld quality is described
by the LBC and EML obtained from tension tests of TS samples.
The load starts dropping as crack initiation is followed by its
propagation around the weld nugget. After the maximum load,
the change in displacement does not follow any regular pattern
because of the uncertainty in tearing of the base metal. The spot-
welds exhibit partial pullout of nuggets followed by tearing of the
base metals in the loading direction. The LBC of the spot-welds
increases while EML decreases with increasing pre-strain of the
� 2010 WILEY-VCH Verlag GmbH & Co. KGaA, Weinheim
base metal as shown in Fig. 7b. The increase in LBC due to
increased pre-strain can be explained simply by the increase in
dislocation density as has been explained in an earlier report [14].
3.4 Failure of spot-welds after immersion in 3.5%
sodium chloride solution
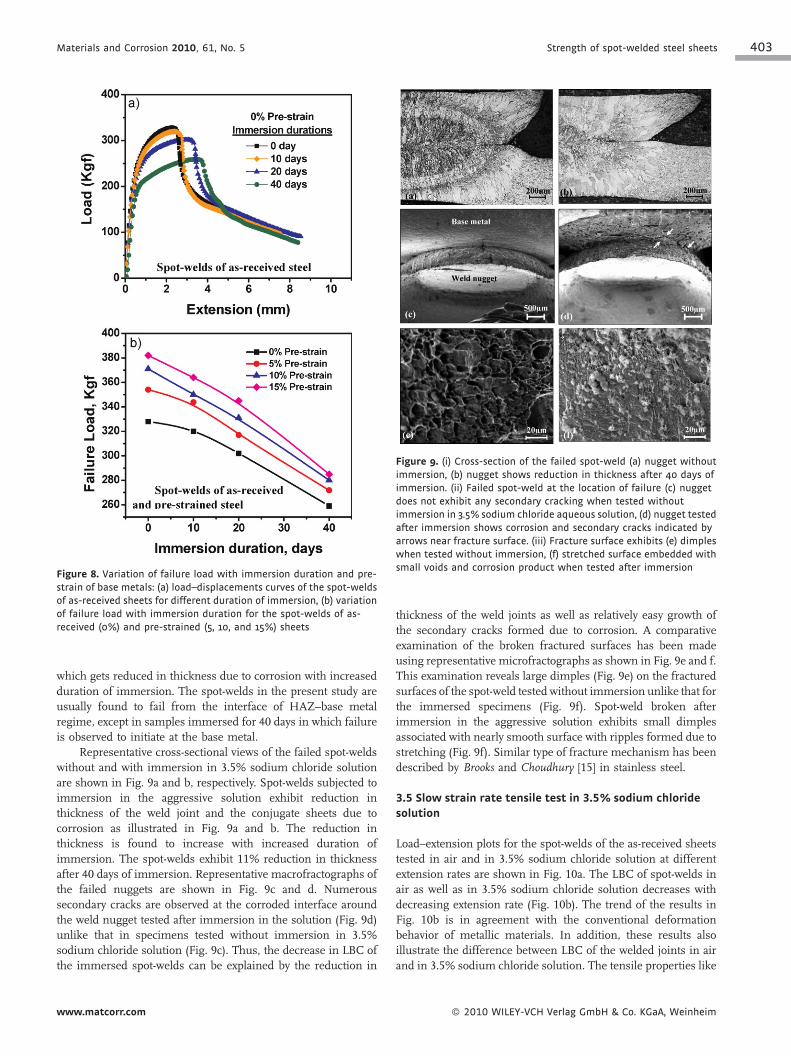
Typical load–extension plots for the spot-welds subjected to
immersion in 3.5% sodium chloride aqueous solution for
different duration are shown in Fig. 8a. The LBC of the spot-
welds is found to decrease with increasing duration of immersion
in the solution as shown in Fig. 8b, but interestingly the amount
of EML is found to increase. The LBC of the spot-welds made on
0% (as-received), 5, 10, and 15% pre-strained sheets decreases by
approximately 21, 23, 24.5, and 25.4% after immersion in 3.5%
sodium chloride solution for 40 days. Thus, the severity of
deterioration in LBC due to immersion in 3.5% sodium chloride
solution gets marginally enhanced with increasing pre-strain of
the sheets. Contrary to this observation, for dissimilar stainless
steel–non-stainless steel joints (EN1.4318 2H—ZStE260BH),
Alenius et al. [3] have reported that the LBC of specimens exposed
to 3.5% sodium chloride solution does not change significantly
even after 90 days of immersion. The EML of the spot-welds are
found to increase with increased duration of immersion; this can
be explained by increased extension of the base metal region
www.matcorr.com
Materials and Corrosion 2010, 61, No. 5 Strength of spot-welded steel sheets 403
Figure 8. Variation of failure load with immersion duration and pre-
strain of base metals: (a) load–displacements curves of the spot-welds
of as-received sheets for different duration of immersion, (b) variation
of failure load with immersion duration for the spot-welds of as-
received (0%) and pre-strained (5, 10, and 15%) sheets
Figure 9. (i) Cross-section of the failed spot-weld (a) nugget without
immersion, (b) nugget shows reduction in thickness after 40 days of
immersion. (ii) Failed spot-weld at the location of failure (c) nugget
does not exhibit any secondary cracking when tested without
immersion in 3.5% sodium chloride aqueous solution, (d) nugget tested
after immersion shows corrosion and secondary cracks indicated by
arrows near fracture surface. (iii) Fracture surface exhibits (e) dimples
when tested without immersion, (f) stretched surface embedded with
small voids and corrosion product when tested after immersion
which gets reduced in thickness due to corrosion with increased
duration of immersion. The spot-welds in the present study are
usually found to fail from the interface of HAZ–base metal
regime, except in samples immersed for 40 days in which failure
is observed to initiate at the base metal.
Representative cross-sectional views of the failed spot-welds
without and with immersion in 3.5% sodium chloride solution
are shown in Fig. 9a and b, respectively. Spot-welds subjected to
immersion in the aggressive solution exhibit reduction in
thickness of the weld joint and the conjugate sheets due to
corrosion as illustrated in Fig. 9a and b. The reduction in
thickness is found to increase with increased duration of
immersion. The spot-welds exhibit 11% reduction in thickness
after 40 days of immersion. Representative macrofractographs of
the failed nuggets are shown in Fig. 9c and d. Numerous
secondary cracks are observed at the corroded interface around
the weld nugget tested after immersion in the solution (Fig. 9d)
unlike that in specimens tested without immersion in 3.5%
sodium chloride solution (Fig. 9c). Thus, the decrease in LBC of
the immersed spot-welds can be explained by the reduction in
www.matcorr.com
thickness of the weld joints as well as relatively easy growth of
the secondary cracks formed due to corrosion. A comparative
examination of the broken fractured surfaces has been made
using representative microfractographs as shown in Fig. 9e and f.
This examination reveals large dimples (Fig. 9e) on the fractured
surfaces of the spot-weld tested without immersion unlike that for
the immersed specimens (Fig. 9f). Spot-weld broken after
immersion in the aggressive solution exhibits small dimples
associated with nearly smooth surface with ripples formed due to
stretching (Fig. 9f). Similar type of fracture mechanism has been
described by Brooks and Choudhury [15] in stainless steel.
3.5 Slow strain rate tensile test in 3.5% sodium chloride
solution
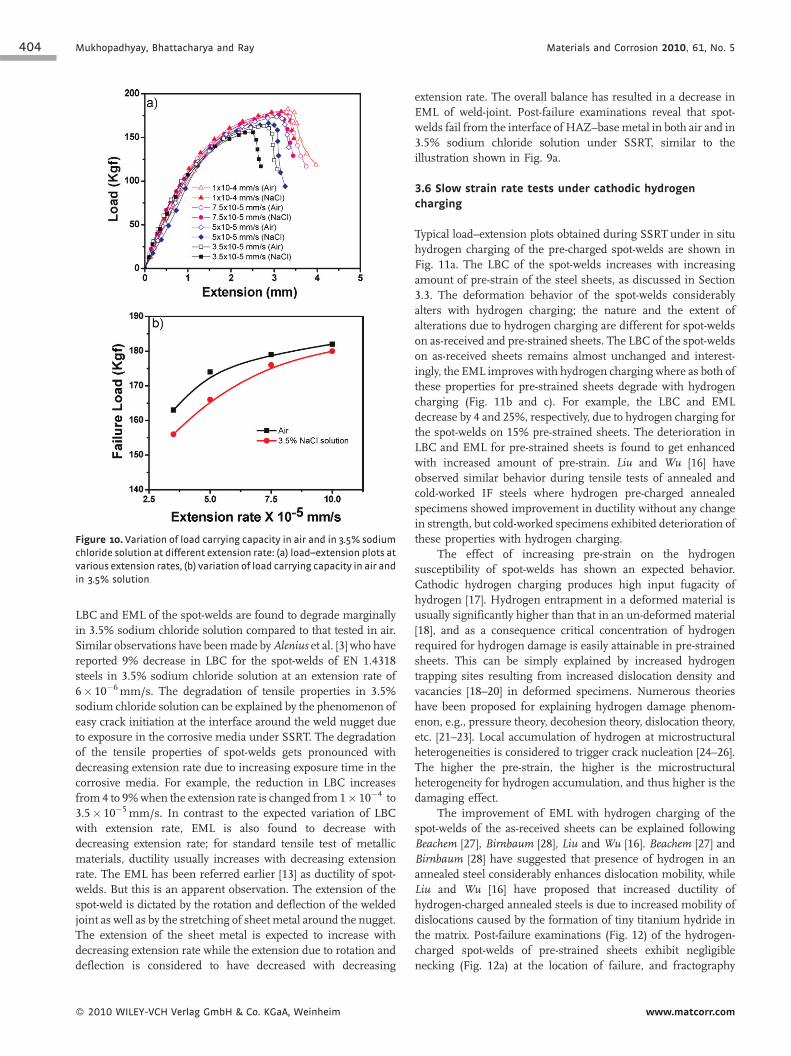
Load–extension plots for the spot-welds of the as-received sheets
tested in air and in 3.5% sodium chloride solution at different
extension rates are shown in Fig. 10a. The LBC of spot-welds in
air as well as in 3.5% sodium chloride solution decreases with
decreasing extension rate (Fig. 10b). The trend of the results in
Fig. 10b is in agreement with the conventional deformation
behavior of metallic materials. In addition, these results also
illustrate the difference between LBC of the welded joints in air
and in 3.5% sodium chloride solution. The tensile properties like
� 2010 WILEY-VCH Verlag GmbH & Co. KGaA, Weinheim
404 Mukhopadhyay, Bhattacharya and Ray Materials and Corrosion 2010, 61, No. 5
Figure 10. Variation of load carrying capacity in air and in 3.5% sodium
chloride solution at different extension rate: (a) load–extension plots at
various extension rates, (b) variation of load carrying capacity in air and
in 3.5% solution
LBC and EML of the spot-welds are found to degrade marginally
in 3.5% sodium chloride solution compared to that tested in air.
Similar observations have beenmade byAlenius et al. [3] who havereported 9% decrease in LBC for the spot-welds of EN 1.4318
steels in 3.5% sodium chloride solution at an extension rate of
6� 10�6mm/s. The degradation of tensile properties in 3.5%
sodium chloride solution can be explained by the phenomenon of
easy crack initiation at the interface around the weld nugget due
to exposure in the corrosive media under SSRT. The degradation
of the tensile properties of spot-welds gets pronounced with
decreasing extension rate due to increasing exposure time in the
corrosive media. For example, the reduction in LBC increases
from 4 to 9%when the extension rate is changed from 1� 10�4 to
3.5� 10�5mm/s. In contrast to the expected variation of LBC
with extension rate, EML is also found to decrease with
decreasing extension rate; for standard tensile test of metallic
materials, ductility usually increases with decreasing extension
rate. The EML has been referred earlier [13] as ductility of spot-
welds. But this is an apparent observation. The extension of the
spot-weld is dictated by the rotation and deflection of the welded
joint as well as by the stretching of sheet metal around the nugget.
The extension of the sheet metal is expected to increase with
decreasing extension rate while the extension due to rotation and
deflection is considered to have decreased with decreasing
� 2010 WILEY-VCH Verlag GmbH & Co. KGaA, Weinheim
extension rate. The overall balance has resulted in a decrease in
EML of weld-joint. Post-failure examinations reveal that spot-
welds fail from the interface of HAZ–basemetal in both air and in
3.5% sodium chloride solution under SSRT, similar to the
illustration shown in Fig. 9a.
3.6 Slow strain rate tests under cathodic hydrogen
charging
Typical load–extension plots obtained during SSRT under in situ
hydrogen charging of the pre-charged spot-welds are shown in
Fig. 11a. The LBC of the spot-welds increases with increasing
amount of pre-strain of the steel sheets, as discussed in Section
3.3. The deformation behavior of the spot-welds considerably
alters with hydrogen charging; the nature and the extent of
alterations due to hydrogen charging are different for spot-welds
on as-received and pre-strained sheets. The LBC of the spot-welds
on as-received sheets remains almost unchanged and interest-
ingly, the EML improves with hydrogen charging where as both of
these properties for pre-strained sheets degrade with hydrogen
charging (Fig. 11b and c). For example, the LBC and EML
decrease by 4 and 25%, respectively, due to hydrogen charging for
the spot-welds on 15% pre-strained sheets. The deterioration in
LBC and EML for pre-strained sheets is found to get enhanced
with increased amount of pre-strain. Liu and Wu [16] have
observed similar behavior during tensile tests of annealed and
cold-worked IF steels where hydrogen pre-charged annealed
specimens showed improvement in ductility without any change
in strength, but cold-worked specimens exhibited deterioration of
these properties with hydrogen charging.
The effect of increasing pre-strain on the hydrogen
susceptibility of spot-welds has shown an expected behavior.
Cathodic hydrogen charging produces high input fugacity of
hydrogen [17]. Hydrogen entrapment in a deformed material is
usually significantly higher than that in an un-deformed material
[18], and as a consequence critical concentration of hydrogen
required for hydrogen damage is easily attainable in pre-strained
sheets. This can be simply explained by increased hydrogen
trapping sites resulting from increased dislocation density and
vacancies [18–20] in deformed specimens. Numerous theories
have been proposed for explaining hydrogen damage phenom-
enon, e.g., pressure theory, decohesion theory, dislocation theory,
etc. [21–23]. Local accumulation of hydrogen at microstructural
heterogeneities is considered to trigger crack nucleation [24–26].
The higher the pre-strain, the higher is the microstructural
heterogeneity for hydrogen accumulation, and thus higher is the
damaging effect.
The improvement of EML with hydrogen charging of the
spot-welds of the as-received sheets can be explained following
Beachem [27], Birnbaum [28], Liu and Wu [16]. Beachem [27] and
Birnbaum [28] have suggested that presence of hydrogen in an
annealed steel considerably enhances dislocation mobility, while
Liu and Wu [16] have proposed that increased ductility of
hydrogen-charged annealed steels is due to increased mobility of
dislocations caused by the formation of tiny titanium hydride in
the matrix. Post-failure examinations (Fig. 12) of the hydrogen-
charged spot-welds of pre-strained sheets exhibit negligible
necking (Fig. 12a) at the location of failure, and fractography
www.matcorr.com

Materials and Corrosion 2010, 61, No. 5 Strength of spot-welded steel sheets 405
Figure 11. Variation of load carrying capacity and extension up to
maximum load (EML) of the spot-welds of as-received and pre-strained
sheets under in situ hydrogen charging: (a) load–extension curves,
(b) comparison of failure loads with and without hydrogen charging,
and (c) variation of extension up to maximum load (EML) with and
without hydrogen charging
Figure 12. SEM micrographs of fracture surface of the spot-welds
tested (i) with hydrogen charging: (a) macroview of the failed weld-
nugget, (b) overview of the fracture surface, (c) magnified view of the
fracture surface, and (ii) without hydrogen charging (d) fractography of
the spot-weld tested in air showing elongated dimples associated with
serpentine glide
reveals predominantly planar quasi-cleavage type fracture
(Fig. 12b and c) indicating relative brittleness unlike specimens
fractured without hydrogen charging; in the latter, pronounced
necking is observed at the location of failure and the fracture
surface exhibits elongated dimples associated with serpentine
glide indicating ductile fracture. The observed features on
the fractured specimens of spot-welds with hydrogen charging,
on the other hand, appear to support the de-cohesionmechanism.
www.matcorr.com
4 Conclusions
Spot-welded joints of TS configuration have been made on as-
received and pre-strained sheets of an IF steel to determine their
deformation behavior in 3.5% sodium chloride solution. The
effect of 3.5% sodium chloride solution on the strength of spot-
welded joints has been determined under three different test
conditions: (i) after immersing the samples in the solution for
various duration of time, e.g., 10, 20, and 40 days followed by
tensile tests, (ii) tests at various extension rates by keeping the
samples in solution, and (iii) tests at slow strain rate under in situ
hydrogen charging. Post-failure examinations have been carried
out to understand the failure mechanism. Analyses of the results
lead to the following major conclusions:
(i) T
he LBC decreases while EML, increases with increasedduration of immersion of the spot-welded joints in 3.5%
sodium chloride solution. The decrease in LBC of the joints
has been explained by the reduction in their thickness and
easy crack initiation due to the attack of corrosive
environment. The increase in EML of the spot-welds has
been explained in terms of increased extension of the base
metal part, which is found to be reduced in thickness by
corrosion with increased duration of immersion.
(ii) T
he LBC and EML of the spot-welds in pre-strained sheetsconsiderably deteriorate with hydrogen absorption while
LBC remains almost unchanged and EML is found to
improve for as-received sheets. This phenomenon can be
explained by higher entrapment of hydrogen in the spot-
welded joints of pre-strained sheets due to their increased
dislocation density and vacancy concentration.
(iii) T
he influence of corrosive environment in deteriorating LBCand EML of the spot-welds of pre-strained sheets increases
with increasing pre-strain.
(iv) T
he LBC and EML of the spot-welds under SSRT in 3.5%sodium chloride solution decrease marginally. The influence
� 2010 WILEY-VCH Verlag GmbH & Co. KGaA, Weinheim
406 Mukhopadhyay, Bhattacharya and Ray Materials and Corrosion 2010, 61, No. 5
� 20
of the corrosive media gets pronounced with decreasing
strain rate; this is due to higher duration of exposure in the
solution at slower strain rate.
Acknowledgements: The authors would like to thank Tata Steel
Ltd., Jamshedpur, India for their financial support to this work via
grant no. R&D-SS/PROD-SM/IN-02/45/09. One of the authors
(G.M.) would also like to thank Tata Steel Ltd. for sponsoring his
graduate studies at the Indian Institute of Technology, Kharagpur.
5 References
[1] D. A. Jones, N. R. Nair, Corrosion 1985, 41, 357.[2] M. E. Somervuori, L. S. Johansson, M. H. Heinonen,
D. H. D. van Hoecke, N. Akdut, H. E. Hanninen, Mater.Corros. 2004, 55, 421.
[3] M. Alenius, P. Pohjanne, M. Somervuori, H. Hanninen,Welding J. 2006, 85, 305s.
[4] M. T. Alenius, M. E. Somervuori, H. E. H. Hanninen,Mater.Corros. 2008, 59, 296.
[5] ASTM Standard E112-03, 2003, Standard Test Methods forDetermining Average Grain Size. Annual Book of ASTMStandards. West Conshohocken, PA, USA.
[6] ASTM Standard E-8M-03, 2003, Standard Test Methods forTension testing of Metallic Materials (Metric). Annual Bookof ASTM Standards. West Conshohocken, PA, USA.
[7] B. Chang, Y. Shi, L. Lu, J. Mater. Process. Technol. 2001, 108,307.
10 WILEY-VCH Verlag GmbH & Co. KGaA, Weinheim
[8] Y. J. Chao, J. Eng. Mater. Technol. ASME 2003, 125, 125.[9] S. Aslanlar, Mater. Des. 2006, 27, 125.[10] M. E. Barkey, H. Kang, Exp. Tech. 1999, 23, 20.[11] K. W. Ewing, M. Cheresh, R. Thompson, P. Kukuchek, 1982,
SAE Technical paper, No. 820281, Society of AutomotiveEngineers, Warrendale, PA.
[12] G. Mukhopadhyay, S. Bhattacharya, K. K. Ray, J. Mater.Process. Technol. 2009, 209, 1995.
[13] M. Zhou, S. J. Hu, H. Zhang, Welding Res. Suppl. 1999, 78,305s.
[14] G. Mukhopadhyay, S. Bhattacharya, K. K. Ray, Mater. Des.2009, 30, 2345.
[15] C. R. Brooks, A. Choudhury, Failure Analysis of EngineeringMaterials, McGraw-Hill Professional, United States 2001.
[16] P. W. Liu, J. K. Wu, Mater. Lett. 2003, 57, 1224.[17] R. A. Oriani, Ann. Rev. Mater. Sci. 1978, 8, 327.[18] U. Hadam, T. Zakroczymski, Int. J. Hydrogen Energy 2009,
34, 2449.[19] B. Russel, P. Vela, Phil. Mag. 1963, 8, 677.[20] M. Nagumo, K. Takai, N. Okuda, J. Alloys Compd. 1999, 293-
295, 310.[21] A. R. Troiano, Hydrogen Embrittlement and Stress Corrosion
Cracking, ASM International, London, 1984.[22] J. Cwiek, A. Zielinski, J. Achiev. Mater. Manuf. Eng. 2006, 18,
207.[23] R. A. Oriani, Scripta Metall. 1979, 13, 479.[24] H. J. Maier, W. Popp, H. Kaesche, Acta Metall. 1987, 35, 875.[25] V. A. Marichev, Prot. Met. 1980, 16, 427.[26] L. Coudreuse, J. Charles, Corros. Sci. 1987, 27, 1169.[27] C. D. Beachem, Metall. Trans. 1972, 3, 437.[28] H. K. Birnbaum, in: N. R. A. W. Moody, Thompson (Eds.),
Hydrogen Effects on Material Behavior, TMS, Warrendale, PA,1990.
(Received: June 14, 2009)
(Accepted: July 6, 2009)
W5427
www.matcorr.com