A Numerical Evaluation of Structural Hot-Spot Stress ... - MDPI
19
applied sciences Article A Numerical Evaluation of Structural Hot-Spot Stress Methods in Rib-To-Deck Joint of Orthotropic Steel Deck Nouman Iqbal * , Heng Fang, Ahsan Naseem , Muhammad Kashif and Hans De Backer Department of Civil Engineering, Ghent University, Technologiepark 60, B-9052 Zwijnaarde, Belgium; [email protected] (H.F.); [email protected] (A.N.); [email protected] (M.K.); [email protected] (H.D.B.) * Correspondence: [email protected] Received: 7 September 2020; Accepted: 29 September 2020; Published: 2 October 2020 Abstract: This study numerically investigates the limitations of structural hot-spot stress (SHSS) methods and proposes a guideline for the calculation of hot-spot stresses, which can be used for the better evaluation of fatigue-related problems. Four different SHSS evaluation methods have been applied to the rib-to-deck (RD) welded joint in orthotropic steel deck (OSD). These methods are used to calculate SHSS at this critical joint utilizing finite element analyses (FEA) based software Siemens NX.12. The limitations and the accuracy of these methods have been observed under different element types and meshing techniques. Moreover, the effect of the nodal-averaging feature is being studied. Two types of governing stresses are produced by the application of Eurocode fatigue load model-4. Essentially, the bending in deck-plate produces highly non-linear stress at the deck-toe, and the membrane effect in rib-plate generates linear stress at the rib-toe. Guidelines are proposed considering different parameters on these two stress states by applying SHSS evaluation methods. In comparison to other SHSS approaches, the International Institute of Welding (IIW) quadratic stress extrapolation (QSE) method shows better results for solid single-element, and the American Society of Mechanical Engineers (ASME) through thickness stress linearization (TTSL) method stands out in solid cubic-mesh technique. In general, shell elements have more consistent SHSS results as compared to solid elements for both stress states. Keywords: structural hot-spot stress; rib-to-deck joint; orthotropic steel deck; finite element analysis; surface stress extrapolation; bending stress; through thickness stress linearization 1. Introduction Fatigue failure of welded joints is a highly localized phenomenon which normally comprises crack initiation and propagation near weld-toe, while design guidelines given in the different codes roughly incorporate local stresses. These structural design guidelines typically consider nominal stresses which are based on S-N curves derived from large fatigue test data [1]. Fatigue strength is assessed by selecting an appropriate SN curve for the specific weld detail. This strength normally represents a 97.7% survival probability for the respected weld detail [2]. In “global or nominal stress approaches”, the strength assessment is made directly from the applied loads or through the nominal stresses in a critical cross-section. The shortcoming of this design approach is that it only takes into account the global behaviour of the complex welded details, where nominal stress cannot be defined implicitly. Therefore, the local stress approaches should be applied for a better understanding of stresses in these fatigue prone welded joints. To overcome these problems, different methods have been developed based on local stress approaches for the fatigue life assessment of welded structures [1,3–6]. The application of these Appl. Sci. 2020, 10, 6924; doi:10.3390/app10196924 www.mdpi.com/journal/applsci
-
Upload
khangminh22 -
Category
Documents
-
view
2 -
download
0
Transcript of A Numerical Evaluation of Structural Hot-Spot Stress ... - MDPI
applied sciences
Article
A Numerical Evaluation of Structural Hot-Spot StressMethods in Rib-To-Deck Joint of OrthotropicSteel Deck
Nouman Iqbal * , Heng Fang, Ahsan Naseem , Muhammad Kashif and Hans De BackerDepartment of Civil Engineering, Ghent University, Technologiepark 60, B-9052 Zwijnaarde, Belgium;[email protected] (H.F.); [email protected] (A.N.); [email protected] (M.K.);[email protected] (H.D.B.)* Correspondence: [email protected]
Received: 7 September 2020; Accepted: 29 September 2020; Published: 2 October 2020�����������������
Abstract: This study numerically investigates the limitations of structural hot-spot stress (SHSS)methods and proposes a guideline for the calculation of hot-spot stresses, which can be used for thebetter evaluation of fatigue-related problems. Four different SHSS evaluation methods have beenapplied to the rib-to-deck (RD) welded joint in orthotropic steel deck (OSD). These methods are usedto calculate SHSS at this critical joint utilizing finite element analyses (FEA) based software SiemensNX.12. The limitations and the accuracy of these methods have been observed under differentelement types and meshing techniques. Moreover, the effect of the nodal-averaging feature is beingstudied. Two types of governing stresses are produced by the application of Eurocode fatigue loadmodel-4. Essentially, the bending in deck-plate produces highly non-linear stress at the deck-toe,and the membrane effect in rib-plate generates linear stress at the rib-toe. Guidelines are proposedconsidering different parameters on these two stress states by applying SHSS evaluation methods.In comparison to other SHSS approaches, the International Institute of Welding (IIW) quadratic stressextrapolation (QSE) method shows better results for solid single-element, and the American Societyof Mechanical Engineers (ASME) through thickness stress linearization (TTSL) method stands out insolid cubic-mesh technique. In general, shell elements have more consistent SHSS results as comparedto solid elements for both stress states.
Keywords: structural hot-spot stress; rib-to-deck joint; orthotropic steel deck; finite element analysis;surface stress extrapolation; bending stress; through thickness stress linearization
1. Introduction
Fatigue failure of welded joints is a highly localized phenomenon which normally comprisescrack initiation and propagation near weld-toe, while design guidelines given in the different codesroughly incorporate local stresses. These structural design guidelines typically consider nominalstresses which are based on S-N curves derived from large fatigue test data [1]. Fatigue strength isassessed by selecting an appropriate SN curve for the specific weld detail. This strength normallyrepresents a 97.7% survival probability for the respected weld detail [2]. In “global or nominal stressapproaches”, the strength assessment is made directly from the applied loads or through the nominalstresses in a critical cross-section. The shortcoming of this design approach is that it only takes intoaccount the global behaviour of the complex welded details, where nominal stress cannot be definedimplicitly. Therefore, the local stress approaches should be applied for a better understanding ofstresses in these fatigue prone welded joints.
To overcome these problems, different methods have been developed based on local stressapproaches for the fatigue life assessment of welded structures [1,3–6]. The application of these
Appl. Sci. 2020, 10, 6924; doi:10.3390/app10196924 www.mdpi.com/journal/applsci
Appl. Sci. 2020, 10, 6924 2 of 19
methods depends upon the field of engineering and also varies within research groups in differentparts of the world. In “local approaches” the strength assessment is made from local strains or stressesin the specified weld detail. This can either be done by the local strain measurement from the straingauges or by the local stress calculation using the finite element analyses (FEA) method. However,there are several complications associated with the local stress approaches due to inhomogeneousmaterial, welding imperfections, and residual stresses present in weld detail [7,8]. These anomalies arenormally found in the areas near to the weld-toe and the weld-root. Moreover, local approaches arevery sensitive to weld profile or geometric parameters, because stresses near weld vary non-linearlyand exact weld geometry is not known before the welding. Therefore, it is difficult to accuratelypredict the stresses near the weld-toe or the weld-root, as weld profile depends upon welding method,welding material, and plate thickness. Consequently, these local approaches may lead to inaccurateresults due to irregularity in the weld geometry.
Another approach that provides a link between these two (global and local) stress approaches andless demanding than local stress approaches is the “structural hot-spot stress approach”. This approachcan be used to measure strain by the application of strain gauges to the specified reference pointsor to calculate stresses from the FEA of the specified weld detail. This approach is computationallyless demanding as compared to local stress approach, because it only takes into account the stressconcentration effect produced by the geometrical constraint at the expected crack initiation point whileexcluding the non-linear stress peak caused by the sharp notch at the weld-toe. By using this approach,we can measure the fatigue strength of a welded joint without considering the weld profile itself,which saves a great deal of time and effort. Moreover, the exact dimensions of the weld are not knownto us before its fabrication, and there are many irregularities associated with the weld profile whichdirectly influence the local stresses, but this approach is less affected by the weld profile or the localnotch effect, because it only considers the stress raising effects caused by weld geometry.
There are various fatigue assessment methods, and there are numerous fatigue-related problems.We cannot generalize a specific method for all the fatigue-related problems in the industry, because itrestricts any further development in these local stress approaches. However, some methods are wellrecognized for certain weld details. In this regard, the International Institute of Welding (IIW) has madesignificant progress in the standardization of local stress approaches and compiled a designer guidelinefor the fatigue analysis of the plate-type welded structures. This guide provides an overview for thefatigue life assessment of welded connections using different structural hot-spot stress (SHSS) methodsand also provides application with examples using FEA [1]. However, these guidelines are not widelyaccepted in the field or the design office, because there are some uncertainties present in their usage.The SHSS methods are generally considered to be practical for fatigue analysis of welded structureswhen using FEA for assessment, but there are some questions that remain open when applying thesemethods to complex welded details, such as the effect of element type, mesh size, nodal-averaging, etc.In addition, the fatigue life prediction may be strongly affected by large variations in the local weldprofile, which should be kept in mind when assessing the reliability of these methods. Furthermore,the practicality is very important for industrial application. In this respect, the testing engineer inthe field and the structural designer at the office must have some well-established methods for themeasurement of local strains and stresses to evaluate the fatigue life of the structures. Therefore,to overcome these uncertainties, an extensive study was carried out by considering a complex weldeddetail in an orthotropic steel deck (OSD) that connects the steel deck to the longitudinal-rib and usuallyknown as a rib-to-deck (RD) joint [9,10]. The OSD models were simulated and tested on a finite elementmethod (FEM) based software Siemens NX.12.0. The limitations and the accuracy of these methodswere investigated under different element types and meshing techniques. Moreover, the effect of thenodal-averaging feature was studied on each mesh variation. Two types of governing stresses wereproduced in the RD joint by the application of the Eurocode fatigue load model-4 [11], i.e., non-linearstress in the deck-plate and linear stress in the rib-plate. At the end of this paper, a guideline is
Appl. Sci. 2020, 10, 6924 3 of 19
proposed to evaluate SHSS by using these methods. The details of the methods used in this study aregiven in the next section.
2. Structural Hot-Spot Stress Evaluation Approach
The SHSS approach determines the macro structural behaviour of the welded component withoutconsideration of the local notch effect. It simply means that it incorporates the stress concentrationeffect induced by the change in weld geometry but does not include the non-linear stress raising effectproduced by the weld profile itself. This approach was developed for the fatigue analysis of weldedcircular tubes and then was extended to the rectangular tubular joints in offshore structures [12,13].Later on, it was also used for the plate-type structures and became a part of the British standard (BS) [14]and the Eurocode-3 [2]. It has now replaced the nominal stress approach in these areas of application.It is named “hot-spot” because of the temperature rise produced by the cyclic plastic deformationbefore the crack initiation at the respected joint. For the determination of stress, the hot-spot or thepoint of crack initiation should be known in advance, and it should be accessible for the applicationof strain gauges. After the advancement in computer applications, researchers have now developedsome FEA methods to find out hot-spot stress at the weld-root, but they are not practicable, whereasthere are various methods available for the determination of SHSS at the weld-toe [15]. These methodsare either based on the surface stress extrapolation at different reference points on the outer surface ofthe plate to the weld-toe or linearization of the stress through the thickness of the plate at the weld-toe.The explanation of each method is given in the next section.
2.1. IIW Surface Stress Extrapolation Methods
This method is based on the extrapolation of surface stress at the specified locations. The structuralstress component acting normally to the weld-toe is the main cause of fatigue crack initiation in thewelded component. This normal stress can be determined through strain measurements at differentreference points and then extrapolated to the weld-toe for the evaluation of SHSS. For the betterestimation of stresses, strain rosettes are recommended instead of uniaxial strain gauges, especiallywhen the direction of principal stresses is unknown. Otherwise, FEA can be used for the evaluation ofSHSS. There are several formulations available on the positioning of reference points from the weld-toe,but the recommendations given by ECSC (European Coal and Steel Community) and CIDECT (ComitéInternational pour le Développement et l’Étude de la Construction Tubulaire) [16,17] are adopted,because these are applicable to both tubular and non-tubular joints. These studies are summarized inIIW recommendations [1,3].
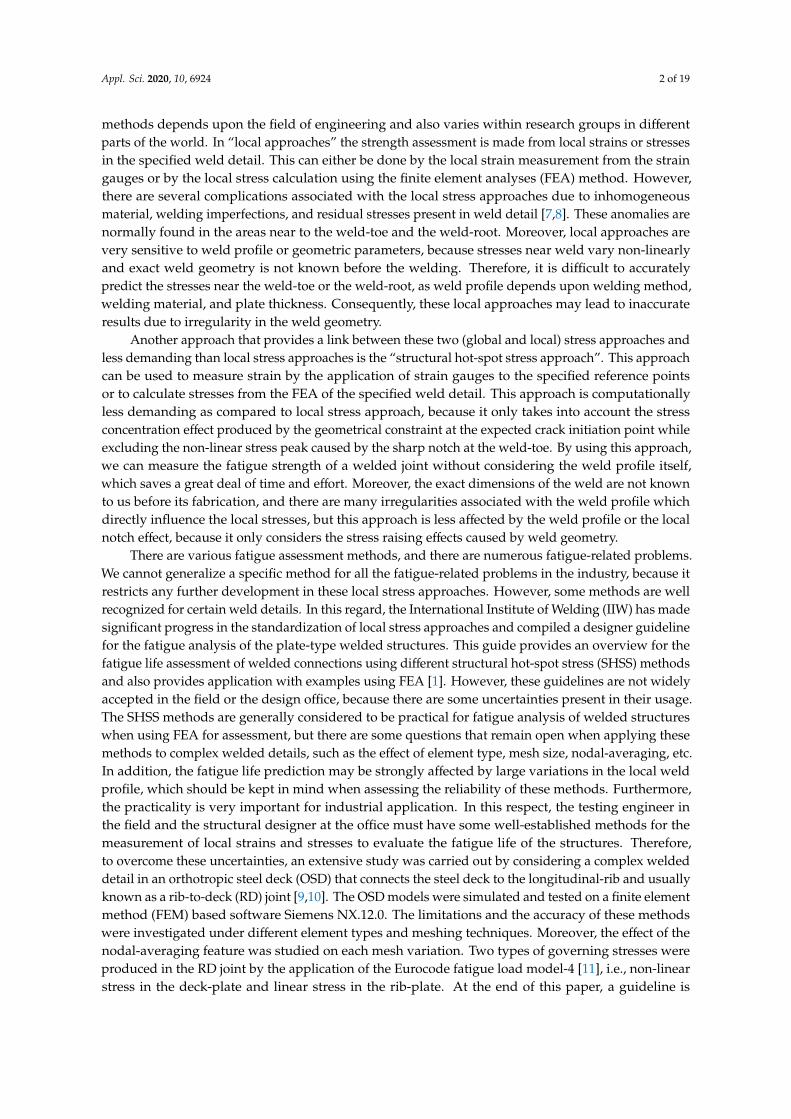
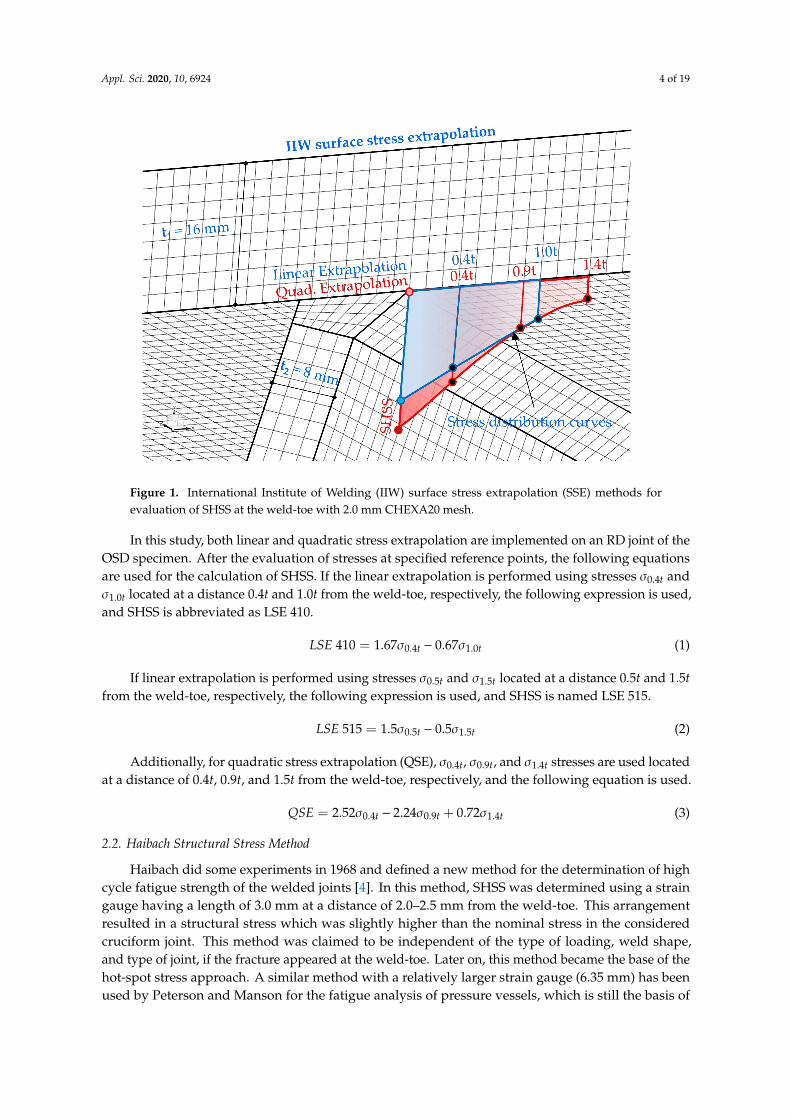
After the advancement in computational analysis, the finite element-based models are preferredtoday for the evaluation of SHSS. Normally, linear stress extrapolation (LSE) is used for the determinationof SHSS at the weld-toe, but if the increase in stress is highly non-linear near the weld-toe, then thequadratic stress extrapolation (QSE) method is preferred. For LSE, two reference points are used, whilethree or more reference points are required for the QSE method [1]. The distance of the reference pointsfrom the weld-toe normally depends upon the plate thickness (t). According to IIW recommendations,two reference points at 0.4t and 1.0t or 0.5t and 1.5t from the weld-toe can be used in LSE method forthe finer and coarser mesh, respectively. While, for QSE, three reference points are recommended at adistance of 0.4t, 0.9t, and 1.4t from the weld-toe, respectively. The detail of these methods according toIIW recommendations is shown in Figure 1.
Appl. Sci. 2020, 10, 6924 4 of 19
Figure 1. International Institute of Welding (IIW) surface stress extrapolation (SSE) methods forevaluation of SHSS at the weld-toe with 2.0 mm CHEXA20 mesh.
In this study, both linear and quadratic stress extrapolation are implemented on an RD joint of theOSD specimen. After the evaluation of stresses at specified reference points, the following equationsare used for the calculation of SHSS. If the linear extrapolation is performed using stresses σ0.4t andσ1.0t located at a distance 0.4t and 1.0t from the weld-toe, respectively, the following expression is used,and SHSS is abbreviated as LSE 410.
LSE 410 = 1.67σ0.4t − 0.67σ1.0t (1)
If linear extrapolation is performed using stresses σ0.5t and σ1.5t located at a distance 0.5t and 1.5tfrom the weld-toe, respectively, the following expression is used, and SHSS is named LSE 515.
LSE 515 = 1.5σ0.5t − 0.5σ1.5t (2)
Additionally, for quadratic stress extrapolation (QSE), σ0.4t, σ0.9t, and σ1.4t stresses are used locatedat a distance of 0.4t, 0.9t, and 1.5t from the weld-toe, respectively, and the following equation is used.
QSE = 2.52σ0.4t − 2.24σ0.9t + 0.72σ1.4t (3)
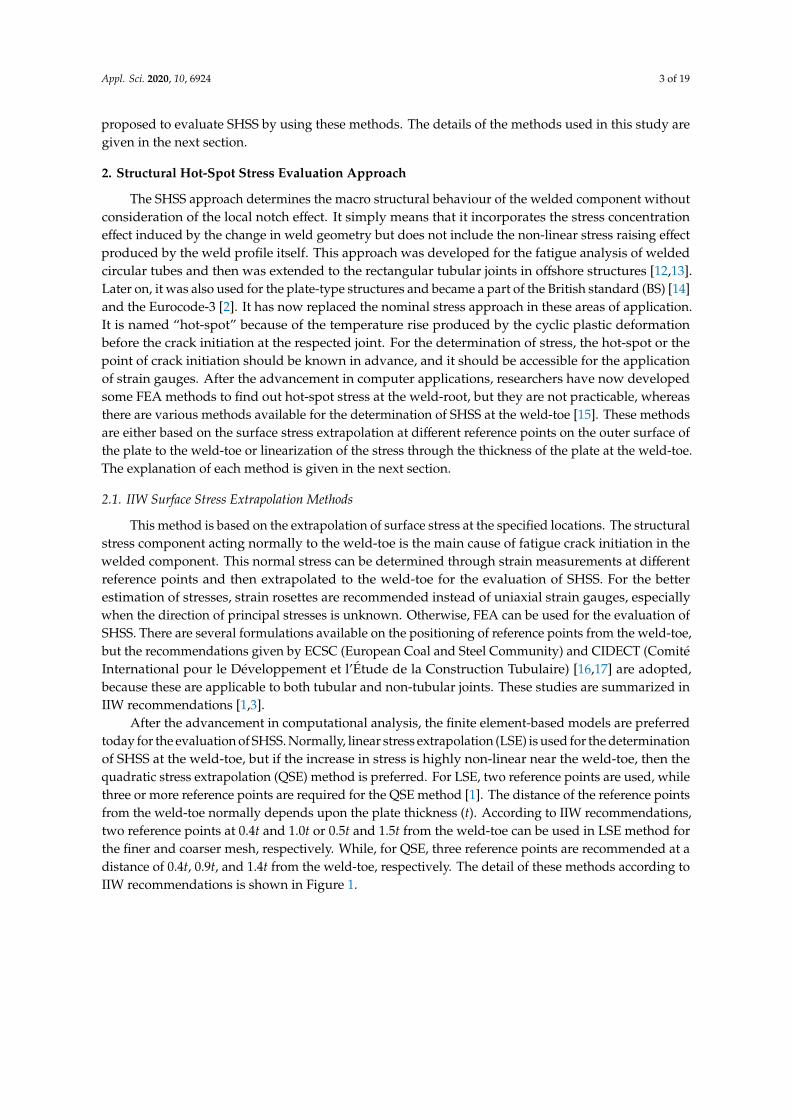
2.2. Haibach Structural Stress Method
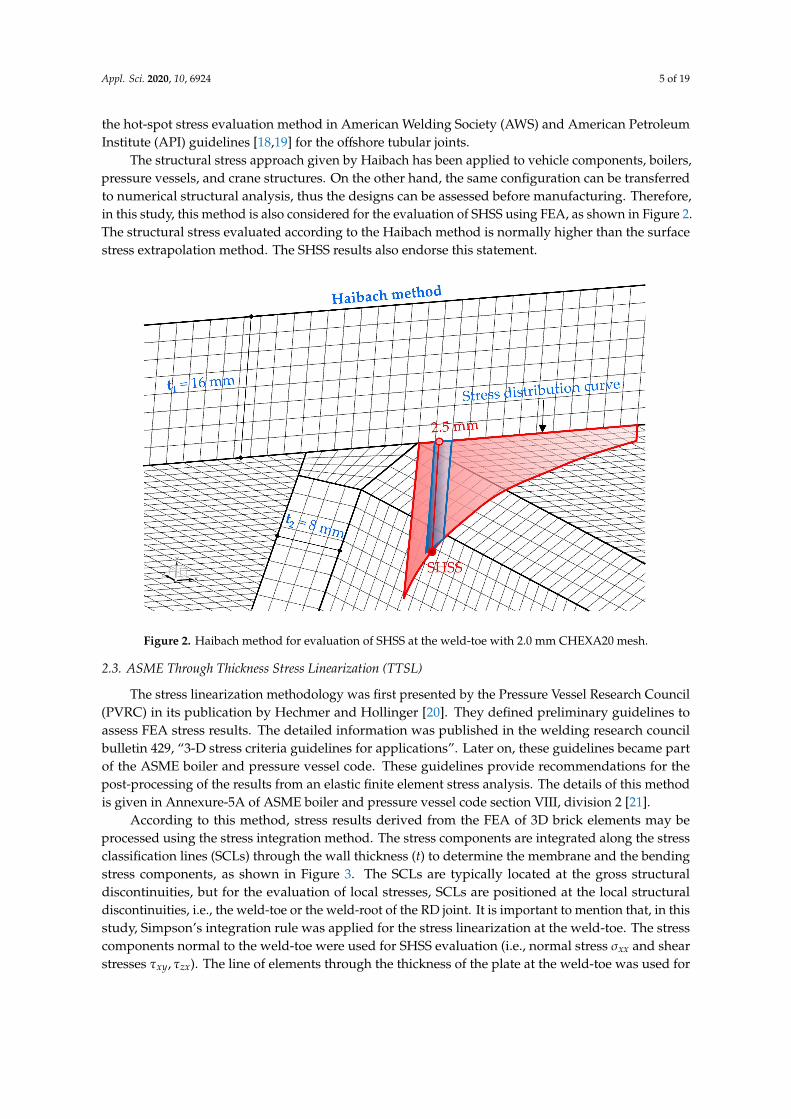
Haibach did some experiments in 1968 and defined a new method for the determination of highcycle fatigue strength of the welded joints [4]. In this method, SHSS was determined using a straingauge having a length of 3.0 mm at a distance of 2.0–2.5 mm from the weld-toe. This arrangementresulted in a structural stress which was slightly higher than the nominal stress in the consideredcruciform joint. This method was claimed to be independent of the type of loading, weld shape,and type of joint, if the fracture appeared at the weld-toe. Later on, this method became the base of thehot-spot stress approach. A similar method with a relatively larger strain gauge (6.35 mm) has beenused by Peterson and Manson for the fatigue analysis of pressure vessels, which is still the basis of
Appl. Sci. 2020, 10, 6924 5 of 19
the hot-spot stress evaluation method in American Welding Society (AWS) and American PetroleumInstitute (API) guidelines [18,19] for the offshore tubular joints.
The structural stress approach given by Haibach has been applied to vehicle components, boilers,pressure vessels, and crane structures. On the other hand, the same configuration can be transferredto numerical structural analysis, thus the designs can be assessed before manufacturing. Therefore,in this study, this method is also considered for the evaluation of SHSS using FEA, as shown in Figure 2.The structural stress evaluated according to the Haibach method is normally higher than the surfacestress extrapolation method. The SHSS results also endorse this statement.
Figure 2. Haibach method for evaluation of SHSS at the weld-toe with 2.0 mm CHEXA20 mesh.
2.3. ASME Through Thickness Stress Linearization (TTSL)
The stress linearization methodology was first presented by the Pressure Vessel Research Council(PVRC) in its publication by Hechmer and Hollinger [20]. They defined preliminary guidelines toassess FEA stress results. The detailed information was published in the welding research councilbulletin 429, “3-D stress criteria guidelines for applications”. Later on, these guidelines became partof the ASME boiler and pressure vessel code. These guidelines provide recommendations for thepost-processing of the results from an elastic finite element stress analysis. The details of this methodis given in Annexure-5A of ASME boiler and pressure vessel code section VIII, division 2 [21].
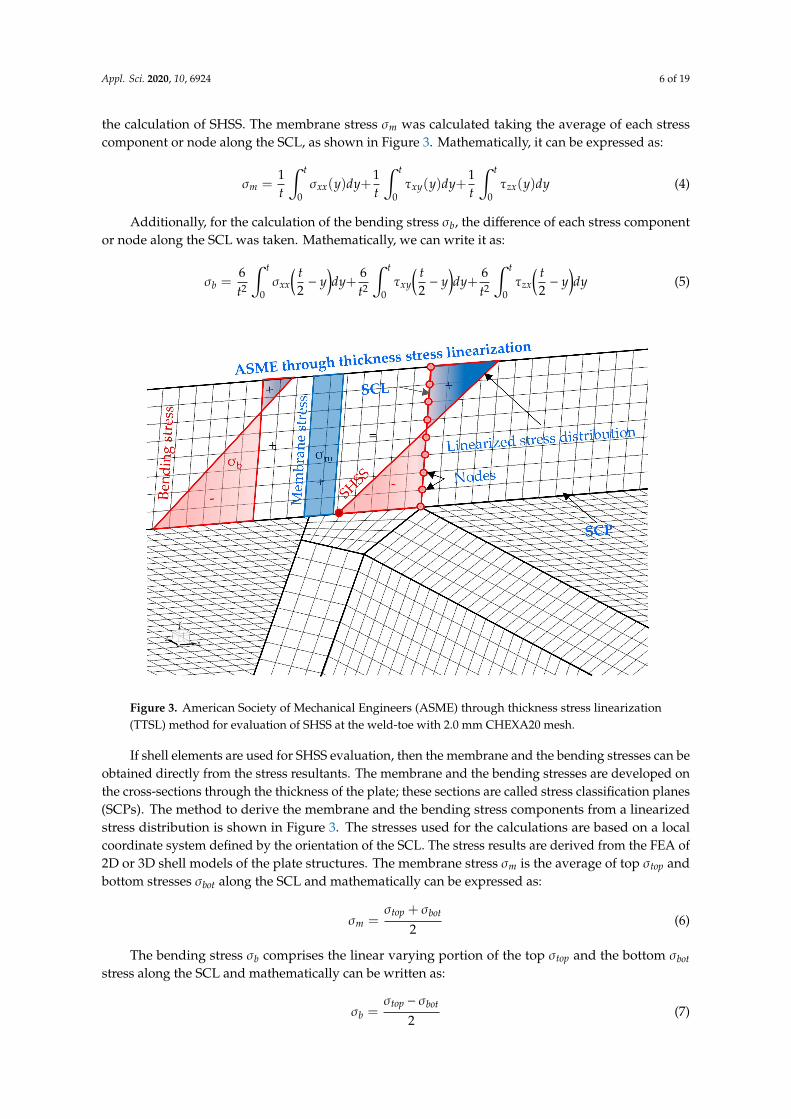
According to this method, stress results derived from the FEA of 3D brick elements may beprocessed using the stress integration method. The stress components are integrated along the stressclassification lines (SCLs) through the wall thickness (t) to determine the membrane and the bendingstress components, as shown in Figure 3. The SCLs are typically located at the gross structuraldiscontinuities, but for the evaluation of local stresses, SCLs are positioned at the local structuraldiscontinuities, i.e., the weld-toe or the weld-root of the RD joint. It is important to mention that, in thisstudy, Simpson’s integration rule was applied for the stress linearization at the weld-toe. The stresscomponents normal to the weld-toe were used for SHSS evaluation (i.e., normal stress σxx and shearstresses τxy, τzx). The line of elements through the thickness of the plate at the weld-toe was used for
Appl. Sci. 2020, 10, 6924 6 of 19
the calculation of SHSS. The membrane stress σm was calculated taking the average of each stresscomponent or node along the SCL, as shown in Figure 3. Mathematically, it can be expressed as:
σm =1t
∫ t
0σxx(y)dy+
1t
∫ t
0τxy(y)dy+
1t
∫ t
0τzx(y)dy (4)
Additionally, for the calculation of the bending stress σb, the difference of each stress componentor node along the SCL was taken. Mathematically, we can write it as:
σb =6t2
∫ t
0σxx
( t2− y
)dy+
6t2
∫ t
0τxy
( t2− y
)dy+
6t2
∫ t
0τzx
( t2− y
)dy (5)
Figure 3. American Society of Mechanical Engineers (ASME) through thickness stress linearization(TTSL) method for evaluation of SHSS at the weld-toe with 2.0 mm CHEXA20 mesh.
If shell elements are used for SHSS evaluation, then the membrane and the bending stresses can beobtained directly from the stress resultants. The membrane and the bending stresses are developed onthe cross-sections through the thickness of the plate; these sections are called stress classification planes(SCPs). The method to derive the membrane and the bending stress components from a linearizedstress distribution is shown in Figure 3. The stresses used for the calculations are based on a localcoordinate system defined by the orientation of the SCL. The stress results are derived from the FEA of2D or 3D shell models of the plate structures. The membrane stress σm is the average of top σtop andbottom stresses σbot along the SCL and mathematically can be expressed as:
σm =σtop + σbot
2(6)
The bending stress σb comprises the linear varying portion of the top σtop and the bottom σbotstress along the SCL and mathematically can be written as:
σb =σtop − σbot
2(7)
Appl. Sci. 2020, 10, 6924 7 of 19
After the calculation of the membrane stress (σm) and bending stress (σb) from a 3D solid or shellmodel, the SHSS can be determined by adding them together.
σSHSS = σm + σb (8)
2.4. Xiao and Yamada Structural Stress Method
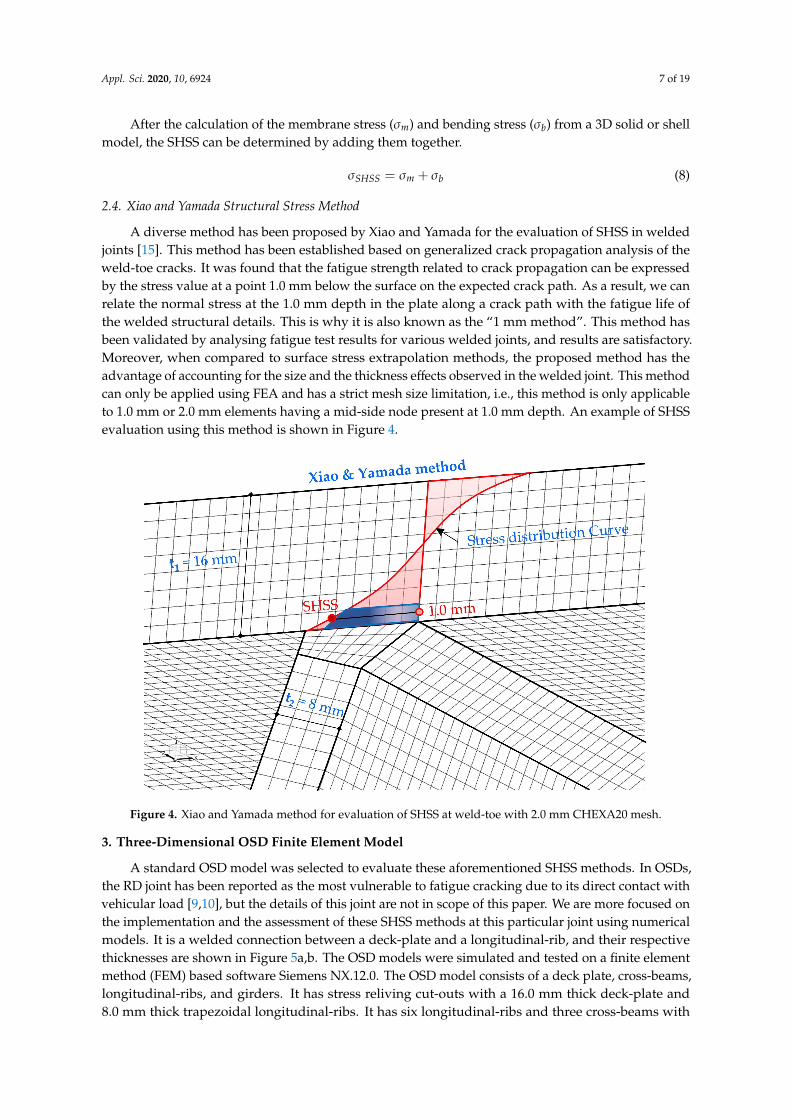
A diverse method has been proposed by Xiao and Yamada for the evaluation of SHSS in weldedjoints [15]. This method has been established based on generalized crack propagation analysis of theweld-toe cracks. It was found that the fatigue strength related to crack propagation can be expressedby the stress value at a point 1.0 mm below the surface on the expected crack path. As a result, we canrelate the normal stress at the 1.0 mm depth in the plate along a crack path with the fatigue life ofthe welded structural details. This is why it is also known as the “1 mm method”. This method hasbeen validated by analysing fatigue test results for various welded joints, and results are satisfactory.Moreover, when compared to surface stress extrapolation methods, the proposed method has theadvantage of accounting for the size and the thickness effects observed in the welded joint. This methodcan only be applied using FEA and has a strict mesh size limitation, i.e., this method is only applicableto 1.0 mm or 2.0 mm elements having a mid-side node present at 1.0 mm depth. An example of SHSSevaluation using this method is shown in Figure 4.
Figure 4. Xiao and Yamada method for evaluation of SHSS at weld-toe with 2.0 mm CHEXA20 mesh.
3. Three-Dimensional OSD Finite Element Model
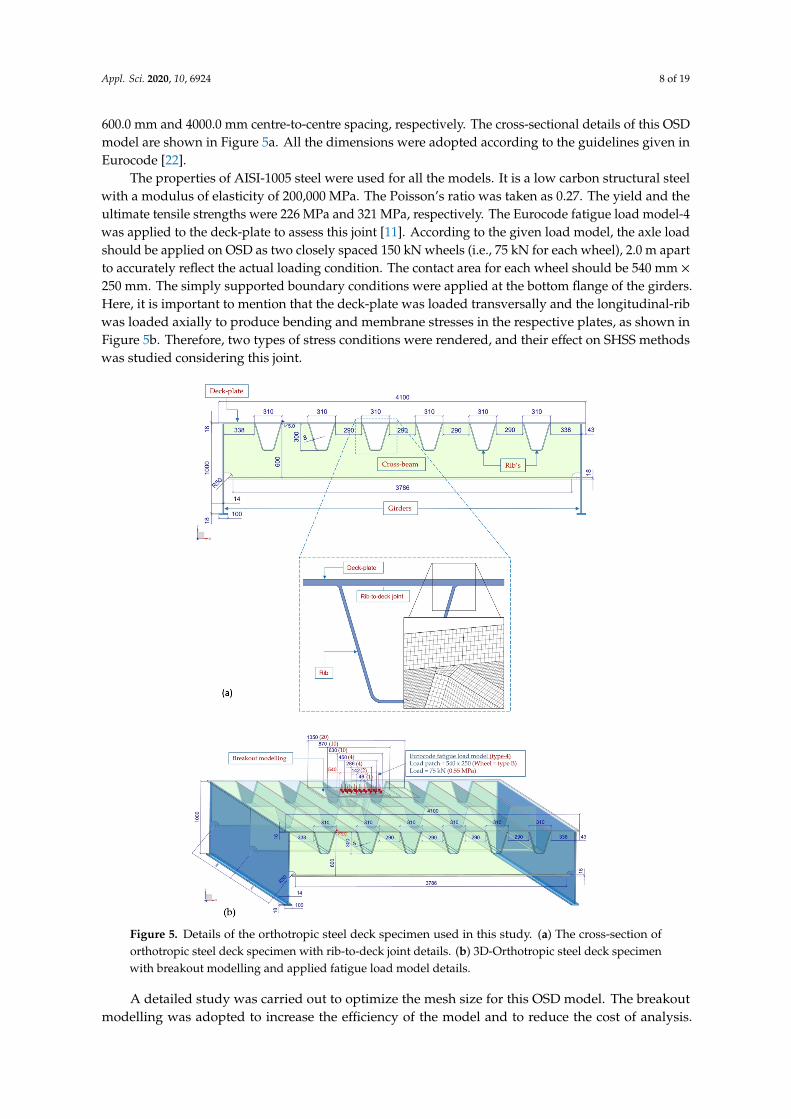
A standard OSD model was selected to evaluate these aforementioned SHSS methods. In OSDs,the RD joint has been reported as the most vulnerable to fatigue cracking due to its direct contact withvehicular load [9,10], but the details of this joint are not in scope of this paper. We are more focused onthe implementation and the assessment of these SHSS methods at this particular joint using numericalmodels. It is a welded connection between a deck-plate and a longitudinal-rib, and their respectivethicknesses are shown in Figure 5a,b. The OSD models were simulated and tested on a finite elementmethod (FEM) based software Siemens NX.12.0. The OSD model consists of a deck plate, cross-beams,longitudinal-ribs, and girders. It has stress reliving cut-outs with a 16.0 mm thick deck-plate and8.0 mm thick trapezoidal longitudinal-ribs. It has six longitudinal-ribs and three cross-beams with
Appl. Sci. 2020, 10, 6924 8 of 19
600.0 mm and 4000.0 mm centre-to-centre spacing, respectively. The cross-sectional details of this OSDmodel are shown in Figure 5a. All the dimensions were adopted according to the guidelines given inEurocode [22].
The properties of AISI-1005 steel were used for all the models. It is a low carbon structural steelwith a modulus of elasticity of 200,000 MPa. The Poisson’s ratio was taken as 0.27. The yield and theultimate tensile strengths were 226 MPa and 321 MPa, respectively. The Eurocode fatigue load model-4was applied to the deck-plate to assess this joint [11]. According to the given load model, the axle loadshould be applied on OSD as two closely spaced 150 kN wheels (i.e., 75 kN for each wheel), 2.0 m apartto accurately reflect the actual loading condition. The contact area for each wheel should be 540 mm ×250 mm. The simply supported boundary conditions were applied at the bottom flange of the girders.Here, it is important to mention that the deck-plate was loaded transversally and the longitudinal-ribwas loaded axially to produce bending and membrane stresses in the respective plates, as shown inFigure 5b. Therefore, two types of stress conditions were rendered, and their effect on SHSS methodswas studied considering this joint.
Figure 5. Details of the orthotropic steel deck specimen used in this study. (a) The cross-section oforthotropic steel deck specimen with rib-to-deck joint details. (b) 3D-Orthotropic steel deck specimenwith breakout modelling and applied fatigue load model details.
A detailed study was carried out to optimize the mesh size for this OSD model. The breakoutmodelling was adopted to increase the efficiency of the model and to reduce the cost of analysis.
Appl. Sci. 2020, 10, 6924 9 of 19
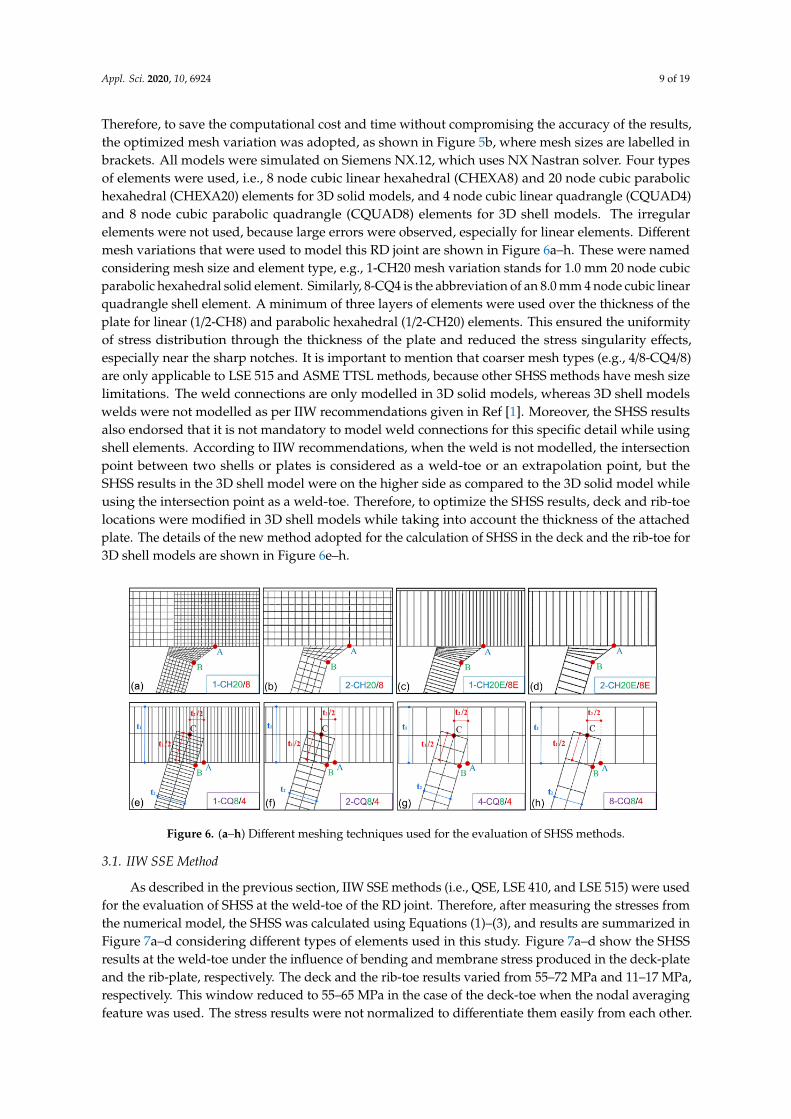
Therefore, to save the computational cost and time without compromising the accuracy of the results,the optimized mesh variation was adopted, as shown in Figure 5b, where mesh sizes are labelled inbrackets. All models were simulated on Siemens NX.12, which uses NX Nastran solver. Four typesof elements were used, i.e., 8 node cubic linear hexahedral (CHEXA8) and 20 node cubic parabolichexahedral (CHEXA20) elements for 3D solid models, and 4 node cubic linear quadrangle (CQUAD4)and 8 node cubic parabolic quadrangle (CQUAD8) elements for 3D shell models. The irregularelements were not used, because large errors were observed, especially for linear elements. Differentmesh variations that were used to model this RD joint are shown in Figure 6a–h. These were namedconsidering mesh size and element type, e.g., 1-CH20 mesh variation stands for 1.0 mm 20 node cubicparabolic hexahedral solid element. Similarly, 8-CQ4 is the abbreviation of an 8.0 mm 4 node cubic linearquadrangle shell element. A minimum of three layers of elements were used over the thickness of theplate for linear (1/2-CH8) and parabolic hexahedral (1/2-CH20) elements. This ensured the uniformityof stress distribution through the thickness of the plate and reduced the stress singularity effects,especially near the sharp notches. It is important to mention that coarser mesh types (e.g., 4/8-CQ4/8)are only applicable to LSE 515 and ASME TTSL methods, because other SHSS methods have mesh sizelimitations. The weld connections are only modelled in 3D solid models, whereas 3D shell modelswelds were not modelled as per IIW recommendations given in Ref [1]. Moreover, the SHSS resultsalso endorsed that it is not mandatory to model weld connections for this specific detail while usingshell elements. According to IIW recommendations, when the weld is not modelled, the intersectionpoint between two shells or plates is considered as a weld-toe or an extrapolation point, but theSHSS results in the 3D shell model were on the higher side as compared to the 3D solid model whileusing the intersection point as a weld-toe. Therefore, to optimize the SHSS results, deck and rib-toelocations were modified in 3D shell models while taking into account the thickness of the attachedplate. The details of the new method adopted for the calculation of SHSS in the deck and the rib-toe for3D shell models are shown in Figure 6e–h.
Figure 6. (a–h) Different meshing techniques used for the evaluation of SHSS methods.
3.1. IIW SSE Method
As described in the previous section, IIW SSE methods (i.e., QSE, LSE 410, and LSE 515) were usedfor the evaluation of SHSS at the weld-toe of the RD joint. Therefore, after measuring the stresses fromthe numerical model, the SHSS was calculated using Equations (1)–(3), and results are summarized inFigure 7a–d considering different types of elements used in this study. Figure 7a–d show the SHSSresults at the weld-toe under the influence of bending and membrane stress produced in the deck-plateand the rib-plate, respectively. The deck and the rib-toe results varied from 55–72 MPa and 11–17 MPa,respectively. This window reduced to 55–65 MPa in the case of the deck-toe when the nodal averagingfeature was used. The stress results were not normalized to differentiate them easily from each other.

Appl. Sci. 2020, 10, 6924 10 of 19
The QSE method gave higher SHSS results at the deck-toe and lower results at the rib-toe as comparedto LSE methods. The difference was quite evident for the LSE 515 method. It was largely due to thepresence of highly non-linear stresses at the deck-toe as compared to the rib-toe, and the QSE methodgenerally gives better results in the stress concentration zone due to its parabolic stress distribution.At the deck-toe, all the elements showed a smooth decreasing trend in SHSS results as we moved fromQSE to LSE 515, except for the 2-CH8 element. The rib-toe results had two distinguished lines, the solidelements (1/2-CH20/8 and 1/2-CH20E/8E) had lower SHSSs except for 1/2-CH8E elements, and theirresults were similar to shell elements (1/2-CQ4/8). Moreover, the solid parabolic elements (1/2-CH20)had lower results, whereas shell linear elements (1/2 CQ4) had higher SHSS results as compared toother elements in both cases (i.e., deck and rib-toe).
Figure 7. (a–d) Variation of SHSS evaluation methods for different meshing techniques.
Nodal averaging did not have much influence on the parabolic elements (1/2-CH20 and 1/2-CQ8),whereas linear elements (1/2-CH8/8E and 1/2-CQ4) showed a slight decrease in SHSS results, asshown in Figure 7a–d. The reduction in SHSS was more pronounced in the 2-CH8 element. Thecoarser mesh (i.e., 4/8-CQ4/8) was only applicable to LSE 515, as other SSE methods have mesh sizelimitations, but their results were not convincing, especially for linear elements (4/8-CQ4). Moreover,nodal averaging had a major influence on their SHSS results. Overall solid elements (1/2-CH20/8and 1/2-CH20E/8E) showed lower and slightly scattered results, especially in linear elements (1/2
Appl. Sci. 2020, 10, 6924 11 of 19
CH8/CH8E), whereas shell elements (1/2-CQ8/4) showed higher and consistent SHSS results for bothcases (i.e., deck and rib-toe).
3.2. Haibach Method
The Haibach method for SHSS evaluation is also based on surface stress calculation. Therefore,it produced similar SHSS results as the IIW SSE methods, but values were a bit scattered, especially inthe case of the deck-toe (Figure 7a,b). The deck and the rib-toe results varied from 55–81 MPa and12–17 MPa, respectively. This window reduced to 55–70 MPa in the case of the deck-toe when the nodalaveraging feature was turned on. The scatter in results was quite justified, as we relied on a singlestress value at a particular point (i.e., 2.5 mm) from the weld-toe as compared to IIW SSE methods,where two or three reference points were used considering the thickness of the respective plate.
At the deck-toe, the Haibach method showed the opposite trend in SHSS results as comparedto SSE methods. The solid elements (1/2-CH20/8 and 1/2-CH20E/8E) gave higher results except for1/2-CH8E elements, which had lower values similar to shell elements (1/2-CQ4/8). The rib-plateresults showed the same trend, i.e., two distinguished lines having solid elements (1/2-CH20/8 and1/2-CH20E/8E) with lower stresses except for 1/2-CH8E elements, whose results were similar to shellelements (1/2-CQ4/8), as shown in Figure 7a–d. Overall, shell elements (1/2-CQ8/4) gave lower stressesat the deck-toe and higher stresses at the rib-toe as compared to solid elements (1/2-CH20/8 and1/2-CH20E/8E). Similarly, in this method, the 2-CH8 element showed exceptionally high stress valuesfor the deck-toe when the nodal averaging feature was turned off. The nodal averaging did not havemuch influence on parabolic elements (1/2-CH20 and 1/2-CQ8), whereas linear elements (1/2-CH8/8Eand 1/2-CQ4) showed a decrease in stress results, which was more pronounced in the 2-CH8 element.
3.3. ASME TTSL Method
The ASME TTSL is claimed to be mesh insensitive, but SHSS results did not verify that statement,as shown in Figure 7a–d. There were some variations in the results, but stress values were moreconverged as compared to other methods, especially when the nodal averaging feature was turnedon. The deck and the rib-toe stress results varied from 58–78 MPa and 14–20 MPa, respectively.This window was reduced to 60–66 MPa in the case of the deck-toe when the nodal averaging featurewas used, which demonstrates its importance in this method. The TTSL method showed slightly higherresults at the deck-toe as compared to other methods, and it was quite evident in 1/2-CH20E elementswhile the nodal averaging feature was turned off. At the rib-toe, two distinguished lines converged atone point, unlike in other methods (Figure 7a–d). Similar to deck-toe results, CH20E elements showedhigher stresses at the rib-toe but, in this case, nodal averaging did not reduce them. Overall, SHSSresults were more consistent as compared to other methods except for 1/2-CH20E and 8-CQ4 elements,which gave higher and lower stress results, respectively. Nodal averaging had a major influence onSHSS results, especially in the case of the deck-toe, where the results were significantly converged.
3.4. Xiao and Yamada Method
The Xiao–Yamada method for SHSS evaluation has very strict mesh size limitations. Therefore,it can only be applied to certain cubic hexahedral elements, i.e., 1.0 mm parabolic or linear elements(1-CH20/8) or 2.0 mm parabolic element (2-CH20) having mid-node at 1.0 mm. For a 2.0 mm linearelement (2-CH8), we can take an average of two consecutive nodes to get a stress value at 1.0 mmdepth of the weld-toe. Hence, this method does not apply to the solid single (1/2-CH20E/8E) or theshell elements (1/2-CQ8/4). The deck and the rib-toe results varied from 52–70 MPa and 15–17 MPa,respectively. This window reduced to 52–65 MPa in the case of the deck-toe while nodal averagingwas turned on. This method gave quite scattered SHSS results in the case of the deck-toe, even thoughthere were only four elements involved due to the strict mesh size limitations of this method. The 2.0mm elements (2-CH20/8) showed quite high stress results as compared to 1.0 mm elements (1-CH20/8).In the case of the rib-toe, the results were slightly higher and converged to one point for both mesh
Appl. Sci. 2020, 10, 6924 12 of 19
sizes, as shown in Figure 7a–d. The nodal averaging feature did not have much influence on rib-toeresults, while the deck-toe showed a significant decrease in SHSS results in 2.0 mm elements (2-CH20/8),which was more prominent in the 2-CH8 element.
4. Parametric Study of SHSS Evaluation Methods
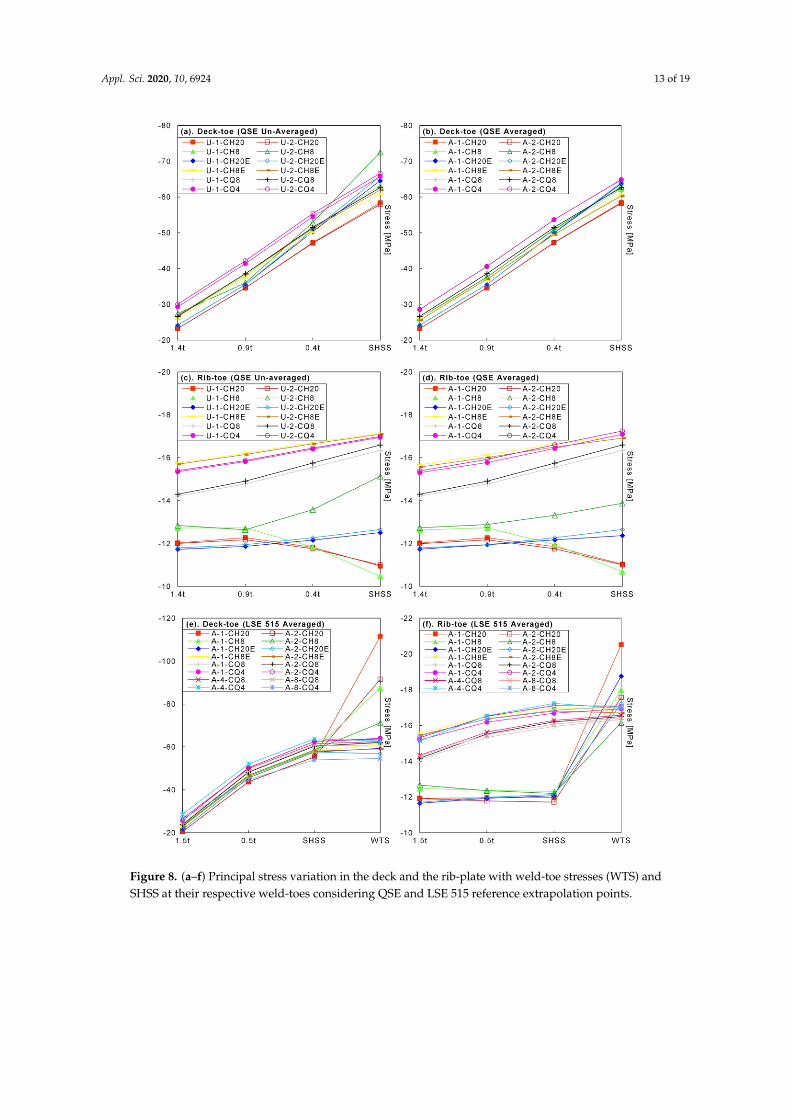
For the detailed investigation of SHSS methods, their performance was examined consideringdifferent influential parameters such as element type, mesh size, nodal averaging, and stress typespresent at the weld-toe. To study the effect of these variables, the FEA stress results for IIW QSE andLSE 515 are presented in Figure 8a–f. In the QSE method, there are stress results at three referencepoints (0.4t, 0.9t, and 1.4t), while in the LSE 515 method, there are stress results at two referencepoints (0.5t, 1.5t) to study the variation in stresses for different mesh types. The LSE 515 method isalso applicable to coarser mesh (4/8-CQ8/4). Furthermore, a detailed comparison of SHSS resultsconcerning each mesh type is given in Figure 9a,b for both the cases (i.e., deck and rib-toe). The graphsare subdivided into four parts, and each part represents SHSS results for different element types usedin this study. Moreover, weld-toe stresses (WTS) are also presented for the comparison with SHSSresults (Figure 8e,f and Figure 9a,b). The WTS is a definite nodal stress determined at the weld-toein the deck and the rib-plate. The detailed analysis of the results for each method is discussed in thefollowing section.
4.1. Effect of Element Type
Four types of elements were used in this study, as shown in Figure 6a–h. Generally, stressesare converged at a distance of 1.5t from the weld-toe, but here, this was not the case (Figure 8a–f).At the deck-toe, it was quite clear that solid parabolic elements (CH20) had the lowest stress results atthese readout points (Figure 8a,b). The same was true for the rib-toe except for solid parabolic singleelements (CH20E), as they had lower stress results at 0.9t and 1.4t, as shown in Figure 8c,d. The solidlinear elements (CH8) showed scattered stress results at these readout points for both the deck andthe rib-toe. The stress results of solid linear single elements (CH8E) were identical to shell parabolicelements (CQ8) in the case of the deck-toe, whereas in the rib-toe, CH8E elements gave the higheststress results, similar to shell linear elements (CQ4). At the deck-toe, the CQ4 elements gave the higheststress results. Overall, shell elements (CQ8/4) had higher stress results as compared to solid elements(CH8/20 and CH8E/20E), and it was quite evident at the rib-toe (Figure 8f).
The increase or the decrease in stresses at these reference points had a significant effect on SHSSresults, especially where results relied on a single reference point (i.e., Haibach and Xiao and Yamada).For example, the 1-CH20 element had the lowest SHSS results while having the highest WTS forboth the deck and the rib-toe in the SSE methods, because it had the lowest stresses at these readoutpoints. The same 1-CH20 element had the highest SHSS for the ASME TTSL method, because thismethod linearizes the stress at the weld-toe and incorporates a part of highly non-linear WTS duringlinearization of stresses over the thickness of the plate (Figure 9a,b). Similarly, the 1/2-CH8 elementsshowed scattered SHSS results for all the evaluation methods, because they had scattered stress resultsat the readout points. Therefore, while applying these SHSS methods considering different elementtypes, it is more important to analyse the stress results at the reference extrapolation points rather thanfocusing on high WTS results. Moreover, the computation time is an important factor to consider,e.g., the 1-CH20E element (44,14,778 nodes) had three times fewer nodes as compared to the 1-CH20element (16,66,396 nodes) for the same simulated OSD model, Hence, it is better to use the 1-CH20Eelement for SHSS evaluation to save computation time and analysis cost. In general, shell elements(CQ8/4) had more consistent SHSS results as compared to solid elements (CH8/20 and CH8E/20E) forboth cases (Figure 9a,b).
Appl. Sci. 2020, 10, 6924 13 of 19
Figure 8. (a–f) Principal stress variation in the deck and the rib-plate with weld-toe stresses (WTS) andSHSS at their respective weld-toes considering QSE and LSE 515 reference extrapolation points.
Appl. Sci. 2020, 10, 6924 14 of 19
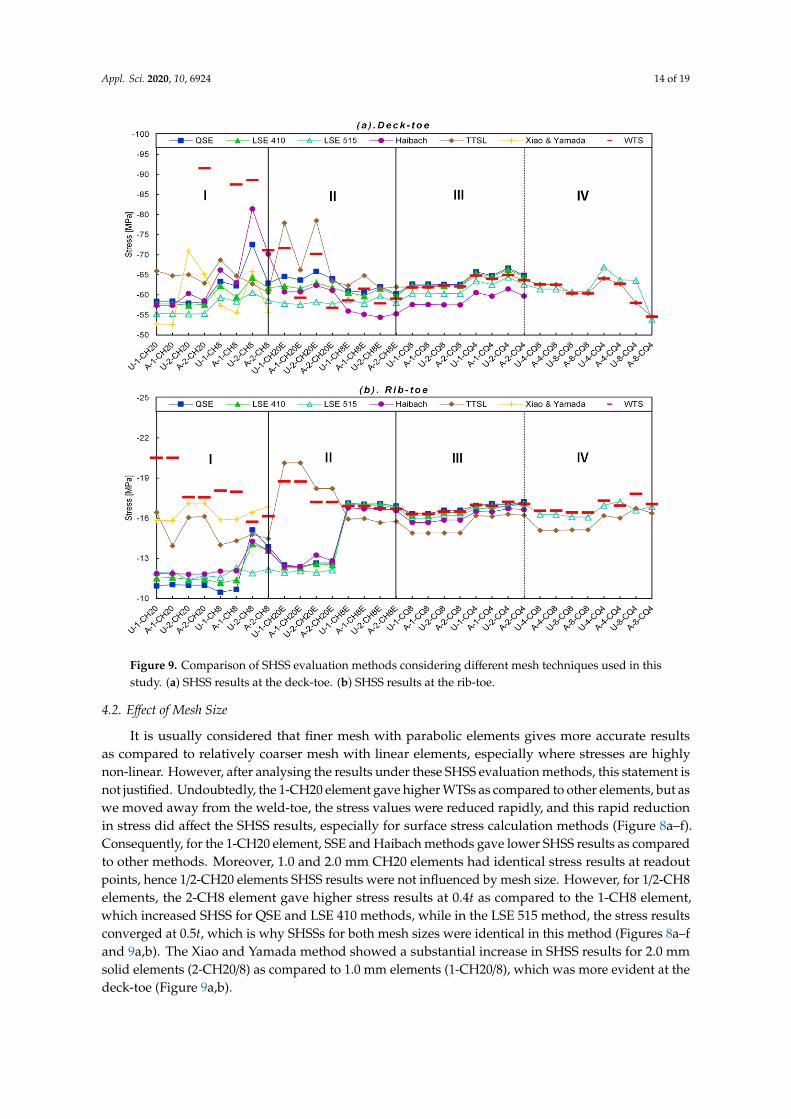
Figure 9. Comparison of SHSS evaluation methods considering different mesh techniques used in thisstudy. (a) SHSS results at the deck-toe. (b) SHSS results at the rib-toe.
4.2. Effect of Mesh Size
It is usually considered that finer mesh with parabolic elements gives more accurate resultsas compared to relatively coarser mesh with linear elements, especially where stresses are highlynon-linear. However, after analysing the results under these SHSS evaluation methods, this statement isnot justified. Undoubtedly, the 1-CH20 element gave higher WTSs as compared to other elements, but aswe moved away from the weld-toe, the stress values were reduced rapidly, and this rapid reductionin stress did affect the SHSS results, especially for surface stress calculation methods (Figure 8a–f).Consequently, for the 1-CH20 element, SSE and Haibach methods gave lower SHSS results as comparedto other methods. Moreover, 1.0 and 2.0 mm CH20 elements had identical stress results at readoutpoints, hence 1/2-CH20 elements SHSS results were not influenced by mesh size. However, for 1/2-CH8elements, the 2-CH8 element gave higher stress results at 0.4t as compared to the 1-CH8 element,which increased SHSS for QSE and LSE 410 methods, while in the LSE 515 method, the stress resultsconverged at 0.5t, which is why SHSSs for both mesh sizes were identical in this method (Figures 8a–fand 9a,b). The Xiao and Yamada method showed a substantial increase in SHSS results for 2.0 mmsolid elements (2-CH20/8) as compared to 1.0 mm elements (1-CH20/8), which was more evident at thedeck-toe (Figure 9a,b).
Appl. Sci. 2020, 10, 6924 15 of 19
The CH20E/8E elements had similar stress results for both mesh sizes (1.0/2.0 mm), therefore,their SHSS results were also identical. Likewise, the 1/2-CQ8/4 shell elements had the same stressresults for the finer mesh (1.0/2.0 mm), hence, their SHSS results were also alike (Figure 8a–f). However,CQ4 elements gave scattered stress results at the deck-toe for the coarser mesh (4.0/8.0 mm), therefore,the 4-CQ4 element had high results, while the 8-CQ4 elements had quite low SHSS results, as shown inFigure 8e. Hence, coarser mesh size (4.0/8.0 mm) should be avoided for SHSS evaluation, especially forlinear shell elements (CQ4).
4.3. Effect of Nodal Averaging
This feature averages the stress at nodes which may increase or decrease the stress resultsdepending on the stress distribution (monotonic or non-monotonic). It is usually more effective wherestresses are highly non-linear, but one must be careful while averaging nodal values at the weld-toe andshould exclude the weld element and the element behind the weld-toe, because it decrease the stressesdue to the larger weld area. After applying this feature in this study, the stress values were a bit reduced,but their impact on SHSS results was insignificant in SSE and Haibach methods; particularly, the LSE515 method showed consistency in results for both the deck and the rib-toe (Figure 9a,b). Similarly,Xiao and Yamada’s method did not have much influence of nodal averaging in the case of the rib-toe,whereas the deck-toe showed significant decrease in SHSS results in 2-CH20/8 elements, which wasevident in the 2-CH8 element (Figure 9a). The ASME TTSL method showed a considerable decrease inSHSS results in the deck and the rib-toe for 1/2-CH20E and 1-CH20 elements, respectively. In general,parabolic solid or shell elements (CH20/20E/CQ8) were not affected by nodal averaging, whereas linearsolid or shell elements (CH8/8E/CQ4) showed a decrease in SHSS results. The reduction in SHSS resultswas more pronounced in the 2-CH8 element (Figure 7a–d). Therefore, it can be concluded that SHSSevaluation methods are not sensitive to nodal averaging in parabolic elements (CH20/20E/CQ8).
4.4. Effect of Stress Type
As described in the previous section, two types of governing stresses were produced at the RDjoint to study four different SHSS evaluation methods. Essentially, bending in the deck-plate producedhighly non-linear stress at the deck-toe, and the membrane effect in the rib-plate produced linearcompressive stress at the rib-toe. Figure 9a,b shows SHSS results obtained for both the cases. The WTSsare also presented for comparison. The SSE methods were less influenced by stress type and hadconsistent SHSS results for both cases. The QSE method gave better results in the case of the deck-toedue to its quadratic nature, which incorporates the non-linear stress and gives a better representation ofthe actual stress scenario at the hot-spot. In the case of the deck-toe, the LSE methods gave somewhatlower SHSS results as compared to the QSE method, which was quite evident in the case of the LSE 515method, whereas for the rib-toe, LSE methods showed slightly higher results in comparison to the QSEmethod, but the 2-CH8 element was exception. It is important to note that stresses were exceptionallyconverged for both cases when the LSE 515 method was used. The LSE 515 showed quite smoothresults for the deck-toe, even for the 2-CH8 element, but SHSS results were low due to linear stressdistribution. Moreover, its first readout point was at a distance of 0.5t from the weld-toe, which became8.0 mm for the deck-toe. This further reduced the SHSS results where stresses were highly non-linear.This statement is further strengthened by rib-toe results, where the QSE method gave lower results ascompared to the LSE 515 method, especially in solid parabolic elements (CH20/20E), because of thelarger weld area nominal stresses being reduced near the weld-toe, which were picked by the QSEmethod. Therefore, the QSE method generally gave better results in the high stress concentration zonedue to its quadratic nature, but if we are interested in the calculation of nominal stresses, then LSE 515is a better choice in SSE methods.
The Haibach and Xiao and Yamada methods are more sensitive to element type and mesh sizevariation as compared to other methods (Figure 9a,b). The scatter in their results is quite justified,as we relied on a single reference point for their SHSS results, i.e., at 2.5 mm and 1.0 mm, respectively.
Appl. Sci. 2020, 10, 6924 16 of 19
The Haibach method showed better results in the case of the deck-toe for solid parabolic elements(CH20/20E), while solid linear single elements (CH8E) and shell parabolic elements (1/2-CQ8) gavelow SHSS results. In the case of the rib-toe, the results were quite smooth and almost identical to SSEmethods. In fact, the stress at the same distance varied as we changed the element type or the meshsize, especially where stress was highly non-linear (i.e., the deck-toe). Therefore, it is better to use onlyCH20E elements while using the Haibach method. In the Xiao and Yamada method, the SHSS resultswere quite scattered in the case of the deck-toe, while for the rib-toe, the results were rather better(Figure 9a,b). These anomalies in SHSS results are not encouraging regarding the use of this method,especially with strict mesh size limitations.
The ASME TTSL method performed better in the case of the deck-toe while the nodal averagingfeature was turned on, and results were quite consistent for each element type and mesh size usedin this study. It gave higher SHSS results for the CH20 elements as compared to other methods thatrepresent the actual stress scenario at the deck-toe (Figure 9a). This method linearized the stress overthe thickness of the plate at the weld-toe, therefore, it included part of the non-linear stress present atthe weld-toe, while other SHSS evaluation methods do not include non-linear stress, as the readoutpoints are away from the weld-toe. For the rib-toe, two distinguished lines converged to one point,unlike other methods (Figure 9b). Similar to the deck-toe, the CH20E elements showed quite highSHSS results at the rib-toe, and nodal averaging had no influence on them. In general, SHSS resultswere more consistent in the deck and the rib-plate except for the CH20E elements that gave higherresults. Additionally, the nodal averaging feature had a major influence on this method; particularly inthe case of the deck-toe, the results were significantly converged.
5. Guidelines
The basic purpose of this exercise was to observe the limitations of SHSS methods and proposea guideline for the calculation of SHSS results that can be used by the design engineer for betterevaluation of fatigue-related problems. Therefore, these methods were applied to the fatigue proneRD joint in the OSD specimen considering different element types and meshing techniques for theevaluation of SHSS at the deck and the rib-toe. A full-scale 3D OSD specimen was simulated andtested on an FEM based software Siemens NX.12.0 for the better understanding of stress behaviour atthis critical joint. The optimized breakout modelling solution was adopted to increase the efficiencyof the model and to reduce the cost of analysis. Four types of elements were used for the modellingwith different mesh techniques and sizes, i.e., 8 node cubic linear hexahedral (CH8/8E) and 20 nodeparabolic hexahedral (CH20/20E) elements for 3D solid models, and 4 node cubic linear quadrangle(CQ4) and 8 node parabolic quadrangle (CQ8) elements for 3D-shell models. Moreover, the effect ofthe nodal averaging feature was studied on these SHSS evaluation methods. Two types of governingstresses were produced; essentially, bending in the deck-plate produced highly non-linear stress at thedeck-toe, and the membrane effect in the rib-plate produced linear compressive stress at the rib-toe.From the application of four different SHSS evaluation methods on these two stress states, the followingguidelines are proposed considering different parameters. These guidelines are summarized inFigure 10.
• The IIW SSE (i.e., QSE, LSE 410, and LSE 515) methods showed consistency in the SHSS results.The QSE method gave better results as compared to LSE methods when stress was highlynon-linear (deck-toe) due to its quadratic nature, which incorporated the part of the non-linearstress peak and gave a better representation of the actual stress scenario at the hot-spot. The LSEmethods performed better where stress was linear (rib-toe), particularly, the LSE 515 methodgave exceptionally converged SHSS results for both stress states. These methods exhibited lowerand somewhat scattered SHSS results for solid elements (CH20/8 and CH20E/8E), especially inlinear elements (CH8/CH8E), whereas shell elements (1/2-CQ8/4) showed higher and consistentSHSS results for both stress states. The solid parabolic single elements (CH20E) outperformedother meshing techniques in the QSE method but gave slightly lower results for solid parabolic
Appl. Sci. 2020, 10, 6924 17 of 19
elements (CH20). Moreover, for same simulated OSD model, the 1-CH20E element had threetimes fewer nodes as compared to 1-CH20 element, which saved computation time and analysiscost (Figure 10). Hence, it is better to use CH20E elements with the IIW QSE method for theevaluation of SHSS in the case of non-linear stress, and the LSE 515 method shall be preferred fornominal stress calculation with shell parabolic elements (1/2-CQ8), as shown in Figure 10.
• The Haibach method for SHSS evaluation is also based on surface stress calculation. Therefore,it had somewhat similar results as the IIW SSE methods, but values were somewhat scattered.The scatter in SHSS results was quite justified, as we relied on a stress value at a particular distancefrom the weld-toe (i.e., 2.5 mm). In this method, shell elements (1/2-CQ8/4) had lower resultsfor non-linear stress state and higher results for linear stress state as compared to solid elements(CH20/8 and CH20E/8E). Similarly, in this method, the solid single parabolic element (CH20E)outperformed other meshing techniques, especially for non-linear stress; however, for nominalstress calculation, it is better to use shell parabolic elements (1/2-CQ8), as shown in Figure 10.
• The ASME through thickness stress linearization (TTSL) method performed better as compared toother SHSS evaluation methods. There were some variations in the SHSS results in the case oflinear stress state, but for non-linear stress state, the results were quite consistent when the nodalaveraging feature was turned on (Figure 10). This means that the ASME TTSL method gave betterresults when stress was highly non-linear. This method linearized the stress over the thickness ofthe plate at the weld-toe. Therefore, it included part of the non-linear stress peak present at theweld-toe, while other SHSS evaluation methods did not, as the readout points were away fromthe weld-toe. In this method, results were more converged in the deck and the rib-plate exceptfor solid single parabolic elements (CH20E) that had higher stress results. For the better SHSSresults, the ASME TTSL method should be used with solid parabolic (1/2-CH20) or shell parabolic(1/2-CQ8) elements for non-linear stress and with solid parabolic single (CH8E) or shell linear(1/2-CQ4) elements for nominal stress calculation, as shown in Figure 10.
• The Xiao–Yamada method for the evaluation SHSS has very strict mesh limitations. Therefore,it can only be applied to certain cubic hexahedral elements (1/2 CH20/8). This method gave quitescattered results in non-linear stress state; the 2.0 mm solid elements (2-CH20/8) showed quitehigh stress results as compared to 1.0 mm solid elements (1-CH20/8), whereas for the linear stress,the results were somewhat higher as compared to other methods. These anomalies in SHSS resultsare not encouraging for the use of this method.
• The Haibach and Xiao and Yamada methods are more sensitive to element type and mesh sizevariation as compared to other methods. The scatter in SHSS results was quite justified, as werelied on a single readout point for their results (i.e., at 2.5 mm and 1.0 mm, respectively) ascompared to other methods. Therefore, IIW SSE or ASME TTSL methods should be preferred forthe better evaluation SHSS.
• The stress values were reduced by nodal averaging, but their impact on SHSS results wasinsignificant in IIW SSE and Haibach methods, whereas the ASME TTSL method showed aconsiderable decrease in results, especially for solid single parabolic elements (CH20E). Moreover,the Xiao and Yamada method did not have much influence of nodal averaging in the linear stressstate, while for the non-linear stress state, it showed a significant decrease in results. In general,parabolic solid or shell elements (CH20/20E/CQ8) were not affected by nodal averaging, whereaslinear solid or shell elements (CH8/8E/CQ4) showed a decrease in SHSS results.
• The coarser meshing (4/8-CQ4/8) is only applicable to LSE 515 and ASME TTSL methods becauseother SHSS methods have mesh size limitations, but their results were not convincing, especiallyfor linear shell elements (CQ4). Additionally, nodal averaging had a major influence on theirresults. Moreover, the solid linear parabolic elements (CH8) gave highly scattered results forall the SHSS evaluation methods used in this study. Hence, these meshing techniques shouldbe avoided.
Appl. Sci. 2020, 10, 6924 18 of 19
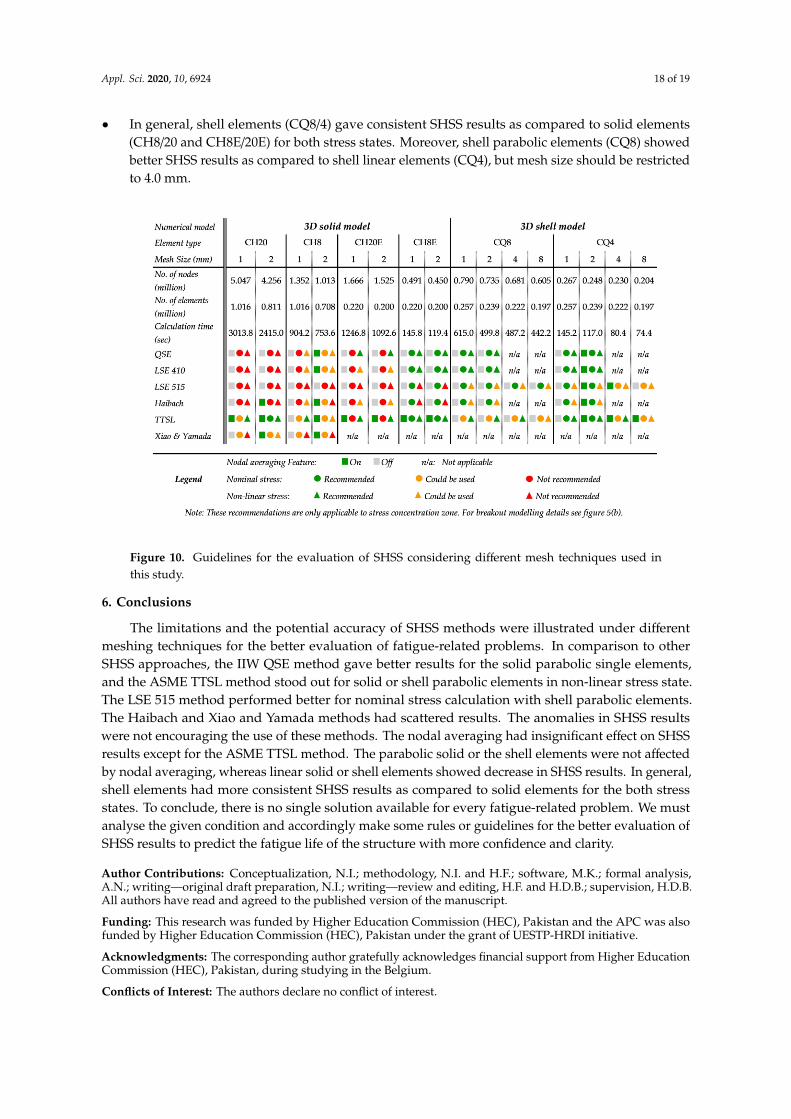
• In general, shell elements (CQ8/4) gave consistent SHSS results as compared to solid elements(CH8/20 and CH8E/20E) for both stress states. Moreover, shell parabolic elements (CQ8) showedbetter SHSS results as compared to shell linear elements (CQ4), but mesh size should be restrictedto 4.0 mm.
Figure 10. Guidelines for the evaluation of SHSS considering different mesh techniques used inthis study.
6. Conclusions
The limitations and the potential accuracy of SHSS methods were illustrated under differentmeshing techniques for the better evaluation of fatigue-related problems. In comparison to otherSHSS approaches, the IIW QSE method gave better results for the solid parabolic single elements,and the ASME TTSL method stood out for solid or shell parabolic elements in non-linear stress state.The LSE 515 method performed better for nominal stress calculation with shell parabolic elements.The Haibach and Xiao and Yamada methods had scattered results. The anomalies in SHSS resultswere not encouraging the use of these methods. The nodal averaging had insignificant effect on SHSSresults except for the ASME TTSL method. The parabolic solid or the shell elements were not affectedby nodal averaging, whereas linear solid or shell elements showed decrease in SHSS results. In general,shell elements had more consistent SHSS results as compared to solid elements for the both stressstates. To conclude, there is no single solution available for every fatigue-related problem. We mustanalyse the given condition and accordingly make some rules or guidelines for the better evaluation ofSHSS results to predict the fatigue life of the structure with more confidence and clarity.
Author Contributions: Conceptualization, N.I.; methodology, N.I. and H.F.; software, M.K.; formal analysis,A.N.; writing—original draft preparation, N.I.; writing—review and editing, H.F. and H.D.B.; supervision, H.D.B.All authors have read and agreed to the published version of the manuscript.
Funding: This research was funded by Higher Education Commission (HEC), Pakistan and the APC was alsofunded by Higher Education Commission (HEC), Pakistan under the grant of UESTP-HRDI initiative.
Acknowledgments: The corresponding author gratefully acknowledges financial support from Higher EducationCommission (HEC), Pakistan, during studying in the Belgium.
Conflicts of Interest: The authors declare no conflict of interest.
Appl. Sci. 2020, 10, 6924 19 of 19
References
1. Niemi, E.; Fricke, W.; Maddox, S.J. Structural Hot-Spot Stress Approach to Fatigue Analysis of Welded Components,IIW Collection; Springer: Singapore, 2018.
2. EN 1993-1-9: Eurocode 3: Design of Steel Structures—Part 1–9: Fatigue; Eurocode: Brussels, Belgium, 2005.3. Hobbacher, A.F. IIW Collection Recommendations for Fatigue Design of Welded Joints and Components; Springer:
Berlin, Germany, 2016.4. Radaj, D.; Sonsino, C.M.; Fricke, W. Fatigue Assessment of Welded Joints by Local Approaches (Second Edition);
Woodhead Publishing: Sawston, UK, 2006.5. Taylor, D.; Barrett, N.; Lucano, G. Some new methods for predicting fatigue in welded joints. Int. J. Fatigue
2002, 24, 509–518. [CrossRef]6. Lotsberg, I. Fatigue Design of Marine Structures; Cambridge University Press: Cambridge, UK, 2016.7. Van Puymbroeck, E.; van Staen, G.; Iqbal, N.; de Backer, H. Residual weld stresses in stiffener-to-deck plate
weld of an orthotropic steel deck. J. Constr. Steel Res. 2019, 159, 534–547. [CrossRef]8. Van Puymbroeck, E.; Nagy, W.; Schotte, K.; Ul-Abdin, Z.; de Backer, H. Determination of residual welding
stresses in a steel bridge component by finite element modeling of the incremental hole-drilling method.Appl. Sci. 2019, 9, 536. [CrossRef]
9. Xiao, Z.G.; Yamada, K.; Ya, S.; Zhao, X.L. Stress analyses and fatigue evaluation of rib-to-deck joints in steelorthotropic decks. Int. J. Fatigue 2008, 30, 1387–1397. [CrossRef]
10. Ya, S.; Yamada, K.; Ishikawa, T. Fatigue Evaluation of Rib-to-Deck Welded Joints of Orthotropic Steel BridgeDeck. J. Bridge Eng. 2010, 16, 492–499. [CrossRef]
11. European Standards. EN 1991-2: Eurocode 1: Actions on structures—Part 2: Traffic Loads on Bridges; Eurocode:Brussels, Belgium, 2005.
12. Department of Energy. Offshore Installations: Guidance on Design, Construction and Certification; H.M.S.O.:London, UK, 1990.
13. De Back, J. The Design Aspects and Fatigue Behaviour of Tubular Joints; Elsevier Science Publishers: Amsterdam,The Netherlands, 1987; pp. 205–223.
14. British Standards. BS 7608:2014: Guide to Fatigue Design and Assessment of Steel Products; British StandardsInstitution: London, UK, 2014.
15. Poutiainen, I.; Tanskanen, P.; Marquis, G. Finite element methods for structural hot spot stressdetermination—A comparison of procedures. Int. J. Fatigue 2004, 26, 1147–1157. [CrossRef]
16. Wardenier, J. Hollow Section Joints; Delft University Press: Delft, The Netherlands, 1982.17. Marshall, P.W. Design of Welded Tubular Connections: Basis and Use of AWS Code Provisions; AWS Inc.: Miami,
FL, USA, 2013; Volume 37.18. American Welding Society. Structural Welding Code-Steel, an American National Standard, 24th ed.; AWS Inc.:
Seattle, WA, USA, 2020.19. API. API Recommended Practice 2A-WSD. Planning, Designing, and Constructing Fixed Offshore Platforms-Working
Stress Design, 22nd ed.; API Publishers: Washington, DC, USA, 2014.20. Hechmer, J.L.; Hollinger, G.L. The ASME Code and 3D Stress Evaluation. J. Press. Vessel Technol. 1991, 113,
482–487. [CrossRef]21. ASME BPVC.VIII.2. ASME Boiler and Pressure Vessel Code, an International Code, Division 2 SECTION VIII
Rules for Construction of Pressure Vessels; The ASME Publishers: New York, NY, USA, 2017.22. European Standards. EN 1993-2: Eurocode 3: Design of Steel Structures—Part 2: Steel Bridges; Eurocode:
Brussels, Belgium, 2011.
© 2020 by the authors. Licensee MDPI, Basel, Switzerland. This article is an open accessarticle distributed under the terms and conditions of the Creative Commons Attribution(CC BY) license (http://creativecommons.org/licenses/by/4.0/).