
Evidence for Early Cretaceous oceanic crust trapped in the Philippine Sea Plate
Upload
independentCategory
view
1download
0
Crust and upper mantle velocity structure of the Yellowstone hot spot
and surroundings
Derek L. Schutt,1 Ken Dueker,1 and Huaiyu Yuan1
Received 11 April 2007; revised 21 September 2007; accepted 30 November 2007; published 28 March 2008.
[1] The Yellowstone hot spot has recently been shown to be a plume that extends into thetransition zone. At roughly 60–120 km depth, the plume material rising beneathYellowstone Park is sheared SW by North America Plate motion, producing a profound lowvelocity layer emplaced beneath the thin lithosphere. To constrain the absolute seismicvelocity of the plate-sheared plume layer, fundamental mode Rayleigh wave observationshave been inverted for phase velocity using the two plane wave technique. The resultingphase velocity models are inverted with Moho-converted P to S arrival times to betterconstrain crustal thickness and absolute S wave velocity structure to �120 km depth. Aregionalized S wave velocity model has an extremely low velocity minimum of 3.8 ±0.1 km/s at 80 km depth beneath the hot spot track. Nonregionalized 3-D velocitymodels find a velocity minimum of 3.9 km/s beneath the hot spot track. Below 120 kmdepth, our resolution diminishes such that the lateral spreading of the plume track is notresolved. The volume of the low velocity plume layer is small and the estimated buoyancyflux for the Yellowstone plume is <0.1 Mg/s which contrasts with the �9 Mg/s valuefor Hawaii. In addition, a notable region of thick crust and high lower crustal velocities isfound around Billings, Montana, consistent with previous refraction and receiver functionstudies that interpret this as evidence for a massive Precambrian underplating event.
Citation: Schutt, D. L., K. Dueker, and H. Yuan (2008), Crust and upper mantle velocity structure of the Yellowstone hot spot and
surroundings, J. Geophys. Res., 113, B03310, doi:10.1029/2007JB005109.
1. Introduction
[2] Over the last �17 Ma, the Yellowstone hot spot hasproduced a series of progressively younger silicic eruptionsthat extend from the Oregon-Nevada border NE to Yellow-stone National Park [Christiansen and Yeats, 1992]. Be-cause the Yellowstone hot spot track (YHT; Figure 1) lies in aregion of extensive recent magmatism, including the Colum-bia River Basalts and the Oregon High Lava Plains, thecause of the hot spot magmatism has remained controversial.This anomalous magmatism has been variously hypothe-sized to be an extending lithospheric crack [Hamilton,1989; Christiansen et al., 2002], a self-propagating mantlemelt instability [Humphreys and Dueker, 1994], or a ther-mal mantle plume [Armstrong and Leeman, 1975; Morganet al., 1984]. Recently, P and S wave tomography studies[Yuan and Dueker, 2005; Waite et al., 2006] have found alow velocity conduit extending from Yellowstone Parkand inclined 15� from vertical toward the NW. The baseof the conduit extends into a locally thinned transition zone[Fee and Dueker, 2004] but does not extend across the660 km discontinuity. This structure is consistent with athermal plume confined to the upper mantle. At �60–120 km depth beneath the YHT, this plume material has
been sheared to the SW by North America plate motion,producing a profoundly low velocity region beneath theYHT associated with some combination of high temper-atures and partial melt [Schutt and Humphreys, 2004].Although ascending plume material interacting with amoving lithosphere is predicted to follow parabolic-likestreamlines [Sleep, 1990], the observed Yellowstone veloc-ity anomaly does not follow parabolic-like streamlinesdownstream from the present location of the hot spot underYellowstone Park [Saltzer and Humphreys, 1997; Schuttand Humphreys, 2004; Yuan and Dueker, 2005; Waite et al.,2006]. In addition, a parabolic-like distribution of fast SKSwave polarization axes is not observed [Waite et al., 2005].The above observations all suggest the YHT is the mani-festation of a weak upper mantle plume with little buoyancyinduced lateral flow at the base of the lithosphere.[3] The previous teleseismic body wave tomographic
models all have limitations, however. Only relative velocityvariations are constrained, which makes it difficult tocompare absolute velocities to other regions or calculateabsolute temperature. In addition, the previous body wavetomograms do not resolve crustal velocity and thicknessvariations, and the tomograms’ best-case �40 km verticalresolution scale is poor with respect to surface wave studies[e.g. West et al., 2004]. In this study, we measure thevelocity of fundamental mode Rayleigh waves in the region.These data are combined with measurements of the relativearrival time difference between receiver function direct P
JOURNAL OF GEOPHYSICAL RESEARCH, VOL. 113, B03310, doi:10.1029/2007JB005109, 2008
1Department of Geology and Geophysics, University of Wyoming,Laramie, Wyoming, USA.
Copyright 2008 by the American Geophysical Union.0148-0227/08/2007JB005109$09.00
B03310 1 of 14
and Pms arrivals to produce models of absolute S wavevelocity and crustal thickness variations.
2. Data
[4] Data were derived from two broadband PASSCALexperiments that operated in late 1999–2001 and whoserecording times overlapped by 75 d (Figure 1): the 46station Yellowstone array and the 31 station Billings array(Figure 1). These arrays operated from 9 June 2000 to4 June 2001 and 30 September 1999 to 23 August 2000,respectively. The arrays were instrumented with CMG-3T,CMG-40T, and STS-2 sensors with corner periods at 120,30, and 120 s. Careful attention was paid to transferfunction normalization and channel polarity because thetwo-plane-wave technique [Forsyth and Li, 2005] fits boththe Rayleigh wave’s amplitudes and phase with equalweight.
[5] Events with surface-wave magnitudes >5.7, fromdistances of 30� � D � 120�, were examined for simplefundamental mode Rayleigh wave packets at 17 waveperiods between 15 and 150 s. To measure phase velocitiesat the 17 periods used in this study, seismograms werenarrowband (10 mHz width) filtered with a zero-phase four-pole Butterworth filter. The filter center periods were at 15,18, 20, 22.5, 25, 27.5, 30, 35, 40, 45, 50, 66, 75, 90, 110,125, and 150 s. Band-pass filtered traces without a relativelysimple fundamental mode Rayleigh wave envelope wererejected. This data culling produced 81 events to be ana-lyzed, although for any given event, measurable Rayleighwave energy was not generally observed at all periods. Formost periods, 50–60 events were analyzed (Table 1) whichprovided data from a reasonable range of back-azimuths(Figure 2). Traces were converted to their Fourier real andimaginary components at each filter center period. There-fore, each station-event seismogram provided up to 34 data
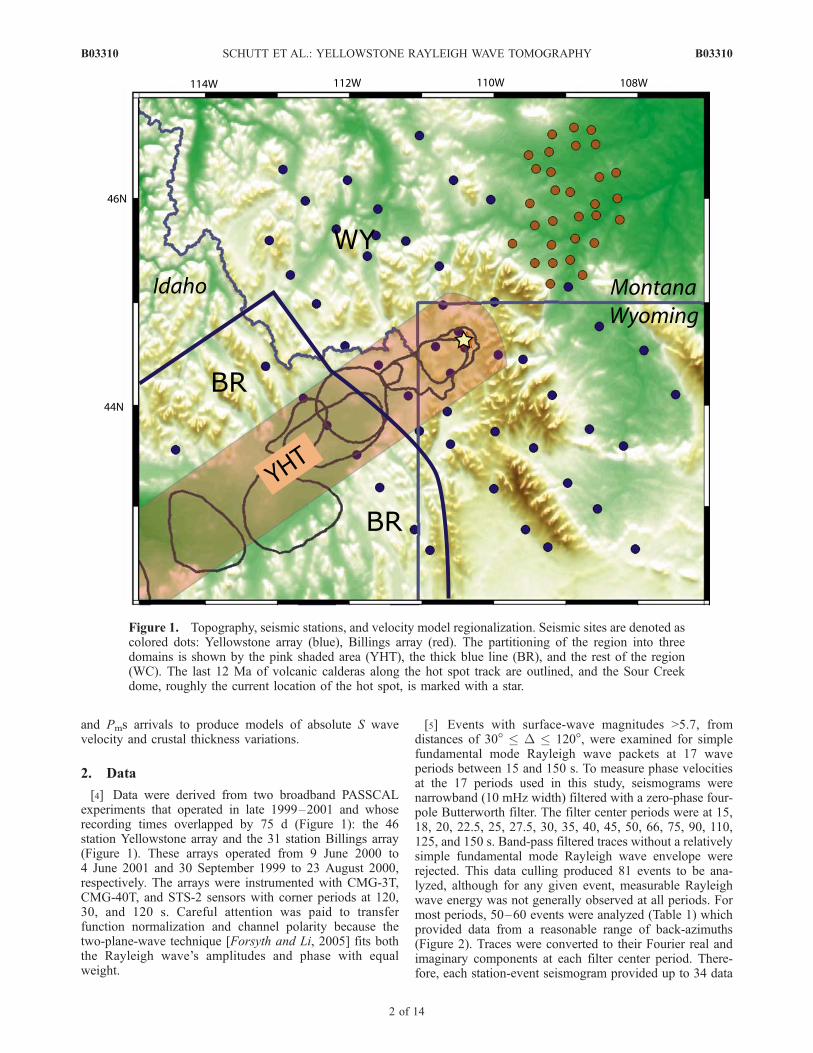
Figure 1. Topography, seismic stations, and velocity model regionalization. Seismic sites are denoted ascolored dots: Yellowstone array (blue), Billings array (red). The partitioning of the region into threedomains is shown by the pink shaded area (YHT), the thick blue line (BR), and the rest of the region(WC). The last 12 Ma of volcanic calderas along the hot spot track are outlined, and the Sour Creekdome, roughly the current location of the hot spot, is marked with a star.
B03310 SCHUTT ET AL.: YELLOWSTONE RAYLEIGH WAVE TOMOGRAPHY
2 of 14
B03310

associated with 17 periods with one real and one imaginarycomponent at each band-pass period.
3. Method
3.1. Phase Velocity Measurement With Two PlaneWave Approximation
[6] To estimate phase velocity, we used a techniquedeveloped by Forsyth and Li [2005] which accounts forsimple multipathing effects, allowing shorter period Ray-leigh waves to be reliably measured. This improves resolu-tion, and has been used successfully in many studies[Forsyth et al., 1998b; Li et al., 2002, 2003; Weeraratneet al., 2003; Fischer et al., 2005]. For each band-passperiod, the real and imaginary Fourier components wereinverted for phase velocity, using the following steps:[7] 1. The effects of wave multipathing are estimated by
parameterizing the incoming waveform as two interferingplane waves. The six parameters associated with these twoplane waves are constrained using a simulated annealingsearch [Forsyth et al., 1998b; Li et al., 2002, 2003;Weeraratne et al., 2003; Fischer et al., 2005].[8] 2. Using the plane wave parameters derived in step 1
and a starting phase velocity model (discussed below), thedata are iteratively inverted for updates to the starting modelusing
Dm ¼ GTC�1ddGþ C�1
mm
� ��1GTC�1
ddDd� C�1mm m�mo½ �
� �;
ð1Þ
where G is the matrix of partial derivatives, Cmm and Cdd
are the a priori model and data covariance matrices, Dd isthe difference between the observed and predicted Fouriercoefficients, mo is the original starting model, and m is thecurrent model [Tarantola and Valette, 1982]. With eachiteration, high misfit events are downweighted to minimizethe effects of Rayleigh waves that are too multipathed to befit by the two-plane wave approximation [Forsyth and Li,2005].[9] Ideally, the data would be sufficient to produce a fully
resolved two-dimensional model of phase velocity varia-
tions for each wave period. However, similar to mostteleseismic tomography, there were insufficient data toproduce a unique two dimensional phase velocity map[Menke, 1989]. Similar to previous studies using the two-plane wave technique, we take a conservative approach tothis problem and seek to find the simplest model parame-terization that fits the data [Forsyth et al., 1998a; Li et al.,2002; Li and Detrick, 2003; Li et al., 2003; Weereratne etal., 2003; Fischer et al., 2005; Forsyth and Li, 2005; Li andDetrick, 2006]. To accomplish this, three sets of phasevelocity inversions were conducted, starting with a uniformphase velocity inversion, proceeding to a regionalized phasevelocity, and ending with a two-dimensional phase velocityinversion. The regionalization domains are defined based onteleseismic P and S body wave tomograms [Schutt andHumphreys, 2004; Yuan and Dueker, 2005; Waite et al.,2006]. Our most important choice is the width of the hotspot track (Figure 1). The body-wave tomograms constrainthe low velocity body beneath the hot spot track above100 km depth to be 80–120 km wide. But, in the 100–200 km depth range the width of the low velocity anomalyvaries between 150 and 200 km. Given that our resolutionkernels have little sensitivity below 120 km depth, we havechosen to fix the width of the regionalized hot spot trackwidth to 110 km.[10] The uniform model is used as initial starting model
(m in equation (1), above) for the next more complicatedmodel. Specifically, the following three inversions areperformed.[11] 1. Invert Rayleigh wave observations for mean phase
velocity at each wave period.[12] 2. Use (1) as a starting model, and invert observa-
tions for mean phase velocity in each of the three tectonicregions: Basin and Range (BR), Wyoming Craton (WY),and Yellowstone hot spot track (YHT) (Figure 1).[13] 3. Use (2) as a starting model and invert data for two-
dimensional phase velocity maps. In these inversions, weuse ‘‘fat ray’’ Gaussian approximations to the sensitivitykernels. Ray width is chosen such that 95% of the cross-sectional area falls within the first Fresnel zone [Weeraratneet al., 2003; Gudmundsson, 1996].[14] Thus, at each of the 17 data periods, three sets of
inversions are performed with each inversion requiring twosteps. Statistics for the inversion of 30 s waves are listed inTable 2. Note that because poorly fit events are down-weighted, the variance reduction between models cannot bestrictly compared [Forsyth and Li, 2005].[15] Figure 3 shows the results of the regionalized phase
velocity inversions. The data fit is excellent with 85–95%of the data variance being explained by the three regionmodel (after poorly fit events are downweighted). Thissuggests that the regionalized velocity structure is a goodapproximation to the actual structure. To assess whether themean phase velocity of the tectonic regions is uniquelyresolved, the rank of the resolution matrix
R ¼ GTC�1ddGþ C�1
mm
� ��1GTC�1
ddG; ð2Þ
is calculated (Figure 3c; variables are the same as inequation (1)). This value diminishes from a value of threefor the shortest periods, implying that the mean phase
Table 1. Variance Reduction by Period for Regionalized Model
WavePeriod (s)
Numberof Rays
VelocityRank
Phase VarianceReduction (%) Events
15 477 2.92 98.31 2218 1148 2.97 99.39 4320 1216 2.97 99.54 4622.5 1610 2.98 99.75 5625 1703 2.97 99.77 6027.5 1682 2.97 99.85 6330 1706 2.96 99.82 6435 1638 2.95 99.85 5940 1539 2.93 99.83 5145 1948 2.91 99.65 6850 2098 2.89 99.49 6966 183 2.72 99.60 6475 1418 2.67 99.60 5390 1082 2.35 99.45 38110 750 1.88 99.69 28125 481 1.50 99.80 18150 420 0.75 99.58 16
B03310 SCHUTT ET AL.: YELLOWSTONE RAYLEIGH WAVE TOMOGRAPHY
3 of 14
B03310

velocity within each region is uniquely resolved, to less thanone for the 150 s period. A unique regionalized phasevelocity for the longest period waves cannot be resolved
because of the relatively narrow width of the YHT and BRregions.[16] Another way to assess the regionalized inversions
robustness is to compare the results of the regionalized
Figure 2. Station-event surface wave great circle paths used in the 150, 50, and 15 s inversions.Yellowstone and Billings stations are indicated by green and red triangles, respectively. Yellow star showsthe Sour Creek volcanic dome as a proxy for the current location of the hot spot. The histogram showsobserved data for each wave period. Data coverage is excellent for wave periods between 18 and 90 s.
Table 2. Phase Velocity Results at 30 s
Model Velocity Variations Starting Model Nobs RMS Phase Misfit (s) Total Variance Reduction (%) Phase Variance Reduction (%)
1 constant none 3412 2.14 86.75 99.18%2 regionalized Model 1 3412 2.07 94.16 99.81%3 2-D Model 1 3412 1.93 93.56 99.84%4 2-D Model 2 3412 2.05 93.72 99.82%
B03310 SCHUTT ET AL.: YELLOWSTONE RAYLEIGH WAVE TOMOGRAPHY
4 of 14
B03310

inversion with the two dimensional inversions (Figure 4).For wave periods >50 s, no significant perturbations to theregionalized phase velocities are required to fit the data.This observation implies that it is sufficient to characterizethe velocity structure in terms of our three tectonic regions.One can also see the effect of the regionalized startingmodel on the 2-D inversion results by comparing inversionsperformed using the regionalized starting model (model 4 inTable 2) to those that did not use the regionalized startingmodel (model 3) (Figure 5). The effect of the regionalizedstarting model is evidenced by the continuity of the lowvelocities along the hot spot track. Correspondingly, thenonregionalized model does not show this hot spot trackcontinuity. Our preference for the regionalized model isbased upon two reasons. First, the body wave tomogramsshow that this is an accurate regionalization: in particularthe 110 km width of the hot spot track domain is wellconstrained by the body wave tomograms. Second, compar-isons of the variance reductions between the three differ-ently parameterized models (three velocity profile fit andthe 2-D nonregionalized and regionalized starting modelimages) shows that all of them provide comparable fits tothe data (Table 2).[17] It might be expected that the strong velocity varia-
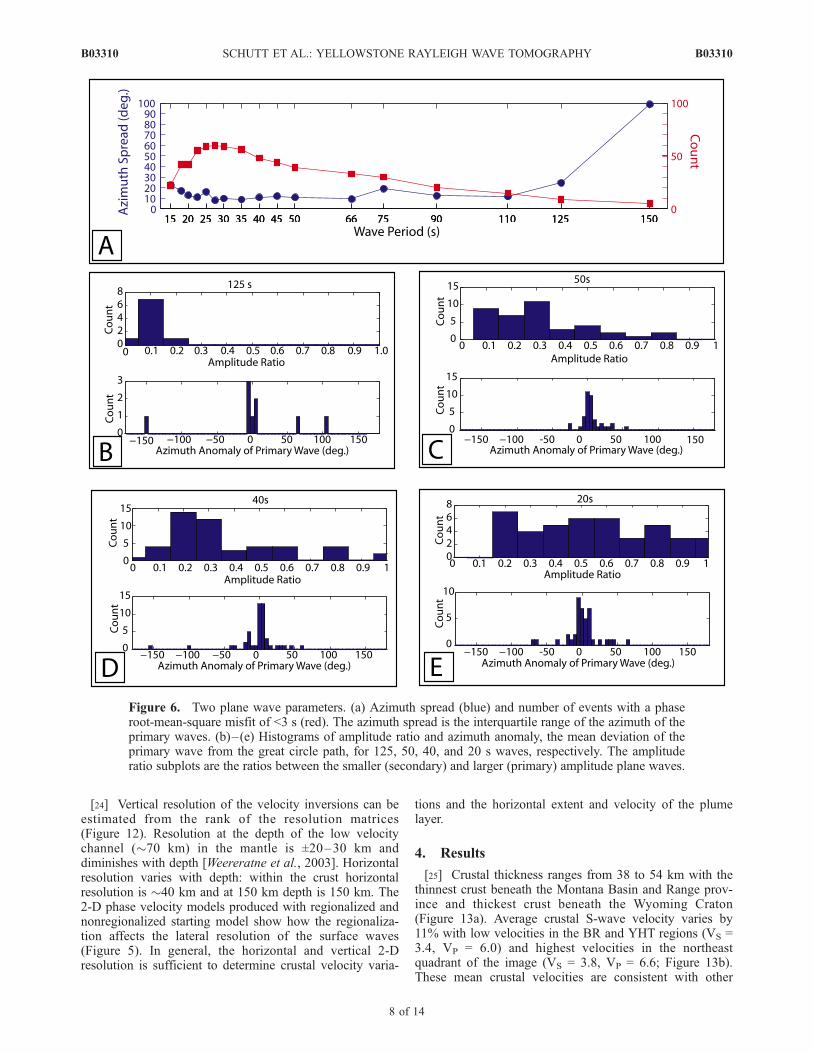
tions beneath our study area would cause some events to bepoorly modeled by the two plane wave approximation to theincoming wavefield. As previously stated, strongly multi-pathed events are downweighted during the inversion. Wenote that the two plane wave technique has been usedsuccessfully at locations with strong velocity variations,such as Tanzania and the East Pacific Rise [Forsyth et al.,1998b; Weeraratne et al., 2003]. Examination of the well-fitevents with a phase RMS misfit <3 s shows that nosystematic misfit exists (Figure 6; Table 3). As expected,the wavefield parameters show increased scattering at
shorter periods. For instance, the mean azimuthal anomaly(with respect to the great circle path) of the largest of thetwo plane waves decreases with increasing period. Inaddition, the amplitude ratio of the smaller plane wave tothe larger plane wave also decreases with increasing period.Furthermore, the scatter of the primary wave azimuthalanomalies also decreases with increasing period. If the largemantle velocity anomaly is causing unusual behavior in thetwo plane wave fits, this would be expected to occur at theperiods most sensitive to the depth of the anomaly, namelythe 30–66 s period waves. Given that no distinctiveincrease in misfits occurs for this period range, we expectthe main conclusions of the paper are not sensitive tostrongly multipathed waves.
3.2. Effects of Azimuthal Anisotropy
[18] SKS phase shear-wave splitting measurements find anearly uniform anisotropy field, having a mean horizontalfast symmetry direction of N43�E, with a mean split time of�1.2 s [Waite et al., 2005]. To assess the effect of azimuthalanisotropy on our phase velocity maps, cos(2q) and sin(2q)velocity terms, in which q represents azimuth, are added tothe model vector [Montagner et al., 2000]. We then invertfor isotropic phase velocity variations and the mean anisot-ropy magnitude and orientation at each period. The result-ing phase velocity curves are very similar to the pureisotropic profiles (Figure 7). This result suggests that theregionalized isotropic phase velocity results are not signif-icantly biased by velocity anisotropy.
3.3. Inversions of Phase Velocity for RegionalizedShear Wave Velocity Structure
[19] The regionalized phase velocity curves were used asdata to invert for regionalized shear wave velocity profiles.This inversion was done iteratively by solving for perturba-
Figure 3. Regionalized phase velocity results. (a) Regionalized phase velocities compared to Hawaii[Priestley and Tilmann, 1999], PREM [Dziewonski and Anderson, 1981], and the Colorado Great Plains[Li et al., 2002]. (b) Phase variance reduction after down-weighting poorly fit events. (c) Modelresolution matrix rank at each period for the three region inversion. When the rank is greater than two, themean phase velocities of the regions are independently resolved. At periods >75 s, the phase velocitiesbetween the regions cannot be independently resolved.
B03310 SCHUTT ET AL.: YELLOWSTONE RAYLEIGH WAVE TOMOGRAPHY
5 of 14
B03310

tions to an initially assumed VS model (equation (1)).Several starting velocity models based on previous obser-vations were tested [Greensfelder and Kovach, 1982;Priestley and Orcutt, 1982; Gorman et al., 2002]. In theend, a simple starting model was chosen that was the meanof the previous observations from the different regions. Thisstarting model has a 42-km-thick three-layer crust, and asub-Moho VS of 4.16 km/s (equivalent to a VP of 7.5 km/sfor a VP/VS value of 1.8) based on receiver function andprevious refraction constraints for the YHT [Sparlin et al.,1982; Peng and Humphreys, 1998, Yuan et al., 2006,Stachnik and Dueker, 2006]. Below the Moho, VS waslinearly increased from 4.16 km/s to match the VSV ofPREM at 200 km depth [Dziewonski and Anderson, 1981].The VP profile was generated using PREM VP/VSV values[Dziewonski and Anderson, 1981].[20] On the basis of the initial VP and VS structure, data
kernels @c/@VS (T, z) and @c/@VP (T, z) were calculated
where c is phase velocity, T is wave period, and z is depth(Figure 8) [Weeraratne et al., 2003]. Density effects onphase velocity have an insignificant effect and were fixed tonominal values [Weeraratne et al., 2003]. The S-P wavevelocity perturbation scaling (dVS/dVP) was assumed to be1.2, appropriate for the near solidus conditions of the YHT[Cammarano et al., 2003; Schutt and Lesher, 2006].[21] The observed phase velocity maps were inverted
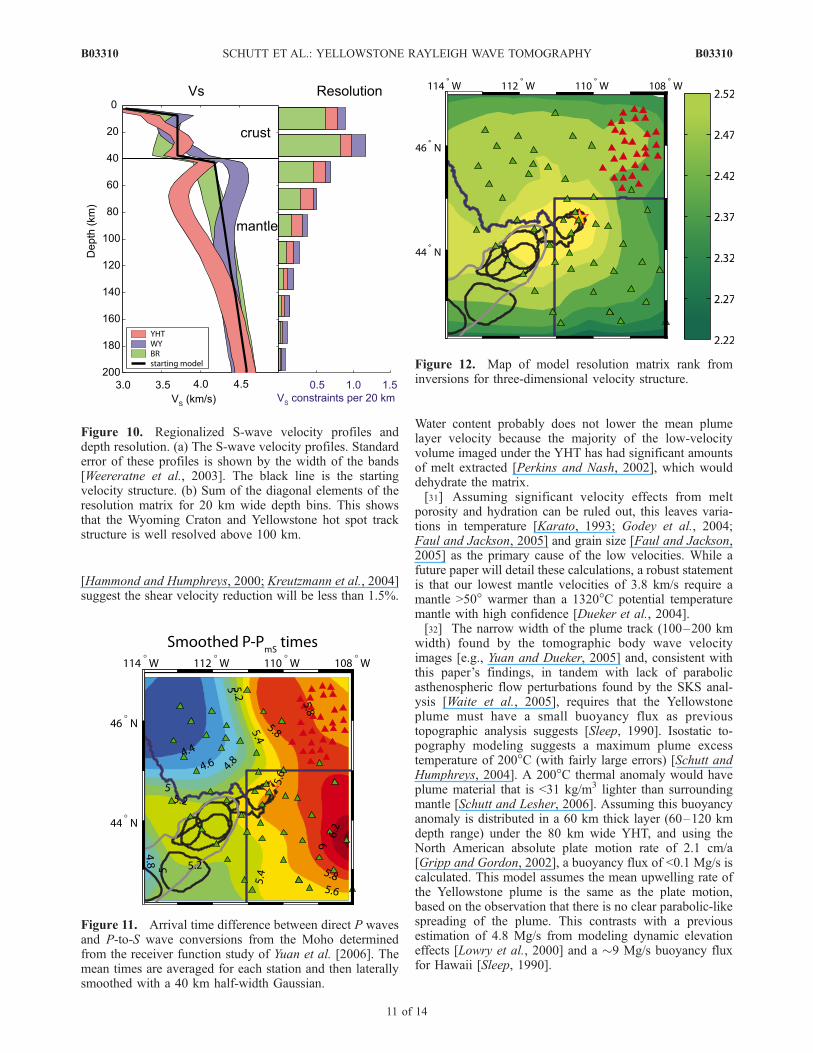
iteratively for VS structure with the recalculation of thedata kernels between iterations. The iteration was repeateduntil velocity updates changed <0.001 km/s. The leastsquares inversion was regularized using diagonal damping.The approximate ‘‘elbow’’ value of the damping parameterwas 25 s-2, and the best tradeoff between resolution andvariance (Figure 9). For consistency, the same dampingvalue was used for the regionalized BR and WY inversions,although this makes these inversions slightly underdamped(Figure 9). The rank of the resolution matrix for the
Figure 4. Two-dimensional phase velocity inversion of 15 s period waves. Yellowstone array stationsare green triangles and Billing array stations are red triangles. Location of the Yellowstone hot spot isgiven by the yellow star. The top left-hand plot shows the phase velocity map. Top right-hand plot is thechange from the starting model (the regionalized phase velocities shown in Figure 2). Bottom left plot isthe standard error of the calculated phase velocities. Bottom right plot is the velocity change divided bythe standard error which is proportional to velocity anomaly significance.
B03310 SCHUTT ET AL.: YELLOWSTONE RAYLEIGH WAVE TOMOGRAPHY
6 of 14
B03310

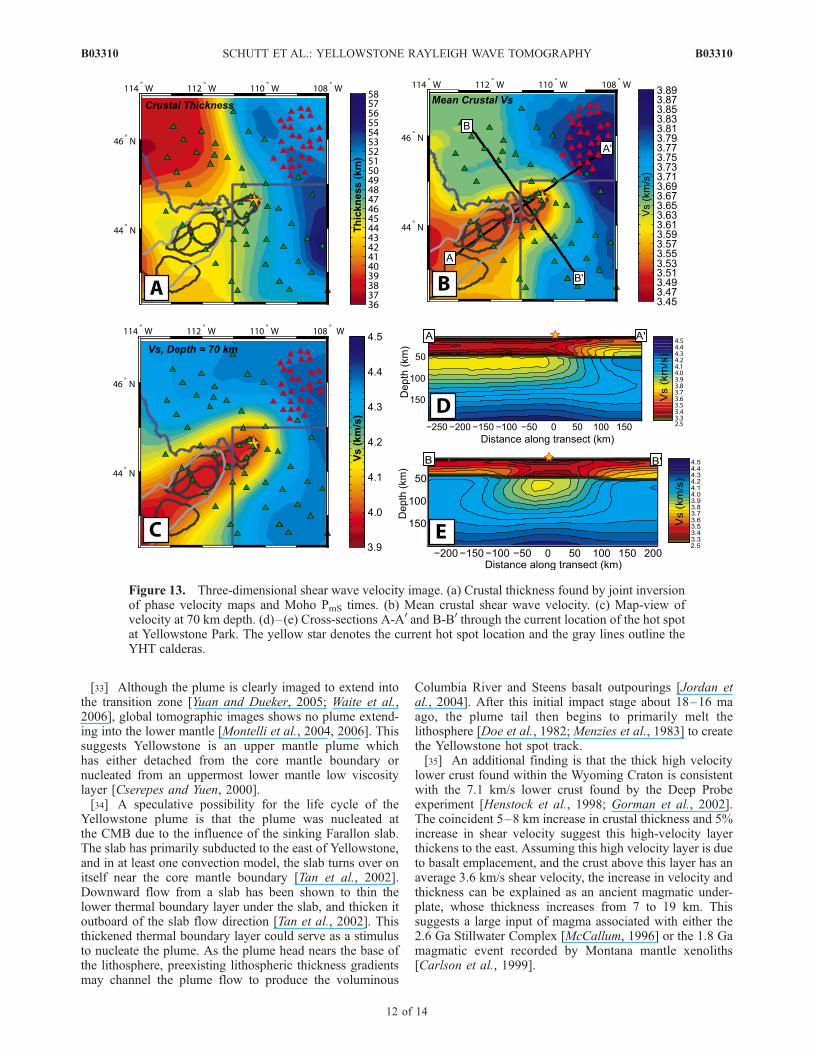
regionalized VS inversions varies from 3.7 for the Wyomingcraton region to 2.1 for the Basin and Range region. Asexpected, the resolution diminishes with depth (Figure 10).Noteworthy is that our Rayleigh wave data set cannotresolve the midcrustal basalt sill beneath the eastern SnakeRiver Plain [Peng and Humphreys, 1998], the bottom of thelow velocity plume layer, or the plume conduit.
3.4. Inversions of Phase Velocity for 3-D Shear WaveVelocity Structure
[22] Because inversions of phase velocity maps for VS arequite sensitive to crustal velocity and thickness variations(Figure 8), it is important to incorporate a priori informationon crustal thickness. We have used measurements of thetime difference between the direct P arrival and the Mohoconverted Pms arrival (hereafter called the Pms time) fromreceiver functions as crustal thickness constraints [Yuan etal., 2006]. These Pms times were spatially averaged using aGaussian half-width of 40 km to create a smoothed 2-D map(Figure 11). The coherent pattern of Pms time variationsvaries by 2.4 s due to crustal thickness variations between
38 and 54 km [Yuan et al., 2006]. In addition, receiverfunction reverberation analysis finds a mean crustal VP/VS
value of 1.78 [Yuan et al., 2006].[23] The Pms times are incorporated into our velocity
inversions as constraints. For each surface grid point, the VS
and VP starting profiles (VS and VP as a function of depthfor that grid point) used in the regionalized VS inversionwere modified by adjusting the thickness of the lowercrustal layer to match the observed Pms times. Using thesemodified VS and VP profiles, data kernels were generated toinvert the observed 2-D phase velocity maps (Figure 4) foran updated VS structure. The updated VS structure is thenused with the Pms time constraints to estimate a new crustalthickness. This process was iterated three times until the VS
and VP profiles matched the observed PmS times withintheir error bars. Synthetic tests show that the crustalthickness and mean crustal velocity can be resolved withina few percent of their true values. The bootstrap estimatedPms time errors are ±0.2 s and the VP/VS errors are ±0.04.Given these uncertainties, crustal thicknesses are accurate to±3 km, and the mean crustal VS is accurate to ±0.1 km/s.
Figure 5. Effect of using a regionalized starting model on 2-D phase velocity inversion, for 15 and 75 swaves. Left column of figures are 2-D inversion results where the regionalized phase velocity structure(Figure 3) was used as a starting point. Right column of figures are the 2-D inversion results with auniform starting model.
B03310 SCHUTT ET AL.: YELLOWSTONE RAYLEIGH WAVE TOMOGRAPHY
7 of 14
B03310
[24] Vertical resolution of the velocity inversions can beestimated from the rank of the resolution matrices(Figure 12). Resolution at the depth of the low velocitychannel (�70 km) in the mantle is ±20–30 km anddiminishes with depth [Weereratne et al., 2003]. Horizontalresolution varies with depth: within the crust horizontalresolution is �40 km and at 150 km depth is 150 km. The2-D phase velocity models produced with regionalized andnonregionalized starting model show how the regionaliza-tion affects the lateral resolution of the surface waves(Figure 5). In general, the horizontal and vertical 2-Dresolution is sufficient to determine crustal velocity varia-
tions and the horizontal extent and velocity of the plumelayer.
4. Results
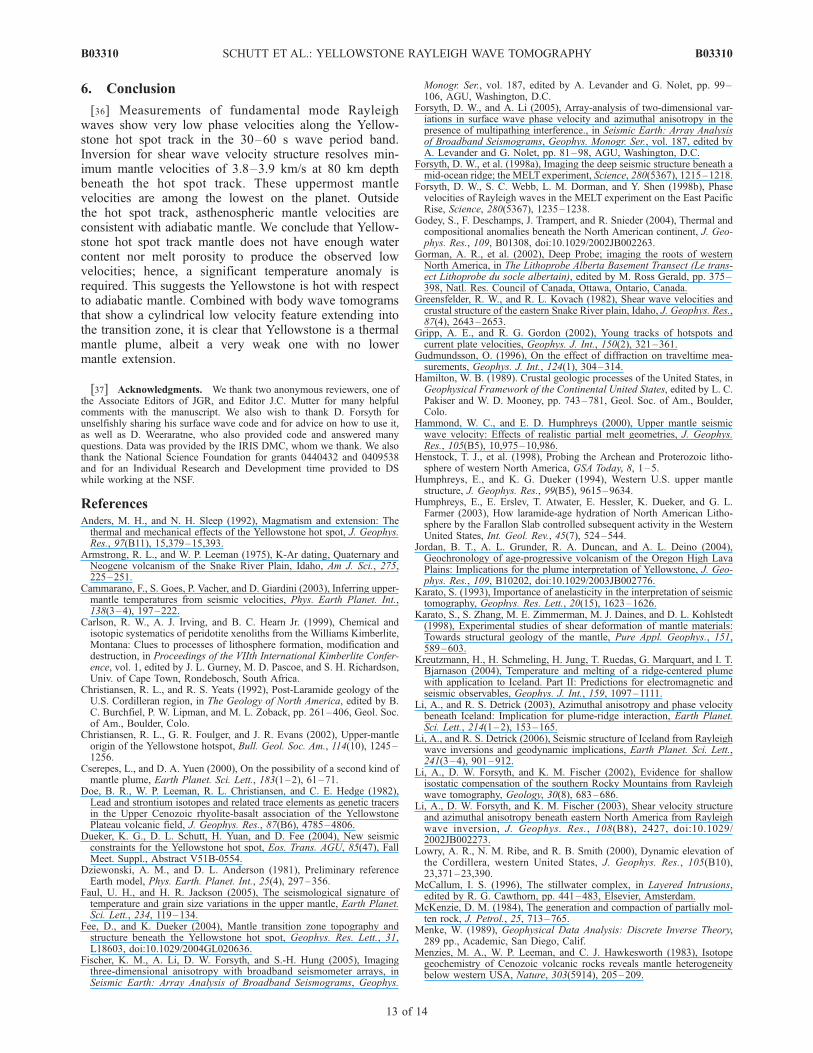
[25] Crustal thickness ranges from 38 to 54 km with thethinnest crust beneath the Montana Basin and Range prov-ince and thickest crust beneath the Wyoming Craton(Figure 13a). Average crustal S-wave velocity varies by11% with low velocities in the BR and YHT regions (VS =3.4, VP = 6.0) and highest velocities in the northeastquadrant of the image (VS = 3.8, VP = 6.6; Figure 13b).These mean crustal velocities are consistent with other
Figure 6. Two plane wave parameters. (a) Azimuth spread (blue) and number of events with a phaseroot-mean-square misfit of <3 s (red). The azimuth spread is the interquartile range of the azimuth of theprimary waves. (b)–(e) Histograms of amplitude ratio and azimuth anomaly, the mean deviation of theprimary wave from the great circle path, for 125, 50, 40, and 20 s waves, respectively. The amplituderatio subplots are the ratios between the smaller (secondary) and larger (primary) amplitude plane waves.
B03310 SCHUTT ET AL.: YELLOWSTONE RAYLEIGH WAVE TOMOGRAPHY
8 of 14
B03310
studies in the region [Gorman et al., 2002; Zhou and Stump,2004; Zeiler et al., 2005].[26] Beneath the YHT, a profound low velocity zone with
a velocity minimum of 3.8 km/s at 80 km depth is imaged(Figure 11 and 13) which is 7% lower than the adjacent4.1 km/s mantle. The 100 km width of the hot spot trackanomaly imaged by the body wave tomograms [Saltzer andHumphreys, 1997; Schutt and Humphreys, 2004; Yuan andDueker, 2005; Waite et al., 2006] is similar to the 80 kmwidth of the eastern Snake River Plain. The halo of averagevelocities (yellow colors in Figure 13c) around the hot spottrack is caused by inversion regularization, and the actualvelocity transition is sharper as resolved by body wavetomography. It is notable that our velocity model is consis-tent with plume material only residing beneath the 100 kmwide eastern Snake River Plain, compared to the muchbroader ‘‘tectonic parabola’’ which is based on current-faulting and paleofaulting rates [e.g., Anders and Sleep,1992]. Below 100 km depth, the surface wave data cannotuniquely resolve the width of the plume mantle. Indeed, thewidth of the deep low velocity zone is defined by theregionalization, derived from the body wave tomography[Yuan and Dueker, 2005; Waite et al., 2006].
[27] The YHT low velocity anomaly extends to about120 km depth before intersecting the shear velocity predictedfor a 1320�C adiabatic mantle [Cammarano et al., 2003;Fauland Jackson, 2005; Stixrude and Lithgow-Bertelloni, 2005].However, the base of the low velocity plume layer is notwell resolved due to declining resolution with depth. Note-worthy is that no perturbations of our starting model arerequired below 140 km depth (Figure 10).
5. Discussion
[28] The 4.2 km/s velocity at 95 km depth beneath theWyoming craton to the east of the hot spot (Figures 13d and13e) is similar to the shear velocity for 4–20 Ma oceanicprofiles [Nishimura and Forsyth, 1989]. This suggests thatbelow 90 km the Wyoming province mantle temperature isconsistent with a nominal mantle adiabat [Faul and Jackson,2005]. Yet, xenoliths from the Eocene William Kimberlitein east Montana suggests a 170 km thick lithosphere existedhere 50 Ma ago [Carlson et al., 1999]. To reconcile thisthick Eocene-age lithosphere with the thinner modern dayWyoming lithosphere, we speculate that the Laramide-ageslab hydrated the lithosphere [Humphreys et al., 2003] toenable subsequent post-Laramide convective destabilizationand lithospheric thinning. This potential convective thin-ning may have been initiated or accelerated by the nearbyYellowstone plume. However, we reiterate that no plumematerial extends significantly beyond the confines of theYHT, albeit the entrainment of ambient mantle certainlydoes extend outward [Yuan and Dueker, 2005; Waite et al.,2006].[29] The 3.8 km/s velocity minimum at 80 km under the
YHT compares to minimum shear velocity of 4.0 km/s forthe Hawaii to Oahu path [Priestley and Tilmann, 1999] and3.8 km/s in the western arm of the East Africa Rift[Weeraratne et al., 2003]. Thus, the YHT uppermost mantleis one of the lowest velocity uppermost mantle regions onthe Earth.[30] Possible causes of the low mantle velocity are many:
melt porosity, mantle hydration, small grain sizes, or in-creased temperature [Karato, 1993; Karato et al., 1998;Kreutzmann et al., 2004; Faul and Jackson, 2005]. Ifequilibrium melt porosity along the YHT is �0.2%[McKenzie, 1984], then melt velocity scaling relationships
Table 3. Statistics From Two Plane Wave Fitsa
WavePeriod (s) N
MedianAmplitude Ratio
Median AzimuthalAnomaly (deg)
AzimuthalSpread (deg)
150 5 0.096 5.617 98.774125 9 0.103 5.874 24.56110 15 0.143 3.282 11.46890 20 0.222 6.113 12.31175 30 0.192 5.026 19.22266 33 0.299 3.84 9.31650 39 0.296 4.17 10.91745 44 0.279 5.563 12.05240 48 0.28 4.839 10.78635 56 0.36 6.915 8.7430 59 0.382 3.678 9.72527.5 60 0.362 4.146 8.12825 59 0.408 7.398 16.05222.5 55 0.454 6.434 11.16420 42 0.518 7.332 12.92518 42 0.501 7.596 17.10915 22 0.638 14.544 22.402aSee Figure 6 caption for explanation of columns.
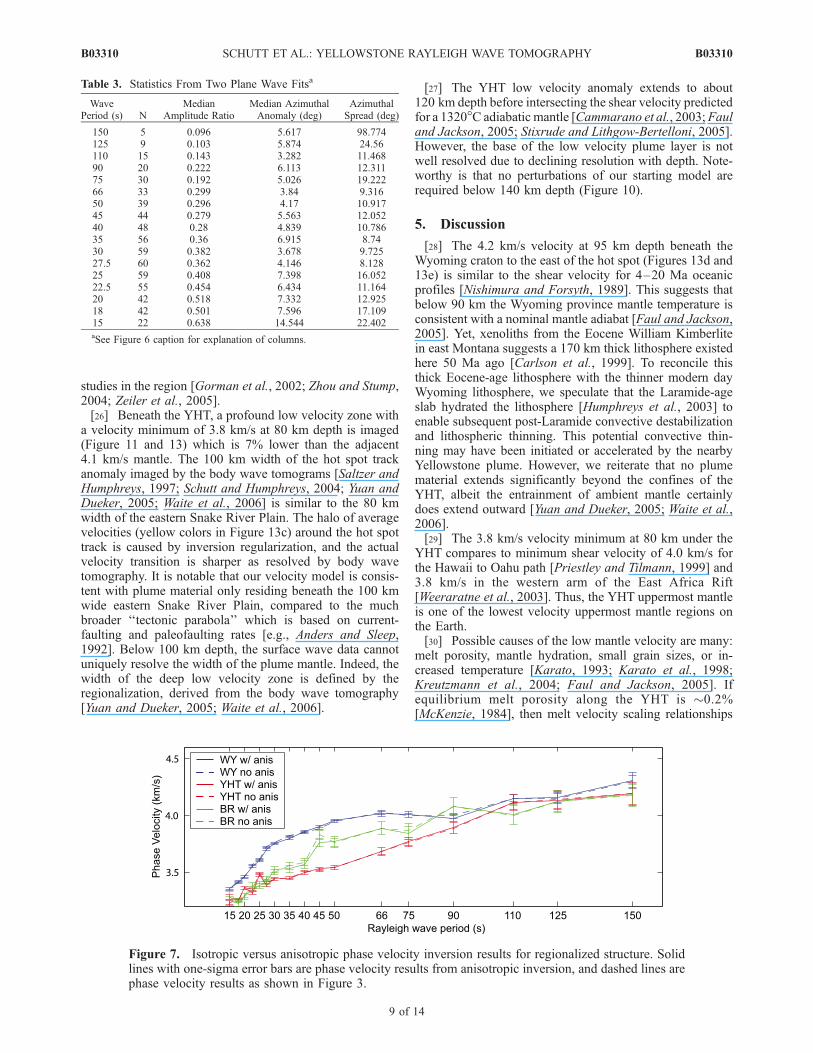
Figure 7. Isotropic versus anisotropic phase velocity inversion results for regionalized structure. Solidlines with one-sigma error bars are phase velocity results from anisotropic inversion, and dashed lines arephase velocity results as shown in Figure 3.
B03310 SCHUTT ET AL.: YELLOWSTONE RAYLEIGH WAVE TOMOGRAPHY
9 of 14
B03310
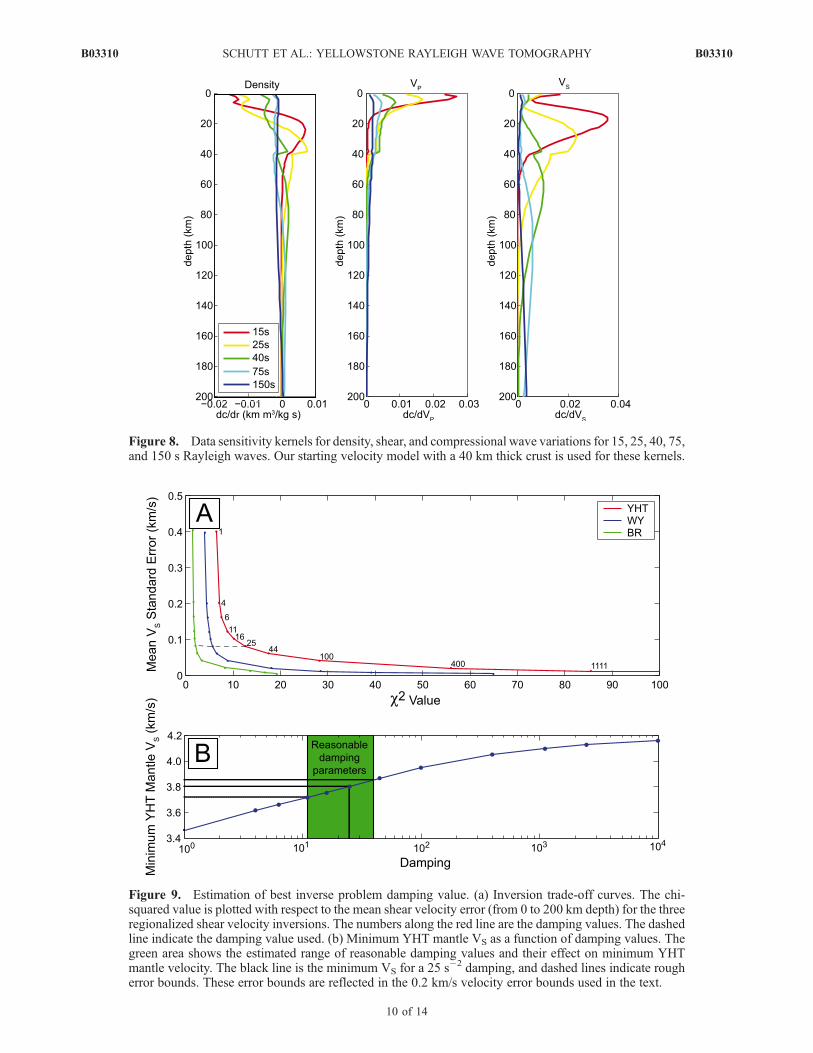
Figure 8. Data sensitivity kernels for density, shear, and compressional wave variations for 15, 25, 40, 75,and 150 s Rayleigh waves. Our starting velocity model with a 40 km thick crust is used for these kernels.
Figure 9. Estimation of best inverse problem damping value. (a) Inversion trade-off curves. The chi-squared value is plotted with respect to the mean shear velocity error (from 0 to 200 km depth) for the threeregionalized shear velocity inversions. The numbers along the red line are the damping values. The dashedline indicate the damping value used. (b) Minimum YHT mantle VS as a function of damping values. Thegreen area shows the estimated range of reasonable damping values and their effect on minimum YHTmantle velocity. The black line is the minimum VS for a 25 s�2 damping, and dashed lines indicate rougherror bounds. These error bounds are reflected in the 0.2 km/s velocity error bounds used in the text.
B03310 SCHUTT ET AL.: YELLOWSTONE RAYLEIGH WAVE TOMOGRAPHY
10 of 14
B03310
[Hammond and Humphreys, 2000; Kreutzmann et al., 2004]suggest the shear velocity reduction will be less than 1.5%.
Water content probably does not lower the mean plumelayer velocity because the majority of the low-velocityvolume imaged under the YHT has had significant amountsof melt extracted [Perkins and Nash, 2002], which woulddehydrate the matrix.[31] Assuming significant velocity effects from melt
porosity and hydration can be ruled out, this leaves varia-tions in temperature [Karato, 1993; Godey et al., 2004;Faul and Jackson, 2005] and grain size [Faul and Jackson,2005] as the primary cause of the low velocities. While afuture paper will detail these calculations, a robust statementis that our lowest mantle velocities of 3.8 km/s require amantle >50� warmer than a 1320�C potential temperaturemantle with high confidence [Dueker et al., 2004].[32] The narrow width of the plume track (100–200 km
width) found by the tomographic body wave velocityimages [e.g., Yuan and Dueker, 2005] and, consistent withthis paper’s findings, in tandem with lack of parabolicasthenospheric flow perturbations found by the SKS anal-ysis [Waite et al., 2005], requires that the Yellowstoneplume must have a small buoyancy flux as previoustopographic analysis suggests [Sleep, 1990]. Isostatic to-pography modeling suggests a maximum plume excesstemperature of 200�C (with fairly large errors) [Schutt andHumphreys, 2004]. A 200�C thermal anomaly would haveplume material that is <31 kg/m3 lighter than surroundingmantle [Schutt and Lesher, 2006]. Assuming this buoyancyanomaly is distributed in a 60 km thick layer (60–120 kmdepth range) under the 80 km wide YHT, and using theNorth American absolute plate motion rate of 2.1 cm/a[Gripp and Gordon, 2002], a buoyancy flux of <0.1 Mg/s iscalculated. This model assumes the mean upwelling rate ofthe Yellowstone plume is the same as the plate motion,based on the observation that there is no clear parabolic-likespreading of the plume. This contrasts with a previousestimation of 4.8 Mg/s from modeling dynamic elevationeffects [Lowry et al., 2000] and a �9 Mg/s buoyancy fluxfor Hawaii [Sleep, 1990].
Figure 10. Regionalized S-wave velocity profiles anddepth resolution. (a) The S-wave velocity profiles. Standarderror of these profiles is shown by the width of the bands[Weereratne et al., 2003]. The black line is the startingvelocity structure. (b) Sum of the diagonal elements of theresolution matrix for 20 km wide depth bins. This showsthat the Wyoming Craton and Yellowstone hot spot trackstructure is well resolved above 100 km.
Figure 11. Arrival time difference between direct P wavesand P-to-S wave conversions from the Moho determinedfrom the receiver function study of Yuan et al. [2006]. Themean times are averaged for each station and then laterallysmoothed with a 40 km half-width Gaussian.
Figure 12. Map of model resolution matrix rank frominversions for three-dimensional velocity structure.
B03310 SCHUTT ET AL.: YELLOWSTONE RAYLEIGH WAVE TOMOGRAPHY
11 of 14
B03310
[33] Although the plume is clearly imaged to extend intothe transition zone [Yuan and Dueker, 2005; Waite et al.,2006], global tomographic images shows no plume extend-ing into the lower mantle [Montelli et al., 2004, 2006]. Thissuggests Yellowstone is an upper mantle plume whichhas either detached from the core mantle boundary ornucleated from an uppermost lower mantle low viscositylayer [Cserepes and Yuen, 2000].[34] A speculative possibility for the life cycle of the
Yellowstone plume is that the plume was nucleated atthe CMB due to the influence of the sinking Farallon slab.The slab has primarily subducted to the east of Yellowstone,and in at least one convection model, the slab turns over onitself near the core mantle boundary [Tan et al., 2002].Downward flow from a slab has been shown to thin thelower thermal boundary layer under the slab, and thicken itoutboard of the slab flow direction [Tan et al., 2002]. Thisthickened thermal boundary layer could serve as a stimulusto nucleate the plume. As the plume head nears the base ofthe lithosphere, preexisting lithospheric thickness gradientsmay channel the plume flow to produce the voluminous
Columbia River and Steens basalt outpourings [Jordan etal., 2004]. After this initial impact stage about 18–16 maago, the plume tail then begins to primarily melt thelithosphere [Doe et al., 1982; Menzies et al., 1983] to createthe Yellowstone hot spot track.[35] An additional finding is that the thick high velocity
lower crust found within the Wyoming Craton is consistentwith the 7.1 km/s lower crust found by the Deep Probeexperiment [Henstock et al., 1998; Gorman et al., 2002].The coincident 5–8 km increase in crustal thickness and 5%increase in shear velocity suggest this high-velocity layerthickens to the east. Assuming this high velocity layer is dueto basalt emplacement, and the crust above this layer has anaverage 3.6 km/s shear velocity, the increase in velocity andthickness can be explained as an ancient magmatic under-plate, whose thickness increases from 7 to 19 km. Thissuggests a large input of magma associated with either the2.6 Ga Stillwater Complex [McCallum, 1996] or the 1.8 Gamagmatic event recorded by Montana mantle xenoliths[Carlson et al., 1999].
Figure 13. Three-dimensional shear wave velocity image. (a) Crustal thickness found by joint inversionof phase velocity maps and Moho PmS times. (b) Mean crustal shear wave velocity. (c) Map-view ofvelocity at 70 km depth. (d)–(e) Cross-sections A-A0 and B-B0 through the current location of the hot spotat Yellowstone Park. The yellow star denotes the current hot spot location and the gray lines outline theYHT calderas.
B03310 SCHUTT ET AL.: YELLOWSTONE RAYLEIGH WAVE TOMOGRAPHY
12 of 14
B03310
6. Conclusion
[36] Measurements of fundamental mode Rayleighwaves show very low phase velocities along the Yellow-stone hot spot track in the 30–60 s wave period band.Inversion for shear wave velocity structure resolves min-imum mantle velocities of 3.8–3.9 km/s at 80 km depthbeneath the hot spot track. These uppermost mantlevelocities are among the lowest on the planet. Outsidethe hot spot track, asthenospheric mantle velocities areconsistent with adiabatic mantle. We conclude that Yellow-stone hot spot track mantle does not have enough watercontent nor melt porosity to produce the observed lowvelocities; hence, a significant temperature anomaly isrequired. This suggests the Yellowstone is hot with respectto adiabatic mantle. Combined with body wave tomogramsthat show a cylindrical low velocity feature extending intothe transition zone, it is clear that Yellowstone is a thermalmantle plume, albeit a very weak one with no lowermantle extension.
[37] Acknowledgments. We thank two anonymous reviewers, one ofthe Associate Editors of JGR, and Editor J.C. Mutter for many helpfulcomments with the manuscript. We also wish to thank D. Forsyth forunselfishly sharing his surface wave code and for advice on how to use it,as well as D. Weeraratne, who also provided code and answered manyquestions. Data was provided by the IRIS DMC, whom we thank. We alsothank the National Science Foundation for grants 0440432 and 0409538and for an Individual Research and Development time provided to DSwhile working at the NSF.
ReferencesAnders, M. H., and N. H. Sleep (1992), Magmatism and extension: Thethermal and mechanical effects of the Yellowstone hot spot, J. Geophys.Res., 97(B11), 15,379–15,393.
Armstrong, R. L., and W. P. Leeman (1975), K-Ar dating, Quaternary andNeogene volcanism of the Snake River Plain, Idaho, Am J. Sci., 275,225–251.
Cammarano, F., S. Goes, P. Vacher, and D. Giardini (2003), Inferring upper-mantle temperatures from seismic velocities, Phys. Earth Planet. Int.,138(3–4), 197–222.
Carlson, R. W., A. J. Irving, and B. C. Hearn Jr. (1999), Chemical andisotopic systematics of peridotite xenoliths from the Williams Kimberlite,Montana: Clues to processes of lithosphere formation, modification anddestruction, in Proceedings of the VIIth International Kimberlite Confer-ence, vol. 1, edited by J. L. Gurney, M. D. Pascoe, and S. H. Richardson,Univ. of Cape Town, Rondebosch, South Africa.
Christiansen, R. L., and R. S. Yeats (1992), Post-Laramide geology of theU.S. Cordilleran region, in The Geology of North America, edited by B.C. Burchfiel, P. W. Lipman, and M. L. Zoback, pp. 261–406, Geol. Soc.of Am., Boulder, Colo.
Christiansen, R. L., G. R. Foulger, and J. R. Evans (2002), Upper-mantleorigin of the Yellowstone hotspot, Bull. Geol. Soc. Am., 114(10), 1245–1256.
Cserepes, L., and D. A. Yuen (2000), On the possibility of a second kind ofmantle plume, Earth Planet. Sci. Lett., 183(1–2), 61–71.
Doe, B. R., W. P. Leeman, R. L. Christiansen, and C. E. Hedge (1982),Lead and strontium isotopes and related trace elements as genetic tracersin the Upper Cenozoic rhyolite-basalt association of the YellowstonePlateau volcanic field, J. Geophys. Res., 87(B6), 4785–4806.
Dueker, K. G., D. L. Schutt, H. Yuan, and D. Fee (2004), New seismicconstraints for the Yellowstone hot spot, Eos. Trans. AGU, 85(47), FallMeet. Suppl., Abstract V51B-0554.
Dziewonski, A. M., and D. L. Anderson (1981), Preliminary referenceEarth model, Phys. Earth. Planet. Int., 25(4), 297–356.
Faul, U. H., and H. R. Jackson (2005), The seismological signature oftemperature and grain size variations in the upper mantle, Earth Planet.Sci. Lett., 234, 119–134.
Fee, D., and K. Dueker (2004), Mantle transition zone topography andstructure beneath the Yellowstone hot spot, Geophys. Res. Lett., 31,L18603, doi:10.1029/2004GL020636.
Fischer, K. M., A. Li, D. W. Forsyth, and S.-H. Hung (2005), Imagingthree-dimensional anisotropy with broadband seismometer arrays, inSeismic Earth: Array Analysis of Broadband Seismograms, Geophys.
Monogr. Ser., vol. 187, edited by A. Levander and G. Nolet, pp. 99–106, AGU, Washington, D.C.
Forsyth, D. W., and A. Li (2005), Array-analysis of two-dimensional var-iations in surface wave phase velocity and azimuthal anisotropy in thepresence of multipathing interference., in Seismic Earth: Array Analysisof Broadband Seismograms, Geophys. Monogr. Ser., vol. 187, edited byA. Levander and G. Nolet, pp. 81–98, AGU, Washington, D.C.
Forsyth, D. W., et al. (1998a), Imaging the deep seismic structure beneath amid-ocean ridge; the MELT experiment, Science, 280(5367), 1215–1218.
Forsyth, D. W., S. C. Webb, L. M. Dorman, and Y. Shen (1998b), Phasevelocities of Rayleigh waves in the MELT experiment on the East PacificRise, Science, 280(5367), 1235–1238.
Godey, S., F. Deschamps, J. Trampert, and R. Snieder (2004), Thermal andcompositional anomalies beneath the North American continent, J. Geo-phys. Res., 109, B01308, doi:10.1029/2002JB002263.
Gorman, A. R., et al. (2002), Deep Probe; imaging the roots of westernNorth America, in The Lithoprobe Alberta Basement Transect (Le trans-ect Lithoprobe du socle albertain), edited by M. Ross Gerald, pp. 375–398, Natl. Res. Council of Canada, Ottawa, Ontario, Canada.
Greensfelder, R. W., and R. L. Kovach (1982), Shear wave velocities andcrustal structure of the eastern Snake River plain, Idaho, J. Geophys. Res.,87(4), 2643–2653.
Gripp, A. E., and R. G. Gordon (2002), Young tracks of hotspots andcurrent plate velocities, Geophys. J. Int., 150(2), 321–361.
Gudmundsson, O. (1996), On the effect of diffraction on traveltime mea-surements, Geophys. J. Int., 124(1), 304–314.
Hamilton, W. B. (1989). Crustal geologic processes of the United States, inGeophysical Framework of the Continental United States, edited by L. C.Pakiser and W. D. Mooney, pp. 743–781, Geol. Soc. of Am., Boulder,Colo.
Hammond, W. C., and E. D. Humphreys (2000), Upper mantle seismicwave velocity: Effects of realistic partial melt geometries, J. Geophys.Res., 105(B5), 10,975–10,986.
Henstock, T. J., et al. (1998), Probing the Archean and Proterozoic litho-sphere of western North America, GSA Today, 8, 1–5.
Humphreys, E., and K. G. Dueker (1994), Western U.S. upper mantlestructure, J. Geophys. Res., 99(B5), 9615–9634.
Humphreys, E., E. Erslev, T. Atwater, E. Hessler, K. Dueker, and G. L.Farmer (2003), How laramide-age hydration of North American Litho-sphere by the Farallon Slab controlled subsequent activity in the WesternUnited States, Int. Geol. Rev., 45(7), 524–544.
Jordan, B. T., A. L. Grunder, R. A. Duncan, and A. L. Deino (2004),Geochronology of age-progressive volcanism of the Oregon High LavaPlains: Implications for the plume interpretation of Yellowstone, J. Geo-phys. Res., 109, B10202, doi:10.1029/2003JB002776.
Karato, S. (1993), Importance of anelasticity in the interpretation of seismictomography, Geophys. Res. Lett., 20(15), 1623–1626.
Karato, S., S. Zhang, M. E. Zimmerman, M. J. Daines, and D. L. Kohlstedt(1998), Experimental studies of shear deformation of mantle materials:Towards structural geology of the mantle, Pure Appl. Geophys., 151,589–603.
Kreutzmann, H., H. Schmeling, H. Jung, T. Ruedas, G. Marquart, and I. T.Bjarnason (2004), Temperature and melting of a ridge-centered plumewith application to Iceland. Part II: Predictions for electromagnetic andseismic observables, Geophys. J. Int., 159, 1097–1111.
Li, A., and R. S. Detrick (2003), Azimuthal anisotropy and phase velocitybeneath Iceland: Implication for plume-ridge interaction, Earth Planet.Sci. Lett., 214(1–2), 153–165.
Li, A., and R. S. Detrick (2006), Seismic structure of Iceland from Rayleighwave inversions and geodynamic implications, Earth Planet. Sci. Lett.,241(3–4), 901–912.
Li, A., D. W. Forsyth, and K. M. Fischer (2002), Evidence for shallowisostatic compensation of the southern Rocky Mountains from Rayleighwave tomography, Geology, 30(8), 683–686.
Li, A., D. W. Forsyth, and K. M. Fischer (2003), Shear velocity structureand azimuthal anisotropy beneath eastern North America from Rayleighwave inversion, J. Geophys. Res., 108(B8), 2427, doi:10.1029/2002JB002273.
Lowry, A. R., N. M. Ribe, and R. B. Smith (2000), Dynamic elevation ofthe Cordillera, western United States, J. Geophys. Res., 105(B10),23,371–23,390.
McCallum, I. S. (1996), The stillwater complex, in Layered Intrusions,edited by R. G. Cawthorn, pp. 441–483, Elsevier, Amsterdam.
McKenzie, D. M. (1984), The generation and compaction of partially mol-ten rock, J. Petrol., 25, 713–765.
Menke, W. (1989), Geophysical Data Analysis: Discrete Inverse Theory,289 pp., Academic, San Diego, Calif.
Menzies, M. A., W. P. Leeman, and C. J. Hawkesworth (1983), Isotopegeochemistry of Cenozoic volcanic rocks reveals mantle heterogeneitybelow western USA, Nature, 303(5914), 205–209.
B03310 SCHUTT ET AL.: YELLOWSTONE RAYLEIGH WAVE TOMOGRAPHY
13 of 14
B03310
Montagner, J.-P., D.-A. Griot-Pommera, and J. Lave (2000), How to relatebody wave and surface wave anisotropy?, J. Geophys. Res., 105(8),19,915–19,027.
Montelli, R., G. Nolet, G. Masters, F. A. Dahlen, and S. H. Hung (2004),Global P and PP traveltime tomography: Rays versus waves, Geophys. J.Int., 158(2), 637–654.
Montelli, R., G. Nolet, F. A. Dahlen, and G. Masters (2006), A catalogue ofdeep mantle plumes: New results from finite-frequency tomography,Geochem. Geophys. Geosyst., 7, Q11007, doi:10.1029/2006GC001248.
Morgan, L. A., D. J. Doherty, and W. P. Leeman (1984), Ignimbrites of theeastern Snake River Plain: evidence for major caldera-forming eruptions,J. Geophys. Res., 89(B10), 8665–8678.
Nishimura, C. E., and D. W. Forsyth (1989), The anisotropic structure ofthe upper mantle in the Pacific, Geophys. J. Int., 96, 203–229.
Peng, X., and E. D. Humphreys (1998), Crustal velocity structure across theeastern Snake River Plain and the Yellowstone swell, J. Geophys. Res.,103(B4), 7171–7186.
Perkins, M. E., and B. P. Nash (2002), Explosive silicic volcanism of theYellowstone hotspot: The ash fall tuff record, Geol. Soc. Am. Bull.,114(3), 367–381.
Priestley, K. F., and J. Orcutt (1982), Extremal travel time inversion ofexplosion seismology data from the eastern Snake River plain, Idaho,J. Geophys. Res., 87(B4), 2634–2642.
Priestley, K. F., and F. J. Tilmann (1999), Shear-wave of the lithosphereabove the Hawaiian hot spot from two-station Rayleigh wave phasevelocity measurements, Geophys. Res. Lett., 26(10), 1493–1496.
Saltzer, R. L., and E. D. Humphreys (1997), Upper mantle P wave velocitystructure of the eastern Snake River plain and its relationship to geody-namic models of the region, J. Geophys. Res., 102(B6), 11,829–11,841.
Schutt, D., and L. Humphreys (2004), P and S wave velocity and Vp/Vs inthe wake of the Yellowstone hot spot, J. Geophys. Res., 109, B01305,doi:10.1029/2003JB002442.
Schutt, D. L., and C. E. Lesher (2006), The effects of melt depletion on thedensity and seismic velocity of garnet and spinel lherzolite, J. Geophys.Res., 111, B05401, doi:10.1029/2003JB002950.
Sleep, N. H. (1990), Hot spots and mantle plumes: Some phenomenology,J. Geophys. Res., 95(B5), 6715–6736.
Sparlin, M. A., L. W. Braile, and R. B. Smith (1982), Crustal structure ofthe eastern Snake River Plain from ray trace modeling of seismic refrac-tion data, J. Geophys. Res., 87(B4), 2619–2633.
Stachnik, J. C., and K. Dueker (2006), Constraining Yellowstone magmaticprocesses beneath the eastern Snake River Plain from Rayleigh wave
ambient noise, Eos Trans. AGU, 87(52), Fall Meet. Suppl., AbstractS43A-1375.
Stixrude, L., and B. C. Lithgow-Bertelloni (2005), Mineralogy and elasti-city of the oceanic upper mantle: Origin of the low-velocity zone, J.Geophys. Res., 110, B03204, doi:10.1029/2004JB002965.
Tan, E., M. Gurnis, and L. Han (2002), Slabs in the lower mantle and theirmodulation of plume formation, Geochem. Geophys. Geosyst., 3(11),1067, doi:10.1029/2001GC000238.
Tarantola, A., and B. Valette (1982), Generalized nonlinear inverse pro-blems solved using the least squares criterion, Rev. Geophys., 20(2),219–232.
Waite, G., D. Schutt, and R. B. Smith (2005), Models of lithosphere andasthenosphere anisotropic structure of the Yellowstone hot spot fromshear wave splitting, J. Geophys. Res., 110, B11304, doi:10.1029/2004JB003501.
Waite, G., R. B. Smith, and R. M. Allen (2006), Vp and Vs structure of theYellowstone Hot spot upper mantle from teleseismic tomography: Evi-dence for an upper mantle plume, J. Geophys. Res., 111, B04303,doi:10.1029/2005JB003867.
Weeraratne, D. S., D. W. Forsyth, K. M. Fischer, and A. A. Nyblade (2003),Evidence for an upper mantle plume beneath the Tanzanian craton fromRayleigh wave tomography, J. Geophys. Res., 108(B9), 2427,doi:10.1029/2002JB002273.
West, M., W. Gao, and S. Grand (2004), A simple approach to the jointinversion of seismic body and surface waves applied to the SouthwestU.S, Geophys. Res. Lett., 31, L15615, doi:10.1029/2004GL020373.
Yuan, H., and K. Dueker (2005), Teleseismic P-wave tomogram of theYellowstone plume, Geophys. Res. Lett., 32, L07304, doi:10.1029/2004GL022056.
Yuan, H., K. Dueker, and D. L. Schutt (2006), Synoptic scale crustalthickness and velocity maps along the Yellowstone hot spot track, EosTrans. AGU, 87(52), Fall Meet. Suppl., Abstract S43A-1376.
Zeiler, C. P., M. C. Stickney, and M. A. Speece (2005), Revised velocitystructure of Western Montana, Bull. Seismol. Soc. Am., 95(2), 759–762,doi:10.1785/0120040088.
Zhou, R.-M., and B. W. Stump (2004), Rayleigh waves generated bymining explosions and upper crustal structure around the Powder RiverBasin, Wyoming, Bull. Seismol. Soc. Am., 94(4), 1410–1429.
�����������������������K. Dueker, D. L. Schutt, and H. Yuan, Department of Geology and
Geophysics, University of Wyoming, P. O. Box 3006, Laramie, WY 82071-3006, USA. ([email protected])
B03310 SCHUTT ET AL.: YELLOWSTONE RAYLEIGH WAVE TOMOGRAPHY
14 of 14
B03310
Copyright © 2022 FDOKUMEN