Assessing the impact of petrol stations on their immediate surroundings
9
Assessing the impact of petrol stations on their immediate surroundings Isabel M. Morales Terrés, Marta Doval Miñarro * , Enrique González Ferradas, Antonia Baeza Caracena, Jonathan Barberá Rico Department of Chemical Engineering, School of Chemistry, University of Murcia, 30071 Murcia, Spain article info Article history: Received 11 January 2010 Received in revised form 9 July 2010 Accepted 7 August 2010 Keywords: Petrol stations Volatile organic compounds Aromatic/aliphatic concentration ratio abstract This paper describes a novel methodology for evaluating the extent to which petrol stations affect their surroundings. The method is based on the fact that the ratio of the concentrations of aliphatic and aromatic hydrocarbon pollutants in the air of the petrol stations and their surroundings (basically determined by vapor emissions from unburned gasoline) differs from the ratio found in urban air, which is mainly influenced by traffic emissions. Bearing this in mind, the spatial limit of influence of petrol stations in any direction would be the first point, moving away from the station, where the ratio becomes equal to the urban background ratio. Application of the methodology involves multipoint measuring campaigns of the air at the studied petrol station and built-up area in general and processing the data with software capable of providing isoconcentration contours. The procedure should help local authorities in terms of land management, so that a “belt” can be established around petrol stations where housing or vulnerable populations and activities such as those in schools, hospitals and community centers should be restricted. Ó 2010 Elsevier Ltd. All rights reserved. 1. Introduction Volatile organic compounds (VOCs) belong to a very heteroge- neous group of chemicals characterized by their relatively high vapor pressures. Exposure to these compounds can bring about a variety of adverse health effects, including asthma, headaches, mucosal symptoms (Steinemann, 2008) and, in some cases (e.g. benzene), an increased risk of cancer (Ott et al., 1978; Lynge et al., 1997). In Europe, the only legally regulated VOC as regards air quality is benzene (Directives 2000/69/EC and 2008/50/EC). The indirect effects of VOCs on health are related to their role as precursors of ozone and other photochemical pollutants. In urban areas, the main source of VOCs is usually traffic. Additional sources are petrol stations and small-scale industries (paint, adhesives, etc.) which use organic compounds as solvents. Petrol stations as emission sources of VOCs have been the subject of considerable study, a particular interest being those related to the design and evaluation of control systems in an attempt to diminish emissions (Uren, 1997; Ohlrogge et al., 2000), those related to their effects on workers (Brugnone et al., 1997; Periago and Prado, 2005) and environmental studies to evaluate associated air quality (Gonzalez-Flesca et al., 2002; Palmgren et al., 2001; Srivastava et al., 2005; Fernández-Villarrenaga et al., 2005). Although Spanish petrol stations were traditionally located in largely uninhabited areas, the continuous urban growth experi- enced by Spain in recent years has resulted in many petrol stations being built within urban areas surrounded by buildings. This situation has led to controversy between the citizens whose houses are close to the petrol stations and the authorities responsible for land management. However, few methods permit us to establish the impact of these petrol stations on the surrounding environment, the work carried out by Karakitsios et al. (2007) in this respect being a notable exception. These authors concluded that petrol stations make a significant contri- bution to ambient benzene concentration in their vicinity. They calculated this contribution by comparing the background concentration, measured by passive samplers, to the contribution of the roads, estimated with both COPERT and CALINE4 models. However, the use of dispersion models is always affected by considerable uncertainty. In this paper, an alternative methodology is described for use as a land management tool by responsible authorities. The method- ology is based on the fact, which we demonstrate in this study, that the ratio of the concentrations of aliphatic and aromatic hydrocarbon pollutants in the air in the vicinity of petrol stations differs from that found in “normal” urban air. The point of using concentration ratios is that they eliminate from the analysis * Corresponding author. Tel.: þ34 868 88 39 37; fax: þ34 868 88 41 48. E-mail address: [email protected] (M.D. Miñarro). Contents lists available at ScienceDirect Journal of Environmental Management journal homepage: www.elsevier.com/locate/jenvman 0301-4797/$ e see front matter Ó 2010 Elsevier Ltd. All rights reserved. doi:10.1016/j.jenvman.2010.08.009 Journal of Environmental Management 91 (2010) 2754e2762
Transcript of Assessing the impact of petrol stations on their immediate surroundings

lable at ScienceDirect
Journal of Environmental Management 91 (2010) 2754e2762
Contents lists avai
Journal of Environmental Management
journal homepage: www.elsevier .com/locate/ jenvman
Assessing the impact of petrol stations on their immediate surroundings
Isabel M. Morales Terrés, Marta Doval Miñarro*, Enrique González Ferradas, Antonia Baeza Caracena,Jonathan Barberá RicoDepartment of Chemical Engineering, School of Chemistry, University of Murcia, 30071 Murcia, Spain
a r t i c l e i n f o
Article history:Received 11 January 2010Received in revised form9 July 2010Accepted 7 August 2010
Keywords:Petrol stationsVolatile organic compoundsAromatic/aliphatic concentration ratio
* Corresponding author. Tel.: þ34 868 88 39 37; faE-mail address: [email protected] (M.D. Miñarro).
0301-4797/$ e see front matter � 2010 Elsevier Ltd.doi:10.1016/j.jenvman.2010.08.009
a b s t r a c t
This paper describes a novel methodology for evaluating the extent to which petrol stations affect theirsurroundings. The method is based on the fact that the ratio of the concentrations of aliphatic andaromatic hydrocarbon pollutants in the air of the petrol stations and their surroundings (basicallydetermined by vapor emissions from unburned gasoline) differs from the ratio found in urban air, whichis mainly influenced by traffic emissions. Bearing this in mind, the spatial limit of influence of petrolstations in any direction would be the first point, moving away from the station, where the ratio becomesequal to the urban background ratio. Application of the methodology involves multipoint measuringcampaigns of the air at the studied petrol station and built-up area in general and processing the datawith software capable of providing isoconcentration contours. The procedure should help localauthorities in terms of land management, so that a “belt” can be established around petrol stations wherehousing or vulnerable populations and activities such as those in schools, hospitals and communitycenters should be restricted.
� 2010 Elsevier Ltd. All rights reserved.
1. Introduction
Volatile organic compounds (VOCs) belong to a very heteroge-neous group of chemicals characterized by their relatively highvapor pressures. Exposure to these compounds can bring abouta variety of adverse health effects, including asthma, headaches,mucosal symptoms (Steinemann, 2008) and, in some cases(e.g. benzene), an increased risk of cancer (Ott et al., 1978; Lyngeet al., 1997). In Europe, the only legally regulated VOC as regardsair quality is benzene (Directives 2000/69/EC and 2008/50/EC). Theindirect effects of VOCs on health are related to their role asprecursors of ozone and other photochemical pollutants.
In urban areas, the main source of VOCs is usually traffic.Additional sources are petrol stations and small-scale industries(paint, adhesives, etc.) which use organic compounds as solvents.Petrol stations as emission sources of VOCs have been the subject ofconsiderable study, a particular interest being those related to thedesign and evaluation of control systems in an attempt to diminishemissions (Uren, 1997; Ohlrogge et al., 2000), those related to theireffects on workers (Brugnone et al., 1997; Periago and Prado, 2005)and environmental studies to evaluate associated air quality
x: þ34 868 88 41 48.
All rights reserved.
(Gonzalez-Flesca et al., 2002; Palmgren et al., 2001; Srivastava et al.,2005; Fernández-Villarrenaga et al., 2005).
Although Spanish petrol stations were traditionally located inlargely uninhabited areas, the continuous urban growth experi-enced by Spain in recent years has resulted in many petrol stationsbeing built within urban areas surrounded by buildings. Thissituation has led to controversy between the citizens whosehouses are close to the petrol stations and the authoritiesresponsible for land management. However, few methods permitus to establish the impact of these petrol stations on thesurrounding environment, the work carried out by Karakitsioset al. (2007) in this respect being a notable exception. Theseauthors concluded that petrol stations make a significant contri-bution to ambient benzene concentration in their vicinity. Theycalculated this contribution by comparing the backgroundconcentration, measured by passive samplers, to the contributionof the roads, estimated with both COPERT and CALINE4 models.However, the use of dispersion models is always affected byconsiderable uncertainty.
In this paper, an alternative methodology is described for use asa land management tool by responsible authorities. The method-ology is based on the fact, which we demonstrate in this study,that the ratio of the concentrations of aliphatic and aromatichydrocarbon pollutants in the air in the vicinity of petrol stationsdiffers from that found in “normal” urban air. The point of usingconcentration ratios is that they eliminate from the analysis

I.M. Morales Terrés et al. / Journal of Environmental Management 91 (2010) 2754e2762 2755
a number of local factors (e.g. wind speed) which affect absoluteconcentrations and which are impossible to take into account(Gelecsér et al., 1997).
2. Experimental section
2.1. Location
The study was carried out in the city of Murcia, located in thesouth-east of the Iberian Peninsula, which is characterized by verylow annual rainfall (around 375 l/m2), annual average tempera-ture of 18 �C and extreme temperatures of 40e45 �C in summerand �2e0 �C in winter.
The air of the urban surface of the city, around 465 hm2, was thesubject of the study with regard to VOC concentrations togetherwith that of a petrol station known as “La Fica”. This petrol station islocated on the east side of the city and is Stage I implemented, thatis, it uses vapor recovery devices to return the VOC-saturatedvolume of air displaced from the storage tank being filled to thetank being emptied (Gonzalez-Flesca et al., 2002). It has four pumpsfor gasoline and diesel and one for motorbikes. The N and Sapproaches to the petrol station are unhindered due to the pres-ence of a 30 m-wide road. A single low building is situated east ofthe station and has no more construction behind it. On the other
Fig. 1. Location of the passive samplers inside and around the petrol station “La Fica”. (2shown). (Distances in meters).
side of the road (west of the station) stand several 3-storey blocks.This explains why this particular petrol station was chosen: thewest area is inside the built-up area of the city, whereas the east ispractically undeveloped (Fig. 1).
2.2. Sampling
As the traffic conditions in the city are not the same throughoutthe week, working days (from Monday 08.00 h to Friday 22.00 h)were distinguished from weekends (Friday 22.00 h to Monday08.00 h). This study was carried out in two different Monday-to-Friday campaigns (from26/05/08 to 30/05/08, and from16/06/08to 20/06/08) with a total exposure time in each campaign of 110 h.
One-hundred-and-five Radiello� passive samplers (RAD130Cartridge Adsorbent and RAD120 Diffusive Bodie, Sigma Aldrich,Inc., St. Louis, Missouri (US)) were used to measure VOCs in theurban area. Information about sampler deployment throughout thecity and quality control can be found in González Ferradás et al.,2010. The present study forms part of a larger one aimed at eval-uating different aspects related to the influence of VOCs in Murcia(e.g., the best locations for siting air monitoring stations to measurebenzene (González Ferradás et al., 2010)), which explains the greatnumber of measuring points chosen. Therefore, fewer samplers canbe used to reduce cost and time in future studies.
passive samplers from the 105 passive samplers used in the urban sampling are also

I.M. Morales Terrés et al. / Journal of Environmental Management 91 (2010) 2754e27622756
With regard to the measurements in the petrol station, fifteenRadiello� passive samplers (apart from the 105 passive samplersused in the city area) were set up in the vicinity, three of themwithin the petrol station itself, close to the pumps, and the restwere set up to achieve a maximum radial layout of 100 m. The finallocation was determined by the availability of fastening places. Thedistribution of the passive samplers around the petrol station canbe seen in Fig. 1.
Temperature, wind speed and wind direction were measuredhourly during the two sampling campaigns at an air qualitymonitoring station located near the petrol station. Temperaturewas measured with a PT100 Hygroclip S3 sensor (Rotronic Instru-ments Ltd, Crawley, West Sussex (UK)) and wind speed and direc-tion with a Young 03002 anemometer (R.M. Young Company,Traverse City, Michigan (US)).
2.3. Analysis and concentration calculations
Benzene, n-hexane and cyclohexane were the VOCs chosen foranalysis during the two different Monday-to-Friday campaigns asthese compounds are representative of aromatics, paraffins andcyclic paraffin hydrocarbons, respectively. Hydrocarbon desorptionfrom the active charcoal in the passive samplers was carried outusing carbon disulfide. Further details regarding solvent desorptioncan be found in González Ferradás et al., 2010. A gas chromatograph(HP 6890, Agilent Technologies, Inc., Santa Clara, California (US))equipped with a flame ionization detector and a semi-capillary DB-5 column (J&W Scientific; 50 m long and 0.32 mm i.d.; film thick-ness 1 mm; Agilent Technologies, Inc., Santa Clara, California (US))was used for quantitation. The oven temperature was programmedfrom 50 �C (0 min) at 10 �C/min to 80 �C (10 min) and at 10 �C/minto 200 �C (10 min). The injector and detector temperatures were250 and 350 �C, respectively, and the flow rate of the carrier gas(N2) was 40 ml/min. Operational procedures (sampler set up andrecovery, desorption and analysis of VOCs) were developed in orderto assure comparable results.
Once the mass of each hydrocarbon was known, mi, theconcentration, Ci, was calculated using the following equation:Ci ¼ mi/(SRi$t), where SRi is the sampling rate of the Radiellodiffusive sampler for the i-component (8.0 � 10�5 m3/min forbenzene, 6.6 � 10�5 m3/min for n-hexane and 5.4 � 10�5 m3/minfor cyclohexane), obtained from Fondazione Salvatore Maugeri(2008), and t is the exposure time.
3. Data treatment
First of all, linear correlations between the different measuredhydrocarbons in each campaign were noted. Unusual observationswere detected with the help of Minitab 13.0 (Minitab Inc., StateCollege, Pennsylvania (US)). Minitab is a statistical softwarepackage which includes, among others, modules for generalunivariate statistics, multivariate statistics, time series analysis andnon-parametric statistics. We used the regression option to obtainregression equations, the Pearson coefficients, and unusual obser-vations. We could distinguish two types of atypical points; pointsthat were atypical for all of the pollutants (a behaviour that wasobserved in only one campaign) were omitted because they wereprobably due to analytical mistakes, whereas points that wereatypical for just one or some of the pollutants or which showedatypical behaviour in more than one campaign were not removedbecause a source other than traffic could have existed. Thepercentage of points removedwas around 5% in the urban samplingwhereas no data from the vicinity of the petrol station was elimi-nated. After that, a statistical analysis with SPSS 15.0 (SPSS Inc.,Chicago, Illinois (US)) was carried out to determine the frequency
distributions of pollutant concentrations. These concentrationsshowed a lognormal behaviour whereas pollutant ratios followednormal distributions for a 95% confidence level.
From the comparison of the measurements in the city and in thepetrol station, a methodology for evaluating the influence of petrolstations on their vicinity was determined. The methodology wasbased on the fact that the ratio of certain VOCs differs in the generalambient air of the city from that in the air of petrol stations. Foreach pair of hydrocarbon concentration ratios, the followingparameters were calculated: URB(N), defined as the average valuein the urban area of the N ratios (w105) obtained for each pair ofcontaminants, and PS(3), defined as the average value of the 3ratios obtained for each pair of contaminants within the petrolstation. For instance, URB(N) and PS(3) for the quotient of benzeneand n-hexane were calculated with equations (1) and (2),respectively.
ðBenz=nHexÞURBðNÞ ¼Pi¼N
i¼1 ðBenz=nHexÞiN
(1)
ðBenz=nHexÞPSð3Þ ¼Pi¼3
i¼1ðBenz=nHexÞi3
(2)
For each average ratio of pollutants, the relative differencebetween that found in the urban area and that found in the petrolstation, D, was calculated, taking as the reference the lower value ofeach pair which coincided with that found in the urban area,equation (3).
D ¼h�
ðBenz=nHexÞPSð3Þ�ðBenz=nHexÞURBðNÞ�i
ðBenz=nHexÞURBðNÞ� 100 (3)
The next step was to draw the isoconcentration curves of thetwo hydrocarbons with the highest relative difference in ratios,radiating from the petrol station by means of suitable software, inthis case SURFER 8.0 (Golden Software Inc., Golden, Colorado(US)), and using as inputs the concentration data of the passivesamplers located inside (3 points) and around the petrol station(12 points). It was also necessary to include some backgroundconcentrations taken from the urban monitors. These graphspermit us to obtain the concentration values of each selectedpollutant at different distances from the petrol station in eachprimary direction (N, S, E and W). The extent of the influence ofthe petrol station is taken as the first point in each directionmoving away from the station where the ratio becomes equal tothe urban background ratio.
4. Results and discussion
4.1. Meteorological data
The average temperature during each campaign was 19.7 and23 �C, respectively. With regard to wind speed, the average valuefor the first campaignwas 1.8 m/s, whereas in the second campaignan average value of 1.5 m/s was found. In both campaigns, similarwind behaviour was observed. The main wind direction wasNE-ENE during 30% and 40% of the time of the first and secondcampaign, respectively. Whenwind speed was<3m/s no prevalentdirection was shown in any case.
4.2. Concentration data in the city
Statistical analysis of the distribution of the concentration databy KolmogoroveSmirnov and ShapiroeWilks tests showed thatspatial concentrations in the area of the petrol station and the
I.M. Morales Terrés et al. / Journal of Environmental Management 91 (2010) 2754e2762 2757
urban city could be fitted to lognormal distributions for a signifi-cance level of 0.05. Ratios of concentrations also passed thenormality tests with the same level of significance. The averagevalues of the concentration logarithms for n-hexane, benzene andcyclohexane (and their standard deviations in parenthesis) were0.581 (0.179), 0.519 (0.195) and 0.491 (0.193) for the first samplingcampaign and 0.547 (0.184), 0.493 (0.203) and 0.554 (0.210) for thesecond one, respectively. Analysis of variance showed that therewere no significant statistical differences in the results obtained inthe urban area from the first to the second campaign at a 95%confidence level.
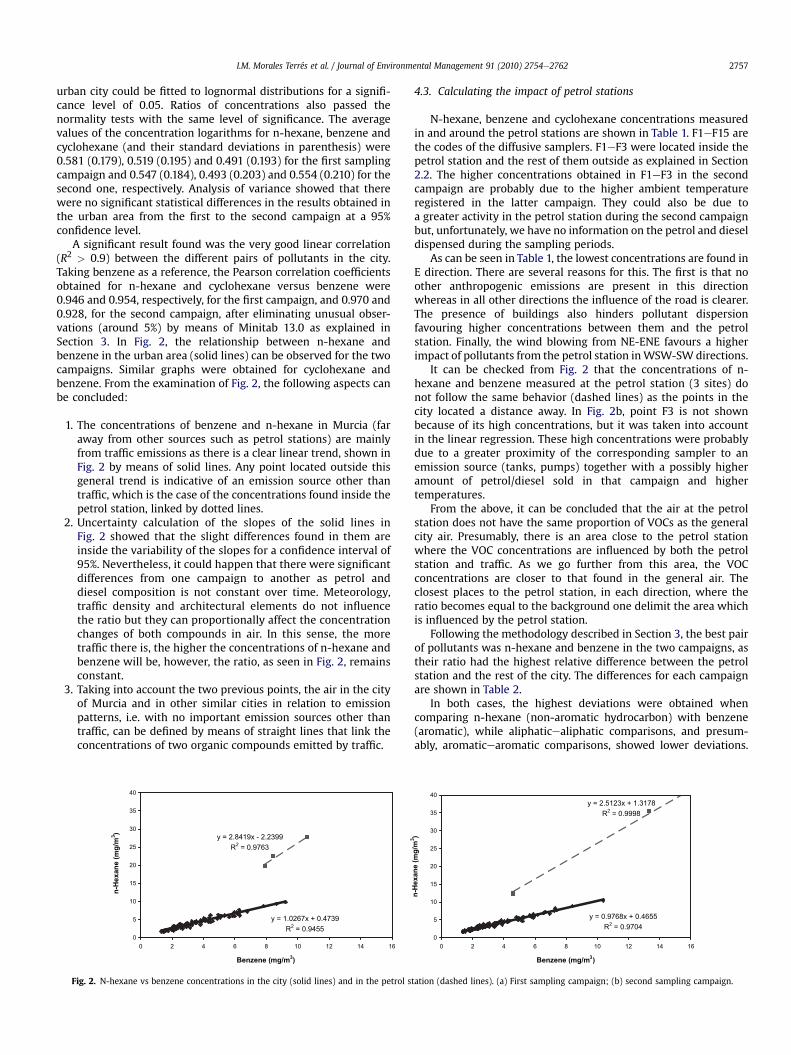
A significant result found was the very good linear correlation(R2 > 0.9) between the different pairs of pollutants in the city.Taking benzene as a reference, the Pearson correlation coefficientsobtained for n-hexane and cyclohexane versus benzene were0.946 and 0.954, respectively, for the first campaign, and 0.970 and0.928, for the second campaign, after eliminating unusual obser-vations (around 5%) by means of Minitab 13.0 as explained inSection 3. In Fig. 2, the relationship between n-hexane andbenzene in the urban area (solid lines) can be observed for the twocampaigns. Similar graphs were obtained for cyclohexane andbenzene. From the examination of Fig. 2, the following aspects canbe concluded:
1. The concentrations of benzene and n-hexane in Murcia (faraway from other sources such as petrol stations) are mainlyfrom traffic emissions as there is a clear linear trend, shown inFig. 2 by means of solid lines. Any point located outside thisgeneral trend is indicative of an emission source other thantraffic, which is the case of the concentrations found inside thepetrol station, linked by dotted lines.
2. Uncertainty calculation of the slopes of the solid lines inFig. 2 showed that the slight differences found in them areinside the variability of the slopes for a confidence interval of95%. Nevertheless, it could happen that there were significantdifferences from one campaign to another as petrol anddiesel composition is not constant over time. Meteorology,traffic density and architectural elements do not influencethe ratio but they can proportionally affect the concentrationchanges of both compounds in air. In this sense, the moretraffic there is, the higher the concentrations of n-hexane andbenzene will be, however, the ratio, as seen in Fig. 2, remainsconstant.
3. Taking into account the two previous points, the air in the cityof Murcia and in other similar cities in relation to emissionpatterns, i.e. with no important emission sources other thantraffic, can be defined by means of straight lines that link theconcentrations of two organic compounds emitted by traffic.
y = 1.0267x + 0.4739R2 = 0.9455
y = 2.8419x - 2.2399R2 = 0.9763
0
5
10
15
20
25
30
35
40
0 2 4 6 8 10 12 14 16
Benzene (mg/m3
)
(e
na
xe
H-
nm
m/
g3
)
Fig. 2. N-hexane vs benzene concentrations in the city (solid lines) and in the petrol s
4.3. Calculating the impact of petrol stations
N-hexane, benzene and cyclohexane concentrations measuredin and around the petrol stations are shown in Table 1. F1eF15 arethe codes of the diffusive samplers. F1eF3 were located inside thepetrol station and the rest of them outside as explained in Section2.2. The higher concentrations obtained in F1eF3 in the secondcampaign are probably due to the higher ambient temperatureregistered in the latter campaign. They could also be due toa greater activity in the petrol station during the second campaignbut, unfortunately, we have no information on the petrol and dieseldispensed during the sampling periods.
As can be seen in Table 1, the lowest concentrations are found inE direction. There are several reasons for this. The first is that noother anthropogenic emissions are present in this directionwhereas in all other directions the influence of the road is clearer.The presence of buildings also hinders pollutant dispersionfavouring higher concentrations between them and the petrolstation. Finally, the wind blowing from NE-ENE favours a higherimpact of pollutants from the petrol station inWSW-SW directions.
It can be checked from Fig. 2 that the concentrations of n-hexane and benzene measured at the petrol station (3 sites) donot follow the same behavior (dashed lines) as the points in thecity located a distance away. In Fig. 2b, point F3 is not shownbecause of its high concentrations, but it was taken into accountin the linear regression. These high concentrations were probablydue to a greater proximity of the corresponding sampler to anemission source (tanks, pumps) together with a possibly higheramount of petrol/diesel sold in that campaign and highertemperatures.
From the above, it can be concluded that the air at the petrolstation does not have the same proportion of VOCs as the generalcity air. Presumably, there is an area close to the petrol stationwhere the VOC concentrations are influenced by both the petrolstation and traffic. As we go further from this area, the VOCconcentrations are closer to that found in the general air. Theclosest places to the petrol station, in each direction, where theratio becomes equal to the background one delimit the area whichis influenced by the petrol station.
Following the methodology described in Section 3, the best pairof pollutants was n-hexane and benzene in the two campaigns, astheir ratio had the highest relative difference between the petrolstation and the rest of the city. The differences for each campaignare shown in Table 2.
In both cases, the highest deviations were obtained whencomparing n-hexane (non-aromatic hydrocarbon) with benzene(aromatic), while aliphaticealiphatic comparisons, and presum-ably, aromaticearomatic comparisons, showed lower deviations.
y = 0.9768x + 0.4655R2 = 0.9704
y = 2.5123x + 1.3178R2 = 0.9998
0
5
10
15
20
25
30
35
40
0 2 4 6 8 10 12 14 16
Benzene (mg/m3
)
(e
na
xe
H-
nm
m/
g3
)
tation (dashed lines). (a) First sampling campaign; (b) second sampling campaign.

Table 1N-hexane, benzene and cyclohexane concentrations (mg/m3) measured with the 15 passive samplers in and around the petrol station. F1eF3 were located inside the petrolstation. F4eF15 were deployed to achieve a maximum radial layout of 100 m. Their orientation respect to the petrol station is also indicated.
Passive sampler code Orientation 1st Campaign 2nd Campaign
n-hexane benzene cyclohexane n-hexane benzene cyclohexane
1 Centre 19.7 7.91 14.9 12.4 4.61 11.12 Centre 22.4 8.44 15.9 35.5 13.3 31.93 Centre 27.7 10.6 21.2 94.8 37.3 100.24 N 9.63 4.69 6.51 19.6 8.60 21.95 N 7.92 3.84 5.76 8.69 4.14 8.566 S 2.03 1.72 1.66 2.24 1.81 2.197 SE 2.21 1.88 1.88 2.21 1.64 2.838 ESE 1.77 1.46 1.40 2.08 1.27 1.869 SE 1.53 1.38 0.98 1.69 1.36 1.8210 S 2.29 2.18 2.22 2.26 1.99 3.0811 SSW 5.45 4.82 4.49 5.84 5.33 6.4812 W 4.96 4.84 4.44 6.91 5.59 6.4313 NNW 3.71 3.65 3.02 6.00 4.61 6.2914 N 5.32 4.19 3.55 6.05 4.22 5.9915 ENE 1.88 1.36 1.39 1.36 1.16 2.34
I.M. Morales Terrés et al. / Journal of Environmental Management 91 (2010) 2754e27622758
This can be attributed to the thermal stability of these compoundsduring the combustion process. Aliphatic compounds are moreeasily burned than aromatic compounds, which meant thataliphatic/aromatic concentration ratios were significantly lower inthe city air than in the petrol station, where the air was mainlycharacterized by unburned gasoline vapours. These findings werecorroborated by their autoignition temperatures, being 498, 260and 240 �C for benzene, cyclohexane and n-hexane, respectively(INSHT, 2003).
Selected pollutant (n-hexane and benzene) isoconcentrationcurves for each campaign were obtained by means of SURFER 8.0,selecting a multiquadric interpolation (Figs. 3 and 4, respectively),using as inputs the concentration data of the 15 passive samplerslocated inside and in the vicinity of the petrol station (Fig. 1). Onlyone point representative of the petrol station was used, obtainedfrom the average concentration of the three passive samplerslocated inside the station. It was also important to use as inputseveral concentration values typical of the urban air to set thebackground concentrations of the city relatively close to the petrolstation. Finally, using the grid node editor tool of the above-mentioned software, concentrations of the selected compoundswere obtained at different distances from the centre of the petrolstation, in each geographical direction, so that the ratio ofn-hexane/benzene could be calculated at different distances fromthe petrol station.
The relationship between the n-hexane/benzene ratio and thedistance from the petrol station for each campaign is represented inFig. 5. The horizontal solid line represents the average n-hexane/benzene ratio obtained in the city during each campaign. The 95%confidence interval of this average is shown as dashed lines. Thedistances in each direction at which the ratios start having similarvalues to that found in ambient air, that is, when the ratios areinside the 95% confidence interval of the typical urban air ratios,delimit the area influenced by the petrol station.
Table 2Average concentration ratios in the urban area, URB (N) and inside the petrol station “La
1st Campaign
n-Hex/Benz n-Hex/Cyclohex Cyclohex/Ben
URB(N) 1.16 1.23 0.95PS(3) 2.59 1.34 1.93D, % 123 8.94 103
As shown in Fig. 5, the further we go from the petrol station theconcentration ratio gets closer to that found in city air, which ismainly characterized by traffic emissions. From Fig. 5, the impactof the petrol station in each direction can be calculated as thepoint where the n-hexane/benzene ratio falls within the region ofthe 95% confidence interval of the urban average ratio. Table 3,summarizes the distances obtained in both campaigns.
A comparison of the distances obtained in both campaignsshows a higher influence of the petrol station in the secondcampaign probably due to the higher temperatures registered inthe latter campaign. Although emissions from vehicle traffic havean evaporative loss contribution (around 10%), motor vehicleexhaust represents the main source of the total VOC on-roademission rate (around 90%) (Doskey et al., 1999; Olson et al., 2009).High temperatures favour evaporation losses in both locations e
urban city and petrol station e but they are likely to be morenoticeable in the air around the petrol station as they representthe main emission source. Anyway, the distances were similar inboth campaigns and, in all cases, below or equal to 75 m.
It is also worth noting that, in both sampling campaigns, themost affected directions were N and E, whereas the less affecteddirection was W. This can be explained by the following: Thepetrol station is located in the limit of the urban perimeter. AnNNW-SSE heavy traffic road splits the area into two: one witha considerably high level of traffic (West half) and one largelyuninhabited (East half). The higher the traffic near the petrolstation, the higher the concentrations of pollutants coming from itand, consequently, the ratio of any pair of aromatic and paraffinichydrocarbons will be more representative of traffic than of thepetrol station, that is, the emissions coming from the petrol stationwill be more and more insignificant as other emission sourcesbecome more important. Also, the presence of buildings in the Wdirection acts as a barrier against the pollution coming from thepetrol station and the main road. This implies that the distance
Fica”, PS(3), and relative differences, D, for the two sampling campaigns.
2nd Campaign
z n-Hex/Benz n-Hex/Cyclohex Cyclohex/Benz
1.10 0.96 1.142.63 1.06 2.49
139 10.4 118

Fig. 3. Isoconcentration curves (mg/m3) of (a) benzene and (b) n-hexane in the first sampling campaign. (Distances of the axis in meters).
I.M. Morales Terrés et al. / Journal of Environmental Management 91 (2010) 2754e2762 2759
between the buildings and the petrol station is likely to be themaximum influence distance in this direction as, behind them,concentrations are very close to the city background ones. Theseresults highlight the fact that the influence of petrol stations
depends on the characteristics of the surrounding area (mainlytraffic density), thus we can establish that their spatial influencesare relative. However, the special location of the studied petrolstation, the time of year the samples were taken and the results
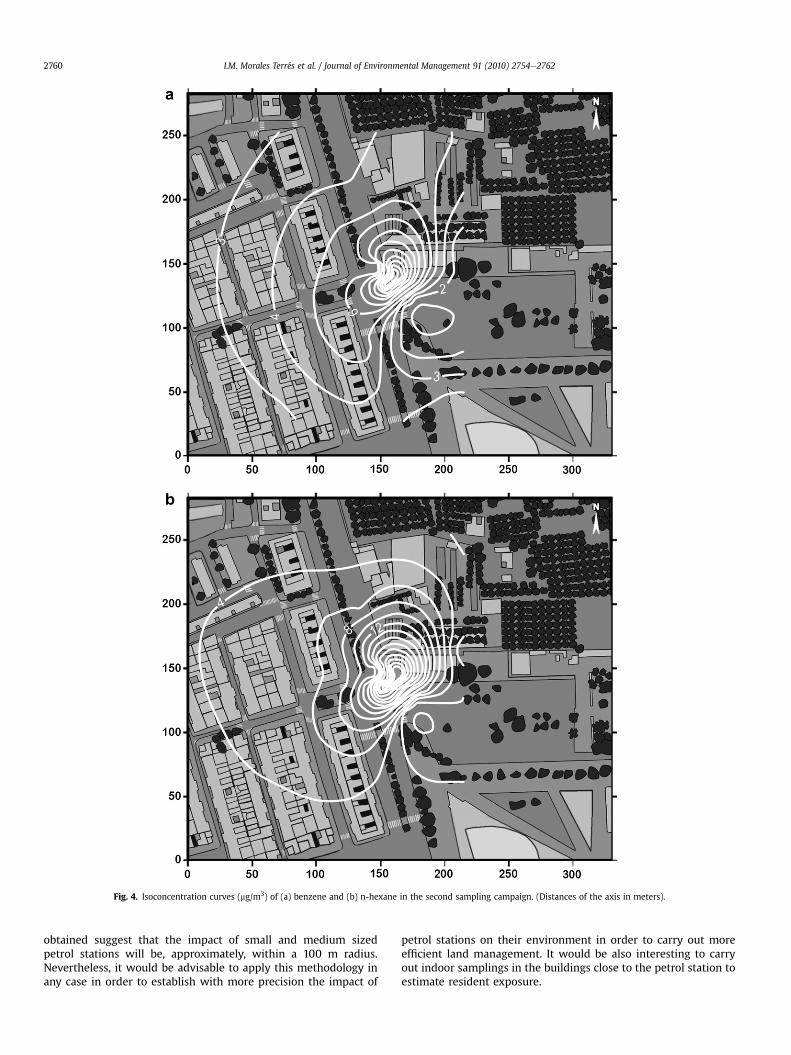
Fig. 4. Isoconcentration curves (mg/m3) of (a) benzene and (b) n-hexane in the second sampling campaign. (Distances of the axis in meters).
I.M. Morales Terrés et al. / Journal of Environmental Management 91 (2010) 2754e27622760
obtained suggest that the impact of small and medium sizedpetrol stations will be, approximately, within a 100 m radius.Nevertheless, it would be advisable to apply this methodology inany case in order to establish with more precision the impact of
petrol stations on their environment in order to carry out moreefficient land management. It would be also interesting to carryout indoor samplings in the buildings close to the petrol station toestimate resident exposure.

0
0.5
1
1.5
2
2.5
3
0 25 50 75 100 125 150
distance from the petrol station (m)
n
-h
ex
/b
en
z ra
tio
NorthSouthEastWest
0
0.5
1
1.5
2
2.5
3
0 25 50 75 100 125
distance from the petrol station (m)
n-h
ex
/b
en
z ra
tio
NorthSouthEastWest
a
b
Fig. 5. Relationship of the n-hexane/benzene ratio vs distance from the petrol station.(a) First sampling campaign; (b) second sampling campaign.
Table 3Maximum spatial influence distances (in meters) of the petrol station “La Fica” in thetwo sampling campaigns.
Direction 1st Campaign 2nd Campaign
North 60 75South 36 49East 60 67West 25 39Average 45 58
I.M. Morales Terrés et al. / Journal of Environmental Management 91 (2010) 2754e2762 2761
Finally, we should remember that it is necessary to aim atavoiding the impact of any type of major pollution source on thepopulation. As has been shown before, in the W direction, theinfluence of the petrol station was lower because a differentpollution source was even more important than the one comingfrom the petrol station with the subsequent harmful effects of thatsource on the population. Minimization of concentrations ofchemicals of concern, regardless of their sources, is indispensablefor effective health protection.
5. Conclusions
In this work, we present a methodology for estimating thespatial influence of petrol stations on their surroundings based onthe fact that the concentration ratio of n-hexane and benzene
found in the air of the petrol stations is different from that found incity air (mainly determined by motor vehicle exhaust). The firstpoint in each geographical direction moving away from the petrolstation where the ratio becomes equal to the urban backgroundratio delimit its area of influence.
The reach distances obtained in the second measuringcampaign (June) are higher than those of the first one, probablydue to the higher ambient temperature in June which favoursevaporation losses in the petrol station during filling up. Anyway,the distances were similar and, in all cases, below or equal to75 m.
In both campaigns, lower impacts were obtained in thosedirections with heavy traffic density (W and S), whereas directionsN and E, without buildings or roads, showed higher impacts. Thiscan be explained as follows: when the petrol station is surroundedby roads with intense traffic, the emissions from the petrol stationare not as important as those coming from vehicle combustion. Ifthe petrol station emissions are mixing with relatively clean air thetypical n-hexane/benzene ratio from these stations changes moreslowly. From these results, it can be concluded that the influence ofpetrol stations is a relative question although, in no case, was theinfluence greater than 75 m.
Presumably, small and medium sized petrol stations will havea similar impact on their surroundings as the one in this work;however, it is recommended that this methodology be applied tospecify their reach with more precision. This methodology willhelp establish a “belt” around petrol stations where vulnerablepopulations and activities such as those in schools and hospitalsshould be restricted. Finally, we should remember that minimi-zation of concentrations of chemicals of concern, regardless oftheir sources, is indispensable for effective health protection. Forthis purpose, similar or different methodologies should be appliedor developed to assess the spatial limits of influence of these othersources.
Acknowledgements
This work was carried out with the financial support of the CityCouncil of Murcia and the technical help of the volunteers whocollaborated in the setting and collection of the diffusive samplers.We would also like to acknowledge the contributions of theanonymous reviewers which have definitely improved the qualityof this article.
References
Brugnone, F., Perbellini, L., Romeo, L., Cerpelloni, M., Cecco, A., Leopard Barra, E.,Moro, G., Marchiori, L., Ferracin, A., 1997. Environmental exposure and bloodlevels of benzene in gas station attendants. Comparison with the generalpopulation. Medicina del Lavoro 88, 131e147.
Doskey, P.V., Fukui, Y., Sultan, M., Al Maghraby, A., Taher, A., 1999. Source profiles fornonmethane organic compounds in the atmosphere of Cairo, Egypt. Journal ofthe Air and Waste Management Association 49, 814e822.
EC Directive, 2000. Council Directive 2000/69/EC relating to limit values of benceneand carbon monoxide in ambient air. Official Journal of European Comunities L313, 12e21.
EC Directive, 2008. Council Directive 2008/50/EC on ambient air quality anda cleaner air for Europe. Official Journal of European Comunities L 152, 1e44.
Fernández-Villarrenaga, V., López-Mahía, P., Muniategui-Lorenzo, S., Prada-Rodríguez, D., 2005. Posible influence of a gas station on volatile organiccompounds levels in the ambient air of an urban area. Fresenius EnvironmentalBulletin 14, 368e372.
Fondazione Salvatore Maugeri, 2008. http://www.radiello.com/.Gelecsér, A., Siszler, K., Hlavay, J., 1997. Toluene-Benzene concentration ratio as
a tool for characterizing the distance from vehicular emission sources. Envi-ronmental Science and Technology 31, 2869e2872.
González Ferradás, E., Doval Miñarro, M., Morales Terrés, E., Marzal Martínez, F.J.,2010. An approach for determining air pollution monitoring sites. AtmosphericEnvironment 44, 2640e2645.

I.M. Morales Terrés et al. / Journal of Environmental Management 91 (2010) 2754e27622762
Gonzalez-Flesca, N., Vardoulakis, S., Cicolella, A., 2002. BTX concentrations neara stage II implemented petrol station. Environmental Science and PollutionResearch 9, 169e174.
INSHT, 2003. Instituto Nacional de Seguridad e Higiene en el Trabajo. Ministerio deTrabajo e Inmigración, Gobierno de España. http://www.insht.es/portal/site/Insht/menuitem.a82abc159115c8090128ca10060961ca/?vgnextoid¼4458908b51593110VgnVCM100000dc0ca8c0RCRD.
Karakitsios, S.P., Delis, V.K., Kassomenos, P.A., Pilidis, G.A., 2007. Contributionto ambient benzene concentrations in the vicinity of petrol stations:estimation of the associated health risk. Atmospheric Environment 41,1889e1902.
Lynge, E., Andersen, A., Nilsson, R., Barlow, L., Pukkala, E., Nordlinder, R., Boffetta, P.,Grandjean, P., Heikkila, P., Horte, L.G., Jakobsson, R., Lundberg, I., Moen, B.,Partanen, T., Riise, T., 1997. Risk of cancer and exposure to gasoline vapors.American Journal of Epidemiology 145, 449e458.
Ohlrogge, K., Wind, J., Hassel, D., 2000. New technology for emission reduction atpetrol stations. In: Czech Association of IUAPPA (International Union of AirPollution Prevention and Environmental Associations) (Ed.), ConferenceProceedings of the 12th Regional Central European Conference IUAPPA and 4thInternational Conference on Environmental Impact Assessment, pp. 418e425.
Olson, D.A., Hammond, D.M., Seila, R.L., Burke, J.M., Norris, G.A., 2009. Spatialgradients and source apportionment of volatile organic compounds nearroadways. Atmospheric Environment 43, 5647e5653.
Ott, M.G., Townsend, J.C., Fishbeck, W.A., Langner, R.A., 1978. Mortality amongworkers occupationally exposed to benzene. Archives of Environmental Health33, 3e10.
Palmgren, F., Hansen, A.B., Berkowicz, R., Skov, H., 2001. Benzene emission from theactual car fleet in relation to petrol composition in Denmark. AtmosphericEnvironment 1, S35eS42.
Periago, J.F., Prado, C., 2005. Evolution of occupational exposure to environmentallevels of aromatic hydrocarbons in service stations. Annals of OccupationalHygiene 49, 233e240.
Srivastava, A., Joseph, A.E., More, A., Patil, S., 2005. Emissions of VOCs at urbanpetrol retail distribution centres in India (Delhi and Mumbai). EnvironmentalMonitoring and Assesment 109, 227e242.
Steinemann, A.C., 2008. Fragranced consumer products and undisclosed ingredi-ents. Environmental Impact Assessment Review 29, 32e38.
Uren, S., 1997. A pilot study to assess benzene concentrations in the vicinity of petrolstations. Croydon. Available on the Internet. UK Department of Environment, UK.http://www.environmental-center.com/articles/article122/doebenv3.doc.