Blind Spot Detection and Warning Systems (BDWS): Concepts of Warning
Upload
khangminh22Category
view
2download
0
© 2018 Journal of Natural Science, Biology and Medicine | Published by Wolters Kluwer ‑ Medknow 227
Original Article
IntroductIon
Noncommunicablediseases(NCDs)inmiddle‑andlow‑incomecountries account for three‑fourths of the total deathsworldwide.[1]They account formore than one‑third of theoutpatientdepartment(OPD)visitsandinpatientadmissionsandmore thanhalf of the proportionalmortality rate fromallcausesofdeathinIndia.[2,3]Italsocontributesto44%ofdisability‑adjustedlifeyearslost.[3]
ThehighriskofsuchNCD‑relatedmorbidityandmortalityamongIndiansisduetoseveralreasons.Theseincludegeneticpredispositiontocentralobesityandmetabolicsyndromealongwithotherfactorssuchassmokingandfaultylifestylehabits.[4]
Theburdenofmodifiable risk factors ofNCDs in India isincreasingsignificantlyoverthepastfivedecades.[5]Therefore,thereasonbehindthisneedstobeascertained.Lowawareness
isstillattributedasareasonforhighprevalenceofhypertensioninbothurbanandruralpartsofIndia.[6‑8]Aminimalreductioninmean blood pressure levels has been reported to saveover100,000deathsduetostrokeandcoronaryheartdiseasesover here.[9]Awareness generation of people regarding thewarningsignsofvariousNCDsisequallyessentialtoenableearlydiagnosisandtreatment.
VeryfewstudiesinIndiahaveresearchedontheawarenessofpeopleaboutspecificNCDs.
Awareness of Risk Factors, Warning Signs, and Immediate Management Measures of Noncommunicable Diseases:
A Multihospital‑based StudyNitin Joseph, R. Srinath, Aditya Ramanathan, Ashutosh Kumar Gupta, P. Nandan, Rimsha Afnan
Department of Community Medicine, Kasturba Medical College, Mangalore, Manipal University, Karnataka, India
Introduction: Noncommunicablediseases(NCDs)accountformorethanone‑thirdofoutpatientvisitsandinpatientadmissionsandmorethanhalfoftheproportionalmortalityratefromallcausesofdeathinIndia.TheburdenofmodifiableriskfactorsofNCDsinIndiaisincreasingsignificantlyoverthepastfivedecades.Therefore,thereasonbehindthisandthepreparednessofpeopletodealwithitneedtobeascertained.Objectives: Theobjectiveofthisstudywastoassesstheawarenessofpeopleregardingriskfactors,warningsigns,andimmediatemanagementpracticesinspecificNCDs.Materials and Methods:Thiscross‑sectionalstudywasconductedamongpeopleinagovernmentandprivatetertiarycarehospitalofMangalorecityinFebruary2016.Datawerecollectedbyinterviewingeachparticipantusingapretestedvalidatedstructuredinterviewschedule.Results:Allthe400enrolledparticipantshadheardaboutheartattack,hypertension,anddiabetesmellitus.However,only250(62.5%)hadheardaboutstroke.Goodawarenessaboutheartattackwaspresentamong62.5%,strokeamong57.6%,hypertensionamong59%,anddiabetesmellitusamong55.8%ofparticipants.Multivariateanalysisusingordinallogisticregressionanalysisfoundthatgoodeducationalstatusandbeingvegetarianweresignificantpredictorsofgoodawarenesslevelaboutheartattack.Similarly,thesefactorsalongwithurbanresidentialstatusweresignificantpredictorsofgoodawarenesslevelaboutstroke.Ageabove55yearswasasignificantpredictorofgoodawarenesslevelaboutdiabetesmellitus.Conclusion: ThevarioussociodemographicgroupsidentifiedtohavepoorknowledgeaboutNCDsinthisstudyrequiretargetedinterventionduringhealtheducationalcampaigns.
Keywords:Awareness,immediatemanagementpractices,noncommunicablediseases,riskfactors,warningsymptoms/signs
Address for correspondence: Dr. Nitin Joseph, Department of Community Medicine, Kasturba Medical College, Light
House Hill Road, Manipal University, Mangalore, Karnataka, India. E‑mail: [email protected]
Access this article online
Quick Response Code:Website:www.jnsbm.org
DOI:10.4103/jnsbm.JNSBM_187_17
Abstract
How to cite this article:JosephN,SrinathR,RamanathanA,GuptaAK,NandanP,AfnanR.Awarenessofriskfactors,warningsigns,andimmediatemanagementmeasuresofnoncommunicablediseases:Amultihospital‑basedstudy.JNatScBiolMed2018;9:227‑35.
This is an open access journal, and articles are distributed under the terms of the Creative Commons Attribution‑NonCommercial‑ShareAlike 4.0 License, which allows others to remix, tweak, and build upon the work non‑commercially, as long as appropriate credit is given and the new creations are licensed under the identical terms.
For reprints contact: [email protected]

Joseph, et al.: Awareness of noncommunicable diseases
Journal of Natural Science, Biology and Medicine ¦ Volume 9 ¦ Issue 2 ¦ July-December 2018228
Hence, this studywas done to assess the awareness ofrisk factors and warning signs of heart attack, stroke,hypertension,anddiabetesmellitusamongpeoplevisitingvarious tertiary health‑care centers. It also assessed theirimmediatemanagement practices toward heart attack andstroke.
mAterIAls And methods
Study settings and study designThiscross‑sectionalstudywasconductedinagovernmentandprivatetertiarycarehospitalofMangalorecityofSouthIndiainthemonthofFebruary2016.
Ethics committee approvalInstitutionalEthicsCommitteeapprovalwasobtainedbeforethecommencementofthisstudy.Permissiontoconductthisstudy at these hospitalswas obtained from the respectivemedicalsuperintendents.
Sample size calculation and sampling methodSamplesizewascalculatedbasedontheformulaZα2pq/d2,where“p”wastakenas34%basedonthefindingsofapreviousstudy[10]whichreportedthat34%ofparticipantswereawareaboutthewarningsignsofstroke.At95%confidenceintervals,withanallowableerror(d)takenas15%of“p”andsubstituting“q”as100‑p,thesamplesizewascalculatedas332.Itwasroundedoff to400participants.Awarenessofpeopleaboutwarningsignsofstrokeinparticularwaschosenforsamplesizecalculationas it isusually the leastunderstoodamongvariousNCDs.Theparticipantswereenrolled in thisstudybyconveniencesamplingmethod.
Study populationInclusion and exclusion criteria• PatientsandtheirattendersvisitingOPDofthesehospitals
wereincludedinthisstudy• Participantsagedbelow18yearsandseriouslyillpatients
wereexcludedfromthisstudy.
Consent for participationTheparticipantswere explained the nature andpurposeofthestudyandwereassuredconfidentialityoftheinformationprovidedbythem.Writteninformedconsentwastakenfromallconsentingparticipants.
Data collection methodologyDatawere obtained by interviewing each participant in aprivateroomclosetotheOPDusingastructuredinterviewschedule.TheschedulewastranslatedintothelocallanguageKannadaandwaslanguageandcontentvalidatedbyexperts.Itwaspretestedinagroupoftenparticipantswhowerenotincludedinthisstudy.
Sociodemographicdetailssuchasage,gender,maritalstatus,education,occupation,educationandoccupationofheadofthehousehold,totalmonthlyfamilyincome,typeoffamily,andplaceofresidencewereinquiredofeachparticipantby
interviewing them.Theywere also inquired about the pasthistoryandfamilyhistoryofcomorbidities,substanceabuse,dietary habits, and awareness of anymedical emergencynumber. In relation to thestudyobjectives, theparticipantswereinquiredwhethertheyhadheardaboutspecificNCDssuch as heart attack, stroke, hypertension, and diabetesmellitus.Iftheyhadheard,theywerefurtherinquiredaboutriskfactorsandwarningsymptomsandsignsofeachofthefourNCDs.
However,theawarenessofparticipantsregardingimmediatemanagement measures was inquired only for medicalemergenciessuchasheartattackandstroke.Ifmorethanonecorrectanswerwasgivenforeachitembytheparticipant,atotaloftwopointswereawarded.Onlyonepointwasawardedforasinglecorrectanswerandzeropointwasawardedfornoresponseorforanincorrectanswer.
Cumulative score of 0–1was categorized as poor, 2–3 asmoderate,and4–6asgoodawarenesslevelregardingheartattack and stroke. For hypertension and diabetesmellitus,cumulative score of 0–1was categorized as poor, 2–3 asmoderate, and4asgoodawareness.Thecutoff scores2–3indicatingmoderateawarenesslevelwerebasedonasinglecorrect answer by participants to risk factors, warningsymptoms/signs, and immediatemanagementmeasures foreachNCD.
Data analysisDataenteredandanalyzedusingStatisticalPackageforSocialSciencessoftwarepackage(SPSSInc.,Chicago,IL,USA)version16.0.UnivariateanalysisusingChi‑squaretestandmultivariateanalysisusingordinallogisticregressionanalysisweredonetoidentifythepredictorsofgoodawarenesslevelofparticipants. P <0.05wastakenasstatisticallysignificantassociation.
results
Themeanageofthetotal400participantswas36.9±13.0years.Among them, 211 (52.8%) were from the governmentand the rest 189 (47.2%)were from the private hospital.Majority of participantsweremales (270 [67.5%]),wereeducatedtillhighschoollevelorabove(253[63.2%]),wereunskilledworkers (110 [27.5%]),were fromupper lowersocioeconomic status (SES) (46.5%), andwere from ruralareas(246[61.5%])[Table1].
Allparticipantshadheardaboutheartattack,hypertension,anddiabetesmellitus.However,only250 (62.5%)of themhadheardaboutstroke.Themostcommonriskfactorofheartattackidentifiedbytheparticipantswasstress(108[27%]),of strokewas hypertension (30.8%), of hypertensionwasstress(141[35.3%]),andofdiabetesmellituswasexcessivesugarintake(164[41%])[Table2].
Themostcommonwarningsymptomofheartattackidentifiedby the participantswas chest pain (228 [57%]), of strokewasweakness of extremities (56%), of hypertensionwas

Joseph, et al.: Awareness of noncommunicable diseases
229Journal of Natural Science, Biology and Medicine ¦ Volume 9 ¦ Issue 2 ¦ July-December 2018 229
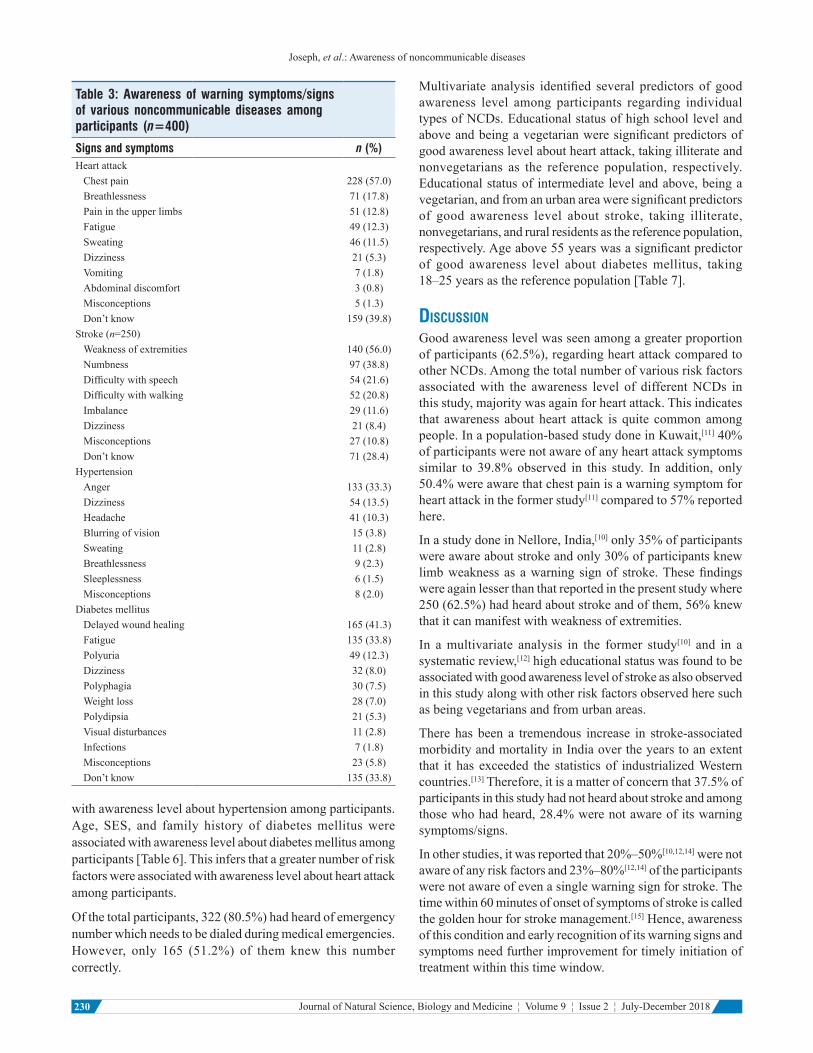
anger (133 [33.3%]), andof diabetesmellituswasdelayedwoundhealing(165[41.3%])[Table3].
Inthisstudy,241(60.3%),265(66.3%),andallparticipantswereawareofatleastonewarningsignorsymptomsaboutheartattack,diabetesmellitus,andhypertension,respectively.Withrespecttostroke,awarenessofatleastonesignorsymptomwaspresentamong179(71.6%)outof250participantswhohadheardaboutstroke[Table3].
Themostcommonimmediatemanagementpracticeforheartattackandstrokeasstatedbyover70%ofparticipantswasmedicalassistance[Table4].
Goodawarenesslevelaboutheartattack,stroke,hypertension,anddiabetesmellituswasseenamong62.5%,57.6%,59%,and55.8%participants,respectively[Table5].
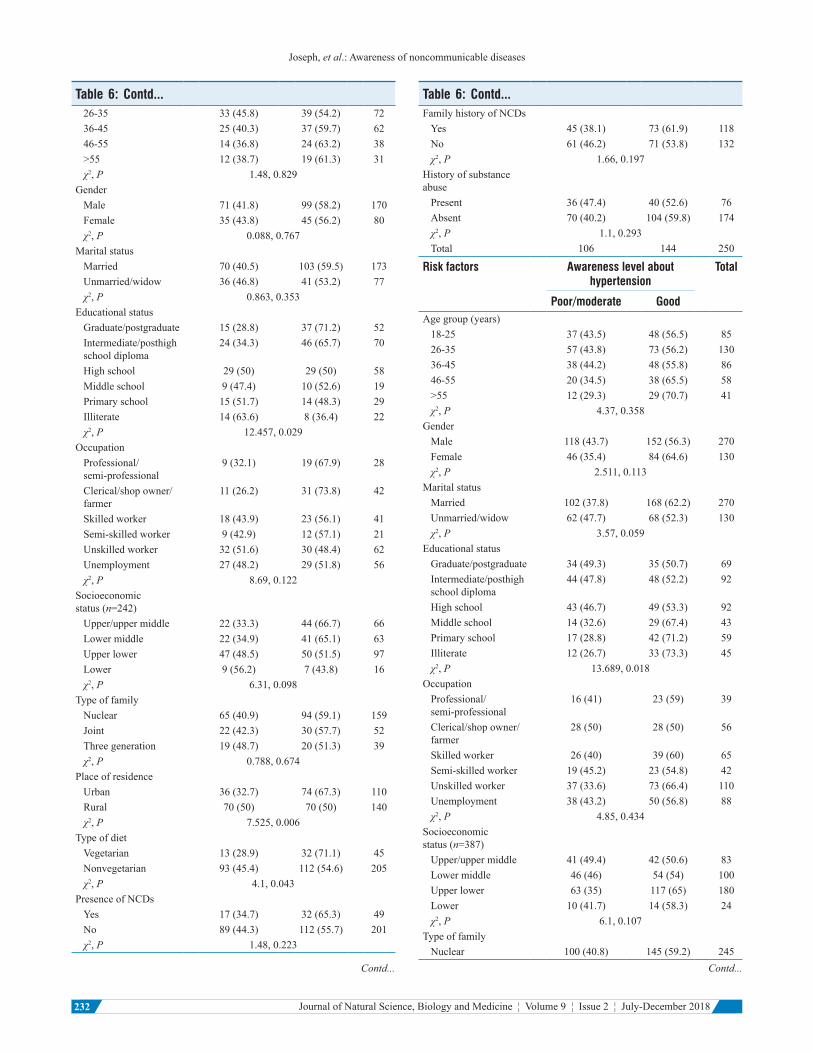
Education,occupation,SES,placeofresidence,andtypeofdietwereassociatedwithawarenesslevelaboutheartattackamongparticipants.Educational status, place of residence,andtypeofdietwereassociatedwithawarenesslevelaboutstrokeamongparticipants.Educationalstatuswasassociated
Table 1: Sociodemographic distribution of the study participants
Characteristics Frequency (%)Agegroup(years)18‑25 85(21.2)26‑35 130(32.5)36‑45 86(21.5)46‑55 58(14.5)56‑65 33(8.3)>65 8(2.0)
GenderMale 270(67.5)Female 130(32.5)
MaritalstatusMarried 270(67.5)Unmarried 126(31.5)Widow 4(1.0)
EducationalstatusGraduate/postgraduate 69(17.2)Intermediate/posthighschooldiploma 92(23.0)Highschool 92(23.0)Middleschool 43(10.8)Primaryschool 59(14.8)Illiterate 45(11.2)
OccupationalstatusProfessional 3(0.8)Semi‑professional 36(9.0)Clerical/shopowner/farmer 56(14.0)Skilledworker 65(16.2)Semi‑skilled 42(10.5)Unskilled 110(27.5)Unemployed 88(22.0)
SES(n=387)Upper 2(0.5)Uppermiddle 81(20.9)Lowermiddle 100(25.9)Upperlower 180(46.5)Lower 24(6.2)
TypeoffamilyNuclear 245(61.3)Joint 93(23.2)Threegeneration 62(15.5)
PlaceofresidenceUrban 154(38.5)Rural 246(61.5)Total 400(100.0)
Table 2: Awareness of risk factors of various noncommunicable diseases among participants (n=400)
Risk factors n (%)HeartattackStress 108(27.0)Hypertension 97(24.3)Smoking 91(22.8)Dyslipidemia 62(15.5)Shockingnews 45(11.3)Obesity 40(10.0)Alcoholintake 24(6.0)Diabetesmellitus 22(5.5)Poorexercisinghabits 15(3.8)Misconceptions 23(5.8)Don’tknow 127(31.8)
Stroke(n=250)Hypertension 77(30.8)Stress 42(16.8)Smoking 31(12.4)Poorphysicalactivity 13(5.2)Dyslipidemia 11(4.4)Obesity 9(3.6)Hereditary 5(2.0)Misconceptions 47(18.8)
HypertensionStress 141(35.3)Increasedsaltintake 52(13.0)Hereditary 36(9.0)Poorphysicalactivity 20(5.0)Obesity 18(4.5)Excessivespiceintake 16(4.0)Dyslipidemia 9(2.3)Misconceptions 18(4.5)Don’tknow 205(51.3)
DiabetesmellitusExcessivesugarintake 164(41.0)Hereditary 82(20.5)Obesity 36(9.0)Stress 29(7.3)Poorphysicalactivity 21(5.3)Junkfoods 19(4.8)Dyslipidemia 12(3.0)Misconceptions 19(4.8)
Joseph, et al.: Awareness of noncommunicable diseases
Journal of Natural Science, Biology and Medicine ¦ Volume 9 ¦ Issue 2 ¦ July-December 2018230
withawarenesslevelabouthypertensionamongparticipants.Age, SES, and family history of diabetesmellituswereassociatedwithawarenesslevelaboutdiabetesmellitusamongparticipants[Table6].Thisinfersthatagreaternumberofriskfactorswereassociatedwithawarenesslevelaboutheartattackamongparticipants.
Ofthetotalparticipants,322(80.5%)hadheardofemergencynumberwhichneedstobedialedduringmedicalemergencies.However, only 165 (51.2%) of them knew this numbercorrectly.
Multivariate analysis identified several predictors of goodawareness level among participants regarding individualtypesofNCDs.Educationalstatusofhighschoollevelandaboveandbeingavegetarianweresignificantpredictorsofgoodawarenesslevelaboutheartattack,takingilliterateandnonvegetarians as the reference population, respectively.Educationalstatusof intermediate levelandabove,beingavegetarian,andfromanurbanareaweresignificantpredictorsof good awareness level about stroke, taking illiterate,nonvegetarians,andruralresidentsasthereferencepopulation,respectively.Ageabove55yearswasasignificantpredictorof good awareness level about diabetesmellitus, taking18–25yearsasthereferencepopulation[Table7].
dIscussIon
Goodawarenesslevelwasseenamongagreaterproportionofparticipants(62.5%),regardingheartattackcomparedtootherNCDs.Amongthetotalnumberofvariousriskfactorsassociatedwith the awareness level of differentNCDs inthisstudy,majoritywasagainforheartattack.Thisindicatesthat awareness aboutheart attack is quite commonamongpeople.Inapopulation‑basedstudydoneinKuwait,[11]40%ofparticipantswerenotawareofanyheartattacksymptomssimilar to 39.8%observed in this study. In addition, only50.4%wereawarethatchestpainisawarningsymptomforheartattackintheformerstudy[11]comparedto57%reportedhere.
InastudydoneinNellore,India,[10]only35%ofparticipantswereawareaboutstrokeandonly30%ofparticipantsknewlimbweakness as awarning signof stroke.Thesefindingswereagainlesserthanthatreportedinthepresentstudywhere250(62.5%)hadheardaboutstrokeandofthem,56%knewthatitcanmanifestwithweaknessofextremities.
In amultivariate analysis in the former study[10] and in asystematicreview,[12]higheducationalstatuswasfoundtobeassociatedwithgoodawarenesslevelofstrokeasalsoobservedinthisstudyalongwithotherriskfactorsobservedheresuchasbeingvegetariansandfromurbanareas.
There has been a tremendous increase in stroke‑associatedmorbidityandmortalityinIndiaovertheyearstoanextentthat it has exceeded the statistics of industrializedWesterncountries.[13]Therefore,itisamatterofconcernthat37.5%ofparticipantsinthisstudyhadnotheardaboutstrokeandamongthosewhohadheard,28.4%werenotawareofitswarningsymptoms/signs.
Inotherstudies,itwasreportedthat20%–50%[10,12,14]werenotawareofanyriskfactorsand23%–80%[12,14]oftheparticipantswerenotawareofevenasinglewarningsignforstroke.Thetimewithin60minutesofonsetofsymptomsofstrokeiscalledthegoldenhourforstrokemanagement.[15]Hence,awarenessofthisconditionandearlyrecognitionofitswarningsignsandsymptomsneedfurtherimprovementfortimelyinitiationoftreatmentwithinthistimewindow.
Table 3: Awareness of warning symptoms/signs of various noncommunicable diseases among participants (n=400)
Signs and symptoms n (%)HeartattackChestpain 228(57.0)Breathlessness 71(17.8)Painintheupperlimbs 51(12.8)Fatigue 49(12.3)Sweating 46(11.5)Dizziness 21(5.3)Vomiting 7(1.8)Abdominaldiscomfort 3(0.8)Misconceptions 5(1.3)Don’tknow 159(39.8)
Stroke(n=250)Weaknessofextremities 140(56.0)Numbness 97(38.8)Difficultywithspeech 54(21.6)Difficultywithwalking 52(20.8)Imbalance 29(11.6)Dizziness 21(8.4)Misconceptions 27(10.8)Don’tknow 71(28.4)
HypertensionAnger 133(33.3)Dizziness 54(13.5)Headache 41(10.3)Blurringofvision 15(3.8)Sweating 11(2.8)Breathlessness 9(2.3)Sleeplessness 6(1.5)Misconceptions 8(2.0)
DiabetesmellitusDelayedwoundhealing 165(41.3)Fatigue 135(33.8)Polyuria 49(12.3)Dizziness 32(8.0)Polyphagia 30(7.5)Weightloss 28(7.0)Polydipsia 21(5.3)Visualdisturbances 11(2.8)Infections 7(1.8)Misconceptions 23(5.8)Don’tknow 135(33.8)

Joseph, et al.: Awareness of noncommunicable diseases
231Journal of Natural Science, Biology and Medicine ¦ Volume 9 ¦ Issue 2 ¦ July-December 2018 231
Table 4: Awareness of immediate management practices in various noncommunicable diseases among participants
Immediate management practices n (%)Heartattack(n=400)Callformedicalhelp 280(70.0)Cardiopulmonaryresuscitation 97(24.3)Rest 48(12)Ventilation 14(3.5)Medication 10(2.5)Loosenclothes 11(2.8)Rubthechest 4(1.0)Misconceptions 6(1.5)Don’tknow 76(19.0)
Stroke(n=250)Callformedicalhelp 178(71.2)Makethemlieononeside 42(16.8)Misconceptions 54(21.6)Don’tknow 65(26.0)
Table 5: Awareness level of participants with respect to different types of noncommunicable diseases
Type of NCD Level of knowledge Total
Poor Moderate GoodHeartattack 134(33.5) 16(4.0) 250(62.5) 400Stroke 27(10.8) 79(31.6) 144(57.6) 250Hypertension 4(1) 160(40) 236(59) 400Diabetesmellitus 4(1) 173(43.2) 223(55.8) 400NCD:Noncommunicabledisease
Table 6: Association between sociodemographic variables and other risk factors with awareness level of participants about various noncommunicable diseases
Risk factors Awareness level about heart attack
Total
Poor/moderate GoodAgegroup(years)18‑25 27(31.8) 58(68.2) 8526‑35 54(41.5) 76(58.5) 13036‑45 28(32.6) 58(67.4) 8646‑55 22(37.9) 36(62.1) 58>55 19(46.3) 22(53.7) 41χ2,P 4.37,0.359
GenderMale 101(37.4) 169(62.6) 270Female 49(37.7) 81(62.3) 130χ2,P 0.003,0.956
MaritalstatusMarried 105(38.9) 165(61.1) 270Unmarried/widow 45(34.6) 85(65.4) 130χ2,P 0.684,0.408
EducationalstatusGraduate/postgraduate 11(15.9) 58(84.1) 69
Table 6: Contd...Intermediate/posthighschooldiploma
24(26.1) 68(73.9) 92
Highschool 34(37) 58(63) 92Middleschool 19(44.2) 24(55.8) 43Primaryschool 31(52.5) 28(47.5) 59Illiterate 31(68.9) 14(31.1) 45χ2,P 44.24,<0.001
OccupationProfessional/semi‑professional
6(15.4) 33(84.6) 39
Clerical/shopowner/farmer
15(26.8) 41(73.2) 56
Skilledworker 18(27.7) 47(72.3) 65Semi‑skilledworker 14(33.3) 28(66.7) 42Unskilledworker 61(55.5) 49(44.5) 110Unemployment 36(40.9) 52(59.1) 88χ2,P 29.4,<0.001
Socioeconomicstatus(n=387)Upper/uppermiddle 17(20.5) 66(79.5) 83Lowermiddle 31(31.0) 69(69.0) 100Upperlower 86(47.8) 94(52.2) 180Lower 8(33.3) 16(66.7) 24χ2,P 20.4,<0.001
TypeoffamilyNuclear 88(35.9) 157(64.1) 245Joint 32(34.4) 61(65.6) 93Threegeneration 30 32 62χ2,P 3.78,0.151
PlaceofresidenceUrbanarea 47(30.5) 107(69.5) 154Ruralarea 103(41.9) 143(58.1) 246χ2,P 5.206,0.023
TypeofdietVegetarian 13(21.7) 47(78.3) 60Nonvegetarian 137(40.3) 203(59.7) 340χ2,P 7.55,0.006
PresenceofNCDsYes 27(38.6) 43(61.4) 70No 123(37.3) 207(62.7) 330χ2,P 0.042,0.838
FamilyhistoryofNCDPresent 62(33.5) 123(66.5) 185Absent 88(40.9) 127(59.1) 215χ2,P 2.33,0.127
HistoryofsubstanceabusePresent 47(37.3) 79(62.7) 126Absent 103(37.6) 171(62.4) 274χ2,P 0.003,0.956
Total 150 250 400
Risk factors Awareness level about stroke Total
Poor/moderate GoodAgegroup(years)18‑25 22(46.8) 25(53.2) 47
Contd... Contd...
Joseph, et al.: Awareness of noncommunicable diseases
Journal of Natural Science, Biology and Medicine ¦ Volume 9 ¦ Issue 2 ¦ July-December 2018232
Table 6: Contd...26‑35 33(45.8) 39(54.2) 7236‑45 25(40.3) 37(59.7) 6246‑55 14(36.8) 24(63.2) 38>55 12(38.7) 19(61.3) 31χ2,P 1.48,0.829
GenderMale 71(41.8) 99(58.2) 170Female 35(43.8) 45(56.2) 80χ2,P 0.088,0.767
MaritalstatusMarried 70(40.5) 103(59.5) 173Unmarried/widow 36(46.8) 41(53.2) 77χ2,P 0.863,0.353
EducationalstatusGraduate/postgraduate 15(28.8) 37(71.2) 52Intermediate/posthighschooldiploma
24(34.3) 46(65.7) 70
Highschool 29(50) 29(50) 58Middleschool 9(47.4) 10(52.6) 19Primaryschool 15(51.7) 14(48.3) 29Illiterate 14(63.6) 8(36.4) 22χ2,P 12.457,0.029
OccupationProfessional/semi‑professional
9(32.1) 19(67.9) 28
Clerical/shopowner/farmer
11(26.2) 31(73.8) 42
Skilledworker 18(43.9) 23(56.1) 41Semi‑skilledworker 9(42.9) 12(57.1) 21Unskilledworker 32(51.6) 30(48.4) 62Unemployment 27(48.2) 29(51.8) 56χ2,P 8.69,0.122
Socioeconomicstatus(n=242)Upper/uppermiddle 22(33.3) 44(66.7) 66Lowermiddle 22(34.9) 41(65.1) 63Upperlower 47(48.5) 50(51.5) 97Lower 9(56.2) 7(43.8) 16χ2,P 6.31,0.098
TypeoffamilyNuclear 65(40.9) 94(59.1) 159Joint 22(42.3) 30(57.7) 52Threegeneration 19(48.7) 20(51.3) 39χ2,P 0.788,0.674
PlaceofresidenceUrban 36(32.7) 74(67.3) 110Rural 70(50) 70(50) 140χ2,P 7.525,0.006
TypeofdietVegetarian 13(28.9) 32(71.1) 45Nonvegetarian 93(45.4) 112(54.6) 205χ2,P 4.1,0.043
PresenceofNCDsYes 17(34.7) 32(65.3) 49No 89(44.3) 112(55.7) 201χ2,P 1.48,0.223
Table 6: Contd...FamilyhistoryofNCDsYes 45(38.1) 73(61.9) 118No 61(46.2) 71(53.8) 132χ2,P 1.66,0.197
HistoryofsubstanceabusePresent 36(47.4) 40(52.6) 76Absent 70(40.2) 104(59.8) 174χ2,P 1.1,0.293Total 106 144 250
Risk factors Awareness level about hypertension
Total
Poor/moderate GoodAgegroup(years)18‑25 37(43.5) 48(56.5) 8526‑35 57(43.8) 73(56.2) 13036‑45 38(44.2) 48(55.8) 8646‑55 20(34.5) 38(65.5) 58>55 12(29.3) 29(70.7) 41χ2,P 4.37,0.358
GenderMale 118(43.7) 152(56.3) 270Female 46(35.4) 84(64.6) 130χ2,P 2.511,0.113
MaritalstatusMarried 102(37.8) 168(62.2) 270Unmarried/widow 62(47.7) 68(52.3) 130χ2,P 3.57,0.059
EducationalstatusGraduate/postgraduate 34(49.3) 35(50.7) 69Intermediate/posthighschooldiploma
44(47.8) 48(52.2) 92
Highschool 43(46.7) 49(53.3) 92Middleschool 14(32.6) 29(67.4) 43Primaryschool 17(28.8) 42(71.2) 59Illiterate 12(26.7) 33(73.3) 45χ2,P 13.689,0.018
OccupationProfessional/semi‑professional
16(41) 23(59) 39
Clerical/shopowner/farmer
28(50) 28(50) 56
Skilledworker 26(40) 39(60) 65Semi‑skilledworker 19(45.2) 23(54.8) 42Unskilledworker 37(33.6) 73(66.4) 110Unemployment 38(43.2) 50(56.8) 88χ2,P 4.85,0.434
Socioeconomicstatus(n=387)Upper/uppermiddle 41(49.4) 42(50.6) 83Lowermiddle 46(46) 54(54) 100Upperlower 63(35) 117(65) 180Lower 10(41.7) 14(58.3) 24χ2,P 6.1,0.107
TypeoffamilyNuclear 100(40.8) 145(59.2) 245
Contd... Contd...

Joseph, et al.: Awareness of noncommunicable diseases
233Journal of Natural Science, Biology and Medicine ¦ Volume 9 ¦ Issue 2 ¦ July-December 2018 233
Table 6: Contd...Joint 39(41.9) 54(58.1) 93Threegeneration 25(40.3) 37(59.7) 62χ2,P 0.049,0.976
PlaceofresidenceUrbanarea 66(42.9) 88(57.1) 154Ruralarea 98(39.8) 148(60.2) 246χ2,P 0.357,0.55
TypeofdietVegetarian 25(41.7) 35(58.3) 60Nonvegetarian 139(40.9) 201(59.1) 340χ2,P 0.013,0.909
PresenceofNCDsYes 28(40) 42(60) 70No 136(41.2) 194(58.8) 330χ2,P 0.035,0.851
PresenceofhypertensionYes 14(33.3) 28(66.7) 42No 150(41.9) 208(58.1) 358χ2,P 1.14,0.286
FamilyhistoryofNCDsYes 71(38.4) 114(61.6) 185No 93(43.3) 122(56.7) 215χ2,P 0.978,0.323
FamilyhistoryofhypertensionYes 41(34.5) 78(65.5) 119No 123(43.8) 158(56.2) 281χ2,P 3.0,0.083
HistoryofsubstanceabusePresent 50(39.7) 76(60.3) 126Absent 114(41.6) 160(58.4) 274χ2,P 0.132,0.716
Total 164 236 400
Risk factors Awareness level about diabetes mellitus
Total
Poor/moderate GoodAgegroup(years)18‑25 45(52.9) 40(47.1) 8526‑35 64(49.2) 66(50.8) 13036‑45 36(41.9) 50(58.1) 8646‑55 27(46.6) 31(53.4) 58>55 5(12.2) 36(87.8) 41χ2,P 21.3,<0.001
GenderMale 121(44.8) 149(55.2) 270Female 56(43.1) 74(56.9) 130χ2,P 0.107,0.743
MaritalstatusMarried 115(42.6) 155(57.4) 270Unmarried/widow 62 68 130χ2,P 0.925,0.336
EducationalstatusGraduate/postgraduate 26(37.7) 43(62.3) 69
Table 6: Contd...Intermediate/posthighschooldiploma
45(48.9) 47(51.1) 92
Highschool 44(47.8) 48(52.2) 92Middleschool 20(46.5) 23(53.5) 43Primaryschool 28(47.5) 31(52.5) 59Illiterate 14(31.1) 31(68.9) 45χ2,P 5.98,0.308
OccupationProfessional/semi‑professional
16(41) 23(59) 39
Clerical/shopowner/farmer
21(37.5) 35(62.5) 56
Skilledworker 36(55.4) 29(44.6) 65Semi‑skilledworker 20(47.6) 22(52.4) 42Unskilledworker 40(36.4) 70(63.6) 110Unemployment 44(50) 44(50) 88χ2,P 8.61,0.126
Socioeconomicstatus(n=387)Upper/uppermiddle 25(30.1) 58(69.9) 83Lowermiddle 54(54.0) 46(46.0) 100Upperlower 83(46.1) 97(53.9) 180Lower 11(45.8) 13(54.2) 24χ2,P 10.8,0.013
TypeoffamilyNuclear 109(44.5) 136(55.5) 245Joint 47(50.5) 46(49.5) 93Threegeneration 21(33.9) 41(66.1) 62χ2,P 4.2,0.122
PlaceofresidenceUrbanarea 67(43.5) 87(56.5) 154Ruralarea 110(44.7) 136(55.3) 246χ2,P 0.056,0.813
TypeofdietVegetarian 25(41.7) 35(58.3) 60Nonvegetarian 152(44.7) 188(55.3) 340χ2,P 0.191,0.662
PresenceofNCDsYes 29(41.4) 41(58.6) 70No 148(44.8) 182(55.2) 330χ2,P 0.274,0.601
PresenceofdiabetesmellitusYes 12(30) 28(70) 40No 165(45.8) 195(54.2) 360χ2,P 3.66,0.056
FamilyhistoryofNCDYes 77 108 185No 100(46.5) 115(53.5) 215χ2,P 0.964,0.326
FamilyhistoryofdiabetesmellitusPresent 33(31.4) 72(68.6) 105Absent 144(48.8) 151(51.2) 295χ2,P 9.49,0.002
Historyofsubstanceabuse
Contd... Contd...

Joseph, et al.: Awareness of noncommunicable diseases
Journal of Natural Science, Biology and Medicine ¦ Volume 9 ¦ Issue 2 ¦ July-December 2018234
Table 6: Contd...Present 50(39.7) 76(60.3) 126Absent 127(46.4) 147(53.6) 274χ2,P 1.56,0.212
Total 177 223 400NCDs:Noncommunicablediseases
Table 7: Ordinal logistic regression analysis of predictors of awareness level of various noncommunicable diseases among the participants (n=400)
Independent predictors of good awareness level
Adjusted OR
95% CIs of adjusted OR
P
Lower limit
Upper limit
OfheartattackEducationalstatusGraduate/postgraduate
0.14 0.05 0.45 0.001
Intermediate/posthighschooldiploma
0.25 0.1 0.61 0.003
Highschool 0.4 0.17 0.95 0.037Middleschool 0.48 0.19 1.22 0.123Primaryschool 0.56 0.24 1.34 0.192Illiterate 0
TypeofdietVegetarian 0.43 0.21 0.9 0.022Nonvegetarian 0
Ofstroke(n=250)EducationalstatusGraduate/postgraduate
0.23 0.093 0.58 0.002
Intermediate/posthighschooldiploma
0.24 0.098 0.57 0.001
Highschool 0.48 0.198 1.18 0.111Middleschool 0.64 0.223 1.84 0.409Primaryschool 0.69 0.257 1.84 0.455Illiterate 0
PlaceofresidenceUrban 0.55 0.351 0.86 0.01Rural 0
TypeofdietVegetarian 0.47 0.259 0.84 0.011Nonvegetarian 0
OfdiabetesmellitusAgegroup(years)≥56 0.13 0.045 0.365 <0.00146‑55 0.8 0.4 1.59 0.52036‑45 0.62 0.33 1.16 0.13826‑35 0.87 0.493 1.52 0.61618‑25 0
CIs:Confidenceintervals,OR:Oddsratio
Awareness level regarding strokewas significantly betteramongurbanresidentsinthepresentstudy.Similarly,inastudydone inMysore, India, awareness about diabetesmellitus,hypertension, dyslipidemia, and strokewas significantlyhigher among participants from urban area.[16] Better
awareness among themmight be due to easy accessibilitytomedicalcareandhealthclubs,moreofmassmediaandinternetfacilities,andbetterliteracyrateinurbancomparedtoruralareas.
Inthisstudy,awarenessofhypertensionwasseensignificantlybetteramongthosewhowereilliterateorthoseeducateduptoprimaryschoollevelcomparedtoothers.Themoderate‑to‑goodawareness levelabouthypertension in this studywas99%,whichwasalsomuchhigher than that reported inpreviousstudieswhereitrangedfrom36.9%to60%.[7,8,17,18]Thismightbebecauseofopportunisticscreeningofbloodpressure(forthoseagedabove30years)byhealth‑careproviders,whichisdoneroutinelynowadays,undertheNationalProgrammeforPreventionandControlofCancer,Diabetes,CardiovascularDiseasesandStroke.ThisstrategyunderNPCDCSwhichwasimplementedthroughoutIndiain2015mighthavegeneratedawarenessabouthypertensionevenamongthelesseducatedgroups. Previous studies[17,19] reported awareness abouthypertensiontobesignificantlybetteramongwomen,whichwasdifferentfromourobservationswherenoassociationwithgenderwasobserved.
In another study[17] done indifferent parts ofKerala, India,moderate‑to‑goodawarenesslevelaboutdiabetesmellituswasfoundtobe72.2%comparedto99%reportedinthepresentstudy.However,knowledgeofparticularriskfactorssuchasphysicalinactivityandobesityresultingindiabetesmellituswasreportedin11.9%ofparticipantsinaChennai,India[20]basedstudywhichwasmorethanourobservationswhereonly5.3%and9%ofparticipants,respectively,knewit.Thisindicatestheurgentrequirementofneed‑baseddiabeteseducationprogramsinbothurbanandruralIndia.Itshouldtargetthosewhowerefoundparticularlytobelessawareaboutdiabetesmellitusinthepresentstudysuchasyoungerpopulationgroups.
conclusIon
Good awareness level about variousNCDs ranged from55.8% to 62.5%amongparticipants in this study.There isthusaneedforfurtherimprovementofawarenessofpeopleregardingvariousNCDs.Theseawarenessprogramsshouldbe so designed to improve awareness regarding those riskfactorsofNCDswhicharenotwidelyknownamongpeoplesuchasthoseidentifiedinthisstudy.Thiswillhelptheminthe implementationofsuitablepreventivemeasuresagainsttheseriskfactors.Awarenessonwarningsymptomsandsignsandimmediatemanagementmeasureswilladditionallyensureearlydiagnosisandtreatment.Thevarioussociodemographicgroupsidentifiedtohavepoorknowledgeinthepresentstudyneedtobeprovidedtargetedinterventionduringthesehealtheducationalcampaigns.ThesemeasureswillhelpincontainingthecurrentincreasingburdenofNCDsinIndia.
LimitationApopulation‑basedstudywouldhavegivenabetterestimateoftheawarenesslevelofvariousNCDsincomparisontoanyhospital‑basedstudy.

Joseph, et al.: Awareness of noncommunicable diseases
235Journal of Natural Science, Biology and Medicine ¦ Volume 9 ¦ Issue 2 ¦ July-December 2018 235
AcknowledgmentsTheauthorsthankthemedicalsuperintendentsofthehospitalsfortheircooperationintheconductofthisstudy.
Financial support and sponsorshipNil.
Conflicts of interestTherearenoconflictsofinterest.
references1. Mendis S, Davis S, Norrving B. Organizational update: The World
HealthOrganizationglobalstatusreportonnoncommunicablediseases2014;onemorelandmarkstepinthecombatagainststrokeandvasculardisease.Stroke2015;46:e121‑2.
2. World Health Organization. Noncommunicable Diseases CountryProfiles2011.Geneva:WorldHealthOrganization;2011.
3. SrinathReddyK,ShahB,VargheseC,RamadossA.RespondingtothethreatofchronicdiseasesinIndia.Lancet2005;366:1744‑9.
4. Gupta R, Guptha S, Sharma KK, GuptaA, Deedwania P. Regionalvariations in cardiovascular risk factors in India: India heart watch.WorldJCardiol2012;4:112‑20.
5. Gupta R, Joshi P, Mohan V, Reddy KS, Yusuf S. Epidemiologyand causation of coronary heart disease and stroke in India. Heart2008;94:16‑26.
6. Gupta R, Gupta S. Hypertension in India: Trends in prevalence,awareness,treatmentandcontrol.RUHSJHealthSci2017;2:40‑6.
7. Gupta R. Trends in hypertension epidemiology in India. J HumHypertens2004;18:73‑8.
8. AnchalaR,KannuriNK,PantH,KhanH,FrancoOH,DiAngelantonioE,et al. Hypertension in India:A systematic review and meta‑analysisof prevalence, awareness, and control of hypertension. J Hypertens2014;32:1170‑7.
9. Patel V, Chatterji S, Chisholm D, Ebrahim S, Gopalakrishna G,Mathers C, et al. Chronic diseases and injuries in India. Lancet2011;377:413‑28.
10. MenonB,SwaroopJJ,DeepikaHK,ConjeevaramJ,MunisusmithaK.Poor awarenessof stroke–Ahospital‑based study fromSouth India:An urgent need for awareness programs. J Stroke Cerebrovasc Dis2014;23:2091‑8.
11. AwadA,Al‑NafisiH.PublicknowledgeofcardiovasculardiseaseanditsriskfactorsinKuwait:Across‑sectionalsurvey.BMCPublicHealth2014;14:1131.
12. StroebeleN,Müller‑RiemenschneiderF,NolteCH,Müller‑NordhornJ,Bockelbrink A, Willich SN, et al. Knowledge of risk factors, andwarningsignsofstroke:Asystematicreviewfromagenderperspective.IntJStroke2011;6:60‑6.
13. BanerjeeTK,DasSK.Fifty years of stroke researches in India.AnnIndianAcadNeurol2016;19:1‑8.
14. PandianJD,JaisonA,DeepakSS,KalraG,ShamsherS,LincolnDJ,et al.Publicawarenessofwarningsymptoms,riskfactors,andtreatmentofstrokeinNorthwestIndia.Stroke2005;36:644‑8.
15. Advani R, Naess H, Kurz MW. The golden hour of acute ischemicstroke.ScandJTraumaResuscEmergMed2017;25:54.
16. Thippeswamy T, Chikkegowda P. Basic risk factors awarenessin non‑communicable diseases (BRAND) study among peoplevisiting tertiary care centre inMysuru, Karnataka. J ClinDiagn Res2016;10:OC04‑7.
17. ThankappanKR,ShahB,MathurP,SarmaPS,SrinivasG,MiniGK,et al. Risk factor profile for chronic non‑communicable diseases:Resultsofacommunity‑basedstudyinKerala,India.IndianJMedRes2010;131:53‑63.
18. Institute of Medicine (US) Committee on Preventing the GlobalEpidemic of Cardiovascular Disease: Meeting the Challenges inDeveloping Countries; Fuster V, Kelly BB, editors. PromotingCardiovascularHealth in theDevelopingWorld:ACriticalChallengeto Achieve Global Health. Washington (D.C.): National AcademiesPress(US);2010.
19. WorldHealthOrganization.GlobalStatusReportofNoncommunicableDiseases2014.Geneva:WorldHealthOrganization;2014.
20. Mohan D, Raj D, Shanthirani CS, Datta M, Unwin NC, Kapur A,et al.AwarenessandknowledgeofdiabetesinChennai–TheChennaiurbanruralepidemiologystudy[CURES‑9].JAssocPhysiciansIndia2005;53:283‑7.
Copyright © 2022 FDOKUMEN