FRASER & NEAVE HOLDINGS BHD For immediate release
27
FRASER & NEAVE HOLDINGS BHD (Company No: 196101000155 (4205-V)) (Incorporated in Malaysia) Level 3A, F&N Point, No. 3, Jalan Metro Pudu 1, Fraser Business Park, Off Jalan Yew, 55100 Kuala Lumpur, Malaysia Tel: 03-92352288 Fax: 03-92227878 QUARTERLY FINANCIAL REPORT Financial year ended 30 September 2020 The Directors are pleased to release the unaudited quarterly financial report for the quarter and financial year ended 30 September 2020. The contents of the financial report comprise the following attached unaudited condensed consolidated financial statements, explanatory notes and additional disclosures and these must be read in conjunction with the Group’s audited financial statements for the year ended 30 September 2019: Schedule A : Unaudited Condensed Consolidated Income Statement Schedule B : Unaudited Condensed Consolidated Statement of Comprehensive Income Schedule C : Unaudited Condensed Consolidated Statement of Financial Position Schedule D : Unaudited Condensed Consolidated Statement of Cash Flows Schedule E : Unaudited Condensed Consolidated Statement of Changes in Equity Schedule F : Selected Explanatory Notes Schedule G : Additional Disclosures The unaudited quarterly financial report has been prepared in accordance with the accounting standard on interim financial reporting issued by the Malaysian Accounting Standards Board and contains additional disclosures prescribed by the Main Market Listing Requirements of Bursa Malaysia Securities Berhad. Unless specified otherwise, the same accounting policies and methods of computation applied to the Group’s financial statements for the previous year had been followed throughout this quarterly financial report. By Order of the Board Kuala Lumpur 3 November 2020 For immediate release
-
Upload
khangminh22 -
Category
Documents
-
view
8 -
download
0
Transcript of FRASER & NEAVE HOLDINGS BHD For immediate release
FRASER & NEAVE HOLDINGS BHD (Company No: 196101000155 (4205-V)) (Incorporated in Malaysia)
Level 3A, F&N Point, No. 3, Jalan Metro Pudu 1, Fraser Business Park, Off Jalan Yew, 55100 Kuala Lumpur, Malaysia Tel: 03-92352288 Fax: 03-92227878
QUARTERLY FINANCIAL REPORT Financial year ended 30 September 2020 The Directors are pleased to release the unaudited quarterly financial report for the quarter and financial year ended 30 September 2020. The contents of the financial report comprise the following attached unaudited condensed consolidated financial statements, explanatory notes and additional disclosures and these must be read in conjunction with the Group’s audited financial statements for the year ended 30 September 2019: Schedule A : Unaudited Condensed Consolidated Income Statement Schedule B : Unaudited Condensed Consolidated Statement of Comprehensive Income Schedule C : Unaudited Condensed Consolidated Statement of Financial Position Schedule D : Unaudited Condensed Consolidated Statement of Cash Flows Schedule E : Unaudited Condensed Consolidated Statement of Changes in Equity Schedule F : Selected Explanatory Notes Schedule G : Additional Disclosures The unaudited quarterly financial report has been prepared in accordance with the accounting standard on interim financial reporting issued by the Malaysian Accounting Standards Board and contains additional disclosures prescribed by the Main Market Listing Requirements of Bursa Malaysia Securities Berhad. Unless specified otherwise, the same accounting policies and methods of computation applied to the Group’s financial statements for the previous year had been followed throughout this quarterly financial report. By Order of the Board Kuala Lumpur 3 November 2020
For immediate release

FRASER & NEAVE HOLDINGS BHD Quarterly Financial Report : Quarter 4 2019/20 Page 2 of 27
Schedule A : Unaudited Condensed Consolidated Income Statement For the quarter and year ended 30 September 2020 Individual 4th quarter Cumulative 4th quarter RM’000 30/09/2020 30/09/2019 % chg 30/09/2020 30/09/2019 % chg Revenue 953,697 975,086 -2.2% 3,988,507 4,077,138 -2.2% Cost of sales (667,982) (670,798) (2,758,139) (2,810,372) Gross profit 285,715 304,288 -6.1% 1,230,368 1,266,766 -2.9% Other income 8,661 3,858 23,622 16,184 Operating expenses (186,526) (221,606) (738,830) (762,506) Operating profit 107,850 86,540 24.6% 515,160 520,444 -1.0% Finance income 555 4,020 5,068 15,223 Finance costs (1,032) (635) (4,858) (4,555) Share of profit of equity-accounted associate, net of tax ^
957
2,338
7,824
9,139
Share of loss of equity-accounted joint venture, net of tax #
(67)
(2,812)
(283)
(7,295)
Profit before tax 108,263 89,451 21.0% 522,911 532,956 -1.9% Tax expense (Schedule G, Note 5) (22,506) (21,434) (112,787) (122,732) Profit for the year 85,757 68,017 26.1% 410,124 410,224 0.0% Profit for the year attributable to: Owners of the Company 85,993 68,027 410,384 410,260 Non-controlling interests (236) (10) (260) (36) Profit for the year 85,757 68,017 410,124 410,224 Basic earnings per ordinary share (sen) (Schedule G, Note 10)
23.5
18.6
111.9
111.9
Diluted earnings per ordinary share (sen) (Schedule G, Note 10)
23.4
18.5
111.7
111.6
^ The share of results of an associate for the quarter refers to Cocoaland Holdings Berhad and is derived from its
unaudited quarterly announcement for the quarter ended 30 June 2020 dated 27 August 2020.The cumulative results are the sum total of its quarterly results recognised by the Group for the year ended 30 June 2020.
# The share of results of a joint venture for the quarter and cumulative results refers to Vacaron Company Sdn Bhd
and are derived from its unaudited management accounts for the quarter and year ended 30 September 2020. This Statement should be read in conjunction with the selected explanatory notes on Schedule F & G of this Report and the Group’s audited financial statements for the year ended 30 September 2019.

FRASER & NEAVE HOLDINGS BHD Quarterly Financial Report : Quarter 4 2019/20 Page 3 of 27
Schedule B: Unaudited Condensed Consolidated Statement of Comprehensive Income For the quarter and year ended 30 September 2020
Individual 4th quarter Cumulative 4th quarter RM’000 30/09/2020 30/09/2019 % chg 30/09/2020 30/09/2019 % chg Profit for the year 85,757 68,017 26.1% 410,124 410,224 0.0% Other comprehensive income, net of tax:
Item that is not to be reclassified subsequently to profit or loss:
Remeasurement of defined benefit plans
(1,231)
(5,540)
(1,231)
(5,540)
Item that is or may be reclassified subsequently to profit or loss:
Foreign currency translation differences for foreign operations
(37,286)
9,492
(28,286)
35,155
(38,517) 3,952 (29,517) 29,615 Total comprehensive income for the year
47,240
71,969
-34.4%
380,607
439,839
-13.5%
Total comprehensive income attributable to:
Owners of the Company 47,476 71,979 380,867 439,875 Non-controlling interests (236) (10) (260) (36) 47,240 71,969 -34.4% 380,607 439,839 -13.5% This Statement should be read in conjunction with the selected explanatory notes on Schedule F & G of this Report and the Group’s audited financial statements for the year ended 30 September 2019.

FRASER & NEAVE HOLDINGS BHD Quarterly Financial Report : Quarter 4 2019/20 Page 4 of 27
Schedule C : Unaudited Condensed Consolidated Statement of Financial Position As at 30 September 2020 RM’000 30/09/2020
30/09/2019
Non-current assets Property, plant and equipment 1,359,893 1,339,180 Right-of-use assets ^ 87,183 - Investment properties (Schedule F, Note 18) 47,569 48,775 Properties held for development 54,958 56,047 Intangible assets 45,921 120,646 Investment in an associate (Schedule F, Note 8) 91,261 89,658 Investment in a joint venture (Schedule F, Note 9) 87,845 87,613 Deferred tax assets 5,970 6,234 1,780,600 1,748,153 Current assets Trade and other receivables 589,661 599,996 Inventories 655,981 578,404 Current tax asset 200 7,567 Derivative financial assets (Schedule F, Note 18)
4 6 Cash and cash equivalents 493,615 569,719
1,739,461 1,755,692
Total assets 3,520,061 3,503,845 Equity Share capital and reserves 2,690,601 2,529,324 Non-controlling interests (161) 99 Total equity 2,690,440 2,529,423 Non-current liabilities Loans and borrowings (Schedule G, Note 7) - 95,909 Lease liabilities ^ 10,785 - Employee benefits 51,304 49,511 Deferred tax liabilities 48,073 33,994 110,162 179,414 Current liabilities Trade and other payables 516,654 * 664,581 Contract liabilities 57,787 * 54,420 Loans and borrowings (Schedule G, Note 7) 91,868 27,402 Lease liabilities ^ 13,672 - Current tax liabilities 39,111 48,469 Derivative financial liabilities (Schedule F, Note 18)
367 136 719,459 795,008 Total liabilities 829,621 974,422 Total equity and liabilities 3,520,061 3,503,845 Net assets per share (RM)
attributable to owners of the Company
7.34 6.90
* Please refer to Schedule F, Note 21. ^ Please refer to Schedule F, Note 2. This Statement should be read in conjunction with the selected explanatory notes on Schedule F & G of this Report and the Group’s audited financial statements for the year ended 30 September 2019.

FRASER & NEAVE HOLDINGS BHD Quarterly Financial Report : Quarter 4 2019/20 Page 5 of 27
Schedule D : Unaudited Condensed Consolidated Statement of Cash Flows For the year ended 30 September 2020 Cumulative 4th quarter RM’000 30/09/2020 30/09/2019 Cash flows from operating activities
Profit before tax 522,911 532,956 Add/(less) non-cash items: - Change in fair value of investment property 1,206 - - Depreciation of property, plant and equipment and amortisation of intangible
assets
106,706
102,418 - Depreciation of right-of-use assets 25,865 - - Finance costs 4,858 4,555 - Finance income (5,068) (15,223) - Gain on disposal of intangible assets (7,805) (5) - Inventories written off 6,498 8,485 - Investment property written off - 543 - Net fair value loss on derivatives 233 50 - Net impairment loss/(reversal of impairment loss) on property, plant and
equipment
44
(334) - Net impairment loss on receivables 416 312 - Net inventories written down 4,917 2,900 - Net loss on disposal of property, plant and equipment 594 417 - Property development costs written off 1,089 - - Property, plant and equipment written off 458 3,298 - Share-based payment transactions expense 7,952 2,275 - Share of profit of equity-accounted associate, net of tax (7,824) (9,139) - Share of loss of equity-accounted joint venture, net of tax 283 7,295 - Others 1,640 1,225 Changes in working capital # (225,296) 4,388 Tax paid (97,074) (68,081)
Net cash from operating activities 342,603 578,335 Cash flows from investing activities
Acquisition of intangible assets (1,796) (128) Acquisition of property, plant and equipment (207,423) (137,711) Dividends received 6,221 3,733 Interest received 5,463 9,580 Investment in a joint venture (500) - Proceeds from disposal of intangible assets 83,175 56 Proceeds from disposal of property, plant and equipment 242 277
Net cash used in investing activities (114,618) (124,193) Cash flows from financing activities
Dividends paid to owners of the Company (220,067) (210,898) Interest paid (4,736) (7,991) Payment of lease liabilities (24,351) - Purchase of shares by Share Grant Plan (“SGP”) Trust (7,184) (5,023) Proceeds from loans and borrowings - 54,805 Repayment of loans and borrowings (26,248) (280,162)
Net cash used in financing activities (282,586) (449,269) Net (decrease)/increase in cash and cash equivalents (54,601) 4,873 Effects of exchange rate fluctuations on cash and cash equivalents (21,503) 27,754 Cash and cash equivalents at 1 October 569,719 537,092 Cash and cash equivalents at 30 September 493,615 569,719

FRASER & NEAVE HOLDINGS BHD Quarterly Financial Report : Quarter 4 2019/20 Page 6 of 27
Schedule D : Unaudited Condensed Consolidated Statement of Cash Flows (cont’d) For the year ended 30 September 2020 Cumulative 4th quarter RM’000 30/09/2020 30/09/2019 Cash and bank balances 319,306 252,980 Short term deposits with licensed banks with a maturity period of
3 months or less
174,309
316,739 Cash and cash equivalents at 30 September 493,615 569,719
# Included the interest amounting to RM15,000 (2019: RM5,814,000) accrued on loan to a joint venture. This Statement should be read in conjunction with the selected explanatory notes on Schedule F & G of this Report and the Group’s audited financial statements for the year ended 30 September 2019.
FRASER & NEAVE HOLDINGS BHD Quarterly Financial Report : Quarter 4 2019/20 Page 7 of 27
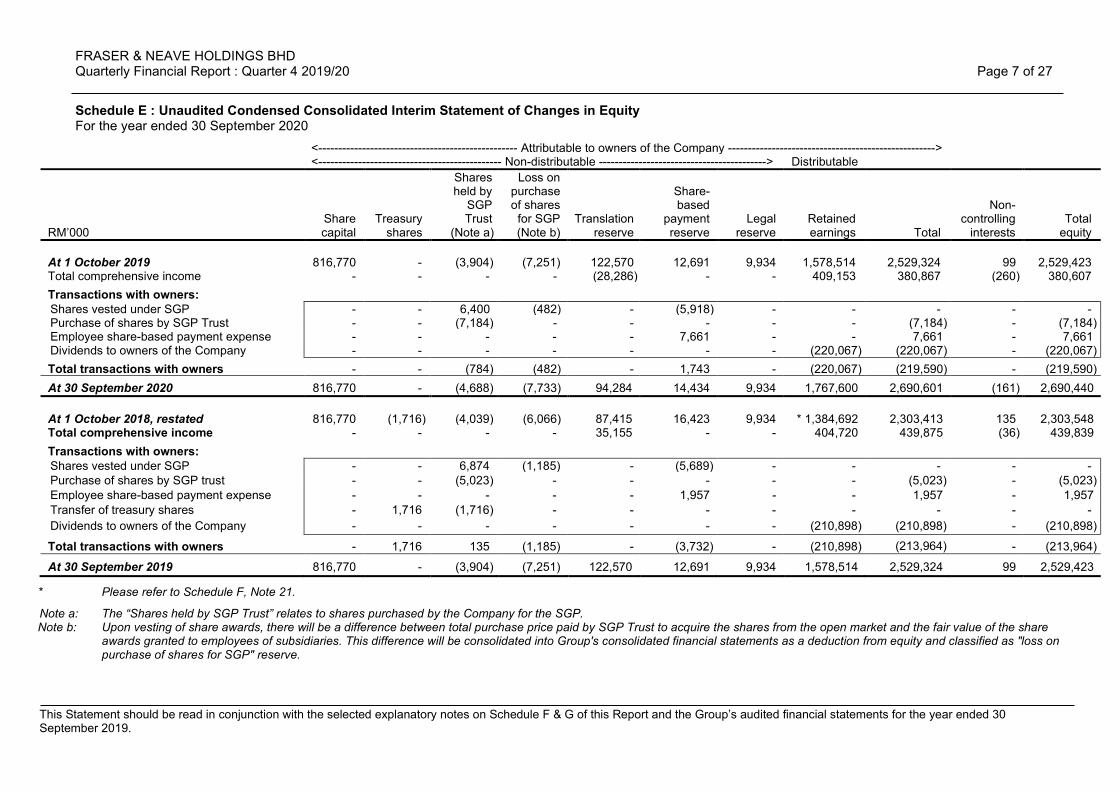
Schedule E : Unaudited Condensed Consolidated Interim Statement of Changes in Equity For the year ended 30 September 2020
<-------------------------------------------------- Attributable to owners of the Company ----------------------------------------------------> <---------------------------------------------- Non-distributable ------------------------------------------> Distributable
RM’000
Share capital
Treasury shares
Shares held by
SGP Trust
(Note a)
Loss on purchase of shares
for SGP (Note b)
Translation reserve
Share-based
payment reserve
Legal reserve
Retained earnings
Total
Non- controlling
interests
Total equity
At 1 October 2019 816,770 - (3,904) (7,251) 122,570 12,691 9,934 1,578,514 2,529,324 99 2,529,423 Total comprehensive income - - - - (28,286) - - 409,153 380,867 (260) 380,607 Transactions with owners: Shares vested under SGP - - 6,400 (482) - (5,918) - - - - - Purchase of shares by SGP Trust - - (7,184) - - - - - (7,184) - (7,184) Employee share-based payment expense - - - - - 7,661 - - 7,661 - 7,661 Dividends to owners of the Company - - - - - - - (220,067) (220,067) - (220,067)
Total transactions with owners - - (784) (482) - 1,743 - (220,067) (219,590) - (219,590) At 30 September 2020 816,770 - (4,688) (7,733) 94,284 14,434 9,934 1,767,600 2,690,601 (161) 2,690,440 At 1 October 2018, restated 816,770 (1,716) (4,039) (6,066) 87,415 16,423 9,934 * 1,384,692 2,303,413 135 2,303,548 Total comprehensive income - - - - 35,155 - - 404,720 439,875 (36) 439,839 Transactions with owners: Shares vested under SGP - - 6,874 (1,185) - (5,689) - - - - - Purchase of shares by SGP trust - - (5,023) - - - - - (5,023) - (5,023) Employee share-based payment expense - - - - - 1,957 - - 1,957 - 1,957 Transfer of treasury shares - 1,716 (1,716) - - - - - - - - Dividends to owners of the Company - - - - - - - (210,898) (210,898) - (210,898)
Total transactions with owners - 1,716 135 (1,185) - (3,732) - (210,898) (213,964) - (213,964) At 30 September 2019 816,770 - (3,904) (7,251) 122,570 12,691 9,934 1,578,514 2,529,324 99 2,529,423
* Please refer to Schedule F, Note 21.
Note a: The “Shares held by SGP Trust” relates to shares purchased by the Company for the SGP. Note b: Upon vesting of share awards, there will be a difference between total purchase price paid by SGP Trust to acquire the shares from the open market and the fair value of the share
awards granted to employees of subsidiaries. This difference will be consolidated into Group's consolidated financial statements as a deduction from equity and classified as "loss on purchase of shares for SGP" reserve.
This Statement should be read in conjunction with the selected explanatory notes on Schedule F & G of this Report and the Group’s audited financial statements for the year ended 30 September 2019.

FRASER & NEAVE HOLDINGS BHD Quarterly Financial Report : Quarter 4 2019/20 Page 8 of 27
Schedule F : Selected Explanatory Notes Pursuant to MFRS 134 1. Corporate information
Fraser & Neave Holdings Bhd (“F&NHB” or “the Company”) is a public limited liability company incorporated and domiciled in Malaysia, and is listed on the Main Market of Bursa Malaysia Securities Berhad. The condensed consolidated interim financial statements of the Group (“interim financial statements”) as at and for the year ended 30 September 2020 comprise the Company and its subsidiaries (together referred to as the “Group”) and the Group’s interest in an associate and a joint venture. These interim financial statements were approved by the Board of Directors on 3 November 2020.
2. Basis of preparation These interim financial statements are unaudited and have been prepared in accordance with applicable disclosure provisions of the Listing Requirements of Bursa Malaysia Securities Berhad, MFRS 134 Interim Financial Reporting issued by the Malaysian Accounting Standards Board and with IAS 34 Interim Financial Reporting issued by the International Accounting Standards Board. These interim financial statements do not include all of the information required for annual financial statements, and should be read in conjunction with the consolidated financial statements of the Group as at and for the year ended 30 September 2019. The audited consolidated financial statements of the Group for the year ended 30 September 2019 are available upon request from the Company’s registered office at Level 3A, F&N Point, No. 3, Jalan Metro Pudu 1, Fraser Business Park, Off Jalan Yew, 55100 Kuala Lumpur, Malaysia.
The interim financial statements should be read in conjunction with the audited financial statements of the Group for the year ended 30 September 2019. These explanatory notes provide an explanation of events and transactions that are significant to an understanding of the changes in the financial position and performance of the Group since the year ended 30 September 2019.
The accounting policies and presentation applied by the Group in these interim financial statements are the same as those applied by the Group in its consolidated annual financial statements as at and for the year ended 30 September 2019, except for the adoption of the following new and amended MFRSs, and Issues Committee (IC) Interpretations mandatory for annual financial periods beginning on or after 1 October 2019: • MFRS 16 Leases • IC Interpretation 23 Uncertainty over Income Tax Treatments • Amendments to MFRS 128 Long-term Interests in Associates and Joint Ventures • Amendments to MFRS 9 Prepayment Features with Negative Compensation • Amendments to MFRS 119 Employee Benefits • Annual Improvements to MFRSs 2015-2017 Cycle MFRS 16 Leases MFRS 16 replaces the guidance in MFRS 117 Leases, IC Interpretation 4 Determining whether an Arrangement contains a Lease, IC Interpretation 115 Operating Leases – Incentives and IC Interpretation 127 Evaluating the Substance of Transactions Involving the Legal Form of a Lease. MFRS 16 introduces a single, on-balance sheet lease accounting model for lessees. A lessee recognises a right-of-use asset representing its right to use the underlying asset and a lease liability representing its obligations to make lease payments. There are recognition exemptions for short-term leases and leases of low-value items. Lessor accounting remains similar to the current standard which continues to be classified as finance or operating lease.
FRASER & NEAVE HOLDINGS BHD Quarterly Financial Report : Quarter 4 2019/20 Page 9 of 27
Schedule F : Selected Explanatory Notes Pursuant to MFRS 134 (cont’d)
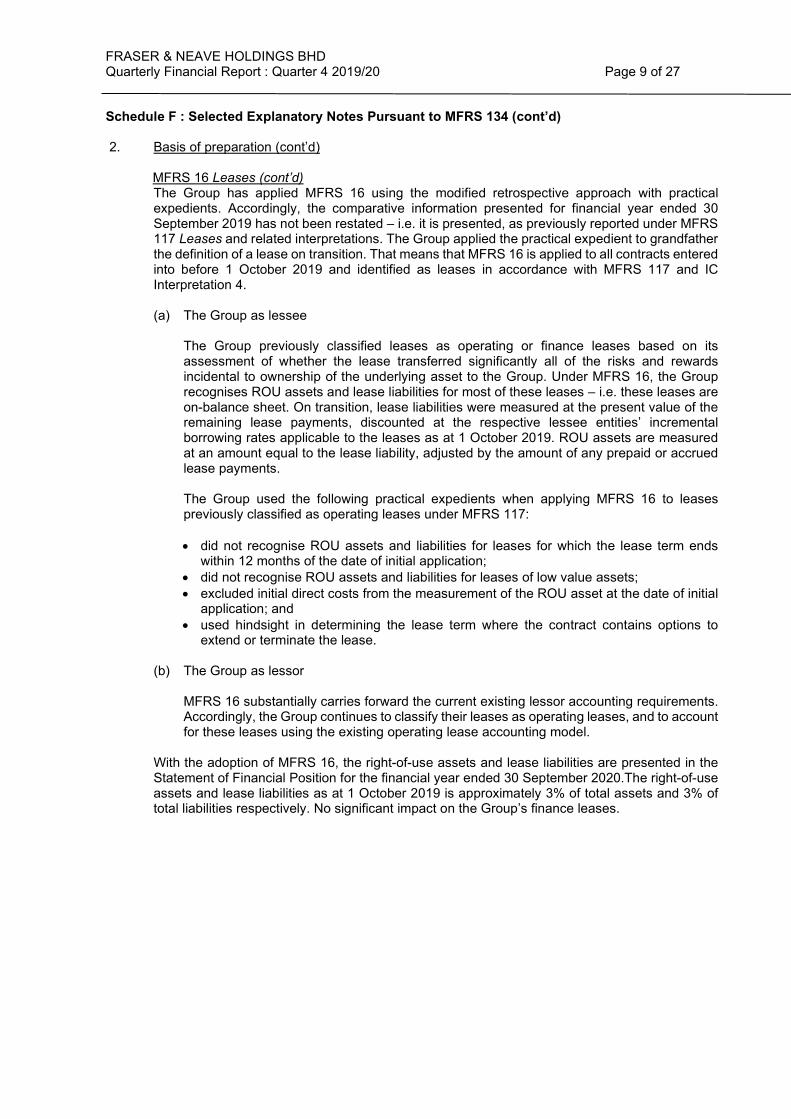
2. Basis of preparation (cont’d) MFRS 16 Leases (cont’d) The Group has applied MFRS 16 using the modified retrospective approach with practical expedients. Accordingly, the comparative information presented for financial year ended 30 September 2019 has not been restated – i.e. it is presented, as previously reported under MFRS 117 Leases and related interpretations. The Group applied the practical expedient to grandfather the definition of a lease on transition. That means that MFRS 16 is applied to all contracts entered into before 1 October 2019 and identified as leases in accordance with MFRS 117 and IC Interpretation 4. (a) The Group as lessee
The Group previously classified leases as operating or finance leases based on its assessment of whether the lease transferred significantly all of the risks and rewards incidental to ownership of the underlying asset to the Group. Under MFRS 16, the Group recognises ROU assets and lease liabilities for most of these leases – i.e. these leases are on-balance sheet. On transition, lease liabilities were measured at the present value of the remaining lease payments, discounted at the respective lessee entities’ incremental borrowing rates applicable to the leases as at 1 October 2019. ROU assets are measured at an amount equal to the lease liability, adjusted by the amount of any prepaid or accrued lease payments.
The Group used the following practical expedients when applying MFRS 16 to leases previously classified as operating leases under MFRS 117:
• did not recognise ROU assets and liabilities for leases for which the lease term ends
within 12 months of the date of initial application; • did not recognise ROU assets and liabilities for leases of low value assets; • excluded initial direct costs from the measurement of the ROU asset at the date of initial
application; and • used hindsight in determining the lease term where the contract contains options to
extend or terminate the lease. (b) The Group as lessor
MFRS 16 substantially carries forward the current existing lessor accounting requirements. Accordingly, the Group continues to classify their leases as operating leases, and to account for these leases using the existing operating lease accounting model.
With the adoption of MFRS 16, the right-of-use assets and lease liabilities are presented in the Statement of Financial Position for the financial year ended 30 September 2020.The right-of-use assets and lease liabilities as at 1 October 2019 is approximately 3% of total assets and 3% of total liabilities respectively. No significant impact on the Group’s finance leases.

FRASER & NEAVE HOLDINGS BHD Quarterly Financial Report : Quarter 4 2019/20 Page 10 of 27
Schedule F : Selected Explanatory Notes Pursuant to MFRS 134 (cont’d)
3. Standards issued but not yet effective The standards and interpretations that are issued but not yet effective up to the date of issuance of the Group’s and the Company’s financial statements are disclosed below. The Group and the Company intend to adopt these standards, if applicable, when they become effective. MFRSs, interpretations and amendments effective for annual periods beginning on or after 1 January 2020 • Amendments to MFRS 3, Business Combinations – Definition of a Business • Amendments to MFRS 101, Presentation of Financial Statements and MFRS 108, Accounting
Policies, Changes in Accounting Estimates and Errors – Definition of Material • Amendments to MFRS 9, Financial Instruments, MFRS 139, Financial Instruments:
Recognition and Measurement and MFRS 7, Financial Instruments: Disclosures – Interest Rate Benchmark Reform
MFRSs, interpretations and amendments effective for annual periods beginning on or after 1 June 2020 • Amendments to MFRS16, Leases – Covid-19-Related Rent Concessions
MFRSs, interpretations and amendments effective for annual periods beginning on or after 1 January 2022 • Amendments to MFRS 1, First-time Adoption of Malaysian Financial Reporting Standards
(Annual Improvements to MFRS Standards 2018−2020) • Amendments to MFRS 3, Business Combinations – Reference to the Conceptual Framework • Amendments to MFRS 9, Financial Instruments (Annual Improvements to MFRS Standards
2018−2020) • Amendments to Illustrative Examples accompanying MFRS 16, Leases (Annual Improvements
to MFRS Standards 2018−2020) • Amendments to MFRS 116, Property, Plant and Equipment − Proceeds before Intended Use • Amendments to MFRS 137, Provisions, Contingent Liabilities and Contingent Assets − Onerous
Contracts − Cost of Fulfilling a Contract • Amendments to MFRS 141, Agriculture (Annual Improvements to MFRS Standards
2018−2020) MFRSs, interpretations and amendments effective for annual periods beginning on or after 1 January 2023 • MFRS 17, Insurance Contracts • Amendments to MFRS 101, Presentation of Financial Statements – Classification of Liabilities
as Current or Non-current MFRSs, interpretations and amendments effective for annual periods beginning on or after a date yet to be confirmed • Amendments to MFRS 10, Consolidated Financial Statements and MFRS 128, Investments in
Associates and Joint Ventures – Sale or Contribution of Assets between an Investor and its Associate or Joint Venture
* not applicable
The Directors expect that the adoption of the above standards and interpretations will have no material impact on the financial statements in the period of initial application.
4. Auditors’ report The auditors’ report of the preceding annual financial statements of the Company and of the Group was not subject to any qualification.

FRASER & NEAVE HOLDINGS BHD Quarterly Financial Report : Quarter 4 2019/20 Page 11 of 27
Schedule F : Selected Explanatory Notes Pursuant to MFRS 134 (cont’d)
5. Comment on seasonality or cyclicality of operation The Group’s performance is normally not affected by seasonal or cyclical events on a year to year basis. However, on a quarter to quarter basis, the demand for certain products such as soft drinks and evaporated milk may be skewed towards major festivities and weather pattern.
6. Unusual items affecting assets, liabilities, equity, net income or cash flows
There were no unusual items affecting assets, liabilities, equity, net income or cash flows during the year ended 30 September 2020.
7. Significant estimates and changes in estimates
There were no significant estimates or changes in estimates that have had any material effect on the results of the current quarter.
8. Investment in an associate
RM’000 30/09/2020 30/09/2019
Quoted shares at cost 68,727 68,727 Share of post-acquisition reserves 73,119 65,295 Dividends received (50,585) (44,364)
91,261 89,658
Market value of investment in an associate for which there is published price quotation
107,626
120,690
The summarised financial information of the associate is as follows: RM’000 30/09/2020 30/09/2019
Total assets 303,092 300,143 Total liabilities (34,231) (37,177)
Individual 4th quarter Cumulative 4th quarter RM’000 30/09/2020 30/09/2019 30/09/2020 30/09/2019 Revenue 48,621 58,784 239,359 251,105 Profit 3,519 8,599 28,774 33,611

FRASER & NEAVE HOLDINGS BHD Quarterly Financial Report : Quarter 4 2019/20 Page 12 of 27
Schedule F : Selected Explanatory Notes Pursuant to MFRS 134 (cont’d)
9. Investment in a joint venture RM’000 30/09/2020 30/09/2019
Unquoted shares, at cost
127,820 500 Share of post-acquisition reserves (22,977) (22,694) 104,843 (22,194) Shareholder’s loan - 126,820 Interest on shareholder’s loan 38,294 38,279 143,137 142,905 Less: Unrealised profit (55,292) (55,292) 87,845 87,613
The summarised financial information of the joint venture is as follows: RM’000 30/09/2020 30/09/2019 Total assets 288,606 286,199 Total liabilities (76,939) (330,606) Individual 4th quarter Cumulative 4th quarter RM’000 30/09/2020 30/09/2019 30/09/2020 30/09/2019 Revenue - - - - Loss (135) (5,623) (566) (14,589)
10. Issuance or repayments of debt/equity securities There were no issuance, cancellation, repurchases, resale and repayments of debt and equity securities in the current quarter.
11. Dividends paid
The following dividends were declared and paid by the Company:
Date of Sen per Total RM’000 payment share amount Year ended 30 September 2020
Final 2019 ordinary 13 February 2020 33.0 121,037 Interim 2020 ordinary 12 June 2020 27.0 99,030 220,067 Year ended 30 September 2019 Final 2018 ordinary 15 February 2019 30.5 111,867 Interim 2019 ordinary 13 June 2019 27.0 99,031 210,898

FRASER & NEAVE HOLDINGS BHD Quarterly Financial Report : Quarter 4 2019/20 Page 13 of 27
Schedule F : Selected Explanatory Notes Pursuant to MFRS 134 (cont’d) 12. Segmental information
Segment results For management purposes, the Group’s operating businesses are organised according to products and services, namely Food and Beverages Malaysia (“F&B Malaysia”), Food and Beverages Thailand (“F&B Thailand”), Property and Others segments. Segment performance is evaluated based on operating profit. Inter-segment transactions and pricing arrangements, where applicable, are determined on a commercial basis. The results by segments for the current, preceding and last year same quarter are as follows:
Revenue
RM’000
F&B Malaysia
F&B Thailand
Property
Others
Total
4th quarter - 30/09/2020 Total revenue 495,147 466,364 973 22,367 984,851 Inter-segment - (8,407) (786) (21,961) (31,154) External 495,147 457,957 187 406 953,697
4th quarter - 30/09/2019 Total revenue 498,333 479,667 845 25,469 1,004,314 Inter-segment - (4,135) (558) (24,535) (29,228) External 498,333 475,532 287 934 975,086
3rd quarter - 30/06/2020 Total revenue 461,445 463,652 686 21,970 947,753 Inter-segment - (7,900) (562) (21,219) (29,681) External 461,445 455,752 124 751 918,072
Cumulative 4th quarter - 30/09/2020
Total revenue 2,040,749 1,970,889 3,345 88,860 4,103,843 Inter-segment - (27,133) (2,469) (85,734) (115,336) External 2,040,749 1,943,756 876 3,126 3,988,507 Cumulative 4th quarter -
30/09/2019
Total revenue 2,164,836 1,924,557 3,337 95,398 4,188,128 Inter-segment - (15,028) (2,284) (93,678) (110,990) External 2,164,836 1,909,529 1,053 1,720 4,077,138

FRASER & NEAVE HOLDINGS BHD Quarterly Financial Report : Quarter 4 2019/20 Page 14 of 27
Schedule F : Selected Explanatory Notes Pursuant to MFRS 134 (cont’d)
12. Segmental information (cont’d)
Segment results (cont’d)
Operating profit/(loss)
RM’000 F&B
Malaysia F&B
Thailand
Property
Others Adjustments and
eliminations
Total 4th quarter - 30/09/2020 Operating profit/(loss) 41,608 72,998 (2,433) (5,360) 1,037 107,850 Finance income 555 Finance costs (1,032) Share of results of an associate 957 Share of results of a joint venture (67) Profit before tax 108,263
4th quarter - 30/09/2019 Operating profit/(loss) 27,694 60,577 (157) 154 (1,728) 86,540 Finance income 4,020 Finance costs (635) Share of results of an associate 2,338 Share of results of a joint venture (2,812) Profit before tax 89,451 3rd quarter - 30/06/2020 Operating profit/(loss) 30,316 91,574 60 (1,733) (1,226) 118,991 Finance income 824 Finance costs (1,117) Share of results of an associate 1,394 Share of results of a joint venture (94) Profit before tax 119,998

FRASER & NEAVE HOLDINGS BHD Quarterly Financial Report : Quarter 4 2019/20 Page 15 of 27
Schedule F : Selected Explanatory Notes Pursuant to MFRS 134 (cont’d)
12. Segmental information (cont’d)
Segment results (cont’d)
Operating profit/(loss)
RM’000 F&B
Malaysia F&B
Thailand
Property
Others Adjustments and
eliminations
Total Cumulative 4th quarter - 30/09/2020 Operating profit/(loss) 144,932 381,017 (1,957) (5,464) (3,368) 515,160 Finance income 5,068 Finance costs (4,858) Share of results of an associate 7,824 Share of results of a joint venture (283) Profit before tax 522,911
Cumulative 4th quarter - 30/09/2019 Operating profit/(loss) 161,059 361,955 (142) (58) (2,370) 520,444 Finance income 15,223 Finance costs (4,555) Share of results of an associate 9,139 Share of results of a joint venture (7,295) Profit before tax 532,956

FRASER & NEAVE HOLDINGS BHD Quarterly Financial Report : Quarter 4 2019/20 Page 16 of 27
Schedule F : Selected Explanatory Notes Pursuant to MFRS 134 (cont’d) 12. Segmental information (cont’d)
Segment assets The total of segment assets is measured based on all assets excluding investments in associate and joint venture, deferred tax assets, current tax asset and cash and cash equivalents. RM’000 30/09/2020 30/09/2019 F&B Malaysia 1,879,085 1,792,899 F&B Thailand 837,480 822,398 Property 114,153 116,656 Others 10,452 11,101
2,841,170 2,743,054 Segment liabilities The total of segment liabilities is measured based on all liabilities excluding loans and borrowings, deferred tax liabilities and current tax liabilities. RM’000 30/09/2020 30/09/2019
F&B Malaysia 333,466 427,495 F&B Thailand 313,086 336,858 Property 843 810 Others 3,174 3,485
650,569 768,648
13. Significant events The Board of Directors of F&NHB had on 29 July 2020 announced that its direct wholly-owned subsidiary, Lion Share Management Limited entered into a conditional sale and purchase agreement (the “Sale and Purchase Agreement”) with F&N Global Marketing Pte Limited (“F&N Global Marketing”), a direct wholly-owned subsidiary of Fraser and Neave, Limited, in relation to the disposal of the “TEAPOT” trademark for a total cash consideration of RM83,175,000. Salient terms of the Sale and Purchase Agreement were set out in the said announcement.
Completion of the Sale and Purchase Agreement occurred on 30 September 2020. At completion, F&N Global Marketing entered into Trade Mark Licence Agreements with F&N Beverages Marketing Sdn Bhd, F&N Dairies (Thailand) Limited and F&N Dairies Distribution (Singapore) Pte Ltd. respectively, all of whom are wholly-owned subsidiaries of F&NHB (“F&NHB Subsidiaries”), granting the F&NHB Subsidiaries a non-exclusive, non-transferable licence to use the “TEAPOT” trademark for the sole purpose of preparing, packaging, manufacturing, marketing, distributing, and selling products under the “TEAPOT” trademark in the respective territories to which each of the F&NHB Subsidiaries have been licensed.
There were no other significant events that have not been reflected in the current quarter.
14. Subsequent events
There were no material events subsequent to the end of the quarter that have not been reflected in the current quarter.

FRASER & NEAVE HOLDINGS BHD Quarterly Financial Report : Quarter 4 2019/20 Page 17 of 27
Schedule F : Selected Explanatory Notes Pursuant to MFRS 134 (cont’d)
15. Changes in the composition of the Group
There were no changes in the composition of the Group during the quarter.
16. Contingent liabilities There were no contingent liabilities of a material nature since the last annual reporting date.
17. Contingent assets
There were no contingent assets of a material nature since the last annual reporting date.
18. Fair value hierarchy
The Group held foreign currency forward contracts carried at fair value based on Level 2: significant observable inputs for identical assets or liabilities as follows:
Fair value RM’000 30/09/2020 30/09/2019 Derivative financial assets 4 6 Derivative financial liabilities 367 136
There was no transfer between any levels of the fair value hierarchy and there was no change in the purpose of any financial asset that subsequently resulted in a different classification of that asset during the quarter. The Group held investment properties amounting to RM47,569,000 (2019: RM48,775,000) carried at Level 3: significant unobservable inputs.
19. Capital commitments Capital expenditure commitments The outstanding capital commitments are as follows:
RM’000 30/09/2020 30/09/2019 Property, plant and equipment Contracted but not provided for 109,441 206,831 Authorised but not contracted for 92,687 230,691 202,128 437,522

FRASER & NEAVE HOLDINGS BHD Quarterly Financial Report : Quarter 4 2019/20 Page 18 of 27
Schedule F : Selected Explanatory Notes Pursuant to MFRS 134 (cont’d) 20. Related party disclosures
Significant related party transactions Related party transactions had been entered into in the ordinary course of business on normal commercial terms. The following are significant related party transactions: Individual 4th quarter Cumulative 4th quarter
RM’000 30/09/2020 30/09/2019 30/09/2020 30/09/2019
Fraser and Neave, Limited (“F&N Limited”) Group
Sales 66,845 72,110 269,561 266,876 Purchases (28,325) (48,892) (169,306) (184,210) Royalties paid (11,188) (12,034) (49,477) (54,119) Internal audit fees paid - (269) - (1,275) Receipt of corporate service fees 442 900 3,211 1,581 Proceeds from disposal of intangible
asset
83,175
- 83,175
-
Vacaron Company Sdn Bhd Finance income - 1,419 15 5,814
Cocoaland Holdings Berhad Group Dividend income - - 6,221 3,733
Thai Beverage Public Company Limited Group
Sales 1,233 410 2,553 1,747 Purchases (683) (1,084) (6,019) (2,845) Marketing expenses (4,382) (5,630) (20,887) (18,223) Corporate service fees paid (581) (619) (2,274) (1,999) Purchase of plant and machinery - - (4,023) - Other income/(expenses) 193 (78) 1,967 (483)
Berli Jucker Public Company Limited
Group
Sales 16,241 21,212 69,410 68,099 Purchases (356) (2,790) (18,116) (20,237) Transportation expenses (2,478) (2,783) (10,599) (10,254)
Other related parties of TCC Group Purchases (14,677) (10,750) (57,045) (42,925) Management fees paid - (171) (307) (2,026) Insurance premium paid (781) (778) (3,192) (3,093)
Permodalan Nasional Berhad (“PNB”) Group *
Sales 7,533 8,756 50,799 59,158 Purchases (19,611) (16,578) (56,825) (44,246) Rental of equipment paid (651) (757) (2,743) (3,012)
Compensation Compensation of key management
personnel of the Group
(3,293)
(3,690) (14,602)
(14,319)
Directors’ fees and remuneration (376) (368) (1,345) (1,322)
* PNB is deemed a related party to F&NHB by virtue of PNB holding 27,576,000 shares as of 30 September 2020 through Amanahraya Trustees Berhad, representing 7.52% equity interest in F&NHB.
FRASER & NEAVE HOLDINGS BHD Quarterly Financial Report : Quarter 4 2019/20 Page 19 of 27
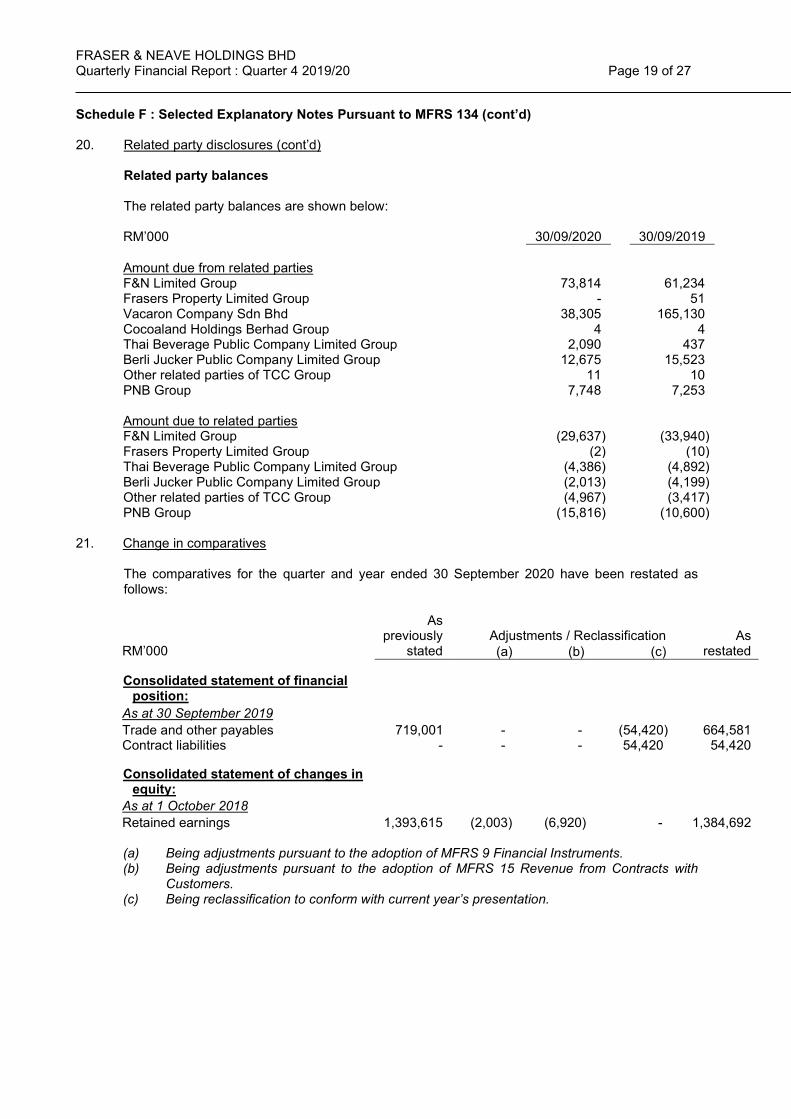
Schedule F : Selected Explanatory Notes Pursuant to MFRS 134 (cont’d) 20. Related party disclosures (cont’d)
Related party balances The related party balances are shown below: RM’000 30/09/2020 30/09/2019
Amount due from related parties F&N Limited Group 73,814 61,234 Frasers Property Limited Group - 51 Vacaron Company Sdn Bhd 38,305 165,130 Cocoaland Holdings Berhad Group 4 4 Thai Beverage Public Company Limited Group 2,090 437 Berli Jucker Public Company Limited Group 12,675 15,523 Other related parties of TCC Group 11 10 PNB Group 7,748 7,253
Amount due to related parties F&N Limited Group (29,637) (33,940) Frasers Property Limited Group (2) (10) Thai Beverage Public Company Limited Group (4,386) (4,892) Berli Jucker Public Company Limited Group (2,013) (4,199) Other related parties of TCC Group (4,967) (3,417) PNB Group (15,816) (10,600)
21. Change in comparatives
The comparatives for the quarter and year ended 30 September 2020 have been restated as follows:
RM’000
As previously
stated
As
restated Adjustments / Reclassification (a) (b) (c)
Consolidated statement of financial
position:
As at 30 September 2019 Trade and other payables 719,001 - - (54,420) 664,581 Contract liabilities - - - 54,420 54,420
Consolidated statement of changes in
equity:
As at 1 October 2018 Retained earnings 1,393,615
(2,003) (6,920) - 1,384,692
(a) Being adjustments pursuant to the adoption of MFRS 9 Financial Instruments. (b) Being adjustments pursuant to the adoption of MFRS 15 Revenue from Contracts with
Customers. (c) Being reclassification to conform with current year’s presentation.

FRASER & NEAVE HOLDINGS BHD Quarterly Financial Report : Quarter 4 2019/20 Page 20 of 27
Schedule G : Additional Disclosures in Compliance with Main Market Listing Requirements 1. Operations review
Current quarter ended 30 September 2020 vs corresponding quarter ended 30 September 2019 Amidst the prolonged COVID-19 containment measures and subdued outdoor activities, the Group managed to deliver a commendable performance for the current quarter on the back of robust exports and stabilising domestic sales, with a moderate contraction in Group revenue of 2.2% to RM953.7 million. Despite higher commodity cost, Group profit before tax grew 21.0% to RM108.3 million due to prudent cost controls on overheads and lower advertising and promotions spending. Excluding the gain on disposal of “TEAPOT” trademark amounting to RM7.8 million and COVID-19 related expenses recognised in the current quarter, and other one-off/non-operating items in both periods, profit before tax improved by 15.1%. • F&B Malaysia
F&B Malaysia recorded RM495.1 million in revenue, a marginal 0.6% decline from 2019. The recovery in sales performance is led by the export markets, where export revenue grew by 2.4%. Recovery was also observed in the domestic Malaysia market, with increased commercial activities and trade executions during the Recovery Movement Control Order period contributing to a smaller than expected, marginal decline against 2019. Operating profit improved by 50.2% mainly due to the gain on disposal of “TEAPOT” trademark in the current quarter of RM7.8 million. Excluding the effects of one-off/non-operating items in both periods, operating profit grew by 8.3% due to reduction in the advertising and promotions expenditure and cost savings.
• F&B Thailand
F&B Thailand recorded RM458.0 million in revenue, a slight contraction of 3.7% from 2019 (-1.7% in Thai Baht terms) due to higher trade stocks in the domestic Thai market carried forward from the third quarter this year, mitigated by growth in Indochina and export markets. Operating profit for F&B Thailand improved 20.5% (26.7% in Thai Baht terms) to RM73.0 million due to lower advertising and marketing spending partially offset by the weaker Thai Baht.

FRASER & NEAVE HOLDINGS BHD Quarterly Financial Report : Quarter 4 2019/20 Page 21 of 27
Schedule G : Additional Disclosures in Compliance with Main Market Listing Requirements (cont’d)
1. Operations review (cont’d) Cumulative financial year vs corresponding last financial year
The Group concluded its financial year ended 30 September 2020 with a resilient performance sustained by strong performance in the 1st quarter and recovery in the 4th quarter; and robust exports. The Group recorded revenue and profit before tax of RM3,988.5 (-2.2%) and RM522.9 million (-1.9%) respectively for current financial year despite COVID-19 pandemic and commodity price pressures. • F&B Malaysia
In Malaysia, a strong recovery of both the domestic and export markets in the final quarter and sustained demand for dairy products, encouraged by in-home consumption resulted in a moderate full year contraction in F&B Malaysia’s performance. F&B Malaysia’s revenue declined by 5.7% to RM2,040.7 million, while its operating profit decreased by 10.0% to RM144.9 million during the period under review. F&B Malaysia’s domestic team continued its efforts in product innovation with an emphasis on offering healthier choices and better value that resonated with our consumers. During the year, F&B Malaysia launched Sunkist Pure Juice Drink and F&N Ready-to-Drink Teh Tarik Ori, and 3 new beverages with zero sugar, namely 100PLUS Zero, F&N Ice Mountain Sparkling Water and OYOSHI Gold No Sugar Premium Japanese Green Tea. F&B Malaysia also successfully launched the F&N Teh Tarik Ori drink during a Zoom virtual conference with consumers in April this year during the Movement Control Order. This pandemic provided an opportunity to fast track our e-commerce strategies with the launch of our e-commerce platform, F&N Life to help our products reach our consumers during the Movement Control Order; and listing of our products in various e-commerce platforms. Against a challenging backdrop, exports from Malaysia achieved close to 10% growth driven by robust sales to Middle East and Africa and ASEAN markets with over RM100 million revenue contributed by Halal markets. Fraser and Neave MENA DWC-LLC, a wholly-owned subsidiary was set up in Dubai this year to expedite the Group’s penetration and development of opportunities in the Middle East and North Africa regions. F&B Malaysia operating profit declined by 10.0% to RM144.9 million mainly due to lower revenue and higher input costs. Excluding the gain on disposal of “TEAPOT” trademark (RM7.8 million), COVID-19 related expenses and other one-off/non-operating items in both years, F&B Malaysia operating profit declined by 16.8%.
• F&B Thailand
F&B Thailand achieved revenue of RM1,943.8 million for the period, with 1.8% (-1.4% in Thai Baht terms) higher revenue aided by favourable RM/THB forex translation. Strong operational execution, successful tactical strategies and recovery in Indochina and export markets, helped to moderate the marginal contraction in revenue for the domestic Thai market, especially in the general trade and the food service channels due to the emergency decree.
F&B Thailand continued providing support to its hawker customers in both the domestic Thai market and in Cambodia and Laos; building brand loyalty and visibility including through innovative digital advertising; and introduced new variants and healthier options namely CARNATION Plus Sweetened Condensed Milk with 0% Fat and 25% Reduced Sugar; and F&N Magnolia Milkies Milk Tablet to meet the changing tastes of discerning consumers in Thailand. Aided by favourable RM/THB forex translation, F&B Thailand operating profit improved 5.3% (+2.0% in Thai Baht terms) to RM381.0 million due to tightened cost control on overheads and advertising and marketing spend.

FRASER & NEAVE HOLDINGS BHD Quarterly Financial Report : Quarter 4 2019/20 Page 22 of 27
Schedule G : Additional Disclosures in Compliance with Main Market Listing Requirements (cont’d) 2. Comment on material change in Group profit before tax for the quarter ended 30 September 2020
vs preceding 3rd quarter ended 30 June 2020 Current quarter Group revenue grew to RM953.7 million (3rd quarter: RM918.1 million) amidst signs of recovery in the local and export markets as businesses and economic activities stabilised to a ‘new normal’. F&B Malaysia revenue grew 7.3% to RM495.1 million (3rd quarter: RM461.4 million). F&B Thailand revenue growth is flat at 0.5% at RM458.0 million (3rd quarter: RM455.8 million) although revenue in THB terms grew by 3.3% due to weaker RM/Thai Baht translation. Group profit before tax correspondingly declined by 9.8% to RM108.3 million (3rd quarter: RM120.0 million) from higher input and packaging costs and weaker RM/Thai Baht translation. Excluding the gain on disposal of “TEAPOT” trademark and COVID-19 related expenses recognised in the current quarter and other one-off/non-operating items in both periods, profit before tax is lower by 14.1%.
3. Prospects The Group remains cautious amid the COVID-19 pandemic as the situation both locally and globally remain fluid and uncertain. While cognisant of our operating environment, this pandemic provides us an opportunity for reset and to ‘reimagine’ our business strategies to fuel growth and innovation. We will continue to prioritise our customers and consumers’ satisfaction, focus on process improvements and digitalisation and relentlessly pursue opportunities to build a stronger and more sustainable business for the future. We will adopt innovative strategies to boost customer experience and e-commerce engagements through our own F&N Life platform as well as through working closer with e-commerce partners in both Malaysia, Thailand and overseas markets. We will continue to safeguard the wellbeing of our employees, trade partners and community while we maintain business as efficiently as possible under the current circumstances. The pandemic has delayed some of our longer-term strategic initiatives, but it has also given us more time to reassess these initiatives for the ‘new normal’. Our continued investments in capex and in our brands will help us strengthen our businesses. We believe our strong fundamentals will see us through these challenging times and we can leverage on our strong balance sheet, bank facilities and low funding cost to support our operations and capitalise on opportunities that may arise.

FRASER & NEAVE HOLDINGS BHD Quarterly Financial Report : Quarter 4 2019/20 Page 23 of 27
Schedule G : Additional Disclosures in Compliance with Main Market Listing Requirements (cont’d) 4. Profit forecast or profit guarantee
The Group did not issue any profit forecast or profit guarantee for the current quarter in a public document.
5. Tax expense
The details of the tax expense are as follows:
Individual 4th quarter Cumulative 4th quarter RM’000 30/09/2020 30/09/2019 30/09/2020 30/09/2019 Current income tax 15,678 18,032 97,621 107,954 Deferred tax – origination and reversal of
temporary differences
6,280 3,616
14,535 14,946
Under/(Over) provision in respect of previous years
- Income tax 495 523 662 523 - Deferred tax 53 (737) (31) (691) 22,506 21,434 112,787 122,732
A reconciliation of income tax expense applicable to profit before tax at the statutory income tax rate to income tax expense at the effective income tax rate of the Group is as follows:
Individual 4th quarter Cumulative 4th quarter
RM’000 30/09/2020 30/09/2019 30/09/2020 30/09/2019
Profit before tax 108,263 89,451 522,911 532,956
Tax at Malaysian statutory tax rate of 24% (2019: 24%)
25,983
21,468 125,499
127,909 Effect of tax rates in foreign jurisdictions (5,293) (2,817) (19,290) (16,577) Tax exempt income (5,823) 3 (22,732) (53) Non-deductible expenses 6,937 2,628 10,114 4,607 Deferred tax assets recognised - (34) - (625) Under/(Over) provision of income and
deferred tax in prior years
548 (214)
631 (168)
Foreign withholding tax 368 286 20,375 8,081 Share of results of an associate (230) (561) (1,878) (2,193) Share of results of a joint venture 16 675 68 1,751 Total income tax expense 22,506 21,434 112,787 122,732
Effective income tax rate 20.8% 24.0% 21.6% 23.0%

FRASER & NEAVE HOLDINGS BHD Quarterly Financial Report : Quarter 4 2019/20 Page 24 of 27
Schedule G : Additional Disclosures in Compliance with Main Market Listing Requirements (cont’d)
6. Status of corporate proposals There were no outstanding corporate proposals or announcements made in the current quarter.
7. Loans and borrowings The details of the Group’s loans and borrowings are as follows: RM’000 Currency 30/09/2020 30/09/2019 Non-current (unsecured) Term loan THB - 95,909 Current (unsecured) Term loan THB 91,868 27,402 91,868 123,311
Commercial Paper (“CP”)/Medium Term Note (“MTN”) A subsidiary of the Company, F&N Capital Sdn Bhd ("the Issuer"), is able to issue up to RM750,000,000 in nominal value under each of the CP and the MTN programmes respectively, which are unconditionally and irrevocably guaranteed by the Company. The CP has a tenure of seven (7) years from the first issue date of the CP under the CP Programme whilst the MTN has a tenure of fifteen (15) years from the first issue date under the MTN Programme. As at 30 September 2020, the unutilised CP/MTN facility available for use amounted to RM1,500,000,000 (2019: RM1,500,000,000). The CP programme of RM750 million has expired on 14 October 2020 whilst the tenure of the MTN Programme is up to 28 September 2028. Term loan On 6 June 2018, a subsidiary of the Company, F&N Dairies (Thailand) Limited was granted a term loan of THB 1,000,000,000 with the tenure of three (3) years from the issued date and interest rate of 2.44% per annum. As at 30 September 2020, the outstanding balance for the term loan amounted to Thai Baht 700,000,000 (2019: Thai Baht 900,000,000).
8. Material litigation There is no material litigation to be disclosed in these interim financial statements.

FRASER & NEAVE HOLDINGS BHD Quarterly Financial Report : Quarter 4 2019/20 Page 25 of 27
Schedule G : Additional Disclosures in Compliance with Main Market Listing Requirements (cont’d)
9. Proposed dividend The Directors recommend a final single tier dividend of 33.0 sen per share (2019: 33.0 sen per share) for approval by shareholders at the forthcoming Annual General Meeting of the Company. If approved by shareholders, the total dividends for the year would amount to 60.0 sen per share (2019: 60.0 sen per share).
10. Earnings per ordinary share (EPS) (a) The calculation of basic earnings per ordinary share at 30 September 2020 was based on the
profit attributable to ordinary shareholders and a weighted average number of ordinary shared outstanding, calculated as follows:
Individual 4th quarter Cumulative 4th quarter 30/09/2020 30/09/2019 30/09/2020 30/09/2019
Profit for the year attributed to owners of the Company (RM’000)
85,993
68,027 410,384
410,260
Weighted average number of ordinary shares net of treasury shares and shares held by SGP Trust (‘000)
366,531
366,528
366,653
366,735
Basic earnings per ordinary share (sen)
23.5
18.6 111.9
111.9
(b) The calculation of diluted earnings per ordinary share at 30 September 2020 was based on profit attributable to ordinary shareholders and the weighted average number of ordinary shares outstanding after adjustment for the effects of all dilutive potential ordinary shares, calculated as follows:
Individual 4th quarter Cumulative 4th quarter 30/09/2020 30/09/2019 30/09/2020 30/09/2019
Profit for the year attributed to
owners of the Company (RM’000)
85,993 68,027
410,384 410,260
Weighted average number of
ordinary shares net of treasury shares and shares held by SGP Trust (‘000)
366,531
366,528
366,653
366,735 Adjustments pursuant to the SGP (‘000)
900
840 900
840 Adjusted weighted average number
of ordinary shares net of treasury shares and shares held by SGP Trust (‘000)
367,431
367,368
367,553
367,575 Diluted earnings per ordinary share
(sen)
23.4 18.5
111.7 111.6
FRASER & NEAVE HOLDINGS BHD Quarterly Financial Report : Quarter 4 2019/20 Page 26 of 27
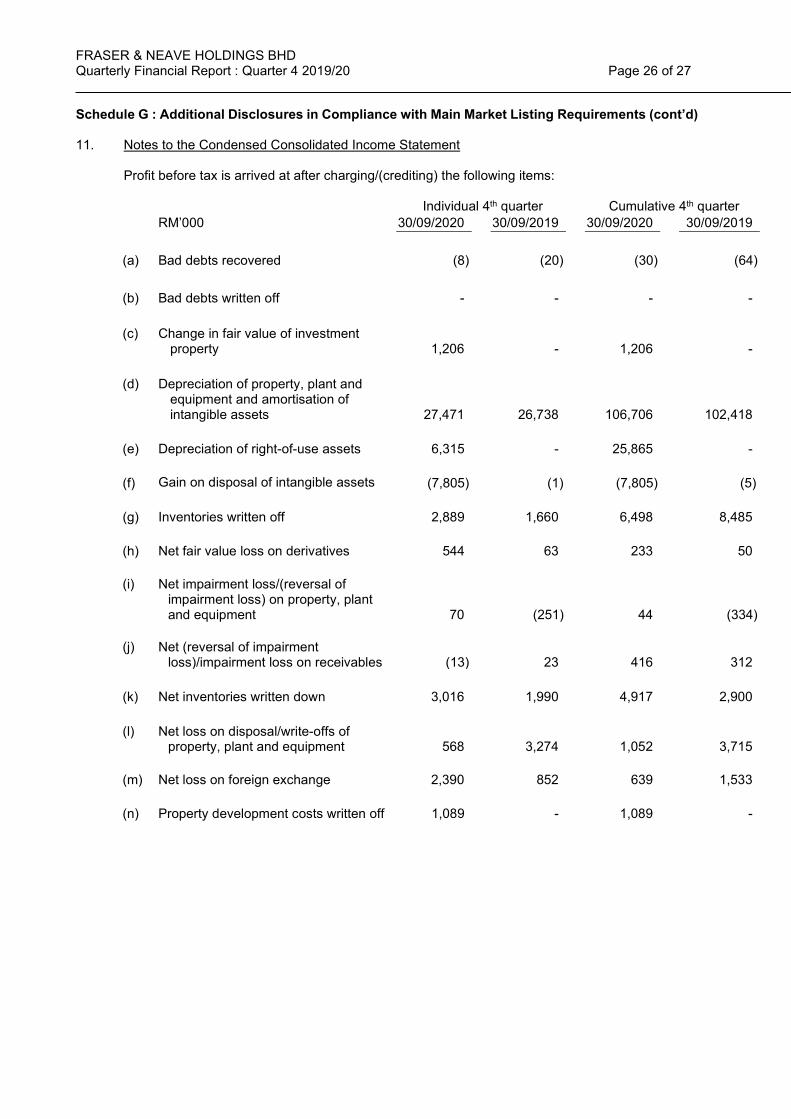
Schedule G : Additional Disclosures in Compliance with Main Market Listing Requirements (cont’d) 11. Notes to the Condensed Consolidated Income Statement
Profit before tax is arrived at after charging/(crediting) the following items: Individual 4th quarter Cumulative 4th quarter RM’000 30/09/2020 30/09/2019 30/09/2020 30/09/2019
(a) Bad debts recovered (8) (20) (30) (64) (b) Bad debts written off - - - - (c)
Change in fair value of investment property
1,206
- 1,206
- (d)
Depreciation of property, plant and equipment and amortisation of intangible assets
27,471
26,738
106,706
102,418
(e) Depreciation of right-of-use assets 6,315 - 25,865 - (f) Gain on disposal of intangible assets
(7,805) (1) (7,805) (5)
(g) Inventories written off 2,889 1,660 6,498 8,485
(h) Net fair value loss on derivatives 544 63 233 50
(i)
Net impairment loss/(reversal of impairment loss) on property, plant and equipment
70
(251)
44
(334) (j)
Net (reversal of impairment loss)/impairment loss on receivables
(13)
23 416
312
(k) Net inventories written down 3,016 1,990 4,917 2,900 (l)
Net loss on disposal/write-offs of property, plant and equipment
568
3,274 1,052
3,715 (m) Net loss on foreign exchange 2,390 852 639 1,533 (n) Property development costs written off 1,089 - 1,089 -

FRASER & NEAVE HOLDINGS BHD Quarterly Financial Report : Quarter 4 2019/20 Page 27 of 27
Schedule G : Additional Disclosures in Compliance with Main Market Listing Requirements (cont’d) 12. Outstanding derivatives
(a) Outstanding derivatives consist of foreign exchange contracts which are measured at fair
value together with their corresponding notional value amounts as follows:
30/09/2020 30/09/2019
Notional value Fair
value Notional value Fair
value RM’000 RM’000
Forward foreign exchange contracts (less than 1 year)
USD ('000) 4,566 (301) 2,400 (49) AUD ('000) 1,706 (62) 2,042 (81) (363) (130)
There is no significant change for the financial derivatives in respect of the following since the year ended 30 September 2020:
(i) The credit risk, market risk and liquidity risk associated with these financial derivatives;
(ii) The cash requirements of the financial derivatives;
(iii) The policy in place for mitigating or controlling the risks associated with these financial
derivatives; and
(iv) The related accounting policies. (b) Disclosure of gains/loss arising from fair value changes of derivative financial instruments
During the year ended 30 September 2020, the Group recognised a total net loss of RM233,000 (2019: RM50,000) in the consolidated income statement arising from the fair value changes on the foreign exchange contracts which are marked-to-market as at 30 September 2020.