Seismic structure of oceanic crust in the western North Atlantic
25
JOURNAL OF GEOPHYSICAL RESEARCH, VOL. 98, NO. B8, PAGES 13,879-13,903, AUGUST 10, 1993 Seismic Structure of Oceanic Crust in the Western North Atlantic ELLEN MORRIS, 1,2 ROBERT S.DETRICK, 3TIMOTHY A. MINSHULL, 4JOHN C. MUTYER, 5 ROBERT S.WHITE, 4WUSI SU, 5AND PETER BUHL 5 We examine the seismic structure of Cretaceous-aged ocean crust northof the Blake Spur fracturezonein the western North Arianticby using a combination of multichannel seismic and wide-angle reflection/refraction data. Although the oceaniccrustin this area is characterized by a relatively uniform thickness and seismic velocity structure, it displays large variations in crustalreflectivity on both ridge-normaland ridge-parallel profiles. The uppercrustis highly reflectiveand contains both subhorizontal (or shallowdipping)events and moresteeply dipping reflectors. Subhorizontal reflectors are typicallypresent between 1.5 and 2 km depth and are, in somecases, laterally continuous for distances of 15 to 20 km. Generally, these events do not correlate with the depthof the seismic layer 2/layer 3 boundary determined from refraction data, and their origin is still poorly understood. The steeply dipping events are generally confined to the upper2.5 km of the crust. We interpret these reflectors as the subsurface expression of ridge-parallel extensional faultscommonly mapped at mid-ocean ridges. The lower crustin this areaexhibitsalternating regions of high and low reflectivity. The highlyreflective zones are made up of packages of linearor concave-upward dipping reflectors thatflattenout in a diffusezoneof high reflectivity nearthe base of the crust. Some of these dipping reflectors appear to cut through the whole crustal section, although mostfade out in the acoustically transparent midcrust. On ridge- normal profiles the majority of theseeventsdip to the east,toward the paleo-spreading center, whereason ridge-parallel profiles the events typically dip south, toward the Blake Spurfracture zone. The base of the crust is generally not associated with a strong, discrete Moho reflection but is a comparatively indistinct boundary usuallyassociated with a 1- to 2-km-thickbandof diffusehigh reflectivity. We interpret the lower crustal and whole crustal dippingevents as the subsurface expression of major fault systems that have ruptured the entire crustal section downto depths of 8-10 kin. With the available data we cannot unambiguously determine the geometrical relationship betweenthe dipping lower crustal reflectorson the ridge-normaland ridge-parallel profiles. We may be imaginga singlemajor detachment surface that dipsbothtowardthe ridge axis and away from accommodation zoneslinking major boundaryfaults. Alternatively, these events may represent two different classes of fault systems that form during different stages of the emplacement and aging of oceanic lithosphere. INTRODUC'I•ON The seismic structure of oceanic crust is usually described by compressional wave velocities that vary continuously with depth [Spudichand Orcutt, 1980a; White, 1984; Purdy and Ewing, 1986]. In thesemodels, the upper crust (seismiclayer 2) is typically characterized by steepvelocity gradients (1-2 s -1)with P wave velocities increasing from <3-4km/s at the seafloor to >6 km/s at 1-2 km depth. The lower crust(seismic layer 3) is usually interpreted as having a more homogeneous structure with small vertical velocity gradients (<0.1-0.2 s -1) and a nearly uniform P wave velocity (6.6-6.8 km/s). Multichannel reflectiondata, which have been usedto image the oceanic crust since the mid-1970s, provide an important independent constraint on the seismic structure of oceanic crust. Early multichannel reflection lines obtained over the oceanic crust imaged a strong, relatively continuous event about 2 s two-way travel time beneath basement that was interpreted as the Moho [e.g., Grow and Markl, 1977; Stoffa et al., 1980] but mapped relatively few intracrustalreflectors. I Graduate School of Oceanography, University of Rhode Island, Kin4gston. •Now at National Renewable Energy Laboratory, Washington, D.C. 3Woods Hole Oceanographic Institution, Woods Hole, Massachusetts. 4Bullard Laboratories, University of Cambridge, Cambridge, Enidland. "Lamont-Doherty Earth Observatory, Palisades, New York. Copyright 1993by the American Geophysical Union. Paper number 93JB00557. 0148-0227/93/93JB-00557505.00 The absence of internal crustal reflectivity on these profiles was consistent with the prevailing view at that time that seismic velocity varies continuously with depth in oceanic crust and large impedance contrastsare not present, except possibly at the crust-mantle boundary. More recent multichannel studieshave revealed a variety of prominent intracrustalreflectors in both the upper and lower oceanic crust. The North Atlantic Transect Experiment (NAT), a two-ship multichannel reflection/refraction experiment carriedout in the western North Atlantic in 1981 [NAT Study Group, 1985], showed that Cretaceous-aged crust contained relatively continuous Moho reflections and a variety of intracrustal reflectors including subhorizontal and dipping events in both the upper and lower crust [NAT Study Group, 1985; Mutter et al., 1985; McCarthy et al., 1988]. Similar intracrustal events have been reported from other areas including the southern Angola Basin [Musgrove and Austin, 1983], the easternGulf of Guinea [RosendaM et al., 1991], in the eastern Atlantic [Banda et al., 1992], on the flank of the Galapagosspreading center [Collins et al., 1989], and in the CuvierBasinoff Northwest Australia[Hopperet al., 1992]. In contrast, thousands of kilometers of reflection data near the fast spreadingEast Pacific Rise [Detrick et al., 1987, 1993] and from older partsof the Pacific [Stoffaet al., 1980] reveal a largely acoustically transparent crust with only a strong, quasi•-continuous Moho reflection about 2 s two-way time below basement. The origin of these intracrustal reflectors has been the subject of much debate,with interpretations includingprimary magmatic layering, lithologic changes, faults, and alteration boundaries. To understand better the nature and origin of these events and the influence of small-offset fracture zones on oceanic crustal structure, a combined multichannel seismic reflection and refraction experiment was carried out in November-December 1987 by groupsfrom the University of 13,879
-
Upload
independent -
Category
Documents
-
view
1 -
download
0
Transcript of Seismic structure of oceanic crust in the western North Atlantic

JOURNAL OF GEOPHYSICAL RESEARCH, VOL. 98, NO. B8, PAGES 13,879-13,903, AUGUST 10, 1993
Seismic Structure of Oceanic Crust in the Western North Atlantic
ELLEN MORRIS, 1,2 ROBERT S. DETRICK, 3 TIMOTHY A. MINSHULL, 4 JOHN C. MUTYER, 5 ROBERT S. WHITE, 4 WUSI SU, 5 AND PETER BUHL 5
We examine the seismic structure of Cretaceous-aged ocean crust north of the Blake Spur fracture zone in the western North Ariantic by using a combination of multichannel seismic and wide-angle reflection/refraction data. Although the oceanic crust in this area is characterized by a relatively uniform thickness and seismic velocity structure, it displays large variations in crustal reflectivity on both ridge-normal and ridge-parallel profiles. The upper crust is highly reflective and contains both subhorizontal (or shallow dipping) events and more steeply dipping reflectors. Subhorizontal reflectors are typically present between 1.5 and 2 km depth and are, in some cases, laterally continuous for distances of 15 to 20 km. Generally, these events do not correlate with the depth of the seismic layer 2/layer 3 boundary determined from refraction data, and their origin is still poorly understood. The steeply dipping events are generally confined to the upper 2.5 km of the crust. We interpret these reflectors as the subsurface expression of ridge-parallel extensional faults commonly mapped at mid-ocean ridges. The lower crust in this area exhibits alternating regions of high and low reflectivity. The highly reflective zones are made up of packages of linear or concave-upward dipping reflectors that flatten out in a diffuse zone of high reflectivity near the base of the crust. Some of these dipping reflectors appear to cut through the whole crustal section, although most fade out in the acoustically transparent midcrust. On ridge- normal profiles the majority of these events dip to the east, toward the paleo-spreading center, whereas on ridge-parallel profiles the events typically dip south, toward the Blake Spur fracture zone. The base of the crust is generally not associated with a strong, discrete Moho reflection but is a comparatively indistinct boundary usually associated with a 1- to 2-km-thick band of diffuse high reflectivity. We interpret the lower crustal and whole crustal dipping events as the subsurface expression of major fault systems that have ruptured the entire crustal section down to depths of 8-10 kin. With the available data we cannot unambiguously determine the geometrical relationship between the dipping lower crustal reflectors on the ridge-normal and ridge-parallel profiles. We may be imaging a single major detachment surface that dips both toward the ridge axis and away from accommodation zones linking major boundary faults. Alternatively, these events may represent two different classes of fault systems that form during different stages of the emplacement and aging of oceanic lithosphere.
INTRODUC'I•ON
The seismic structure of oceanic crust is usually described by compressional wave velocities that vary continuously with depth [Spudich and Orcutt, 1980a; White, 1984; Purdy and Ewing, 1986]. In these models, the upper crust (seismic layer 2) is typically characterized by steep velocity gradients (1-2 s -1) with P wave velocities increasing from <3-4 km/s at the sea floor to >6 km/s at 1-2 km depth. The lower crust (seismic layer 3) is usually interpreted as having a more homogeneous structure with small vertical velocity gradients (<0.1-0.2 s -1) and a nearly uniform P wave velocity (6.6-6.8 km/s). Multichannel reflection data, which have been used to image the oceanic crust since the mid-1970s, provide an important independent constraint on the seismic structure of oceanic crust. Early multichannel reflection lines obtained over the oceanic crust imaged a strong, relatively continuous event about 2 s two-way travel time beneath basement that was interpreted as the Moho [e.g., Grow and Markl, 1977; Stoffa et al., 1980] but mapped relatively few intracrustal reflectors.
I Graduate School of Oceanography, University of Rhode Island, Kin4gston.
•Now at National Renewable Energy Laboratory, Washington, D.C. 3Woods Hole Oceanographic Institution, Woods Hole,
Massachusetts.
4Bullard Laboratories, University of Cambridge, Cambridge, Enidland.
"Lamont-Doherty Earth Observatory, Palisades, New York.
Copyright 1993 by the American Geophysical Union.
Paper number 93JB00557. 0148-0227/93/93JB-00557505.00
The absence of internal crustal reflectivity on these profiles was consistent with the prevailing view at that time that seismic velocity varies continuously with depth in oceanic crust and large impedance contrasts are not present, except possibly at the crust-mantle boundary.
More recent multichannel studies have revealed a variety of prominent intracrustal reflectors in both the upper and lower oceanic crust. The North Atlantic Transect Experiment (NAT), a two-ship multichannel reflection/refraction experiment carried out in the western North Atlantic in 1981 [NAT Study Group, 1985], showed that Cretaceous-aged crust contained relatively continuous Moho reflections and a variety of intracrustal reflectors including subhorizontal and dipping events in both the upper and lower crust [NAT Study Group, 1985; Mutter et al., 1985; McCarthy et al., 1988]. Similar intracrustal events have been reported from other areas including the southern Angola Basin [Musgrove and Austin, 1983], the eastern Gulf of Guinea [RosendaM et al., 1991], in the eastern Atlantic [Banda et al., 1992], on the flank of the Galapagos spreading center [Collins et al., 1989], and in the Cuvier Basin off Northwest Australia [Hopper et al., 1992]. In contrast, thousands of kilometers of reflection data near the
fast spreading East Pacific Rise [Detrick et al., 1987, 1993] and from older parts of the Pacific [Stoffa et al., 1980] reveal a largely acoustically transparent crust with only a strong, quasi•-continuous Moho reflection about 2 s two-way time below basement.
The origin of these intracrustal reflectors has been the subject of much debate, with interpretations including primary magmatic layering, lithologic changes, faults, and alteration boundaries. To understand better the nature and origin of these events and the influence of small-offset fracture zones on
oceanic crustal structure, a combined multichannel seismic
reflection and refraction experiment was carried out in November-December 1987 by groups from the University of
13,879

13,880 MORRZS ET AL.: SEISMIC STRUC"I'URE IN WESTERN NORTH ATLANTIC
Rhode Island, Lamont-Doherty Earth Observatory, and Cambridge University. This experiment was located on 137- 155 Ma crust approximately 700 km southwest of Bermuda along a portion of NAT Line 15 near where it crossed the small-offset Blake Spur fracture zone (FZ) (Figure 1). NAT Line 15 had imaged numerous intracrustal reflectors in this area [Mutter et al., 1985; NAT Study Group, 1985; McCarthy et al., 1988] and what appeared to be an anomalous crustal structure beneath the Blake Spur FZ [Mutter et al., 1984; McCarthy et al., 1988]. The purpose of this experiment was to acquire additional multichannel seismic reflection and wide- angle reflection/refraction data in this area to determine the crustal structure across both the Blake Spur FZ and the ribbon of crust lying between the Blake Spur FZ and an unnamed fracture zone -100 km to the north.
A brief overview of this experiment and a summary of our preliminary results are given by White et al. [1990]. A more detailed description of the anomalous crustal velocity structure
within the Blake Spur FZ is presented by Minshull et al. [1991]. In this paper we describe the structure of the oceanic crust lying to the north of the Blake Spur FZ, focusing on the properties and the geologic significance of the diverse suite of intracrustal reflectors found in this area and their relationship to the crustal seismic velocity structure. In discussing these data, we use the terms ridge-normal and ridge-parallel to refer to seismic profiles oriented normal (WNW-ESE) and parallel (NNE-SSW) to the axis of the paleo-spreading center at which this crust was formed.
TECTONIC SEWrING
The Blake Spur FZ is a prominent, small-offset fracture zone in the western North Atlantic. Its offset changes from -15 km at the present-day Mid-Atlantic Ridge to -50 km in the Blake Spur magnetic anomaly adjacent to the North American continental margin [Klitgord and Schouten, 1986] (Figure 1).
40 ø
35 ø
30 ø
25 ø
,ooo
80 ø 75 ø 70 ø 65 ø
Fig. 1. Location of the Blake Spur survey area in the western North Atlantic (stippled box). Major fracture zones and magnetic lineations (data from Klitgord and Schouten, [1986]) are indicated by solid lines.
MORRIS ET AL.: SEISMIC STRU•E IN WESTERN NORTH ATLANTIC 13,881
The seismic experiment described in this paper was located near where NAT Line 15 crosses the Blake Spur FZ on crust that is 137-155 Ma old (magnetic anomalies M14 to M25 according to the time scale of Kent and Gradstein, [1985]). The survey encompasses a region that is approximately 195 by 285 kin. This area lies within the Hatteras abyssal plain and oceanic crust is typically buried by up to 1.5 km of sediment [Mountain and Tucholke, 1985].
Figure 2 shows a detailed depth-to-basement and magnetic isochron map of this area. The crust in the western portion of the area, from magnetic anomaly M21 to M25 (155 to 150 Ma), was formed at a spreading rate of 19 mm/yr (half rate). At magnetic anomaly M21 time there was a change in plate motion which is reflected in a small kink in the trace of the
Blake Spur FZ at 27ø25'N latitude [Klitgord and Schouten, 1986]. After anomaly M21, spreading rates decreased to 14 mm/yr and then continued to decrease to about 9 mm/yr (half rate), in the eastern part of the survey area [Klitgord and Schouten, 1986]. The Blake Spur area is thus typical of crust formed at a slow-spreading ridge, like the present-day Mid- Atlantic Ridge.
The Blake Spur FZ is marked by a band of rough basement topography consisting of isolated topographic lows and highs striking 110-120 ø . The offset along the fracture zone changes from about 50 km (-2.6 Ma offset, at a 19 mm/yr half
rate) in the western part of the area to 11 km (-1.2 Ma offset, at a 9 mm/yr haft rate) in the eastern portion. The sea floor north of the Blake Spur FZ has more subdued basement relief and a NNE-SSW grain that parallels the magnetic lineations. About 105 km north of the Blake Spur FZ lies a small unnamed fracture zone which also strikes about 110 ø and has an offset of
20 km at the location of the M16 isochron (2.2 Ma offset assuming a 9 mm/yr half rate).
DATA ACQUISITION, PROCESSING, AND MODELING
Over 3000 km of single-ship common depth point (CDP) multichannel seismic reflection data and 18 wide-angle reflection/refraction expanding spread profiles (ESPs) were obtained in the Blake Spur area in this study (Figure 3). Fourteen ESPs and coincident CDP reflection lines were shot
parallel to the Blake Spur FZ and across the ribbon of crust lying between the Blake Spur FZ and the unnamed northern fracture zone. Four additional ESPs and coincident ridge- parallel reflection profiles were shot on crust ranging in age from about M18 to M25. Five long reflection profiles were also obtained: two ridge-normal profiles (lines 711 and 721) and three ridge-parallel profiles (lines 719, 699, and 716). The ridge-parallel lines extend across the Blake Spur FZ and the ribbon of crust lying immediately to the north (Figure 3).
• < 6300 rn
6300-6600 rn
.*..2[• > 6600 rn
0 25 50 75 I I I I
kilometers
• 28 ø N
71øW 70øW
Fig. 2. Depth-to-basement map for the Blake Spur survey area (interpolated onto a 3-km grid and contoured every 100 m). The location of the Blake Spur FZ and the unnamed northern fracture zone are shown as dashed lines; magnetic lineations are solid lines.

13,882 MORRIS ET AL.: SEISMIC STRUCWURE IN WESTERN NORTH ATLANTIC
Common Depth Point Reflection Data
The multichannel seismic reflection data obtained in this
experiment were acquired by using the R/V Conrad's Digicon DSS-240 recording system. This system consisted of a 240- channel, 3-1cm-long digital streamer with a group spacing of 12.5 m. The seismic source was a 4846 inch 3 array of 10 air guns with chamber sizes ranging from 365 to 825 inch 3 fired at a nominal shot spacing of 50 m. Both the streamer and the air guns were towed at a depth of 10 m.
The reflection data were processed at Lamont-Doherty Earth Observatory to obtain the final migrated and depth-converted sections presented in this paper. Prestack processing included application of a two-dimensional dip filter over a slowness range from -0.35 to +0.35 s/kin to suppress coherent noise from scattering at the seafloor and the sediment-basement interface. Stacking velocities were derived from semblance analyses performed at least every 200 CDPs (5 km) and more frequently when the structures along the line changed rapidly. These data were put through a routine sequence of gathering, applying a normal moveout correction, and stacking. Poststack migration was carried out by using the F-K split- step algorithm of Stoffa et al. [1977]. The migrated time sections were converted to depth by applying a 10-layer regional velocity model derived from the ESP and semblance velocity data.
Expanding Spread Profiles
The two-ship expanding spread profiles were acquired by using the R/V Conrad as the shooting ship and the RRS Discovery as the receiving ship. The Conrad fired a 5821 inch 3 air gun array on a 40-s schedule, and the arrivals were recorded by the Discovery on a 48-channel, 2.4-km-long analog streamer. The ESPs were typically shot out to shot- receiver ranges of ~60 lcm. Radio ranging systems aboard both ships were used to determine shot-receiver distances to an accuracy of better than 5 m out to about a 25-km range and better than 15 m out to a 60-km range. Record sections were constructed by sorting the traces into nonoverlapping 50-m bins and then stacking the traces within each bin along a linear trajectory corresponding to an 8-km/s (P = 0.125) reduction velocity. Because the sea floor is virtually flat throughout the area and basement relief is generally less than 300 m, topographic corrections were unnecessary for these data.
The ESP data were analyzed to derive a compressional wave velocity/depth function by using a combination of travel time and amplitude modeling. The data were first transformed to intercept time versus ray parameter (x-P) by slant stacking the data along linear trajectories at P values from 0.05 to 0.66 s/kin and a 0.002 s/kin increment (305 P values). The x-P data were then used in a x-sum recursion to derive a preliminary
0 25 50 75 I I I I
kilometers
71øW 70ow
6
13
1
28 ø N
27 ø N
Fig. 3. Track map showing the location of the reflection profiles and ESPs obtained in this experiment. The fracture zones are shown as dashed lines. The location of NAT line 15 [Mutter et al., 1984; McCarthy et al., 1988] is shown for reference. The thick lines highlight the profiles presented as line drawings in Figures 4-6. Also indicated are the line numbers of reflection profiles shown in subsequent figures.

MORRIS ET AL.: SEISMIC STRUCTURE IN WESTERN NORTH ATLANTIC 13,883
velocity model [Diebold and Stoffa, 1981]. This initial velocity model was iteratively adjusted to match the travel times of the main reflection and refraction branches by using an interactive seismic modeling package (JDSEIS). Once a final travel time model was obtained, synthetic seismograms were computed by the Maslov technique [Chapman, 1978; Chapman and Drummond, 1982] and the velocity model was adjusted to fit the observed amplitude range pattern. This final velocity model was checked by computing full-waveform reflectivity synthetics [Fuchs and Muller, 1971; Chapman and Orcutt, 1985] every 200 m of horizontal range and comparing with the observed record sections.
PRINCIPAL RESULTS: REFLECTION DATA
Multichannel seismic reflection profiles collected across the oceanic crust north of the Blake Spur FZ reveal a wide range of intracrustal reflectors and variations in crustal reflectivity on profiles shot both parallel and normal to the paleo-ridge. The upper crust is associated with both subhorizontal and steeply dipping events, while the midcrust is often almost acoustically transparent. The lower crust is associated with a diffuse background reflectivity and distinct
linear or concave-upward-dipping reflectors with a highly variable spacing and reflectivity. Some of these events extend into the upper crust and, in a few cases, appear to cut through the entire crustal section. The base of the crust (Moho) is associated with a banded sequence of reflectors that is absent in many places.
Digitized representations of five seismic profiles have been constructed to illustrate the extreme variability in crustal reflectivity that exists within this area. Figures 4 (line 711) and 5 (lines 721, 714, and 713) show two line interpretations of-300 km long ridge-normal profiles which approximately parallel the Blake Spur FZ and extend across crust aged from 137 to 155 Ma. Figure 6b shows a line interpretation of a 130-km-long ridge-parallel profile (line 699) that extends from the Blake Spur FZ to the northern fracture zone along the M16 magnetic isochron. Two shorter ridge-parallel profiles were digitized: line 702 lies along isochron M15+, and line 710 is located along M23 (Figures 6a and 6c, respectively).
To quantify the structural diversity of the events seen in these data, various reflector properties including dip, length, and crustal location were compiled (Tables 1 and 2). To be included in this compilation, a seismic event had to (1) be laterally continuous for at least 2 kin, (2) exhibit dips greater
Line 711
NW ESP 18 I
• 6 - .sediment
C3 14 ....... _ ,.-. ....... -- ....
Fig. 10a Fig. 13a • Fig. 12a .-.•, -- •..., -- -.•_-.-.__• ..... _.- dime "- base9hent •. '•... .,j: -- -- ••,. %,.
I I
600 1000
Fig. 12a•
I I I I I I I
1400 1800 2200 2600 3000 3400 3800
i Fig. 7b _ secl[me_n•
I I I I I I I I
4400 4800 5200 5600 6000 6400 6800 7200 7600
6
C3 14
Line 716 Line 6 Line 719 SE ! I
Data ,, e .•' Gap '-'-----*-•'•- - e• m -• bas ent
! I I I I I I I I
8200 8600 9000 9400 9800 10200 10600 11000 11400
No Vertical Exaggeration CDP Number 0 20 I ! I km
Fig. 4. Digitized representation of reflection line 711, a ridge-normal profile that is located on crust aged 141 Ma to 153 Ma (Figure 3). ESP midpoints and the locations of subsequent figures which show examples of seismic data from this line are indicated. Note the high reflectivity of the lower crust, with predominantly eastward-dipping events on the western part of the profile and a more acoustically transparent crust on the eastern half of this profile.

13,884 MOP, RIS ET AL.: SEISMIC STRUCT•E IN WESTERN NORTH ATLANTIC
than 2 ø, and (3) have a relatively high amplitude. To ensure that these statistics were not biased by the tectonically disturbed terrain near a fracture zone, only profiles more than 12 km away from fracture zones were included in the compilation. For an interface that changed dip along its length, the predominant dip of the feature was measured. If a reflection package consisted of a series of short, discontinuous reflectors, the entire band of reflectors was
considered one feature. Using this approach, 158 events on over 1600 km of CDP profiles were identified.
The events identified in seismic reflection data on crust
north of the Blake Spur FZ divide naturally into a classification scheme based on depth in the crustal section. The subdivisions we have used are upper crust (uppermost 2.5 km of crust), lower crust (lower 4.5 km of the oceanic crustal section), whole crust, and Moho.
Upper Crust Reflectors
The upper crust within the Blake Spur area contains both subhorizontal (<5 ø) and more steeply dipping (-20-23 ø) reflectors. Statistically, nearly 30% of the events identified
on reflection profiles on crust north of the Blake Spur FZ are confined to the upper crust (Table 1).
The flat-lying reflectors in the upper crust consist of subhorizontal or gently dipping events or bands of reflectors which exhibit considerable lateral variability in terms of both their reflection character and their continuity. These events are present at all levels within the shallow crust. The most prominent and laterally coherent subhorizontal events generally lie 1.5-2 km below the top of oceanic basement, have dips of less than 5 ø , and in places are laterally continuous for up to 15-20 kin. However, a number of shorter (up to 3 km long) subhorizontal events are present within the upper kilometer of crust on some profiles [Minshull and Singh, 1993]. Three examples of these events are presented in Figure 7 to illustrate the diversity of upper crustal reflectors observed in the Blake Spur area. On line 721 (Figure 7a), a high-amplitude, discrete subhorizontal reflector is observed at 8.5 km depth (-2 km into the crust) dipping -3 ø to the east. On some profiles this event is relatively flat in the shallow crust, steepens in its midportion, and then flattens out again near the base of the upper crust (Figure 7b). Sometimes the•½ events are a band of reflective energy instead of a discrete
Line 721
NW ESP 18 , I , _
..• 6 _ _ _ ,•diment ,- 10
c3 14 • 'x ....• .... •._:._Moho _ - --_ . I I I
7400 7000 6600
I Fig. 7a ESP 17 ,, _ _
• - ' - - -- ------.--.._ • •' basement •'=. :•' •-L. -'= • . ... _
I I I I I I
6200 5800 5400 5000 4600 4200
I ,,, Fig. 13d Fig. 8c ESP 16 .c 10
c3 14
10 i i i i i I 3 0 320o 2800 2400 2000 1doo 1200 8(0 400
Line 714 ESP 15 Line 699 Fig. 1 lb ESP !•.4
Data
Gap
No Vertical Exaggeration
:;--"" ' .'"'•.-' .:• - " x,, :_•_-'• I I I I I I I I
2600 2200 1800 1400 1000 600 200 800 0
CDP Number I I km
Line 713 SE
sedimeht .... -1
I
400 20
I
Fig. 5. Digitized representation of a ridge-normal profile which includes reflection lines 721,714, and 713 located on crust aged 141 Ma to 153 Ma (Figure 3). ESP midpoints and the locations of subsequent figures which show examples of seismic data from this line are indicated. Note the variety of intracrustal reflectors, with apparent dips to both the east and west, and the alternating areas of high and low crustal reflectivity.

MORRIS ET AL.: SEISMIC STRUCrURE IN WESTERN NORTH ATLANTIC 13,885
(•u)•) •dea'-
o
(W)l) 41decI
(LU)I) qlde(]
0..=

13,886 MORRIS ET AL.: SEISMIC STRUCTURE IN WESTERN NORTH ATLANTIC
Upper crust Lower crust Whole crust
Upper crust Lower crust Whole crust
TABLE 1. Event Occurence Statistics
Event Dip Direction Event Location (Percentage Frequency
% of Total) Events/100 km
Ridge-Normal Profiles 26 57 (eas0 2.2 68 43 (west) 5.8
6 0.5
Ridge-Parallel Profiles 29 78 (south) 3.5 51 22 (north) 6.0 20 2.4
dominated by southward-dipping upper crustal events (four out of every five events observed dip to the south). However, sometimes both northward and southward-dipping events are observed on these profiles (Figure 8d). On line 702, the northward-dipping reflector cuts through the entire upper crustal section and appears to fiatten out in the lower crust (Figure 8d). The orientation of these reflectors suggests that the southward-dipping event may be an antithetic structure to the more prominent northward-dipping reflector.
Lower Crust Reflectors
reflector. On line 710 for example, there is a -400-m wide band of reflectors that dips about 2 ø toward the south (Figure 7c). When present, the lateral continuity of these features is usually expressed as a series of short, high-amplitude events which can extend over distances of up to 15-20 km (see Figure 9a), although more commonly they are much shorter.
Dipping reflectors in the upper crust are high-amplitude, linear events that extend from the sediment/basement interface
into the midcrust (Figure 8). These reflectors are sometimes (13 of 43 occurrences) traced to an offset in the basement surface and are about equally distributed throughout the data set on both ridge-normal and ridge-parallel profiles. On ridge- normal profiles, an approximately equal percentage of events is seen dipping toward (eastward) and away from (westward) the pal_eo-spreading center (Table 1). The dips of these events are quite variable, ranging from 5 ø to 46 ø, but the average dips of both eastward- (23 ø + 14 ø) and westward (20 ø + 10ø)-dipping reflectors are similar (Table 2). On the ridge-parallel profiles, upper crust reflectors dipping to the south, toward the Blake Spur FZ, are more common than events dipping toward the northern fracture zone (Table 1).
Some of the dipping events can be tied directly to basement escarpments as large as 1 km (Figure 8a). In other cases, these events appear to fade out in the highly reflective upper crust, just below the basement surface (Figure 8b). On some profiles, these upper crust dipping events consist of a package of high-amplitude reflective energy rather than a discrete reflector (e.g., Figure 8c). The ridge-parallel profiles are
The lower crust in the Blake Spur area exhibits distinct regions of both high and low reflectivity and numerous linear or concave-upward dipping events (Figures 4-6). These events usually consist of packages of high amplitude reflectors, 4-5 km in length, dipping at angles of 20o-30 ø (e.g., CDPs 600- 2400 (Figure 4) and CDPs 1600-2400 (Figure 6a)). They often change character down-dip from a few discrete, continuous reflectors in the middle crust to a broader band of short, discontinuous, higher-amplitude reflectors in the lowermost crust, where they usually flatten out near the Moho in a zone of diffuse high reflectivity. An important feature in these data is the uneven and highly variable distribution of events. There can be large intervals with no reflectors as well as areas with many events, for example, in the western part of the survey area (Figure 4, CDPs 1200-2400).
On ridge-normal profiles, more than 60% of the lower crustal events dip to the east, toward the paleo-spreading center (Table 1). These events have apparent dips ranging from 17 ø to 44 ø with an average dip of 30 ø .+_ 7 ø (see Figure 9 and Table 2). On line 711, relatively closely spaced, eastward- dipping, lower crustal reflectors are present between 9.5 and 13.5 km depth (-3-7 tan into the crust) and have a relatively uniform dip (Figure 10a). In other areas, these events are concave with dips flattening considerably in the lowermost crust (e.g., Figure 11). In a few cases, they appear to extend down into the underlying mantle, cutting through the flat- lying, banded Moho event without offsetting it (Figure l lb), although this could be an out-of-plane reflector mislocated by two-dimensional migration. Westward-dipping lower crust
Upper crust Eastward
Westward Lower crust
Eastward
Westward Whole crust
Eastward Westward
Upper crust Eastward
Westward Lower crust
Eastward
Westward
Whole crust Eastward
Westward
TABLE 2. Event Dip Statistics Number of
Events Mean + SD
Ridge-Normal Profiles
9 23ñ 14 14 20 + 10
38 30ñ 7 23 24 ñ 8
4 35ñ 8 1 26
Ridge-Parallel Profiles
4 18+ 8 16 20ñ 7
9 22+ 12 26 20 ñ 8
2 17+ 1 12 21 + 7
Dip, deg
Minimum
5
8
17
10
28
NA
6
8
5
6
16
12
Maximum
42
46
44
39
46
NA
24
33
35
32
18
30

MORRIS ET AL.: SEISMIC STRUCTURE IN WESTERN NORTH ATLANTIC 13,887
E •8
lO
W Line 721 E
E •8
lO
S Line
.... .. • .,. :.
.... • :- 6 ...... • ..• •,'•.....•.==•...c.• . ..•...• ••.-•.•:•-•.••
•.:, , .•. .... . .... • •. .•' . ß •;•.•'•'.• • • •.•.•.•?"•:'
••.:•.• d•'• .,•;•. •.. :.--•j:,,¾ • :':•' '--• ,.•.••: "•½',•.. :, .,-- .:• ,•:•:,•, ..... - ........ • .... •., "• .,• .,•:,•,•,•:,. .• .... • ,, •,•.• •,,• •.,•,,,. ...... .•.,•,. .•'.•..? ........ •.•'•'•.,,'.•,'•,'¾ '•:•,•:.,•'.-• :•'• ...... • ,' •'•,•.:•,,•.F½•'• .... .•' ................ • ............... •'-"•'• ...... '•-. r.•'.•::.
•.• r ,• •,?;•.'.• ,. •.• • ..-:. •'•"• ..,•.-.•. ..... ::-....-,
• 5 KM i
Fig. 7. Examples of sub-horizontal, upper crustal reflectors from lines (a) 721, (b) 711, and (c) 710. The oceanic basement is at -6.5 km depth. This and all subsequent seismic figures are migrated, depth-converted sections plotted with no vertical exaggeration. These events are present at all levels within the shallow crust, although the most prominent and laterally coherent subhorizontal reflectors generally lie 1.5-2 km below the top of the oceanic basement.

13,888 MOR•S ET AL.: SEISMIC STRU•E IN WESTERN NORTH ATLAI•rIC
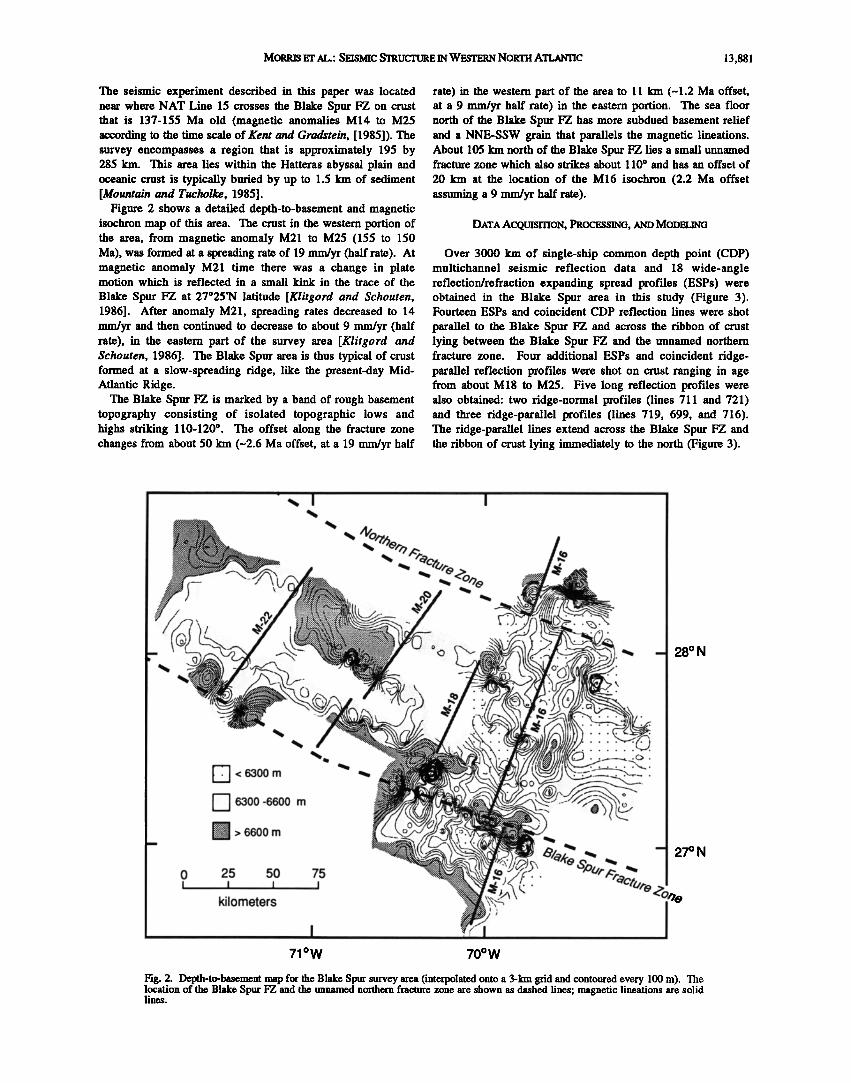
events (i.e., dipping away from the paleo-ridge) are less common on ridge-normal profiles, but they have similar dips (24 ø + 8 ø) and reflection character (Figure 10b). The spacing of these lower crustal events is quite irregular (e.g., Figures 4 and 5); in some areas, where they are best developed, they occur every 6-7 kin, while in other areas they are widely spaced or absent. These alternating zones of low and high lower-crust reflectivity are not believed to be due to scattering of energy from either the seafloor or the top of oceanic basement; the seafloor is very flat throughout this area, and there is no obvious correlation between the changes in basement topography and variations in lower crust reflectivity.
The ridge-parallel lines in the Blake Spur area are dominated by lower crust events which dip southward toward the Blake Spur FZ (Figure 12b), similar to the orientations observed in the upper crust. The apparent dips of these events range from 8 ø to 34 ø (see Figure 9), but the mean dip (20 ø ñ 8 ø) is somewhat smaller than the value of 30 ø observed for the
eastward-dipping lower crust reflectors on the ridge-normal profiles (Table 2). Northward-dipping lower crust events are relatively uncommon on the ridge-parallel profiles in the Blake Spur area, but where they are observed, their mean dip (22 ø) is comparable to that observed for the southward-dipping events (see Figure 9).
Whole Crust Events
Dipping events are observed on both the ridge-normal and ridge-parallel profiles in the Blake Spur area, which extend from the crust-mantle boundary well up into the upper crust and occasionally to the top of oceanic basement (Figure 12). There is no evidence that these reflections significantly offset either the Moho or the sediment-basement surface. The whole
crust events, which are more common on ridge-parallel profiles than on ridge-normal profiles (14 and 5, respectively, in the entire data set), can be either linear or concave-upward in shape and have dips ranging from 12 ø to 46 ø with generally steeper dips on the ridge-normal profiles (Table 2 and Figure 9). In a few instances, these events exhibit a distinct sigmoidal shape with shallow dips in the lower crust that gradually steepen in the middle crust and then roll over into a nearly horizontal attitude in the shallow crust (Figure 6a, CDPs 4800-5700; Figure 6c, CDPs 200-1000). Usually, there is not one discrete reflector, but instead, there is a band of
reflectors whose amplitudes and complexity gradually increase downdip.
Most whole crust events seen on the ridge-normal profiles dip eastward toward the paleo-ridge and have an average dip of 35 ø + 8 ø (Table 2), comparable to the dip of the lower-crust
•8
6
8
10
W Line 721 E
W Line 709 E __ .
':'•-•,=-•/•_- ..... .:--•;:-.-•- ' -- .:=,.2,,.•T-.5,,,-.,•-z .........
• i "".i '. .•' .--. ' .' . .. . _', ,.4-•-,• -• • . .,,, '•c•,;,, ;- •, E ' ' '"'"' 'ff• "' "' '='" "' "; •''•,•rr,• •, . . ' ...... •',.": ..- ' ,. . ',:•'-c...", ', ',6•.. '.•. ;','•. -. '." .',,",- ..... --• 8 ....... .• .,•, ...:,.: ....• .• ......,- ., ;,--..,,• : ..... ,•a .. ....... •..,• -
,..,,•'.• ....• ,•... :•,:• ... ..,., .... •. ..... , .... • .... .
,.• .......... •, •......:,..-,. -,,,.,:. ..,. !,•,• ...... •, i7'•:. •,.v,, •,4,.•,•., .•V ................. • .... •';•"--:,'.',•.•, ' ........ •' ....... :: '.• .,F•,•i•.•,.•,'•-• ', ,•'• -.•'.,'- .? '•.,'.',c•' ' .',:•' •',.' '.•..,' .... :• .... 10 ,'•.• - ,,"• •"-.,':• ,.•. ' •.•. .... •.•, ":;;.•' "-:•:.'•i' '•":•'[ .•, ,H••?• •', '•f•.,• , ' •. •: , , ß • .............. ' .... e. •[•.-.,.•.•.,,,.,,,.,•
•.¾• • •.. •.•,•., •. ,• ,, •,.•-...•:, ,.:• ,,•,,•.,• .......... ,.• •,, _- .•..• ......... • ..... .,.•,..•-•.•.,, .,• .r• ................ • • .....
6 S Line 702 -,-- N / ,,..,,,-.,,--•..-. ".----•?_.-,,- ...... - =•_•, . -,,,.- - - -... -a.,.,....• - / F :, •"" -' ' --= '""'"7, "',,q-' - . .•'""'•'.•,: '-' ..,,-..•' :. ' ' . ..' 4 ß • ,.,. •' • ,,,. ,:.' ..... ,• , .'• - : / .... .. .,,. ,.,: .... . _ , . / • :-,'"":.:.' .-..-, .," •.'- ß . ,'"'"" '•"•. -'..• ,v' ' '- , '.,,.
. •,....,. ,,,• , ,,,,;:,,,,•..• . .",•,....• . .,% - .:;•:, .:• .• .•:..• , •.. •! ,:-... .... • ,,. ..... ..... ,•. .... ..•.•.. •J• ............ • ..... t4•..,•. ,•'•.,,:....•...:• ,•,.
,, .... ': .... ..,.-. ,•,,.,,:.,:,•.:..,• ....... ,,.•: ,.•." .... .•.,.,,,•.:.,•..?'-•,..,. ........ •-•.,,;,,,.. ,..,...,..:•..•..,,.,,,,,.•.•/,, ...... .•..., •.•.,?•.: •.•..•.,,.,....,.• .%. :::,.•.,• •..•:• •..,• % .•.:::.:,r?,;,,•....• ,,.=,.,,,•...;..•.. •,.,, .,,. :,. ,.: ::,•,,• :.? ...:•.,•X? .?'. •',:'..•..:,.,';,•?.,k,•,• ';• "'•:: • ,." .. • ..... •. •.• ',,• '...'• ', ..... ,, •.•,,' ...... •. ,,..., :$•?•,....,,'"''_.,•.. ß "- ' • .... ß .'•,,' •..•" •,. ':" ,,, ', ""• '"'• ' .., ' ..... z..
•Fv• •,•" ' '• •¾ '""•'•••"• :'• ...... ?x .• ..., •. ,•_: .• ........ ..,_.. _,• .....•-.• •.: • ,• .....,.-..,_
t 5 KM i
Fig. 8. Examples of upper crustal dipping events from lines (a) 696, (b) 709, (c) 721, and (d) 702. The oceanic basement is at -6.5 km depth except on line 696, where a large basement scarp almost reaches the sea floor. These steeply dipping events often cut down through the entire upper crustal section before fading out in the more acoustically transparent midcrust.
MORRIS ET AL.' SEISMIC STRUCTURE IN WESTERN NORTH ATLANTIC 13,889
reflectors discussed above. Sometimes, as an event is traced
from the upper crust to the base, the dip gradually decreases with depth, producing an overall concave-upward shape (Figure 12a)
On the ridge-parallel profiles, nearly all the whole crust events (12 of 14) dip southward toward the Blake Spur FZ. These events generally have shallower dips (21 E 7 ø) and are longer than those observed on ridge-normal profiles. A band of strong reflectors which have a nearly constant dip of-25 ø can be traced from the crust-mantle boundary near 14 km depth through the lower and middle crust into the upper crust, where it is obscured by diffractions (Figure 12b). Several other examples of southward-dipping whole crust events can be seen on the line drawings (Figure 6).
Moho Character
The crust-mantle boundary within the ribbon of crust north of the Blake Spur FZ is known from ESP velocity studies (summarized in the next section) to lie at a relatively uniform depth of 13.5-14 km (total crustal thickness, --7-8 km). The Moho is not marked by a discrete reflector but instead is a broad band of high reflectivity. On many reflection profiles, the lowermost crust is acoustically transparent and no Moho reflection is observed.
In some locations the crust-mantle boundary is represented by a series of short reflective segments of variable length and continuity in a relatively narrow (-0.5-kin) band at a depth of 13-14 km (Figures 13a and 13b). Frequently, there is an increase in reflectivity when a lower-crust dipping event soles out near the base of the crust (Figure 13b). The crust-mantle boundary is usually characterized by a wider (-2-kin) band of high reflectivity like that illustrated in Figure 13c. Here, the entire lower crust is so highly reflective that a discrete boundary cannot be recognized in the reflection data. The crust-mantle boundary, as determined from ESP velocity solutions, generally lies near the base of this highly reflective zone. This thick band of reflectors associated with the Moho
transition has been observed in other ocean basins [Collins et al., 1986]. In many areas, the lower crust is acoustically transparent and devoid of any Moho reflectors (Figure 13d). Moho reflections, sometimes absent over distances of 40 km
or more, alternate with highly reflective zones where the Moho usually appears a band of high reflectivity 1-2 km thick (Figures 4-6).
PmN•P• RESULTS: ESPs
The crustal velocity structure in the Blake Spur area is constrained by 18 ESPs acquired during this experiment
LOWER AND WHOLE CRUSTAL EVENTS
Flow Line Profiles
6
Eastward Dipping
0 10 20 30 40 50
Dip (degrees)
Isochron Profiles
i i i a i i i
Northward Dipping
6 ' 1'0 ' 2'0 ' 3•0 ' 4'0
Dip (degrees)
Westward Dipping
ß , , , , , , , , ,
•
6
Southward Dipping
0 10 20 30 40 50 6 ' ' 4•) Dip (degrees)
10 20 30
Dip (degrees)
Fig. 9. Histograms summarizing the distribution of both the lower and whole crustal dipping events observed on ridge-normal and ridge-parallel profiles in the Blake Spur area. Note the predominance of eastward-dipping events on the ridge-normal profiles and southward-dipping events on the ridge-parallel profiles.

13,890 MORRIS ET AL.: SETSM[C STRUCTt•E IN WESTERN NORTH ATLANTIC ,
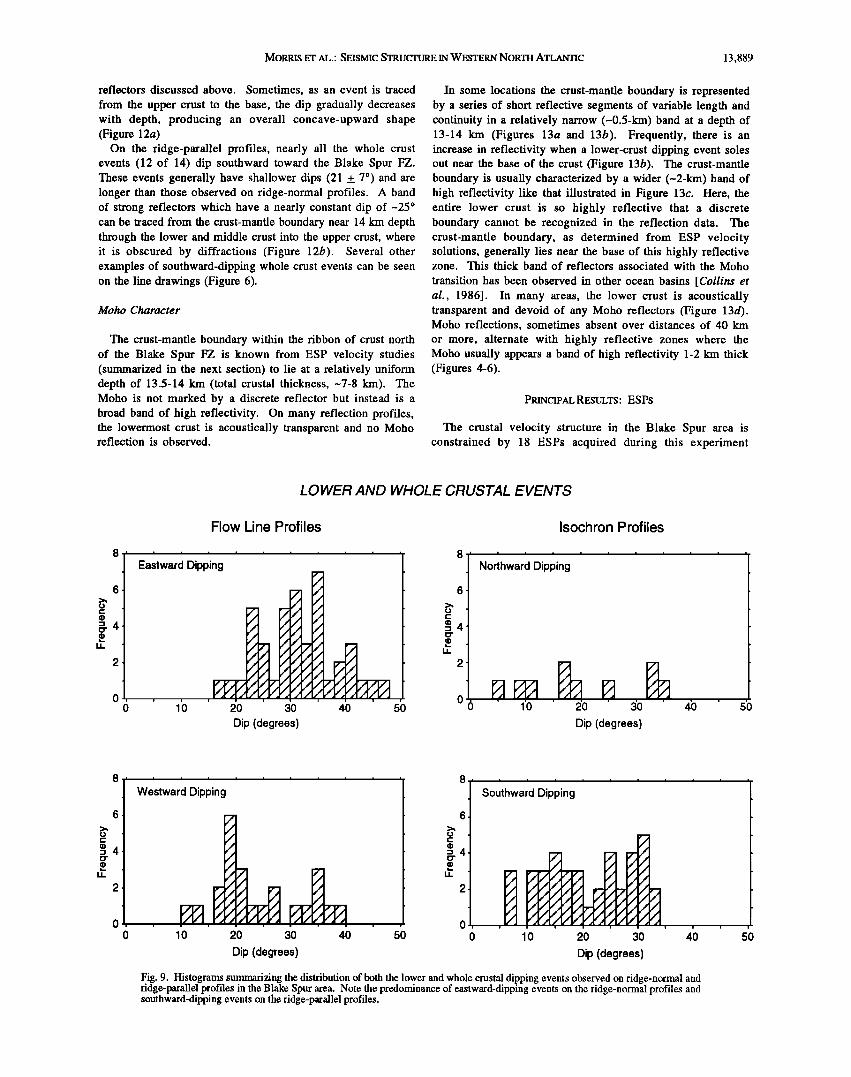
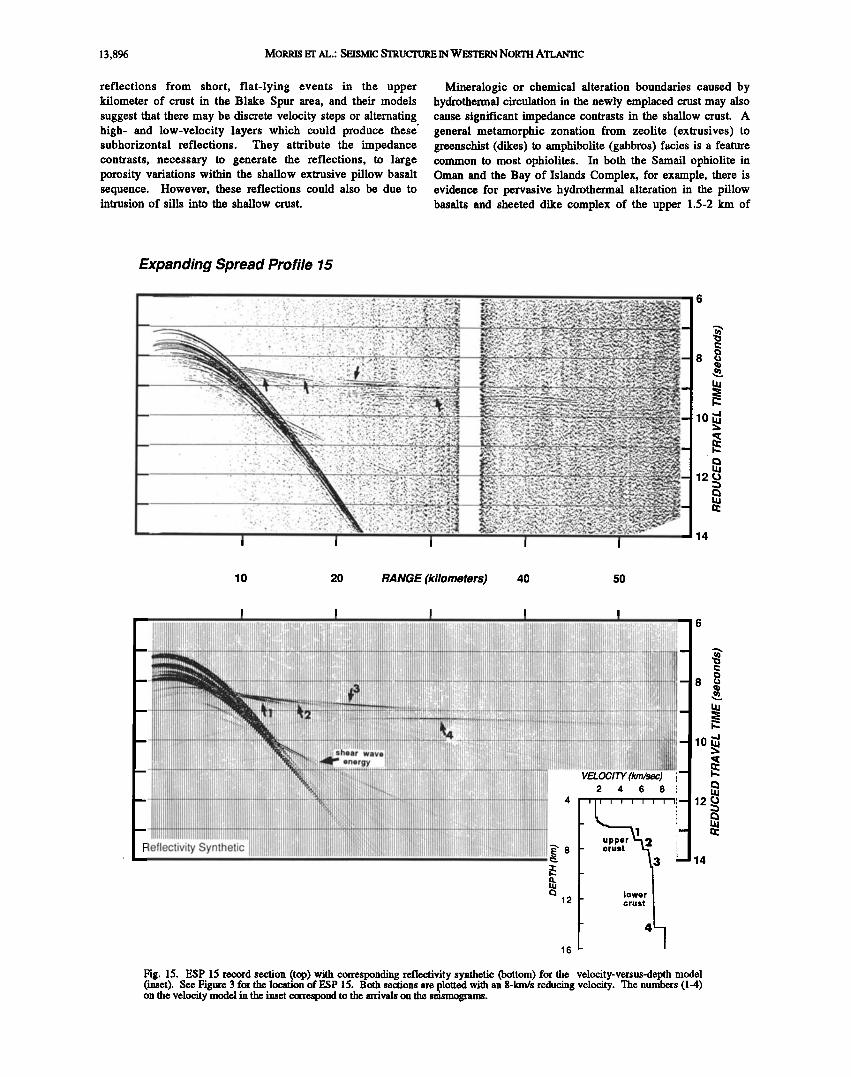
(Figure 3). A detailed interpretation of the crustal structure within and immediately adjacent to the Blake Spur FZ has been presented by Minshull et al. [1991]. We focus primarily on two ESPs (ESPs 15 and 18) shot parallel to the ridge, which represent the crustal structure away from the Blake Spur FZ. Figures 15 and 17 show the record sections with the reflectivity synthetic seismograms displayed at the same scale, and the inset is the final P wave velocity model (also see Tables 3a and 3d). We will summarize these results in two isovelocity sections, one which is oriented normal to the ridge and the other which runs parallel to the ridge.
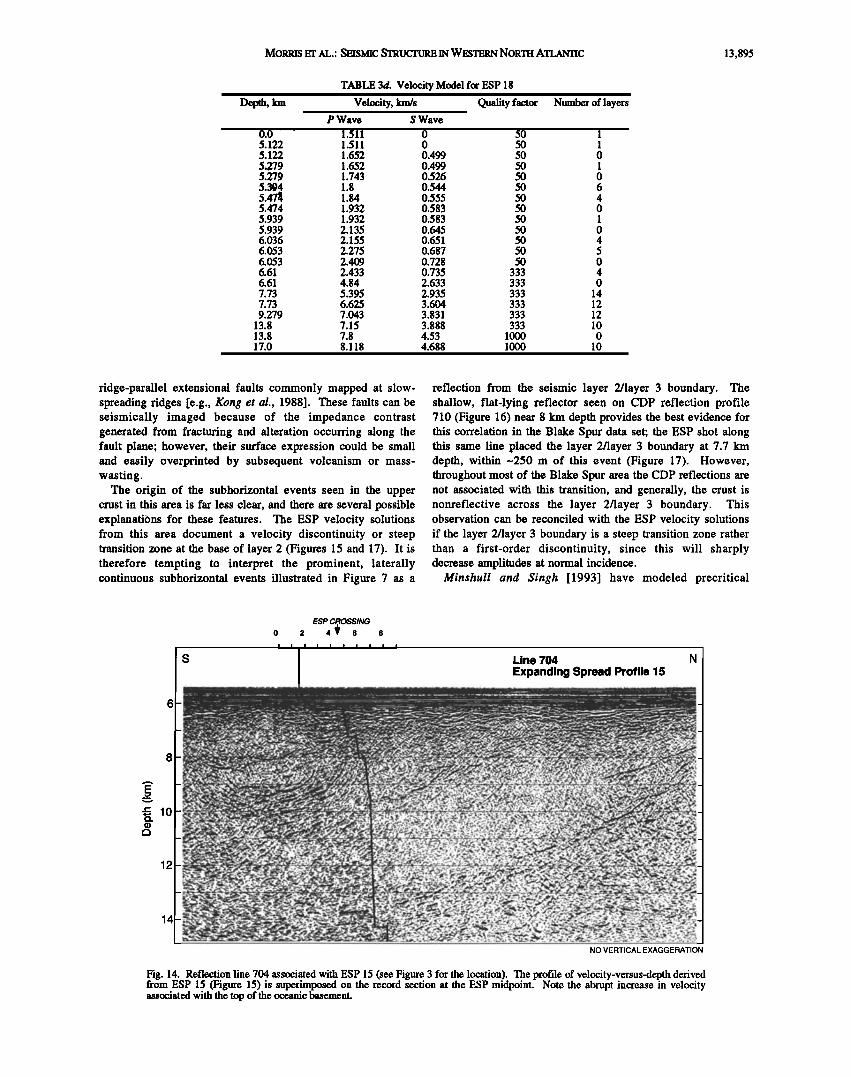
ESP 15
ESP 15 is located on ~143-Ma crust near magnetic anomaly M17 in the eastern part of the survey area (Figure 3). A coincident CDP reflection profile, line 704, is shown in Figure 14. The oceanic crust on this line is characterized by a
relatively high, but diffuse reflectivity with no coherent subbasement reflectors in the middle or upper crust beneath the ESP midpoint. Two southward-dipping lower crust reflectors are observed near the northern end of the line. The deeper of these two events flattens out at about 13 km depth beneath the ESP midpoint and is associated with a broad zone of high reflectivity near the base of the crust.
Strong compressional wave arrivals are observed out to ranges of 50-60 km on ESP 15, including well-developed converted shear wave energy (Figure 15). The upper layer is associated with high-amplitude P wave arrivals observed at ranges of 8-15 km (arrival 1, Figure 15). These arrivals are modeled with a ~l-km-thick layer with a gradient of 0.37 s-1 and velocities which increase from 4.9 km/s at the sediment-
basement interface to 5.3 km/s. Arrival 2 (Figure 15), at ranges of 11-19 km, is modeled with an ~800-m-thick layer and a smaller velocity gradient (0.23 s -1) with a discontinuity at its base, where there is an abrupt increase to layer 3
Fig. 10. Examples of lower-crust dipping events from ridge-normal profiles (a) 711 and (b) 696. These events usually consist of packages of high-amplitude reflectors, 4-5 km in length, dipping at angles of 20o-30 ø. The majority of events dip eastward, toward the paleo-ridge, but westward-dipping events are also observed (e.g., line 696). Both lines also have subhorizontal events in the middle and upper crust.

MORRIS ET AL.: SEISMIC STRUCI•RE IN WESTERN NORTH ATLANTIC 13,891
velocities (-6.6 km/s). The velocity structure within layer 3 is constrained by the distinctive amplitude variations observed beyond a 15-km range: first-arrival amplitudes are small between 17 and 20 km, increase again between 20 and 26 km, and, then decrease dramatically at greater ranges. To model these amplitude relationships, a higher-velocity gradient (0.20 s-l) is required for the upper 500-600 m of layer 3 (arrival 3, Figure 15) that is underlain by a thick, relatively constant velocity layer (gradient < 0.05 s- 1). The crustal arrivals suggest a series of velocity discontinuities which do not appear to correlate with any CDP reflections on line 704 (Figure 14). The PmP arrival has a broad zone of high. amplitudes from 26- to 31-km range (arrival 4, Figure 15) and a weak Pn arrival at ranges of 50-60 km, which constrains the depth to the crust-mantle boundary at 14.3 km, corresponding to the base of the zone of high reflectivity observed on line
704 (Figure 14). The location of the critical point for the PmP arrivals indicates a velocity of > 8 km/s for the upper mantle.
ESP18
ESP 18 is located on magnetic anomaly M23 (154 Ma) in the western part of the study area (Figure 3). The coincident CDP reflection profile, line 710, is shown in Figure 16. The sediment/basement interface is located at 6.6 km depth on this profile, and there is relatively little basement relief. A high- amplitude, continuous subhorizontal reflector is present near 8 km depth (-1.4 km into the crust). Near the ESP midpoint, this event appears to dip toward the south, cutting nearly 1000 m deeper into the crustal section. The midcrust on this profile is characterized by numerous short, high-amplitude events that dip both to the north and the south. An -2-km-wide band of
W Line 683 E
/
W Lin, •14 E
Fig. 11: Examples of lower-crust dipping events from ridge-normal profiles (a) 683 and (b) 714. Note how these reflectors appear to change character downdip from a few discrete, continuous reflectors to a broader zone of short, discontinuous higher- amplitude events in the lower crust. They usually flatten out in the lowermost crust, merging into a band of diffuse reflectivity that characterizes the Moho in much of this area (-14 km depth). In a few cases (e.g., line 714), these dipping events appear to cut through the Moho and extend into the underlying mantle.

13,892 MORRIS ET AL.: SEISMIC STRUC'I3JRE IN WESTERN NORTH ATLANTIC
high reflectivity is observed from 12 to 14 km depth, near the base of the crust.
The upper crust arrivals on ESP 18 are characterized by two phases. A second arrival with a relatively slow phase velocity (< 5.4 km/s) and a steep velocity gradient (0.5 s-l) is evident from a --8- to 13-km range (arrival 1, Figure 17), and a relatively high amplitude first arrival with a higher phase velocity (> 6.6 km/s) extends out to ranges of 20-25 km (arrival 2, Figure 17). This transition from 5.4- to 6.6-km/s velocities which is at a depth of 1.1 km, marks the layer 2/layer 3 boundary and is close to, but does not correlate exactly with, the depth of the subhorizontal upper-crust reflector observed on line 710 (Figure 16). Similar to ESP 15, the upper part of layer 3 is modeled with a high gradient (0.27 s -1), producing the high-amplitude arrivals out to a 20-25-km range (arrival 2, Figure 17) and a deeper, nearly constant velocity layer (gradient < 0.02 s -1) causing attenuation of arrivals at greater ranges. The strong Prop phase observed at
ranges of 33-39 km (arrival 3) and a normal-incidence Moho reflection time of 10.2 s observed on line 710 are consistent
with a total crustal thickness of 7.2 km on this profile and an upper mantle velocity of 7.8 km/s. A weak Pn arrival at the 50-60-!•m range (arrival 4, Figure 17) has a phase velocity of 8.1 km/s, suggesting a small positive velocity gradient below the Moho.
Isovelocity Sections
A compilation of all the ESP velocity solutions from this experiment are presented in Figure 18. The models from ESPs 1-8, and 13 across the Blake Spur FZ are those of Minshull et al. [1991]; the models from ESPs 9-11 are those of W. Su (unpublished data; 1992), and the solutions from ESPs 15-18 are from this study (Table 3).
Although the Blake Spur FZ is associated with a very anomalous crustal structure [Minshull et al., 1991], outside of
14
Fig. 12. Examples of dipping reflectors that appear to cut through the entire crustal section. (a) Line 711 is a ridge-normal profile, and (b) line 699 is oriented parallel to the paleo-ridge, along magnetic isod•ron M16. These whole crustal events are more common on ridge-parallel profiles than on ridge-normal profiles. They can be either linear or somewhat concave-upward in shape and usually consist of a band of reflectors that increase in strength and complexity downdip.

MORRIS ET AL.: SEISMIC STRUCTURE IN WESTERN NORTH ATLANTIC 13,893
the fracture zone the crustal velocity structure in this area is remarkably homogeneous. There is no significant variation in crustal thickness or structure along the -20 Ma of crust sampled by the ridge-normal transect, nor is there a systematic variation in crustal structure across the ribbon of crust north of
the Blake Spur FZ or in the vicinity of the northern fracture zone. Away from the Blake Spur FZ, the average crustal thickness determined for the ridge-normal direction-oriented ESPs is 7.6 + 0.7 km (this paper), and for the ESPs running in a ridge-parallel direction the thickness is 7.9 + 0.6 km [Minshull et al., 1991; W. Su, unpublished data, 1992]. The Moho lies between 13 and 14.5 km throughout the area, except in the immediate vicinity of the Blake Spur FZ.
DISCUSSION
This study, and the earlier NAT experiment, have documented a wide variety of reflectors in Cretaceous-aged crust in the western North Atlantic (Figure 19). Although the oceanic crust away from the Blake Spur FZ is relatively uniform in terms of its thickness and seismic velocity structure, the crustal reflectivity varies quite widely, both as a function of depth within the crustal section and regionally throughout the survey area (Figures 4-6). We believe that the variable reflectivity and diverse subhorizontal and dipping reflectors observed in the Blake Spur area are typical of
oceanic crust created at slow-spreading ridges and preserve a record of the magmatic, tectonic, and hydrothermal processes that are associated with the creation and aging of the crust.
Upper Crust Structure
The upper crustal velocities are 4.8-5.3 km/s and increase downward with relatively steep velocity gradients (-0.46 s-l) typical of seismic layer 2 elsewhere in the ocean basins [Spudich and Orcutt, 1980b; White, 1984; Purdy and Ewing, 1986, White et al., 1992]. Triplications on the ESP record sections, like those described previously on ESPs 15 and 18, indicate the presence of velocity discontinuities or steep velocity gradients within layer 2 and at the layer 2/layer 3 boundary in some locations. However, there is not a simple relationship between the velocity structure of the upper crust and the reflectors imaged in this section on the CDP reflection profiles
The steeply dipping reflectors in the upper crust are observed most frequently on ridge-normal profiles and, in about one third of the cases, can be traced to offsets in the
basement surface. These events have dips ranging from 7 ø to 42 ø and usually fade out at depths of 1.5 km into the crust, probably within the sheeted dike section. We suggest that these features are probably the subsurface expression of the
10
A
E •12
14
10
A
E •.12
14
W Line 711 E S Line 683 N
W Line 687
{ 5 KM {
Fig. 13. Examples of the reflection character of the crust-mantle boundary in the Blake Spur area from lines (a) 711, (b) 687, (c) 683, and (d) 721. Coincident refraction data indicate that the Moho is located at a relatively uniform depth of 13.5-14 km in this area. Note the extremely variable character of the Moho transition, which alternates between being highly reflective and being acoustically transparent.
13,894 MORRIS ET AL.: SEISMIC STRUCTURE IN WESTERN NORTH ATLANTIC
TABLE 3a. Velocity Model for ESP 15
Depth, km Velocity, km/s Quality factor Number of layers
P Wave $ Wave
0.0 1.517 0 50 1 5.485 1.517 0 50 1 5.485 1.7 0.513 50 0 5.756 1.7 0.513 50 1 5.756 1.744 0.527 50 0 5.856 1.814 0.548 50 4 5.856 1.871 0.565 50 0 5.954 1.994 0.602 50 4 5.954 2.024 0.611 50 0 6.122 2.324 0.702 50 4 6.122 2.574 0.777 50 0 6.26 2.844 0.906 50 8 6.26 4.89 2.52 333 0 7.28 5.263 3.06 333 10 7.28 5.875 3.2 333 0 8.08 6.065 3.4 333 10 8.08 6.55 3.65 333 0 9.45 6.825 3.8 333 8 9.45 6.95 3.9 333 0
12.27 7.09 3.99 333 8 14.3 7.2 4.12 333 10 14.3 8.2 4.56 1000 0 20.0 8.2 4.56 1000 1
TABLE 3b. Velocity Model for ESP 16
Depth, km Velocity, km/s Quality factor Number of layers
P Wave S Wave
0.00 1.51 0 50 0 5.436 1.52 0 50 1 5.636 1.688 0.51 50 4 5.636 1.757 0.531 50 0 5.938 1.757 0.531 50 1 5.938 2.059 0.622 50 0 6.271 2.061 0.622 50 4 6.63 3.5 1.057 50 10 6.63 4.97 2.704 333 0 8.04 5.809 3.16 333 14 8.04 6.55 3.563 333 0 9.79 6.88 3.743 333 12
10.92 7.15 3.89 333 12 13.585 7.22 3.927 333 12 13.585 7.995 4.613 1000 0 20.0 8.17 4.714 1000 8
TAB LE 3c. Velocity Model for ESP 17
Depth, km Velocity, km/s Quality factor
0.0 5.405 5.405 5.549 5.661 5.661 5.778 5.778 5.881 5.881 6.255 6.255 6.562 6.562 7.892 7.892
10.21 13.5 14.6 14.6 20.0
P Wave
1.516 1.516 1.634 1.634 1.726 1.72 1.72 1.799 2.025 2.036 2.354 2.462 3.428 5.345 5.782 6.56 7.04 7.19 7.964 8.2 8.2
Number of layers
S Wave
0 50 1 0 50 1 0.654 50 0 0.654 50 1 0.69 50 5 0.688 50 2 0.688 50 1 0.72 50 0 0.81 50 6 0.814 50 0 0.942 50 4 0.985 50 0 1.035 50 8 2.907 333 0 3.145 333 4 3.568 333 0 3.83 333 12 3.911 333 12 4.595 1000 12 4.731 1000 0 4.731 1000 1
MORRIS ET AL.: SEISMIC STRUCTURE IN WESTERN NORTH ATLANTIC 13,895
TABLE 3d. Velocity Model for ESP 18
Velocity, km/s Quality factor Number of layers P Wave
0.0 1.511 5.122 1.511 5.122 1.652 5.279 1.652 5.279 1.743 5.394 1.8 5.47/• 1.84 5.474 1.932 5.939 1.932 5.939 2.135 6.036 2.155 6.053 2.275 6.053 2.409 6.61 2.433 6.61 4.84 7.73 5.395 7.73 6.625 9.279 7.043
13.8 7.15 13.8 7.8 17.0 8.118
S Wave
0 50 1 0 50 1 0.499 50 0 0.499 50 1 0.526 50 0 0.544 50 6 0.555 50 4 0.583 50 0 0.583 50 1 0.645 50 0 0.651 50 4 0.687 50 5 0.728 50 0 0.735 333 4 2.633 333 0 2.935 333 14 3.604 333 12 3.831 333 12 3.888 333 10 4.53 1000 0 4.688 1000 10
ridge-parallel extensional faults commonly mapped at slow- spreading ridges [e.g., Kong et al., 1988]. These faults can be seismically imaged because of the impedance contrast generated from fracturing and alteration occurring along the fault plane; however, their surface expression could be small and easily overprinted by subsequent volcanism or mass- wasting.
The origin of the subhorizontal events seen in the upper crust in this area is far less clear, and there are several possible explanations for these features. The ESP velocity solutions from this area document a velocity discontinuity or steep transition zone at the base of layer 2 (Figures 15 and 17). It is therefore tempting to interpret the prominent, laterally continuous subhorizontal events illustrated in Figure 7 as a
reflection from the seismic layer 2/layer 3 boundary. The shallow, flat-lying reflector seen on CDP reflection profile 710 (Figure 16) near 8 km depth provides the best evidence for this correlation in the Blake Spur data set; the ESP shot along this same line placed the layer 2/layer 3 boundary at 7.7 km depth, within -250 m of this event (Figure 17). However, throughout most of the Blake Spur area the CDP reflections are not associated with this transition, and generally, the crust is nonreflective across the layer 2/layer 3 boundary. This observation can be reconciled with the ESP velocity solutions if the layer 2/layer 3 boundary is a steep transition zone rather than a first-order discontinuity, since this will sharply decrease amplitudes at normal incidence.
Minshull and $ingh [1993] have modeled precritical
12
14
ESP CROSSING
0 2 4• 6 8 I I I I I I I I I
Line 704 N Expanding Spread Profile 15
• '•' ':' *..,. '•-• ',• '•'•':A'•'•"": ':'• .:' •'• ",'"•':•"•:"• ..%•?A :•':' -'"'•'•% -• "" :•'"'••, "• ,,,:• '•,, ..'•';'2•'•-*:.'•}•,..•-•,•'•"•. ,.:'•?'•-
NO VERTICAL EXAGGERATION
Fig. 14. Reflection line 704 associated with ESP 15 (see Figure 3 for the location). The profile of velocity-versus-depth derived from ESP 15 (Figure 15) is superimposed on the record section at the ESP midpoint. Note the abrupt increase in velocity associated with the top of the oceanic basement.
13,896 MORRIS ET AL.: SEISMIC STRUCTURE IN WESTERN NORTH ATLANTIC
reflections from short, flat-lying events in the upper kilometer of crust in the Blake Spur area, and their models suggest that there may be discrete velocity steps or alternating high- and low-velocity layers which could produce these' subhorizontal reflections. They attribute the impedance contrasts, necessary to generate the reflections, to large porosity variations within the shallow extrusive pillow basalt sequence. However, these reflections could also be due to intrusion of sills into the shallow crust.
Mineralogic or chemical alteration boundaries caused by hydrothermal circulation in the newly emplaced crust may also cause significant impedance contrasts in the shallow crust. A general metamorphic zonation from zeolite (extrusives) to greenschist (dikes) to amphibolite (gabbros) facies is a feature common to most ophiolites. In both the Samail ophiolite in Oman and the Bay of Islands Complex, for example, there is evidence for pervasive hydrothermal alteration in the pillow basalts and sheeted dike complex of the upper 1.5-2 km of
Expanding Spread Profile 15
I I 14
10 20 RANGE (kilometers) 40 50
I I
-••II••I!;I•i'i•••••••••I•ii••••••••••I;•••••I•I;;I;i•••••••••••II;!•i••.•••••I•t••••••••••••I•i•`i[I•Ii•i••••••!•i••••i••••••• I -!llllllllllllll111111111111111111;lll!11111 IllIll II,1111111iili!1111 Ililll,11;ll llllll!iftlttillt,l,rIIIIlllll,111!litltllllllllIlliliillitl
ß , ß III l,1111illll,•ll II•l,l•l,l, iiiltltt,t•l,lllll,111il:,IIlllllli,•, Reflectivity Synthetic 1 [ I I
I I
I III. iI,i
II,•111,••,,•,,1!•••/•q!11••=!;•!lll•,••••l••i • , •, •, •,, •,• !t••;••tl!!!,!•••••;[l!!1111111•l";•11!ill••••;i•llllillll - '•, '•-
• lower I
16 4 .
14
Fig. 15. ESP 15 record section (top) with corresponding reflectivity synthetic (bottom) for the velocity-versus-depth model (inset). See Figure 3 for the location of ESP 15. Both sections are plotted with an 8-km/s reducing velocity. The numbers (1-4) on the velocity model in the inset correspond to the arrivals on the seismograms.

MORRIS ET AL.: SEISMIC STRUCTURE IN WESTERN NORTH ATLANTIC 13,897
crust [Nehlig and Juteau, 1988; Casey et al., 1981]. The estimates for the depth of pervasive hydrothermal alteration in the oceanic crust, derived from ophiolite studies, correspond to the depth of the subhorizontal reflectors (1.5-2 km), suggesting that they may be related. Alteration processes probably vary in time because of the cyclic nature of a ridge crest hydrothermal system, possibly explaining the spatial variability in the depth and occurrence of the subhorizontal reflector.
Lastly, it is possible that at least some of these events are structural in origin and are caused by out-of-plane energy reflected off of the upper or whole crust dipping events. For example, reflections from a dipping surface would appear as a flat event on seismic profiles oriented parallel to the strike of these faults. A difficulty with this explanation is that many of these subhorizontal events are consistently found within a narrow depth range of 1.5 to 2 km, which we would not expect given that the seismic profiles are randomly located relative to the location of these dipping events.
Lower Crust Structure
Seismic layer 3 is characterized by velocities of 6.5-7.2 km/s, which smoothly vary with depth from steeper (-0.2 s-l) velocity gradients to very low (< 0.1 s -1) gradients at its base. Although somewhat thicker than normal, total crustal thicknesses in this area are within the range determined for Mesozoic crust in the western North Atlantic [Purdy, 1983; White eta/., 1992]. In the lower crust, there are prominent bands of dipping reflectors which cut through the lower crust and flatten out near the base of the crust in a broad zone of
high reflectivity. These events are observed in the lower crust on both ridge-normal and ridge-parallel profiles and have apparent dips of 200-30 ø . On ridge-normal profiles, the majority of these events dip to the east, toward the paieo-
spreading center, while on ridge-parallel profiles, most of the events dip south toward the Blake Spur FZ. In some cases, especially evident on ridge-parallel profiles, these reflectors can be traced from the crust/mantle boundary up into the shallow crust (the whole crustal events described above). We are confident that these events are not scattering artifacts arising from rough basement topography, since the stacking velocity analyses indicate that their moveout velocities are consistent with reflections from within the crustal section.
One of the most important new observations, providing insight into the origin of these dipping events, is their occurrence on both ridge-normal and ridge-parallel profiles. We have used the average apparent strikes and dips of the lower crustal dipping events from the ridge-normal, ridge- parallel, and oblique profiles (NAT lines 15, 709 and, 720) compiled in Table 2 to perform a classical stereonet structural analysis to estimate the true strike and dip of these events, assuming a planar structure (Figure 20). If the lower crust dipping events observed on both the ridge-normal and ridge- parallel profiles are caused by reflections off the same planar structure, this structure would have to strike N50øE and have a
dip of 35 ø to the SE (Figure 20, upper panel). This orientation is -30 ø oblique to the strike of the paleo-spreading center (N20øE). This obliquity is difficult to reconcile with the well- documented axis-parallel structural fabric of oceanic crust away from major fracture zones. Alternatively, these events could be caused by two (or more) different structures (Figure 20, lower panel). A planar structure striking N20øE (parallel to the paleo-ridge) and dipping 300-40 ø to the east can adequately explain the eastward-dipping events on the ridge-normal lines and oblique profiles (Lines 709, 720, and NAT 15). A second Plane, striking N18øW and dipping 30 ø to the southwest, is then required to explain the apparent dips of the southward and westward-dipping events observed on the ridge-parallel and ridge-normal profiles. The N20øE structure is consistent with
ESP CROSSING
Line 710 N Ex Profile 18
12
14
NO VERTICAL EXAGGERATION
Fig. 16. Reflection line 710 associated with ESP 18 (see Figure 3 for the location). The profile of velocity-versus-depth derived from ESP 18 (see Figure 17) is superimposed on the record section at the ESP midpoint. Note that the velocity discontinuity at the base of seismic layer 2 (-7.8 km) does not directly correspond to the subhorizontal reflector at -8 km depth.

13,898 MORPdS ET AL.: SEISMIC STRUCrURE IN WESTERN NORTH ATLANTIC
the expected ridge-parallel structural fabric, but this interpretation requires an additional mechanism to produce a structural fabric that strikes 38 ø obliquely to the paleo-ridge axis.
Stereonet analysis assumes that the reflectors are caused by planar structures cutting through the crust. It is possible that in the Blake Spur area we are imaging a more complex three- dimensional structural surface with an elongate, asymmetric shape that strikes parallel to the paleo-ridge and dips both toward the rise axis and the adjacent fracture zone. This type of nonplanar structure would explain the problematic orientations that were the result of the stereonet analysis.
Magmatic/deformation layering. McCarthy et al. [1988] interpreted the dipping events in the lower crust, seen on NAT line 15, as preserved images of magmatic layering associated with the cooling edge of a large (>10-km half width) magma
chamber. They explained the systematic spacing of the dipping reflectors as being due to the episodic inflation of the magma chamber and subsequent faulting. Their interpretation of these events as cumulate layering was strongly influenced by field evidence for layered gabbros within the lower crust section of some ophiolites, including the Oman ophiolite [e.g., Sinewing, 1981; Pallister and Hopson, !981; Nicolas, 1989]. This layering, which progressively increases in dip upsection, has been interpreted as cumulates deposited on the floor of a large axial magma chamber [Sinewing, 1981; Pallister and Hopson, 1981], although Nicolas [1989] proposed an alternative model.
Since these models were proposed, new seismic constraints on the existence of magma chambers at midocean ridges have been discovered that effectively preclude the existence of large, steady-state axial magma chambers, even at fast-
Expanding Spread Profile 18
I I
lO 20 30 RANGE (kilometers) 50 60 70
IIlllllllllllllllllllllllll;llJlllllll;IIilJll - VELOCITY (km/sec)
2 4 6 8
4 [, ,j• .... -- t• lower [ ch crust / 12 -
4 16
Fig. 17. ESP 18 record section (top) with corresponding reflectivity synthetic (bottom) for the velocity-versus-depth model (inset). See Figure 3 for the location of ESP 18. Both sections are plotted with an 8-knds reducing velocity. The numbers (1-4) on the velocity model in the inset correspond to the arrivals on the seismograms.
14
14

MORRIS ET AL.: SEISMIC STRUCTURE IN WESTERN NORTH ATLANTIC 13,899
DEPTH (KM) o
I• .-.iiiii:i!::.:..' "'
..
.....
..
'.' -'.:. ::.::... "i: '::.:..:':':::'i Z'.' ......
.....:.:.:.................................
. .......................................
:':..::{...-:i:::'"': '.:':::-' ":: ::".i?.-' '.:.:?" :i::..:.:ii:i" ' ':i.:: ::!!:i.i!
.. ...... ...................... .....
': '-':":::7':::'-::..i: ::i' ':i.'.{!.i:! ...
.....
......
.......
'.j .. .....:
..
:...
..
.: .
:' :'::.::i.'.:-.: : ......
:!iii'::iii: i':::':.! ...
...
.... .
.
.:.. ..
.....................................
LLI Z
==============================================
(•/) HJ. d_•/

13,900 MORRIS ET AL.: SEISMIC STRUCTURE IN WESTERN NORTH ATLANTIC
' • ' ':'• "-:: .. •'"•*•:'"•:: ........ '••_._et•t edirnents ;L : ....... '•;•..-•': ............. .• •.•"..':-;'•, ,-: :•:, . . "
RIDGE NORMAL PROFILE Fig. 19. Cartoon showing the range of intracrustal events observed on both ridge-normal and ridge-parallel reflection profiles in the Blake Spur area. With the available data, the geometrical relationship between these various reflectors cannot be unambiguously determined.
ß
N
R t N50E .......... 35 ø SE
W ," + E i
i
I i i
,720
spreading ridges [Detrick eta/, 1987, 1993]. Instead, the crust appears to be formed from the injection of sill-like bodies at relatively high levels within the crust [Sinton and Detrick, 1992]. At fast-spreading ridges, this magma sill is a quasi- steady-state feature, whereas at slow-spreading ridges its is highly episodic. Henstock et al. [1993] and Phipps Morgan and Chen [1993] have shown that ductile flow of the crust away from a shallow intrusion zone can produce a deformation fabric in the lower crust like that observed in the Oman
ophiolite. Their models predict that the deformation fabric will be best developed at fast-spreading ridges rather than in slow-spreading regimes because the accumulated strain during the flow process is most intense at deeper crustal levels and there are stronger gradients in the accumulated strain at the higher spreading rates. Since the crust in the Blake Spur area formed at relatively low spreading rates (<19 mm/yr, half rate), this strain-related layering is expected to be less important. Another result of their modeling is that ductile flow of the lower crust away from the ridge axis will always produce a strain-related fabric that dips toward the ridge axis [Henstock eta/., 1993; Phipps Morgan and Chen, 1993]. The extensive additional reflection coverage available from our recent survey has revealed reflectors far more diverse in orientation than was originally imagined. There are a large number of lower crustal events which dip away from the paleo- ridge, including an equal number seen on ridge-parallel profiles, arguing against strain-related deformation fabric as the origin for these reflectors.
Tectonic origin. The character of the dipping events seen in the Blake Spur data set and the abundant evidence for the importance of faulting at slow spreading ridges, like the Mid- Atlantic Ridge, strongly suggest that these features may be related to large-scale faulting during mechanical extension of the oceanic lithosphere. High-resolution bathymetric and side-scan sonar surveys of slow spreading ridges reveal that faulting and fissuring are active throughout the rift valley floor [Kong eta/., 1988]. The inferred dip and spacing of most of these faults suggest that they probably do not penetrate more than a few hundred meters into the crust (e.g., the upper crust dipping events discussed above). However, there is evidence for the presence of large faults that bound the rift valley, which we speculate may be responsible for both
s
N
+ E •i, 30o '""'• ":'-•'R N
s Fig. 20. Summary of stereonet analysis to determine the geometrical relationship of the lower crust dipping events observed on the orthogonal ridge-normal (RN) and ridge-parallel (RP) profiles and three oblique lines (NAT line 15, and lines 709 and 720). The dips plotted are from Table 2. Upper diagram assumes events observed on both the ridge-normal and ridge-parallel profiles are caused by reflections off the same planar structure. The lower diagram fits these events with two different structures. With the available data from the Blake Spur area, we cannot unambiguously determine the geometrical relationship between the dipping lower crustal reflectors observed on the ridge-normal and ridge- parallel profiles.
the lower crust and whole crust dipping events observed in the Blake Spur data set.
A basic assumption in this interpretation is that the dipping events imaged only in the lower crust are related to those that can be traced through the entire crustal section. Several factors may contribute to the imaging of these events in thee lower crust. The events generally increase in dip upsection,
MORR/S Er AL.: SF•SM/C STRUCrURE D• WESTERN NORTH ATLANTIC 13,901
making them more difficult to image by the CDP technique. Coherent noise from scattering at the sediment-basement interface could also obscure these events in the midcrust to
upper crust [White et al., 1990]. The contrasting physical properties in the upper and lower crusts may contribute to the observed differences in crustal reflectivity. For example, as faults propagate to the surface, some deformation may be absorbed within the fractured, porous upper crust, resulting in a diffuse zone that may be less reflective [White et al., 1990]. In addition, observations made by Dick et al. [1991] at ODP site 735B that deformation-driven compaction of a partially solidified gabbroic body can cause late-stage intercumulus liquids to migrate into porous ductile shear zones have led Mutter and Karson [1992] to propose that high-density banding along these shear zones may give rise to dipping reflectors that would be confined to the lower crust.
The principal uncertainty in tectonic models for the origin of the dipping reflectors observed in the Blake Spur area centers around whether we are imaging one (or more) separate structures in the lower crust. Two distinct types of faults may explain the diversity of reflectors [White et al., 1990]. In this model, one class of faults strikes parallel to the palco-ridge and is responsible for the eastward and westward facing normal faults that form as a result of mechanical extension of young lithosphere during the crustal accretion process to produce the features observed on the ridge-normal profiles. A second class of faults striking east-west and dipping to the south is needed to explain the southward-dipping events seen on the ridge- parallel profiles. White et al. [1990] propose that these faults form off-axis as a result of large-scale crustal failure in response to the accumulation of thermal stresses in the cooling and thickening lithosphere.
Mutter and Karson [1992] have suggested an alternative model that explains the presence of dipping reflectors on both the ridge-normal and ridge-parallel profiles as being due to a single structural surface whose subsurface expression is a large, low-angle detachment surface with an elongate, asymmetric crescent shape. Their model draws heavily on the structures observed in major continental rift systems such as the East African Rift [e.g., RosendaM, 1987; Ebinger, 1989; Karson and Curtis, 1991] and involves a single major detachment complex underlying each spreading center cell. The boundary faults associated with these detachment surfaces form alternating half graben, which link together via accommodation zones to form the rift axis. When imaged along a ridge-normal profile, this surface dips steeply toward the ridge axis; when viewed along a ridge-parallel line, this structure dips at a much smaller angle away from the accommodation zone.
Neither of these tectonic models offers a completely satisfactory explanation of all the features observed in the Blake Spur data set. For example, the predominance of southward-dipping events on the ridge-parallel profiles in the Blake Spur area is not readily predicted by either model. Although there is good evidence for the accumulation of thermal stresses off-axis as the lithosphere cools and thickens [Haxby and Parmentier, 1988], there is no independent evidence that these stresses can cause the large-scale crustal failure implied by the White et al. [1990] model. The existence of large detachment faulting, as called for by the Mutter and Karson [1992] model, is hard to reconcile with the relatively constant crustal thicknesses observed away from the fracture zone (Figure 18).
Implications for crustal accretion processes. The Blake Spur data set has revealed a level of three-dimensional structural complexity in the oceanic crust, especially in the lower crust, that was previously unknown and is not yet entirely understood.
If, as we suggest, the dipping reflectors observed in the lower crust are images of faults, our results strongly suggest that some of the faults formed at slow spreading ridges can cut through the entire crustal section. This is consistent with teleseismic and microseismic investigations at the Mid- Atlantic Ridge that document the existence of large, normal faults bordering the rift valley that rupture the crustal section down to depths of 8-10 km [Toomey et al., 1985, 1988]. The dipping reflectors observed in the Blake Spur area do not generally offset subhorizontal reflectors, implying that these faults do not accommodate large amounts of differential motion. However, they may provide a permeable pathway for water, promoting alteration and brecciation along the fracture planes and allowing hydrothermal fluids to penetrate to the deepest crustal levels.
Another striking feature of the Blake Spur data set is the large variation in crustal reflectivity in this area. There are regions where the crust is acoustically transparent over distances of up to 50 km and others where there are numerous, regularly spaced reflectors that appear very faultlike in character. If the high-reflectivity zones are indicative of more extensive faulting and crustal alteration, the variations in crustal reflectivity observed in the Blake Spur area may suggest a temporal variation in the partitioning of spreading between magmatism and tectonism. Given the spreading rates involved, these variations occur on a time scale of a few
million years. Despite the wide variations in crustal reflectivity, the overall crustal structure in the Blake Spur area is relatively uniform, with similar crustal thicknesses and velocity layering throughout the area away from the fracture zones.
Although the Moho is usually associated with a discrete velocity discontinuity or transition in refraction data, in the Blake Spur area the Moho often has a banded appearance, with alternating regions of high and low reflectivity over a significant depth range. Collins et al. [1986] modeled the oceanic Moho as a series of mafic and ultramafic lenses which
produced high-amplitude reflections. This model of alternating thin layers can explain the complex and extremely variable Moho boundary observed in the Blake Spur area.
The single most important uncertainty that remains for these data is a clear definition of the true structural
relationships among the diverse dipping events which have been imaged on the ridge-normal and ridge-parallel profiles in the Blake Spur area. To fully understand the geological significance of these features full three-dimensional seismic imaging of the reflectivity and crustal structure in this area are required.
CONCLUSIONS
On the basis of the multichannel reflection and wide-angle reflection/refraction data presented in this paper, we can draw the following conclusions regarding the seismic structure of Cretaceous-aged crust in the western North Atlantic:
1. Although the oceanic crust away from the Blake Spur FZ is relatively uniform in terms of its thickness and seismic velocity structure, it displays a wide range of intracrustal

13,902 MORRIS ET AL.: SEISMIC STRUCTURE IN WESTERN NORTH ATLANTIC
reflectors and variations in crustal reflectivity on both ridge- normal and ridge-parallel profiles that suggest a complex internal structure. This level of structural complexity in oceanic crust has not been well documented in the past and is not yet fully understood.
2. The upper crust (layer 2) is 1.1 to 1.8 km thick and is characterized by steep velocity gradients with a few velocity discontinuities or sharp transition zones including one at the layer 2/layer 3 boundary. The upper crust can be highly reflective and contains both subhorizontal (or shallow dipping) events and more steeply dipping reflectors that cut through the entire upper crust section before fading out in the more acoustically transparent midcrust.
3. The subhorizontal upper crust reflectors are not generally associated with the seismic layer 2/layer 3 boundary, and their origin is unclear. We interpret the steeply dipping reflectors seen in the upper crust as the subsurface expression of ridge- parallel extensional faults that were active when this crust formed 150 Myr ago.
4. The lower crust in the Blake Spur area shows distinct regions of both high and low reflectivity and numerous linear or concave-upward dipping reflectors. These events, imaged with similar frequency on both ridge-parallel and ridge-normal profiles, usually consist of packages of high-amplitud• reflectors, 4-5 km in length, dipping at angles of 20o-30 ø that usually flatten out in a diffuse zone of high reflectivity near the base of the crust. Sometimes these events are observed to
cut through the entire crust. Where this is the case, the Moho is not offset, large displacements of basement are not observed, and the crustal thickness remains relatively uniform.
5. We interpret the lower crust and whole crust dipping events as the subsurface expression of major fault systems that have ruptured the entire crustal section down to depths of 8-10 kin. With the available data in the Blake Spur area, we cannot unambiguously determine the geometrical relationship between the dipping lower crust reflectors observed on the ridge-normal and ridge-parallel profiles.
6. The base of the crust is a comparatively indistinct boundary usually associated with a 1-2 km thick band of diffuse high reflectivity.
Acknowledgments. We thank the crew, officers, and science party of the R/V Robert Conrad and the RRS Discovery for their dedication, hard work and cooperative spirit during the two-ship field program. This study would not have been possible without the help of Rene Forman, Joyce Alsop, and John Diebold in data processing and interpretation. The modeling of the ESPs was done at Cambridge University, and the help we received from Dave Lyness and Sue Horsefield is greatly appreciated. This experiment and data analyses were funded by the Office of Naval Research and the National Science Foundation (U.S. scientists) and the Natural Environment Research Council (U.K. scientists).
REFERENCES
Banda, E., C. R. Ranero, and J. J. Danobeitia, Seismic boundaries of the eastern central Atlantic Mesozoic crust from MCS data, Geol. Soc. AM Bull., 104, 1340-1349, 1992.
Casey, J. F., J. F. Dewey, P. J. Fox, J. A. Karson, and E. Rosencrantz, Heterogeneous nature of the oceanic crust and upper mantle: A perspective from the Bay of Islands Ophiolite, in The Sea, vol. 7, edited by C. Emiliani, pp. 305-338, Wiley-Interscience, New York, 1981.
Chapman, C. H., A new method for computing synthetic seismograms, Geophys. J. R. Astron. Soc., 54, 481-518, 1978.
Chapman, C. H., and R. Drummond, Body-wave seismograms in inhomogeneous media using Maslov asymptotic ray theory, Bull. Seismol. Soc. Am., 72, S277-S317, 1982.
Chapman, C. H., and J. A. Orcutt, The computation of body wave synthetic seismograms in laterally homogeneous media, Rev. Geophys., 23, 105-163, 1985.
Collins, J. A., T. M. Brocher, and J. A. Karson, Two-dimensional seismic reflection modeling of the inferred fossil oceanic crust/mantle transition in the Bay of Islands Ophiolite, J. Geophys. Res., 91, 12,520-12,538, 1986.
Collins, J. A., M. G. Purdy, and T. M. Brocher, Seismic velocity structure at Deep Sea Drilling Project Site 504B, Panama Basin: Evidence for thin oceanic crust, J. Geophys. Res., 94, 9283-9302, 1989.
Detrick, R. S., P. Buhl, E. Vera, J. Mutter, J. Orcutt, J. Madsen, and T. Brocher, Multichannel seismic imaging of a crustal magma chamber along the East Pacific Rise between 9øN and 13øN, Nature, 326, 35- 41, 1987.
Detrick, R. S., A. Harding, J. Orcutt, G. Kent, J. Mutter, and P. Buhl, Seismic structure of the southern East Pacific Rise, Science, 259, 499-503, 1993.
Dick, H. J. B., H. Schouten, P.S. Meyer, D. G. Gallo, H. Bergh, R. Tyce, P. Patfiat, K. T. M. Johnson, J. Snow, and A. Fisher, Tectonic evolution of the Ariantis II fracture zone, Proc. Ocean Drill. Program, Sci. Results, 118, 359-398, 1991.
Diebold, J. B., and P. L. Stoffa, The traveltime equation, tau-p mapping and inversion of common midpoint data, Geophysics, 46, 238-254, 1981.
Ebinger, C. J., Geometric and kinematic development of border faults and accommodation zones, Kivu-Rusizi Rift, Africa, Tectonics, 8, 117-133, 1989.
Fuchs, K., and G. Muller, Computation of synthetic seismograms with the reflectivity method and comparison with observation, Geophys. J. R. Astron. Soc.,23, 417-433, 1971.
Grow, I. A., and R. G. Markl, IPOD-USGS multichannel seismic reflection profile from Cape Hatteras to the Mid-Atlantic Ridge, Geology, 5, 625-630, 1977.
Haxby, W. F., and E. M. Parmentier, Thermal contraction and the state of stress in the oceanic lithosphere, J. Geophys. Res., 93, 6419- 6429, 1988.
Henstock, T. J., A. W. Woods and R. S. White, The accretion of oceanic crust by episodic sill intrusion, J. Geophys. Res., 98, 4143- 4161, 1993.
Hopper, J. H., J. C. Mutter, C. Z. Mutter, R. L. Larson, and the Northwest Australia Study Group, Magmatism and rift margin evolution: Evidence from northwest Australia, Geology, 20, 853-857, 1992.
Karson, J. A., and P. C. Curtis, Tectonic and magmatic processes in the eastern branch of the East African Rift and implications for magmatically active continental rifts, J. Afr. Earth Sci., 8, 431-450, 1989.
Kent, D. V., and F. M. Gradstein, A Cretaceous and Jurassic geochronology, Geol. Soc. A• Bull., 96, 1419-1427, 1985.
Klitgord, K. D., and H. Schouten, Plate kinematics of the central Ariantic, in The Geology of North America, vol. M, The Western North Atlantic Region, edited by P. R. Vogt and B. E. Tucholke, p. 351-378, Geological Society of America, Boulder, CO, 1986.
Kong, L. S. L., R. S. Detrick, P. J. Fox, L. A. Mayer, and W. B. F. Ryan, The morphology and tectonics of the MARK area from Sea Beam and Sea MARC I observations (Mid-Atlantic Ridge 23øN), Mar. Geophys. Res., 10, 59-90, 1988.
McCarthy, J., J. C. Mutter, J. Morton, N. Sleep, and G. Thompson, Relic magma chamber structures preserved within Mesozoic North Atlantic crust? Geol. Soc. AM Bull., 100, 1423-1436, 1988.
Minshull, T. A., and S.C. Singh, Shallow structure of oceanic crust in the western North Atlantic from seismic waveform inversion and
modeling, J. Geophys. Res., 98, 1777-1792, 1993. Minshull, T. A., R. S. White, J. C. Mutter, P. Buhl, R. S. Detrick, C. A.
Williams, and E. Morris, Crustal structure at the Blake Spur fracture zone from expanding spread profiles, J. Geophys. Res., 96, 9955- 9984, 1991.
Mountain, G. S., and B. E. Tucholke, Mesozoic and Cenozoic geology of the U.S. Ariantic continental slope and rise, in Geologic Evolution of the United States Atlantic Margin, edited by C.W. Poag, pp. 293- 341, Van Nostrand Reinhold, New York, 1985.

MORRIS ET AL.: SEISMIC STRUCTURE IN WESTERN NORTH ATLANTIC 13,903
Musgrove, L. A., and J. A. Austin, Intrabasement structure in the southern Angola Basin, Geology, 11, 169-173, 1983.
Mutter, J. C., and J. A. Karson, Structural processes at slow-spreading ridges, Science, 257, 627-634, 1992.
Mutter, J. C., R. S. Detrick, and the NAT Study Group, Multichannel seismic evidence for anomalously thin crust at oceanic fracture zones, Geology, 12, 534-537, 1984.
Mutter, J. C., and the NAT Study Group, Multichannel seismic images of the oceanic crust's internal structure: Evidence for a magma chamber beneath the Mesozoic Mid-Atlantic Ridge, Geology, 13, 629-632, 1985.
NAT Study Group, North Atlantic Transect: A two-ship, wide aperture multichannel seismic investigation of the oceanic crust, J. Geophys. Res., 90, 10,321-10,341, 1985.
Nehlig, P., and T. Juteau, Deep crustal seawater penetration and circulation at ocean ridges: Evidence from the Oman ophiolite, Mar. Geol., 84, 209-228, 1988.
Nicolas, A., Structures of Ophiolites and Dynamics of Oceanic Lithosphere, Petrol. Struct. Geol. Ser. vol. 4, pp. 3-320, Kluwer Academic, Hingham, Mass., 1989.
Pallister, J. S., and C. A. Hopson, Samall ophiolite plutonic suite: Field relations, phase variation and layering and a model of spreading ridge magma chamber, J. Geophys. Res., 86, 2593-2644, 1981.
Phipps Morgan, J., and Y. J. Chen, The genesis of oceanic crust: Magma injection, hydrothermal circulation, and crustal flow, J. Geophys. Res., in press, 1993.
Purdy, G. M., The seismic structure of 140 my old crust in the Central Atlantic Ocean, Geophys. J. R. Astron. Soc., 72, 115-138, 1983.
Purdy, G. M., and J. I. Ewing, Seismic structure of the ocean crust, in The Geology of North America, vol. M, The Western North Atlantic Region, edited by P. R. Vogt and B. E. Tucholke, 313-330, Geological Society of America, Boulder, Colo., 1986.
Rosendahl, B. R., Architecture of continental rifts with special reference to East Africa, Annu. Rev. Earth Planet. Sci., 15, 445- 503, 1987.
Rosendahl, B. R., H. Groschel-Becker, J. Meyers, and K. Kaczmarick, Deep seismic reflection study of a passive margin, southeastern Gulf of Guinea, Geology, 19, 291-295, 1991.
Sinton, J. M., and R. S. Detrick, Mid-ocean ridge magma chambers, J. Geophys. Res., 97, 197-216, 1992.
Smewing, J. D., Mixing characateristics and compositional differences in mantle-derived melts beneath spreading axes: Evidence from cyclically layered rocks in the ophiolite of North Oman, J. Geophys. Res., 86, 2645-2659, 1981.
Spudich, P., and J. A. Orcutt, A new look at the seismic velocity structure of the oceanic crust, Rev. Geophys., 18, 627-645, 1980a.
Spudich, P., and J. A. Orcutt, Petrology and porosity of an oceanic crustal site: Results from wave form modeling of seismic refraction data, J. Geophys. Res., 85, 1409-1433, 1980b.
Stoffa, P. L., T. K. Kan, P. Buhl, and H. Kutschale, The application of split-step algorithm to the migration of marine seismic data, paper presented at the 47th Annual Meeting, Soc. of Exp. Geophys., Calgary, Alberta, Canada, Sept. 1977.
Stoffa, P. L., P. Buhl, T. J. Herron, T. K. Kan, and W. J. Ludwig, Mantle reflections beneath the crestal zone of the East Pacific Rise from
multi-channel seismic data, Mar. Geol., 35, 83-97, 1980. Toomey, D. R., S.C. Solomon, G. M. Purdy, and M. H. Murray,
Microearthquakes beneath the Median Valley of the Mid-Atlantic Ridge near 23øN: Hypocenters and focal mechanisms, J. Geophys. Res., 90, 5443-5458, 1985.
Toomey, D. R., S.C. Solomon, and G. M. Purdy, Microearthquakes beneath the median valley of the Mid-Atlantic Ridge near 23øN: Tomography and tectonics, J. Geophys. Res., 93, 9093-9112, 1988.
White, R. S., Atlantic oceanic crust: seismic structure of a slow- spreading ridge, in Ophiolites and Oceanic Lithosphere, vol. 13, edited by I. G. Gass, S. J. Lippard, and A. W. Shelton, pp. 101-111, Blackwell Scientific, Boston, Mass., 1984.
White, R. S., R. S. Derrick, J. C. Mutter, P. Buhl, T. Minshull, and E. Morris, New seismic images of oceanic crustal structure, Geology, 18, 462-465, 1990.
White, R. S., D. McKenzie, and R. K. O'Nions, Oceanic crustal thickness from seismic measurements and rare earth element
inversions, J. Geophys. Res, 97, 19,683-19,716, 1992.
P. Buhl, J. C. Mutter, and W. Su, Lamont-Doherty Earth Observatory, Palisades, NY 10964.
R.S. Detrick, Woods Hole Oceanographic Institution, Woods Hole, MA 02543.
T. A. Minshull, and R. S. White, Bullard Laboratories, University of Cambridge, CB3 0EZ, England.
E. Morris, National Renewable Energy Laboratory, 409 12th Street, SW, Washington, DC 20024.
(Received June 29, 1992; revised February 16, 1993; accepted March 4, 1993.)