Seismic velocity and Poisson’s ratio tomography of the crust beneath East Anatolia
18
ORIGINAL ARTICLE Seismic velocity and Poisson’ s ratio tomography of the crust beneath southwest Anatolia: an insight into the occurrence of large earthquakes Mohamed K. Salah & Sakir Sahin & Cem Destici Received: 1 May 2007 /Accepted: 1 August 2007 / Published online: 11 Septeber 2007 # Springer Science + Business Media B.V. 2007 Abstract The western part of Anatolia is one of the most seismically and tectonically active continental regions in the world, and much of it has been undergoing NS-directed extensional deformation since the Early Miocene. In this study, we determine 3-D tomographic images of the crust under the southwestern part of the North Anatolian Fault Zone by inverting a large number of arrival time data of P and S waves. From the obtained P- and S-wave velocity models, we estimated the Poisson’ s ratio structures for a more reliable interpretation of the obtained anomalies. Our tomographic results confirmed the major tectonic features detected by previous studies and revealed new structural heterogeneities related to the active seismotectonics of the studied area. High P-wave velocity anomalies are recognized near the surface, while at deeper crustal layers, low P-wave velocities are widely distributed. The crustal S-wave velocity and Poisson’ s ratio exhibit more structural heterogeneities compared to the P-wave velocity structure. Micro- earthquake activity is intense along highly heteroge- neous zones in the southwestern part, which is characterized by low to high P-wave velocity, low S- wave velocity, and high Poisson’ s ratio anomalies. Large earthquakes are also concentrated in zones dominated by low velocities and low to high Poisson’ s ratios. Results of the checkerboard and synthetic tests indicate that the imaged anomalies are reliable features down to a depth of 25 km. Moreover, they are consistent with many geological and geophysical results obtained by other researchers along the south- western part of the North Anatolian Fault Zone. Keywords Crustal structure . Seismic tomography . Seismic wave velocity . Poisson’ s ratio . Southwest Anatolia 1 Introduction The Aegean Sea and the surrounding land areas (Fig. 1) have been considered as a “natural geophys- ical laboratory” due to the wide variety of tectonic processes encompassed (Kiratzi 2002). Plate motion models (De Mets et al. 1990) suggest that the Arabian and African plates move northwards relative to Eurasia at rates of ∼25 and 10 mm/year, respectively. The northward movement of the Arabian plate causes the westward extrusion of the Anatolian plate (McKenzie 1970, 1972, 1978). Recent synthesis of geodetic data (Papazachos 1999; McClusky et al. 2000) confirms the first-order rigid behavior of Anatolia and introduces a rigid Aegean plate. The relative motion between Anatolia and the Aegean plate is associated with significant internal deforma- J Seismol (2007) 11:415–432 DOI 10.1007/s10950-007-9062-2 DO09062; No of Pages M. K. Salah : S. Sahin (*) : C. Destici Geophysical Department, Faculty of Engineering and Architecture, Suleyman Demirel University, Cunur 32260, Isparta, Turkey e-mail: [email protected]
Transcript of Seismic velocity and Poisson’s ratio tomography of the crust beneath East Anatolia

ORIGINAL ARTICLE
Seismic velocity and Poisson’s ratio tomography of the crustbeneath southwest Anatolia: an insight into the occurrenceof large earthquakes
Mohamed K. Salah & Sakir Sahin & Cem Destici
Received: 1 May 2007 /Accepted: 1 August 2007 / Published online: 11 Septeber 2007# Springer Science + Business Media B.V. 2007
Abstract The western part of Anatolia is one of themost seismically and tectonically active continentalregions in the world, and much of it has beenundergoing NS-directed extensional deformation sincethe Early Miocene. In this study, we determine 3-Dtomographic images of the crust under the southwesternpart of the North Anatolian Fault Zone by inverting alarge number of arrival time data of P and S waves.From the obtained P- and S-wave velocity models, weestimated the Poisson’s ratio structures for a morereliable interpretation of the obtained anomalies. Ourtomographic results confirmed the major tectonicfeatures detected by previous studies and revealednew structural heterogeneities related to the activeseismotectonics of the studied area. High P-wavevelocity anomalies are recognized near the surface,while at deeper crustal layers, low P-wave velocitiesare widely distributed. The crustal S-wave velocity andPoisson’s ratio exhibit more structural heterogeneitiescompared to the P-wave velocity structure. Micro-earthquake activity is intense along highly heteroge-neous zones in the southwestern part, which ischaracterized by low to high P-wave velocity, low S-wave velocity, and high Poisson’s ratio anomalies.
Large earthquakes are also concentrated in zonesdominated by low velocities and low to high Poisson’sratios. Results of the checkerboard and synthetic testsindicate that the imaged anomalies are reliable featuresdown to a depth of 25 km. Moreover, they areconsistent with many geological and geophysicalresults obtained by other researchers along the south-western part of the North Anatolian Fault Zone.
Keywords Crustal structure . Seismic tomography .
Seismic wave velocity . Poisson’s ratio .
Southwest Anatolia
1 Introduction
The Aegean Sea and the surrounding land areas(Fig. 1) have been considered as a “natural geophys-ical laboratory” due to the wide variety of tectonicprocesses encompassed (Kiratzi 2002). Plate motionmodels (De Mets et al. 1990) suggest that the Arabianand African plates move northwards relative toEurasia at rates of ∼25 and 10 mm/year, respectively.The northward movement of the Arabian plate causesthe westward extrusion of the Anatolian plate(McKenzie 1970, 1972, 1978). Recent synthesis ofgeodetic data (Papazachos 1999; McClusky et al.2000) confirms the first-order rigid behavior ofAnatolia and introduces a rigid Aegean plate. Therelative motion between Anatolia and the Aegeanplate is associated with significant internal deforma-
J Seismol (2007) 11:415–432DOI 10.1007/s10950-007-9062-2
DO09062; No of Pages
M. K. Salah : S. Sahin (*) : C. DesticiGeophysical Department,Faculty of Engineering and Architecture,Suleyman Demirel University,Cunur 32260, Isparta, Turkeye-mail: [email protected]

tion, expressed mainly as extension in the Aegeandomain, as originally defined by McKenzie (1972,1978). The presence of two major strike-slip faults,the North Anatolian Fault (NAF) and the EastAnatolian Fault, facilitates the westward motion ofthe Anatolian plate. The NAF is a dextral strike-slipfault (Fig. 1) that runs for about 1,400 km from theKarliova triple junction in the east to the Aegeanextensional regime in the west (McKenzie 1972,1978; Dewey and Şengör 1979). Its western portion,as it enters into the Northern Aegean Sea, splays intoseveral branches; the two most pronounced are shownin Fig. 1. The northern branch is the most seismicallyactive, and its associated basins have depths of∼1,500 m. The southern branch is not as welldeveloped and the associated basins are also not asdeep.
The western Anatolia (Fig. 1) is a part of the“Aegean Extensional Province” and is one of the mostseismically active continental regions of the world(Akyol et al. 2006). The current extension orientedapproximately N–S is occurring at a rate of 30–40 mm/year (McKenzie 1978; Taymaz et al. 1991) in theregion and has replaced the Paleocene orogeniccontraction (e.g., Şengör et al. 1985, Taymaz et al.1991; Seyitoğlu and Scott 1996; Bozkurt 2001).
During the Early–Middle Miocene period, thickvolcano–sedimentary associations were formed withinapproximately N–S-trending fault-bounded continentalbasins under an E–Wextensional regime (Yılmaz et al.2000). After starting N–S extension, the intracontinen-tal plate alkaline volcanic province of western Anatoliawas formed during Late Miocene to Quaternary time(e.g., Aldanmaz 2002; Tonarini et al. 2005). However,the exact timing and cause of the extension are stillcontroversial, and many models, including those basedon orogenic collapse (e.g., Dewey 1988), subductingslab rollback (e.g., McKenzie 1978; Le Pichon andAngelier 1979; Royden 1993), and westward extrusionof the Anatolian block (e.g., Dewey and Şengör 1979;Cemen et al. 1999), have been proposed. ApproximatelyE–W-trending grabens and their basin-bounding activenormal faults are the most prominent neotectonicfeatures of western Anatolia (Bozkurt 2001). Geologicalobservations and analysis of gravity data revealed thatthe thickness of the sedimentary cover in these grabensvaries from 0.5 to 3.5 km and are underlined bymetamorphic rocks (Bozkurt and ve Sözbilir 2004; Sariand Şalk 2006).
Although there has been extensive study of thenear-surface geology of this unique region, researchon deep crustal structure and earthquake activity has
Fig. 1 Simplified map ofthe Aegean Sea and thesurrounding areas (Kiratzi2002). Solid lines are majorstrike-slip faults. Blackarrows indicate the motionof the plates relative toEurasia (McClusky et al.2000). Black rectangleshows the present studyarea. The small divergingblack arrows indicate thedirection of internal defor-mation (extension) in thebroader Aegean area (CG,Corinth Gulf; CP,Chalkidiki peninsula; FBZ,Fethiye-Burdur Fault Zone;G, Ganosdag; M, Magnesiabasin; P, Peloponnese; S,Sperchios basin; SP,Sporades basin)
416 J Seismol (2007) 11:415–432

been hampered by sparse coverage of seismic stationsand the lack of any organization that can collect, edit,and distribute seismic data. Now, more study andresearch are needed to better understand the seismo-tectonic setting in western Anatolia. It is also im-portant to compare this area with other seismicallyactive regions around the world. Akinci et al. (1994)analyzed the decay of coda wave amplitude, Qc, inwestern Anatolia and found that it depends onfrequency and lapse time. Only recently, the Depart-ment of Earth and Atmospheric Sciences at SaintLouis University and the Department of GeophysicalEngineering at Dokuz Eylul University, in late 2002,began a cooperative seismological study of westernAnatolia in an effort to better understand the crustalstructure and the details of earthquake activity in theregion (Zhu et al. 2006). They deployed fivebroadband and 45 short-period seismic stationsbetween November 2002 and October 2003 to studythe crustal thickness and seismicity, as well as theupper mantle structure. They detected a general trendof westward crustal thinning from 36 km in centralAnatolia to 28–30 km in the central Menderes Massifto 25 km beneath the Aegean Sea and found thatcrustal thinning in the Aegean is not uniform in theN–S extensional direction. Akyol et al. (2006) studiedthe earthquake activity in western Anatolia that iscovered by and adjacent to the recently deployedregional network. They obtained a 1-D P-wave crustalvelocity model using a generalized scheme forsimultaneously obtaining earthquake locations and acrustal velocity model. Their velocity model ischaracterized by crustal velocities that are significant-ly lower than average continental values. The lowvelocities may be associated with high crustal temper-atures, a high degree of fracture, or the presence offluids at high pore pressure in the crust. They alsofound that the level of seismic activity in westernAnatolia is higher than previously reported.
Our study area is situated between latitudes 36.0–39.0°N and longitudes 27.0–31.0°E in the southernpart of western (SW) Anatolia. It is clear from theabove description that western Anatolia is one of themost seismically active areas of the MediterraneanBasin. In this region, earthquakes are located alongfaults that are the result of the regional extensionaltectonic regime, which is itself dependant of thewestward motion of the Aegean–Anatolian plate andof the northwards subduction of the African plate
beneath Aegea and Anatolia along the Aegean andCyprus arcs. In the past 50 years, major earthquakeshave caused extensive damage and destruction in thisregion (Akinci et al. 1994). For example, the Edremit–Ayvalık (1949) earthquake, M=7.0, destroyed nearly5,000 buildings; the Yenice–Gönen (1953) earth-quake, M=7.4, destroyed 1,800 buildings; the Alaşehir(1969) earthquake, M=6.9, damaged 3,700 buildings;and the Gediz (1970) earthquake, M=7.3, destroyed9,500 buildings and killed 1,400 people. Along theactive NW–SE-trending Dinar normal fault, the 1October 1995 earthquake, M=6.1, occurred and re-sulted in a ∼10-km-long surface rupture with the southside thrown by ≤50 cm (Altunel et al. 1999). This highlevel of seismotectonic activity, along with a lack of aprevious systematic tomography study, promotes us toconduct tomographic inversion on a large number ofP- and S-wave arrival times to study the 3-D seismicvelocity structure and its relation with the occurrenceof large damaging earthquakes in the western part ofAnatolia.
2 Data
In this study, a number of 4,470 events that occurredbetween latitudes 36–39°N and longitudes 27–32°E(Fig. 2a–c) was used. These events are recorded byeight seismic stations belonging to the TurkishNational Telemetric Earthquake Network (Turknet),which is operated by the Turkish General Directorateof Disaster Affairs. This network has two broadbandand six short-period seismic stations with a samplingfrequency of 50 Hz. The dynamic range is 140 and164–184 dB for the broadband and short-periodseismic stations, respectively. The crustal model ofHerrin (1968) and the HYPO71 source code are usedfor the determination of the hypocentral parameters(Lee and Lahr 1972). The errors in the hypocentrallocations do not exceed 2.5 km for all events. Fromthe distribution of the seismic stations and the usedevents, we prefer to limit our study area intolongitudes 27–31°E (Fig. 2a). Through a visualinspection of Fig. 2a–c, it can be noticed that thedistribution of both the seismic stations and the eventsin the study area is uneven; for example, there is onlyone seismic station south of latitude 37°N, and theseismicity is sparse in the SE part of the study area.The level of seismicity is also low in the central
J Seismol (2007) 11:415–432 417
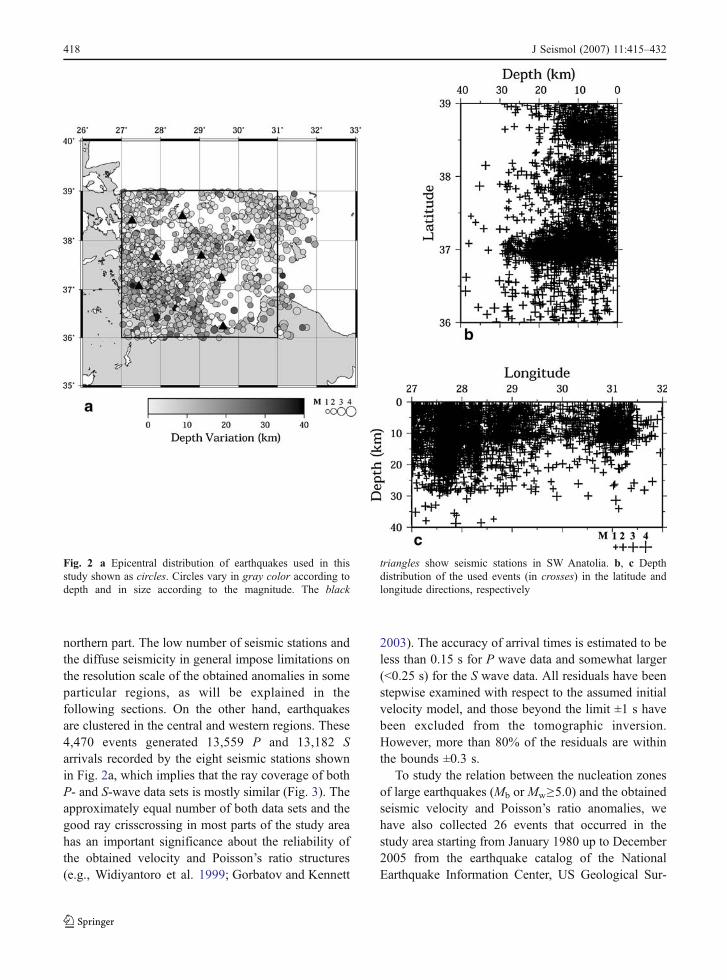
northern part. The low number of seismic stations andthe diffuse seismicity in general impose limitations onthe resolution scale of the obtained anomalies in someparticular regions, as will be explained in thefollowing sections. On the other hand, earthquakesare clustered in the central and western regions. These4,470 events generated 13,559 P and 13,182 Sarrivals recorded by the eight seismic stations shownin Fig. 2a, which implies that the ray coverage of bothP- and S-wave data sets is mostly similar (Fig. 3). Theapproximately equal number of both data sets and thegood ray crisscrossing in most parts of the study areahas an important significance about the reliability ofthe obtained velocity and Poisson’s ratio structures(e.g., Widiyantoro et al. 1999; Gorbatov and Kennett
2003). The accuracy of arrival times is estimated to beless than 0.15 s for P wave data and somewhat larger(<0.25 s) for the S wave data. All residuals have beenstepwise examined with respect to the assumed initialvelocity model, and those beyond the limit ±1 s havebeen excluded from the tomographic inversion.However, more than 80% of the residuals are withinthe bounds ±0.3 s.
To study the relation between the nucleation zonesof large earthquakes (Mb or Mw≥5.0) and the obtainedseismic velocity and Poisson’s ratio anomalies, wehave also collected 26 events that occurred in thestudy area starting from January 1980 up to December2005 from the earthquake catalog of the NationalEarthquake Information Center, US Geological Sur-
Fig. 2 a Epicentral distribution of earthquakes used in thisstudy shown as circles. Circles vary in gray color according todepth and in size according to the magnitude. The black
triangles show seismic stations in SW Anatolia. b, c Depthdistribution of the used events (in crosses) in the latitude andlongitude directions, respectively
418 J Seismol (2007) 11:415–432

vey (Fig. 4). A close inspection of the distribution ofthe epicenters of these large events implies that theyoccur mainly due to movements along the NAF, aswas explained in the previous section.
3 Methods
To analyze the arrival time data, we used thetomographic method of Zhao et al. (1992), which hasbeen applied to many parts of the world with different
tectonic circumstances (e.g., Zhao and Kanamori1995; Zhao et al. 1996, 1997, 2001; Serrano et al.1998, 2002a, b; Kayal et al. 2002). This method isadaptable to a general velocity structure, whichincludes several complex-shaped velocity discontinu-ities and allows 3-D velocity variations everywhere inthe model. The discontinuities represent knowngeological boundaries, like the Moho discontinuityand/or a subducting slab boundary, etc. A 3-D grid netis set up in the model to express the 3-D structure.Velocity perturbations at the grid nodes are taken asunknown parameters. The velocity perturbation at anypoint in the model is calculated by linearly interpo-lating the velocity perturbations at the eight gridnodes surrounding that point. To calculate travel timesand ray paths accurately and rapidly, an efficient 3-Dray-tracing technique (Zhao et al. 1992) is employedthat iteratively uses the pseudobending technique (Umand Thurber 1987) and Snell’s law. Station elevationsare taken into account in the ray tracing. The leastsquares regression algorithm (Paige and Saunders1982) with a damping regularization is used to solvethe large and sparse system of observation equations,allowing a great number of data to be used to solve alarge tomographic problem. The nonlinear tomo-graphic problem is solved by iteratively conductinglinear inversions. In each iteration, perturbations to
Fig. 4 Distribution of large crustal earthquakes that occurred inSW Anatolia (M≥5.0) from 1980 until 2005 used in this study(see text for details). Thin black lines denote active faults in thestudied region (Şaroğlu et al. 1992)
Fig. 3 Ray path coverage of P-wave (a) and S-wave (b) datasets. Every path between an event and a recording station isdrawn as one straight line
J Seismol (2007) 11:415–432 419
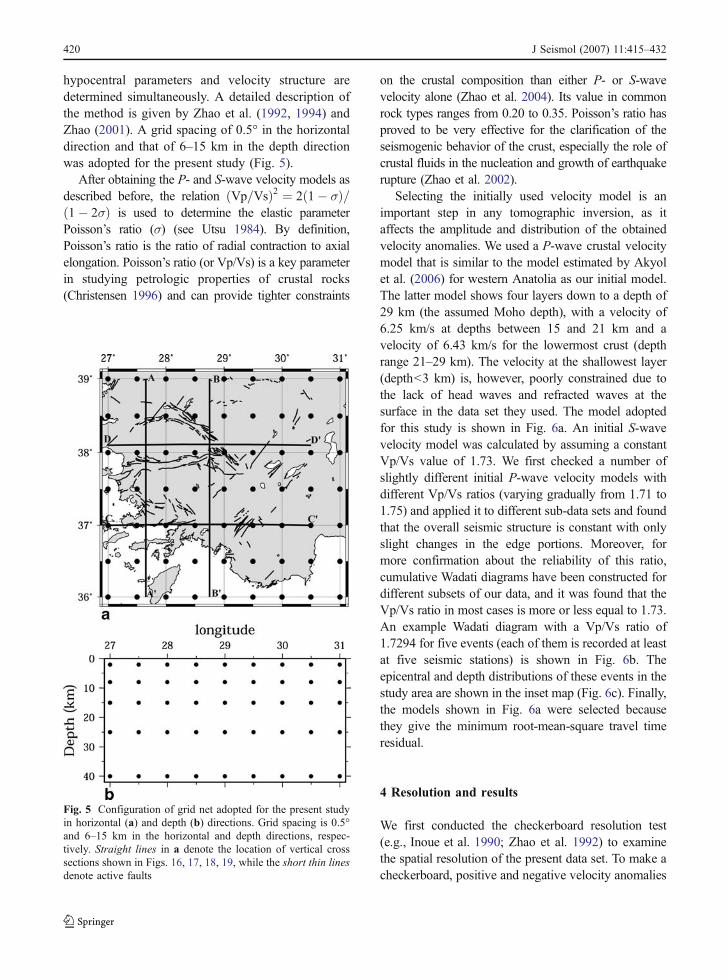
hypocentral parameters and velocity structure aredetermined simultaneously. A detailed description ofthe method is given by Zhao et al. (1992, 1994) andZhao (2001). A grid spacing of 0.5° in the horizontaldirection and that of 6–15 km in the depth directionwas adopted for the present study (Fig. 5).
After obtaining the P- and S-wave velocity models asdescribed before, the relation Vp=Vsð Þ2 ¼ 2 1� σð Þ=1� 2σð Þ is used to determine the elastic parameterPoisson’s ratio (σ) (see Utsu 1984). By definition,Poisson’s ratio is the ratio of radial contraction to axialelongation. Poisson’s ratio (or Vp/Vs) is a key parameterin studying petrologic properties of crustal rocks(Christensen 1996) and can provide tighter constraints
on the crustal composition than either P- or S-wavevelocity alone (Zhao et al. 2004). Its value in commonrock types ranges from 0.20 to 0.35. Poisson’s ratio hasproved to be very effective for the clarification of theseismogenic behavior of the crust, especially the role ofcrustal fluids in the nucleation and growth of earthquakerupture (Zhao et al. 2002).
Selecting the initially used velocity model is animportant step in any tomographic inversion, as itaffects the amplitude and distribution of the obtainedvelocity anomalies. We used a P-wave crustal velocitymodel that is similar to the model estimated by Akyolet al. (2006) for western Anatolia as our initial model.The latter model shows four layers down to a depth of29 km (the assumed Moho depth), with a velocity of6.25 km/s at depths between 15 and 21 km and avelocity of 6.43 km/s for the lowermost crust (depthrange 21–29 km). The velocity at the shallowest layer(depth<3 km) is, however, poorly constrained due tothe lack of head waves and refracted waves at thesurface in the data set they used. The model adoptedfor this study is shown in Fig. 6a. An initial S-wavevelocity model was calculated by assuming a constantVp/Vs value of 1.73. We first checked a number ofslightly different initial P-wave velocity models withdifferent Vp/Vs ratios (varying gradually from 1.71 to1.75) and applied it to different sub-data sets and foundthat the overall seismic structure is constant with onlyslight changes in the edge portions. Moreover, formore confirmation about the reliability of this ratio,cumulative Wadati diagrams have been constructed fordifferent subsets of our data, and it was found that theVp/Vs ratio in most cases is more or less equal to 1.73.An example Wadati diagram with a Vp/Vs ratio of1.7294 for five events (each of them is recorded at leastat five seismic stations) is shown in Fig. 6b. Theepicentral and depth distributions of these events in thestudy area are shown in the inset map (Fig. 6c). Finally,the models shown in Fig. 6a were selected becausethey give the minimum root-mean-square travel timeresidual.
4 Resolution and results
We first conducted the checkerboard resolution test(e.g., Inoue et al. 1990; Zhao et al. 1992) to examinethe spatial resolution of the present data set. To make acheckerboard, positive and negative velocity anomalies
Fig. 5 Configuration of grid net adopted for the present studyin horizontal (a) and depth (b) directions. Grid spacing is 0.5°and 6–15 km in the horizontal and depth directions, respec-tively. Straight lines in a denote the location of vertical crosssections shown in Figs. 16, 17, 18, 19, while the short thin linesdenote active faults
420 J Seismol (2007) 11:415–432

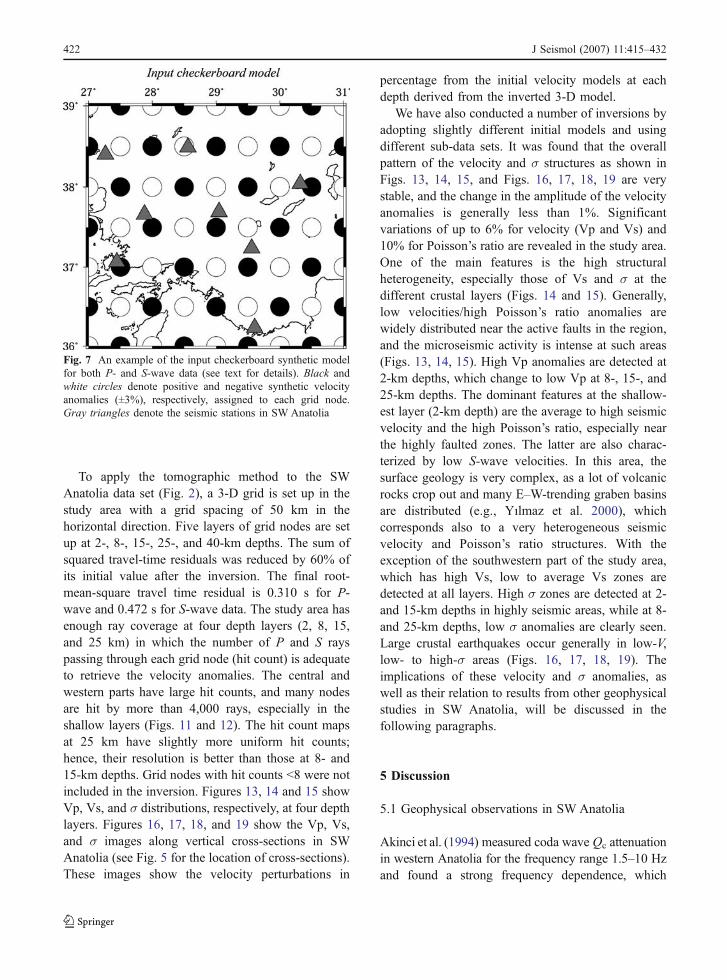
of ±3% were assigned to all the 3-D grid nodes as inFig. 7. Synthetic arrival times are calculated for thisinput checkerboard model. Numbers of stations,events, and ray paths in the synthetic data are thesame as those in the real data. Random errors of 0.1–0.15 s as in the real data have also been added to thesynthetic data and were inverted with the samealgorithm as we did for the real data. The invertedimage of the checkerboard suggests where the resolu-tion is good and where it is poor. Figures 8 and 9 showthe results of the tests for both Vp and Vs structures,respectively. The checkerboard tests indicate a goodand uniform resolution of about 50 km horizontally forboth Vp and Vs structures in the southwestern part ofAnatolia, especially at 2- and 25-km depths. This isbecause of the more uniform distribution of manyhorizontal rays and the vertical ray paths passing at
these depths. However, the southeastern part of thestudy area has a relatively poor resolution, owing to thescarcity of both events and seismic stations.
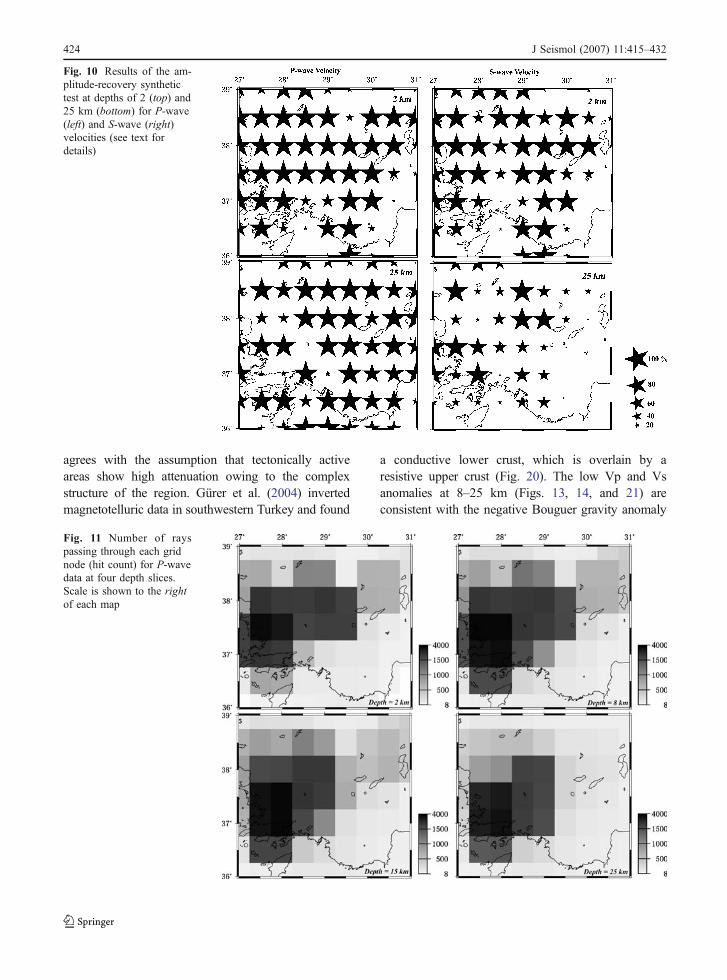
We also conducted the model-recovery synthetictests (e.g., Lei and Zhao 2005) to demonstrate therecovery of the amplitudes of Vp and Vs in the studyarea. We input 6% velocity anomalies, which are thesame as the inverted maximum velocity anomalies inthe grid nodes, and then calculate the inversion valueat each grid. Figure 10 shows examples of results ofthis synthetic test. It is clear that the amplitudes of Vpand Vs are well recovered down to 25-km depth,although there are some slight differences at greatdepths. Thus, the velocity and Poisson’s ratio anoma-lies derived from the inverted P- and S-wave data inthis study are considered to be reliable features in SWAnatolia.
Vp/Vs = 1.7294
0
10
20
30
40
0 10 20 30 40 50
Tp (s)
Ts
- T
p (
s)
b a
c
Fig. 6 a Initial P-wave(solid line) and S-wave(dashed line) velocitymodels adopted for thepresent study. b An exampleof a cumulative Wadatidiagram constructed for fiveselected events distributed inthe study area and havingvarious focal depths (c)
J Seismol (2007) 11:415–432 421
To apply the tomographic method to the SWAnatolia data set (Fig. 2), a 3-D grid is set up in thestudy area with a grid spacing of 50 km in thehorizontal direction. Five layers of grid nodes are setup at 2-, 8-, 15-, 25-, and 40-km depths. The sum ofsquared travel-time residuals was reduced by 60% ofits initial value after the inversion. The final root-mean-square travel time residual is 0.310 s for P-wave and 0.472 s for S-wave data. The study area hasenough ray coverage at four depth layers (2, 8, 15,and 25 km) in which the number of P and S rayspassing through each grid node (hit count) is adequateto retrieve the velocity anomalies. The central andwestern parts have large hit counts, and many nodesare hit by more than 4,000 rays, especially in theshallow layers (Figs. 11 and 12). The hit count mapsat 25 km have slightly more uniform hit counts;hence, their resolution is better than those at 8- and15-km depths. Grid nodes with hit counts <8 were notincluded in the inversion. Figures 13, 14 and 15 showVp, Vs, and σ distributions, respectively, at four depthlayers. Figures 16, 17, 18, and 19 show the Vp, Vs,and σ images along vertical cross-sections in SWAnatolia (see Fig. 5 for the location of cross-sections).These images show the velocity perturbations in
percentage from the initial velocity models at eachdepth derived from the inverted 3-D model.
We have also conducted a number of inversions byadopting slightly different initial models and usingdifferent sub-data sets. It was found that the overallpattern of the velocity and σ structures as shown inFigs. 13, 14, 15, and Figs. 16, 17, 18, 19 are verystable, and the change in the amplitude of the velocityanomalies is generally less than 1%. Significantvariations of up to 6% for velocity (Vp and Vs) and10% for Poisson’s ratio are revealed in the study area.One of the main features is the high structuralheterogeneity, especially those of Vs and σ at thedifferent crustal layers (Figs. 14 and 15). Generally,low velocities/high Poisson’s ratio anomalies arewidely distributed near the active faults in the region,and the microseismic activity is intense at such areas(Figs. 13, 14, 15). High Vp anomalies are detected at2-km depths, which change to low Vp at 8-, 15-, and25-km depths. The dominant features at the shallow-est layer (2-km depth) are the average to high seismicvelocity and the high Poisson’s ratio, especially nearthe highly faulted zones. The latter are also charac-terized by low S-wave velocities. In this area, thesurface geology is very complex, as a lot of volcanicrocks crop out and many E–W-trending graben basinsare distributed (e.g., Yılmaz et al. 2000), whichcorresponds also to a very heterogeneous seismicvelocity and Poisson’s ratio structures. With theexception of the southwestern part of the study area,which has high Vs, low to average Vs zones aredetected at all layers. High σ zones are detected at 2-and 15-km depths in highly seismic areas, while at 8-and 25-km depths, low σ anomalies are clearly seen.Large crustal earthquakes occur generally in low-V,low- to high-σ areas (Figs. 16, 17, 18, 19). Theimplications of these velocity and σ anomalies, aswell as their relation to results from other geophysicalstudies in SW Anatolia, will be discussed in thefollowing paragraphs.
5 Discussion
5.1 Geophysical observations in SW Anatolia
Akinci et al. (1994) measured coda wave Qc attenuationin western Anatolia for the frequency range 1.5–10 Hzand found a strong frequency dependence, which
Fig. 7 An example of the input checkerboard synthetic modelfor both P- and S-wave data (see text for details). Black andwhite circles denote positive and negative synthetic velocityanomalies (±3%), respectively, assigned to each grid node.Gray triangles denote the seismic stations in SW Anatolia
422 J Seismol (2007) 11:415–432

Fig. 9 The results of thecheckerboard resolution testfor S-wave velocity at fourcrustal depths. Other detailsare similar to those of Fig. 8
Fig. 8 The results of thecheckerboard resolution testfor P-wave velocity at fourcrustal depths (see text fordetails). Black and whitecircles denote high and lowvelocities, respectively. Theperturbation scale is shownto the right. The depth ofeach layer is shown at theupper right of each map
J Seismol (2007) 11:415–432 423
agrees with the assumption that tectonically activeareas show high attenuation owing to the complexstructure of the region. Gürer et al. (2004) invertedmagnetotelluric data in southwestern Turkey and found
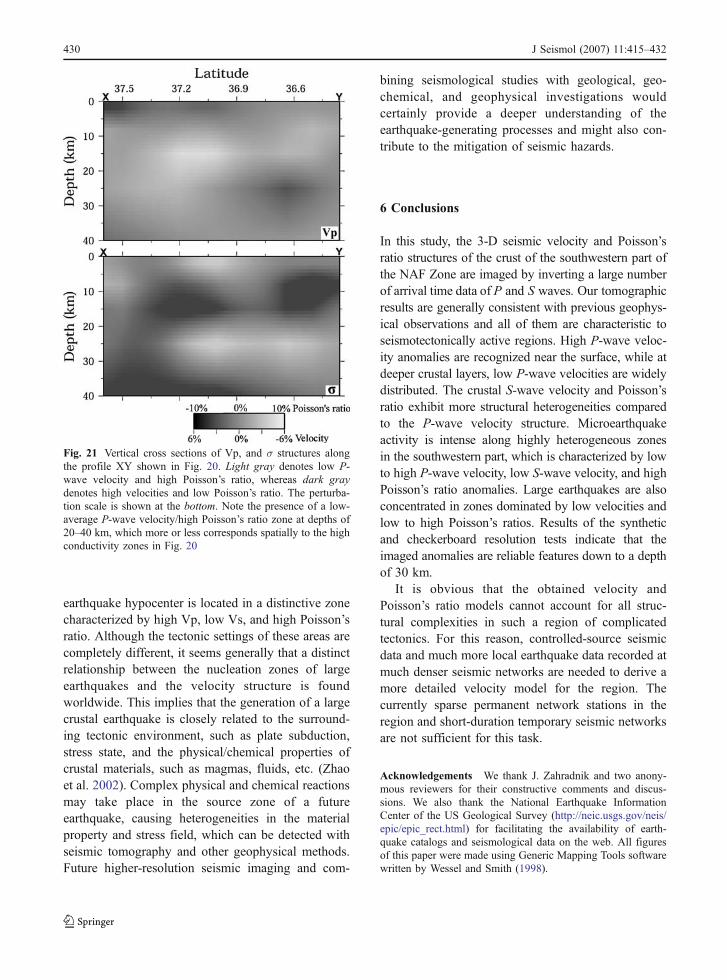
a conductive lower crust, which is overlain by aresistive upper crust (Fig. 20). The low Vp and Vsanomalies at 8–25 km (Figs. 13, 14, and 21) areconsistent with the negative Bouguer gravity anomaly
Fig. 11 Number of rayspassing through each gridnode (hit count) for P-wavedata at four depth slices.Scale is shown to the rightof each map
Fig. 10 Results of the am-plitude-recovery synthetictest at depths of 2 (top) and25 km (bottom) for P-wave(left) and S-wave (right)velocities (see text fordetails)
424 J Seismol (2007) 11:415–432

(Fig. 20a) and the high conductivity zones in the lowercrust obtained by Gürer et al. (2004). Moreover, thereis a high Poisson’s ratio anomaly between the twowhite stars (Figs. 15d and 21), and this zone has high
conductivity down to about 50-km depths (Fig. 20b),which is probably caused by the presence of fluids.Akyol et al. (2006) obtained a 1-D P-wave crustalvelocity model for western Anatolia using a general-
Fig. 13 P-wave velocitystructures (in %) at depthsof 2 (a), 8 (b), 15 (c), and25 km (d) beneath SWAnatolia. Light and darkgray colors indicate low andhigh velocities, respectively.Crosses denote the micro-seismic activity in a depthrange of 0–4 km in a, 4–12 km in b, 12–20 km in c,and 20–30 km in d. Largeearthquakes (M≥5.0) occur-ring in the same depth rangeof the background seismici-ty are plotted as large opencircles. Thin solid lines de-note active faults in SWAnatolia. Two white stars inthe center and in the south-east correspond, respective-ly, to points X and Y of theprofiles shown in Figs. 20and 21. The perturbationscale is shown to the lowerright
Fig. 12 Number of rayspassing through each gridnode for S-wave data at fourdepth slices. Other detailsare similar to those ofFig. 11
J Seismol (2007) 11:415–432 425

ized scheme for simultaneously obtaining earthquakelocations and a crustal velocity model. Their velocitymodel – as explained before – is characterized bycrustal velocities that are significantly lower than
average continental values. The large standard devi-ation values of the crustal velocity model indicatesignificant lateral variations in the velocity structure.The main feature of low velocities obtained in their
Fig. 15 Distribution ofPoisson’s ratio (σ) structuresat four depth slices [2 (a),8 (b), 15 (c), and 25 km(d)]. Light and dark graycolors denote high and lowσ, respectively. The range ofthe gray scale to the lowerright is ±10%. Other detailsare similar to those ofFig. 13
Fig. 14 S-wave velocitystructures at the four depthslices [2 (a), 8 (b), 15 (c),and 25 km (d)]. Otherdetails are similar to thoseof Fig. 13
426 J Seismol (2007) 11:415–432

model may be associated with high crustal temper-atures, a high degree of fracture, or the presence offluids at high pore pressure in the crust. The unusuallylow velocities may also indicate that fluid-filled faultsand fractures in this seismically active region maypermeate the crust (e.g., Al-Shukri and Mitchell 1988;Mitchell et al. 1997). The source of these fluids is theAfrican slab subducting beneath the Aegean–Anatolianblocks (Tonarini et al. 2005). The progressive additionof these fluids is thought to initiate the partial melting
that generated the different orogenic magmas and canalso trigger large crustal earthquakes. Akyol et al.(2006) also found that the level of seismic activity inwestern Anatolia is higher than previously reported andthat the peak seismicity for the region occurs at a depthof about 10 km. Obtained velocities at the base of thecrust are within the bounds of average crustal velocitiesat high temperature (Christensen and Mooney 1995).High average heat flow (107±45 mW m−2) withgeothermal activity has also been detected by İlkışık(1995) in western Anatolia. Such values are 60%above the world average. A close association alsoexists between areas of high heat flow values (above
Fig. 17 Vertical cross sections of Vp, Vs, and σ structuresalong line BB′. All other details are similar to those of Fig. 16
Fig. 16 Vertical cross sections of Vp, Vs, and σ structuresalong line AA′ (see Fig. 5 for the locations of the crosssections). Light gray denotes the low velocities and highPoisson’s ratio, whereas dark gray denotes high velocities andlow Poisson’s ratio. Large circles show the locations of largeearthquakes (M≥5.0) in a 50-km-wide zone around the profile,whereas crosses denote microseismic activity in a 20-km-widezone around the profile. The perturbation scale is shown at thebottom
J Seismol (2007) 11:415–432 427

100 mW m−2) and areas of Tertiary and youngervolcanism. High heat flow is also observed inPaleozoic units of the Menderes Massif, which isunder tensional stress. The highest heat flow esti-mate of 247 mW m−2 is obtained near Gediz (38°57′N,29°13.2′E). This area is part of a seismically activeregion (see also Bozkurt 2001) and is located neara Middle Eocene subduction zone, which is an areaof later collision tectonics. In our present analysis,we found that this area has a low Vp and low-averageVs, which are consistent with the high heat flowvalues. Additionally, intensive faulting and extension-related volcanism (Paton 1992) and high geothermal
gradient (e.g., Gemici and Tarcan 2002) are amongthe main characteristics of the region. The obtainedvelocity and Poisson’s ratio structures in this study aregenerally consistent with the above-mentioned geophys-ical observations obtained by different researchers.
5.2 Large earthquakes in western Anatolia
The northern Aegean Sea and western Anatolia aredominated by dextral strike-slip faulting and are charac-terized by frequent strong earthquakes (Papadimitriouand Sykes 2001), some of them occurring very closetogether in time. Parallel secondary faults are also
Fig. 19 Vertical cross sections of Vp, Vs, and σ structuresalong line DD′. All other details are similar to those of Fig. 16
Fig. 18 Vertical cross sections of Vp, Vs, and σ structuresalong line CC′. All other details are similar to those of Fig. 16
428 J Seismol (2007) 11:415–432

recognized from seismicity and fault-plane solutionsof recent strong earthquakes. It is then of interest toexamine the relation between the velocity structure andthe nucleation zones of these events and whether thestress changes associated with the occurrence of each ofthem can advance the time of occurrence of, i.e.,trigger, subsequent ones. Earthquakes in a sequencegenerally are not independent (Scholz 1990). Each oneis affected by both tectonic loading and stress changescaused by prior events, especially by either greatearthquakes or other shocks that occur nearby. Fromthis point of view, the state of stress and its variationwith time should be taken into account when studyingthe potential of a seismotectonically active region togenerate a future large earthquake. Benetatos et al.(2006) analyzed the October 2005 series of earthquakesthat occurred in the Gulf of Siğaçik (western Turkey)and found that the type of faulting is pure strike-slip, asevidenced from focal mechanism solutions. They usedaftershocks, which align roughly in a NE–SW cloudbut considerably spread after the first day of thesequence, indicating the simultaneous activation ofmultiple structures nearly orthogonal to the mainrupture. The region of occurrence is a well-known
geothermal area (Drahor and Berge 2006), whichimplies that it is in a very unstable state, with the faultsystems close to rupture and very sensitive to stressperturbations. They showed that the sequence isadequately explained by static stress triggering.
In our results, we found that the large earthquakestend to occur in highly heterogeneous zones imagedby seismic tomography especially those characterizedby low-velocity/low- to high-Poisson’s ratio. Manyauthors studied the relationship between the nucle-ation zones of large earthquakes and the velocitystructure. In the Los Angeles basin area, for example,Hauksson and Haase (1997) found that four M>5.9earthquakes occurred in or adjacent to high-velocityzones. They interpreted that the high-velocity zonesform the upper block of a thrust fault or a thin-skinned structure; that is, the earthquake rupturesactually happened at the boundary between high- andlow-velocity zones. In Japan, Zhao and Negishi(1998), Zhao et al. (2000, 2002), and Salah and Zhao(2003) found that large crustal earthquakes occur in oraround zones of low seismic velocity and high σrevealed by seismic tomography. In India, Kayal et al.(2002) found that the mainshock of the 2001 Bhuj
Fig. 20 Bouguer gravityanomaly (a) along aNW–SE profile XY (coor-dinates are as follows: X,37°35″N, 29°05″E; Y, 36°20″N, 30°15″E) in SWAnatolia, and a finalresistivity model (b)obtained by 2-D inversionmodeling of magnetotellu-ric data, which is sensitiveto resistivity structures to80-km depth, on a 1:1exaggeration in the figure(Gürer et al. 2004). Threehigh-conductivity zones aredelineated
J Seismol (2007) 11:415–432 429
earthquake hypocenter is located in a distinctive zonecharacterized by high Vp, low Vs, and high Poisson’sratio. Although the tectonic settings of these areas arecompletely different, it seems generally that a distinctrelationship between the nucleation zones of largeearthquakes and the velocity structure is foundworldwide. This implies that the generation of a largecrustal earthquake is closely related to the surround-ing tectonic environment, such as plate subduction,stress state, and the physical/chemical properties ofcrustal materials, such as magmas, fluids, etc. (Zhaoet al. 2002). Complex physical and chemical reactionsmay take place in the source zone of a futureearthquake, causing heterogeneities in the materialproperty and stress field, which can be detected withseismic tomography and other geophysical methods.Future higher-resolution seismic imaging and com-
bining seismological studies with geological, geo-chemical, and geophysical investigations wouldcertainly provide a deeper understanding of theearthquake-generating processes and might also con-tribute to the mitigation of seismic hazards.
6 Conclusions
In this study, the 3-D seismic velocity and Poisson’sratio structures of the crust of the southwestern part ofthe NAF Zone are imaged by inverting a large numberof arrival time data of P and S waves. Our tomographicresults are generally consistent with previous geophys-ical observations and all of them are characteristic toseismotectonically active regions. High P-wave veloc-ity anomalies are recognized near the surface, while atdeeper crustal layers, low P-wave velocities are widelydistributed. The crustal S-wave velocity and Poisson’sratio exhibit more structural heterogeneities comparedto the P-wave velocity structure. Microearthquakeactivity is intense along highly heterogeneous zonesin the southwestern part, which is characterized by lowto high P-wave velocity, low S-wave velocity, and highPoisson’s ratio anomalies. Large earthquakes are alsoconcentrated in zones dominated by low velocities andlow to high Poisson’s ratios. Results of the syntheticand checkerboard resolution tests indicate that theimaged anomalies are reliable features down to a depthof 30 km.
It is obvious that the obtained velocity andPoisson’s ratio models cannot account for all struc-tural complexities in such a region of complicatedtectonics. For this reason, controlled-source seismicdata and much more local earthquake data recorded atmuch denser seismic networks are needed to derive amore detailed velocity model for the region. Thecurrently sparse permanent network stations in theregion and short-duration temporary seismic networksare not sufficient for this task.
Acknowledgements We thank J. Zahradnik and two anony-mous reviewers for their constructive comments and discus-sions. We also thank the National Earthquake InformationCenter of the US Geological Survey (http://neic.usgs.gov/neis/epic/epic_rect.html) for facilitating the availability of earth-quake catalogs and seismological data on the web. All figuresof this paper were made using Generic Mapping Tools softwarewritten by Wessel and Smith (1998).
Fig. 21 Vertical cross sections of Vp, and σ structures alongthe profile XY shown in Fig. 20. Light gray denotes low P-wave velocity and high Poisson’s ratio, whereas dark graydenotes high velocities and low Poisson’s ratio. The perturba-tion scale is shown at the bottom. Note the presence of a low-average P-wave velocity/high Poisson’s ratio zone at depths of20–40 km, which more or less corresponds spatially to the highconductivity zones in Fig. 20
430 J Seismol (2007) 11:415–432

References
Akinci A, Taktak AG, Ergintav S (1994) Attenuation of codawaves in western Anatolia. Phys Earth Planet Inter87:155–165
Akyol N, Zhu L, Mitchell B, Sözübir H, Kekovalı K (2006)Crustal structure and local seismicity in western Anatolia.Geophys J Int 166(3):1259–1269
Aldanmaz E (2002) Mantle source characteristics of alkalibasalts and basanites in an extensional intra-continentalplate setting, western Anatolia, Turkey: implications formulti-stage melting. Int Geol Rev 44:440–457
Al-Shukri HJ, Mitchell BJ (1988) Reduced seismic velocities inthe source zone of New Madrid earthquakes. Bull SeismolSoc Am 78:1491–1509
Altunel E, Barka A, Akyüz S (1999) Palaeoseismicity of theDinar fault, SW Turkey. Terra Nova 11:297–302
Benetatos C, Kiratzi A, Ganas A, Ziazia A, Plessa A,Drakatos G (2006) Strike-slip motions in the Gulf ofSigacik (western Anatolia): properties of the 17 October2005 earthquake seismic sequence. Tectonophysics426:263–279
Bozkurt E (2001) Neotectonics of Turkey—a synthesis. GeodynActa 14:3–30
Bozkurt E, ve Sözbilir H (2004) Tectonic evolution of theGediz Graben: field evidence for an episodic, two-stageextension in western Turkey. Geol Mag 141:63–79
Cemen I, Goncuoglu C, Dirik K (1999) Structural evolution ofthe Tuzgolu Basin in central Anatolia, Turkey. J Geol107:693–706
Christensen NI (1996) Poisson’s ratio and crustal seismology. JGeophys Res 101:3139–3156
Christensen NI, Mooney WD (1995) Seismic velocity structureand composition of the continental crust: a global view. JGeophys Res 100:9761–9788
De Mets C, Gordon RG, Argus DF, Stein S (1990) Currentplate motions. Geophys J Int 101:425–478
Dewey JF (1988) Extensional collapse of orogens. Tectonics7:1123–1139
Dewey JF, Şengör AMC (1979) Aegean and surroundingregions: complex multi-plate and continuum tectonics ina convergent zone. Geol Soc Amer Bull 90:84–92
Drahor M, Berge M (2006) Geophysical investigations of theSeferihisar geothermal area, western Anatolia, Turkey.Geothermics 35:302–320
Gemici Ü, Tarcan G (2002) Hydrogeochemistry of the Simavgeothermal field, western Anatolia, Turkey. J VolcanolGeotherm Res 116:215–233
Gorbatov A, Kennett BLN (2003) Joint bulk-sound and sheartomography for western Pacific subduction zones. EarthPlanet Sci Lett 210:527–543
Gürer A, Bayrak M, Gürer ÖF (2004) Magentotelluric imagesof the crust and mantle in the southwestern Taurides,Turkey. Tectonophysics 391:109–120
Hauksson E, Haase JS (1997) Three-dimensional Vp and Vp/Vsvelocity models of the Los Angeles basin and centralTransverse Ranges, California. J Geophys Res 102:5423–5433
Herrin E (1968) Seismological tables for P-phases. BullSeismol Soc Am 60:461–489
İlkışık OM (1995) Regional heat flow in western Anatoliausing silica temperature estimates from thermal springs.Tectonophysics 244:175–184
Inoue H, Fukao Y, Tanabe K, Ogata Y (1990) Whole mantle Pwave travel time tomography. Phys Earth Planet Inter59:294–328
Kayal JR, Zhao D, Mishra OP, De R, Singh OP (2002)The 2001 Bhuj earthquake: tomographic evidence forfluids at the hypocenter and its implications for rupturenucleation. Geophys Res Lett 29(24):2152, DOI 10.1029/2002GL015177
Kiratzi A (2002) Stress tensor inversions along the westernmostNorth Anatolian Fault Zone and its continuation into theNorth Aegean Sea. Geophys J Int 151:360–376
Le Pichon X, Angelier J (1979) The Hellenic arc and trenchsystem: a key to the neotectonic evolution of the easternMediterranean area. Tectonophysics 60:1–42
Lee WHK, Lahr JC (1972) HYP071: a computer program fordetermining hypocenter, magnitude, and first motionpattern of local earthquakes. Open File Report, USGeological Survey
Lei J, Zhao D (2005) P-wave tomography and origin of theChangbai intraplate volcano in northeast Asia. Tectono-physics 397:281–295
McClusky S, Balassanian S, Barka A, Demir C, Ergintav S,Georgiev I, Gurkan O, Hamburger M, Hurst K, Kahle H,Kastens K, Kekelidze G, King R, Kotzev V, Lenk O,Mahmoud S, Mishin A, Nadariya M, Ouzounis A,Paradissis D, Peter Y, Prilepin M, Reilinger R, Sanli I,Seeger H, Tealeb A, Toksöz MN, Veis G (2000) Globalpositioning system constrains on plate kinematics anddynamics in the eastern Mediterranean and Caucasus. JGeophys Res 105:5695–5719
McKenzie DP (1970) Plate tectonics of the Mediterraneanregion. Nature 226:239–243
McKenzie DP (1972) Active tectonics of the Mediterraneanregion. Geophys J Roy Astron Soc 30:109–185
McKenzie DP (1978) Active tectonics of the Alpine–Himalayanbelt: the Aegean Sea and surrounding regions. Geophys JRoy Astron Soc 55:217–254
Mitchell BJ, Pan Y, Xie J, Cong L (1997) Lg coda Q variationacross Eurasia and its relation to crustal evolution. JGeophys Res 102:22767–22779
Paige CC, Saunders MA (1982) LSQR: sparse linearequations and least squares problems. ACM Trans MathSoftw 8:43–71
Papadimitriou E, Sykes L (2001) Evolution of the stress fieldin the northern Aegean Sea, Greece. Geophys J Int146:747–759
Papazachos CB (1999) Seismological and GPS evidence forthe Aegean–Anatolia interaction. Geophys Res Lett17:2653–2656
Paton S (1992) Active normal faulting, drainage patterns andsedimentation in southwestern Turkey. J Geol Soc149:1031–1044
Royden LH (1993) The tectonic expression of slab pull atcontinental convergent boundaries. Tectonics 12:303–325
Salah MK, Zhao D (2003) 3-D seismic structure of KiiPeninsula in southwest Japan: evidence for slab dehydra-tion in the forearc. Tectonophysics 364:191–213
J Seismol (2007) 11:415–432 431

Sari C, Şalk M (2006) Sediment thicknesses of the westernAnatolia graben structures determined by 2-D and 3-Danalysis using gravity data. J Asian Earth Sci 26:39–48
Şaroğlu F, Emre Ö, Kuşçu İ (1992) Active fault map of Turkey.General Directorate of Mineral Research and Exploration,Ankara
Scholz CH (1990) The mechanics of earthquakes and faulting.Cambridge University Press, New York
Şengör AMC, Yılmaz Y, Sungurlu O (1985) Tectonics of theMediterranean Cimmerides: nature and evolution of thewestern termination of Paleotethys. In: Robertson AF,Dixon JE (eds) The geological evolution of the EasternMediterranean, vol 17, spec publ. Geological Society,London, pp 77–112
Serrano I, Morales J, Zhao D, Torcal F, Vidal F (1998) P-wavetomographic images in the central Betics–Alborán sea(South Spain) using local earthquakes: contribution for acontinental collision. Geophys Res Lett 25(21):4031–4034, DOI 10.1029/1998GL900021
Serrano I, Bohoyo F, Galindo-Zaldívar J, Morales J, Zhao D(2002a) Geophysical signatures of a basic-body rockplaced in the upper crust of the External Zones of theBetic Cordillera (Southern Spain). Geophys Res Lett 29(11), DOI 10.1029/2001GL013487
Serrano I, Zhao D, Morale J (2002b) 3-D crustal structure ofthe extensional Granada basin in the convergent boundarybetween the Eurasia and African plates. Tectonophysics344:61–79
Seyitoğlu G, Scott BC (1996) The age of the Alaşehir graben(west Turkey) and its tectonic implications. Geol J 31:1–11
Taymaz T, Jackson J, Mckenzie D (1991) Active tectonics ofthe central Aegean Sea. Geophys J Int 106:433–490
Tonarini S, Agostini S, Innocenti F, Manetti P (2005) δ11B astracer of slab dehydration and mantle evolution inwestern Anatolia Cenozoic magmatism. Terra Nova17:259–264
Um J, Thurber C (1987) A fast algorithm for two-point seismicray tracing. Bull Seismol Soc Am 77:972–986
Utsu T (1984) Estimation of parameters for recurrencemodels of earthquakes. Bull Earthq Res Inst Univ Tokyo59:53–66
Wessel P, Smith WHF (1998) New improved version ofGeneric Mapping Tools released. EOS Trans Am GeophysU 79:579
Widiyantoro S, Kennett BLN, van der Hilst RD (1999)Seismic tomography with P- and S-data reveals lateralvariations in the rigidity of deep slabs. Earth Planet SciLett 173:91–100
Yılmaz Y, Genc SC, Gurer OF, Bozcu M, Yılmaz K, Karacık Z,Altunkaynak S, Elmas A (2000) When did the WesternAnatolian grabens begin to develop? In: Bozkurt E,Winchester JA, Piper JDA (eds) Tectonics and magmatismin Turkey and the surrounding area, vol 173, specialpublications. Geological Society, London, pp 353–384
Zhao D (2001) New advances of seismic tomography and itsapplications to subduction zones and earthquake faultzones: a review. Isl Arc 10:68–84
Zhao D, Kanamori H (1995) The 1994 Northridge earthquake:3-D crustal structure in the rupture zone and its relation tothe aftershock locations and mechanisms. Geophys ResLett 22:763–766
Zhao D, Negishi H (1998) The 1995 Kobe earthquake: seismicimage of the source zone and its implications for therupture nucleation. J Geophys Res 103:9967–9986
Zhao D, Hasegawa A, Horiuchi S (1992) Tomographic imagingof P- and S-wave velocity structure beneath northeasternJapan. J Geophys Res 97:19909–19928
Zhao D, Hasegawa A, Kanamori H (1994) Deep structure ofJapan subduction zone as derived from local, regional, andteleseismic events. J Geophys Res 99:22313–22329
Zhao D, Kanamori H, Humphreys E (1996) Simultaneousinversion of local and teleseismic data for the crust andmantle structure of southern California. Phys Earth PlanetInter 93:191–214
Zhao D, Xu Y, Wiens D, Dorman L, Hildebrand J, Webb S(1997) Depth extent of the Lau back-arc spreading centerand its relation to subduction processes. Science278:254–257
Zhao D, Ochi F, Hasegawa A, Yamamoto A (2000) Evidencefor the location and cause of large crustal earthquakes inJapan. J Geophys Res 105:13579–13594
Zhao D, Wang K, Rogers G, Peacock S (2001) Tomographicimage of low P velocity anomalies above slab innorthern Cascadia subduction zone. Earth Planets Space53:285–293
Zhao D, Mishra OP, Sanda R (2002) Influence of fluids andmagma on earthquakes: seismological evidence. PhysEarth Planet Inter 132:249–267
Zhao D, Tani H, Mishra OP (2004) Crustal heterogeneity inthe 2000 western Tottori earthquake region: effect offluids from slab dehydration. Phys Earth Planet Inter145:161–177
Zhu L, Akyol N, Mitchell BJ, Sozbilir H (2006) Seismotec-tonics of western Turkey from high resolution earthquakerelocations and moment tensor determination. GeophysRes Lett 33, DOI 10.1029/2006GL025842
432 J Seismol (2007) 11:415–432