Relevance of ammonium oxidation within biological soil crust communities
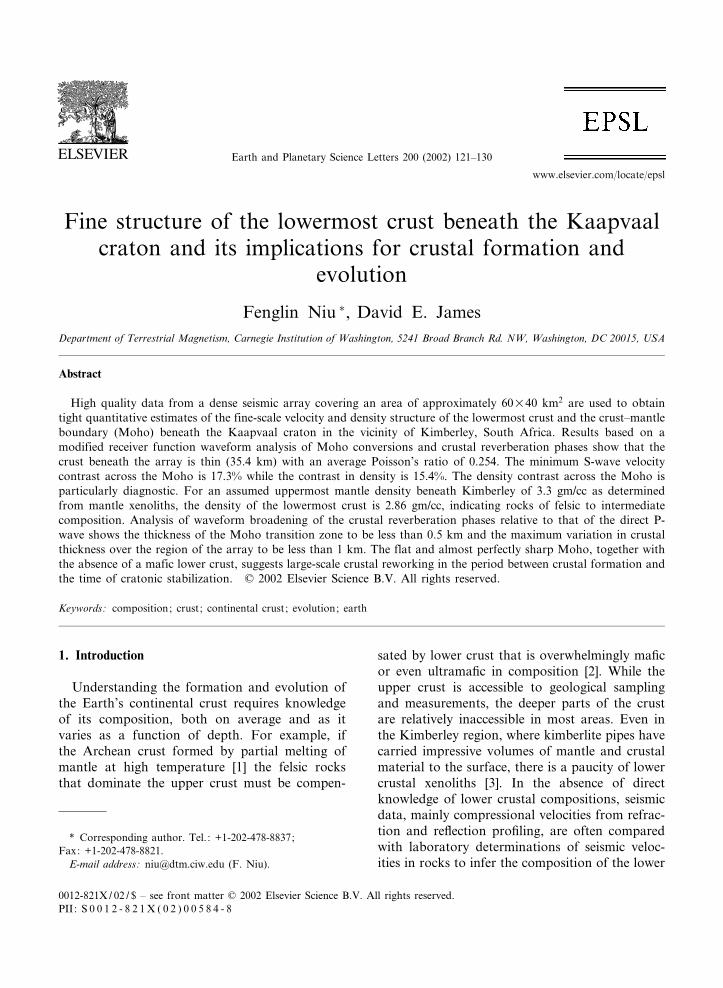
Fine structure of the lowermost crust beneath the Kaapvaalcraton and its implications for crustal formation and
evolution
Fenglin Niu �, David E. JamesDepartment of Terrestrial Magnetism, Carnegie Institution of Washington, 5241 Broad Branch Rd. NW, Washington, DC 20015, USA
Abstract
High quality data from a dense seismic array covering an area of approximately 60U40 km2 are used to obtaintight quantitative estimates of the fine-scale velocity and density structure of the lowermost crust and the crust^mantleboundary (Moho) beneath the Kaapvaal craton in the vicinity of Kimberley, South Africa. Results based on amodified receiver function waveform analysis of Moho conversions and crustal reverberation phases show that thecrust beneath the array is thin (35.4 km) with an average Poisson’s ratio of 0.254. The minimum S-wave velocitycontrast across the Moho is 17.3% while the contrast in density is 15.4%. The density contrast across the Moho isparticularly diagnostic. For an assumed uppermost mantle density beneath Kimberley of 3.3 gm/cc as determinedfrom mantle xenoliths, the density of the lowermost crust is 2.86 gm/cc, indicating rocks of felsic to intermediatecomposition. Analysis of waveform broadening of the crustal reverberation phases relative to that of the direct P-wave shows the thickness of the Moho transition zone to be less than 0.5 km and the maximum variation in crustalthickness over the region of the array to be less than 1 km. The flat and almost perfectly sharp Moho, together withthe absence of a mafic lower crust, suggests large-scale crustal reworking in the period between crustal formation andthe time of cratonic stabilization. 9 2002 Elsevier Science B.V. All rights reserved.
Keywords: composition; crust; continental crust; evolution; earth
1. Introduction
Understanding the formation and evolution ofthe Earth’s continental crust requires knowledgeof its composition, both on average and as itvaries as a function of depth. For example, ifthe Archean crust formed by partial melting ofmantle at high temperature [1] the felsic rocksthat dominate the upper crust must be compen-
sated by lower crust that is overwhelmingly ma¢cor even ultrama¢c in composition [2]. While theupper crust is accessible to geological samplingand measurements, the deeper parts of the crustare relatively inaccessible in most areas. Even inthe Kimberley region, where kimberlite pipes havecarried impressive volumes of mantle and crustalmaterial to the surface, there is a paucity of lowercrustal xenoliths [3]. In the absence of directknowledge of lower crustal compositions, seismicdata, mainly compressional velocities from refrac-tion and re£ection pro¢ling, are often comparedwith laboratory determinations of seismic veloc-ities in rocks to infer the composition of the lower
0012-821X / 02 / $ ^ see front matter 9 2002 Elsevier Science B.V. All rights reserved.PII: S 0 0 1 2 - 8 2 1 X ( 0 2 ) 0 0 5 8 4 - 8
* Corresponding author. Tel. : +1-202-478-8837;Fax: +1-202-478-8821.E-mail address: [email protected] (F. Niu).
EPSL 6199 14-5-02
Earth and Planetary Science Letters 200 (2002) 121^130
www.elsevier.com/locate/epsl
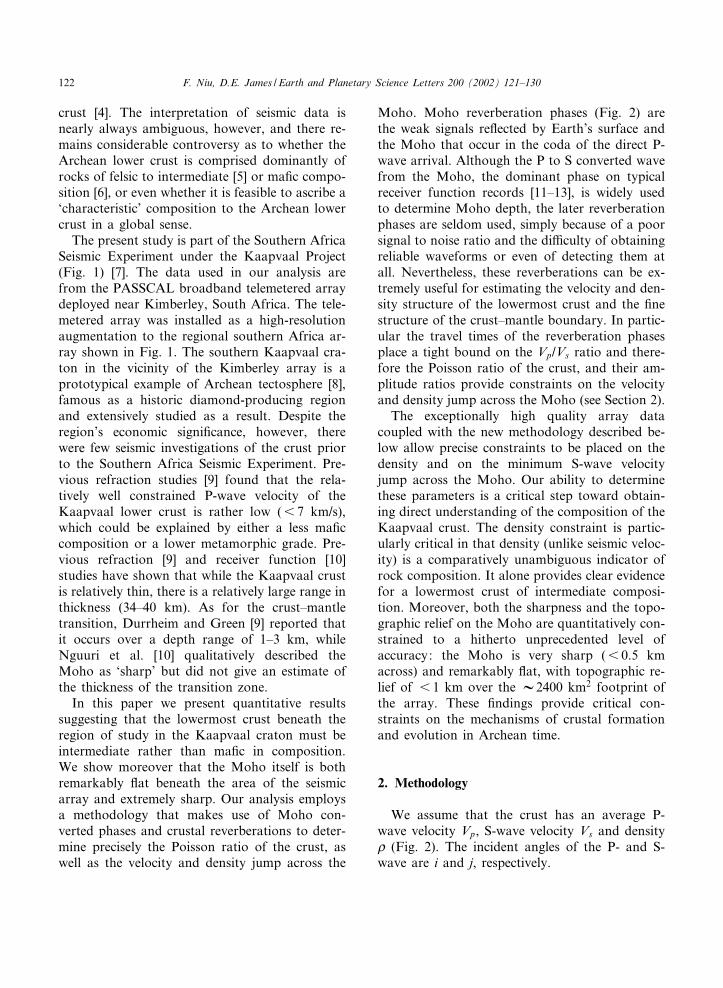
crust [4]. The interpretation of seismic data isnearly always ambiguous, however, and there re-mains considerable controversy as to whether theArchean lower crust is comprised dominantly ofrocks of felsic to intermediate [5] or ma¢c compo-sition [6], or even whether it is feasible to ascribe a‘characteristic’ composition to the Archean lowercrust in a global sense.
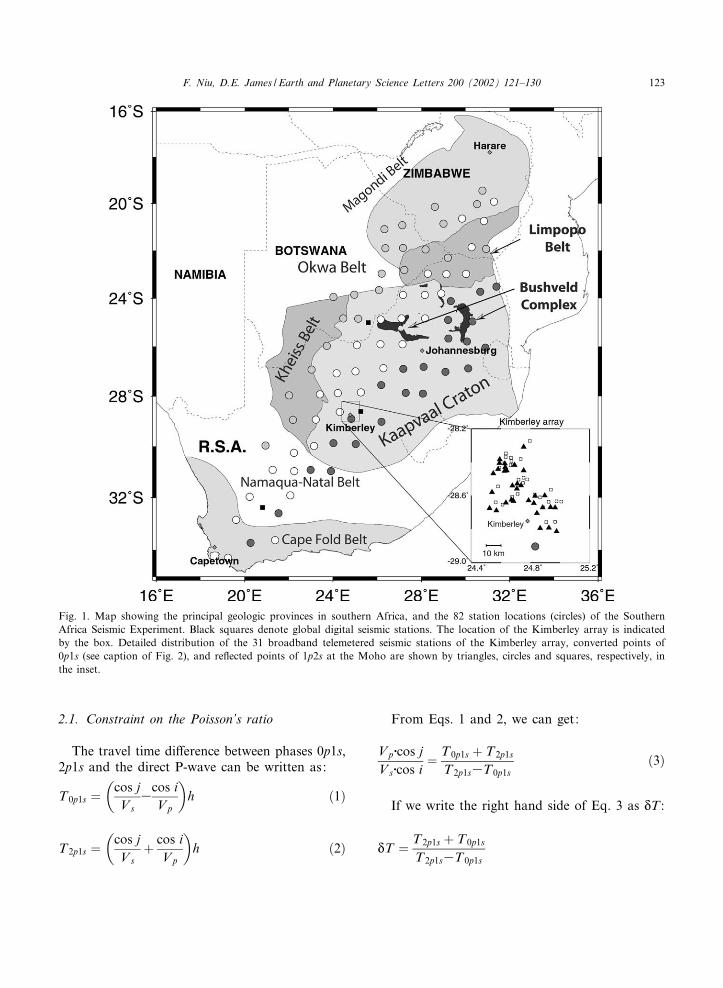
The present study is part of the Southern AfricaSeismic Experiment under the Kaapvaal Project(Fig. 1) [7]. The data used in our analysis arefrom the PASSCAL broadband telemetered arraydeployed near Kimberley, South Africa. The tele-metered array was installed as a high-resolutionaugmentation to the regional southern Africa ar-ray shown in Fig. 1. The southern Kaapvaal cra-ton in the vicinity of the Kimberley array is aprototypical example of Archean tectosphere [8],famous as a historic diamond-producing regionand extensively studied as a result. Despite theregion’s economic signi¢cance, however, therewere few seismic investigations of the crust priorto the Southern Africa Seismic Experiment. Pre-vious refraction studies [9] found that the rela-tively well constrained P-wave velocity of theKaapvaal lower crust is rather low (6 7 km/s),which could be explained by either a less ma¢ccomposition or a lower metamorphic grade. Pre-vious refraction [9] and receiver function [10]studies have shown that while the Kaapvaal crustis relatively thin, there is a relatively large range inthickness (34^40 km). As for the crust^mantletransition, Durrheim and Green [9] reported thatit occurs over a depth range of 1^3 km, whileNguuri et al. [10] qualitatively described theMoho as ‘sharp’ but did not give an estimate ofthe thickness of the transition zone.
In this paper we present quantitative resultssuggesting that the lowermost crust beneath theregion of study in the Kaapvaal craton must beintermediate rather than ma¢c in composition.We show moreover that the Moho itself is bothremarkably £at beneath the area of the seismicarray and extremely sharp. Our analysis employsa methodology that makes use of Moho con-verted phases and crustal reverberations to deter-mine precisely the Poisson ratio of the crust, aswell as the velocity and density jump across the
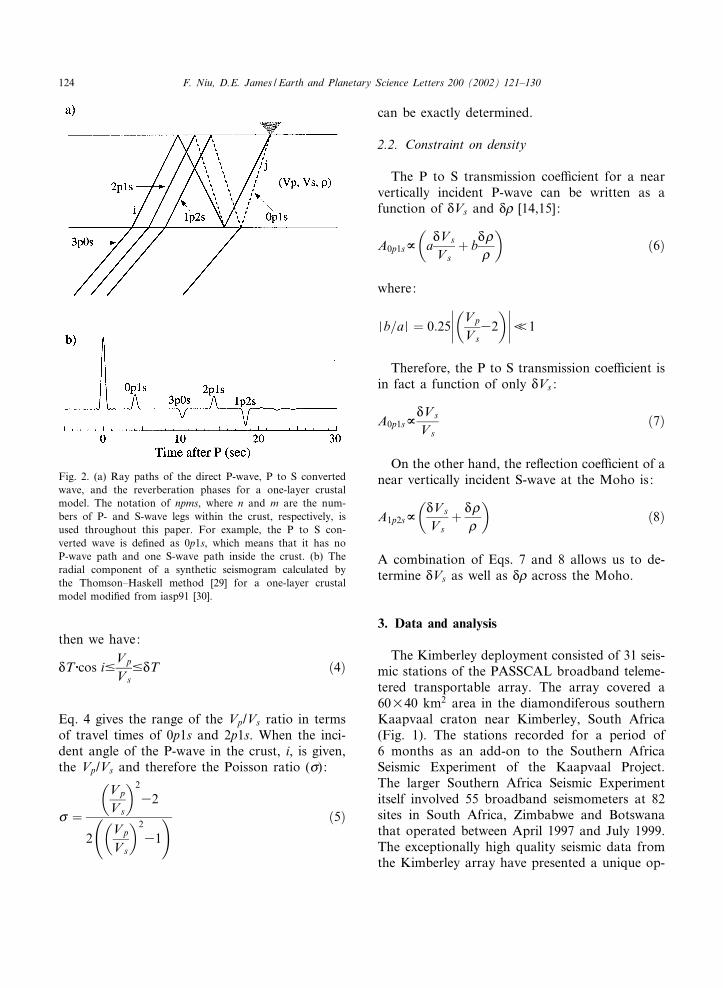
Moho. Moho reverberation phases (Fig. 2) arethe weak signals re£ected by Earth’s surface andthe Moho that occur in the coda of the direct P-wave arrival. Although the P to S converted wavefrom the Moho, the dominant phase on typicalreceiver function records [11^13], is widely usedto determine Moho depth, the later reverberationphases are seldom used, simply because of a poorsignal to noise ratio and the di⁄culty of obtainingreliable waveforms or even of detecting them atall. Nevertheless, these reverberations can be ex-tremely useful for estimating the velocity and den-sity structure of the lowermost crust and the ¢nestructure of the crust^mantle boundary. In partic-ular the travel times of the reverberation phasesplace a tight bound on the Vp/Vs ratio and there-fore the Poisson ratio of the crust, and their am-plitude ratios provide constraints on the velocityand density jump across the Moho (see Section 2).
The exceptionally high quality array datacoupled with the new methodology described be-low allow precise constraints to be placed on thedensity and on the minimum S-wave velocityjump across the Moho. Our ability to determinethese parameters is a critical step toward obtain-ing direct understanding of the composition of theKaapvaal crust. The density constraint is partic-ularly critical in that density (unlike seismic veloc-ity) is a comparatively unambiguous indicator ofrock composition. It alone provides clear evidencefor a lowermost crust of intermediate composi-tion. Moreover, both the sharpness and the topo-graphic relief on the Moho are quantitatively con-strained to a hitherto unprecedented level ofaccuracy: the Moho is very sharp (6 0.5 kmacross) and remarkably £at, with topographic re-lief of 6 1 km over the V2400 km2 footprint ofthe array. These ¢ndings provide critical con-straints on the mechanisms of crustal formationand evolution in Archean time.
2. Methodology
We assume that the crust has an average P-wave velocity Vp, S-wave velocity Vs and densityb (Fig. 2). The incident angles of the P- and S-wave are i and j, respectively.
EPSL 6199 14-5-02
F. Niu, D.E. James / Earth and Planetary Science Letters 200 (2002) 121^130122
2.1. Constraint on the Poisson’s ratio
The travel time di¡erence between phases 0p1s,2p1s and the direct P-wave can be written as:
T0p1s ¼cos jVs
3cos iVp
� �h ð1Þ
T2p1s ¼cos jVs
þ cos iVp
� �h ð2Þ
From Eqs. 1 and 2, we can get:
VpWcos jVsWcos i
¼ T0p1s þ T2p1s
T2p1s3T0p1sð3Þ
If we write the right hand side of Eq. 3 as NT :
NT ¼ T2p1s þ T0p1s
T2p1s3T0p1s
Fig. 1. Map showing the principal geologic provinces in southern Africa, and the 82 station locations (circles) of the SouthernAfrica Seismic Experiment. Black squares denote global digital seismic stations. The location of the Kimberley array is indicatedby the box. Detailed distribution of the 31 broadband telemetered seismic stations of the Kimberley array, converted points of0p1s (see caption of Fig. 2), and re£ected points of 1p2s at the Moho are shown by triangles, circles and squares, respectively, inthe inset.
EPSL 6199 14-5-02
F. Niu, D.E. James / Earth and Planetary Science Letters 200 (2002) 121^130 123
then we have:
NT Wcos i9VpVs
9NT ð4Þ
Eq. 4 gives the range of the Vp/Vs ratio in termsof travel times of 0p1s and 2p1s. When the inci-dent angle of the P-wave in the crust, i, is given,the Vp/Vs and therefore the Poisson ratio (c) :
c ¼
VpVs
� �2
32
2VpVs
� �2
31
! ð5Þ
can be exactly determined.
2.2. Constraint on density
The P to S transmission coe⁄cient for a nearvertically incident P-wave can be written as afunction of NVs and Nb [14,15] :
A0p1sO aNVsVs
þ bNbb
� �ð6Þ
where:
Mb=aM ¼ 0:25j VpVs32� �jI1
Therefore, the P to S transmission coe⁄cient isin fact a function of only NVs :
A0p1sONVsVs
ð7Þ
On the other hand, the re£ection coe⁄cient of anear vertically incident S-wave at the Moho is:
A1p2sONVsVs
þ Nb
b
� �ð8Þ
A combination of Eqs. 7 and 8 allows us to de-termine NVs as well as Nb across the Moho.
3. Data and analysis
The Kimberley deployment consisted of 31 seis-mic stations of the PASSCAL broadband teleme-tered transportable array. The array covered a60U40 km2 area in the diamondiferous southernKaapvaal craton near Kimberley, South Africa(Fig. 1). The stations recorded for a period of6 months as an add-on to the Southern AfricaSeismic Experiment of the Kaapvaal Project.The larger Southern Africa Seismic Experimentitself involved 55 broadband seismometers at 82sites in South Africa, Zimbabwe and Botswanathat operated between April 1997 and July 1999.The exceptionally high quality seismic data fromthe Kimberley array have presented a unique op-
Fig. 2. (a) Ray paths of the direct P-wave, P to S convertedwave, and the reverberation phases for a one-layer crustalmodel. The notation of npms, where n and m are the num-bers of P- and S-wave legs within the crust, respectively, isused throughout this paper. For example, the P to S con-verted wave is de¢ned as 0p1s, which means that it has noP-wave path and one S-wave path inside the crust. (b) Theradial component of a synthetic seismogram calculated bythe Thomson^Haskell method [29] for a one-layer crustalmodel modi¢ed from iasp91 [30].
EPSL 6199 14-5-02
F. Niu, D.E. James / Earth and Planetary Science Letters 200 (2002) 121^130124
portunity to image the ¢ne structure of the crustand the Moho in a cratonic ‘type locality’ in un-precedented detail.
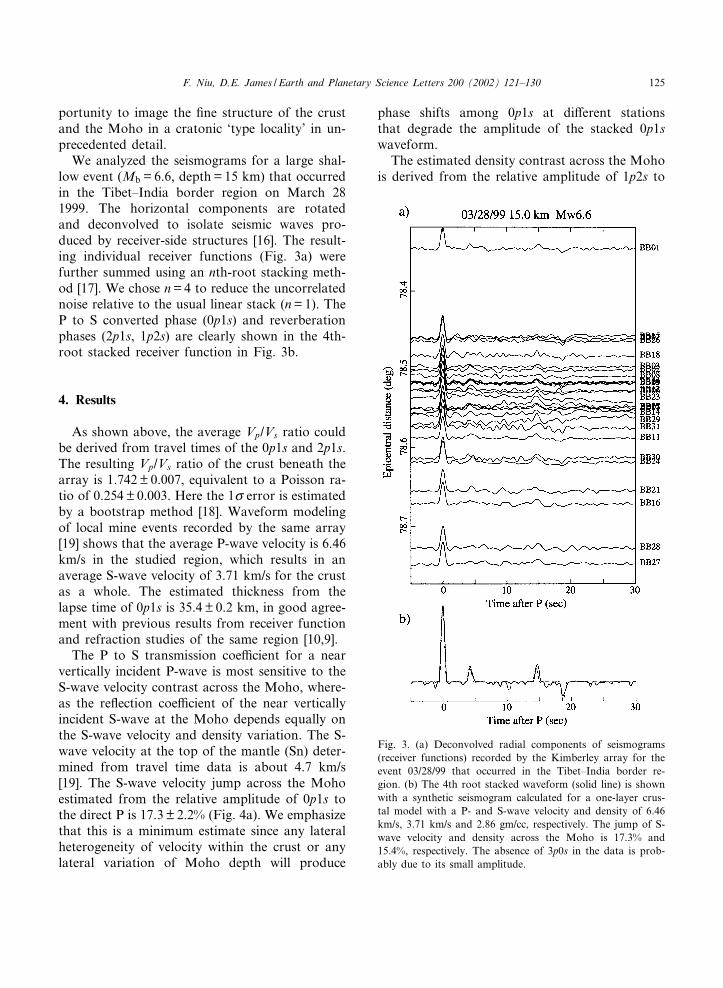
We analyzed the seismograms for a large shal-low event (Mb = 6.6, depth= 15 km) that occurredin the Tibet^India border region on March 281999. The horizontal components are rotatedand deconvolved to isolate seismic waves pro-duced by receiver-side structures [16]. The result-ing individual receiver functions (Fig. 3a) werefurther summed using an nth-root stacking meth-od [17]. We chose n=4 to reduce the uncorrelatednoise relative to the usual linear stack (n=1). TheP to S converted phase (0p1s) and reverberationphases (2p1s, 1p2s) are clearly shown in the 4th-root stacked receiver function in Fig. 3b.
4. Results
As shown above, the average Vp/Vs ratio couldbe derived from travel times of the 0p1s and 2p1s.The resulting Vp/Vs ratio of the crust beneath thearray is 1.742 U 0.007, equivalent to a Poisson ra-tio of 0.254U 0.003. Here the 1c error is estimatedby a bootstrap method [18]. Waveform modelingof local mine events recorded by the same array[19] shows that the average P-wave velocity is 6.46km/s in the studied region, which results in anaverage S-wave velocity of 3.71 km/s for the crustas a whole. The estimated thickness from thelapse time of 0p1s is 35.4 U 0.2 km, in good agree-ment with previous results from receiver functionand refraction studies of the same region [10,9].
The P to S transmission coe⁄cient for a nearvertically incident P-wave is most sensitive to theS-wave velocity contrast across the Moho, where-as the re£ection coe⁄cient of the near verticallyincident S-wave at the Moho depends equally onthe S-wave velocity and density variation. The S-wave velocity at the top of the mantle (Sn) deter-mined from travel time data is about 4.7 km/s[19]. The S-wave velocity jump across the Mohoestimated from the relative amplitude of 0p1s tothe direct P is 17.3 U 2.2% (Fig. 4a). We emphasizethat this is a minimum estimate since any lateralheterogeneity of velocity within the crust or anylateral variation of Moho depth will produce
phase shifts among 0p1s at di¡erent stationsthat degrade the amplitude of the stacked 0p1swaveform.
The estimated density contrast across the Mohois derived from the relative amplitude of 1p2s to
Fig. 3. (a) Deconvolved radial components of seismograms(receiver functions) recorded by the Kimberley array for theevent 03/28/99 that occurred in the Tibet^India border re-gion. (b) The 4th root stacked waveform (solid line) is shownwith a synthetic seismogram calculated for a one-layer crus-tal model with a P- and S-wave velocity and density of 6.46km/s, 3.71 km/s and 2.86 gm/cc, respectively. The jump of S-wave velocity and density across the Moho is 17.3% and15.4%, respectively. The absence of 3p0s in the data is prob-ably due to its small amplitude.
EPSL 6199 14-5-02
F. Niu, D.E. James / Earth and Planetary Science Letters 200 (2002) 121^130 125
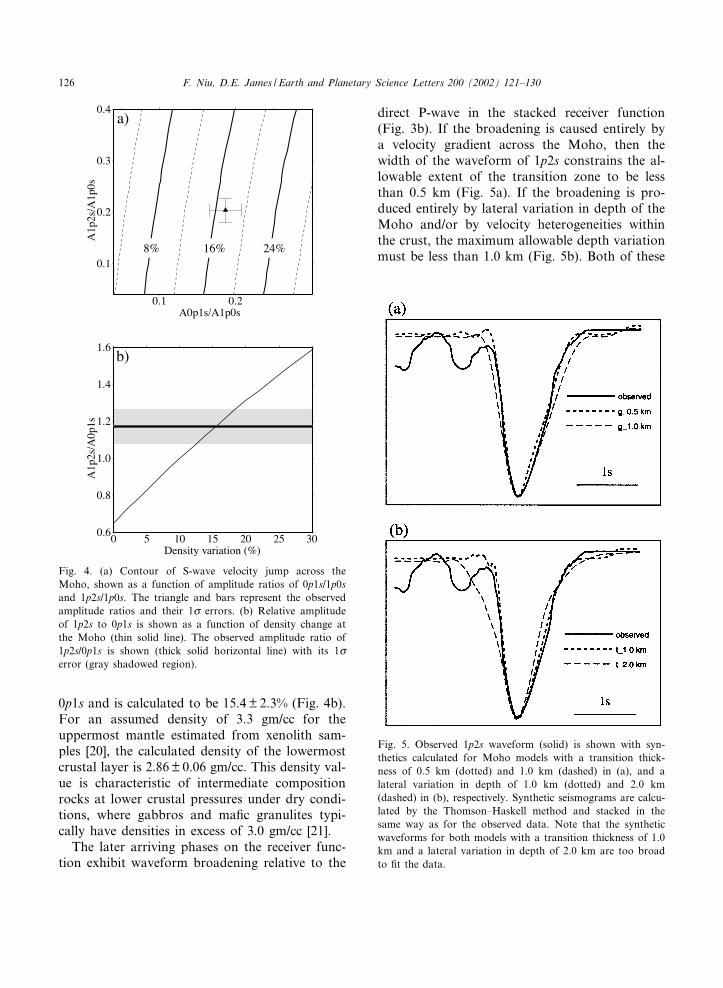
0p1s and is calculated to be 15.4 U 2.3% (Fig. 4b).For an assumed density of 3.3 gm/cc for theuppermost mantle estimated from xenolith sam-ples [20], the calculated density of the lowermostcrustal layer is 2.86U 0.06 gm/cc. This density val-ue is characteristic of intermediate compositionrocks at lower crustal pressures under dry condi-tions, where gabbros and ma¢c granulites typi-cally have densities in excess of 3.0 gm/cc [21].
The later arriving phases on the receiver func-tion exhibit waveform broadening relative to the
direct P-wave in the stacked receiver function(Fig. 3b). If the broadening is caused entirely bya velocity gradient across the Moho, then thewidth of the waveform of 1p2s constrains the al-lowable extent of the transition zone to be lessthan 0.5 km (Fig. 5a). If the broadening is pro-duced entirely by lateral variation in depth of theMoho and/or by velocity heterogeneities withinthe crust, the maximum allowable depth variationmust be less than 1.0 km (Fig. 5b). Both of these
Fig. 5. Observed 1p2s waveform (solid) is shown with syn-thetics calculated for Moho models with a transition thick-ness of 0.5 km (dotted) and 1.0 km (dashed) in (a), and alateral variation in depth of 1.0 km (dotted) and 2.0 km(dashed) in (b), respectively. Synthetic seismograms are calcu-lated by the Thomson^Haskell method and stacked in thesame way as for the observed data. Note that the syntheticwaveforms for both models with a transition thickness of 1.0km and a lateral variation in depth of 2.0 km are too broadto ¢t the data.
Fig. 4. (a) Contour of S-wave velocity jump across theMoho, shown as a function of amplitude ratios of 0p1s/1p0sand 1p2s/1p0s. The triangle and bars represent the observedamplitude ratios and their 1c errors. (b) Relative amplitudeof 1p2s to 0p1s is shown as a function of density change atthe Moho (thin solid line). The observed amplitude ratio of1p2s/0p1s is shown (thick solid horizontal line) with its 1cerror (gray shadowed region).
EPSL 6199 14-5-02
F. Niu, D.E. James / Earth and Planetary Science Letters 200 (2002) 121^130126
constraints are extraordinarily tight in light ofwhat is typically observed of Moho structureand topography.
5. Discussion
The results presented in this paper are perhapsthe most precise quantitative seismic measure-ments of crustal and Moho properties ever ob-tained for southern Africa. While our results arestrictly applicable only to the region of the Kim-berley array, their qualitative similarity with re-sults from regional single station receiver functionstudies for undisturbed cratonic crust of southernAfrica [10] suggests that the structures observedbeneath the Kimberley array may be characteris-tic of much of the Kaapvaal craton. Both the lowPoisson ratio of 0.254 for the crust as a whole andthe density of 2.86 gm/cc for lowermost crustalrocks provide compelling evidence that the lowercrust beneath the Kaapvaal craton is dominatedby rocks of intermediate to felsic rather thanma¢c composition [4]. The required S-wave veloc-ity contrast across the Moho s 17.3% is consis-tent with but not diagnostic of intermediate com-positions. While suggestions that Archean lowercrust is less ma¢c than that of post-Archean crustin southern Africa have been published previously[5,10,22], the issue remains controversial. Indeed,
Zandt and Ammon [6] in a global study con-cluded that the lowermost crust of ancient plat-forms is characterized by a relatively high Poissonratio (V0.28), indicative of ma¢c material. Forthe region of the Kaapvaal studied here, however,the properties measured for the lowermost crustindicate that it can accommodate only relativelysmall amounts of granulite-facies ma¢c compo-nents. The absence of a ma¢c signature in theseismic results is consistent with the fact thatma¢c granulite xenoliths from the lower Archeancrust are rare [23,24].
Two additional and quite important constraintsemerge from this study as to the structure andmorphology of the Moho beneath the Kimberleyarray. First, we have shown that within the areaof the array the cratonic Moho is an extremelysharp boundary, with a transition less than 0.5km. Second, the Moho is extremely £at, with amaximum variation in crustal thickness of 1 kmover the approximately 2400 km2 area of the ar-ray. Both of these determinations are calculatedunder the assumption that other variables remain¢xed. The Moho transition thickness and the var-iation in crustal thickness are therefore maximumestimates.
The observed sharpness and £atness of theMoho have fundamental implications for crustalformation and evolution in the Archean. While itmay be possible to produce a crustal section suchas that observed beneath the Kimberley arraysimply by direct emplacement of evolved meltsto form crust by means of subduction or quasi-subduction melting processes, we still requiresome means of preserving original Moho struc-tures during late Archean tectonomagmaticevents. The assembly history of the Kaapvaalcrust is complex, spanning nearly 1 billion yearsof geologic time [25]. Although details of crustalaggregation are still unclear, models typically in-volve extensive collisional accretion of island arcsand microcontinental blocks to form nuclear con-tinental masses [25]. Such accretionary processesmay be expected to produce a complicated mosaicof varying Moho structures and diverse crustallithologies. Just such structures were observed inthe Limpopo Belt, a late Archean collisional zonebetween the Zimbabwe and Kaapvaal cratons
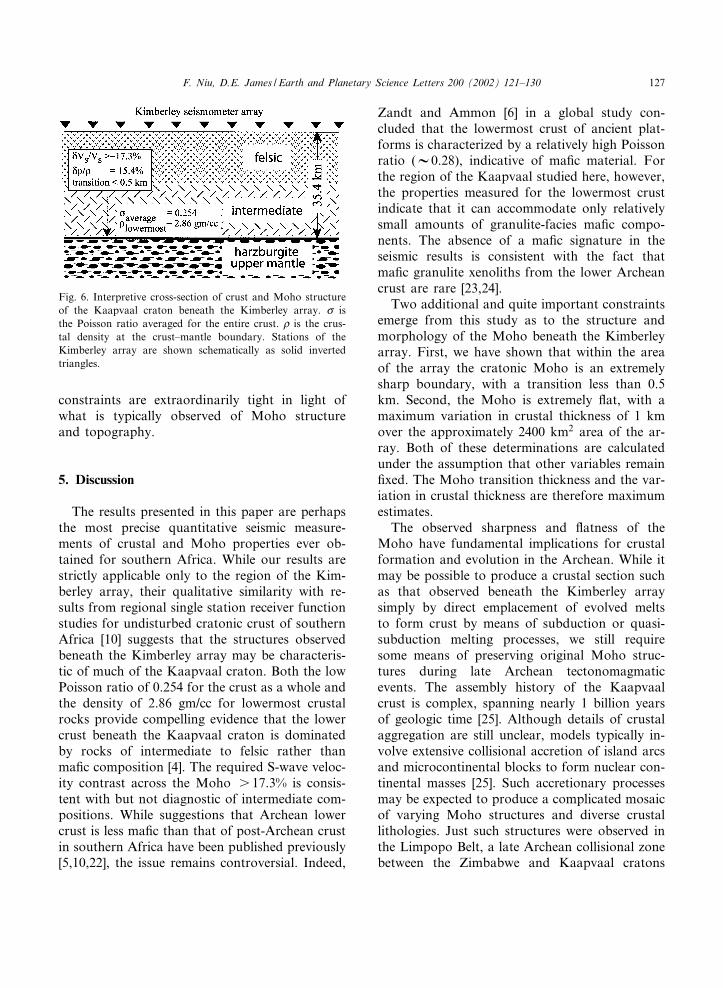
Fig. 6. Interpretive cross-section of crust and Moho structureof the Kaapvaal craton beneath the Kimberley array. c isthe Poisson ratio averaged for the entire crust. b is the crus-tal density at the crust^mantle boundary. Stations of theKimberley array are shown schematically as solid invertedtriangles.
EPSL 6199 14-5-02
F. Niu, D.E. James / Earth and Planetary Science Letters 200 (2002) 121^130 127
that exhibits many traits of tectonic deformationseen in modern continent^continent collision, in-cluding extensive crustal thickening and a highlycomplex Moho [10]. On the other hand, relatively£at Moho structures have been found to be pre-served over areas of signi¢cant extent in somePhanerozoic accretionary terranes in western Can-ada [26], so it remains possible that the Mohostructures observed today are simply those pre-served from the time of crustal formation.
An alternative and more plausible explanationof our observations is that the Kaapvaal crust wasindeed assembled by accretionary tectonics, butthat the £at and sharp Moho was achieved in alater stage of crustal evolution. This explanationimplicitly requires that a large volume of theKaapvaal crust has been re-melted on a regionalscale since its formation. Such large thermalevents, mainly involving the lower crust, were sug-gested by a recent geochronological study [27] ofcrustal rocks exposed in the Vredefort dome lo-cated some 300 km northwest of Kimberley.Much of what we know about the deep crust be-neath the Kaapvaal craton has come from thestudy of rocks exposed in the Vredefort complexin which an almost complete section of cratoniccrust has been turned on-edge by isostatic re-bound following a massive meteor impact around2.0 billion years ago (Ga). Moser and co-workers[27] carried out a detailed study of mid and lowercrustal rocks (which are dominantly felsic to in-termediate in composition) exposed in the erodedremains of the crater. They presented evidencethat the rocks exposed in the Vredefort dome rec-ord a complex history of crustal formationaround 3.5 Ga followed by large-scale re-meltingduring a craton-wide thermal event at 3.11 Ga.Based on the distribution and ages of rocks inthe Vredefort crustal section, they concludedthat as much as 40% of the crust, chie£y the lowercrust, was re-melted during that event. We furtherspeculate that the very large degree of crustalmelting proposed by Moser et al. [27] is su⁄cientto form something resembling an ‘ocean’ of meltin the cratonic lower crust near the crust^mantleboundary. The magmatic di¡erentiation andlayering accompanying the crystallization of thatlower crustal melt ‘ocean’ is one possible means
for producing both a £at and sharp Moho as wellas the evolved rock compositions that we inferfrom the seismic data.
6. Summary of conclusions
We have introduced in this paper a re¢nedtechnique for using reverberation phases in re-ceiver function analysis of high quality broadbanddata. The method yields well determined averageseismic velocities and Poisson ratios for the crust.The S-wave velocity jump and density jumpacross the Moho are also obtained from the anal-ysis. When coupled with high quality array data,the technique also places quantitative constraintson both the sharpness of the crust^mantle bound-ary and the topographic relief on the Moho. Wehave applied the methodology to high qualityteleseismic data recorded on the broadband Kim-berley array to obtain quantitative constraints onthe nature of the lower crust and Moho of theKaapvaal craton of southern Africa. The primaryresults of the analysis reveal the following featuresof the crust and crust^mantle boundary beneaththe array: (1) the crust is relatively thin (35.4 km)with a low average crustal Poisson ratio ofV0.254; (2) the density contrast across theMoho is V15.4%, indicating a lowermost crustaldensity around 2.86 gm/cc; (3) the Moho is verysharp, with a crust^mantle transition zone lessthan 0.5 km; and (4) the Moho is surprisingly£at with topographic relief less than 1 km overa region of V2400 km2. An interpretive summaryof these results is shown in Fig. 6. The evidencefor a £at and almost perfectly sharp Moho, to-gether with the absence of a ma¢c lower crust,suggests large-scale crustal reworking during amajor thermomagmatic event in the period be-tween initial crustal formation and the time ofcratonic stabilization at the end of the Archean.
Acknowledgements
The Kaapvaal Project involved the e¡orts ofmore than 100 people a⁄liated with about 30 in-stitutions. Details of participants and a project
EPSL 6199 14-5-02
F. Niu, D.E. James / Earth and Planetary Science Letters 200 (2002) 121^130128

summary can be found on the Kaapvaal websitewww.ciw.edu/kaapvaal. We owe a special debt ofthanks to the PASSCAL team that manages thetelemetered array, notably Frank Vernon and JimFowler, with the able technical support of GlenO⁄eld. Rod Green, with support from Jock Ro-bey, Josh Harvey, Lindsey Kennedy and others ofthe de Beers geology headquarters at the DairyFarm in Kimberley, sited and constructed the sta-tions of the array. As always, supertech RandyKuehnel was invaluable. The data were processedthrough Frank Vernon’s laboratory at UCSD(IGPP) and are archived at the IRIS Data Man-agement Center from which were obtained theselected data used in this study. The KaapvaalProject is funded by the National Science Foun-dation Continental Dynamics Program and byseveral public and private sources in southernAfrica. F.N. thanks the Carnegie Institution forsupport under its postdoctoral fellowship pro-gram. Map ¢gures were produced with GMT[28]. A discussion with Hitoshi Kawakatsu inthe early stage of this work was stimulative andhelpful. Discussions with Alan Linde, SelwynSacks, Susan van der Lee and Lianxing Wenwere helpful in preparing the manuscript. RobertaRudnick and Mark Schmitz provided constructivereviews that improved the manuscript signi¢cant-ly.[RV]
References
[1] R.L. Rudnick, Making continental crust, Nature 378(1995) 571^578.
[2] D.M. Fountain, N.I. Christensen, Composition of thecontinental crust and upper mantle: a review, in: L.C.Pakiser, W.D. Mooney (Eds.), Geophysical Frameworkof the Continental United States, Geol. Soc. Am. Mem.172, Boulder, CO, 1989, pp. 711^742.
[3] M.D. Schmitz, Geological and Thermochronological Evo-lution of the Lower Crust of Southern Africa, PhD The-sis, Massachusetts Institute of Technology, Cambridge,MA, 2002, 271 pp.
[4] N.I. Christensen, D.M. Fountain, Constitution of thelower continental crust based on experimental studies ofseismic velocities in granulite, Geol. Soc. Am. Bull. 86(1975) 227^236.
[5] R.J. Durrheim, W.D. Mooney, Evolution of the Precam-brian lithosphere: seismological and geochemical con-straints, J. Geophys. Res. 99 (1994) 15359^15374.
[6] G. Zandt, C.J. Ammon, Continental crust compositionconstrained by measurement of crustal Poisson’s ratio,Nature 374 (1995) 152^154.
[7] R.W. Carlson, T.L. Grove, M.J. de Wit, J.J. Gurney,Program to study the crust and mantle of the Archeancraton in southern Africa, EOS Trans. AGU 77 (1996)273^277.
[8] D.E. James, M.J. Fouch, J.C. VanDecar, S. van der Lee,and Kaapvaal Seismic Group, Tectospheric structure be-neath southern Africa, Geophys. Res. Lett. 28 (2001)2485^2488.
[9] R.J. Durrheim, R.W. Green, A seismic refraction inves-tigation of the Archaean Kaapvaal Craton, South Africa,using mine tremors as the energy source, Geophys. J. Int.108 (1992) 812^832.
[10] T.K. Nguuri et al., Crustal structure beneath southernAfrica and its implications for the formation and evolu-tion of the Kaapvaal and Zimbabwe cratons, Geophys.Res. Lett. 28 (2001) 2501^2504.
[11] C.A. Langston, Structure under Mount Rainier, Washing-ton, inferred from teleseismic body waves, J. Geophys.Res. 84 (1979) 4749^4762.
[12] T.J. Owens, G. Zandt, S.R. Taylor, Seismic evidence foran ancient rift beneath the Cumberland plateau, Tennes-see: a detailed analysis of broadband teleseismic P wave-forms, J. Geophys. Res. 89 (1984) 7783^7795.
[13] R. Kind, G.L. Kosarev, N.V. Petersen, Receiver functionat the stations of the German Regional Seismic Network(GRSN), Geophys. J. Int. 121 (1995) 191^202.
[14] K. Aki, P.G. Richards, Quantitative Seismology: Theoryand Methods, W.H. Freeman and Co., San Francisco,CA, 1980.
[15] M. Kato, H. Kawakatsu, Seismological in situ estimationof density jump across the transition zone discontinuitiesbeneath Japan, Geophys. Res. Lett. 28 (2001) 2541^2544.
[16] C.J. Ammon, The isolation of receiver e¡ects from tele-seismic P waveforms, Bull. Seismol. Soc. Am. 81 (1991)2504^2510.
[17] K.J. Muirhead, Eliminating false alarms when detectingseismic events automatically, Nature 217 (1968) 533^534.
[18] B. Efron, R. Tibshirani, Bootstrap methods for standarderrors, con¢dence intervals, and other measures of statis-tical accuracy, Stat. Sci. 1 (1986) 54^75.
[19] D.E. James, F. Niu, J. Rokosky, Crustal formation in theArchean: constraints from the Southern Africa SeismicExperiment, Lithos (2002) submitted.
[20] F.R. Boyd, R.H. McCallister, Density of fertile and sterilegarnet peridotites, Geophys. Res. Lett. 3 (1976) 509^512.
[21] N.I. Christensen, Seismic velocities, in: R.S. Charmichael(Ed.), Handbook of Physical Properties of Rocks, Vol. II,CRC Press, Boca Raton, FL, 1982, pp. 2^228.
[22] W.L. Gri⁄n, S.Y. O’Reilly, The composition of the lowercrust and the nature of the continental Moho-xenolithevidence, in: P.H. Nixon (Ed.), Mantle Xenoliths, JohnWiley and Sons, Chichester, 1987, pp. 413^432.
[23] P.W.C. Van Calsteren, N.B.W. Harris, C.J. Hawkes-
EPSL 6199 14-5-02
F. Niu, D.E. James / Earth and Planetary Science Letters 200 (2002) 121^130 129
worth, M.A. Menzies, D.W. Rogers, Xenoliths fromsouthern Africa: a perspective on the lower crust, in:J.B. Dawson, D.A. Carswell, J. Hall, K.H. Wedepohl(Eds.), The Nature of the Lower Continental Crust, Ox-ford University Press, London, 1986, pp. 351^362.
[24] M.D. Schmitz, S.A. Bowring, The temporal diversity oflower crustal granulites throughout the Kaapvaal craton,Southern Africa, EOS Trans. AGU 81 (Fall Meet. Suppl.)(2000) 1249.
[25] M.J. de Wit et al., Formation of an Archaean continent,Nature 357 (1992) 553^562.
[26] F.A. Cook, The re£ection Moho beneath the southern
Canadian Cordillera, Can. J. Earth Sci. 32 (1995) 1520^1530.
[27] D.E. Moser, R.M. Flowers, R.J. Hart, Birth of the Kaap-vaal tectosphere 3.08 billion years ago, Science 291 (2001)465^468.
[28] P. Wessel, W.H.F. Smith, Free software helps map anddisplay data, EOS Trans. AGU 72 (1991) 445^446.
[29] N.A. Haskell, Crustal re£ections of the plane P and SVwaves, J. Geophys. Res. 67 (1962) 4751^4767.
[30] B.L.N. Kennett, E.R. Engdahl, Travel times for globalearthquake location and phase identi¢cation, Geophys.J. Int. 105 (1991) 429^465.
EPSL 6199 14-5-02
F. Niu, D.E. James / Earth and Planetary Science Letters 200 (2002) 121^130130
Copyright © 2022 FDOKUMEN