Heat production heterogeneity of the Indian crust beneath the Himalaya: Insights from the northern...
7
Heat production heterogeneity of the Indian crust beneath the Himalaya: Insights from the northern Indian Shield P. Senthil Kumar ⁎, Rajeev Menon, G.K. Reddy National Geophysical Research Institute, Council of Scientific and Industrial Research, Uppal Road, Hyderabad 500 606, India abstract article info Article history: Received 1 January 2009 Received in revised form 14 April 2009 Accepted 15 April 2009 Available online 12 May 2009 Editor: T.M. Harrison Keywords: heat production heat flow crustal thermal structure Indian Shield Himalaya Crustal thermal structure of the Himalaya depends partly on the thermal properties of the Indian crust that has subducted beneath the Himalayan range and partly accreted to it. In most studies the Indian crust is assigned uniform thermal properties, mostly derived from the data from southern India. We show here that this might actually not be a good assumption, based on the in-situ heat production measurements at 279 sites in the Bundelkhand craton, Chottanagpur gneissic complex and Singhbhum craton. The dominant rocks (granites and gneisses) in the Bundelkhand craton and Chottanagpur gneissic complex are characterized by high heat production (3.93–6.52 μWm -3 ), whereas the rocks in the Singhbhum craton are low in heat production (1.41– 3.27 μWm -3 ), thereby suggesting a large variation of heat production in the northern Indian Shield. The available surface heat flow values also show consistently large variation, from 56 to 96 mW m -2 . The crustal heat production heterogeneity within the Indian crust has to be duly considered in the interpretation of thermobarometric and thermochronological data of the Himalaya. © 2009 Published by Elsevier B.V. 1. Introduction The formation of a mountain belt in response to continental collision depends, among other factors, on the rheology of colliding continents, and hence on their thermal structure (see Avouac, 2007). Determination of heat production heterogeneity of the Indian crust beneath the Himalaya is essential to understand the thermal structure of the Himalaya. As a consequence of heat production contributing significantly to the crustal thermal structure of the orogen, it is necessary to determine the abundance of heat producing elements (K, U and Th) in the major rock formations of the Himalayan range as well as in the subducting Indian crust. Several researchers have modeled the crustal thermal structure of the Himalaya (e.g., Francheteau et al., 1984; Molnar and England, 1990; England et al., 1992; England and Molnar, 1993; Royden, 1993; Henry et al., 1997; Harrison et al., 1998; Beaumont et al., 2004; Jamieson et al., 2004; Bollinger et al., 2004, 2006; Whipp et al., 2007; Hetényi et al., 2007; Priestley et al., 2008). However, there are only a few heat production data from the Himalayan rocks (e.g., England et al., 1992; Whipp et al., 2007), which are inadequate to draw any meaningful conclusion with regard to the overall crustal radiogenic heat contribution. We need to know how radiogenic heat production varies laterally and vertically in the subducting Indian crust beneath this orogen. The present endeavour is a step toward achieving this objective. Most Himalayan thermal models use the heat production data from the exposed Indian Shield as a proxy of the subducting Indian crust. However, the existing heat production data are largely confined to the southern Indian Shield (see Rao et al., 2003), which is unlikely to represent the subducting Indian crust. A large number of heat production measurements from the northern Indian Shield are warranted for a comprehensive understanding of the crust beneath the Himalaya. For this purpose, we present (a) new heat production data from the Bundelkhand granites, Chottanagpur gneissic complex and Singhbhum craton (Fig. 1), (b) crustal heat production budget of the northern Indian crust, (c) models of steady state crustal geotherms of the northern Indian crust. Finally we discuss the implications of our study with regard to the Himalayan thermal structure. 2. The northern Indian Shield The northern Indian Shield consists of Rajasthan craton, Bundelk- hand craton, and the Chottanagpur gneissic complex (Fig. 1). The Rajasthan craton is composed largely of Proterozoic provinces (e.g., the Aravalli and Delhi fold belts) with patches of Archaean rocks (e.g., the banded gneissic complex); the rocks are likely to underlie the western part of the central Himalaya. This study does not present new data from the Rajasthan craton, but reviews the published literature on thermal models for a fruitful discussion. The Bundelkhand craton and the Chottanagpur gneissic complex may underlie the middle and eastern part of the central Himalaya and hence is the subject of the present study. The Bundelkhand craton exposes an Archaean granite complex (~2500 Ma age), namely, the Bundelkhand granites, which consist of porphyritic, medium to coarse grained and fine grained textural varieties. The granites underlie the Proterozoic sedimentary Earth and Planetary Science Letters 283 (2009) 190–196 ⁎ Corresponding author. Tel.: +91 40 23434711; fax: +91 40 27171564. E-mail address: [email protected] (P.S. Kumar). 0012-821X/$ – see front matter © 2009 Published by Elsevier B.V. doi:10.1016/j.epsl.2009.04.015 Contents lists available at ScienceDirect Earth and Planetary Science Letters journal homepage: www.elsevier.com/locate/epsl
-
Upload
independent -
Category
Documents
-
view
3 -
download
0
Transcript of Heat production heterogeneity of the Indian crust beneath the Himalaya: Insights from the northern...
Earth and Planetary Science Letters 283 (2009) 190–196
Contents lists available at ScienceDirect
Earth and Planetary Science Letters
j ourna l homepage: www.e lsev ie r.com/ locate /eps l
Heat production heterogeneity of the Indian crust beneath the Himalaya: Insightsfrom the northern Indian Shield
P. Senthil Kumar ⁎, Rajeev Menon, G.K. ReddyNational Geophysical Research Institute, Council of Scientific and Industrial Research, Uppal Road, Hyderabad 500 606, India
⁎ Corresponding author. Tel.: +91 40 23434711; fax:E-mail address: [email protected] (P.S. Kumar)
0012-821X/$ – see front matter © 2009 Published by Edoi:10.1016/j.epsl.2009.04.015
a b s t r a c t
a r t i c l e i n f oArticle history:Received 1 January 2009Received in revised form 14 April 2009Accepted 15 April 2009Available online 12 May 2009
Editor: T.M. Harrison
Keywords:heat productionheat flowcrustal thermal structureIndian ShieldHimalaya
Crustal thermal structure of the Himalaya depends partly on the thermal properties of the Indian crust that hassubducted beneath the Himalayan range and partly accreted to it. In most studies the Indian crust is assigneduniform thermal properties, mostly derived from the data from southern India. We show here that this mightactually not be a good assumption, based on the in-situ heat production measurements at 279 sites in theBundelkhand craton, Chottanagpur gneissic complex and Singhbhum craton. The dominant rocks (granites andgneisses) in the Bundelkhand craton and Chottanagpur gneissic complex are characterized by high heatproduction (3.93–6.52 μWm−3), whereas the rocks in the Singhbhum craton are low in heat production (1.41–3.27 μWm−3), thereby suggesting a large variationof heat production in thenorthern Indian Shield. The availablesurface heat flow values also show consistently large variation, from 56 to 96 mW m−2. The crustal heatproduction heterogeneity within the Indian crust has to be duly considered in the interpretation ofthermobarometric and thermochronological data of the Himalaya.
© 2009 Published by Elsevier B.V.
1. Introduction
The formation of a mountain belt in response to continentalcollision depends, among other factors, on the rheology of collidingcontinents, and hence on their thermal structure (see Avouac, 2007).Determination of heat production heterogeneity of the Indian crustbeneath the Himalaya is essential to understand the thermal structureof the Himalaya. As a consequence of heat production contributingsignificantly to the crustal thermal structure of the orogen, it isnecessary to determine the abundance of heat producing elements(K, U and Th) in the major rock formations of the Himalayan range aswell as in the subducting Indian crust. Several researchers havemodeled the crustal thermal structure of the Himalaya (e.g.,Francheteau et al., 1984; Molnar and England, 1990; England et al.,1992; England and Molnar, 1993; Royden, 1993; Henry et al., 1997;Harrison et al., 1998; Beaumont et al., 2004; Jamieson et al., 2004;Bollinger et al., 2004, 2006; Whipp et al., 2007; Hetényi et al., 2007;Priestley et al., 2008). However, there are only a few heat productiondata from the Himalayan rocks (e.g., England et al., 1992; Whipp et al.,2007), which are inadequate to draw any meaningful conclusion withregard to the overall crustal radiogenic heat contribution. We need toknow how radiogenic heat production varies laterally and vertically inthe subducting Indian crust beneath this orogen. The presentendeavour is a step toward achieving this objective.
Most Himalayan thermal models use the heat production datafrom the exposed Indian Shield as a proxy of the subducting Indian
+91 40 27171564..
lsevier B.V.
crust. However, the existing heat production data are largely confinedto the southern Indian Shield (see Rao et al., 2003), which is unlikelyto represent the subducting Indian crust. A large number of heatproduction measurements from the northern Indian Shield arewarranted for a comprehensive understanding of the crust beneaththe Himalaya. For this purpose, we present (a) new heat productiondata from the Bundelkhand granites, Chottanagpur gneissic complexand Singhbhum craton (Fig. 1), (b) crustal heat production budget ofthe northern Indian crust, (c)models of steady state crustal geothermsof the northern Indian crust. Finally we discuss the implications ofour study with regard to the Himalayan thermal structure.
2. The northern Indian Shield
The northern Indian Shield consists of Rajasthan craton, Bundelk-hand craton, and the Chottanagpur gneissic complex (Fig. 1). TheRajasthan craton is composed largely of Proterozoic provinces (e.g.,the Aravalli and Delhi fold belts) with patches of Archaean rocks (e.g.,the banded gneissic complex); the rocks are likely to underlie thewestern part of the central Himalaya. This study does not present newdata from the Rajasthan craton, but reviews the published literatureon thermal models for a fruitful discussion. The Bundelkhand cratonand the Chottanagpur gneissic complex may underlie the middle andeastern part of the central Himalaya and hence is the subject of thepresent study. The Bundelkhand craton exposes an Archaean granitecomplex (~2500 Ma age), namely, the Bundelkhand granites, whichconsist of porphyritic, medium to coarse grained and fine grainedtextural varieties. The granites underlie the Proterozoic sedimentary
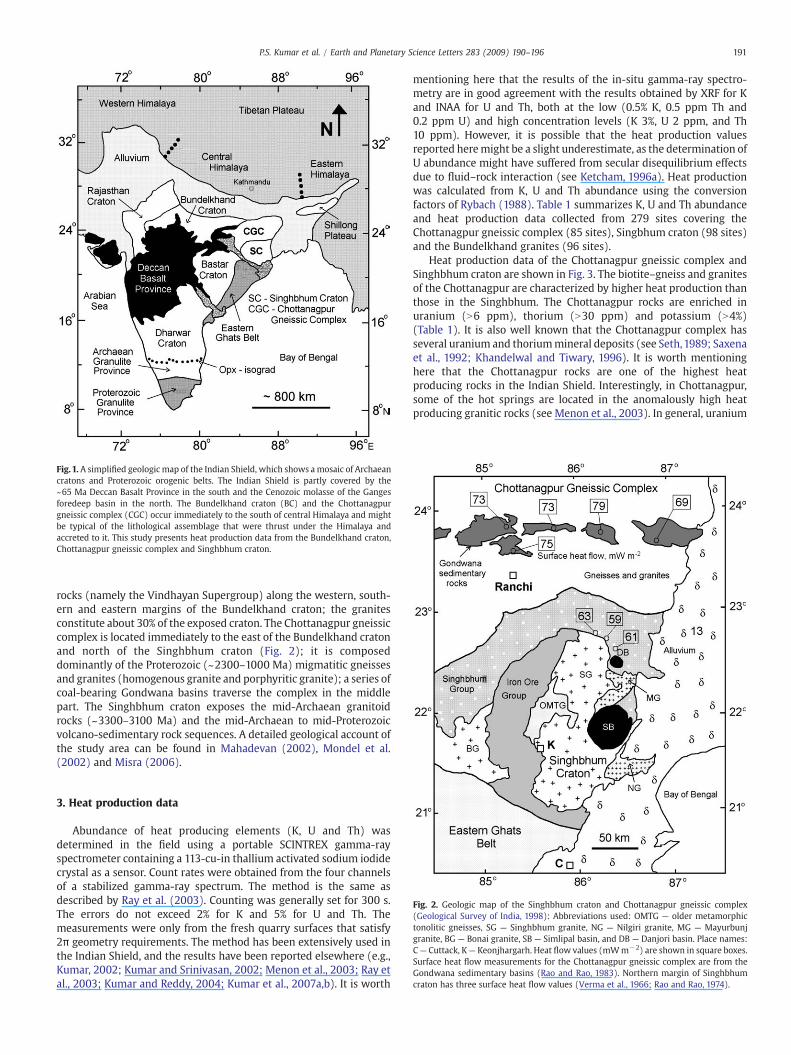
Fig.1. A simplified geologic map of the Indian Shield, which shows a mosaic of Archaeancratons and Proterozoic orogenic belts. The Indian Shield is partly covered by the~65 Ma Deccan Basalt Province in the south and the Cenozoic molasse of the Gangesforedeep basin in the north. The Bundelkhand craton (BC) and the Chottanagpurgneissic complex (CGC) occur immediately to the south of central Himalaya and mightbe typical of the lithological assemblage that were thrust under the Himalaya andaccreted to it. This study presents heat production data from the Bundelkhand craton,Chottanagpur gneissic complex and Singhbhum craton.
191P.S. Kumar et al. / Earth and Planetary Science Letters 283 (2009) 190–196
rocks (namely the Vindhayan Supergroup) along the western, south-ern and eastern margins of the Bundelkhand craton; the granitesconstitute about 30% of the exposed craton. The Chottanagpur gneissiccomplex is located immediately to the east of the Bundelkhand cratonand north of the Singhbhum craton (Fig. 2); it is composeddominantly of the Proterozoic (~2300–1000 Ma) migmatitic gneissesand granites (homogenous granite and porphyritic granite); a series ofcoal-bearing Gondwana basins traverse the complex in the middlepart. The Singhbhum craton exposes the mid-Archaean granitoidrocks (~3300–3100 Ma) and the mid-Archaean to mid-Proterozoicvolcano-sedimentary rock sequences. A detailed geological account ofthe study area can be found in Mahadevan (2002), Mondel et al.(2002) and Misra (2006).
Fig. 2. Geologic map of the Singhbhum craton and Chottanagpur gneissic complex(Geological Survey of India, 1998): Abbreviations used: OMTG — older metamorphictonolitic gneisses, SG — Singhbhum granite, NG — Nilgiri granite, MG — Mayurbunjgranite, BG — Bonai granite, SB — Simlipal basin, and DB — Danjori basin. Place names:C— Cuttack, K— Keonjhargarh. Heat flow values (mWm−2) are shown in square boxes.Surface heat flow measurements for the Chottanagpur gneissic complex are from theGondwana sedimentary basins (Rao and Rao, 1983). Northern margin of Singhbhumcraton has three surface heat flow values (Verma et al., 1966; Rao and Rao, 1974).
3. Heat production data
Abundance of heat producing elements (K, U and Th) wasdetermined in the field using a portable SCINTREX gamma-rayspectrometer containing a 113-cu-in thallium activated sodium iodidecrystal as a sensor. Count rates were obtained from the four channelsof a stabilized gamma-ray spectrum. The method is the same asdescribed by Ray et al. (2003). Counting was generally set for 300 s.The errors do not exceed 2% for K and 5% for U and Th. Themeasurements were only from the fresh quarry surfaces that satisfy2π geometry requirements. The method has been extensively used inthe Indian Shield, and the results have been reported elsewhere (e.g.,Kumar, 2002; Kumar and Srinivasan, 2002; Menon et al., 2003; Ray etal., 2003; Kumar and Reddy, 2004; Kumar et al., 2007a,b). It is worth
mentioning here that the results of the in-situ gamma-ray spectro-metry are in good agreement with the results obtained by XRF for Kand INAA for U and Th, both at the low (0.5% K, 0.5 ppm Th and0.2 ppm U) and high concentration levels (K 3%, U 2 ppm, and Th10 ppm). However, it is possible that the heat production valuesreported heremight be a slight underestimate, as the determination ofU abundance might have suffered from secular disequilibrium effectsdue to fluid–rock interaction (see Ketcham, 1996a). Heat productionwas calculated from K, U and Th abundance using the conversionfactors of Rybach (1988). Table 1 summarizes K, U and Th abundanceand heat production data collected from 279 sites covering theChottanagpur gneissic complex (85 sites), Singbhum craton (98 sites)and the Bundelkhand granites (96 sites).
Heat production data of the Chottanagpur gneissic complex andSinghbhum craton are shown in Fig. 3. The biotite–gneiss and granitesof the Chottanagpur are characterized by higher heat production thanthose in the Singhbhum. The Chottanagpur rocks are enriched inuranium (N6 ppm), thorium (N30 ppm) and potassium (N4%)(Table 1). It is also well known that the Chottanagpur complex hasseveral uranium and thoriummineral deposits (see Seth,1989; Saxenaet al., 1992; Khandelwal and Tiwary, 1996). It is worth mentioninghere that the Chottanagpur rocks are one of the highest heatproducing rocks in the Indian Shield. Interestingly, in Chottanagpur,some of the hot springs are located in the anomalously high heatproducing granitic rocks (see Menon et al., 2003). In general, uranium

Table 1Mean Th, mean U and mean K abundance of rocks in the Chottanagpur gneissiccomplex, Singhbhum craton and Bundelkhand granites.
Rocks N Th, ppm U, ppm K, % HP,(μW m−3)
Chottanagpur Gneissic ComplexBiotite gneiss 35 29.04 (0.86) 6.10 (0.31) 4.28 (0.09) 3.93 (0.12)Homogeneous granite 24 44.43 (2.99) 6.05 (0.62) 4.93 (0.12) 5.03 (0.25)Porphyritic granite 26 62.56 (3.34) 6.96 (0.49) 5.09 (0.06) 6.52 (0.28)
Singhbhum CratonOlder metamorphictonolitic gneisses
12 13.43 (0.47) 2.02 (0.12) 1.29 (0.08) 1.55 (0.05)
Singhbhum granite 58 10.46 (0.43) 1.61 (0.09) 3.09 (0.11) 1.41 (0.05)Nilgiri granite 9 16.88 (1.03) 2.51 (0.30) 3.08 (0.14) 2.08 (0.09)Mayurbunj granite 19 24.16 (1.81) 4.80 (0.44) 4.31 (0.15) 3.27 (0.15)
Bundelkhand granitesPorphyritic granite 31 37.50 (3.12) 7.23 (0.59) 4.25 (0.12) 4.80 (0.33)Medium to coarsegrained granite
43 33.48 (2.20) 7.74 (0.71) 4.61 (0.10) 4.68 (0.28)
Fine grained granite 22 31.35 (2.18) 5.85 (0.38) 4.42 (0.12) 4.04 (0.19)
Note standard error of the mean is given in parentheses. N is number of measurements.
192 P.S. Kumar et al. / Earth and Planetary Science Letters 283 (2009) 190–196
and thorium are hosted in the accessory minerals such as monazite,xenotime, allanite, zircon and apatite, whereas potassium is in alkalifeldspar and biotite. Heat production of the biotite gneiss, homo-geneous and porphyritic granite is 3.93, 5.03, and 6.52 μW m−3,respectively (Fig. 3a; Table 1). Regional geologic maps suggest thatthese rocks constitute approximately 60%, 20% and 20% of the rockexposures, respectively. This proportion would provide a gross heatproduction of 4.67 μW m−3 for the entire Chottanagpur gneissiccomplex.
Radioelement abundance and heat production of the gneisses andgranites of the Singhbhum craton show a large variation (Table 1;Fig. 3b). The older metamorphic tonalitic gneisses (~3.3 Ga) andthe Singhbhum granites (~3.1 Ga) have more or less same heat
Fig. 3. Heat production data of (a) theChottanagpur gneissic complex and (b) the Singhbhumcra
production, around 1.5 μW m−3. Although heat production of thegneisses is similar to the gneisses in other Archaean cratons in theIndian Shield, the Singhbhum granites have remarkably very low heatproduction, when compared to the other Archaean granites in theIndian Shield. Although the potassium content of the Singhbhumgranites is greater than the gneisses, U–Th abundance is similar to thegneisses (Table 1). However, the other two small granite bodies(Nilgiri and Mayurbunj) have slightly higher elemental abundanceand heat production. Heat production data for the sedimentary rocks(the Iron Ore Group and SinghbumGroup) are not available. However,the published geochemical database (e.g., Saha et al., 2004) suggeststhat some of the clastic sedimentary rocks have radioelementalabundance similar to that of the gneisses and granites. The Singhbhumgranites constitute themost dominant rock types and hence their heatproduction is likely to control the gross heat production of theSinghbhum craton.
Radioelement abundance and heat production of the Bundelk-hand granites are given in Fig. 4 and Table 1. They consist of threetextural varieties: porphyritic, medium to coarse-grained and fine-grained granites, and have a mean heat production of 4.80, 4.68, and4.04 μW m−3, respectively. These rocks constitute about 40%, 35%and 25% of the entire granite exposure, respectively. This proportionwould indicate a gross surface heat production of 4.56 μW m−3 forthe entire Bundelkhand granites. Interestingly, the gross heatproduction value is very similar to that of the Chottanagpur gneissiccomplex. As the Bundelkhand granites constitute the northernexposure of the Bundelkhand craton and form the basement of theVindhayan Supergroup, the granites are the most dominantcomponent of the Bundelkhand upper crust. The Vindhayansedimentary rocks have variable thickness from a few meters tomore than 4 km; the thicker sequence occurs along the southernmargin of the Bundelkhand craton. Heat production data for theVindhayan sedimentary rocks are not available. However, a recentgeochemical study have shown that some of the Proterozoic clasticsedimentary rocks underlying the Vindhayan Supergroup are rich in
ton.Meanheat production and standard error of themean (inparentheses) are also shown.
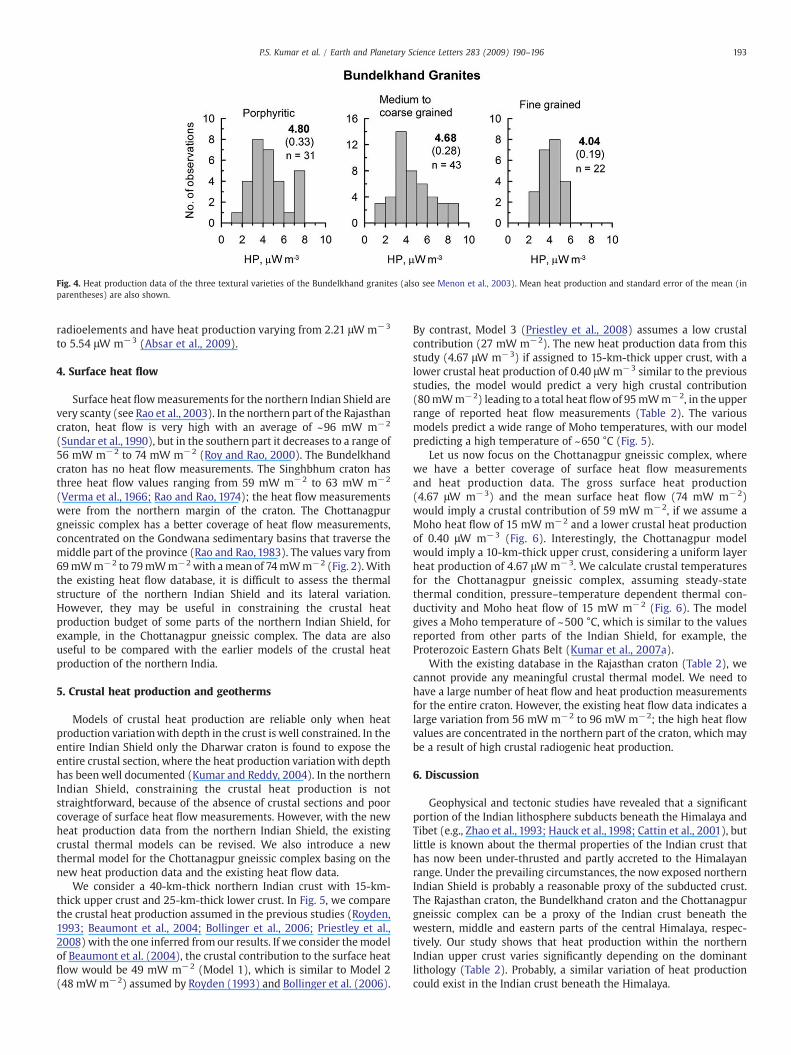
Fig. 4. Heat production data of the three textural varieties of the Bundelkhand granites (also see Menon et al., 2003). Mean heat production and standard error of the mean (inparentheses) are also shown.
193P.S. Kumar et al. / Earth and Planetary Science Letters 283 (2009) 190–196
radioelements and have heat production varying from 2.21 μW m−3
to 5.54 μW m−3 (Absar et al., 2009).
4. Surface heat flow
Surface heat flowmeasurements for the northern Indian Shield arevery scanty (see Rao et al., 2003). In the northern part of the Rajasthancraton, heat flow is very high with an average of ~96 mW m−2
(Sundar et al., 1990), but in the southern part it decreases to a range of56 mW m−2 to 74 mW m−2 (Roy and Rao, 2000). The Bundelkhandcraton has no heat flow measurements. The Singhbhum craton hasthree heat flow values ranging from 59 mW m−2 to 63 mW m−2
(Verma et al., 1966; Rao and Rao, 1974); the heat flow measurementswere from the northern margin of the craton. The Chottanagpurgneissic complex has a better coverage of heat flow measurements,concentrated on the Gondwana sedimentary basins that traverse themiddle part of the province (Rao and Rao, 1983). The values vary from69mWm−2 to 79mWm−2 with amean of 74mWm−2 (Fig. 2). Withthe existing heat flow database, it is difficult to assess the thermalstructure of the northern Indian Shield and its lateral variation.However, they may be useful in constraining the crustal heatproduction budget of some parts of the northern Indian Shield, forexample, in the Chottanagpur gneissic complex. The data are alsouseful to be compared with the earlier models of the crustal heatproduction of the northern India.
5. Crustal heat production and geotherms
Models of crustal heat production are reliable only when heatproduction variationwith depth in the crust is well constrained. In theentire Indian Shield only the Dharwar craton is found to expose theentire crustal section, where the heat production variationwith depthhas been well documented (Kumar and Reddy, 2004). In the northernIndian Shield, constraining the crustal heat production is notstraightforward, because of the absence of crustal sections and poorcoverage of surface heat flow measurements. However, with the newheat production data from the northern Indian Shield, the existingcrustal thermal models can be revised. We also introduce a newthermal model for the Chottanagpur gneissic complex basing on thenew heat production data and the existing heat flow data.
We consider a 40-km-thick northern Indian crust with 15-km-thick upper crust and 25-km-thick lower crust. In Fig. 5, we comparethe crustal heat production assumed in the previous studies (Royden,1993; Beaumont et al., 2004; Bollinger et al., 2006; Priestley et al.,2008) with the one inferred from our results. If we consider themodelof Beaumont et al. (2004), the crustal contribution to the surface heatflow would be 49 mW m−2 (Model 1), which is similar to Model 2(48 mWm−2) assumed by Royden (1993) and Bollinger et al. (2006).
By contrast, Model 3 (Priestley et al., 2008) assumes a low crustalcontribution (27 mW m−2). The new heat production data from thisstudy (4.67 μW m−3) if assigned to 15-km-thick upper crust, with alower crustal heat production of 0.40 μW m−3 similar to the previousstudies, the model would predict a very high crustal contribution(80mWm−2) leading to a total heat flowof 95mWm−2, in the upperrange of reported heat flow measurements (Table 2). The variousmodels predict a wide range of Moho temperatures, with our modelpredicting a high temperature of ~650 °C (Fig. 5).
Let us now focus on the Chottanagpur gneissic complex, wherewe have a better coverage of surface heat flow measurementsand heat production data. The gross surface heat production(4.67 μW m−3) and the mean surface heat flow (74 mW m−2)would imply a crustal contribution of 59 mW m−2, if we assume aMoho heat flow of 15 mW m−2 and a lower crustal heat productionof 0.40 μW m−3 (Fig. 6). Interestingly, the Chottanagpur modelwould imply a 10-km-thick upper crust, considering a uniform layerheat production of 4.67 μW m−3. We calculate crustal temperaturesfor the Chottanagpur gneissic complex, assuming steady-statethermal condition, pressure–temperature dependent thermal con-ductivity and Moho heat flow of 15 mW m−2 (Fig. 6). The modelgives a Moho temperature of ~500 °C, which is similar to the valuesreported from other parts of the Indian Shield, for example, theProterozoic Eastern Ghats Belt (Kumar et al., 2007a).
With the existing database in the Rajasthan craton (Table 2), wecannot provide any meaningful crustal thermal model. We need tohave a large number of heat flow and heat production measurementsfor the entire craton. However, the existing heat flow data indicates alarge variation from 56 mW m−2 to 96 mW m−2; the high heat flowvalues are concentrated in the northern part of the craton, which maybe a result of high crustal radiogenic heat production.
6. Discussion
Geophysical and tectonic studies have revealed that a significantportion of the Indian lithosphere subducts beneath the Himalaya andTibet (e.g., Zhao et al., 1993; Hauck et al., 1998; Cattin et al., 2001), butlittle is known about the thermal properties of the Indian crust thathas now been under-thrusted and partly accreted to the Himalayanrange. Under the prevailing circumstances, the now exposed northernIndian Shield is probably a reasonable proxy of the subducted crust.The Rajasthan craton, the Bundelkhand craton and the Chottanagpurgneissic complex can be a proxy of the Indian crust beneath thewestern, middle and eastern parts of the central Himalaya, respec-tively. Our study shows that heat production within the northernIndian upper crust varies significantly depending on the dominantlithology (Table 2). Probably, a similar variation of heat productioncould exist in the Indian crust beneath the Himalaya.
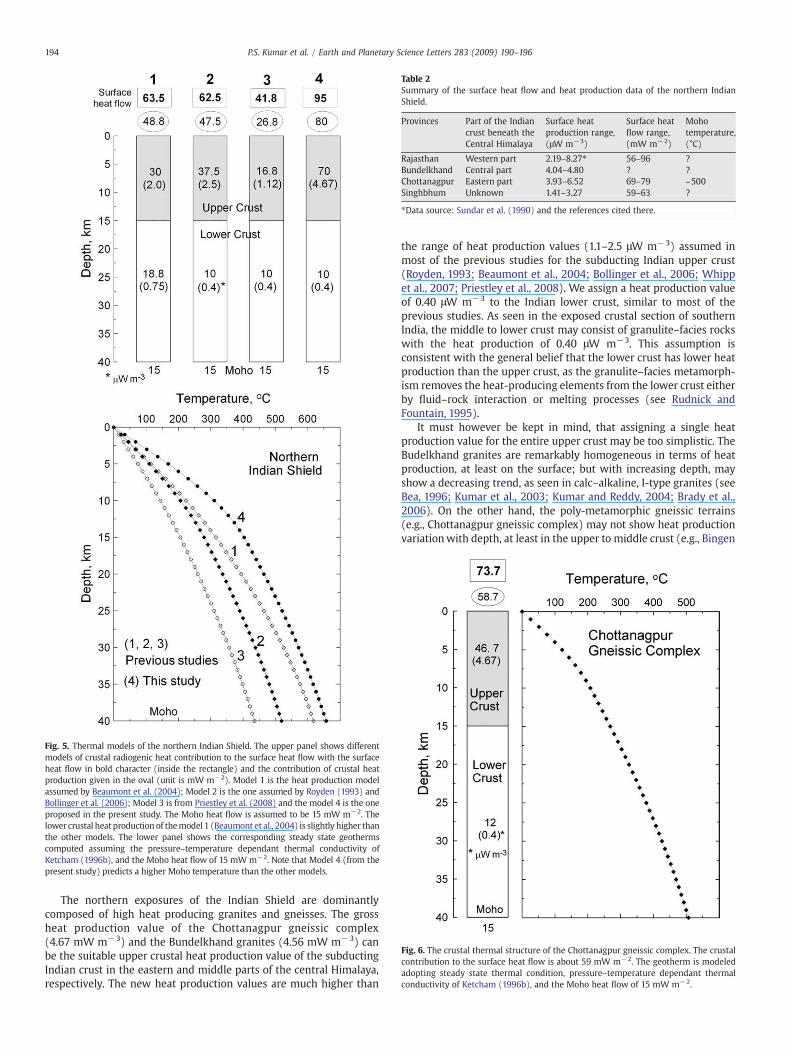
Table 2Summary of the surface heat flow and heat production data of the northern IndianShield.
Provinces Part of the Indiancrust beneath theCentral Himalaya
Surface heatproduction range,(μW m−3)
Surface heatflow range,(mW m−2)
Mohotemperature,(°C)
Rajasthan Western part 2.19–8.27⁎ 56–96 ?Bundelkhand Central part 4.04–4.80 ? ?Chottanagpur Eastern part 3.93–6.52 69–79 ~500Singhbhum Unknown 1.41–3.27 59–63 ?
⁎Data source: Sundar et al. (1990) and the references cited there.
Fig. 6. The crustal thermal structure of the Chottanagpur gneissic complex. The crustalcontribution to the surface heat flow is about 59 mW m−2. The geotherm is modeledadopting steady state thermal condition, pressure–temperature dependant thermalconductivity of Ketcham (1996b), and the Moho heat flow of 15 mW m−2.
Fig. 5. Thermal models of the northern Indian Shield. The upper panel shows differentmodels of crustal radiogenic heat contribution to the surface heat flow with the surfaceheat flow in bold character (inside the rectangle) and the contribution of crustal heatproduction given in the oval (unit is mW m−2). Model 1 is the heat production modelassumed by Beaumont et al. (2004); Model 2 is the one assumed by Royden (1993) andBollinger et al. (2006); Model 3 is from Priestley et al. (2008) and the model 4 is the oneproposed in the present study. The Moho heat flow is assumed to be 15 mW m−2. Thelower crustal heat production of themodel 1 (Beaumont et al., 2004) is slightly higher thanthe other models. The lower panel shows the corresponding steady state geothermscomputed assuming the pressure–temperature dependant thermal conductivity ofKetcham (1996b), and the Moho heat flow of 15 mW m−2. Note that Model 4 (from thepresent study) predicts a higher Moho temperature than the other models.
194 P.S. Kumar et al. / Earth and Planetary Science Letters 283 (2009) 190–196
The northern exposures of the Indian Shield are dominantlycomposed of high heat producing granites and gneisses. The grossheat production value of the Chottanagpur gneissic complex(4.67 mW m−3) and the Bundelkhand granites (4.56 mW m−3) canbe the suitable upper crustal heat production value of the subductingIndian crust in the eastern and middle parts of the central Himalaya,respectively. The new heat production values are much higher than
the range of heat production values (1.1–2.5 μW m−3) assumed inmost of the previous studies for the subducting Indian upper crust(Royden, 1993; Beaumont et al., 2004; Bollinger et al., 2006; Whippet al., 2007; Priestley et al., 2008). We assign a heat production valueof 0.40 μW m−3 to the Indian lower crust, similar to most of theprevious studies. As seen in the exposed crustal section of southernIndia, the middle to lower crust may consist of granulite–facies rockswith the heat production of 0.40 μW m−3. This assumption isconsistent with the general belief that the lower crust has lower heatproduction than the upper crust, as the granulite–facies metamorph-ism removes the heat-producing elements from the lower crust eitherby fluid–rock interaction or melting processes (see Rudnick andFountain, 1995).
It must however be kept in mind, that assigning a single heatproduction value for the entire upper crust may be too simplistic. TheBudelkhand granites are remarkably homogeneous in terms of heatproduction, at least on the surface; but with increasing depth, mayshow a decreasing trend, as seen in calc–alkaline, I-type granites (seeBea, 1996; Kumar et al., 2003; Kumar and Reddy, 2004; Brady et al.,2006). On the other hand, the poly-metamorphic gneissic terrains(e.g., Chottanagpur gneissic complex) may not show heat productionvariationwith depth, at least in the upper to middle crust (e.g., Bingen

195P.S. Kumar et al. / Earth and Planetary Science Letters 283 (2009) 190–196
et al., 1996; Bea and Montero, 1999; Kumar and Reddy, 2004). In themiddle to lower crust, as seen in many crustal sections, heatproduction may decrease with increasing depth. But it is also possiblethat the heat production in the lower crust may not be loweverywhere. For example, some of the Proterozoic granulite–faciesrocks in the Indian Shield have heat production values greater than2.0 μWm−3 (see Kumar et al., 2007a). We are not surewhether such ahigh-heat producing lower crust can exist in northern India orbeneath the Himalaya. Probably, the northern part of the Rajasthancraton may have a high heat producing lower crust.
Fig. 5 shows that the radiogenic heat contribution of the Indian crustto the Himalaya would be around 80 mWm−2, if we consider the newheat production data fromnorthern India. Alternatively, if we consider atypical Chottanagpur crust (Fig. 6), the contribution would be around59mWm−2. Clearly, thesenewestimates aremuchhigher than those inmost of the previous studies. These would definitely lead to a highersurface heat flow and crustal temperatures in the Himalayan crust.
A robust estimation of crustal temperatures in the Himalayarequires a large number of measurements of surface heat flow,radiogenic heat production and thermal conductivity of rocks from theentire Himalaya. The existing heat production data of the Himalayashow a narrow range of 1.1 μW m−3–3.07 μW m−3 (England et al.,1992; Whipp et al., 2007), which are less than the heat productionvalues documented from the Bundelkhand granites and Chottanagpurgneissic complex. The Lesser Himalaya contains the Proterozoic IndianShield rocks (see Hodges, 2000). The Higher Himalaya may alsocontain the components of the Indian Shield, although it has animprint of much younger metamorphic and melting events (e.g.,Harrison et al., 1998; 1999a,b). A further study on heat productiondistribution in these Himalayan litho-tectonic units, combined withthe results of this study, it is possible to constrain the heat productionheterogeneity of the entire Himalayan crust.
Acknowledgements
Our sincere thanksare due to the reviewers (an anonymous reviewerand Mike Sandiford) and the editor (T. M. Harrison) for very helpfulreview comments and suggestions; T. Seshunarayana, C. Shankar, G.Ramacharyulu and G. Ramulu for their support.We are grateful to Jean-Philippe Avouac for his meticulous reviews on the earlier manuscripts;V. P. Dimri, Director, NGRI for permission to publish this paper.
Appendix A. Supplementary data
Supplementary data associated with this article can be found, inthe online version, at doi:10.1016/j.epsl.2009.04.015.
References
Absar, N., Raza, M., Roy, M., Naqvi, S.M., Roy, A.K., 2009. Composition and weatheringconditions of Paleoproterozoic upper crust of Bundelkhand Craton, Central India:records from geochemistry of clastic sediments of 1.9 Ga Gwalior Group.Precambrian Res. 168, 313–329.
Avouac, J.-P., 2007. Dynamic processes in extensional and compressional settings —
mountain building: from earthquakes to geological deformation. Treatise Geophys. 6,377–439.
Bea, F., 1996. Residence of REE, Y, Th and U in granites and crustal protoliths:implications for the chemistry of crustal melts. J. Petrol. 37, 521–552.
Bea, F., Montero, P., 1999. Behavior of accessory phases and redistribution of Zr, REE, Y,Th, and U during metamorphism and partial melting of metapelites in the lowercrust: an example from the Kinzigite Formation of Ivrea-Verbano, NW Italy.Geochim. Cosmochim. Acta 63, 1133–1153.
Beaumont, C., Jamieson, R.A., Nguyen, M.H., Medvedev, S., 2004. Crustal channel flows:1. Numerical models with applications to the tectonics of the Himalayan–Tibetanorogen. J. Geophys. Res. 109, B06406. doi:10.1029/2003JB002809.
Bingen, B., Demaiffe, D., Hertogen, J., 1996. Redistribution of rare earth elements,thorium, and uranium over accessory minerals in the course of amphibolite togranulite facies metamorphism: the role of apatite and monazite in orthogneissesfrom southwestern Norway. Geochim. Cosmochim. Acta 60, 1341–1354.
Bollinger, L., Avouac, J.-P., Beyssac, O., Catlos, E.J., Harrison, T.M., Grove, M., Goffe, B.,Sapkota, S., 2004. Thermal structure and exhumation history of the Lesser Himalayain Central Nepal. Tectonics 23. doi:10.1029/2003TC001564.
Bollinger, L., Henry, P., Avouac, J.-P., 2006. Mountain building in the Nepal Himalaya:thermal and kinematic model. Earth Planet. Sci. Lett. 244, 58–71.
Brady, R.J., Ducea, M.N., Kidder, S.B., Saleeby, J.B., 2006. The distribution of radiogenicheat production as a function of depth in the Sierra Nevada Batholith, California.Lithos 86, 229–244.
Cattin, R., Martelet, G., Henry, P., Avouac, J.P., Diament, M., Shakya, T.R., 2001. Gravityanomalies, crustal structure and thermo-mechanical support of the Himalayas ofCentral Nepal. Geophys. J. Int. 147, 381–392.
England, P., Molnar, P., 1993. The interpretation of inverted metamorphic isograds usingsimple physical calculations. Tectonics 12, 145–157.
England, P., Le Fort, P., Molnar, P., Pecher, A., 1992. Heat sources for Tertiarymetamorphism and anatexis in the Annapurna–Manaslu region, central Nepal.J. Geophys. Res. 97 (B2), 2107–2128.
Francheteau, E., Jaupart, C., Xian-Jie, S., Wen-Hua, K., De-Lu, L., Jia-Chi, B., Hung-Pin, W.,Hsia-Yeu, D., 1984. High heat flow in southern Tibet. Nature 307, 32–36.
Geological Survey of India, 1998. Geological map of India, scale 1:2000000, publishedby Geological Survey of India, Kolkota.
Harrison, T.M., Grove, M., Lovera, O.M., Catlos, E.J., 1998. A model for the origin ofHimalayan anatexis and inverted metamorphism. J. Geophys. Res. 103 (B11),27,017–27,032.
Harrison, T.M., Grove, M., McKeegan, K.D., Coath, C.D., Lovera, O.M., Le Fort, P., 1999a.Origin and episodic emplacement of the Manaslu intrusive complex, CentralHimalaya. J. Petrol. 40, 3–19.
Harrison, T.M., Grove, M., Lovera, O.M., Catlos, E.J., D'Andrea, J., 1999b. The origin ofHimalayan anatexis and inverted metamorphism: models and constraints. J. AsianEarth Sci. 17, 755–772.
Hauck, M.L., Nelson, K.D., Brown, L.D., Zhao, W., Ross, A.R., 1998. Crustal structure of theHimalayan orogen at ~90° east longitude from Project INDEPTH deep reflectionprofiles. Tectonics 17, 481–500.
Henry, P., Le Pichon, X., Goffe, B., 1997. Kinematic, thermal and petrological model of theHimalayas: constraints related to metamorphism within the underthrust Indiancrust and topographic elevation. Tectonophysics 273, 31–56.
Hetényi, G., Cattin, R., Brunet, F., Bollinger, L., Vergne, J., Nábělek, J.L., Diament, M., 2007.Density distribution of the India plate beneath the Tibetan plateau: geophysical andpetrological constraints on the kinetics of lower-crustal eclogitization. Earth Planet.Sci. Lett. 264, 226–244.
Hodges, K.V., 2000. Tectonics of the Himalaya and southern Tibet from twoperspectives. Geol. Soc. Am. Bull. 112, 324–350.
Jamieson, R.A., Beaumont, C., Medvedev, S., Nguyen, M.H., 2004. Crustal channel flows: 2.Numerical models with implications for metamorphism in the Himalayan–Tibetanorogen. J. Geophys. Res. 109, B06407. doi:10.1029/2003JB002811.
Ketcham, R.A., 1996a. An improved method for determination of heat production withgamma-ray scintillation spectrometry. Chem. Geol. 130, 175–194.
Ketcham, R.A., 1996b. Distribution of heat-producing elements in the upper and middlecrust of southern and west central Arizona: evidence from core complexes.J. Geophys. Res. 101, 13,611–13,632.
Khandelwal, M.K., Tiwary, K.N., 1996. Uranium mineralization in silicified andbrecciated zones within Early Proterozoic migmatites around Jhapar and Nawatola,Central India. J. At. Miner. Sci. 4, 55–58.
Kumar, P.S., 2002. Radioelemental Distribution in the Dharwar Craton, South India:Implications for the Evolution of Upper Continental Crust and Heat Generation inthe Craton, Unpublished Ph.D. Thesis, Osmania University, Hyderabad, India, 217 p.
Kumar, P.S., Srinivasan, R., 2002. Fertility of Late Archaean basement granite in the vicinityof U-mineralizedNeoproterozoic Bhima basin, peninsular India. Curr. Sci. 82, 571–576.
Kumar, P.S., Reddy, G.K., 2004. Radioelements and heat production of an exposed cross-section of Archaean crust, Dharwar craton, south India. Earth Planet. Sci. Lett. 224,309–324.
Kumar, P.S., Basavalingu, B., Srinivasan, R., 2003. Origin of the closepet granite in the light offabric, mineralogy and radioelemental composition. In: Mohan, A. (Ed.), Milestones inpetrology: Bangalore, India. Geological Society of India Memoir, vol. 52, pp. 229–254.
Kumar, P.S., Menon, R., Reddy, G.K., 2007a. The role of radiogenic heat production in thethermal evolution of a Proterozoic granulite–facies orogenic belt: Eastern Ghats,Indian Shield. Earth Planet. Sci. Lett. 254, 39–54.
Kumar, P.S., Menon, R., Reddy, G.K., 2007b. Crustal geotherm in southern Deccan BasaltProvince, India: the Moho is as cold as adjoining cratons. In: Foulger, G.R., Jurdy, D.M.(Eds.), Plates, Plumes, and Planetary Processes. Geological Society of America SpecialPaper, vol. 430, pp. 275–284. doi:10.1130/2007.2430(14).
Mahadevan, T.M., 2002. Geology of Bihar and Jharkhand. Geological Society of India,Bangalore. 563 pp.
Menon, R., Kumar, P.S., Reddy, G.K., Srinivasan, R., 2003. Radiogenic heat production oflate Archaean Bundelkhand granite and some Proterozoic gneisses and granitoidsof central India. Curr. Sci. 85, 634–638.
Misra, S., 2006. Precambrian chronostratigraphic growth of Singhbhum–Orissa craton,eastern Indian Shield. J. Geol. Soc. India 67, 356–378.
Molnar, P., England, P., 1990. Temperatures, heat flux and frictional stress near majorthrust faults. J. Geophys. Res. 95, 4833–4856.
Mondel, M.E.A., Goswami, J.N., Deomurari, M.P., Sharma, K.K., 2002. Ion microprobe207Pb/206Pb ages of zircons from the Bundelkhand massif, northern India:implications for crustal evolution of the Bundelkhand–Aravalli protocontinent.Precambrian Res. 117, 85–100.
Priestley, K., Jackson, J., McKenzie, D., 2008. Lithospheric structure and deepearthquakes beneath India, the Himalaya and southern Tibet. Geophys. J. Int. 172,345–362.

196 P.S. Kumar et al. / Earth and Planetary Science Letters 283 (2009) 190–196
Rao, R.U.M., Rao, G.V., 1974. Results of some geothermal studies in Singhbhum thrustbelt, India. Geothermics 4, 153–161.
Rao, G.V., Rao, R.U.M., 1983. Heat flow in Indian Gondwana Basins and heat productionof their basements. Tectonophysics 91, 105–117.
Rao, R.U.M., Roy, S., Srinivasan, R., 2003. Heat flow researches in India: results andperspectives. In: Mahadevan, T.M., Arora, B.R., Gupta, K.R. (Eds.), IndianContinental Lithosphere: Emerging Research Trends, Memoir 53. GeologicalSociety of India, pp. 347–391.
Ray, L., Kumar, P.S., Reddy, G.K., Roy, S., Rao, G.V., Srinivasan, R., Rao, R.U.M., 2003. Highmantle heat flow in a Precambrian granulite province: evidence from southernIndia. J. Geophys. Res. 108 (B2), 2084. doi:10.1029/2001JB000688.
Roy, S., Rao, R.U.M., 2000. Heat flow in the Indian Shield. J. Geophys. Res. 105 (B11),25,587–25,604.
Royden, L.H., 1993. The steady state thermal structure of eroding orogenic belts andaccretionary prisms. J. Geophys. Res. 98, 4487–4507.
Rudnick, R.L., Fountain, D.M., 1995. Nature and composition of the continental crust: alower crustal perspective. Rev. Geophys. 33, 267–309.
Rybach, L., 1988. Determination of heat production rate. In: Haenel, R., Rybach, L.,Stegena, L. (Eds.), Handbook of Terrestrial Heat Flow Determination. Kluwer,Dordrecht, pp. 125–142.
Saha, A., Basu, A.R., Garzione, C.N., Bandyopadhyay, P.K., Chakrabarti, A., 2004.Geochemical and petrological evidence for subduction–accretion processes in theArchean Eastern Indian Craton. Earth Planet. Sci. Lett. 220, 91–106.
Saxena, V.P., Krishnamurthy, P., Murugan, C., Sabot, H.K., 1992. Geochemistry of thegranitoids from the central Surguja Shear Zone, India: geological evolution andimplications on uranium mineralization and exploration. Explor. Res. At. Miner. 5,27–40.
Seth, D.K., 1989. Structure and uranium mineralization in the Proterozoic rocks ofDhumath area, Sarguja district, Madhya Pradesh, India. Explor. Res. At. Miner. 2,77–91.
Sundar, A., Gupta, M.L., Sharma, S.R., 1990. Heat flow in the Trans-Aravalli igneous suite,Tusham, India. J. Geodyn. 12, 89–100.
Verma, R.K., Rao, R.U.M., Gupta, M.L., 1966. Terrestrial heat flow in Mosabani mine,Singhbhum district, Bihar. J. Geophys. Res. 71, 4943–4948.
Whipp Jr., D.M., Ehlers, T.A., Blythe, A.E., Huntington, K.W., Hodges, K.V., Burbank, D.W.,2007. Plio-Quaternary exhumation history of the central Nepalese Himalaya: 2.Thermokinematic and thermochronometer age prediction model. Tectonics 26,TC3003. doi:10.1029/2006TC001991.
Zhao, W., Nelson, K.D., Project INDEPTH, 1993. Deep seismic reflection evidence forcontinental underthrusting beneath southern Tibet. Nature 366, 557–559.