Tropical Forests of the Guiana Shield
540
Tropical Forests of the Guiana Shield Ancient Forests in a Modern World
-
Upload
khangminh22 -
Category
Documents
-
view
0 -
download
0
Transcript of Tropical Forests of the Guiana Shield

Tropical Forests of the Guiana Shield
Ancient Forests in a Modern World

This page intentionally left blank

Tropical Forests of the Guiana Shield
Ancient Forests in a Modern World
Edited by
D.S. Hammond
Formerly of Iwokrama International Centre for Rain ForestConservation and Development
Georgetown, Guyana
CABI Publishing

CABI Publishing is a division of CAB International
CABI Publishing CABI PublishingCAB International 875 Massachusetts AvenueWallingford 7th FloorOxfordshire OX10 8DE Cambridge, MA 02139UK USA
Tel: +44 (0)1491 832111 Tel: +1 617 395 4056Fax: +44 (0)1491 833508 Fax: +1 617 354 6875E-mail: [email protected] E-mail: [email protected] site: www.cabi-publishing.org
©CAB International 2005. All rights reserved. No part of this publication may bereproduced in any form or by any means, electronically, mechanically, byphotocopying, recording or otherwise, without the prior permission of thecopyright owners.
A catalogue record for this book is available from the British Library, London,UK.
Library of Congress Cataloging-in-Publication DataTropical forests of the Guiana Shield: ancient forests of the modern world / editedby D. Hammond
p. cm.Includes bibliographical references and index.ISBN 0-85199-536-5 (alk. paper)1. Rain forest ecology--Guyana Shield. 2. Rain forests--Guyana Shield. 3. NaturalHistory--Guyana Shield. 4. Guyana Shield. I. Hammond, D. (David S.) II. Title.
QH111.T76 2005578.734´098--dc22
2004021133
ISBN 0 85199 536 5
Typeset by MRM Graphics Ltd, Winslow, BucksPrinted and bound in the UK by Biddles Ltd, King’s Lynn
Contents
Contributors vii
Acknowledgements ix
Acronyms and Abbreviations xi
1 Ancient Land in a Modern World 1David S. Hammond
2 Biophysical Features of the Guiana Shield 15David S. Hammond
3 Ecophysiological Patterns in Guianan Forest Plants 195Thijs L. Pons, Eustace E. Alexander, Nico C. Houter, Simmoné A. Roseand Toon Rijkers
4 Rainforest Vertebrates and Food Plant Diversity in the Guiana Shield 233Pierre-Michel Forget and David S. Hammond
5 Folivorous Insects in the Rainforests of the Guianas 295Yves Basset, Neil D. Springate and Elroy Charles
6 Flower-visiting Insects in Guianan Forests: Pollinators, Thieves, Lovers andTheir Foes 321Bart P.E. De Dijn
7 Guianan Forest Dynamics: Geomorphographic Control and Tropical ForestChange Across Diverging Landscapes 343David S. Hammond
8 Socio-economic Aspects of Guiana Shield Forest Use 381David S. Hammond
v

9 Forest Conservation and Management in the Guiana Shield 481David S. Hammond
Index 521
vi Contents

Contributors
Alexander, E.E., Planning and Research Development Division, Guyana ForestryCommission, 1 Water Street, Kingston, Georgetown, Guyana.
Basset, Y., Smithsonian Tropical Research Institute, Apartado 2072, Balboa, Ancon,Panama. (e-mail: [email protected])
Charles, E., Faculty of Agriculture/Forestry, University of Guyana, Turkeyen, Georgetown,Guyana. (e-mail: [email protected])
De Dijn, B.P.E., National Zoological Collection, University of Suriname, UniversityComplex, Leysweg, PO Box 9212, Paramaribo, Suriname. (e-mail: [email protected])
Forget, P.-M., Département Ecologie et Gestion de la Biodiversité, Museum Nationald’Histoire Naturelle, UMR 5176, CNRS-MNHN, 4 Av. Du Petit Chateau, F.91800Brunoy, France. (e-mail: [email protected])
Hammond, D.S., Iwokrama International Centre for Rain Forest Conservation andDevelopment, Georgetown, Guyana. Current Address: NWFS Consulting, 15595 NWOak Hill Dr., Beaverton, OR 97006, USA. (e-mail: [email protected])
Houter, N.C., Department of Plant Ecophysiology, Utrecht University, Sorbonnelaan 16,3584 CA Utrecht, The Netherlands.
Pons, T.L., Department of Plant Ecophysiology, Utrecht University, Sorbonnelaan 16, 3584CA Utrecht, The Netherlands. (e-mail: [email protected])
Rijkers, T., Department of Forest Ecology and Forest Management, Wageningen University,PO Box 47, 6700 AA Wageningen, The Netherlands.
Rose, S.A., Planning and Research Development Division, Guyana Forestry Commission, 1Water Street, Kingston, Georgetown, Guyana.
Springate, N.D., Department of Entomology, The Natural History Museum, CromwellRoad, London SW7 5BD, UK. (e-mail: [email protected])
vii

This page intentionally left blank

Acknowledgements
Any work is the product of numerous contributions at many different moments in manydifferent ways. This book is no different and the individuals who have contributed throughtheir patient and persistent collection of data in the field, organization and compilation ofreferences, time series and spatial information and administrative support are numerous.I would particularly like to thank again Kate Lance, Kwasie Crandon, Roxroy Bollers,George Roberts, Catherine Clarebrough, Luc van Tienen, Mariska Weijerman, ArnoudSchouten and Dexter Angoy for their efforts in collecting data presented or referred to invarious chapters of the book. Several UK and Guyanese volunteer and training groups dida marvellous job with data collection. Twydale Martinborough deserves special thanks forher efforts in meticulously compiling much of the data on production statistics andChanchal Prashad for her excellent work in digitizing and compiling many of the geologi-cal and historical GIS coverages presented in figures throughout the book. Thanks areextended to all of the scientists and resource management professionals in French Guiana,Guyana and Suriname for sharing information and literature early in the book’s develop-ment. I also owe a debt of gratitude for the efficient and timely administrative support ofJuliet Dos Santos and Jean Bacchus in making the compilation of ‘grey’ literature and sta-tistics that much easier. The amazing efficiency and speed through which high quality datawere made available by governmental institutions in Guyana, Venezuela, Suriname,France, Brazil, the USA and the UK, often free-of-charge and through ftp downloading, hasenhanced in no small measure the quality of content and avoided the labyrinth typicallyencountered en route to acquiring such types of environmental data. I would like toacknowledge their effort here as a means of registering support for the growing trend inmaking these types of data available to the international community. These includeANEEL (Brazil), CDC (USA), CNRS (France), CPRM (Brazil), DAAC (USA), DANE(Colombia), GEBCO (UK), IBAMA (Brazil), IBGE (Brazil), INMET (Brazil), IRD (France),INSEE (France), MARNR (Venezuela), NOAA (USA), NODC (USA), OCEI (Venezuela),ODP (USA), SCOPE (USA), UEA-CRU (UK), USGS (USA), and Woods Hole OceanographicInstitute – LBA (USA). Similarly, I wish to thank agencies and commissions under the UNumbrella – the FAO, UNEP, UNESCO, UNDP, IPCC and WCD, for making data and litera-ture they have generated widely and easily available.
Administrative, logistical, data-sharing and library support were provided to the bookat various stages by the Tropenbos-Guyana Programme, Tropenbos Foundation, GuyanaForestry Commission, Geology and Mines Commission, Imperial College – Silwood Park,UK Natural History Museum, CABI Bioscience, and the Iwokrama International Centre forRain Forest Conservation and Development. In particular, thank you for the great cooper-ation and exchange with various institutions in Guyana, including the Guyana Forestry
ix

x Acknowledgements
Commission, University of Guyana, National Agricultural Research Institute andEnvironmental Protection Agency.
Without the financial support provided to the editor and for project development, thisbook would not have been possible. To this end, generous support provided at variousearly stages by the Department for International Development-UK, the TropenbosFoundation and the European Commission (to the Iwokrama Centre) is gratefully acknowl-edged. Support during the final stages was provided solely by the editor.
I wish to acknowledge the professional and motivational support provided at varioustimes through the development of this book by Professor Val Brown (now at University ofReading), David Cassells (Iwokrama/World Bank), Ben ter Welle (Tropenbos/UtrechtUniversity/GTZ), my friend and colleague Pierre-Michel Forget (MNHN – Paris) and Hanster Steege (National Herbarium – Utrecht). I also would like to thank the many scientificcolleagues who agreed to review chapters at various stages and often at short notice andthe contributing authors for their unprecedented patience while this volume went throughvarious changes.
The editor would like to dedicate his effort on this book to the memory of Timothy C.Whitmore, one of the great tropical botanists, ecologists and foresters of the 20th centuryand a scientific guiding light during my time living and working in Guyana.
Most of all, thanks to my family for their endless patience.
About the Editor
David S. Hammond has been researching and working to help conserve and sustainablydevelop neotropical forests since 1987. He received his BSc in Botany–EnvironmentalScience from Miami University, USA, and a PhD in Environmental Sciences from theUniversity of East Anglia, UK. He currently resides in Portland, Oregon.

ANEEL Agencia Nacional de Energia EletricaAVHRR Advanced very high resolution radiometryBP Before present (normally 1950)CAM Crassulacean acid metabolismCOADS Coupled ocean–atmospheric data set, NOAACVG Corporacion Venezolana de GuayanaDAAC Distributed Active Archive Center, NASA DANE Departamento Administrativo Nacional de Estadistica, ColombiaDNPM Departamento Nacional de Produção Mineral, BrazilDOC Dissolved oxygen concentrationDWIC Dutch West Indies CompanyENSO El Niño – southern oscillationETR Electron transport rateFAO Food and Agriculture Organization of the United NationsGDP Gross domestic productGFC Guyana Forestry CommissionGGMC Guyana Geological and Mines CommissionGOES Geostationary operational environmental satelliteHIV Human immuno-deficiency virusHydromet Guyana Hydrometeorological OfficeIBAMA Instituto Brasileiro do Meio Ambiente e dos Recursos Naturais
RenováveisIBGE Instituto Brasileiro de Geografia y EstatisticaINDERENA Instituto de Desarrollo de los Recursos Naturales, ColombiaINPARQUES Instituto Nacional de Parques, VenezuelaINRA Institut National de Recherche Agronomique ISR Incoming short-wave radiationITCZ Inter-tropical convergence zoneJERS Japanese earth resources satelliteLAPD Latin American Pollen databaseLAR Leaf area ratioLGM Last Glacial MaximumLMA Leaf mass per unit areaLMF Leaf mass fractionNAR Net assimilation rate
xi
Acronyms and Abbreviations

xii Acronyms and Abbreviations
NCAR National Center for Atmospheric ResearchNCEP National Center for Environmental Prediction, NOAANEP Net ecosystem productivityNOAA National Oceanic and Atmospheric AdministrationNPV Net present valueNTFP Non-timber forest productOCEI Oficina Central de Estadistica e Informatica, VenezuelaOLR Outgoing long-wave radiationONF Office National de Forêt, FranceORSTOM Institut de Recherche Scientifique pour le Développement en
CoopérationPFD Photon flux densityPS II Photosystem IIRGR Relative growth rateRIL Reduced impact loggingSAR Synthetic aperture radarSLP Sea-level atmospheric pressureSOI Southern oscillation indexSPC Spare productive capacitySST Sea-surface temperatureTATE Trans-Amazonian tectonothermal episodeTRMM Tropical rainfall measuring missionTSS Total suspended solidsTZ+ Total dissolved cation concentrationUSGS United States Geological SurveyVPD Vapour pressure deficitWBR World base reference WCMC World Conservation Monitoring CentreWMSSC World Monthly Surface Station Climatology, NCARWPA World petroleum assessmentWRI World Resources InstituteWUE Water use efficiency

Introduction
The Guiana Shield could be described as aland of old rock, poor soils, much water,extensive forest and few people. These fiveattributes, perhaps better than any other,lay down a foundation for much of the geo-graphic and historic variation that hasshaped the shield, its forests and the waythese have and will be conserved and used.
Few tropical forest regions of the worldcan trace their geological origins directlyback to the earliest days of life itself. Evenfewer can be recognized as having largelyescaped thus far the sweep of modernhuman society as it appropriates an everincreasing share of the global naturalresource base. Covering much of the north-east corner of South America between theOrinoco and Amazon Rivers, the contempo-rary forest landscape of this region is acomplex of ancient and recent geologicalfeatures, many of these showing few signsof recent human modification. Today,forests of the shield rest upon a silent geo-logical landscape. Billions of years ofrepeated deformation have all butexhausted the geological processes thatcatalyse the natural transfer of nutrients,soil and biomass across other landscapes.During the Precambrian and throughout thePhanerozoic, the shield landscape has beenshaped by an incredible sequence ofrepeated fracturing, volcanism, erosion anddeposition that was compounded by mil-lennial-scale effects of regional climate
change. In recent times, the silence of thegeological landscape has been broken by agrowth in industrial human activity. Placedin perspective, the forests of the GuianaShield that are used and conserved todayrepresent a mere snapshot of the evolution-ary process extending back to a CretaceousGondwanaland, more than 120 millionyears ago (Romero, 1993) (see Chapters 2and 7). From all available evidence, the dis-tribution of closed forests in the region overthe last several million years has continu-ally expanded and contracted in responseto climate change and its impact on sealevel, rainfall and temperature (see Chapter2). Compared with the natural dynamism ofthe much younger geological landscapes ofwestern Amazonia and Central America,however, recent surface and internalchanges to the lithosphere (‘crust’) areabsent or indiscernible in the modernGuianan landscape (see Chapter 2). Themountains have been weathered to theirroots and the resulting sediments reworkedto such an extent that, in many areas, thenutrient and water holding capacity haslargely disappeared (see ‘Soil and soil fer-tility’, Chapter 2). The shaping influence ofthis environment on many short- and long-term biological processes is increasinglybecoming clear as we accrue information oncontemporary and historical events in theregion. The biological evidence, however,does not in all cases reinforce the view thatan exhausted edaphic environment leads toa proportional decline in the variety of life,
1© CAB International 2005. Tropical Forests of the Guiana Shield (ed. D.S. Hammond)
1 Ancient Land in a Modern World
David S. HammondIwokrama International Centre for Rain Forest Conservation and Development,Georgetown, Guyana. Currently: NWFS Consulting, Beaverton, Oregon, USA

as plants and animals find novel means tocope with diminishing opportunities forsurvival and growth (see Chapters 3–5) andother processes continue to play a moreimportant role in sustaining diversity(Chapter 7). The implications of the geolog-ical age of the shield to the debate onhuman use and conservation of theseforests is profound, but often diluted due tothe scale and duration of its shaping influ-ence. There is no factor, apart from the cur-rent decisions made by human society, thatwields greater overarching influence on thesize and location of resource use and con-servation opportunities in the region andthe land’s future ability to sustain economicgrowth than the twin foundational forces ofgeology and climate (see Chapters 2, 8, and 9).
The (sparse) archaeological and histor-ical record suggests that society and culturein the shield region have come and goneand recycled again through repeated wavesof colonization and abandonment (see‘Human Prehistory of the Guiana Shield’,Chapter 8). Today, the region remains oneof the least populated areas of the world(Fig. 1.1 and Chapter 8). In fact, population
densities in most parts of the shield aremore comparable to the coldest and leastproductive (shield) areas of the planet, suchas Nunuvut (northern Canada) and Siberia(Russia), than to other tropical forestregions. Yet the Guiana Shield is coveredby vast stretches of forest and savanna that,at first glimpse, appear no less productiveand accommodating to human life than anyother tropical environment. Other tropicalcountries, such as Indonesia, southernIndia, Bangladesh and Nigeria, have popu-lation densities comparable to the USA,Great Britain or Germany. How can such avast area of tropical forest remain sosparsely populated despite a long history ofhuman colonization (see ‘Colonial History’,Chapter 8)? Is the paradox of a tropical for-est landscape both verdant and impover-ished an adequate explanation? Orhave other factors worked surreptitiouslyto shape the relationship between peopleand the environment of the GuianaShield?
The answer to this and other large-scale questions is rarely addressed ade-quately by any single perspective. The‘forêt dynamique’ can follow a trajectory
2 D.S. Hammond
Fig. 1.1. Two-hundred and thirteen countries ranked by forest area per capita in 2000. Rankings ofcountries are influenced by both the natural extent of forest cover and losses due to deforestation. Datasource: FAO (2001). France (Metropole) and French Guiana (DOM) are considered separately here forcomparative purposes.
French Guiana
Suriname
Guyana
CanadaBrazil
VenezuelaUSA France China India UK
Netherlands
Ranking
For
est
area
per
cap
ita (
ha)

that is not necessarily the sole product ofunderstood biophysical mechanisms orcontemporary social processes. The sumtotal of numerous anomalies, the relicts ofpast events unrecorded and poorly under-stood, may plausibly constrain the courseof natural processes, and thus drive forestchange along a course that is otherwiseassigned wholly to environmental forces (instatistical parlance, an ‘aggregated’ type IIerror). Human history and the socialdynamics of decision-making can inter-weave with a wide range of biological andphysical processes to create a unique andunreplicable forest filled with its own spe-cial mix of life. The forces that work to fash-ion the forest we see today and that we willsee in the future are not easily attributed toany single approach or perspective. A sim-plified depiction of these broad interdisci-plinary relationships and their scale ofoperation is offered in Fig. 1.2. Manage-ment of forest cover and composition basedon a static snapshot of either biological orsocial structure, composition and function
overlooks the essence of that which consti-tutes a forest ecosystem: change. The the-matic approach taken in this book is aimedat drawing together what we know aboutthese forces, the forest components andprocesses they influence, and how these arelinked to forest composition, function andchange in the Guiana Shield region. Do for-est-use planning horizons adequatelyaccount for both slow-moving, low-fre-quency and short-term, high-frequencyforces and reflect the proportional influenceattached to their level of resonance throughthe forest ecosystem? And can these systemattributes be sensibly considered in practi-cal management action in the field? Manyapproaches already work to this end. Yetimportant facets of forest use remain largelyoutside the scope of resource management,confounding long-term sustainability. Theinteraction of socio-economic and biophys-ical foundations vary across the neotropics.The applicability of practices across thisvariance towards a common goal, thus mayrequire further thought (see Chapter 9).
Ancient Land in a Modern World 3
ENERGY, GEOPHYSICAL EARTH,
CLIMATE, GEOLOGY & SOILS (water & nutrients)
Plant cycle
Adult
Seeds & Seedlings
Flowers
Fruits
FLORA
Herbivores Granivores
Pollinators Dispersers
InsectivoresCarnivores FAUNA
SUSTAINED YIELD
Governance
Mining
Conversion
FOREST USE
Renewable
Non-Renewable
SOCIAL SYSTEM
History Cultural & Spiritual
Beliefs
Business
& Trade
International Relations
Law
Transport & Communications
Logging
Hunting, Fishing & Collecting
NTFPs(plants)
HUMAN
Tourism & Education
& ASTRONOMICAL INTERACTIONS
Technology
(zoo) Parasites
FoodSystems
Health & Nutrition
FU
NG
I
PR
OT
IST
S
Fig. 1.2. Simplified depiction of the major social, biological and physical forces working to shape thetropical forest ecosystem. The size of the line increases with a putative increase in magnitude of control,magnitude defined as a combination of spatial extent and rapidity of change. Dual arrowheads representdirect feedback. See Chapters 2 and 7 for details of energy, geophysical and astronomical forces andgeology, climate and soils; Chapters 7–9 for social forces; Chapters 3, 4, 7 and 9 for plant systems andChapters 4–7 for animal systems.
Decom
posers

Contents of this Book
Thus, the objective of this volume is to pro-vide a wide base of information compiledin a single source so the broadest range ofinfluences can be considered by the readerand assessed for their relevance across theGuiana Shield region (and perhaps, thelarger neotropics). The book also aims toprovide a glimpse at the inner workings ofthe Guiana Shield as a regional landscape,rather than only as a series of political enti-ties or as a poorly studied part of theAmazon Basin. Both biophysical and social(Chapters 8, 9) features of the region arecovered, but the emphasis on geological(Chapter 2), pedological (Chapter 2), cli-matic (Chapter 2), hydrological (Chapter 2),botanical (Chapters 3–5), ecological (Chap-ters 4, 5, 8, 9) and zoological (Chapters 5–7)research is apparent.
The book content is wide-ranging.More effort was expended on trying tobroadly triangulate the complex of attrib-utes that combine to shape forests of theshield region than diving to the deepestlevel of detail in each of the various fieldscovered. As a consequence, many key con-cepts, processes and attributes may appearinadequately characterized in the view ofexperts and for this the editor apologizes. Itis my hope that the effort to bring a broadcross-disciplinary approach to theories andexplanations that are often otherwisedelimited and isolated by a specific scien-tific focus can compensate in some smallmeasure for the lack of technical refine-ment. A solid reference base underpinnedby an extensive bibliography should beused to explore in greater detail the manyareas only briefly addressed in this singlevolume. Contributors have made a specialeffort to review a growing volume ofresearch conducted within the region andorganize this into a series of sectional topicsthat improve access to specific areas ofinterest. In many instances, very littleresearch has been conducted and this con-dition is noted in each of the chaptersexplicitly or as a set of testable hypotheses.Elsewhere, comparisons with other tropicalforest regions are constructed as a way of
characterizing the different environmentswithin the Guiana Shield by their socio-economic ranking (Chapters 8, 9) or posi-tion along a larger-scale biophysicalgradient (Chapters 2 and 7).
Chapter 2 does much of the latter. Itattempts to bring together information frommany sources to define the spatial distribu-tion and properties of rock, soils, rivers andlakes, rainfall and temperature and com-pare these with other neotropical regions. Italso describes the main regional landformsand landscape macro-features. Biophysicalfeatures are continually changing and thischapter also briefly describes many, but cer-tainly not all, of the main factors that gov-ern the change trajectory. In manyinstances, the specific effects of these fac-tors on the Guiana Shield are poorly under-stood, often due to sparse research andmonitoring. In other cases, the importanceand/or relevance of specific processes haveebbed and waned over the course of theregion’s history. Climate change mecha-nisms in particular are summarilydescribed in an effort to highlight the link-ages between terrestrial, marine and atmos-pheric systems and how these have shapedforest evolutionary development, distribu-tion and composition across the GuianaShield.
In Chapter 3, Thijs Pons and colleaguesprovide an interesting look at the ecophysi-ological function of forest plants in theGuiana Shield. They present a wide rangeof experimental results and address thesewithin a broader context defined by otherstudies conducted within the region andelsewhere. The chapter addresses most ofthe main plant physiological pathways:photosynthesis, growth, transpiration,water and nutrient uptake and discusseschanges in these in relation to canopy struc-ture, openness and water availability,among others. The chapter also brieflyexplores the role of symbionts in catalysingand sustaining nutrient uptake pathways ina highly limited growth environment. Theauthors conclude that regional forest treespecies can be described by wide-rangingcombinations of different ecophysiologicalattributes.
4 D.S. Hammond

Chapter 4 focuses on reviewing thelarge body of literature published on theterrestrial fauna known to reside in theregion’s forests and how these animalsmake use of the plant resources. Theauthors review what is known about dietaryhabits of the main forest fauna taxa, butwith an emphasis on mammals. The chap-ter also discusses the cross-regulatingeffects that plants and animals can exert oneach other. Dispersal and pollination areperhaps of greatest importance to thisexchange and these important componentsof plant–animal relationships are discussedin relation to the type and diversity of ani-mal food preferences, along with otheractivities such as seed and seedling preda-tion, folivory and nectar/pollen-feeding. Anaccompanying checklist of known verte-brates (less fish) from the region representsa simple taxonomic snapshot of the diver-sity, but provides a good point source forcomparison with other regions and acrossthe shield itself.
Chapter 5 by Yves Basset et al. pro-vides a broad review of the work done withabove-ground, leaf-feeding insects in theregion, including a historical account ofinsect collecting and curation in the threeGuianas. The authors briefly address severalimportant topics relevant to tropical forestfolivory and folivore diversity, such as host-specificity, stand (mono)dominance andspatial resource distribution. The authorsemphasize the relatively sparse entomologi-cal studies carried out in the region.
Chapter 6 addresses the specific role ofinsects as flower visitors. It examines therole of visitors as both pollinators and nec-tar-robbers, providing examples drawnfrom the very few studies carried out atlocations within the Guiana Shield. De Dijnbriefly examines trends in pollinator andplant diversity, but highlights the paucityof concrete information from the region.The chapter concludes with suggestions forfuture pollination research in the GuianaShield.
Chapter 7 explores the ecological andevolutionary responses of forests to changescharacterized in Chapter 2. Forest structureand composition are interlocked with indi-
vidual recruitment, growth and survivor-ship along a reaction function. Variation inthese attributes in many ways betterdescribes a forest than traditional staticmeasures of standing diversity and biomassbecause these quantities represent aresponse to past forces without first under-standing how and for how long these res-onate through a forest system. The chapterdraws on a large volume of publishedresearch to explore regional differences inmany of the common disturbances believedto drive forest change. It also compares sev-eral plant life-history attributes and geo-graphical ranges believed to be important indistinguishing system contrasts. It con-cludes with a discussion of the relative roleof geomorphic and geographical controls inshaping forest trajectories and an eclecticis-tic proposal for observed differences in for-est composition and diversity.
Chapter 8 approaches the descriptionof the regional forests from a (pre-)historicaland socio-economic perspective. It summa-rizes the relatively small amount of archae-ological and anthropological knowledge ofpre-Columbian Amerindian societies andthe dynamics of settlement, migration andforest use within the region. The chapterdoes not attempt to cover the diverse andunique cultural drivers of these societies(e.g. cosmology), although the role of ritual,religion, kinship and other cornerstones ofsocial structure are recognized as importantfactors influencing both Amerindian andnon-Amerindian forest use patterns andpurposes. The chapter also provides a briefchronology of post-Columbian colonizationand forest use within the region and the his-torical establishment and development offorestry, mining and agriculture. The chap-ter finishes with a brief description of thecurrent social and economic condition ofthe different countries/provinces/statesfound within the Guiana Shield with anemphasis on the historical transition fromindustrial uses of NTFPs, timber and min-erals.
Chapter 9 draws upon preceding chap-ters to explore forest conservation and man-agement direction in the Guiana Shieldsince its earliest inception through to recent
Ancient Land in a Modern World 5

initiatives. This section attempts to high-light relationships between regional land-scape conservation, patterns of biologicaldiversity, economic use of forestlandresources and global economic drivers,drawing upon the growing volume of stud-ies published on these topics recently.
Ancient Land, Modern Name
The Guiana Shield draws its name from thefusion of two terms – one ancient, one mod-ern. ‘Guiana’, ‘Guayana’ and ‘Guyana’ arebelieved to be linguistic variants on a tradi-tional Amerindian word widely interpretedto mean ‘water’ or ‘much water’ (but seeWilliams, 1923; Cummings, 1963).1 Theword ‘Shield’ in this context refers to amodern scientific term used by geologists todescribe a large region of very old, exposedPrecambrian basement rock that is notaffected to any large extent by modern vol-canic or tectonic activity (Press and Siever,1982; Gibbs and Barron, 1993; Goodwin,1996). The Guiana Shield region, however,was not commonly referred to as a singlegeological province until the late 1950s,when techniques for isotopic dating of rockimproved and evidence supporting platetectonic theory began to accrue. The area isalso described in regional languages ofFrench, Spanish and Portuguese as the‘Bouclier Guyanais’, ‘Escudo de Guayana’and ‘Escudo Guyanense’, respectively (seeGibbs and Barron, 1993). The names Guianaand Guayana are interchangeable andapplied equally in describing the specificshield region (e.g. Maguire, 1970; seehttp://www.guayanashield.org).
The region was defined as a discretegeopolitical entity in Western literaturelong before it was recognized as a geologicalprovince. This was at first based on themythical view that the lands were part of avast Amerindian empire, centred on thefabled city of Manoa and akin to thoseencountered by the Spanish in Peru andMexico (Raleigh, 1596). Later, the geopoli-tics of European imperial ambitionsdivided South America into three broadareas, viz. Brazil (Portugal), New Grenada
(Spain) and Guiana (England, France andThe Netherlands). On this basis, Guianawas considered at the time by some toextend between the Amazon, Orinoco andNegro Rivers (Bancroft, 1769), though thelocations of international boundarieswithin the region were not established untilalmost a century later (Schomburgk, 1840,1848), and even then returning to the searchfor El Dorado as the root basis of colonialclaims to the region (see Burnett, 2000).2
Guiana Shield, Tropical Forest Coverand the Global Distribution of
Precambrian Landscapes
In part the significance of the Guiana Shieldforests rests with the underlying geologicallandscape and the relative importance ofthe region to the global stock of tropicalforests growing on surfaces dominated bythe Precambrian. There are nine main areasof exposed Precambrian rock, belonging toten geological provinces (after Osmonson etal., 2000), that are subject to climatic con-ditions capable of sustaining tropical moistforests worldwide (after Olson et al., 2001)(Fig. 1.3). Of these, three are located inSouth America, four in Africa and two inIndia. Indian and Madagascan forests arelocated at the northern and southern maxi-mum of tropical climates, respectively, andwould typically classify as sub-tropical,while the remaining areas consist of a widevariety of tropical forest assemblages,including both open and closed canopy for-mations. The total global area ofPrecambrian rock naturally covered bytropical forests is estimated at 5.08 × 10⁶
km2. The Guiana Shield is by far the largestcontiguous area of exposed Precambrianrock naturally covered by tropical forests inthe world, accounting for one-third of thistotal (Fig. 1.4). When further consideringthe levels of deforestation that have affectedPrecambrian areas in India, Madagascar,the Atlantic coast of Brazil and West Africaover the last 50 years, the relatively largearea of forest remaining in the GuianaShield accounts for more than half of theremaining tropical moist forests growing on
6 D.S. Hammond
Precambrian geological landscapes world-wide.
The significance of this statistic rests inthe biophysical and socio-economic controlthat underlying geology exerts upon forestecological and evolutionary processes, theway in which forestlands are used andmanaged, and the opportunities and limitsthat this region’s forest resources can offerto local rural communities, nationaleconomies and the global storage of biolog-ical diversity, carbon and water. The voy-age of the shield area atop its underlyingcrustal plate has combined with movementof the other continental land masses toplace this Precambrian region in a uniquegeographical position along the meteorologi-cal equator, a position not held by any otherarea of similar geological antiquity (Chapter2). Its current position along the westernrim of the Atlantic basin also exposes theancient geology of this region to a tropicalclimate that is responsive to a wide range offorcing factors, ranging from El Niño eventsthrough to periodic fluctuation in solarsunspot activity and planetary orientation(see Chapter 2). While many regions cur-
rently accommodating tropical forestsformed part of the sea floor over most of ourplanet’s geological history, the landscape ofthe Guiana Shield was actively evolving inresponse to climatic fluctuations (see ‘Sea-level change’, Chapter 2). This long historyof exposure is now strongly reflected in thespatial distribution of soils, water and min-erals (see Chapter 2), the ways in which for-est plants and animals interact to surviveand reproduce (see Chapters 3, 4, 5 and 7),and in our own (pre-)history of occupation(Chapter 8).
Location and Size of the Guiana Shield
Location
The Guiana Shield is a vast expanse of low-land forest, mountains, wetlands andsavanna in northern South America,wedged between the llanos of northernVenezuela and eastern Colombia and theAmazon River in northern Brazil. The size,shape and location of the shield have beenoutlined since the early 1950s by numerous
Ancient Land in a Modern World 7
Fig. 1.3. The estimated global area (× 1000 km2) of tropical moist forest naturally occurring onPrecambrian landscapes grouped by geological province. Forest areas were estimated by spatiallyintersecting a modified subset of Precambrian geological provinces derived from Osmonson et al. (2000)and a subset of tropical moist forest ecoregions derived from Olson et al. (2001). See these references fordetails of positional accuracy and resolution.
8 D.S. Hammond
Fig. 1.4. (A) Distribution of the major areas of exposed Precambrian rock, (B) maximum extent of modern(sub)tropical forest cover (not including losses to deforestation) and (C) major tropical forest areas situatedon Precambrian formations, all in black. Distribution of Precambrian rock based on USGS WPA-derivedcoverage of global geological provinces (Osmonson et al., 2000) and cross-checked with Goodwin (1996)and references contained therein. Distribution of tropical forests based on WWF Ecoregion classificationsystem coverage (Olson et al., 2001) and cross-checked with FAO (2001), Collins et al. (1991), Sayer et al.(1992) and Harcourt and Sayer (1996). Note that the Mercator Projection stretches graticules at highlatitudes. This super-sizes areas of Precambrian rock occurring above the 20th parallel in (A). Backgroundimage shows ocean floor topography with major tectonic joints and platforms as white lines and surfaces.Courtesy of ESRI.

geographers, geologists (Gansser, 1954;McConnell, 1961; Kalliokoski, 1965;Blancaneaux and Pouyllau, 1977; Mendoza,1977; Gibbs and Barron, 1993; USGS andT.M. Corporacion Venezolana de Guayana,1993; Goodwin, 1996) and more recently,conservation groups (e.g. http://www.guayanashield.org). All of the SouthAmerican craton consists of Precambrianrock of one form or another, but not allremains exposed, principally due to down-warping of the crust along faults, geosyn-clines and other points of subsidence thatcriss-cross the continent. Many of theseareas are covered by sediments depositedduring the Phanerozoic and the questionremains whether these areas should beincluded when defining the location andarea of the shield.
The most detailed and extensive depic-tion of the Guiana Shield, as a geologicalentity, has been drawn up by Gibbs andBarron (1993). Considering only those areaslargely occupied by Precambrian rock for-mations in the map presented in Gibbs andBarron (1993), the shield area consists ofnorthwestern and southeastern lobes, sepa-rated by two central sedimentary depres-sions extending from Atlantic andAmazonian sediment margins towards thecentre of the region (Fig. 1.5A). IncludingAtlantic and central areas of Quaternarysediment as depicted by Gibbs and Barronextends the area considerably (Fig. 1.5B).Adding the large area along the south-cen-tral margin of the shield located betweenthe Japurá and Solimões Rivers extends thisto the maximum area delimited by Gibbsand Barron and others (Fig. 1.5C). In thiscase, the northern and southern boundariescan be defined by the maximum width ofthe Orinoco and Amazon River floodplains,respectively, while the Atlantic coast ofSouth America and the central ChiribiquetePlateau in southeastern Colombia could beconsidered as the eastern and westernboundaries. On this basis the shield rangesmore than 14 degrees in latitude betweenits most northerly point at the OrinocoDelta (10°N, 62°W) and southerly pointapproximately 75 km north of Coari, Brazil
(4°S, 63°W), on the south bank of theSolimões. The most easterly point is foundin the coastal swamplands north of themouth of the Amazon near Sucuriju,Amapá, Brazil (2°N, 50°W). The shieldreaches its most westerly point at ColimaCumare (0°40′N, 74°W), north of theCaquetá River in Colombia.
Other depictions have generally agreedwith Gibbs and Barron’s demarcation,though the inclusion/exclusion of the largeAtlantic and Amazonian margins of shield-derived sediments repeatedly acts as themain filter in defining the areal extent of theshield. Williams and others depicted theshield as an area that extended from theAtlantic seaboard westward to the RioNegro between the Orinoco in the north andband of Palaeozoic sediment runningimmediately north and in parallel with theAmazon River. As part of a WorldPetroleum Assessment (Schenk et al.,1999), the US Geological Survey delimitedthe Guiana Shield area as a geologicalprovince that excludes Quaternary sedi-mentary lowland areas around the conflu-ence of the Negro and Branco Rivers and inthe Berbice Basin (Fig. 1.5D). This depic-tion of the shield area has a western marginalong the Brazil–Colombia border. The areahas been similarly delimited in Goodwin(1996), Berrangé (1977), Putzer (1984) andRäsänen (1993). Pouyllau (1976, cited inBlancaneaux and Pouyllau, 1977) similarlyexcluded areas covered by deep sedimentsalong the Atlantic and Amazon margins,but also placed the western margin fullyeast of the Rio Negro. Dosso (1990, cited inChareyre, 1994, Fig. 2) depicted the GuianaShield as limited to an area even furthereast and south of the Orinoco and RioNegro Rivers, but including sedimen-tary margins along the Atlantic, NorthPará and Amapá. In the process of de-fining regional conservation prioritiesat a 2002 meeting in Suriname, parti-cipants identified a shield area very similarin size and shape to Gibbs and Barron’sdepiction including Phanerozoic sedimen-tary cover (http://www.guayanashield.org)(Fig. 1.5E).
Ancient Land in a Modern World 9

10 D.S. Hammond
Fig. 1.5. Location and areal extent of the Guiana Shield showing several possible configurations defined as:(A) Precambrian zones+deep Phanerozoic sedimentary cover principally of shield origin (adapted fromGibbs and Barron, 1993); (B) same as (A) but excluding deep Putomayo–Solimoes sedimentary plains; (C)Precambrian zones only, based on rock types dated >550 Ma as assigned in Gibbs and Barron (1993); (E)Precambrian+shallower parts of central sedimentary basins (Osmonson et al., 2000; Berrangé, 1977). TheGuiana Shield region as defined in (D) is based on the results of a conservation priority-setting workshopfor the region held in 2002 (http://www.guayanashield.org).
Bolivar
NorthPará
Amapa
Vaupés
AmazonasEcuador
Peru
Bolivia
Brazil
French Guiana
Panama
Venezuela
Colombia
CostaRica Suriname
Guyana
Trinidad and Tobago
Barbados
Amazonas
Amazonas Roraima

Size of Guiana Shield
The Guiana Shield constitutes slightlymore than 1.5% of the global continentalsurface area, 13% of the South Americancontinent and all or most of the area of fourcountries: Venezuela, Guyana, Surinameand French Guiana (Table 1.1). Thoughamounting to only a small proportion of itstotal national area, Brazilian national terri-tory constitutes more than half of theGuiana Shield, more than any other coun-try. This large area falls within four statesin northern Brazil – Amapá, Roraima,Pará and Amazonas – and accounts for vir-tually the entire area of the shield draininginto the greater Amazon Basin (see Chapter2).
The balance of each nation’s interest inthe Guiana Shield depends on many fac-tors, but the relationship between the pro-portion of a country’s area in the shield andits relative contribution to the shield (Table1.1) suggests that Brazil’s relationship withthe region is at the same time both substan-tial and diluted. The structuring of policies
and allocation of resources in the Braziliancase needs to consider a national interestthat is significantly broader and morediverse than the relatively small part of thecountry that is found within the shield area.But at the same time, Brazil occupies morethan half of the shield area, and these samebroad policies can affect the region as awhole more than those implemented by anyother country. France, too, has a relation-ship with the region that considers nationaldomestic needs extending outside theGuiana Shield. Other countries whose landarea is entirely or predominantly locatedwithin the shield area have an interest thatis more attenuated to the prevailing shieldenvironment, but have a relatively modestinfluence on how this region as a whole isconserved and developed. Despite thisasymmetry, considerable spatial variationin forest composition, diversity and acces-sibility across the shield area suggests thateach country has an important role to playin maintaining regional forest cover, pro-ductivity and conservation quality.
The important interplay of socio-
Ancient Land in a Modern World 11
Table 1.1. Estimated area of the Guiana Shield (GS) and its breakdown by constituent country.
Land area (km2)
Country In GSa Entire countryb % country area in GS % contribution to GS
Brazil 1,204,279 8,456,510 14.2 52.6Colombia 170,500 1,038,710 16.4 7.5French Guiana 88,150 88,150c 100.0 3.9Guyana 214,980 214,980 100.0 9.4Suriname 156,000 156,000 100.0 6.8Venezuela 453,950 882,060 51.5 19.8Guiana Shield 2,287,859 100.0
aBased on (1) Brazil – area figures for munícipios in Amapá, Roraima, Pará and Amazonas falling withinthe adopted Guiana Shield boundary provided by IBGE (2000). The shield area of administrative unitsthat extend outside the perimeter was calculated from available statistics through geoprocessing inARCVIEW 3.2. (2) Colombia – area figures based on values provided through anonymous ftp by DANE(2000) and cross-corrected by geoprocessing of Japurá, Negro and Orinoco watershed units with shieldand international boundary coverages using ARCVIEW 3.2. (3) Venezuela – based on area figures formunicipios in Delta Amacuro, Bolivar and Amazonas states published by OCEI (2000).bNational land area figures are consistent with those published in Harcourt and Sayer (1996), FAO(2001), but figures for French Guiana and Suriname are less than those published by FAO (1993) andcommonly cited in various encyclopaedias, almanacs and other statistical compilations that most likelyadopted figures from previous citations. The sum of watershed area calculations for French Guiana andSuriname generally support figures stated here (Amatali, 1993; Hiez, 1964).cOnly Département Otre Mer (DOM) du Guyane – not including metropolitan France.

economic and biophysical factors indicatesthat the size and shape of the shield usedfor the purpose of describing regional fea-tures may vary depending on the factorunder consideration. While the definitionof the shield as a geological provinceundoubtedly underpins all others, the term‘Guiana Shield’ is increasingly used as ameans of demarcating and defining a regionof interest for many non-geological attrib-utes (e.g. Bryant et al., 1997; Haden, 1999).Expanding the definition of the GuianaShield as an area of biogeographical (e.g.floristic province; Maguire, 1966; Mori,1991) and conservation significance (e.g.http://www.guayanashield.org) influencesthe shape and area of interest, one that isnot necessarily identical to a shield definedin the strictest sense by the presence ofunderlying exposed Precambrian rock (Fig.1.5A,D vs. 1.5C,E). In this context, definingan area that includes the main sedimentarydepressions traversing the area would bemore appropriate since the upland and low-land landscapes are strongly interlinked.
Impinging uncertainties
The location, size and shape of the GuianaShield presented here is based on a series ofgeological and topographical thresholds.While the shield is considered to be adistinct geological entity, the fine-scaleresolution of its boundaries is little morethan a good approximation for a number ofreasons. First, it forms one part of a muchlarger biogeochemical region and theprocesses that have shaped the shieldenvironment are shared, to varying extent,with other areas of South America andother continents (especially West Africa).The area of mineralogical affinity thatdefines the modern-day shield areaexpands as one moves further back in timethrough the Precambrian. Secondly, thearea remains remote and many parts havebeen poorly surveyed. Our knowledge ofmore specific small-scale landscape fea-tures of the region have in the past beenlargely interpolated at larger scales, thoughimprovements in remotely sensed data
acquisition are improving this knowledgebase. This coverage also varies by countrydue to differences in national technicalcapability. Suriname and Guyana are par-ticularly constrained in this regard in com-parison with their French, Brazilian andVenezuelan neighbours.
Whether the vast areas of Phanerozoiccover along the Atlantic coast and in north-ern Pará, Amazonas and Roraima statesshould be included or excluded from theGuiana Shield has largely favoured theirexclusion from a strict geological perspec-tive. However, many included areas alsohave significant sedimentary cover formedunder the same conditions and through thesame processes as those excluded (Gibbsand Barron, 1993). Much of the cover isthought to have originated from the erosionof older sedimentary structures (e.g. theRoraima Group) and basement rock withsignificant redeposition and remixingthrough oscillating periods of marine flood-ing, retreat and evaporation. Precambrianrock rests below all of these sedimentarybasins and its presence/absence does notqualify as a selective factor alone. Thethreshold depth and mineralogical prove-nance of Phanerozoic cover that should beincluded as part of the Guiana Shield is,however, a major criterion playing on thesize and shape of the shield and has yet tobe objectively established.
There are also complications with gen-eralizing the extent of the shield area whenconsidering the eastern and western limits.The eastern edge can vary depending onwhether current or past sea level is consid-ered as a limit to the eastern boundary. Thewestern edge of the shield is even more dif-ficult to define unambiguously, since signif-icant geological and floristic elementstypical of central shield locations canextend as far west as southeastern Colombianorth of the Solimões River (Gibbs andBarron, 1993; Duivenvoorden and Lips,1995; Cortès and Franco, 1997; Cortès et al.,1998). Information from these areas sug-gests that flora, fauna, soils and hydrologi-cal attributes are equally or more typical ofcentral and western Amazonian forestlands(Duivenvoorden and Lips, 1995) as biogeo-
12 D.S. Hammond

graphical and geological influences of theAndes to the west and north intermingledwith the much older shield contributionscentred to the east and south. From ananthropological perspective, the Amer-indian languages spoken in southernColombia are also considered part of theTukano/Ticuna linguistic groups ratherthan the shield-centred Carib/Arawakan/Yanomami groups (Chapter 8). Southern
parts of the geological shield are largelyinhabited by Tupi/Guarani-speaking peo-ples traditionally found living south of theAmazon River but not in any other part ofthe Guiana Shield. These and other attrib-utes that together help in creating a distinctpicture of the Guiana Shield region, andthrough this a better sense of its size as itrelates to many different attributes, aredescribed in much greater detail later.
Ancient Land in a Modern World 13
Notes
1 The etymological origins of ‘Guiana’ are debatable, though the modern translation is widely accepted tomean ‘water’ or ‘many waters’. Schomburgk (1840) suggested that the name is derived from a small tribu-tary of the Orinoco, while Codazzi (1841) argued that the name originated with an Amerindian tribe, theGuayanos, and that the term for pale or white, ‘uayana’, was used in describing the first Europeans theyencountered. Certainly a vast area extending inland from the Atlantic was referred to as Guiana since theearliest written accounts of exploration by Raleigh (1596), Keymis (1596) and Harcourt (1613), though theyused this name without qualifying its origins. A succinct account of some of the possibilities and variationsis also given by Berry et al. (1995).2 Segments of the international boundaries within the shield are still disputed more than 150 years later(Braveboy-Wagner, 1984; Burnett, 2000).
References
Amatali, M. (1993) Climate and surface water hydrology. In: Ouboter, P.E. (ed.) The Freshwater Ecosystemsof Suriname. Kluwer Academic, Dordrecht, The Netherlands, pp. 29–52.
Bancroft, E. (1769) An Essay on the Natural History of Guiana in South America. T. Becket and P.A. DeHondt, London.
Berrangé, J.P. (1977) The Geology of Southern Guyana, South America. Overseas Memoir 4. HMSO,London.
Berry, P.E., Holst, B.K. and Yatskievych, K. (1995) Flora of the Venezuelan Guayana. Volume 1:Introduction. Timber Press, Portland, Oregon.
Blancaneaux, P. and Pouyllau, M. (1977) Les relations géomorpho-pédologiques et la retombée nord-occi-dentale du massif guyanais (Vénézuela). Cahiers ORSTOM, Série Pédologique 15, 437–448.
Braveboy-Wagner, J.A. (1984) The Venezuela–Guyana Border Dispute: Britain’s Colonial Legacy in LatinAmerica. Westview Press, Boulder, Colorado.
Bryant, D., Nielsen, D. and Tangley, L. (1997) The Last Frontier Forests – Ecosystems and Economies on theEdge. World Resources Institute, Washington, DC.
Burnett, D.G. (2000) Masters of all they Surveyed – Exploration, Geography, and a British El Dorado.University of Chicago Press, Chicago, Illinois.
Chareyre, P. (1994) Régénération Naturelle en Guyane Française. Distribution Spatiale de Quelques EspècesLigneuses dans une Forêt Secondaire de 18 Ans. UFR de Sciences, Université Paris XII Val de Marne, Paris.
Codazzi, A. (1841) Resumen de la Geografia de Venezuela. H. Fournier, Paris.Collins, N.M., Sayer, J.A. and Whitmore, T.C. (1991) The Conservation Atlas of Tropical Forests: Asia.
Macmillan, London.Cortès, R. and Franco, P. (1997) Análisis panbiogeográfico de la flora de Chiribiquete, Colombia. Caldasia
19, 465–478.Cortès, R., Franco, P. and Rangel, O. (1998) La flora Vascular de la Sierra de Chiribiquete, Colombia.
Caldasia 20, 103–141.Cummings, L.P. (1963) The name Guiana: its origin and meaning. Journal of the British Guiana Museum and
Zoo 38, 51–53.

DANE (2000) Informacion geoestadistico. http://www.dane.gov.coDuivenvoorden, J.F. and Lips, J.M. (1995) A Land–Ecological Study of Soils, Vegetation and Plant Diversity
in Colombian Amazonia. Tropenbos Foundation, Wageningen, The Netherlands.FAO (1993) Forest Resources Assessment 1990: Tropical Countries. FAO Forestry Paper 112. FAO, Rome.FAO (2001) Global Forest Resources Assessment 2000. FAO Forestry Paper 140. FAO, Rome.Gansser, A. (1954) Observations on the Guiana Shield (South America). Ecologae Geologicae Helvetiae 47,
77–112.Gibbs, A.K. and Barron, C.N. (1993) The Geology of the Guiana Shield. Oxford University Press, Oxford,
UK.Goodwin, A. (1996) Principles of Precambrian Geology. Academic Press, New York.Haden, P. (1999) Forestry Issues in the Guiana Shield Region: A Perspective on Guyana and Suriname. EU
Tropical Forestry Paper 3. Overseas Development Institute, London.Harcourt, C.S. and Sayer, J.A. (1996) The Conservation Atlas of Tropical Forests: the Americas. Simon and
Schuster, London.Harcourt, R. (1613) A Relation of a Voyage to Guiana. John Beale, London.Hiez, G. and Dubreuil, P. (1964) Les Régimes Hydrologiques en Guyane Francaise. ORSTOM, Paris.IBGE (2000) Cidades@. http://www.ibge.gov.brKalliokoski, J. (1965) Geology of north-central Guyana Shield, Venezuela. Geological Society of America
Bulletin 76, 1027–1050.Keymis, L. (1596) A Relation of the Second Voyage to Guiana. Thomas Dawson, London.Maguire, B. (1966) Contributions to the botany of the Guianas. Memoirs of the New York Botanical Gardens
15, 50–128.Maguire, B. (1970) On the flora of the Guayana Highland. Biotropica 2, 85–100.McConnell, R.B. (1961) The Precambrian rocks of British Guiana. Timehri 40, 77–91.Mendoza, V. (1977) Evolucion tectonica del Escudo de Guayana. Boletín de Geologia (Publicacion Especial)
7, 2237–2270.Mori, S.A. (1991) The Guayana lowland floristic province. Comptes Rendu de la Société de Biogéographie
67, 67–75.OCEI (INE) (2000) Aspectos fisicos. http://www.ocei.gov.veOlson, D.M., Dinerstein, E., Wikramanayake, E.D., Burgess, N.D., Powell, G.V.N., Underwood, E.C.,
D’Amico, J.A., Itoua, I., Strand, H.E., Morrison, J.C., Loucks, C.J., Allnutt, T.F., Ricketts, T.H., Kura, Y.,Lamoreux, J.F., Wettengel, W.W., Hedao, P. and Kassem, K.R. (2001) Terrestrial ecoregions of theworld: a new map of life on Earth. Bioscience 51, 933–938.
Osmonson, L.M., Persits, F.M., Steinhouer, D.W. and Klett, T.R. (2000) Geologic Provinces of the World –wrld_prvg. USGS, Denver, Colorado.
Press, F. and Siever, R. (1982) Earth. W.H. Freeman and Co., San Francisco, California.Putzer, H. (1984) The geological evolution of the Amazon basin and its mineral resources. In: Sioli, H. (ed.)
The Amazon: Limnology and Landscape Ecology of a Mighty Tropical River and its Basin. Dr W. Junk,Dordrecht, The Netherlands, pp. 15–46.
Raleigh, W. (1596) The Discoverie of the large, rich, and bewtiful empyre of Guiana, with a relation of thegreat and golden citie of Manoa (which the Spanyards call El Dorado) and of the provinces of Emeria,Arromaia, Amapaia, and othe countries, with their rivers, adjoyning. Robert Robinson, London.
Räsänen, M. (1993) La geohistoria y geologia de la Amazonia Peruana. In: Danjoy, W. (ed.) AmazoniaPeruana. Vegetacion Humeda Tropical en el Llano Subandino. PAUT/ONERN, Jyväskylä, Finland, pp.43–65.
Romero, E.J. (1993) South American paleofloras. In: Goldblatt, P. (ed.) Biological Relationships BetweenAfrica and South America. Yale University Press, New Haven, Connecticut, pp. 62–85.
Sayer, J.A., Harcourt, C.S. and Collins, N.M. (1992) The Conservation Atlas of Tropical Forests: Africa.Macmillan, London.
Schenk, C.J., Viger, R.J. and Anderson, C.P. (1999) Maps Showing Geology, Oil and Gas Fields and GeologicProvinces of South America. USGS Open File Report. 97-470D. USGS, Denver, Colorado.
Schomburgk, R.H. (1840) A Description of British Guiana. Simpkin, Marshall and Co., London.Schomburgk, R.H. (1848) Reisen in British Guiana den Jahren 1840–1844. J.J. Weber, Leipzig.USGS and T.M. Corporacion Venezolana de Guayana (1993) Geology and Mineral Resource Assessment of
the Venezuelan Guayana Shield. USGS Bulletin 2062. US GPO, Washington, DC.Williams, J. (1923) The name Guiana. Société des Américanistes de Paris – New Series 15, 19–34.
14 D.S. Hammond

Geology – a Precambrian Conundrum
The physical appearance of the GuianaShield is as much a reflection of early globaltectonic evolution as it is the consequenceof localized weathering and deformation.The mixing of many different geologicalevents and processes at different spatialscales over a considerable period of timehas created a modern landscape that is bothdiverse and patchy. From ancient riftingand volcanism through to the erosionalretreat of the massive sediment forming theGuayana Highlands and its subsequentredeposition during interglacial sea trans-gressions, the Guiana Shield embraces avast geological history that has substan-tially influenced both the type and extent ofmodern plant and animal life, as well as thepace and scale of human development. TheGuiana Shield owes its modern physicallandscape to the same set of geologicalprocesses that have affected other tropicalforestlands. The relative influence, how-ever, of these different processes in shapingglobal tropical forestlands, both past andpresent, emphasizes the important role thatrock formation and deformation processescan play in constraining the trajectory offorest evolution. This chapter attempts todescribe the salient geological features ofthe Guiana Shield and illustrate some of thesimilarities and contrasts between thisregion and other parts of the neotropics andthe more extensive, global Precambrian.
Taken together, a picture emerges of theGuiana Shield as a canvas, sewn togetherfrom different materials on which a uniquecollage of forest consociations has devel-oped and evolved.
The South American craton
The Guiana Shield can be viewed as a clus-ter of three bulges separated by a series ofdepressions in the centre of the SouthAmerican plate. This plate extends in theeast many hundreds of kilometres beneaththe waters of the equatorial Atlantic to themid-Atlantic ridge, a long snake-like zoneof sea-floor spreading that has separatedand gradually distanced the SouthAmerican from the African craton since themid-Jurassic. To the west, the SouthAmerican plate abruptly ends off the west-ern Pacific coast along the ‘trailing’ bound-ary of the plate where the giant Pacific platerock moves beneath, or subducts the SouthAmerican plate. The continental crust rid-ing atop the South American plate can bevariously divided according to the age ofthe dominant superficial rock formations.The mainly metamorphosed rock of theSouth American continental crust, or cra-ton, generally consists of (after Goodwin,1996):
1. Three major areas of exposedPrecambrian rock, the Guiana, Central
15© CAB International 2005. Tropical Forests of the Guiana Shield (ed. D.S. Hammond)
2 Biophysical Features of the Guiana Shield
David S. HammondIwokrama International Centre for Rain Forest Conservation and Development,Georgetown, Guyana. Currently: NWFS Consulting, Beaverton, Oregon, USA
Brazilian (aka Guaporé; Gibbs and Barron,1993) and Atlantic (aka Uruguay) Shield(4.6–0.57 Ga BP);2. The surrounding regions that are pre-dominantly covered with often deep,reworked and consolidated Phanerozoicsediment (0.57–0.01 Ga BP); and3. Mountain-building areas, such as theAndes, that continue to develop along theedges of the South American and neigh-bouring plates in response to subduction ofthe lithosphere (0.245 Ga–present).
Precambrian rock can also be found under-lying many of the sedimentary and moun-tainous regions, but it is in the shield areaswhere these represent the main surface for-mations.
Areas of exposed Precambrian crust aregenerally sub-classified according to the ageof the formations, ranging from the oldestrocks on the planet, formed around 4.6 bil-lion years ago, to those developing in theLate Proterozoic, around 570 million yearsbefore present (BP). Precambrian rock is notdifficult to find. Given that the geologicalhistory of the planet is largely Precambrian,it is not surprising that approximately 72%of the global continental crust is thought to
have been formed during this era(Poldevaart, 1955). Thus at the core of eachmodern continent is a large, Precambriancraton that has been relatively stable, ingeological terms, for at least 500 millionyears.
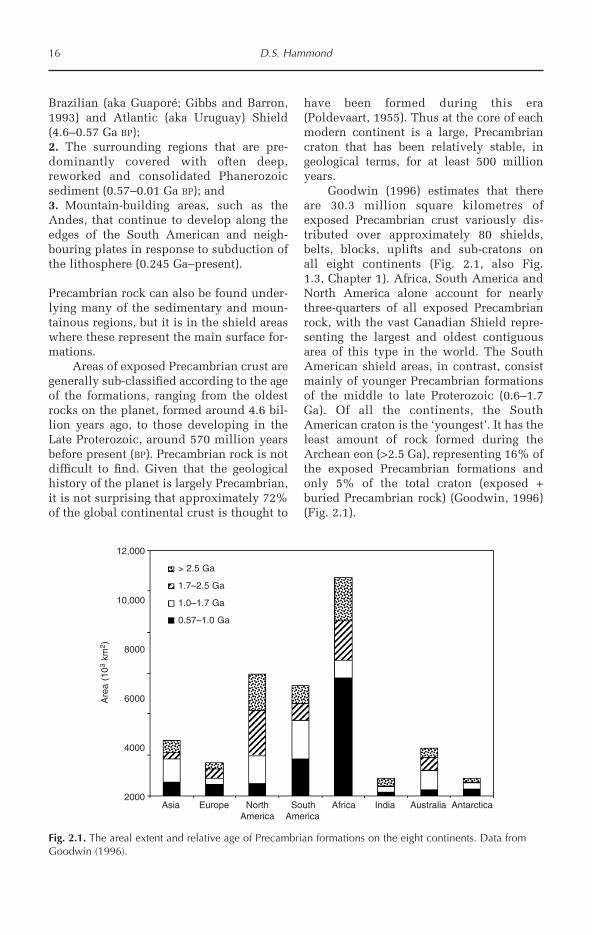
Goodwin (1996) estimates that thereare 30.3 million square kilometres ofexposed Precambrian crust variously dis-tributed over approximately 80 shields,belts, blocks, uplifts and sub-cratons onall eight continents (Fig. 2.1, also Fig.1.3, Chapter 1). Africa, South America andNorth America alone account for nearlythree-quarters of all exposed Precambrianrock, with the vast Canadian Shield repre-senting the largest and oldest contiguousarea of this type in the world. The SouthAmerican shield areas, in contrast, consistmainly of younger Precambrian formationsof the middle to late Proterozoic (0.6–1.7Ga). Of all the continents, the SouthAmerican craton is the ‘youngest’. It has theleast amount of rock formed during theArchean eon (>2.5 Ga), representing 16% ofthe exposed Precambrian formations andonly 5% of the total craton (exposed +buried Precambrian rock) (Goodwin, 1996)(Fig. 2.1).
16 D.S. Hammond
Fig. 2.1. The areal extent and relative age of Precambrian formations on the eight continents. Data fromGoodwin (1996).
Are
a (1
03km
2 )
Asia Europe North South Africa India Australia AntarcticaAmerica America
> 2.5 Ga
1.7–2.5 Ga
1.0–1.7 Ga
0.57–1.0 Ga
12,000
10,000
8000
6000
4000
2000
The Guiana Shield
The Guiana Shield accounts for more than50% of the exposed Precambrian surfacearea in South America (Goodwin, 1996)(Fig. 1.2, Chapter 1), nearly 98% of this areaconsisting of rock formed during theProterozoic (2.4 to 0.57 Ga BP). While mostof the major rock formations in the shieldwere being formed and modified duringthis period, relatively few changes weretaking place to the older rock making upother well known Precambrian areas of theworld (Gibbs and Barron, 1993). This makesthe Guiana Shield the largest area ofexposed rock in the world that was formedduring the Proterozoic and of particularinterest to Precambrian geologists. The ageand extent of the main basement complexexposed in the shield should also be, how-ever, of concern to those focused on thebiology, conservation and use of tropicalforests. The geological foundation has beenchanged over the last 570 million yearsthrough uplifting, subsidence, faulting, sea-level change, erosion and substantialweathering. Interacting with climate, theseevolving geological features have stronglyinfluenced the modern-day distribution ofplants, animals and minerals of the GuianaShield through their effects on hydrology,weather, soils and topography.
To understand the relative uniquenessof this geological legacy and the extent of itsimpact on tropical forests, we need to fur-ther resolve the distribution of Precambrianformations across the major tropical forestregions of the planet and more specificallydissect the development of the GuianaShield through time and examine how theresulting features are spatially distributedacross the shield area today.
Comparison with geology of other tropicalforest regions
The global distribution of tropical forestsgenerally is believed to have shifted contin-uously in response to changes in global andregional climate, particularly temperatureand rainfall. Processes that form the under-lying substrate of these regions have played
an equally important role in determiningthe composition, structure, extent and per-sistence of tropical forest cover. The geologi-cal processes and events that shaped thelarge-scale landscapes of modern-day tropi-cal forestlands have arguably been the pri-mary factor responsible for calibrating thelong-standing trajectory of forest evolutionin these regions (see Chapter 7).
The relative importance of differentgeological processes, such as faulting,uplifting, volcanism, sedimentationand erosion, has not remained constantacross all regions. As a result, the GuianaShield has stronger geological affinitieswith some tropical forest regions comparedto others. This is thought to have led, insome instances, to convergence in theobserved attributes of modern-day forestplant species and forest stands as theyrespond to edaphic conditions derivedfrom similar geological foundations (e.g.low pH and high aluminium and ironmobility). Tectonics, the partnering progen-itor of change, along with climate, is a goodplace to start in drawing out these differ-ences.
PLUTONIC VS. VOLCANIC A good primarydichotomy distinguishing the geology oftropical forestlands is based on the relativeimportance of sub-surface, plutonic andabove-surface, volcanic rock-formingprocesses. The dominance of one over theother is largely related to the distance of aforestland area from the perimeter of itsparenting tectonic plate and how rock hasbeen principally formed over time. Thetropical forestlands of South America,west-central Africa, India and Australia arecurrently all centrally located on theirrespective plates and principally reflectancient diastrophic deformation of amainly plutonic Precambrian crust(Goodwin, 1996), while those of CentralAmerica, the Caribbean, the Pacific Islandsand virtually all of South-east Asia arelocated on plate edges/hotspots and areformed primarily through more recent, andmore dynamic, volcanic and sedimentaryprocesses. Inevitably, some overlap existsacross this dichotomy. Many of the promi-
Biophysical Features of the Guiana Shield 17

nent geological formations in the GuianaShield owe their uniqueness to ancient flowof volcanic material (e.g. of the UatumaSupergroup) (Gibbs and Barron, 1993),while Precambrian crust underlies much ofsouthern New Guinea (Drexel et al., 1993).The 2000 km long Grenville Belt, consid-ered part of the Canadian Shield, extendsalong a narrow strip as far south as thePacific selva baja in Mexico’s Oaxaca state(Hoffmann, 1989). The vast majority oftropical forestland in South-east Asia, thePacific Islands, Central America and theCaribbean rests, however, upon a landscapeshaped principally by modern extrusivevolcanic and sedimentary deposition offine-grained rocks and their subsequent gra-dation. Those in eastern South America,west-central Africa, southern India andnorthern Australia share a common founda-tion of coarse-grained plutonic rocks meta-morphosed, often repeatedly, then exposedand reburied, more passively, throughselective gradation, uplifting and subsi-dence.
Volcanic landscapes are typicallyrenewed and reshaped more frequentlythan shield areas and have a shorter, andoften more tumultuous, cycle of gradation.Plutonic landscapes are more rigidly struc-tured, comparably quiescent, are subject toa much longer cycle of gradation, andexposed in modern times to change shapedalmost exclusively by fluvio-deltaic andmarine sedimentation. The consequences ofthese large-scale differences cut down tothe smallest scales. For example, they havesubstantial impacts on the rate, type andspatial scale of gradation, the chemistry ofsoil formation (e.g. feldspar decay prod-ucts) and their subsequent influence onplant–water–nutrient relationships. Furtheraspects of these differences as they arelinked to soil–plant relationships withinthe Guiana Shield are covered in moredetail later (see ‘Main Soils of the GuianaShield’).
EXTENT OF PRECAMBRIAN COVERAGE A seconddichotomy useful in differentiating the geo-logical condition of the Guiana Shield fromother tropical forest regions is based on the
relative contribution of Precambrian crustto the surface area of each craton.Formations in Africa and South Americaaccount for a much greater fraction of thePrecambrian surface – between 2.5 and 10times greater – than in either Australia orIndia (Fig. 2.2). The latter India craton,while formed around a series ofPrecambrian formations, is largely coveredin the north by recent fluvial sediment flow-ing from the Himalayas through the Gangesand Indus Rivers and the marine-derivedDeccan Traps (Naqvi and Rogers, 1987).Southern areas are edged by marinedeposits. The major geological formation ofAustralia is due to folding of Palaeozoicmarine and platform sediments depositedfollowing subsidence in the east-centralregion. The oldest and most exposedPrecambrian formations dominate WesternAustralia’s dry tropical forestlands (Drexelet al., 1993).
EXTENT OF EXPOSURE Africa is closer toSouth America in extent, age and composi-tion of its Precambrian than any other trop-ical continent. This is hardly surprisinggiven their fusion as part of Gondwanaprior to rifting in the late Jurassic. However,the exposed formations account for a muchhigher percentage of the total Precambrianin Africa than in South America. In fact, thefigure is more than twice that of SouthAmerica (Goodwin, 1996), translating intoan additional area of over 10 million squarekilometres. Most of this supports dry forest,scrub and desert, with a much smaller frac-tion covered by tropical moist forests incomparison to South America, where theGuiana Shield accounts for the largestamount (see Chapter 1). The difference inamount of exposed Precambrian basementprovides another useful means of contrast-ing the geology of the Guiana Shield fromother tropical regions. The implicationsof this to tropical forest dynamics atthe cratonic level are discussed further inChapter 7.
PHANEROZOIC COVER Across the SouthAmerican craton, only the Guiana, CentralBrazilian and Atlantic Shields exhibit sig-
18 D.S. Hammond

nificant areas of exposed Precambriancrust. The remaining cratonic area is cov-ered almost entirely by sediments ofPhanerozoic age. The division betweenProterozoic and Phanerozoic cover withinthe South American craton constitutes afourth dichotomy in the geological distinc-tion of the Guiana Shield. The developmentof the Andes along the western and north-
ern rim of the craton created a significantgeosynclinal subsidence between theforming western cordillera and well-estab-lished east-central shield areas (Gibbs andBarron, 1993). While still formed ofPrecambrian crust, this Sub-AndeanForedeep received significant volumes ofsediment during the Phanerozoic throughthe accelerated gradation brought on by the
Biophysical Features of the Guiana Shield 19
More Buried
Guiana ShieldCentral Brazilian Shield
Atlantic Shield
Central Brazilian ShieldAtlantic Shield
Globaltropical forestlands
Mainly PlutonicMainly volcanic
South AmericaAfrica
AustraliaIndia
SE AsiaCentral America
Caribbean
South AmericaAfrica
AustraliaIndia
More PrecambrianLess Precambrian
Africa South America
More exposed
Mostly Proterozoic coverMostly Phanerozoic cover
Sub-Andean ForedeepAmazon Downwarp
Greenstone belts commonGreenstone belts rare
GuianaShield
Fig. 2.2. Distinguishing the Guiana Shield from other tropical geological regions in South America and theworld. Based on information in Goodwin (1996) and Gibbs and Barron (1993).

rise of the Andes (Klammer, 1984;Goodwin, 1996). Rapid deposition onlyserved to promote further subsidence of thetrough and increase sediment aggradationthrough isostasy, resulting in modern sedi-ment depths exceeding several kilometresin some areas. Development of the AmazonDownwarp followed a similar path as sedi-ment was pushed eastward along the newlyformed Amazon River after significantuplifting in the west and eustatic subsi-dence in the east created a major east-to-west incline.
GREENSTONE BELTS The Guiana Shield isthe geological sibling of the CentralBrazilian and Atlantic Shield areas. Theyshare a similar distribution of igneous,metamorphic and sedimentary formations,many of which formed concomitantlyacross a Precambrian West Gondwanansuper-shield that was later bisected by theAmazon Downwarp. One of two main geo-logical features distinguishing the GuianaShield from its southern hemispheric sib-lings is the relative abundance of green-stone belts (roches vertes). The other is thethick, Proterozoic sedimentaries formingthe Guayana Highlands. Greenstone com-plexes cover extensive areas along thenorth-eastern rim of the Guiana Shield,but are scarcely discernible in eitherCentral Brazilian or Atlantic Shield areas(Gibbs and Barron, 1993; Goodwin, 1996).The occurrence of these metamorphosedbasalts is thought to be coincident with theaxis of Atlantic rifting (Gibbs and Barron,1993), a feature that would have been inmuch closer proximity to the easternGuiana Shield than the Central BrazilianShield during the early Cretaceous initia-tion of the rifting process and subject tomore pronounced compression as theAfrican plate rotated counter-clockwise inrelation to South America (e.g. seeRabinowitz and LaBrecque, 1979), givingrise to the South Atlantic first (Pindell andDewey, 1982). The relative abundance ofgreenstone belts is a fifth dichotomy usefulin distinguishing the geology of the GuianaShield from that of other neotropical forest-lands.
Formative events shaping the Guiana Shield
The timeline of geological development inthe Guiana Shield is both long and com-plex. Often sequences linking modern-dayfeatures to specific geological eras, periodsor epochs are tentative, uncertain, or sim-ply unknown to Precambrian geologists.The establishment of the main formativeevents and arrangement here of featuresaccording to their proposed geological ageis principally based on Kalliokoski (1965),Groeneweg and Bosma (1969), McConnelland Williams (1969), Berrangé (1977),RADAMBRASIL (1973–1978), Mendoza(1977), Cordani and de Brito Neves (1982),Teixeira et al. (1989) and in particular,more recent treatments by Gibbs and Barron(1993) and USGS and TM CorporacionVenezolana de Guayana (CVG-TM) (1993).
During the earliest stages, rock forma-tion and deformation were believed toreflect large-scale processes, such asregional metamorphism, that commonlyaffected many of the modern-day continen-tal components of the formerGondwanaland. These were largely associ-ated with the creation, reactivation anddeformation of a crystalline basement com-plex dominated by felsic granulites(remelted and reshaped silica-rich rocks)(Gibbs and Barron, 1993). After the finalbreak-up of the southern supercontinentbegan about 135 million years ago, SouthAmerica was in effect an island continent(Press and Siever, 1982). Processes that ear-lier influenced several modern-day conti-nents collectively, began to increasinglyaffect each independently as the parentcrustal plates carried the other continentsaway from South America, while SouthAmerica itself remained close to its modern-day position (Goldblatt, 1993).
The Guiana Shield became isolatedfrom its sibling shield areas in SouthAmerica as regional uplift of the GuayanaHighlands and later, the Andes, altered thedirection and number of grading bevels(large erosion slopes) across the continent(Gibbs and Barron, 1993). Further faulting,downwarping due to sediment loading andmore localized uplifting continued to alter
20 D.S. Hammond
the type and extent of gradationalprocesses. Later, deposition of sedimentsfrom the Andes, uplifting of the shieldhighlands and continuing sea transgressioninto the surrounding basins, served tochange the topography of the region evenfurther. The consequent modern-day land-scape is diverse and patchy, particularly inthe northwest of the shield (GuayanaHighlands and vicinity).
In an effort to organize the chronologyof geological events shaping SouthAmerica, and more specifically the GuianaShield, geologists have assigned modernformations of similar composition and con-formation to ranked associations. Eachassociation has then been assigned a rela-tive position within a geochronology. Notall of these formations are fully or even par-tially visible (or readily accessible) at thesurface. The extent and conformation ofthese have been more completely assessedthrough drilling and using geophysicaltechniques (e.g. radar, gravity and aeromag-netic) to characterize their lithology (e.g.USGS and CVG-TM, 1993). Analysing therelative abundance of different (non)radioactive isotopes in rock samples hasbeen used to establish a position for eachassociation within the geochronology.Where rocks have been seen as a complexproduct of many different events occurringat different points in time, it often has notbeen possible to assign a reliable date(Gibbs and Barron, 1993). At the same time,the accuracy and precision of an isotopicdate, like that of many other techniques forreconstructing palaeohistories, diminisheswith antiquity, often leading to reportedconfidence intervals attached to Pre-cambrian dates greater than the entireCenozoic (70 million years) (see radioiso-topic dates presented in Gibbs and Barron(1993)). This fact has prevented geologistsfrom establishing a pinpointed cause-and-effect chronosequence for rock productssince the calculated age intervals of consec-utive events often will overlap. Uncon-formity in the stratification of rocks can fur-ther complicate the development of adetailed chronology of events. This leads tooverlap in the assignment of formative
events in the geology of the Guiana Shield.Table 2.1 presents a chronosequence of themajor geological associations recognized forthe Guiana Shield and the names given tothese in each of the six countries within theshield region.
TECTONIC PROCESSES These processesinclude diastrophic activities that deformthe surface through folding, twisting, warp-ing, shearing or compressing rock and vol-canic activities that lead to the distributionof heated magma as lava or pyroclasticsfrom volcanoes and fissures (rifts).Diastrophic events, leading to rock meta-morphism and reactivation (remelting),have affected nearly all geological forma-tions in the Guiana Shield (the RoraimaSupergroup/Avanavero Suite complex andMesozoic sediments being the exceptions).Volcanic events have had a more punctu-ated influence on the shield landscape as aconsequence of these larger diastrophicevents. Greenstone belts, the swarms of‘younger’ dykes and sills, the UatumaSupergroup volcanics and the Apoteri Suiteunderlying the main Takutu Graben Fillhave all developed through volcanic ejec-tion emanating from tensional forces fissur-ing the surrounding rock.
The main diastrophic episodes knownor expected to have played a prominent rolein shaping the modern geological landscapeof the Guiana Shield include the followingtentative assignments and dates based oncorrelation of a number of different sourceslisted with each episode – they are not allconsidered definitive. Their occurrence rel-ative to other selected geological and clima-tological events shaping South America canbe seen in Fig. 2.3.
1. Proto-Shield Period (>3.4 Ga BP) (also‘Old Crystalline Basement’ (Berrangé,1977), Proto-Imataca (Montgomery, 1979)).Submarine formation of early planetarycrust and Imataca protolith.2. Imataca Episode (3.4–2.7 Ga BP) (alsoreferred to as the Gurian Orogenesis (Huber,1995a)). Submarine formation of Imatacagranulites and gneisses, intermixed withmanganese-rich metasediments iron forma-
Biophysical Features of the Guiana Shield 21
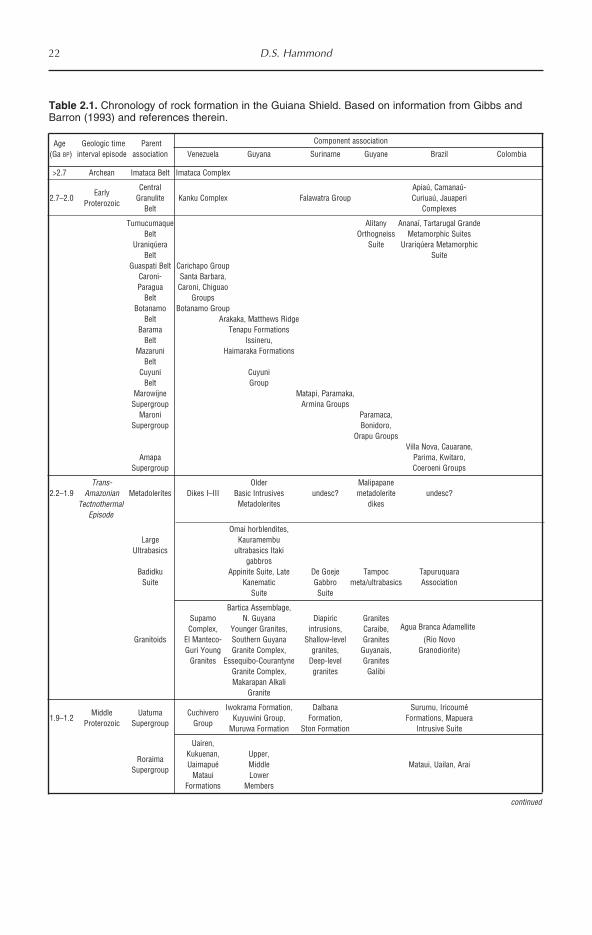
22 D.S. Hammond
Age Geologic time Parent Component association
(Ga BP) interval episode association Venezuela Guyana Suriname Guyane Brazil Colombia
>2.7 Archean Imataca Belt Imataca Complex
EarlyCentral Apiaú, Camanaú-
2.7–2.0Proterozoic
Granulite Kanku Complex Falawatra Group Curiuaú, JauaperiBelt Complexes
Tumucumaque Alitany Ananaí, Tartarugal GrandeBelt Orthogneiss Metamorphic Suites
Uraniqúera Suite Urariqúera MetamorphicBelt Suite
Guaspati Belt Carichapo GroupCaroni- Santa Barbara,Paragua Caroni, Chiguao
Belt GroupsBotanamo Botanamo Group
Belt Arakaka, Matthews RidgeBarama Tenapu Formations
Belt Issineru,Mazaruni Haimaraka Formations
BeltCuyuni Cuyuni
Belt GroupMarowijne Matapi, Paramaka,
Supergroup Armina GroupsMaroni Paramaca,
Supergroup Bonidoro,Orapu Groups
Villa Nova, Cauarane,Amapa Parima, Kwitaro,
Supergroup Coeroeni Groups
Trans- Older Malipapane2.2–1.9 Amazonian Metadolerites Dikes I–III Basic Intrusives undesc? metadolerite undesc?
Tectonothermal Metadolerites dikesEpisode
Omai horblendites,Large Kauramembu
Ultrabasics ultrabasics Itakigabbros
Badidku Appinite Suite, Late De Goeje Tampoc TapuruquaraSuite Kanematic Gabbro meta/ultrabasics Association
Suite Suite
Bartica Assemblage,Supamo N. Guyana Diapiric GranitesComplex, Younger Granites, intrusions, Caraibe, Aqua Branca Adamellite
Granitoids El Manteco- Southern Guyana Shallow-level Granites (Rio NovoGuri Young Granite Complex, granites, Guyanais, Granodiorite)
Granites Essequibo-Courantyne Deep-level GranitesGranite Complex, granites GalibiMakarapan Alkali
Granite
Middle Uatuma CuchiveroIwokrama Formation, Dalbana Surumu, Iricoumé
1.9–1.2Proterozoic Supergroup Group
Kuyuwini Group, Formation, Formations, MapueraMuruwa Formation Ston Formation Intrusive Suite
Uairen,
RoraimaKukuenan, Upper,
SupergroupUaimapué Middle Mataui, Uailan, Arai
Mataui LowerFormations Members
Table 2.1. Chronology of rock formation in the Guiana Shield. Based on information from Gibbs andBarron (1993) and references therein.
continued
TectnothermalEpisode
Agua Branca Adamellite
continued

Biophysical Features of the Guiana Shield 23
Table 2.1. continued.
Age Geologic Time Parent Component association
(Ga BP) interval/episode association Venezuela Guyana Suriname Guyane Brazil Colombia
Tepequém, Urutanim,Quasi- Uafaranda, Surucucu, Rio
1.9–1.2Middle Roraima Sipapo Block, Makan Tafelberg, Emma Novo, Araca, Neblina
Proterozoic Mesas Cerro Paru Mountain Range Padre Massif, UrupiMassif, Uneuixi
Avanavero Cano Roja, Tumutamari Pedra Preta, Arai,Suites Meseta de Boro Dike, Ebini Sill, Avanavero, Bakhuis Uaicas, Quarente
(Roraima Sipapo, Duida, Kopinang Sill, Dikesundesc.
Islas, PixilingaIntrusives) Paru dikes Waracabra Norite Sill Sills
La Pedrera,Vaupés/Tunhuí Cineruco Tunuí, Caparro Piraparana,
Supergroup Group Groups Guainia,Naquém Groups
Post-Roraima Surucucus, AbonariParguaza
Parguazaacid intrusives Intrusive Suites, Paraguaza, Mitú
Granites (Amatuk Dike, Madeira, Aqua ComplexKanaima Felsites) Boa Plutons
AlkaliCatrimani, Apiau syenites
IntrusivesCerro Impacto Muri Mountain Mutum Mt., Seis Lagos, Mapari,
Maraconai Maicuru, Apupariu
1.3–1.2Nickerie Mylonitized Orinoquean
Kmudku Episode Nickerian Episode Jari-Falsino EpisodeEpisode faults Event
1.2–0.57 Late Cachoeira Seringa SuiteProterozoic Seca Suite
0.57–0.22 Palaeozoic PAPA Dikes southern Roraima swarmsGuyana swarms
Margin Hato Viejo Prosperança, Trombetas (west) AraracuaraSediments Formation Formations Formation
Apatoe Dike southern western0.22–0.07 Mesozoic Suite (Basic Guyana Suriname Roraima swarms
Dike Suite) swarms swarms
Takutu, Rupununi,Rewa Group Pirara, Manari Forma- undesc.
tions, Apoteri Suite
AmazonMargin Alter de Chão
Sediment
Stabroek, Potoco,Guyana Canje, NewBasin Amsterdam Formations
0.07–0.53Cenozoic Georgetown Onverdacht
(Palaeocene) Formation Formation
Coastal0.053–0.07 Eocene Sedimentary Pomeroon Formation
Plains
0.037–0.26 Oligocene Bauxite Hiatus Bauxite Hiatus Bauxite Hiatus
0.026–0.07 Miocene Courentyne Courentyne Para Group (Piraracu,Formation Formation Solimoes Formations)
0.007–0.002PlioceneMesa Berbice Coeswijne
Barreira Formation Pebas FormationFormation Formation Formation
North Rupununi0.002–
PleistoceneSavannas Zanderij
Sables BlancsIça, Boa Vista
0.0001 Formation, Formation FormationsBerbice Formation
River silts Demerara Formation, Coropina Coastal, River Coastal, River River silts
<0.0001Recent and River silts Formation, River silts silts and and
clays and clays silts and clays and clays clays clays
MakariMountain
Parguaza, MitúComplex
Catrimani, Apiau syenites,Mutum Mt., Seis Lagos, Mapari,Maraconai, Maicuru, Apupariu
0.07-0.053
0.053-0.037
0.037-0.026
0.026-0.007
Vaupés/TunuíSupergroup

24 D.S. Hammond
tions, dolomites and anorthosites.Subsequently reactivated and metamor-phosed.3. Pre-Transamazonian Orogenesis (2.6–2.1Ga BP) (Mendoza, 1977; Huber, 1995a; alsoreferred to as the Early Proterozoic Arc
stage (Gibbs and Barron, 1993)). Submarineformation of Kanuku, Bakhuis granulitesand Falawtra gneisses of the CentralGranulite Belt and the Tumucumaque gran-ulites and orthogneisses. Widespreadgreenstone (metamorphosed basalts) belts
4600Million years ago
Hadean4000
2000
3000
1000
Coastal Clays
600
200
300
100
50
10 Cen
ozo
ic
Caribbean Plate initiation
Mid-Atlantic ridge initiation
Andean Orogeny
TATE
Nickerie
Episode
Kanuku/Bakhuis Mts
Tumucumaque (Tumuc Humac) Mts
Pakaraima Mts, Tafelberg, Makari Mt.
Serrania de Imataca
Sierra de Maigualida
Imataca Complex
Granite-Greenstone Belts
Central Guiana Granulite Belt
Berbice /Zanderij /Boa Vista
Sands Formation
Roraima Group (Pantepui),
Avanavero Suite,
Uatuma-Paraguaza Granites
Piraparana Volcanics, Alkaline Complexes
Mylonite Belts
Coastal Plain Bauxites
Oscillating Sea Transgression/
Regression Phases
Takutu Graben
Apoteri Volcanic Lavas
North Rupununi
sediment cover
South Rupununi sediment cover
Rupununi shallow marine lagoons
Isthmus of
Panama formed
Caribbean island arc formed
Pangea break-up initiated
Te
rtiary
Eastward flow of
Amazon River begins
Cre
tac
eo
us
Me
so
zo
ic
Ju
ras
sic
Pa
leo
zo
ic
Amazon Downwarp initiated
Pro
tero
zo
ic
Alg
on
kia
n
P r e
c a
m b
r i a n A
rch
aea
n
Azo
ic
Fig. 2.3. Selected tectonic and gradational events shaping the geological cycle of the Guiana Shield.Selected South American, Guiana Shield and formation-specific events are aligned to the left, centre andright, respectively. Prominent events are in bold. TATE=Trans-Amazonian Tectonothermal Episode.

produced by considerable folding of earlyvolcanic and sedimentary rocks formedprior to continental crust. Their modern NEalignment is attributed to the later mid-Atlantic rifting. Formation of non-green-stone supracrustals of the Kwitaro Groupand Parima Suite, among others.4. Trans-Amazonian TectonothermalEpisode (TATE) (2.4–2.1 to 2.0–1.7 Ga BP)(also referred to as Trans-AmazonianOrogenic Cycle, Akawaian Episode(Berrangé, 1977), Trans-Amazonian Oro-genesis (Mendoza, 1977; Huber, 1995a)).The most important event affecting nearlyall of the South American proto-craton.Submarine formation of feldspar-rich grani-toids that today account for most of thewidely distributed crystalline basementexposed, most notably, in southern Guyanaand Venezuela and over most of Suriname,French Guiana (Granites Caraibe andGuyanais), Amapá and North Pará. Thoughtto have created an early island arc, notunlike the Caribbean of today (Gibbs andBarron, 1993) that was later in-filled anduplifted.5. Uatuma Episode. The main volcanicevent to affect the modern shield landscapeoccurred after the TATE during the MiddleProterozoic (1.9–1.7 Ga BP) and consistentin timing with the western Parguazaepisode. The development of the UatumaSupergroup of acid to intermediate vol-canics and subvolcanic intrusives precededthe later depositional episode forming theRoraima Supergroup (Fig. 2.3). Acid (silica-rich) rocks formed during this period aresandwiched between an underlying base-ment of granites and gneisses and overlyingsedimentary cover associated with theRoraima Group and more recent deposition(Gibbs and Barron, 1993).6. Parguaza Tectonothermal Episode(1.9?–1.5 Ga BP). Correlated with thehypothesized Rio Negro-Juruena Episode(Tassinari (1984), cited in Gibbs and Barron(1993). Also referred to as the ParguazaEvent (Priem et al., 1982)). An uncertainsubmarine event believed to have led to theformation of the Mitú complex and, impor-tantly, the formation of NW–SE rift valleysembracing the Parguaza granitic batholith
along the upper Rio Negro and AtabapoRivers in western Venezuela/Colombia andalong the Guaniamo and upper VentuariRivers.7. Nickerian Episode (1.3–1.1 Ga BP) (corre-lated with the Orinoquean Event(Venezuelan Guayana), the KmudkuEpisode (south Guyana), Jari-FalsionEpisode (Amapá) (see Gibbs and Barron,1993)). Also referred to as the NickerianCompressional Episode and OrinocanOrogenesis (Mendoza, 1977; Huber, 1995a).Another important episode leading to cra-tonic formation by shearing and in-filling ofblock-fault fractures through mechanicaltransport of angular fragments of sedimen-tary rock and subsequent lithification ofthese deposits through fault movement(mylonite formation).8. Dolerite dyke intrusion (0.49–0.14 Ga BP)(Basic dyke suite (Berrangé, 1977), Apatoedyke suite (Gibbs and Barron, 1993)). Aseries of silica-poor dyke suites intrudedupon the surrounding metamorphosedrocks throughout much of the shield areaduring the Palaeozoic and Mesozoic eras asa consequence of localized tensile fracturingof the surrounding rock due perhaps to east-ern plate boundary initiation (Caribbean)and ocean-floor spreading (Mid-Atlantic). Insouthern Guyana, these long, sinuous struc-tures can run 50+ km and consist mainly ofcalcium, magnesium and iron amphibolites,pyroxenes and olivines (Berrangé, 1977).The last of the main tectonic episodes toinfluence the modern-day landscape of theGuiana Shield.
GRADATIONAL PROCESSES These processesinclude degradation through mechanicaland chemical weathering and erosion aswell as aggradation through the lithificationof sediments deposited by marine, fluvial orAeolian (wind) action. In many instances,the resulting sedimentary rock deposits restunconformably atop other strata.
1. Roraima Episode (1.7–1.6 Ga BP). Theprincipal sedimentary event shaping theGuiana Shield. The widespread depositionof sediment in the uplifted back-arc basin,further uplifting and block-faulting, and
Biophysical Features of the Guiana Shield 25

subsequent weathering and erosion of theRoraima Group consolidated the region as acratonic feature and created the GuayanaPantepui and Pakaraima Mountains (Fig.2.3).2. Takutu Episode (0.18–0.13 Ga BP). TheRewa Group forms a series of littoral mud-stone, siltstone, shale and sandstonedeposits distributed across the NorthRupununi Savannas and parts of Roraimastate, Brazil (Fig. 2.3). They are thought tobe derived from the volcanic and subvol-canics of the Iwokrama Formation, adjacentto the Takutu Graben (Berrangé, 1977) andlying unconformably beneath more recentlaterite platforms (Nappi LateriteFormation).3. ‘Courentyne Episode’ (<0.10 Ga BP) (afterCourentyne Group (Berrangé, 1977)). Whilenot an episode recognized per se by shieldgeologists, the series of (mainly) sedimen-tary events dominating the past 100 millionyears have without doubt substantivelyaltered the landscape of the region. In time,as plate movements continue, it is likelythat this run of sedimentation will beeclipsed by other more formative tectonicupheavals, compartmentalizing the lateMesozoic/Cenozoic as an episode. For-mations identified along the Atlantic coast,in the Takutu Graben, on the northern rimof the Amazon River, and along the RioBranco and Rio Orinoco show concordancein relation to depositional dynamics,though not perhaps sediment provenance.The series of depositional cycles over theperiod were strongly linked to the rise andfall of sea level concomitant with changesin climate (glaciation) and the effects thatinland sea advance had on eustatic subsi-dence, and with sea retreat, uplifting of theforeshore basins. Marine ingress alonglower rivers and floodplains has mixedwith and been reworked by more recentriver transport to create the modern-daysand and silt plateaus common throughoutmany parts of the Guiana Shield.Sedimentation shaped the surface alongerosion bevels formed by the combinationof erosion and depositional forces andstructural changes in the planation surface(e.g. faulting, subsidence and uplifting).
The uplift of the Andes during the Tertiaryrepresents the most significant of thesestructural changes affecting sedimentation.
Prominent geological regions of the GuianaShield
Rock associations in the Guiana Shieldhave generally been referred to as super-groups, groups, complexes, belts, suitesand/or formations. Akin to the relationshipbetween plants and taxonomists, theseassociations have been periodically dis-membered, regrouped, promoted and rele-gated by shield geologists as new evidence,or (re-)interpretation of existing evidence,leading to new proposals (Gibbs andBarron, 1993). Typically, supergroups arecomposed of groups or complexes (depend-ing on degree of conformation) and these, inturn, of formations, each designating acloser lithological association. Belts are for-mations of conformable lithology that nor-mally distribute anisotropically and areprincipally formed of granulite or green-stone (roches vertes) in the shield, typicalproducts of large-scale regional metamor-phism. The Guiana Shield has been frac-tured into tentative geological provinces,based on a number of distinguishing fea-tures (e.g. age, metamorphic grade, expo-sure) and major rock associations present ineach sector of the region and described byvarious geologists (Mendoza, 1980; Cordaniand de Brito Neves, 1982; Gibbs andBarron, 1993) (Fig. 2.4). All the provincesrest upon a basement of crystalline rock,but subsequent metamorphism, sedimenta-tion, volcanism and mylonitization havealtered the superficial layers extensively.Provinces can be described according to thepredominant source of these layers and themain rock associations found within eachcontiguous area (see Fig. 2.4 for distributionof rock associations).
MAINLY METAMORPHOSED CRYSTALLINE AND
METAVOLCANIC ROCKS (GRANULITES, GRANITOIDS,GRANITES, GREENSCHISTS) These are the old-est rocks in the shield. They can be foundpredominantly in five areas, consistentwith five of seven geological provinces con-
26 D.S. Hammond
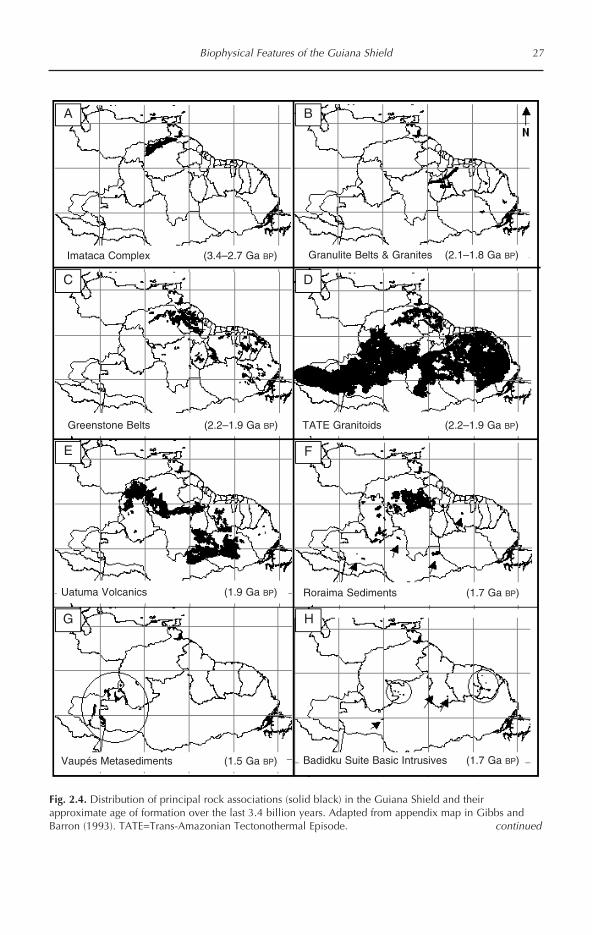
Biophysical Features of the Guiana Shield 27
Fig. 2.4. Distribution of principal rock associations (solid black) in the Guiana Shield and theirapproximate age of formation over the last 3.4 billion years. Adapted from appendix map in Gibbs andBarron (1993). TATE=Trans-Amazonian Tectonothermal Episode. continued
A
DC
F
HG
E
B
Imataca Complex (3.4–2.7 Ga BP) Granulite Belts & Granites (2.1–1.8 Ga BP)
Greenstone Belts (2.2–1.9 Ga BP) TATE Granitoids (2.2–1.9 Ga BP)
Uatuma Volcanics (1.9 Ga BP)
Vaupés Metasediments (1.5 Ga BP) Badidku Suite Basic Intrusives (1.7 Ga BP)
Roraima Sediments (1.7 Ga BP)
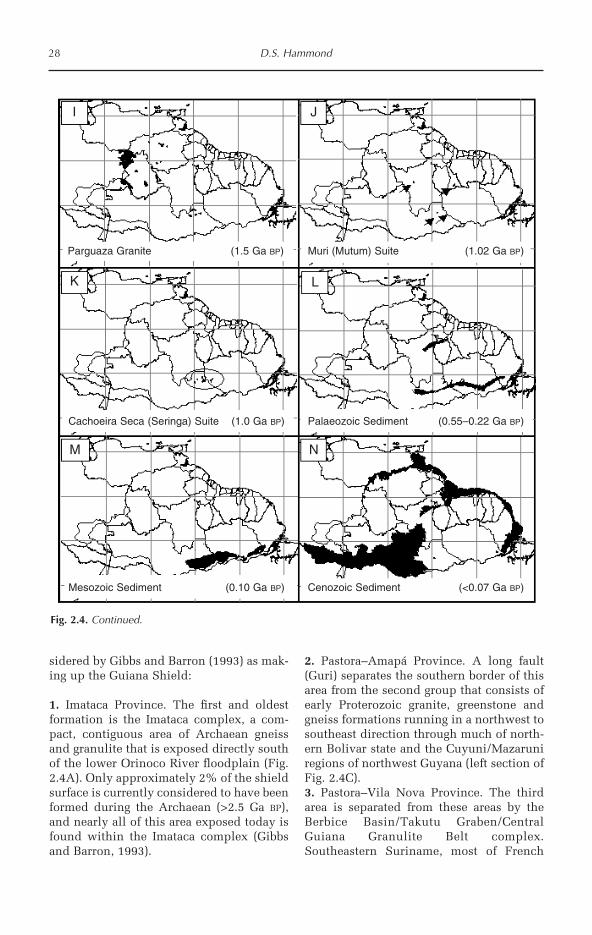
28 D.S. Hammond
sidered by Gibbs and Barron (1993) as mak-ing up the Guiana Shield:
1. Imataca Province. The first and oldestformation is the Imataca complex, a com-pact, contiguous area of Archaean gneissand granulite that is exposed directly southof the lower Orinoco River floodplain (Fig.2.4A). Only approximately 2% of the shieldsurface is currently considered to have beenformed during the Archaean (>2.5 Ga BP),and nearly all of this area exposed today isfound within the Imataca complex (Gibbsand Barron, 1993).
2. Pastora–Amapá Province. A long fault(Guri) separates the southern border of thisarea from the second group that consists ofearly Proterozoic granite, greenstone andgneiss formations running in a northwest tosoutheast direction through much of north-ern Bolivar state and the Cuyuni/Mazaruniregions of northwest Guyana (left section ofFig. 2.4C).3. Pastora–Vila Nova Province. The thirdarea is separated from these areas by theBerbice Basin/Takutu Graben/CentralGuiana Granulite Belt complex.Southeastern Suriname, most of French
Fig. 2.4. Continued.
I
NM
K L
J
Parguaza Granite (1.5 Ga BP)
Cachoeira Seca (Seringa) Suite (1.0 Ga BP) Palaeozoic Sediment (0.55–0.22 Ga BP)
Mesozoic Sediment (0.10 Ga BP) Cenozoic Sediment (<0.07 Ga BP)
Muri (Mutum) Suite (1.02 Ga BP)

Guiana and northern parts of Amapá andPará states in Brazil are covered by plutonicgranites dissected by metamorphosedgreenstones that formed from submarinevolcanic activity along fracture seams asthese were opened up as a consequence ofregional tectonic stresses (cluster on right ofFig. 2.4C).4. Western side – east section ofRoraima–Uatuma Province. The fourth areaof exposed early Precambrian rock islocated in eastern Roraima and northwest-ern Pará. It consists of central Guianangranulites and early Proterozoic granite andgneiss interspersed with the middleProterozoic volcanics, granites andmetasediments that make up the Wassarai,Kamoa and Acarai mountains along thesouthern border of Guyana and highlandsfurther south along the eastern border ofRoraima and Amazonas states with Pará(Fig. 2.4C, D, E).5. Western side – west section ofRoraima–Uatuma Province and northVaupés–Parguaza Province. The fifth area isfound in the Territorio Federal Amazonasof Venezuela, Roraima and Amazonasstates in Brazil and Vaupés state inColombia and covers much of the westernGran Sabana, upper Orinoco and upper RioNegro basins. This area is dominated byexposed granitoids associated with theTrans-Amazonian Tectonothermal Episode,the massive Parguaza granite batholith sur-rounding Puerto Ayacucho upstream fromthe Meta-Orinoco confluence and localizedsedimentary cover (Fig. 2.4D, E). Furthersouth these formations are increasinglycovered by Phanerozoic platform sedimentsdeposited as water flow direction and vol-ume within the Amazon Basin varied witheustatic and orogenic activity over the last570 million years.
MAINLY ACID VOLCANICS, SUBVOLCANICS AND ALKALI
BASALTS These rocks originate from vol-canic and subsequent plutonic activity dur-ing the Middle Proterozoic. Volcanic rocksare principally of extrusive, feldspar-richrhyodacites formed in pyroclastic, lava andash flows exposed along rivers (Berrangé,1977; Gibbs and Barron, 1993).
Subvolcanics are largely plagioclase-biotite-rich, granitic intrusives forminguplands. The small exposure of akalibasalts in the south (Cachoeira Seca suite)is localized. Exposed formations can befound in two of Gibbs’ seven provinces,located along a central northwest to south-east axis. Kloosterman (1973) suggestedthat these centrally located deposits are theremnants of three supercalderas (large vol-canoes).
1. Eastern side – east section ofRoraima–Uatuma Province. The first arearuns from a southern buried margin run-ning parallel to the Amazon River fromManaus to Obidos northward into south-west Guyana and Suriname.
Highly metamorphosed and weatheredvolcanics of the Uatuma Supergroup, form-ing in part the Kuyuwini and Burro-Burrogroups, are exposed along the northern rimof the Kanuku Graben in central Guyana(Iwokrama Formation) and in the south ofGuyana along the Brazil border (Berrangé,1977). They extend into southwestSuriname along the Zuid River and upperOrenoque Rivers through to the DalibanaCreek area (Fig. 2.4E).
Subvolcanic intrusives of metamor-phosed granitics form a number of impor-tant highlands in southern Guyana,including the Kamoa, Amuku, Acarai andWassarai Mountains (Berrangé, 1977).Volcanic materials also contribute to theirformation to varying degrees. TheWilhelmina Massif of south-centralSuriname is principally formed from meta-morphosed quartz porphyries, rhyolitepumice and rhyodacites with subvolcanicgranitoid intrusives (Verhofstad, 1971;Gibbs and Barron, 1993).2. Central strip – west section ofRoraima–Uatuma Province. The secondarea runs westward from the MakariMountain in the upper Berbice of Guyana,through the Siparuni area and southernPakaraimas along the southern rim of themain Roraima Group forming the tepui ofthe Guayana Highlands. The Uatuma Groupin fact runs beneath nearly the entireRoraima sedimentary group (Gibbs and
Biophysical Features of the Guiana Shield 29

Barron, 1993). This area of Proterozoic vol-canic and subvolcanic formations contin-ues westward between the Ventauri andlower Caura Rivers, terminating at the east-ern margin of the Orinoco (Fig. 2.4E). Theyconsist mainly of metamorphosed tuffa-ceous lavas, pumice and ignimbrites (lithi-fied volcanic ash and breccia). Highlandcentres forming the Sierra Maigualida,Sierra de Guampi and Sierra Guanay rangesare granitic intrusives formed from theSanta Rosalia and San Pedro batholiths.
MAINLY SEDIMENTARY While recognizingthat sediments are continuously eroded anddeposited through both mechanical andchemical action, the main sedimentary for-mations seen today in the Guiana Shieldcan be attributed to three main gradationphases (adapted from Gibbs and Barron,1993): (i) submarine sedimentary episodesfollowing Archaen/Early Proterozoiccrustal formation that were subsequentlymetamorphosed and degraded, often lead-ing to unconformity with early, mainlymetamorphosed, igneous rock (e.g. Kwitaro,Parima Groups); (ii) wide-ranging and deep(900+ m) sediments deposited as epiconti-nental (shallow marine), fluviodeltaic andAeolian strata during the MiddleProterozoic and subsequently lightly meta-morphosed and degraded (RoraimaSupergroup and Quasi-Roraima formations,Vaupés Supergroup); (iii) extensivePhanerozoic sedimentary episodes associ-ated with climate-induced changes in sealevel, uplifting, subsidence, faulting andmountain-building (see Table 2.1).Significant sedimentary formations can befound in three provinces delimited byGibbs and Barron (1993). Localized andoften not insignificant formations can befound, however, throughout the GuianaShield interspersed with metamorphosedvolcanic, subvolcanic and plutonic groups.
1. Eastern side – west section ofRoraima–Uatuma Province. The remnantsof the massive Roraima Group cover sedi-ments are found mainly in central Bolivarstate and form the Serra Pacaraima thatextends eastward into central Guyana and
southward into northern Roraima state inBrazil (Fig. 2.4F). The little-metamorphoseddeposits of the Roraima formation uncon-formably overlie the volcanics of theUatuma Supergroup and are highly interca-lated with intrusive, silica-poor doleriteand gabbro dykes, sills and sheets of theAvanavero Suite (Gibbs and Barron, 1993).These are most visible as rounded hills andridges between sedimentary tepui table-lands and in the Gran Sabana of Venezuela,but are most commonly exposed among theyounger Roraima deposits in Guyana’sPakaraima Mountains.
The Roraima Supergroup includesmany notable flat-topped peaks (mesas, cer-ros, tepuis) and compacted highland (mas-sif) areas within the northern shield area,including Mount Roraima (at the junctionwith Guyana and Brazil), Kukenán(Kukenaam), Los Testigos massif, Jaua mas-sif, Auyán massif and Chimantá massif,among others in Venezuela (see Huber,1995a). Merumé, Ayanganna, Kurungiku,Wokomung, Ayanguik are prominent com-ponents of the Roraima in Guyana, andSerra Telequén on the Brazil side of thefrontier with Venezuela.
Members of the Quasi-RoraimaFormation (after Gibbs and Barron, 1993)are distinct table top massifs that form anarchipelago of outlying, isolated peaks(arrows in Fig. 2.4F). It has been suggestedthat these were connected with the mainRoraima group in a single sedimentarycover with a size eightfold that of its currentsurface area (Gansser, 1954). Subsequentselective degradation of weaker substrateelements over the past 1.6 billion years hasleft the remaining highland areas frag-mented. Notable among these outlyingpeaks and massifs is the Makari Mountainabove Canister Falls in Guyana, theTafelberg and Emma Range in east-centralSuriname, the Urupi Massif in the north-eastern corner of Amazonas state, Brazil,Serra Araca (Jauri), Padre and Pico deNeblina (transnational) near theVenezuelan frontier, and Uneuxi betweenthe Negro and Japurá Rivers. In Venezuela,a series of outlying massifs extend in anorth–south alignment near the Casiquiare
30 D.S. Hammond

rift valley in Amazonas state. These includefrom north to south, Yutajé massif, Parúmassif, the Jaua massif, the Duida-Marahuaka massif and the Neblina-Aracamuni massif (again see Huber, 1995a).2. Southwestern Vaupés–Parguaza Pro-vince. This area is covered by metamor-phosed sediment ridges of the MiddleProterozoic Vaupés (Tunui) Supergroupand much younger, largely unconsolidatedsheet sediments of Tertiary/Quaternary age(Mariñame and Pebas formations) (Gibbsand Barron, 1993).
The Vaupés formations extend betweenthe Vaupés and Caquetá Rivers in easternColombia and along the upper Rio Negro(Guainia) in the vicinity of the Casiquiare.These quartz-rich structures are thought tohave originated in an epicontinental envir-onment, having been deposited uncon-formably upon a metamorphosed basementcomplex of gneiss reactivated during theParguazan Tectonothermal Episode,approx. 1.5 Ga BP (Priem et al., 1982). Thenorthern group runs parallel to the pro-posed Casiquiare rift valley that struc-turally separates the upper reaches of theNegro and Orinoco Rivers (Fig. 2.4G).3. Atlantic coast section of Berbice–BoaVista Province. The Berbice Basin spreadsfan-like towards the Atlantic coast betweenthe Essequibo (Guyana) and Maroni(Suriname/Guyana) Rivers from a narrow-ing inland reach extending as far south asthe upper Berbice River (upper band of Fig.2.4N). Bouger gravity measurements indi-cate deep bedded sediments and a signifi-cant dip that extends southwestwardtowards the Takutu Graben – an area ofcrustal downwarping that has led to subsi-dence and block faulting along its margins.Subsidence is inclined towards theAtlantic. The combination of continuedsubsidence, periodic uplifting, oscillatingsea-level change and river action, particu-larly during the Tertiary/Quaternaryperiod, created a sequence of depositionalenvironments centred on a Berbice–Courentyne Rivers axis that led to deep lay-ering of white, quartzite sands atop kaolinsand other chemically weathered products(such as bauxite) of the underlying base-
ment complex. Bauxite and kaolin depositsformed through the chemical weathering offeldspar-rich basement complex rocks priorto sedimentation and are thought to tracethe former coastline during theEocene/Oligocene period, 25–35 millionyears ago (Van der Hammen and Wymstra,1964). The initial deposits (Stabroek,Onverdacht, Nickerie Formations) of con-glomeratic sandstones, siltstones and shaleswere deposited in the upper Aptian epoch(late Cretaceous), around 90 million yearsago and were followed by limestones,shales and carbonates (Canje, NewAmsterdam, Georgetown and PomeroonFormations) through to the mid-Miocene(18 Ga BP) (Gibbs and Barron, 1993).Subsequent depositional phases during thePlio-Pleistocene (the Courentyne, Berbice,Coeswijne, Zanderij Formations) consistedprincipally of the quartzite white sands. Upuntil the Pleistocene, these sediments weredeposited in a marine environment. Localuplifting during the Pleistocene tilted theAtlantic edge of the basin upward andbrought the white sand formation above sealevel. These sediments attain a depth ofmore than 2000 m near the mouth of theCourentyne River and are largely responsi-ble for the capture and inclusion of organicmaterial offshore that has subsequently ledto the formation of commercially attractiveoil deposits (Bleakley, 1957; Van derHammen and Wymstra, 1964). Upliftingcreated a new erosion bevel along theAtlantic coast as fluvial action reworkedearlier submarine deposits. Unconformabledeposition of silts and clays along theuplifted basin shore (Demerara andCoropina Formations) has occurred duringthe Quaternary, yielding the coastal striphistorically underpinning cash-crop culti-vation in Guyana and Suriname (seeChapter 8).4. Central Takutu Graben section ofBerbice–Boa Vista Province. The inlandconnection with the downwarping BerbiceBasin runs southwestward for 300 km fromthe upper Berbice through to the Rio Brancosouth of Boa Vista as a 30–50 km widegraben, or rift valley, created through ten-sional block faulting in the late
Biophysical Features of the Guiana Shield 31
Jurassic–early Cretaceous. The RupununiSavanna north of the Kanuku Mountainsand south of the Pakaraimas is principally aproduct of this development and the subse-quent in-filling (Manari, Pirara, Rupununi,Takutu Formations) and lithification undershallow marine conditions produced aseries of shales, siltstones, sandstones andcarbonates to a depth of up to 7 km(Berrangé, 1977; Crawford et al., 1984).These rest atop lavas of the ApoteriFormation that run along the eastern mar-gin of the graben and surface in the north toform the Toucan Hills. Fluviatile andAeolian deposits of silt and sand accumu-lating since the late Miocene (12 millionyears BP) constitute the main surface struc-ture (North Savanna Formation) down to adepth of approx. 25 m (Crawford et al.,1984) (upper band in Fig. 2.4L).5. Southwestern section of Berbice–BoaVista Province. The southwestern end ofthe Cenozoic sediment filling the down-warp-graben structure bisecting the GuianaShield (Fig. 2.4N). Running southwardalong the Rio Branco from Caracarai, themainly quartzite sand cover is the productof sea transgressions backing up theAmazon River during the Plio-Pleistoceneand later, uplifting and subsequent fluvialaction of the Rio Branco and Rio Negro (butfor alternative origin of recent sediments,see Leenheer and Santos (1980)). Referredto as the Iça Formation, it gradates in thesouth with the older Pirarucu and SolimõesFormations of the Miocene–Holocene ParáGroup and the younger top sediments dis-tributed in relation to the alternatingQuaternary glacial and inter-glacial peri-ods.
Rock chemistry of principal formations
The main geological formations recognizedby shield geologists have been formedthrough a sequence of oscillating intrusiveand extrusive events consistent with themain tectonothermal episodes. This isreflected in the chemistry of the variousrock types that make up each formation.Molecular oxides, the building blocks ofrock, are found throughout the Earth’s
crust. They combine to characterize themain minerals that are then mixed under awide range of temperature and pressureconditions to form rock types. Rock typessubjected to similar development anddeformation at the same or similar time arefound in each formation. The chemicalcomposition of non-sedimentary rocks fallsinto two main categories that are groupedvariously into the geological regionsdescribed above. Felsic rocks in the GuianaShield contain a very high relative abun-dance of silica dioxide (SiO2) compared toits overall crustal abundance and relativelylow contributions from the other mainoxides of iron (Fe), magnesium (Mg), cal-cium (Ca), potassium (K) and sodium (Na)(see Fig. 2.5 – groups with grey columns).Mafic and ultra-mafic rock types are, in con-trast, highly deficient in SiO2 compared toits overall crustal abundance. These rocksform under much higher temperature andpressure conditions that accompany subter-ranean intrusion into subsurface fracturesin the surrounding country rock. They typ-ically contain elevated contributions fromminerals that readily precipitate (harden)first at higher temperatures, such as MgOand CaO, and depending on the type ofintrusion, K2O, Na2O, FeO and Al2O3 (Fig.2.5 – groups with black columns). Theseminerals then consolidate first, leaving thesiliceous materials to solidify when temper-atures finally drop below their much lowermelting point. A third rock group consistsentirely of lithified and unlithified sedi-mentary deposits, but these are formed ini-tially through surficial weatheringprocesses. The very high SiO2 content ofmany of these deposits in the Guiana Shieldreflects the past dominance of felsic weath-ering surfaces and a protracted life domi-nated by repeated episodes of weathering,deposition, lithification, erosion and leach-ing.
Chemical profiles of a wide range ofrock samples presented in Gibbs andBarron (1993) and presented in Fig. 2.5strongly illustrate the distinction betweenthe two main non-sedimentary rock groups.The most extensive formations in theshield, commonly referred to as the
32 D.S. Hammond

Biophysical Features of the Guiana Shield 33
Fig. 2.5. A chronology of oxide formation based on sample data presented in Gibbs and Barron (1993).The compositions of rock samples are given for the main oxides that contribute through weathering to soilformation and nutrient influx from parent rock, viz. silicon, iron, magnesium, calcium, potassium andsodium. Their contribution to average composition of rock within each group is presented as thedifference from their overall contribution to global crust (represented by the zero axis). Groups of greycolumns represent mainly extrusive formations that are dominated by felsic (silica-rich) rock types andgroups of black columns represent those intrusives dominated by mafic (silica-poor) rock types. Episodesleading to sedimentary formations are indicated by arrows and labels.
Mean (Global crust % – rock sample %)
‘crystalline basement complex’, consistprincipally of felsic rock types. Theseinclude the Imataca and Central Guianagranulites (Fig. 2.5, Fig. 2.4A, B), granitoidsformed during the Trans-AmazonianTectonothermal Episode (Fig. 2.5, Fig.2.4D), the Uatuma metavolcanics (Fig. 2.5,Fig. 2.4E) and the Parguaza/Surucucu gran-ite group (Fig. 2.5, Fig. 2.4I). Mafic-domi-nated rock types are limited to exposure ofintrusive formation surfaces that are oftenvery limited in extent (e.g. Badidku Suite(Fig. 2.4H) and Muri Suite (Fig. 2.4J)). Theextensive, and much older, low- tomedium-grade Greenstone belts along thenortheastern rim of the shield area (Fig.2.4C) represent the most important excep-tion to this rule and one of the defining geo-logical attributes of the shield area (seeabove, ‘Comparison with geology of othertropical forest regions’).
The significance of the relatively highcontributions of SiO2 to the modern forestlandscape of the Guiana Shield when com-pared to other tropical regions of the worldis compelling. The influence of this ubiqui-tous compound in all of its mineral formshas fundamentally shaped the structureand function of plant life (see Chapter 3),and the opportunities and challenges facedby people in their efforts to make a livingfrom these resources. At the same time, thegeographical distribution of contrastingmafic and ultramafic rock dominants hasinfluenced the landscape-level diversity ofthe shield’s forests and played a controllingrole in the mineral exploitation and conser-vation of these lands (see Chapter 9).
Tectonics, Topography and Landforms
Regional tectonic features
The Guiana Shield rests in the north-centralquadrant of the South American tectonicplate and just south of the tri-juncture withthe very active eastern margin of theCaribbean Plate and southernmost exten-sion of the North American Plate (Fig.2.6A). At some distance away from theAtlantic coastline of the shield, near the
major axis of the Atlantic Basin, the Africanand South American plate margins meet,forming an important sea-floor spreadingzone.
The modern shield region has beendevoid of volcanic activity since theMesozoic. A number of important volcanicbelts, however, are located north and westof the area along regional plate subductionzones (Fig. 2.6A, solid triangles). Formertectonic events have created a series ofmuch smaller fault lines across Southand Central America, but concentratedalong the Andes and the Guiana andBrazilian Shield areas (Fig. 2.6A, parallellines).
Topography
The broad-scale topography of the GuianaShield and its periphery can be dissectedinto three distinct ‘highland islands’ sepa-rated through crustal subsidence along anumber of distinct structural faults, warpsand geosynclines (Fig. 2.6A, B). Many ofthese features are immediately recognizableas forming significant landscapes in theirown right. The formative features of theseareas have been described variously by oth-ers (RADAMBRASIL, 1972; PRORADAM,1979; Sombroek, 1990; Huber, 1995a). Mostgeologists believe that the interstitial low-lands acted as depositories of sedimenteroded from the highland areas and, in part,pushed inland as sea level rose and trans-gressed during interglacial stages of theQuaternary period (Irion, 1976; Gibbs andBarron, 1993). As sediment-laden watersnaturally flowed in and through thesetroughs, the weight of deposited sedimentcaused the crust in turn to further subside.Subsidence caused the deposition zone todeepen even further, maintaining an ero-sion bevel that kept these areas as the prin-cipal zone of deposition. This phenomenonextended the aggrading phase of a geomor-phic cycle that forms much of the shield’smodern appearance. The resulting surfacesare vast and encompass some of the heavi-est sediment deposits found in the region,often reaching several kilometres deep. Anumber of these low-lying areas are in fact
34 D.S. Hammond
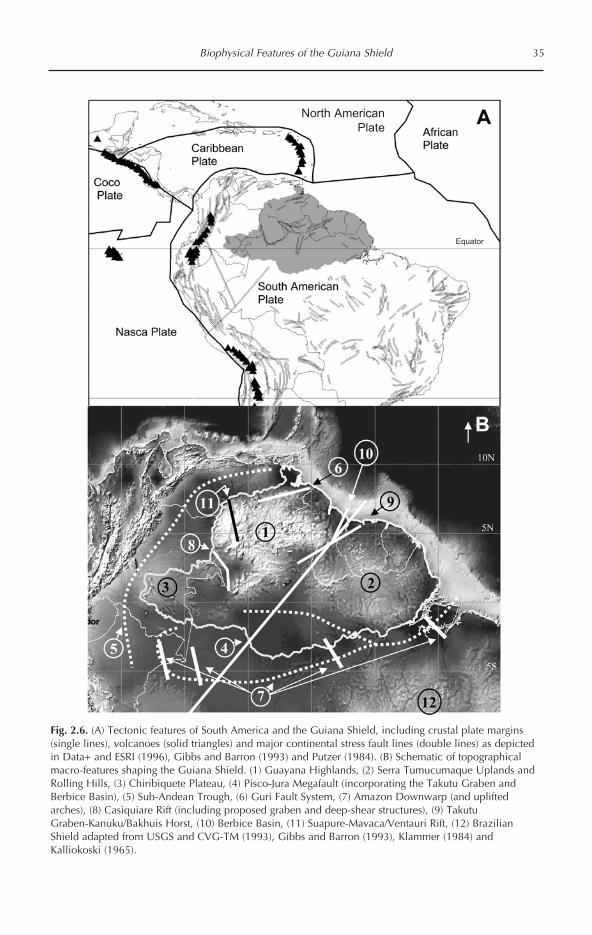
Biophysical Features of the Guiana Shield 35
Fig. 2.6. (A) Tectonic features of South America and the Guiana Shield, including crustal plate margins(single lines), volcanoes (solid triangles) and major continental stress fault lines (double lines) as depictedin Data+ and ESRI (1996), Gibbs and Barron (1993) and Putzer (1984). (B) Schematic of topographicalmacro-features shaping the Guiana Shield. (1) Guayana Highlands, (2) Serra Tumucumaque Uplands andRolling Hills, (3) Chiribiquete Plateau, (4) Pisco-Jura Megafault (incorporating the Takutu Graben andBerbice Basin), (5) Sub-Andean Trough, (6) Guri Fault System, (7) Amazon Downwarp (and upliftedarches), (8) Casiquiare Rift (including proposed graben and deep-shear structures), (9) TakutuGraben-Kanuku/Bakhuis Horst, (10) Berbice Basin, (11) Suapure-Mavaca/Ventauri Rift, (12) BrazilianShield adapted from USGS and CVG-TM (1993), Gibbs and Barron (1993), Klammer (1984) andKalliokoski (1965).
North AmericanPlate
Equator

not considered to be within the GuianaShield as defined sensu stricto due to theirmore recent Quaternary ages (e.g. see mapsin Räsänen, 1993; Huber, 1995a; Goodwin,1996). But their role in delimiting and frac-tionating the highland Precambrian core ofthe shield and the important influence theyhave had on the geological, biological, eco-nomic and social history of the region war-rant inclusion here.
The average (±1 SD) elevation for theentire shield area is estimated at 270 (±341)m above sea level (asl).1 The relativelyunique deposition of conglomeritic sedi-ments en masse that have come to beknown as the Roraima Supergroup has cre-ated an unusually wide topographic rangefor an area dominated by Precambrian geol-ogy. Compared to the other two main shieldareas in the Americas, the Brazilian andCanadian Shields, the elevational rangefound within the Guiana Shield is notice-ably greater, varying between a maximumof 3014 m near the centre of the shield area(No. 1 in Fig. 2.6B) down to a minimum of15 m below current sea level in thereclaimed coastlands of the Berbice alongthe northern shield perimeter (No. 10, Fig.2.6B, also see Fig. 2.8).
The highest elevations and mostrugged topography are found between 3°and 6°. The aggregation of peaks and highvalleys of the Guayana Highlands rapidlygive way southwards to flat low-lying val-leys barely above sea level (Fig. 2.7). TheOrinoco River cuts deeply along the north-ern margin of the shield, barely ascendingmore than 100 m asl at its upper juncturewith the Casiquiare (Fig. 2.7, 3° N). The RioBranco and Rio Negro start from a relativelynarrow valley sandwiched between thesteep southern edge of the GuayanaHighlands (Fig. 2.7, 3° N to Equator) andthe more gradual rise associated with thewestern margin of the southeastern ‘island’,referred to here as the TumucumaqueUplands (Fig. 2.6B, No. 2). Southward theRio Branco basin fans outwards to meet upwith the lower Rio Negro, occupying anarea nearly 800 km wide (Fig. 2.7, 1° N toEquator). Only isolated remnants associatedwith the Roraima formation and various
intrusive rocks break up this peneplain(Fig. 2.7, Equator). The exposed crystallinebasement that occupies much of theTumucumaque Upland area (Fig. 2.6B, No.2) also loses much of its relatively modesttopographic variation southward, as down-warping associated with the AmazonTrough led to deep and extensive sedimen-tation across much of the area (Fig. 2.7)(Gibbs and Barron, 1993).
Shield macro-features
GUAYANA HIGHLANDS The GuayanaHighlands dominate Venezuela east of theOrinoco and extend across much of west-central Guyana and northern Roraima statein Brazil. This is the largest of the three‘islands’ of shield crust that rise above thesurrounding basins (cuencas) formedthrough downwarping processes. It repre-sents the northernmost part of the GuianaShield and the most rugged topography inthe region. Born from a mixture of ancientsedimentary rock deposited atop the crys-talline basement and intruded by igneousrock of the Avanavero Suite, the GuayanaHighlands are dominated by the high flat-topped peaks of the Roraima Supergroupand Quasi-Roraima formation and therounded granite peaks of the Parguaza andImataca complexes to the north and south-western edges of the area (Figs 2.6B, 2.7).The northern perimeter of this region is dis-tinctly and drastically defined by the cur-rent course of the Orinoco River, as itseparates the rapidly rising hills of theParguaza and Uatuma formations from theflat, low-lying llanos (Fig. 2.7, 7° N, 6° N).While this major river system drains nearlythe entire highland area (and adjacent landsin eastern Colombia and the Venezuelanllanos), the main stem follows a relativelyweak hydraulic gradient, rising less than0.1 m for every 1 km length travelled up toits headwater tributaries. The main stembarely reaches more than 100 m asl up tothis point. In contrast, many of the mainwaterways feeding into the Orinoco fromwithin the Guayana Highlands area, such asthe Caura and Ventauri Rivers, have mainstems that run in valleys extending well
36 D.S. Hammond

Biophysical Features of the Guiana Shield 37
6o N
0
2000
2o N
0
1000
2000
3o N
0
1000
2000
Distance (km)0 750 1500 2250
Ele
vation
(m
a
sl)
0
1000
2000 Equator
7o N
0
2000
Atlantic Shelf
Imataca
Parguaza
Lla
no
s
NW Guyana
Maigualida
Cau
ra
Sierra de Lema
Cu
yuni
Upper Guaviare
Parima Tepequem
TafelbergNouragues
Upper Meta/Vichada
Uainama
OrinocoCasiquiare
Parima
Dome Hill
Oranje Itoupe
Chiriquibete Caparro Casiquiere
Rift
UrucusiroSipaliwini Tumucumaque
Iguaje Tapirapeco
TumucumaqueAcarai
Araracuara
Neg
ro
Bra
nco
Jari Am
azo
n
Tumucumaque
Bra
nco
Bra
nco
Bra
nco
Ne
gro
4o N
0
1000
2000
1o N
0
1000
2000
5o N
-1000
0
1000
2000Cuao Uasadi Chimanta
Takwari
Kurungiku
Berb
ice Suriname
GuyaneBasement
Ven
tauri
Fig. 2.7. Two-dimensional west to east topographic profiles across the Guiana Shield.
Ele
vatio
n (m
asl
)
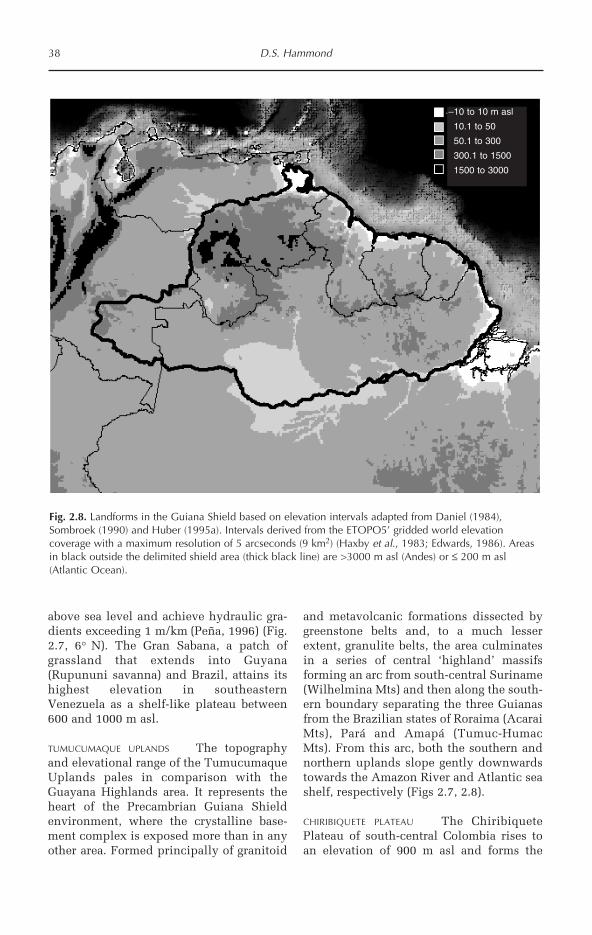
38 D.S. Hammond
above sea level and achieve hydraulic gra-dients exceeding 1 m/km (Peña, 1996) (Fig.2.7, 6° N). The Gran Sabana, a patch ofgrassland that extends into Guyana(Rupununi savanna) and Brazil, attains itshighest elevation in southeasternVenezuela as a shelf-like plateau between600 and 1000 m asl.
TUMUCUMAQUE UPLANDS The topographyand elevational range of the TumucumaqueUplands pales in comparison with theGuayana Highlands area. It represents theheart of the Precambrian Guiana Shieldenvironment, where the crystalline base-ment complex is exposed more than in anyother area. Formed principally of granitoid
and metavolcanic formations dissected bygreenstone belts and, to a much lesserextent, granulite belts, the area culminatesin a series of central ‘highland’ massifsforming an arc from south-central Suriname(Wilhelmina Mts) and then along the south-ern boundary separating the three Guianasfrom the Brazilian states of Roraima (AcaraiMts), Pará and Amapá (Tumuc-HumacMts). From this arc, both the southern andnorthern uplands slope gently downwardstowards the Amazon River and Atlantic seashelf, respectively (Figs 2.7, 2.8).
CHIRIBIQUETE PLATEAU The ChiribiquetePlateau of south-central Colombia rises toan elevation of 900 m asl and forms the
Fig. 2.8. Landforms in the Guiana Shield based on elevation intervals adapted from Daniel (1984),Sombroek (1990) and Huber (1995a). Intervals derived from the ETOPO5’ gridded world elevationcoverage with a maximum resolution of 5 arcseconds (9 km2) (Haxby et al., 1983; Edwards, 1986). Areasin black outside the delimited shield area (thick black line) are >3000 m asl (Andes) or ≤ 200 m asl(Atlantic Ocean).
–10 to 10 m asl
10.1 to 50
50.1 to 300
300.1 to 1500
1500 to 3000
westernmost surficial landscape includedin the Guiana Shield (Fig. 2.6B, No. 3) andincludes the La Chorrera massif. The west-ern margin of the mainly quartzic, sand-stone plateau is separated from the easternAndes by the deep Tertiary sediments ofthe Sub-Andean Trough that runs along thenorthern rim of the Guiana Shield (Fig.2.6B, No. 5). The sandstones forming theplateau are commonly referred to as theAraracuara Formation. They are of compa-rable composition to those forming theRoraima highlands, but are considerablyyounger, being of Palaeozoic, rather thanPrecambrian, age (Estrada and Fuertes,1993). They rest unconformably atop meta-morphosed rocks forming the MitúComplex, a series of mainly gneissesthought to have been formed as a conse-quence of a second, recently postulated,tectonothermal event metamorphosing andremobilizing the basement complex in thewestern part of the shield (Gibbs andBarron, 1993). The original age over most ofthis basement has been obliterated by thisevent, but isotopic dating indicates meta-morphic formation around 1.5 Ga, about thetime that the Parguaza Granites were form-ing in western Venezuela/eastern Colombia(Table 2.1) (Fig. 2.7, 6° N).
KANUKU/BAKHUIS HORST The KanukuMountains define the northeastern edge ofthe Tumucumaque Uplands where thismeets the North Savannas Rift Valley, a sec-tion of the much longer Takutu Graben (Fig.2.6B, No. 9) (Berrangé, 1977). This massifforms part of the Kanuku Complex, a for-mation of mainly high-grade metamorphicrocks, paragneisses, migmatites and gran-ulites, which extends over 22,000 km2 ofsouthern Guyana and represents the west-ern leg of the much longer Central GuianaGranulite Belt (Fig. 2.4B). The origin of thevarious rock units forming the Kanukucomplex is not entirely clear, but a numberof pathways have been proposed describingthe transition from sedimentary (Berrangé,1977) and crystalline basement precursorsto the present-day metamorphics. The east-ern leg of this belt, the Falawatra Group,runs through eastern Suriname to form the
Wilhelmina and Bakhuis Gebergte(Mountains) (Gibbs and Barron, 1993).These horsts were formed by the loweringof adjacent lands, the North Rupununi andBerbice basins, through block faultingwithin the crystalline basement (Berrangé,1977), rather than an uplifting due to otherregional metamorphic processes. TheKanuku horst extends eastward from thesavanna strip embracing the Takutu Riverbetween the Serra do Tucano (ToucanHills) in Brazil and Yamat Mountain inGuyana. The horst is dissected by thenorthward-flowing Rupununi, Kwitaro andRewa Rivers in the east and reaches itshighest elevation, 960 m asl, in the centralsegment (Mt Naraikipang). The Wilhelminaand Bakhuis ranges extend north from theLucie River near to the border with Guyanato the uplands forming the headwaters ofthe Kabalebo and Nickerie Rivers to thewest and the Coppename to the east.
ATLANTIC COASTAL SHELF Stretching morethan 1550 km between Trinidad (PariaShelf) and the mouth of the Amazon River(Amazon Shelf) and extending between 20and 80 km offshore, the build-up ofPhanerozoic sediment atop the submarineextension of the Precambrian basement hasformed a shallow marine environment.Throughout this zone it is not uncommonto encounter patches extending severalsquare kilometres in size that are coveredwith less than 2 m of water during low tide.The shelf is particularly wide at the north-ern end near to the mouth of the OrinocoRiver. The rapid increase in depth offshorefrom the mouth of the Courentyne Riverforms part of the larger downwarpingknown as the Berbice Basin and representsone of the narrowest points in the shallowmarine shelf environment along with therapid downslope near the Oyapock Riveron the French Guiana–Amapá border. Themodern coastal shelf deposits are believedto have been formed from two sources con-tributing material over the Cenozoic: (i) thebulk of coarser sandy sediments ejectedfrom rivers spilling directly on to thecoastal shelf (Pujos et al., 1990) with somelocalized longshore redistribution (Krook,
Biophysical Features of the Guiana Shield 39

1979); and (ii) lighter silt and mud from theAmazon River transported and depositedalong the Guiana coast (Eisma and van derMarel, 1971). Virtually all of the materialscontributed via the Amazon are believed tobe Andean in origin, with little contribu-tion from the rivers draining the westernshield area (Gibbs, 1967; Mario and Pujos,1998). Nearly 10% (1.5 × 10⁸ t/year) of thetotal suspended matter ejected currentlyinto the Atlantic from the Amazon isbelieved to be transported directly north-westward by the Guiana Current (MullerKarger et al., 1988). Finer silt and clay arealso transported through more passive long-shore drift and ocean swells from theAmazon Cone along the Guiana coast(Wells and Coleman, 1981; Pujos andFroidefond, 1995). These fluid muds formthe characteristic intertidal banks occupy-ing most of the near coastline. The relativecontribution of deposits from each of thesetwo sources has changed over time inresponse to geological and climatic events.Oscillating transgression and regression ofmarine waters due to climate change,changes in forest cover and, over a longertimescale, changes in the erosion bevel ofthe Amazon and Guiana Shield regions dueto regional uplifting and downwarpinghave all affected the dynamics of coastalsedimentation along the Guiana coast overthe course of the last 100 million years(Bleakley, 1957; McConnell, 1969; Nota,1969; Pujos et al., 1990; Mario and Pujos,1998).
Major faults, downwarps, rift valleys andgeosynclines
Geomagnetic, gravity and seismic surveysshow that the Guiana Shield is fractionatedby hundreds of faults and rift-like struc-tures (compiled by A.K. Gibbs in Fig. 1.7 ofGibbs and Barron (1993)). By far the major-ity of these structures contained within thecrystalline basement core of the shield findtheir origins in the Precambrian, thoughmany have been reactivated later. Most ofthese range from 1 to 100 km in length, buta few major faults extend for hundreds of
kilometres. Downwarping involves faultingand deformation at a much larger scale andin response to craton-altering mechanisms,such as the uplift of the Andes or eustatictilting of the continental crust during peri-ods of sea transgression into the major riverbasins within and surrounding the shield.Several of the largest and most important ofthese identified in Fig. 2.6 are describedbriefly below.
Pisco-Jurúa megafault
This major fault is thought to run north-northeast from the western Cordillera ofPeru, across the upper Amazon (Solimões)Basin along the alignment of its northeast-ward flowing tributary, the Juruá River, andends at the Berbice Basin on the northernrim of the shield area (Fig. 2.6A and 2.6B,No. 4). The megafault has been proposed asa tensional feature running roughly perpen-dicular to the main mid-Atlantic rift axisand remaining active until the Mesozoic,though its original activation may havebeen as much as 1 billion years earlier, dur-ing the Nickerian Episode (Gibbs andBarron, 1993). It has been implicated in thedevelopment of the Takutu Graben as theinteraction between tensional and torsionalforces between the Kanuku/Bakhuis horstformations and the megafault ‘twisted’ thecrust in the graben vicinity resulting in arhombochastic orientation of the horst-graben association (Szatmari, 1983, cited inGibbs and Barron, 1993).
Sub-Andean Trough
A massive sedimentary depression liesdirectly east-southeast of the AndeanCordillera as it wraps around the northernand western margin of the South Americancraton. It is wedged between the Andes andthe Guiana Shield in the north, thePalaeozoic Amazon Downwarp in the mid-dle and the western margin of the BrazilianShield in the south (Fig. 2.6B, No. 5). Thearea accounts for a large proportion of thelowland tropics in western Brazil, Peru,Ecuador, Colombia and, to a lesser extent,Bolivia. The area is typically separated
40 D.S. Hammond
from the Amazon Downwarp at the IquitosArch near the confluence of the Solimõeswith the Napo, Ucayali and Javari Rivers.The Sub-Andean Trough (after Devol andHedges, 2001) has been variously referredto as the Andean Geosyncline (Williams etal., 1967), pre-Andean region (Fittkau,1971), Sub-Andean Foreland (Putzer, 1984),Amazon Foreland Basin (Cuenca deantearco de la Amazonia) (Räsänen, 1993),and Cis-Andean Plains (Sternberg, 1995),among others. The crystalline basementrock beneath the trough is entirely coveredwith relatively recent, but very deep, sedi-mentary deposits eroded from the easternface of the Andean highlands. The rela-tively compressed timeline of depositionand change that has affected this and theAmazon Downwarp areas has producedone of the largest Tertiary sedimentarybasins in the world. Sediments found inthis depression are thought to have beendeposited over a series of episodes datingback to the Palaeocene, 70 million yearsago. These are variously represented by theIpururo and Pebas (Solimões) formations ofthe Plio-Pleistocene, the Curaray,Chambira, Arajuno, Chalcana (Pozo),Cachiyacu (Rio Branco) and Tiyuyacu(Contamana) formations of the Mio-Eocene,and the Cruzeiro Formation of thePalaeocene (Beurlen, 1970; Campos andBacoccoli, 1973; Galvis et al., 1979).Consisting mainly of river alluvium, sands,conglomerates, ferruginous clays, silts andsideritic ironstones, the deposits can attaindepths between 4000 and 10,000 m (Putzer,1984; Gibbs and Barron, 1993; Räsänen,1993).
Guri fault system
The 400 km long Guri or Guri-El Piar faultis a system or zone of multiple transcurrentfaults, sheared and partially mylonitized,striking west-southwest to form the south-ern boundary of the Imataca Complex (Fig.2.6A and 2.6B, No. 6) (Kalliokoski, 1965;Gibbs and Barron, 1993; Goodwin, 1996).Outliers of the Imataca Complex occursouth of the fault system (USGS and CVG-TM, 1993), but it represents a general line of
contact between Archean rock in the northand the (predominantly) Proterozoic granite-greenstone rock formations to the south(Gibbs and Barron, 1993). The fault systemruns parallel to the El Pao Fault to the northand is believed to have developed approxi-mately 1.2–1.3 Ga during the NickerianEpisode (Gibbs and Barron, 1993). Both theGuri-El Piar and the El Pao strike parallel tothe projected alignment of the Pisco-JuruáMegafault (similarly of Nickerian age) androughly perpendicular to the hypothesizedorientation of the Atlantic fracture zoneduring its formative stages of developmentprior to mid-Atlantic rifting.
Amazon Downwarp
The lowland area of sedimentary coverrunning along the main stem of the Amazonfor 3500 km between the southern rim ofthe Guiana Shield and the northern rim ofthe Brazilian Shield is referred to here asthe Amazon Downwarp (Fig. 2.6B, No. 7)and is somewhat narrower than the geo-chemical province described as CentralAmazonia by Fittkau (1971). This areaaccounts for almost half of the entireAmazon Basin (Stallard and Edmond,1987). It is separated from the western Sub-Andean Trough by the ridge of uplifted andexposed Precambrian rock of the IquitosArch running north–south across theupper Solimões in eastern Peru/westernBrazil (Putzer, 1984). The AmazonDownwarp is dissected by three additionaluplifted arches all running roughly parallelto one another (Fig. 2.6B, No. 7). ThePurús Arch runs north-northwest from thelower Madeira and across the Purús andAmazon Rivers just upstream from theirconfluence. The Carauarí Arch extendsbetween the lower Putamayo River inColombia southward to the upland regionseparating the Juruá and Purús Rivers. TheGurupá Arch runs along a similar align-ment east of the Rio Xingu mouth and alongthe eastern flank of Marajó Island, at themouth of the Amazon. The arches arethought to have played a prominent role inregulating the extent of sea transgressioninto the downwarped area and subsequent
Biophysical Features of the Guiana Shield 41

deposition of sediments. The Iquitos Archis believed to have been the eastern-most upland edge of a palaeo-watersheddraining westward during the Tertiary priorto the uplifting of the Ecuadorian Andesand closing of the Pacific outlet (Putzer,1984).
The Amazon Downwarp interfaceswith the southern rim of the Guiana Shieldthrough a series of sedimentary formationsrunning parallel to the main stem of theAmazon River. The oldest, and furthestfrom the river, date back to the Palaeozoic.They consist of the Prosperança,Trombetas, Jatapu, Lontra, Ereré, Curua,Monte Alegre, Itaituba and Nova OlindaFormations in order of decreasing agebetween the Cambrian and upper Permianperiods of the Palaeozoic (Fig. 2.4L)(Putzer, 1984; Gibbs and Barron, 1993).These bands of silts, sands, conglomerates,evaporates, sandstones, shales and iron-stones grade into the upper Cretaceous(Mesozoic) red clays, silts and sandstonesof the Alter De Chaõ Formation (Fig. 2.4M).These are partly covered by more recentsand and silt deposits of the Barreiros,Piracurú, Solimões, Iça, Tucunaré and BoaVista formations dating from the Mioceneto the Plio-Pleistocene (Fig. 2.4N). Recentsilts and clays are deposited along andacross the main river channel floodplains ofthe Amazon.
The distribution of many of the olderseries of sediments reflects oscillation andvariation in sea levels over the past 500 mil-lion years and changes in the angle of theSouth American cratonic planation surfaceas deformation and tectonism changed thetilt of the continent (Klammer, 1984). Thedistribution and unique composition ofmany of these sedimentary events, such asthe Monte Alegre greenish sands andBelterra Clays, has fundamentally influ-enced forest life in the downwarp, from thegreen waters of the Tapajós to the Babaçuforests near Santarém.
The classical volume edited by Sioli(1984b) gives an extensive and comprehen-sive overview of the main features of theAmazon Downwarp and its linkages withthe peripheral landscape.
Casiquiare Rift
Bellizia (1972, cited in Blancaneaux andPouyllau, 1977) described this structure asone of three major fracture zones runningparallel from north to south through theVenezuelan Amazon (the others being theSupare-Mavaca and Ventauri Rifts, Fig.2.6A and 2.6B, No. 11). It has also beenreferred to as the Parguaza Subduction andAtabapo-Negro suture zone (Gibbs andBarron, 1993). This suture-like structurerunning north-northwest in southwesternAmazonas state of Venezuela effectivelyseparates and deflects the upper reaches ofthe Negro (Guianía) and Orinoco Rivers,leaving the Casiquiare River (sometimes‘canal’) to act as one of only two modernconnections between the Atlantic-drainingand Amazon-draining waterways of theshield (Fig. 2.9A). Simple Bouger gravityanomalies calculated for the area under-score the existence of a high density bodybeneath the suture running from 3° N andextending to a point just south of PuertoAyacucho near the confluence of theGuayapo and Autana Rivers to the east ofthe Orinoco (USGS and CVG-TM, 1993). Itis postulated by Tassinari (in Gibbs andBarron, 1993) to be the subduction zone ofa tectonic ‘palaeoplate’ linked to a secondPost Trans-Amazonian tectonothermalepisode, around 1.9–1.76 Ga, that reacti-vated basement rock during the ParguazaEpisode (also Rio Negro–Juruena Episode)around 1.5 Ga. Formations to the west ofthe suture zone, such as the gneisses of theMitú Complex in Colombia, show con-cordant ages around 1.5 Ga, while thosebasement granitoids east of the zoneare consistent with the TATE around2.1–1.8 Ga. Others interpret the zone assimply a mobile belt formed of high-grade(granulite) metamorphics (Bridger, 1984,cited in Gibbs and Barron, 1993).Regardless of its exact origins, the 300 kmwide, localized subsidence created in thezone has produced a hydrological pene-plain with stagnant drainage culminatingin the Rebalse de Macavacape along theupper reaches of the Rio Atabapo (Fig.2.9A). The famous bi-directional flow of
42 D.S. Hammond
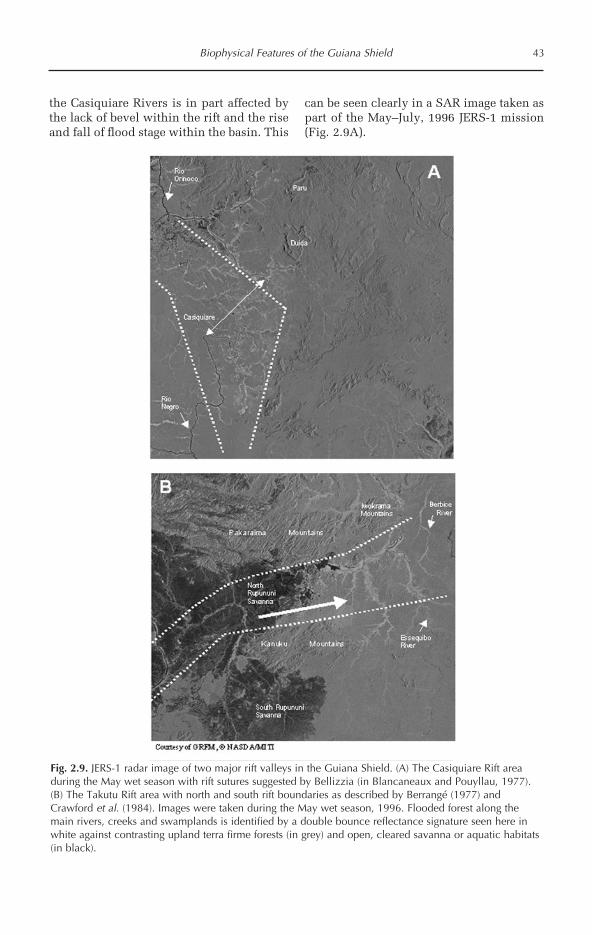
Biophysical Features of the Guiana Shield 43
the Casiquiare Rivers is in part affected bythe lack of bevel within the rift and the riseand fall of flood stage within the basin. This
can be seen clearly in a SAR image taken aspart of the May–July, 1996 JERS-1 mission(Fig. 2.9A).
Fig. 2.9. JERS-1 radar image of two major rift valleys in the Guiana Shield. (A) The Casiquiare Rift areaduring the May wet season with rift sutures suggested by Bellizzia (in Blancaneaux and Pouyllau, 1977).(B) The Takutu Rift area with north and south rift boundaries as described by Berrangé (1977) andCrawford et al. (1984). Images were taken during the May wet season, 1996. Flooded forest along themain rivers, creeks and swamplands is identified by a double bounce reflectance signature seen here inwhite against contrasting upland terra firme forests (in grey) and open, cleared savanna or aquatic habitats(in black).

Takutu Graben
The savanna valley that runs along thenorthern flank of the Kanuku Mountainsand the southern flank of the PakaraimaMountains in southern Guyana and thenortheastern Brazilian state of Roraima isthe product of two parallel major faultswith a series of intervening minor faults(Berrangé, 1977; Crawford et al., 1984). The(re-)activation of these faults created a cas-cading series of downthrown blocks ofPrecambrian basement rock to a depth ofover 7 km (Crawford et al., 1984). Thegraben itself extends between its northern-most point located upstream from the vil-lage of Apoteri, near the confluence of theEssequibo and Rupununi Rivers and south-ern limit on the Rio Branco (Fig. 2.9B). BothBoa Vista, the state capital of Roraima, andLethem, the regional capital of southernGuyana, rest atop the sedimentary fill of therift valley. The South Rupununi savannasdo not fall within the graben, resting atopmuch older Kanuku Complex paragneisses,granulites and granites formed during thePrecambrian (Berrangé, 1977).
Landforms
Considerable effort has been made by geol-ogists, geographers, soil scientists andbotanists to characterize various sub-regions of the Guiana Shield by a series oflandforms linking topography, geologicalhistory, soil and hydrology (Sombroek,1990; Huber, 1995a). Here, these featureshave been combined into five large land-form categories, each encompassing differ-ent subsets of the shield macro-featuresdescribed above. Elevation is considered asthe principal factor, given its strong rela-tionship with geology, soil formation andhydrology (through erosion bevels) in land-scapes dominated by the Precambrian(Gibbs and Barron, 1993).
Recent Coastal Plains (–10 to 10 m asl)
Along the Atlantic coast between themouths of the Orinoco and Amazon Rivers,
a narrow plain of flat, low-lying sedimentsextends up to 80 km inland from the pres-ent-day coastline (Fig. 2.8). This beltaccounts for approximately 5% of theshield area, reaching its greatest width nearthe mouth of the four largest rivers drainingthe area, the Orinoco, Essequibo,Courantyne/Berbice and Amazon (Fig. 2.8).These areas are subject to daily tidal oscil-lations extending many kilometresupstream. In fact, the Recent Coastal Plainsrarely rise higher than 10 m asl and the vastmajority of this landform that has not beenempoldered is subject to tidal submersion.
The coastal belt consists of a series ofunconsolidated clay and silt layersdeposited over the past 10,000 years. Fluidmuds, a dense suspension of solid clay andsilt particles, can extend for kilometresalong the seaward margin of the more stablecoastal mud banks (often anchored by man-grove). These represent the current land-building front between the built-up coastalplain backlands and open marine environ-ment of the coastal shelf. Silt and clay form-ing the fluid muds have largely arrivedalong the coast through the conveyingaction of the Guiana Current running north-westward along the Atlantic coast (e.g.Ryther et al., 1967; Wells and Coleman,1981; Muller Karger et al., 1988). These cur-rents deflect the massive Amazon sedimentplume northward, transporting about 10%of this material from the Amazon Rivermouth and depositing this along the Guianacoast (Muller Karger et al., 1988). The ejec-tion of sediment from the many riversdraining the shield interior and spillingtheir sediment load directly into theAtlantic has compounded deposition, creat-ing localized sediment ‘bulges’ on the sea-ward side of the major rivers. The extentand distribution of coastal sediments hasbeen shaped over time by variations in sealevel, coastal downwarping, tidal strength,rate of sediment injection, and mostrecently, agricultural development and theinstallation of coastline defences. Despitedramatic increases in the rate and area ofdeforestation in the Amazon Basin, theimpact of this phenomenon on existingnutrients and sediment levels in the main-
44 D.S. Hammond

stem Amazon is thought to remain negligi-ble in comparison to the contribution madethrough natural weathering of the AndeanHighlands (DeMaster and Aller, 2001).
Efforts in Guyana to ‘hold back the sea’have created the most heavily populatedagricultural zone along the Guiana Atlanticseaboard, but only after considerable costand effort. Up until the early 1700s, theAtlantic coastline largely remained a man-grove- and palm-dominated tidal wetlandinterspersed with upland patches of forest.Extensive coastal defence works in the1700s opened up a large empoldered land-scape ideal for lowland sugar cultivation.Since 1850, however, the reclaimed coast-line has slowly moved inland as sedimentaccrued along the artificially abrupt coast-line (Case, 1943). In many areas of Guyana,coastal defence and land reclamation workshave retained a polder-like zone of landthat is up to 15 m below sea level. This areais repeatedly affected by breaches in seadefences and many parts have returned totheir brackish condition. Where the solidrock of the Precambrian Rolling Hills land-form extends close to the coastline, particu-larly in central French Guiana and northernAmapá, the coastal plains are largelyrestricted to the offshore tidal flats consist-ing of mud banks and fluid muds up to sev-eral metres deep.
The Recent Coastal Plains landformencompasses both the Young Coastal Plain(Demerara Formation) and Old CoastalPlain (Coropina Formation) zones typicallyused to describe the Cenozoic deposits cir-cumscribing the Precambrian shield centre(Fig. 2.4K) (Bleakley, 1957; Daniel, 1984;Gibbs and Barron, 1993).
Tertiary Sandy Plains (10–50 m asl)
Rising above the Recent Coastal Plains andthe riverine floodplains of the Amazon andits main tributaries, the Tertiary SandyPlains cover approximately 30% of theGuiana Shield land area. This landformroughly approximates the sandy Plains pro-posed by Sombroek (1990) and is includedin Huber’s (1995a) Lowlands category.Formed of heavily reworked and leached
sands, they cover a large belt running paral-lel to the Recent Coastal Plains along theAtlantic and covering much of the lowlandssurrounding the Amazon, lower Negro,Japurá/Caquetá and lower Branco Rivers innorthern Brazil/southern Colombia. Muchof the topographic relief of the underlyingPrecambrian rock is buried beneath thenumerous stratified layers of sand and loamthat can reach several thousand metresthick in regions of significant crustal down-warping along the lower Berbice/Courentyne Rivers.
The Tertiary Sandy Plains include sed-imentary formations associated with peri-odic sea level change and eustaticmovement of the shield area since the lateCretaceous/early Tertiary and include: theNew Amsterdam, Georgetown, Pomeroon,Courantyne and Berbice Formations inGuyana, the Nickerie, Onverdacht,Coeswijne and Zanderij Formations inSuriname, the Alter De Chaõ, Pirarucú,Solimões, Iça and Boa Vista Formations inBrazil, Mesa Formation in Venezuela andPebas Formation in Colombia. Subsequenterosion of these plains has led to a series ofmoderately sloped valleys that are subjectto widespread vertical infiltration wheresands are deep and largely devoid of clayand loam.
Precambrian Rolling Hills (50–300 m asl)
By far the vast majority of the shield land-scape rests atop granitoids formed duringthe massive Trans-Amazonian Tectono-thermal Episode (Fig. 2.4D). Combinedwith Precambrian greenstones in the northand south and metavolcanics of the centralshield region, a gently undulating terrainhas been created through synclinal foldingand differential weathering of these andsurrounding associations over the last 2 bil-lion years. Today, this can be seen as aseries of (flat-topped) hills, ridges and val-leys with an elevation of between approx.80 and 300 m.
The Precambrian Rolling Hills and thestratigraphic units underlying themaccount for more than 50% of the shieldarea. In Guyana, this landform has been
Biophysical Features of the Guiana Shield 45

included in the Precambrian Lowlands ofDaniel (1984), along with a number of otherstructures described independently below.Sombroek (1990) described this area as thecrystalline shield Uplands. They includemuch of the Imataca terrain of northeasternVenezuelan Guayana, extending eastwardthrough the Northwest region of Guyana tothe lower Essequibo River. Dissected by theBerbice Basin and Falawtra Group inSuriname, the Rolling Hills continue east-ward across most of Suriname south of theZanderij, across virtually all of (French)Guyane and into west-central Amapá.Above the 2nd parallel, this landform cov-ers most of Pará, Roraima and Amazonasstates, only intersected by the IçaFormation running between the Rio Brancoand Rio Negro. The Rolling Hills continuewestward into eastern Colombia and mostof the southern half of Amazonas state inVenezuela.
Guiana Uplands (300–1500 m) and GuayanaHighlands (1500–3000 m asl)
The second most important landform foundin the Guiana Shield, referred to here as theGuiana Uplands, is dominated by struc-tures forming the Roraima, Vaupés andUatuma Supergroups and intrusive rocksuites of varying age (see Figs 2.4 and 2.8).The Inselberg complexes, and parts of theSandstone table lands and crystallineshield Uplands of Sombroek (1990) areincluded here in the Guiana Uplands. Agood part of the Guayana Highland andmany inselbergs of the TumucumaqueUpland macro-features are included in theUplands landform, along with theChiribiquete Plateau in Colombia and iso-lated massifs and peaks rising above 300 mthat are scattered throughout the surround-ing lowlands (Figs 2.6B, 2.7). Together, theyare represented by a number of mountain-ous areas ranging from 300 to 3000 m in ele-vation and covering approximately 15% ofthe shield area (the Roraima Supergroupcovers 10% of the shield area or 163,000km2 (McConnell, 1959), 45% of this areaformed by the Pakaraima Highland massifalone (Gibbs and Barron, 1993)). The eleva-
tion of these areas has been created throughregion-wide weathering, depositional andvolcanic processes and more localizeduplifting along block fault margins. This isin part referred to in Guyana by Daniel(1984) as the Pakaraima Mountain Regionand would incorporate both the Uplandand Highland classifications provided byHuber (1995a) for the Venezuelan Guayanaportion of the shield. Many lower, outlyingand isolated peaks and hills (300–500 masl) not considered in these classificationsare also included here.
At 3014 m asl, Sierra de la Neblina onthe Venezuelan Amazonas–BrazilianRoraima border reaches the highest eleva-tion in the Guiana Shield. An isolatedand dramatic chain of clustered tabletop escarpments, Neblina is one of morethan 70 tablelands, often referred to astepuis, mesas, tafelbergs or chapadões,found throughout eastern Venezuela (50),western Guyana (12), Suriname (1) andBrazil (7) that together form the GuayanaHighlands. They are the uppermost rem-nants of a once widespread, +3000 m thick,sedimentary plain that is believed to havecovered as much as one-third of the modern-day area of the Guiana Shield (Gansser,1954). The second highest peak in theshield, Roraima, rests at the internationalboundary between Brazil, Venezuela andGuyana, some 800 km northeast of Neblina.Maximum elevations drop off rapidly fromthe twin highland centres formed by themain Pakaraima Mountain massif occu-pying eastern Venezuela and westernGuyana, and the string of clusteredtepuis running southwest across southernBolivar and Amazonas states in Venezuela.Juliana Top in Suriname reaches a heightof only 1230 m, while Mont Itoupe at840 m, the highest peak in French Guiana,is barely one-third the height of Neblina.Contrasting soils, climate and vegeta-tion further underscore the distinctionbetween the Upland and Highland land-forms. The highest peaks in Colom-bian Guayana and the shield area formingpart of the Brazilian states of Amazonasand Pará are also of modest elevationand represented by isolated massifs within
46 D.S. Hammond

Biophysical Features of the Guiana Shield 47
an otherwise flat, low-lying landscape (Fig.2.10).
There is a strong relationship betweenthe geological origins of the highland areasand their current summit elevations with atransition from sedimentary rock-domi-nated structures at the higher elevationsthrough to igneous-dominated structures atlower highland elevations (Fig. 2.10).Generally speaking, areas in the GuianaShield attaining summits in excess of 1600 mare sedimentary in origin and belong to theRoraima Supergroup. This would includevirtually all of the altiplanicies and picosfound in the Venezuelan Guayana, northernRoraima State and the PakaraimaMountains of Guyana and is roughly con-sistent with the Highlands classificationgiven by Huber (1995a). There are severalexceptions, however (e.g. Cerro Coro Coro,C. Yavi), linked to the intrusive graniticbatholith forming large parts of theParguaza Granite (Vaupés Supergroup) innorthwestern Amazonas state of Venezuelaand adjacent Colombia (Gibbs and Barron,1993).
Highland areas ranging from 800 to1600 m originate from a variety of geologi-cal structures, including those formedthrough lithified sediments (of the RoraimaSupergroup), granitic intrusives, granulitic
horsts and ancient metamorphosed vol-canics (Uatuma volcanics). This elevationalband is consistent with the Uplands(500–1500 m) of Venezuelan Guayana(Huber, 1995a), but can be extended at theshield level to include many areas of thePakaraima, Wassarai, Acarai and KamoaMountains in Guyana, the RoraimaHighlands in Brazil, the ChiribiquetePlateau, Colima Otare, C. Main Hanari andC. Campana in Colombia as well as horstsand other lower massifs scattered inGuyana (Kanuku Mts) and Suriname(Bakhuis Mts, Hendrik Top, Tafelberg,Wilhelmina Mts).
Hills and mountains of sedimentaryorigin are virtually absent at an elevationalrange of 300–800 m. Nearly all of theselandscape features owe their elevation to acombination of regional tectonic uplifting,changes in the erosion bevel (caused byeustatic tilting) and more localized differ-ential weathering processes that have elim-inated surrounding country rock to exposehard, silica-rich granites and granulites andlaterite-capped dolerites and other silica-poor rock types as isolated massifs andridgelines. These structures account formost of the highland areas found in FrenchGuiana, Suriname and the Brazilian statesof Amapá, Pará and Amazonas.
Fig. 2.10. The known summit elevation of 185 notable tepuis/mesas, horsts, inselbergs/lajas, mountains,hills and plateaus found in the Guiana Shield. The name of the peak representing the highest elevation ineach of the countries forming the shield region is in brackets.
3100
2800
2500
2200
1900
1600
1300
1000
700
400
100
Max
imum
ele
vatio
n as
l (m
)
Chiribiquete Plateau and Colima Otare (Colombia)
Pico de la Neblina (Venezuela/Roraima-Brazil)
Roraima-tepuy/Mount Roraima (Brazil/Guyana/Venezuela)
Kukenan-tepui/Kukenaam (Venezuela/Guyana)
Ayanganna (Guyana)Roraima Sedimentaries(few Granites)
Granites Roraima Sedimentaries(few metavolcanics, granulites)
Brownsberg (Suriname)
Serra Curicuriari (Amazonas-Brazil)
Greenstones, Granulites, Granitoids,(few metavolcanics, outlying Roraima sedimentaries)
Serra Tepequem (Roraima-Brazil)
Juliana Top (Suriname)
Tafelberg (Suriname)
Mont Itoupe (French Guiana)Serra Mitaraca (Para-Brazil)

Weathering rates
Rock weathers through two main processes:one driven by mechanical agents, such aswind, ice or water, and another workingthrough a slow chemical breakdown, disso-lution and export of materials throughgroundwater flows.
An abundant forest cover and extendedweathering history has effectively restrictednatural physical weathering to the steepestslopes of the Guayana Highlands. Rock for-mations naturally prone to erosion wereremoved from the surface long ago, leavingonly the most resistant rock types. Thecombination of these factors has virtuallyeliminated physical weathering as a collec-tive force degrading rock surfaces in theregion (but see Chapter 8 on mining).
The estimated chemical weatheringrate for the shield region (10 mm/ka afterEdmond et al., 1995) is one of the lowest inthe world and 8–70 times lower than ratesestimated for Andean drainages usingeither a dissolution rate or cationic concen-tration method as the basis for calculation(Stallard, 1988; Edmond et al., 1996;Mortatti and Probst, 2003).
In part, the low modern chemicalweathering rate estimated for the shield isdue to a high quartz (SiO2) abundance.Quartz is the most common siliceous min-eral found in the Guiana Shield (distribu-tion of A, B, D and E in Fig. 2.4 and mineralcomposition in Fig. 2.5) but is also notori-ously impervious to dissolution, registeringone of the lowest rates among common sili-cate minerals (Table 2.3 in Lerman, 1994).Rock types with much lower or no silicatecontent (e.g. carbonates, evaporites) tend tohave much higher dissolution, and there-fore estimated weathering, rates regardlessof acidity. Without persistent high soilacidity (e.g. under more arid and/or coolerclimatic conditions), it is not unreasonableto suggest that the weathering rate of theshield’s crystalline basement would beeven lower than current estimates, althoughwind-driven weathering would in all likeli-hood increase. Wind-driven deposition hasbeen implicated in the development of par-abolic dunes and sand sheet features of the
(Pleistocene) Boa Vista Formation inRoraima, Brazil and southern Guyana(Latrubesse and Nelson, 2001), along theRio Negro (Filho et al., 2002) and in theColombian–Venezuelan llanos north of theshield region.
This combination of geological, cli-matic and biological conditions promoteshighly acidic (low pH) soil conditions(through microbial/root respiration of CO2that combines with water to form carbonicacid, H2CO3) and thus a predominance ofchemical (low pH) over physical (high pH)weathering of rock. The consequence of anenvironment dominated by chemicalweathering is an in situ accumulation ofthese weathering products in the form ofsoil. Environments dominated by physicalweathering forces export these products,leading to a decrease in soil thickness. Inthe Guiana Shield, soil profiles are believedto be thickening (Mortatti and Probst,2003). It is the considerable depth of manysoil types in the region, combined with cli-mate-driven changes to their physical prop-erties, that leads to their stronglycontrolling effect on forest composition,productivity and structure.
Soils and Soil Fertility – Poorest of thePoor
Generally speaking, soils of the wet tropicsare acidic (pH 3.5–6), poor in availablenutrients (especially phosphorus: Schulz,1960; Vitousek, 1984) and calcium (Schulz,1960; Jordan and Herrera, 1981), often con-tain high aluminium and iron levels andhave a low cation exchange capacity(Sanchez, 1976). It is generally acceptedthat the main determinants of modern-daywet tropical soil properties have to do withthe mineral composition of the original par-ent material, (historic) water table dynam-ics, acid chemistry, biological action,human modification and weathering age.Each soil ‘type’ is the product of its ownunique life history, changing continuously(but often indiscernibly) in response to itssurrounding environment. Modern soil tax-onomy attempts to simplify an otherwise
48 D.S. Hammond

continuous variation in soil characteristicsby boxing these into general soil groups thatexhibit certain properties at a particularpoint in time (FAO, 1998). Importantly, thedistribution of these soil types, and theimpact of their wide-ranging propertiesupon tropical forest growth, compositionand distribution, vary considerably fromone region to another (Sanchez, 1976;Richter and Babbar, 1991).
Soil properties exert an importantdirect or indirect control function over trop-ical forest vegetation composition, structureand function at a wide range of scales (e.g.Richards and Davis, 1933; Richards, 1952;Schulz, 1960; Ogden, 1966; Hall andSwaine, 1976; Ashton, 1977; Huston, 1980;Lescure and Boulet, 1985; Vitousek andDenslow, 1987; Gentry, 1990; Terborgh,1992; ter Steege et al., 1993; Clark, 1994). Asmore data have accrued and more interdis-ciplinary research has been conducted inareas previously considered inaccessible, ithas been possible to further evaluate thespecific mechanisms driving tropical forestsoil–vegetation relationships in light ofother intervening factors, such as climateand disturbance (e.g. Huston, 1994;Clinebell et al., 1995; Duivenvoorden andLips, 1995; ter Steege and Hammond, 2001).Soils are an important medium throughwhich underlying differences in geology,hydrology and topography influence thespatial transitions in composition and struc-ture of tropical forests. Their value inexplaining forest patterns across the land-scape mosaic of the Guiana Shield is of par-ticular significance (see Chapter 7).
This section aims to provide a generaloverview of the classification, distributionand characteristics of soils in the GuianaShield, often drawing comparisons withother tropical forest regions to emphasizethe spatial contrasts that typify this tropicalpedosphere.
Soil classifications systems used in theGuiana Shield
There are four major soil classificationschemes that are currently used to catego-
rize soil properties across the GuianaShield:
1. FAO/UNESCO system and its offspring,the WBR (World Base Reference for SoilResources) international system are usedincreasingly throughout the region, but par-ticularly in Guyana and Suriname (FAO-UNESCO, 1974; FAO, 1988, 1998).2. US Soil Taxonomy classification schemethat has been used widely in Guyana,Suriname, Colombia and Venezuela(USDA, 1996).3. Sistema Brasileiro de Classificação deSolos (CiBCS) used throughout theBrazilian Legal Amazon (EMBRAPA-CNPS,1999).4. Référéntial Pédologique (Baize andGirard, 1995) and its predecessors (e.g.Leveque, 1961; Aubert, 1965) used inFrench Guiana.
Guyana (Stark et al., 1959; Khan et al.,1980) and Suriname (van der Eyk, 1957)also have used rudimentary soil classifica-tion series based on the more common soilforms mainly encountered along theAtlantic coast and sedimentary plains. InGuyana, this consists of several ‘series’ cov-ering soils derived from igneous intrusives(Prosperity Creek), crystalline basementand other silica-rich igneous rock forma-tions (Durban) and unconsolidated Tertiarysediments (Tiwiwid and Kasarama) (e.g.Stark et al., 1959).
The reference base of the FAO WBRconsists of 153 soil units falling variouslyinto 30 main soil groups. Thirteen of thesemain groups occur in the Guiana Shield,but only five account for approx. 90% of thesoils in the area and two widely distributedlowland soil groups, the Ferralsols andAcrisols, represent more than 65% of theshield soil cover.
Classifying soils in the Guiana Shieldusing the 12 Soil Orders of the US SoilTaxonomy also pinpoints five of these thatcover over 90% of the area. Again, two ofthese, the Oxisols and Ultisols, account forthree-quarters of the soils known in theregion (e.g. Westin, 1962).
The Brazilian system of soil classifica-tion consists of 70 soil groups. Five of these
Biophysical Features of the Guiana Shield 49

account for the majority of the soil cover inthe southern half of the shield where theyhave been used. Two of these, theLatossolos and Podzólicos, are believed toaccount for more than 70% of the soils inthe entire Brazilian Legal Amazon (Volkaff,1984; Prado, 1996).
Soil cover in Guyana can be assignedmainly to four large groups within theFrench system of soil classification, in partdue to the small area and rather uniformPrecambrian landscape relative to the otherparts of the shield region. Over three-quar-ters of the area can be included under thebroad groups headed by the SolFerrallitiques, Sols ferrugineux, Sols pod-zoliques and Sols hydromorphes (e.g.Leveque, 1961; Blancaneaux, 1973).
There is some complementaritybetween the various soil classification sys-tems, but generally speaking, less group-by-group equivalency than one would hopefor. These asymmetric relationships areexpressed through inconsistencies in theassignment of field samples across systems.For example, van Kekem et al. (1996) relateacri-haplic and acri-xanthic Ferralsols ofcentral Guyana to the Kandiudults(Ultisols) of the US Soil Taxonomy system,while Dubroeucq et al. (1999) pair haplicand xanthic Ferralsols with Haploperoxesand Acroperoxes (Oxisols). Relationshipsbetween the main soil groups in one systemand those of another are often discordant,with elements found within various majorgroups in one system often falling within asingle group under another.2
The FAO/WBR system has beenadopted here to describe and compare soilsfound within the Guiana Shield and con-trast these with the soils found in othertropical forestland areas. Reference to othersoil names and descriptors is retainedwhere this will assist in linking localknowledge with the broader classificatoryframework.
Main soils in the Guiana Shield
At least 43 of the 153 global soil units rec-ognized under the FAO WBR system (FAO,
1988) are currently known to occur in theGuiana Shield area (Schulz, 1960; Leveque,1961; Westin, 1962; FAO, 1965;Blancaneaux, 1973; RADAMBRASIL,1973–1978; PRORADAM, 1979; Gavaud etal., 1986; Sombroek, 1990; Duivenvoordenand Lips, 1995; UNEP et al., 1995; vanKekem et al., 1996; Ramos and Blanco,1997; Dubroeucq et al., 1999). More than65% of the surface area, however, is coveredby only nine soil units falling in two of themain reference groups: the Ferralsols andAcrisols. The remaining 35% of the areaconsists of approximately 34 units within11 other reference groups reflecting a widerange of soil conditions (Fig. 2.11). Soils arestrongly, but not exclusively, linked totopography and landform (Sombroek, 1990),and the main soils in the Guiana Shieldhave been grouped below according to theirrelative topographic position.
Highland soils
Highland soils are best described as thin,young and weakly developed formationsdistributed in relatively small patches withwidely ranging properties strictly influ-enced by localized biogeochemical condi-tions. They are often intermixed with othersoil groups typically associated with moreextensive lowland formations. Variation inbiogeochemical conditions is strongly asso-ciated with small-scale topographic relief.
CAMBISOLS These soils are patchily asso-ciated with valleys and pediments of thePakaraima Mountain area in easternVenezuela–western Guyana and thefoothills of the Kanuku Mountains inGuyana (Fig. 2.11A, striped areas). Theycan vary in depth, have a relatively highcation exchange capacity (CEC) (FAO,1998) and are composed of the youngerweathering products of mainly basic intru-sive formations (FAO, 1965). In thePakaraima Mountains, these are largelyassociated with the Avanavero Suite (Gibbsand Barron, 1993). Cambisols are notrestricted to highland regions alone. Themottled clays characterizing GleyicCambisols typify many lowland alluvial
50 D.S. Hammond

Biophysical Features of the Guiana Shield 51
plains, while Ferralic Cambisols, particu-larly those in a rudic (stony) phase, aremore commonly encountered on mountain-ous slopes and high hills.
LEPTOSOLS AND REGOSOLS Very shallow,mineral soils recently formed throughweathering (e.g. exfoliation) of exposedrocks along the summits and upper slopesof the Guayana Highland massifs of theRoraima Formation are typically classifiedas Leptosols (aka Lithosols) (Sombroek,1990), but variously intermix with otherupland Regosol and Cambisol soils in rela-
tion to localized changes in topography(Fig. 2.11A). They are characterized by theirshallow depth, abundance of coarse rockfragments and, consequently, virtualabsence of diagnostic horizons. Shallowand weakly formed soils associated withthe slopes and summits of the largerPrecambrian granitic batholiths and outly-ing inselbergs (lajas) are grouped asRegosols. According to SOTER (UNEP etal., 1995), these soils are broadly associatedwith the highland areas in Venezuela,Guyana, northern Brazil (Roraima) andColombia (Fig. 2.11A, black). Topography
Fig. 2.11. The 12 soil reference groups dominating the Guiana Shield pedosphere presented here in foursets approximating an altitudinal gradient from highest (A) to lowest (D) elevations. (A) Leptosols (black,arrows and inside circle), Regosols (grey), Cambisols (striped). (B) Ferralsols (black), Acrisols (grey), Lixisols(striped). (C) Arenosols (black), Podzols (striped). (D) Histosols (black), Gleysols (grey), Plinthosols (striped),Solonchaks (arrow). Soil distributions presented here are based on the combined FAO soil (FAO, 1988)and landform coverages produced at a 1:1 million scale through the SOTER project (UNEP et al., 1995).These soil type distributions are not applicable at smaller scales (see text). Eutric and dystric Fluvisols aredistributed at smaller spatial scales throughout the area and are not presented here.
C
A
D
B

and elevation were most likely of overrid-ing importance in assigning Leptosol andRegosol soils to these regions using theSOTER approach and their true distributionis certainly more interspersed with othersoils than appears in Fig. 2.11. They areassociated with the Parguaza Formation,Imataca Complex, (quasi-)RoraimaFormation, Avanavero Suite, UatumaVolcanics and Mitú complex.
The small-scale impact of localizedchanges in topography on highland soilproperties cannot be overstated. For exam-ple, soil samples collected on the tablesummit (altiplanicie) of the Sierra deMaigualida within the Caura basin region ofVenezuelan Guayana have been describedas Lithic Tropofibrists and Tropohemists(Histosols) in the USDA Taxonomy (Ramos,1997). These soils are often associated withlocalized depressions of poorly drained,stagnating organic matter with little min-eral horizon formation and are more akin tolowland swamp bogs formed in localizedrock depressions or areas of occludeddrainage at much lower elevations (e.g. vanKekem et al., 1996). At lower elevations inthe Cerro Mani–Cerro Chanaro area of theGuayana Highlands, soils on high hillswere, in contrast, identified as TypicKanhapludults (haplic Ferralsols, skeletic?)intermixed with bare rock (Ramos andBlanco, 1997).
Upland and sedimentary plain soils
The undulating hills and valleys andTertiary sedimentary plains of the GuianaShield are dominated by soils that are moreextensively distributed, tend to form largerpatch sizes and do not embrace the almostindescribable spatial transitions in soilproperties that typify the younger soil sur-faces of the highlands. These broad soilunits cover many of the flat, peneplaniclowland troughs, basins and depressionssurrounding and dissecting the much olderexposed Precambrian basement complex.These include large areas between majorrivers in the shield, including between theNegro and Branco, Mazaruni andEssequibo, Berbice and Courentyne and
Orinoco and Negro Rivers (FAO, 1965;Sombroek, 1990). They also extend overmuch of the exposed basement complex,most notably across the TumucumaqueUplands where silica-rich rocks have beenchemically degraded to form deep silt andclay-containing soil horizons (Fig. 2.6B,No. 2).
FERRALSOLS AND ACRISOLS Ferralsols aredeep soils typified by a highly weatheredsubsurface dominated by low-activity clays(saprolite, pipe clays), such as kaolinitewith a relatively high iron content (Baillie,1996). They are largely the product ofextensive in situ weathering and decompo-sition of silica-rich parent material over aprolonged period. Ferralsols dominate mostof the Guiana Shield and are only wide-spread in tropical South America andAfrica (Sanchez, 1976; Richter and Babbar,1991), where tropical forest vegetation restsatop ancient crystalline basement rock,often covered by deep sedimentary depositsof Precambrian provenance. They are vari-ously intermixed with soil types belongingto the Acrisol group throughout the GuianaShield and tropical South America(Sanchez, 1981). Acrisols are also deepsoils characterized by a dense clay subhori-zon, but are generally associated withyounger, less highly weathered parentmaterial, and a clay subhorizon developedlargely through downward clay migration(illuviation) of deposited materials, ratherthan those formed from rock decomposi-tion. They typically contain higher concen-trations of weatherable minerals and activeclay particles than the Ferralsols (UNEP etal., 1995; FAO, 1998), but specific chemicalproperties of soil samples attributed to thetwo groups overlap extensively and thesesoils types are often tightly interwoven atsmaller spatial scales (Cuevas, 2001) andoften separated only by slope position (e.g.Hapludoxs vs. Kandiudults in Dubroeucqand Volkaff, 1998). Duivenvoorden andLips (1995) recognized this relationship byreferring to the dominating lowland soilunits as Ali-Acrisols (Alisols × Acrisols)and Acri-Ferralsols (Acrisols × Ferralsols).
Ferralsols are widespread throughout
52 D.S. Hammond
the upper Berbice Basin and Takutu Grabenand across the Tumucumaque Uplands.They are noticeably less dominant overlarge parts of the western and southern sed-imentary plains and hills in Brazil andColombia where Acrisols become morecommon (PRORADAM, 1979; IGAC, 1993;Duivenvoorden and Lips, 1995) (Fig. 2.11B,grey shading), principally due to the declin-ing influence of stable Precambrian rocksstructures on soil development dynamics(Fig. 2.11B, black shading). Ferralsols (mix-ture of Udults and Orthoxs in USDATaxonomy system) have been assigned tolowland slopes, plateaus and terraceswithin Venezuelan Guayana (Westin, 1962;MARNR, 1985; Gavaud et al., 1986), butSOTER assign a dominant role to Acrisolssoils over most of the Venezuelan Guayanaregion (UNEP et al., 1995) (Fig. 2.11B, greyshading). Fuentes and Madero (1996) indi-cate that the most extensively distributedsoils of the large Caura Basin inVenezuelan Guayana are Ultisols (Acrisols)with a relatively minor occurrence ofOxisols (Ferralsols). In the Caquetá regionof Colombia, Duivenvoorden and Lips(1995) suggest that the increase in Ali-Acrisol cover is largely due to the contribu-tion of deposits from younger Andeanparent material, while Acri-Ferrasol soilsare derived largely from more extensivelyweathered shield parent rock. Both groups,however, show some of the lowest standingnutrient levels and storage capacities rela-tive to most other mesic soil types.
LIXISOLS According to the SOTER data-base (UNEP et al., 1995), soils of the Lixisolgroup are generally found in the lowlandbasins of western Bolivar and Amazonasstates along the northern rim of the GuianaShield (Fig. 2.11B). These are generallyassociated with the floodplain areasembracing the upper Ventauri, upperCuyuni and confluences of the Orinocowith the Caura, Aro and other large tribu-taries. They are generally classified as amixture of Psamments and Ustoxs in theUSDA Taxonomy (MARNR, 1985; Gavaudet al., 1986).
The physical properties of these soils
are very similar to those of the Acrisols andLuvisols and are difficult to distinguish inthe field (FAO, 1998). Generally, they areconsidered to be younger, and more fertile,than Acrisols.
ARENOSOLS AND PODZOLS – WHITE SANDS
Large areas within the sedimentary plainsare dominated by soils that largely consistof coarse sand, with varying, but always rel-atively small, amounts of clay, silt or loamand no rock fragments. The extreme situa-tion is exemplified by the very deep albicArenosols, sometimes called giant Podzols(Baillie, 1996). The upper horizons of thesewhite, or bleached, sands (sable blancs) canextend to depths of several metres, andshow some of the lowest CECs known, butalso very low aluminium saturation (vanKekem et al., 1996). The pure sand matrixhas very little, if any, water-holding capac-ity and dry seasons in the region bring aperiod of dry down that results in virtuallyno moisture remaining in the top horizons ofdeep deposits (e.g. Jetten, 1994). Otherarenosolic soils on slopes and in valleys oftenshow an increase in clay content with depth(e.g. gleyic Arenosols), but remain highlyinfertile. These can also vary in their hydro-logical properties, particularly the effects offluctuating water tables on clay illuviationactivity and hardpan development.
Podzols represent another variation ona sand-dominated theme. They tend to con-tain more silt than Arenosols in a patch-work of bleached sand and silt pocketsoverlying a relatively thin subhorizon ofcemented organic matter and aluminium oriron oxides (hard pan, humic pan or ort-stein) (Sombroek, 1990; Baillie, 1996; FAO,1998). It is thought that this hard pan isformed through the action of fluctuatingwater tables that gradually leach organicmatter and clay constituents from the upperprofile down to a level consistent with theminimum water level, where these becomeconcentrated (podzolization) (Cooper,1979). This cemented layer occludes verti-cal drainage to varying degrees and allPodzols remain saturated during (part of)the year, but may briefly dry down in theupper horizon to levels achieved by exces-
Biophysical Features of the Guiana Shield 53

sively drained Arenosols during dry peri-ods (Jetten, 1994; Coomes and Grubb,1996). The depth and horizontal extent ofthe hard pan may vary and this influencesthe degree of drainage and duration offlooding (van der Eyk, 1957; Klinge, 1968).Some Podzols remain saturated throughoutmost of the year due to the presence of ahard pan at shallower depths or a topo-graphic location susceptible to regularriverine flooding (groundwater Podzols)(Bleakley and Khan, 1963). This seasonaloscillation between flood and drought con-ditions combined with low nutrient reten-tion make these soils some of the poorestknown in the tropics and represent one ofthe most unique challenges to plant life(Heyligers, 1963).
Arenosols and Podzols are commonlyencountered throughout the sedimentaryplains of the Guiana Shield (Fig. 2.11C), buttend to be found in large, relatively isolatedpatches surrounded by sandy soils withpronounced clay subhorizons, such as theFerralsols and Acrisols. The transition fromthese sand-dominated soil patches to neigh-bouring types with higher clay and silt con-tent is often abrupt. Their distribution isstrongly shaped by those of the Tertiarysedimentary formations covering theregion, but usually represent a sub-section of this cover (compare Fig. 2.11Cwith Fig. 2.4N). For example, Schultz(1960) estimated that albic Arenosolsaccounted for only 17% of the ZanderijFormation in Suriname, the remaining areadominated by clay and silt-containing ferra-solic soil types. In Guyana, they are thoughtto occupy only 26% of the sedimentarycover attributed to the Berbice Formation,about 8% of the national land area (FAO,1965).
PLINTHOSOLS – LOWLAND NEO-LATERITES LikePodzols, the Plinthosols (‘groundwater lat-erites, lateritas hydromórficas, schol soils’)can also be characterized by a hardpan attheir more advanced stages of development.This, however, is typically found at or nearto the surface (<100 cm depth) and isformed from the cementation of iron or alu-minum-rich kaolinite (plinthite), rather
than organic matter (FAO, 1998). This hard-pan, better known as laterite, and also vari-ously called petroplinthite, ferrite, ripio,arrecife, ferricrete, cuirass, ironpan or iron-stone (Huber, 1995a; Baillie, 1996; vanKekem et al., 1996; Tardy, 1997; FAO,1998; EMBRAPA-CNPS, 1999) is exclu-sively linked to clay and iron-rich soils thathave been exposed over a period of time tofluctuating water tables within a low-lyingsedimentary plain.
Plinthosols are more commonly associ-ated with soil series in the Amazon Basinthan in any other tropical region, thoughtheir distribution is pan (sub)tropical(Richter and Babbar, 1991; FAO, 1998). Thelargest fraction of their mapped area inSouth America is located in the basin below100 m asl that is west of Manaus. Extensiveflooding and drying was concentrated inthis section of the Amazon and Sub-Andean basins during the Pleistocene(Irion, 1984). Within the shield area,Plinthosols can be found to occur in associ-ation with other soil types across large areasof the Rio Negro–Amazon sedimentaryplains, along the Atlantic coastline and inthe Takutu Graben region where floodingconditions continue to support their forma-tion on iron–aluminium rich substrates(Fig. 2.11D). Plinthosols are estimated tocover about 7% of the Brazilian Amazon(Richter and Babbar, 1991) and between 8%and 12% of Guyana (FAO, 1965).
Upland laterite soils – Palaeo-plinthosols andinverse topography
Plinthosols are the contemporary equiva-lent of much older iron hardpans nowfound covering many ridges, benches andhill tops (cuirasses) in the upland and high-land areas. They are believed to have beenformed during the Eocene-Oligocene(Berrangé, 1977) or Plio-Pleistocene (Sinha,1968), but with possible episodes dating asfar back as the early Palaeozoic (Gibbs andBarron, 1993). In some instances, olderforms found in lowland settings havedegraded and then recemented later, mak-ing it difficult to distinguish them from neo-laterites. Neo-laterites are generally
54 D.S. Hammond
considered to have formed within the last10,000 years (Sinha, 1968).
Anyone who has travelled throughparts of the forested or savanna interior ofthe shield has probably encountered lat-erite in one of its various forms. However,they may not have fully understood howstrongly petroplinthic formation, or lateri-zation, has shaped modern topography ofthe Guiana Shield. As you travel across oneof the many boulder-strewn hills coveredwith pot-holed and pea-gravelled red rock,you may have in fact been moving on whatwas once a flooded valley floor. At one timethese palaeo-valleys were subject to similarhydrological conditions seen in areas occu-pied by Plinthosols today. As erosion pro-ceeded to reshape the former landscape, theiron hardpan that had formed under fluctu-ating water table conditions in the valleysreduced the rate of valley weathering rela-tive to the surrounding uplands. This lefterosion of the surrounding highlands tooutpace the valleys. Eventually, the formerupland areas eroded to a lower level, form-ing new valleys. The old valleys, nowcapped with laterite and relatively impervi-ous to degradation through normal weath-ering processes, transformed into strings ofupland hills and ridges. Later regionaluplifting further emphasized the erosionaldifferences between laterite uplands andcatalysed erosion in valleys as new bevelsreinvigorated the deformation process. Thispronounced inverse topography is seenthroughout much of the Guiana Shieldlandscape today, but particularly withinand along the major depressions that weresubjected to staggered periods of floodingthroughout the Cenozoic. Repetition of thelaterization process in ‘new’ valleys over amuch longer period of time has created aseries of planation surface relicts(Choubert, 1957; McConnell, 1968).
The formation of Plinthosols and lat-erites requires a relatively high concentra-tion of iron in the parent material (Tardy,1997). Plutonic (ultra)mafic intrusives typi-cally present higher concentrations of iron(and magnesium) (see Fig. 2.5) and it is notsurprising that most laterite-capped hillsand mountains of the Guiana Shield are
formed (but not exclusively) atop exposedelements of those intrusive rock suites thathave a high ferro-magnesium (and alu-minium) content (e.g. van der Eyk, 1957).The most prevalent of these are the unmeta-morphosed dolerites of the Basic DykeSuite emplaced during the Permian,Triassic and Jurassic periods (Table 2.1)(Priem et al., 1968; Berrangé, 1977).
Upland palaeo-plinthosols are classi-fied differently from their modern counter-parts because weathering over time hasbroken down, dissected, dissolved andoccasionally reconsolidated the ironpan invarious ways. Where the hardpan remainsrelatively solid, continuous and close to thesurface, the soils have been classified asbeing Leptosols in a petroferric phase(FAO, 1988), or more recently reclassifiedas dystric Plinthosols (FAO, 1998). Wherehardpan has degraded, laterization has pro-duced smaller aggregates rather than sheets,or deformation has led to mixing in withsubhorizons of more silicic content, thesoils can be classified as Ferralsols in askeletic phase (e.g. van Kekem et al., 1996).
Subterranean laterites – calcine bauxite
In some instances, the plinthite or hardpanis covered by very deep sedimentary cover(e.g. Berbice Formation in Guyana) that hasbeen washed clean of any organic or min-eral coatings. When the overlying sedimen-tary cover is substantial, buried plinthic orpetroplinthic horizons are no longer con-sidered as forming part of the pedospherebut rather as mineral deposits. Under theseconditions, chemical weathering proceedsat a low pH in a reducing, rather than oxi-dizing, environment and the iron oxidesthat would normally bind to formPlinthosols at the surface are instead dis-solved or kept in solution as free iron. Inmany cases, high concentrations of aluminaremain, attached only to the surroundingclay matrix and relatively free of iron(Krook, 1969; Gibbs and Barron, 1993).These form most of the major high-gradebauxite deposits in the Guiana Shield,although lower grade deposits (e.g. higheriron content) have been formed through
Biophysical Features of the Guiana Shield 55

other bauxitization pathways (e.g. BakhuysMts in Suriname; Krook and de Roever,1975). (See also Chapter 8).
Soils of the coastal and riverine floodplains
The youngest soils in the shield area arethose currently and continuously beingshaped by fluvial, tidal, stagnating andanthropogenic processes operating withinthe long, narrow coastal and riverine flood-plains that embrace and dissect the oldersedimentary plains, uplands and highlands.They are often collectively referred to asalluvial soils, but include a number of dif-ferent soil types recognized under the WBR.They are typically located at the lowest ele-vations within each landform whereverflooding is permanent or seasonal. Themost extensive cover is restricted to themargins of the Guiana Shield in the form ofthree narrow strips, one running parallel tothe Atlantic seashore between the Orinocoand Amazon and another two mirroring thecourse of the lower Branco and NegroRivers in Brazil, respectively (Fig. 2.11D).Floodplain soils properties are also foundassociated with smaller waterways through-out the shield and with numerous naturaland artificial swamplands formed throughlocalized depressions. Water is the over-whelming factor shaping all of the soils typ-ically encountered in the coastal andriverine floodplains and as a consequence,most floodplain soil types exhibit relativelyfew diagnostic horizons due to continuousaction of the fluctuating tides and riverstages.
ALLUVIAL SOILS – FLUVISOLS AND GLEYSOLS
Fluvisols have upper layers that are contin-uously changing as fresh materials are regu-larly deposited and removed through tidaland fluvial action and are typified by thepresence of young organic matter withinthe upper horizons (USDA, 1996; FAO,1998). Floodplain areas that are saturatedfor most of the year are characterized byGleysols. These soils are characterized byreducing conditions and a low pH thatbring iron into solution in a manner similarto that forming calcine bauxite strata, but
much closer to the surface. Fluvisols andGleysols are among some of the youngestsoils typically found in tropical forest areasand as a consequence of their age and modeof development are found as a minor soiltype throughout the tropical forest regionsof the world (Richter and Babbar, 1991).They arguably represent the youngest soilsin the Guiana Shield.
The constant reworking of the upperhorizon of fluvisolic soils principallyinvolves the addition of silts and claysthrough flocculation (colloidal suspensionas aggregates), but transfer of larger parti-cles through saltation (bouncing along thechannel floor) and organic matter can alsotake place at higher current speeds. Theresult of this action is a regular rechargingof the nutrients in the upper horizon. Themagnitude and quality of the recharge,however, depends on the nutrient source(Sombroek, 1991). Rivers draining theAndean cordillera and Central Americansierras transport and deposit much largervolumes of relatively high activity clayscompared to black and clear water riversdraining the Guiana Shield, creating a strik-ing contrast in the concentrations of nutri-ents in the upper horizon(s) of soils withinand outside the shield (Fig. 2.12) (Sollins etal., 1994; van Kekem et al., 1996; Zarin,1999). Even differences in mineral prove-nance within relatively young geologicallandscapes, such as the Andes, can lead tosignificant differences in the concentrationsof exchangeable nutrients transported anddeposited to form Fluvisols and other allu-vial soils (Zarin, 1999). At both scales, dif-ferences can begin to affect vegetationpatterns.
Fluvisols are thought to cover approxi-mately 2% of tropical South America(Richter and Babbar, 1991), but more than85% of this area is found within the Sub-Andean Trough and Amazon Downwarpareas and mostly outside of the GuianaShield region (RADAMBRASIL, 1973–1978; IGAC, 1993). Gleysols are more com-mon, covering nearly 4% of tropical SouthAmerica and again, largely concentrated inthe major sedimentary basins and depres-sions criss-crossing the Amazon. Gleysols
56 D.S. Hammond
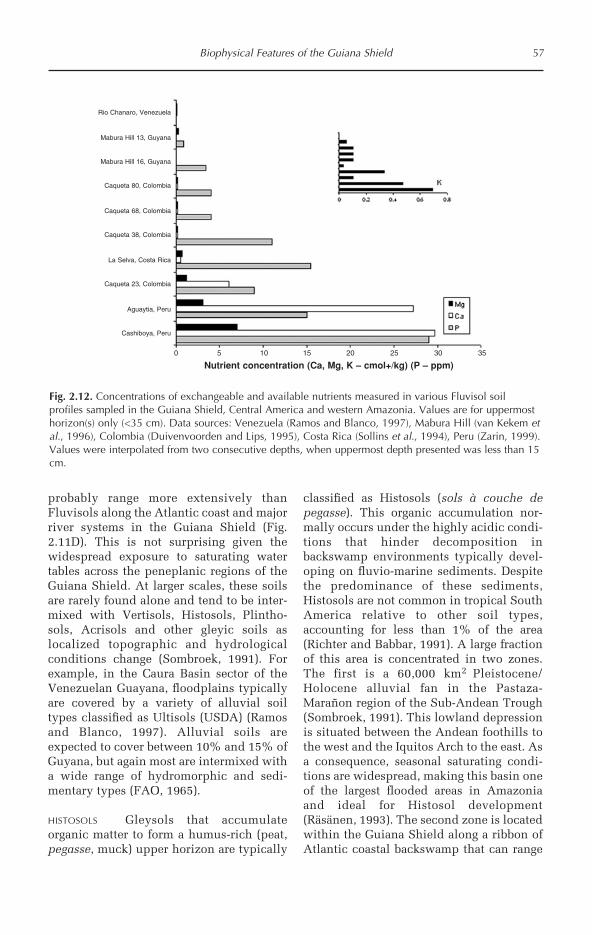
Biophysical Features of the Guiana Shield 57
probably range more extensively thanFluvisols along the Atlantic coast and majorriver systems in the Guiana Shield (Fig.2.11D). This is not surprising given thewidespread exposure to saturating watertables across the peneplanic regions of theGuiana Shield. At larger scales, these soilsare rarely found alone and tend to be inter-mixed with Vertisols, Histosols, Plintho-sols, Acrisols and other gleyic soils aslocalized topographic and hydrologicalconditions change (Sombroek, 1991). Forexample, in the Caura Basin sector of theVenezuelan Guayana, floodplains typicallyare covered by a variety of alluvial soiltypes classified as Ultisols (USDA) (Ramosand Blanco, 1997). Alluvial soils areexpected to cover between 10% and 15% ofGuyana, but again most are intermixed witha wide range of hydromorphic and sedi-mentary types (FAO, 1965).
HISTOSOLS Gleysols that accumulateorganic matter to form a humus-rich (peat,pegasse, muck) upper horizon are typically
classified as Histosols (sols à couche depegasse). This organic accumulation nor-mally occurs under the highly acidic condi-tions that hinder decomposition inbackswamp environments typically devel-oping on fluvio-marine sediments. Despitethe predominance of these sediments,Histosols are not common in tropical SouthAmerica relative to other soil types,accounting for less than 1% of the area(Richter and Babbar, 1991). A large fractionof this area is concentrated in two zones.The first is a 60,000 km2 Pleistocene/Holocene alluvial fan in the Pastaza-Marañon region of the Sub-Andean Trough(Sombroek, 1991). This lowland depressionis situated between the Andean foothills tothe west and the Iquitos Arch to the east. Asa consequence, seasonal saturating condi-tions are widespread, making this basin oneof the largest flooded areas in Amazoniaand ideal for Histosol development(Räsänen, 1993). The second zone is locatedwithin the Guiana Shield along a ribbon ofAtlantic coastal backswamp that can range
Nutrient concentration (Ca, Mg, K – cmol+/kg) (P – ppm)
Fig. 2.12. Concentrations of exchangeable and available nutrients measured in various Fluvisol soilprofiles sampled in the Guiana Shield, Central America and western Amazonia. Values are for uppermosthorizon(s) only (<35 cm). Data sources: Venezuela (Ramos and Blanco, 1997), Mabura Hill (van Kekem etal., 1996), Colombia (Duivenvoorden and Lips, 1995), Costa Rica (Sollins et al., 1994), Peru (Zarin, 1999).Values were interpolated from two consecutive depths, when uppermost depth presented was less than 15cm.
Rio Chanaro, Venezuela
Mabura Hill 13, Guyana
Mabura Hill 16, Guyana
Caqueta 80, Colombia
Caqueta 68, Colombia
Caqueta 38, Colombia
La Selva, Costa Rica
Caqueta 23, Colombia
Aguaytia, Peru
Cashiboya, Peru
0 5 10 15 20 25 30 35

up to 65 km inland between the Orinocoand Berbice Rivers (Fig. 2.11D) (FAO,1965). This band continues to a lesserextent along the coast of Suriname (van derEyk, 1957), French Guiana (Leveque, 1961),Amapá and a portion of the Orinoco delta(Westin, 1962; MARNR, 1985). This soiltype has been estimated at 4% of the landarea in Guyana (FAO, 1965), but is less than1% in other shield countries (van der Eyk,1957; Westin, 1962). Histosols can also befound in patches at more local scales.Subsidence caused by subterranean decayof surface laterites, drainage impedimentscaused by human activity and perchedwater tables can all create the conditionsneeded for localized accumulation oforganic matter and development of histicsoil horizons.
Histosols can also be found at localizeddepressions in large Podzol plateaus in theRio Negro Basin where a spodic horizonoccludes drainage and sparks a process oflateral transformation from Podzol toHistosol as the occluding spodic horizonmoves upward, raising the perched watertable and stimulating further organic depo-sition and retention (Dubroeucq andVolkaff, 1998). These local peat swampssituated within white sand plains arealso known to occur in the Burro-BurroRiver and Demerara regions of Guyana(D. Hammond, personal observation;Hawkes and Wall, 1993; van Kekem et al.,1996), but are normally classified as carbicPodzols due to the thinner organic matterhorizon.
The accumulation of organic matter inthe histic horizon can exceed 10 m alongthe area of greatest development betweenthe Amakura and Pomeroon Rivers in thenortheastern corner of the shield (FAO,1965), declining to 2–3 m in Suriname (vander Eyk, 1957) and normally to depths lessthan 2 m at inland lowland forest locations(e.g. Duivenvoorden and Lips, 1995;Fuentes and Madero, 1996; van Kekem etal., 1996; Dubroeucq et al., 1999). Histosolsare also found on the exposed summits ofhighland tepuis, although these developunder much lower ambient temperaturesand are in many ways more closely related
to temperate peat bog soils (Gavaud et al.,1986; Huber, 1995a).
MANGROVE AND ESTUARINE SOILS – SOLONCHAKS
Solonchaks are Gleysol-like coastal fore-land soils dominating estuarine and tidalmangrove areas. They are principally char-acterized by their high electrical conductiv-ity due to saturation with a brackishsolution of readily soluble salts derivedfrom seawater (FAO, 1998). They are notwidely distributed in South America,account for less than 0.1% of the BrazilianLegal Amazon (Richter and Babbar, 1991)and are largely restricted to a very thin rib-bon of land directly in contact with thetidal belt area of the Atlantic coastal flood-plain. According to SOTER, a thin strip ofcoastal mangrove in southeastern Amapá,part of the Amazon estuary, is dominatedby Solonchak-type soils (UNEP et al., 1995)(Fig. 2.11D). These are known to extendacross Marajó Island (Sombroek, 1991).Many areas of Solonchak soils have beenmodified through human activity, particu-larly where agricultural empoldering hasreplaced brackish seawater with freshwaterand their former distribution was in all like-lihood more extensive, as in the case ofmuch of the Atlantic coastal perimeter ofthe shield area. In places, Solonchaks arefound to incorporate an acid sulphate layer(‘cat clays’) that developed from sulphide-bearing strata oxidizing after drainage(Baillie, 1996). These areas, where theydevelop, are highly toxic to plant life,showing one of the lowest soil pH condi-tions known to occur in the tropics (lessthan 3.0).
HUMAN SOILS – ANTHROSOLS A wide rangeof soils in the Guiana Shield have beenmodified through various agricultural activ-ities (e.g. tilling, irrigating, draining, forestclearing and burning) that accompany foodand livestock production. These are gener-ally referred to as Anthrosols. Other humanactivities, such as mining, urban and villagesettlements, forestry, and other forms ofinfrastructural development have depositeda wide range of anthropogeomorphic mate-rial in soils and these have altered the phys-
58 D.S. Hammond
ical and chemical properties of the pedo-sphere at deposition sites. Most Anthrosolsand other human-altered soils are concen-trated along the main river and coastalfloodplains. The combination of accessibil-ity and relatively high fertility (where theseare not stagnic or salic) have made these thesoils of choice for cultivation over the last13,000 years (e.g. Roosevelt, 1991) (seeChapter 8). In riverine areas subject tostrong and rapid deposition–erosion cycles,the pedological signature of human usemay not last long enough to significantlychange the dominant fluvic properties asso-ciated with continuous sedimentation. Incontrast, upland (terra firme) soils may bearthe imprint of former agrarian activitymuch longer. Balée (1989) estimates thataround 12% of terra firme forests in theAmazon are anthropogenic and this figuremay prove to be even higher. Perhaps themost well-known soils believed to be asso-ciated with former human inhabitation andland use are the nutrient-rich terra prêta doíndio (Indian black land) soils fromFerralsol-dominated locations along themain lowland rivers in Brazil, Peru,Ecuador and Colombia (Eden et al., 1984;Balée, 1989; Wood and McCann, 1999). Anassociation of these soils with relatively fer-tile Nitisols (Alfisols, terra roxa estrutu-rada) borne on mafic intrusives has beensuggested for some locations in westernAmazonia (Moran, 1995) and it is likelythat geological control over pre-Columbianagricultural site success cannot be fully dis-counted despite views suggesting thathighly infertile soils have been managed inthe past to make them highly suitable toagriculture (Wood and McCann, 1999).
Formative factors in Guiana Shield soildevelopment
Given the manifestly important role soilformation and function play in agriculturaldevelopment, it is not surprising that of allthe scientific disciplines, only the geologi-cal development and composition of theGuiana Shield, and its impact on commer-cial mineral extraction, has a more exten-
sive published record of research withinthe region. The commercial consequencesof this enquiry, however, have not provennecessarily to be entirely of social benefit.Moreover, the impacts of mineral and agri-cultural development have not oftenproven to be comfortably compatible withthe understood prehistoric rate and courseof ecosystem change within the shield (seeChapters 8 and 9). Understanding the evo-lution of soils, their present-day distribu-tion and characteristic properties helps toshed light on one of many controls exertedby the physical landscape on Guiana Shieldforests, their distribution and composition.
A review of the main soils of theGuiana Shield has shown a complex ofultra-weathered substrate that can bebroadly characterized by relatively low pH,widespread and record-setting nutrientdeficiencies (base saturations of <1% andcation exchange capacities of <0.1cmol+/kg are common) and low organic car-bon content (except histic swamp soils andindurated layers of podzols). As with allattempts to generalize, there are manyexceptions and the most significant of theseare characterized below. Many factors haveinfluenced soil development in the region,as they have done elsewhere, and it is notthe purpose here to review universally rec-ognized soil-forming processes or the influ-ence of local landscape attributes, such asslope position (Jenny, 1980). Rather, I hopeto highlight and qualify a number of forma-tive factors that to one extent or anothercombine in distinguishing the soil environ-ments of the shield region from those foundbeneath other tropical forestlands (andsavannas). Four aspects of the underlyinggeological and climatic history of the regionin particular assist in understanding howcertain broad soil types have come to dom-inate large areas throughout the GuianaShield.
Age matters: Precambrian vs. Cenozoic
More than 90% of the modern GuianaShield surface is shaped by underlying rockformations set in place either more than 600million (Precambrian) or less than 70 mil-
Biophysical Features of the Guiana Shield 59

60 D.S. Hammond
lion (Tertiary) years ago (Fig. 2.13). Therecord of diastrophic activity in the shieldduring the intervening Palaeozoic/lowerMesozoic appears limited to minor faultfracturing and depositional activity alongits margins and in the Takutu graben (Gibbsand Barron, 1993) (Fig. 2.3). All but one ofthe major tectonothermal episodes shapingthe mineral composition of the igneous andmetamorphic parent rock were completedby the upper Proterozoic. Only swarms ofdykes and sills forming the Apotoe DykeSuite were emplaced during the earlyPhanerozoic. Weathering and sedimenta-tion phases predominantly shaped the geo-morphic evolution of the shield regionthroughout the Palaeozoic and Mesozoiceras (Fig. 2.4L), but the evaporates, iron-stones, clastics and other sedimentary rocksformed from these deposits are now largelyburied by the massive and extensive influxof unconsolidated sediments that tookplace during the Cenozoic, mainly due tothe uplift of the Andes and frequent sea-level movements over the pleni-glacial (Fig.2.4N).
Only the (sub)tropical forest soils atopthe exposed Precambrian crust of the Manand Benin–Nigeria Shields of West Africa,the northern half of the Brazilian Shieldand the Indian Craton compare in surfacearea with those of the Guiana Shield(Chapter 1, Fig. 1.2 (Goodwin, 1996)). Thesoils of all of the other major tropical forestregions in the world are principally derivedfrom much younger, and active, parent rockassociated with volcanic activity and oro-genic uplift dating back no more than 30million years BP (Borneo, most of PapuaNew Guinea, SE Asia, Polynesia, CentralAmerica, Caribbean) or have formed inlarge sedimentary basins (AmazonDownwarp, Sub-Andean Trough, CongoBasin, Deccan Traps). The characteristics ofthese ‘young’ soils borne from primaryweathering of volcanic, as compared to plu-tonic, rock strike a significant contrast (e.g.Cambisols, Luvisols, Andosols, Nitisols,Kastanozems vs. Ferralsols, Arenosols,Podzols, Plinthosols). Even when consider-ing only the soils formed atop Cenozoicsedimentary deposits, many of the soils
Fig. 2.13. Approximate age intervals (in Ga BP) of the different rock formations making up the present-dayGuiana Shield landscape according to radioisotopic, palynological and stratigraphic dating of rock andsediment referenced in Gibbs and Barron (1993). Note that Precambrian ages (left of arrow) reflect bothnew rock formation and re-activation of previously formed rock, while Phanerozoic formations (right ofarrow) are largely sedimentary (except the Apotoe Dyke Suite).
> 3
.4
3.4–
3.1
3.1–
2.8
2.8–
2.5
2.5–
2.3
2.2–
1.9
1.9–
1.6
1.6–
1.3
1.3–
0.9
0.9–
0.6
0.6–
0.3
0.3–
0.1
< 0
.1
Rock age (Ga BP)
Imat
aca
bath
olith
% o
f G
uia
na
Sh
ield
are
a
TA
TE70
60
50
40
30
20
10
0

dominating Central America, theCaribbean, the western Amazonian forelandand SE Asia have been formed from pri-mary weathering surfaces created throughrelatively recent tectonic and volcanicmountain-building processes. These sedi-mentary processes are active and continu-ously recharging depositional basins withnew material from abundant weatheringsurfaces. In contrast, most Tertiary-agedsediments in the Guiana Shield have beenredeposited from secondary or tertiarypoint sources as a consequence of moregradual episodic change, often associatedwith the rise and fall of sea-levels and tec-tonic uplifting. The long history of soilmaterial formation is inextricably associ-ated with the dynamics of soil materialmigration from the highland and upland‘islands’ into subsiding depressionsthroughout the shield area.
Movement matters: autochthonous vs.allochthonous processes
The source–sink relationship betweenupland areas largely structured byPrecambrian rock and the reworked sedi-mentary surfaces of the lowland plains hasproduced a major dichotomy in characteriz-ing soil formations of the Guiana Shield.The breakdown of mainly Precambrianrocks in situ has created a number of pri-mary soil groups. These display contrastingchemical and physical properties that mir-ror differences in their parent material (fel-sic vs. (ultra)mafic vs. sedimentary) and thepalaeo-climatic conditions under which theuppermost portions of parent rock were bro-ken down to form soil. Subsequent erosionand redeposition of these autochthonousmaterials has over an extended period oftime created a new set of secondary,allochthonous soil types that are commonlyassociated with the Cenozoic sedimentaryplains, but also savannas and more local-ized valleys in the upland and highlandregions of the shield. The properties of thesesecondary soil groups in turn reflect theirown relatively brief life history of changingwater table conditions, biological activityand climate over the last 70 million years.
The main, and oldest, autochthonoussoils in the Guiana Shield are representedby the Ferralsol, Acrisol and (to muchlesser extent) Lixisol groups (FAO/WBRclassification). The properties of these soilsprincipally reflect chemical weatheringprocesses dominating soil formation underwarm and wet environmental conditionsmodulated by forest cover. These soils arerecognizable as forming much of thePrecambrian Rolling Hills, Guiana Uplandand Guayana Highland landforms.Chemical weathering proceeds mainlythrough contact between water and rockminerals under closed forest cover, creatinga heavy clay subhorizon (saprolite).Ambient temperature, mineral attributes ofthe rock, acidity of the water and the dura-tion and frequency of their contact controlthe rate of chemical reactions driving thebreakdown process.
The allochthonous soil materials in theGuiana Shield are represented by two maingroups. The older of these two groups con-sists of the Arenosols and Podzols associ-ated with highly leached Plio-Pleistocenesediments, and largely forming the TertiarySandy Plains. The second, younger group,consisting mainly of Histosols, (humic andeutric) Gleysols and to a lesser extentFluvisols, is linked to recent and continu-ing deposition of Amazon silts and claysalong the Atlantic coast and shield sedi-ments along river floodplains under varyinghydrological conditions. They fall mainlywithin the Recent Coastal Plains. Theiron-sesquioxide rich Plinthosols canfall in either group, depending on theirtopographic position and concretionarystage, both in part reflecting on age of thesoil.
Arenosols and Podzols have beenaffected by chemical weathering of theirconstituent minerals at numerous stages.Originating from in situ breakdown of meta-morphosed Precambrian granites, volcanicsand, most importantly, Roraima conglomer-ates and sandstones, the weathered prod-ucts were then fluvio-deltaicallytransported in subsiding depressions dur-ing periods of inland sea movement(Bleakley, 1957). Once deposited, these in
Biophysical Features of the Guiana Shield 61
turn were increasingly weathered(Heyligers, 1963), but starting from a bench-mark defined by the previous weathering,not rock-forming, processes. Dubroeucqand Volkaff (1998) suggest that the largePodzols of the upper Rio Negro have devel-oped in situ as one stage in a lateral trans-formation process that entails thedeformation and planation ofOxisol/Ultisol-dominated hills and subse-quent depletion of clays from these soils(Ferralsols) through podzolization.Podzolization commences as changes inhorizontal water table movements and fil-tration of humic materials spark the devel-opment of a spodic horizon andconsequently further elevation of the watertable. Both theories may be complementaryin describing the evolution of these soils,only at different spatial and temporalscales. Water, as both a weathering anddepositional agent, is implicated in bothproposals and clearly has been the maincatalyst in shaping the attributes of bothautochthonous and allochthonous soils inthe Guiana Shield.
Water matters: flooding, oscillating watertables and coastal migration
Water has arguably been the most impor-tant surficial agent affecting the physicallandscape of the Guiana Shield. Its role inthe formation of soils can be broadly attrib-uted to past and present fluctuations in themarine and freshwater tables that have ledto flooding, drought and coastal migration(sea transgression–regression). Water tablescan be viewed as consisting of an amplitude(stage height), wavelength (stage duration)and frequency (seasonal, historical occur-rence) (see ‘River, Lake and Tidal Systems’,below). Different combinations of thesethree parameters can describe most soilattributes found in the Guiana Shieldbecause most areas have been significantlyaffected by changes in the water table inone way or another (e.g. hardpan forma-tion), at one time or another (e.g. lateriteplanation surfaces).
Fluvisols form through flooding thatoccurs for several days or months on an
annual or supra-annual basis. The deliveryof new sediments at an average frequency,through large increases in stage height (highamplitude), but over a relatively brief dura-tion (short wavelength) recharges the upperhorizon of soils in these areas while impor-tantly maintaining an oxidizing environ-ment. Gleysols are also flooded frequently,but normally at lower stage heights (modestamplitude), for a greater duration (very longwavelength) and every year (very high fre-quency). Histosols (swamp and bog soils)have an even more pronounced flat-lineprofile. Akin to Fluvisols, Gleysols andHistosols, these soils are also rechargedthrough the addition of silts, clays andorganic matter. Due to the long wavelengthand high frequency of flooding conditions,however, these soils are characterized by areducing, rather than oxidizing, environ-ment.
The impact of historic, mainlyPleistocene, fluctuations in sea level onsoils in the Guiana Shield is most obviousat large spatial scales in the low-lyingdepressions, grabens and downwarpingsfound throughout the region. Extensive andprolonged coastal inundation combinedwith its impeding effects on freshwaterdrainages created deltaic, estuarine, lacus-trine and littoral depositional conditions(McConnell, 1958; Bleakley and Khan,1963; Sinha, 1968; Daniel, 1984) that havecontributed to the extensive formation ofArenosol, Podzol and Ferralsol-dominatedsurfaces throughout the main lowland areasalong the rim of the exposed basement‘islands’.
Fluctuating water tables have also beenthe main agent responsible for the forma-tion of Plinthosols, and eventually hard-ened laterites, in many areas. Plinthosolsdevelop from highly weathered soils thathave relatively high iron contents, such asFerralsols. When these soils are exposed toa series of water table fluctuations, the irongoes into solution, ‘washes’ through the soilmatrix, and is deposited as a concentratedclay band, called plinthite, at the zone ofintermittent saturation. Laterite forms whenthe plinthite precursor undergoes an ‘irre-versible drying’ phase after the water table
62 D.S. Hammond
lowers during drier climatic intervals, oftenforming multiple layers as the loweringprocess occurs in stages (Bleakley, 1964).Iron cations within the plinthite then fullyoxidize and concretize to form hardenedironstone layers of varying thickness anddensity. The importance of rock prove-nance in delivering the iron needed for lat-erite development is another factorinteracting with water that has contributedto the modern soil landscape of the GuianaShield.
Mineral matters: granitoids, basic intrusivesand Roraima sedimentaries
The conditions that have led to rock forma-tion and persistence vary widely within theGuiana Shield. This is reflected, for exam-ple, in the contrasting elemental composi-tion of extrusive and intrusive rockformations in the region (see Fig. 2.5) andthe relative contribution of sedimentaryand metamorphic rock types in shaping thesharply contrasting topographic relief dom-inated by sedimentary plains, inselbergsand tepuis (see Fig. 2.8). Generally speak-ing, parent material plays an important rolein shaping soil properties, but with time itsimpact can become one of soil horizonthickening, rather than soil horizon diversi-fication (Hole, 1961, cited in Dubroeucqand Volkaff, 1998). Only where parent rockis close to the surface and covered byyounger, thin-horizoned soils does horizondevelopment proceed dynamically. Theproperties of deeper, more highly weath-ered soils formed in geologically stableregions are believed to eventually ‘de-couple’ from the underlying rock strata(Burnham, 1989). Numerous authors havecommented on the impacts of varying min-eral content of parent material on soil typeand properties in South America and othertropical regions (Harrison and Reid, 1911;Hardy and Follet-Smith, 1931; van der Eyk,1957; Jenny, 1980; Burnham, 1989;Sombroek, 1991; Huber, 1995a; Baillie,1996; Osher and Buol, 1998; Leigh, 1999).Importantly, this geological variation canbe indirectly, but strongly, associated (viasoil) with changes in forest composition
and structure (Richards, 1952; Ogden, 1966;Huston, 1980; Duivenvoorden and Lips,1995).
Mineral provenance in the GuianaShield is most visibly expressed in soilproperties through three main pathways: (i)in situ formation of clays; (ii) supply of sed-iments to lowland floodplain and sedimen-tary plain soils; and (iii) development oflaterites.
TATE Granitoids dominate the geologi-cal landscape of the Guiana Shield (Fig.2.4D). As a group, they consist of a complexmix of granites, syenites, diorites, gneissesand amphibolites, among others. All ofthese granitoids are composed principallyof minerals, such as k-feldspar (KAlSi3O8)and quartz (SiO2), which contain relativelyhigh concentrations of silica and alu-minium (Fig. 2.5) (Gibbs and Barron, 1993).K-feldspar decomposes into kaolinite(Al2Si2O5(OH4)) through the hydrolyticaction of carbonic acid (H2CO3) – carbondioxide gas dissolved in water. Potassium,chlorine and silica dioxide are dissolvedand washed away, leaving only kaolinite.Under the extensive chemical weatheringregime found under tropical forests, kaolin-ite can be broken down further, dissolvingthe remaining silica and leaving behindgibbsite (Al(OH)3), the main material com-prising bauxite. Quartz is virtually undis-solvable and remains with the degradedclays (or bauxite) as sand, forming soil hori-zons in response to different hydrologicalconditions. Ferralsols, Acrisols and othersoils with high aluminium contents areprincipally the product of feldspar weather-ing through hydrolysis and the retention ofhard quartz (sand).
In contrast, many of the dykes, sills andridges seen throughout the Guiana Shieldare formed from intrusive and volcanicrocks with a quite different mineral make-up. Basic intrusives and greenstonesformed from the precipitation of mafic min-erals with higher melting points. As agroup, the basic intrusives and greenstonesconsist of metamorphosed plutonic andvolcanic rocks, such as andesite, basalt,gabbro and dunite (Gibbs and Barron,1993). All of these basic (mafic) rocks con-
Biophysical Features of the Guiana Shield 63

tain very little, if any, k-feldspar and largequantities of plagioclase feldspars(NaAlSi3O8; CaAlSi2O8), olivine((Mg,Fe)2SiO4) and/or pyroxene((Mg,Fe)SiO3) that consist mainly of silica,sodium, calcium, magnesium and, impor-tantly, iron. The dissolution of silica leavesthese minerals to form free cations (e.g.Mg2+, Fe2+). This cationic form of iron oxi-dizes readily in solution to form ferric ironand then precipitates to produce limonite, aferric oxide that gives many red tropicalsoils their distinct colour. This reactionalso takes place in granitoid-borne soils, butis less pronounced. Certain types ofFerralsols, Acrisols, Nitisols, Plinthosols,Alisols, Cambisols and Leptosols are often,but not exclusively, traced back to a basicintrusive/volcanic provenance in theGuiana Shield and elsewhere. The highiron content of products formed fromdecomposition of basic intrusive rockmakes these ideal surfaces for laterite for-mation when exposed to the oscillatingwater table needed for plinthite develop-ment.
The Roraima sedimentaries form alarge part of the Guayana Highlands andconsist mainly of coarse-grained conglom-erates, sandstones, breccia, arkose andgreywacke with some finer-grained silt-stones and shales (Gibbs and Barron, 1993).Most of the coarse sedimentary materialsare made up almost entirely of quartz and k-feldspar. Finer materials often contain moremafic minerals. Quartz sands form the maincontribution of these Precambrian sedimen-tary rocks to soil formation in the GuianaShield. Most large sedimentary depressionscovered by quartz sand Arenosols, Podzolsand Ferralsols are believed to have formedfrom a Roraima sedimentary provenance(Bleakley, 1957; Gansser, 1974), eitherthrough direct source-to-sink transfer orthrough secondary transfer phases, such asinterglacial sea transgressions. Soils withhigh sand contents in some parts of thewestern shield area, however, have origi-nated from Palaeozoic sandstones of theChiribiquete complex or weathered igneousand metamorphic formations of the Andesin Colombia (Duivenvoorden and Lips,
1995). Some areas may have also developedthrough podzolization of Acri-Ferralsolsoils formed in situ from the underlyingPrecambrian granitoids (Dubroeucq andVolkaff, 1998; Dubroeucq et al., 1999).
Distribution of soils in relation to otherneotropical forest regions
The differences in relative occurrence oftropical soil types within regions have beenemphasized at the global scale (Sanchez,1981; Richter and Babbar, 1991; Huston,1994) and between landforms and regionswithin continents (e.g. Sombroek, 1991;Moran, 1995). Within the Guiana Shield,soils have been mapped at national scales(van der Eyk, 1957; Leveque, 1961; FAO,1965; CVG-TECMIN, 1991), but with fewcomparisons across the geological land-scape. National soil surveys can be oftremendous use in managing forests forconservation and use, but artificial politicalboundaries also can unintentionally cen-sure interpretation of soil effects on foreststructure, composition and function whenthe full range of conditions are not consid-ered (Huston, 1994, p. 515).
The geologically benign shield area isdominated by soil types that exhibit prop-erties on one extreme end of the global geo-chemical spectrum. Ferralsols, Arenosols,Podzols and Histosols (not shown in Fig.2.14) account for a larger portion of theshield area than in Central America, theSub-Andean Trough (Amazon Foredeep) orthe Amazon Downwarp (Fig. 2.14, see Fig.2.6B for regions). These soils present someof the lowest levels of exchangeable nutri-ents and their corollaries, pH, CEC and highactivity clay abundance. In contrast, theCentral American zone houses as a propor-tion of its total area, more of the moderateto high fertility (but not necessarily arable)soil groups, such as the Cambisols, Nitisols,Regosols, Vertisols and (not shown)Fluvisols, Alisols, Luvisols and Phaeozems.Infertile Podzols, tropical Arenosols andFerralsols are virtually absent from theCentral American landscape. The westernAmazon Foredeep and west-to-east
64 D.S. Hammond

Biophysical Features of the Guiana Shield 65
Amazon Downwarp are more similar to theGuiana Shield but show important differ-ences in relative soil dominance. Acrisols(Ultisols) are more widely distributed com-pared to Ferralsols and two large groups ofhydromorphic soils, the Gleysols andPlinthosols, are particularly widespread incomparison to other regions (Fig. 2.14).Fluvisols also account for a more significantfraction of these two regions than theGuiana Shield.
Interpreting the general nutrient statusof broad soil groups based on field data alsoillustrates the contrasts between regionalsoil-forming pathways and provenances,even when comparing similarly classifiedsamples. For example, the exchangeablenutrients contained in floodplain soils havebeen shown to reflect their rock prove-nances (Fig. 2.12) and those in westernAmazonia are thought to contribute muchhigher concentrations of macro-nutrientsessential to plant growth (Sanchez et al.,1982; Gentry and Terborgh, 1991 cited in
Linna, 1993), even when considering localvariation in rock parentage (Zarin, 1999).Properties of Tertiary sedimentary landunits in the uplands of Araracuara,Colombia can also be distinguished by theirparent material provenance (Duiven-voor-den and Lips, 1998). Yavitt (2000) con-cluded that small-scale variation in rockprovenance had little discernible effect onlevels of available phosphorus, nitrogenand sulphur in soils formed atop sedimen-tary and andesitic parent materials on BarroColorado Island (BCI). However, as theauthor notes, nitrogen is not a good indica-tor of a rock provenance effect since this israrely involved in mineral formation andcations that better reflect differences inphenocrystic andesite, foraminiferal lime-stone and sandstone mineral weathering,such as calcium, sodium and magnesium,were not analysed. Localized veinscomposed of sulphide minerals are com-monly found emplaced in country rock ofmany different types and would strongly
Fig. 2.14. Approximate percentage of tropical lowland area covered by 11 broad FAO/WBR soil groupswithin each of four neotropical regions (see Fig. 2.8 for locations). AC: Acrisols, AR: Arenosols, CM:Cambisols, FR: Ferralsols, GL: Gleysols, LP: Leptosols, NT: Nitisols, PT: Plinthisols, PZ: Podzols, RG:Regosols, VR: Vertisols. Distribution of soils based on SOTER global soil map (1:1 million) (UNEP et al.,1995) and tropical lowlands on WWF Ecoregion map (1:1 million) (Olson et al., 2001).
FAO/WBR soil group
Amazon Foredeep
Amazon Downwarp
S. Mexico &CentralAmerica
Guiana Shield
60
50
40
30
20
10
0
% (
sub
) tr
op
ical
fo
rest
are
a
AC AR CM FR GL LP NT PT PZ PG VR

reflect size and distribution of samplingeffort.
The rock provenance effect can alsoassist in comparing soil properties at thelevel of the neotropics. On the one endthere is a predominance of soils in CentralAmerica (e.g. La Selva, Sollins et al., 1994)and western Amazonia (e.g. WA flood-plains, Zarin, 1999) that have relativelyhigh levels of exchangeable nutrients suchas calcium, magnesium, potassium andphosphorus (Fig. 2.15). These soils tend tohave lower levels of dissolved aluminiumand iron binding these elements in a rela-tively high soil pH environment. On theother end, there is a dominance of soilgroups in the Guiana Shield (Caura, 24 MileReserve, Mabura Hill, Caquetá in Fig. 2.15)(Schulz, 1960; Jordan and Herrera, 1981;Lescure and Boulet, 1985b; Aymard et al.,1998) that have very low standing levels ofexchangeable and available nutrients eitherdue to high ionic-binding with aluminiumand iron sustained under very low pH con-ditions or simply a scarcity of ionicallyactive clays, such as montmorillonite, ver-miculite and illite (e.g. Ferralsol, Arenosol,Spodzol). In some cases, such as that of theCaquetá region in Colombia, the intermedi-ate range in concentrations recorded maybe the product of more dynamic mixing ofmaterials from both Andean and Guiananorigins (Duivenvoorden and Lips, 1998).
This general positioning of regionsalong a fertility gradient reflects the relativeabundance of different soil types withineach regional mosaic. All of the regionscontain soils associated with both extremesof tropical fertility, but those coveringCentral America tend to extend across agreater range (e.g. Yavitt and Wieder, 1988;Sollins et al., 1994) than those in theGuiana Shield, which tend to cluster at thelower end (e.g. Duivenvoorden and Lips,1995; van Kekem et al., 1996; Ramos, 1997)(Fig. 2.15). The Amazon and Sub-Andeansedimentary depressions tend to have amore finely mixed distribution of soil-building materials, with the well-drainedsoil types of Andean mafic or fine sedimen-tary provenance (e.g. Nitisols, Alisols,Luvisols, Fluvisols) generally exhibiting the
highest concentrations of exchangeablecations. Western Amazon and CentralAmerican forests grow on soils withexchangeable nutrient concentrations simi-lar to those found in the Guiana Shield –but young, steep and rapidly eroding plana-tion surfaces created by the rising mountainslopes of Central America and westernAmazonia increase the relative contributionof enriched sedimentary soil types to theadjacent lowland forest regions due to theaction of more substantive erosionalprocesses in the alpine highlands, such asglaciation and mass wasting of Cenozoicrock (see ‘Physico-chemical transport’,below). In contrast, highland contributionsof lowland soil-building materials in theGuiana Shield are nominal and largelyderived from Precambrian sedimentary for-mations.
Climate and Weather – a Simple Matterof Rainfall?
Weather is a collection of the many smaller-scale manifestations of larger climaticeffects. Conversely, climate is often definedas the average condition associated withmore variable weather. Weather deliversthe impact generated by the interaction ofglobal scale climate-regulating processes,such as planetary motion, solar sunspotactivity, plate tectonics, volcanics andatmospheric and oceanic circulation, withregional land topography, hydrology andvegetation cover. More recently, humanactivity has become an important forcingfactor at both global and regional scales.
Energy is the lingua franca of climateand weather and both are a way of viewingthe same spatial and temporal variation inradiative heating and cooling, only at dif-ferent scales. At the largest scale, global cli-mate is shaped by a multitude of factorsoperating within a complex of interactingsubsystems (Robinson and Henderson-Seller, 1999). A number of these subsys-tems exert a particularly pronounced effecton the climate and weather of tropicalforestlands, but the impact of these does notresonate equally across all regions and is
66 D.S. Hammond

Biophysical Features of the Guiana Shield 67
unlikely to have done so in the past, despitespeculation otherwise. In the pantheon offactors shaping forests, climate stands nextto geology as a giant and long-term varia-
tion in rainfall and temperature haveproven to be of particular significance. Theimpacts of climate and geology are bothlong-standing and widespread, and as a
Cau
ra,
Ven
ezue
la
24 M
ile R
eser
ve,
Guy
ana
Mab
ura
Hill
, G
uyan
a
Caq
ueta
, C
olom
bia
La S
elva
, C
R
Flo
od p
lain
s, W
. A
maz
onia
Cau
ra,
Ven
ezue
la
24 M
ile R
eser
ve,
Guy
ana
Mab
ura
Hill
, G
uyan
a
Caq
ueta
, C
olom
bia
La S
elva
, C
R
Flo
od p
lain
s, W
. A
maz
onia
Fig. 2.15. Range of standing soil nutrient concentrations measured during soil surveys at a number ofneotropical locations. All values are taken from upper profiles (most cases 20–35 cm depth). Values wereinterpolated from two consecutive depths (A+B horizons) when uppermost depth presented was less than15 cm. Data sources: 24 Mile Reserve (Ogden, 1966), Mabura Hill (van Kekem et al., 1996), Caquetá(Duivenvoorden and Lips, 1995), Caura (Fuentes and Madero, 1996; Briceño et al., 1997; Ramos andBlanco, 1997), La Selva (Sollins et al., 1994), western Amazon floodplains (Hoag, 1987 in Zarin, 1999).An outstanding phosphorus value of 145 ppm from the floodplains of western Amazonia was rejected asan outlier. Note that methods of extraction used are different depending on predominant soil attributes atdifferent locations, but still may not yield perfectly proportional extraction efficiencies.
cmol
+/k
g
cmol
+/k
g
cmol
+/k
g
ppm

consequence, often imperceptible or evenmisleading at the minor scales of time andspace that define many scientific studies.As we will see in the case of the neotropics,scaling up from sample to system may befull of pitfalls when different climate mech-anisms can bring similar rainfall patterns todifferent locations. Geographic locationbecomes an important element in definingnot only the annual cycle of seasonal rain-fall, but also how this cycle has and islikely to fluctuate in response to moreexpansive climate-driving forces. Withrecent rapid advances in climatologicalresearch techniques and technologies, anevolving picture of regional interconnec-tions between land, sea and air that drivesmodern variability in tropical rainfall andinter alia, the evolving structure, functionand composition of tropical forests, isbeginning to emerge.
Rainfall variation, pace-setter of tropical life
Up until the mid-20th century, Western sci-entific understanding of tropical rainfallvariation was limited. To 19th-century sci-entists and natural historians accustomedto seasonal changes in day-length and tem-perature (the two are of course boundtogether as cause and effect), the climate oftropical forestlands for all intents and pur-poses appeared uniform (e.g. Wallace,1878). The account of Bates in his Amazontravelogue exemplifies this early percep-tion:
A little difference exists between the dryand wet seasons … It results from this, thatthe periodical phenomena of plants andanimals do not take place at about the sametime in all species, or in the individuals ofany given species…. Plants do not flower orshed their leaves, nor do birds moult, pair,or breed simultaneously … With the dayand night always of equal length, theatmospheric disturbances of each dayneutralizing themselves before eachsucceeding morn; with the sun in its courseproceeding midway across the sky, and thedaily temperature the same within two orthree degrees throughout the year – howgrand in its perfect equilibrium and
simplicity is the march of Nature under theequator! In some areas the convectionalthunderstorms are so regular that appoint-ments are made ‘before’ and ‘after therains’. (1879, Ch. II, p. 27)
The erroneous view that tropical forestswere uniformly affected by an unchangingweather regime was in many ways sympto-matic of the limited breadth and depth ofscientific instrumentation and technologyavailable to scientists at the time. Theirimpressive empirical powers unknowinglyrelegated the effect of many tropical cli-matic processes, both past and present, tothe backbench of scientific enquiry.Starting from such an early misconceptionmeant that substantial breakthroughs in ourbroader understanding of the large-scalemechanisms responsible for rainfall varia-tion in the tropics gained little momentumuntil relatively recently. Even up until aslate as the 1960s some climatologists hadnot fully accepted the notion of meteorolog-ical interconnections, though these wereproposed for some tropical areas as early asthe 1920s (Walker, 1923, 1924) and views ofAmazonia as a stable environment per-sisted (e.g. Richards, 1952; Schwabe, 1969).Establishing a linkage between a number ofimportant oceanic and atmospheric statevariables, such as sea temperature and rain-fall, helped to establish a mechanisticfoothold in explaining global variability inrainfall and the key role that sea tempera-ture plays in regulating climate in an other-wise equivalent barotropic atmosphere (e.g.Ichiye and Peterson, 1963; Bjerknes, 1966,1969).
The mistaken belief that an absence oftemperature-driven seasonality and littleinterannual variability somehow simplifiedthe growth cycle in the wet tropics hasfaded with time and the mounting record offailure met in trying to harness this ‘sim-plicity’ through large-scale commercialforestry and agricultural practices and tech-nologies (e.g. see Moran, 1982). The annualarrival and disappearance of heavy rainfallhad already inculcated an implicit under-standing of rainfall seasonality and itsimplications into the long-establishedagrarian cultures and societies of the low-
68 D.S. Hammond
land tropics long before the arrival ofWestern scientific theory. As a conse-quence, many of their customs and tradi-tions reflected, and continue to reflect, arefined understanding of the effects of whatotherwise may appear as relatively minorseasonal and interannual fluctuations inrainfall, the true pace-setter of contempo-rary tropical life (see Chapters 4 and 7).
About this section
This section aims to provide a synopticaccount of the complex pool of global,regional and local factors shaping climateand weather in the Guiana Shield and todescribe and categorize, albeit briefly, thespatial and temporal variation in these fac-tors by drawing upon wide-ranging pub-lished research and presenting this intandem with data available from selectedweather stations in and adjacent to theregion. In particular, it focuses, albeit onlysuperficially, on the extent and nature oflarge-scale, modern variation in rainfall,temperature, cloud cover and radiativefluxes across the shield area and in relationto other neotropical regions. It is importantto note, however, that variation in climateand weather of the Guiana Shield remainsone of the most poorly monitored in theworld (Folland et al., 2001). The mainprocesses that govern rainfall and tempera-ture in the region and how their interac-tions (could) control variation are alsobriefly considered. This section alsoattempts to demarcate the current debatesurrounding prehistoric climatic conditionsacross neotropical lowlands, the extent ofevidence available for the Guiana Shieldregion and a rough compositing of thiswide-ranging information in consideringclimate change over the Quaternary (asrecent as 1000 ka BP). It is not intended toact as a substitute for more substantial textsor the wide range of published studiesexploring tropical climate, and the reader isreferred to the many references cited in thissection for further clarification of the com-plex interrelationships only summarizedbriefly here.
Modern climatic regions
The Guiana Shield embraces a large part ofthe climatological variability that can befound anywhere in the lowland tropics.According to the Köppen climate classifica-tion system, the area is consistent withthree major climate zones, Af, Aw and Am,based on temperature and precipitation(Walsh, 1996; Robinson and Henderson-Seller, 1999). These are roughly distributedalong a longitudinal line with a corridor ofrelatively dry Aw climate separating themain western area classified as Af from theeastern rim classified by a mixture of Amand Af subtypes (Fig. 2.16). Tepuis andother peaks of restricted surface area in theGuayana Highlands are exposed to highamounts of precipitation and much lowertemperatures and would generally be clas-sified as Cfb in Köppen’s system. Theseisland-like areas of much cooler and wetterclimate break the narrow corridor of Awtype climate that runs roughly north–southbetween the southern cerrados of theBrazilian Shield and the northern llanos ofcentral Venezuela and northeasternColombia.
The distribution of climatic regions inthe Guiana Shield under Köppen’s systemis mirrored when classifying the area usingthe perhumidity index (PI) devised byWalsh (1996). The PI measures the depthand extent of seasonality in tropical rain-fall. This method yields similar results forthe region except in the way the climate ofthe western tongue of the shield is classi-fied. Under Walsh’s scheme, this area isclassified as a tropical superwet (PI ≥20)with a zonal transition eastward acrossthree other climate types, viz. tropical wet(PI = 10–19.5), tropical wet seasonal(PI = 5–9.5) and seasonal (PI <5).
According to a similar precipitation–temperature system devised by García(1987, cited in Huber, 1995a), the mainwestern and eastern Aw and Am zones inthe shield would classify as a macrothermic(>24°C) ombrophilous (>2 m rainfall perannum) climate. A macrothermictropophilous (1>x>2 m rainfall per annum)climate type under García’s system is con-
Biophysical Features of the Guiana Shield 69

70 D.S. Hammond
Fig. 2.16. The distribution of average annual rainfall for 87 neotropical locations expressed as standarddeviates. Standard deviates range from –3 (smallest points) to +4 (largest points). Rainfall for all 87locations ranges between 903 (Tegucigalpa, Honduras) and 4248 (La Selva, CR) with an average of 2221mm. Each location average is based on at least 10 years of monthly totals. In most cases these records fallbetween 1950 and 2000. Note the position of the ‘meteorological equator’ (hatched line) at 5° N of theequator (solid line) and in relation to locations recording larger (3+) positive standard deviates (largecircles) and the relatively dry southern rim of the Amazon Basin (–1/–2 SD; smaller circles). Stippled linesare the 2000 mm isohyet as mapped by Sombroek (1999). Aw<2000<Af /Am. See text for data sourcesreferences and definitions.
Rainfall (mm)⊕ 2801–4248 (10,000)O 2001–2800O 1001–2000O 401–1000
0–400
Temperature (L/H°C)–20–5.9/0.9–10.9
6–15.9/11–20.916–20.9/21–25.9
21–30/26–35.9

sistent with Köppen’s Aw designation.Cooler highland types would include themesothermic (12–18°C) ombrophilous andsubmicrothermic (8–12°C) ombrophilousclassifications.
The Guiana Shield represents the mostextensive Precambrian area classified underKöppen’s wettest and warmest climate cat-egory, Af (Walsh’s tropical wet/superwetand García’s macrothemic ombrophilous),despite a large central swathe of the regionexperiencing a more severe seasonaldecline in rainfall (Aw). The three otherPrecambrian areas with (sub)tropical forest,viz. the Brazilian Shield and Precambrianareas in Africa and India, also experiencemore severe drops in rainfall during the dryseason months and are for the most partclassified as Aw. The broad expanse of Afclimate in the Guiana Shield correlates wellwith its principal rank as the world’s largestrepository of tropical moist forest onPrecambrian rock (Chapter 1).
Climate classificatory systems help tounderstand large-scale spatial variation inaverage rainfall and temperature across theshield, but also mask longer-term fluctua-tions in the depth and breadth of seasonal-ity and any anisotropies that occur acrossthe region. This drawback of the PI (andother) system(s) is noted by Walsh (1996),but the system does fit well with the current(natural) distribution of recognized tropicalforest formations. Given the importance ofseasonal environmental fluctuations as phe-nological pace-setters in the tropics, inter-annual variation in rainfall status adds animportant dimension to a region’s contem-porary climate regime and, inter alia, powerto exploratory analyses attempting tounscramble the host of factors shapingstanding forest diversity and productivity.
Modern centres of high rainfall in the GuianaShield
The Guiana Shield embraces some of thewettest and driest locations found withinthe equatorial trough. As may be expectedfor such a vast, relatively unpopulated area,ground station data for the region are few
and far between and principally located onthe perimeter of the shield along the mainstems of the largest rivers. Few stations,combined with erratic record-keeping andinfrequent reporting at existing stations,makes this one of the most poorly moni-tored in the western hemisphere, particu-larly those areas where populationdensities are at their lowest (Folland et al.,2001).
Despite this limitation, existing stationdata and interpolations derived from thesehave identified several centres of highannual precipitation (>3000 mm perannum) within the Guiana Shield (e.g.Sombroek, 1999). The easternmost of theseis centred on northern French Guiana andextends southward outside the GuianaShield as a narrow coastal band along theAtlantic seaboard of Amapá and across themouth of the Amazon River (Fig. 2.16A)(Snow, 1976).
In the north-central region of the shielda second small centre extends across theGuayana Highlands between the PakaraimaMountains of west-central Guyana and east-ern Venezuela through to the northerncoastal swamplands of northwest Guyana(Fig. 2.16A) (Snow, 1976; Huber, 1995a).This centre of high annual precipitation isisolated by a narrow corridor of relativelydry lowland climate, referred to here as theSavanna Trough, that extends between theRoraima massif along the Guyana–Venezuela–Brazil border and thenorth–south alignment of the upper CaroniRiver and extends southward across theAmazon Downwarp west of Santarem (Fig.2.16A) (Soubiés, 1979; Sombroek, 1999).Northward, a reduced rainfall regime fansout across much of the lower Caroni,Paragua and Caura River basins and theupper Cuyuni River watershed. Rain datafrom stations in this corridor, such as SantaElena de Uairén, Kamarata, La Paragua,Ciudad Bolívar, Anacoco and Tumeremo,among others, show a distinct suppressionof the June–July wet season (Fig. 2.16A)compared to high precipitation centresimmediately east and west of the corridor.Isolated tepuis found within the corridor,however, have recorded annual totals equal
Biophysical Features of the Guiana Shield 71

to or greater than the Pakaraima highlandregion (Huber, 1995a), almost entirely dueto local orographic effects.
A third centre of high precipitation isboth the largest and wettest of the three,extending from the upper Orinoco inVenezuela and across the western tongue ofthe Guiana Shield in northern Brazil andsouth-central Colombia. This centre formsthe eastern flank of a much larger zone ofexceptionally high rainfall that extendsacross most of the lowland forest areas ofthe Sub-Andean Foredeep and AmazonDownwarp regions of Colombia, Ecuador,western Brazil and northern Peru (see Figs2.6B and 2.16A) (Snow, 1976; Salati andMarques, 1984, p. 106; Figueroa and Nobre,1990; Walsh, 1996). The high annual rain-fall total in this western zone is due to thevirtual absence of any month receiving lessthan 60–100 mm of rain, a characteristicthat normally defines tropical seasonalityaccording to Köppen (1918), Walsh (1996)(a PI value of 20–24) and others. In compar-ison, eastern and central centres of highrainfall in the shield normally include atleast one or two months with less than 100mm of rainfall.
Seasonal variation in rainfall
Rainfall in the Guiana Shield shows sea-sonal variation that generally conforms toone of three general models referred to hereas: (i) northern uni-modal; (ii) southern uni-modal; and (iii) Atlantic bi-modal. Thenorthern uni-modal model is applicable to70% of the shield area falling between 1° Sand 5° N. Rainfall peaks between May andAugust, ranging from 100 to 600 mm permonth for the period. Both forest andsavanna locations, such as Boa Vista inRoraima and Araracuara, Colombia, con-form to this model, but with very differentannual totals (Fig. 2.17, centre and rightcolumns).
The southern uni-modal model appearsin 20% of the extended shield area foundsouth of the equator between 1° and 3° S,but extends much further throughout mostof southern Amazonia. The main peak in
rainfall in this area occurs from Novemberto January with slightly lower averagemonthly totals than occur in the northernuni-modal area (e.g. Manaus, Leticia in Fig.2.17).
The Atlantic bi-modal model fits wellwith the seasonality of rainfall over approx-imately 10% of the shield area running par-allel to the northeastern Atlantic coastline.The major peak of rainfall occurs at thesame time as in the northern uni-modalareas to the west, but with a second muchsmaller peak occurring from November toJanuary, the typical peak for southern uni-modal regions (e.g. Paramaribo,Georgetown in Fig. 2.17). In some parts ofthe shield where a bi-modal rainfall pre-dominates, this second peak is much largerand the seasonality is in effect uni-modal.The large amount of rain falling annuallyalong the coastal zone of French Guiana,Amapá and across the mouth of theAmazon in comparison to more northerlyAtlantic coastline stations (e.g. Paramaribo,Georgetown, Port Kaituma) is a fine exam-ple of this effect (Fig. 2.17), which can beattributed to the interplay of regional con-vective and localized dynamic upliftingprocesses (Robinson and Henderson-Seller,1999) and a surface roughness gradientfrom ocean to forest (Snow, 1976). Thesecoastal effects along the Guiana Shield arethe same as have promoted growth of theBrazilian Atlantic forest south of the –6thparallel (Morellato and Haddad, 2000).
Generally speaking, there are two con-tinental-scale gradients of declining rainfallrunning perpendicular to one another, onemeridional (longitudinal) and the otherzonal (latitudinal). These gradients, how-ever, are not apparent when examiningtotal annual rainfall for sites within the areaaffected, largely due to the compoundingeffects of continental, local topographic andmaritime influences. Anisotropies ofdeclining rainfall at this scale are ‘phase-dependent’, occurring exclusively duringthe normal dry season months.
Rainfall differences in the zoneaffected by a northern uni-modal or bi-modal regime are the result of a strong con-tinental-scale west to east decline in
72 D.S. Hammond
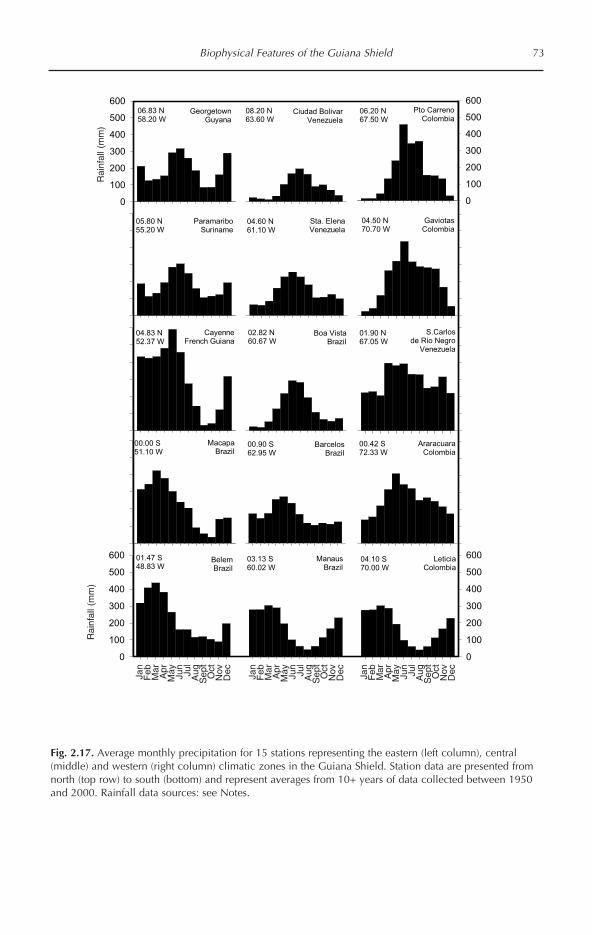
Biophysical Features of the Guiana Shield 73
Boa VistaBrazil
CayenneFrench Guiana
S.Carlosde Rio Negro
Venezuela
BarcelosBrazil
MacapaBrazil
AraracuaraColombia
Sta. ElenaVenezuela
ParamariboSuriname
GaviotasColombia
ManausBrazil
BelemBrazil
Jan
Feb
Mar
Apr
May
Jun
Jul
Aug
Se
pt
Oct
No
vD
ec
0
100
200
300
400
500
600 LeticiaColombia
0
100
200
300
400
500
600
Ciudad BolivarVenezuela
GeorgetownGuyana
0
100
200
300
400
500
600Pto Carreno
Colombia
0
100
200
300
400
500
600
01.47 S 48.83 W
03.13 S 60.02 W
04.10 S 70.00 W
00.00 S 51.10 W
00.90 S 62.95 W
00.42 S 72.33 W
04.83 N52.37 W
02.82 N60.67 W
01.90 N67.05 W
05.80 N55.20 W
04.60 N61.10 W
04.50 N70.70 W
06.83 N58.20 W
08.20 N63.60 W
06.20 N67.50 W
Fig. 2.17. Average monthly precipitation for 15 stations representing the eastern (left column), central(middle) and western (right column) climatic zones in the Guiana Shield. Station data are presented fromnorth (top row) to south (bottom) and represent averages from 10+ years of data collected between 1950and 2000. Rainfall data sources: see Notes.
Rai
nfal
l (m
m)
Rai
nfal
l (m
m)
Jan
Feb
Mar
Apr
May Jun
Jul
Aug
Sep
tO
ctN
ovD
ec Jan
Feb
Mar
Apr
May Jun
Jul
Aug
Sep
tO
ctN
ovD
ec Jan
Feb
Mar
Apr
May Jun
Jul
Aug
Sep
tO
ctN
ovD
ec

precipitation during the months ofSeptember and October (–November) (Fig.2.18A). During most other months of theyear, rainfall variation is overwhelminglyshaped by the Inter-Tropical ConvergenceZone (ITCZ) interacting with finer-scalelandscape features (e.g. topography,drainage) throughout the area north of theequator. During this period, the meridionalgradient disappears altogether (Fig. 2.18A).The decline, which varies in slope by year,is due almost entirely to a precipitous sea-sonal drop in rainfall across the eastern halfof lowland South America, while locationsin the western superwet zone north of theequator experience a much smaller sea-sonal reduction in the amount received(Fig. 2.17).
The second seasonal anisotropy inrainfall occurs as a north to south declinethat for the most part extends outside theGuiana Shield. It forms across the areasouth of the shield (i.e. 2°–10° S) that con-forms to a uni-modal regime with the areawithin the southern Guiana Shield formingthe upper end of the ‘phase-dependent’ gra-dient. The north to south decline in thisinstance occurs for the dry season monthsof April to July (Fig. 2.18B). The trough thatoccurs during this dry phase of the south-ern uni-modal deepens southward anddefines the gradient. Rainfall during the wetseason phase from November to January isroughly uniform across the region, varia-tion again being largely a function ofsmaller-scale differences. This gradientextends from just north of the AmazonRiver and southwards towards the centralpart of the Brazilian Shield (about 10° S)where the ranging ITCZ meets its southern-most limit across the South American con-tinent (Snow, 1976; Critchfield, 1983).Localized convection also diminishes asthe high atmospheric water vapour storagethat characterizes the central AmazonDownwarp (Salati and Marques, 1984),Sub-Andean Foredeep and western parts ofthe Guiana Shield declines southwardacross the Brazilian Shield.
When combining annual and seasonalisohyet maps of ‘normal’ precipitationacross the Amazon Basin, the gradient in
seasonal rainfall decline from west to east isalso evident (Figs 8 and 9 in Salati andMarques, 1984). A more recent map com-piled by Sombroek (1999) depicts the varia-tion in seasonality across the Amazonregion. The map shows the (interpolated)spatial distribution of dry month frequencyacross tropical South America and identi-fies a large zone north of the equator whereno month receives less than 50 mm of rain(drought conditions, after Walsh, 1996).This zone is bisected by the north–southcorridor of drier climate (Aw) that coincideswith much of the Rio Branco/GranSabana/Rupununi savanna (Fig. 2.16). Themeridional gradient in dry season rainfalldecline across northern South America isclearly more refined, with many locationsnot reaching physiological drought condi-tions as depicted in Sombroek’s map, butstill registering diminishing rainfall duringthe identified months. To a large extent,this is a consequence of ITCZ behaviouracross the region and its impact on dry sea-son timing. Westward locations tend toexperience a (less severe) seasonal dip inrainfall two months later (Dec–Feb) thaneastern locations (Sept–Oct) (Fig. 2.18).Despite the staggered arrival of the ‘dry’season at western locations, the total num-ber of dry days (<0.1 mm) occurring at sitesduring the September–October periodremains relatively high, but occurs in muchshorter consecutive periods compared withDecember–February, when periods ofgreater than six consecutive days are morecommon (e.g. Snow, 1976; Duivenvoordenand Lips, 1995). This high incidence of sin-gle dry days nested within longer wet peri-ods contrasts with the more prolongedperiods with and without rain that typifymany sites in the eastern Guiana Shield(e.g. Frost, 1968) and constitute the differ-ence in seasonal monthly and annual totalsbetween the two regions (Snow, 1976) (seeChapter 7). Long-term series of daily andmonthly rainfall records indicate that thesedifferences are amplified during strongENSO phases as a consequence of asym-metric response along the east–west gradi-ent. A discussion and review of researchassigning a plausible role of these asymme-
74 D.S. Hammond

Biophysical Features of the Guiana Shield 75
Oct
Dec
Feb
Apr
Longitude
-80
-75
-70
-65
-60
-55
-50
-45
Ra
infa
ll (m
m)
0100200300400500600
June
Aug
Jan
Mar
May
July
Sept
Nov
Apr
July
Jan
Feb
May
Oct
Dec
Feb
Apr
Rainfall (mm)
0
10
0
20
0
30
0
40
0
50
0
La
titu
de
-14-12-10-8-6-4-20
June
Aug
Mar July
Sept
Nov
MayJan
Fig. 2.18. Simple dissection of average monthly rainfall by geographic position for locations in tropicalSouth America. (A) Monthly rainfall vs. longitude across the Guiana Shield. Only monthly data fromlowland (<200 m asl) sites affected by the northern uni-modal rainfall pattern and falling between 9° Nand 1° S are included. (B) Monthly rainfall vs. latitude across the southern Guiana Shield, AmazonDownwarp and Brazilian Shield. Only data from lowland sites affected by the southern uni-modal patternare included. Monthly values represent averages for 10+ years. Lines represent best fit, least-squaresregression. Rainfall data sources: see Notes.
A
B

tries in driving variation in forest distribu-tion, productivity and perhaps, standingspecies diversity across the neotropics isdiscussed in Chapter 7.
Historic variation in rainfall
Rainfall across the Guiana Shield follows afairly predictable seasonal pattern consis-tent with the three major models, with rela-tively little variation in each month’s rankcontribution to annual rainfall. The actualtotal annual or monthly amount of rainfallreceived, however, is subject to muchgreater variation, particularly where precip-itation patterns are sensitive to oscillationsin regional atmospheric–oceanic circula-tions, rather than more predictable and reg-ular effects of convection driven by localtopography or evapotranspiration.
Century-long records of monthly rain-fall for stations within the Guiana Shieldare limited to a few of the main populationcentres. Most of these stations are locatedon or near the perimeter of the shield area(as described in Chapter 1) and recordsfrom stations located in the interior of theshield are typically of much shorter dura-tion and often missing periods ranging fromone month to several years. Long-term,monthly time series maintained at locationsin the Caribbean (e.g. Puerto Rico (since1899), Barbados (1853), Trinidad (1862))and eastern Brazil (e.g. Fortaleza (1849),Recifé (1875)) are of greatest duration andcompletion. One station directly on theshield perimeter, the Botanic Gardens,Georgetown, Guyana (1880) has maintaineda record comparable with these other sta-tions. Since 1950, a ‘modern’ record ofmonthly rainfall has been maintained at amuch larger number of stations both withinand adjacent to the region. Restricting com-parisons among stations to this more recentperiod, a general picture of variation inrainfall over a semi-centennial scale withinand surrounding the Guiana Shield can beassembled from the same historical stationdata employed in composite climatologicalanalyses.3
Seasonally adjusted average annual
rainfall shows little or no overall trendbetween 1958 and 2002 at station locationsin or adjacent to the Guiana Shield (Fig.2.19). Similar analyses carried out on 5 × 5°gridded averages as part of the IPCC WG1’sassessment of global rainfall trends show ageneral decline of 4–12% over the easternhalf of the Guiana Shield during the period1946–1975 (Fig. 2.25i in Folland et al.,2001). This contrasts with a positive trendin annual rainfall of 4–8% calculated forgrid cells covering western Amazonia andCentral America (Panama/Costa Rica) overthe same period.4 All stations examined,however, show irregular oscillatory varia-tion with positive (wet) and negative (dry)phases lasting anywhere between 1 and 5years. Long-term rainfall records at a num-ber of stations show reasonable concor-dance in the timing of these multi-annualphases (Fig. 2.19), although less so whenalso considering phase duration and ampli-tude. This concordance is, logically, mostcommon among adjacent stations, thoughzonal relationships appear more importantthan meridional ones. Only during signifi-cantly strong La Niña (e.g. 1989–90) and ElNiño (e.g. 1982–83, 1997–98) phases of theSouthern Oscillation does a wider regionalspread of available station data showincreasing concordance (Fig. 2.19). Again,however, the trend towards spatial concor-dance in rainfall variability is limited to anarea east of Manaus, north of Salvador andsouth of Panama and is centred on the east-ern half of the Guiana Shield. Rainfall vari-ability at western and southern Amazonianstations (e.g. Leticia, Fig. 2.19) shows onlyweak or slightly negative correlations witheasterly stations during these periods.Analyses employing empirical orthogonalfunctions (EOFs) to discriminate differentsources of variation yield similar conclu-sions for eastern and southern areas inBrazil (Tanaka et al., 1995), only at largerspatial scales. Generally speaking, locationswest of the Savanna Trough show a declin-ing long-term precipitation relationshipwith those found east of this dry zone.
The annual course of seasonal transi-tions in the Guiana Shield and elsewhere inthe tropics follows a predictable periodi-
76 D.S. Hammond

Biophysical Features of the Guiana Shield 77
Leading series
SOIRainfall
0
5
-2.5
-1.5
-0.5
0.5
1.5
2.5
19
58
19
62
19
65
19
69
19
73
19
76
19
80
19
84
19
87
19
91
19
95
19
98
20
02
-1.5
-1
-0.5
0
0.5
1
1.5
Fortaleza, Brazil
Leticia, Colombia
Manaus, Brazil
-2.5
-1.5
-0.5
0.5
1.5
2.5
19
58
19
62
19
65
19
69
19
73
19
76
19
80
19
84
19
87
19
91
19
95
19
98
20
02
-1.5
-1.0
-0.5
0.0
0.5
1.0
1.5
-2.5
-1.5
-0.5
0.5
1.5
2.5
-1.5
-1.0
-0.5
0.0
0.5
1.0
1.5
Cayenne, F. Guiana
GTBG, Guyana
BCI, Panama
La Selva, C. Rica
San Juan, P. Rico
0 10-10
0
0.5
0.5
Lag (months)
Co
rrela
tion
Sta
nd
ard
de
via
te
Fig. 2.19. Time series of SOI and rainfall between 1958 and 2002 for selected stations located on or nearthe perimeter of the Guiana Shield. Shown are series of standardized monthly rainfall and SOI valuessmoothed using a 12 month MA. Standardized rainfall values were based on mean andvariance of all data available for the period. Standardized SOI values were taken directly from normalizedvalues calculated by the Climatic Research Unit/University of East Anglia using methods described byRopelewski and Jones (1987). Negative and positive trending in standardized values for the SOI aregenerally consistent with El Niño/La Niña conditions, respectively. Cross correlation plots for each rainfallstation cover a 24-month lag between the standardized monthly SOI and rainfall values. Bars above orbelow horizontal lines depict P=0.05 level of significance of cross correlation at that lag. Positive andnegative values represent correlations with rainfall leading and following SOI, respectively. Single missingvalues were interpolated using a local quadratic smoothing routine (SYSTAT 8.0). Cross correlations forseries not spanning the full period between 1958 and 2002 were truncated prior to analysis. See Note 3for rainfall data sources.
city. At the decadal scale, deviations inmonthly rainfall over the Guiana Shieldand the adjacent regions of the neotropicsaccumulate and the regular periodicity ofrainfall associated with seasonality disap-pears at longer timescales when the sea-sonal component is removed (Figs 2.17,2.19). Frequency, duration and amplitudeof multi-annual dry and wet phases canvary considerably. Despite this less pre-dictable behaviour, seasonally decomposedrainfall variation at the longer interannualtimescale also fluctuates in a periodic man-ner. These fluctuations, however, reflect thecomposite action of a more varied series ofperiodic cycles shaping the global circula-tion.
Within the global circulation, the inter-action between sea surface temperatures(SST) and atmospheric pressure (AP) in thetropical Atlantic and Pacific Oceans wieldsthe largest influence on the annual andinterannual variation in rainfall within theGuiana Shield (Fu et al., 2001; Liebmannand Marengo, 2001). Three main compart-ments in the global circulation of moisture,viz. oceanic currents, atmospheric cells andterrestrial stores, interact to influence themovement and magnitude of SST and APthroughout the tropics (Philander, 1990;Robinson and Henderson-Seller, 1999).Energy exchange between atmosphere,ocean and land inextricably bind the behav-iour of one to the other, but they are treatedhere as separate processes in order to focuson several key features of each compart-ment affecting rainfall and temperature inthe Guiana Shield and adjacent tropicalregions.
Modern centres of low temperature in theGuiana Shield
Spatial coverage and length of the tempera-ture record lags available information onrainfall. This lack of data is most apparentat upper elevation locations of the centralshield (e.g. Huber, 1995a). In part thisreflects the fact that seasonal variation intemperature is relatively small in thebarotropic environment of the equatorial
trough, particularly in comparison to thedaily range, and has therefore not rankedhigh among priorities for meteorologicalmonitoring in the tropics. But it also reflectsa declining capacity to maintain the moreextensive monitoring systems establishedin the 1950s across a relatively remoteregion of the world.
The Guiana Shield embraces a larger,spatially weighted range in sub-alpine tem-perature than any other part of the neotrop-ics. This range consists of one major andtwo minor highland centres of relativelylow temperature (average minimum:6–20°C) surrounded by an extensive low-land area of much higher temperatures(average minimum: 21–30°C) (Fig. 2.16B).Centres of relatively low temperature arelocated on the three main upland ‘islands’found within the region, the GuayanaHighlands, Tumucumaque Uplands andChiribiquete Plateau (Fig. 2.6B; ‘Shieldmacro-features’, above). Lowest tempera-tures are found at the highest elevations onisolated tepuis and peaks formed from theRoraima sedimentaries, Avanavero intru-sives and Parguaza granites of the Guayanaand Tumucumaque regions and thePalaeozoic sedimentary rock of theAraracuara Formation forming theChiribiquete Plateau (Fig. 2.16B).
Daily and seasonal variation in temperature
Lowest mean daily temperatures in theGuiana Shield are expected to occur on thesummits of the highest tepuis of theGuayana Highlands during the peak seasonof rainfall and cloud cover. Highest maxi-mum daily temperatures occur in the low-lying sections of the Savanna Troughduring the peak dry season (Frost, 1968)when cloud cover (October) and moderat-ing latent heat sources (March) are mini-mal. Daily temperatures can range as muchas 20°C, but typically vary between 7°C and15°C over a 24 h period at most monitoringstations within the Guiana Shield (Schulz,1960; Ratisbona, 1976; Snow, 1976; Vargasand Rangel, 1996a). The width of the dailyrange also typically varies by as much as
78 D.S. Hammond

Biophysical Features of the Guiana Shield 79
Fig. 2.20. Mean monthly surface temperatures at 8 stations representing eastern (left); and central (right)climatic zones in the Guiana Shield. Data are presented from north (top) to south (bottom) and representaverages from 10+ years of data collected between 1950 and 2000. Data sources: Snow (1976), Johnson(1976).
292827262524232221201918
29
28
27
26
25
24
23
22
21
20
19
18
29
28
27
26
25
24
23
22
21
20
19
18
292827262524232221201918
292827262524232221201918
29
28
27
26
25
24
23
22
21
20
19
18
29
28
27
26
25
24
23
22
21
20
19
18
292827262524232221201918
Tem
pera
ture
(°C
)T
empe
ratu
re (
°C)
Tem
pera
ture
(°C
)T
empe
ratu
re (
°C)
Jan
Feb
Mar
Apr
May Jun
Jul
Aug
Sep
t
Oct
Nov
Dec Jan
Feb
Mar
Apr
May Jun
Jul
Aug
Sep
t
Oct
Nov
Dec
Boa VistaBrazil (74 m)
ManausBrazil
(60 m)
GeorgetownGuyana (2 m)
ParamariboSuriname(2 m)
CayenneFrench Guiana (9 m)
BelémBrazil (24 m)
Ciudad BolivarVenezuela
(50 m)
Santa ElenaVenezuela
(907 m)

80 D.S. Hammond
2–5°C between seasons based on availablestation data. Widest ranges occur in opensavannas during dry season months whenthere is little cloud cover to modulate radi-ation fluxes. Conversely, coastal and high-land forest locations across the regionexhibit the lowest seasonal change in dailytemperature range (Snow, 1976).
Seasonal variation, while small bycomparison, is not uniform across theregion and changes in range width aredemonstrable. Available data suggest thatintra-annual variation generally rangesbetween 2°C and 4°C (Fig. 2.20). Stationsregistering relatively uniform rainfall (e.g.Cayenne, French Guiana) experience thelowest seasonal variation in mean tempera-tures, while regions subject to more pro-nounced uni-modal rainfall in the SavannaTrough typically show the greatest seasonalchange in mean temperature (e.g. Boa Vista,Roraima, Brazil) (Salati and Marques,1984).
Historical variation in temperature
A sparse history of temperature data collec-tion across the Guiana Shield and thesouth-central Amazon has created a notice-able gap in the global grid of historical tem-perature coverages (Fig. 2.9 in Folland etal., 2001). This gap has been most persist-
ent over the Brazilian Legal Amazon,including the southern, sedimentary low-lands of the Guiana Shield.
Despite the problem of spatial incon-sistency in data coverage, some stationshave been producing quality data for manydecades. When combined, these data sug-gest that the Amazon region as a whole hasbeen experiencing a trend of increasingtemperature since the early 1900s, esti-mated as a rate of +0.56°C per century byVictoria et al. (1998). Spatially averagingavailable station data for the Guiana Shieldregion also indicates a slightly lower posi-tive trend (+0.33°C per century) in temper-ature for the area between 1880 and 2002(Jones et al., 1999) (Fig. 2.21). Grid cellsover the Guiana Shield that form part of theIPCC’s gridded global depiction of histori-cal temperature change indicate a similarrate of increase for most lowland areassince 1946, when adequate data coveragebegan (Folland et al., 2001). However, grid-ded rates across the shield region, or theneotropics for that matter, do not appearuniform in this depiction. Rates withincells have not remained constant over the20th century, nor have different cells neces-sarily shown similar rates of change,although autocorrelation between grid val-ues at certain spatial scales is apparent.Most noticeable is the declining trend intemperatures (–0.2°C/decade) assigned to
Fig. 2.21. Spatially averaged temperature anomalies for the Guiana Shield and adjacent regions fallingbetween 10° N and 05° S and 50° W and 75° W. Anomalies from 1880 to 1998 are referenced to themean for the period 1961–1990 with a spatial resolution of 5° × 5°. Line is best-fit trend line. See Jones etal. (1999) for details of parent data set construction and anomaly calculations.
––––

cells over the Guayana Highlands, particu-larly from 1946 to 1975 (Fig. 2.9c,d inFolland et al., 2001). Areas of the GuianaShield covered by the grid analysis ofFolland et al. generally appear to havewarmed at a lower rate than adjacent west-ern and southern regions of Amazonia.These areas show rates of increase that aretwo to four times greater than those of theGuiana Shield and Central Americanregions. Importantly, the analysis also indi-cates that western Amazonia may haveexperienced warming (of 0.2–0.4°C/decade)from 1946 to 1975 while the Guiana Shield(–0.4–0.2°C/decade) and Central America(–0.2–0°C/decade) generally experienced adecline in temperature. This could beimportant in framing regional variation innet ecosystem productivity of tropicalforests, given the role of temperatureand moisture in defining variation in bothplant growth and microbial respirationacross Amazonia, all else being equal (seeChapter 7).
Seasonal to multi-decadal rainfall andtemperature-regulating mechanisms
Solar heating
The simplest and most direct influenceshaping the seasonal rise and decline ofrainfall in the tropics is the annual swing inthe amount of solar radiation received inthe northern (boreal) and southern (austral)hemispheres. This occurs as a consequenceof Earth’s axial tilt in relation to the Sunthat swings the belt of maximum insolationbetween northern and southern hemi-spheres through the course of a single orbit(one year). In the higher latitudes, thisswing strongly affects temperature andcharacterizes seasonality. While this sea-sonal swing in temperature does notdirectly affect the tropical belt (but see‘Guiana Shield rainfall and temperatureregulation in relation to other neotropicalregions’ and ‘Mid-latitude incursions’, thischapter), it does affect seasonal rainfall inthe tropics by forcing the meridional oscil-lation of the atmospheric convergencezones that bring strong rain across much of
the tropics. It also passively directs the con-veyance of warm and cold water from onehemisphere to another which attenuates theatmospheric response (especially at highlatitudes) to the swing in solar seasons (see‘Oceanic components’, this chapter).
If the annual cycle of differential solarheating was the only factor shaping season-ality, the amount and timing of rainfall inthe tropics would be highly predictable atall but the largest timescales (see ‘Longer-term climate forcing factors’, below). As itstands, the amplitude of variation becomesless predictable over larger time intervals asthe impact of different factors operating atdifferent periodicities begins to accumu-late. Other mechanisms must be acting tomodify the seasonal trek established by thebasic astronomical relationships betweenour planet and the Sun. These mechanisms,in the seas and atmosphere, are driven byand create a cascade of further adjustmentsto initial changes in the Sun–Earth interac-tions. They can be collectively consideredas the global and regional circulation.
Global and regional circulation
Warm and cold currents, both in the air andsea, are continuously moving and shiftingtheir geographic track and the strength anddirection of flow. It is these movements andtheir degree of connectivity within andbetween regions that modulate variations insolar heating of the surface. The temporalvariation of rainfall experienced in theGuiana Shield region is directly influencedby the cycling of moisture in the atmos-phere through two very large and importantmeridional (parallel to longitude) and zonal(parallel to latitude) components – theHadley and Walker Circulations, respec-tively. Equatorward movements of extra-tropical highs (that limit rainfall) andmid-latitude atmospheric Rossby waves(that generate rainfall), the movement ofeasterly (African) waves across the northerntropical Atlantic and the seasonal forma-tion of their offspring, hurricanes, in thetropical mid-Atlantic, also influence rain-fall in the Guiana Shield on a regular basis,although not in equal parts.
Biophysical Features of the Guiana Shield 81

Rainfall variation is also influencedindirectly by the geographic distribution ofwarm and cold surface seawater in the trop-ical Atlantic and Pacific Oceans throughtheir impacts on ocean–atmosphereexchange processes. The distribution ofseawater temperature primarily reflects thepush-and-pull of seasonal hemisphericheating, consequent changes in wind flow,and the effects this has on the track andstrength of major surface currents operatingin these tropical maritime regions(Tomczak and Godfrey, 1994). These shiftscan occur as frequently as every year or asmore gradual adjustments to changes in theglobal oceanic conveyor (Broecker, 1991).They can also be affected by more frequentadjustments in the form of wave-like pack-ets of warm water sent zonally acrossoceanic basins, referred to as Kelvin(Kessler and McPhaden, 1995) and Rossbywaves (Dickinson, 1978). Changes in windstress, coastline geometries and the reso-nance dynamics of reflecting waves havebeen identified as key features of these phe-nomena affecting seawater temperatures(Philander, 1990).
Importantly, temperature changes alsoreflect the effects these shifts can have ondeep seawater upwelling and the geometryof the thermocline within a basin over anyparticular period of time. Major oceaniccurrents are driven by wind, gradients ofsalinity and temperature created by fluxesof heat and freshwater (the thermohalinecirculation) and inertia created through theglobal ocean conveyor. Currents play animportant primary role in shaping rainfallvariability over (parts of) the Guiana Shieldsince they convey warm water. The maincurrents in the Atlantic and Pacific directlyinvolved in tropical water movements,include the massive pantropical NorthEquatorial current (surface), SouthEquatorial current (surface), EquatorialUndercurrent (thermoclinic) and NorthEquatorial Countercurrent (surface),and the much smaller Peru current(surface, Pacific), North Brazil current(surface, Atlantic), Brazilian CoastalCurrent (surface, Atlantic), Guiana current(surface, Atlantic) and Caribbean current
(surface, Atlantic) (Richardson and Walsh,1986).
Oceanic currents and the overlyingatmosphere interact to create a continuouscascade of change in the geographic distri-bution of their main energy-transfer andstorage zones. These zones can be charac-terized by a large number of (collinearly)related parameters. Sea-surface temperature(SST), surface windstress (SW), outgoinglong-wave radiation (OLR), atmosphericpressure (AP) and sea current velocity(SCV) are particularly useful (leading,tracking and simultaneous) indicators.Cascading changes in the state conditionsof these commonly monitored attributes areassociated with rainfall variability at dailyto multi-decadal scales within the SouthAmerican tropics (e.g. Meisner and Arkin,1987; Nobre and Shukla, 1996; Fu et al.,2001; Liebmann and Marengo, 2001; Paegleand Mo, 2002). The main atmosphericpump contributing rainfall that sustainstropical forests in the Guiana Shield, how-ever, is the thermally direct HadleyCirculation and its rainfall-producing cen-tre, the Inter-Tropical Convergence Zone, orITCZ.
ATMOSPHERIC COMPONENTS – THE HADLEY CIRCU-LATION The Hadley Circulation consistsof two cells. Each of these cells is sustainedby moisture-laden air rising within theITCZ, moving poleward through the uppertroposphere, subsiding (descending) in thesub-tropical latitudes to form the tradewinds that then flow equatorward along anarc-like trajectory, shaped by the Corioliseffect, to once again rise within the ITCZ.Moisture gathered along this journey istrapped within the low-level trade windflow as it travels equatorward by persistenthigher atmospheric warm air trapping thecooler trade winds along the poleward endof the cycle, leaving the ITCZ as the onlyrainfall-producing phase of the cycle(Robinson and Henderson-Seller, 1999).The meridional migration of this airflowpattern largely influences the seasonalcycle of rainfall across the Guiana Shield intandem with the main oceanic currents thatseasonally redistribute energy and modu-
82 D.S. Hammond

late the meridional shift of warm SSTs.Because heating of the Earth’s surface isroughly equal throughout the year acrossthe tropics, the effects of seasonal differ-ences in heating and cooling that create dif-ferences between land and sea convectionpatterns at higher latitudes are minimized,decreasing the longitudinal differences incloud migration over tropical continentscompared to adjacent oceanic zones.
THE ITCZ The ITCZ is a belt of hydrostaticinstability that occurs in a ring of low pres-sure circling the Earth called the equatorialtrough (Fig. 2.22). It is maintained by theconvergence and convective ascent of low-altitude trade winds as part of the HadleyCirculation. It is the main cause of heavyrainfall and thick seasonal cloud cover thattypify many parts of the tropics. ITCZ-related cloud cover over the equatorialAtlantic has two components: (i) cloudblocks produced through localized convec-tion; and (ii) cloud trains associated withthe westward movement of African easterlywaves.5
The ITCZ oscillates between a northernand southern limit that, on average, tends toreside for longer periods north of the equa-tor, although it is capable of extendingmuch further southward across SouthAmerica (Fig. 2.22B) (Critchfield, 1983).This northern hemispheric asymmetry maybe related to the meridional distributionand geometry of continental land massesand their consequent effects on large-scalewind patterns that sustain the ITCZ(Philander et al., 1996). The lag between theseasonal shift of the main solar heatingzone from one hemisphere to the other andmovement of warm ocean water deflects themain residence time of the ITCZ northward.Wind patterns are strongly shaped by thedistance and difference in atmosphericpressure centres (Fig. 2.22B). These pres-sure centres are directly affected by sea-sur-face temperatures (SSTs). SSTs, in turn,vary with changes in the action of oceancurrents affected by winds to form a posi-tive feedback loop. Atmospheric conver-gence zones, like the ITCZ, typically resideover the warmest surface waters and
migrate with latitudinal movements of thewarm oceanic currents. Warm ocean cur-rents act as the main engine to hydrostaticinstability and increased cloud formationin the ITCZ (Fig. 2.22A), although a highSST does not always lead to large-scale con-vective activity (Graham and Barnett,1987). Nonetheless, a northward asymme-try in ‘normal’ meridional ranging of theITCZ typically results in much higher rain-fall amounts in locations between 2° and 8°N and the creation of a ‘meteorological’equator at 5° N, where ITCZ-driven rainfallis commonly received in varying amountsduring most, but not all, months of a ‘nor-mal’ year (Snow, 1976). It is the extremedepartures from the ‘normal’ seasonal tim-ing of ITCZ migration, forced by a widearray of climate-driving factors discussedlater, that leads to substantial amplificationof seasonal rainfall patterns in the region.
Importantly, the latitudinal limits ofthe ITCZ vary zonally (Critchfield, 1983).The tropical forests of East Africa, India, SEAsia and Polynesia are subject to an annualmigration that can range from 30° N to 15°S. The neotropics are affected by a muchnarrower ranging of the ITCZ. In an areaextending from the eastern Pacific, over theSub-Andean Trough and to the western rimof the Guiana Shield, this remains largelynorth of the equator with a seasonal migra-tion of no more than 10°. The movement ofthe ITCZ dips southward over the easternhalf of tropical South America during theboreal autumn–winter, passing over most ofthe Guiana and Brazilian Shield areas.
The annual cycle of seasonal rainfallover most of the Guiana Shield is estab-lished by the meridional migration of theITCZ (Snow, 1976; Figs 2.17, 2.22A, 2.23).The (semi-)annual passover of the ITCZ setsup the normal periodicity of high rainfallacross eastern South America and largelyaccounts for the latitudinal shifts in the cal-endric timing of wet and dry seasonsencountered across the tropics. The deepestpart of the dry season is established whenthe atmospheric instability produced by theITCZ is at its furthest distance from anygiven location within the equatorial trough.Given the range limits of the ITCZ and its
Biophysical Features of the Guiana Shield 83
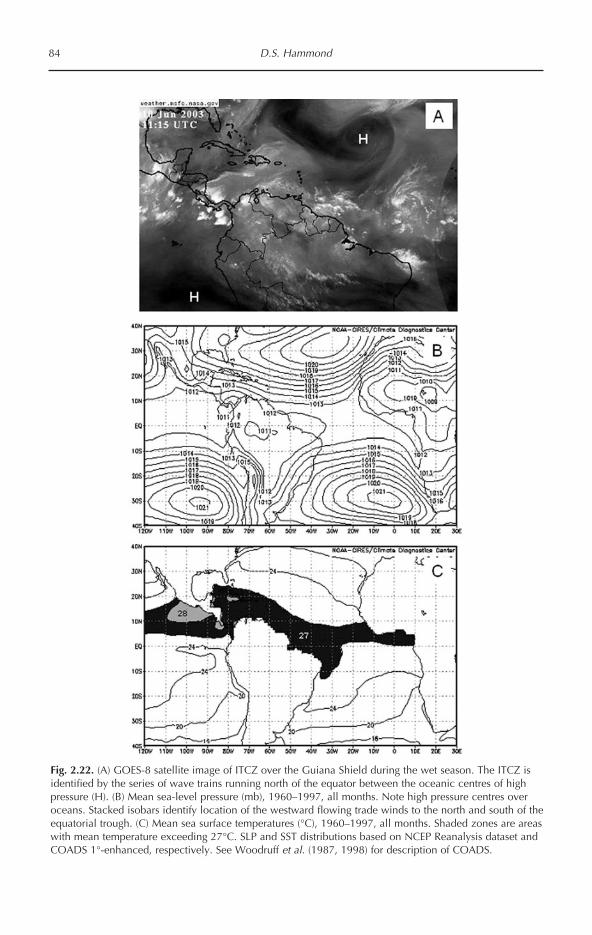
84 D.S. Hammond
Fig. 2.22. (A) GOES-8 satellite image of ITCZ over the Guiana Shield during the wet season. The ITCZ isidentified by the series of wave trains running north of the equator between the oceanic centres of highpressure (H). (B) Mean sea-level pressure (mb), 1960–1997, all months. Note high pressure centres overoceans. Stacked isobars identify location of the westward flowing trade winds to the north and south of theequatorial trough. (C) Mean sea surface temperatures (°C), 1960–1997, all months. Shaded zones are areaswith mean temperature exceeding 27°C. SLP and SST distributions based on NCEP Reanalysis dataset andCOADS 1°-enhanced, respectively. See Woodruff et al. (1987, 1998) for description of COADS.

disproportionate residence time just northof the equator, it is not surprising that sta-tions in this area experience dry seasons ofless severity and shorter duration over thecourse of a ‘normal’ year (Figs 2.17, 2.23).
The distribution and position of theGuiana Shield places virtually the entirearea within this zone of higher ITCZ activ-ity, making it the largest, contiguous area oftropical forest located within this pantropi-cal belt of high ITCZ-driven rainfall. Onlythe tropical superwet SE Asian forests onBorneo and (previously) Sumatra andPeninsular Malaysia also fall largely within3° of the meteorological equator (at 5° N).But rainfall variability in the westernPacific is most closely linked to changes inanother atmospheric conveyor, the WalkerCirculation.
ATMOSPHERIC COMPONENTS – THE WALKER CIRCULA-TION While the Hadley Circulation andits action on sustaining rainfall within theITCZ has been recognized for centuries, thezonal compartment of circulation influenc-ing rainfall in the Guiana Shield and otherregions, the Walker Circulation, has only inthe last 40 years come to be recognized forthe important impact it has on neotropicalrainfall and global climate. Like the HadleyCirculation, the Walker Circulation (WC) isthermally direct. It is also driven by a zoneof hydrostatic instability. This zone in thePacific is normally located over the farwestern Pacific and Indonesia with a highaltitude eastern flow, subsidence of dry airalong the eastern Pacific (western coast ofSouth America) and the sea-level return ofthis air westward towards the westernPacific zone of convection (an equatorialextension of the trade winds) (Bjerknes,1969; Philander, 1983; Rasmusson andWallace, 1983). Some climatologists havealso suggested a Walker cell for the AtlanticBasin, with the convective zone locatedover the Amazon and subsidence occurringover the zone of South Atlantic high pres-sure and northeastern Brazil (Kidson, 1975,cited in Philander, 1990).
THE PACIFIC ENSO The main convectioncentre of the Walker Circulation oscillates
zonally (west to east), but unlike the merid-ional oscillation of the ITCZ, the circulatorypath of the WC periodically fails altogether.This drives the main zone of convectiveinstability (and rainfall) much further intothe eastern Pacific after having amplifiedthe seasonal southward migration of theITCZ. This periodic event represents aphase in the Southern Oscillation (SO), arepeating pattern of reversal in the pressuregradient between the eastern (commonlytracked at Tahiti) and western (Darwin,Australia) Pacific (defined by the SouthernOscillation Index (SOI)) and is strongly cor-related with heavy rainfall and droughtevents in many regions of the world.6
Periods of heavy rainfall and drought in theeastern Pacific have become known as LaNiña (LN) and El Niño (EN) events, respec-tively, although the circumstances definingthese periods are, in many ways, subjective,since they simply represent phases in alarger circulatory process that may vary inits intensity and duration depending on thecombined result of a number of differentatmospheric and oceanographic conditions(Philander, 1990). Adopting one conserva-tive measure7 of EN and LN, at least 22 dis-tinct periods consistent with a strong tosevere El Niño phase of the SO haveoccurred since 1870. During the sameperiod, at least 16 strong to severe La Niñaevents have taken place. Due to the greaterfrequency and socio-economic importanceof EN periods and the absence of any recog-nized standard for delimiting these, theterm EN is often combined with the SO todefine the anomalous change in conditionsacross the equatorial Pacific as ENSO, the ElNiño–Southern Oscillation. Simply stated,EN is a phase of ENSO when anomalouslylow surface pressure, heavy rainfall, warmSSTs and weakened trade winds prevail inthe east-central Pacific. LN describes aphase of anomalously strong, and rapid,emergence of these conditions over thewestern tropical Pacific, often immediatelyfollowing the relaxation of EN conditions.ENSO thus can be viewed as embodying allphases of a continuous oscillatory process.
The zonal migration of convectiveinstability between the eastern and western
Biophysical Features of the Guiana Shield 85
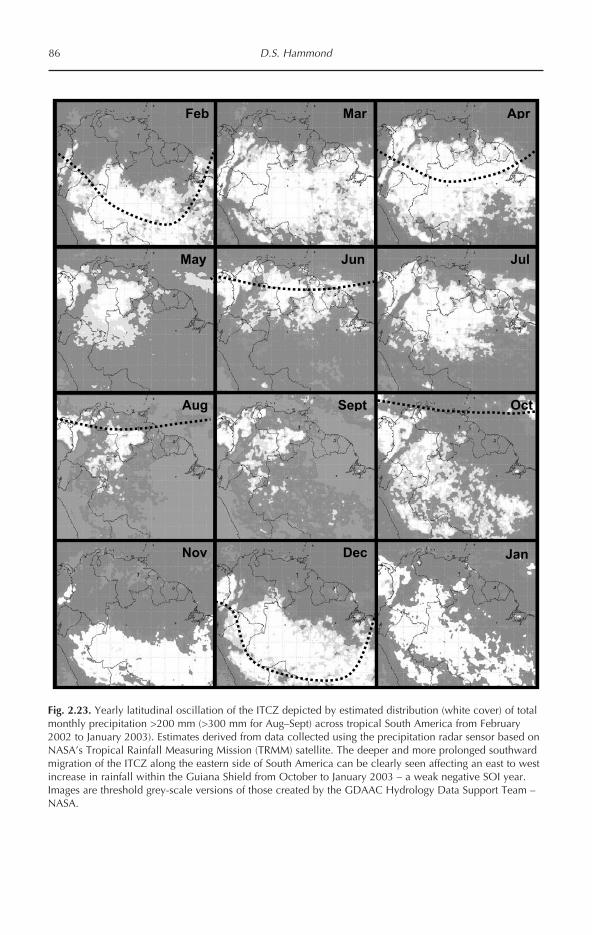
86 D.S. Hammond
Fig. 2.23. Yearly latitudinal oscillation of the ITCZ depicted by estimated distribution (white cover) of totalmonthly precipitation >200 mm (>300 mm for Aug–Sept) across tropical South America from February2002 to January 2003). Estimates derived from data collected using the precipitation radar sensor based onNASA’s Tropical Rainfall Measuring Mission (TRMM) satellite. The deeper and more prolonged southwardmigration of the ITCZ along the eastern side of South America can be clearly seen affecting an east to westincrease in rainfall within the Guiana Shield from October to January 2003 – a weak negative SOI year.Images are threshold grey-scale versions of those created by the GDAAC Hydrology Data Support Team –NASA.
Feb
May
Apr
Jun
Mar
Aug
Jul
Sept Oct
Nov Dec Jan

Pacific that is directed by ENSO-relatedchanges to the Walker Circulation is notdirectly related to rainfall over the GuianaShield. An indirect connection, or telecon-nection, between changes in a number oftracking parameters, including the SOI, thatare used to identify warm (western rainfall)and cold (western drought) phases of theENSO, and multidecadal variation in rain-fall across much of the Guiana Shield hasbeen established (Ropelewski and Halpert,1987, 1989, 1996; Kiladis and Diaz, 1989;Dai and Wigley, 2000). Many, but not all, ofthe most severe historical flooding anddroughts known to have occurred in easternlowland South America have been tied phe-nomenologically to the magnitude of westto east change in the Pacific circulation(Fig. 2.19; Kiladis and Diaz, 1986). The cor-relation between the SOI and anomalousrainfall also appears to dampen immedi-ately south and north of the Guiana Shield,although total rainfall also generallydeclines (Fig. 2.19) (Marengo andHastenrath, 1993; Ropelewski and Halpert,1996). For example, rainfall variationsoutheast of the Guiana Shield, in north-eastern Brazil around Recifé, is signifi-cantly correlated with variation in the SOI,but the SOI only accounts for 10% of thisvariation (Kousky et al., 1984). The absenceof a significant leading or trailing associa-tion with the SOI at Fortaleza is also indica-tive of other factors, particularlydisturbances to the meridional AtlanticSST gradient, overshadowing the minoreffects zonal variation in the tropical Pacificclimate generally exerts over the area (Fig.2.19) (e.g. Rogers, 1988). This, of course, isnot the case for the Guiana Shield region. Infact, the region has been identified byRopelewski and Halpert (1987, 1989, 1996)as having the most consistent negative (pos-itive) precipitation responses to EN (LN)events in the neotropics. Typically, themedian deviation from ‘base year’ rainfallduring the 18–24 months of an EN (LN)period is in the range of –50 to –300 mm(+100 to +400) (Ropelewski and Halpert,1996). The results of Dai and Wigley’s(2000, Figs 1 and 2) EOF analysis on rainfalldata covering the period 1900–1998 con-
firm these results, estimating a –50 to –200mm response to typical EN phases over theGuiana Shield.
This impact of ENSO on rainfall is toamplify the existing seasonal variation inrainfall rather than alter seasonality(Hastenrath, 1984a; Philander, 1990).Across NE South America, this hasoccurred as a consistent precipitation defi-ciency from July to March following theonset of ENSO conditions in the equatorialPacific since the late 19th century(Ropelewski and Halpert, 1987). This canmanifest itself in various ways. For exam-ple, during severe EN phases, the effectacross the eastern third of the GuianaShield is an attenuation of rainfall duringthe May–July wet season, a deepening ofthe subsequent September–October dry sea-son and significantly, the January–March‘little’ dry season. During LN phases, theopposite is true, with an amplification ofrainfall during the wet season and attenua-tion of the dry season. At smallertimescales, EN phase effects are often seenas unusually long series of consecutivedays without precipitation, creatingdrought-like conditions towards the end ofthese anomalously long rainless periods(Hammond and ter Steege, 1998; van Dam,2001) (see Chapter 7). During strong LNphases, enhanced wet season rainfall isderived from an early onset and/or exten-sion of the wet season with higher peakrainfall rates often leading to unusuallysevere flooding and mass wasting ofexposed riverine soils. These often immedi-ately follow severe EN events, such asoccurred most recently in 1982–83 and1997–98 (rapid (−) to (+) SOI in Fig. 2.19). Itis important to note, however, that ENSOcan interact with other local and regionalclimate forcing mechanisms to create con-siderable spatial variation in the timing andintensity of response (strength of cross cor-relations, Fig. 2.19) (e.g. Panama, Rand andRand, 1982, p. 49; Costa Rica, Waylen et al.,1996). In fact, given the wide range of mod-ulating factors shaping station-specific rain-fall values, the strong cross correlations ofrainfall with SOI scores at several easternGuiana Shield stations attests to the impor-
Biophysical Features of the Guiana Shield 87

tance of this phenomenon in regulatinginter-annual and decadal rainfall variationacross the region (Fig. 2.19).
The spatial extent of ENSO-correlatedvariations in regional rainfall extendsacross the Guiana Shield, but with a clearepicentre spreading from the PakaraimaMts region of west-central Guyana throughto northern Amapá in Brazil (Ropelewskiand Halpert, 1996). The analysis of Dai andWigley (2000) extends this centre south-ward to cover most of northeastern Brazil.Negative precipitation anomalies duringwarm EN phases drop off rapidly from anaverage shortfall of over 300 mm of rain atthe epicentre to less than 50 mm north andsouth of the shield region.8 Ropelewski andHalpert (1996) identified a similar distribu-tion of positive anomalies associated withthe cold LN phases that are centred on theGuiana Shield and decline outside theregion. As mentioned previously, shifts inthe median precipitation received in theregion during warm and cold phases are notsymmetric, with LN-phase median valuesregistering within the 60–70th percentile ofbase precipitation years (50% is the basemedian) and EN phase median valuesfalling within the 30–40th percentile.
Evidence suggests that spatial variationin rainfall remains stationary during ENphase reductions across the Guiana Shield,but that stationarity is scale-dependent. Inother words, the area of maximum rainfallexpands and contracts around each stablecentre when shifting into LN and ENphases, respectively, but the centres do notshift. Instead, there is a general landscape-scale decline in precipitation with high andlow rainfall centres remaining stationary.For example, the reduction in rainfall dis-tribution across French Guiana between a‘neutral’ year (1956) and a strong EN year(1958) shows persistence of maximum rain-fall south of Cayenne between the upperSinnamary and Approuague Rivers(graphique 8 vs. 9 in Hiez and Dubreuil,1964).
THE ATLANTIC ENSO Several authors haveidentified the existence of a WalkerCirculation spanning the equatorial
Atlantic/South America similar to the well-known Pacific cell (Covey and Hastenrath,1978; Zebiak, 1993). The cell is defined bya zone of convective instability located overthe Amazon (Kidson, 1975), a troposphericeastward movement of dry air that subsidesoff the southwestern African coast and thenis driven across the Atlantic and the dryzone of northeastern Brazil by strong south-ern trade winds towards the Amazon.Again, changes to the circulation largelyoccur as a consequence of the strengtheningand relaxation of the trade winds north andsouth of the equator. Wang (2002) refers tovariability in this circulation as the Atlanticzonal equatorial mode and suggests that theHadley and Walker circulations overthe Atlantic are affected by the PacificENSO through anomalously early warmingof the tropical north Atlantic during theboreal spring following EN onset. However,unlike EN periods in the Pacific, migrationof the westernmost convergence zoneeastward during periods of trade windrelaxation is not known to occur in theAtlantic cell (Philander, 1990), possiblydue in part to internal land surfaceeffects (e.g. soil moisture variation) main-taining convectivity over the AmazonBasin during an event. Instead, SST in thewestern Atlantic respond alone to relax-ation of the trade winds, creating a rain-fall response gradient spanning thepersistent western Amazon centre of con-vection and the belt of rainfall failure that ismost consistent along the northeasternregion of the Guiana Shield. The ENSO–precipitation relationships described byRopelewski and Halpert (1996) show a gra-dient across tropical South America that isconsistent with this west to east declineduring Pacific EN events. The much higherrainfall received in northwest Amazoniafurther suggests that modest amplifica-tion of seasonality due to Atlantic/PacificENSO would have a relatively limitedeffect on the region’s water balance.Rainfall anomalies over the Andean high-lands to the west are more likely to influ-ence surface water balances in the northernSub-Andean Foredeep region (Vuille et al.,2000).
88 D.S. Hammond

Atmospheric components – mid-latitudeincursions
Rainfall and temperature in the Amazonregion are not solely the product of changesin Hadley and Walker Circulations.Regional incursions of polar fronts areknown to affect tropical forestlands andcerrados of the southern Amazon and occa-sionally penetrate into the equatorial zone,particularly in western Amazonia(Ratisbona, 1976). It has also been notedthat south polar incursions are capable ofmoving further northward into Venezuela(Riehl, 1977), connecting via the OrinocoPlains with the Atlantic high pressure(Azores High) system (Ratisbona, 1976) thatseasonally flows southward across thellanos of Venezuela and northern GuianaShield behind the southward-moving ITCZ.The path of this Atlantic high pressureincursion southward is in part shaped by ablocking effect of the Venezuelan/Colombian Andes and the southeastern tra-jectory of the Atlantic coastline forcingzonal movement of warm SSTs as theymigrate with the swing in solar insolationbetween hemispheres.
FRIAGEMS Rapid incursions of cold airmasses can bring temperature depressionsof 8–10°C, and well below the 18°C mini-mum expected at most tropical forest loca-tions. When a cold, polar front surges deepinto the equatorial zone, it is locallyreferred to as a friagem, and brings briefperiods of unusually low temperatures thattypically last 5–6 days, with a 2–3 daydepression in temperature and humidity,although longer events have been recorded(Ratisbona, 1976; Walsh, 1996; Marengo etal., 1997). These incursions are relativelycommon from May to September (Marengoand Nobre, 2001), when the ITCZ is near itsnorthernmost position and high pressurezones of the southern hemisphere trailnorthward.
Equatorial incursions typicallyemanate from the southwest, first affectingsouthwestern Amazonian forests as air ischannelled northward along the easternbase of the Andes and western rim of theBrazilian Shield uplands. Only the
strongest events, probably precipitated byanomalous northward extension and resi-dence of the ITCZ, result in a friagem reach-ing areas of the Guiana Shield and, in thiscase, with effects largely restricted to south-western areas (North Pará, Roraima,Colombian, Venezuelan and Brazilianstates of Amazonas) (Fig. 13 in Ratisbona,1976) and extreme minima dissipating asthe cold air mass is modified during itsmove across Amazonia (Marengo et al.,1997).
Oceanic components – Pacific currents andSST migration
While a strong ENSO–precipitation rela-tionship clearly exists for the GuianaShield, atmospheric behaviour of theWalker Circulation alone is insufficient toexplain this phenomenon, although inter-basin atmospheric connections can beimportant. The role of migrating Pacific sea-surface temperatures (SST) is crucial inunderstanding EN/LN development andthus the link between rainfall in the GuianaShield and changes occurring in the equa-torial Pacific as a consequence of ENSO.Migration of SST is largely controlled bychanges to surface oceanic currents whosestrength and direction are in turn mainlydriven by surface wind direction, speedand persistence. The establishment of sea-water density gradients due to spatial dif-ferences in temperature and salinity (thethermohaline circulation) also contributesto the migration of SST, but more slowly.
Seawater is steadily conveyed aroundthe global oceans by the main oceanic cur-rents, but also migrates across oceanicbasins as a series of fast-moving waves thatcan act to intensify or even redirect currentflow. These waves develop as a near-termoceanic adjustment to changes in atmos-pheric wind flow conditions (Gill, 1982;Philander, 1990). While numerous waveforms are known to develop and flow acrossall of the main ocean basins and along themain coastlines, two of the major wavesknown to specifically affect SST migrationacross the tropical Pacific are equatorialKelvin waves and Rossby Waves.
Biophysical Features of the Guiana Shield 89

Equatorial Kelvin waves are packets orpulses of relatively warm water that havepropagated off the massive warm poolencompassing the Indonesian westernPacific (Glantz, 1998). They regularly formduring intervening periods between a relax-ation and subsequent restrengthening ofsurface winds associated with theMadden–Julian Oscillation, an importantglobal atmospheric cycle with a 40–50 dayperiodicity affecting variability over thewestern Pacific (Madden and Julian, 1972).Once formed, Kelvin waves travel acrossthe equatorial Pacific at a rate of around 13km/h conveying warm water towards thenormally cool eastern Pacific zone(Philander, 1990). Importantly, they have adownwelling effect, deepening the layer ofwarm water above the thermocline.
Deflection of Kelvin waves against theSouth American continent is one method ofproducing westward travelling Rossbywaves (Gill, 1982; Philander, 1990). Thesewaves travel at a much slower rate and arenot restricted to the equatorial waters as areKelvin waves. They can propagate in apoleward direction, the speed of the pole-ward ends declining as their distances fromthe leading centre increases, creating a fan-like configuration (Philander, 1990; Cheltonand Schlax, 1996). Equatorial Rossby wavesreaching the western rim of the Pacific areoften redeflected westward, forming newKelvin waves. This resonance of eastwardand westward propagating waves sets up adelayed oscillatory mechanism that isbelieved to play an important role in regu-lating the phase-swings inherent to theENSO (Schopf and Suarez, 1987). In partic-ular, high-frequency propagation of largeKelvin waves foreshadows the onset of theeastward migration of warm SST associatedwith strong EN events. The excitation of thePacific through an increase in Kelvin,Rossby and recycled Kelvin–Rossby wavesacts to attenuate earlier zonal movement ofthe warm SST (and zone of convection)eastward and shift conditions towards a LNevent (Philander, 1990).
Atmospheric convergence zones, suchas the ITCZ, South Atlantic ConvergenceZone (SACZ) or South Pacific Convergence
Zone (SPCZ), occur exclusively over zonesof warm SST. Conversely, subsidence ofdry air occurs over cold waters. Thiswind–temperature relationship is at theheart of an ocean–atmosphere coupling thatdrives precipitation and its variation overmany tropical regions. In the Pacific, thestrong trade winds flowing (south)west-ward just north of the ITCZ push warm sur-face waters of the north equatorial currenttowards Austral-Indonesia. This centre ofwarm water in the western Pacific drivesconvection, supplies the tropospheric east-ward flow of air that subsides in the easternPacific and, through the generation of west-ward surface trade winds moving towardsthe low pressure zone over warm water,continues to maintain the location of warmSST in the western Pacific by sustaining thewestward flow of surface waters. The inter-action between normal seasonal shifts ofthe ITCZ and the SPCZ as a consequence ofextra-equatorial changes in radiative heat-ing during the annual planetary orbitaround the Sun modulates rainfall distribu-tion in the Pacific.
Rapid changes occur to this conditionwhen initial external forcing factors (e.g.MJO anomalies), that are not yet completelyunderstood, cause the zonal trade winds torelax, allowing the warm waters in thewestern Pacific to move rapidly eastward.This movement alters the depth of the ther-mocline and the eastward advection ofwarm waters competes with upwelling ofcold water in the eastern equatorial Pacific.Upwelling of deep, cold water normally‘sets’ the low moisture retention qualities ofthe surface winds along the western coast ofSouth America and along the equatorialPacific as Ekman drift drives warmer watersoffshore and poleward to produce a tongueof cold water (Philander, 1990). As a conse-quence, when this equatorial upwellingfails, the eastern region becomes hydrostat-ically unstable sooner and the convergencezone forms over the eastern, rather than thewestern half of the equatorial Pacific withconcomitant changes in the position ofatmospheric centres of high pressure.
A collapse in the westward-flowingtrade winds during EN periods also leads to
90 D.S. Hammond

a southward displacement of the ITCZtowards the equator, and pulls the SPCZnorthward so that all three of the main con-vection zones are centred in the eastern halfof the equatorial Pacific when normallythey would be distributed along the south-ern, western and northern flanks of theregion (Rasmusson and Wallace, 1983;Philander, 1990). This movement, precipi-tated by the eastward shift in warm SST,also leads to a transgression of mid-latitudewesterlies into the equatorial belt. This inturn heightens the flow of warm waterseastward. The shifting of warm SST zonesalso inhibits the normal seasonal migrationof the ITCZ northwards as the stationarywarm waters oppose the effects of seasonalchanges in radiative heating of the planet’ssurface. The series of changes that occur inthe Pacific as a consequence of ENSO arenot limited to the Pacific. As the tradewinds relax and the zone of warm SSTsshifts in the Pacific during strong EN peri-ods, shifts in the oceanic and atmosphericconditions in the Atlantic basin are set inmotion. Consequently, interannual varia-tion in ITCZ-driven rainfall over the east-central region of the Guiana Shield, theCaribbean and Central America are vari-ously affected through this teleconnection.
The migratory behaviour of the warmSST belt in the Pacific drives the vigour ofthe Walker Circulation. The relative impor-tance of seasonal, meridional SST move-ments to the ITCZ in the Pacific stillrequires consideration (Philander, 1990),particularly in its potential role in terminat-ing EN/LN events (Harrison and Vecchi,1999), but changes to the equatorially con-tained Walker Circulation are currentlyregarded as the overriding climatologicalresponse to equatorial SST anomalies.
Oceanic components – Atlantic currents andSST migration
In the same way that a northerly ITCZ, pres-ence of easterly trade winds and mainte-nance of a western zone of convectiveinstability define atmospheric parallelsbetween the Atlantic and Pacific Basins,they also share a number of common
oceanic features (Xie et al., 1999). The lineof maximum SST, the thermal equator, restsnorth of the geographic equator between 3°and 10° N for both oceans (Fig. 2.22C)(Philander, 1990). The eastern Atlanticalong the southwest African coast is drivenby a similar current dynamic as that operat-ing in the coastal waters of the eastern equa-torial Pacific. Both zones are definedby a shoaling thermocline, cold-waterupwelling, eastern tongue of equatorial coldwater and advection of warmer surfacewater poleward, a process that maintainsthe westward flow of the trade windstowards the convergence zones of convec-tion (Fig. 2.22C) (Xie et al., 1999). Togetherthese features predispose neotropicalforests to the same ENSO-type amplifica-tion of seasonal rainfall patterns as havebeen observed in the Maritime region(Oceania) of the western Pacific, but as aconsequence of different pathways.Differences in the relative size of the twoocean basins, the way that the currentsfunction and perhaps most crucially, thenature of the ocean–atmosphere couplings,force different rainfall responses and vari-abilities in the Atlantic and Pacific.
Climatologists and oceanographers areonly beginning to understand the variousroles that the many different structures andattributes of the tropical Atlantic play inregulating basin-wide rainfall (includingthe Guiana Shield). As a consequence, thewide variety of analytical models currentlybeing employed often generate conflicting,if not opposing, conclusions regarding therelative significance of both atmosphericand oceanic processes operating withinboth the Atlantic and Pacific. On manypoints, consensus remains elusive (e.g.existence of a true Atlantic ‘dipole’). Nonethe less, a solid core of key features regulat-ing rainfall as part of the tropical Atlanticcirculation is emerging. The most salientof these are briefly described below andtheir inter-relationships within andbetween oceanic basins are characterized.Among these, the dynamical heatingand cooling of surface water in the tropicalAtlantic, like that in the Pacific, exertsa pivotal influence on climate variation
Biophysical Features of the Guiana Shield 91

within and along the perimeter of theAtlantic basin.
The geographic location of anom-alously warm SST is the simplest predictorof heavy rainfall in most coastal regions ofthe tropical Atlantic basin, includingCentral America, the Caribbean and north-east Brazil (Hastenrath, 1984a,b; Enfield,1996). In the tropical Atlantic, the develop-ment of anomalously cold and warm SSTsis largely led by changes in trade wind flow(Déqué and Servain, 1989; Huang andShukla, 1997; Dommenget and Latif, 2000).Composite analyses carried out by Nobreand Shukla (1996) indicate that this weak-ening (strengthening) of trade wind stressleads maximal warming (cooling) of SST inthe eastern tropical Atlantic by an averageof two months. This in part translates into azonal shift in the thermocline depth on aseasonal basis, leading to a contraction ofthe cold-water upwelling zone in the south-eastern tropical Atlantic and a weakeningof the SST that concentrate as the tropicalWestern Hemisphere Warm Pool (WHWP)(after Wang and Enfield, 2003) across theeastern Pacific, Central America and theCaribbean during the boreal wet season,May–July (Fig. 2.22C). As this zone of warmSST moves southward, the heavy rainfallassociated with the ITCZ moves in concert.It returns the following season when theWHWP expands over the boreal summer asa response to a seasonal increase in incom-ing solar radiation across the northernhemisphere (see section on Solar heating,above), restrengthening of the southeasterlytrade winds and conveyance of warm wateralong the north Brazil/Guyana/Caribbeancurrent chain. Changes to this annual pat-tern of meridional movement along an SSTgradient defines the main oceanic influenceon rainfall over most of eastern tropicalSouth America, Central America and theCaribbean at interannual and decadaltimescales.
NORTH AND SOUTH SEA-SURFACE TEMPERATURE
ANOMALIES (SSTA) AND THE ATLANTIC DIPOLE
The meridional gradient in tropical SST isdemarcated by the WHWP in the north-western tropical Atlantic and a zone of rel-
atively cold water off the (very dry) south-western coast of Africa (Fig. 2.22C). A num-ber of studies have suggested that decadalvariation in SSTA in the tropical north andsouth Atlantic occurs across the gradient asa basin-wide dipole response to changes inwind-induced latent heat fluxes (Carton etal., 1996; Chang et al., 1997; Huang andShukla, 1997). Other studies suggest thatanomalies can appear dipole-like, but fluc-tuations on either end of the Atlantic aremore dynamic and linked to independentprocesses operating within each hemi-sphere at different timescales (Houghtonand Tourre, 1992; Enfield and Mayer, 1997;Mehta, 1998; Sutton et al., 2000). In eithercase, the inter-hemispheric SST gradienthas been found to oscillate noticeably at atimescale of about 13 years (Mehta andDelworth, 1995; Chang et al., 1997), bring-ing changes to the seasonal movement ofthe ITCZ/SACZ and rainfall to easternSouth America. An anomalously cold southtropical Atlantic (SSTA–) and warm northtropical Atlantic (SSTA+) set up conditionsthat strengthen southeasterly and weakennortheasterly trade winds, anomalouslypushing the ITCZ northward and throughthis, promoting anomalously high rainfallover the eastern Guiana Shield, Caribbeanand lower Central America. These condi-tions in the Atlantic have been known forsome time to correlate well with droughtacross northeastern Brazil (Bahía) south ofthe Guiana Shield (Hastenrath and Heller,1977).
EAST AND WEST SSTA AND THE ATLANTIC ENSO MODE
When trade winds are strengthened, thewestward flow of surface waters in theequatorial Atlantic deepens warm waters atthe western edge of the basin and shoalsthese in the east, promoting greater cold-water upwelling along parts of the WestAfrican coast and the equator. When tradewinds relax, opposing conditions dominateand warm waters pooled in the northwest-ern Atlantic flow eastward, carried by west-erly surface winds (Wang, 2002).Periodically, trade winds strengthen andrelax more extensively than ‘usual’ and thisvariation creates zones of anomalously
92 D.S. Hammond
warm and cold SSTs. This scenario mirrorsthe well-known zonal shift in SSTAs thatoccurs in the equatorial Pacific. TheAtlantic ENSO, however, is damped incomparison to the high amplitude fluctua-tions of the Pacific ENSO that are drivenmainly by variation in surface wind stress(Philander, 1990). Surface wind stress isbelieved to play only a minor role in forcinginterannual variability in SSTs in the equa-torial and north tropical Atlantic (Zebiak,1993). Instead, variation in wind-inducedlatent heat flux9 has been assigned the dom-inant role (Chang et al., 1997; Häkkinen andMo, 2002). In the subtropical Atlantic, sev-eral modelling studies have suggested thatchanges in heat flux feedback betweenatmosphere and surface waters are impor-tant in explaining variability in tropicalAtlantic SSTs (e.g. Carton et al., 1996).Saravanan and Chang (1999) go further tosuggest that this thermodynamic feedbackis affected by the spatial variation inthe mixed layer depth, and through thisinteraction, strongly influences SST vari-ability in the subtropical seas, poleward of10° latitude. The zonal shift in SST and SLPconditions ascribed to an ENSO in the trop-ical Atlantic is considered stable (Zebiak,1993), Delecluse et al. (1994) suggested thatENSO in the Pacific may be remotely forc-ing unusual zonal shifts to theocean–atmosphere exchange in the tropicalAtlantic, but the complex of mechanismsthat would link Pacific and Atlantic ENSOtype variations still awaits clear decipher-ing.
The impact of the Atlantic ENSO varia-tion on rainfall has focused largely on theeastern rim of the tropical Atlantic, whereSSTAs, particularly in the south and north-eastern tropical and subtropical Atlantic,have been associated with anomalous sea-sonal rainfall in the Sahel, along theGuinean and Angolan Coasts and in theCongo Basin (Hastenrath, 1984a; Mo et al.,2001; Vizy and Cook, 2001; Kouadio et al.,2003). While the impact of the AtlanticENSO on equatorial Atlantic SST variabil-ity is apparently similar to, but less than,the Pacific ENSO’s effects on SSTs in thePacific, the resulting effects of this rela-
tively weak relaxation of the WalkerCirculation on rainfall variation in theGuiana Shield are less clear. This is partic-ularly true in light of the other impacts thatthe Pacific ENSO, the meridional AtlanticSST gradient (aka Atlantic Dipole) andother remote forcing factors may exert inconcert or during alternating seasonalphases. Marengo and Hastenrath (1993)indicate that the Amazon Basin may havebecome a zone of subsidence during theextreme 1983 EN event as the zone of con-vergence associated with the convectivearm of the Atlantic Walker Circulationshifted to the west of the Andes, but gener-ally western Amazon precipitation anom-alies are not related to ENSO.
Remote forcing factors
The latitudinal oscillation of the ITCZbrings heavy seasonal rainfall to the easternGuiana Shield, the Caribbean and southernCentral America. Its seasonal trek is drivenby movement of Atlantic warm waters thatchange position in response to seasonalshifts in hemispheric solar heating, thecourse of the oceanic currents, behaviour ofthe major atmospheric circulations andeffect of basin geometry. Ocean–atmos-phere models indicate that these internalprocesses driving change in the Atlanticbasin would not sustain or achieve theobserved variability in SSTAs without theaction of remote forcing factors (e.g. Nobreet al., 2003). Connections with remoteatmospheric and oceanic circulation pat-terns in the tropical Pacific and extra-tropi-cal Atlantic can act to attenuate or amplifythe effects of seasonal changes to the tropi-cal Atlantic SST gradient. By forcing anom-alous changes in the location, extent andintensity of the main warm SST pool (viastrengthening and relaxation of the tradewinds), they force a shift in, amongst otherphenomena, the normal seasonal move-ments of the ITCZ, the production and trackof African easterly waves (and hurricanes)and rainfall across the region.
PACIFIC ENSO EFFECTS ENSO has beenshown to play a significant role in shaping
Biophysical Features of the Guiana Shield 93
SST variability in the tropical Atlantic atinterannual to multi-decadal timescales(Hameed et al., 1993; Mo and Häkkinen,2001). A study by Enfield and Mayer (1997)(and later Ruiz-Barradas et al., 2000; Méliceand Servain, 2003) showed that the devel-opment of Atlantic SST anomalies laggedthose induced directly by ENSO in thePacific by 4–5 months and that these wereconsistently most severe along the westernedge of the tropical north Atlantic (i.e. theWHWP). Mélice and Servain identified aquasi-decadal (9.6 years) response of tropi-cal north Atlantic SST anomalies to theSOI. This response was asynchronous withthe (14 year) signal identified for a tropicalsouth Atlantic SSTA–SOI relationship, fur-ther suggesting that northern and southernoceanic–atmospheric processes mayrespond independently to different remoteforces and are not oscillating in a sustainednorth–south dipole.
Northwestern Atlantic rainfall re-sponses to ENSO development in thePacific are not necessarily proportional.Often a severe EN/LN phase fails to trans-late into equally severe rainfall anomaliesat locations normally considered respon-sive to ENSO (see Fig. 2.19, SOI vs. rain-fall). In part, this relates to the intensity ofzonal shifts in ocean–atmosphere condi-tions in the Pacific that translate intoEN/LN events. But other, longer-term oscil-lations that alter background SSTs in theeastern tropical Pacific can interact toenhance the impacts of the ENSO. Mestas-Nuñez and Enfield (2001) constructed asynthetic characterization of ENSO bycanonically correlating various indicatorsand compared this with SST anomaliesin the (Niño-3 zone) eastern tropicalPacific. They found that 40–50% of theamplitude in SSTs achieved during themost severe 1982–83 and 1997–98 ENevents was not associated with the canoni-cal ENSO, but longer-term oceanic adjust-ments sub-strengthening the impactsof a strong negative ENSO phase. Thisalone, however, does not result in a propor-tional amplification of rainfall in thewestern Atlantic sector, even in areas, suchas the eastern Guiana Shield, that have
shown a very consistent response to EN/LNevents.
The most severe amplification of sea-sonal rainfall patterns in the Caribbean, NEBrazil and Central America has been attrib-uted to periods when Pacific and AtlanticSST (or SLP) patterns achieve a certain con-formation. Again, severe events do notoccur regularly because changes in otheratmospheric components of the global cir-culation affecting tropical Atlantic SSTs donot always oscillate in a way that reinforcesthe effects of ENSO. Spectral analyses sug-gest that oscillatory phases of different forc-ing factors are typically attenuating rainfallresponses because their respective phasesof development and dissipation are discor-dant, and this mitigates the development ofstrong SST anomalies. However, at certainperiodicities, the oscillatory phases of dif-ferent forcing factors that promote posi-tive/negative SST anomalies conform,creating a composite effect that amplifiesanomalous behaviour of SSTs in the tropi-cal Atlantic (e.g. Uvo et al., 1998; Enfieldand Alfaro, 1999; Mo and Häkkinen, 2001).
In the tropical eastern Pacific, 79% ofvariation in SST anomalies is directlyattributable to ENSO. The amount of SSTvariation in the tropical north Atlanticexplained by ENSO in the Pacific is consid-erably less, about 25% according to Enfieldand Mayer (1997). The dominance of thezonal Walker Circulation in the Pacific, dif-ferences in basin size, land distribution andthe overriding importance of a meridional,rather than zonal, gradient as the founda-tion on which SSTAs develop in theAtlantic create conditions that are more dif-ficult to attribute to any single influence,internal or remote. Other remote influencescan act as important sources of variation atalternate periodicities. One of the mainforcing factors interacting with the Atlanticmeridional gradient and Pacific ENSO toshape the magnitude of SSTAs in the tropi-cal North Atlantic is the North AtlanticOscillation.
NAO EFFECTS In the Atlantic, researchsuggests that circulatory patterns other thanthose driven by the thermally direct Hadley
94 D.S. Hammond

Circulation can also force more subtlechanges in the SST gradient through varia-tion in their own oscillatory behaviour. Asa consequence, they may periodically alterthe seasonal positioning of subsidence andconvergence zones of the Hadley, drivingmulti-year to centennial-scale rainfall vari-ation in parts of the region. The NorthAtlantic Oscillation (NAO) has been vari-ously placed high on the list of co-contribu-tors, along with ENSO. The influence thatNAO has on rainfall in the basin is believedto be delivered indirectly through its forc-ing effects upon wind flow and oceanic heattransfer patterns. The ITCZ remains themain delivery vehicle for rainfall overmuch of the eastern half of the GuianaShield and adjacent regions, but the cas-cade of adjustments forced through inter-connecting atmospheric and oceaniccirculatory features is ultimately drivingthe variation in rainfall that occurs betweenyears, decades and centuries.
The NAO is defined by a large-scalefluctuation of sea-level pressure betweencentres near Iceland (low pressure) and theAzores islands (Portugal) (high pressure)(van Loon and Rogers, 1978; Rogers, 1984).The behaviour of NAO during the borealwinter is the dominant atmosphericdynamic in the North Atlantic and hasproven to be an important source of long-term variability in global climate. NAO isknown to vary seasonally, inter-annuallyand at decadal and multi-decadal scales.Extreme high index phases are character-ized by a very strong Azores high pressurein the south-east and an intense Icelandiclow pressure in the far north. They bringstrong mid-latitude westerlies, anom-alously low SST to the tropical Atlantic andmuch reduced rainfall over the Caribbean(Malmgren et al., 1998; Robertson et al.,2000; Giannini et al., 2001). Its effect onrainfall in the Guiana Shield has not beenspecifically studied. However, resultsachieved using general circulation models(GCMs) suggest that inter-annual fluctua-tions in simulated NAO conditions arestrongly associated with SST anomalies inthe tropical and subtropical North Atlanticand variations in these are known to affect
rainfall in the eastern Guiana Shield region(Nobre and Shukla, 1996; Fu et al., 2001).
AMPLIFICATIONS Recent climatologicalanalyses indicate that the most extreme pre-cipitation events across northern SouthAmerica, the Caribbean and lower CentralAmerica may occur when both the PacificENSO and NAO simultaneously reachextremes. Dry periods are characterized bystrong warm ENSO phases (+SSTA in theeastern Pacific) and strong positive NAOphases (+SLP anomalies over the Azores)and exceptionally wet periods when signsare reversed. The western tropical Atlanticis the only region known to experience vari-ations in SLP and SSTA associated withextreme phases of both the NAO and ENSO,establishing a unique spectrum of oscillat-ing conditions. Several of the most severedroughts on record (1877–78, 1982–83,1997–98) as having occurred in the GuianaShield and Central America are coincidentwith simultaneous extremes in the ENSOand NAO (Rogers, 1984; Huang et al., 1998;Malmgren et al., 1998; Giannini et al.,2001). During other phases, these systemsoscillate in a manner that acts to attenuatethe effects they have on SLP and SSTAs,and through these, the seasonal positioningof the ITCZ. These amplifying and mitigat-ing interactions between ENSO, NAO andother remote forces help to explain why thevariation in rainfall across the GuianaShield is not consistently and proportion-ally responsive to the intensity of EN/LNevents (Fig. 2.19).
Certain interannual or decadal-scalestate conditions in other oceanic andatmospheric systems also amplify SSTAsand phases of the seasonal rainfall cycleover the Guiana Shield region. According toEnfield and Alfaro (1999), one of the mostimportant of these, the Atlantic meridionalgradient (‘dipole’), interacts with negative(positive) conditions in the eastern tropicalPacific to further enhance (reduce) rainfallover the Caribbean, lower Central Americaand northern South America when the‘dipole’ phase is characterized by anom-alous northern tropical Atlantic conditionsof opposite sign to those in the eastern
Biophysical Features of the Guiana Shield 95

Pacific. Wang (2002) further concludes thatENSO can interact with both the Atlanticzonal equatorial mode (Atlantic WalkerCirculation) and the Atlantic meridionalgradient to enhance warm SSTAs in thetropical north Atlantic during the borealspring following the mature phase of an ENevent.
Land-borne components – topography,evapotranspirative recycling and surface
albedo
Terrestrial-borne effects of varying topogra-phy, surface albedo and vegetation coverinterface with local hydrological conditionsand the larger global circulation to definefurther variation in rainfall at smaller spa-tial scales. In the western Guiana Shieldand Sub-Andean Foredeep these are per-haps the dominant mechanisms regulatingrainfall during all but the most extremeocean–atmosphere phases, as the effects ofvarying oceanic conditions in the Atlanticdampen towards the continental centre (Fuet al., 2001) and westward water vapourflux declines (e.g. Fig. 18 in Salati andMarques, 1984).
TOPOGRAPHY, OROGRAPHY AND SOIL MOISTURE
Variation in surface roughness (and there-fore frictional force) can foster localizedprecipitation in a number of ways. Alongcoastal margins, moisture-laden surfacewinds travelling from smooth warm oceansurfaces across the mangrove-covered andforested coastline profiles can create condi-tions leading to rainfall. This effect isbelieved to enhance seasonal rainfallreceived along the Atlantic margin of theGuiana Shield as low-level easterlies moveacross the warm northward-flowing Braziland Guiana Currents (Snow, 1976). Thehigh centre of rainfall in southeasternFrench Guiana and Amapá is due in part tothis effect, although other factors are alsocontributing to the high precipitation ratesin the area.
Severe topographic transitions involv-ing mountains create more substantive fric-tional forces, rapid uplift and formation ofrain clouds. Orographic lifting plays a sig-
nificant role in maintaining the relativelyhigh local rainfall received on the wind-ward slopes of massifs forming the GuayanaHighland region. The long narrow corridorof relatively low rainfall dividing easternand western parts of the shield is inter-rupted by the eastern extension of thePakaraima Mts and surrounding tepui for-mations (Fig. 2.16A). Leeward of thesemountain features, rainfall shadows pre-dominate (Frost, 1968; Snow, 1976). Thismay assist in explaining the relatively nar-row north–south belt of ‘dry’ climate bisect-ing the Guiana Shield. As moistureaffecting the eastern Guiana Shield isdriven westward into the GuayanaHighlands by the trade winds and seabreezes, leeward slopes are starved of thisaddition to the main ITCZ source.Orographic lifting atop isolated horst for-mations, such as the Kanuku Mountains insouthern Guyana or Bakhuys Mountains inSuriname, can also substantially amplifyotherwise relatively modest local rainfalland water balances (Frost, 1968; Snow,1976).
The topographic effect of the GuayanaHighlands on rainfall nonetheless is slightin comparison with the orographic impactof the eastern Andean slopes. Rainfall alongthese slopes can reach above 4000 mm/yearas the trade wind flows pick up moistureacross the lowland basin and then are rap-idly forced upward (Johnson, 1976).Orographic uplift typically leads to cloudtypes different from those typifying adja-cent lowland systems. Orographic cloudstend to configure as stratus or altostratustypes, while convective clouds over thelowlands are mainly cumulo-nimbus. Bothdeliver rainfall, but with differing intensi-ties and rain rates. Rainfall from orographicclouds along the eastern Andean slopesoccurs over longer periods with fewerextreme rainfall events and is substantiallyaugmented at certain elevations by fog-delivered precipitation (e.g. Grubb andWhitmore, 1966). Downslope at lowlandsites where rainfall is delivered mainlythrough convection, the opposite is true(Fig. 2.24). The significance of this differ-ence rests in the impact of slope and rain
96 D.S. Hammond

Biophysical Features of the Guiana Shield 97
rate on surface run-off in these regions, aswell as the effects of a more uniform cloudcover and rainfall on expected changes intemperature with varying elevation (envir-onmental lapse rates). In the Guiana Shield,orographic effects reflect the modest eleva-tion of a scattered and localized archipelagoof ancient horst (Kanuku, Bakhuys),batholithic (Parguaza) and sedimentary(Roraima Supergroup) formations that arefor the most part centrally placed atop thecrystalline basement complex and fed byocean-modulated trade winds and seabreezes. The contrast with orographic con-ditions in western Amazonia could not bemore striking. Uplift is fed by substantial,water-laden northeasterlies impacting amassive, continuous, north–south barrier ofconsiderable elevation. This barrier islocated on the periphery of the westernlowland region. The western Andes con-tain, rather than divide as is the case of theGuiana Shield highlands, the hydrologicalbasin of the adjacent lowland region.
Localized low-points in topographycan also affect rainfall. Anomalously high
annual precipitation has been recorded at anumber of stations that share very few geo-graphic attributes (Iquitos, Peru; San Carlosde Rio Negro, Venezuela; Macapa, Brazil),except that they are situated within orimmediately adjacent to large, seasonallyflooded sedimentary depressions (e.g. SanCarlos and Casiquiere Rift in Fig. 2.9A).Large topographic depressions at the mouthof the Amazon, and along the central seg-ment of the Amazon (Solimões) west ofManaus (Fig. 2.8) create vast evaporativemoisture sources that may contribute torainfall generation over the central andwestern Amazon through northwestwardatmospheric conveyance.10 Southeasterlytrade winds travelling over the relativelydry Brazilian northeast become dry as theyachieve equilibrium with the surface. Whenthese dry winds encounter this depression,evaporation increases rapidly as the sensi-ble heat of the air combines with incomingradiation. As the air adjusts to the wettersurface, this moisture is conveyed north-westward towards the ITCZ.
While the balance of ocean- and land-
Fig. 2.24. Comparison of mean monthly total and 24 hour maximum rainfall for highland (Puyo, Ecuador)and lowland (Iquitos, Peru) locations in western Amazonia. Data for period 1949–1970. Source: Johnson(1976).
Puyo, EC (950 m)
Iquitos, PE (104 m)
Mea
n to
tal
24 h
max
.

borne processes is clearly different for eachlocation, local convection stimulated byenhanced surface to atmosphere watervapour flow (latent heat fluxes) may beenhancing precipitation otherwise predom-inantly delivered through the action oflarger-scale mechanisms (Koster andSuarez, 1995).
VEGETATION COVER AND EVAPOTRANSPIRATIVE RECY-CLING Salati and Margues (1984) esti-mated that 50% of the annual precipitationfalling over central Amazonia is sourcedfrom evapotranspiration. Eltahir and Bras(1994) more recently estimated a lower25–35% of rainfall over the Amazon assourced from regional evapotranspirationbased on their model analysis of two differ-ent data sets. Evapotranspiration from vege-tation cover and direct evaporation (latentheat fluxes) from the forest canopy andexposed water surfaces plays a crucial rolein sustaining high regional rainfall levels inmany parts of the tropics, but may be of par-ticular importance over the relatively iso-lated western Guiana Shield, Sub-AndeanForedeep and Amazon Downwarp regions.Analyses carried out by Marques et al.(1979) show a westward gradient of increas-ing atmospheric water storage (precipitablewater) over the Amazon Downwarpwith little month-to-month variation.In part, this suggests that local landsurface processes of vegetation cover andevapotranspirative recycling may play anequally or more important role in the main-tenance of rainfall over the westernAmazon and Guiana Shield than in theeastern half, where ocean-borne processesdominate (Ratisbona, 1976, p. 266). Thestrength of evapotranspirative recyclingmay also be acting to anchor the convergentarm of the zonal Atlantic WalkerCirculation (Philander, 1990), reducingthe amplitude of inter-annual variationit embraces relative to its Pacific counter-part. In this case, it may also be indirectlyshaping rainfall variability over theeastern Guiana Shield region by modulat-ing the range of zonal shifts in rainfallspurred by changing SSTA in the equatorialAtlantic.
SURFACE ALBEDO The amount of radiationreflected as a proportion of total incomingradiation is an important component of theglobal energy budget. It is known to have animportant role in regulating energy fluxesthat drive atmospheric convergence (diver-gence) and localized hydrostatic instability(stability). While the spatial variation insurface albedo is poorly resolved for theneotropics (Marengo and Nobre, 2001), dif-ferences associated with a change in surfacecover are well known. Generally speaking,there is a steady increase in the albedo ofsurfaces covered by forest vegetation (0.13),pasture/grassland (0.18) and desert/exposed sandy soil (0.37), respectively(Robinson and Henderson-Seller, 1999).Simulated increases in surface albedo atlow latitudes yielded a decrease in soilmoisture and precipitation in one model(Lofgren, 1995). Marengo and Nobre noted,however, a wide range of disparate modelresults and emphasized the need forimproved descriptions of land surface char-acteristics prior to establishing the climato-logical response to changes in attributessuch as surface albedo. Nonetheless, sea-sonal variation in albedo across Amazoniais believed to be related principally tochanges in soil moisture, rather thanincoming solar radiation (Culf et al., 1995).It has also been shown through field sur-veying that rapid secondary regrowth ofvegetation after forest loss reduces albedoto background forest levels within a decade(Giambelluca et al., 1997).
It stands to reason that regions with ahigher proportion of sand-dominated soilsand significant seasonal reductions in rain-fall are likely to experience a greaterincrease in surface albedo after vegetationloss and more rapid development of atmos-pheric subsidence zones. Given the relativepredominance of sandy soils, an estab-lished strong seasonality in rainfall overmuch of the central shield zone, relativelymodest secondary biomass accumulationrates and a high susceptibility to periodicEN-driven drought, changes in surfacealbedo conditions are likely to have a rela-tively important effect on local rainfall for-mation in the Guiana Shield compared with
98 D.S. Hammond

lowland regions of western Amazonia orCentral America that receive external mois-ture sourced from orographic, rather thanconvective, uplift along the upper easternslopes of the Andes. River highstands atany given location typically lag peak sea-sonal rainfall by several months, attestingto the buffering capacity that surface flowcan play on maintaining positive moisturebalances. As a whole, sedimentary evi-dence suggests that the Amazon River sys-tem has experienced a delayed response toregional changes in climate (Latrubesse andFranzinelli, 2002). Conveyance of moisturefrom the ever-wet, eastern Andean slopes tolowland regions subject to relatively strongseasonal declines in rainfall has the invari-able effect of buffering changes in surfacealbedo that would occur if this was a func-tion of local rainfall alone.
Surface albedo changes in the GuianaShield occur as a consequence of changesin vegetation cover and soil moisture levels.In the past, the climate of the Guiana Shieldwas believed to be quite different (see‘Prehistoric climates of the Guiana Shield’,below) and the positive feedback effects ofvegetation loss, soil moisture decline andincreasing surface albedo may have furtherpropelled some parts of the region into aperiod of much lower rainfall and morescattered forest cover (see ‘Prehistoric cli-mates of the Guiana Shield’, below). At thesame time, the effects of changing sea levelthroughout the Quaternary would alter sur-face run-off in the region, and some inlanddepressions may have experienced higher(lower) water tables of increased(decreased) duration than today (e.g. see‘Upland laterite soils’, above), reducing(increasing) surface albedo effects.
LATENT VS SENSIBLE HEAT FLUXES AND SOIL TYPE
EFFECTS Soil hydrological properties alsoinfluence regional rainfall by altering therelative contribution of sensible (H) andlatent heat (LE) fluxes, depicted by theBowen ratio (H/LE), to the overall processof energy transfer from surface to atmos-phere. Water bodies, such as oceans andlakes, typically have very low Bowen ratios.Latent heat fluxes occur as water undergoes
a phase change from liquid to gas (evapora-tion) to liquid (condensation) and thesedominate the exchange over water bodies.Sensible heat fluxes (high to low air tem-perature changes) are minimal and temper-ature changes are modest. In extremely drysurfaces, such as deserts, the opposite istrue with virtually all of the exchangeoccurring as sensible heat (and thus wide-ranging temperatures) since there is virtu-ally no water available to drive evaporation.Regional surfaces that exhibit high Bowenratios provide little energy to drive rainfalland attenuate temperature variations due tosensible heat fluxes. Considering surfaceswith energy transfer processes dominatedby sensible heat fluxes, the opposite is true.Generally speaking, the moisture-retentionproperties of surfaces are crucial in deter-mining the Bowen ratio. For tropical forest-lands, these properties are principally afunction of rainfall intensity, topography,vegetation cover and soil type (Bonell andBalek, 1993).
This establishes a potentially impor-tant source of regional variation in theneotropics. Soil types dominated alterna-tively by clay-loam and sand are notequally distributed across the neotropics(see ‘Soils and Soil Fertility’, above). Clay-dominated soils will tend to retain a muchhigher surface water content than sand-dominated types and latent heat fluxes willplay a more substantive role than sensibleheat in defining the local energy budgets inareas where closed forest canopy is not inplace. Closed forest canopy covers a widerange of soil types across the Guiana Shieldand the greater neotropics. The latent heatflux associated with the forest canopy,when viewed as a surface, will alwaysattenuate variation in the Bowen ratio rela-tive to its underlying soil surface due to theadded effects of transpiration and the eco-physiological adaptations (e.g. storageorgans, tap roots) that work to avoid com-plete desiccation and death. Living plants,unlike soils, therefore, moderate rapidshifts from latent to sensible heat-domi-nated energy transfers that would otherwiseoccur if the underlying soils were exposed.When this canopy is removed, differences
Biophysical Features of the Guiana Shield 99

in soil properties, all else being equal, aremore likely to spur greater spatial variationin precipitation and temperature responsesto larger-scale forcing factors. The easternGuiana Shield has the highest concentra-tion of sand-dominated and laterite-cappedsoil surfaces in the wet neotropics. Thesesoils, on average, experience faster dry-down rates than clay- and loam-dominatedsoil types (e.g. Jetten, 1994). The latteraccount for a larger proportion of theAmazon Downwarp and Sub-AndeanForedeep regions of western Amazonia (e.g.Sourdat, 1987) (Fig. 2.14).
SEA BREEZE Along the Atlantic coastline, asmaller land–ocean exchange process isbelieved to affect rainfall over the easternGuiana Shield region when the low sensi-ble heat release zone over the ocean comesin contact with the relatively higher absorp-tion and release rates of the adjacent landsurface. This means that the land heats upand cools down much faster than the oceancreating a temperature gradient perpendi-cular to the coastline (Robinson andHenderson-Seller, 1999). The consequentgradient in pressure forms a small-scale cir-culatory cell that drives a daily cycle ofwind movement from relatively warm tocool zones. During the day, when the landis warmer than the adjacent water, theascending branch of this cell occurs overland and an onshore surface wind predom-inates, called a sea breeze. The oppositecondition, referred to as land breeze, is trueat night when the slow heat loss rate of theocean makes this zone warmer than theadjacent coastlands. In both cases, cumulusclouds formed along the ascending branchare conveyed towards the coastline andhave been associated with enhanced pre-cipitation in areas up to several hundredkilometres inland (Kousky, 1980). Kouskyalso suggests that seasonal variation in thecontribution of sea and land breeze effectsto precipitation along the coastline ofnortheastern Brazil reflects changes in SSTand land heating. SSTAs are stronglylinked to changes in wind stress and ther-mohaline current movements. This suggeststhat the contribution to annual rainfall
made by the sea–land breeze cycle is sensi-tive to changes in global-scale circulatorypatterns, such as ENSO and NAO, as well aschanges to the amount of radiation receivedat the land surface that can be affected byexternal forcing factors (see ‘Longer-termclimate forcing factors’, below).
Guiana Shield rainfall and temperatureregulation in relation to other neotropical
regions
Taking latitudinally averaged values forincoming solar and outgoing long-waveradiation emphasizes the spatial constancyof this important influence on temperatureacross the tropics relative to regions ofhigher latitude. But within the tropics thereare important differences to be highlighted.The longer residence of the ITCZ north ofthe equator slightly reduces both ISR andOLR in this area due to the more persistentcloud cover compared to the austral portionof the equatorial trough. Across the GuianaShield and Amazonia, there also appears tobe a zonal increase in cloud cover persist-ence from east to west and a concomitantdecline (of between 27 and 78 W/m2) inannual average ISR received at the surfacerelative to eastern South America and theCaribbean (Lockwood, 1979). Satellite-based radar backscatter of rainfall illus-trates this zonal gradient in Fig. 2.23.
Of course, annualized averages do notreflect spatial differences in temporal varia-tion. As we have seen, Pacific ENSO,Atlantic meridional and zonal SST gradi-ents, African easterly waves (and hurri-canes), atmospheric Rossby waves andSACZ/SPCZ behaviour can all influencerainfall across the neotropics, but not uni-formly. For example, the depth of precipita-tion response to Pacific ENSO and AtlanticSSTAs across eastern South Americaappears more pronounced than in westernAmazonia (and the western tongue of theGuiana Shield). Western Amazonia canexperience an anomalous increase ordecline in rainfall during extreme ENSOphases, but these are modest by any meas-ure when compared with the easternGuiana Shield area (e.g. Fig. 2.6 in Marengo
100 D.S. Hammond

and Nobre, 2001). For example, Dai andWigley’s (2000) analysis of ENSO–precipi-tation relationships indicate an annualaverage decline (from the long-term mean)in rainfall during typical EN phases acrosswestern Amazonia of 0 to –100 mm perannum compared with a –50 to –300 mmdecline over most of the Guiana Shield andnortheastern Brazil. Considering the muchhigher average rainfall over most parts ofwestern Amazonia only further emphasizesthe contrast between these regionalresponses. Equatorial extension of mid-lati-tude atmospheric and oceanic systems,such as the Azores High AP (part of NAO)can have a pronounced effect on windstress, latent heat flux and SST in the (sub-)tropical North Atlantic, and impact on rain-fall in the Caribbean and Central America.The much greater southward extension ofthe ITCZ across eastern South America maycontribute to a deeper equatorial extensionof the Azores High across the easternGuiana Shield. Land–ocean processesacross the Guianas may buffer this area tosome extent from this movement, leaving ahigh AP extension corridor to remain overthe Savanna Trough, combining withreduced wind friction, higher albedo andmore rapid moisture loss of these mixedopen forest–grasslands. Anomalous phasesof NAO-related AP changes register little orno change of rainfall in west-central orsouthern Amazonia. In contrast, unusualbehaviour of the SACZ and SPCZ in theaustral mid-latitudes or the austral arm ofthe Atlantic ‘dipole’ can strengthen orweaken precipitation in southernAmazonia and SE Brazil, but with relativelylittle impact on the Guiana Shield.Northward extension of cold air masses ofpolar origin can regularly bring seasonaldrops in minimum temperatures oversouthern Amazonia, but much less fre-quently to the Guiana Shield.
In effect, mechanisms regulating rain-fall across the neotropics overlap, but withimpact epicentres occurring in differentregions (after Marengo and Nobre, 2001).Variation in the influence of land surfaceprocesses, such as topography, act to createsmaller-scale spatial anomalies in rainfall
regimes regulated by larger-scale mecha-nisms. The upper Rio Negro–Rio Orinocoregion receives some of the highest annualrainfall totals due to its position close to themeteorological equator, the influence ofITCZ behaviour and a high availability ofprecipitable water affected by the trough-like Casiquiare Rift. This rift receivestremendous surface run-off from both theeastern slopes of the Colombian Andes aswell as the western ranges of the GuayanaHighlands, culminating in extensive sea-sonal flooding as water flow is occludedalong the Orinoco and Rio Negro Rivermainstems (see ‘Casiquiare Rift’, above).The coastal zone between Cayenne, FrenchGuiana and northern Amapá also receivessimilarly high levels of rainfall due to geo-graphic position. The upper GranSabana–Rio Branco–Rupununi region sepa-rating these two locations, despite falling inthe same latitudinal band, receives muchless rainfall. In part this has been attributedto a leeward location relative to theGuayana Highlands (Frost, 1968; Snow,1976). But the fact that this region also restsalong the watershed divide might suggest amore rapid seasonal decline in the soilmoisture needed to maintain a strong inter-nal precipitation cycle during periodswhen the ITCZ has migrated southward andhigh pressure from the north has filled inbehind. Lowland areas of northwesternAmazonia within the ITCZ band and at thefoothills of the Andes hold a mid-centralposition along a more severe watershedincline and the effects of seasonal rainfalldecline are lagged by moisture movingdownward along the main watershed axis.Closer to the mainstem of theAmazon/Solimões, the volume of waterupstream attenuates the amplitude of dis-charge fluctuations (see ‘River, Lake andTidal Systems’, below) and possibly theeffects on water vapour and latent energyfluxes and thus precipitable water levels.For example, Marengo (1999) found that theriver level at Manaus, Brazil and Iquitos,Peru appeared relatively insensitive to verystrong EN/LN events due to the large size ofthe upstream area.
Taken as a whole, available informa-
Biophysical Features of the Guiana Shield 101
tion suggests that the three climatologicalregions of the Guiana Shield, as defined byKöppen, exhibit different rainfall patternsas a consequence of their geographic posi-tion in relation to the equator, oceans,mountains and sedimentary basins. Thissimple characteristic most cogently identi-fies those climate-regulating mechanismsthat are largely responsible for observed dif-ferences in seasonal timing and, perhapsmost importantly, the periodicity andamplitude of long-term rainfall and temper-ature variation. Changes in the fluctuatingbehaviour of these mechanisms, particu-larly those operating quasi-independentlyupon climate in the neotropics (e.g. humanactivity), are likely to result in newanisotropies in rainfall across the regionthat are not simply amplifying or attenuat-ing existing response gradients. Examiningpatterns of climate indicators across theGuiana Shield and adjacent regions in rela-tion to the modern climate-shaping mecha-nisms can help to establish to what extentformer climate change has determined thespatial patchwork of varying compositionand structure that forms modern tropicalforests in the region.
Prehistoric climates of the Guiana Shield
Tropical forests in the Guiana Shield arearguably as much, if not more, the productof past climate conditions as they are con-temporary ones. Yet the relative impact ofprehistoric climatic fluctuations on mod-ern-day forest distribution and compositionis difficult to establish conclusively. Glacialand polar ice layers can trap air from pastclimatic periods in bubbles, providinginformation on the trace gas and isotopiccomposition of past atmospheres. Oceanfloor sediment cores can also provide evi-dence of fluctuations in SSTs, salinity, cur-rent movement and biological productivity.The link between these and regional rain-fall and temperature changes over theneotropics, however, is not a simple one. Inthe lowland tropics, these more precisemeasures of prehistoric atmospheres do notexist, so we do not have a direct indicator ofvarying rainfall and temperature across
modern-day tropical forest regions. Instead,other proximate measures are typicallyused to frame regional prehistoric climatephases. Proximate measures of neotropicalclimate change taking place millions ofyears ago have relied heavily on analysis ofgeological features, such as loess deposits,geomorphological features (such as lateriticplanation surfaces) and sedimentary rocktype and distribution. Over the most recent100 ka BP that define the Quaternary period,more precise measures have been devel-oped using fossil organic remains that pre-serve well under certain lowland tropicalconditions. These lake- and swamp-derivedpollen and phytolith cores are being used toidentify climatological shifts in the region.Palaeoecologists and archaeologists havealso employed cultural transitions, meas-ured by changes in archaeological, charcoaland phytolithic remnants, as a proximatemeasure of palaeoclimatic change in theneotropics over the last 10,000 years.
It is important to note, however, thatthe maximum temporal resolution of mostof these records is 100 years (Table 12.1 inRobinson and Henderson-Seller, 1999), sothe impact of rainfall fluctuations at theperiodicities documented in studies ofmodern climatological phenomena, such asENSO, may simply be integrated into therecord along with other signals.
There are also issues related to theaccuracy of radiocarbon dates assigned todifferent materials frequently used as indi-cators of past climatic change. Lake bottomsediments can often undergo varying levelsof mixing and gyttja (pronounced ‘yut-ya’,Swed.) deposits can form from a variety of(non-atmospheric) carbon sources.Charcoal is considered the most reliablematerial for radiocarbon dating (Libby,1955), but the assigned age will also reflectthe source plant’s pre-burn growth period,described as the ‘in-built’ or ‘presample’age of the wood material. This can be con-siderable in the case of many modernAmazonian trees that have had their centralheartwood radiocarbon dated from 150 to1400 14C years BP (Zagt, 1997; Chambers etal., 1998).11 Stratigraphic variation of soilcharcoal concentration is also subject to
102 D.S. Hammond

misinterpretation when the position in thesoil profile is affected by factors other thanclimate change (e.g. post-fire downstreamtransport, biological activity, infiltrationrates, stream meandering) and samples arenot dated directly (Piperno et al., 1990).
Further circumstantial evidence of cli-mate change affecting the Guiana Shieldcould also be drawn from better-resolvedproximate measures constructed from mate-rial in the mid-latitudes or high altitudes,such as tree rings, ice cores and lake sedi-ments. This may assist in establishingimportant impacts of global-scale mecha-nisms (e.g. orbital forces), but the transla-tion of impact from temperate to tropicallatitudes again must rely in part on a correctinterpretation of cascading interactionsbetween regional atmospheric and oceaniccirculations. Only the most pervasive oftemperate–tropical climate connectionswould be reflected in the tropical records –changes in the internal mechanisms affect-ing rainfall (e.g. the balance between ocean-and evapotranspiration-derived contribu-tions to Amazon precipitable water) wouldbe more difficult to resolve. Ultimately, anacceptable reconstruction of prehistoricneotropical climate will require a composit-ing of the results from a growing number ofstudy sites that, interpreted on their own,may variously reflect relative contributionsof real changes in regional climatic condi-tions and the influences of local site attrib-utes. A durable interpretation of therelationship between adjusting climatechange mechanisms, hydrological and sedi-mentological responses to these adjust-ments, and the consequent depositiondynamics of fossil organic material has yetto be established. Sample sites not yieldingsignificant material are typically disre-garded rather than used to establish theimpact of local site attributes on materialdeposition patterns. Modern pollen andphytolith spectra reflect depositionaldynamics under current geomorphologicaland climate conditions – these may not belinearly related to prehistoric state condi-tions, particularly if fluctuating humanoccupation is considered as a factor overthe last 10 ka BP. Climate change and
human land-use signals are not necessarilyin phase and could create different deposi-tional outcomes.
This section aims to present a simplenon-specialist’s overview of the informa-tion used to reconstruct prehistoric climaticchange in the Guiana Shield and neigh-bouring regions and to draw attention to themain reconstructions of palaeo-precipita-tion and temperature patterns across theregion based on this information. The inter-pretation of palaeo-data fundamentallyinforms the approach adopted in recon-structing past climate change. From thestand-point of population and communitydynamics, the impacts of former climatechange on current forest composition anddistribution within the Guiana Shieldshould be substantial given: (i) the estab-lished life expectancy of many tropicalcanopy trees; (ii) the geographical locationand topography of the region in relation tothe main climate-driving features of theglobal circulation; and (iii) the currentgeometry and position of the forest/savannainterface across the area (see Chapter 7).Given well-established concerns over thefuture impacts of a contracting neotropicalforest cover on global climate, biologicaldiversity levels and regional socio-economic well-being, a clear understandingof prehistoric ‘cause and effect’ pathwayslinking climate and tropical forests can sub-stantively inform the range of likelyresponses to modern forest land-use.
PALAEO-CLIMATE PROXY DATA FOR THE GUIANA
SHIELD Fewer than 60 sites have beensampled in the ‘lowland’ neotropics (Fig.2.25) and, of these, material has been radio-metrically dated in only a handful of cases(Colinvaux, 1996; Haberle, 1997; Piperno,1997). Most data are palynological or sedi-mentary and collected from Andean high-land locations (Fig. 2.25), although severalphytolithic, isotopic and archaeologicalstudies have also been carried out. Mostpublished sample sites are located on theperiphery or outside of the shield area andalmost always in the large sedimentarybasins (Berbice Depression, Takutu Graben,Sub-Andean Foredeep, Amazon Down-
Biophysical Features of the Guiana Shield 103

104 D.S. Hammond
warp) or volcanic arcs (Central America)that range across the lowland neotropics(Fig. 2.25) (e.g. Fig. 2.1 in Romero, 1993).Few locations in the major areas of exposedPrecambrian rock (Guayana Highlands,Tumucumaque Uplands, northern BrazilianShield) have been examined and thesederived almost exclusively from swamp orbog locations (terric Histosols) where strati-fied palynological profiles most typicallydevelop (Rull, 1991). Less than 1% of thelowland neotropics is thought to be coveredby Histosol soil types (Richter and Babbar,1991) and mainly concentrated in sedimen-tary depressions of the Sub-AndeanForedeep (Schulman et al., 1999), BerbiceDepression (Fig. 2.11D) and other regionalzones of downwarping (and inundation).Histic soil cover in areas dominated by
Precambrian rock types is considerablyreduced, although bog formations atoptepuis have proved useful for palynologicalstudies of the Holocene (Schubert and Fritz,1985; Rull, 1991). Lakes and swamps of anage needed to expand the record across thelowland neotropics are not common orevenly distributed. This relative rarity ofpollen-preserving conditions presents diffi-culties in confidently discriminating thecontribution of fluvial from aerial, localfrom remote, sources to the profiles andthus the spatial scale at which these profilescan be appropriately applied in recon-structing past vegetative responses to for-mer climate conditions. Long-distancefluvial transport of pollen downslope tolowland sample sites is considered aninsignificant transfer path for a variety rea-
Fig. 2.25. Location of fossil pollen, phytolith and charcoal studies across the neotropics. Note dispropor-tionate sampling of Andean highlands relative to Sub-Andean Foredeep, Amazon Depression and nearabsence of samples from Tumucumaque Upland region of Guiana Shield. Source: Latin American PollenDatabase (crossed squares) and other non-LAPD listed pollen core locations (open squares) and additionalcharcoal study sites (triangles).

sons. Current understanding of modern flu-vial systems across Amazonia repeatedlyidentifies the highland Andes as the sourceof the overwhelming majority of both par-ticulate organic and total suspended solidssampled in stream and through sedimentcores at the mouth of the Amazon (see‘River, Lake and Tidal Systems’, below). Itis difficult to reconcile current transportefficacy with a selective absence of pollentransport along similar distances of prehis-toric river systems. Clearly, scaling uppalaeoclimate reconstruction from a singlesample site to the entire lowland neotropicsassumes considerable spatial uniformity inthe cause-and-effect of climate change. Thisspatial uniformity is not apparent in ourcurrent understanding of forces affectingthe modern neotropical climate (see‘Modern climatic regions’, above). Giventhe regional variation in influence ofdifferent modern climate forcing factors,past changes in rainfall most certainlyvaried by region rather than uniformlyacross the neotropics (Colinvaux, 1987,1996).
Phytoliths, being mineral-based rem-nants of plant structures, are not con-strained to local conditions that preserveorganic materials (such as histic soils) andcan cover a much wider range of substrateconditions (Piperno and Becker, 1996). Tothis end, they have greatly assisted in ‘tri-angulating’ results from pollen-based stud-ies. Archaeological data have also beenused to assess climate change, based on theassumption that early societies relocatedand adjusted the style, quantity and compo-sition of their utensil manufacturing anddiet in response to changing climate andthat this response is apparent from materi-als found at midden (‘trash’) and burial(‘cemetery’) sites (Meggers, 1994). Radio-carbon ages for buried charcoal have alsobeen used to infer periods of relative aridityin the neotropics and/or former occupationby pre-Columbian inhabitants (Saldarriagaand West, 1986). Combinations of charcoaland phytolith data have greatly assisted inestablishing plausible connections betweenpalaeofire events and prehistoric humanactivities. Again, however, few neotropical
sites have been examined and many soiltypes found throughout the region have notbeen studied. This presents anotherquandary in the scaling up of interpreta-tion. Underlying soil types have asymmet-ric hydrological responses to fluctuations inrainfall and, therefore, susceptibilities tofire after an ignition event (see ‘Soils andSoil Fertility’, above; Hammond and terSteege, 1998).
Apart from detailed technical concernsover site-specific influences, the main diffi-culty in understanding palaeoclimate fromthese types of data rests in the fact that theyreflect a composite response to change,potentially occurring at many different spa-tial and temporal scales. Identifying themain signal associated with changes in thetype of pollen, pottery and phytolithsencountered in a dated chronology is diffi-cult. Not all signals necessarily reflect peri-odicities of the main climate forcinginfluences (e.g. anomalous social decision-making, war, disease and restoration, epi-demic plant disease (Allison et al., 1986),volcanic explosions (Behling, 2000), geo-seismic impacts on soil movement and flu-viatile dynamics (e.g. Frost, 1988)). Thosethat do should not necessarily be translatedas a uniform impact on palaeoclimatethroughout the neotropics.
Clearly the accrual of a substantialnumber of sampling sites is needed acrossthe neotropics in order to recognize the spa-tial scale of anomalous rainfall responses topast climate change. Given the considerablezonal and meridional variation in rainfallseasonality that currently characterizes theGuiana Shield and adjacent areas, a morecomplete stratification of sample sites thatembraces a wider range of landforms andsoil types would increase the resolution ofpalaeoclimate change established by proxyfor the region.
MAIN RECONSTRUCTIONS OF PAST NEOTROPICAL CLI-MATE CHANGE Despite some lingeringuncertainties, the interpretation of past cli-mate based on the palynological, charcoal,phytolithic and archaeological record pro-vides an important quantitative approach toestimating prehistoric fluctuations in tem-
Biophysical Features of the Guiana Shield 105
perature and precipitation across theneotropics. Compositing results from manydifferent sites can assist in overcoming site-specific uncertainties and provides thebasis for a cogent reconstruction of past cli-mate. A detailed palaeoclimatologicalreconstruction for the Guiana Shield hasyet to be made, although a number of sce-narios have been generated based on bestavailable information. The most wellknown of these is the CLIMAP project recon-struction of global climate during the LastGlacial Maximum (LGM) (18–25 ka BP), butthe global scale of this early effort providesfew details regarding the Guiana Shieldregion.
The distribution of extant plants andanimals, geomorphological features, mod-ern rainfall and temperature gradients, fos-sil pollen, phytoliths and charcoal have allbeen variously incorporated into hypothe-ses championing one or another aspect ofclimate change as the main force affectingneotropical forest cover. These data havehistorically been interpreted into two mainscenarios of change. One is based on theview that rainfall was the predominantforce for change across the neotropics dur-ing the Quaternary (Haffer, 1969; Vanzolini,1973; Whitmore and Prance, 1987 andchapters therein), converting vast areas offorest to (wooded) savanna (Ab’Saber,1977). The other contends that ambienttemperature change largely explains varia-tion in the palaeobotanical record duringthis period (van der Hammen, 1974; Liuand Colinvaux, 1985). Other climate changepathways have been proposed (for example,changes in [CO2] or UV light (e.g. Flenley,1998)), though these are not as easilytestable using the type of proxy data col-lected in the region and discussed here. Thestrengths and weaknesses of each have beenassessed by Colinvaux (1996) andColinvaux and De Oliveira (2001). Theweight of scientific opinion has oscillatedbetween moisture and temperature over thepast 35 years. In part, this is a consequenceof a fragmented palaeo-botanical recordthat has failed to show strong spatial syn-chrony of vegetation responses to putativeclimatic fluctuations. This may reflect dis-
parities due to local site factors, such asvarying depositional responses to the sameclimate phases, the role of different plantsuccessional trajectories, or varying impor-tance of unconformable sedimentaryrecords (often many periods are ‘missing’from the core sample of sediments (e.g. seeLedru et al., 1998)). A fuzzy signal may alsobe due to disparate methodologicalapproaches (e.g. see Marchant et al., 2001).Alternatively, inconsistent site interpreta-tions of alternating wet and dry, cold andwarm periods may reflect real regional dif-ferences in the way moisture and energybalances fluctuate in response to forcingfactors (e.g. Hooghiemstra and van derHammen, 1998). This would be consistentwith the view that mechanisms affectingclimate at any particular location tend tointeract across a wide range of spatial andtemporal scales to deliver anisotropic cli-mate signals at the forest surface in a man-ner, but not magnitude, similar to presentday systems.
The proximate record of climatechange in the neotropics extends back to atleast the mid-Cretaceous when the GuianaShield was believed to have only started toseparate from its West African counterpart,the Man and Benin Shields (see ‘Internalplanetary energetics’, below) (Barron andWashington, 1982). Understanding the spa-tial variation of prehistoric climate acrossthe Guiana Shield over the last 100,000years, however, is arguably of greatestimportance in establishing the effect ofregional processes on past moisture andtemperature variations that have shaped thecomposition and distribution of modernforests of the region.
HOLOCENE RAINFALL AND TEMPERATURE (0–10 KA
BP) Anomalous periods of drought arebelieved to have affected the lowlandneotropics over much of the Holocene(Absy et al., 1991). Maximum achievableresolution of the palaeo-record, however,currently cannot characterize seasonal,annual or even decadal rainfall signals. Anattenuation of wet season rainfall versusamplification of dry season drought wouldhave different implications for rainforest
106 D.S. Hammond
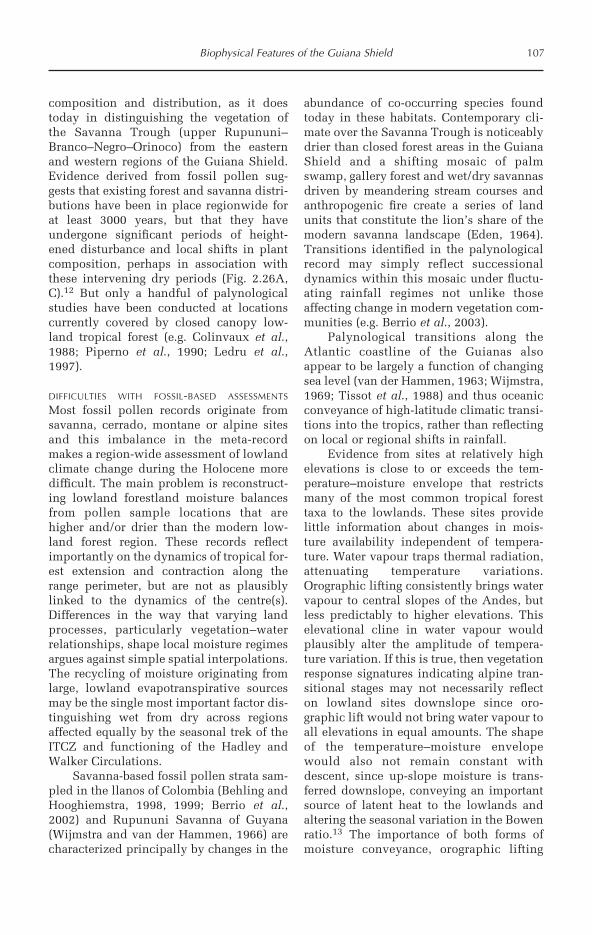
composition and distribution, as it doestoday in distinguishing the vegetation ofthe Savanna Trough (upper Rupununi–Branco–Negro–Orinoco) from the easternand western regions of the Guiana Shield.Evidence derived from fossil pollen sug-gests that existing forest and savanna distri-butions have been in place regionwide forat least 3000 years, but that they haveundergone significant periods of height-ened disturbance and local shifts in plantcomposition, perhaps in association withthese intervening dry periods (Fig. 2.26A,C).12 But only a handful of palynologicalstudies have been conducted at locationscurrently covered by closed canopy low-land tropical forest (e.g. Colinvaux et al.,1988; Piperno et al., 1990; Ledru et al.,1997).
DIFFICULTIES WITH FOSSIL-BASED ASSESSMENTS
Most fossil pollen records originate fromsavanna, cerrado, montane or alpine sitesand this imbalance in the meta-recordmakes a region-wide assessment of lowlandclimate change during the Holocene moredifficult. The main problem is reconstruct-ing lowland forestland moisture balancesfrom pollen sample locations that arehigher and/or drier than the modern low-land forest region. These records reflectimportantly on the dynamics of tropical for-est extension and contraction along therange perimeter, but are not as plausiblylinked to the dynamics of the centre(s).Differences in the way that varying landprocesses, particularly vegetation–waterrelationships, shape local moisture regimesargues against simple spatial interpolations.The recycling of moisture originating fromlarge, lowland evapotranspirative sourcesmay be the single most important factor dis-tinguishing wet from dry across regionsaffected equally by the seasonal trek of theITCZ and functioning of the Hadley andWalker Circulations.
Savanna-based fossil pollen strata sam-pled in the llanos of Colombia (Behling andHooghiemstra, 1998, 1999; Berrio et al.,2002) and Rupununi Savanna of Guyana(Wijmstra and van der Hammen, 1966) arecharacterized principally by changes in the
abundance of co-occurring species foundtoday in these habitats. Contemporary cli-mate over the Savanna Trough is noticeablydrier than closed forest areas in the GuianaShield and a shifting mosaic of palmswamp, gallery forest and wet/dry savannasdriven by meandering stream courses andanthropogenic fire create a series of landunits that constitute the lion’s share of themodern savanna landscape (Eden, 1964).Transitions identified in the palynologicalrecord may simply reflect successionaldynamics within this mosaic under fluctu-ating rainfall regimes not unlike thoseaffecting change in modern vegetation com-munities (e.g. Berrio et al., 2003).
Palynological transitions along theAtlantic coastline of the Guianas alsoappear to be largely a function of changingsea level (van der Hammen, 1963; Wijmstra,1969; Tissot et al., 1988) and thus oceanicconveyance of high-latitude climatic transi-tions into the tropics, rather than reflectingon local or regional shifts in rainfall.
Evidence from sites at relatively highelevations is close to or exceeds the tem-perature–moisture envelope that restrictsmany of the most common tropical foresttaxa to the lowlands. These sites providelittle information about changes in mois-ture availability independent of tempera-ture. Water vapour traps thermal radiation,attenuating temperature variations.Orographic lifting consistently brings watervapour to central slopes of the Andes, butless predictably to higher elevations. Thiselevational cline in water vapour wouldplausibly alter the amplitude of tempera-ture variation. If this is true, then vegetationresponse signatures indicating alpine tran-sitional stages may not necessarily reflecton lowland sites downslope since oro-graphic lift would not bring water vapour toall elevations in equal amounts. The shapeof the temperature–moisture envelopewould also not remain constant withdescent, since up-slope moisture is trans-ferred downslope, conveying an importantsource of latent heat to the lowlands andaltering the seasonal variation in the Bowenratio.13 The importance of both forms ofmoisture conveyance, orographic lifting
Biophysical Features of the Guiana Shield 107

108 D.S. Hammond
Fig. 2.26. Holocene/late Pleistocene distribution of (A) drier (solid column)/wetter (empty column) and (B)warmer (empty)/cooler (solid) climate phases based on interpretation of stratigraphic position of fossilpollen, phytoliths, geomorphological features and geochemical abundances in relation to stratigraphicposition. Age of strata based on radiocarbon dates and projected sedimentation rates. Dashed linerepresents beginning of Holocene. Hatched bars indicate results showing high-frequency fluctuationsbetween conditions. Grey bars indicate peak of charcoal radiocarbon dates from Fig. 2.26(C) and theexpected span of the Last Glacial Maximum (LGM), a period of reduced sea level and lower globaltemperatures. (C) Distribution of 14C dates for fossil charcoal samples collected at various lowland forestand savanna locations in the Guiana Shield and adjacent regions. Savanna is modern habitat at GranSabana and Salitre sites. Forest is modern habitat at all other sites. Other site features, soil sampling depth(D) and radiocarbon dating methods differ between sites. See Note reference in text for further clarificationand site references. a = open aquatic sites; +/++ = peak phase.
14C
yea
rs B
P
Val
enci
a, V
E
Val
enci
a, V
E
Val
enci
a, V
E
Ven
ezue
la
L. V
olca
n, P
AN
M.
Osc
uro,
PA
N
El V
alle
, P
AN
La Y
egua
da,
PA
N
La Y
egua
da,
PA
N
L. W
oodh
ouse
, P
AN
Geo
rget
own,
GY
Alli
ance
Wel
l, S
U
Man
a, F
G
Lagu
na S
ardi
nas,
CO
Lagu
na A
ngel
, C
O
Lagu
na C
arim
agua
, C
O
Lagu
na E
l Pin
al,
CO
Lagu
no C
hene
vo,
CO
Nou
ragu
es,
FG
Lagu
no M
ozam
biqu
e, C
O
Lagu
na A
gua
Suc
ia,
CO
Lake
Mur
iru,
GY
Rio
Neg
ro,
BR
Ana
nguc
ha,
EC
low
land
wet
land
s, E
C
P.
de M
onic
a, C
aqet
a, C
O
low
er A
maz
on,
BR
Man
aus,
BR
Cac
o La
ke,
BR
Car
ajas
, B
R
Car
ajas
, B
R
Sal
itre,
BR
Sal
itre,
BR
Ron
doni
a
Cro
min
ia,
BR
mid
Sao
Fra
nc R
., B
R
Titi
caca
Titi
caca
Titi
caca
Cur
tiset
al.
1999
Bra
dbur
yet
al.
1981
Sal
gado
-Lab
ouria
u 19
80R
uil 1
996
Beh
ling
2000
Pip
erno
& J
ones
200
3B
ush
& C
olin
vaux
199
0P
impe
rno
et a
l.19
92B
ush
et a
l.19
92B
ush
& C
olin
vaux
199
4V
an d
er H
amm
en 1
963
Wijm
stra
196
9T
isso
tet
al.
1988
Beh
ling
& H
oogh
iem
stra
199
8B
ehlin
g &
Hoo
ghie
mst
ra 1
998
Beh
ling
& H
oogh
iem
stra
199
9B
ehlin
g &
Hoo
ghie
mst
ra 1
999
Ber
rioet
al.
2002
Ledr
uet
al.
1997
Ber
rioet
al.
2002
Wijm
stra
& V
an d
er H
amm
en 1
966
Wijm
stra
& V
an d
er H
amm
en 1
966
Filh
oet
al.
2002
Fro
st 1
988
Wen
get
al.
2002
Beh
ling
et a
l.19
99B
ush
et a
l.20
00B
ehlin
get
al.
2001
Siff
edin
eet
al.
2003
Sife
ddin
eet
al.
2001
Abs
yet
al.
1991
Pes
send
aet
al.
2001
Ledr
uet
al.
1996
de F
reita
s et
al.
2001
Fer
raz-
Vic
enti
& S
alga
do-L
abou
riau
1996
De
Oliv
iera
et
al.
1999
Row
eet
al.
2002
Bak
eret
al.
2001
Cro
sset
al.
2001
0
1000
2000
3000
4000
5000
6000
7000
8000
9000
10000
11000120001300014000150001600017000180001900020000210002200023000240002500026000270002800029000300003100032000330003400035000
A

Biophysical Features of the Guiana Shield 109
14C
yea
rs
El V
alle
, P
AN
La Y
egua
da,
PA
NL.
Wod
ehou
se,
PA
NC
ON
oura
gues
, F
GA
maz
on S
ea F
an,
BR
P.
de M
onic
a, C
aqet
a, C
OM
era,
EC
San
Jua
n B
osco
, E
CC
aco
Lake
, B
RS
alitr
e, B
RK
atira
, B
Rm
id S
ao F
ranc
R.,
BR
Cro
min
ia,
BR
Fig. 2.26. continued
B
Bus
h &
Col
inva
ux 1
990
Pip
erno
et a
l. 19
90B
ush
& C
olin
vaux
199
0va
n’t
Gee
r et
al.
2000
Ledr
uet
al.
1997
Hab
erle
199
7B
ehlin
get
al.
1999
Liu
& C
olin
vaux
198
5B
ush
et a
l. 19
90S
iffed
ine
et a
l. 20
03Le
dru
et a
l. 19
96va
n de
r H
amm
en &
Abs
y 19
94D
e O
livie
ra e
t al
. 19
99F
erra
z-V
icen
ti &
Sal
gado
-Lab
ouria
u 19
96
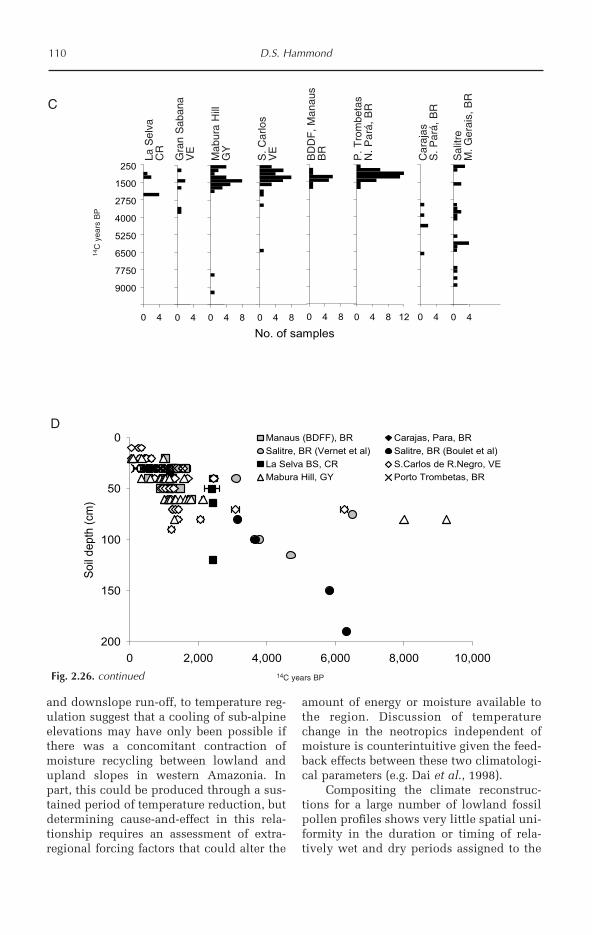
110 D.S. Hammond
and downslope run-off, to temperature reg-ulation suggest that a cooling of sub-alpineelevations may have only been possible ifthere was a concomitant contraction ofmoisture recycling between lowland andupland slopes in western Amazonia. Inpart, this could be produced through a sus-tained period of temperature reduction, butdetermining cause-and-effect in this rela-tionship requires an assessment of extra-regional forcing factors that could alter the
amount of energy or moisture available tothe region. Discussion of temperaturechange in the neotropics independent ofmoisture is counterintuitive given the feed-back effects between these two climatologi-cal parameters (e.g. Dai et al., 1998).
Compositing the climate reconstruc-tions for a large number of lowland fossilpollen profiles shows very little spatial uni-formity in the duration or timing of rela-tively wet and dry periods assigned to the
Figure 2.26D
0
50
100
150
200
0 2,000 4,000 6,000 8,000 10,000
14C yrs BP
Soil
depth
(cm
)
Manaus (BDFF), BR Carajas, Para, BR
Salitre, BR (Vernet et al) Salitre, BR (Boulet et al)
La Selva BS, CR S.Carlos de R.Negro, VE
Mabura Hill, GY Porto Trombetas, BR
0 40 40 4 8 120 4 80 4 80 4 80 40 4
250
1500
2750
4000
5250
6500
7750
9000
No. of samples
14C
years
BP
La
Se
lva
, C
R
Gra
n S
ab
an
a
VE
Ma
bu
ra H
ill
GY
Sa
n C
arl
os,
V
E
BD
DF
, M
ana
uB
R
P.
Tro
mb
eta
s N
.Pa
rá,
BR
Ca
raja
s,
S.P
ará
, B
R
Sa
litre
, M
.Ge
rais
, B
R
La S
elva
CR
Gra
n S
aban
aV
E
Mab
ura
Hill
GY
S.
Car
los
VE
BD
DF
, M
anau
sB
R
P.
Tro
mbe
tas
N.
Par
á, B
R
Car
ajas
S.
Par
á, B
R
Sal
itre
M.
Ger
ais,
BR
14C
yea
rs B
P
14C years BP
C
D
Fig. 2.26. continued

data over the last 10,000 years (Fig. 2.26A).Phytolith studies have been restrictedlargely to a few sites, mainly in Panama andalong the Amazon mainstem. Adding theseto the composite generally reinforces theview, however, that translating the palyno-logical record into a prehistory of rainfallshows only modest spatial or temporal con-sistency over the Holocene (Piperno andBecker, 1996). It does, however, unequivo-cally show that the neotropical forest regionhas undergone significant change over thelast 10,000 years.
Asynchrony in the fossil pollen, rockand isotopic abundance records over theHolocene suggests: (i) other forces havealtered the pollen–vegetation–climate rela-tionship; (ii) rainfall responses to climatechange varied widely across the neotropics;or (iii) interpretations of pollen-type stratavary in their accuracy. All are likely to betrue. Most records over the Holocene indi-cate that human activity has periodicallyaltered the distribution of forest cover, par-ticularly over the past 5 ka. At LakeWodehouse, Panama, phytolithic evidencesuggests that forests have only been recov-ering from prehistoric cultivation for 300years, although modern rainfall seasonalityis not expected to have varied significantlyup to 1600 years earlier (Bush andColinvaux, 1994; Piperno, 1994). Other nat-ural catastrophes, such as flooding (Frost,1988) or volcanic activity (Behling, 2000),can also disrupt the palynological/phy-tolithic record of response to prevailing cli-matic conditions. Bush and Colinvaux(1994) conclude that dry phases associatedwith the late Holocene record from Darien,Panama are most likely a reflection of localevents. Ledru et al. (1996) identified severalperiods of aridity in the palynologicalrecord at the south-central Brazilian site atSalitre, but not at Serra Negra, only severalhundred metres upslope from the lowerpeat bog location. Asynchrony in the recordof geological responses to prehistoric cli-mate change is also increasingly beingviewed as a consequence of regional varia-tion in the response to global climate for-cing factors (Sifeddine et al., 2003).
Local vegetation mosaics at the sample
site may also act to filter out regional pat-terns of change. Berrio et al. (2002) opinethat certain fossil pollen cores taken fromlake locations in the Llanos Orientales ofColombia do not adequately reflect regionalsavanna elements when the sample siteperiphery is dominated by arboreal swampvegetation.
Interpretation of the sample pollenstrata may also introduce heterogeneity inthe reconstruction of palaeoclimate. Bush(2002) warns that using fossil grass pollenas the main factor in reconstructing prehis-toric precipitation change is potentiallymisleading, given long-ranging wind polli-nation of grasses and their ability to colo-nize both dry (savannas) and wet (floatinggrass mats and marshes) environments andstrong associations with human-modifiedlandscapes.
LOCAL AND REGIONAL DIFFERENCES Thesecaveats further emphasize the role of local-ized effects on fossil pollen deposition andhow they preclude wider extrapolationacross Amazonia. The Guiana Shield, withits distinct geographical distribution alongthe thermal and meteorological equators,proximity to the western rim of the AtlanticBasin, and unique underlying geology, isunlikely to have been subject to the sameclimatic history as Central American, west-ern Amazonian or northeastern Brazilianregions. Modern mechanisms with varyingspatial centres of influence on neotropicalrainfall further suggest that the prehistoricclimate of the Guiana Shield may have var-ied ‘out-of-phase’ with adjacent regions. Itis tempting to reconstruct the spatial varia-tion of prehistoric rainfall by uniformlyreducing or enhancing existing distribu-tional patterns (e.g. Bush, 1994; Figs 3 and4 in van der Hammen and Absy, 1994), butthis logic in many ways is inconsistent withthe geography of oceanic–land–atmosphereprocesses that govern the modern hydro-logical cycle. Forcing factors of tremendousamplitude would be needed to overshadowthe dynamical adjustment processes thatcreate spatial variation in climate condi-tions across the neotropics.
The few palynological cores that have
Biophysical Features of the Guiana Shield 111
been examined within the Guiana Shieldindicate that the area east of the RioNegro/Rio Orinoco was subject to more pro-nounced changes in rainfall in comparisonwith western Amazonia over the past10,000 years (Fig. 2.26A). The ubiquitouspresence of charcoal across many parts ofthe eastern landscape further suggests thatmuch of the existing forest/savanna mosaicin the Guiana Shield has been subject todrought-induced fire. Radiocarbon datesranging from <100 to 10,000 14C years BP
indicate that fire has maintained a presenceover the entire Holocene (Fig. 2.26C). Fewpublished, radiocarbon-dated charcoalrecords are available for western regions.Charcoal has been identified from soil pro-files in some regions (e.g. Caqueta region,Colombia; Duivenvoorden and Lips, 1995)and as thick layers in terraces along theColombian Solimões (D. Hammond, per-sonal observation), so fire has occurred,perhaps catastrophically, in the upperAmazon Basin. The relatively infrequentoccurrence of deposits, however, comparedwith the very high frequency of charcoalencountered in soil cores taken within (SanCarlos de Rio Negro, Gran Sabana, MaburaHill, Nouragues) or adjacent to (Manaus)the eastern Guiana Shield is noteworthy.This distinction may be due to fewer andsmaller fires occurring under higher sus-tained rainfall, as it is today, in northwest-ern Amazonia, or reworking of charcoaldeposits by the prominent regime of fluvialmeandering that characterizes many partsof the western Amazonian lowlands (Saloet al., 1986). The abundance of charcoalages in the 1200–3000 years BP range mayalso be a testament to the rapid increase inanthropogenic lowland forest impacts dur-ing the late Holocene, although some loca-tions in the Guianas appear to have beenexposed to forest fires that pre-date evi-dence of human inhabitation (Tardy et al.,2000; Hammond et al., submitted).
PLEISTOCENE RAINFALL AND TEMPERATURE (10–100KA BP) Global climate change during thePleistocene is believed to have been domi-nated by a period of oscillating glacial–interglacial phases culminating in the Last
Glacial Maximum (LGM), approximately24–18 14C ka BP. Unlike the Holocene, paly-nological, geological and isotopic recordsfor the Pleistocene generally suggest a uni-form cooling phase across South Americaconsistent with LGM onset. The compositerecord also indicates a period of drier cli-mate extending from the LGM to the begin-ning of the Holocene (10 ka BP). Asimultaneous decline in lowland moistureavailability and temperature during theLGM would be consistent with a view thatthe lowland neotropics and upland slopesare bound by a temperature–moisture feed-back cycle that can only be shifted whenthere is a change in the overall amount ofenergy or moisture available. Two externalforcing factors have been identified as themost likely catalysts of declining moistureand temperature across the neotropics (see‘Longer-term climate forcing factors’,below), but the spatial variation of impactremains poorly resolved. Most recordsextending through the LGM are derivedfrom sediments sampled from alpine orsavanna/cerrado locations on the peripheryof the modern lowland forest region. Theabsence of LGM records from lowlandneotropical locations is noticeable(Colinvaux, 1996, p. 359; Ledru et al., 1998;Rull, 1999).
LAPSE RATES The Pleistocene lowlandtemperature depressions needed to explainaltitudinal variation in the presence ofmodern alpine and montane pollen are typ-ically estimated by assuming a linear rela-tionship between temperature andelevation. The most common approach isto apply the mean lapse rate for tropicallatitudes (currently figured at 6°C per kmchange in elevation) to the difference in ele-vation between the fossil pollen sample siteand the modern elevational limits of thesame indicator taxa.14 By applying this rateto the distance, a change of temperatureassociated with downslope migration ofindicator taxa is calculated.
Lapse rates, however, are far from con-stant across mountainous landscapes andhave been shown to vary by elevation,aspect, latitude and proximity to ocean
112 D.S. Hammond
within the neotropics (Johnson, 1976;Walsh, 1996). The most appropriate appli-cation of a temperature–altitudinal relation-ship for these purposes is theenvironmental lapse rate (ELR) (Robinsonand Henderson-Seller, 1999). ELRs varycontinuously in space and time and are sen-sitive to simple changes in slope, aspectand other landscape features as well asdiurnal and seasonal variations in cloudcover and incoming solar radiation. Localinflections in the temperature–altitude rela-tionship are commonplace. An inversioncan cause temperatures to increase withelevation over substantive areas. The flowof wind along mountain slopes can also setup local anomalies to assumed temperaturegradients, as well as potentially influencethe transport of wind-borne pollen. Energylosses on exposed upland ridges can occurmore quickly than adjacent valleys as OLRfrom the valley and surrounding slopes isexchanged. This creates a downward flow-ing cold air mass, the katabatic wind. Whenthe downward flow of this cold air isobstructed, it can settle at a lower elevation,creating a local negative temperature anom-aly called a frost hollow. Colinvaux (1987)referred to this possibility as the ‘katabaticwind hypothesis’ and considered it as oneexplanation for the presence of putativemontane or alpine pollen at elevationsbelow their current range, but did notbelieve glaciers had descended far enoughto sustain this explanation (Colinvaux,1993). By return, however, an upward flow-ing mass, the anabatic wind, can also createstrong flow of relatively warm air to higherelevations during the day. This shift in flowdirection is a daily event with a wind forcethat is moderated by the level of cloudcover. This is important because tempera-ture variation at tropical latitudes is greaterbetween night and day than between sea-sons of the year. It complicates explana-tions of changing forest compositionbecause the creeping descent of highlandspecies would take on a highly fractaldimension when considering the action oflocal topography in creatingkatabatic/anabatic winds, frost hollows andinversion layers, among other anomalies
impinging upon basic ELRs. Local mixingof lowland and highland taxa would in thisinstance vary considerably between loca-tions, inflating the range of prehistoric tem-perature changes along the periphery oflowland neotropical forestlands. In fact, theconsequence of these local effects on mix-ing may already be recorded in the manyfossil pollen samples collected in theAndean and Panamanian highlands.Described as ‘forest communities withoutmodern analogue’ (although it is worth not-ing that very similar mixes may still befound in the Guayana Highlands today),many strata derived from sediment corescontain pollen of both lowland and high-land taxa in sufficient concentrations tosuggest that prehistoric communitiesadjusted to temperature suppression duringthe LGM on a taxon-by-taxon basis. It isequally plausible that sediment strata arean integrated record of vegetation from bothexposed (and colder) ridgelines and pro-tected (and warmer) highland valleys.
GUIANA SHIELD VS. WESTERN AMAZONIA Thecool aridity that is believed to have arrivedin the neotropics during Pleistocene glacialadvances is generally believed to have hadthe greatest impact on the Amazon periph-ery. There is some geological evidence tosuggest that large areas of the easternGuiana Shield were drier during thesephases independent of sea-level change(Clapperton, 1993; Iriondo, 1997; Filho etal., 2002), but pollen and phytolith data aregenerally scarce or absent from most of theregion.
While mean adiabatic lapse rateswould remain relatively constant across thelatitudinal range embracing most of theneotropics (around 6–7°C/km elevation),ELRs at similar elevations are not likely toremain constant for slopes of the sameaspect in the Andes and Guayana Highlandsfor several reasons related to variation inlapse rate control briefly mentioned above.
1. The general decline in tropical lowlandelevation from the Andean foothillstowards the Atlantic Ocean is in the rangeof 150–200 m. Applying the same simple
Biophysical Features of the Guiana Shield 113

lapse rate approach frequently used to esti-mate prehistoric temperature change fromfossil pollen, the basic elevational differ-ence between the Sub-Andean and Guiananlowlands would alone suggest that theGuiana Shield experienced temperatures0.9–1.2°C higher than the westernAmazonia lowlands during periods ofglobal temperature depression.2. The continuous line of the south-centralAndes creates a formidable barrier to thesouth/northwestward-flowing trade winds,while the more highly weathered remnantsof the Guayana Highlands consist of scat-tered tepuis and exposed intrusives inter-sected by low-lying valleys that have littleorographic effect. Isolated tropical moun-tains and massifs also tend to collect andretain less incoming radiation than moun-tain ranges, such as the Andes. As a conse-quence, lower temperatures are sustained atlower elevations in isolated highland areas.This Massenerhebung effect (Grubb andWhitmore, 1966) represents a striking pointof contrast in the way that temperature, andvegetation, would vary with elevation alongthe eastern slopes of the GuayanaHighlands and Andes, respectively, inresponse to global cooling during the LGM.Considering this effect independent ofother confounding variables, the highlandsof the Guiana Shield would be cooler thanthe Andean slopes of western Amazonia atcomparable elevations.3. Trade winds have only travelled overforestland for a limited period beforeencountering the Guayana Highlands incomparison to the more substantial dis-tances between the Atlantic and the easternslopes of the Ecuadorian/Peruvian Andes.Latent heat fluxes are plausibly influencedby variation in western Atlantic SSTs in thecase of the Guiana Shield as moisture is car-ried from ocean to mountain slopes. Fluxesof latent heat influencing ELRs along theAndean slopes are more likely drawn fromthe pool of lowland forest moisture. SSTsare strongly shaped not only by localocean–atmosphere exchange, but also byoceanic conveyance. Thus, a source oflatent heat potentially influencing theGuayana Highlands is not directly con-
nected to highland rainfall and surface run-off. Latent heat source effects on tempera-ture and moisture along the westernAmazonian perimeter are more stronglydependent on precipitation recycling, link-ing latent heat sources created by lowlandmoisture pools with downslope run-off cre-ated by orographic rainfall through a cycleof sustained feedback. A change in the statecondition of the lowland moisture pool (e.g.through deforestation) or run-off (e.g.through dam emplacement) could affectlatent heat fluxes and the effect of moistureon ELRs. This suggests that the GuayanaHighlands are more likely to experienceattenuation of rainfall decline when low-land moisture pools or run-off are affecteddue to the compensating conveyance ofocean-borne latent heat. It also indicatesthat when oceanic latent heat fluxesdecline, due to a lowering of SST in thewestern tropical Atlantic, intact lowlandmoisture recycling may attenuate, or delay,changes to moisture availability in the high-land region. When there is both a decline inSSTs and a contraction of the terrestrialmoisture pool, the Guayana Highlandregion would experience a more cata-clysmic decline in moisture availabilityand lowering of temperature that wouldlead to substantial forest contraction. Giventhe much larger lowland moisture poolat the base of the Andes, a greater capacityto attenuate or delay forest decline inthe face of diminishing moisture influxfrom extra-regional sources would appearplausible.4. The role of local wind dynamics on tem-perature creep would also predictably dif-fer between the two regions. Thepediments, vertical walls and flat summitscharacterizing many of the highland forma-tions in Guayana would not experience thesame kind of daily wind flow adjustmentsthat would be encountered in the alternat-ing, ridge–valley relief (a trellis drainagepattern) that characterizes many of the east-ern slopes of the Andes.
Whether local effects play a formativerole in explaining elevational shifts inalpine and montane taxa, or simply repre-sent minor spatial anomalies, will depend
114 D.S. Hammond

largely on the scale of impact discharged bylonger-term external forcing factors thatslowly shift the seasonal distributionand/or total amount of energy received atthe surface (see below). Local and globalprocesses deliver high and low frequencyvariations in temperature, respectively. Theintegration of these signals will ultimatelydefine the conditions confronting inter-gen-erational plant growth attributes (seeChapter 3), and the altitudinal migrationand/or adaptation of cold and drought tol-erant and intolerant species.
CRETACEOUS–PALAEOGENE TEMPERATURE AND MOIS-TURE Evaporites, laterite, bauxite, coal,kaolinite, Aeolian sandstone, carbonate andironstone deposits are generally consideredas strong indicators of prehistoric change inrainfall, evaporation, temperature and sea-level stand (e.g. Damuth and Kumar, 1975;Berrangé, 1977; Parrish et al., 1982; Tardy,1992; Gibbs and Barron, 1993; Ramón et al.,2001; ODP, 2003) (see ‘Sea-level change’,below). Throughout the Cretaceous, the for-mation of ironstone, coal and bauxitedeposits in the Guiana Shield suggests theregion was warm and received, on average,rainfall only slightly less than modern lev-els. Around the boundary betweenCretaceous and Tertiary periods (the K–Tboundary), 70 million years BP, the geologi-cal, isotopic and palynological evidenceindicates a more humid tropical climate forthe Guiana Shield, one on par with modernconditions (Tardy et al., 1990). Isotopic andpalaeo-botanical evidence support the viewthat the amplification of this humid zonewas most likely driven by a decrease inevaporation, rather than increase in rain-fall. Evaporation would have dropped inconcert with a decline in global tempera-ture over the Maastrichtian.
Temperatures during the Eocene arebelieved to have been higher than at anyother time during the Tertiary (Savin, 1977;Zachos et al., 1994). During this epoch,extensive bauxitization occurred in theeastern Guiana Shield together with the for-mation of ironstone, kaolinite and coaldeposits at various locations throughoutnorthern South America (Prasad, 1983;
Girard et al., 2002). This high tempera-ture–high humidity climate is believed tohave dissipated during the Oligocene,about 30 million years ago, but was stillcapable of supporting further developmentof bauxite and laterite deposits in theregion.
Longer-term climate forcing factors
Enveloping the wide range of oceanic,atmospheric and land-borne features thatshape and influence the daily to decadaltrek of rainfall and temperature change areprocesses operating at much longertimescales. These processes reflect on theinternal energetics of our planet, the Sunand the astronomical relationship betweenthese two bodies. Their planet-wide effectscut to the heart of the geophysical Earth.
But how would these ultimate forcingfactors shape rainfall and temperature inthe Guiana Shield? At low to very low fre-quencies, they change the basic amount andspatial distribution of insolation receivedin the region relative to the rest of theplanet. Internal energetics of our planetfundamentally influence climate throughtwo main mechanisms: volcanic emissionsand crustal plate migration. Of these two,the influence of plate migration has themore substantial, but less punctuated,effect on climate in the Guiana Shield.Internal energetics of the Sun are alsobelieved to affect change in the planet’s cli-mate, mainly through the frequency andmagnitude of sunspots, flares and otherphenomena that impinge upon our planet’smagnetosphere, and amount and type ofincoming radiation. Finally, cyclical varia-tions in the astronomical relationshipbetween Sun and Earth, calledMilankovitch cycles, set up a series of slow-moving oscillations in the amount and dis-tribution of energy reaching the planetarysurface. No discussion of the engines driv-ing variation in modern tropical forestsshould discount the impact of these subtle,but life-shaping, factors that establish thewider limits in which smaller processes,including the ascent of human predomi-nance, ultimately operate.
Biophysical Features of the Guiana Shield 115
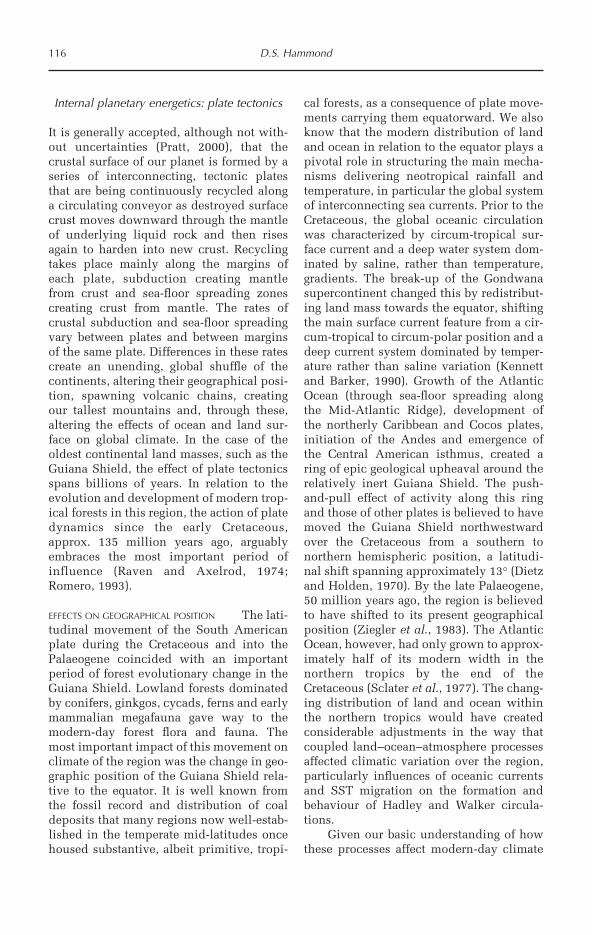
Internal planetary energetics: plate tectonics
It is generally accepted, although not with-out uncertainties (Pratt, 2000), that thecrustal surface of our planet is formed by aseries of interconnecting, tectonic platesthat are being continuously recycled alonga circulating conveyor as destroyed surfacecrust moves downward through the mantleof underlying liquid rock and then risesagain to harden into new crust. Recyclingtakes place mainly along the margins ofeach plate, subduction creating mantlefrom crust and sea-floor spreading zonescreating crust from mantle. The rates ofcrustal subduction and sea-floor spreadingvary between plates and between marginsof the same plate. Differences in these ratescreate an unending, global shuffle of thecontinents, altering their geographical posi-tion, spawning volcanic chains, creatingour tallest mountains and, through these,altering the effects of ocean and land sur-face on global climate. In the case of theoldest continental land masses, such as theGuiana Shield, the effect of plate tectonicsspans billions of years. In relation to theevolution and development of modern trop-ical forests in this region, the action of platedynamics since the early Cretaceous,approx. 135 million years ago, arguablyembraces the most important period ofinfluence (Raven and Axelrod, 1974;Romero, 1993).
EFFECTS ON GEOGRAPHICAL POSITION The lati-tudinal movement of the South Americanplate during the Cretaceous and into thePalaeogene coincided with an importantperiod of forest evolutionary change in theGuiana Shield. Lowland forests dominatedby conifers, ginkgos, cycads, ferns and earlymammalian megafauna gave way to themodern-day forest flora and fauna. Themost important impact of this movement onclimate of the region was the change in geo-graphic position of the Guiana Shield rela-tive to the equator. It is well known fromthe fossil record and distribution of coaldeposits that many regions now well-estab-lished in the temperate mid-latitudes oncehoused substantive, albeit primitive, tropi-
cal forests, as a consequence of plate move-ments carrying them equatorward. We alsoknow that the modern distribution of landand ocean in relation to the equator plays apivotal role in structuring the main mecha-nisms delivering neotropical rainfall andtemperature, in particular the global systemof interconnecting sea currents. Prior to theCretaceous, the global oceanic circulationwas characterized by circum-tropical sur-face current and a deep water system dom-inated by saline, rather than temperature,gradients. The break-up of the Gondwanasupercontinent changed this by redistribut-ing land mass towards the equator, shiftingthe main surface current feature from a cir-cum-tropical to circum-polar position and adeep current system dominated by temper-ature rather than saline variation (Kennettand Barker, 1990). Growth of the AtlanticOcean (through sea-floor spreading alongthe Mid-Atlantic Ridge), development ofthe northerly Caribbean and Cocos plates,initiation of the Andes and emergence ofthe Central American isthmus, created aring of epic geological upheaval around therelatively inert Guiana Shield. The push-and-pull effect of activity along this ringand those of other plates is believed to havemoved the Guiana Shield northwestwardover the Cretaceous from a southern tonorthern hemispheric position, a latitudi-nal shift spanning approximately 13° (Dietzand Holden, 1970). By the late Palaeogene,50 million years ago, the region is believedto have shifted to its present geographicalposition (Ziegler et al., 1983). The AtlanticOcean, however, had only grown to approx-imately half of its modern width in thenorthern tropics by the end of theCretaceous (Sclater et al., 1977). The chang-ing distribution of land and ocean withinthe northern tropics would have createdconsiderable adjustments in the way thatcoupled land–ocean–atmosphere processesaffected climatic variation over the region,particularly influences of oceanic currentsand SST migration on the formation andbehaviour of Hadley and Walker circula-tions.
Given our basic understanding of howthese processes affect modern-day climate
116 D.S. Hammond
in the shield region, a more southerly, land-locked position of the Guiana Shield priorto the Cretaceous break-up would foster amuch drier, continental climate susceptibleto strong polar air mass incursions duringaustral winters and a diminished influenceof the ITCZ on seasonal rainfall as warmSSTs and the main equatorial troughremained largely north of the area. As thecontinent fractured, a narrow and shallowtropical Atlantic would have been muchwarmer and saltier than it is today (Leckieet al., 2000). Mid-oceanic zones of sus-tained high pressure (anticyclones), whichcurrently influence rainfall variation atmulti-annual scales over the region throughdipolar structuring of regional pressure sys-tems, would have had more difficulty informing and remaining positioned over anarrower Atlantic Ocean. The first of these,the south Tethyan subtropical high-pres-sure cell, probably did not develop until theLate Cretaceous as the southern Atlanticreached a width sufficient to accommodatethe formation of a stable high-pressure cen-tre (Parrish et al., 1982). Subsequent estab-lishment of the Caribbean Current throughclosure of the Central American Seawayand opening of the Pedro Channel along theNicaraguan Rise during the Miocene repre-sented the last crucial stage in the evolutionof the western Atlantic/eastern Pacificbasin geography and its influence on theglobal oceanic conveyor (Roth et al., 2000).The separation of Atlantic and Pacific bythe Panamanian Isthmus reorganized thethermohaline currents and thus would havechanged the migratory responses of SSTs tothe latitudinal swing of maximum insola-tion between northern and southern hemi-spheres each year.
EFFECTS OF VOLCANIC EMISSIONS Volcanicemissions are considered important cli-matic adjustors. Large eruption eventsinject considerable ash and aerosols intothe stratosphere. The main effect of theselarge eruptions is an increase in the plane-tary albedo and therefore the amount ofincoming solar radiation reflected back intospace. The result is a cooling of the planet’ssurface for a period of several years follow-
ing a major eruption (Angell andKorshover, 1985; Mass and Portman, 1989;Pyle, 1992). Cooling effects are small butconsistent after major eruptions, registeringa 0.1–0.2°C decrease in tropical tempera-tures up to 2 years after the event (Robockand Mao, 1995). An increase in planetaryalbedo occurs when the tremendous vol-ume of sulphur dioxide emitted duringblasts of very high magnitude is graduallytransformed in the stratosphere into precip-itating sulphuric acid aerosols. High con-centrations of these aerosols also createconditions suitable for additional reactivechemistry that ultimately produce ozone-destroying molecules, and a consequentincrease in UV light penetration.
Equatorial regions are the most impor-tant source of stratospheric volcanicaerosols. Most tropical eruptions do notcreate aerosol plumes that would lead tosignificant stratospheric aerosol loading,since the tropopause reaches its highestaltitude over the tropics. However, the dis-proportionate concentration of major vol-canic eruptions in the 0–30° region morethan compensates for this higher plumeheight requirement (Halmer and Schminke,2003). In the tropics, volcanic aerosols arequickly conveyed by the trade winds untilthey form a stratospheric belt of anom-alously high aerosol concentrations abovethe equatorial regions with further disper-sion into higher latitudes (Cadle et al.,1976). Through this process of conveyance,source regions of eruptions registering highvolcanic explosivity index (VEI) values inthe tropics can rapidly impact the amountof insolation received by less active areas,such as the Guiana Shield. The eruption ofMount Pinatubo in the Philippines is anexcellent example of a modern volcaniceruption with a very high VEI value that ledto the formation of high concentrations ofstratospheric aerosols during 1990–91 overthe Guiana Shield (McCormick et al., 1995).The injection of volcanic water vapour intothe stratosphere may, however, counteractsome of the negative radiative forcingeffects caused by aerosol build-up (Joshiand Shine, 2003). Warming of the tropo-sphere during EN periods has also been
Biophysical Features of the Guiana Shield 117

cited as a potential positive force that canmask the cooling effects of major volcaniceruptions (Robock and Mao, 1995). Theeffects of major eruptions on tropical rain-fall have not been thoroughly assessed.Mass and Portman (1989) found no vol-canic signal in their analysis of historicalprecipitation records. These minor coolingevents may, however, decrease tropicalevaporation, with consequent lagged effectson lowland moisture recycling mechanismsand run-off.
Lower magnitude eruptions often failto inject gas or dust as high as the strato-sphere and their resulting troposphericemissions fail to remain airborne for long ortravel as extensively, particularly across thelowland tropics where rainfall rates arevery high. Eruptions in the activeAndes–Central America–Caribbean regiontypically distribute aerosols and dust at tro-pospheric level in a northwestward direc-tion (e.g. de Silva and Zielinski, 1998).Emissions from Caribbean volcanoes, there-fore, can be deposited in the tropical forest-lands of Central America. The absence oflow-level tectonic activity southeastward ofthe Guiana Shield effectively eliminates apotent source of particulates and aerosolsthat can yield short-term impacts on localenergy and nutrient budgets (Fig. 2.6A) (seeChapter 7).
Changes in the stratospheric influx ofvolcanic and anthropogenic aerosols, alongwith dust, alter the atmospheric opticaldepth (AOD). AOD is a good proxy indica-tor of changes in the amount of incomingsolar radiation received at the surface as aconsequence of periodic aerosol build-up.
Given the short-term effects of volcanicaerosol build-up on temperature, one canonly conclude that stratospheric residencetime of volcanic aerosols over the prehis-toric Guiana Shield would have been mostdependent on eruption frequency.Activation of the Greater Antilles,Panama–Costa Rica and Central Americanvolcanic arc phases over a period of 45 mil-lion years during the late Cretaceous–earlyTertiary would have brought more frequentvolcanic eruptions and a plausible increasein volcanic aerosol control over short-term
tropical temperature fluctuations duringthis period.
In the absence of long-term fluctuationsin eruption frequencies, the most signifi-cant role of the relatively brief, but wide-spread, effect of volcanic eruptions oninsolation levels would rest in its interac-tion with other climate forcing factors. Themost notable of these interactions areattached to the modern relationshipbetween volcanic eruptions and the ENSO.Based on an assessment of historical sur-face station temperatures and volcaniceruptions, Angell and Korshover (1985) andlater Robock and Mao (1995) proposed thataerosol-induced cooling has been damp-ened by warming of the troposphere duringEN phases, a conclusion similarly reachedthrough modelling (Kirchner and Graf,1995; Joshi and Shine, 2003). Given thestrength of the historical EN–precipitationrelationship in the Guiana Shield, it is mostlikely that large volcanic eruptions havecombined in the past with other factors tomodulate the consistency of this response.The massive eruption of El Chichon(Mexico, 17.4°N, 93.2°W) in 1982, for exam-ple, may assist in explaining the relativelymodest precipitation response to the severe1982–83 EN event recorded in Georgetown,Guyana compared with that recorded dur-ing 1997–98, an EN period without anymajor eruption events.15
Model results presented by Crowley(2000) suggest that, historically, volcanicemissions played a more prominent role inforcing temperature change prior to theonset of industrial greenhouse gas emis-sions around AD 1850. Between 22% and49% of pre-industrial variation in a 1000-year temperature reconstruction could beexplained by changes in ice-core derived,proximate measures ([SO3]) of volcanicactivity. At much longer timescales, Bryson(1988) proposed that the build-up of vol-canic aerosols can modulate the effects ofslow-changing planetary motion on prehis-toric climate (see Milankovitch cycles,below). A 40,000-year reconstruction ofatmospheric optical depth (AOD) estimates(Bryson, 2002) shows a strong increase dur-ing the LGM (Fig. 2.27), a period associated
118 D.S. Hammond

Biophysical Features of the Guiana Shield 119
Fig. 2.27. Long-term climate forcing factors and their variation over the last 100 ka. (A, B, C) Milankovitchcycles (Berger and Loutre, 1991; Berger, 1992). (D) Solar irradiance inferred by variation in 10Beconcentrations from GISP-2 ice core (Finkel and Nishiizumi, 1997). (E) North tropical Atlantic SSTvariation based on Barbados coral d18O proxy measure (Guilderson et al., 1994, 2001a,b). (F) Variation inprehistoric aerosol optical depth (AOD) based on volcanicity index (Bryson, 1988, 2002). (G) Variation inatmospheric carbon dioxide (CO2). (H) Methane (CH4) concentrations based on Vostok ice cores samples(Petit et al., 1999, 2001). Arrow direction indicates increasing temperature effects/responses. See refer-ences for details of data precision and assumptions.
(A)
(B)
(C)
(D)
(E)
(F)
(G)
(H)
Years BP (x 103)

120 D.S. Hammond
with global cooling. Still other externalforcing factors may interact with variationin volcanic aerosol build-up to exert aglobal-scale effect on climate change acrossthe Guiana Shield. One of these forces, vari-ation in solar irradiance, shows similar pat-terns of variation over historical andprehistoric time.
Internal solar energetics: solar cycles
In the early 1850s Rudolf Wolf, a Swissastronomer, developed a tracking index ofsolar activity based on the number ofsunspots observed either directly, or indi-rectly through the effects of varying solarwinds on variation in the frequency of mag-netic needle disturbances (Hoyt andSchatten, 1997). Sunspots had been recog-nized much earlier as a potential source ofsolar variability by other famousastronomers, but by 1868, it was Wolf whohad reconstructed a time series of sunspotsextending back to the year 1700. Buildingon the work of his predecessors, this seriesof observations, called the Wolf Sunspot
Numbers (also later Zurich and GroupSunspot Numbers), revealed a repeatingwave-like, 11-year cycle of variationbetween periods of maximum sunspot for-mation (Fig. 2.28).
Yet, up until the mid-20th century,most scientists still considered the amountof solar energy irradiating our planet as anunwavering constant, despite the record ofWolf Sunspot Numbers suggesting thatsolar activity was oscillatory. This was inpart due to difficulties in detecting subtleshifts in the Sun’s irradiance (Hoyt andSchatten, 1997).16 Later experiments wouldprovide further evidence in support of avariable solar output, but the pattern ofactivity established by Wolf and others wasfinally confirmed in the 1980s through aseries of satellite-based observation mis-sions operating over the two most recentsolar cycles. The previously held total irra-diance constant of 1367 W/m2 has beenobserved to vary by as much as 5 W/m2
since the 1978 mission launch (Willson andHudson, 1991; Willson, 1997).
While confirmation of the solar cycle
Fig. 2.28. Historical record of variation in mean annual Wolf Sunspot Numbers illustrating the 11-yearcycle and local Maunder and Dalton minima (Waldmeier, 1961; NGDC, 2003).
Daltonminimum
Wol
f S
unsp
ot N
o.

through satellite-borne measurements hasestablished sunspot activity as a potentialclimate forcing factor, documented varia-tion is a mere 0.4% change in the amount ofirradiant energy reaching the planetaryatmosphere. This translates into a climateforcing effect that cannot directly accountfor historical changes in average tempera-ture (Beer et al., 2000). Calculated solarvariation is also considered relatively smallwhen compared to other forcing effects,such as measured increases in atmosphericCO2 concentrations registered since 1850(Fröhlich and Lean, 1998). A positive trendin surface temperature at scales greater thanthe 11-year solar cycle suggests that vari-ability in the amount of solar irradiance atthis timescale is not directly forcing climatechange. It remains unclear, however,whether the amplitude and/or periodicityof the solar cycle measured most recentlyhas remained the same over the past.
PALAEO-VARIATION IN SOLAR ACTIVITY Beyondthe well-established 11-year Schwabesunspot cycle, solar activity also fluctuatesat lower frequencies as the amplitude of the11-year cycle varies between cycles. The22-year Hale,17 50–140-year Gleissberg and170–260-year Suess cycles have receivedgreatest attention among solar physicistsand climatologists (Ogurtsov et al., 2002;Tsiropoula, 2003). These medium-termfluctuations in solar output could exert apotent effect on tropical climate and, interalia, modern tropical forest compositionand distribution, because this timescalewould embrace a physical landscape andtaxonomic catalogue that is not substan-tively different from today. Since irradiancemeasurement series cover only the mostrecent solar cycles, proxy indicator patternshave been the main method used to exam-ine medium-term variations in solar activ-ity.
WOLF SUNSPOT NUMBERS – MULTI-DECADAL VARIA-TION The 300-year record of WSNsmaintained by the Zurich Observatorystrongly suggests considerable variation insolar cycle amplitude. The most importantof these are identified by consistent low-
amplitude Schwabe cycling over 3–6 cycles(30–70 years) or anomalously low sunspotminima. Historically, several such periodshave been identified: (i) the Wolf grandminimum at approximately AD 1350; (ii) theSpörer Minimum (AD 1450–1540); (iii) theMaunder Minimum (AD 1645–1715) (Eddy,1976); and (iv) the Dalton Minimum (AD
1795–1823) (Fig. 2.28).
COSMOGENIC ISOTOPES – MILLENNIAL VARIATION
Varying concentrations of cosmogenic iso-topes, such as beryllium-10 (10Be) or car-bon-14 (14C), extracted from ice cores alsopoint to considerable longer-term variationin solar irradiance (Beer et al., 1993). Hoytand Schatten (1997) urge caution, however,when using 10Be to explore sun–climaterelationships given its erratic correlationwith historical WSN series. With caution inmind, and without considering collinearitywith other climate forcing processes (see‘Obliquity’ and ‘Precession’, below), a trendof increasing solar activity over the last35,000 years can be tentatively postulatedbased on declining 10Be concentrations inan ice core extracted from the Greenland icesheet (Fig. 2.27D) (Finkel and Nishiizumi,1997).18 This trend embraces a number ofimportant deviations that are synchronouswith known periods of unusually high/lowtemperature throughout the Quaternary(Bond et al., 2001; Shindell et al., 2001).Perry and Hsu (2000) used harmonic pro-gression to model variation of solar outputover the last 90,000 years. They suggest thatperiodic variation within the last 90,000-year glacial cycle, as reconstructed by16/18O ratios in deep sea sediment cores, fitswell with the modelled variation in solaroutput based on a harmonic amplificationof the basic 11-year sunspot cycle.
SOLAR EVOLUTION AND INCREASING LUMINOSITY
At the largest timescale, it is well estab-lished that solar luminosity has increasedby 30% since the birth of our planet (Hoytand Schatten, 1997). Surface temperatureson Earth, on the other hand, have notincreased in tandem with increasing lumi-nosity. This illustrates the imperfect rela-tionship between solar activity and surface
Biophysical Features of the Guiana Shield 121
temperature and emphasizes the importantrole of compensatory mechanisms (e.g.atmospheric water vapour) in regulating theamount of irradiance received at, andreflected from, the surface. The discrepancybetween trends in solar luminosity and sur-face temperature indicate that solar activitycannot directly account for changes in plan-etary climate alone. While solar influenceon climate is unequivocal, the impact maynot be delivered directly through simpleirradiation. Other forces are intervening toboth amplify and attenuate variations insolar activity through a wide variety ofbackfeeding pathways. Thus the greatchange in luminosity that has occurred overthe life of the Sun could be viewed as thefounding force driving biophysical pools onEarth to undergo a long-term process ofcompensatory evolution. Compensatoryevolution works towards energetic stabilitydespite trending solar luminosity (i.e. theGaia Hypothesis (Lovelock, 1979)). Tropicalforests, through their role as a carbon pool,water store and albedo reducer, could beseen as both a product of and contributor toenergetic adjustment in the face of trendingchange in solar irradiance over the last40,000+ years.
PUTATIVE EFFECTS ON TEMPERATURE Withoutconsidering other compensatory mecha-nisms, average surface temperature shouldvary directly and in proportion to a changein solar activity. The analysis of Friis-Christensen and Lassen (1991) showed astrong correlation between variation inweighted Schwabe cycle length (9.7–11.8years) and northern hemisphere land tem-perature anomalies over the last 140 years.Later, they extended this correlation back toAD 1500 (Lassen and Friis-Christensen,1995).
This relationship does not necessarilyreflect a direct causal linkage. The knownlevel of solar variation (in W/m2) isbelieved to be an order of magnitudesmaller than that necessary to fully accountfor changes in surface temperature meas-ured directly or through proxy indicatormethods (Hoyt and Schatten, 1997; Rind,2002). It could, however, reflect an initial
forcing effect that is subsequently amplifiedor attenuated as a function of global cli-matic adjustment pathways. Recentresearch has suggested that the rather smallvariation in irradiance that accompaniesmovement through the solar cycle can trig-ger internal climatological adjustments thatlead to more substantive shifts in tempera-ture and rainfall via a wide range of inter-mediate components of the global climatesystem. Solar forcing of climate change viaeffects on stratospheric ozone concentra-tions in particular has stood out as onemechanistic explanation for oscillation ofcertain climate parameters (Haigh, 1996;Shindell et al., 1999; Labitzke and Matthes,2003). Dynamical models of the post-indus-trial warming period best fit observed tem-perature data when variation in solaractivity, an increasing carbon dioxide con-centration and major volcanic eruptions areincorporated (Hansen et al., 1981;Schlesinger and Ramankutty, 1992;Thomson, 1997; Fröhlich and Lean, 1998;Meehl et al., 2003; Stott et al., 2003).Models examining the pre-industrialHolocene also indicate that solar forcingacts as one of several, if not the most,important factors forcing temperaturechange (Crowley, 2000). Crowley’s energybalance climate model attributed 18–20%of reconstructed pre-industrial temperaturechanges to solar influences, based on varia-tion in 10Be data series, and 9–45% varia-tion based on 14C data.
Pegging palaeo-temperature changeacross the Guiana Shield as a consequenceof solar variation is difficult. This is due inpart to a dearth of data at observation fre-quencies sufficient to resolve a linkagebetween temperature variation in the regionwith known patterns of solar activity.Connecting neotropical change with betterunderstood temperature changes at higherlatitudes is also complicated due to com-plex conveyance dynamics within theAtlantic and eastern Pacific sectors (see sec-tions on Atmosphere, Ocean and Land-borne components, above). An incompleteknowledge of energy transfer mechanismslinking low and high latitudes also cautionsagainst assuming that there is a zonally syn-
122 D.S. Hammond

chronous response to lower-frequency vari-ations in solar activity.
Rind and Overpeck (1993) constructeda GCM to examine the spatial variation intemperature change after prolonged solarirradiance dampening during periods suchas the Maunder Minimum. Their resultssuggest that the Guiana Shield would haveexperienced a temperature decline of lessthan 0.5°C. It also suggests that southwest-ern Amazonia and parts of tropical WestAfrica may have experienced a more sub-stantial temperature depression as a conse-quence of variation in solar activity. A morerecent dynamic model constructed byShindell et al. (2001) also shows a statisti-cally significant relationship between pro-jected decline in average temperature (–0.2to –0.35°C) over the Guiana Shield anddecline in sunspot activity during the 18th-century Maunder Minimum, but again thedirect temperature response over the regionappears modest in comparison to upper lat-itudes. Estimating longer-term temperaturechanges in the Guiana Shield due to solarvariation alone is difficult. Cosmogenic iso-tope abundance can provide an estimate ofvarying solar activity at a millennial scale,but how and to what extent this leads totropical temperature change remains poorlyresolved.
PUTATIVE EFFECTS ON RAINFALL The impacts ofvarying solar activity on prehistoric rainfallin the Guiana Shield are most plausiblylinked to changes in ITCZ behaviour overthe region. The ITCZ is the main deliverymechanism for rainfall over most of theequatorial tropics. As part of the zonallydriven Hadley Circulation, it is highly sensi-tive to oceanic and atmospheric conveyancemechanisms operating at higher latitudes.
Several studies have also concludedthat the direct impact of solar forcing mayvary by region, based on spatial variation inatmospheric scattering and absorption char-acteristics. Anti-cyclonic zones of highpressure that tend to reside over mid-oceanregions have been identified as importantregional response zones. These stable areasof high pressure remain cloud-free andthrough this condition are most responsive
to increases in solar irradiance. GCMresults of Meehl et al. (2003) suggest thatthis maximum exposure to irradiancechange enhances evaporation in theseareas. This moisture is then advectedtowards the main tropical rainfall-produc-ing zones, intensifying the Hadley andWalker circulations. In the case of theGuiana Shield, this would suggest that pos-itive phases of the Schwabe cycle may bringenhanced rainfall over the eastern regionmost affected by subtropical oceanic mois-ture sources. By contrast, the authors sug-gest that this same pattern of solar variationwould likely reduce rainfall over theCaribbean and Central America as intensifi-cation leads to further expansion of the sub-tropical high pressure zone along thedescending arm of the Hadley Cell.Interestingly, Bond et al. (2001) concludedthat a strong correlation between proxymeasures of north Atlantic drift-ice abun-dance and periods of reduced solar irradi-ance was explained by heightened ozoneproduction, consequent high-latitude cool-ing and a decrease in the intensity of thenorthern arm of the Hadley Circulation.They suggest that this dynamic adjustmentprocess led to reduced precipitation in the(sub-)tropics during periods of reducedsolar activity.
Taken alone, longer-term positivetrends in solar irradiance would plausiblylead to considerable change in the magni-tude of rainfall received in the region. Butvariation in atmospheric and oceanicresponses combined with the effects ofother forcing factors work to amplify andattenuate the magnitude of solar effects.While regional climatic effects of variationin solar output over decadal, centennialand millennial scales remain poorly under-stood, current research suggests that thisexternal forcing factor has exerted a signifi-cant effect on past precipitation patternsover the Guiana Shield.
Solar–planetary relationships: MilankovitchCycles
Another significant set of three external cli-mate forcing factors, Milankovitch cycles,
Biophysical Features of the Guiana Shield 123
oscillate at ultra-low frequencies. Thesethree external sources of variation, referredto as (i) equinoctial precession, (ii) obliq-uity, and (iii) orbital eccentricity, are linkedto the way in which our planet moves inspace relative to other planets and the Sun.Their impact is delivered through changesin both the amount and distribution of inso-lation received at the surface of our planet.Variations due to Milankovitch cyclingoccur very slowly. So slowly in fact thatchanges in precession, obliquity and eccen-tricity over the last 1000 years embrace only0.7%, 5.2% and 0.6% of the total breadth ofvariation that has occurred since 5 millionyears BP, respectively (see Figs 2.27 and2.28). The crucial climatic impact of theserhythms, however, rests with the fact thattheir low rates of change also sustain long-standing periods when the distribution andintensity of solar irradiance remains at rela-tively low and high levels.
OBLIQUITY Thermal seasonality that char-acterizes temperate and polar regions islargely created by a tilt of the spin axis link-ing the Earth’s poles relative to the Sun. Asour planet orbits the Sun, this axial tilt, orobliquity, leads to a pole-to-pole shift in thespatial distribution of maximum and mini-mum insolation. As a consequence, borealand austral winters occur at opposite sol-stices and amplify toward the poles.Tropical latitudes are least affected, sincethis region of the planet remains well inso-lated regardless of orbital position.
Obliquity is a cyclical change in theangle of axial tilt. Earth’s polar axis is cur-rently tilted at 23.5° relative to the plane ofthe ecliptic, but this can vary between 22°and 24.5° (Fig. 2.27). A full shift betweenthese limits occurs over a period of approx-imately 40,000 years. Since the tilt angledetermines the latitudinal distribution ofinsolation across our planet over the courseof each orbital pass, a change in this anglealters the energetic intensity of seasonality.It also would change the latitudinal limitsof climate that could be considered tropi-cal. As tilting becomes less severe, the lati-tudinal band of area that remains fullyinsolated throughout the year would
expand. When the angle is increased, thetropical belt would narrow. Both contrac-tion and expansion would be less than thechange in axial tilt due to the effect of adecreasing incidence angle on insolation aslatitude increases. As a result, the equato-rial zone is not affected by changes in axialtilt. Obliquity will, however, force a changein the slope of the thermal gradient betweenpoles and equator, an important anisotropythat drives transfer components of theglobal climate system. This intensifies sea-sonality at high latitudes.
PRECESSION Earth orbits the Sun along aslightly offset, elliptic path that controls theintensity of seasonal differences createdthrough axial tilt. This orbital asymmetry isbest described by two points along the path:one that positions Earth closest (perihelion)and another farthest (aphelion) from theSun each year.
The orientation of the semi-major axisdefined by these two points is not stable.Earth’s orbital path is the product of com-peting gravitational forces exerted by theSun and other planets within the solar sys-tem. The largest of these planets, Jupiter,exerts a particularly strong gravitationaleffect. This effect works to change the align-ment of the perihelion as Jupiter movesthrough its orbit around the Sun at a muchslower rate than Earth, changing the gravi-tational alignment between the Sun, Earthand Jupiter. This change in alignment‘drags’ the perihelion around the orbitalpath, altering the relationship between sea-sonal timing (caused by axial tilt) and sea-sonal intensity (caused by the distance fromthe Sun).
At the same time, orientation of Earth’srotation axis is also moving by about 0.5°per century. This cyclical change, along apath best described as a ‘conical wobble’,creates further variation in the relationshipbetween seasonal timing and intensity.This precession of the rotation axis com-bines with perturbations to the alignment ofthe orbital ellipse to govern the severity ofseasons over the cycle. Forces creating pre-cessional wobble are akin to an externalobject touching the side of a fast-spinning
124 D.S. Hammond

Biophysical Features of the Guiana Shield 125
top. In this case, the external object is thegravitational torque exerted by the Sun andMoon on the rotating Earth.
It is not difficult to imagine that whenthe Earth reaches perihelion during theboreal winter, the decrease in distancebetween Sun and Earth will act to moderatethe seasonal decline in insolation caused byaxial tilt. When the perihelion shiftstowards the solstice of boreal summer, sea-sonality intensifies as summers receivemore insolation and winters (at the aphe-lion) receive less insolation. This is pre-cisely the situation 11,000 years BP, whenthe perihelion was reached around June(Fig. 2.27). Currently, perihelion is reachedin January and over the last millennium ithas been aligned with boreal wintermonths, moderating temperature declineduring this season. As the alignment of therotation axis changes orientation through afull ‘wobble’ cycle, seasonal alignment ofthe perihelion occurs. A full cycle isbelieved to take approximately 22,000 years
to complete, but can vary between 18 and23 ka due to less predictable changes inorbital orientation.
ORBITAL ECCENTRICITY Earth’s orbital pathis not only subject to cyclical realignmentof the semi-major axis, but also to variationin the ratio of major to minor axis length. Inother words, the shape of the orbit continu-ally oscillates between a perfect circle(eccentricity=0) and a parabola (eccentric-ity=1), but with a far more circular than par-abolic shape to the ellipse (0–0.6) (Fig.2.27). This pattern of variation taken alonealters the absolute distance between Earthand Sun. At lower eccentricity values, theorbital path is more circular and the differ-ence in distance at perihelion and aphelionapproaches zero. At higher eccentricity val-ues, this difference increases. As a conse-quence, when orbital eccentricity is moreelliptic, the distance between Earth andSun is increased, and the amount of insola-tion is reduced (Fig. 2.29).
Fig. 2.29. Calculated Milankovitch forcing effects (precession, eccentricity) on the amount of incomingsolar radiation received along the equator over the last 1 million years. Lengths of 22 ka, 100 ka and 412ka represent glacial cycle periodicities. Note how peak glacial stadia associated with the 412 ka cycle areassociated with higher amplitudinal swings in radiation and our current position (far left) leaving the LGMat a point of modest precessional forcing and relatively low solar flux variation in the tropics.
Pre
cess
ion
(si
n Ω
)/ec
cen
tric
ity
(e)
(W m
–2)
0
–50
–100
–150
–200
–250
–300
–350
–400
–450
–500
–550
–600
–650
–700
–750
–800
–850
–900
–950
–100
0
Years (×1000) from present (AD 1950)
0.1
0.08
0.06
0.04
0.02
0
–0.02
–0.04
–0.06
Equatorial insolation
Eccentricity
Precession
glacial
412k100k
22k
inter-glacial

Orbital eccentricity is believed toaccount for a mere 2 W/m2 ranging inreceived solar radiation over the course of acycle. Two cycles have been identified foreccentricity variations, one at 100,000 andanother at 412,000 years (Fig. 2.29). Earth’sorbit currently is more circular than ellipticand has largely been so over the last 50,000years, but with a relatively small increase inellipticity around the time of the LastGlacial Maximum and onset of the currentinterglacial period (Figs 2.27 and 2.29).
ASTRONOMICAL THEORY OF CLIMATE CHANGE AND
GLACIAL CYCLES Of the three Milankovitchcycles, only eccentricity variations affectchanges in the total amount of solar radia-tion received. Obliquity and precessionshape the distribution of incoming radia-tion, but not the total amount. Consideredindependently, each cycle creates relativelyminor changes in the distribution andamount of insolation. However, takentogether, all three cycles can produceseverely contrasting scenarios. Precessionaleffects work to alter the timing of the sea-sons created by axial tilt, but wobbling ofthe rotation axis along a circular orbitwould not alter the slope of the latitudinalinsolation gradient, only the calendric tim-ing of the shift between northern and south-ern hemispheres. The key rests with theaddition of orbital eccentricity. As the orbitbecomes more elliptic, the change in dis-tance at perihelion/aphelion works withprecessional and obliquity movements toamplify and attenuate effects on planetaryclimate. These effects have been shown tobe most pronounced at high latitudes, butsignificant variation of insolation in theequatorial regions is also expected (Fig.2.29).
The most significant change associatedwith high-latitude effects over the last 2.5million years is believed to be a fluctuationin the amount of planetary water stored asice. From 2.5 to 1.5 Ma BP, glacial maximaare believed to have occurred around every41,000 years. At least ten ice ages arebelieved to have occurred over the last onemillion years, but with the frequency slow-ing to every 100,000 years, based on varying
oxygen isotope ratios in sampled sedimentcores (Hays et al., 1976). These fluctuatingperiods of glacial expansion (stadia) andretreat (interstadia, interglacials) have beenassociated with precession, obliquity andeccentricity periodicities since the early20th century (Milankovitch, 1941).Variation contained in a large number ofsedimentary (e.g. Olsen and Kent, 1996;Scarparo Cunha and Koutsoukos, 2001),isotopic (e.g. Rial, 1999; Stirling et al.,2001) and palynological records (e.g. Mayleet al., 2000; Bush et al., 2002) taken at bothlow and high latitudes appears consistentwith Milankovitch cycle periodicities. Thetheory, despite its power to neatly explainvariation in a wide array of biophysicalprocesses linked to climate and glaciation,cannot account for all variation encoun-tered over the composite proxy record ofpalaeoclimatic change (Imbrie and Imbrie,1980). Nor has a 40,000-year range in gla-cial cycle duration over the Plio-Pleistocene been fully explained (Elkibbiand Rial, 2001), although Rial (1999) gives acompelling explanation based on frequencymodulation of the 100 ka eccentricity cycle.In some instances, different cyclical beatsmay be shaping different aspects of envir-onmental change during different climatephases (Muller and MacDonald, 1997), cre-ating non-linear responses. Logically, theeffects of varying internal and externalforces are interacting within astronomicalcycles to create a unique sequence, a pre-history, of conditions that trigger, amplify,attenuate and terminate climatic phasesalong a non-replicable path of planetaryevolution.
IMPACTS ON GUIANA SHIELD PALAEO-CLIMATE
The changing configuration ofMilankovitch cycle phases is believed tohave had its greatest impact at high lati-tudes, particularly in its regulatory effectson ambient temperature, polar ice forma-tion and all that these influence. While pastinsolation changes may have had the weak-est effect on the tropics, it also moved theslope of the latitudinal insolation gradient,altering the pace and extent of both oceanicconveyance and atmospheric advection
126 D.S. Hammond

processes. The considerable role that thesetransfer linkages between high and low lat-itudes play in shaping regional climates(see ‘Remote forcing factors’, above) sug-gests substantive consequences for low-lati-tude areas such as the Guiana Shield. Atsynoptic and larger scales, this is likely tohave occurred through changes in the sea-sonal location and intensity of the ITCZ andSST anomalies. These mechanisms areinextricably bound to one another througha system of cascading feedback, so cannotbe viewed as independent responses.However, they do exert different levels ofimpact upon regional climates across theneotropics.
The ITCZ is the principal mechanismthat delivers strong seasonal rainfall acrossthe Guiana Shield as it migrates with sea-sonal shifts in hemispheric insolation andSST belts. Anomalous shifts in ITCZ migra-tory behaviour, often driven by ENSO, cur-rently bring anomalously high and lowrainfall to the Guiana Shield at scales ofweeks to years. At much greater timescales,shifts in the distribution of insolation dueto Milankovitch cycling would have sub-stantially altered the zonal limits of ITCZranging and the annual to multi-annual pre-cipitation regimes across the region. Martinet al.’s (1997) comprehensive reconstruc-tion of palaeoclimate over the neotropicsindicates a +10° latitudinal extension of theITCZ limit southward since the earlyHolocene/late Pleistocene as a consequenceof astronomical forcing. Palynological evi-dence from the lowland tropics of Boliviaalso suggests that tropical forests reachedtheir modern-day extension into southwestAmazonia as late as 3000 BP, a consequenceof an astronomically forced southwardmigration of the ITCZ (Mayle et al., 2000).Variations in terrigenous titanium concen-trations in the Cariaco Basin, Venezuelasuggest that the ITCZ has been migratingfurther southward across South Americaover the last 10,000 years since the earlyHolocene ‘Altithermal’ (Haug et al., 2001), achange that is consistent with variation inMilankovitch cycling (Fig. 2.27). Palaeo-limnological data from two Amazonianlakes located in the western Guiana Shield
(Amazonas, Brazil) show variations inpotassium concentrations, an indicator ofwater level and leakage fluctuations, that areconsistent with precessional-scale (19–22 kacyclical) influences and a wetter LGM overnorth (western) Amazonia (Bush et al.,2002) that would accompany a reducedpoleward ranging of the ITCZ. A morenortherly ranging of the ITCZ would alsolead to more sustained polar incursionsacross southern Amazonia and more fre-quent seasonal cold mass surges across theequator. These would substantively reducethe annual temperatures across these areas,limiting growth and survival of most low-land tropical forest species.
These field data are consistent withGCM results that predict substantialchanges in moisture and temperature acrossthe neotropics. Reconstructions using theGENESIS model depict substantial regionalresponses to astronomical and other forcingeffects during the LGM, 18,000–22,000years ago (Clark et al., 1999, Fig. 2 – LGMAnomaly). Climatic features over theGuiana Shield reconstructed as part ofClark et al.’s global assessment show a –2(–4)°C to +4 (0)°C difference between mod-ern and LGM boreal (austral) summersurface temperatures. In contrast, recon-structed surface temperatures over the adja-cent western Amazonian (–8 (–8)°C to –2(–2)°C) and Central American (–1 (–2)°C to–4 (–8)°C) regions during LGM boreal (aus-tral) summers were noticeably cooler.Reconstructed net rainfall (precipitation–evaporation) rates indicate a much drierGuiana Shield relative to westernAmazonia and Central America. Highertemperatures and lower rainfall over anLGM Guiana Shield are consistent with amore substantial decrease in cloud coverover the region relative to the other regions,a condition that parallels modern-dayregional differences. LGM climate recon-structions using the CLIMBER-2 model showsimilar ranges and trends in temperature(–4°C to –6°C) and rain rate (–1 to 0.2mm/day) changes across the neotropics butwithout sufficient spatial resolution to dif-ferentiate between regions (Ganopolski etal., 1998, Fig. 6).
Biophysical Features of the Guiana Shield 127
Polar cooling during peak glacial stagesin the past is also believed to have beenstrengthened through enhanced ice albedo,prompting a further steepening of the equa-tor-to-pole thermal gradient. Zonal steepen-ing increases the strength of trade windsthat convey energy and moisture towardsthe low pressure, equatorial trough (Trend-Staid and Prell, 2002). Trade winds also actto deepen the thermocline along the west-ern rim of tropical oceans and promoteupwelling of cold deep waters along equa-torial zones (Bush and Philander, 1998). Asubstantial strengthening of these windsduring season-intensifying Milankovitchphases would extend upwelling furtheracross the basins and increase entrainmentof colder subtropical waters. This process,reminiscent of strong La Niña ENSOphases, has repeated itself periodically atfrequencies consistent with astronomicalforcing effects. Prehistoric changes in windgradients and seawater movement as aresult of Milankovitch-driven insolationshifts are reflected in sea sediments record-ing variation in abundance of tropicalorganisms. Abundance of many tropicalmarine organisms is strongly responsive tochanging seawater temperatures (e.g. algalblooms), and these have been shown to varyat frequencies consistent with astronomicalforcing effects (McIntyre and Molfino, 1996;Perks et al., 2002).
In the Atlantic, the net effect duringglacial maxima would be a considerabledecline in tropical and subtropical SSTsthat normally drive both ITCZ and non-ITCZ precipitation across the easternGuiana Shield, eastern Central America andthe Lesser Antilles. A reduction in tropicalSST would also have acted to furtherreduce temperature along the eastern rim ofthe Guiana Shield and Caribbean. Zonaltransport of warm waters to higher latitudeswould cease to moderate Milankovitchcycle insolation effects on temperature andthus act in concert with increases in icesheet albedo to amplify temperaturedeclines that are then conveyed back to thetropics (Bush and Philander, 1998;Ganopolski et al., 1998; Clark et al., 1999).
Prehistoric oceanic and atmospheric
conditions affecting climate over theGuiana Shield were clearly very different.Results employing a wide range of climatechange analogues and model assumptionsshow little uniform temperature depressionover the prehistoric lowland neotropics asdifferent land–ocean–atmosphere relation-ships altered responses to global-scaleexternal forcing effects. Ultimately, how-ever, it is the change in the amount, timingand spatial distribution of insolation regu-lated by astronomical forcing effects thatgoverns the cascading adjustment chainand the way in which it has altered palaeo-climate across the Guiana Shield and adja-cent regions of the neotropics.
Greenhouse gas concentrations
Of all the potential contributors to past andpresent climate change, greenhouse gasesare perhaps the most widely acknowledged.Of these, the historic variation and forcingeffects of carbon dioxide (CO2), methane(CH4) and nitrous oxide (N2O) are arguablythe best documented and most widely pub-licized, although other trace gases con-tribute (e.g. OH) and water vapour (i.e.cloud cover) is without doubt the mostimportant in creating the greenhouse effectdue to its major effects on deflecting ISRand trapping OLR.
Direct measurements of modern CO2concentrations in the atmosphere show thatthese have been increasing steadily and at ahigher rate since 1950 and that this increaseis largely attributed to anthropogenic emis-sions derived from agriculture, deforesta-tion, fossil fuel burning and CO2-producingindustrial processes, such as cement manu-facturing (Mackenzie and Mackenzie,1995). Atmospheric CO2 levels, however,also increase as a consequence of naturalprocesses, such as changes in primary pro-duction (plants and phytoplankton), car-bonate-rock formation and weathering,volcanic eruptions and changing SSTs,among others. These pre-industrial sourcesof variation alone are believed to havealtered atmospheric concentrations of CO2substantively. Proximate measures of varia-tion in CO2 concentrations over the last
128 D.S. Hammond

100 ka drawn from Antarctic (Vostok, TaylorDome) ice core data show massive increasesin both CO2 (64%) and CH4 (54%) over the18 ka since the end of the LGM and prior tothe onset of the Industrial Revolution (Fig.2.27 – Greenhouse Gas I and II) (Petit et al.,2001). The Vostok record extends back 430ka, and several other periods with green-house gas concentrations as high or higherthan those estimated for the modern pre-industrial period are evident around 125 ka,325 ka and 415 ka BP. However, none of theice core-derived measurements of prehis-toric CO2 or CH4 equals or exceeds measuredpost-industrial levels.19
Unlike Milankovitch forcing that altersthe meridional distribution and amount ofinsolation, the effect of changes in well-mixed greenhouse gases on the planetaryenergy balance is believed to have a rela-tively uniform spatial effect on tempera-ture. In this case, mean annual airtemperatures should be increasing acrossthe Guiana Shield in line with global esti-mates. The IPCC calculates a globalincrease of 0.6±0.2°C in mean temperatureover the last 100 years. This is consistentwith the positive trend in BrazilianAmazon temperatures of +0.56°C per cen-tury calculated by Victoria et al. (1998)based on station records for the period1913–1995 and spatially averaged tempera-ture change for an area encompassing theGuiana Shield as a whole (Fig. 2.21).
Other external forcing factors
Past climatic changes over the GuianaShield could also have been associatedwith other external forcing factors that arenot traditionally incorporated in climatereconstruction efforts.
METEORIC IMPACTS One of these, meteoricimpacts, has been invoked as a cause of theK–T extinction event. Meteoric impacts ofsufficient magnitude would generate aperiod of cooling that is consistent with aphase of tremendous volcanic activity.Recent coring on the submerged eastern rimof the shield (the Demerara Rise) has uncov-ered 1–2 cm ejecta layers consistent with
the massive K–T Chicxulub impact site offthe coast of the Yucatán Peninsula (Fig. F14in ODP, 2003).
WEAKENING OF THE MAGNETOSPHERE A rever-sal of geomagnetic polarity due to changesin the direction of flow within the Earth’smolten internal core/inner mantle couldalso impinge substantially upon global andregional climate. Recent reconstructionssuggest that the reversal process occurs as aprocess of field weakening (Glatzmaiers etal., 1999). During a reversal, it is believedthat the dipole circulation that typifies themodern magnetosphere slowly weakensand gives way to a period dominated by apolypolar field before re-establishing areversed, dipole-dominated field (e.g. Li etal., 2002). These openings are associatedwith a much higher amount of cosmic radi-ation at wavelengths that would fundamen-tally alter biological productivity, carbonstorage, water cycling and sensible heatfluxes. How regional and global climatewould adjust to this weak phase of the mag-netic reversal is unclear. A chronology ofthis reversal process is well documented inthe geological record, however, and a rever-sal of the magnetic pole is believed to haveoccurred several hundred times since theseparation of South America from Africaand the expected beginning of angiospermevolution (Kent and Gradstein, 1985). Itsrole in defining the palaeochronology of cli-mate change cannot be discounted.
NON-VOLCANIC AEROSOLS Most of these areanthropogenic but, like volcanic emissions,have a relatively short atmospheric resi-dence time and are deposited largelythrough dry (wind) and wet (rain/snow)precipitation. Their effects are varied.Deposited soot (black carbon) can reduceice albedo and enhance glacial melting,while sulphates in the troposphere arebelieved to have a general cooling effect onregional climates. Anthropogenic sulphateconcentration over the Guiana Shield isestimated to be one of the lowest globallyand on par with levels more typical of aus-tral high latitudes (Charlson et al., 1991).Concentrations increase westward across
Biophysical Features of the Guiana Shield 129
Amazonia, Central America and thePeruvian/Ecuadorian Andes based onCharlson et al.’s model, but remain low rel-ative to north temperate centres of highconcentrations. With little industry locatedeastward of the region, the main sources ofallochthonous mineral aerosols are bornealong African easterly wave fronts from thedeserts of North Africa (Jones et al., 2003).
Simple matter of rainfall?
The breadth and complexity of relation-ships ultimately responsible for character-izing rainfall over the Guiana Shield isdifficult to embrace in even the mostsophisticated climate models. Long-termvariability in rainfall is strongly sensitive tospatial scale, and this sensitivity is at itsgreatest over the tropics (Giorgi, 2002), sug-gesting that there is a fractal-like scalarshaping the climate topology. Nonetheless,it is increasingly possible to chain togetherthese eclectic relationships and draw sev-eral general conclusions about modern andprehistoric patterns of climate in theGuiana Shield and adjacent regions.
MODERN RAINFALL PATTERNS Firstly, it isclear that rainfall varies across the GuianaShield in a manner that emphasizes the dif-ferent role of oceanic and land-bornesources of moisture (a meridional gradient)and zonal variation in peak insolation (azonal gradient). In the east, oceanic influ-ences play an important role in a regionhighly sensitive to changes in coupledatmosphere–ocean processes, such asENSO. Eastern shield forests are bufferedfrom more severe rainfall seasonality bythese maritime influences and a southwardmovement of the ITCZ over the westernAtlantic that strongly lags the continentalpattern. In the Savanna Trough, rainfall ismost seasonal as the ITCZ reaches its maxi-mum southward migration along this longi-tudinal swathe. Penetration of the Azoreshigh pressure system behind this seasonalmovement of the ITCZ southward interactswith land-borne feedbacks, such asincreased albedo, southward-facingdrainage bevel and reduced surface rough-
ness, that amplify seasonal rainfall decline.The northern arm of this central region isinterrupted by the Guayana highland archi-pelago that brings high local rainfallthrough orographic uplift. In the west, ITCZranging is more limited. Precipitation recy-cling occurs along a system characterizedby the Andean orographic wall, an exten-sive forested landscape characterized byhigh surface roughness, high evapotranspi-ration, high west-to-east surface run-off andlow albedo. Nonetheless, local topography,soils and land-use can substantively alterrainfall patterns associated with larger-scale circulatory features, creating localzones of anomalously high and low rainfall.
The variation in rainfall across theGuiana Shield straddles the crossroad ofmuch larger meridional and zonal gradientsdriven by the seasonal swing of maximuminsolation between hemispheres and a tran-sition from marine- to terrestrial-driven sys-tems. South and north of the region, rainfallbecomes more seasonal as the range limitsof the ITCZ are reached and the subsidencebranches of the Hadley Circulation domi-nate rainfall. Westward, rainfall generallycontinues to increase as a consequence ofhigher rainfall rates and dampened sea-sonal decline. This increase is driven by anarrower seasonal ranging of the ITCZ andmore substantial precipitation recyclingfostered by sustained surface in-flow fromthe Andes. Both maintain high water tables,persistent cloud cover and steady evapo-transpiration linked to an extensive forest-land system. Declining ENSO effects onwestern Amazonia rainfall further enhanceinter-annual stability.
Temperature variations across theGuiana Shield and adjacent regions arelargely shaped by daily and seasonal inso-lation cycling, topography and elevationalisolation, proximity to the western Atlantic,increasing greenhouse gas concentrationsand the interaction of these with the move-ment of the ITCZ, mainly via changes incloud cover and equatorward incursion ofcold polar fronts.
PAST RAINFALL PATTERNS The neotropicshave not responded to global climate
130 D.S. Hammond
changes uniformly in the past and areunlikely to do so in the future. Sedimentcore data and GCM results do not supportthe view that palaeo-patterns of neotropicalrainfall can be deduced simply by applyinga uniform reduction in rainfall along mod-ern isohyets or temperature along modernisotherms. This approach increasinglyappears counterintuitive in light of evi-dence emphasizing a coupled land–ocean–atmosphere system dominated by short-and long-ranging transfer components.
Evidence also suggests that northwest-ern Amazonia experienced more moderaterainfall reductions during past climaticphases characterized by weakened Hadleyand Walker Circulations and/or stronglyaltered ITCZ migratory behaviour. Mostnotable among these to occur in recent geo-logical time is the Last Glacial Maximum.The Guiana Shield, in contrast, appears tobe susceptible to more severe rainfalldecline during these periods, possibly dueto the greater influence of changing SSTs onregional climate combined with land-borneattributes (topography, soils) that movemore rapidly to amplify ocean-derivedchanges to rainfall delivery. A substantialdecline in sea level during the LGM wouldhave also left current coastal regions of theGuiana Shield (the Guianas, Bolivar andAmapá states) much further inland (see‘Sea-level change’, below). This may help toexplain, from a mechanistic perspective,the discordance among palaeoclimatereconstructions derived from fossil pollenstudies (Fig. 2.25), although local siteattributes are also likely to prove a strongsource of variation.
The early Holocene saw a substantialchange in neotropical climate as ITCZmovement southward declined, sea levelrose towards its current maximum and hightemperatures and rainfall prevailed acrossmuch of the modern Guiana Shield. Theinfluence of ENSO also began to increase,with pronounced inter-annual variation inrainfall and temperature across the shieldarea. Major volcanic eruptions also wouldhave led to lower ISR levels and short-termanomalies in zonal movement of the ITCZ,cloud cover and rainfall.
MODERN VARIATION IN TEMPERATURE
Variability in temperature is easier to definesince this typically shows a much weakersensitivity to spatial scale than rainfall(Giorgi, 2002). Given the very minor varia-tion of insolation across the neotropics,other factors that subsequently alter avail-able energy largely account for any broadspatial variation in daily maximum–minimum temperatures. The most signifi-cant of these appear to be: (i) proximity towarm oceanic currents; (ii) cloud cover per-sistence; and (iii) elevation.
The eastern Guiana Shield, Caribbeanand Central American climate is bufferedby the northward movement of the warmNorth Brazilian–Guiana Current and thelong residence of warm waters forming theWestern Hemisphere Warm Pool along thenorthern coast of South America (Fig.2.22C). Cloud cover persists longer overwestern reaches of Amazonia and theGuiana Shield compared to eastern regions(Fig. 2.23) and this exerts a stronger modu-lation of diurnal temperature fluctuationsthroughout the year. Elevation is thestrongest contributor to spatial variation inmean daily temperature across the GuianaShield, with upper elevations in theGuayana Highlands showing the lowestdaily minima. Polar incursions from south-western South America, the friagems, canlead to short periods of much lower tem-peratures in western Amazonia, but theseonly rarely reach into the Guiana Shieldarea. Average temperatures across theGuiana Shield appear to be increasing overthe last century in line with global warmingpredictions.
PAST VARIATION IN TEMPERATURE Prehistoricchanges in neotropical temperatures, likethose for rainfall, have also been proposedfor the lowland forest regions. An increas-ing body of results, generated through bothsediment cores and circulation models,reinforces the view derived from palyno-logical studies that a temperature depres-sion across the neotropics occurred duringthe LGM and temperatures have been gen-erally increasing over the last 10,000 years.Several circulation models have produced
Biophysical Features of the Guiana Shield 131

results that indicate temperatures acrossthe eastern Guiana Shield may havedropped less than in adjacent lowlandregions of western Amazonia or CentralAmerica, probably due to declining tropicalSSTs and strengthened high pressure sys-tems that decrease cloud cover residenceover the area. A wide range of field andmodel results suggests that precessionalforcing of global insolation patterns islargely responsible for altering the coupledocean–atmosphere influences on climate inthe region at glacial timescales of 100–400 ka.The likelihood of a uniform variation oftemperature across the Guiana Shield andthe extended neotropics appears smallwhen considering the influence of thesecoupled effects combined with local land-scape attributes, such as topographic relief.
PRIMARY DETERMINANTS OF VARIATION Clearlymany factors interact to bring about achange in rainfall and temperature over theGuiana Shield. However, several factorsstand out among the most prominent. Mostobvious, and perhaps least helpful, is geo-graphic position. It encapsulates the inte-grated effect of land–ocean–atmospherelinkages over a wide range of time and spa-tial scales. The bulk of climatic researchshows that the relative importance of differ-ent climate-governing mechanisms varieswith geographic position and scale acrossthe neotropics. Geographic position, there-fore, is best viewed as a non-stationary indi-cator of any single climatic attribute, suchas temperature or rainfall, since both larger-scale, high-energy features of the global cli-mate, such as ENSO forcing, andsmaller-scale, low-energy landscape attrib-utes, such as topography, vary anisotropi-cally, but not collinearly.
Changes in the ranging behaviour ofthe ITCZ are particularly powerful in link-ing many of the most significant forcing fac-tors and the transfer linkages between land,sea and air that govern climate over theGuiana Shield. Changes in timing and extentof its latitudinal migration have been linkedto variation in both drivers and conditions ofmodern, historical and prehistoric climate,such as ENSO, solar cycling, SSTs, cloud
cover, NAO and Milankovitch cycling.Evidence points to an interaction
between Milankovitch cycling and topogra-phy as the most significant factor control-ling tropical temperature fluctuations andthe role these changes have played in forestlandscape evolution across the neotropics,but factors (e.g. downstream mass transportof particulate carbon, edaphic and climatictolerances of indicator taxa, local topo-graphic effects on temperature) controllingthe distribution of palaeo-pollen, an impor-tant proxy indicator of past climaticchange, are still not adequately resolved.
Finally, tectonic forces altering theextent, geometry and latitudinal position ofthe South and Central American landmasses have played a major part in the wayland–atmosphere–ocean interactionsshaped palaeoclimate across the ancientGuianan landscape – a legacy that contin-ues to shape the distribution, structure andcomposition of forests across the regiontoday.
River, Lake and Tidal Systems – A Taleof Two Basins
Guiana, Guayana, Guyana – the land ofmany waters. The region is awash, literallyfor much of the year, and water may ulti-mately prove to be one of the population’smost valuable assets (see Chapter 8). Riverand tidal systems of the shield have tradi-tionally delimited forest accessibility andwith it the socio-economic landscape ofthis region. Only relatively recently haveregional road and airfield networksexpanded to such an extent that waterwayshave begun to decline from their historicalrole as backbone of the regional transporta-tion network. Arguably, they continue toplay a pre-eminent role in the way that peo-ple have accessed and continue to accessthe forest resources of the region (seeChapter 8). But compared with the year-round navigability of the Amazon, the sea-sonal impoundment of most majorwaterways in the shield historically hasconstrained travel to small craft, whileshaping patterns of aquatic productivity.
132 D.S. Hammond
The consequences of this subtle, but impor-tant, difference is reflected in the methodand rate of (pre-)historic forest resource useand inhabitation (see Chapter 8).
Surface waters, however, also consti-tute an important pool in regional andglobal hydrological and biogeochemicalcycles. They form a large part of the terres-trial compartment and link this directlywith ocean and atmospheric componentsthrough run-off and evaporation. Waterflow accounts for 85–95% of the materialtransported from land to ocean globally(Lerman, 1979, 1994). The export of GuianaShield-borne terrigenous materials to theAtlantic occurs almost exclusively viawater flow (see sections below, but also‘Nutrient Balance and Migration’ inChapter 7). Surface water distributionmainly reflects the interaction betweenrainfall and topography, though other con-tributing factors, such as soil and vegetationcover, also play significant roles in definingresidence time and rate of movement. Thedistribution, persistence and depth ofstanding water in turn add a potent sourceof variation to the mix of factors shaping thetropical landscape. Changing river, lakeand tidal stages influence regional soil for-mation and rock weathering (see ‘Geology’and ‘Soils’ sections above), surface albedo(see ‘Surface albedo’, above), evaporation(Robinson and Henderson-Seller, 1999),decomposition, emissions of greenhousegases (e.g. Quay et al., 1989; Devol et al.,1994; Artaxo, 2001) and vegetation types(e.g. Richards and Davis, 1933; Fanshawe,1952; Schulz, 1960; Duivenvoorden andLips, 1995; Huber, 1995b), just to name sev-eral of the more obvious responses.
The purpose of this section is to sum-marily describe the modern river, lake, wet-land and tidal systems shaping the GuianaShield. It reviews available information ona number of physical attributes that can beused to characterize the region in relation toadjacent neotropical areas. These includegeomorphological controls and hydrologi-cal (watershed areas, discharge rates) andlimnological characteristics (bottom, sus-pended and dissolved sediment loads, sil-ica and carbon transport, clay fractions) of
the region’s main rivers. The location andsize of major wetland and lake areas acrossthe region are described. It also identifies abasic chronology and trends in sea-levelchange based on current scientific under-standing and the coarse-scale spatial effectsof eustatic adjustment on marine transgres-sion and regression throughout the shieldregion.
Two major basins separating the GuianaShield
The Precambrian geology of the shield area,although highly weathered, is not pene-planic and topography continues to shapethe direction and rate of surface run-off(Gibbs and Barron, 1993). At the largest spa-tial scale, this run-off, flowing in oppositedirections, is collected into two large basinsdivided by a band of higher elevationformed through the east–west extension ofthe Tumucumaque Uplands, GuayanaHighlands and Chiribiquete Plateau fromcentral Amapá to the base of the ColombianAndes (Fig. 2.30).
Waters shed southward flow into theAmazon River. This vast basin, the largeston our planet, drains an area of7,050,000 km2 (Sioli, 1984a). The part ofthe Amazon that drains all of the southernand western regions of the shield, referredto here as the North Amazon Basin (NAB)(North Peripheral Region, after Furch(1984)), is spread across five major riversystems, the Caquetá (Japuerá), Negro,Uatuma/Jatapu, Trombetas/Mapuera andJari along with 30 smaller watersheds (Fig.2.30). Drainage into the mainstem water-ways of these systems covers an estimatedarea of 1.3 million km2, a little over 18% ofthe entire area of the Amazon Basin, butapproximately 57% of the Guiana Shield.20
The remaining waters draining theGuiana Shield flow northward into theAtlantic Ocean and constitute the secondmajor basin, referred to here as the Guiana(Guayana) Basin (GB). This network drainsall of the eastern and northern shieldregions, mainly through the Orinoco,Essequibo, Courentyne (Courentijn),
Biophysical Features of the Guiana Shield 133

134 D.S. Hammond
Fig. 2.30. (A) East to west divide (thick dotted line) separating two major basins draining the GuianaShield. Arrows indicate major direction of flow across main watersheds. Basins are connected seasonallythrough Casiquiare Rift and Takutu Graben (solid circles) and possibly between upper tributaries of RiosAtabapo and Guainía (empty circle). Broken horizontal line is meteorological equator. (B) Major water-sheds draining the Guiana Shield. Outflowing watersheds ranked by area they drain (within the shieldregion). (1) Negro, (2) Orinoco, (3) Essequibo, (4) Trombetas-Mapuera, (5) Caquetá/Japuerá, (6)Courentyne/Corantijn, (7) Marowijne/Maroni, (8) Jari, (9) Uatuma-Jatapu, (10) Oyapack/Oiapaque, (11)Paru de Este, (12) Maraca-Villa Nova, (13) Nhamunda, (14) Araguari, (15) Curua, (16) Waini-Barima, (17)Maicaru, (18) Berbice, (19) Suriname, (20) Amakura, (21) Koppename, (22) Mana, (23) Calcoene, (24)Approuague, (25) Nickerie, (26) Saramacca, (27) Demerara, (28) Commewijne, (29) Sinnamary, (30)Comté, (31) Cacipore, (32) Counamama, (33) Kourou, (34) Mahaica-Mahaicony-Abary, (35) Iracoubo.Only watersheds with an estimated area exceeding 1000 km2 are delimited.

Maroni (Marowijne) and Oyapock(Oiapoque) Rivers (Fig. 2.30). Waters flow-ing across the Guiana (Guayana) Basin andultimately into the Atlantic Ocean drain anestimated area of nearly 834,000 km2 and43% of the Guiana Shield. The NAB and GBare anchored by two parent rivers, the RioNegro and Orinoco, respectively. Thesemassive waterways receive run-off from vastareas of high rainfall, ranking them as two ofthe largest rivers in the world (Fig. 2.30A),dominating discharge from the GuianaShield (Fig. 2.30B). The Orinoco andCaquetá/Japuerá, however, also receive con-siderable in-flow from tributaries drainingthe eastern slopes of the Andes and this canequal or exceed discharge from waterwaysoriginating in the shield region (Fig. 2.30B).
Major watersheds of the Guiana Shield
Watersheds fragment the two main basinsinto systems of semi-independent hydro-logical compartments. When organizedaround rivers leaving a basin, they delimitindependent areas of run-off and the rela-tive influence of differing regional physicalattributes on water discharge, sedimenttransport and hydrochemistry (Degens etal., 1990). Within watersheds, the transitionfrom headwater perimeter to mainstemmouth embraces an important, spatiallydependent hydrological gradient. Variationin both typically affects anisotropic changesin forest composition, structure and pro-ductivity (Richards, 1996), although miti-gating variables, such as varying rainfall,soils, geology and population dynamics,may create patterns at intervening scales.
Thirty-four watersheds (>1000 km2)collectively drain South America north ofthe Amazon and east of the Andes, includ-ing all of the Guiana Shield (Fig. 2.30B).Watersheds surrounding each mainstemriver draining the region range in size fromseveral hundred square kilometres to over720,000 km2 in the case of the Rio Negro,the shield’s largest self-contained drainagearea (Table 2.2). The median watershed sizefor the 34 main rivers flowing out of theGuiana Shield is estimated at 19,900 km2.
Measures of central tendency in this caseare, however, misleading due to thebimodal distribution of watershed sizes cre-ated by a few, very large rivers draining thewestern reaches of the shield and a muchlarger number of relatively small water-sheds aggregated within the Guiana Basineast of the Essequibo River (Fig. 2.30B).
Eight of the 30 largest watershedsbelong to the national area of more than onecountry, including the three largest sys-tems, the Negro, Orinoco and Essequibo(Table 2.2, Fig. 2.30B). The Rio Negro isprincipally a Brazilian river, flowing fromthe southern slopes of the GuayanaHighlands and Chiribiquete Plateau, butalso drains areas of southwest Guyana (eastbank of Tacutu River) and Venezuela(Casiquiare Channel) due to localized faultzones (Casiquiare and Takutu) that haveshifted the basin divide and led to a changein flow direction. This is most pronouncedin the case of the Tacutu River (watershedarea 9800 km2). It drains a strip of southernGuyana as it flows northward before chang-ing course 180° around the Serra do Tucanovolcanics (see ‘Prominent geologicalregions’, above) and flowing southward intothe Rio Branco less than 100 km westwardof its headwaters.
The Orinoco, draining virtually theentire South American land area north ofthe Negro, Japuerá and Essequibo water-sheds, is much larger than the Negro, but itsheadwaters are located both within andoutside the Guiana Shield. In fact onlyabout 40% of the estimated 1 million km2
watershed area rests within the GuianaShield, fed most notably by the Caroni(93,000 km2), Caura (45,350) and Ventauri(41,760) tributaries – substantive rivers intheir own right (Fig. 2.30B). The remainingpart of the watershed flows from the head-waters of the Apure, Meta and GuaviareRivers in the eastern Andes across the low-land sedimentary plains of Venezuela andColombia (Figs 2.6B, 2.30B).
The Essequibo River watershed con-sists of two arms meeting in north-centralGuyana. The northern arm flows eastwardalong two large rivers, from the VenezuelanImataca region via the Cuyuni River (89,000
Biophysical Features of the Guiana Shield 135

136 D.S. Hammond
km2) and the Guyanese North Pakaraimasthrough the Mazaruni River. The southernarm flows northward across lowland forestand savanna through the Kassikaityu,Kuyuwini, Kwitaro, Rewa (11,000 km2),and Rupununi (22,000) Rivers from theirsources in the Acarai, Kamoa, Amuku,Wassarai and Kanuku mountain ranges.While the Essequibo watershed constitutes55% of Guyana’s national land area, an esti-mated 25% of the total watershed areaextends into Venezuela as part of theCuyuni headwaters (Table 2.2).
The Trombetas system is the largestwatershed contained within a single coun-try of the shield region, Brazil. Coveringmost of Pará state north of the Amazon, thearea surrounds a three-pronged system con-sisting of the Mapuera (26,500 km2),Trombetas (73,400) and Paru de Oeste(36,500) watersheds, headwatered along thesouthern slopes of the Serra Acarai andTumucumaque ranges along theGuyana–Suriname–Brazil border.
The Japuerá, or Caquetá as it is knownin Colombia, finds its source west of the
Table 2.2. The thirty largest watersheds exporting water from the Guiana Shield into the Amazon orAtlantic Ocean, their estimated surface areas and distribution among the six shield countries.
Ref. River system Colombia Brazil Venezuela Guyana Suriname F. Guiana Total (km2)
1 Negro 78,600 589,300 40,500 12,300 720,7002 Orinoco 18,200 359,000 377,2003 Essequibo 339,000 118,500 157,5004 Trombetas 136,400 136,4005 Japuerá 73,700 17,800 91,5006 Jatapu 74,700 74,7007 Marowijne 39,100 30,900 70,0008 Courentyne 27,900 40,700 68,6009 Jari 54,600 54,600
10 Paru de Este 44,250 44,25011 Oyapock 18,700 14,200 32,90012 Araguari 31,500 31,50013 Maraca Pucu 26,000 26,00014 Nhamunda 25,500 25,50015 Curua 24,400 24,40016 Coppename 21,900 21,90017 Maicaru 20,600 20,60018 Waini-Barima 1,200 17,900 19,10019 Suriname 17,200 17,20020 Berbice 16,600 16,60021 Amacuro-Aguirre 14,200 14,20022 Mana 12,100 12,10023 Approuague 10,250 10,25024 Nickerie 10,100 10,10025 Saramacca 9,150 9,15026 Calcoene 9,100 9,10027 Demerara 8,200 8,20028 Commewijne 6,600 6,60029 Sinnamary 6,600 6,60030 Cacipore 5,500 5,500
Misc. others* 125,000 11,100 2,650 11,200 149,950
Total (km2) 170,500 1,203,350 453,900 212,500 147,400 85,250 2,272,900
*Includes: Brazil: Urubu, Piorini, Parana, Cuncuaru, Amapá Grande and other smaller riverlets in Paráand Amapá; Guyana: Pomeroon, Mahaica, Mahaicony, Abary and others; Suriname: Coronie and othersmall coastal stream systems; French Guiana: Comté, Kourou, Counamama, Iracoubo, Organabo,Macouria, Montsinery, Mahury, Kaw and other small coastal creeks.
Guiana Shield in the eastern slopes of theColombian Andes. Its large watershed(242,000 km2) is largely contained outsidethe Guiana Shield (62%) (Fig. 2.30B). Onlythe northern tributaries, most notably theApaporis River, are considered here todrain from the Guiana Shield.
The Marowijne, or Maroni, River is a70,000 km2 watershed distributed almostequally between eastern Suriname andwestern French Guiana (Table 2.2). Flowingfrom the Tumucumaque Uplands via theTapanahoni, Oelemort, Lawa, Waki,Tampoc (7650 km2), Malani and AlitaniRivers, the Marowijne watershed is FrenchGuiana’s largest, accounting for an esti-mated 34% of French Guiana’s land areaand 25% of Suriname.
The third largest watershed in theGuiana Basin feeds the Courentyne(Courentijn) River mainstem (Fig. 2.30B)and is shared by Guyana (41% of area) andSuriname (59%) (Table 2.2). It originates inthe Acarai range in Guyana and theWilhelmina Mountains and Sipaliwinisavannas of Suriname, draining along theNew, Aramatau, Lucie and SipaliwiniRivers.
The Oyapock (Oyapok, Oiapaque)watershed spreads westward from itsmouth at the border between Amapá andFrench Guiana (Fig. 2.30B). Roughly 57%of the area falls within French Guiana alongseveral major tributaries, most notably theNoussiri, Camopi (6000 km2) and YaloupiRivers. In Amapá, it is fed principally bythe Cricou, Anotaie, Iaué and MuturaRivers.
The smallest of the watersheds sharedbetween different countries is theWaini–Barima system spread across thenorthernmost regions of Guyana andVenezuela. Fed by Barama, Kaituma andAruka Rivers in Guyana, the Barima swingsnorthwestward along the Atlantic coast todrain along the southern bank of theOrinoco delta. The lower reaches of theWaini follow a parallel path but drainbefore reaching the border. Slightly morethan 6% of the watershed area is located inVenezuela, but this importantly includesthe Barima river mouth.
River directions and connections
The unique geomorphology of the GuianaShield can exert a pronounced control onchannel behaviour along many of the majorwaterways coursing through the region.The main features linking geomorphologyto river dynamics in the shield area are aproduct of several interdependentprocesses, i.e. (i) repeated regional tiltingand uplift; (ii) an accumulation of exposedfaults, rifts and joints; (iii) accumulation ofexposed dyke and sill lithologies; (iv) cre-ation of an inverse topography through lat-erite formation in palaeochannels; (v) theprevalence of unconsolidated, reworkedsediments in the major depositional basins;and (vi) retroflexion northwestward ofcoastal river mouths by strong wind-driven,ocean currents.
TECTONIC CONTROLS – UPLIFTING AND REGIONAL
TILT The Precambrian landscape of theGuiana Shield is derived from a long seriesof intervening tectonic and eustaticprocesses that have repeatedly altered ero-sion bevel slope and aspect (Gibbs andBarron, 1993). Hydrography has changed asa consequence and many of the modern-dayriver courses once belonged to neighbour-ing watersheds or flowed in the oppositedirection. There are numerous examples ofstream capture as a consequence of regionaltilting. These include the Rio Tacutu’supper Tertiary capture of the RupununiRiver’s west bank tributaries. Most notableamong the waterways once flowing east-ward is the Sawariwau River, whose head-waters are located near the seasonallyinundated Dadanawa region (Berrangé,1977). The upper Mazaruni’s suddenchange from a northward to eastward flowis also attributed to tilt-induced capturefrom its former downstream flow along theUrluowra River, a tributary of the CuyuniRiver (Bracewell, 1950). This capture isindicative of a wider regional west to eastdownwarp across Guyana associated withBerbice Basin formation. Similarly, theheadwaters of the Tapanahoni River inSuriname, a tributary of the Marowijne,were captured from Jai Creek as a conse-
Biophysical Features of the Guiana Shield 137

quence of eastward tilting (Haug, 1966;Leaflang et al., 1978 cited in Gibbs andBarron, 1993). The capture of theCasiquiare Canal by the Rio Negro isbelieved to have been caused by a south-eastern tilting along the Orinoco head-waters (Stern, 1970; Khobzi et al., 1980).Gibbs and Barron (1993) also present sev-eral cases of stream capture that reflectmore localized changes in erosion bevels.Of particular significance is the proposalthat the current flow of the Essequibo Riverabove Massara once formed the upperreaches of a much larger Berbice Riverwatershed before a change in flow directionwestward led to its capture by the lowerEssequibo from Rattlesnake Creek.
STRUCTURAL CONTROLS – FAULTS AND JOINTS
Regional tilting has occurred as both causeand consequence of fault, rift and joint for-mation. A series of tectonic events reacti-vated the igneous rock base and producedan extensive field of faults, rifts and jointsacross the region over a 2 billion yearperiod (see Fig. 2.6A, B and ‘Tectonicprocesses’, above). Sea-level change as aconsequence of climate variation has alsoled to further fracturing of the shield area aseustatic adjustments create alternating peri-ods of downwarping and uplifting. Majorfault zones have created wide, linear basinsthat constrain drainage direction and formthe base of several regional erosion bevels.Most noticeable among the drainage effectsof faulting and fracturing are abrupt andlocalized orthogonal channel swings andparallel stream spreading, often involvingcounter-flowing drainages. The counter-flowing upper Orinoco and Rio Negrodrainages are constrained by the massiveCasiquiare Rift (Fig. 2.9A, see ‘Shieldmacro-features’, above), a pattern also seenin the parallel channelling of the upperRupununi and Tacutu Rivers in southwest-ern Guyana (Fig. 2.9B). The abrupt orthogo-nal shift in drainage alignment of theBerbice, Essequibo and Rupununi Riversbetween Rappu Falls and Apoteri in centralGuyana provides a more localized exampleof a major fault axis, in this instance thecentral section of the Takutu Graben (Fig.
2.6A, B), controlling parallel river flowdirection. In other cases, direction along theentire length of mainstem flow is simplyconstrained by the fault major axis(Noordam, 1993). The southwestern flow ofthe Rio Branco follows the trough formedby the eastward extension of the Pisco-JuraMegafault and westward termination of theTakutu Graben (Fig. 2.6A, B). A major trib-utary of this river, the Uraricoera, has a flowconstrained by the southeastern dip of theAracaca–Urutamin horst-fault complex innorth Roraima state (see Fig. 2.3 in Gibbsand Barron, 1993). Minor stress fractures,often formed as a consequence of eustaticadjustment, have exerted a less pro-nounced, but widespread, effect on local-ized river direction in the Guiana Shield(e.g. Suriname, Noordam (1993)).Localized, orthogonal swing in mainstemdirection can be found along the courses ofmost major rivers draining the region,including parallel displacements alongthe middle Caroni and Paragua Riversin Venezuelan Guayana and theupper Mazaruni and Essequibo Rivers inGuyana.
INVERTED RELIEF Water levels in palaeo-channels over the Neogene fluctuated withalternating periods of relatively wet and dryclimate (see ‘Prehistoric climates of theGuiana Shield’, above), creating ideal con-ditions for lateritic cementation of exposedbasic rocks. Combining with other resistantparent rock structures, faults and fractures,the proliferation of laterite domes and hillsacross the landscape has also acted to limitlocal drainage direction and movement,contributing to the evolution of rectangulardrainage patterns, a hydrographic featurecommonly characterizing many parts of theshield region (e.g. central Suriname, Haug(1966)).
NATURAL IMPOUNDMENTS Almost everyriver draining the exposed crystalline base-ment of the Guiana Shield courses overexposed linear bands of intrusive rock thatare more resistant than the surroundingmaterial. The cataracts formed from themeeting of channel and typically an
138 D.S. Hammond
exposed dyke or sill are a unique feature ofthe central shield’s waterways as theycourse across areas of relatively shallowsediment. Referred to as ‘falls’ in Guyana,‘saut’ or ‘soula’ in French Guiana, ‘sula’ inSuriname (Zonneveld, 1952), ‘cachicoera’in Brazil and ‘raudal’ or ‘salto’ inVenezuela, their impounding effect canpush waters to open up a braided networkof stationary, anastomosing channels thatopen and close with the seasonal change inriver height. Dykes and sills can also actlike faults or fractures in effectively extin-guishing lateral channel migration whenrunning parallel to the main erosion bevel,leading to stretches that appear unusuallystraight relative to other lengths of the river(e.g. Caqueta River, p. 34 in Duivenvoordenand Lips, 1995). Greenstone belts rangingacross the exposed Precambrian rim of theeastern Guiana Shield have had a similarlocal-scale effect on drainage direction andsinuosity (Gibbs and Barron, 1993). Asrivers move into the deeper sedimentsdeposited along the edge of the shield, how-ever, natural impoundments disappear alto-gether and water flow direction becomesincreasingly controlled by the characteris-tics of the surrounding depositional envir-onment (Sioli, 1984a; Goulding et al.,1988), a feature that pervasively controlslowland dynamics across westernAmazonia (Salo et al., 1986; Räsänen et al.,1987), albeit as a downstream response tomore substantial elevational gradients andcurrent velocities upstream.
SAND-DOMINATED SEDIMENTARY PLAINS Thedepositional environment of the GuianaShield is characterized by an unusual abun-dance of heavily reworked quartz sandfields, a feature reflected in the particle-sizedistribution of upland soils, especially inthe Rio Negro, Caquetá, Branco and Berbicebasins (Duivenvoorden and Lips, 1995; vanKekem et al., 1996; Dubroeucq et al., 1999),Casiquiare rift valley (Table 4 inSaldarriaga, 1994) and coastal savannas ofthe Guianas (van der Eyk, 1957;Blancaneaux, 1973; Cooper, 1979). Clay-and silt-dominated soil types do occur (e.g.dystric Gleysols), but these are typically
associated with stream channels and dis-tributed as a consequence of river migra-tion. In some instances, where past rivercapture has extinguished mainstem seg-ments, these soils may appear at some dis-tance from active floodplain areas (e.g.Kuruduni River in Guyana (van Kekem etal., 1996)). Large substrate particle size andslow flow velocities combine to minimizeriver migration across the sand-dominatedsedimentary plains. Instead, infiltration, thedownward movement of water through thesoil profile, dominates run-off across theseareas (e.g. Jetten, 1994). This creates adrainage system characterized by a muchlower stream density (e.g. Teunissen, 1993)than those dominated by surface run-offprocesses, such as those with headwaters inthe Andes (e.g. Fig. 2.2 in Duivenvoordenand Lips, 1995).
DEFLECTED COASTAL RIVER MOUTHS Mostrivers discharging into the Atlantic arecharacterized by downstream courses thatrapidly move northwestward from theirmajor channel axis. This sudden change inriver course is caused by the northwest-ward movement of the Guiana Current thatbegins with entrainment of the Amazonfreshwater river plume and continuesthrough to the Orinoco. Larger rivers, par-ticularly during peak discharge periods,experience less severe channel deflection oftheir lower reaches (e.g. Amazon,Essequibo, Courentyne, Maroni, Orinoco)compared to smaller waterways (e.g.Oyapock, Approuague, Mana,Commewijne, Nickerie, Pomeroon, Waini,Barima), although freshwater plumes, andsediment loads, are still diverted in linewith the prevailing longshore currents.
Average water discharge rates
The surface export of freshwater from theGuiana Shield is substantial. Throughapproximately 47 medium to very largerivers (after Table 6.1 in Meybeck et al.,1992) the region exports on average anestimated 2792 km3 of freshwater eachyear. This amounts to 7–7.5% of the globaltotal, estimated at between 37,300 and
Biophysical Features of the Guiana Shield 139

140 D.S. Hammond
40,000 km3 per annum (Baumgartner andReichel, 1975; Table 4 in Dai andTrenberth, 2002), and 25% of SouthAmerica’s total volume of freshwater, about11,100 km3 per annum (Degens et al., 1990),
discharged to the oceans (Table 2.3).21
Northeastern South America is the world’slargest regional contributor of freshwater tothe global oceanic pool (Dai and Trenberth,2002) and the two basins draining the
Table 2.3. Estimated average water discharge (Q) and specific discharge (q) rates for rivers exportingfrom the Guiana Shield region. See text and endnote no. 11 for details of base data sources,calculations and assumptions. Note: standard deviation is likely to be high for many river averageslisted here due to inter-annual patterns of rainfall variation not fully embraced by record series.
Rank Basin Countrya River system Q (km3/year) q (l/s/km2)
1 NAB Co-Ve-Br Negro 1,400.0 59.22 GB Ve Orinoco (Guayana only) 565.0 35.83 NAB Co-Br Caquetá-Japuerá 168.3 22.04 GB Gu (Ve) Essequibo 154.0 32.35 NAB Br Trombetas 74.6 30.86 GB Su-Fg Marowijne-Maroni 56.3 27.17 GB Gu-Su Courentyne-Courentijn 49.6 23.18 NAB Br Jari 31.5 19.59 NAB Br Jatapu 30.5 42.1
10 GB Fg-Br Oyapock-Oiapoque 28.3 29.011 NAB Br Uatumá 21.1 32.912 NAB Br Paru de Oeste 17.3 15.113 GB Su Coppename 15.8 23.014 NAB Br Paru de Este 15.1 15.515 GB Su Suriname 13.4 25.816 GB Fg Approuague 11.7 36.117 GB Gu Berbice 11.0 21.118 GB Br Araguari 10.5 14.219 GB Fg Mana 9.7 25.420 GB Fg Sinnamary 9.1 44.221 NAB Br Nhamunda 7.3 21.722 GB Su Saramacca 7.1 25.023 GB Fg Comte 7.0 43.724 GB Gu Demerara 6.9 26.825 GB Br Caciporé 6.8 53.826 GB Br Calcoene 6.3 15.527 GB Fg Mahury 6.3 61.428 GB Gu Waini 6.3 36.729 GB Su Nickerie 5.6 17.630 NAB Br Padauari 4.4 20.631 NAB Br Curua 4.2 6.432 GB Gu-Ve Barima 4.0 8.833 GB Su Commewijne 3.8 18.234 NAB Br Maicaru 3.6 6.635 GB Fg Kourou 3.5 57.736 GB Fg Iracoubo 2.3 50.037 GB Gu Pomeroon 1.9 10.638 NAB Br Maraca Pucu 1.5 11.139 GB Fg Counamama 1.4 50.040 GB Fg Cayenne 1.3 58.3
GB/NAB Misc. others (7 rivers) 7.3
Guiana Shield 2,792 38.7
aBr, Brazil; Co, Colombia; Fg, French Guiana; Gu, Guyana; Su, Suriname; Ve, Venezuela.

Guiana Shield contribute significantly tothis ranking.
NAB RIVERS Moving southward, 15 majorrivers draining the Guiana Shield into theAmazon account for approximately one-third of the volume (5519 km3 per annum(Richey et al., 1990)) that is discharged, onaverage, from its mouth, give or take a 1%additional loss to evapotranspiration in-transit to the Atlantic as part of the Amazonmainstem flow. The Rio Negro dominatesthe distribution of surface water leaving theNAB, accounting for 79% of the total esti-mated discharge from the basin. This isequal to about 13% of the annual averagedischarge from the Amazon Basin (Molinieret al., 1993). Two notable tributaries feedthis flow. From the Chiribiquete region ofColombia, the Vaupés/Uaupés delivers anestimated 36 km3 per annum (see Bodo(2001) and Notes for details) to the Negrosouth of its mainstem exit from VenezuelanAmazonas. The largest contributor, the RioBranco, drains much of the southern slopesof the highland chain dividing the shield’stwo basins, before flowing through the GranSabana and into the lower Rio Negro. Atthis point, it delivers its water at an esti-mated average discharge rate of 377 km3 perannum (Seyler and Boaventura, 2001), or27% of the water exported each year to theAmazon via the Rio Negro. TheCaquetá/Japuerá delivers approximately6% of the water from the NAB to theAmazon mainstem, although this figurealso includes waters draining from headwa-ter tributaries in the Colombian Andes andinflates the contribution from shield-drain-ing waterways downstream. Adequate dis-charge data are not available for the majorrivers, Yarí, Mirití-Paraná and Apaporis,but given their watershed area and locationwithin one of the major rainfall centres ofthe neotropics, their contribution (to waterflow only) is likely to compensate for theirmodest elevational gradients.
GB RIVERS Moving northeastward, 32major rivers flowing into the western tropi-cal Atlantic account for a little more than5% of the annual freshwater inflow to the
Atlantic Ocean, estimated at 19,200 km3 perannum (Dai and Trenberth, 2002). Over56% of the surface water is estimated toleave the GB each year through the Orinoco,but the Orinoco receives only a little morethan half of its estimated volume fromshield-draining tributaries, most notablythe Caura (110 km3 per annum), Caroni(157 km3 per annum) and Ventauri (63 km3
per annum) (Weibezahn, 1990; Cressa et al.,1993 and references therein). The remain-ing volume is discharged from westernshield tributaries, such as the Inirida (95km3 per annum) and Atabapo Rivers thatdrain podzol/arenosol-dominated lowlandregions of the Chiribiquete and Casiquiareregions and, most importantly, the easternslopes of the Colombian and VenezuelanAndes, mainly through the Guaviare (230km3 per annum), Meta (157 km3 perannum) and Apure (70 km3 per annum)Rivers (Meade et al., 1990, and referencestherein).
Together, the Orinoco and Rio Negrowatershed make up over 70% of the esti-mated annual flow of surface water leavingthe region (Table 2.3). Of the remainder,445 km3, about 40% of the total Orinocoflow, is generated on average each year fromrivers draining northward through theGuianas and Amapá into the Atlantic. Mostnotable among the contributing rivers arethe Essequibo, Courentyne/Courentijn,Marowijne/Maroni and Oyapock/Oiapoque(Table 2.3). Juxtaposed between theOrinoco and Amazon Rivers, this regionappears insignificant in its annual export offreshwater. But the total volume is esti-mated as being over twice that dischargedby the Danube (eastern Europe), one andthree-quarters the volume of the Columbia(Pacific Northwest USA), similar to theGanges (India) and nearly 75% of that flow-ing from the Mississippi (Dai andTrenberth, 2002), to place its compositecontribution in a global context.
SPECIFIC DISCHARGE RATES More striking, atleast perhaps to non-hydrologists, is theactual area drained to create these sizeableflow rates, referred to as the specific dis-charge rate.21 In the Guiana-Amapá case, an
Biophysical Features of the Guiana Shield 141

area of 532 × 104 km2 is drained (ΣAGB–AOrinoco from Table 2.2, Σ QGB–QOrinocofrom Table 2.3), giving a specific dischargerate of 26.5 l/s/km2. This is over three timesthat estimated for the Danube, 2.5 times thatof the Columbia, nearly twice the specificdischarge of the Ganges and over four timesthe volume of water estimated to leave theMississippi for each square kilometre ofland drained (Mouth Vol and DA – Table 2in Dai and Trenberth, 2002).
Taken as a whole, the Guiana Shieldaverages a discharge rate of 2792 km3 perannum from a drainage area that amounts toless than 2.3% of the global area draining tothe oceans, achieving a specific dischargerate (q) of 38.5 l/s/km2, one of the highestknown for an area of this size. The AmazonBasin as whole is estimated to generate aslightly lower specific discharge rate,between 28 l/s/km2 (Degens et al., 1990)and 36 l/s/km2 (calculated from Table 2 inDai and Trenberth, 2002). The high value ofq for the Rio Negro contributes significantlyto estimations for both the Guiana Shieldand Amazon Basin (Table 2.3). Othershield-draining tributaries of the Amazonalso achieve high q values (Table 2.3) andcompensate for the much lower values esti-mated for northward flowing Amazon tribu-taries, such as the Tapajos (26 l/s/km2) andXingu (19 l/s/km2), that drain the drier east-ern Brazilian Shield region (Fig. 2.16A).The contribution of shield-draining tribu-taries to the Orinoco’s specific discharge isreflected in the larger q value calculatedwhen considering the Guayanan portionalone (Table 2.3, 35.8 l/s/km2) against thatof the entire watershed (34.5 l/s/km2).Again, the decline in annual rainfallrecorded for lowland Venezuela/Colombianorth of the Guiana Shield dampens thevalue of q despite several major rivers withheadwaters sourced in the Andes. The pres-ence of the Guayana Highlands along thehigh-rainfall-producing meteorologicalequator bolsters run-off and thus the spe-cific discharge. The geographic distributionof the watershed in relation to the meteoro-logical equator is further emphasized by therelatively high values of q estimated formuch smaller rivers draining eastern
French Guiana (e.g. Oyapock, Approuague,Sinnamary, Comté, Kourou and others inTable 2.3) and the decline in q movingwestward along the Atlantic coast betweenthe Maroni and Berbice Rivers. In part, thisgeneral trend appears to be more sensitiveto the lithological make-up of the water-shed area than changes in rainfall, withrivers largely draining deeper unconsoli-dated sands showing much lower specificdischarge values. Infiltration rates can besubstantive for arenosolic soils, especiallywhere these are deep and do not rest abovea relatively shallow sub-horizon ofindurated material. This modulates therelease rate into the surface river flow, espe-cially in relation to lithological formationswith shallow or high clay soils, or thosewith an exposed, indurated layer, such aslaterite (see ‘Main soils in the GuianaShield’, above). As a consequence, seasonalvariation in the discharge rate from sand-dominated watersheds exhibits a relativelylow amplitude compared to equivalentareas with less infiltration and groundwaterflow capacities.
Seasonal variation in discharge
As is the case with rainfall, the averageannual discharge of surface water gives agood indication of the spatial movement ofwater through and out of the Guiana Shield.It does not adequately describe, however,variation in surface flow, particularly inresponse to the behaviour of the mecha-nisms that deliver rainfall to the region.Annual averages mask the important sea-sonal variation component of the surfacedrainage flux and how this variationchanges spatially. If rainfall is the seasonalpacesetter of terrestrial tropical life in theterra firme forests, the surface waterresponse to alternating wet and dry seasonsis certainly the pacesetter of life in flood-plain forests.
Generally speaking, both discharge rateand stage (height) of the largest river main-stems peak one to three months after thepeak in seasonal rainfall across the SouthAmerican tropics. The latitudinal rangingof the ITCZ and the rainfall it delivers over
142 D.S. Hammond

Biophysical Features of the Guiana Shield 143
the Guiana Shield and greater Amazon isclearly mirrored by the rise and fall of aver-age monthly discharge rates (Fig. 2.31).Seasonal variation in discharge is not ‘in-phase’ or synchronous across the region,however (Figs 2.31, 2.32). With the onset ofthe ‘dry’ season over the Guiana Shield dur-ing the boreal autumn (September–November), and with the ITCZ recentlyarriving over the Brazilian Shield, dis-charge is at its lowest across both theGuiana Shield and southern Amazonia.Only the large Orinoco and its Andean-
draining tributaries continue to flow at arate above their seasonal minima (Fig. 2.31– November). By February, rivers drainingthe western shield have diminished out-flow, but eastern shield rivers in FrenchGuiana and Amapá maintain higher rates asthe ITCZ curls northward along the Atlanticseaboard of equatorial South America intandem with the dampened poleward rang-ing of maximum SSTs. A rise in the dis-charge from rivers draining the Bolivianand Peruvian Andes and Brazilian Shieldlags the southward movement of the ITCZ.
Fig. 2.31. Seasonal variation in river discharge rates (filled circles) and mean monthly rainfall (opencircles) across the Guiana Shield and adjacent regions. Rainfall values are for the preceding month.February: period of minimum river discharge rates across most of shield region and maximum dischargefrom rivers south of Amazon reflecting southerly position of ITCZ . May: increase in discharge from majorrivers across shield region as peak seasonal rainfall spreads across entire area and diminishes in the southwith northward movement of ITCZ. August: wet season (June/July) nears end and shield rivers at maximumdischarge as ITCZ returns southward from its northern range limit, while south Amazon rivers reach minima. November: discharge from shield rivers quickly declines as rainfall drops off as ITCZ movessouthward, increasing rainfall in south Amazon. Hatched horizontal line is meteorological equator.Rainfall values range across seven intervals between 0–50 mm (smallest circle) and 500–600 mm (largest).Mean monthly discharge values are standard deviates (mean=0) for each station dataset and range acrossseven 0.5 intervals between –1.5 (smallest circle) and +2.0 (largest).
Feb May
NovAug

144 D.S. Hammond
By April, the ITCZ has moved over thesouth-central Guiana Shield. Dischargefrom rivers draining the southeasternshield, viz. Amapá, North Pará and FrenchGuiana, peak during this phase while riversdraining the south Amazon stay close totheir seasonal highs (Fig. 2.31 – May, Fig.2.32). Rivers across the north-northwesternGuiana Shield, including the Orinoco, con-tinue to flow at rising, but still relativelylow, rates. By the peak of the boreal sum-mer in July, the high rainfall and river dis-charge rates have moved northward (Fig.2.32). Discharge rates peak across the west-ern and northern shield in July, while ratesdiminish across French Guiana, Amapá andalong the southern rim of the region.Rainfall is at a minimum across southernAmazonia and discharge rates, as a conse-quence, approach their minima reached inOctober. At the same time, rainfall oversouthern Central America has just declinedfrom its seasonal peak in July–August, gen-erating a delayed peak in river dischargefrom September to November (Fig. 2.32).
Many factors other than latitudinalposition (including stream order, samplingerror and record length) can influence thetiming of peak average discharge. These arereflected in the approximately four-monthspread in peak averages recorded at thesame latitude for 486 lowland stations fromthe ANEEL and UNESCO databases (Bodo,2001) (Fig. 2.32). Nonetheless, within low-land systems of the neotropics, it is perhapsnot too unreasonable to state that all riversdraining the Guiana Shield experience apeak discharge sometime between Apriland July, Central American rivers betweenMay and November, and South Amazonianrivers between January and July (Fig. 2.32).
Inter-annual variation in discharge
In the Guiana Shield, surface discharge rep-resents the major component of run-off.Run-off can be crudely equated to rainfallless atmospheric return through evapotran-spiration. Logically, run-off should there-fore be conditioned indirectly to the same
Fig. 2.32. Latitudinal shift in peak monthly discharge across the Guiana Shield and adjacent regions in theneotropics based on inter-annual averages. Note: Averages are not based on concomitant intervals for allrivers. Data sources: Bodo (2001), ANEEL, Hydrometeorological Service (1980, 1981, 1982, 1985, 2000).
–

factors that affect variation in these twodominant fluxes. Across the GuianaShield, the two extreme phases of ENSO,El Niño and La Niña, are the most impor-tant climatological events affecting varia-tion in modern rainfall and evapo-transpiration (see ‘Modern centres of highrainfall’, above), and thus inter-annual vari-ation in water flow rates and stage heights.This relationship has been well docu-mented for the Amazon mainstem and sev-eral of its major tributaries (Molion andMoraes, 1987; Richey et al., 1989; Marengo,1995).
In the Guiana Shield, Lointier (1993)identified an 18–19-year interval betweenextreme low and high peak discharge ratesof the Oyapock (Maripa) over the intervalspanning 1953–1993. The variation fromthe long-term mean over this period clearlymirrors the incidence of strong EN and LNphases of ENSO, with discharge rates con-sistently declining by 12–50% from thelong-term average during strong EN phaseyears and increasing by 12–80% during LNphases. Past annual discharge anomaliesfrom other French Guiana rivers, such asthe Approuague, Camopi, Mana, Maroni/Marowijne and Tampoc appear to similarlycoincide with the onset of EN/LN condi-tions (Hiez and Dubreuil, 1964), as doneighbouring Surinamese and Guyaneserivers.
In fact, the spatial decline of a strongSOI–precipitation relationship north andsouth from its regional centre in the east-central Guiana Shield (see ‘Historic varia-tion in rainfall’, above) should be reflectedin the spatial variation in river dischargeresponses (Fig. 2.33).22 Multi-decadalrecords of monthly river discharge withinthe region are extremely scarce, but severalstations have sufficient data to evaluateresponses to several of the more recent ENevents. During the strong EN event of1972–73, rivers draining the north and eastof the shield (Essequibo, Rio Branco in Fig.2.33) show a strong seasonal decline inmonthly discharge compared to the decadalmean for each month over the period1967–1977, registering only 20–40% of theaverage flow during the first quarter of the
final EN year. The Orinoco also experi-enced a less drastic reduction in flow dur-ing the period at Ciudad Guayana (PuertoAngostura). In part, the relatively mildresponse of Orinoco discharge to EN-induced rainfall failure is due to modula-tion by its tributary connections with theAndes. Major contributors draining theGuayana Highlands appear to have experi-enced an ENSO response similar to the east-central shield (e.g. Caroni: Hastenrath et al.,1999). Large rivers with strong connectionsto the Andes in south and westernAmazonia showed a very weak or positiveresponse to both the 1972–73 and verystrong 1982–83 EN events (Caquetá/Japuerá, Jurua, Purus and Madeira Rivers inFig. 2.33) (Sklar, 2000). Similar to 1972–73,shield-draining rivers experienced a sus-tained reduction in discharge from August(year 1) to April (year 2) as the EN eventreached its ‘mature’ phase, noted by thelarge negative SOI score in Fig. 2.33 (rightcolumn, except Jari).
The anisotropic discharge response toEN and LN events across the lowland trop-ics of South America suggests that much ofthe Guiana Shield, without substantial flu-vial connections to the Andes, would haveexperienced more severe and prolongedwater-level fluctuations under extendedpalaeo-ENSO conditions, or other climato-logical phenomena that would have simi-larly forced a longer ITCZ residence northor south of the region (e.g. certainMilankovitch cycle phases). Based on cur-rent understanding of the climatologicaldynamics delivering rainfall to the regionand effects of its surface geomorphology onrun-off, the aquatic systems and prehistoricinhabitants of the Guiana Shield may havebeen disproportionately affected by apalaeoclimatic see-saw of flooding andimpounded pooling not experienced inother neotropical regions.
Physico-chemical transport
A world-class, but ENSO-sensitive, surfacedischarge rate is not the only distinctiveattribute of Guiana Shield waterways.Waters also erode and then transport partic-
Biophysical Features of the Guiana Shield 145

146 D.S. Hammond
ulate and dissolved sediments that reflectthe unique combination of lithologicalbase, soil substrate and geographic positionof their tributary headwaters (Sioli, 1975;Meybeck, 1994). Limnological conditions offreshwater systems also play an importantrole in the evolution and maintenance ofaquatic life in the tropics (Lowe-McConnell, 1987; Goulding et al., 1988)
and represent the most important terrestrialmode of material flux on the planet(groundwater, wind and ice are other majorpathways) (Lerman, 1994). Globally, tropi-cal river systems account for an estimatedthree-quarters of the dissolved silica, nearlyhalf of ions, over half of the organic carbonand one-third of the total suspended matterreaching oceans each year from only one-
Fig. 2.33. River discharge responses to strong (1972–73) and very strong (1982–83) ENSO events acrossthe Guiana Shield (top row) and southern Amazonia (bottom row). Monthly discharges during the ENSOevents are expressed as a percentage of the long-term average for each month (=100). Data sources: seeNotes for further details.
1972–73
1982–83
1982–83543210–1–2–3–4–5
SO
I sc
ore
(SD
1882
–200
2)
543210
–1
–2
–3
–4
–5
SO
I sc
ore
(SD
1882
–200
2)
543210
–1
–2
–3
–4
–5
SO
I sc
ore
(SD
1882
–200
2)
543210
–1
–2
–3
–4
–5
SO
I sc
ore
(SD
1882
–200
2)
% o
f m
ean
mon
thly
dis
char
ge%
of
mea
n m
onth
ly d
isch
arge
% o
f m
ean
mon
thly
dis
char
ge%
of
mea
n m
onth
ly d
isch
arge
Caquetá-JapueráJari
RioDischarge
Berbice
Orinoco
Essequibo

Biophysical Features of the Guiana Shield 147
third of the total drainage area (Meybeck,1982, 1988).
Up until very recently, the physico-chemical transport of materials was poorlystudied across most of the Guiana Shield,consisting of a few, short-term measure-ment series at scattered locations (e.g.Edwards and Thornes, 1970). Studies alongthe Amazon and Orinoco mainstems weremore substantial (Gibbs, 1967; Sioli, 1968;Stallard and Edmond, 1983; Furch, 1984,Irion, 1984), in part due to a productiveBrazilian–German biogeochemical researchprogramme in the 1960s and 1970s (for areview, see McClain and Elsenbeer, 2001),but still sparse relative to the spatial andtemporal scale of fluvial processes attachedto these two giant waterways. Two largeinternational projects, CAMREX (Richey etal., 1990) and SCOPE (Degens, 1982), com-bined with numerous other smaller studies
undertaken over the last two decades or so,have further improved the general under-standing of transport features and processesin the region. But a comprehensive networkof long-term monitoring sites remains elu-sive and the combined spatial and temporalvariation in the physico-chemical attributesof regional waterways is inadequatelyresolved. General trends in many of the keyfeatures, particularly as these relate to uni-versal links between water chemistry, geo-morphology and climate (change) can,however, be tentatively assembled for theGuiana Shield. It is important to note, how-ever, that basic data for many common lim-nological parameters are not widelyavailable for many significant rivers drain-ing the region, particularly in Guyana,Suriname, North Pará, Roraima andColombia. Most significant among thesedeficiencies is the lack of access to good
Fig. 2.33. continued
1972–73 1982–83 543210
–1
–2
–3
–4
–5
SO
I sc
ore
(SD
1882
–200
2)
543210
–1
–2
–3
–4
–5
SO
I sc
ore
(SD
1882
–200
2)
543210
–1
–2
–3
–4
–5
SO
I sc
ore
(SD
1882
–200
2)
% o
f m
ean
mon
thly
dis
char
ge%
of
mea
n m
onth
ly d
isch
arge
% o
f m
ean
mon
thly
dis
char
ge

data from Guyanese rivers, despite thelithological diversity of their drained water-sheds and central position within thehydrography of the shield region.
PH – ACIDITY Waterways of the GuianaShield register some of the lowest pH val-ues in the neotropics, generally rangingfrom 4.5 to 7.0 along lower segments of thelarger waterways (Fig. 2.34). Much smallertributaries can show average pH readings ofless than 4.0, but this depends primarily onthe lithology of the drainage area.Waterways draining the north AmazonBasin are typically lower than those drain-ing the Guiana Basin. This is principally afunction of western shield tributaries of theRio Negro watershed that have pH valuesconsistently below 4.0 (Sioli, 1957; Furch,1984; Seyler and Boaventura, 2001) andnorthern shield tributaries of the OrinocoRiver that have pH values consistentlybetween 5.0 and 7.0 (Depetris and Paolini,1990; Cressa et al., 1993). Rivers drainingthe eastern shield area show a mixture ofboth low pH (Berbice, Maroni, Nickerie,Essequibo) and higher pH (Rio Branco,Trombetas) waters, but nearly all rivers canbe classified as acidic.
All else being equal, tropical waterswill typically show higher acidity valuesthan temperate streams, but the role ofwatershed lithology can override the effectsof tropical temperature on aquatic pH(hydrogen ion concentration). Waterwaysdraining rock formations containing rela-tively high concentrations of acidity-buffer-ing calcium tend to have a near-neutral tobasic pH. The absence of significant cal-cium-bearing weathering surfaces in thelowlands of eastern Amazonia and theGuiana Shield generally prevents bufferingthat typifies most western Amazonianwaterways sourced in the eastern slopes ofthe Andes (Fig. 2.34), but isolated exposureof carbonate sedimentaries in some deposi-tional environments of the shield can leadto local exceptions (e.g. Takutu River:Berrangé, 1977).
A lowering of water pH can also occurwith an increase in atmospheric carbondioxide concentration, oxidation of nitro-
gen and sulphur emissions (‘acid rain’) (see‘Non-volcanic aerosols’, above), volcanicemissions that form hydrochloric acid, sul-phuric acid products of iron pyrite weath-ering, soil carbon dioxide release throughoxidation of organic matter and the releaseof organic acids from plants and animals(Lerman, 1994). Of these, biological sourcesof hydrogen ions are the greatest contribu-tors to the consistently low modern pH val-ues of Guiana Shield waterways.
A biological provenance of hydrogenion concentrations in surface waters of theGuiana Shield is in part facilitated by thequartz-rich lithologies that dominate theregion and boost leachate transport throughtheir relatively high infiltration capacities.High rates of necromass decomposition andmicrobial action in a highly acidic soilmatrix delivers these leachates throughinfiltration and groundwater flow from themany sand-dominated substrates across theshield. These organic leachates are com-posed almost entirely of two carbon poly-mer groups, humic and fulvic acids(Stevenson, 1994) that act to reduce aquaticpH.
BEDLOAD TRANSPORT Most large materialsare too heavy to be transported in suspen-sion and these slide or jump (saltate) alongthe river beds with the current. Globally,bottom transport is estimated at 1.5 × 10⁶
t/year, or around 10% of the total estimatedsediment received by the world’s oceanseach year. Bedload sediments consist ofmaterials with grain sizes typically largerthan 60 µm, ranging from polycrystallinerock fragments (when spherically abraded,forming gravel) and grains (quartz sands) tosimple minerals (such as feldspar, somequartz sands, heavy minerals), but the sizedistribution and material type also criti-cally depend on various other factors, suchas rock provenance, flow rates and pH(Nordin et al., 1983; Irion, 1990; Guyot etal., 1999).
Bedload transport along major riversdraining the Guiana Shield is nominal andconsists almost exclusively of quartz sandsintermixed with varying concentrations ofheavier minerals (e.g. gold placers). Low
148 D.S. Hammond

Biophysical Features of the Guiana Shield 149
0
2
4
6
8
10
20
40
80
16
0
32
0
64
0
10
00
TSS (mg/l)
0
2
4
6
8
4.5 5.0 5.5 6.0 6.5 7.0 7.5 8.0
pH
No
. o
f ri
ve
rs
Brazilian ShieldGuiana ShieldAndesLlanos
0
2
4
6
8
2 4 8 16 32 64 128 200
Conductivity (m S/cm)
0
2
4
6
2 4 8 12 16 20 24 30
Silica (mg/l)
0
2
4
6
2 4 8 12 16 20 24 40
DOC (mg/l)
Fig. 2.34. Ranging of physico-chemical attributes of rivers grouped by region. Data sources: see Notes andmain text for details.
No
. of
rive
rsN
o. o
f ri
vers
No
. of
rive
rsN
o. o
f ri
vers
No
. of
rive
rs

flow velocities combined with dominanceof crystalline basement lithologies and highacidities create conditions that lead toquartz dominance of bedload materials inmost rivers draining the Guiana Shield.Potter (1978) ascribed the predominance ofquartz to trailing edges of tectonic plates(i.e. shield areas) that typically show bed-loads with a quartz:feldspar:rock fragmentratio of 7:1:2. In contrast, along collisionrims of plates (e.g. the Andes) the ratio istypically 3:2:5. Rivers draining the GuianaShield, such as the Rio Negro and Orinoco,show extreme quartz bedload dominancewith average ratios of 9:1:1, some of thehighest in the world (Young, 1976;Franzinelli and Potter, 1983; Franzinelliand Igreja, 2002).
SUSPENDED SEDIMENTS Bedload transportglobally, however, accounts for onlyaround 10% of the terrigenous sedimentestimated to enter the oceans each year. Inthe Amazon mainstem, this figure declinesto less than 2% of total sediment load(1–2% in Richey et al., 1986 – but sampled1982–84, a very strong EN event). Of fargreater significance is the material exportedin suspension, estimated at 13.5 × 10⁹t eachyear, or 90% of the total global load(Milliman and Meade, 1983). Of this, 85%is believed to consist of minerals (Degens etal., 1990). Minerals with a grain size lessthan 60 µm (fine suspended sediments(FSS)), typically silts and clays, form thelion’s share of suspended matter, althoughmuch larger materials (coarse suspendedsediments (CSS)) can also be transportedin this manner, depending on currentvelocities and material densities (Meade,1985).
Most rivers draining the Guiana Shieldare consistently characterized by some ofthe lowest concentrations of total sus-pended solids (TSS) (collinear to turbidity(NTU)) known for neotropical waterways,averaging between 1 and 20 mg/l (Depetrisand Paolini, 1990; Meade et al., 1990;Weibezahn, 1990; Lointier, 1991; Cressa etal., 1993 and references therein;Haripersad-Makhanlal and Ouboter, 1993;Vargas and Rangel, 1996b). In most
instances, this represents a concentrationrange that is 1–3 orders of magnitude lowerthan averages recorded from rivers withAndean-sourced headwaters (10 to >1000mg/l), though there is some overlap (Gibbs,1967; Milliman and Meade, 1983; Sioli,1984a and references therein; Depetris andPaolini, 1990; McClain et al., 1995, Seylerand Boaventura, 2001) (Fig. 2.34). Thisasymmetry in sediment transport has beenparticularly well-resolved in the case of theOrinoco and its tributaries. Meade et al.(1990) estimate that tributaries draining theGuiana Shield make up no more than 5% ofthe Orinoco mainstem sediment load,despite contributing half of the water that itdischarges, on average, each year. Onlynear the tide-influenced outlets of coastalrivers in the region are TSS concentrationslikely to rise substantially as offshore fluidmuds, upstream tidal flow and coastal agri-cultural run-off combine to hyper-concen-trate suspended sediments along the lowerreaches (e.g. Surinamese rivers (Amatali,1993)).
Several rivers draining the central andeastern interior of the Guiana Shield, suchas the Rio Branco or Rio Parú, are alsoknown to register TSS concentrations ashigh as 100 mg/l. Irion (1984) notes thatthese rivers are actively channellingthrough weathering deposits rich in kaolin-ite. The TSSs exported through these riversconsist entirely of this kaolinite with somequartz, a quality that distinguishes them(and other shield waterways) from Andean-draining rivers carrying similar concentra-tions of suspended sediments (see ‘Clayfractions’, below). The Japuerá drains thewestern shield region and is also character-ized by TSS at the upper end of the GuianaShield range (28–30 mg/l), but receivesmuch of this from its headwaters in theeastern slopes of the Colombian Andes.Based on other limnological attributes(Eden et al., 1982), tributaries of the Japueráexclusively draining the shield region arelikely to have TSS concentrations similar tothose feeding the Negro and TrombetasRivers (5–15 mg/l) (Seyler and Boaventura,2001). The wide distribution of TSS valuesfor rivers sourced in the Andes depicted in
150 D.S. Hammond
Fig. 2.34 reverses this logic. The Sub-Andean Trough acts as a giant sedimenttrap and TSS values upstream of this cir-cum-Amazonian belt are in most instancesdefining the upper limits of TSS for theserivers. For example, at Angosto de Bala(12.3° S) along the upper reaches of theBeni River in Bolivia, Guyot et al. (1993)measured an average TSS concentration of6348 mg/l (!) for March 1988, the seasonalpeak in discharge (see Fig. 2.32), highestdilution, and therefore, annual minimumTSS concentration. Samples taken down-stream of the Sub-Andean Trough charac-terize the lower limits of TSS values,reflecting both the loss of sediment to dep-osition in the trough and subsequent dilu-tion by joining downstream waterwayswith little suspended load. Together, sam-ples taken above and below the trough con-tribute to the wide range of TSS valuesgauged for Andean-sourced waterways.
A number of factors combine to createthe low TSS environment of the GuianaShield. Irion (1990) suggests TSS dependson four main factors: (i) tectonic uplifting(mountains); (ii) climate and vegetationcover; (iii) composition of bedrock material;and (iv) age and morphology of surfaces.Meybeck (1994) defines these factors morespecifically as: (i) lithology; (ii) atmos-pheric aerosols; (iii) evapotranspiration;(iv) rainfall; (v) temperature; (vi) contactwith rock; (vii) geomorphologic features;(viii) vegetation; (ix) past geological history;(x) lake retention; and (xi) tectonic and vol-canic controls. Against all of these criteria,the modern state condition of the GuianaShield places it at the lowest end of thepredicted suspended load continuum.Since all rivers with large sediment loadsinvariably originate in mountains(Milliman and Syvitiski, 1994), this limitssuspended solids production in the GuianaShield to the scattered mountain peaks andchains of the Guayana Highland andTumucumaque Upland regions. Thesehighlands, however, do not typically reachelevations extending above the tree-line,limiting the area of rock and soil readilyexposed to erosive forces in the absence ofsignificant biological activity, a major con-
tributor to dissolution rates (Eckhardt,1985). Relatively high primary productionacross most of the shield’s elevational gra-dient attests to the fact that virtually all ofthe landscape remains within a high tem-perature and rainfall envelope, except forthe highest summits of the tepuis and peaksthat form the Guayana Highlands.
Where highland formations are suscep-tible to physical weathering, they almostalways show high silicate composition (e.g.Uatuma metavolcanics (Gibbs and Barron,1993); Tumuc Humac inselbergs (Grimaldiand Riéra, 2001)) and/or, where they resideatop basic parent rock (e.g. AvanaveroSuite), have surfaces protected by highlyresistant lateritic duricrust formed fromiron oxides, arguably the most stable miner-als on the planet (Press and Siever, 1982).Both lithologies hinder physical weatheringrates, even under tropical conditions, con-tributing to low TSS in the surface watersdraining the Guiana Shield. Finally, the ageof most geological formations in the shieldand the virtual absence of significant newrock creation over the last 70+ million years(Cenozoic) has led to the selective extinc-tion of highly weatherable lithologiesacross the region. Only the least weather-able crystalline basement formations andtheir unlithified sedimentary productsremain, along with the last remnants of aonce thick, Precambrian cover of mixedquartzic and arkosic sandstones, conglom-erates and shales (Gibbs and Barron, 1993)that boost TSS in rivers draining parts ofthe Guayana Highlands, such as the Irengand Cotingo tributaries of the Rio Branco(D. Hammond, personal observation).Isolated exposure of calcrete formationsalong the Takutu River in the southRupununi, Guyana/Roraima, Brazil(Berrangé, 1977) also increase TSS contri-butions from this tributary.
CLAY FRACTIONS Most of the fine particu-lates that make up TSS in rivers are clay min-erals. In the neotropics, most clay sedimentsin rivers can be classified as illite, smectite(montmorillonite), chlorite, kaolinite or gibb-site, but their relative contributions to TSSvary considerably between regions.
Biophysical Features of the Guiana Shield 151

Illite (hydrous mica, clay mica)accounts on average for 45–60% of TSSclay fractions globally, making it the mostcommon suspended clay mineral (Irion,1990). It comprises 20–25% of the Amazonand Orinoco River mainstem suspendedclay loads. This reflects both high contribu-tions from Andean headwater tributaries(e.g. ~60% in Rio Beni, Bolivia (Guyot et al.,1993)) and very low or no contributionsfrom rivers draining shield areas (e.g. <1%in Rio Negro (Irion, 1984)). Illite is a weath-ering product of mountain granites, gneissesand slates (effectively cemented and com-pressed illites) and these surfaces are poorlyrepresented in the Guiana Shield. X-raycrystallographic analyses of a wide range ofshield soils show only traces of this mineral(see ‘Soils and Soil Fertility’, above).
Smectite (montmorillonite, bentonite)is the second most common component ofriver clay sediments globally, averaging30–40% of suspended content (Irion, 1990).This group typifies western Amazonianrivers draining the Peruvian andEcuadorian Andes, where it can account formore than three-quarters of the total clayfraction (e.g. >80% of Purús and JurúaRivers). The TSS clay mineralogy of theBeni, a major tributary of the Madeira, hasalso shown very low (4%) smectite contentsduring dry periods (Guyot et al., 1993). Ittypically accounts, however, for 40–50% ofthe Amazon’s clay load, but forms only avery small part of the (already low) sus-pended clays in the Orinoco (<10%), Negro(<1%) and other shield-draining rivers.Smectite originates from Tertiary (25–70Ma BP), fine-grained sediments that coverlarge areas of the Sub-Andean Trough butare far less common in the sedimentarydepressions of the shield (see ‘Shieldmacro-features’, above). Most sedimentsinhabiting the depressions are coarse-grained, quartzic materials (Gibbs andBarron, 1993) and this is reflected in thelow smectite contributions to the TSSclay fraction discharged by rivers drainingthese sedimentary basins.
Chlorite typically makes up 15–25% ofthe global TSS clay fraction in rivers. Onaverage, 20% of the Amazon clay fraction is
chlorite, with some large tributaries drain-ing the northwestern Andes (e.g. Huallaga,Napo) registering upwards of 50% content.Southern Amazon rivers (e.g. Madeira,Beni) linked to the Bolivian Andes registerchlorite contents (~20%) more consistentwith the Amazon mainstem (Martinelli etal., 1989; Guyot et al., 1993). In contrast,sampling of the Orinoco and Negro TSSload has yielded only trace quantities ofchlorite in the clay fraction (Irion, 1984).Like illite, chlorite is a typical weatheringproduct of alpine bedrock and opportuni-ties for its production are far less commonin the shield region in comparison with thewestern rim of Amazonia.
Kaolinite is a relatively scarce compo-nent of river TSS clay mineralogy at aglobal scale (<10% of average content), butunderpins a fundamental contrast in thespatial occurrence of clay sedimentsthroughout the river systems of the lowlandneotropics. Unlike other minerals, kaoliniteis dominant within the TSS clay fraction ofrivers draining eastern shield regions. Itaccounts for >90% of the clay suspended intransport along the Rio Negro (Irion, 1984)and upwards of 40% of the Orinoco’s claycontent, but a much smaller fraction in theAmazon (~14%) and its western tributaries(e.g. Beni, ~13% (c.v. 0.39) (Guyot et al.,1993)). In general, kaolinite dominance ofthe clay fraction occurs downstream alongthe highest stream orders in the Amazon(Seyler and Boaventura, 2001). Kaolinite isthe (near) final chemical weathering prod-uct of silica-rich parent rock and also dom-inates the soil clay fraction across theGuiana Shield (see ‘Soils and Soil Fertility’,above) (e.g. Schulz, 1960; van Kekem et al.,1996; Duivenvoorden and Lips, 1995;Franco and Dezzeo, 1994). This dominancedeclines in soils of the Central Americantropical forestlands (e.g. Barro ColoradoIsland (Leigh, 1999, pp. 67–78)) andWestern Amazonia, where smectites (mont-morillonites) become more common.
SIGNIFICANCE OF GEOGRAPHIC VARIATION IN TSS
CLAY FRACTION Clay minerals are formedas layered sheets of silica and aluminaenclosed by oxygen or hydroxyl tetrahe-
152 D.S. Hammond
drons. More importantly, the range of claysfound in river suspended sediments andtropical forest soils exhibits different bond-ing properties that produce different affini-ties for both major and minor cations thatare important for plant growth and deter-mine standing levels of soil fertility. Stronghydrogen bonding between the silica andalumina sheets forming kaolinite limit theavailability of negative charge sites. As aconsequence, fewer cation-bearing watermolecules are adsorbed. This creates a claymatrix that has limited hydration capacityand very low cation activity. Bondingbetween layers forming the crystallinestructure of illite clays occurs as the forma-tion of its base unit, a 2:1 complex of silicaand alumina sheets, creates a net negativecharge that is balanced by attracting potas-sium (or other) cations. These interlayerbonds are not as strong as the hydrogenbonds of kaolinite, and illite is capable ofexchanging cations more readily, increasingfertility. Clays of the smectite group exhibita 2:1 silicate layering similar to illite, butwithout silicon replacement by aluminium.Silica sheets stacks are thin and ephemeral,maintained only by very weak van derWaals’ forces. Stacks disassociate easily aswater and exchangeable ions attach freelyto the negative charge sites between sheets.As a consequence, smectites generally haveexcellent hydration properties and supportgood cationic activity, both features thatgive soils with appreciable montmorillonitecontent a higher fertility in the tropics. Theregional variation in abundance of FAO soiltypes with relatively higher CEC–pH/lowerAl–Fe saturation (e.g. Vertisols, Ali-Acrisols, Lixi-Luvisols, transitionalNitisols) favours western Amazonia,Central America and to a lesser extent, theAmazon Downwarp (see Fig. 2.14).
Rivers draining the Guiana Shieldcarry a very small suspended sediment loadcontaining a clay fraction dominated bykaolinite. This indicates that they play aninsignificant role in the redistribution andreplenishment of mineral nutrients fromheadwaters to lowlands, despite very sub-stantial specific discharge rates. The trans-fer role of rivers headwatered in the Andes
would seem altogether greater.Substantially greater TSS loads dominatedby relatively more active smectite and illitegroups are transferred from Tertiary sedi-ments and highland bedrocks to the sedi-mentary plains of the Sub-Andean Trough,where most larger, non-clay minerals sus-pended in the discharge are deposited(Irion, 1984; Linna, 1993; Guyot et al.,1999). Thus, western lowland Amazoniaand the Amazon Downwarp are in receiptof an eternal external influx of exchange-able cations originating from an effectivelylimitless erosion surface. The subsequentinsurgence of mainstem waters into thefloodplain and ‘spiralling’ (after Richey etal., 1990) lateral exchange of materialsbetween these promotes deposition andlong-term storage of Andean-derived clayfractions across the Sub-Andean andAmazon lowland floodplains (Meade et al.,1985). Only substantial changes in climate(see ‘Prehistoric climates of the GuianaShield’, above) would appear capable ofmodulating this transfer process and alter-ing the balance between the modern inef-fectiveness of river transport as a mode ofnutrient redistribution across the GuianaShield and the highly effective transferfunction of rivers coursing the elevationalgradient of the eastern Andean piedmont.
PARTICULATE CARBON Not all suspendedmatter in rivers originates from rock andsediment weathering. Approximately 2.25 ×10⁹ t, or 15%, of the global sediment fluxfrom rivers to oceans is believed to consistof organic matter (Degens et al., 1990).Particulate carbon transported by rivers istypically classified as organic (POC) or inor-ganic (PIC). In the Amazon Basin, POC typ-ically accounts on average for less than 2%of the TSS being delivered to the lowermainstem Amazon (Richey et al., 1990;McClain et al., 1995; Table 16.3 in Seylerand Boaventura, 2001). Rivers drainingAndean carbonate rock formations canshow high PIC concentrations at upper ele-vations. These dissolve rapidly withdescent into warm, relatively acidic low-land reaches and PIC is practically absentfrom (neo)tropical river systems. For many
Biophysical Features of the Guiana Shield 153

rivers draining the Guiana Shield, themovement of POC as fine and coarse frac-tions of leaves, wood and other detrital mat-ter can account on average for a muchgreater part of TSS (lower Caura: 30%(García, 1996); upper Rio Negro: 15–19%;Trombetas: 5%; Branco: 6% (Seyler andBoaventura, 2001); Orinoco: ~2–6%(Depetris and Paolini, 1990)). It is impor-tant to emphasize, however, that thesehigher contributions reflect on the very lowconcentrations of minerals, rather thanunusually high POC, in Guiana Shieldrivers (Meybeck, 1982; Fig. 15.14 in Devoland Hedges, 2001). Overall, POC appears tovary over the same magnitude in riversdraining both shield and downwarpedlandscapes, suggesting that coarse, large-scale geological features inadequatelyexplain variation that may be betterascribed to smaller scale source (e.g. vegeta-tion type and distribution, topography) andtransport (flooding, impoundment) effects.
The flow of particulate carbon fromland to ocean via rivers can serve an impor-tant storage function with the global carboncycle. Contributions to both freshwater andestuarine biological productivity as well asstorage in sea-shelf sediments representnon-trivial storage compartments. DeMasterand Aller (2001) estimate that 86% of thePOC discharged at the Amazon mouth trav-els directly to the seabed and 31% ulti-mately remains buried, accounting for 70%of the total POC deposited in the Amazonshelf sediments (30% is of marine origin).Nearly 10% of the Amazon POC dischargeis transported northwestward along theGuiana coastline to form a significant partof these shelf deposits.
DISSOLVED SEDIMENTS While the Pre-cambrian age of the shield has largelyexhausted modern suspended sedimentproduction capacity, a long history ofhighly acidic conditions has catalysedchemical weathering of land materials andtheir movement as dissolved sediments.Dissolved sediments are typically groupedas: (i) cations and elements (major, traceand total (TZ+)); (ii) silica (DSi); and (iii)organic (DOC) and inorganic (DIC) carbon.
CATION CONCENTRATIONS The concentrationof major cations is the product of pH-dependent leaching and dissolutionprocesses combined with the prevalence ofclay types with varying cation carryingcapacities (see above). Cation load dependson many of the same factors that determinethe rate of suspended sediment accumula-tion in river mainstems and TZ+ can varywidely between adjacent waterways drain-ing small catchments with differing litholo-gies in the Andes (McClain et al., 1995;Sobieraj et al., 2002). Their concentration atany given time, like TSS, is also a function ofdilution and therefore related to the seasonalvariation in discharge rate (Meade, 1985).
The more active weathering associatedwith the Andes produces significantlyhigher average TZ+ values in rivers draininginto the western Amazonian lowlands com-pared to shield-draining waterways (Gibbs,1967; Stallard and Edmond, 1983; Cressa etal., 1993). Generally speaking, the latterrarely achieve average TZ+ values greaterthan 200 µeq/l (Group 1 rivers after Stallardand Edmond (1983)). In a comparison of 50major world rivers (watershed area >105
km2), the TZ+ value of Rio Negro waterswas the lowest, by an order of magnitude(Meybeck, 1979). Cation sums for shield-draining rivers in the Guiana Basin exhibitsimilarly low concentrations (Cressa et al.,1993; e.g. Maroni, in Négrel andLachassagne, 2000; e.g. Caura, Caroni,Orinoco, in Colonnello, 2001). Anotherproximate measure of cation availability,the conductivity of water, shows a similartrend in relation to geographic origin ofheadwaters (Fig. 2.34). Conductivity valuesfor shield-draining rivers generally rangeup to 64 µS/cm and Andean tributariesnearly three times this maximum (Fig.2.34). Many rivers draining tropical forestsin Panama and Costa Rica also show excep-tionally high conductivity (e.g. 53–480µS/cm in La Selva, CR; Sanford Jr et al.,1994). Values for shield and sub-Andeanregions, however, typically overlap, giventheir sensitivity to changes in discharge,dissolution and deposition rates affected byvarying rainfall, temperature, pH and eleva-tion.
154 D.S. Hammond

DISSOLVED SILICATES (SILICIC ACID) Silica dis-charged from rivers constitutes more than80±20% of the average annual influx tooceans globally, estimated at 169±56 mega-tonnes (Tréguer et al., 1995). Nearly three-quarters of the riverborne material arrivevia tropical waterways (Meybeck, 1994)and rivers draining northeastern SouthAmerica are believed to account for around20%, or 27.4 megatonnes (based on aboveestimate) of the global silica discharge tooceans each year. The Orinoco dischargeprobably accounts for approximately10–15% of this amount (based on 1983–84data from Paolini et al. (1987)) of which50% (approx. 1.4 megatonnes) is thought tobe sourced from the Guiana Shield(Edmond et al., 1996). Rivers draining theGuianas probably contribute between 1 and3 megatonnes (Lointier, 1991, 1993), butgood data on dissolved silica fluxes arelargely absent for most rivers drainingGuyana and Suriname.
The super-abundance of silica-richcrystalline rocks in the shield limits overallweathering rates compared to other regionswith more diverse, and recent, lithologies.But average concentrations of dissolved sil-icates (in the form of silicic acid, H4SiO4) inrivers draining the Guiana Shield appearcomparable to other lowland rivers drain-ing the Colombian and Venezuelan llanosand less than or equal to those originatingin the Andes based on information avail-able (Stallard and Edmond, 1983; Cressa etal., 1993; Sobieraj et al., 2002) (Fig. 2.34).Seasonal variations in dissolved silica, likeTSS and TZ+, show a negative correlation(or positive lag) with discharge rate (e.g.Lointier, 1993) and unbalanced samplingacross the neotropics may belie regionaluniformity given the latitudinal gradient inpeak discharge (Figs 2.31, 2.32) andimpacts of ENSO (Fig. 2.33). Silica dissolu-tion far outstrips the chemical weatheringof other cations in the Guiana Shield, how-ever. This is reflected in its position as themajor constituent of total dissolved solidstransported in rivers draining the region(Edmond et al., 1995). It forms a relativelyminor component of the TDS concentrationmeasured along rivers originating in the
Andes, but principally due to the very highcationic, rather than excessively low silica,concentrations (Cressa et al., 1993; Edmondet al., 1996).
The absence of significant carbonate,modern volcanic or evaporite formations inthe shield limits neutralization of highacidity through action with minerals in par-ent rock (Fölster, 1985). This creates opti-mal soil pH conditions for crystalline rockweathering and silica dissolution in thepresence of an erosional surface dominatedby this mineral. In the Andes, reduced bio-logical activity and temperature combinewith contributions from carbonate depositsto maintain higher pH levels (Fig. 2.34) andreduce dissolution potential of silica.Instead, physical erosion of the extensivesurface bedrock exposed in the highlandscombines to drive silica movement intorivers mainly as part of the suspended andbed loads, with chemical dissolution occur-ring downstream. This balance is reflectedin the much higher silicate weathering ratesassessed for the Andes in relation to low-land Amazonia. These higher rates supporta decrease in soil profile thicknesses in theAndes, Sub-Andean Trough and AmazonDownwarp while soil profiles are deepen-ing across the Guiana Shield (Mortatti andProbst, 2003).
Dissolved silica exported throughrivers is thought to play an important rolein marine biological uptake and storage ofcarbon dioxide (Wollast and Mackenzie,1983). Silica is an essential base constituentin siliceous diatom and radiolarian devel-opment, both major contributors to offshoreprimary production along cold and warmwater coastal margins, respectively(Milliman and Boyle, 1975). Silica recy-cling within the phytoplankton communityis often minimal (DeMaster and Aller, 2001)and opal silicates released as zooplanktonicpellets are exported to coastal and abyssalfloor deposits and/or re-enter solution andare re-exported to the surface via deepwater upwelling currents. Changes in theamount of silica delivered to coastaloceanic waters via rivers can profoundlyinfluence the balance of phytoplanktonicproduction (Egge and Aksnes, 1992; Turner
Biophysical Features of the Guiana Shield 155
et al., 1998, and references therein), partic-ularly where cold water upwelling influ-ences are relatively weak in comparison tofreshwater discharges, as is the case alongthe western rims of the tropical Atlanticand Pacific basins (e.g. Amazon shelf(DeMaster and Aller, 2001)). Water reser-voirs and impoundments that efficientlytrap silicates can have a particularly pro-nounced impact on river delivery rates(Milliman, 1997), and thus coastal produc-tivity in these regions.
DISSOLVED CARBON The carbon loads ofmost (Table 16.3 in Seyler and Boaventura,2001), but not all (e.g. Rio Beni, Table 7 inGuyot et al., 1993), South American riversare characterized by a very large dissolvedcarbon fraction (e.g. Paolini et al., 1987).Blackwater rivers that typify many water-sheds throughout the Guiana Shield (e.g.Rio Negro, Caroni, Caura, Essequibo,Demerara, Berbice, Nickerie) can exhibithigh dissolved carbon concentrations, butthe range of organic (DOC) fractions for var-ious rivers appears consistent across low-land regions (Fig. 2.34), although the lowestDOC concentrations are found at higher ele-vation river segments draining the Andeanpiedmont (e.g. Fig. 4 in Guyot and Wasson,1994), while POC fractions increase withincreasing TSS concentrations (Meybeck,1982).
Inorganic carbon (DIC) often accountsfor an equally large or larger part of the dis-solved load, mainly in the form bicarbon-ate, carbon dioxide and carbonate, althoughthe latter is exclusive to the higher pH ofwhitewater Andean rivers (Gibbs, 1967;Stallard and Edmond, 1983). The DIC frac-tion in lowland rivers is principally bicar-bonate, but the ratio of bicarbonate tocarbon dioxide can vary along a spatialcline in biological activity from (mainstem)thalweg to floodplain (varzea), and there-fore CO2 production through (microbial)respiration (Devol and Hedges, 2001).Alkalinity (the sum of dissolved weakbases) is effectively a measure of this bicar-bonate concentration. It is sensitive to pHand the relatively acidic waters of mostrivers draining the Guiana Shield and east-
ern Amazonia express relatively low alka-linity values (e.g. Rio Caura (Lewis andSaunders, 1987; García, 1996), Caroni(Paolini, 1986), Sipaliwini, Tapanahoni(Haripersad-Makhanlal and Ouboter, 1993),Negro (Vegas-Vilarrúbia et al., 1987)).Along the Amazon mainstem, DOC and DICtypically increase downstream as DOC-richwaters draining the shield regions combinewith an increase in CO2-producing varzeaand floodplain area to heighten concentra-tions, particularly during the seasonal risetowards peak discharge (Devol and Hedges,2001).
The organic fraction originates fromboth autochthonous and allochthonoussources. The autochthonous pathway cen-tres on photosynthesis, while allochtho-nous carbon arrives through leaching ofplant litter and soil organic matter. As aconsequence, carbon arriving as leachates(refractory carbon) is typically of muchhigher molecular weight, having alreadybeen substantially broken down throughdecomposition and mineralized prior toarrival. Refractory carbon has typicallyundergone a diagenetic phase, combiningwith clay and other mineral particles throughan adsorption process prior to arrival in thesurface water system. In contrast, carbon bio-logically fixed in the water column is typi-cally of low molecular weight, rich innitrogen and available for mineralization(labile carbon). This distinction is importantin defining the pathways each fraction takesthrough the carbon cycle as labile carboncontributes significantly to biological pro-ductivity, while refractory forms are gener-ally shunted directly into riverine and coastalbottom sediments. Refractory DOC, in partic-ular, forms a significant slow-turning com-partment in the global pool of stored carbon.Analysis of isotopic carbon discrimination inmaterials sampled from the Amazon main-stem suggests that refractory DOC may residein channel sediments as long as a century(but more typically decades) prior to finalcoastal discharge (Richey et al., 1990; Devoland Hedges, 2001).
Dissolved carbon in rivers draining theGuiana Shield is principally organic, ofhigh molecular weight and highly refrac-
156 D.S. Hammond

tory. This reflects upon the diagenetic prop-erties of the soil–DOC interactions. Humicsubstances (fulvic acids, humic acids,humin) produced through decompositionand varying in molecular weight and ioniccharge are filtered through soils varying inclay content (Stevenson, 1994). Soils withlittle clay, such as Podzols or Arenosols, areheavily infiltrated and probably releaseboth fulvic and humic acid forms of DOC.Humic acids tend to dominate the soil solu-tion in these soil types underlying coastalsavanna in French Guiana, although30–50% remain immobile (Turenne, 1974).Forested ferrasolic soils with a higher clayfraction are more likely to immobilize solu-ble organic substances with an activecharge through clay particle adsorptionwithin the soil matrix, leaving refractoryforms with neutral or negative charging(fulvic acids) to pass more quickly into thelocal streams. Fulvic acids are generallybelieved to contribute the largest carbonfraction to DOC of blackwater rivers drain-ing the Guiana Shield due to the extensiveforest cover, although humic acid contribu-tions are greater in comparison to otherAmazonian rivers due to the extensivesavanna and podzolic scrubland areasdrained in the Rio Negro, Berbice,Essequibo, Caroni, Orinoco and manysmaller watersheds (Ertel et al., 1986, citedin Richey et al., 1990; Vegas-Vilarrúbia etal., 1988). Thus, DOC carried by theserivers contributes little to in-channel andoffshore productivity (e.g. bacteria (Farjallaet al., 2002)). Their highly degraded stateand low biological uptake leaves refractoryDOC to form a substantial carbon storewithin river sediment beds. Organic matterproduced through the turnover of living for-est biomass is substantially degraded priorto leaching and transport into adjacentwaterways.
DOC also readily binds to trace metalsto form metallo-organic complexes throughsurface adsorption, although DOC may con-stitute only part of a river’s complexingcapacity (colloidal and particulate carbonalso providing binding sites) (Degens et al.,1990; Benaïm and Mounier, 1998). DOC’scomplexing capacity allows it to act as a
transport vehicle for heavy metals, includ-ing mercury, arsenic and other materialsgenerally capable of reaching toxic concen-trations through bio-accumulation alongthe natural food chain as benthic feedersingest carbon-complexed metals.Alternatively, they may be discharged intothe oceans and assimilated into the coastalmarine ecosystem.
Seasonally inundated floodplains
The seasonal or inter-annual inundation ofriverine floodplains is a massive event thataffects large areas of the AmazonDownwarp (Junk, 1993) and to a lesserextent, sedimentary depressions in theGuiana Shield (Fig. 2.35). The most signifi-cant of these is believed to account for, onaverage, nearly 3500 km2 of theRupununi/Rio Branco savannas, based onanalysis of satellite-borne, radar reflectancesignatures (Hamilton et al., 2002). Othersignificant areas of floodplain forest in theregion include the Casiquiare Rift–RioVentauri valleys of Venezuelan Amazonas(see Fig. 2.9A and Fig. 2.35, No. 4), theTakutu Rift extension across the Essequiboand upper Berbice Rivers in central Guyana(see Fig. 2.9B and Fig. 2.35, No. 3) and themiddle Rio Negro (Fig. 2.35, No. 5).
While most floodplain centres acrossthe Guiana Shield are inundated on a regu-lar basis, the extent of inundation can varyby a factor of 4 or more in some locations(e.g. Rupununi maximum:average areaflooded annually – 4.75) and generallymore than other centres receiving surfacewater from the Andes (Apure-Meta – 3.1,Beni-Mamoré – 3.1, upper Amazon – 2.1)(Sippel et al., 1998; Hamilton et al., 2002).Given the relatively greater impact of ENSOevents on rainfall and river discharge ratevariation across the Guiana Shield, a highervariability in seasonal floodplain inunda-tion is predictable.
Seasonally inundated floodplains inthe tropics are considered importantsources of methane, a potent greenhousegas (Bartlett and Harris, 1993). Variation inthe extent and duration of seasonal inunda-tion can affect the rate of methane emission,
Biophysical Features of the Guiana Shield 157

158 D.S. Hammond
along with other factors. For example, anequivalent area of inundated forest alongthe Orinoco is believed to generate signifi-cantly less methane than along the Amazondue to differences in the duration anddepth of coverage (Smith et al., 2000).ENSO events are likely to reduce inundatedareas along river systems. Without a buffer-ing connection to the Andes, the contribu-tion of these areas to total neotropical
methane emissions is likely to be consider-ably less than western or centralAmazonian flooded forests (e.g. Pastaza-Maranon) that are less responsive to chang-ing ENSO phases, all else being equal.
Reservoirs
Permanently standing, or lentic, water bod-ies constitute a relatively minor fraction of
Fig. 2.35. General location of major inundated floodplains (numbers) and reservoirs (letters) across theGuiana Shield and adjacent regions of lowland Amazonia. Based on radar reflectance signatures(resolution=0.5 km) acquired by the JERS-1 satellite from February to July, 1996 (Chapman et al., 2001).Only areas of flooded forest or open water are identified. Significant savanna areas (Rupununi, Sipaliwini)are also known to flood, but reflectances generated by water, grassland and other flat surfaces are notseparable at the wavelength utilized by the JERS-1 SAR radiometer. Also note that sequential acquisitionby the satellite spanned February–June along longitudinal swathes and all parts of the mosaic are notconcordant with the latitudinal lag in peak discharge as presented in Fig. 2.32. Key: (1) Orinoco andcoastal Guianan tidal swamps, (2) Amazon-Amapá tidal swamps, (3) Takutu Rift, (4) Casiquiare Rift, (5)Rio Negro, (6) Apuré-Meta, (7) Solimões mainstem, (8) Beni-Mamoré, (9) Pastaza-Marañón. Reservoirs: (A)Guri, (B) Brokopondo, (C) Petit Saut, (D) Balbina.
the surface water area in the Guiana Shield,unlike lowland areas in the AmazonDownwarp and Sub-Andean Trough, whereshallow tropical lakes are commonplace asa consequence of high-energy, fluvialdynamics (Sioli, 1984a; Räsänen et al.,1987; Melack and Forsberg, 2001). Instead,many rivers draining the Guiana Shieldconsist of anastamosing channels createdthrough constrained downstream transportof their quartz bedloads. In the case of theRio Negro, the pattern of their migrationacross the mainstem can form a patchworkof sedimentary atolls each linked to faster-moving sub-channel waters through inletsand outlets that alter their water levels inline with changing river stage height (e.g.Goulding et al., 1988, pp. 22–23). Long-standing inlets formed around geomorpho-logical structures are also prevalent alongmany waterways of the region, but isolated,perennial lowland lakes are infrequent.
The largest and most significant bodiesof year-around standing water are man-made. Large areas of former forest area havebeen permanently inundated to form reser-voirs (embalses) along the lower reaches ofseveral shield rivers. All reservoirs in theregion have been developed for hydro-elec-tric power generation and four of theseaccount for the majority of area inundatedand power produced (Fig. 2.35). These fourinclude Guri Lake along the Caroni(Venezuela), Brokopondo Lake along theSuriname (Suriname), Petit Saut along theSinnamary (French Guiana) and Cachoeirada Porteia along the Trombetas (Pará,Brazil) (Fig. 2.35). Combined, they cover anarea of 6818 km2 and have a combinedhydro-electric generating capacity of 11,576MW, although Guri, the second largesthydro-electric operation in South America,alone accounts for 86% of total power pro-duction.
Apart from the tremendous socialissues attached to the creation of artificiallakes, the impoundment and regulation ofnatural river flow can have considerableeffects on downstream hydrological andlimnological conditions (WCD, 2000).Reservoirs can also become potent netgreenhouse gas sources as DOC and POC is
deposited and submerged forest remnantsdecompose under anoxic conditions, par-ticularly when terra firme, rather than exist-ing floodplain forests, are affected (e.g.Balbina, Tucurui dams, Brazil (Fearnside,1995, 1997)). The initial pulse of methaneand carbon dioxide emissions can be quitesignificant as original forest vegetationbegins to decay (e.g. Petit Saut, FG (Galy-Lacaux et al., 1997)). Impoundment of par-ticulate and dissolved solids not only limitsthe functional economic life of reservoirs,but can lead to significant impacts at thecoastal marine and estuarine interface.Restricted, modulated discharge that char-acterizes reservoir outflow extinguishesseasonal stage height fluctuations, con-stricts the size of the coastal freshwaterplume and effectively eliminates the flow ofdissolved solids (Colonnello, 2001), partic-ularly silica, that play an important func-tional role in maintaining coastal water(phytoplankton) productivity and diversity(Turner et al., 1998; DeMaster and Aller,2001). Tidal saline wedges also penetratefurther upstream as freshwater outflowsdiminish after dam construction, leading tochanges in coastal vegetation (Colonnelloand Medina, 1998; Echezuria et al., 2002).
Coastal processes
ESTUARIES AND MUD-FLATS The northerncoastline of the Guiana Shield is dominatedby a series of prograding and degrading sec-tions shaped by the influx, movement anddeposition of clays and silts along theGuiana Shelf (that part of the SouthAmerican craton current below sea-level).The movement of sediments dischargedfrom the Amazon along the northwest-flow-ing Guiana Current accounts for the over-whelming majority of inputs and, as aconsequence, control of Guianan coastlinechanges. Of the 11–13 × 108 t of sedimentestimated to leave the Amazon, on average,each year (Meade et al., 1985), between19% and 23% is thought to flow northwest-ward along the Guianan coast as suspendedsediment and fluid muds (Wells andColeman, 1981; Froidefond et al., 1988;Muller-Karger et al., 1988). These consist
Biophysical Features of the Guiana Shield 159

mainly of clays (Pujos et al., 1989), similarin mineralogical composition to thosefound in the suspended sediment loads ofwestern Amazonia and the Guiana Shield(see ‘Clay fractions’, above) (Parra andPujos, 1998).
Fluid mud banks are large: 50–60 kmlong, 10–20 km wide and up to 5 m deep(Prost, 1987; Froidefond et al., 1988). Theyare estimated to migrate northwestwardalong the French Guianan coastline at anaverage rate of 900 m/year, 1500 m/yearalong the Suriname coast and 1300 m/yearoff the Guyana coastline (Prost andLointier, 1987). Rates vary in relation tolocal shoreline orientation relative to sea-sonal variation in wind stress, the mainagent moving fluid mud banks along thecoastline. Wind stress favouring northwest-ward movement along the coast is highestfrom June to October, when the ITCZ ismoving northward, and thus southeasterlytrade winds prevail across the shield lati-tudes. Slightly less fluid components ofthese mud banks, or ‘slingmud’, are activedepositional sites that dampen wave actionand grow land when they become attachedto more solid foreshore extensions(Augustinus, 1980). Wave action is focusedbetween the shifting mud banks, erodingthe shoreline and creating a moving chainof alternating accretion and erosion zones.
Modern-day materials flowing north-westward along the coastline of the Guianasare almost entirely of Andean origin(Debrabant et al., 1997; McDaniel et al.,1997; DeMaster and Aller, 2001). In thepast, putative dry periods (glacial maxima)and relatively low sea-level stages extendedthe terrestrial boundary seaward towardsthe edge of the craton. As a consequence,the supply of terrigenous sediments arriv-ing from the Amazon is believed to havebeen mostly deposited in the deeperabyssal waters (north)eastward of themarine shelf with extinction of the long-shore transport load. With nominal sedi-ment being delivered to thepalaeo-foreshore of the Guiana coastlinefrom Amazonian sources, coastal waterswould have been free of the modern-dayfluid muds and high concentrations of sus-
pended sediments. The remains of a barrierreef and presence of quartzic sands derivedfrom shield-draining waterways (Pujos andOdin, 1986) attest to clear, productivecoastal water conditions during the LGMthat were more similar to present-day con-ditions in the south Caribbean Sea. Deliveryof sediment from shield-draining rivers cur-rently accounts for only a very small frac-tion of the coastal foreshore sediments(Parra and Pujos, 1998).
An overwhelming Andean provenanceof sediment discharged at the mouth of theAmazon and the significant deflectionnorthwestward of river discharge by theNorth Brazil/Guiana Current establishes anamazing linkage between land accretionalong the Guiana Shield’s eastern perimeterand physical weathering of the Andes.Combined with eustatic sea-level changesassociated with glacial–interglacial periods,changes in the conditions affecting Andeanerosion, lowland Amazonian transport andcoastal wind-driven advection have gov-erned change in shield coastline evolutionand marine biogeochemical featuresthroughout the Quaternary (Prost, 1987;Prost and Lointier; 1987, Pujos et al., 1990).
Sea-level change
One of the most significant and obviousprocesses that has affected shield hydrol-ogy and surface area is sea-level change.Given the relative tectonic quiescence ofthe shield since the end of the Proterozoic(550 Ma BP) and absence of glacial ice, thecumulative impacts of a changing sea:landsurface area in the region largely recordadjustments to global seawater displace-ment and volume generated by events else-where, although localized subsidence (e.g.Berbice Basin) and uplifting continued toaffect this balance (Gibbs and Barron,1993). Thus, the range of sea-level changeaffecting the lowland shield region hasbeen passively constrained by its geologicalstability and equatorial location. The highlyweathered topography would have made ita significant contributor to global land lossduring Mesozoic sea-level highstands. Butrapid extinction of the crystalline basement
160 D.S. Hammond
along the edge of the relatively narrowGuiana Shelf would have limited the plau-sible extension of land eastward duringmore recent Quaternary low stands.
The fluctuating change in the shieldperimeter due to sea-level changes wouldhave altered more than the shift in terres-trial land area. Both hydrology and regionalclimate, and thus forest cover and composi-tion, of modern coastal and interior regionswould have been profoundly affected as theshape and area of maritime influence (e.g.moisture, cation transport, wind stress)over terrestrial systems was modified (see‘Land-borne components’, above).Adjusting erosion bevels would have sup-ported alternating deposition and erosionof sediments and the consequent formationof environmentally and economicallyimportant deposits, such as peat (pegasse),white sands (quartzipsamments) and baux-ite (Gibbs and Barron, 1993).
TIMELINE OF SEA-LEVEL CHANGE The geologi-cal, palaeo-oceanographic and marinepalaeontological records are the mostprominent indicators of past sea-levelchange. Geological approaches have beenused extensively in the Guiana Shield(Gibbs and Barron, 1993), in the AmazonDownwarp (Irion, 1984), along the Orinoco,Guiana and Amazon Shelfs (Flood et al.,1997; Shackleton et al., 1997; ODP, 2003)and the Caribbean Sea (e.g. Jackson et al.,1996; Leckie et al., 2000), in part reflectingthe important role that Phanerozoic sedi-mentary processes have had in concentrat-ing economically important hydrocarbon,bauxite and carbonate (lime) deposits andin part a need to better understand the evo-lution of land–ocean dynamics in theregion and its role in and response to globalclimate change.
Given the putative Cretaceous age ofangiosperm lineages and break-up ofGondwana, the record of sea-level adjust-ments since the Cenomanian is of greatestdirect relevance to modern forest evolutionand development in the Guiana Shield.Sea-level is generally believed to haveaffected the peripheral areas of the shieldregion as a series of transgression and
regression phases over the period followingsea intrusion between the separating SouthAmerican and African cratons, 100 Ma BP
(Pitman et al., 1993). The discrimination ofthese phases is based on proximate indica-tors of changing sea-level, such as terres-trial deposits of marine sediments, marinedeposits of deltaic and lacustrine sedi-ments, submerged and uplifted palaeo-reefsand mangrove sediments, weathering geo-morphology and marine–terrestrial chemi-cal signatures.
CRETACEOUS–PALAEOGENE The early Ceno-zoic witnessed a period of intense tectonicactivity that shaped much of the modern-day neotropical realm. The Guiana Shieldwas in a unique transitional position duringthis period. Geological evidence indicatesthat it accounted for most of the terrestrialenvironment of northern South America,but had already divided from its counter-part region of modern-day West Africa andbegun to develop an eastern shoreline envi-ronment. Stress fracturing and doleritedyke emplacement across the region werecommonplace as a result of mid-Atlanticrift formation (Choudhuri and Milner,1971). Importantly, neither the western oro-genic belts nor formation and eastwardmovement of the Caribbean Plate had initi-ated (Coates and Obando, 1996). Yet,palaeopalynological records indicate thatthe angiospermous flora was already rap-idly developing and by the end of thePalaeogene, 24 Ma BP, many of the plantfamilies that typify the modern forests ofthe region were well in place (Romero,1993).23 While virtually all of the modern-day petrographic features of the GuianaShield were already in place, Atlantic sea-floor spreading, the formation and migra-tion of the Caribbean Plate, and subsequenttectonic uplift of the western and northernAndes over the last 100 million years, led totremendous reworking of the SouthAmerican coastline and surroundingAtlantic Basin. Subsidence and upliftingprocesses altered land–ocean relationshipsand regional compensatory changes in ero-sion bevels created a complex landscapethat was not uniformly affected by climate-
Biophysical Features of the Guiana Shield 161
driven changes in sea-level. Glacial ice wasapparently absent or insignificant in theMesozoic world and average sea-level wasconsiderably higher than today (Prenticeand Matthews, 1988). As a consequence,the record of early Palaeogene sea-levelchange in relation to the shield area isoccluded by subsequent tectonic eventsshaping the Andes, Central America andthe Caribbean and the prior absence of gla-cial ice-driven processes. What evidenceexists is closely tied to sedimentary-typeclassification along the shield margins (see‘Prominent geological regions’, above) andis principally qualitative in nature (trans-gressive vs. regressive).
The production of a preciseCretaceous–Palaeogene sea-level curve forthe Atlantic margin of the Guiana Shield ismisled by the interaction between changingsea-levels due to external forcing and thesubstantial tectonic activity altering adja-cent neotropical regions. This activitywould have degraded, diachronously reor-ganized, or even ablated sedimentary layersrecording sea-level high and low stands inthe region. Instead, we have to rely on moreprecise characterizations of sea-levelchange from other, often extra-tropical,regions and assume that maximum highand low stand signatures dominate sea-level change around the Guiana Shield.
The available evidence, from both fieldsample analysis and theoretical assess-ments, shows surprising concordance inlinking shield coastline to sea-levelchanges, albeit without the spatial or tem-poral precision attempted for Holoceneestimates (see below). Expressed relative tomodern sea level, the emerging coastline ofthe Guiana Shield is postulated to haveexperienced a significant transgression dur-ing the late-Cretaceous (Cenomanian–Turonian), classified as the CanjeFormation (Naparima Hill Formation –Trinidad; La Luna Formation – Venezuela).The timing of this sedimentary formationcorrelates very well with a peak in produc-tion of glauconies, a common group of iron-rich, green clays precipitated directly on tomarine bottom sediments from seawater,
and favoured by deep water conditions thattypify transgressive sea-level phases (Fig. 1in Smith et al., 1998). Vail et al. (1977) pro-posed a high stand phase of +350 m abovemodern sea-level based on coastal aggrada-tion profiles two million years later duringthe Campanian that coincides with theputative age of the New AmsterdamFormation, although this technique carriessignificant source errors (e.g. see Christie-Black et al., 1990).
The early Eocene benthic δ18O recordindicates that the planet was the warmest ithad ever been (Zachos et al., 1994; Bains etal., 1999). This warming phase would havebeen associated with a lagging sea-levelhigh stand of substantial magnitude.Another large increase in glaucony produc-tion during the late Eocene supports theview of a large transgressive phase directlyfollowing the Eocene Thermal Maximum. Achronology of successive transgression–regression phases affecting the eastern rimof a Palaeogene shield is consistent withpalaeosolic sequences along the southernrim in northeastern Pará, Brazil belongingto the Piraruçu and Solimões formations(de Fátima Rossetti, 2001) and those consti-tuting the Courentyne Group in Suriname(Krook, 1979). The Cretaceous–Palaeogenewas characterized by a relatively young andisolated proto-Atlantic that increasinglybecame connected with much older basinsas tectonic activity pulled the newly sepa-rated continents towards their present-daylocations. The sedimentary record of sea-level change during this period is relativelyscant (Rull, 1999), but available evidencesuggests that direct impacts upon a tropicalflora already in existence upon the GuianaShield would have been substantial along arim not yet loaded with the type and depthof sediment seen today. Uplifting events,such as that affecting the Guiana coast atthe end of the Eocene (Gibbs and Barron,1993), however, may have effectively atten-uated the extent of sea ingress during theseperiods. The sedimentary record of theRupununi end of the Takutu Graben regiondoes not reflect a marine transgressionsince the early Jurassic (Berrangé, 1977).
162 D.S. Hammond

NEOGENE Sea-level change during theneotropical Neogene (24 Ma BP to present)coincides with substantial tectonic upliftand isostatic adjustments across the SouthAmerican continent, the formation of theCentral American isthmus and expansionof the Caribbean island arc. In the earlyNeogene (Miocene), the northern rim of theGuiana Shield was transformed through itscollision with the eastward-moving, south-ern edge of the Caribbean Plate and theemergence of the Andes across northernColombia–Venezuela. Geosynclinal subsi-dence south of the emerging highlands ini-tiated the formation of the northern arm ofthe Sub-Andean Trough (Fig. 2.6B).Sedimentary strata indicate that this was alarge shallow marine or epicontinental inletduring the Miocene (Fig. 6 in Diaz deGamero, 1996), a date that also is consistentwith a registered glaucony peak, and puta-tive sea high stand, from 19 to 15 Ma BP
(Smith et al., 1998). Marine deposits inwestern Amazonian regions of the AndeanTrough date to the same period, suggestingthat the rise in sea-level also covered muchof the lowlands west of the shield (Hoorn,1993; Räsänen et al., 1995). Deposits alongthe southern shield rim record a similarlytimed sea transgression, followed by a sig-nificant regressive phase by the end of thelate Miocene (de Fátima Rossetti, 2001).This regression is consistent with interpre-tations of sedimentary formations along theSuriname coast (Krook, 1979), estimates ofsea-level decline made by Vail et al. (1977)and a reduction in the area of the Vene-zuelan llanos affected by epicontinentalmarine conditions (Diaz de Gamero, 1996).
Constructing a chronology of sea-levelchange for the latter half of the Neogene(Plio-Pleistocene through Holocene) candraw upon a record of sedimentary evi-dence that has benefited from both their‘young’ age and the timing of their emplace-ment along the geochronology. Recentdeposits have not been exposed to the samebreadth of diastrophic change as thoseemplaced during the late Mesozoic–earlyCenozoic. The Andean orogeny hadachieved much of its modern-day stature,the Central American Seaway had been
closed by the Panamanian Isthmus and theCaribbean had moved into a sub-tropicalAtlantic configured very similar to itsmodern-day size and shape by the middlePliocene (3.5–3.1 Ma BP) (Coates andObando, 1996). Over the Quaternary,changes in sea level attributable to eustaticand steric effects (see below) have becomemore important in driving fluctuations inthe shield’s coastline position relative toisostatic forces, although epeirogenicmovements probably continue to playa formative role in defining variationamong different locations within theregion.24
The record of Plio-Pleistocene sea-levelchange adjacent to the eastern rim of theGuiana Shield suggests a degree of unifor-mity in sea-level response to eustatic andsteric effects across the western tropicalAtlantic. Sea-level heights derived fromstacked Barbados coral d18O values25 indi-cate high stands at 200 and 125 (230Th) kaBP and alternating declines consonant with,but slightly higher than, eustatic adjust-ment over the late Quaternary series of gla-cial stadia–interstadia as calculated byChappell and Shackleton (1986) for easternPacific deposits (Fig. 2.36A). The Barbadosrecord indicates a high stand during theseglacial periods above modern sea level (+5m), as does the uplifted palaeoreef record ofthe Huon Peninsula, Papua New Guinea inthe western Pacific (+6 m) (Bloom andYonekura, 1990). Based on the profiles ofSPECMAP d18O and Chappell andShackleton’s calculations, these are theonly probable periods over the last 200 kawhere sea level has met or exceededHolocene levels in the region.
Since the LGM, 18–22 ka ago, sea risehas rapidly increased from a lowstand esti-mated worldwide at 120 m below presentsea level (Fig. 2.36A). Holocene sea-levelheights calculated from radiocarbon-datedsediments in the Lesser Antilles, Panama,Venezuela, Guyana, Suriname and Brazilconcur with this rapid rise since the end ofthe LGM (Fig. 2.36B). A lowstand of thismagnitude during the LGM would haveincreased the size of the eastern shield areato the edge of the continental shelf, adding
Biophysical Features of the Guiana Shield 163

164 D.S. Hammond
-130
-120
-110
-100
-90
-80
-70
-60
-50
-40
-30
-20
-10
0
10
050100150200
Estim
ate
d s
ea level (m
belo
w p
resent)
-2.5
-2
-1.5
-1
-0.5
0
0.5
1
1.5
2
SP
EC
MA
Pd 1
8O
-60
-50
-40
-30
-20
-10
0
10
0200040006000800010,00012,00014,000
M.Bay, JAMDOM REPPREast Coast, PANCaracas, VEGtown, GUYParamaribo, SURRecife, BRCayo Sal VEUnare,VE
Estim
ate
d s
ea level
(mre
lativ
eto
pre
se
nt)
Fig. 2.36. Palaeo sea-level estimates. (A) Global estimates of ice-volume equivalent sea-level variationover last 140 ka (solid line) from Chappell and Shackleton (1986). SPECMAP δ18O normalized values(dashed line) back to 225 ka BP included for reference through earlier isotopic glacial–interglacial stages(Imbrie et al., 1984). Estimated sea levels for various tropical western Atlantic locations based on 230Th–231Pa ages of Barbados palaeo-reef coral deposits (open squares) (Edwards et al., 1997; Gallup et al.,2002) and 14C ages of coastal Venezuelan corals and mangrove sediments at Cayo Sal (open circles) andUnare (open diamonds). Venezuelan sites also presented in (B) (without error bars) for cross-referencingwith estimated Holocene sea-level changes at locations in the Caribbean, Panama and along the Atlanticcoast of South America between Caracas, Venezuela and Recifé, Brazil. Data based on means (+/–SE)derived from Tushingham and Peltier (1993) for 14C-dated estimates older than 0.3 ka BP.
B
A
14 C yrs BP
Age (ka BP)
Est
imat
ed s
ea le
vel
(m r
elat
ive
to p
rese
nt)
Est
imat
ed s
ea le
vel (
m b
elow
to
pres
ent)

Biophysical Features of the Guiana Shield 165
approximately 30,000–40,000 km2 to theGuiana Basin portion of the shield, createda terrestrial connection between Trinidadand the mainland and extended currentcoastal regions northeastward by an esti-mated 75 km (northwest Guyana coast) to175 km (southern edge of Tobago) (Fig.2.37). Patterns of alternating sediment dep-osition in the nearshore Amazon delta andoffshore Amazon Fan are consistent with awithdrawal of the Atlantic beyond the edgeof the shelf at the LGM (Damuth andKumar, 1975; Milliman et al., 1975) as arecurves generated for the Atlantic coast ofVenezuela (Rull, 1999) and variousCaribbean islands (Pirazzoli, 1991).Radiometrically dated deposits along theAtlantic coastline from Panama to Recifégenerate sea-level estimates conforming tothe general view of a rapidly rising sea levelalong the coast of the Guiana Shield over
the late Pleistocene–early Holocene inresponse to glacial retraction and oceanicwarming (Fig. 2.36B).
Over the last 8000 years, however, therate of global sea-level rise has generallydeclined, but along different regional trajec-tories (Clark and Lingle, 1979; Pirazzoli,1991). An analysis of these trajectoriesalong a latitudinal gradient by Bloom andYonekura (1990), illustrates the substan-tially different sea-level change responseexperienced along the coast of CentralAmerica, the Caribbean and (by associa-tion) the Guiana Shield relative to othercontinental coastlines rimming the AtlanticBasin. Sites in the Caribbean and Panamashow monotonic trends of decelerating sea-level rise, while those at higher latitudesshow decelerating sea-level decline. Bloomand Yonekura suggest that this reflects thefact that most of the glacier meltwater had
Fig. 2.37. Generalized impression of eastward extension of terrestrial environment during sea-level mini-mum of the LGM, 20 ka BP (based on data in Fig. 2.36), emphasizing land connections between Trinidadand Guiana Shield. Pleistocene shallow marine environments underpinning oceanographic studies ofshield region palaeoclimate and terrigenous sedimentary dynamics of the Amazon Basin are identified.
166 D.S. Hammond
returned to the oceans by 8 ka BP and thatsea-level changes since then largely reflectregional variation in coastal isostaticadjustment (and also steric and epeirogeniceffects). Responses among locations alongthe tropical Atlantic coast support thisview. Sites south of Venezuela appear con-sistently at or above current levels, sugges-tive of a coastal region dominated bysubsiding basins (e.g. Orinoco, Berbice andAmazon coastal regions). Estimates for sitesnorth of Venezuela, in Panama and theCaribbean, show considerably lower sealevels, indicating that these areas have beenuplifting (Fig. 2.36B). Williams (1998) sim-ilarly concluded from the distribution andstratigraphy of archaeological sites thatthe littoral zone between the Orinocoand Pomeroon Rivers along the Guianacoastline had experienced subsidence-driven sea incursion over the late Holocene,driving prehistoric Amerindian settlementsinland.
MODERN AND FUTURE SEA-LEVEL CHANGE Thenotion of land- rather than ocean-driven sea-level change is important in realistically pre-dicting future trends in sea-level change. Themodern historical record of sea-level changein the western tropical Atlantic region con-tinues to record this spatial variation in iso-static–epeirogenic adjustment processes withlittle concordance among regional time series(Aubrey et al., 1988). The IPCC assessment offuture sea-level change indicates a range ofsea-level rise along the Guiana Shield coast ofbetween 0 and 0.5 m over the next 100 yearsbased on the results of nine different modelsincorporating thermal expansion and oceaniccurrent shifts, but not isostatic or tectoniceffects (Church et al., 2001). Concordanceamong model predictions for the shield mar-gin was one of the lowest of all tropicalregions. The western and eastern equatorialPacific and eastern tropical Atlantic dis-played greater consistency among the modelpredictions.
Notes
1 The average elevation for the Guiana Shield was calculated from 26,770 values contained in the raster-based elevational coverage GTOPO5 created by the USGS (EDC, 1996).2 A table comparing the main neotropical soil groups identified under the FAO/WBR, USDA and Braziliansoil classification systems based on property assignment in USDA (1996) and FAO (1998), and soil-typeequivalents given in van Kekem et al. (1996, Appendices), Bernoux et al. (Table 11.1, 2001), Duivenvoordenand Lips (1995, Appendix II). The author was unable to locate an authoritative and comprehensive assess-ment of soil-type equivalents between the three main systems in use in the Guiana Shield, although this mayexist and would facilitate more accurate soil assignment in region-wide comparisons of plant–animal–soil–water relationships.
FAO/WRB USDA Soil Taxonomy Sistema Brasileiro de Classificação de Solos
Acrisols Oxisols, Ultisols (Paleudults/Hapluduits) Latossolos, Podzolicos Vermehlo – Amarelos eutroficosAndosols AndisolsAnthrosols Terra preta (also Nitisol)Arenosols Entisols (Psamments) Areias QuartzosasCambisols Inceptisols (Tropepts) CambisolosChernozems Chernozems Brunizens AvermeihadosFerraisols Utisols (Kandiudults/Humults), Oxisols Latossolos, Podzolicos Vermehlo – Amarelo,
(Udoxs/Orthosx/Utoxs) Terras Roxas distroficasFluvisols Inceptisols (Tropepts), Entisols (Fluvents) Solus AluviaisGleysols Inceptisols (Aquepts) Cambissolos – Tropicais distroficos, Solos AluviaisHistosols Histosols (Saprists/HemistsLeptosols KandisolsLuvisols KandisolsNitisols Kandisols, Alfisols Podzolicos Vermehlo – Amarelos plinticos, Terras Roxas
estruturadas/eutroficos
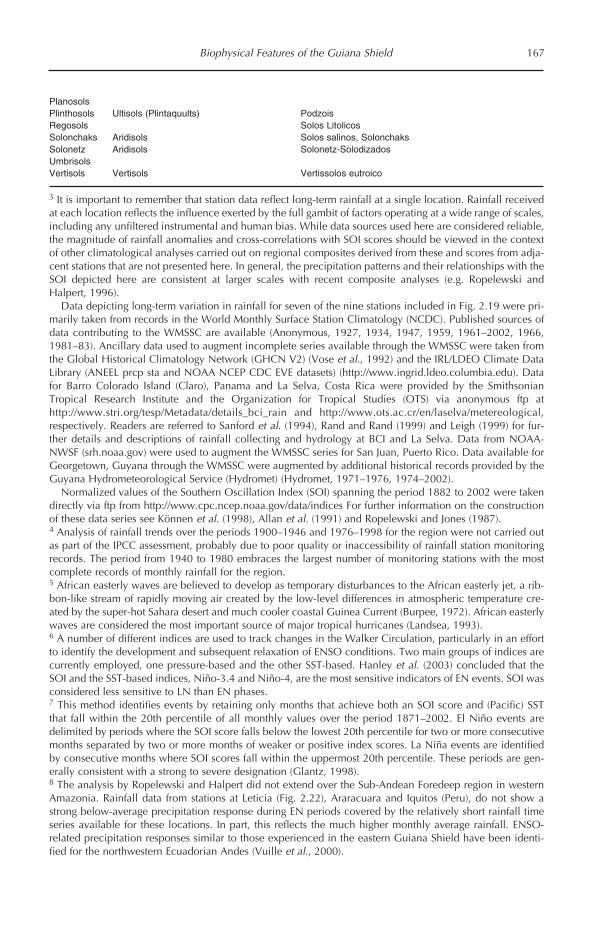
Biophysical Features of the Guiana Shield 167
PlanosolsPlinthosols Ultisols (Plintaquults) PodzoisRegosols Solos LitolicosSolonchaks Aridisols Solos salinos, SolonchaksSolonetz Aridisols Solonetz-SolodizadosUmbrisolsVertisols Vertisols Vertissolos eutroico
3 It is important to remember that station data reflect long-term rainfall at a single location. Rainfall receivedat each location reflects the influence exerted by the full gambit of factors operating at a wide range of scales,including any unfiltered instrumental and human bias. While data sources used here are considered reliable,the magnitude of rainfall anomalies and cross-correlations with SOI scores should be viewed in the contextof other climatological analyses carried out on regional composites derived from these and scores from adja-cent stations that are not presented here. In general, the precipitation patterns and their relationships with theSOI depicted here are consistent at larger scales with recent composite analyses (e.g. Ropelewski andHalpert, 1996).
Data depicting long-term variation in rainfall for seven of the nine stations included in Fig. 2.19 were pri-marily taken from records in the World Monthly Surface Station Climatology (NCDC). Published sources ofdata contributing to the WMSSC are available (Anonymous, 1927, 1934, 1947, 1959, 1961–2002, 1966,1981–83). Ancillary data used to augment incomplete series available through the WMSSC were taken fromthe Global Historical Climatology Network (GHCN V2) (Vose et al., 1992) and the IRL/LDEO Climate DataLibrary (ANEEL prcp sta and NOAA NCEP CDC EVE datasets) (http://www.ingrid.ldeo.columbia.edu). Datafor Barro Colorado Island (Claro), Panama and La Selva, Costa Rica were provided by the SmithsonianTropical Research Institute and the Organization for Tropical Studies (OTS) via anonymous ftp athttp://www.stri.org/tesp/Metadata/details_bci_rain and http://www.ots.ac.cr/en/laselva/metereological,respectively. Readers are referred to Sanford et al. (1994), Rand and Rand (1999) and Leigh (1999) for fur-ther details and descriptions of rainfall collecting and hydrology at BCI and La Selva. Data from NOAA-NWSF (srh.noaa.gov) were used to augment the WMSSC series for San Juan, Puerto Rico. Data available forGeorgetown, Guyana through the WMSSC were augmented by additional historical records provided by theGuyana Hydrometeorological Service (Hydromet) (Hydromet, 1971–1976, 1974–2002).
Normalized values of the Southern Oscillation Index (SOI) spanning the period 1882 to 2002 were takendirectly via ftp from http://www.cpc.ncep.noaa.gov/data/indices For further information on the constructionof these data series see Können et al. (1998), Allan et al. (1991) and Ropelewski and Jones (1987).4 Analysis of rainfall trends over the periods 1900–1946 and 1976–1998 for the region were not carried outas part of the IPCC assessment, probably due to poor quality or inaccessibility of rainfall station monitoringrecords. The period from 1940 to 1980 embraces the largest number of monitoring stations with the mostcomplete records of monthly rainfall for the region.5 African easterly waves are believed to develop as temporary disturbances to the African easterly jet, a rib-bon-like stream of rapidly moving air created by the low-level differences in atmospheric temperature cre-ated by the super-hot Sahara desert and much cooler coastal Guinea Current (Burpee, 1972). African easterlywaves are considered the most important source of major tropical hurricanes (Landsea, 1993).6 A number of different indices are used to track changes in the Walker Circulation, particularly in an effortto identify the development and subsequent relaxation of ENSO conditions. Two main groups of indices arecurrently employed, one pressure-based and the other SST-based. Hanley et al. (2003) concluded that theSOI and the SST-based indices, Niño-3.4 and Niño-4, are the most sensitive indicators of EN events. SOI wasconsidered less sensitive to LN than EN phases.7 This method identifies events by retaining only months that achieve both an SOI score and (Pacific) SSTthat fall within the 20th percentile of all monthly values over the period 1871–2002. El Niño events aredelimited by periods where the SOI score falls below the lowest 20th percentile for two or more consecutivemonths separated by two or more months of weaker or positive index scores. La Niña events are identifiedby consecutive months where SOI scores fall within the uppermost 20th percentile. These periods are gen-erally consistent with a strong to severe designation (Glantz, 1998).8 The analysis by Ropelewski and Halpert did not extend over the Sub-Andean Foredeep region in westernAmazonia. Rainfall data from stations at Leticia (Fig. 2.22), Araracuara and Iquitos (Peru), do not show astrong below-average precipitation response during EN periods covered by the relatively short rainfall timeseries available for these locations. In part, this reflects the much higher monthly average rainfall. ENSO-related precipitation responses similar to those experienced in the eastern Guiana Shield have been identi-fied for the northwestern Ecuadorian Andes (Vuille et al., 2000).

168 D.S. Hammond
9 Latent heat flux in this case refers to the exchange of energy between the ocean and atmosphere as a con-sequence of evaporation from the ocean surface and subsequent condensation in the atmosphere. It repre-sents an indirect transfer of heat occurring during a phase transition of water from liquid to vapour(evaporation) and vapour to liquid (condensation) or solid (ice). Feedback occurs through evaporation andprecipitation amplifying (positive) or attenuating (negative) these heat fluxes.10 Differential SLP in the northwest and southeastern Amazon indicate major cross-equatorial northwesterlywind flow when the ITCZ is at its northernmost position and high seasonal evapotranspirative conditions pre-dominate in the Amazon. Forward air mass trajectories from biomass burning in the southeastern Amazonregion clearly trace this northwestward movement (Fig. 3.2 in Artaxo, 2001).11 It has been suggested that sapwood to heartwood movement of sap could lead to spurious radial chronolo-gies (Worbes and Junk, 1989). If significant, then inward translocation of sap would lead to an underestima-tion of radiocarbon ages. Radiocarbon-dated heartwood from the base of these trees in this case wouldrepresent the minimum ‘pre-set’ age.12 Data sources. Fig. 2.26A: L. Volcan: Behling (2000); El Valle: Bush and Colinvaux (1990); L. Wodehouse:Bush and Colinvaux (1994); La Yeguada: Piperno et al. (1990); Anangucocha: Frost (1988); Mera-San JuanBosco: Bush et al. (1990); River Lake 1, 2 and 3: Colinveaux et al. (1988); Pantano de Monica 1, 2 and 3:Behling et al. (1999); L. Agua Sucia, L. Chenevo, L. Mozambique: Berrio et al. (2002); L. Angel, L. Sardinas:Behling and Hooghiemstra (1998); L. Carimagua, L. El Pinal: Behling and Hooghiemstra (1999); Georgetown:Van der Hammen (1963); L. Moreiru (Muriru): Wijmstra and Van der Hammen (1966); Alliance Well: Wijmstra(1969); Mana: Tissot et al. (1988); Nouragues: Ledru et al (1997); Salitre: Ledru et al. (1996); Crominia: Salgado-Labouriau et al. (1997). Fig. 2.25B: La Selva: Horn and Sanford (1992), Kennedy and Horn (1997); Gran Sabana:Fölster (1992); Mabura Hill: Hammond, ter Steege and van der Borg (unpublished manuscript); San Carlos deRio Negro: Saldarriaga and West (1986); BDFF/Manaus: Piperno and Becker (1996); Porto Trombetas: Francisand Knowles (2001); Carajas: Soubies (19790); Salitre: Vernet et al. (1994), Boulet et al. (1995).13 The Bowen ratio (H/LE) is the ratio of sensible to latent heat at any point in time. It links water availabil-ity (through latent heat flux) with temperature (through sensible heat flux). Maritime climates at mid-latitudesare strongly affected by seasonal declines in sensible heat flux, but experience less severe temperature dropsthan expected given their latitude due to compensating latent heat flux from the adjacent ocean to atmos-phere. Similarly, a shift in the sensible heat flux due to changes in global temperatures would be compen-sated by an increase in the latent heat flux, particularly where there is abundant soil moisture, such as inflooded forest regions, to drive this process.14 This would take the form: –6 (Em – Es)
1000where Em is the minimum modern elevational limit for indicator taxon I and Es is the elevation of the sam-pled fossil pollen for indicator taxon I.
Indicator taxa used in assessing Pleistocene temperature changes include many putative highland or high-latitudinal species (Colinvaux, 1996): South America – Alpine: Alnus (Betulaceae), Araucaria, Humiria(Humiriaceae), Podocarpus (Podocarpaceae), Weinmannia (Cunoniaceae); Montane: Melastomataceae,Hedyosmum (Chloranthaceae), Rapanea (Myrsinaceae), Ilex (Aquifoliaceae). Central America – Quercus(Fagaceae), Ilex, Magnolia (Magnoliaceae), Gunnera (Haloragidaceae), Symplocos (Symplocaceae). OnlyAraucaria unequivocally qualifies as a mid-to-high latitude inhabitant. Gentry (1993, p. 263) assigns themodern Alnus acuminata to montane second-growth forests in northwest South America and indicates thatPodocarpus can be found at scattered lowland locations on psamment soils. Ilex inundata is a commonspecies found throughout the lowland tropical forests of the Amazon Downwarp, Sub-Andean Trough andon sandy soils or seasonally inundated floodplains (Gentry, 1993; Ribeiro et al., 1999). Several species of Ilexare also commonly encountered in the low-lying hills of the Iwokrama Forest (Clarke et al., 2001), CentralGuyana and on dry sand savannas and savanna forest throughout Guyana, Suriname and French Guiana (vanRoosmalen, 1985; Boggan et al., 1998). Species of Humiria are also common components of lowland plantcommunities on podzol and arenosol (white sand) soils in the Guianas and Venezuela Guayana (Richards,1952; Boggan et al., 1998; ter Steege, 2000), as well as western Amazonia (Gentry, 1993). Both Ilex (divari-cata) and Humiria typify bana-like shrublands found on white sand dune formations in the Sipapo, Atabapoand Guainia lowlands (50–200 m asl) of Venezuelan Guayana (Huber, 1995b). Gentry (1993) assigns Rapanea(aka Myrsine) to mid-elevational cloud forests ‘in rather exposed situations’ (i.e. drier). Julian Steyermark(1966, 1967) found a collection of taxa at the 1400–2200 m asl range of the Guayanan tepui region that showsa mix of lowland and highland genera very similar to that identified from fossil pollen cores in the Andes. Thehighland genera Podocarpus, Weinmannia and Magnolia were found mixing with common lowland genera(but not species!) such as Schefflera, Caryocar, Moronobea, Dimorphandra and Byrsonima.
Biophysical Features of the Guiana Shield 169
Taxa assigned an upland distribution in fossil pollen analyses appear as modern components of relativelydry lowland habitats. Are these taxa indicative of Pleistocene aridity or cooling? Virtually all of the taxaindicative of cooling, except Araucaria and Hedyosmum, can be associated with relatively dry lowland (Ilex,Humiria, Podocarpus), or upland (Rapanea) habitats, suggesting the aridity hypothesis cannot be independ-ently discounted.15 This refers to the absence of tropical eruptions of sufficient magnitude to create a sulfate spike in both polarice caps. Several much smaller, mainly phreatic (steam-driven) eruptions took place in the tropics during the1997–98 El Niño event, but none of these injected aerosol-producing chemicals into the stratosphere inamounts capable of significantly altering insolation levels.16 Solar irradiance is a measure of the portion of total solar energy output, or luminosity, that radiates towardsEarth at a distance of one astronomical unit (= 1.5 × 10⁸ km). It is used in preference to the previously usedterm ‘solar constant’, since this has now been shown to be not strictly correct.17 Hoyt and Schatten (1997) note, however, that the Hale cycle is based on a doubling of the Schwabe cycleto explain 20–25 year oscillation in certain meteorological phenomena, rather than a distinct periodicitywithin the sunspot record. Hoyt and Schatten suggest that these may be better explained by the 18.6 yearSaros lunar tidal cycle (Camuffo, 1999).18 Cosmogenic isotope concentrations deposited on Earth are believed to be regulated by the strength of thesolar magnetic field. During periods of high solar activity, this field is strengthened, reducing Earth’s expo-sure to cosmic rays and the consequent production of 10Be, 14C and other isotopes. Solar activity and iso-tope concentrations are thereby considered inversely related (Bard et al., 1997). Lower concentrations wouldindicate higher solar activity and a warming of the planetary atmosphere (Hoyt and Schatten, 1997, p. 179).19 The measurement intervals for ice core-derived concentrations and using gas autoanalysers differ consid-erably. For example, the interval between consecutive samples taken from the 400 ka Vostok ice core seriesof gas measurements ranges between 43 and 5966 years, while modern concentrations at Mauna Loa,Hawaii have been directly sampled daily over a mere 45 years. The possibility of prehistoric spikes of post-industrial magnitude occurring during one or more of the long intervals between ice core measurements can-not be fully discounted due to the large discrepancy between direct and proxy sampling resolutions.However, for this to have occurred, a CO2-generating ‘event’ or ‘phase’ of sufficient magnitude, driven by aplausible (group of) mechanism(s) capable of naturally raising concentrations to modern levels would needto be identified (e.g. carbonate weathering, volcanic emissions).20 The fractional contribution of these rivers to the Amazon and to the Guiana Shield differ by the area esti-mated to be covered by the upper Japurá region not located within the delimited shield region.21 Discharge (Q) is the downstream rate of water flux expressed in cubic metres or cubic kilometres per sec-ond. Specific discharge (q) is this rate (Q) divided by the size of the draining watershed (A) (see Table 2.3)and is typically expressed in litres per second per square kilometre (Lerman, 1994). It offers a way of com-paring flow rates of rivers with strongly contrasting surface drainage areas.
Discharge rates for rivers draining the Guiana Shield are based on a variety of published sources, oftencovering different time intervals with varying degrees of overlap. Varying monitor intervals can potentiallycreate significant differences between the stated and the true long-term average discharges if the data inter-vals used to calculate averages differ in their width and inclusion of anomalies related to strong to severeENSO events. Where flow data covered less than 10 years but included severe ENSO events (1982–83,1990–91, 1997–98), these years were not included in the calculation of the average annual discharge.Brazilian station data are drawn from station records published by ANEEL and made available throughhidroweb.aneel.gov.br(vazões) Station data from other countries were sourced from the following: Venezuela– UNESCO ds552.0 v1.3 via dss.ucar.edu/datasets/ds552.0 (Bodo, 2001), Table 1 in Weibezahn (1990),Table 2 in Cressa et al. (1993) and cross-checked for consistency, given available river data, with figuresgiven in Yanez and Ramirez (1988), Edmond et al. (1995, 1996) and Vargas and Rangel (1996b); Guyana –UNESCO ds552.0, Hydrometeorological Service (1981, 1982, 1985, 2000) and Dai and Trenberth (2002);Suriname – UNESCO ds552.0, Amatali (1993), Dai and Trenberth (2002); French Guiana – UNESCOds552.0, Hiez and Dubreuil (1964), Lointier (1991) and Dai and Trenberth (2002).22 River discharge data taken from UCAR compilation UNESCO ds552.0 v1.3 viadss.ucar.edu/datasets/ds552.0 (Bodo, 2001) and ANEEL via hidroweb.aneel.gov.br, except for Berbice River,1982–83, taken from Hydrometeorological Service (2000). SOI values are standard deviates from the long-term average for the 200-year period spanning 1882 to 2002. The discharge for each month of the EN yearsevaluated was calculated as a percentage of a decadal average for that month. For the 1972–73 and 1982–83events, the averages were based on the periods 1967–1977 and 1978–1988, respectively.23 It is important to note, however, that virtually all of the 65 fossil study sites examined by Romero (1993)
170 D.S. Hammond
were located on the periphery of the South American craton. About one-third of these are located along theeastern shield regions (mainly the Brazilian Shield) and thus could be considered exclusively characteristicof Palaeogene vegetation on the passive margin of a Precambrian landscape. While the northwestern mar-gin of the craton had not yet fully evolved in response to the emerging Andean orogeny, volcanic arc beltsassociated with the southern perimeter of the emerging Caribbean Plate are believed to have been activesince the Cenomanian or earlier (Pitman et al., 1993).24 Eustatic movements refer to the global change in sea level, typically as a result of glacial expansion andcontraction. Steric effects refer here to changes in sea level caused by changes in seawater temperature.When seawater increases (decreases) in temperature, it expands (contracts), raising (lowering) sea level.Isostatic movements are generated by long-term rise or subsidence of crust, typically in response to moun-tain-building and weathering, which can influence coastline changes relative to other effects. Epeirogenicmovements are vertical shifts in land elevation believed to be caused by mantle convection currents or ther-mal effects below the lithosphere (Harrison, 1990).25 δ18O refers to the deviation in the ratio of the relatively rare (and heavy) oxygen isotope (18O) and the rel-atively more common (and lighter) isotope (16O) within a foraminifera (coral) sample from that of standardmean ocean water (SMOW). Algebraically, δ=([18O/16OS]/[
18O/16OSMOW])–1. Glacial ice is isotopically light(and therefore the remaining seawater is isotopically heavy) and low (high) sea stands are characterized bylarger (smaller) δ18O values.
References
Ab’Saber, A.N. (1977) Espacos ocupados pela expansão dos climas secos na América do Sul, por ocasiãodos períodos glaciais quaternários. Paleoclimas Universidad São Paulo, Instituto de Geografia 3, 1–19.
Absy, M.L., Cleef, A., Fournier, M., Martin, L., Servant, M., Sifeddine, A., Ferreira da Silva, M., Soubiés, F.,Suguio, K., Turcq, B. and van der Hammen, T. (1991) Mise en évidence de quatre phases d’ouverturede la forêt dense dans le sud-est de l’Amazonie au cours des 60000 dernières années. Première com-paraison avec d’autres régions tropicales. Comptes Rendu de l’Academie des Sciences, Paris 312, SérieII, 673–678.
Allan, R.J., Nicholls N., Jones, P.D. and Butterworth, I.J. (1991) A further extension of the Tahiti-Darwin SOI,early SOI results and Darwin pressure. Journal of Climate 4, 743–749.
Allison, T.D., Moeller, R.E. and Davis, M.B. (1986) Pollen in laminated sediments provides evidence for amid-Holocene forest pathogen outbreak. Ecology 67, 1101–1105.
Amatali, M. (1993) Climate and surface water hydrology. In: Ouboter, P.E. (ed.) The Freshwater Ecosystemsof Suriname. Kluwer Academic, Dordrecht, The Netherlands, pp. 29–52.
Angell, J.K. and Korshover, J. (1985) Surface temperature changes following the six major volcanic episodesbetween 1780 and 1980. Journal of Applied Meteorology 24, 937–951.
Anonymous (1927) World Weather Records – 1920. Smithsonian Institution, Washington, DC.Anonymous (1934) World Weather Records – 1921 to 1930. Smithsonian Institution, Washington, DC.Anonymous (1947) World Weather Records – 1931 to 1940. Smithsonian Institution, Washington, DC.Anonymous (1959) World Weather Records – 1941 to 1950. US Department of Commerce, Washington,
DC.Anonymous (1961–2002) Monthly Climatic Data for the World – 1961 to Present. US Department of
Commerce, Asheville, North Carolina.Anonymous (1966) World Weather Records – 1951 to 1960 US Department of Commerce, Washington, DC.Anonymous (1981–1983) World Weather Records – 1961 to 1970. US Department of Commerce,
Washington, DC.Artaxo, P. (2001) The atmospheric component of biogeochemical cycles in the Amazon Basin. In: Richey,
J.E. (ed.) The Biogeochemistry of the Amazon Basin. Oxford University Press, Oxford, UK, pp. 42–52.Ashton, P.S. (1977) A contribution of rain forest research to evolutionary theory. Annals of the Missouri
Botanical Garden 64, 694–705.Aubert, G. (1965) Classification des sols. Cahiers ORSTOM, Série Pédologie 3, 269–288.Aubrey, D.G., Emery, K.O. and Uchupi, E. (1988) Changing coastal levels of South America and the
Caribbean region from tide-gauge records. Tectonophysics 154, 269–284.Augustinus, P.G.E.F. (1980) Actual development of the chenier coast of Suriname. Sedimentary Geology 26,
91–113.
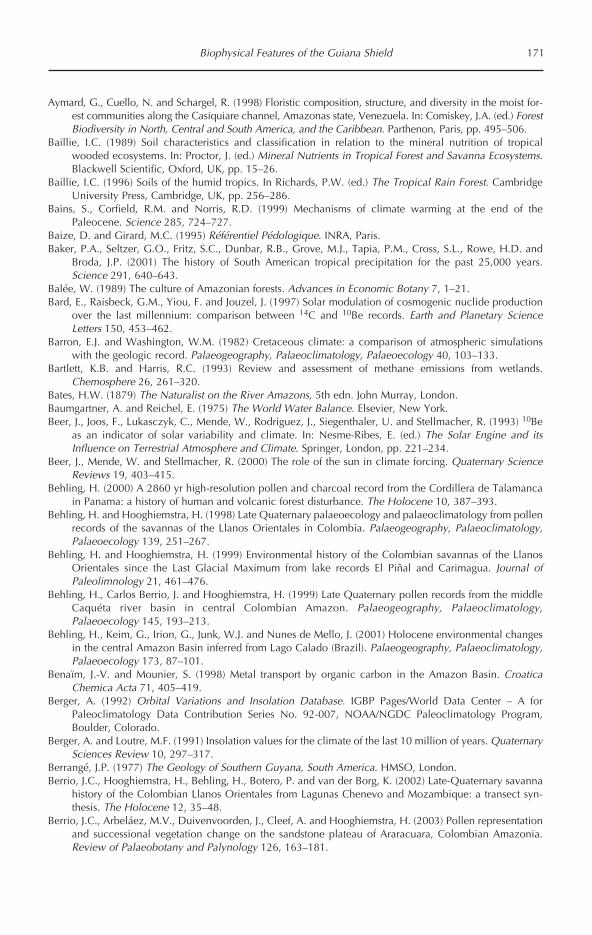
Biophysical Features of the Guiana Shield 171
Aymard, G., Cuello, N. and Schargel, R. (1998) Floristic composition, structure, and diversity in the moist for-est communities along the Casiquiare channel, Amazonas state, Venezuela. In: Comiskey, J.A. (ed.) ForestBiodiversity in North, Central and South America, and the Caribbean. Parthenon, Paris, pp. 495–506.
Baillie, I.C. (1989) Soil characteristics and classification in relation to the mineral nutrition of tropicalwooded ecosystems. In: Proctor, J. (ed.) Mineral Nutrients in Tropical Forest and Savanna Ecosystems.Blackwell Scientific, Oxford, UK, pp. 15–26.
Baillie, I.C. (1996) Soils of the humid tropics. In Richards, P.W. (ed.) The Tropical Rain Forest. CambridgeUniversity Press, Cambridge, UK, pp. 256–286.
Bains, S., Corfield, R.M. and Norris, R.D. (1999) Mechanisms of climate warming at the end of thePaleocene. Science 285, 724–727.
Baize, D. and Girard, M.C. (1995) Référentiel Pédologique. INRA, Paris.Baker, P.A., Seltzer, G.O., Fritz, S.C., Dunbar, R.B., Grove, M.J., Tapia, P.M., Cross, S.L., Rowe, H.D. and
Broda, J.P. (2001) The history of South American tropical precipitation for the past 25,000 years.Science 291, 640–643.
Balée, W. (1989) The culture of Amazonian forests. Advances in Economic Botany 7, 1–21.Bard, E., Raisbeck, G.M., Yiou, F. and Jouzel, J. (1997) Solar modulation of cosmogenic nuclide production
over the last millennium: comparison between 14C and 10Be records. Earth and Planetary ScienceLetters 150, 453–462.
Barron, E.J. and Washington, W.M. (1982) Cretaceous climate: a comparison of atmospheric simulationswith the geologic record. Palaeogeography, Palaeoclimatology, Palaeoecology 40, 103–133.
Bartlett, K.B. and Harris, R.C. (1993) Review and assessment of methane emissions from wetlands.Chemosphere 26, 261–320.
Bates, H.W. (1879) The Naturalist on the River Amazons, 5th edn. John Murray, London.Baumgartner, A. and Reichel, E. (1975) The World Water Balance. Elsevier, New York.Beer, J., Joos, F., Lukasczyk, C., Mende, W., Rodriguez, J., Siegenthaler, U. and Stellmacher, R. (1993) 10Be
as an indicator of solar variability and climate. In: Nesme-Ribes, E. (ed.) The Solar Engine and itsInfluence on Terrestrial Atmosphere and Climate. Springer, London, pp. 221–234.
Beer, J., Mende, W. and Stellmacher, R. (2000) The role of the sun in climate forcing. Quaternary ScienceReviews 19, 403–415.
Behling, H. (2000) A 2860 yr high-resolution pollen and charcoal record from the Cordillera de Talamancain Panama: a history of human and volcanic forest disturbance. The Holocene 10, 387–393.
Behling, H. and Hooghiemstra, H. (1998) Late Quaternary palaeoecology and palaeoclimatology from pollenrecords of the savannas of the Llanos Orientales in Colombia. Palaeogeography, Palaeoclimatology,Palaeoecology 139, 251–267.
Behling, H. and Hooghiemstra, H. (1999) Environmental history of the Colombian savannas of the LlanosOrientales since the Last Glacial Maximum from lake records El Piñal and Carimagua. Journal ofPaleolimnology 21, 461–476.
Behling, H., Carlos Berrio, J. and Hooghiemstra, H. (1999) Late Quaternary pollen records from the middleCaquéta river basin in central Colombian Amazon. Palaeogeography, Palaeoclimatology,Palaeoecology 145, 193–213.
Behling, H., Keim, G., Irion, G., Junk, W.J. and Nunes de Mello, J. (2001) Holocene environmental changesin the central Amazon Basin inferred from Lago Calado (Brazil). Palaeogeography, Palaeoclimatology,Palaeoecology 173, 87–101.
Benaïm, J.-V. and Mounier, S. (1998) Metal transport by organic carbon in the Amazon Basin. CroaticaChemica Acta 71, 405–419.
Berger, A. (1992) Orbital Variations and Insolation Database. IGBP Pages/World Data Center – A forPaleoclimatology Data Contribution Series No. 92-007, NOAA/NGDC Paleoclimatology Program,Boulder, Colorado.
Berger, A. and Loutre, M.F. (1991) Insolation values for the climate of the last 10 million of years. QuaternarySciences Review 10, 297–317.
Berrangé, J.P. (1977) The Geology of Southern Guyana, South America. HMSO, London.Berrio, J.C., Hooghiemstra, H., Behling, H., Botero, P. and van der Borg, K. (2002) Late-Quaternary savanna
history of the Colombian Llanos Orientales from Lagunas Chenevo and Mozambique: a transect syn-thesis. The Holocene 12, 35–48.
Berrio, J.C., Arbeláez, M.V., Duivenvoorden, J., Cleef, A. and Hooghiemstra, H. (2003) Pollen representationand successional vegetation change on the sandstone plateau of Araracuara, Colombian Amazonia.Review of Palaeobotany and Palynology 126, 163–181.
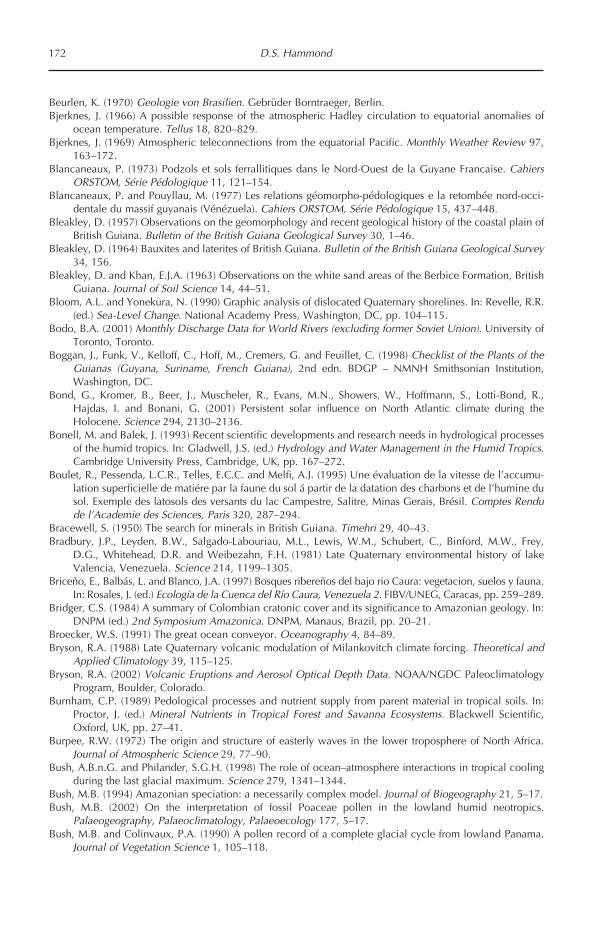
172 D.S. Hammond
Beurlen, K. (1970) Geologie von Brasilien. Gebrüder Borntraeger, Berlin.Bjerknes, J. (1966) A possible response of the atmospheric Hadley circulation to equatorial anomalies of
ocean temperature. Tellus 18, 820–829.Bjerknes, J. (1969) Atmospheric teleconnections from the equatorial Pacific. Monthly Weather Review 97,
163–172.Blancaneaux, P. (1973) Podzols et sols ferrallitiques dans le Nord-Ouest de la Guyane Francaise. Cahiers
ORSTOM, Série Pédologique 11, 121–154.Blancaneaux, P. and Pouyllau, M. (1977) Les relations géomorpho-pédologiques e la retombée nord-occi-
dentale du massif guyanais (Vénézuela). Cahiers ORSTOM, Série Pédologique 15, 437–448.Bleakley, D. (1957) Observations on the geomorphology and recent geological history of the coastal plain of
British Guiana. Bulletin of the British Guiana Geological Survey 30, 1–46.Bleakley, D. (1964) Bauxites and laterites of British Guiana. Bulletin of the British Guiana Geological Survey
34, 156.Bleakley, D. and Khan, E.J.A. (1963) Observations on the white sand areas of the Berbice Formation, British
Guiana. Journal of Soil Science 14, 44–51.Bloom, A.L. and Yonekura, N. (1990) Graphic analysis of dislocated Quaternary shorelines. In: Revelle, R.R.
(ed.) Sea-Level Change. National Academy Press, Washington, DC, pp. 104–115.Bodo, B.A. (2001) Monthly Discharge Data for World Rivers (excluding former Soviet Union). University of
Toronto, Toronto.Boggan, J., Funk, V., Kelloff, C., Hoff, M., Cremers, G. and Feuillet, C. (1998) Checklist of the Plants of the
Guianas (Guyana, Suriname, French Guiana), 2nd edn. BDGP – NMNH Smithsonian Institution,Washington, DC.
Bond, G., Kromer, B., Beer, J., Muscheler, R., Evans, M.N., Showers, W., Hoffmann, S., Lotti-Bond, R.,Hajdas, I. and Bonani, G. (2001) Persistent solar influence on North Atlantic climate during theHolocene. Science 294, 2130–2136.
Bonell, M. and Balek, J. (1993) Recent scientific developments and research needs in hydrological processesof the humid tropics. In: Gladwell, J.S. (ed.) Hydrology and Water Management in the Humid Tropics.Cambridge University Press, Cambridge, UK, pp. 167–272.
Boulet, R., Pessenda, L.C.R., Telles, E.C.C. and Melfi, A.J. (1995) Une évaluation de la vitesse de l’accumu-lation superficielle de matiére par la faune du sol á partir de la datation des charbons et de l’humine dusol. Exemple des latosols des versants du lac Campestre, Salitre, Minas Gerais, Brésil. Comptes Rendude l’Academie des Sciences, Paris 320, 287–294.
Bracewell, S. (1950) The search for minerals in British Guiana. Timehri 29, 40–43.Bradbury, J.P., Leyden, B.W., Salgado-Labouriau, M.L., Lewis, W.M., Schubert, C., Binford, M.W., Frey,
D.G., Whitehead, D.R. and Weibezahn, F.H. (1981) Late Quaternary environmental history of lakeValencia, Venezuela. Science 214, 1199–1305.
Briceño, E., Balbás, L. and Blanco, J.A. (1997) Bosques ribereños del bajo rio Caura: vegetacion, suelos y fauna.In: Rosales, J. (ed.) Ecología de la Cuenca del Río Caura, Venezuela 2. FIBV/UNEG, Caracas, pp. 259–289.
Bridger, C.S. (1984) A summary of Colombian cratonic cover and its significance to Amazonian geology. In:DNPM (ed.) 2nd Symposium Amazonica. DNPM, Manaus, Brazil, pp. 20–21.
Broecker, W.S. (1991) The great ocean conveyor. Oceanography 4, 84–89.Bryson, R.A. (1988) Late Quaternary volcanic modulation of Milankovitch climate forcing. Theoretical and
Applied Climatology 39, 115–125.Bryson, R.A. (2002) Volcanic Eruptions and Aerosol Optical Depth Data. NOAA/NGDC Paleoclimatology
Program, Boulder, Colorado.Burnham, C.P. (1989) Pedological processes and nutrient supply from parent material in tropical soils. In:
Proctor, J. (ed.) Mineral Nutrients in Tropical Forest and Savanna Ecosystems. Blackwell Scientific,Oxford, UK, pp. 27–41.
Burpee, R.W. (1972) The origin and structure of easterly waves in the lower troposphere of North Africa.Journal of Atmospheric Science 29, 77–90.
Bush, A.B.n.G. and Philander, S.G.H. (1998) The role of ocean–atmosphere interactions in tropical coolingduring the last glacial maximum. Science 279, 1341–1344.
Bush, M.B. (1994) Amazonian speciation: a necessarily complex model. Journal of Biogeography 21, 5–17.Bush, M.B. (2002) On the interpretation of fossil Poaceae pollen in the lowland humid neotropics.
Palaeogeography, Palaeoclimatology, Palaeoecology 177, 5–17.Bush, M.B. and Colinvaux, P.A. (1990) A pollen record of a complete glacial cycle from lowland Panama.
Journal of Vegetation Science 1, 105–118.
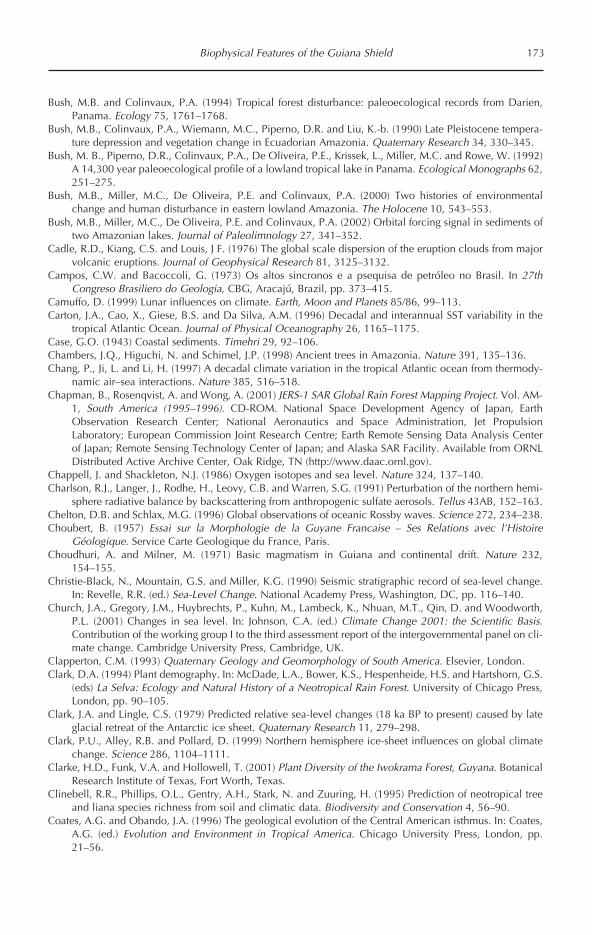
Biophysical Features of the Guiana Shield 173
Bush, M.B. and Colinvaux, P.A. (1994) Tropical forest disturbance: paleoecological records from Darien,Panama. Ecology 75, 1761–1768.
Bush, M.B., Colinvaux, P.A., Wiemann, M.C., Piperno, D.R. and Liu, K.-b. (1990) Late Pleistocene tempera-ture depression and vegetation change in Ecuadorian Amazonia. Quaternary Research 34, 330–345.
Bush, M. B., Piperno, D.R., Colinvaux, P.A., De Oliveira, P.E., Krissek, L., Miller, M.C. and Rowe, W. (1992)A 14,300 year paleoecological profile of a lowland tropical lake in Panama. Ecological Monographs 62,251–275.
Bush, M.B., Miller, M.C., De Oliveira, P.E. and Colinvaux, P.A. (2000) Two histories of environmentalchange and human disturbance in eastern lowland Amazonia. The Holocene 10, 543–553.
Bush, M.B., Miller, M.C., De Oliveira, P.E. and Colinvaux, P.A. (2002) Orbital forcing signal in sediments oftwo Amazonian lakes. Journal of Paleolimnology 27, 341–352.
Cadle, R.D., Kiang, C.S. and Louis, J F. (1976) The global scale dispersion of the eruption clouds from majorvolcanic eruptions. Journal of Geophysical Research 81, 3125–3132.
Campos, C.W. and Bacoccoli, G. (1973) Os altos sincronos e a psequisa de petróleo no Brasil. In 27thCongreso Brasiliero do Geologia, CBG, Aracajú, Brazil, pp. 373–415.
Camuffo, D. (1999) Lunar influences on climate. Earth, Moon and Planets 85/86, 99–113.Carton, J.A., Cao, X., Giese, B.S. and Da Silva, A.M. (1996) Decadal and interannual SST variability in the
tropical Atlantic Ocean. Journal of Physical Oceanography 26, 1165–1175.Case, G.O. (1943) Coastal sediments. Timehri 29, 92–106.Chambers, J.Q., Higuchi, N. and Schimel, J.P. (1998) Ancient trees in Amazonia. Nature 391, 135–136.Chang, P., Ji, L. and Li, H. (1997) A decadal climate variation in the tropical Atlantic ocean from thermody-
namic air–sea interactions. Nature 385, 516–518.Chapman, B., Rosenqvist, A. and Wong, A. (2001) JERS-1 SAR Global Rain Forest Mapping Project. Vol. AM-
1, South America (1995–1996). CD-ROM. National Space Development Agency of Japan, EarthObservation Research Center; National Aeronautics and Space Administration, Jet PropulsionLaboratory; European Commission Joint Research Centre; Earth Remote Sensing Data Analysis Centerof Japan; Remote Sensing Technology Center of Japan; and Alaska SAR Facility. Available from ORNLDistributed Active Archive Center, Oak Ridge, TN (http://www.daac.ornl.gov).
Chappell, J. and Shackleton, N.J. (1986) Oxygen isotopes and sea level. Nature 324, 137–140.Charlson, R.J., Langer, J., Rodhe, H., Leovy, C.B. and Warren, S.G. (1991) Perturbation of the northern hemi-
sphere radiative balance by backscattering from anthropogenic sulfate aerosols. Tellus 43AB, 152–163.Chelton, D.B. and Schlax, M.G. (1996) Global observations of oceanic Rossby waves. Science 272, 234–238.Choubert, B. (1957) Essai sur la Morphologie de la Guyane Francaise – Ses Relations avec l’Histoire
Géologique. Service Carte Geologique du France, Paris.Choudhuri, A. and Milner, M. (1971) Basic magmatism in Guiana and continental drift. Nature 232,
154–155.Christie-Black, N., Mountain, G.S. and Miller, K.G. (1990) Seismic stratigraphic record of sea-level change.
In: Revelle, R.R. (ed.) Sea-Level Change. National Academy Press, Washington, DC, pp. 116–140.Church, J.A., Gregory, J.M., Huybrechts, P., Kuhn, M., Lambeck, K., Nhuan, M.T., Qin, D. and Woodworth,
P.L. (2001) Changes in sea level. In: Johnson, C.A. (ed.) Climate Change 2001: the Scientific Basis.Contribution of the working group I to the third assessment report of the intergovernmental panel on cli-mate change. Cambridge University Press, Cambridge, UK.
Clapperton, C.M. (1993) Quaternary Geology and Geomorphology of South America. Elsevier, London.Clark, D.A. (1994) Plant demography. In: McDade, L.A., Bower, K.S., Hespenheide, H.S. and Hartshorn, G.S.
(eds) La Selva: Ecology and Natural History of a Neotropical Rain Forest. University of Chicago Press,London, pp. 90–105.
Clark, J.A. and Lingle, C.S. (1979) Predicted relative sea-level changes (18 ka BP to present) caused by lateglacial retreat of the Antarctic ice sheet. Quaternary Research 11, 279–298.
Clark, P.U., Alley, R.B. and Pollard, D. (1999) Northern hemisphere ice-sheet influences on global climatechange. Science 286, 1104–1111.
Clarke, H.D., Funk, V.A. and Hollowell, T. (2001) Plant Diversity of the Iwokrama Forest, Guyana. BotanicalResearch Institute of Texas, Fort Worth, Texas.
Clinebell, R.R., Phillips, O.L., Gentry, A.H., Stark, N. and Zuuring, H. (1995) Prediction of neotropical treeand liana species richness from soil and climatic data. Biodiversity and Conservation 4, 56–90.
Coates, A.G. and Obando, J.A. (1996) The geological evolution of the Central American isthmus. In: Coates,A.G. (ed.) Evolution and Environment in Tropical America. Chicago University Press, London, pp.21–56.

174 D.S. Hammond
Colinvaux, P.A. (1987) Amazon diversity in light of the paleoecological record. Quaternary Science Review6, 93–114.
Colinvaux, P.A. (1993) Pleistocene biogeography and diversity in tropical forests of South America. In:Goldblatt, P. (ed.) Biological Relationships Between Africa and South America. Yale University Press,New Haven, Connecticut, pp. 473–499.
Colinvaux, P.A. (1996) Quaternary environmental history and forest diversity in the neotropics. In: Coates, A.G.(ed.) Evolution and Environment in Tropical America. University of Chicago Press, London, pp. 359–406.
Colinvaux, P.A. and De Oliveira, P.E. (2001) Amazon plant diversity and climate through the Cenozoic.Palaeogeography, Palaeoclimatology, Palaeoecology 166, 51–63.
Colinvaux, P.A., Frost, M., Frost, I., Liu, K.-B. and Steinitz-Kannan, M. (1988) Three pollen diagrams of for-est disturbance in the western Amazon basin. Review of Palaeobotany and Palynology 55, 73–81.
Colonnello, G. (2001) Physico-chemical comparison of the Mánamo and Macareo rivers in the Orinoco deltaafter the 1965 Mánamo dam construction. Interciencia 26, 136–143.
Colonnello, G. and Medina, E. (1998) Vegetation changes induced by dam construction in a tropical estu-ary: the case of the Mánamo river, Orinoco Delta (Venezuela). Plant Ecology 139, 145–154.
Coomes, D.A. and Grubb, P.J. (1996) Amazonian caatinga and related communities at La Esmeralda,Venezuela: forest structure, physiognomy and floristics, and control by soil factors. Vegetatio 122,167–191.
Cooper, A. (1979) Muri and white sand savannah in Guyana, Suriname and French Guiana. In: Specht, R.L.(ed.) Heathlands and Related Shrublands. Elsevier, Amsterdam, pp. 471–481.
Cordani, U.G. and de Brito Neves, B.B. (1982) The geologic evolution of South America during the Archaeanand Early Proterozoic. Revista Brasiliera Geociencias 12, 78–88.
Covey, D.L. and Hastenrath, S. (1978) The Pacific El Niño phenomenon and the Atlantic circulation. MonthlyWeather Review 106, 1280–1287.
Crawford, F.D., Szelewski, C.E. and Alvey, G.D. (1984) Geology and exploration in the Takutu graben ofGuyana and Brazil. Journal of Petroleum Geology 8, 5–36.
Cressa, C., Vasquez, E., Zoppi, E., Rincon, J.E.and Lopez, C. (1993) Aspectos generales de la limnologia enVenezuela. Interciencia 18, 237–248.
Critchfield, H.J. (1983) General Climatology, 4th edn. Prentice-Hall, New York.Cross, S.L., Baker, P.A., Seltzer, G.O., Fritz, S.C. and Dunbar, R.B. (2001) Late Quaternary climate and
hydrology of tropical South America inferred from an isotopic and chemical model of Lake Titicaca,Bolivia and Peru. Quaternary Research 56, 1–9.
Crowley, T.J. (2001) Causes of climate change over the past 1000 years. Science 289, 270–289.Cuevas, E. (2001) Soil versus biological controls on nutrient cycling in terra firme forests. In: Richey, J.E. (ed.)
The Biogeochemistry of the Amazon Basin. Oxford University Press, Oxford, UK, pp. 53–67.Culf, A.D., Fisch, G. and Hodnett, M.G. (1995) The albedo of Amazonian forest and ranch land. Journal of
Climate 8, 1544–1554.Curtis, J.H., Brenner, M. and Hodell, D.A. (1999) Climate change in the Lake Valencia basin, Venezuela,
12600 yr BP to present. The Holocene 9, 609–619.CVG-TECMIN (1991) Proyecto Inventario de los Recursos Naturales de la Región Guayana. CVG-TECMIN,
Ciudad Bolivar, Venezuela.Dai, A. and Trenberth, K.E. (2002) Estimates of freshwater discharge from continents: latitudinal and seasonal
variations. Journal of Hydrometeorology 3, 660–687.Dai, A. and Wigley, T.M.L. (2001) Global patterns of ENSO-induced precipitation. Geophysical Research
Letters 27, 1283–1286.Dai, A., Trenberth, K.E. and Karl, T.R. (1998) Effects of clouds, soil moisture, precipitation, and water vapor
on diurnal temperature range. Journal of Climate 12, 2451–2473.Damuth, J.E. and Kumar, N. (1975) Amazon cone: morphology, sediments, age and growth pattern. Bulletin
of the Geological Society of America 86, 863–878.Daniel, J.R.K. (1984) Geomorphology of Guyana: An Integrated Study of Natural Environments. Release
Books, Georgetown.Data+ and ESRI (1996) ArcAtlas: Our Earth. ESRI, Redlands, California.de Fátima Rossetti, D. (2001) Late Cenozoic sedimentary evolution in northeastern Pará, Brazil, within the
context of sea level changes. Journal of South American Earth Sciences 14, 77–89.de Freitas, H.A., Pessenda, L.C.R., Aravena, R., Gouveia, S.E.M., de Souza Ribeiro, A. and Boulet, R. (2001)
Late Quaternary vegetation dynamics in the southern Amazon Basin inferred from carbon isotopes insoil organic matter. Quaternary Research 55, 39–46.

Biophysical Features of the Guiana Shield 175
de Oliveira, P.E., Barreto, A.M.F. and Suguio, K. (1999) Late Pleistocene/Holocene climatic and vegetationalhistory of the Brazilian caatinga: the fossil dunes of the middle Sao Francisco River. Palaeogeography,Palaeoclimatology, Palaeoecology 152, 319–337.
de Silva, S.L. and Zielinski, G.A. (1998) Global influence of the AD 1600 eruption of Huaynaputina, Peru.Nature 393, 455–458.
Debrabant, P., Lopez, M. and Chamley, H. (1997) Clay mineral distribution and significance in Quaternarysediments of the Amazon Fan. In: Peterson, L.C. (ed.) Proceedings of the Ocean Drilling Program,Scientific Results. ODP, College Station, Texas, pp. 177–192.
Degens, E.T. (1982) Transport of Carbon and Minerals in Major World Rivers, Part 1. SCOPE/UNEP,Hamburg.
Degens, E.T., Kempe, S. and Richey, J. (1990) Summary: biogeochemistry of major world rivers. In: Degens,E.T., Kempe, S. and Richey, J. (eds) Biogeochemistry of the Major World Rivers. John Wiley & Sons,Chichester, UK, pp. 323–332.
Delecluse, P., Servain, J., Levy, C., Arpe, K. and Bengtsson, L. (1994) On the connection between the 1984Atlantic warm event and the 1982–83 ENSO. Tellus 46A, 448–464.
DeMaster, D.J. and Aller, R.C. (2001) Biogeochemical processes on the Amazon shelf: changes in dissolvedand particulate fluxes during river/ocean mixing. In: Richey, J.E. (ed.) The Biogeochemistry of theAmazon Basin. Oxford University Press, Oxford, UK, pp. 328–357.
Depetris, P. and Paolini, J. (1990) Biochemical aspects of South American rivers: the Paraná and Orinoco.In: Degenes, E.T., Kempe, S. and Richey, J. (eds) Biogeochemistry of the Major World Rivers. John Wiley& Sons, Chichester, UK, pp. 105–125.
Déqué, M. and Servain, J. (1989) Teleconnections between tropical Atlantic sea surface temperatures andmidlatitude 50 kPa heights during 1964–1986. Journal of Climate 2, 929–945.
Devol, A.H. and Hedges, J.I. (2001) Organic matter and nutrients in the mainstem Amazon River. In:Richey, J.E. (ed.) The Biogeochemistry of the Amazon Basin. Oxford University Press, Oxford, UK, pp.275–306.
Devol, A.H., Richey, J., Forsberg, B.R. and Martinelli, L.A. (1994) Environmental methane in the Amazonriver floodplain. In: Mitsch, W.J. (ed.) Global Wetlands. Elsevier, London, pp. 151–165.
Diaz de Gamero, M.L. (1996) The changing course of the Orinoco River during the Neogene: a review.Paleogeography, Palaeoclimatology, Palaeoecology 123, 385–402.
Dickinson, R.E. (1978) Rossby waves – long-period oscillations of oceans and atmospheres. Annual Reviewof Fluid Mechanics 10, 185–195.
Dietz, R.S. and Holden, J.C. (1970) The breakup of Pangaea. Scientific American 223, 30–41.Dommenget, D. and Latif, M. (2001) Interannual to decadal variability in the tropical Atlantic. Journal of
Climate 13, 777–792.Drexel, J.F., Preiss, W.V. and Parker, A.J. (eds) (1993) The Geology of South Australia 1. The Precambrian.
South Australia State Print, South Australia.Dubroeucq, D. and Volkaff, B. (1998) From oxisols to spodosols and histosols: evolution of the soil mantles
in the Rio Negro basin (Amazonia). Catena 32, 245–280.Dubroeucq, D., Volkaff, B. and Faure, P. (1999) Les couvertures pédologiques á Podzols du Bassin du Haut
Rio Negro (Amazonie). Étude et Gestion des Sols 6, 131–153.Duivenvoorden, J.F. and Lips, J.M. (1995) A Land–Ecological Study of Soils, Vegetation and Plant Diversity
in Colombian Amazonia. Tropenbos Foundation, Wageningen, The Netherlands.Duivenvoorden, J.F. and Lips, J.M. (1998) Mesoscale patterns of tree species diversity in Colombian
Amazonia. In: Comiskey, J.A. (ed.) Forest Biodiversity in North, Central and South America, and theCaribbean. Parthenon, Paris, pp. 535–550.
Echezuria, H., Cordova, J., Gonzalez, M., Gonzalez, V., Mendez, J. and Yanes, C. (2002) Assessment of envi-ronmental changes in the Orinoco River delta. Regional Environmental Change 3, 20–35.
Eckhardt, F.E.W. (1985) Solubilization, transport, and deposition of mineral cations by microorganisms – effi-cient rock weathering agents. In: Drever, J.I. (ed.) The Chemistry of Weathering. D. Reidel, Dordrecht,The Netherlands, pp. 161–174.
EDC (1996) GTOPO30 (a Digital Elevation Model). USGS EROS Data Center, Washington, DC.Eddy, J.A. (1976) The Maunder minimum. Science 192, 1189–1192.Eden, M.J. (1964) The Savanna Ecosystem – Northern Rupununi, British Guiana. Department of Geography,
McGill University, Montreal.Eden, M.J., McGregor, D.F.M. and Morelo, J.A. (1982) Geomorphology of the middle Caquetá basin of east-
ern Colombia. Zeitschrift für Geomorphologie N.F. 26, 343–364.

176 D.S. Hammond
Eden, M.J., Bray, W., Herrera, L. and McEwan, C. (1984) Terra preta soils and their archaeological contextin the Caquetá basin of southeast Colombia. American Antiquity 49, 125–140.
Edmond, J.M., Palmer, M.R., Measures, C.I., Grant, B. and Stallard, R.F. (1995) The fluvial geochemistry anddenudation rate of the Guayana Shield in the Venezuela, Colombia, and Brazil. Geochemica etCosmochimica Acta 59, 3301–3325.
Edmond, J.M., Palmer, M.R., Measures, C.I., Brown, E.T. and Huh, Y. (1996) Fluvial geochemistry of the east-ern slope of the northeastern Andes and its foredeep in the drainage of the Orinoco in Colombia andVenezuela. Geochemica et Cosmochimica Acta 60, 2949–2974.
Edwards, A.M.C. and Thornes, J.B. (1970) Observations on the dissolved solids of the Casiquiare and upperOrinoco, April–June 1968. Amazoniana 2, 245–256.
Edwards, M.H. (1986) Digital image processing of local and global bathymetric data. Masters thesis.Washington University, St Louis, Missouri.
Edwards, R.L., Chang, H., Murrell, M.T. and Goldstein, S.J. (1997) Protactinium-231 dating of carbonates bythermal ionization mass spectrometry: implications for Quaternary climate change. Science 276,782–786.
Egge, J.K. and Aksnes, D.L. (1992) Silicate as a regulating nutrient in phytoplankton competition. MarineEcol. Prog. Ser. 83, 281–289.
Eisma, B.R. and van der Marel, H.W. (1971) Marine mud along the Guiana coast and their origin from theAmazon Basin. Contributions to Mineralogy and Petrology 31, 321–334.
Elkibbi, M. and Rial, J.A. (2001) An outsider’s review of the astronomical theory of the climate: is the eccen-tricity-driven insolation the main driver of the ice ages? Earth-Science Reviews 56, 161–177.
Eltahir, E.A.B. and Bras, R.L. (1994) Precipitation recycling in the Amazon basin. Quarterly Journal of theRoyal Meteorological Society 120, 861–880.
EMBRAPA-CNPS (1999) Sistema Brasileiro de Classificacao de Solos. Embrapa Produção da Informação, Riode Janeiro.
Enfield, D.B. (1996) Relationships of inter-American rainfall to tropical Atlantic and Pacific SST variability.Geophysical Research Letters 23, 3505–3508.
Enfield, D.B. and Alfaro, E.J. (1999) The dependence of Caribbean rainfall on the interaction of the tropicalAtlantic and Pacific Oceans. Journal of Climate 12, 2093–2103.
Enfield, D.B. and Mayer, D.A. (1997) Tropical Atlantic SST variability and its relation to El Niño-SouthernOscillation. Journal of Geophysical Research 102, 929–945.
Ertel, J., Hedges, J.I., Richey, J., Devol, A.H. and dos Santos, U. (1986) Dissolved humic substances of theAmazon river system. Limnology and Oceanography 31, 739–754.
Estrada, J. and Fuertes, J. (1993) Estudios en la Guayana colombiana IV. Notas sobres la vegetación y la florade la sierra de Chiribiquete. Revista de la Academia Colombiana de Ciencias Exactas, Físicas yNaturales 18, 483–497.
Fanshawe, D.B. (1952) The Vegetation of British Guiana: A Preliminary Review. Imperial Forestry Institute,Oxford, UK.
FAO (1965) A report to accompany a general soil map of British Guiana. FAO, Rome.FAO (1988) Soil Map of the World. Revised Legend. FAO, Rome.FAO (1998) World Reference Base for Soil Resources. FAO, Rome.FAO-UNESCO (1974) Soil Map of the World 1:5000000. Vol. 1. Legend. UNESCO, Paris.Farjalla, V.F., Esteves, F.A., Bozelli, R.L. and Roland, F. (2002) Nutrient limitation of bacterial production in
clear water Amazonian ecosystems. Hydrobiologia 489, 197–205.Fearnside, P.M. (1995) Hydroelectric dams in the Brazilian Amazon as sources of ‘greenhouse gasses’.
Environmental Conservation 22, 7–19.Fearnside, P.M. (1997) Greenhouse gas emissions from Amazonian hydroelectric reservoirs: the example
of Brazil’s Tucurui dam as compared to fossil fuel alternatives. Environmental Conservation 24,64–75.
Ferraz-Vicentini, K.R. and Salgado-Labouriau, M.L. (1996) Palynological analysis of a palm swamp in CentralBrazil. Journal of South American Earth Sciences 9, 207–219.
Figueroa, N. and Nobre, C.A. (1990) Precipitation distribution over central and western tropical SouthAmerica. Climanálise 5, 36–42.
Filho, A.C., Schwartz, D., Tatumi, S.H. and T. Rosique (2002) Amazonian paleodunes provide evidence fordrier climate phases during the late Pleistocene-Holocene. Quaternary Research 58, 205–209.
Finkel, R.C. and Nishiizumi, K. (1997) Beryllium 10 concentrations in the Greenland Ice Sheet Project 2 icecore from 3–40 ka. Journal of Geophysical Research 102, 26699–26706.

Biophysical Features of the Guiana Shield 177
Fittkau, E.J. (1971) Ökologische Gliederung des Amazonas-Gebietes auf geochemischer Grundlage.Münstersche Forschungen zur Geologie und Paläontologie 20, 35–50.
Flenley, J.R. (1998) Tropical forests under the climates of the last 30,000 years. Climatic Change 39,177–197.
Flood, R.D., Piper, D.J.W., Klaus, A. and Peterson, L.C. (eds) (1997) Amazon Fan. ODP, College Station, Texas.Folland, C.K., Karl, T.R., Christy, J.R., Clarke, R.A., Gruza, G.V., Jouzel, J., Mann, M.E., Oerlemans, J., Salinger,
M.J. and Wang, S.-W. (2001) Observed climate variability and change. In: Johnson, C.A. (ed.) ClimateChange 2001: The Scientific Basis. Contribution of the working group I to the third assessment report of theintergovernmental panel on climate change. Cambridge University Press, Cambridge, UK, pp. 101–181.
Fölster, H. (1985) Proton consumption rates in Holocene and present-day weathering of acid forest soils. In:Drever, J.I. (ed.) The Chemistry of Weathering. D. Reidel, Dordrecht, The Netherlands, pp. 197–210.
Fölster, H. (1992) Holocene autochthonous forest degradation in southeast Venezuela. In: Goldammer, J.G.(ed.) Tropical Forests in Transition. Birkhäuser, Basel, pp. 25–44.
Francis, J.K. and Knowles, O.H. (2001) Age of A2 horizon charcoal and forest structure near Porto Trombetas,Pará, Brazil. Biotropica 33, 385–392.
Franco, W. and Dezzeo, N. (1994) Soil and soil water regime in the terra firme-caatinga forest complex nearSan Carlos de Rio Negro, state of Amazonas, Venezuela. Interciencia 19, 305–316.
Franzinelli, E. and Igreja, H. (2002) Modern sedimentation in the lower Negro river, Amazonas State, Brazil.Geomorphology 44, 259–271.
Franzinelli, E. and Potter, P.E. (1983) Petrology, chemistry and texture of modern river sands, Amazon riversystem. Journal of Geology 91, 23–29.
Friis-Christensen, E. and Lassen, K. (1991) Length of the solar cycle: an indicator of solar activity closely asso-ciated with climate. Science 254, 698–700.
Fröhlich, C. and Lean, J. (1998) The Sun’s total irradiance: cycles, trends and related climate change uncer-tainties since 1976. Geophysical Research Letters 25, 4377–4380.
Froidefond, J.M., Pujos, M. and Andre, X. (1988) Migration of mud banks and changing coastline in FrenchGuiana. Marine Geology 84, 19–30.
Frost, D.B. (1968) The Climate of the Rupununi Savannas. McGill University, Montreal.Frost, I. (1988) A Holocene sedimentary record from Anañgucocha in the Ecuadorian Amazon. Ecology 69,
66–73.Fu, R., Dickinson, R.E., Chen, M. and Wang, H. (2001) How do tropical sea surface temperatures influence
the seasonal distribution of precipitation in the equatorial Amazon. Journal of Climate 14, 4003–4026.Fuentes, J. and Madero, A.J. (1996) Suelos. In: Huber, O. (ed.) Ecología de la Cuenca del Río Caura,
Venezuela. I. Caracterización General. UNEG/FIBV, Caracas, pp. 44–47.Furch, K. (1984) Water chemistry of the Amazon basin: the distribution of chemical elements among fresh-
waters. In: Sioli, H. (ed.) The Amazon. Limnology and Landscape Ecology of a Mighty Tropical Riverand its Basin. Dr. W. Junk, Dordrecht, The Netherlands, pp. 167–195.
Gallup, C.D., Cheng, H., Taylor, F.W. and Edwards, R.L. (2002) Direct determination of the timing of sealevel change during termination II. Science 295, 310–313.
Galvis, J., Huguett, A. and Ruge, P. (1979) Geologia de la Amazonia Colombiana. Boletín GeologicaIngeominas 22, 3–86.
Galy-Lacaux, C., Delmas, R., Jambert, C., Dumestre, J.-F., Labroue, L. and Richard, S. (1997) Gaseous emis-sions and oxygen consumption in hydroelectric dams. A case study in French Guiana. GlobalBiogeochemical Cycles 11, 471–483.
Ganopolski, A., Rahmstorf, S., Petoukhov, V. and Claussen, M. (1998) Simulation of modern and glacial cli-mates with a coupled global model of intermediate complexity. Nature 391, 351–356.
Gansser, A. (1954) Observations on the Guiana Shield (South America). Ecologae Geologicae Helvetiae 47,77–112.
Gansser, A. (1974) The Roraima problem (South America). Verhandlungen Naturforschenden GesellschaftBasel 84, 80–100.
García, S. (1996) Limnologia. In: Rosales, J. and Huber, O. (eds) Ecología de la Cuenca del Río Caura,Venezuela. I. Caracterización General. Refolit, Caracas, pp. 54–59.
Gavaud, M., Blancaneaux, P., Dubroeucq, D. and Pouyllau, M. (1986) Les paysages pédologiques del’Amazonie vénézuélienne. Cahiers ORSTOM, Série Pédologique 22, 265–284.
Gentry, A.H. (1990) Floristic similarities and differences between southern Central America and upper andcentral Amazonia. In Gentry, A.H. (ed.) Four Neotropical Forests. Yale University Press, New Haven,Connecticut, pp. 141–157.

178 D.S. Hammond
Gentry, A.H. (1993) A Field Guide to the Families and Genera of Woody Plants of Northwest South America.Conservation International, Washington, DC.
Giambelluca, T.W., Hölscher, D., Bastos, T.X., Frazão, R.R., Nullet, M.A. and Ziegler, A.D. (1997)Observations of albedo and radiation balance over postforest land surfaces in the Eastern AmazonBasin. Journal of Climate 10, 919–928.
Giannini, A., Cane, M.A. and Kushnir, Y. (2001) Interdecadal changes in the ENSO teleconnection to theCaribbean region and the North Atlantic Oscillation. Journal of Climate 14, 2867–2879.
Gibbs, A.K. and Barron, C.N. (1993) The Geology of the Guiana Shield. Oxford University Press, Oxford,UK.
Gibbs, R.J. (1967) The geochemistry of the Amazon river system. Part 1. The factors that control the salinityand the composition and concentration of the suspended solids. Geological Society of America Bulletin78, 1203–1232.
Gill, A.E. (1982) Atmosphere–Ocean Dynamics. Academic Press, New York.Giorgi, F. (2002) Dependence of the surface climate interannual variability on spatial scale. Geophysical
Research Letters 29, 2101–2106.Girard, J.-P., Freyssinet, P. and Morillon, A.-C. (2002) Oxygen isotope study of Cayenne duricrust paleosur-
faces: implications for past climate and laterization processes over French Guiana. Chemical Geology191, 329–343.
Glantz, M.H. (1998) Currents of Change: Impacts of El Nino and La Nina on Climate and Society. CambridgeUniversity Press, Cambridge, UK.
Glatzmaiers, G.A., Coe, R.S., Hongre, L. and Roberts, P.H. (1999) The role of the Earth’s mantle in control-ling the frequency of geomagnetic reversals. Nature 401, 885–890.
Goldblatt, P. (1993) Biological relationships between Africa and South America: an overview. In: Goldblatt,P. (ed.) Biological Relationships Between Africa and South America. Yale University Press, New Haven,Connecticut.
Goodwin, A. (1996) Principles of Precambrian Geology. Academic Press, New York.Goulding, M., Carvalho, M.L. and Ferreira, E.G. (1988) Rio Negro: Rich Life in Poor Water. SPB Academic,
The Hague, The Netherlands.Graham, N.E. and Barnett, T.P. (1987) Sea surface temperature, surface wind divergence and convection
over tropical oceans. Science 238, 657–659.Grimaldi, M. and Riéra, B. (2001) Geography and climate. In: Théry, M. (ed.) Nouragues – Dynamics and
Plant–Animal Interactions in a Neotropical Rain Forest. Kluwer Academic, Dordrecht, The Netherlands,pp. 9–18.
Groeneweg, W. and Bosma, W. (1969) Review of the stratigraphy of Suriname. In: 8th Guiana GeologicalConference, Georgetown, Guyana, pp. 1–29.
Grubb, P.J. and Whitmore, T.C. (1966) A comparison of montane and lowland forest in Ecuador. II. Theclimate and its effects on the distribution and physiognomy of the forests. Journal of Ecology 54,303–333.
Guilderson, T.P., Fairbanks, R.G. and Rubenstone, J.L. (1994) Tropical temperature variations since 20,000years ago: modulating interhemispheric climate change. Science 263, 663–665.
Guilderson, T.P., Fairbanks, R.G. and Rubenstone, J.L. (2001a) Barbados Coral Oxygen Isotope Data. #2001-010. World Data Center for Paleoclimatology, Boulder, Colorado.
Guilderson, T.P., Fairbanks, R.G. and Rubenstone, J.L. (2001b) Tropical Atlantic coral oxygen isotopes: gla-cial–interglacial sea surface temperatures and climatic change. Marine Geology 172, 75–89.
Guyot, J.L. and Wasson, J.G. (1994) Regional pattern of riverine dissolved organic carbon in the Amazondrainage basin in Bolivia. Limnology and Oceanography 39, 452–458.
Guyot, J.L., Jouanneau, J.M., Quintanilla, J. and Wasson, J.G. (1993) Les flux de matières dissoutes et partic-ulaires exportés des Andes par le Rio Béni (Amazonie Bolivienne), en période de crue. GeodinamicaActa (Paris) 6, 233–241.
Guyot, J.L., Jouanneau, J.M. and Wasson, J.G. (1999) Characterisation of river bed and suspended sedimentsin the Rio Madeira drainage basin (Bolivian Amazonia). Journal of South American Earth Sciences 4,401–410.
Haberle, S. (1997) Upper quaternary vegetation and climate history of the Amazon Basin: correlating marineand terrestrial pollen records. In: Peterson, L.C. (ed.) Proceedings of the Ocean Drilling Program,Scientific Results. ODP, College Station, Texas, pp. 381–396.
Haffer, J. (1969) Speciation in Amazonian forest birds. Science 165, 131–137.Haigh, J.D. (1996) The impact of solar variability on climate. Science 272, 981–984.

Biophysical Features of the Guiana Shield 179
Häkkinen, S. and Mo, K.C. (2002) The low-frequency variability of the tropical Atlantic Ocean. Journal ofClimate 15, 237–250.
Hall, J.B. and Swaine, M.D. (1976) Classification and ecology of closed canopy forest in Ghana. Journal ofEcology 64, 913–951.
Halmer, M.M. and Schminke, H.-J. (2003) The impact of moderate-scale explosive eruptions on statosphericgas injections. Bulletin of Volcanology 65, 433–440.
Hameed, S., Meinster, A. and Sperber, K. R. (1993) Teleconnections of the Southern Oscillation in the trop-ical Atlantic sector in the OSU coupled upper ocean–atmosphere GCM. Journal of Climate 6, 487–498.
Hamilton, S.K., Sippel, S.J. and Melack, J.M. (2002) Comparison of inundation patterns among major SouthAmerican floodplains. Journal of Geophysical Research 107 (D20), 8038.
Hammond, D.S. and ter Steege, H. (1998) Propensity for fire in the Guianan rainforests. Conservation Biology12, 944–947.
Hanley, D.E., Bourassa, M.A., O’Brien, J.J., Smith, S.R. and Spade, E.R. (2003) A quantitative evaluation ofthe ENSO indices. Journal of Climate 16, 1249–1258.
Hansen, J., Johnson, D., Lacis, A., Lebedeff, S., Lee, P., Rind, D. and Russell, G. (1981) Climate impact ofincreasing atmospheric carbon dioxide. Science 213, 957–966.
Hardy, F. and Follet-Smith, R.R. (1931) Studies in tropical soils. 2. Some characteristic igneous rock soil pro-files in British Guiana, South America. Journal of Agricultural Science 21, 739–761.
Haripersad-Makhanlal, A. and Ouboter, P.E. (1993) Limnology: physico-chemical parameters and phyto-plankton composition. In: Ouboter, P.E. (ed.) The Freshwater Ecosystems of Suriname. KluwerAcademic, Dordrecht, The Netherlands, pp. 53–75.
Harrison, C.G.A. (1990) Long-term eustasy and epeirogeny in continents. In: Revelle, R.R. (ed.) Sea-LevelChange. National Academy Press, Washington, DC, pp. 141–158.
Harrison, D.E. and Vecchi, G.A. (1999) On the termination of El Niño. Geophysical Research Letters 26,1593–1596.
Harrison, J.B. and Reid, K.D. (1911) Formation of laterite from a practically quartz-free diabase. GeologicalMagazine 8, 120, 355, 477.
Hastenrath, S. (1984a) Interannual variability and annual cycle: mechanisms of circulation and climate in thetropical Atlantic sector. Monthly Weather Review 112, 1097–1107.
Hastenrath, S. (1984b) Predictability of Northeast Brazil drought. Nature 307, 531–533.Hastenrath, S. and Heller, L. (1977) Dynamics of climate hazards in northeast Brazil. Quarterly Journal of the
Royal Meteorological Society 103, 77–92.Hastenrath, S., Greischar, L., Colón, E. and Gil, A. (1999) Forecasting the anomalous discharge of the Caroni
river, Venezuela. Journal of Climate 12, 2673–2678.Haug, G.H., Hughen, K.A., Sigman, D.M., Peterson, L.C. and Rohl, U. (2001) Southward migration of the
Intertropical Convergence Zone through the Holocene. Science 293, 1304–1308.Haug, G.M.W. (1966) Verslag van het veldwerk in het stroomgebeid van de Paloemeu. GMD Informatie
17/66, Geologie Mijnbouw Dienst Suriname, Paramaribo.Hawkes, M.D. and Wall, J.R.D. (1993) The Commonwealth and Government of Guyana Iwokrama Rain
Forest Programme: Phase 1 Site Resource Survey. Natural Resources Institute, Chatham, UK.Haxby, W.F. (1983) Digital images of combined oceanic and continental data sets and their use in tectonic
studies. EOS Transactions of the American Physical Union 64, 995–1004.Hays, J.D., Imbrie, J. and Shackleton, N.J. (1976) Variations in the earth’s orbit: pacemaker of the ice ages.
Science 194, 1121–1132.Heyligers, P.C. (1963) Vegetation and soil of a white-sand savanna in Suriname. Verhandelingen der
Koninklijke Nederlandse Akademie van Wetenschappen, Afd. Natuurkunde 54, 1–148.Hiez, G. and Dubreuil, P. (1964) Les Régimes Hydrologiqes en Guyane Francaise. ORSTOM, Paris.Hoag, R.E. (1987) Characterization of soils on floodplain of tributaries flowing into the Amazon River in Peru.
PhD thesis. North Carolina State University, Raleigh, North Carolina.Hoffmann, P.F. (1989) Precambrian geology and tectonic history of North America. In: Bally, A.W. and
Palmer, A.R. (eds) The Geology of North America – an Overview. The Geological Society of America,Boulder, Colorado, pp. 447–512.
Hole, F.D. (1961) A classification of pedoturbations and some other processes and factors of soil formationin relation to isotropism and anisotropism. Soil Science 91, 375–377.
Hooghiemstra, H. and van der Hammen, T. (1998) Neogene and Quaternary development of the neotropi-cal rain forest: the forest refugia hypothesis, and a literature review. Earth-Science Reviews 44,147–183.

180 D.S. Hammond
Hoorn, C. (1993) Marine incursion and the influence of Andean tectonics on the Miocene depositional his-tory of northwestern Amazonia: results of a palynostratigraphic study. Palaeogeography,Palaeoclimatology, Palaeoecology 105, 267–309.
Horn, S.P. and Sanford, R.L. (1992) Holocene fires in Costa Rica. Biotropica 24, 354–361.Houghton, R.W. and Tourre, Y.M. (1992) Characteristics of low-frequency sea surface temperature fluctua-
tions in the tropical Atlantic. Journal of Climate 5, 765–772.Hoyt, D.V. and Schatten, K.H. (1997) The Role of the Sun in Climate Change. Oxford University Press,
Oxford, UK.Huang, B. and Shukla, J. (1997) Characteristics of the interannual and decadal variability in a general
circulation model of the tropical Atlantic Ocean. Journal of Physical Oceanography 27, 1693–1712.
Huang, J.-P., Higuchi, K. and Shabbar, A. (1998) The relationship between the North Atlantic Oscillation andthe El Niño-Southern Oscillation. Geophysical Research Letters 25, 2707–2716.
Huber, O. (1995a) Geographical and physical features. In: Berry, P.E., Holst, B.K. and Yatskievych, K. (eds)Flora of the Venezuelan Guayana. Timber Press, Portland, Oregon, pp. 1–62.
Huber, O. (1995b) Vegetation. In: Berry, P.E., Holst, B.K. and Yatskievych, K. (eds) Flora of the VenezuelanGuayana. Timber Press, Portland, Oregon, pp. 97–160.
Huston, M.A. (1980) Soil nutrients and tree species richness in Costa Rican forests. Journal of Biogeography7, 147–157.
Huston, M.A. (1994) Biological Diversity: the Coexistence of Species on Changing Landscapes. CambridgeUniversity Press, Cambridge, UK.
Hydromet (1971–1976) Annual Climatological Data Summary. Guyana Hydrometeorological Service(Ministry of Public Works and Transport), Georgetown.
Hydromet (1974–2002) Monthly Weather Bulletin. Guyana Hydrometeorological Service (Ministry ofAgriculture), Georgetown.
Hydrometeorological Service (1980) Annual Surface Water Data – 1969. Hydrometeorological Service,Georgetown, Guyana.
Hydrometeorological Service (1981) Annual Surface Water Data – 1970. Hydrometeorological Service,Georgetown, Guyana.
Hydrometeorological Service (1982) Annual Surface Water Data – 1971. Hydrometeorological Service,Georgetown, Guyana.
Hydrometeorological Service (1985) Annual Surface Water Data – 1972. Hydrometeorological Service,Georgetown, Guyana.
Hydrometeorological Service (2001) Berbice river basin, surface water data (1975–1995)Hydrometeorological Service, Georgetown, Guyana.
Ichiye, T. and Peterson, J. (1963) The anomalous rainfall of the 1957–58 winter in the equatorial centralPacific arid area. Journal of the Meteorological Society of Japan 41, 172–182.
IGAC (1993) Aspectos Ambientales para el Ordenamiento Territorial del Occidente del Departamento delCaquetá. Tomo I, Capítulos I–III. IGAC, Bogotá.
Imbrie, J. and Imbrie, J.Z. (1980) Modeling the climate response to orbital variations. Science 202, 943–953.Imbrie, J., Hays, J.D., Martinson, D.G., McIntyre, A., Mix, A.C., Moreley, J.J., Pisias, N.G., Prell, W.L. and
Shackleton, N.J. (1984) The orbital theory of Pleistocene climate: support from a revised chronology ofthe marine 18O record. In: Berger, A. (ed.) Milankovitch and Climate. D. Reidel, Dordrecht, TheNetherlands, pp. 269–306.
Irion, G. (1976) Quaternary sediments of the upper Amazon lowlands of Brazil. Biogeographica 7, 163–167.Irion, G. (1984) Sedimentation and sediments of the Amazonian rivers and evolution of the Amazonian land-
scape since Pliocene times. In: Sioli, H. (ed.) The Amazon. Limnology and Landscape Ecology of aMighty Tropical River and its Basin. Dr. W. Junk, Dordrecht, The Netherlands, pp. 201–213.
Irion, G. (1990) Minerals in rivers. In: Degenes, E.T., Kempe, S. and Richey, J. (eds) Biogeochemistry of theMajor World Rivers. John Wiley & Sons, Chichester, UK, pp. 265–281.
Iriondo, M.H. (1997) Models of deposition of loess and loessoids in the upper Quaternary of South America.Journal of South American Earth Sciences 10, 71–79.
Jackson, J.B.C., Budd, A.F. and Coates, A.G. (1996) Evolution and Environment in Tropical America. ChicagoUniversity Press, Chicago, Illinois.
Jenny, H. (1980) The Soil Resource: Origin and Behaviour. Springer, New York.Jetten, V.G. (1994) Modelling the Effects of Logging on the Water Balance of a Tropical Rain Forest. A Study
in Guyana. Tropenbos Foundation, Wageningen, The Netherlands.

Biophysical Features of the Guiana Shield 181
Johnson, A.M. (1976) The climate of Peru, Bolivia and Ecuador. In: Schwerdtfeger, W. (ed.) Climates ofCentral and South America. Elsevier, Oxford, UK, pp. 147–218.
Jones, C., Mahowald, N. and Luo, C. (2003) The role of easterly waves on African desert dust transport.Journal of Climate 16, 3617–3628.
Jones, P.D., Parker, D.E., Osborn, T.J. and Briffa, K.R. (1999) Global and hemispheric temperature anomalies– land and marine instrument records. In: Carbon Dioxide Information Analysis Center (ed.) Trends: ACompendium of Data on Global Change. Carbon Dioxide Information Analysis Center, Oak RidgeNational Laboratory, US Department of Energy, Oak Ridge, Tennessee.
Jordan, C.J. and Herrera, R. (1981) Tropical rainforests: are nutrients really critical? American Naturalist 117,167–180.
Joshi, M.M. and Shine, K.P. (2003) A GCM study of volcanic eruptions as a cause of increased stratosphericwater vapour. Journal of Climate 16, 3525–3534.
Junk, W.J. (1993) Wetlands of tropical South America. In: Whigham, D.F. (ed.) Wetlands of the World:Inventory, Ecology and Management. Kluwer Academic, Dordrecht, The Netherlands, pp. 679–739.
Kalliokoski, J. (1965) Geology of north-central Guyana Shield, Venezuela. Geological Society of AmericaBulletin 76, 1027–1050.
Kennedy, L.M. and Horn, S.P. (1997) Prehistoric maize cultivation at the La Selva biological station, CostaRica. Biotropica 29, 368–370.
Kennett, J.P. and Barker, P.F. (1990) Latest Cretaceous to Cenozoic climate and oceanographic developmentsin the Weddell Sea, Antarctica: an ocean-drilling perspective. In: Kennet, J.P. (ed.) Proceedings of theOcean Drilling Program, Scientific Results. ODP, College Station, Texas, pp. 937–960.
Kent, D.V. and Gradstein, F.M. (1985) A Cretaceous and Jurassic geochronology. Bulletin of the GeologicalSociety of America 96, 1419–1427.
Kessler, W.S. and McPhaden, M.J. (1995) Forcing of intraseasonal Kelvin waves in the equatorial Pacific.Journal of Geophysical Research 100, 10613–10631.
Khan, Z., Paul, S. and Cummings, D. (1980) Mabura Hill – Upper Demerara Forestry Project: SoilsInvestigation. Report No. 1. NARI, Ministry of Agriculture, Georgetown, Guyana.
Khobzi, J., Kroonenberg, S.B., Favre, P. and Weeda, A. (1980) Aspectos geomorfologicos de la Amazonia yOrinoquia Colombianas. Revista CIAF 5, 97–126.
Kidson, J.W. (1975) Tropical eigenvector analysis and the Southern Oscillation. Monthly Weather Review103, 187–196.
Kiladis, G.N. and Diaz, H.F. (1986) An analysis of the 1877–78 ENSO episode and comparison with the1982–83. Monthly Weather Review 114, 1035–1047.
Kiladis, G.N. and Diaz, H.F. (1989) Global climatic anomalies associated with extremes in the SouthernOscillation. Journal of Climate 2, 1069–1090.
Kirchner, I. and Graf, H.-F. (1995) Volcanoes and El Nino: signal separation in northern hemisphere winter.Climate Dynamics 11, 341–358.
Klammer, G. (1984) The relief of the extra-Andean Amazon basin. In: Sioli, H. (ed.) The Amazon: Limnologyand Landscape Ecology of a Mighty Tropical River and its Basin. Dr. W. Junk, Dordrecht, TheNetherlands, pp. 47–83.
Klinge, H. (1968) Report on Tropical Podzols. FAO, Rome.Kloosterman, J.B. (1973) Vulcoes gigantes do tipo anelar no Escudo das Guianas. Miner. Metal. 36, 52–58.Können, G.P., Jones, P.D., Kaltofen, M.H. and Allan, R.J. (1998) Pre-1866 extensions of the Southern
Oscillation Index using early Indonesian and Tahitian meteorological readings. Journal of Climate 11,2325–2339.
Köppen, W. (1918) Klassifikation der Klimate nach temperatur, niederschlag und jahreslauf. Peterm.Geographische Mitteilungen 64, 193–203.
Koster, R.D. and Suarez, M.J. (1995) Relative contributions of land and ocean processes to precipitation vari-ability. Journal of Geophysical Research 100, 13775–13790.
Kouadio, Y.K., Ochou, D.A. and Servain, J. (2003) Tropical Atlantic and rainfall variability in Cote d’Ivoire.Geophysical Research Letters 30, 8005–8012.
Kousky, V.E. (1980) Diurnal rainfall variation in northeast Brazil. Monthly Weather Review 108, 488–498.Kousky, V.E., Kagano, M.T. and Cavalcant, I.F. (1984) A review of the Southern Oscillation: oceanic–atmos-
pheric circulation changes and related rainfall anomalies. Tellus 36, 490–504.Krook, L. (1969) The origin of bauxite in the coastal plains of Suriname and Guyana. Geologie en Mijnbouw
Dienst van Suriname 20.Krook, L. (1979) Sediment petrographical studies in Northern Suriname. PhD thesis, Vrije Universiteit,
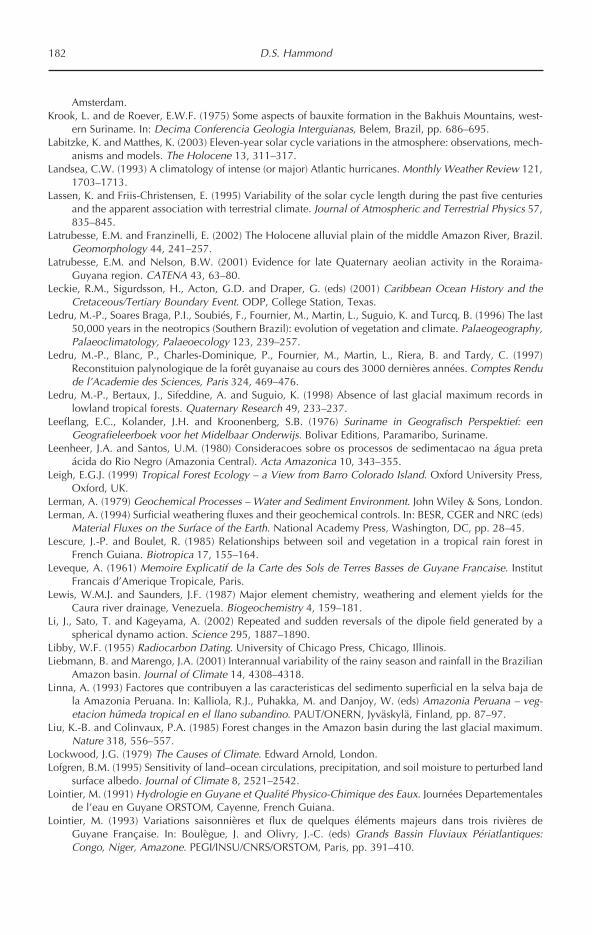
182 D.S. Hammond
Amsterdam.Krook, L. and de Roever, E.W.F. (1975) Some aspects of bauxite formation in the Bakhuis Mountains, west-
ern Suriname. In: Decima Conferencia Geologia Interguianas, Belem, Brazil, pp. 686–695.Labitzke, K. and Matthes, K. (2003) Eleven-year solar cycle variations in the atmosphere: observations, mech-
anisms and models. The Holocene 13, 311–317.Landsea, C.W. (1993) A climatology of intense (or major) Atlantic hurricanes. Monthly Weather Review 121,
1703–1713.Lassen, K. and Friis-Christensen, E. (1995) Variability of the solar cycle length during the past five centuries
and the apparent association with terrestrial climate. Journal of Atmospheric and Terrestrial Physics 57,835–845.
Latrubesse, E.M. and Franzinelli, E. (2002) The Holocene alluvial plain of the middle Amazon River, Brazil.Geomorphology 44, 241–257.
Latrubesse, E.M. and Nelson, B.W. (2001) Evidence for late Quaternary aeolian activity in the Roraima-Guyana region. CATENA 43, 63–80.
Leckie, R.M., Sigurdsson, H., Acton, G.D. and Draper, G. (eds) (2001) Caribbean Ocean History and theCretaceous/Tertiary Boundary Event. ODP, College Station, Texas.
Ledru, M.-P., Soares Braga, P.I., Soubiés, F., Fournier, M., Martin, L., Suguio, K. and Turcq, B. (1996) The last50,000 years in the neotropics (Southern Brazil): evolution of vegetation and climate. Palaeogeography,Palaeoclimatology, Palaeoecology 123, 239–257.
Ledru, M.-P., Blanc, P., Charles-Dominique, P., Fournier, M., Martin, L., Riera, B. and Tardy, C. (1997)Reconstituion palynologique de la forêt guyanaise au cours des 3000 dernières années. Comptes Rendude l’Academie des Sciences, Paris 324, 469–476.
Ledru, M.-P., Bertaux, J., Sifeddine, A. and Suguio, K. (1998) Absence of last glacial maximum records inlowland tropical forests. Quaternary Research 49, 233–237.
Leeflang, E.C., Kolander, J.H. and Kroonenberg, S.B. (1976) Suriname in Geografisch Perspektief: eenGeografieleerboek voor het Midelbaar Onderwijs. Bolivar Editions, Paramaribo, Suriname.
Leenheer, J.A. and Santos, U.M. (1980) Consideracoes sobre os processos de sedimentacao na água pretaácida do Rio Negro (Amazonia Central). Acta Amazonica 10, 343–355.
Leigh, E.G.J. (1999) Tropical Forest Ecology – a View from Barro Colorado Island. Oxford University Press,Oxford, UK.
Lerman, A. (1979) Geochemical Processes – Water and Sediment Environment. John Wiley & Sons, London.Lerman, A. (1994) Surficial weathering fluxes and their geochemical controls. In: BESR, CGER and NRC (eds)
Material Fluxes on the Surface of the Earth. National Academy Press, Washington, DC, pp. 28–45.Lescure, J.-P. and Boulet, R. (1985) Relationships between soil and vegetation in a tropical rain forest in
French Guiana. Biotropica 17, 155–164.Leveque, A. (1961) Memoire Explicatif de la Carte des Sols de Terres Basses de Guyane Francaise. Institut
Francais d’Amerique Tropicale, Paris.Lewis, W.M.J. and Saunders, J.F. (1987) Major element chemistry, weathering and element yields for the
Caura river drainage, Venezuela. Biogeochemistry 4, 159–181.Li, J., Sato, T. and Kageyama, A. (2002) Repeated and sudden reversals of the dipole field generated by a
spherical dynamo action. Science 295, 1887–1890.Libby, W.F. (1955) Radiocarbon Dating. University of Chicago Press, Chicago, Illinois.Liebmann, B. and Marengo, J.A. (2001) Interannual variability of the rainy season and rainfall in the Brazilian
Amazon basin. Journal of Climate 14, 4308–4318.Linna, A. (1993) Factores que contribuyen a las caracteristicas del sedimento superficial en la selva baja de
la Amazonia Peruana. In: Kalliola, R.J., Puhakka, M. and Danjoy, W. (eds) Amazonia Peruana – veg-etacion húmeda tropical en el llano subandino. PAUT/ONERN, Jyväskylä, Finland, pp. 87–97.
Liu, K.-B. and Colinvaux, P.A. (1985) Forest changes in the Amazon basin during the last glacial maximum.Nature 318, 556–557.
Lockwood, J.G. (1979) The Causes of Climate. Edward Arnold, London.Lofgren, B.M. (1995) Sensitivity of land–ocean circulations, precipitation, and soil moisture to perturbed land
surface albedo. Journal of Climate 8, 2521–2542.Lointier, M. (1991) Hydrologie en Guyane et Qualité Physico-Chimique des Eaux. Journées Departementales
de l’eau en Guyane ORSTOM, Cayenne, French Guiana.Lointier, M. (1993) Variations saisonnières et flux de quelques éléments majeurs dans trois rivières de
Guyane Française. In: Boulègue, J. and Olivry, J.-C. (eds) Grands Bassin Fluviaux Périatlantiques:Congo, Niger, Amazone. PEGI/INSU/CNRS/ORSTOM, Paris, pp. 391–410.
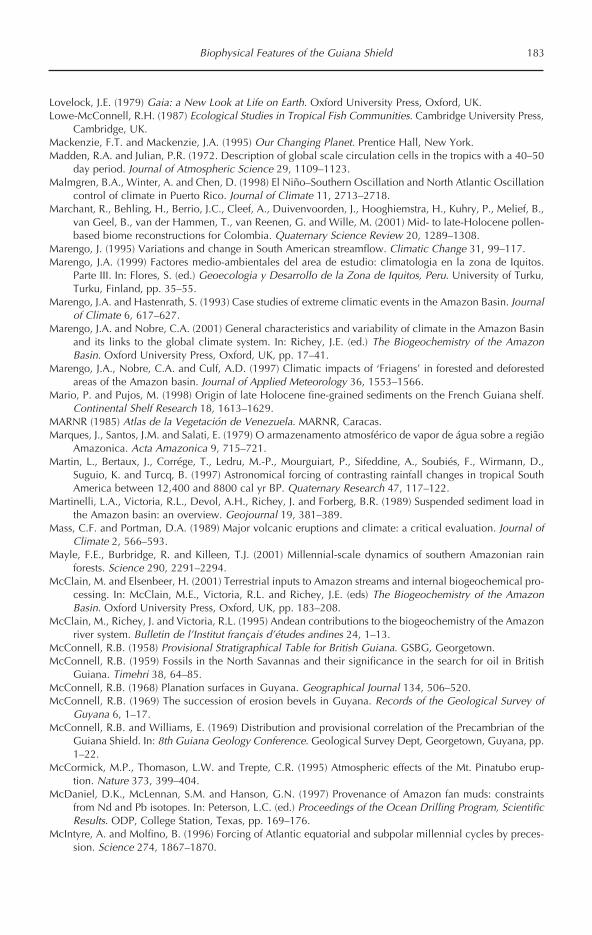
Biophysical Features of the Guiana Shield 183
Lovelock, J.E. (1979) Gaia: a New Look at Life on Earth. Oxford University Press, Oxford, UK.Lowe-McConnell, R.H. (1987) Ecological Studies in Tropical Fish Communities. Cambridge University Press,
Cambridge, UK.Mackenzie, F.T. and Mackenzie, J.A. (1995) Our Changing Planet. Prentice Hall, New York.Madden, R.A. and Julian, P.R. (1972. Description of global scale circulation cells in the tropics with a 40–50
day period. Journal of Atmospheric Science 29, 1109–1123.Malmgren, B.A., Winter, A. and Chen, D. (1998) El Niño–Southern Oscillation and North Atlantic Oscillation
control of climate in Puerto Rico. Journal of Climate 11, 2713–2718.Marchant, R., Behling, H., Berrio, J.C., Cleef, A., Duivenvoorden, J., Hooghiemstra, H., Kuhry, P., Melief, B.,
van Geel, B., van der Hammen, T., van Reenen, G. and Wille, M. (2001) Mid- to late-Holocene pollen-based biome reconstructions for Colombia. Quaternary Science Review 20, 1289–1308.
Marengo, J. (1995) Variations and change in South American streamflow. Climatic Change 31, 99–117.Marengo, J.A. (1999) Factores medio-ambientales del area de estudio: climatologia en la zona de Iquitos.
Parte III. In: Flores, S. (ed.) Geoecologia y Desarrollo de la Zona de Iquitos, Peru. University of Turku,Turku, Finland, pp. 35–55.
Marengo, J.A. and Hastenrath, S. (1993) Case studies of extreme climatic events in the Amazon Basin. Journalof Climate 6, 617–627.
Marengo, J.A. and Nobre, C.A. (2001) General characteristics and variability of climate in the Amazon Basinand its links to the global climate system. In: Richey, J.E. (ed.) The Biogeochemistry of the AmazonBasin. Oxford University Press, Oxford, UK, pp. 17–41.
Marengo, J.A., Nobre, C.A. and Culf, A.D. (1997) Climatic impacts of ‘Friagens’ in forested and deforestedareas of the Amazon basin. Journal of Applied Meteorology 36, 1553–1566.
Mario, P. and Pujos, M. (1998) Origin of late Holocene fine-grained sediments on the French Guiana shelf.Continental Shelf Research 18, 1613–1629.
MARNR (1985) Atlas de la Vegetación de Venezuela. MARNR, Caracas.Marques, J., Santos, J.M. and Salati, E. (1979) O armazenamento atmosférico de vapor de água sobre a região
Amazonica. Acta Amazonica 9, 715–721.Martin, L., Bertaux, J., Corrége, T., Ledru, M.-P., Mourguiart, P., Sifeddine, A., Soubiés, F., Wirmann, D.,
Suguio, K. and Turcq, B. (1997) Astronomical forcing of contrasting rainfall changes in tropical SouthAmerica between 12,400 and 8800 cal yr BP. Quaternary Research 47, 117–122.
Martinelli, L.A., Victoria, R.L., Devol, A.H., Richey, J. and Forberg, B.R. (1989) Suspended sediment load inthe Amazon basin: an overview. Geojournal 19, 381–389.
Mass, C.F. and Portman, D.A. (1989) Major volcanic eruptions and climate: a critical evaluation. Journal ofClimate 2, 566–593.
Mayle, F.E., Burbridge, R. and Killeen, T.J. (2001) Millennial-scale dynamics of southern Amazonian rainforests. Science 290, 2291–2294.
McClain, M. and Elsenbeer, H. (2001) Terrestrial inputs to Amazon streams and internal biogeochemical pro-cessing. In: McClain, M.E., Victoria, R.L. and Richey, J.E. (eds) The Biogeochemistry of the AmazonBasin. Oxford University Press, Oxford, UK, pp. 183–208.
McClain, M., Richey, J. and Victoria, R.L. (1995) Andean contributions to the biogeochemistry of the Amazonriver system. Bulletin de l’Institut français d’études andines 24, 1–13.
McConnell, R.B. (1958) Provisional Stratigraphical Table for British Guiana. GSBG, Georgetown.McConnell, R.B. (1959) Fossils in the North Savannas and their significance in the search for oil in British
Guiana. Timehri 38, 64–85.McConnell, R.B. (1968) Planation surfaces in Guyana. Geographical Journal 134, 506–520.McConnell, R.B. (1969) The succession of erosion bevels in Guyana. Records of the Geological Survey of
Guyana 6, 1–17.McConnell, R.B. and Williams, E. (1969) Distribution and provisional correlation of the Precambrian of the
Guiana Shield. In: 8th Guiana Geology Conference. Geological Survey Dept, Georgetown, Guyana, pp.1–22.
McCormick, M.P., Thomason, L.W. and Trepte, C.R. (1995) Atmospheric effects of the Mt. Pinatubo erup-tion. Nature 373, 399–404.
McDaniel, D.K., McLennan, S.M. and Hanson, G.N. (1997) Provenance of Amazon fan muds: constraintsfrom Nd and Pb isotopes. In: Peterson, L.C. (ed.) Proceedings of the Ocean Drilling Program, ScientificResults. ODP, College Station, Texas, pp. 169–176.
McIntyre, A. and Molfino, B. (1996) Forcing of Atlantic equatorial and subpolar millennial cycles by preces-sion. Science 274, 1867–1870.
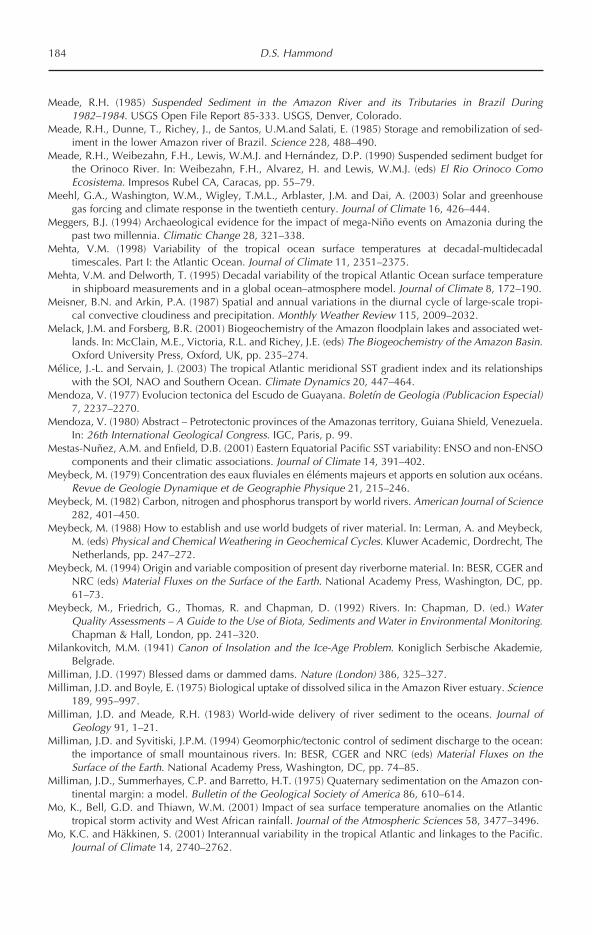
184 D.S. Hammond
Meade, R.H. (1985) Suspended Sediment in the Amazon River and its Tributaries in Brazil During1982–1984. USGS Open File Report 85-333. USGS, Denver, Colorado.
Meade, R.H., Dunne, T., Richey, J., de Santos, U.M.and Salati, E. (1985) Storage and remobilization of sed-iment in the lower Amazon river of Brazil. Science 228, 488–490.
Meade, R.H., Weibezahn, F.H., Lewis, W.M.J. and Hernández, D.P. (1990) Suspended sediment budget forthe Orinoco River. In: Weibezahn, F.H., Alvarez, H. and Lewis, W.M.J. (eds) El Rio Orinoco ComoEcosistema. Impresos Rubel CA, Caracas, pp. 55–79.
Meehl, G.A., Washington, W.M., Wigley, T.M.L., Arblaster, J.M. and Dai, A. (2003) Solar and greenhousegas forcing and climate response in the twentieth century. Journal of Climate 16, 426–444.
Meggers, B.J. (1994) Archaeological evidence for the impact of mega-Niño events on Amazonia during thepast two millennia. Climatic Change 28, 321–338.
Mehta, V.M. (1998) Variability of the tropical ocean surface temperatures at decadal-multidecadaltimescales. Part I: the Atlantic Ocean. Journal of Climate 11, 2351–2375.
Mehta, V.M. and Delworth, T. (1995) Decadal variability of the tropical Atlantic Ocean surface temperaturein shipboard measurements and in a global ocean–atmosphere model. Journal of Climate 8, 172–190.
Meisner, B.N. and Arkin, P.A. (1987) Spatial and annual variations in the diurnal cycle of large-scale tropi-cal convective cloudiness and precipitation. Monthly Weather Review 115, 2009–2032.
Melack, J.M. and Forsberg, B.R. (2001) Biogeochemistry of the Amazon floodplain lakes and associated wet-lands. In: McClain, M.E., Victoria, R.L. and Richey, J.E. (eds) The Biogeochemistry of the Amazon Basin.Oxford University Press, Oxford, UK, pp. 235–274.
Mélice, J.-L. and Servain, J. (2003) The tropical Atlantic meridional SST gradient index and its relationshipswith the SOI, NAO and Southern Ocean. Climate Dynamics 20, 447–464.
Mendoza, V. (1977) Evolucion tectonica del Escudo de Guayana. Boletín de Geologia (Publicacion Especial)7, 2237–2270.
Mendoza, V. (1980) Abstract – Petrotectonic provinces of the Amazonas territory, Guiana Shield, Venezuela.In: 26th International Geological Congress. IGC, Paris, p. 99.
Mestas-Nuñez, A.M. and Enfield, D.B. (2001) Eastern Equatorial Pacific SST variability: ENSO and non-ENSOcomponents and their climatic associations. Journal of Climate 14, 391–402.
Meybeck, M. (1979) Concentration des eaux fluviales en éléments majeurs et apports en solution aux océans.Revue de Geologie Dynamique et de Geographie Physique 21, 215–246.
Meybeck, M. (1982) Carbon, nitrogen and phosphorus transport by world rivers. American Journal of Science282, 401–450.
Meybeck, M. (1988) How to establish and use world budgets of river material. In: Lerman, A. and Meybeck,M. (eds) Physical and Chemical Weathering in Geochemical Cycles. Kluwer Academic, Dordrecht, TheNetherlands, pp. 247–272.
Meybeck, M. (1994) Origin and variable composition of present day riverborne material. In: BESR, CGER andNRC (eds) Material Fluxes on the Surface of the Earth. National Academy Press, Washington, DC, pp.61–73.
Meybeck, M., Friedrich, G., Thomas, R. and Chapman, D. (1992) Rivers. In: Chapman, D. (ed.) WaterQuality Assessments – A Guide to the Use of Biota, Sediments and Water in Environmental Monitoring.Chapman & Hall, London, pp. 241–320.
Milankovitch, M.M. (1941) Canon of Insolation and the Ice-Age Problem. Koniglich Serbische Akademie,Belgrade.
Milliman, J.D. (1997) Blessed dams or dammed dams. Nature (London) 386, 325–327.Milliman, J.D. and Boyle, E. (1975) Biological uptake of dissolved silica in the Amazon River estuary. Science
189, 995–997.Milliman, J.D. and Meade, R.H. (1983) World-wide delivery of river sediment to the oceans. Journal of
Geology 91, 1–21.Milliman, J.D. and Syvitiski, J.P.M. (1994) Geomorphic/tectonic control of sediment discharge to the ocean:
the importance of small mountainous rivers. In: BESR, CGER and NRC (eds) Material Fluxes on theSurface of the Earth. National Academy Press, Washington, DC, pp. 74–85.
Milliman, J.D., Summerhayes, C.P. and Barretto, H.T. (1975) Quaternary sedimentation on the Amazon con-tinental margin: a model. Bulletin of the Geological Society of America 86, 610–614.
Mo, K., Bell, G.D. and Thiawn, W.M. (2001) Impact of sea surface temperature anomalies on the Atlantictropical storm activity and West African rainfall. Journal of the Atmospheric Sciences 58, 3477–3496.
Mo, K.C. and Häkkinen, S. (2001) Interannual variability in the tropical Atlantic and linkages to the Pacific.Journal of Climate 14, 2740–2762.
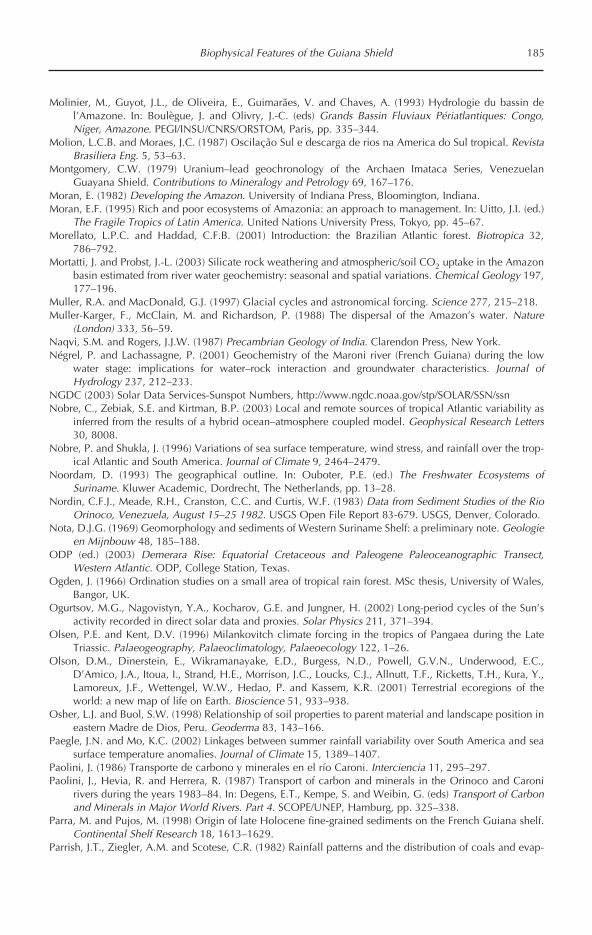
Biophysical Features of the Guiana Shield 185
Molinier, M., Guyot, J.L., de Oliveira, E., Guimarães, V. and Chaves, A. (1993) Hydrologie du bassin del’Amazone. In: Boulègue, J. and Olivry, J.-C. (eds) Grands Bassin Fluviaux Périatlantiques: Congo,Niger, Amazone. PEGI/INSU/CNRS/ORSTOM, Paris, pp. 335–344.
Molion, L.C.B. and Moraes, J.C. (1987) Oscilação Sul e descarga de rios na America do Sul tropical. RevistaBrasiliera Eng. 5, 53–63.
Montgomery, C.W. (1979) Uranium–lead geochronology of the Archaen Imataca Series, VenezuelanGuayana Shield. Contributions to Mineralogy and Petrology 69, 167–176.
Moran, E. (1982) Developing the Amazon. University of Indiana Press, Bloomington, Indiana.Moran, E.F. (1995) Rich and poor ecosystems of Amazonia: an approach to management. In: Uitto, J.I. (ed.)
The Fragile Tropics of Latin America. United Nations University Press, Tokyo, pp. 45–67.Morellato, L.P.C. and Haddad, C.F.B. (2001) Introduction: the Brazilian Atlantic forest. Biotropica 32,
786–792.Mortatti, J. and Probst, J.-L. (2003) Silicate rock weathering and atmospheric/soil CO2 uptake in the Amazon
basin estimated from river water geochemistry: seasonal and spatial variations. Chemical Geology 197,177–196.
Muller, R.A. and MacDonald, G.J. (1997) Glacial cycles and astronomical forcing. Science 277, 215–218.Muller-Karger, F., McClain, M. and Richardson, P. (1988) The dispersal of the Amazon’s water. Nature
(London) 333, 56–59.Naqvi, S.M. and Rogers, J.J.W. (1987) Precambrian Geology of India. Clarendon Press, New York.Négrel, P. and Lachassagne, P. (2001) Geochemistry of the Maroni river (French Guiana) during the low
water stage: implications for water–rock interaction and groundwater characteristics. Journal ofHydrology 237, 212–233.
NGDC (2003) Solar Data Services-Sunspot Numbers, http://www.ngdc.noaa.gov/stp/SOLAR/SSN/ssnNobre, C., Zebiak, S.E. and Kirtman, B.P. (2003) Local and remote sources of tropical Atlantic variability as
inferred from the results of a hybrid ocean–atmosphere coupled model. Geophysical Research Letters30, 8008.
Nobre, P. and Shukla, J. (1996) Variations of sea surface temperature, wind stress, and rainfall over the trop-ical Atlantic and South America. Journal of Climate 9, 2464–2479.
Noordam, D. (1993) The geographical outline. In: Ouboter, P.E. (ed.) The Freshwater Ecosystems ofSuriname. Kluwer Academic, Dordrecht, The Netherlands, pp. 13–28.
Nordin, C.F.J., Meade, R.H., Cranston, C.C. and Curtis, W.F. (1983) Data from Sediment Studies of the RioOrinoco, Venezuela, August 15–25 1982. USGS Open File Report 83-679. USGS, Denver, Colorado.
Nota, D.J.G. (1969) Geomorphology and sediments of Western Suriname Shelf: a preliminary note. Geologieen Mijnbouw 48, 185–188.
ODP (ed.) (2003) Demerara Rise: Equatorial Cretaceous and Paleogene Paleoceanographic Transect,Western Atlantic. ODP, College Station, Texas.
Ogden, J. (1966) Ordination studies on a small area of tropical rain forest. MSc thesis, University of Wales,Bangor, UK.
Ogurtsov, M.G., Nagovistyn, Y.A., Kocharov, G.E. and Jungner, H. (2002) Long-period cycles of the Sun’sactivity recorded in direct solar data and proxies. Solar Physics 211, 371–394.
Olsen, P.E. and Kent, D.V. (1996) Milankovitch climate forcing in the tropics of Pangaea during the LateTriassic. Palaeogeography, Palaeoclimatology, Palaeoecology 122, 1–26.
Olson, D.M., Dinerstein, E., Wikramanayake, E.D., Burgess, N.D., Powell, G.V.N., Underwood, E.C.,D’Amico, J.A., Itoua, I., Strand, H.E., Morrison, J.C., Loucks, C.J., Allnutt, T.F., Ricketts, T.H., Kura, Y.,Lamoreux, J.F., Wettengel, W.W., Hedao, P. and Kassem, K.R. (2001) Terrestrial ecoregions of theworld: a new map of life on Earth. Bioscience 51, 933–938.
Osher, L.J. and Buol, S.W. (1998) Relationship of soil properties to parent material and landscape position ineastern Madre de Dios, Peru. Geoderma 83, 143–166.
Paegle, J.N. and Mo, K.C. (2002) Linkages between summer rainfall variability over South America and seasurface temperature anomalies. Journal of Climate 15, 1389–1407.
Paolini, J. (1986) Transporte de carbono y minerales en el río Caroni. Interciencia 11, 295–297.Paolini, J., Hevia, R. and Herrera, R. (1987) Transport of carbon and minerals in the Orinoco and Caroni
rivers during the years 1983–84. In: Degens, E.T., Kempe, S. and Weibin, G. (eds) Transport of Carbonand Minerals in Major World Rivers. Part 4. SCOPE/UNEP, Hamburg, pp. 325–338.
Parra, M. and Pujos, M. (1998) Origin of late Holocene fine-grained sediments on the French Guiana shelf.Continental Shelf Research 18, 1613–1629.
Parrish, J.T., Ziegler, A.M. and Scotese, C.R. (1982) Rainfall patterns and the distribution of coals and evap-

186 D.S. Hammond
orites in the Mesozoic and Cenozoic. Palaeogeography, Palaeoclimatology, Palaeoecology 40, 67–101.
Peña, O. (1996) Hidrografia. In: Huber, O. (ed.) Ecología de la Cuenca del Río Caura, Venezuela. I.Caracterización General. FUNDACITE, Caracas, pp. 29–33.
Perks, H.M., Charles, C.D. and Keeling, R.F. (2002) Precessionally forced productivity variations across theequatorial Pacific. Paleoceanography 17, 1037–1043.
Perry, C.A. and Hsu, K J. (2001) Geophysical, archaeological, and historical evidence support a solar-outputmodel for climate change. PNAS 97, 12433–12438.
Pessenda, L.C.R., Boulet, R., Aravena, R., Rosolen, V., Gouveia, S.E.M., Ribeiro, A.S. and Lamotte, M. (2001)Origin and dynamics of soil organic matter and vegetation changes during the Holocene in a forest-savanna transition zone, Brazilian Amazon region. The Holocene 11, 250–254.
Petit, J.R., Jouzel, J., Raynaud, D., Barkov, N.I., Barnola, J.M., Basile, I., Bender, M., Chappellaz, J., Davis, J.,Delaygue, G., Delmotte, M., Kotlyakov, V.M., Legrand, M., Lipenkov, V., Lorius, C., Pépin, L., Ritz, C.,Saltzman, E. and Stievenard, M. (1999) Climate and atmospheric history of the past 420,000 years fromthe Vostok Ice Core, Antarctica. Nature 399, 429–436.
Petit, J R., Jouzel, J., Raynaud, D., Barkov, N.I., Barnola, J.M., Basile, I., Bender, M., Chappellaz, J., Davis, J.,Delaygue, G., Delmotte, M., Kotlyakov, V.M., Legrand, M., Lipenkov, V., Lorius, C., Pépin, L., Ritz, C.,Saltzman, E. and Stievenard, M. (2001) Vostok Ice Core Data for 420,000 Years. Paleoclimatology DataContribution Series No. 2001-76, NOAA/NGDC Paleoclimatology Program, Boulder, Colorado.
Philander, S.G.H. (1983) El Niño Southern Oscillation phenomena. Nature 302, 295–301.Philander, S.G.H. (1990) El Nino, La Nina, and the Southern Oscillation. Academic Press, London.Philander, S.G.H., Gu, D., Lambert, G., Li, T., Halpern, D., Lau, N.-C. and Pacanowski, R.C. (1996) Why the
ITCZ is mostly north of the equator. Journal of Climate 9, 2958–2972.Pindell, J.L. and Dewey, J.F. (1982) Permo-Triassic reconstruction of western Pangaea and the evolution of
the Gulf of Mexico/Caribbean region. Tectonics 1, 1179–1211.Piperno, D.R. (1994) Phytolith and charcoal evidence for prehistoric slash-and-burn agriculture in the Darien
rain forest of Panama. The Holocene 4, 321–325.Piperno, D.R. (1997) Phytoliths and microscopic charcoal from leg 155: a vegetational and fire history of the
Amazon basin during the last 75 k.y. In: Peterson, L.C. (ed.) Proceedings of the Ocean Drilling Program,Scientific Results. ODP, College Station, Texas, pp. 411–418.
Piperno, D.R. and Becker, P. (1996) Vegetational history of a site in the central Amazon basin derived fromphytolith and charcoal records from natural soils. Quaternary Research 45, 202–209.
Piperno, D.R. and Jones, J.G. (2003) Paleoecological and archaeological implications of a LatePleistocene/Early Holocene record of vegetation and climate from the Pacific coastal plain of Panama.Quaternary Research 59, 79–87.
Piperno, D.R., Bush, M.B. and Colinvaux, P.A. (1990) Paleoenvironments and human occupation in late-gla-cial Panama. Quaternary Research 33, 108–116.
Pirazzoli, P.A. (1991) World Atlas of Holocene Sea-Level Change. Elsevier, Amsterdam.Pitman, W.C.I., Cande, S., LaBrecque, J.L. and Pindell, J.L. (1993) Fragmentation of Gondwana: the separa-
tion of Africa from South America. In: Goldblatt, P. (ed.) Biological Relationships Between Africa andSouth America. Yale University Press, London, pp. 15–34.
Poldevaart (1955) Chemistry of the Earth’s crust. Geological Society of America Special Paper 62, 119–144.Potter, P.E. (1978) Petrology and chemistry of modern big river sands. Journal of Geology 86, 423–449.Prado, H.D. (1996) Manual de Classificacão de Solos do Brasil. FUNEP, São Paulo.Prasad, G. (1983) A review of the early Tertiary bauxite event in South America, Africa and India. Journal of
African Earth Sciences 1, 305–313.Pratt, D. (2001) Plate tectonics: a paradigm under threat. Journal of Scientific Exploration 14, 307–352.Prentice, I.C. and Matthews, R.K. (1988) Cenozoic ice-volume history: development of a composite oxygen
isotope record. Geology 16, 963–966.Press, F. and Siever, R. (1982) Earth, 3rd edn. W.H. Freeman and Co., San Francisco, California.Priem, H.N.A., Boelrijk, N.A.I.M., Hebeda, E.H., Verschure, R.H. and Verdurmen, E.A.T. (1968) Isotopic age
determinations on Suriname rocks, 3. Proterozoic and Permo-Triassic basalt magmatism in the GuianaShield. Geologie en Mijnbouw 47, 17–20.
Priem, H.N.A., Andriessen, P.A.M., Boelrijk, N.A.I.M., de Boorder, H., Hedeba, E.H., Huguett, A.,Verdurmen, E.A.T. and Verschure, R.H. (1982) Geochronology of the Precambrian in the Amazonasregion of southeastern Colombia (western Guiana Shield). Geologie en Mijnbouw 61, 229–242.
PRORADAM (1979) La Amazonia Colombiana y sus Recursos. IGAC/CIAF/MINDEFENSA, Bogotá.
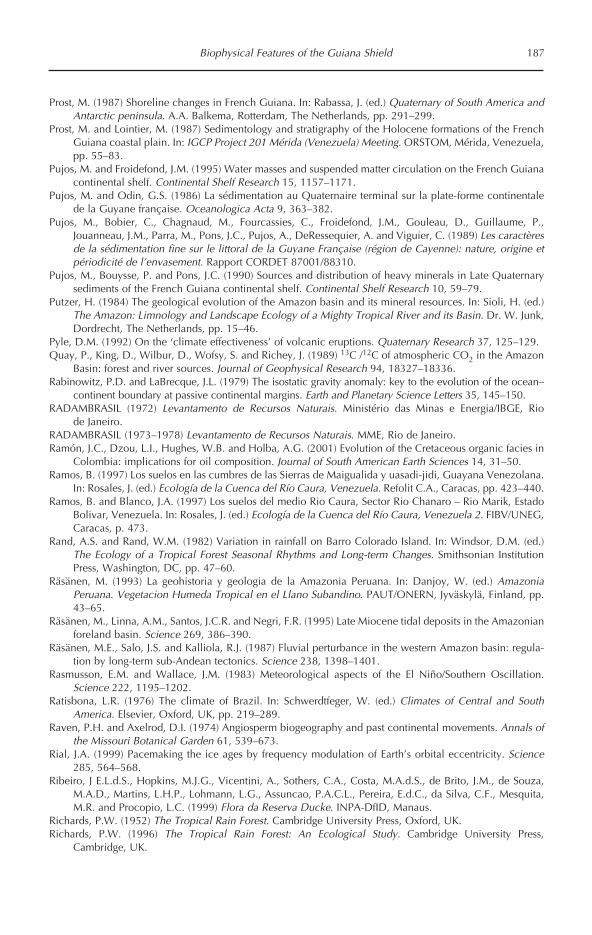
Biophysical Features of the Guiana Shield 187
Prost, M. (1987) Shoreline changes in French Guiana. In: Rabassa, J. (ed.) Quaternary of South America andAntarctic peninsula. A.A. Balkema, Rotterdam, The Netherlands, pp. 291–299.
Prost, M. and Lointier, M. (1987) Sedimentology and stratigraphy of the Holocene formations of the FrenchGuiana coastal plain. In: IGCP Project 201 Mérida (Venezuela) Meeting. ORSTOM, Mérida, Venezuela,pp. 55–83.
Pujos, M. and Froidefond, J.M. (1995) Water masses and suspended matter circulation on the French Guianacontinental shelf. Continental Shelf Research 15, 1157–1171.
Pujos, M. and Odin, G.S. (1986) La sédimentation au Quaternaire terminal sur la plate-forme continentalede la Guyane française. Oceanologica Acta 9, 363–382.
Pujos, M., Bobier, C., Chagnaud, M., Fourcassies, C., Froidefond, J.M., Gouleau, D., Guillaume, P.,Jouanneau, J.M., Parra, M., Pons, J.C., Pujos, A., DeRessequier, A. and Viguier, C. (1989) Les caractèresde la sédimentation fine sur le littoral de la Guyane Française (région de Cayenne): nature, origine etpériodicité de l’envasement. Rapport CORDET 87001/88310.
Pujos, M., Bouysse, P. and Pons, J.C. (1990) Sources and distribution of heavy minerals in Late Quaternarysediments of the French Guiana continental shelf. Continental Shelf Research 10, 59–79.
Putzer, H. (1984) The geological evolution of the Amazon basin and its mineral resources. In: Sioli, H. (ed.)The Amazon: Limnology and Landscape Ecology of a Mighty Tropical River and its Basin. Dr. W. Junk,Dordrecht, The Netherlands, pp. 15–46.
Pyle, D.M. (1992) On the ‘climate effectiveness’ of volcanic eruptions. Quaternary Research 37, 125–129.Quay, P., King, D., Wilbur, D., Wofsy, S. and Richey, J. (1989) 13C /12C of atmospheric CO2 in the Amazon
Basin: forest and river sources. Journal of Geophysical Research 94, 18327–18336.Rabinowitz, P.D. and LaBrecque, J.L. (1979) The isostatic gravity anomaly: key to the evolution of the ocean–
continent boundary at passive continental margins. Earth and Planetary Science Letters 35, 145–150.RADAMBRASIL (1972) Levantamento de Recursos Naturais. Ministério das Minas e Energia/IBGE, Rio
de Janeiro.RADAMBRASIL (1973–1978) Levantamento de Recursos Naturais. MME, Rio de Janeiro.Ramón, J.C., Dzou, L.I., Hughes, W.B. and Holba, A.G. (2001) Evolution of the Cretaceous organic facies in
Colombia: implications for oil composition. Journal of South American Earth Sciences 14, 31–50.Ramos, B. (1997) Los suelos en las cumbres de las Sierras de Maigualida y uasadi-jidi, Guayana Venezolana.
In: Rosales, J. (ed.) Ecología de la Cuenca del Río Caura, Venezuela. Refolit C.A., Caracas, pp. 423–440.Ramos, B. and Blanco, J.A. (1997) Los suelos del medio Rio Caura, Sector Rio Chanaro – Rio Marik, Estado
Bolivar, Venezuela. In: Rosales, J. (ed.) Ecología de la Cuenca del Río Caura, Venezuela 2. FIBV/UNEG,Caracas, p. 473.
Rand, A.S. and Rand, W.M. (1982) Variation in rainfall on Barro Colorado Island. In: Windsor, D.M. (ed.)The Ecology of a Tropical Forest Seasonal Rhythms and Long-term Changes. Smithsonian InstitutionPress, Washington, DC, pp. 47–60.
Räsänen, M. (1993) La geohistoria y geologia de la Amazonia Peruana. In: Danjoy, W. (ed.) AmazoniaPeruana. Vegetacion Humeda Tropical en el Llano Subandino. PAUT/ONERN, Jyväskylä, Finland, pp.43–65.
Räsänen, M., Linna, A.M., Santos, J.C.R. and Negri, F.R. (1995) Late Miocene tidal deposits in the Amazonianforeland basin. Science 269, 386–390.
Räsänen, M.E., Salo, J.S. and Kalliola, R.J. (1987) Fluvial perturbance in the western Amazon basin: regula-tion by long-term sub-Andean tectonics. Science 238, 1398–1401.
Rasmusson, E.M. and Wallace, J.M. (1983) Meteorological aspects of the El Niño/Southern Oscillation.Science 222, 1195–1202.
Ratisbona, L.R. (1976) The climate of Brazil. In: Schwerdtfeger, W. (ed.) Climates of Central and SouthAmerica. Elsevier, Oxford, UK, pp. 219–289.
Raven, P.H. and Axelrod, D.I. (1974) Angiosperm biogeography and past continental movements. Annals ofthe Missouri Botanical Garden 61, 539–673.
Rial, J.A. (1999) Pacemaking the ice ages by frequency modulation of Earth’s orbital eccentricity. Science285, 564–568.
Ribeiro, J E.L.d.S., Hopkins, M.J.G., Vicentini, A., Sothers, C.A., Costa, M.A.d.S., de Brito, J.M., de Souza,M.A.D., Martins, L.H.P., Lohmann, L.G., Assuncao, P.A.C.L., Pereira, E.d.C., da Silva, C.F., Mesquita,M.R. and Procopio, L.C. (1999) Flora da Reserva Ducke. INPA-DfID, Manaus.
Richards, P.W. (1952) The Tropical Rain Forest. Cambridge University Press, Oxford, UK.Richards, P.W. (1996) The Tropical Rain Forest: An Ecological Study. Cambridge University Press,
Cambridge, UK.

188 D.S. Hammond
Richards, P.W. and Davis, T.A. (1933) The vegetation of Moraballi Creek, British Guiana: an ecological studyof a limited area of tropical rain forest. Journal of Ecology 21, 350–384.
Richardson, P.L. and Walsh, D.W. (1986) Mapping climatological seasonal variations of surface currents inthe tropical Atlantic using ship drifts. Journal of Geophysical Research 91, 10537–10550.
Richey, J., Meade, R.H., Salati, E., Devol, A.H., Nordin, C.F. and dos Santos, U. (1986) Water discharge andsuspended sediment concentrations in the Amazon River: 1982–1984. Water Resources Research 22,756–764.
Richey, J., Nobre, C.A. and Deser, C. (1989) Amazon river discharge and climate variability. Science 246,101–103.
Richey, J., Victoria, R.L., Salati, E. and Forsberg, B.R. (1990) The biogeochemistry of a major river system:the Amazon case study. In: Degenes, E.T., Kempe, S. and Richey, J. (eds) Biogeochemistry of the MajorWorld Rivers. John Wiley & Sons, Chichester, UK, pp. 57–74.
Richter, D.D. and Babbar, L.I. (1991) Soil diversity in the tropics. Advances in Ecological Research 21,369–389.
Riehl, H. (1977) Venezuelan rain systems and the general circulation of the summer tropics. I. Rain systems.Monthly Weather Review 105, 1402–1420.
Rind, D. (2002) The sun’s role in climate variations. Science 296, 673–677.Rind, D. and Overpeck, J.T. (1993) Hypothesized causes of decade-to-century scale climate variability-cli-
mate model results. Quaternary Science Review 12, 357–374.Robertson, A.W., Mechoso, C.R. and Kim, Y.-J. (2001) The influence of Atlantic sea surface temperature
anomalies on the North Atlantic Oscillation. Journal of Climate 13, 122–138.Robinson, P.J. and Henderson-Seller, A. (1999) Contemporary Climatology, 2nd edn. Longman,
London.Robock, A. and Mao, J. (1995) The volcanic signal in surface temperature observations. Journal of Climate
8, 1086–1103.Rogers, J.C. (1984) The association between the North Atlantic Oscillation and the Southern Oscillation in
the northern hemisphere. Monthly Weather Review 112, 1999–2015.Rogers, J.C. (1988) Precipitation variability over the Caribbean and tropical Americas associated with the
Southern Oscillation. Journal of Climate 1, 172–182.Romero, E.J. (1993) South American paleofloras. In: Goldblatt, P. (ed.) Biological Relationships between
Africa and South America. Yale University Press, New Haven, Connecticut pp. 62–85.Roosevelt, A.C. (1991) Moundbuilders of the Amazon: Geophysical Archaeology on Marajó Island, Brazil.
Academic Press, London.Ropelewski, C.F. and Halpert, M.S. (1987) Global and regional scale precipitation patterns associated with
the El Nino/Southern Oscillation. Monthly Weather Review 115, 1606–1626.Ropelewski, C.F. and Halpert, M.S. (1989) Precipitation patterns associated with the high index phase of the
Southern Oscillation. Journal of Climate 3, 268–284.Ropelewski, C.F. and Halpert, M.S. (1996) Quantifying Southern Oscillation–precipitation relationships.
Journal of Climate 9, 1043–1059.Ropelewski, C.F. and Jones, P.D. (1987) An extension of the Tahiti–Darwin Southern Oscillation Index.
Monthly Weather Review 115, 2161–2165.Roth, J.M., Droxler, A.W. and Kameo, K. (2001) The Caribbean carbonate crash at the middle to late
Miocene transition: linkage to the establishment of the modern global ocean conveyor. In: Draper, G.(ed.) Proceedings of the Ocean Drilling Program, Scientific Results. ODP, College Station, Texas, pp.249–273.
Rowe, W., Dunbar, R.B., Mucciarone, D.A., Seltzer, G.O., Baker, P.A. and Fritz, S.C. (2002) Insolation, mois-ture balance and climate change on the South American altiplano since the last glacial maximum.Climatic Change 52, 175–199.
Ruiz-Barradas, A., Carton, J.A. and Nigam, S. (2001) Structure of interannual-to-decadal climate variabilityin the tropical Atlantic sector. Journal of Climate 13, 3285–3297.
Rull, V. (1991) Contribución a la Paleoecología de Pantepui la Gran Sabana (Guayana Venezolana): Clima,Biogeografía, y Ecología. Fundacite-Guayana/UNEG, Caracas.
Rull, V. (1996) Late Pleistocene and Holocene climates of Venezuela. Quaternary International 31, 85–94.Rull, V. (1999) Palaeoclimatology and sea-level history in Venezuela: new data, land–sea correlations, and
proposals for future studies in the framework of the IGBP-PAGES project. Interciencia 24, 92–101.Ryther, J.H., Menzel, D.W. and Corwin, N. (1967) Influence of the Amazon River outflow on the ecology of
the western tropical Atlantic I: hydrology and nutrient chemistry. Journal of Marine Research 25, 69–82.

Biophysical Features of the Guiana Shield 189
Salati, E. and Marques, J. (1984) Climatology of the Amazon region. In: Sioli, H. (ed.) The Amazon,Limnology and Landscape Ecology of a Mighty Tropical River and its Basin. Dr. W. Junk, Dordrecht,The Netherlands, pp. 85–126.
Saldarriaga, J.G. (1994) Recuperación de la Selva de ‘Tierra Firme’ en el Alto Río Negro AmazoniaColombiana–Venezolana. Tropenbos Colombia Programme, Bogotá.
Saldarriaga, J.G. and West, D.C. (1986) Holocene fires in the northern Amazon basin. Quaternary Research26, 358–366.
Salgado-Labouriau, M.L. (1980) A pollen diagram of the Pleistocene-Holocene boundary of Lake Valencia,Venezuela. Review of Palaeobotany and Palynology 30, 297–312.
Salgado-Labouriau, M.L., Casseti, V., Ferraz-Vicentini, K.R., Martin, L., Soubiés, F., Suguio, K. and Turcq, B.(1997) Late Quaternary vegetational and climatic changes in cerrado and palm swamp from CentralBrazil. Palaeogeography, Palaeoclimatology, Palaeoecology 128, 215–226.
Salo, J., Kalliola, R., Hakkinen, L., Makinen, Y., Niemela, P., Puhakka, M. and Coley, P.D. (1986) Riverdynamics and the diversity of Amazon lowland forest. Nature 322, 254–258.
Sanchez, P.A. (1976) Properties and Management of Soils in the Tropics. John Wiley & Sons, New York.Sanchez, P.A. (1981) Soil management in the Oxisol savannahs and Ultisol jungles of tropical South
America. In: Greenland, D.J. (ed.) Characterisation of Soils. Oxford University Press, Oxford, UK, pp.214–253.
Sanford Jr, R.L., Paaby, P., Luvall, J.C. and Phillips, E. (1994) Climate, geomorphology and aquatic systems.In: McDade, L.A., Bawa, K.S., Hespenheide, H.A. and Hartshorn, G.S. (eds) La Selva: Ecology andNatural History of a Neotropical Rain Forest. Chicago University Press, Chicago, Illinois, pp. 19–33.
Saravanan, R. and Chang, P. (1999) Oceanic mixed layer feedback and tropical Atlantic variability.Geophysical Research Letters 26, 3629–3632.
Savin, S.M. (1977) The history of the Earth’s surface temperature during the past 100 million years. AnnualReview of Earth and Planetary Sciences 5, 319–356.
Scarparo Cunha, A.A. and Koutsoukos, A.M. (2001) Orbital cyclicity in a Turonian sequence of theCotinguiba Formation, Sergipe Basin, NE Brazil. Cretaceous Research 22, 529–548.
Schlesinger, M.E. and Ramankutty, N. (1992) Implications for global warming of intercycle solar irradiancevariations. Nature 360, 330–333.
Schopf, P.S. and Suarez, M.J. (1987) Vacillations in a coupled ocean–atmosphere model. Journal ofAtmospheric Science 45, 549–566.
Schubert, C. and Fritz, S.C. (1985) Radiocarbon ages of peat, Guayana highlands (Venezuela).Naturwissenschaften 72, 427–429.
Schulman, L., Ruokolainen, K. and Tuomisto, H. (1999) Parameters for global ecosystem models. Nature399, 535–536.
Schulz, J.P. (1960) Ecological studies on rain forest in Northern Suriname. Verhandelingen der KoninklijkeNederlandse Akademie van Wetenschappen, Afd. Natuurkunde 163, 1–250.
Schwabe, G.H. (1969) Towards an ecological characterization of the South American continent. In: Fittkau,E.J. (ed.) Biogeography and Ecology in South America. Dr. W. Junk, The Hague, The Netherlands.
Sclater, J.G., Hellinger, S. and Tapscott, C. (1977) The paleobathymetry of the Atlantic Ocean from theJurassic to the present. Journal of Geology 85, 509–552.
Seyler, P.T. and Boaventura, G.R. (2001) Trace elements in the mainstem Amazon River. In: McClain, M.E.,Victoria, R.L. and Richey, J.E. (eds) The Biogeochemistry of the Amazon Basin. Oxford University Press,Oxford, UK, pp. 307–327.
Shackleton, N.J., Curry, W.B., Richter, C. and Bralower, T.J. (eds) (1997) Ceara Rise. ODP Vol. 154 inProceedings of the Ocean Drilling Program, Scientific Results. College Station, Texas.
Shindell, D., Rind, D., Balachandran, N., Lean, J. and Lonergan, P. (1999) Solar cycle variability, ozone, andclimate. Science 284, 305–308.
Shindell, D.T., Schmidt, G.A., Mann, M.E., Rind, D. and Waple, A. (2001) Solar forcing of regional climatechange during the Maunder minimum. Science 294, 2149–2152.
Sifeddine, A., Martin, L., Turcq, B., Volkmer-Ribeiro, C., Soubiés, F., Cordeiro, R.C. and Suguio, K. (2001)Variations of the Amazonian rainforest environment: a sedimentological record covering 30,000 years.Palaeogeography, Palaeoclimatology, Palaeoecology 168, 221–235.
Sifeddine, A., Albuquerque, A.L.S., Ledru, M.-P., Turcq, B., Knoppers, B., Martin, L., Zamboni de Mello, W.,Passenau, H., Dominquez, J.M L., Cordeiro, R.C., Abrao, J.J. and da Silva Pinto Bittencourt, A.C. (2003)A 21000 cal years paleoclimatic record from Cacó Lake, northern Brazil: evidence from sedimentaryand pollen analyses. Palaeogeography, Palaeoclimatology, Palaeoecology 189, 25–34.

190 D.S. Hammond
Sinha, N.K.P. (1968) Geomorphic Evolution of the Northern Rupununi Basin, Guyana. McGill University,Montreal.
Sioli, H. (1957) Valores de pH de águas amazônicas. Boletin Museu Paraense E.Goeldi (Geólogia) 1, 1–37.Sioli, H. (1968) Hydrochemistry and geology in the Brazilian Amazon region. Amazoniana 1, 267–277.Sioli, H. (1975) Tropical rivers as expressions of their terrestrial environments. In: Golley, F.B. and Medina, E.
(eds) Tropical Ecosystems: Trends in Terrestrial and Aquatic Research. Springer, New York, pp. 275–287.Sioli, H. (1984a) The Amazon and its main affluents: hydrography, morphology of the river courses, and river
types. In: Sioli, H. (ed.) The Amazon: Limnology and Landscape Ecology of a Mighty Tropical River andits Basin. Dr. W. Junk, Dordrecht, The Netherlands, pp. 127–195.
Sioli, H. (ed.) (1984b) The Amazon: Limnology and Landscape Ecology of a Mighty Tropical River and itsBasin. Dr. W. Junk, Dordrecht, The Netherlands.
Sippel, S.J., Hamilton, S.K., Melack, J.M. and Novo, E.M. (1998) Passive microwave observations of inunda-tion area and area/stage relation in the Amazon River. International Journal of Remote Sensing 19,3055–3074.
Sklar, L. (2000) Report on Hydrological and Geochemical Processes in Large Scale River Basins. WorldCommission on Dams, Manaus, Brazil.
Smith, L.K., Lewis, W.M.J., Chanton, J.P., Cronin, G. and Hamilton, S.K. (2001) Methane emissions from theOrinoco River floodplain, Venezuela. Biogeochemistry 51, 113–140.
Smith, P.E., Evenson, N.M., York, D. and Odin, G.S. (1998) Single-grain 40Ar–39Ar ages of glauconies: impli-cations for the geologic time scale and global sea level variations. Science 279, 1517–1519.
Snow, J.W. (1976) The climate of northern South America. In: Schwerdtfeger, W. (ed.) Climates of Centraland South America. Elsevier, Oxford, UK, pp. 295–478.
Sobieraj, J.A., Elsenbeer, H. and McClain, M. (2002) The cation and silica chemistry of a Subandean riverbasin in western Amazonia. Hydrological Processes 16, 1353–1372.
Sollins, P., Sancho, F.M., Mata, C.R. and Sanford Jr, R.L. (1994) Soils and soil process research. In: McDade,L.A., Bawa, K.S., Hespenheide, H.A. and Hartshorn, G.S. (eds) La Selva: Ecology and Natural Historyof a Neotropical Rain Forest. Chicago University Press, Chicago, Illinois, pp. 34–53.
Sombroek, W. (1999) Annual rainfall and strength of dry season strength in the Amazon region and theirenvironmental consequences. Ambio 30, 388–396.
Sombroek, W.G. (1990) Amazon Landforms and Soils in Relation to Biological Diversity in Priority Areas forConservation in Amazonia. Conservation International/INPA, Manaus, Brazil.
Sombroek, W.G. (1991) Amazon landforms and soils in relation to biological diversity. In: ISRIC (ed.) AnnualReport 1990. ISRIC, Wageningen, The Netherlands, pp. 7–25.
Soubiés, F. (1979) Existence d’une phase sèche en Amazonie Brésilienne datée par la présence de charbonsdans les sols (6.000–3.000 ans B.P.). Cahiers ORSTOM, Série Géologie 11, 133–148.
Sourdat, M. (1987) Reconnaissances pédologiques en Amazonie péruvianne. Problèmes de pédogenése etde mise en valeur. Cahiers ORSTOM, Série Pédologie 23, 95–109.
Stallard, R.F. (1988) Weathering and erosion in the humid tropics. In: Lerman, A. and Meybeck, M. (eds)Physical and Chemical Weathering in Geochemical Cycles. Kluwer, Dordrecht, The Netherlands, pp.225–246.
Stallard, R.F. and Edmond, J.M. (1983) Geochemistry of the Amazon: 2. The influence of geology and weath-ering environment on the dissolved load. Journal of Geophysical Research 88, 9671–9688.
Stallard, R.F. and Edmond, J.M. (1987) Geochemistry of the Amazon 3. Weathering chemistry and limits todissolved inputs. Journal of Geophysical Research 92, 8293–8302.
Stark, J., Hill, H., Rutherford, G.K. and Jones, T.A. (1959) Soil and Land Use Survey No. 5. British Guiana.Part II – the Bartica Triangle. ICTA Regional Research Centre, Port-of-Spain, Trinidad.
Stern, K.M. (1970) Der Casiquiare-Kanal, einst und jetzt. Amazoniana 2, 401–416.Sternberg, H.O.R. (1995) Waters and wetlands of Brazilian Amazonia: an uncertain future. In: Uitto, J.I. (ed.)
The Fragile Tropics of Latin America – Sustainable Management of Changing Environments. UnitedNations University Press, Tokyo, pp. 113–179.
Stevenson, F.J. (1994) Humus Chemistry – Genesis, Composition, Reactions. John Wiley & Sons, New York.Steyermark, J. (1966) Contribuciones a la flora de Venezuela, parte 5. Acta Botanica Venezuelica 1, 9–256.Steyermark, J. (1967) Flora del Auyán-tepui. Acta Botanica Venezuelica 2, 5–370.Stirling, C.H., Esat T.M., Lambeck, K., McCulloch, M.T., Blake, S.G., Lee, D.-C. and Halliday, A.N. (2001)
Orbital forcing of the marine isotope stage 9 interglacial. Science 291, 290–293.Stott, P.A., Jones, G.S. and Mitchell, J.F.B. (2003) Do models underestimate the solar contribution to recent
climate change? Journal of Climate 16, 4079–4093.

Biophysical Features of the Guiana Shield 191
Sutton, R.T., Jewson, S.P. and Rowell, D.P. (2001) The elements of climate variability in the tropical Atlanticregion. Journal of Climate 13, 3261–3284.
Szatmari, P. (1983) Amazon rift and Pisco-Juruá fault: their relation to the separation of North America fromGondwana. Geology 11, 300–304.
Tanaka, M., Tsuchiya, A. and Nishizawa, T. (1995) Distribution and interannual variability of rainfall inBrazil. In: Uitto, J.I. (ed.) The Fragile Tropics of Latin America. United Nations University Press, Tokyo,pp. 94–109.
Tardy, C., Kobilsek, B., Roquin, C. and Paquet, H. (1990) Influence of peri-Atlantic climates and paleocli-mates on the distribution and mineralogical composition of bauxites and ferricretes. In: Geochemistryof the Earth’s Surface and of Mineral Formation, 2nd International Symposium. CNRS/ORSTOM,Provence, France, pp. 179–182.
Tardy, C., Vernet, J.-L., Servant, M., Fournier, M., Leprun, J.-C., Pessenda, C.L., Sifeddine, A., Solari, M.-E.,Soubies, F., Turcq, B. and Wengler, L. (2001) Feux, sols et écosystèmes forestiers tropicaux. In: Servant-Vildary, S. (ed.) Dynamique à Long Terme des Ecosystèmes Forestiers Intertropicaux. UNESCO, Paris,pp. 343–348.
Tardy, Y. (1992) Geochemistry and evolution of lateritic landscapes. In: Chesworth, W. (ed.) Weathering,Soils and Paleosols. Elsevier, London, pp. 408–443.
Tardy, Y. (1997) Petrology of Laterites and Tropical Soils. Ashgate, London.Tassinari, C.C.G. (1984) Evolução Geotectonica da Provincia Rio Negro-Juruena na Regiao Amazonica.
Universidade de São Paulo, São Paulo.Teixeira, W., Tassinari, C.C.G., Cordani, U.G. and Kawashita, K. (1989) A review of the geochronology of
the Amazonian Craton: tectonic implications. Precambrian Research 42, 213–227.ter Steege, H. (2001) Plant Diversity in Guyana. Tropenbos Foundation, Wageningen, The Netherlands.ter Steege, H. and Hammond, D.S. (2001) Character convergence, diversity, and disturbances in tropical rain
forest in Guyana. Ecology 82, 3197–3212.ter Steege, H., Jetten, V.G., Polak, A.M. and Werger, M.J.A. (1993) Tropical rain forest types and soil factors
in a watershed area in Guyana. Journal of Vegetation Science 4, 705–716.Terborgh, J. (1992) Diversity and the Tropical Rain Forest. Scientific American Library, New York.Teunissen, P.A. (1993) Vegetation and vegetation succession of the freshwater wetlands. In: Ouboter, P.E. (ed.)
The Freshwater Ecosystems of Suriname. Kluwer Academic, Dordrecht, The Netherlands, pp. 77–98.Thomson, D.J. (1997) Dependence of global temperatures on atmospheric CO2 and solar irradiance. PNAS
94, 8370–8377.Tissot, C., Djuwansah, M.R.and Marius, C. (1988) Evolution de la mangrove en Guyane au cours de
l’Holocene: étude palynologique. Inst. fr. Pondichéry, trav. sec. sci. tech. 25, 125–137.Tomczak, M. and Godfrey, S.J. (1994) Regional Oceanography: An Introduction. Pergamon Press, New York.Tréguer, P., Nelson, D.M., van Bennekom, A.J., DeMaster, D.J., Leynaert, A. and Quéguiner, B. (1995) The
silica balance in the world ocean: a reestimate. Science 268, 375–379.Trend-Staid, M. and Prell, W.L. (2002) Sea surface temperature at the Last Glacial Maximum: a reconstruc-
tion using the modern analog technique. Paleoceanography 17, 1065–1169.Tsiropoula, G. (2003) Signatures of solar activity variability in meteorological parameters. Journal of
Atmospheric and Solar-Terrestrial Physics 65, 469–482.Turenne, J.F. (1974) Molecular weights of humic acids in podzol and ferrallitic soils of the savannas of French
Guyana and their evolution related to soil moisture. Tropical Agriculture (Trinidad) 51, 134–144.Turner, R.E., Qureshi, N., Rabalais, N.N., Dortch, Q., Justic, D., Shaw, R.F. and Cope, J. (1998) Fluctuating
silicate:nitrate ratios and coastal plankton food webs. Proceedings of the National Academy of SciencesUSA 95, 13048–13051.
Tushingham, A.M. and Peltier, W.R. (1993) Relative Sea Level Database. IGBP PAGES/World data center –A for paleoclimatology data contribution series 93-016. NOAA/NGDC Paleoclimatology Program,Boulder, Colorado.
USGS and T. M. Corporacion Venezolana de Guayana (1993) Geology and Mineral Resource Assessment ofthe Venezuelan Guayana Shield. US GPO, Washington, DC.
UNEP, ISSS, ISRIC and FAO (1995) Global and National Soils and Terrain Digital Databases (SOTER), 2ndedn. LWWD-FAO, Rome.
USDA (1996) Keys to Soil Taxonomy, 7th edn. USDA, Washington, DC.Uvo, C.B., Repelli, C.A., Zebiak, S.E. and Kushnir, Y. (1998) The relationships between tropical Pacific and
Atlantic SST and northeast Brazil monthly precipitation. Journal of Climate 11, 551–562.Vail, P.R., Mitchum, M.R. and Thompson, S. (1977) Seismic stratigraphy and global changes in sea level, part

192 D.S. Hammond
4: global cycles of relative changes of sea level. In: Payton, C.E. (ed.) Seismic Stratigraphy – Applicationsto Hydrocarbon Exploration. AAPG, Tulsa, Oklahoma, pp. 49–212.
van Dam, O. (2001) Forest Filled with Gaps: Effects of Gap Size on Water and Nutrient Cycling in TropicalRain Forest. A Study in Guyana. Tropenbos Guyana Programme, Wageningen, The Netherlands.
van der Eyk, J.J. (1957) Reconnaissance Soil Survey in Northern Suriname. WAU, Wageningen, TheNetherlands.
van der Hammen, T. (1963) A palynological study of the Quaternary of British Guiana. Leidse GeologischeMededelingen 29, 125–180.
van der Hammen, T. (1974) The Pleistocene changes of vegetation and climate in tropical South America.Journal of Biogeography 1, 3–26.
van der Hammen, T. and Absy, M.L. (1994) Amazonia during the last glacial. Palaeogeography,Palaeoclimatology, Palaeoecology 109, 247–261.
van der Hammen, T. and Wymstra, T.A. (1964) A palynological study on the Tertiary and Upper Cretaceousof the British Guiana. Leidse Geologische Mededelingen 30, 183–241.
van Kekem, A.J., Pulles, J.H.M. and Khan, Z. (1996) Soils of the Rainforest in Central Guyana. Tropenbos-Guyana, Georgetown.
van Loon, H. and Rogers, J.C. (1978) The seesaw in winter temperatures between Greenland and NorthernEurope. Part I: general description. Monthly Weather Review 106, 296–310.
van Roosmalen, M.G.M. (1985) Fruits of the Guianan Flora. Institute of Systematic Botany, Utrecht, TheNetherlands.
Vanzolini, P.E. (1973) Paleoclimates, relief and species multiplication in equatorial forests. In: Duckworth,W.D. (ed.) Tropical Forest Ecosystems in African and South America: a Comparative Review.Smithsonian Institution Press, Washington, DC, pp. 255–258.
Vargas, H. and Rangel, J. (1996a) Clima: comportamiento de las variables. In: Huber, O. (ed.) Ecología de laCuenca del Río Caura, Venezuela. I. Caracterización General. UNEG/FIBV, Caracas, pp. 34–39.
Vargas, H. and Rangel, J. (1996b) Hidrologia y sedimentos. In: Rosales, J. and Huber, O. (eds) Ecología dela Cuenca del Río Caura, Venezuela. I. Caracterización General. Refolit, Caracas, pp. 48–53.
Vegas-Vilarrúbia, T., Paolini, J. and García-Miragaya, J. (1988) Differentiation of some Venezuelan blackwater rivers based upon physico-chemical properties of their humic substances. Biogeochemistry 6,59–77.
Vegas-Vilarrúbia, T., Paolini, J. and Herrera, R. (1987) A physico-chemical survey of blackwater rivers fromthe Orinoco and the Amazon basins of Venezuela. Archiv Hydrobiologie 111, 491–506.
Verhofstad, J. (1971) Geology of the Wilhelmina Mountains, with special reference to the occurrence ofPrecambrian ash-flow tuffs. Amsterdam Geologie Mijnbouw Dienst Sur. Med. 21, 9–97.
Vernet, J.-L., Wengler, L., Solari, M.-E., Ceccantini, G., Fournier, M., Ledru, M.-P. and Soubiés, F. (1994)Feux, climats et végétations au Brésil central durant l’Holocène: les données d’un profil de sol à char-bons de bois. Comptes Rendus de l’Académie de Science, Paris 319, 1391–1397.
Victoria, R.L., Martinelli, L.A., Moraes, J.M., Ballester, M.V., Krusche, A.V., Pellegrino, G., Almeida, R.M.B.and Richey, J.E. (1998) Surface air temperature variations in the Amazon region and its borders duringthis century. Journal of Climate 11, 1105–1110.
Vitousek, P.M. (1984) Litterfall, nutrient cycling, and nutrient limitation in tropical forests. Ecology 65,285–298.
Vitousek, P.M. and Denslow, J.S. (1987) Differences in extractable phosphorus among soils of the La SelvaBiological Station, Costa Rica. Biotropica 19, 167–170.
Vizy, E.K. and Cook, K.H. (2001) Mechanisms by which Gulf of Guinea and Eastern North Atlantic sea sur-face temperature anomalies can influence African rainfall. Journal of Climate 14, 795–821.
Volkaff, B. (1984) Organisations régionales de la couverture pédologique du Brésil. Chronologie des dif-férenciations. Cahiers ORSTOM, Série Pédologique 21, 225–236.
Vose, R.S., Schmoyer, R.L., Steurer, P.M., Peterson, T.C., Heim, R., Karl, T.R. and Eischeid, J. (1992) TheGlobal Historical Climatology Network: Long-term Monthly Temperature, Precipitation, Sea LevelPressure, and Station Pressure Data. ORNL/CDIAC-53, NDP-041, Oak Ridge National Laboratory, OakRidge, Tennessee.
Vuille, M., Bradley, R.S. and Keimig, F. (2001) Climate variability in the Andes of Ecuador and its relation totropical Pacific and Atlantic sea surface temperature anomalies. Journal of Climate 13, 2520–2535.
Waldmeier, M. (1961) The Sunspot – Activity in the Years 1610–1960. Schulthess and Co. AG, Zurich.Walker, G.T. (1923) Correlation in seasonal variations of weather. VIII. A preliminary study of world weather.
Memoirs of the Indian Meteorological Dept 24, 75–131.

Biophysical Features of the Guiana Shield 193
Walker, G.T. (1924) Correlation in seasonal variations of weather. IX. A further study of world weather.Memoirs of the Indian Meteorological Dept 24, 275–332.
Wallace, A.R. (1878) Tropical Nature and Other Essays. Macmillan, London.Walsh, R.P.D. (1996) Climate. In: Richards, P.W. (ed.) The Tropical Rain Forest. Cambridge University Press,
Cambridge, pp. 159–205.Wang, C. (2002) Atlantic climate variability and its associated atmospheric circulation cells. Journal of
Climate 15, 1516–1536.Wang, C. and Enfield, D.B. (2003) A further study of the tropical western hemisphere warm pool. Journal of
Climate 16, 1476–1493.Waylen, P.R., Caviedes, C.N. and Quesada, M.E. (1996) Interannual variability of monthly precipitation in
Costa Rica. Journal of Climate 9, 2606–2613.WCD (2001) Ecosystems and large dams: environmental performance. In: Dams and Development: A New
Framework for Decision-making. Earthscan, London, pp. 73–96.Weibezahn, F.H. (1990) Hidroquimica y solidos suspendidos en el alto y medio Orinoco. In: Weibezahn,
F.H., Alvarez, H. and Lewis, W.M.J. (eds) El Rio Orinoco como Ecosistema. Impresos Rubel CA,Caracas, pp. 151–210.
Wells, J.T. and Coleman, J.M. (1981) Physical processes and fine-grained sediment dynamics, coast ofSuriname, South America. Journal of Sedimentary Petrology 51, 1053–1068.
Weng, C., Bush, M.B. and Athens, J.S. (2002) Holocene climate change and hydrarch succession in lowlandAmazonian Ecuador. Review of Palaeobotany and Palynology 120, 73–90.
Westin, F.C. (1962) Report to the Government of Venezuela on the Major Soils of Venezuela. FAO, Rome.Whitmore, T.C. and Prance, G.T. (1987) Biogeography and Quaternary History in Tropical America. Oxford
University Press, Oxford, UK.Wijmstra, T.A. (1969) Palynology of the Alliance Well. Geologie en Mijnbouw 48, 125–133.Wijmstra, T.A. and van der Hammen, T. (1966) Palynological data on the history of tropical savannas in
northern South America. Leidse Geologische Mededelingen 38, 71–90.Williams, D. (1998) The archaic colonization of the Western Guiana Littoral and its aftermath. Archaeology
and Anthropology 12, 22–41.Williams, E., Cannon, R.T. and McConnell, R.B. (1967) The Folded Precambrian of Northern Guyana Related
to the Geology of the Guiana Shield. GSG, Georgetown, Guyana.Willson, R.C. (1997) Total solar irradiance trend during solar cycles 21 and 22. Science 277, 163–165.Willson, R.C. and Hudson, H.S. (1991) The Sun’s luminosity over a complete solar cycle. Nature 351, 42–44.Wollast, R. and Mackenzie, F.T. (1983) Global cycle of silica. In: Aston, S.R. (ed.) Silicon Geochemistry and
Biogeochemistry. Academic Press, New York, pp. 39–76.Wood, W.I. and McCann, J.M. (1999) The anthropogenic origin and persistence of Amazonian dark earths.
Yearbook of the Conference of Latin American Geographers 25, 7–14.Woodruff, S.D., Slutz, R.J., Jenne, R.L. and Steurer, P.M. (1987) A comprehensive ocean-atmosphere data set.
Bulletin of the American Meteorological Society 68, 1239–1250.Woodruff, S.D., Diaz, H.F., Elms, J.D. and Worley, S.J. (1998) COADS Release 2 data and metadata enhance-
ments for improvements of marine surface flux fields. Physics and Chemistry of the Earth 23, 517–527.Worbes, M. and Junk, W.J. (1989) Dating tropical trees by means of 14C from bomb tests. Ecology 70,
503–507.Xie, S.P., Tanimoto, Y., Noguchi, H. and Matsuno, T. (1999) How and why climate variability differs between
the tropical Atlantic and Pacific. Geophysical Research Letters 26, 1609–1612.Yanez, C. and Ramírez, A. (1988) Estudio geoquímico de grandes ríos venezolanos. Memorias de la Sociedad
de Ciencias Naturales La Salle 48, 41–58.Yavitt, J.B. (2001) Nutrient dynamics of soil derived from different parent material on Barro Colorado Island,
Panama. Biotropica 32, 198–207.Yavitt, J.B. and Wieder, R.K. (1988) Nitrogen, phosphorus and sulfur properties of some forest soils on Barro
Colorado Island, Panama. Biotropica 20, 2–10.Young, S.W. (1976) Petrographic textures of detrital polygonal quartz as an aid to interpreting crystalline
source rocks. Journal of Sedimentary Petrology 34, 595–603.Zachos, J.C., Stott, L.D. and Lohmann, K.C. (1994) Evolution of early Cenozoic marine temperatures.
Palaeoceanography 9, 353–387.Zagt, R.J. (1997) Tree Demography in the Tropical Rain Forest of Guyana. Tropenbos-Guyana Programme,
Georgetown.Zarin, D.J. (1999) Spatial heterogeneity and temporal variability of some Amazonian floodplain soils. In:

Henderson, A. (ed.) Várzea: Diversity, Development, and Conservation of Amazonia’s WhitewaterFloodplains. NYBG, New York, pp. 313–321.
Zebiak, S.E. (1993) Air–sea interaction in the equatorial Atlantic region. Journal of Climate 6, 1567–1586.Ziegler, A.M., Scotese, C.R. and Barrett, S.F. (1983) Mesozoic and Cenozoic paleogeographic maps. In:
Sundermann, J. (ed.) Tidal Friction and the Earth’s Rotation II. Springer, London, pp. 240–252.Zonneveld, J.I.S. (1952) Watervallen in Suriname. Tijdschrift Koninklijke Nederlandse Aardkundig
Genootschap 69, 499–507.
194 D.S. Hammond
Introduction
Ecophysiology seeks to understand thephysiological traits that explain the distri-bution of plants in space and time. Startingfrom ecological observations about habitatcharacteristics and population dynamics,physiological mechanisms are investigatedthat are at the basis of these phenomena.Agronomical questions, including thosefrom forestry, can also be the starting pointfor these types of studies. Most ecophysio-logical studies operate at the level of thewhole plant and its interaction with the(a)biotic environment. The tremendousprogress in physiology and environmentalsciences has greatly stimulated the devel-opment of ecophysiology into a field of itsown right (Lambers et al., 1998). Plant traitsare often divided between physiologicaland morphological or structural, which isalso done in this chapter. However, oneshould realize that structure is a result ofdevelopment and our understanding aboutthe physiological control of developmenthas increased substantially, which makes ita rather artificial dichotomy.
Ecophysiological research on tropicalforests started more recently, mainly in theneotropics and later in other regions.
Technical advances in field instrumenta-tion that have brought the laboratory to theforest and up into the canopy have princi-pally made this possible. Much of this workhas been reviewed recently by Mulkey et al.(1996) and Lüttge (1997). A number of prob-lems that make it generally difficult toextrapolate ecophysiological research to thecommunity and ecosystem level are exacer-bated by the vast species diversity of large,long-lived plants present in tropical forests.The size and longevity of the individualsalso pose technical and conceptual prob-lems, and make essential experimentalapproaches that are commonly appliedelsewhere difficult. Nevertheless, muchprogress has been made in understandingthe ecophysiological underpinnings of trop-ical forest plant functioning during the pasttwo decades. We now have a much betterunderstanding of the physiological traits oftropical forest plants that are particularlyrelevant in examining plant distributionand succession. However, these conclu-sions inevitably are based on assumptionsabout the adaptive value of plant traits.This is a potential pitfall, because criticaltests of these assumptions are lacking.Since these tests are difficult to perform, ifnot impossible, we must find other tools.
195© CAB International 2005. Tropical Forests of the Guiana Shield (ed. D.S. Hammond)
3 Ecophysiological Patterns in GuiananForest Plants
Thijs L. Pons1, Eustace E. Alexander2, Nico C. Houter1, SimmonéA. Rose2 and Toon Rijkers3
1Department of Plant Ecophysiology, Utrecht University, Utrecht, The Netherlands;2Planning and Research Development Division, Guyana Forestry Commission,
Kingston, Georgetown, Guyana; 3Department of Forest Ecology and ForestManagement, Wageningen University, Wageningen, The Netherlands

Critical reasoning supported by mechanis-tic modelling is one approach. Correlatingphysiological traits with distribution andpopulation biological parameters isanother.
An important tool in ecophysiologicalwork is the investigation of the response ofplants to a range of growth conditions. Intropical forest studies, the light climate hasoften been used as an environmental vari-able. Plants adjust to these growth condi-tions. However, for this adjustment to becalled acclimation, it should result in a bet-ter performance than without the adjust-ment. Acclimation potential for a particularenvironmental factor is an important trait,which determines the range of conditionswhere the plant can occur. Tropical foresttree species are often divided in two func-tional groups with respect to their lightrequirements for regeneration (Swaine andWhitmore, 1988). Shade-intolerant pio-neers that require large disturbances areincluded in one group and late successionalshade-tolerant species belong to the secondgroup. Prototypes of the two groups occupyextremes of a continuum. They are charac-terized by contrasting trait sets (Swaine andWhitmore, 1988). Other species occupypositions along the continuum between thetwo groups. Many recent ecophysiologicalstudies carried out in the Guianas were setup to identify the position of species in thesuccessional continuum and identify thetraits associated with that position. A com-plicating factor with forest trees is that theirenvironment changes with development. Alate successional tree that can establish as aseedling in the understorey or small canopygap must be able to tolerate shade as a juve-nile, but must be capable of efficientlyexploiting full daylight once it reachesadult stature. This may place conflictingdemands on the plant and may requireontogenetic changes in traits. Adaptationsto the light climate are considered to be ofoverriding importance for establish-ment and succession after disturbance.However, nutrient and water availabilitymay play an important role as well, partic-ularly on nutrient-poor soils (Coomesand Grubb, 2000). Variation in forest com-
position on different substrates must atleast to some extent be associated with thespecies water and nutrient relations andtolerance to toxic elements where relevant.However, less progress is made with theunravelling of the physiological mecha-nisms of adaptation of forest trees to theseedaphic factors as compared to the light cli-mate.
This chapter reviews the currentlyavailable knowledge on traits relevant forresource acquisition and stress tolerance inforest plants of the Guianas. Photosynthesisis discussed with particular attention toacclimation of plants to light climatechanges and some data about ontogeneticchanges associated with this. Growth per-formance based on photosynthetic carbongain and morphological adjustments in dif-ferent gap environments is treated next. Wethen discuss water relations which may beparticularly relevant in very dry years andwhen floods occur. Acquisition of nutrientelements is reviewed, with particular atten-tion to the importance of nitrogen fixationamong the abundant leguminous species,and the possible role of toxic concentra-tions of aluminium. Most of these studiesare from French Guiana and Guyana, sincehardly any ecophysiological studies havebeen carried out in Suriname. Data from theGuianas are supplemented with data fromother neotropical forests where relevantand they are discussed in that wider per-spective.
Photosynthetic Performance
Photosynthetic pathways
Plant growth in terms of biomass accumula-tion occurs as the result of carbon gainachieved through the photosyntheticprocess. Of the three main types of photo-synthetic metabolism that can be distin-guished, tropical forest plants mostly havethe C3 pathway. The C4 type typically isrestricted to herbaceous weeds that caninvade forest clearings. Crassulacean acidmetabolism (CAM) is most prominent in(hemi-)epiphytes, and can be found in the
196 T.L. Pons et al.
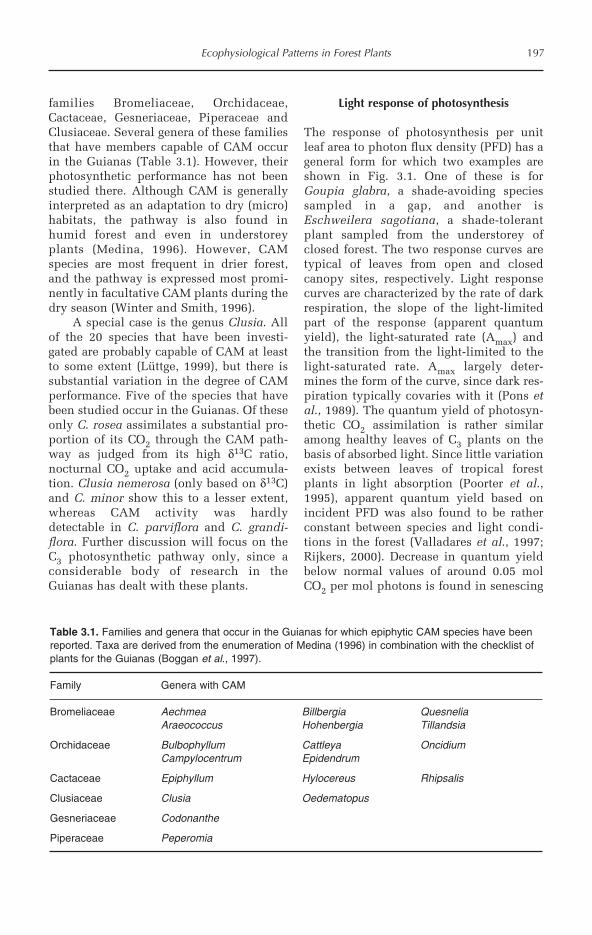
families Bromeliaceae, Orchidaceae,Cactaceae, Gesneriaceae, Piperaceae andClusiaceae. Several genera of these familiesthat have members capable of CAM occurin the Guianas (Table 3.1). However, theirphotosynthetic performance has not beenstudied there. Although CAM is generallyinterpreted as an adaptation to dry (micro)habitats, the pathway is also found inhumid forest and even in understoreyplants (Medina, 1996). However, CAMspecies are most frequent in drier forest,and the pathway is expressed most promi-nently in facultative CAM plants during thedry season (Winter and Smith, 1996).
A special case is the genus Clusia. Allof the 20 species that have been investi-gated are probably capable of CAM at leastto some extent (Lüttge, 1999), but there issubstantial variation in the degree of CAMperformance. Five of the species that havebeen studied occur in the Guianas. Of theseonly C. rosea assimilates a substantial pro-portion of its CO2 through the CAM path-way as judged from its high δ13C ratio,nocturnal CO2 uptake and acid accumula-tion. Clusia nemerosa (only based on δ13C)and C. minor show this to a lesser extent,whereas CAM activity was hardlydetectable in C. parviflora and C. grandi-flora. Further discussion will focus on theC3 photosynthetic pathway only, since aconsiderable body of research in theGuianas has dealt with these plants.
Light response of photosynthesis
The response of photosynthesis per unitleaf area to photon flux density (PFD) has ageneral form for which two examples areshown in Fig. 3.1. One of these is forGoupia glabra, a shade-avoiding speciessampled in a gap, and another isEschweilera sagotiana, a shade-tolerantplant sampled from the understorey ofclosed forest. The two response curves aretypical of leaves from open and closedcanopy sites, respectively. Light responsecurves are characterized by the rate of darkrespiration, the slope of the light-limitedpart of the response (apparent quantumyield), the light-saturated rate (Amax) andthe transition from the light-limited to thelight-saturated rate. Amax largely deter-mines the form of the curve, since dark res-piration typically covaries with it (Pons etal., 1989). The quantum yield of photosyn-thetic CO2 assimilation is rather similaramong healthy leaves of C3 plants on thebasis of absorbed light. Since little variationexists between leaves of tropical forestplants in light absorption (Poorter et al.,1995), apparent quantum yield based onincident PFD was also found to be ratherconstant between species and light condi-tions in the forest (Valladares et al., 1997;Rijkers, 2000). Decrease in quantum yieldbelow normal values of around 0.05 molCO2 per mol photons is found in senescing
Ecophysiological Patterns in Forest Plants 197
Table 3.1. Families and genera that occur in the Guianas for which epiphytic CAM species have beenreported. Taxa are derived from the enumeration of Medina (1996) in combination with the checklist ofplants for the Guianas (Boggan et al., 1997).
Family Genera with CAM
Bromeliaceae Aechmea Billbergia QuesneliaAraeococcus Hohenbergia Tillandsia
Orchidaceae Bulbophyllum Cattleya OncidiumCampylocentrum Epidendrum
Cactaceae Epiphyllum Hylocereus Rhipsalis
Clusiaceae Clusia Oedematopus
Gesneriaceae Codonanthe
Piperaceae Peperomia

leaves or is the result of stresses that causea decrease in stomatal conductance, chloro-phyll content and thus light absorption, orphotoinhibition (Kao and Forseth, 1992).The transition from the light-limited part ofthe response curve to the light-saturatedrate is generally more acute for shade-grown leaves and more gradual for leavesfrom more exposed sites (Valladares et al.,1997), as was true for the measured treesaplings also (Fig. 3.1).
A substantial amount of data on Amaxof forest tree species is available for theGuianas. However, in the following discus-sion, data will also be used for species ofinterest that occur in the Guianas but thatwere measured elsewhere. Low values ofAmax on a leaf area basis between 1 and 4µmol/m2/s are found in epiphytes (Zotz andWinter, 1993) and in plants growing in theshaded forest understorey (Figs 3.1 and 3.2)(Raaimakers et al., 1995; Rijkers et al.,2000a,b). Most saplings and young individ-ual late successional trees that are growingin rather exposed conditions have Amax val-ues of 5–10 µmol/m2/s (Figs 3.1 and 3.2;Huc et al., 1994; Raaimakers et al., 1995;Reich et al., 1995; Rijkers et al., 2000a,b).
However, for some species, such asChlorocardium rodiei, lower values arereported (Fig. 3.2). Not many data are avail-able for mature trees in the Guianas. Thosethat are available suggest that values foryoung trees are indicative for mature ones.In the study by Rijkers et al. (2000a), Amaxvalues of young trees were similar to thoseof mature trees in Dicorynia guianensis andVouacapoua americana, though seedlingsand saplings had lower values. However,the low Amax measured for a mature indi-vidual of the canopy tree Qualea rosea (Royand Salager, 1992) was also found forsaplings of the same species that weregrown in exposed conditions by Barigah etal. (1998). Several light-demanding specieshave higher rates of Amax. Values of up to
198 T.L. Pons et al.
Fig. 3.1. Light-response curves of photosynthesisfor leaves of saplings of two species in therainforest around Mabura Hill, Central Guyana.Measurements were carried out on detachedleaves at around 28°C. Eschweilera sagotiana wassampled in the understorey under a closed forestcanopy; Goupia glabra was sampled in a logginggap. Data points were fitted to the non-rectangularhyperbola as described in Lambers et al. (1998)(T.L. Pons, unpublished data).
Fig. 3.2. Relationships of leaf mass per unit area(LMA) and light-saturated rate of photosynthesis perunit area (Amax) with canopy openness for ninespecies in the forest of the Mabura area in CentralGuyana. Continuous lines represent significantcorrelations; dotted lines refer to non-significantcorrelations. The gradient in canopy opennessresulted from logging activity. Amax was measuredin situ on leaves of saplings (Raaimakers et al.,1995). Cecropia obtusa (Co), Tapirira obtusa (To),Goupia glabra (Gg), Eschweilera sagotiana (Es),Peltogyne venosa (Pv), Eperua falcata (Ef), Dycimbealtsonii (Da), Mora excelsa (Me), Chlorocardiumrodiei (Cr).
Canopy openness (%)
PFD (µmol2/s)
A (
µm
ol/m
2 /s)
Am
ax(µ
mo
l/m2 /
s)L
MA
(g
/m2 )

15 µmol/m2/s have been reported for Piperspp. (Chazdon and Field, 1987), Vismiaspp. (Reich et al., 1995), Jacaranda copaia(Huc et al., 1994), Tapirira marchandii,Goupia glabra (Raaimakers et al., 1995),Virola surinamensis and Diplotropis pur-purea (Bonal et al., 2000b). Even higher val-ues of up to 30 µmol/m2/s have been foundfor fast-growing early successional speciessuch as Ceiba pentandra and Ficus insipida(Zotz and Winter, 1996), and Cecropiaobtusa (Raaimakers et al., 1995).
High irradiances incident on leaves areencountered frequently in a tropical envir-onment when there is no substantial shad-ing by neighbours. Hence, PFD frequentlywill be above the saturation point wherephotosynthesis operates at Amax. A positiveassociation of Amax with daily photosyn-thetic carbon gain in exposed upper canopyleaves can thus be expected. However, it issurprising that there is a close linear rela-tionship (Zotz and Winter, 1993), sinceleaves operate only part of the day at lightsaturation and stress effects during middayreduce photosynthetic rates below theirpotential. Nevertheless, the relationshipwith Amax established by Zotz and Winter(1993) creates the possibility to estimatedaily carbon gain of leaves on the basis ofmeasurement of Amax only.
Environmental effects on photosyntheticparameters
The light-saturated rate of photosynthesis(Amax) not only varies between species, butis also under strong environmental control.For instance, Amax typically increases withan increase in nutrient (Pons et al., 1994)and light availability during growth(Björkman, 1981). For instance, Amax ofGoupia glabra, a species that has been stud-ied extensively, varied substantially withinand between studies from the Guianas andelsewhere. Amax measured in Guyana(Raaimakers et al., 1995) was higher thanAmax reported for French Guiana (Huc etal., 1994; Rijkers et al., 2000a) and fromVenezuela (Reich et al., 1995). Amax typi-cally varies proportionally with leaf N,
because a substantial fraction of it isinvolved in the photosynthetic apparatus(Field and Mooney, 1986; Pons et al., 1989).This relationship remains consistent acrossobservations made on Goupia glabra inGuyana and French Guiana (Fig. 3.3).Hence, the higher photosynthetic ratesmeasured in Guyana are the result of higherleaf N contents per unit leaf area. This inturn may be the result of a higher lightand/or higher N availability for the plants.
Raaimakers et al. (1995) measuredAmax of saplings growing in selectivelylogged forest in central Guyana where largevariation in light availability existed. Amaxwas positively associated with canopyopenness in most species (Fig. 3.2). Thiswas particularly true for the three early suc-cessional species involved in the study(Cecropia obtusa, Tapirira obtusa andGoupia glabra), which responded stronglyto increased canopy openness, whereas thiswas less apparent for the late successionalspecies (only significant in three out of thesix species studied). Within species, indi-viduals growing in low light had thinleaves, as evident from the low leaf massper unit area (LMA) (Fig. 3.2), particularlyin the early successional species. The latesuccessional species, Eschweilera andChlorocardium, had thick leaves, particu-larly when grown in high light.
Ecophysiological Patterns in Forest Plants 199
Fig. 3.3. Relationship of light-saturated rate of pho-tosynthesis (Amax) with leaf nitrogen (NLA), both perunit leaf area, for Goupia glabra in two differentstudies combined. Raaimakers et al. (1995) cate-gories of canopy openness (<25%, ; 25–50%, ◊;>50%, ∆) and Rijkers et al. (2000a), three tree sizes(1 m, ; 5 m, ;15 m, ).
NLA (mmol/m2)
Am
ax(µ
mo
l/m2 /
s)

Although Amax per unit leaf areadecreases with decreasing light availability(Fig. 3.2), the amount of chlorophyll perunit leaf area often remains rather constantacross light conditions in many species(Rijkers et al., 2000a). Consequently, Amaxper unit chlorophyll also decreases. Thisaspect of acclimation to the light environ-ment involves complicated structuralchanges in chloroplasts (Anderson et al.,1995). It fine tunes the balance between theinvestment in photon absorption and pho-tosynthetic capacity to the available light.High investment in photon absorption atthe expense of photosynthetic capacityimproves photosynthetic efficiency inshaded environments, whereas the reverseapplies to high irradiance conditions(Evans and Poorter, 2001). Species vary intheir plasticity with respect to Amax per unitchlorophyll (Murchie and Horton, 1997).Houter (unpublished results) investigatedthis variation in photosynthetic capacityper unit chlorophyll in four species grow-ing in gaps of different sizes. Photo-synthetic capacity was estimated by meansof chlorophyll fluorescence measured atsaturating PFD. The light-saturated rate ofphotosynthetic electron transport (ETRmax)was calculated from these data, whichscales with Amax. The shade-tolerantspecies Oxandra asbeckii and Chloro-cardium rodiei had low ETRmax and highchlorophyll concentrations when growingunder a closed canopy (Fig. 3.4). Thisresulted in a low ETRmax per unit chloro-phyll (ETRmax/chl) in these species. In con-trast, the light-demanding species Goupiaglabra and Cecropia obtusa had higherETRmax and somewhat lower chlorophyllconcentrations in shade, leading to a higherETRmax/chl. When growing in large gaps,all species had a substantially higherETRmax/chl. Only Oxandra, a small treethat remains below the upper canopy whenmature, did not reach the high values foundfor the other three species that normallyencounter full daylight conditions at leastwhen mature (Fig. 3.4). The large variationin ETRmax/chl found for Chlorocardiumunder different light conditions contrastsstrongly with the small variation in
Amax/area in this species (Fig. 3.2). Thisspecies is shade tolerant in early develop-mental stages, but is exposed to full day-light when mature. Greater photosyntheticefficiency in high light of Chlorocardiumleaves is apparently not achieved byincreasing capacity per unit area but bylowering chlorophyll content. The parame-ter photosynthetic capacity per unit chloro-phyll thus better reveals the potential ofphotosynthetic acclimation of this speciesto the large variation in light conditions towhich it is normally exposed during its lifecycle than capacity per unit area.
Rijkers et al. (2000a) investigated fourtree species for the response of their leaf
200 T.L. Pons et al.
Fig. 3.4. Photosynthetic capacity (ETRmax) andchlorophyll both per unit leaf area, and the ratio ofboth parameters (ETRmax/chl) for four species in theforest of the Mabura Hill area in Central Guyana.As a measure of photosynthetic capacity, the rateof electron transport was measured by means ofchlorophyll fluorescence at light saturation (∆F/Fm’* PFD * 0.425). The species are: Oxandra asbeckii(Oxan), Chlorocardium rodiei (Chlo), Goupiaglabra (Goup) and Cecropia obtusa (Cecr) (N.C.Houter, unpublished data).
ET
Rm
ax/c
hl (
mm
ol/m
ol/s
)E
TR
max
(µm
ol/m
2 /s)
Ch
loro
ph
yll (
µ mo
l/m2 /
s)

characteristics to light availability in indi-viduals of different sizes in Nouragues,French Guiana. Individuals in natural gapsand under a closed canopy were measured.The range in light availability was less thanin the study of Raaimakers et al. (1995),resulting in a smaller effect of canopyopenness on Amax and leaf mass per unitarea (LMA) (Rijkers et al., 2000a). However,most remarkable was the association ofthese parameters with tree size (Fig. 3.5).The larger individuals had higher Amax andLMA, which was independent of lightavailability. Amax measured on sunlit leavesof large mature trees was not higher thanthe value for trees of around 20 m, althoughLMA was substantially higher (Rijkers etal., 2000a). Such an ontogenetic change inleaf traits has earlier been found for tem-
perate trees (Niinemets, 1997), and appearsto be present in tropical trees as well.
Photosynthetic rates are constrained bythe low availability of light under a closedforest canopy. This causes a long paybacktime of resources invested in a leaf. The lowLMA that plants have when growing inshade (Fig. 3.2) indicates a low investmentof carbon compounds and thus low con-struction costs per unit area. Hence, thisadaptive trait reduces the inherently longpayback times in shaded understorey envir-onments. Rijkers (2000) calculated paybacktimes on the basis of the temporal distribu-tion of PFD over a cloudless day and thephotosynthesis–light response curves thatwere rather constant over the life span ofthe leaves. Results are a minimum estimate,since aspects like cloudiness and middaystress effects (see below) at the carbon gainside and carbon costs of supporting struc-tures were not taken into account. Paybacktimes of Dicorynia guianensis andVouacapoua americana were indeed sub-stantially longer (approx. 20–40 days) for alow light understorey environment com-pared to about 8 days for leaves in gaps.Dicorynia showed no variation in leaf lifespan with light environment, butVouacapoua had longer leaf life spanswhen growing in shade (Rijkers, 2000), sim-ilar to several other species in Guyana(Rose, 2000). Presumably, longer leaf lifespan in shade is the result of selection forthis trait in an environment with inherentlylong payback times. The predominantlylong leaf life spans in the forests of theGuiana Shield and elsewhere in theneotropics (Bongers and Popma, 1990;Reich et al., 1995; Rijkers, 2000; Rose, 2000)are associated with selection for shade-tol-erant genotypes in these forests.
Dynamics of photosynthesis
The data on photosynthetic performancedescribed so far are based on steady-stateresponses. However, photon flux densitiesin particular are highly dynamic. On cleardays, the diffuse understorey light environ-ment is interrupted by occasional short
Ecophysiological Patterns in Forest Plants 201
Fig. 3.5. Relationships of leaf mass per unit area(LMA) and light-saturated rate of photosynthesis perunit leaf area (Amax) with tree size of four speciesin the forest of Nouragues, French Guiana (Rijkerset al., 2000a). Species are: Duguetia surinamensis(), Vouacapoua americana (), Dicorynia guianesis() and Goupia glabra (∆). Individual trees wereselected in a way that tree height and canopyopenness varied independently to a considerableextent. Ancova with species as main factor and treeheight and canopy openness as covariablesshowed significant independent effects of the threefactors on LMA (r2=0.77) and Amax (r2=0.55).
Am
ax(µ
mo
l/m2 /
s)L
MA
(g
/m2 )
Tree height (m)

periods of high light when direct sunlightpenetrates through small holes in thecanopy (Chazdon, 1988). In a gap, diffuselight is alternated by longer periods ofdirect light (Fig. 3.6). The photosyntheticapparatus in a leaf requires some time afterexposure to high light before the fullsteady-state rate is achieved, referred to asphotosynthetic induction (Pearcy, 1990).
The photosynthetic response to a sud-den increase in PFD was investigated insaplings of three species growing in theshaded understorey and in gaps inNouragues, French Guiana (Rijkers et al.,2000b). Times until 90% of full inductionwere rather short, at 7–11 minutes. Increasein chloroplast activity was the main limita-tion in Dicorynia guianensis and
Vouacapoua americana, whereas stomatallimitations were more important inPourouma bicolor. Plants growing in theshaded understorey maintained a highinduction state when switched from high tolow light, enabling them to respond rapidlyto a sequence of short-lived light flecks. Incontrast, Dicorynia saplings growing in gapsshowed a rapid loss of photosynthetic induc-tion, principally limited by chloroplastrather than stomatal performance. Theseexperiments were carried out in the morn-ing. However, studies done on trees andshrubs at other neotropical locations indi-cate that induction times tend to be longerand loss of induction faster in the afternoonand during the dry season (Poorter andOberbauer, 1993; Allen and Pearcy, 2000).
202 T.L. Pons et al.
Fig. 3.6. Course over a day of gas exchange parameters of a Goupia glabra leaf (upper panel) and environ-mental parameters (lower panel). Measurements were carried out on a sapling in a large gap (c. 3200 m2)on a bright day in the dry season (19 November 1999) in the forest in the Mabura Hill area in CentralGuyana. Shown are net photosynthesis (An), the potential rate of net photosynthesis (Ap) calculated on thebasis of the light response curve of that leaf and the course of the photon flux density (PFD), stomatal con-ductance (gs), the intercellular CO2 concentration (Ci) and the leaf temperature (TL) measured when theleaf was not in the cuvette (N.C. Houter, unpublished data).
PF
D (
mm
ol/m
2 /s)
An
and
Ap
(µm
ol/m
2 /s)
TL
(°C
)Time of day (h)
Ci(p
pm
) g
s(m
mo
l/m2 /
s; x
4)
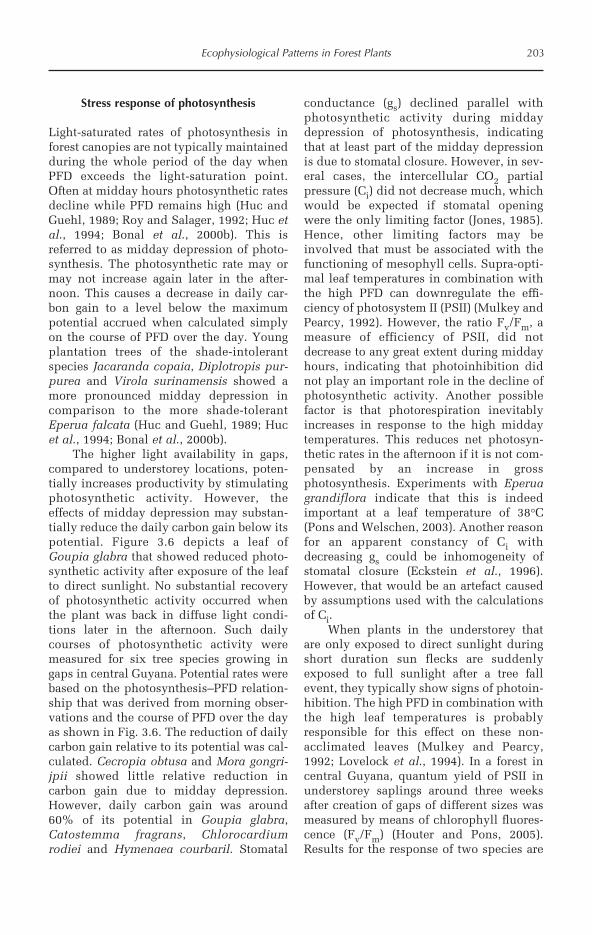
Stress response of photosynthesis
Light-saturated rates of photosynthesis inforest canopies are not typically maintainedduring the whole period of the day whenPFD exceeds the light-saturation point.Often at midday hours photosynthetic ratesdecline while PFD remains high (Huc andGuehl, 1989; Roy and Salager, 1992; Huc etal., 1994; Bonal et al., 2000b). This isreferred to as midday depression of photo-synthesis. The photosynthetic rate may ormay not increase again later in the after-noon. This causes a decrease in daily car-bon gain to a level below the maximumpotential accrued when calculated simplyon the course of PFD over the day. Youngplantation trees of the shade-intolerantspecies Jacaranda copaia, Diplotropis pur-purea and Virola surinamensis showed amore pronounced midday depression incomparison to the more shade-tolerantEperua falcata (Huc and Guehl, 1989; Hucet al., 1994; Bonal et al., 2000b).
The higher light availability in gaps,compared to understorey locations, poten-tially increases productivity by stimulatingphotosynthetic activity. However, theeffects of midday depression may substan-tially reduce the daily carbon gain below itspotential. Figure 3.6 depicts a leaf ofGoupia glabra that showed reduced photo-synthetic activity after exposure of the leafto direct sunlight. No substantial recoveryof photosynthetic activity occurred whenthe plant was back in diffuse light condi-tions later in the afternoon. Such dailycourses of photosynthetic activity weremeasured for six tree species growing ingaps in central Guyana. Potential rates werebased on the photosynthesis–PFD relation-ship that was derived from morning obser-vations and the course of PFD over the dayas shown in Fig. 3.6. The reduction of dailycarbon gain relative to its potential was cal-culated. Cecropia obtusa and Mora gongri-jpii showed little relative reduction incarbon gain due to midday depression.However, daily carbon gain was around60% of its potential in Goupia glabra,Catostemma fragrans, Chlorocardiumrodiei and Hymenaea courbaril. Stomatal
conductance (gs) declined parallel withphotosynthetic activity during middaydepression of photosynthesis, indicatingthat at least part of the midday depressionis due to stomatal closure. However, in sev-eral cases, the intercellular CO2 partialpressure (Ci) did not decrease much, whichwould be expected if stomatal openingwere the only limiting factor (Jones, 1985).Hence, other limiting factors may beinvolved that must be associated with thefunctioning of mesophyll cells. Supra-opti-mal leaf temperatures in combination withthe high PFD can downregulate the effi-ciency of photosystem II (PSII) (Mulkey andPearcy, 1992). However, the ratio Fv/Fm, ameasure of efficiency of PSII, did notdecrease to any great extent during middayhours, indicating that photoinhibition didnot play an important role in the decline ofphotosynthetic activity. Another possiblefactor is that photorespiration inevitablyincreases in response to the high middaytemperatures. This reduces net photosyn-thetic rates in the afternoon if it is not com-pensated by an increase in grossphotosynthesis. Experiments with Eperuagrandiflora indicate that this is indeedimportant at a leaf temperature of 38°C(Pons and Welschen, 2003). Another reasonfor an apparent constancy of Ci withdecreasing gs could be inhomogeneity ofstomatal closure (Eckstein et al., 1996).However, that would be an artefact causedby assumptions used with the calculationsof Ci.
When plants in the understorey thatare only exposed to direct sunlight duringshort duration sun flecks are suddenlyexposed to full sunlight after a tree fallevent, they typically show signs of photoin-hibition. The high PFD in combination withthe high leaf temperatures is probablyresponsible for this effect on these non-acclimated leaves (Mulkey and Pearcy,1992; Lovelock et al., 1994). In a forest incentral Guyana, quantum yield of PSII inunderstorey saplings around three weeksafter creation of gaps of different sizes wasmeasured by means of chlorophyll fluores-cence (Fv/Fm) (Houter and Pons, 2005).Results for the response of two species are
Ecophysiological Patterns in Forest Plants 203
shown in Fig. 3.7. They showed a decline ofFv/Fm with increasing gap size and valuessubstantially below the normal 0.8 value forhealthy leaves in the larger gaps. The pre-dawn values are only slightly higher thanthe midday measurements, which indicatesthat most of the photoinhibition could beattributed to long-lasting damage to PSIIrather than to a temporary photoprotectivedown-regulation in quantum yield. Theshade-tolerant subcanopy species Oxandraasbeckii suffered strongly from photoinhi-bition in gaps larger than 100 m2, whereasFv/Fm of the canopy species Catostemmafragrans reached low values only in thelargest gaps of 1600 m2. The data suggestthat the sensitivity to photoinhibition is
related to a plant’s shade tolerance, whichwas also found for rainforest plants in NewGuinea (Lovelock et al., 1994).
Gas exchange processes at the canopy andecosystem level
The increase of photosynthetic capacity inseedlings and saplings that occurs with anincrease in light availability in treefall gapsis also found to occur along the vertical pro-file of single trees. In an Amazonian rain-forest, Carswell et al. (2000) found that thephotosynthetic capacity of leaves decreasedwith distance from the canopy surface andthat this was accompanied by a decrease innitrogen content. Such a parallel distribu-tion of photosynthetic capacity with lightintensity improves resource use efficiencyfor photosynthesis at the whole plant andcommunity level (Pons et al., 1989).
Exchange processes between forest andatmosphere were investigated in FrenchGuiana by using carbon and oxygen stableisotope composition of air, plants and litter(Buchmann et al., 1997). During daytime,CO2 concentrations in the upper canopyregions were about 12 ppm lower than inthe bulk air above the canopy due to photo-synthetic CO2 uptake processes (Table 3.2).Conversely, measured CO2 values at groundsurface locations were well above the nor-mal atmospheric values due to CO2 genera-tion from soil-based microbial respiration.Night-time values were all higher than freeatmosphere, with a strong gradient to thesoil surface where CO2 concentrationreached 562 ppm. Plant-derived organicmatter has substantially less 13C comparedto CO2 in the atmosphere (approx. 20‰)due to discrimination against 13C duringthe photosynthesis process (Farquhar et al.,1982). The CO2 originating from respirationhad a similar isotopic carbon compositionas plants and litter, resulting in a decline inδ13C during the night and towards the soilsurface due to CO2 originating from soil andplants mixing with that from the atmos-phere (Table 3.2). CO2 from the atmosphereapparently dominates the composition ofthe air in the canopy during daytime,
204 T.L. Pons et al.
Fig. 3.7. Quantum yield of photosystem IImeasured after dark adjustment (Fv/Fm) of leaves ofsaplings three weeks after the creation of openingsof different sizes in the forest canopy (means ofthree similar sized gaps ± SE). Measurements werecarried out early in the morning and during mid-day hours in the forest in the Mabura Hill area incentral Guyana. Morning values for plants that hadbeen exposed for half a year to conditions in alarge gap are also included. A closed forest canopyis arbitrarily put at a gap size of 25 m2 (Houter andPons, 2005). Species are: Catostemma fragrans andOxandra asbeckii.
Gap size (m2)10 100 1000 10,000

because the δ13C values were not much dif-ferent from free atmospheric values. Duringthe night, decreased air turbulence leads toa localized build-up of plant- and soil-derived CO2 in the air in the forest(Buchmann et al., 1997).
Leaves sampled from different canopypositions showed decreasing δ13C withdecreasing height (Table 3.2). When the val-ues are corrected for the different isotopiccomposition of CO2 in the air at the heightof the leaf, then it appears that 13C discrim-ination (∆13C) is higher in the mid-canopyand understorey compared to the uppercanopy regions. This means that uppercanopy leaves operate at a lower intercellu-lar CO2 concentration (Ci) compared tomid-canopy and understorey leaves(Farquhar et al., 1982). Hence, leaves in thelower regions of the forest canopy havetheir stomata more widely open relative totheir low photosynthetic rates in the shadeas compared to upper canopy leaves(Dolman et al., 1991).
Gas exchange processes at the ecosys-tem level have also been studied inAmazonian rainforest in Brazil using stableisotope and Eddy covariance techniqueswhich permit conclusions on net carbonexchange between forest and atmosphere(Grace et al., 1996; Lloyd et al., 1996). Theconcept of a climax forest in most ofAmazonia would imply no net positive ornegative exchange of carbon of these forestswith the atmosphere. However, these stud-
ies challenge this concept and suggest thatAmazonian forests are net sinks for CO2.The rising atmospheric CO2 concentrationdrives this carbon sequestering, which isperiodically reversed in El Niño years whenthese forests are sources to the atmosphere(Tian et al., 1998). Model calculations andfurther evidence indicate that tropicalforests in general act as carbon sinks (Malhiand Grace, 2000), which would thus alsoapply to the predominantly primary forestsof the Guiana Shield. However, these con-clusions are based on data from a limitednumber of sites. Measurements in theGuianan forests are needed to quantify theircontribution to the global carbon cycle.
Relative Growth Rate and itsComponents
The growth rate of plants in terms of bio-mass increase is not only determined by therate of photosynthetic carbon gain of theirleaves, but also by the amount of photosyn-thetically active tissue. Hence, photosyn-thetic characteristics of leaves as discussedabove are just one category of traits thatdetermine growth performance. One ofthese is the light-saturated rate of photosyn-thesis, which is a good predictor of dailycarbon gain at the leaf level (Zotz andWinter, 1996). To obtain the daily net car-bon gain of a whole plant that is equivalentto biomass increase, the daily release of
Ecophysiological Patterns in Forest Plants 205
Table 3.2. Gradients in CO2 and 13C concentrations in the dry season in a forest in French Guiana(Paracou). The stable isotope 13C is expressed as a ratio relative to the PDB standard (δ13C). ∆13C isthe discrimination against 13C during the assimilation of leaf carbon. δ13C of soil is the mean of soilorganic matter and litter (Buchmann et al., 1997).
CO2 concentration δ13C of CO2 in air δ13C leaf, ∆13C(ppm) (‰) soil (‰) (‰)
Day Night Day Night
Troposphere 355 –7.728 m 343 434 –7.9 –11.5 –28.6 21.713 m 342 465 –7.9 –11.5 –33.2 26.52 m 350 499 –8.0 –11.8 –33.6 26.1 Near surface 444 562 –9.7 –16.5Soil –26.5 –29.4
δ13C leaf, ∆13Csoil (‰) (‰)

CO2 through respiration must be subtractedfrom daily photosynthesis. Respiration is asubstantial part of daily photosynthesis:about 40% in high light and 75% in lowlight conditions has been measured fortropical tree seedlings (Lehto and Grace,1994). The other major component thatinfluences growth rate is distribution of bio-mass over plant organs, particularly photo-synthetic leaf area. The leaf area ratio (LAR;leaf area per unit plant biomass), the param-eter used to describe this biomass distribu-tion, was found to explain most of thevariation in relative growth rate (RGR;increase in biomass per unit biomass pres-ent and time) in herbaceous species undergrowth chamber conditions, whereas thenet assimilation rate (NAR; increase in bio-mass per unit leaf area and time) was ofminor importance (Poorter and van derWerf, 1998). This contrasts with growthanalysis carried out with tropical treeseedlings under conditions that betterresemble natural habitat conditions. In areview of 43 studies, Veneklaas and Poorter(1998) showed that slow-growing climaxspecies that are shade tolerant in earlydevelopment generally have a low NAR inhigh light conditions, compared to shade-intolerant pioneer species. This high NARin pioneers is largely due to a higher light-saturated rate of photosynthesis whichmore than compensates for the respiratorylosses of CO2 that are also somewhat higher(Veneklaas and Poorter, 1998). The highphotosynthetic capacity of pioneers enablesthem to exploit high light conditions moreefficiently than climax species, which gen-erally have lower capacities (Fig. 3.2).Hence, photosynthetic characteristics areimportant determinants of growth rate inhigh light conditions for tree saplings in theforest. The morphological parameter LAR isgenerally a more important determinant ofgrowth rate under low light conditions. TheLAR is typically higher in pioneer speciescompared to climax species, which resultsin a paradoxically higher relative growthrate (RGR) of shade-intolerant trees in lowlight (Veneklaas and Poorter, 1998). Themost important determinant of LAR is thespecific leaf area (SLA; leaf area per unit
leaf dry mass), which is often high in pio-neers, although they may also be character-ized by a somewhat higher leaf massfraction (LMF; leaf mass per unit plantmass).
In many studies where the effect oflight availability on growth has beenanalysed, plants are grown under shadedevices that do not fully simulate variationin the complex light climate as found in theforest. One important point is that the spec-tral component of light is absent in most ofthese studies. The low red:far-red ratiofound under a leaf canopy usually influ-ences allocation and morphological param-eters and thus growth rates (Corré, 1983),although this may be less in shade-toleranttropical rainforest saplings (Kitajima, 1994).Furthermore, the daily course of photonflux density (PFD) in canopy gaps is char-acterized by periods of high PFD in directsunlight with periods of low PFD in diffuselight (Fig. 3.6). This contrasts with a morehomogeneous distribution of PFD over aday under experimental shade screen con-ditions. Photosynthetic capacity is probablymore important for photosynthetic perform-ance and thus NAR and RGR in a gap lightenvironment compared to the more homo-geneous reduction in light under shadescreens, although this has not been expli-citly investigated. The large variation inPFD over the day in canopy gaps is also thereason why daily carbon gain is expected tobe lower in a gap compared to the moreequal light distribution under shade screen(Pons et al., 1994).
Growth in relation to canopy openness
Experiments were conducted in Guyanawhere seedlings were planted in gaps of dif-ferent sizes and growth was monitored bymeans of destructive harvesting (Boot,1993, 1996; Rose, 2000). Since seedlingsdid not survive in all conditions, particu-larly at the lower light availabilities, theseexperiments provide some information onshade tolerance in early development.Small-seeded species such as Cecropiaobtusa, Goupia glabra and Laetia procera
206 T.L. Pons et al.

showed reduced survival under a closedcanopy and in a small gap of about 50 m2,with increasing survival times in the orderof the species mentioned. Several otherspecies were included in the experiments,but all showed substantial survival in deepshade of up to a year or more (Boot, 1996;Rose, 2000).
Relative growth rates generallyincreased with increasing gap size, but lev-elled off above a gap size of around 800 m2
(Fig. 3.8). There were clear differencesbetween species in maximum RGRachieved in the largest gaps. Small-seededspecies had much higher RGRmax thanlarge-seeded ones, particularly the verylarge-seeded Mora gongrijpii (Fig. 3.8), M.excelsa and Chlorocardium rodiei (terSteege, 1993, 1994b; ter Steege et al., 1994),which had very low RGRmax. This resultedin a close correlation between inherentRGRmax and seed mass (Rose, 2000; Roseand Poorter, 2003). Some general trendsassociated with the RGRmax–seed mass rela-tionship could be distinguished. The higherRGR of the small-seeded species was partlycaused by their high LAR, which was inturn the result of a high SLA. The LMF, theother component of the LAR, was onlyslightly higher in the fast-growing speciesthan in the slow-growing ones (Fig. 3.8).The NAR, the other component of the RGR,was also substantially higher in the fast-growing species. As argued above, the driv-ing force of NAR is the daily assimilation,which is to a large extent determined byAmax (Zotz and Winter, 1996). The highAmax of the small-seeded pioneer speciesthus contributes to their high growth ratethrough its effect on NAR. The large plas-ticity in SLA expressed by Cecropia andGoupia compared to the other species wasparticularly impressive, both showing veryhigh SLA when growing in gaps of 200 m2
(Fig. 3.8).Although clear trends could be distin-
guished in RGRmax and its components,there were also important exceptions.Carapa guianensis had a higher RGRmaxcompared to other species with similar seedmass. This large-seeded, but not veryshade-tolerant species (Favrichon, 1994)
had a rather high NAR, probably based on ahigh Amax (Huc et al., 1994). The high RGRof Cecropia obtusa was not based on a highSLA, but its thick leaves have a high Amaxleading to a high NAR. The reverse was truefor Goupia glabra, which had a NAR simi-lar to several larger-seeded climax species,but had thin leaves (high SLA) resulting ina high LAR that led to the high RGR (Fig.3.8). Another exception is the shade-toler-ant Duguetia neglecta that had a high SLAcompared to other shade-tolerant species(Boot, 1993, 1996). Its RGR was low due toa low NAR, but whether that is associatedwith an even lower Amax than the othershade-tolerants is unknown.
Plants with small seeds that have ahigh RGRmax start their development withvery little initial biomass but increase thisrapidly after germination. This contrastswith plants with large seeds that have a lowRGR. They start growth with a relativelyhigh biomass, but that increases slowlyafter germination. At a certain moment theaccumulated biomass of both plant typeswill equal each other (Boot, 1996). Thesemoments of equal plant mass have been cal-culated assuming constant RGR (Rose andPoorter, 2003). It would take Cecropiaobtusa 174 days to attain the same plantmass as Mora gongrijpii, which has, onaverage, a seed mass that is six orders ofmagnitude greater than Cecropia. Theslower-growing Goupia glabra andHymenaea courbaril would take 264 and786 days respectively to attain mass equalto Mora. Hence, if the residual vegetation isnot too dense after a large disturbance, thesmall-seeded pioneers can exploit theirinherently higher growth rate to compen-sate for the small initial plant size and gainadvantage over the slow-growing climaxspecies.
However, RGR typically declines dur-ing plant growth (Veneklaas and Poorter,1998). The low RGR of larger plants can bedue to a larger investment in stem mass,thus causing a low LMF and LAR, and self-shading may be more prevalent in theircrowns leading to a lower NAR. Since largeseeds give rise to large seedlings, there isthus a fair chance that at least part of the
Ecophysiological Patterns in Forest Plants 207

208 T.L. Pons et al.
Fig. 3.8. Relative growth rate (RGR) and its components net assimilation rate (NAR), leaf area ratio (LAR),specific leaf area (SLA) and leaf mass fraction (LMF) of four species differing by five orders of magnitude inseed size. Species order from low to high seed mass is: Cecropia obtusa, Goupia glabra, Hymenaeacourbaril and Mora gongrijpii. Growth parameters of the seedlings were determined for a period of up tofive months after seed reserves were exhausted. The experiment was carried out in the forest understoreyunder a closed canopy (FU), and in gaps of exponentially increasing sizes as indicated in the legend inm2. In the largest gap, Goupia and Hymenaea were allowed to grow until similar or larger plant size wasreached than Mora (3200 L). Cecropia and Goupia did not survive in sufficient numbers in FU (after Rose,2000).
RG
R (
mg
/g/d
ay)
NA
R (
g/m
2 /d
ay)
LA
R (
m2 /
kg)
SL
A (
m2 /
kg)
LM
F (
g/g
)

association of RGRmax with seed mass iscaused by this decreasing RGR with plantsize. Furthermore, the assumptions of themodel calculations referred to above maynot be valid. To investigate if RGR doesindeed decrease with plant size in thespecies under investigation, Goupia andHymenaea were allowed to grow in thelargest gap until they reached a similar orlarger size than Mora, the species with thehighest seed mass (Fig. 3.8). The predicteddecline in RGR was indeed found forGoupia and was the result of a decrease inLAR, but not NAR, which even increased.The Hymenaea plants that were allowed togrow further also showed a stimulation ofNAR compared to the smaller plants whichcompensated fully for the decrease in LAR,resulting in a similar RGR across a plantmass range of two orders of magnitude.Although RGR of Goupia decreased withplant size, it was still substantially higherthan that of the larger-seeded climax speciesHymenaea and Mora. Hence, there is indeedan inherent difference in RGR betweensmall-seeded pioneers and large-seededshade-tolerants, independent of plant size.Furthermore, although the calculationsbased on stable RGR may underestimate thetime it takes to reach equal plant mass, theprinciple that small-seeded species can out-compete large-seeded slow growers in largergaps based on their high RGR remains valid.
The high biomass that small-seededpioneer species such as Jacaranda copaiacan accrue after a relatively brief period ofgrowth at high light availability, comparedto lower growth rates of large-seeded,shade-tolerant species, has also beendemonstrated in an experiment in FrenchGuiana (Barigah et al., 1998). The hemi-shade-tolerant species with larger seeds,Platonia insignis and two Carapa spp. (C.guianensis and C. procera) had similarplant masses at the end of the experimentalgrowth period compared to Jacaranda. Thisindicates that the latter species had also ahigher RGR, which enables it to surpasslarger-seeded slower-growing species inhigh light conditions.
Fast growth of small-seeded pioneersin large gaps was also demonstrated in an
experiment where eight species wereplanted in gaps and allowed to grow forthree years (Rose, 2000). The initially smallCecropia obtusa, Goupia glabra andSclerolobium guianense dominated thecanopy after one year in the largest experi-mental gaps (1600 m2 and 3200 m2).Surprisingly, the largest-seeded speciesused in the experiment, Catostemma fra-grans and Chlorocardium rodiei, were notthe tallest in the small gap (50 m2). Thatposition was achieved by Pentaclethramacroloba, which also showed substantialheight growth in the largest gaps. Theremarkable combination of tolerance ofdeep shade and fast growth in gaps was alsodemonstrated for this species in Costa Rica(Fetcher et al., 1994).
Seedling establishment and seed size
The results of the experiments withGuianan tree species described above fitquite well with general ideas about the roleof seed size in establishment (Leishman etal., 2000). One of the advantages of a largeseed is associated with survival in shade. Ifseed reserves are not immediately allocatedto the slow-growing seedling, then thereserves in the cotyledons can sustain theseedling for a prolonged period until condi-tions become more favourable. This is par-ticularly evident in the very large-seededChlorocardium rodiei, which keeps itsreserves for up to a year after germination(Boot, 1993; ter Steege et al., 1994). In theprocess, plant mass, including cotyledons,gradually decreases due to a negative car-bon balance in the shaded understoreyenvironment, but survival is high. Anotheradvantage of a large seed is associated withthe competitive advantage of the large ini-tial size. Carapa spp. combine these twotraits. Large seeds always come with thedisadvantage of the trade-off with smallnumbers (Smith and Fretwell, 1974). Largenumbers of seeds are essential for speciesthat exploit the unpredictable window forestablishment after an occasional heavydisturbance. The small seed size that comeswith larger numbers improves dispersal
Ecophysiological Patterns in Forest Plants 209
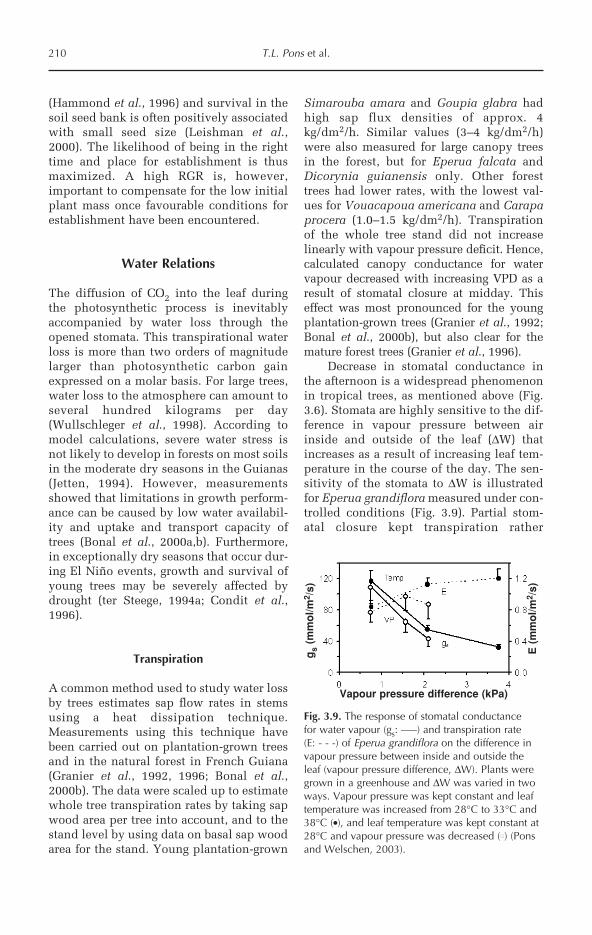
(Hammond et al., 1996) and survival in thesoil seed bank is often positively associatedwith small seed size (Leishman et al.,2000). The likelihood of being in the righttime and place for establishment is thusmaximized. A high RGR is, however,important to compensate for the low initialplant mass once favourable conditions forestablishment have been encountered.
Water Relations
The diffusion of CO2 into the leaf duringthe photosynthetic process is inevitablyaccompanied by water loss through theopened stomata. This transpirational waterloss is more than two orders of magnitudelarger than photosynthetic carbon gainexpressed on a molar basis. For large trees,water loss to the atmosphere can amount toseveral hundred kilograms per day(Wullschleger et al., 1998). According tomodel calculations, severe water stress isnot likely to develop in forests on most soilsin the moderate dry seasons in the Guianas(Jetten, 1994). However, measurementsshowed that limitations in growth perform-ance can be caused by low water availabil-ity and uptake and transport capacity oftrees (Bonal et al., 2000a,b). Furthermore,in exceptionally dry seasons that occur dur-ing El Niño events, growth and survival ofyoung trees may be severely affected bydrought (ter Steege, 1994a; Condit et al.,1996).
Transpiration
A common method used to study water lossby trees estimates sap flow rates in stemsusing a heat dissipation technique.Measurements using this technique havebeen carried out on plantation-grown treesand in the natural forest in French Guiana(Granier et al., 1992, 1996; Bonal et al.,2000b). The data were scaled up to estimatewhole tree transpiration rates by taking sapwood area per tree into account, and to thestand level by using data on basal sap woodarea for the stand. Young plantation-grown
Simarouba amara and Goupia glabra hadhigh sap flux densities of approx. 4kg/dm2/h. Similar values (3–4 kg/dm2/h)were also measured for large canopy treesin the forest, but for Eperua falcata andDicorynia guianensis only. Other foresttrees had lower rates, with the lowest val-ues for Vouacapoua americana and Carapaprocera (1.0–1.5 kg/dm2/h). Transpirationof the whole tree stand did not increaselinearly with vapour pressure deficit. Hence,calculated canopy conductance for watervapour decreased with increasing VPD as aresult of stomatal closure at midday. Thiseffect was most pronounced for the youngplantation-grown trees (Granier et al., 1992;Bonal et al., 2000b), but also clear for themature forest trees (Granier et al., 1996).
Decrease in stomatal conductance inthe afternoon is a widespread phenomenonin tropical trees, as mentioned above (Fig.3.6). Stomata are highly sensitive to the dif-ference in vapour pressure between airinside and outside of the leaf (∆W) thatincreases as a result of increasing leaf tem-perature in the course of the day. The sen-sitivity of the stomata to ∆W is illustratedfor Eperua grandiflora measured under con-trolled conditions (Fig. 3.9). Partial stom-atal closure kept transpiration rather
210 T.L. Pons et al.
Fig. 3.9. The response of stomatal conductancefor water vapour (gs: –––) and transpiration rate(E: - - -) of Eperua grandiflora on the difference invapour pressure between inside and outside theleaf (vapour pressure difference, ∆W). Plants weregrown in a greenhouse and ∆W was varied in twoways. Vapour pressure was kept constant and leaftemperature was increased from 28°C to 33°C and38°C (), and leaf temperature was kept constant at28°C and vapour pressure was decreased () (Ponsand Welschen, 2003).
gs
(mm
ol/m
2 /s)
E (
mm
ol/m
2 /s)
Vapour pressure difference (kPa)
constant across a wide range of ∆W, as wasalso found in growth room experiments forEperua falcata, Diplotropis purpurea andVirola michelii (Bonal, 2000). No differencein the ∆W-response of the stomata was evi-dent between these species. However, theclosure response may be so strong in otherspecies that transpiration rates even declinewith increasing ∆W, as found for the shrubPiper auritum (Tinoco-Ojanguren andPearcy, 1993). The ∆W-response is animportant reason for the midday decreasein stomatal opening. It limits water loss,and if intercellular CO2 concentrationdecreases with partial stomatal closure, italso enhances water-use efficiency (WUE)of the photosynthetic process.
Midday water potentials (Ψw) measuredin plantation-grown trees varied between –1and –2 MPa in the study of Huc et al. (1994).The two shade-intolerant pioneer speciesthat were included in the study, Jacarandacopaia and Goupia glabra, had high middayΨw, and the two late successional species,Dicorynia guianensis and Eperua falcata,had low midday Ψw (more negative).Carapa guianensis had values in betweenthese extremes. No decrease in pre-dawn ormidday Ψw was evident in the course of thedry season, when the measurements wereperformed. This indicates that the trees hadaccess to moist soil layers. The higher mid-day Ψw in the two pioneer species, in com-bination with similar stomatal conductance,suggests a lower resistance for water trans-port and/or uptake in these species com-pared to the late successional species (Hucet al., 1994).
Midday water potentials were morecontrasting between shade-tolerant and-intolerant species in another study carriedout on plantation-grown trees in FrenchGuiana (Bonal et al., 2000b). Eperua falcataagain had a low midday Ψw of –2 MPa,which was stable across wet and dry sea-sons (Fig. 3.10). Diplotropis pupurea had amidday Ψw of –1.6 MPa in the wet season,but surprisingly, a substantially higher Ψwin the dry season, when a lower valuewould be expected. The other shade-intol-erant species included in the study, Virolasurinamensis, which generally occurs on
wet soils, exhibited strong, isohydricbehaviour. Midday water potential wasnever lower than –0.3 MPa, which wasclose to the predawn Ψw of –0.2 MPa (Fig.3.10). These water potentials are unusuallyhigh for a tree and suggest a very low resist-ance for uptake and transport of water.Stomatal and canopy conductance ofDiplotropis and Virola were high during thewet season (Bonal et al., 2000b).Conductances decreased substantially inDiplotropis in the dry season, which appar-ently limited transpiration to such anextent that Ψw increased. Stomata almostcompletely closed in the dry season inVirola, which is a condition for the veryhigh Ψw. These seasonal changes in waterrelations contrast with those of Eperua,which showed only a limited decrease inconductances in the dry season. This isconsistent with the view that Eperua canaccess water in deeper soil layers, based onsimilar d18O in soil and xylem water and arelatively deep rooting depth (Bonal et al.,2000a). Pot experiments carried out undercontrolled growth room conditions (Bonal,2000) confirmed that Virola (in this caseVirola michelii) maintained high Ψw andEperua a low Ψw across a wide range of soilwater contents, and that Diplotropisincreased its Ψw in response to moderatelydry soil conditions.
Flooding and drought tolerance in Mora spp.
Mora gongrijpii is found more frequently inupland well-drained conditions and mayexperience occasional droughts in dryyears, whereas M. excelsa mostly occursalong creeks and rivers and experiencesoccasional floods. Ter Steege (1993, 1994a)carried out several experiments in CentralGuyana in order to establish the speciesspecific traits that are responsible for thishabitat segregation. The study concentratedon early growth stages because these werethought to be most vulnerable to environ-mental stress, particularly drought. Middaywater potentials of saplings of the twoshade-tolerant Mora spp. growing in theforest understorey were high in the dry sea-
Ecophysiological Patterns in Forest Plants 211
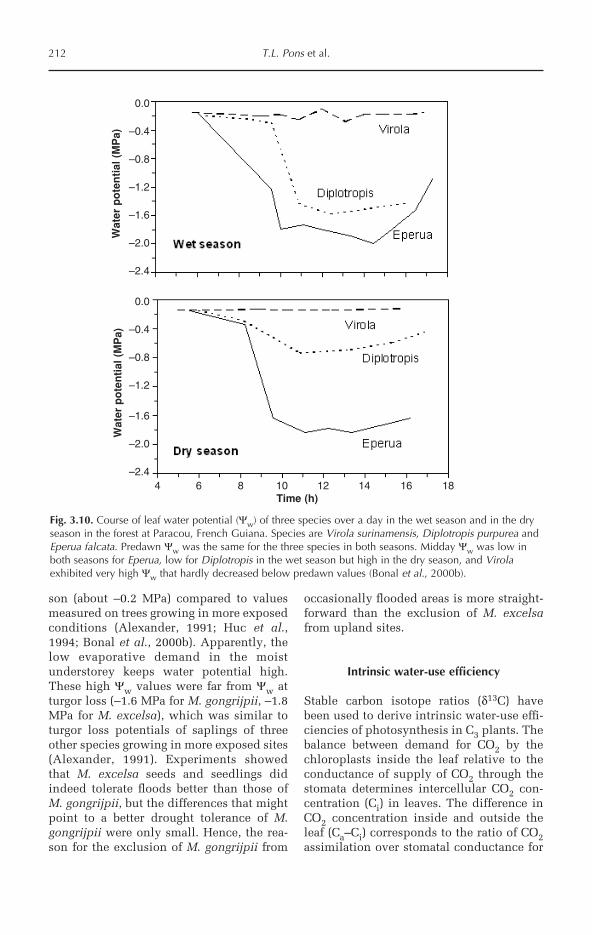
son (about –0.2 MPa) compared to valuesmeasured on trees growing in more exposedconditions (Alexander, 1991; Huc et al.,1994; Bonal et al., 2000b). Apparently, thelow evaporative demand in the moistunderstorey keeps water potential high.These high Ψw values were far from Ψw atturgor loss (–1.6 MPa for M. gongrijpii, –1.8MPa for M. excelsa), which was similar toturgor loss potentials of saplings of threeother species growing in more exposed sites(Alexander, 1991). Experiments showedthat M. excelsa seeds and seedlings didindeed tolerate floods better than those ofM. gongrijpii, but the differences that mightpoint to a better drought tolerance of M.gongrijpii were only small. Hence, the rea-son for the exclusion of M. gongrijpii from
occasionally flooded areas is more straight-forward than the exclusion of M. excelsafrom upland sites.
Intrinsic water-use efficiency
Stable carbon isotope ratios (δ13C) havebeen used to derive intrinsic water-use effi-ciencies of photosynthesis in C3 plants. Thebalance between demand for CO2 by thechloroplasts inside the leaf relative to theconductance of supply of CO2 through thestomata determines intercellular CO2 con-centration (Ci) in leaves. The difference inCO2 concentration inside and outside theleaf (Ca–Ci) corresponds to the ratio of CO2assimilation over stomatal conductance for
212 T.L. Pons et al.
Fig. 3.10. Course of leaf water potential (Ψw) of three species over a day in the wet season and in the dryseason in the forest at Paracou, French Guiana. Species are Virola surinamensis, Diplotropis purpurea andEperua falcata. Predawn Ψw was the same for the three species in both seasons. Midday Ψw was low inboth seasons for Eperua, low for Diplotropis in the wet season but high in the dry season, and Virolaexhibited very high Ψw that hardly decreased below predawn values (Bonal et al., 2000b).
4 6 8 10 12 14 16 18Time (h)
Wat
er p
ote
nti
al (
MP
a)W
ater
po
ten
tial
(M
Pa)
0.0
–0.4
–0.8
–1.2
–1.6
–2.0
–2.4
0.0
–0.4
–0.8
–1.2
–1.6
–2.0
–2.4

water vapour (A/gs), also commonlyreferred to as the intrinsic water-use effi-ciency (WUE). A low Ci resulting from rela-tively closed stomata thus indicates a highWUE of the gas exchange process. Sincediscrimination against the heavier carbonisotope 13C during photosynthetic CO2assimilation depends on Ci, WUE can bederived from carbon isotope ratios of plantdry matter (Farquhar et al., 1989). This rela-tionship, however, is complicated by thefact that fractionation of stable isotopes alsooccurs during further transport and metab-olism of assimilates (Leavitt and Long,1982; Schmidt and Gleixner, 1998). And,particularly relevant in trees, structuralorganic compounds are deposited in differ-ent plant parts at different times when con-ditions for CO2 assimilation may bedifferent (Pate and Arthur, 1998).Nevertheless, δ13C ratios in plant carbon arewidely used to estimate intrinsic water-useefficiency.
Substantial variation in δ13C values of21 tree species in a natural forest and anearby plantation was found in a study byGuehl et al. (1998). The δ13C of sunlit leavesranged from –26.7‰ to –31.4‰, a differenceof about 5‰, which would represent arange in Ci of 80 ppm. Groups with differ-ent levels of shade tolerance exhibited dif-ferences in isotopic signature. Speciesclassified as shade hemi-tolerant, those thatcan establish under a closed canopy butneed canopy openings for their growth tocanopy height, had the highest δ13C.Although there was overlap between thegroups, heliophilic and true shade-toleranttrees tended to have lower (more negative)δ13C values. A more recent study on a muchlarger number of species (102) was carriedout on three sites in natural forest in FrenchGuiana by Bonal et al. (2000c). They foundan even larger variation in δ13C of sunlitleaves with some extremely low (negative)δ13C values (range –34.8‰ to –27.5‰). Thisrange is representative of a threefold differ-ence in WUE. This larger data set confirmedthe conclusion of the earlier study thatspecies classified as shade hemi-toleranthad the highest δ13C, and that heliophilicand true shade-tolerant species had 1–2‰
lower values. A negative correlation wasfound between δ13C and midday waterpotential, which suggests a negative rela-tionship of δ13C with hydraulic conduc-tance. Furthermore, evergreen trees hadsubstantially lower δ13C than deciduousones. The full meaning of these results cannot yet be fully appreciated in ecophysio-logical terms until the causes behind thecorrelations have been further investigated.However, it is clear that the substantialvariation in carbon isotope compositionbetween species in a forest contains impor-tant information on plant functioning withrespect to carbon acquisition and waterrelations. It clearly shows that these func-tional aspects differ considerably betweenco-occurring species.
Relationships between δ13C and physi-ological parameters have been investigatedin a comparison of plantation grown treesin French Guiana. Leaf δ13C values werealso less negative (–27.3‰) for two late suc-cessional species compared to three earlysuccessionals (–29.9‰) (Huc et al., 1994),which is consistent with the larger range ofspecies in the studies mentioned above.However, the difference in Ci as concludedfrom the δ13C data could not be confirmedby gas exchange measurements. In the morerecent study on three species of these plan-tation trees by Bonal et al. (2000b), similardifferences in δ13C were found betweenspecies differing in shade tolerance, as inthe other studies. The shade-intolerantVirola surinamensis and Diplotropis pur-purea had low δ13C (–29.9‰ and –30.9‰,respectively) and the shade hemi-tolerantEperua falcata had a higher value (–28.6‰).Ci measured by gas exchange was moreconsistent with δ13C values in this study.High Ci and thus low WUE prevailed dur-ing most of the day in Virola andDiplotropis in the wet season, when theseperform most of their CO2 assimilation.Eperua maintained a lower Ci in both wetand dry seasons.
In several studies in French Guiana,both leaf and wood δ13C was determined(Huc et al., 1994; Guehl et al., 1998; Bonal,2000). Leaf carbon originates largely fromthe time when the leaf was formed with an
Ecophysiological Patterns in Forest Plants 213

unknown fraction of more recently assimi-lated carbon. Large variation in δ13Cbetween leaves of a tree exists, depending,for example, on canopy position(Buchmann et al., 1997) and time of leafdevelopment (Pate and Arthur, 1998). Incontrast, stem wood carbon is laid downmore continuously and supposedly origi-nates from all leaves of the tree in propor-tion to their photosynthetic activity. Woodmay thus provide a more long-term averagefor 13C discrimination during the assimila-tion process of the whole tree. Cellulose ofsunlit leaves had a consistently more nega-tive δ13C value compared to wood cellu-lose, with substantial interspecific variationin the difference between the two compart-ments (Huc et al., 1994; Guehl et al., 1998;Bonal, 2000). The causes of these differ-ences are not well understood, apart fromthe above-described differences in timing ofcarbon deposition, but that probably doesnot explain it fully.
Wood δ13C was used by H. ter Steege(unpublished results) to compare dominanttree species along a gradient in elevationabove a creek on soils differing in drainageand water-holding capacity. Trees on the
wet Fluviosol soils along the creek hadlower δ13C values than those growing onthe well-drained white sand soils on the topof the ridge (Table 3.3). The other two soilsthat had intermediate positions on theslope, Leptosol and ferralic Arenosol (lat-eritic clay and brown sand), had trees withintermediate δ13C values. OnlyPentaclethra macroloba was sampled alongthe creek and higher up the ridge, whichshowed a lower δ13C at the lower elevationwhich has a more year-round high wateravailability (Table 3.3). Apparently,Pentaclethra growing at the lower elevationoperated at a lower WUE compared to thehigher site. A low WUE and thus a high Ci,however, means a higher rate of photosyn-thesis with the same size of the photosyn-thetic apparatus and thus a high nutrientuse efficiency (Fredeen et al., 1991). Thesystematic variation of wood δ13C with soildrainage contrasts with the study of Bonalet al. (2000c), where no difference in leafδ13C was found between trees sampled onsoils of different drainage characteristics.The studies are difficult to compare sincewood (Table 3.3) and leaves (Bonal et al.,2000c) were used. However, a comparison
214 T.L. Pons et al.
Table 3.3. Carbon stable isotope ratios (δ13C in ‰) of wood samples taken from common tree speciesalong an altitudinal gradient from a creek border up to a ridge top south of Mabura Hill in CentralGuyana. Different soil types occurred along the gradient. Samples were taken from the cambium until adepth of 5 cm, which represents probably at least 20 years of radial increment. Means (SE) of fivereplications per species soil type combination are presented. The effect of elevation is statisticallysignificant (H. ter Steege, unpublished results).
Soil type Dystric Fluvisol Dystric Leptosol Ferralic Arenosol Albic Arenosol
Height above creek (m) 5 25 25 60Species
Eperua rubiginosa –28.1 (0.8) – – –Mora excelsa –30.0 (0.5) – – –Pentaclethra macroloba –27.7 (0.3) – –26.0 (0.6) –Chlorocardium rodiei – –28.3 (0.6) –28.4 (0.2) –Mora gongrijpii – –27.8 (0.3) –28.1 (0.3) –Vouacapoua macropetala – –26.9 (0.5) – –Dicymbe altsonii – – – –27.5 (0.1)Eperua falcata – – – –25.9 (0.3)Eperua grandiflora – – – –26.5 (0.5)
Mean per soil type –28.5 (0.4) –27.6 (0.3) –27.5 (0.4) –26.6 (0.3)

suggests that some tropical rainforest treespecies may respond to water availability interms of their intrinsic WUE and othersmay not.
Nutrient Relations
Most of the soils of the Guiana Shield areold and highly leached. They are character-ized as poor in available mineral nutrients(Poels, 1987; van Kekem et al., 1996).Nitrogen may have a higher availability forplant growth in the large areas of relativelyundisturbed forest, as this has predomi-nantly an organic origin. Most plants havesymbiosis with mycorrhiza and the foresttrees in the Guianas are no exception. Someinventory work on these fungi has beendone, but no ecophysiological work isavailable for our area. Furthermore, most
soils are acidic and many of these may havean excess of potentially toxic elements suchas aluminium. Not much work has beendone on nutrient relations of forest plantsin the Guianas. With the limited informa-tion available, the question addressed iswhat is known about how trees cope withthis low nutrient availability and possiblehigh concentrations of toxic elements.Differences between species with respect tomodes of nutrient acquisition and use arealso examined.
Nutrient concentrations in leaves
In the framework of several studies, leaveshave been analysed for their nutrient con-centrations. Data on the elements nitrogenand phosphorus are most widely availableand they are summarized in Table 3.4 for
Ecophysiological Patterns in Forest Plants 215
Table 3.4. Concentrations of nitrogen and phosphorus in dry matter of leaves and P/N ratios measuredin various studies in the Guianas. Number of species sampled (n) and means (SD) are provided.Species are grouped in categories as indicated by the authors, such as successional status and diame-ter at breast height (dbh).
Number of N (mg/g) P (mg/g) N/P (g/g)species (n) Mean (SD) Mean (SD) Mean (SD)
Kabo, Surinamea
Trees > 5 cm dbh 16.8 0.85 19.8Trees < 5 cm dbh and other small plants 15.2 0.78 19.5Palms 9.4 0.68 13.8Lianas 17.3 0.93 18.6
Mabura Hill, Guyanab
Late successionals on white sandsSaplings 6 17.1 (4.1) 0.77 (0.26) 23.0 (4.9)Mature trees 6 16.1 (2.3) 0.64 (0.15) 26.3 (8.6)
Late successionals on brown sandsSaplings 6 13.9 (2.7) 0.60 (0.07) 23.6 (5.7)Mature trees 6 16.6 (1.0) 0.59 (0.13) 29.6 (7.0)
Early successionals (both soils types)Saplings 3 18.9 (4.5) 0.70 (0.18) 27.2 (4.6)Mature trees 3 19.5 (2.7) 0.64 (0.14) 30.9 (4.6)
Paracou, French Guianac
Mature treesEarly successional and heliophilic sp. 5 18.2 (5.5) 0.60 (0.09) 30.9 (9.8)Late successional and shade (hemi-)tolerant sp. 3 14.4 (3.7) 0.58 (0.09) 28.1 (3.9)
Nouragues, French Guianad
Late successional sp. 3 25.2 (1.3) 1.18 (0.12) 21.7 (3.3)
aPoels (1987), mixed samples from 12 plots; bRaaimakers (1995); cGuehl et al. (1998); dRijkers et al.(2000a), supplemented with unpublished results.
different areas. The range of N concentra-tions of dried leaf material is between 9 and25 mg/g, with most values around 17 mg/g.Phosphorus concentrations are low andrange from 0.6 to 1.2 mg/g, with most val-ues around 0.7 mg/g. The studies in MaburaHill, Guyana (Raaimakers, 1995) andParacou, French Guiana (Guehl et al., 1998)show similar leaf N and P concentrations,the study at Kabo, Suriname (Poels, 1987)slightly higher ones, but the study of Rijkerset al. (2000b) in Nouragues, French Guiana,indicates substantially higher values ofboth elements (Table 3.4). This suggests ahigher nutrient availability in this forestcompared to the other ones, at least as far asthese elements are concerned. However, thelimited number of data does not allow afirm conclusion. Several early successionalspecies such as Cecropia obtusa, Jacarandacopaia and Sclerolobium melinonii havehigher values compared to late successionalspecies for leaf N and P in the studies ofRaaimakers (1995), Guehl et al. (1998) or forN only (Roggy et al., 1999b), but the aver-ages for early and late successionals are notmuch different (Table 3.4). Saplings andmature trees also have similar N and P con-centrations. High N concentrations arefound in some species that have symbioticnitrogen fixation such as Sclerolobium,Swartzia and Inga spp., but not in all(Roggy et al., 1999b; Perreijn, 2002).
P concentrations in the rainforest treeleaves in the Guianas are among the lowestfound in tropical forests (Lathwell andGrove, 1986; Vitousek and Sanford, 1986)and are similar to other terra firme sites inSouth America. The values are substan-tially lower than for tropical rainforests onmore fertile soils (Vitousek and Sanford,1986) and those that are considered satis-factory for agricultural fruit trees (Bennett,1993). Although concentrations of nutrientelements cannot be used to draw firm con-clusions on their limitation for growth, thedata suggest that the availability of phos-phate may limit tree productivity in theseforests. The N/P ratios are highest in theMabura Hill and Paracou samples (Table3.4), further indicating that not N but P isthe limiting nutrient for growth there.
Nitrogen can accumulate in undisturbedecosystems as a result of biotic and abioticinputs (Jordan, 1985), whereas phosphoruscannot accumulate on strongly leached lowphosphorus soils, or is sequestered in soilshigh in aluminium (Al) and iron (Fe)oxides.
Brouwer (1996) and Poels (1987) alsoanalysed concentrations of other macro-nutrient elements in leaves: K, Ca and Mg.The values for these elements that theyreport for Guyana and Suriname, respec-tively, are rather low. Hence, these ele-ments are also potentially growth limiting.Extremely low values were found for cal-cium in late successional trees on Oxisolsin the Rio Negro area in Venezuela (about0.5 mg/g; Reich et al., 1995). There weresome indications that these low calciumconcentrations do indeed limit photosyn-thetic rates. Since similar soil types alsooccur in the Guianas, such a calcium limi-tation may be expected there as well.Specific adaptations to low availability ofsome mineral nutrients such as P and Camay be expected on the highly leached soilsof the Guianas, which needs further investi-gation.
Effects of phosphorus availability
Since phosphorus was identified as a possi-ble limiting nutrient for plant growth in theforests of the Guianas, experiments werecarried out to investigate this hypothesisfurther (Raaimakers, 1995; Raaimakers andLambers, 1996). Two species, Tapiriraobtusa, a fast-growing pioneer, and Lecythiscorrugata, a slow-growing late succes-sional, both mainly occurring on whitesands in Guyana, were grown on a range ofP addition rates in pots. Increasing additionof P did not stimulate the growth ofLecythis, although the plants did absorb thenutrient as evident from the increasing Pconcentrations (Fig. 3.11). Phosphorus fromthe seed reserves was apparently still suffi-cient to sustain growth during the 6-monthperiod of the experiment. The results sug-gest that the inherent growth rate ofLecythis is so low that the extra phosphorus
216 T.L. Pons et al.

cannot be used to increase growth. Thereverse situation was found for Tapirira.Relative growth rate of this speciesincreased with increasing P addition, but Pconcentrations remained very low, indicat-ing that growth of this inherently faster-growing species is more easily limited by Pavailability. Since P concentrations re-mained low independent of P availability,it further suggests that the low P concentra-tions found in leaves (Table 3.4) may not bean indication of actual P limitation, butrather a reflection of the species adaptationto the low P environment.
Nutrient addition experiments havealso been carried out with seedlings in the
forest. A similar result as in the greenhouseexperiment was found (Raaimakers, 1995).The growth of Dicymbe altsonii was stimu-lated by P addition and concentrationsincreased only slightly. However, thegrowth of Chlorocardium rodiei was notstimulated, but P concentrations increased,again indicating that the plant had taken upmore P, but this was stored mostly in rootsand stems, and not utilized for increasedgrowth.
A pot experiment carried out inGuyana with the early successionalCecropia obtusa and Goupia glabra and thelate successional Chamaecrista adiantifoliaessentially confirmed the results described
Ecophysiological Patterns in Forest Plants 217
Fig. 3.11. Relationship of relative growth rate (RGR) and concentration of phosphorus in plant dry mass (Pconcentration) with P added to the plants during growth (P added). Two species were investigated, theearly successional Tapirira obtusa () and the late successional Lecytis corrugata (). Plants were grown inpots with sand in a greenhouse. Continuous lines represent significant correlations; dotted lines refer tonon-significant correlations (after Raaimakers and Lambers, 1996).
RG
R (
mg
/g/d
ay)
P c
on
cen
trat
ion
(m
g/g
)
P added (mg per plant)
1 10 100 1000 10,000
50
40
30
20
10
0
2.0
1.5
1.0
0.5
0.0

above with respect to growth stimulationand P concentration in early and late suc-cessional species (Raaimakers, 1995). Theroots of the pioneers were much thinnerthan those of the climax species. However,the rates of P absorption per unit root lengthwere not different between species.Supposedly, the thin, fast-growing roots ofthe pioneers are effective for exploring thesoil for nutrients in a gap environment, thusenabling fast growth. However, this proba-bly occurs at the expense of a high rootturnover.
Efficiency of nutrient use
Nutrient elements are used for growth andmaintenance processes in the plant. Therates of these processes per unit of a partic-ular element present in the plant can varysubstantially between species and growthconditions. An important process thatdrives growth is photosynthesis. The light-saturated rate of photosynthesis (Amax) perunit N present in the leaf, often referred toas photosynthetic N use efficiency (PNUE),was high in the three early successional treespecies measured by Raaimakers et al.(1995), although still low compared tomany herbaceous plants (Pons et al., 1994).The six late successional species had abouthalf the PNUE of the early successionals,and similar PNUE to other evergreenspecies (Field and Mooney, 1986). ThesePNUE calculations are based on instanta-neous rates of photosynthesis. However,when the carbon acquisition over the wholelifetime of a leaf is considered, N use effi-ciencies in the two species groups are moresimilar, because leaves of late successionalsmay live more than twice as long as those ofearly successionals (see below). At the pre-vailing low tissue concentrations, phospho-rus may limit photosynthetic capacity. Thatthis might be the case is suggested by thecloser association of Amax with P comparedto the relationship with N, and that Amaxper unit P was high (Raaimakers et al.,1995).
During the senescence process andbefore abscission, a plant typically resorbs
compounds from a leaf, thus increasing theefficiency of the utilization of nutrients.Nitrogen and phosphorus are among thenutrient elements that are resorbed, and thepercentage resorption of both elements isaround 50% across all plant species (Aerts,1996). Resorption of N and P has beeninvestigated by Raaimakers (1995) inGuyana. Although P concentrations arevery low, as mentioned above, P resorptionappeared to be 57% on average for the fourspecies studied, with no difference betweenearly and late successional species.However, there was no or hardly anyresorption of N, which is exceptional, incomparison with other studies on nutrient-poor soils elsewhere in the Amazon area(Medina, 1984; Reich et al., 1995). Highresorption efficiency in forests on Oxisolsand Ultisols is also concluded from the verylow P concentrations in leaf litter(Vitousek, 1984; Vitousek and Sanford,1986).
Nutrient use efficiency by plants isdetermined by residence time in the plant(Berendse and Aerts, 1987). One factorinfluencing that parameter is the resorptionof nutrients from senescing tissue as men-tioned above; another factor is the life spanof plant tissue. Calculations show that thevariation in leaf life span contributes moreto nutrient conservation than variation inresorption efficiency (Aerts, 1995). Hence,plants growing on the predominantly nutri-ent-poor soils in the Guianas would benefitfrom long life spans of their leaves andother tissues with respect to conservation ofnutrients. Evergreen tropical forest trees arecharacterized by long leaf life spans.However, a large range in leaf life spans canbe found in tropical forests (Reich et al.,1991; Veneklaas and Poorter, 1998). Datahave recently become available from stud-ies in the Guianas. Leaf life spans appearedto be about 3 years for Dicorynia guianensisand for larger trees of Vouacapoua ameri-cana. This increased to 7 years for saplingsof V. americana growing in the shadedunderstorey (Rijkers, 2000). Saplings of var-ious species growing in gaps in Guyana hadshorter median leaf life spans (Rose, 2000).Values for the late successional species
218 T.L. Pons et al.

Catostemma fragrans, Chlorocardiumrodiei, Ormosia coccinea and Pentaclethramacroloba ranged between 1 and 2 years.Two early successionals, Cecropia obtusaand Goupia glabra, had leaf life spans ofless than half a year. However, two otherearly successional species, Laetia proceraand Sclerolobium guianensis had similarlife spans as the late successionals. Hence,there are examples among the selectedspecies that illustrate the commonly heldview that early successionals have high leafturnover rates, but important exceptionsexist. The adaptive value of a high leafturnover rate in pioneers is supposed to beassociated with fast growth and competi-tion for light in early succession (Ackerlyand Bazzaz, 1995). This is apparently notalways the overriding factor accounting forvariation in leaf turnover rate in Guianantrees. The factors influencing leaf longevitydeserve further attention.
Symbiotic nitrogen fixation
Most nitrogen in ecosystems originatesfrom an organic source, i.e. biological nitro-gen fixation. This process can occur in free-living bacteria in soil or in thephyllosphere, as Ruinen (1965) showed inSuriname, and in legumes with theirenhanced capability to form symbiosis withRhizobium-type bacteria or other bacterialsymbioses. Legumes are very abundant inthe forests of the Guianas (see Chapter 1),but not all of them are active in N2 fixation.This raises two questions. First, which ofthe leguminous species are active in N2 fix-ation? Secondly, what is the importance ofN2 fixation in the nitrogen cycle of forests inthe Guiana Shield? Although nitrogen isnot likely to be an important growth-limit-ing element in primary forest, as arguedbefore, losses to the ecosystem, such as byleaching of nitrate following disturbance(Poels, 1987; Brouwer, 1996), and denitrifi-cation, should be compensated by N inputsmainly from N2 fixation.
Leguminous species have been investi-gated for the presence of root nodules in alarge survey comprising 172 species in
Brazil (De Souza Moreira et al., 1992). Thesurvey included some species that alsooccur in the Guianas, and several otherspecies are closely related. Nodulation inthe natural habitat and/or in nursery-grownplants was found in 47% of the speciesexamined. Some species that were nodulat-ing in the nursery were not found to do soin the natural habitat, particularly on nutri-ent-poor upland soils. Hence, species mayhave the potential of symbiotic N2 fixation,but may not do so in the forest, which maybe due to deficiency of mineral elementssuch as phosphorus (De Souza Moreira etal., 1992). A high availability of soil-bornenitrogen relative to other nutrient elementsmay also limit the occurrence of symbiosisand/or suppress the nitrogen-reducingactivity in the nodules (Marschner, 1995).
In a survey in French Guiana (Roggyand Prevost, 1999), 67% of the 62 legumi-nous taxa that were investigated appearedto be nodulated, with the lowest frequencyin the Caesalpiniacae (50%) that are themost abundant in the forest. A combinationof surveys from Guyana and French Guiana(Table 3.5) reveals that there are a numberof important, sometimes locally dominant,genera that lack rhyzobia symbiosis, suchas Dicorynia, Dicymbe, Eperua, Hymenaea,Mora, Peltogyne and Vouacapoua, althoughan occasional nodule-like structure may befound, such as in Dicorynia (Béreau andGarbaye, 1994). Species in both theMimosaceae (Parkia sp.) and in thePapilionaceae (Dipteryx sp.) also showedno root nodules in Guyana (Norris, 1969;Perreijn, 2002) and French Guiana (Guehlet al., 1998; Roggy and Prevost, 1999).Important Guianan tree genera that havebeen shown to nodulate include: Cassia,Chamaecrista, Sclerolobium and Swartziaof the Caesalpininiaceae, Abarema, Ingaand Pentaclethra of the Mimosaceae, andDioclea, Hymenolobium and Ormosia of theFabaceae (Table 3.5).
Pot experiments were carried out inGuyana to investigate the N2-fixation capa-city of several nodulating species(Perreijn, 2002). Local forest soil wasenriched with 15N and uptake of total N and15N was measured in potential N2-fixers
Ecophysiological Patterns in Forest Plants 219

220 T.L. Pons et al.
Table 3.5. Nodulation of legumes and nitrogen-fixing activity of selected taxa. Nodulation was derivedfrom four studies in Guyana (Gu) and French Guiana (FG). Presence (+) or absence (–) of root noduleswas recorded (blank=not sampled); Nor: Norris (1969); Per: Perreijn et al. (2002); Gue: Guehl et al.(1998), Rog: Roggy et al. (1999a). Percentages in the study of Roggy et al. (1999a) refer to theproportion of species that showed nodulation. The percentage of leaf N derived from atmospheric N2(%Ndfa) was calculated from 15N stable isotope ratios by Perreijn et al. (2002) and Roggy et al.(1999b). The two assumptions used for fractionation associated with N2-fixation used in the lastreference were averaged. Values are presented for sample sizes >5 only. Only taxa that (are supposedto) occur in the three Guianas or are considered important otherwise are presented. Nomenclature afterBogan et al. (1997).
Nodulation score % NdfaNor Per Gue Rog Perreijna Roggyb
Gu Gu FG FG Gu (n) FG (n)
CaesalpiniaceaeBauhinia kuntheana –Cassia cowanii +Chamaecrista spp. + + 23 (2)Dialum guianense –Dicorynia guianensis – –Eperua spp. – – – –Hymenea courbaril –Mora spp. – –Peltogyne venosa – – – –Recordoxylon speciosum +Sclerolobium spp. + + + + 33 (1)Senna latifolia –Senna quinquangulare +Swartzia spp. + + + 57 (3) 75 (11)Tachigali paniculata +Vouacapoua americana – 41 (11)
Family 50% 41 (6) 40 (57)MimosaceaeAbarema spp. + +Balizia pedicellaris + +Enterolobium schomburgkii +Inga spp. + + 83% 0 (1) 52 (30)Mimosa myriadena –Parkia spp. – – –Pentacletra macroloba + + 58 (1)Pseudopiptadenia suaveolens –Stryphnodendron polystachium +Zygia racemosa -
Family 71% 17 (4) 44 (36)PapilionaceaeDioclea spp. + + +Diplotropis purpurea – + + 71 (1)Dipterix spp. – –Hymenolobium spp. + +Mucuna urens +Ormosia spp. + + + 85 (2)Poecilanthe hostmanii +Pterocarpus officinalis +
Family 77% 66 (7) 50 (19)
aFamily and genera means over species, n=number of species. bMeans over individuals, n=number ofsamples.

and in non-nodulating reference species.These experiments showed clearly thatwhen supplied with all other mineral nutri-ents except N, conditions that stimulate N2fixation, Pentaclethra macroloba andSclerolobium guianensis derived around90% of their N from atmospheric N2(%Ndfa). Chamaecrista adiantifolia had alower N2-fixation activity, which is consis-tent with its lower %Ndfa calculated fromnatural abundance of 15N (Table 3.5). N2 fix-ation decreased when no extra P was sup-plied and also when extra ammonium wasadded. Hence, on soils that are known tohave low P availability, this element isprobably limiting for N2 fixation.Furthermore, a high availability of soil Nrelative to other nutrient elements, whichmay occur in undisturbed forest, can down-regulate N2 fixation. The low light condi-tions in the understorey may also limitnodulation and thus N2-fixation activity oftree seedlings, as found for Pentaclethramacroloba in Costa Rica (Fetcher et al.,1994). Nevertheless, evidence from naturalabundance of 15N indicates that Swartziasp. can have N2 fixation in the forest under-storey (Shearer and Kohl, 1986). However,further information is required on the effectof light availability on N2-fixation activity.
Stable nitrogen isotope natural abundancestudies
The difference in the ratio of 15N/14Nbetween a plant or soil sample and atmos-pheric N2 (δ15N) can be used to identifynitrogen sources for plant growth, providedthat the isotopic signatures are sufficientlydifferent. Guehl et al. (1998) investigatedthe natural variation in δ15N in the forest inParacou, French Guiana. Among the sevenleguminous species, there were three thathad nodules (Table 3.5) and these also hadhigh leaf N concentrations (>2%). Two ofthe nodulating species had δ15N valuesclose to zero, which is indicative of activeN2 fixation. The other nodulating specieshad a δ15N in the range of the non-nodulat-ing species, which might be due to low N2-fixing activity. Interpretation, however, is
complicated by the fact that some non-nodulating legumes and non-leguminousspecies also had low δ15N ratios. Thus, fur-ther diversification in N-source in combina-tion with different isotopic signatures ofthese sources may be involved, as well asspecies-specific isotopic discriminationduring acquisition and metabolism of N-compounds, and several other possible rea-sons (as discussed by Guehl et al. (1998)and Roggy et al. (1999b)).
Roggy et al. (1999b) included morenodulating leguminous species in theirinvestigation and found large variation inδ15N and leaf N concentration, rangingbetween –1‰ and 7‰ for δ15N and between1.0% and 3.2% for N concentration. Theresults indicate that active N2-fixers arecharacterized by a low δ15N and a high Nconcentration, non-N2-fixing legumes by ahigh δ15N and a low N concentration, andnon-leguminous pioneers by a low δ15Nand a low N concentration. They concludethat δ15N can be used for distinguishingfunctional groups with respect to N acquisi-tion and metabolism when used in combi-nation with other traits such as nodulation,N concentration and taxonomy. PioneerPiper spp. preferentially use nitrate as anitrogen source, whereas shade-tolerantspecies of the same genus use ammonium(Fredeen et al., 1991; Fredeen and Field,1992). Nitrate is found in higher concentra-tions in soils in gaps compared to theunderstorey of undisturbed forest whereammonium prevails (Brouwer, 1996). Thedifferent isotopic signatures of non-nodu-lating pioneers and late successionals asfound by Roggy et al. (1999b) is probablyrelated to this uptake of different forms ofsoil N, because the δ15N of pioneers resem-bled that of nitrate and the δ15N of late suc-cessionals was close to that of ammonium(J.C. Roggy, unpublished data).
Natural abundance of 15N potentiallycan be used to quantify actual symbioticN2-fixation activity in the forest (Shearerand Kohl, 1986). Calculations are based ona two-source model, hence a condition forsuccessful use of the method is that soil Nand air N have a sufficiently different δ15N.Reference species are selected that do not
Ecophysiological Patterns in Forest Plants 221
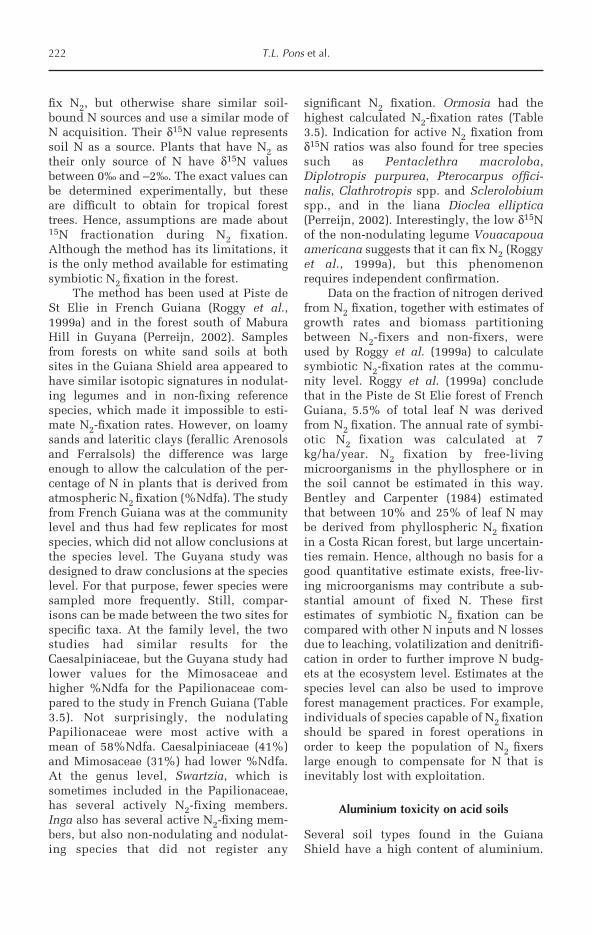
fix N2, but otherwise share similar soil-bound N sources and use a similar mode ofN acquisition. Their δ15N value representssoil N as a source. Plants that have N2 astheir only source of N have δ15N valuesbetween 0‰ and –2‰. The exact values canbe determined experimentally, but theseare difficult to obtain for tropical foresttrees. Hence, assumptions are made about15N fractionation during N2 fixation.Although the method has its limitations, itis the only method available for estimatingsymbiotic N2 fixation in the forest.
The method has been used at Piste deSt Elie in French Guiana (Roggy et al.,1999a) and in the forest south of MaburaHill in Guyana (Perreijn, 2002). Samplesfrom forests on white sand soils at bothsites in the Guiana Shield area appeared tohave similar isotopic signatures in nodulat-ing legumes and in non-fixing referencespecies, which made it impossible to esti-mate N2-fixation rates. However, on loamysands and lateritic clays (ferallic Arenosolsand Ferralsols) the difference was largeenough to allow the calculation of the per-centage of N in plants that is derived fromatmospheric N2 fixation (%Ndfa). The studyfrom French Guiana was at the communitylevel and thus had few replicates for mostspecies, which did not allow conclusions atthe species level. The Guyana study wasdesigned to draw conclusions at the specieslevel. For that purpose, fewer species weresampled more frequently. Still, compar-isons can be made between the two sites forspecific taxa. At the family level, the twostudies had similar results for theCaesalpiniaceae, but the Guyana study hadlower values for the Mimosaceae andhigher %Ndfa for the Papilionaceae com-pared to the study in French Guiana (Table3.5). Not surprisingly, the nodulatingPapilionaceae were most active with amean of 58%Ndfa. Caesalpiniaceae (41%)and Mimosaceae (31%) had lower %Ndfa.At the genus level, Swartzia, which issometimes included in the Papilionaceae,has several actively N2-fixing members.Inga also has several active N2-fixing mem-bers, but also non-nodulating and nodulat-ing species that did not register any
significant N2 fixation. Ormosia had thehighest calculated N2-fixation rates (Table3.5). Indication for active N2 fixation fromδ15N ratios was also found for tree speciessuch as Pentaclethra macroloba,Diplotropis purpurea, Pterocarpus offici-nalis, Clathrotropis spp. and Sclerolobiumspp., and in the liana Dioclea elliptica(Perreijn, 2002). Interestingly, the low δ15Nof the non-nodulating legume Vouacapouaamericana suggests that it can fix N2 (Roggyet al., 1999a), but this phenomenonrequires independent confirmation.
Data on the fraction of nitrogen derivedfrom N2 fixation, together with estimates ofgrowth rates and biomass partitioningbetween N2-fixers and non-fixers, wereused by Roggy et al. (1999a) to calculatesymbiotic N2-fixation rates at the commu-nity level. Roggy et al. (1999a) concludethat in the Piste de St Elie forest of FrenchGuiana, 5.5% of total leaf N was derivedfrom N2 fixation. The annual rate of symbi-otic N2 fixation was calculated at 7kg/ha/year. N2 fixation by free-livingmicroorganisms in the phyllosphere or inthe soil cannot be estimated in this way.Bentley and Carpenter (1984) estimatedthat between 10% and 25% of leaf N maybe derived from phyllospheric N2 fixationin a Costa Rican forest, but large uncertain-ties remain. Hence, although no basis for agood quantitative estimate exists, free-liv-ing microorganisms may contribute a sub-stantial amount of fixed N. These firstestimates of symbiotic N2 fixation can becompared with other N inputs and N lossesdue to leaching, volatilization and denitrifi-cation in order to further improve N budg-ets at the ecosystem level. Estimates at thespecies level can also be used to improveforest management practices. For example,individuals of species capable of N2 fixationshould be spared in forest operations inorder to keep the population of N2 fixerslarge enough to compensate for N that isinevitably lost with exploitation.
Aluminium toxicity on acid soils
Several soil types found in the GuianaShield have a high content of aluminium.
222 T.L. Pons et al.

At the low pH found in these soils, Al3+
builds up to such high concentrations thatit becomes toxic to many plants (Marshner,1995). A drop in pH below 4.5 with accom-panied increase in Al3+ in the soil solutionwas found after gap creation on brownsandy ferralic Arenosols in Guyana(Brouwer, 1996). White sandy albicArenosols almost completely lack alu-minium and no build up of Al3+ can beexpected (van Kekem et al., 1996). Hence,plants growing on Al-containing brownloamy sands and lateritic clays (ferralicArenosols and Ferralsols) are exposed topotentially toxic levels of Al3+. The differ-ence in Al content between soil types couldbe one of the causes of the floristic differ-ences between the forests on these soils.Aluminium tolerance should be an impor-tant trait of plants establishing on Al-con-taining soils, particularly after disturbancebecause of the high Al3+-concentrationsthat predominate during these early succes-sional periods.
The hypothesis that aluminium is animportant environmental variable explain-ing edaphic effects on forest species com-position in central Guyana was investigated(Alexander and ter Steege, unpublishedresults). Non-shade-tolerant pioneerspecies growing in gaps in the forest canopyon Al-soils appeared to accumulate sub-
stantial quantities of Al in their leaves(Table 3.6). This was not found in pioneersgrowing on non-Al-containing white sand.Climax species sampled in gaps did notaccumulate Al in their leaves and Al con-centrations were not different betweenthese plants when growing on Al-contain-ing Ferralsols and Leptosols or non-Al-con-taining albic Arenosols (Table 3.6). Thedegree of Al accumulation in leaf tissue wassubstantially different between pioneerspecies. Palicourea guianensis and Miconiaspp. were strong accumulators and had Alconcentrations up to 1% of dry mass.Goupia glabra and Cecropia spp. (C. obtusaand C. sciadophylla) were in an intermedi-ate group with Al concentrations of >1‰.The non-accumulators were the climaxspecies Mora gongrijpii, Chlorocardiumrodiei and Vouacapoua macropetala; theyhad Al concentrations <0.4‰. No increasein Al concentration in leaves of Al-accumu-lating species was evident with increasinggap size. Such an increase was expected,since earlier research had indicated thatfree Al3+ increases with gap size (Brouwer,1996). One aspect of Al tolerance is that thetoxic element is sequestered in ageing tis-sue that is abscised later (Marshner, 1995).Accumulation of Al in leaf tissue on Al-containing soils is thus considered as anexpression of Al tolerance. The high tissue
Ecophysiological Patterns in Forest Plants 223
Table 3.6. Aluminium concentrations (means ± SE; mg/g) in leaves of pioneer and climax speciessampled in gaps in the forest on different soil types in central Guiana (Mabura Hill area) (Alexander andter Steege, unpublished results).
Dystric Ferralic AlbicSpecies Leptosol Arenosol Arenosol
PioneersCecropia spp. 1.87 (0.10) 1.22 (0.20) 0.28 (0.04)Goupia glabra 1.09 (0.18) 2.53 (0.21) 0.49 (0.03)Miconia spp. 5.44 (0.41) 8.07 (0.70) –Palicourea spp. 11.22 (0.87) 0.77 (0.05) –
Mean 5.86 (0.63) 4.12 (0.32) 0.38 (0.04)
ClimaxChlorocardium rodiei 0.14 (0.01) 0.51 (0.04) –Mora gongrijpii 0.26 (0.07) 0.33 (0.04) –Voucapoua macropetala 0.32 (0.03) 0.36 (0.04) –
Mean 0.26 (0.03) 0.40 (0.02) –
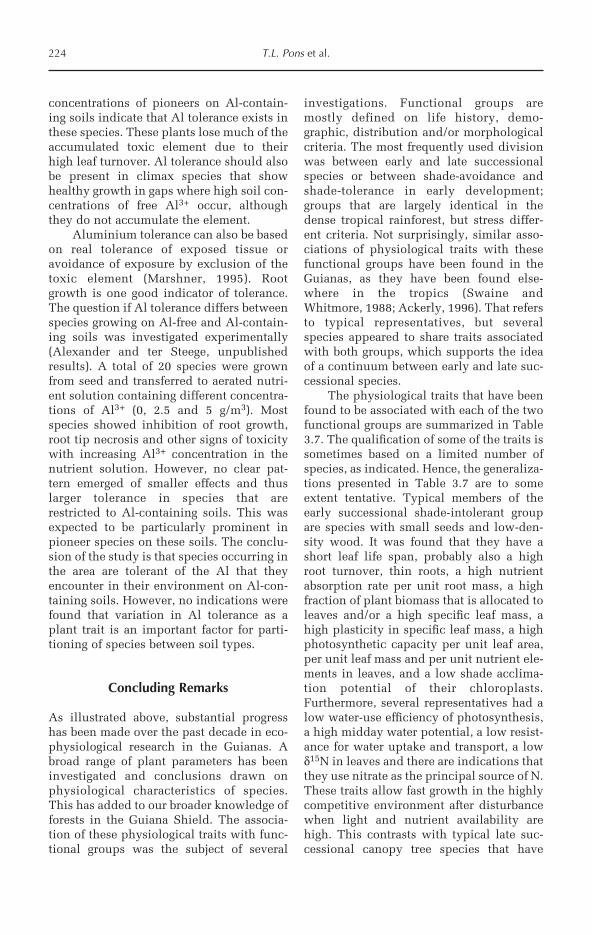
concentrations of pioneers on Al-contain-ing soils indicate that Al tolerance exists inthese species. These plants lose much of theaccumulated toxic element due to theirhigh leaf turnover. Al tolerance should alsobe present in climax species that showhealthy growth in gaps where high soil con-centrations of free Al3+ occur, althoughthey do not accumulate the element.
Aluminium tolerance can also be basedon real tolerance of exposed tissue oravoidance of exposure by exclusion of thetoxic element (Marshner, 1995). Rootgrowth is one good indicator of tolerance.The question if Al tolerance differs betweenspecies growing on Al-free and Al-contain-ing soils was investigated experimentally(Alexander and ter Steege, unpublishedresults). A total of 20 species were grownfrom seed and transferred to aerated nutri-ent solution containing different concentra-tions of Al3+ (0, 2.5 and 5 g/m3). Mostspecies showed inhibition of root growth,root tip necrosis and other signs of toxicitywith increasing Al3+ concentration in thenutrient solution. However, no clear pat-tern emerged of smaller effects and thuslarger tolerance in species that arerestricted to Al-containing soils. This wasexpected to be particularly prominent inpioneer species on these soils. The conclu-sion of the study is that species occurring inthe area are tolerant of the Al that theyencounter in their environment on Al-con-taining soils. However, no indications werefound that variation in Al tolerance as aplant trait is an important factor for parti-tioning of species between soil types.
Concluding Remarks
As illustrated above, substantial progresshas been made over the past decade in eco-physiological research in the Guianas. Abroad range of plant parameters has beeninvestigated and conclusions drawn onphysiological characteristics of species.This has added to our broader knowledge offorests in the Guiana Shield. The associa-tion of these physiological traits with func-tional groups was the subject of several
investigations. Functional groups aremostly defined on life history, demo-graphic, distribution and/or morphologicalcriteria. The most frequently used divisionwas between early and late successionalspecies or between shade-avoidance andshade-tolerance in early development;groups that are largely identical in thedense tropical rainforest, but stress differ-ent criteria. Not surprisingly, similar asso-ciations of physiological traits with thesefunctional groups have been found in theGuianas, as they have been found else-where in the tropics (Swaine andWhitmore, 1988; Ackerly, 1996). That refersto typical representatives, but severalspecies appeared to share traits associatedwith both groups, which supports the ideaof a continuum between early and late suc-cessional species.
The physiological traits that have beenfound to be associated with each of the twofunctional groups are summarized in Table3.7. The qualification of some of the traits issometimes based on a limited number ofspecies, as indicated. Hence, the generaliza-tions presented in Table 3.7 are to someextent tentative. Typical members of theearly successional shade-intolerant groupare species with small seeds and low-den-sity wood. It was found that they have ashort leaf life span, probably also a highroot turnover, thin roots, a high nutrientabsorption rate per unit root mass, a highfraction of plant biomass that is allocated toleaves and/or a high specific leaf mass, ahigh plasticity in specific leaf mass, a highphotosynthetic capacity per unit leaf area,per unit leaf mass and per unit nutrient ele-ments in leaves, and a low shade acclima-tion potential of their chloroplasts.Furthermore, several representatives had alow water-use efficiency of photosynthesis,a high midday water potential, a low resist-ance for water uptake and transport, a lowδ15N in leaves and there are indications thatthey use nitrate as the principal source of N.These traits allow fast growth in the highlycompetitive environment after disturbancewhen light and nutrient availability arehigh. This contrasts with typical late suc-cessional canopy tree species that have
224 T.L. Pons et al.
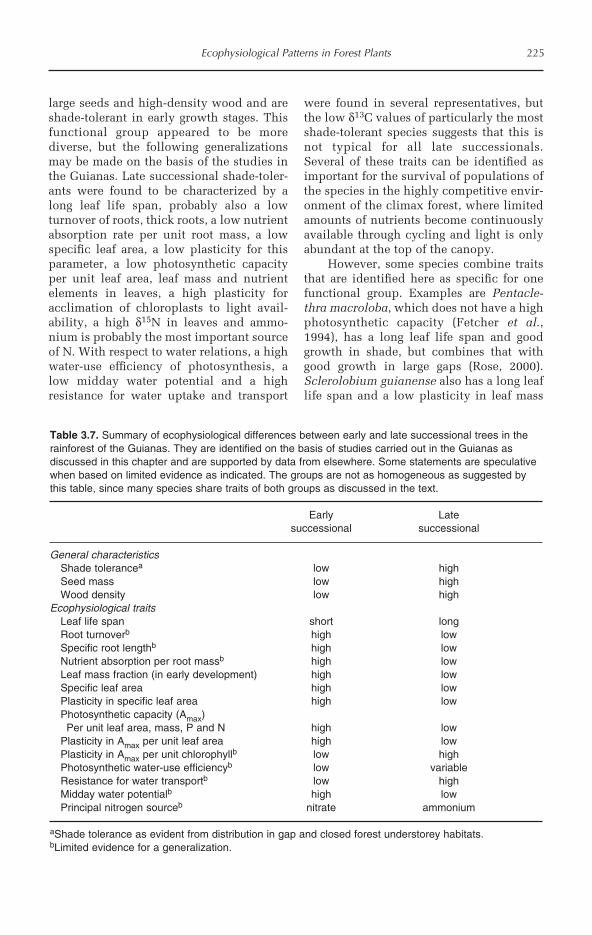
large seeds and high-density wood and areshade-tolerant in early growth stages. Thisfunctional group appeared to be morediverse, but the following generalizationsmay be made on the basis of the studies inthe Guianas. Late successional shade-toler-ants were found to be characterized by along leaf life span, probably also a lowturnover of roots, thick roots, a low nutrientabsorption rate per unit root mass, a lowspecific leaf area, a low plasticity for thisparameter, a low photosynthetic capacityper unit leaf area, leaf mass and nutrientelements in leaves, a high plasticity foracclimation of chloroplasts to light avail-ability, a high δ15N in leaves and ammo-nium is probably the most important sourceof N. With respect to water relations, a highwater-use efficiency of photosynthesis, alow midday water potential and a highresistance for water uptake and transport
were found in several representatives, butthe low δ13C values of particularly the mostshade-tolerant species suggests that this isnot typical for all late successionals.Several of these traits can be identified asimportant for the survival of populations ofthe species in the highly competitive envir-onment of the climax forest, where limitedamounts of nutrients become continuouslyavailable through cycling and light is onlyabundant at the top of the canopy.
However, some species combine traitsthat are identified here as specific for onefunctional group. Examples are Pentacle-thra macroloba, which does not have a highphotosynthetic capacity (Fetcher et al.,1994), has a long leaf life span and goodgrowth in shade, but combines that withgood growth in large gaps (Rose, 2000).Sclerolobium guianense also has a long leaflife span and a low plasticity in leaf mass
Ecophysiological Patterns in Forest Plants 225
Table 3.7. Summary of ecophysiological differences between early and late successional trees in therainforest of the Guianas. They are identified on the basis of studies carried out in the Guianas asdiscussed in this chapter and are supported by data from elsewhere. Some statements are speculativewhen based on limited evidence as indicated. The groups are not as homogeneous as suggested bythis table, since many species share traits of both groups as discussed in the text.
Early Latesuccessional successional
General characteristicsShade tolerancea low highSeed mass low highWood density low high
Ecophysiological traitsLeaf life span short longRoot turnoverb high lowSpecific root lengthb high lowNutrient absorption per root massb high lowLeaf mass fraction (in early development) high lowSpecific leaf area high lowPlasticity in specific leaf area high lowPhotosynthetic capacity (Amax)Per unit leaf area, mass, P and N high low
Plasticity in Amax per unit leaf area high lowPlasticity in Amax per unit chlorophyllb low highPhotosynthetic water-use efficiencyb low variableResistance for water transportb low highMidday water potentialb high lowPrincipal nitrogen sourceb nitrate ammonium
aShade tolerance as evident from distribution in gap and closed forest understorey habitats.bLimited evidence for a generalization.

per unit area, but combines that with fastgrowth in large gaps (Rose, 2000). Carapaguianensis has large seeds, a trait that is typ-ical for late successional species, but alsohas a relatively high photosynthetic capacity(Huc et al., 1994) and a relatively highgrowth rate in large gaps, but shows goodsurvival in small gaps (Rose, 2000). Suchspecies apparently occupy intermediatepositions not only with respect to their phys-iological traits, but also with respect to theirrequirements for establishment from seed.Possible association of such traits with thefurther subdivision in functional groups, assuggested by Swaine and Whitmore (1988)and Favrichon (1994) or based on other cri-teria than used by these authors, needs to beinvestigated in more detail. Physiologicalinformation may also be used as criteria fordistinguishing functional groups, such as thecapacity for N2 fixation and intrinsic water-use efficiency. However, further research isneeded to point out the functional signifi-cance of particular physiological traits andhow they contribute to niche differentiationin tropical rainforest plants.
Most of the ecophysiological studieseither dealt with young growth stages orwith mature trees; only a few compared dif-ferent growth stages. It appeared that phys-iological traits do not remain constantthroughout development. These shifts withgrowth stage probably reflect changingdemands, both internally and with thechanging environment when trees growlarger. An example is the decrease in shadetolerance with tree size as a result of theinevitable decrease in leaf area ratio(Givnish, 1988). The ontogenetic pattern ofcharacter development in tropical forestplants, the species-specific nature of thesepatterns and what is the functional signifi-cance of the changes are largely unknown.Studies that address this issue would needto integrate architectural with physiologicaldata through model-based approaches.Such approaches have been used elsewhere(Ackerly, 1996; Pearcy and Yang, 1996) andneed to be further developed in order toincrease our understanding of whole treeprocesses in the complex environment ofthe tropical rainforest.
226 T.L. Pons et al.
References
Ackerly, D.D. (1996) Canopy structure and dynamics: integration of growth processes in tropical pioneertrees. In: Mulkey, S.S., Chazdon, R.L. and Smith, A.P. (eds) Tropical Forest Plant Ecophysiology.Chapman & Hall, New York, pp. 619–658.
Ackerly, D.D. and Bazzaz, F.A. (1995) Leaf dynamics, self-shading and carbon gain in seedlings of a tropi-cal pioneer tree. Oecologia 101, 289–298.
Aerts, R. (1995) The advantages of being evergreen. Trends in Ecology and Evolution 10, 402–407.Aerts, R. (1996) Nutrient resorption from senescing leaves of perennials: are there general patterns? Journal
of Ecology 84, 597–608.Alexander, D.Y. (1991) Comportement hydrique au cours de la saison sèche et place dans la succession de
trois arbres Guyanais: Trema micrantha, Goupia glabra et Eperua grandiflora. Annales des SciencesForestières 48, 101–112.
Allen, M.T. and Pearcy, R.W. (2000) Stomatal behavior and photosynthetic performance under dynamiclight regimes in a seasonally dry tropical rain forest. Oecologia 122, 470–478.
Anderson, J.M., Chow, W.S. and Park, Y.I. (1995) The grand design of photosynthesis: acclimation of thephotosynthetic apparatus to environmental cues. Photosynthesis Research 46, 129–139.
Barigah, S.T., Imbert, P. and Huc, R. (1998) Croissance et assimilation nette foliaire de jeune plants de dixarbres de la forêt Guyanaise, cultivés a cinq niveaux d’éclairement. Annales des Sciences Forestières55, 681–706.
Bennett, W.F. (1993) Nutrient Deficiencies and Toxicities in Crop Plants. APS Press, The AmericanPhytopathological Society, St Paul, Minnesota.
Bently, B.L. and Carpenter, E.J. (1984) The direct transfer of newly fixed nitrogen from free-living epiphyl-lous micro-organisms to their host plant. Oecologia 63, 52–56.
Béreau, M. and Garbaye, J. (1994) First observations on the root morphology symbioses of 21 major tree speciesin the primary tropical rain forest of French Guyana. Annales des Sciences Forestières 51, 407–416.

Berendse, F. and Aerts, R. (1987) Nitrogen-use-efficiency: a biological meaningful definition? FunctionalEcology 1, 293–296.
Björkman, O. (1981) Responses to different quantum flux densities. In: Lange O.L., Nobel, P.S., Osmond,C.B. and Ziegler, H. (eds) Physiological Plant Ecology. I. Responses to the Physical Environment.Springer, Berlin, pp. 57–107.
Boggan, J., Funk, V., Kelloff, C., Hoff, M., Cremers, G. and Feuillet, C. (1997) Checklist of the Plants of theGuianas (Guyana, Surinam, French Guiana). Smithsonian Institution, Washington, DC.
Bonal, D. (2000) Variabilité interspecifique de l’efficience d’utilisation de l’eau en forêt tropicale humideguyanaise. PhD thesis, University of Nancy, France.
Bonal, D., Atger, C., Barigah, T.S., Ferhi, A., Guehl, J.M. and Ferry, B. (2000a) Water acquisition patterns oftwo wet tropical canopy tree species of French Guiana as inferred from (H2O)-18O extraction profiles.Annals of Forest Science 57, 717–724.
Bonal, D., Barigah, T.S., Granier, A. and Guehl, J.M. (2000b) Late-stage canopy tree species with extremelylow delta C13 and high stomatal sensitivity to seasonal soil drought in the tropical rain forest of FrenchGuiana. Plant Cell and Environment 23, 445–459.
Bonal, D., Sabatier, D., Montpied, P., Tremeaux, D. and Guehl, J.M. (2000c) Interspecific variability of delta13C among trees in rainforests of French Guiana: functional groups and canopy integration. Oecologia124, 454–468.
Bongers, F. and Popma, J. (1990) Leaf dynamics of seedlings of rain forest species in relation to canopy gaps.Oecologia 82, 122–127.
Boot, R. (1993) Growth and Survival of Tropical Rain Forest Tree Seedlings in Forest Understorey and GapOpenings; Implications for Forest Management. Tropenbos Documents 6. Tropenbos Foundation,Wageningen, The Netherlands.
Boot, R. (1996) The significance of seedling size and growth rate of tropical rainforest tree seedlings forregeneration in canopy openings. In: Swaine, M.D. (ed.) The Ecology of Tropical Forest Tree Seedlings.Parthenon, Paris, pp. 267–284.
Brouwer, L. (1996) Nutrient Cycling in Pristine and Logged Tropical Rain Forest. Tropenbos-Guyana Series1. Tropenbos-Guyana programme, Georgetown, Guyana.
Buchmann, N., Guehl, J.M., Barigah, T.S. and Ehleringer, J.R. (1997) Interseasonal comparison of CO2 con-centrations, isotopic composition, and carbon dynamics in an Amazonian rain forest (French Guiana).Oecologia 110, 120–131.
Carswell, F.E., Meir, P., Wandelli, E.V., Bonates, L.C.M., Kruijt, B., Barbosa, E.M., Nobre, A.D., Grace, J. and Jarvis,P.G. (2000) Photosynthetic capacity in a central Amazonian rain forest. Tree Physiology 20, 179–186.
Chazdon, R.L. (1988) Sunflecks and their importance to forest understorey plants. Advances in EcologicalResearch 18, 1–63.
Chazdon, R.L. and Field, C.B. (1987) Determinants of photosynthetic capacity in six rainforest Piper species.Oecologia 73, 222–230.
Condit, R., Hubbell, S.P. and Foster, R.B. (1996) Changes in tree species abundance in a neotropical forest:impact of climate change. Journal of Tropical Ecology 12, 231–256.
Coomes, D.A. and Grubb, P.J. (2000) Impacts of root competition in forests and woodlands: a theoreticalframework and review of experiments. Ecological Monographs 70, 171–207.
Corré, W.J. (1983) Growth and morphogenesis of sun and shade plants. II. The influence of light quality. ActaBotanica Neerlandica 32, 185–202.
De Souza Moreira, F.M., Da Silva, M.F. and De Faria, S.M. (1992) Occurrence of nodulation in legumespecies in the Amazon region of Brazil. The New Phytologist 121, 563–570.
Dolman, A.J., Gash, J.H.C., Roberts, J. and Shuttleworth, W.J. (1991) Stomatal and surface conductance oftropical rainforest. Agricultural and Forest Meteorology 54, 303–318.
Eckstein, J., Beyschlag, W., Mott, K.A. and Ryel, R.J. (1996) Changes in photon flux can induce stomatalpatchiness. Plant Cell and Environment 19, 1066–1074.
Evans, J.R. and Poorter, H. (2001) Photosynthetic acclimation of plants to growth irradiance: the relativeimportance of specific leaf area and nitrogen partitioning in maximizing carbon gain. Plant Cell andEnvironment 24, 755–767.
Farquhar, G.D., O’Leary, M.H. and Berry, J.A. (1982) On the relationship between carbon isotope discrimi-nation and the intercellular carbon dioxide concentration in leaves. Australian Journal of PlantPhysiology 9, 121–137.
Farquhar, G.D., Ehleringer, J.R. and Hubick, K.T. (1989) Carbon isotope discrimination and photosynthesis.Annual Review of Plant Physiology 40, 503–537.
Ecophysiological Patterns in Forest Plants 227

Favrichon, V. (1994) Classification des espèces arborées en groupes fonctionelles en vue de la réalisationd’un modèle de dynamique de peuplement en forêt Guyanese. Revue de Ecologie – la Terre et la Vie49, 379–403.
Fetcher, N., Oberbauer, S.F. and Chazdon, R. (1994) Physiological ecology of plants. In: McDade, L.A.,Bawa, K.S., Hespenheide, H.A. and Hartshorn, G.S. (eds) La Selva Ecology and Natural History of aNeotropical Rain Forest. University of Chicago Press, Chicago, Illinois, pp. 128–141.
Field, C. and Mooney, H.A. (1986) The photosynthesis–nitrogen relationship in wild plants. In: Givnish, T.J.(ed.) On the Economy of Plant Form and Function. Cambridge University Press, Cambridge, UK, pp.25–55.
Fredeen, A.L. and Field, C.B. (1992) Ammonium and nitrate uptake in gap, generalist and understory speciesof the genus Piper. Oecologia 92, 207–214.
Fredeen, A.L., Griffin, K. and Field, C.B. (1991) Effects of light quantity and quality and soil nitrogen statuson nitrate reductase activity in rainforest species of the genus Piper. Oecologia 86, 441–446.
Givnish, T.J. (1988) Adaptation to sun and shade: a whole plant perspective. Australian Journal of PlantPhysiology 15, 63–92.
Grace, J., Malhi, Y., Lloyd, J., McIntyre, J., Miranda, A.C., Meir, P. and Miranda, H.S. (1996) The use of eddycovariance to infer the net carbon dioxide uptake of Brazilian rain forest. Global Change Biology 2,209–217.
Granier, A., Huc, R. and Colin, F. (1992) Transpiration and stomatal conductance of two rain forest speciesgrowing in plantations (Simarouba amara and Goupia glabra) in French Guyana. Annales des SciencesForestieres 49, 17–24.
Granier, A., Huc, R. and Barigah, S.T. (1996) Transpiration of natural rain forest and its dependence on cli-matic factors. Agricultural and Forest Meteorology 78, 19–29.
Guehl, J.M., Domenach, A.M., Bereau, M., Barigah, T.S., Casabianca, H., Ferhi, A. and Garbaye, J. (1998)Functional diversity in an Amazonian rain forest of French Guyana: a dual isotope approach (d15N andd13C). Oecologia 116, 316–330.
Hammond, D.S., Gourlet-Fleury, S., van de Hout, P., Ter Steege, H. and Brown, V.K. (1996) A compilationof known Guianan timber trees and the significance of their dispersal mode, seed size and taxonomicaffinity to tropical rain forest management. Forest Ecology and Management 83, 99–116.
Houter, N.C. and Pons, T.L. (2005) Gap size effects on photoinhibition in understorey saplings in tropicalrainforest. Plant Ecology (in press).
Huc, R. and Guehl, J.M. (1989) Environmental control of CO2 assimilation rate and leaf conductance in twospecies of tropical rain forest of French Guiana (Jacaranda copaia D. Don and Eperua falcata Aubl.).Annales des Sciences Forestières 46 suppl., 443–447.
Huc, R., Ferhi, A. and Guehl, J.M. (1994) Pioneer and late stage tropical rainforest tree species (FrenchGuiana) growing under common conditions differ in leaf gas exchange regulation, carbon isotope dis-crimination and water potential. Oecologia 99, 297–305.
Jetten, V.G. (1994) Modelling the Effects of Logging on the Water Balance of a Tropical Rain Forest.Tropenbos Series 6. Tropenbos Foundation, Wageningen, The Netherlands.
Jones, H.G. (1985) Partitioning stomatal and non-stomatal limitations to photosynthesis. Plant Cell andEnvironment 8, 95–104.
Jordan, C.F. (1985) Nutrient Cycling in Tropical Forest Ecosystems. John Wiley & Sons, Chichester, UK.Kao, W.Y. and Forseth, I.N. (1992) Diurnal leaf movement, chlorophyll fluorescence and carbon assimila-
tion in soybean grown under different nitrogen and water availabilities. Plant Cell and Environment 15,703–710.
Kitajima, K. (1994) Relative importance of photosynthetic traits and allocation patterns as correlates ofseedling shade tolerance of 13 tropical trees. Oecologia 98, 419–428.
Lambers, H., Chapin III, F.S. and Pons, T.L. (1998) Plant Physiological Ecology. Springer, New York.Lathwell, D.J. and Grove, T.L. (1986) Soil–plant relationships in the tropics. Annual Review of Ecology and
Systematics 17, 1–16.Leavitt, S.W. and Long, A. (1982) Evidence for 13C/12C fractionation between tree leaves and wood. Nature
298, 742–745.Lehto, T. and Grace, J. (1994) Carbon balance of tropical tree seedlings: a comparison of two species. New
Phytologist 127, 455–463.Leishman, M.R., Wright, I.J., Moles, A.T. and Westoby, M. (2000) The evolutionary ecology of seed size. In:
Fenner, M. (ed.) Seeds: The Ecology of Regeneration in Plant Communities. CAB International,Wallingford, UK, pp. 31–57.
228 T.L. Pons et al.

Lloyd, J., Kruijt, B., Hollinger, D.Y., Grace, J., Francey, R.J., Wong, S.C., Kelliher, M., Miranda, A.C.,Farquhar, G.D., Gash, J.H.C., Vygodskaya, N.N., Wright, I.R., Miranda, H.S. and Schultze E.D. (1996)Vegetation effects on the isotopic composition of atmospheric CO2 at local and regional scales: theo-retical aspects and a comparison between rain forest in Amazonia and a Boreal forest in Siberia.Australian Journal of Plant Physiology 23, 371–399.
Lovelock, C.E., Jebb, M. and Osmond, C.B. (1994) Photoinhibition and recovery in tropical plant species:response to disturbance. Oecologia 97, 297–307.
Lüttge, U. (1997) Physiological Ecology of Tropical Plants. Springer, Berlin.Lüttge, U. (1999) One morphotype, three physiotypes: sympatric species of Clusia with obligate C3 photo-
synthesis, obligate CAM and C3-CAM intermediate behaviour. Plant Biology 1, 138–148.Malhi, Y. and Grace, J. (2000) Tropical forests and atmospheric carbon dioxide. Trends in Ecology and
Evolution 15, 332–337.Marschner, H. (1995) Mineral Nutrition of Higher Plants. Academic Press, London.Medina, E. (1984) Nutrient balance and physiological processes at the leaf level. In: Medina, E., Mooney,
H.A. and Vazquez-Yanes, C. (eds) Physiological Ecology of Plants in the Wet Tropics. Junk Publishers,The Hague, pp. 139–154.
Medina, E. (1996) CAM and C4 plants in the humid tropics. In: Mulkey, S.S., Chazdon, R.L. and Smith, A.P.(eds) Tropical Forest Plant Ecophysiology. Chapman and Hall, New York, pp. 56–88.
Mulkey, S.S. and Pearcy, R.W. (1992) Interactions between acclimation and photoinhibition of photosyn-thesis of a tropical forest understorey herb, Alocasia macrorrhiza, during simulated canopy gap forma-tion. Functional Ecology 6, 719–729.
Mulkey, S.S., Chazdon, R.L. and Smith, A.P. (1996) Tropical Forest Plant Ecophysiology. Chapman and Hall,New York.
Murchie, E.H. and Horton, P. (1997) Acclimation of photosynthesis to irradiance and spectral quality inBritish plant-species – chlorophyll content, photosynthetic capacity and habitat preference. Plant Celland Environment 20, 438–448.
Niinemets, U. (1997) Distribution patterns of foliar carbon and nitrogen as affected by tree dimensions andrelative light conditions in the canopy of Picea abies. Trees – Structure and Function 11, 144–154.
Norris, D.O. (1969) Observations on the nodulation status of rainforest leguminous species in Amazonia andGuyana. Tropical Agriculture, Trinidad 46, 145–151.
Pate, J. and Arthur, D. (1998) Delta 13C analysis of phloem sap carbon: novel means of evaluating seasonalwater stress and interpreting carbon isotope signatures of foliage and trunk wood of Eucalyptus globu-lus. Oecologia 117, 301–311.
Pearcy, R.W. (1990) Sunflecks and photosynthesis in plant canopies. Annual Review of Plant Physiology 41,421–453.
Pearcy, R.W. and Yang, W. (1996) A three dimensional crown architecture model for assessment of light cap-ture and carbon gain by understorey plants. Oecologia 108, 1–12.
Perreijn, K. (2002) Symbiotic Nitrogen Fixation by Leguminous Trees in Tropical Rain Forest in Guyana.Tropenbos-Guyana Series 11. Tropenbos-Guyana programme, Georgetown, Guyana.
Poels, R.L.H. (1987) Soils, water and nutrients in a forest ecosystem in Suriname. PhD thesis, WageningenUniversity, Wageningen, The Netherlands.
Pons, T.L. and Welschen, R.A.M. (2003) Midday depression of net photosynthesis in the tropical rainforesttree Eperua grandiflora: contributions of stomatal and internal conductances, respiration and Rubiscofunctioning. Tree Physiology 23, 937–947.
Pons, T.L., Schieving, F., Hirose, T. and Werger, M.J.A. (1989) Optimization of leaf nitrogen allocation forcanopy photosynthesis in Lysimachia vulgaris. In: Lambers, H., Cambridge, M.L., Konings, H. and Pons,T.L. (eds) Causes and Consequences of Variation in Growth Rate and Productivity of Higher Plants. SPBAcademic Publishing, The Hague, pp. 175–186.
Pons, T.L., Van der Werf, A. and Lambers, H. (1994) Photosynthetic nitrogen use efficiency of inherently slow- andfast-growing species: possible explanations for observed differences. In: Roy, J. and Garnier, E. (eds) A WholePlant Perspective on Carbon–Nitrogen Interactions. SPB Academic Publishing, The Hague, pp. 61–77.
Poorter, L. and Oberbauer, S.F. (1993) Photosynthetic induction responses of two rain forest tree species inrelation to light environment. Oecologia 96, 193–199.
Poorter, H. and Van der Werf, A. (1998) Is inherent variation in RGR determined by LAR at low irradianceand by NAR at high irradiance? A review of herbaceous species. In: Lambers, H., Poorter, H. and vanVuuren, M.M.I. (eds) Inherent Variation in Plant Growth: Physiological Mechanisms and EcologicalConsequences. Backhuys Publishers, Leiden, Belgium, pp. 309–336.
Ecophysiological Patterns in Forest Plants 229
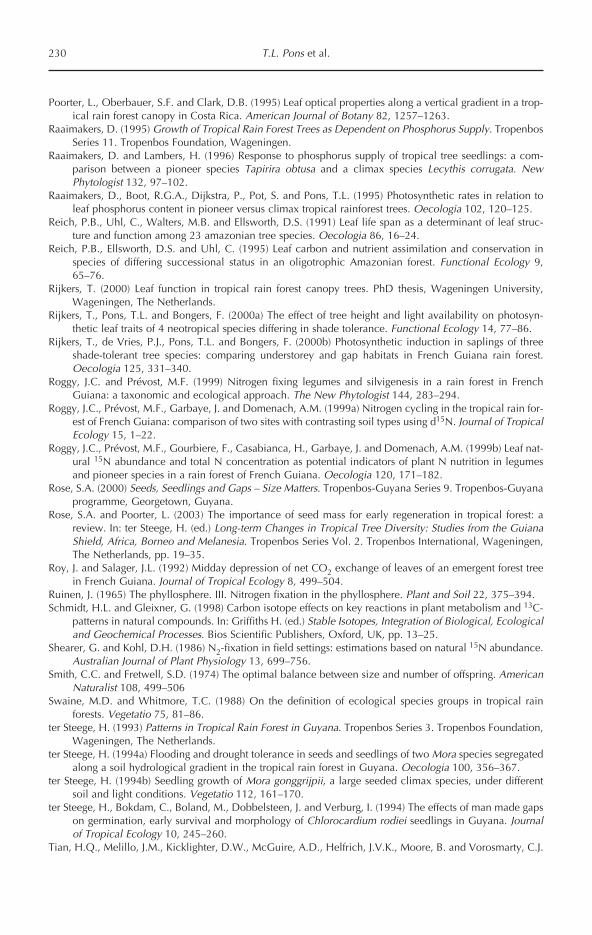
Poorter, L., Oberbauer, S.F. and Clark, D.B. (1995) Leaf optical properties along a vertical gradient in a trop-ical rain forest canopy in Costa Rica. American Journal of Botany 82, 1257–1263.
Raaimakers, D. (1995) Growth of Tropical Rain Forest Trees as Dependent on Phosphorus Supply. TropenbosSeries 11. Tropenbos Foundation, Wageningen.
Raaimakers, D. and Lambers, H. (1996) Response to phosphorus supply of tropical tree seedlings: a com-parison between a pioneer species Tapirira obtusa and a climax species Lecythis corrugata. NewPhytologist 132, 97–102.
Raaimakers, D., Boot, R.G.A., Dijkstra, P., Pot, S. and Pons, T.L. (1995) Photosynthetic rates in relation toleaf phosphorus content in pioneer versus climax tropical rainforest trees. Oecologia 102, 120–125.
Reich, P.B., Uhl, C., Walters, M.B. and Ellsworth, D.S. (1991) Leaf life span as a determinant of leaf struc-ture and function among 23 amazonian tree species. Oecologia 86, 16–24.
Reich, P.B., Ellsworth, D.S. and Uhl, C. (1995) Leaf carbon and nutrient assimilation and conservation inspecies of differing successional status in an oligotrophic Amazonian forest. Functional Ecology 9,65–76.
Rijkers, T. (2000) Leaf function in tropical rain forest canopy trees. PhD thesis, Wageningen University,Wageningen, The Netherlands.
Rijkers, T., Pons, T.L. and Bongers, F. (2000a) The effect of tree height and light availability on photosyn-thetic leaf traits of 4 neotropical species differing in shade tolerance. Functional Ecology 14, 77–86.
Rijkers, T., de Vries, P.J., Pons, T.L. and Bongers, F. (2000b) Photosynthetic induction in saplings of threeshade-tolerant tree species: comparing understorey and gap habitats in French Guiana rain forest.Oecologia 125, 331–340.
Roggy, J.C. and Prévost, M.F. (1999) Nitrogen fixing legumes and silvigenesis in a rain forest in FrenchGuiana: a taxonomic and ecological approach. The New Phytologist 144, 283–294.
Roggy, J.C., Prévost, M.F., Garbaye, J. and Domenach, A.M. (1999a) Nitrogen cycling in the tropical rain for-est of French Guiana: comparison of two sites with contrasting soil types using d15N. Journal of TropicalEcology 15, 1–22.
Roggy, J.C., Prévost, M.F., Gourbiere, F., Casabianca, H., Garbaye, J. and Domenach, A.M. (1999b) Leaf nat-ural 15N abundance and total N concentration as potential indicators of plant N nutrition in legumesand pioneer species in a rain forest of French Guiana. Oecologia 120, 171–182.
Rose, S.A. (2000) Seeds, Seedlings and Gaps – Size Matters. Tropenbos-Guyana Series 9. Tropenbos-Guyanaprogramme, Georgetown, Guyana.
Rose, S.A. and Poorter, L. (2003) The importance of seed mass for early regeneration in tropical forest: areview. In: ter Steege, H. (ed.) Long-term Changes in Tropical Tree Diversity: Studies from the GuianaShield, Africa, Borneo and Melanesia. Tropenbos Series Vol. 2. Tropenbos International, Wageningen,The Netherlands, pp. 19–35.
Roy, J. and Salager, J.L. (1992) Midday depression of net CO2 exchange of leaves of an emergent forest treein French Guiana. Journal of Tropical Ecology 8, 499–504.
Ruinen, J. (1965) The phyllosphere. III. Nitrogen fixation in the phyllosphere. Plant and Soil 22, 375–394.Schmidt, H.L. and Gleixner, G. (1998) Carbon isotope effects on key reactions in plant metabolism and 13C-
patterns in natural compounds. In: Griffiths H. (ed.) Stable Isotopes, Integration of Biological, Ecologicaland Geochemical Processes. Bios Scientific Publishers, Oxford, UK, pp. 13–25.
Shearer, G. and Kohl, D.H. (1986) N2-fixation in field settings: estimations based on natural 15N abundance.Australian Journal of Plant Physiology 13, 699–756.
Smith, C.C. and Fretwell, S.D. (1974) The optimal balance between size and number of offspring. AmericanNaturalist 108, 499–506
Swaine, M.D. and Whitmore, T.C. (1988) On the definition of ecological species groups in tropical rainforests. Vegetatio 75, 81–86.
ter Steege, H. (1993) Patterns in Tropical Rain Forest in Guyana. Tropenbos Series 3. Tropenbos Foundation,Wageningen, The Netherlands.
ter Steege, H. (1994a) Flooding and drought tolerance in seeds and seedlings of two Mora species segregatedalong a soil hydrological gradient in the tropical rain forest in Guyana. Oecologia 100, 356–367.
ter Steege, H. (1994b) Seedling growth of Mora gonggrijpii, a large seeded climax species, under differentsoil and light conditions. Vegetatio 112, 161–170.
ter Steege, H., Bokdam, C., Boland, M., Dobbelsteen, J. and Verburg, I. (1994) The effects of man made gapson germination, early survival and morphology of Chlorocardium rodiei seedlings in Guyana. Journalof Tropical Ecology 10, 245–260.
Tian, H.Q., Melillo, J.M., Kicklighter, D.W., McGuire, A.D., Helfrich, J.V.K., Moore, B. and Vorosmarty, C.J.
230 T.L. Pons et al.

(1998) Effect of interannual climate variability on carbon storage in Amazonian ecosystems. Nature396, 664–667.
Tinoco-Ojanguren, C. and Pearcy, R.W. (1993) Stomatal dynamics and its importance to carbon gain in tworainforest Piper species. I. VPD effects on the transient stomatal response to lightflecks. Oecologia 94,388–394.
Valladares, F., Allen, M.T. and Pearcy, R.W. (1997) Photosynthetic responses to dynamic light under fieldconditions in 6 tropical rain forest shrubs occurring along a light gradient. Oecologia 111, 505–514.
van Kekem, A.J., Pulles, J.H.M. and Khan, Z. (1996) Soils of the Rainforest in Central Guyana. Tropenbos-Guyana Series 2. Tropenbos-Guyana programme, Georgetown, Guyana.
Veneklaas, E.J. and Poorter, L. (1998) Growth and carbon partitioning of tropical tree seedlings in contrast-ing light environments. In: Lambers, H., Poorter, H. and van Vuuren, M.M.I. (eds) Inherent Variation inPlant Growth: Physiological Mechanisms and Ecological Consequences. Backhuys Publishers, Leiden,The Netherlands, pp. 337–361.
Vitousek, P.M. (1984) Litterfall, nutrient cycling and nutrient limitation in tropical forests. Ecology 65,285–298.
Vitousek, P.M. and Sanford, R.L. (1986) Nutrient cycling in moist tropical forest. Annual Review of Ecologyand Systematics 17, 137–167.
Winter, K. and Smith, J.A.C. (1996) Crassulacean Acid Metabolism: Biochemistry, Ecophysiology andEvolution. Springer, Berlin.
Wullschleger, S.D., Meinzer, F.C. and Vertessy, R.A. (1998) A review of whole plant water use studies intrees. Tree Physiology 18, 499–512.
Zotz, G. and Winter, K. (1993) Annual carbon balance and nitrogen-use efficiency in tropical C3 and CAMepiphytes. The New Phytologist 126, 481–492.
Zotz, G. and Winter, K. (1996) Diel patterns of CO2 exchange in rainforest canopy plants. In: Mulkey, S.S.,Chazdon, R.L. and Smith, A.P. (eds) Tropical Forest Plant Ecophysiology. Chapman and Hall, NewYork, pp. 89–113.
Ecophysiological Patterns in Forest Plants 231

This page intentionally left blank

Introduction
In the tropics, many animals are a funda-mental component of plant reproductivebiology. Animals underpin plant fecundityas a pollinator while feeding on nectar,increase their spatial distribution and theprobability of survival of their offspring as aseed disperser, and regulate the regenera-tion of their sympatric competitors as aseed and seedling predator (Janzen, 1970,1971; Howe and Smallwood, 1982;Wheelwright and Orians, 1982).Conversely, plants produce the leaves,roots, sap, flowers, fruit, seeds, wood andbark that provide vital resources to animalreproduction and survival, including car-nivorous and insectivorous species thatrely indirectly upon plants via their pri-mary consumers. Apart from their funda-mental role as food, plants also provideanimals with shelter and support when for-aging or resting. Together, the myriad evo-lutionary forces which combine to definerelationships between plants and animalsplay a significant role in shaping the diver-sity of tropical forests (Terborgh, 1988,1992). For the last 30 years, the bulk ofstudies dealing with plant–animal relation-ships in the tropical forests of the Guianashas mirrored studies at other tropical
research sites, focusing on frugivory as amutualistic interaction (Fleming, 1991).These studies have illustrated the widevariety of feeding habits and diets amongflying, arboreal and terrestrial vertebrates(reviewed by Howe, 1986).
Howe and Westley (1988) later sepa-rated the ecological relationships of plantsand animals into two types, viz. herbivoryand mutualism, though in reality both over-lap. For instance, large neotropical scatter-hoarding rodents act as herbivores whenthey consume seeds, but dispersers whenthe cached seeds are forgotten, and thisdeposition enhances germination andseedling establishment (Forget, 1990, 1994).In contrast to Howe and Westley’s (1988)definition, mutualistic associationsbetween plants and animals are here con-sidered as being included in the process ofherbivory. Herbivory is broadly definedhere as the consumption of plant materialsuch as leaves, fruit, seed, flowers and bark,and may clearly be advantageous to bothanimals and plants under certain conditions(Boucher et al., 1982; see also Boucher,1985; Lewis, 1985). However, where it isclear that most animals behave as herbi-vores at one time or another during theirlife, it is not certain if any mutual benefit isderived from this action. For example, the
233© CAB International 2005. Tropical Forests of the Guiana Shield (ed. D.S. Hammond)
4 Rainforest Vertebrates and Food PlantDiversity in the Guiana Shield
Pierre-Michel Forget1 and David S. Hammond2
1Département Ecologie et Gestion de la Biodiversité, Museum National d’HistoireNaturelle, Brunoy, France; 2Iwokrama International Centre for Rain Forest
Conservation and Development, Georgetown, Guyana. Currently: NWFS Consulting,Beaverton, Oregon, USA

ultimate consequences of fruit ingestionand seed dispersal are often uncertain(Howe and Smallwood, 1982) and thuscharacterizing plant–frugivore relation-ships as mutualistic may often prove pre-mature.
Though the majority of Guianan verte-brates are classified as fruit-eating animals(Dubost, 1987), their diets are not restrictedto fruit year-round, as a period of low avail-ability associated with a seasonal decline inrainfall forces animals to shift to alternativeresources such as leaves, flowers, insectsand small vertebrates (Primates: vanRoosmalen, 1985; Guillotin et al., 1994;Simmen and Sabatier, 1996. Marsupials:Julien-Laferrière and Atramentowicz, 1990.Ground-dwelling vertebrates: Guillotin,1982a, 1982b; Henry, 1994a. Birds: Erard etal., 1991).
In the next section, we introduce thereader to the Guianan vertebrate commu-nity, but with an emphasis on mammalsand their specialized diets in relation to theforest types they are most likely to inhabit.In subsequent sections we review the cur-rent knowledge of the diversity of plantsand plant parts that are incorporated in thediet of vertebrate groups known to activelyfeed on plants during some period in theirlifetime. We then show how many Guiananvertebrate herbivores play a significant eco-logical role in pollination, seed dispersaland seed–seedling predation. Afteranalysing the diversity of plant familiesthat are included in the diets of Guianananimal species or groups, a special interestis devoted to the palm family, a keystoneplant group in the Guianan forests. The last
section aims at underlining the importanceof herbivores to the maintenance of plantdiversity, and the conservation of managedtropical rainforest in the Guiana Shield.
General Characteristics of theVertebrate Fauna in the Guianas
Taxonomic richness1
The faunal diversity of the Guianan regionis generally considered to be relatively lowwhen compared to other neotropical sites,particularly those mega-diverse sites alongthe eastern foot slopes of the Andes in west-ern Amazonia (Voss and Emmons, 1996;Kay et al., 1997). While work by taxono-mists and ecologists in the Guianas gener-ally supports this notion, several vertebrategroups have recently been more thoroughlyexamined and appear to rival, if not exceed,counts made from other sites. Several ofthese groups are important plant-feedersand will be discussed more thoroughly laterin the chapter. Table 4.1 shows the numberof vertebrate species, by class, known tooccur in each of the three Guianan coun-tries, the result of a long record of zoologi-cal investigations. Each country presentlyhouses over 1000 vertebrate species. Thesenumbers are certain to increase. Severalindividuals sighted in the field are stillawaiting identification, including severalsmall mammals from Suriname (Charles-Dominique, 1993a). Many arboreal verte-brates have yet to be sighted at all due to thetraditional difficulties in accessing largeareas of the forest canopy (Voss and
234 P.-M. Forget and D.S. Hammond
Table 4.1. Number of described vertebrates known to occur in each of the three Guianan countries.
Class Guyana Suriname French Guiana Guianas
Mammals 221 180 191 234Birds 752 672 699 812Fish, skates and eelsa 420 318 334 ≅440Amphibians 81 94 72 118Reptilesa 140 143 162 206Total 1426 1365 1416 ≅1765
aFreshwater only.
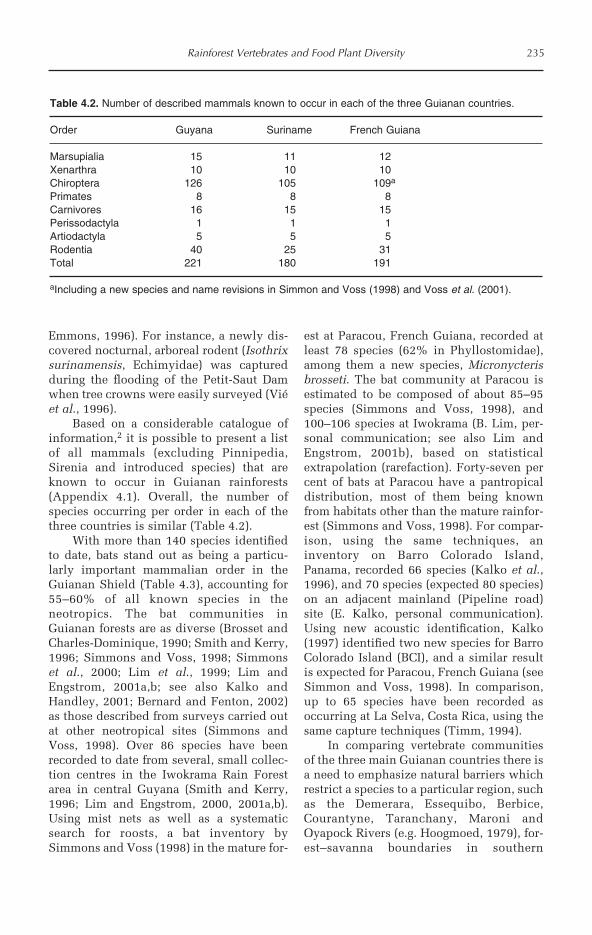
Emmons, 1996). For instance, a newly dis-covered nocturnal, arboreal rodent (Isothrixsurinamensis, Echimyidae) was capturedduring the flooding of the Petit-Saut Damwhen tree crowns were easily surveyed (Viéet al., 1996).
Based on a considerable catalogue ofinformation,2 it is possible to present a listof all mammals (excluding Pinnipedia,Sirenia and introduced species) that areknown to occur in Guianan rainforests(Appendix 4.1). Overall, the number ofspecies occurring per order in each of thethree countries is similar (Table 4.2).
With more than 140 species identifiedto date, bats stand out as being a particu-larly important mammalian order in theGuianan Shield (Table 4.3), accounting for55–60% of all known species in theneotropics. The bat communities inGuianan forests are as diverse (Brosset andCharles-Dominique, 1990; Smith and Kerry,1996; Simmons and Voss, 1998; Simmonset al., 2000; Lim et al., 1999; Lim andEngstrom, 2001a,b; see also Kalko andHandley, 2001; Bernard and Fenton, 2002)as those described from surveys carried outat other neotropical sites (Simmons andVoss, 1998). Over 86 species have beenrecorded to date from several, small collec-tion centres in the Iwokrama Rain Forestarea in central Guyana (Smith and Kerry,1996; Lim and Engstrom, 2000, 2001a,b).Using mist nets as well as a systematicsearch for roosts, a bat inventory bySimmons and Voss (1998) in the mature for-
est at Paracou, French Guiana, recorded atleast 78 species (62% in Phyllostomidae),among them a new species, Micronycterisbrosseti. The bat community at Paracou isestimated to be composed of about 85–95species (Simmons and Voss, 1998), and100–106 species at Iwokrama (B. Lim, per-sonal communication; see also Lim andEngstrom, 2001b), based on statisticalextrapolation (rarefaction). Forty-seven percent of bats at Paracou have a pantropicaldistribution, most of them being knownfrom habitats other than the mature rainfor-est (Simmons and Voss, 1998). For compar-ison, using the same techniques, aninventory on Barro Colorado Island,Panama, recorded 66 species (Kalko et al.,1996), and 70 species (expected 80 species)on an adjacent mainland (Pipeline road)site (E. Kalko, personal communication).Using new acoustic identification, Kalko(1997) identified two new species for BarroColorado Island (BCI), and a similar resultis expected for Paracou, French Guiana (seeSimmon and Voss, 1998). In comparison,up to 65 species have been recorded asoccurring at La Selva, Costa Rica, using thesame capture techniques (Timm, 1994).
In comparing vertebrate communitiesof the three main Guianan countries there isa need to emphasize natural barriers whichrestrict a species to a particular region, suchas the Demerara, Essequibo, Berbice,Courantyne, Taranchany, Maroni andOyapock Rivers (e.g. Hoogmoed, 1979), for-est–savanna boundaries in southern
Rainforest Vertebrates and Food Plant Diversity 235
Table 4.2. Number of described mammals known to occur in each of the three Guianan countries.
Order Guyana Suriname French Guiana
Marsupialia 15 11 12Xenarthra 10 10 10Chiroptera 126 105 109a
Primates 8 8 8Carnivores 16 15 15Perissodactyla 1 1 1Artiodactyla 5 5 5Rodentia 40 25 31Total 221 180 191
aIncluding a new species and name revisions in Simmon and Voss (1998) and Voss et al. (2001).

Guyana and Suriname or even changes inforest habitat types, rather than artificialboundaries. For example, Eisenberg’s(1989) distribution maps often suggestgeopolitical limits to the geographic rangesof mammals. Obviously, the real extent anddiversity of each forest habitat, especiallyin regard to those plant resources utilizedby vertebrates, can strongly influence pat-terns of regional vertebrate diversity in theGuianas. Voss and Emmons (1996)analysed the diversity of the mammalianfauna recorded at Arataye, French Guiana,and Kartabo, Guyana (Table 4.3), and com-pared them to other Amazonian sites. Theyshowed that sites in similar biomes havecomparable mammalian assemblagesdespite being in different countries(Appendix 4.1). However, the mammalianfauna in the Guianas is composed of farfewer species than like assemblages foundin other regions of lowland forest inAmazonia (Voss and Emmons, 1996). Thenumber of mammal species, notably pri-mates, in Venezuelan Guayana (Ochoa,1995, 2000), the Iwokrama Forest(Engstrom and Lim, personal communica-tion; see Lim et al., 2002), the BrownsbergNature Park (Fitzgerald et al., 2002;Fitzgerald, 2003) and the Nouragues reserve
(Bongers et al., 2001; Feer and Charles-Dominique, 2001) are also generally fewerthan elsewhere in the neotropics, though anumber of specific groups are more spe-ciose in the Guianas than at other neotropi-cal sites (Table 4.4). With an averagerainfall for the region of more than 2000mm per year (see Chapter 2), the lowerdiversity of primates recorded in theGuiana Shield is more likely related tolower productivity than to the relativelylow tree diversity found in some parts ofthe shield area compared to otherAmazonian sites, where higher productiv-ity may be related to soil nutrient richnessand available energy in the ecosystem (Kayet al., 1997; Lehman, 2000).
Ecological characteristics
Up until the 1970s there was a strongemphasis on mammal identification, classi-fication, geographical distributions andreproductive/mating behaviour in theGuianas, with a few anecdotal observationsof arboreal mammal feeding behaviour andforaging preferences (Beebe, 1917; Tate,1939; Muckenhirn et al., 1976; Husson,1978). Since the 1980s, however, substan-
236 P.-M. Forget and D.S. Hammond
Table 4.3. Number of mammalian species recorded and expected (in brackets) at six Guianan rain for-est sites, with area of site and no. of years in which collections or sightings have been made.
Bronwsberg Nouragues- ParacouImataca Iwokrama Kartabo Nature Park Arataye (French
(Venezuela) (Guyana) (Guyana) (Suriname) (French Guiana) Guiana)(3.2 × 10⁶ ha) (3.6 × 10⁵ ha) (4.3 x 10³ ha) (8.4 x 10³ ha) (1 x 10³ ha) (1 x 10³ ha)
Order 3 years 4 years 5 years 2 years 17 years 10 years
Marsupialia 9 7 (10) 7 (8) 6 11 12Xenarthra 9 9 9 6 9 9Chiroptera 78 83 (106) 12 (75)b 57 69 78 (85-95)Primates 3 5 (7) 6 8 7 6a
Carnivora 16 13 (14) 13 8 13 10Perissodactyla 1 1 1 1 1 1Artiodactyla 5 4 4 4 4 4Rodentia 22 15 (27) 20 (22) 22 24 21Total 143 137 (178) 72 (128) 112 138 141 (148-158)
aBlack spider monkey Ateles paniscus and brown capuchin Cebus apella are nearly extinct (R. Voss,personal communication; P.-M. Forget, personal observation).bDisproportionately low sampling effort was expended on bats relative to other mammals.
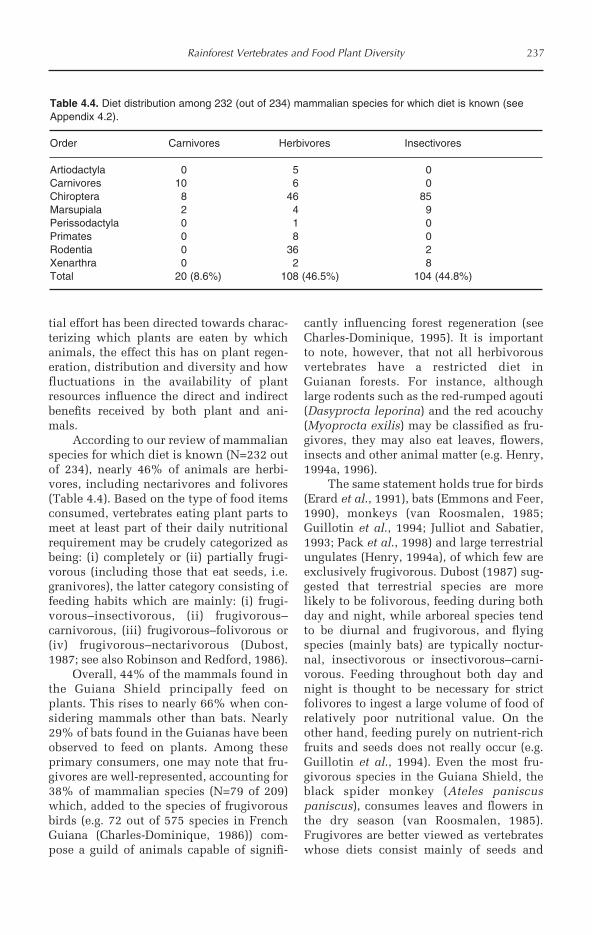
tial effort has been directed towards charac-terizing which plants are eaten by whichanimals, the effect this has on plant regen-eration, distribution and diversity and howfluctuations in the availability of plantresources influence the direct and indirectbenefits received by both plant and ani-mals.
According to our review of mammalianspecies for which diet is known (N=232 outof 234), nearly 46% of animals are herbi-vores, including nectarivores and folivores(Table 4.4). Based on the type of food itemsconsumed, vertebrates eating plant parts tomeet at least part of their daily nutritionalrequirement may be crudely categorized asbeing: (i) completely or (ii) partially frugi-vorous (including those that eat seeds, i.e.granivores), the latter category consisting offeeding habits which are mainly: (i) frugi-vorous–insectivorous, (ii) frugivorous–carnivorous, (iii) frugivorous–folivorous or(iv) frugivorous–nectarivorous (Dubost,1987; see also Robinson and Redford, 1986).
Overall, 44% of the mammals found inthe Guiana Shield principally feed onplants. This rises to nearly 66% when con-sidering mammals other than bats. Nearly29% of bats found in the Guianas have beenobserved to feed on plants. Among theseprimary consumers, one may note that fru-givores are well-represented, accounting for38% of mammalian species (N=79 of 209)which, added to the species of frugivorousbirds (e.g. 72 out of 575 species in FrenchGuiana (Charles-Dominique, 1986)) com-pose a guild of animals capable of signifi-
cantly influencing forest regeneration (seeCharles-Dominique, 1995). It is importantto note, however, that not all herbivorousvertebrates have a restricted diet inGuianan forests. For instance, althoughlarge rodents such as the red-rumped agouti(Dasyprocta leporina) and the red acouchy(Myoprocta exilis) may be classified as fru-givores, they may also eat leaves, flowers,insects and other animal matter (e.g. Henry,1994a, 1996).
The same statement holds true for birds(Erard et al., 1991), bats (Emmons and Feer,1990), monkeys (van Roosmalen, 1985;Guillotin et al., 1994; Julliot and Sabatier,1993; Pack et al., 1998) and large terrestrialungulates (Henry, 1994a), of which few areexclusively frugivorous. Dubost (1987) sug-gested that terrestrial species are morelikely to be folivorous, feeding during bothday and night, while arboreal species tendto be diurnal and frugivorous, and flyingspecies (mainly bats) are typically noctur-nal, insectivorous or insectivorous–carni-vorous. Feeding throughout both day andnight is thought to be necessary for strictfolivores to ingest a large volume of food ofrelatively poor nutritional value. On theother hand, feeding purely on nutrient-richfruits and seeds does not really occur (e.g.Guillotin et al., 1994). Even the most fru-givorous species in the Guiana Shield, theblack spider monkey (Ateles paniscuspaniscus), consumes leaves and flowers inthe dry season (van Roosmalen, 1985).Frugivores are better viewed as vertebrateswhose diets consist mainly of seeds and
Rainforest Vertebrates and Food Plant Diversity 237
Table 4.4. Diet distribution among 232 (out of 234) mammalian species for which diet is known (seeAppendix 4.2).
Order Carnivores Herbivores Insectivores
Artiodactyla 0 5 0Carnivores 10 6 0Chiroptera 8 46 85Marsupiala 2 4 9Perissodactyla 0 1 0Primates 0 8 0Rodentia 0 36 2Xenarthra 0 2 8Total 20 (8.6%) 108 (46.5%) 104 (44.8%)
fruits, in terms of the total volume andenergy consumed per year, but are notrestricted to these items.
Arboreal vertebrates are unique amongforest macrofauna in that they have direct(indirectly through insects) access to themassive primary productive capacity of thetropical forest canopy. Floral parts, nectar,pollen, ripe and unripe fruit and seeds,young foliage, bark, sap and a multitude ofinsects are available to arboreal vertebrates.These same resources are, in principle,never or only secondarily available to sym-patric vertebrate species restricted to theforest floor, though on occasion a plant’sdefences may prevent initial feeding byarboreal vertebrates. Particularly importantamong canopy-inhabiting animals are themammals, which of all forest vertebratesare responsible for consuming the over-whelming majority of plant biomass. Thecommunity of arboreal, non-volant mam-mals inhabiting Guianan forests consists of21 species, 19 of these feeding on plantswholly or in part. This group representsnearly 10% of all mammal species expectedto occur in the Guiana Shield. An addi-tional four plant-eating mammals could beconsidered scansorial, foraging consistentlyon the forest floor and in the trees, whileanother three species are primarily terres-trial, but may occasionally forage above theforest floor for fruit, flowers, foliage andbark.
Forest habitat and mammalian diet diversity
Guianan forest tree diversity is highlydependent on soil type, drainage class andtopographical features, which ultimatelyinfluence the landscape-scale spatial distri-bution of species and the overall represen-tation of different plant families in thecommunity (Lescure and Boulet, 1985; terSteege et al., 1993; Sabatier et al., 1997; terSteege, 1998; ter Steege and Zondervan,2000). At a small spatial scale in the GuianaShield, occurrence of soil with gooddrainage, often on slopes, hilltops andridges, alternates with conditions wheresoil drainage is delayed, blocked (down-
slope) or absent, leading to hydromorphicsoils alongside creeks and rivers (Lescureand Boulet, 1985). Small-scale, local soilconditions change abruptly. A distance ofseveral hundred metres can often cover amosaic of forest types consisting of highlymixed and diversified assemblages throughto forests with strong monodominance.This patchwork of soil conditions thusstrongly influences the distribution of foodplants at a smaller scale. High tree-speciesrichness (approx. >100–150 species per ha)(Sabatier et al., 1997) is often encounteredat the mid-point along the soil drainage gra-dient on well-drained, sandy and lateriticFerrasols. Richness declines in both direc-tions from this mid-point (Richards, 1996;ter Steege et al., 1993). Excessively well-drained, pure sand Psamments are charac-terized by several dominating species, suchas occur in Wallaba forest (Eperua grandi-flora, E. falcata). Soils that are coincidentwith strong monodominance in the canopy,such as Mora excelsa (Caesalpiniaceae) orMauritia flexuosa, tend to occur on poorlydrained floodplain (Fluvisolic) and swamp(Histisolic) soils (Rankin, 1978; Richards,1996) (Table 4.5).
An important finding of Dubost (1987)is that upland forest at a site in northernFrench Guiana had a richer faunal commu-nity than that close to the edge of a river.The abundance of several large-seededgravity, water or rodent-dispersed speciesthroughout the Guianas (Alexa imperatri-cis, Dicymbe spp., Elisabetha coccinea,Eperua spp., Mora spp., Vouacapoua spp.,Caesalpiniaceae; Carapa spp. Meliaceae;Catostemma commune, Bombacaceae;Chlorocardium rodiei, Lauraceae), and thetrend for these taxa to dominate the stand atthe local scale in many areas (Davis andRichards, 1933, 1934; Hammond andBrown, 1995; Richards, 1996; see Chapter 7,this volume) lowers the likelihood thatspecies which produce fleshy fruits willestablish in the stand, due to infrequent vis-itation by arboreal or flying frugivores andthe strong competitive edge local domi-nants have achieved. Consequently, the fewvertebrates which spend most, if not all, oftheir time in habitats adjoining rivers, lakes
238 P.-M. Forget and D.S. Hammond
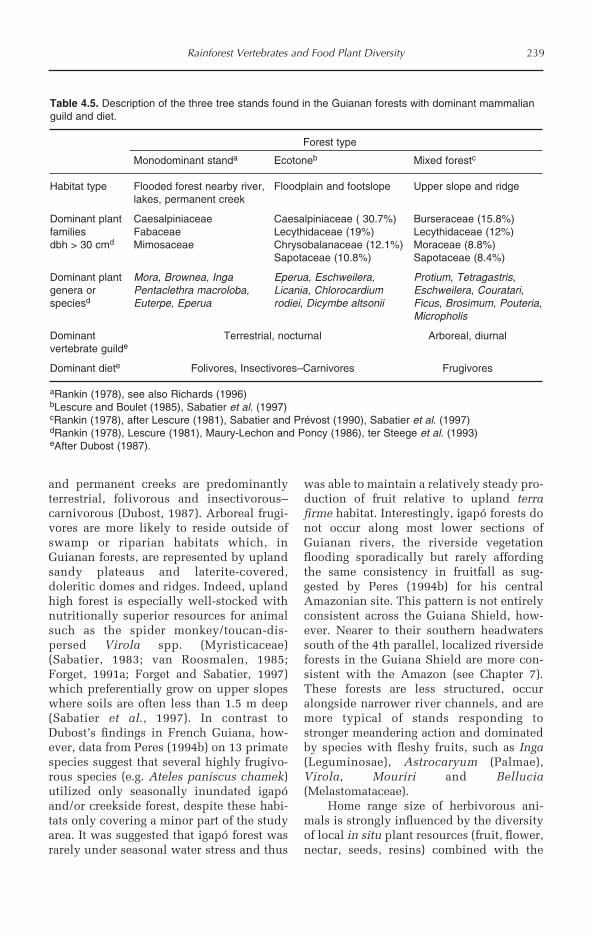
and permanent creeks are predominantlyterrestrial, folivorous and insectivorous–carnivorous (Dubost, 1987). Arboreal frugi-vores are more likely to reside outside ofswamp or riparian habitats which, inGuianan forests, are represented by uplandsandy plateaus and laterite-covered,doleritic domes and ridges. Indeed, uplandhigh forest is especially well-stocked withnutritionally superior resources for animalsuch as the spider monkey/toucan-dis-persed Virola spp. (Myristicaceae)(Sabatier, 1983; van Roosmalen, 1985;Forget, 1991a; Forget and Sabatier, 1997)which preferentially grow on upper slopeswhere soils are often less than 1.5 m deep(Sabatier et al., 1997). In contrast toDubost’s findings in French Guiana, how-ever, data from Peres (1994b) on 13 primatespecies suggest that several highly frugivo-rous species (e.g. Ateles paniscus chamek)utilized only seasonally inundated igapóand/or creekside forest, despite these habi-tats only covering a minor part of the studyarea. It was suggested that igapó forest wasrarely under seasonal water stress and thus
was able to maintain a relatively steady pro-duction of fruit relative to upland terrafirme habitat. Interestingly, igapó forests donot occur along most lower sections ofGuianan rivers, the riverside vegetationflooding sporadically but rarely affordingthe same consistency in fruitfall as sug-gested by Peres (1994b) for his centralAmazonian site. This pattern is not entirelyconsistent across the Guiana Shield, how-ever. Nearer to their southern headwaterssouth of the 4th parallel, localized riversideforests in the Guiana Shield are more con-sistent with the Amazon (see Chapter 7).These forests are less structured, occuralongside narrower river channels, and aremore typical of stands responding tostronger meandering action and dominatedby species with fleshy fruits, such as Inga(Leguminosae), Astrocaryum (Palmae),Virola, Mouriri and Bellucia(Melastomataceae).
Home range size of herbivorous ani-mals is strongly influenced by the diversityof local in situ plant resources (fruit, flower,nectar, seeds, resins) combined with the
Rainforest Vertebrates and Food Plant Diversity 239
Table 4.5. Description of the three tree stands found in the Guianan forests with dominant mammalianguild and diet.
Forest type
Monodominant standa Ecotoneb Mixed forestc
Habitat type Flooded forest nearby river, Floodplain and footslope Upper slope and ridgelakes, permanent creek
Dominant plant Caesalpiniaceae Caesalpiniaceae ( 30.7%) Burseraceae (15.8%)families Fabaceae Lecythidaceae (19%) Lecythidaceae (12%)dbh > 30 cmd Mimosaceae Chrysobalanaceae (12.1%) Moraceae (8.8%)
Sapotaceae (10.8%) Sapotaceae (8.4%)
Dominant plant Mora, Brownea, Inga Eperua, Eschweilera, Protium, Tetragastris,genera or Pentaclethra macroloba, Licania, Chlorocardium Eschweilera, Couratari,speciesd Euterpe, Eperua rodiei, Dicymbe altsonii Ficus, Brosimum, Pouteria,
Micropholis
Dominant Terrestrial, nocturnal Arboreal, diurnalvertebrate guilde
Dominant diete Folivores, Insectivores–Carnivores Frugivores
aRankin (1978), see also Richards (1996)bLescure and Boulet (1985), Sabatier et al. (1997)cRankin (1978), after Lescure (1981), Sabatier and Prévost (1990), Sabatier et al. (1997)dRankin (1978), Lescure (1981), Maury-Lechon and Poncy (1986), ter Steege et al. (1993)eAfter Dubost (1987).

quantity and type of seeds imported to anarea by primary dispersal agents. Spidermonkeys and howler monkeys consumeleaves and/or flowers of Eperua falcata(Caesalpiniaceae) in the dry season, but thebulk of their diet is made of myristicaceousand sapotaceous tree species, respectively(van Roosmalen, 1985; Julliot, 1993), twofamilies that are most often found in highforest on well-drained soils. Acouchieshave small home ranges (about 1 ha) andprefer forest near unflooded riverbanks,whereas agoutis have larger home ranges,including forest at both inundated andwell-drained sites (Dubost, 1988). Thoughthey consume many species with seeds thatsimply fall and accumulate on the ground(Meliaceae, Caesalpiniaceae, Chrysobala-naceae, Lauraceae; Forget, 1990, 1996;Hammond et al., 1992), both rodent speciesalso rely upon an influx of seeds of manyother plant families that are not foundwithin their home ranges, but are dropped intransit or beneath perches by bats (e.g.Anacardiaceae, Caryocaraceae, Chrysobal-anaceae, Lecythidaceae), birds (e.g.Burseraceae) or monkeys (e.g. Sapotaceae).
Bats as Herbivores
Diversity and dietary distribution
More than 137 bat species have been cata-logued for the entire Guianan Shield region(see Appendix 4.2). The majority of these
are insectivores (61.3%), while plant-eatingbats account for nearly 32% (N=35) of thetotal. Fifty-four percent (76 out of 137) ofthe Guianan bat species belong to the fam-ily Phyllostomidae, which includes thefruit (N=37) and nectar-eating specialists(N=13) in the Guianas (Table 4.6, see alsoQuelch, 1892; Greenhall, 1959; Husson,1962; Brosset and Charles-Dominique,1990; Cosson, 1994; Smith and Kerry, 1996;Brosset et al., 1996; Kalko, 1997; Simmonsand Voss, 1998; Simmons et al., 2000;Kalko and Handley, 2001; Lim andEngstrom, 2001a,b; Bernard and Fenton,2002). Of the 109 bat species recorded so farfrom French Guiana (see Appendix 4.2), 75and 61 of these were found in primary andsecondary forests, respectively (Brosset etal., 1996; see also Brosset et al., 1995), mostof these feeding on insects or fruit (Charles-Dominique, 1993a). For instance, in themature forest of Paracou, at least 74 batspecies were captured, including 17 frugi-vores and five nectarivores (Simmons andVoss, 1998).
Little and large fruit-eating bats
The abundance of fruit-eating bat species isdirectly attributable to the occurrence offruit trees on which they prefer to feed, thisfrequency being a consequence of the levelof disturbance to the forest stand. For exam-ple, Brosset et al. (1996) found that the pop-ulation growth achieved by somefrugivorous bats (e.g. the short-tailed fruit
240 P.-M. Forget and D.S. Hammond
Table 4.6. Number of bat species according to their principal dietary item in the Guianas. Some speciesconsume more than one dietary item.
Dietary item Guyanaa
Surinameb
French Guianac
All Guianasd
Fruit 37 26 23 31Nectar 11 14 7 13Insects 60 66 53 84Vertebrates 1 6 4 6Blood 2 1 2 2
aAfter Greenhall (1959), Emmons and Feer (1990), Smith and Kerry (1996)bAfter Husson (1962), Genoways and Williams (1979)cAfter Charles-Dominique (1994), Brosset et al. (1996)dThis study (Appendix 4.2).

bat, Carollia perspicillata; see Cosson,1994) in secondary forests was linked to theabundance of fruit from early secondaryrecolonizers (Cecropia obtusa, Ficus spp.,Piper spp., Solanum spp., Vismia spp.)which, due to their early establishment andhigh fecundity, are consumed and dis-persed in large numbers even further bybats (De Foresta et al., 1984; Charles-Dominique, 1986; see also Marinho-Filho,1991). In contrast, the populations of otherlarge fruit-eating bats (e.g. Artibeusjamaicensis and A. lituratus) appear todecline in largely degraded areas, possiblydue to a decline in the mature forest treespecies whose fruits they principally feedupon. Conversely, populations of A. obscu-rus, a common large fruit-eating bat withbroad feeding preferences and typicallyabundant in primary forest but not in sec-ondary stands (Brosset et al., 1996), showeda favourable short-term response to forestfragmentation resulting from the buildingof the Petit Saut Dam in French Guiana(Cosson et al., 1999; Granjon et al., 1997).Following fragmentation, the abundanceand diversity of the bat communities waslower on smaller islands compared to largerislands (40 ha) and the mainland peninsula(>1500 ha) (Cosson et al., 1999; Granjon etal., 1997; Pons and Cosson, 2002).
As an example of diet specialization infrugivorous bats, Cockle (1997) found thatfruits of (hemi-)epiphytes in theCyclanthaceae (Evodianthus funifer,Asplundia spp., Thoracocarpus bissectus)and Araceae (Philodendron spp.,Rhodospatha spp.) accounted for 57% ofthe diet of the small fruit-bat Rhinophyllapumilio at a mature forest in FrenchGuiana. Seeds of these families were alsofound in the faeces of the short-tailed fruitbats, Carollia brevicaudata and C. perspicil-lata, and the yellow-shouldered fruit bats,Sturnira tildae and S. lilium. Fruits fromspecies in the Solanaceae (Solanum spp.),Moraceae (Ficus spp.), Piperaceae (Piperspp.) and Bignonaceae (Schlegelia spp.)also figured prominently in the diet of R.pumilio during the course of the study(Cockle, 1997). In total, 47 species in 15
plant families were identified from faecesbeneath feeding roosts as being consumedand dispersed by R. pumilio.
Though underestimated, the protein-rich foliage resource might be also essentialfor frugivorous bats such as the large fruit-bats A. jamaicensis and A. lituratus, which,in forests of Puerto Rico at least, meet theirmicro-nutrient and vitamin requirementsthrough leaves, an abundant and easy-to-capture resource in comparison to insects(Kunz and Diaz, 1995).
Arboreal Herbivorous Mammals
Diurnal foragers
Flowers
Reproductive parts are a staple resource formany diurnal, arboreal frugivores duringthe dry season, especially primates. Julliotand Sabatier (1993) estimated that the treesMicropholis cayennensis (Sapotaceae),Eperua falcata (Caesalpiniaceae) and theliana Odontadenia sp. (Apocynaceae) con-stituted more than 50% of flower consump-tion by red howler monkeys, Alouattaseniculus, in French Guiana. Nearly 13% ofthe diet of howler monkeys is composed offlowers, based on feeding records (Julliot,1994). Flowers are also part of capuchinand spider monkey diets in French Guianaand Suriname, though to a much lesserextent than in the case of howler monkeys(van Roosmalen, 1985; Guillotin et al.,1994; Simmen and Sabatier, 1996; Simmenet al., 2001). Oliveira et al. (1985) observedthat a troop of Guianan sakis, Pitheciapithecia, ate only flowers from species inthe Bignoniaceae, Leguminosae andPassifloraceae during the dry season (14%of records) at a site near Manaus, Brazil.Tamarins (Saguinus spp.), capuchin mon-keys (Cebus spp.) and white-faced saki allturned to Symphonia and Mabea cf. eximianectar during the July–October dry seasontrough in fruit production at a site on theRio Urucu in central Amazonia (Peres,1994b).
Rainforest Vertebrates and Food Plant Diversity 241

Fruit and seeds
A large part of zoological research has beendirected towards primates, arguably beingthe most influential, non-volant, vertebrateconsumers of plant materials in Guianantropical rainforests. Guillotin et al. (1994)compared the diversity of fruit and seedscontained in the stomach contents of a ran-dom sample of black spider monkeys, redhowler monkeys and brown capuchin mon-keys in French Guiana. They concludedthat competition for fruits is of little impor-tance since each species concentrated onfruits of different sizes. The larger species(spider monkey and howler monkey)focused primarily on the top end of the fruitsize spectrum, while relatively small indi-viduals of brown capuchins Cebus apellaate smaller fruits. During the dry season,howler monkeys and capuchins shifted tofoliage and insects, respectively, whereasspider monkeys maintained a frugivorousdiet (see also van Roosmalen, 1985). Basedon diversity of plant species consumed,Guillotin et al. (1994) found that spidermonkeys and howler monkeys fed oncanopy, emergent (>25 m) and subcanopytrees (15–25 m) more often than in under-storey treelets (<15 m), whereas browncapuchins did not show any preferencesbetween strata, though they were found toprospect more frequently in epiphytes andlianas. The diets of the three monkeys over-lap by 35–59%, while the proportion offruit in the diet is directly related to thetotal number of species identified fromstomach contents (42, 34 and 63 species,respectively). The higher the number offruit species eaten by a given monkey, thelower the percentage of those shared withother monkey species (Guillotin et al.,1994).
The diversity of plant species con-sumed by monkeys depends on body size,habitat type and location. The relativeoccurrence of each plant item consumed isthen dependent on the method used todescribe the diet. For instance, based onstomach content analysis, Guillotin et al.(1994) quoted only four species ofSapotaceae consumed by howler monkeys
at Arataye river area, whereas, after observ-ing monkeys for more than 2 years, Julliot(1996a,b) listed 21 species at the Nouraguesstation only 8 km away (see also Julliot,1994). At Nouragues, the family Sapotaceae(27 species) is a major source of fruit forhowler monkeys (59% of feeding records),spider monkeys (35%) and capuchins(28%). Other species, mainly Moraceae (e.g.Bagassa guianensis), Myristicaceae (Virolaspp.) and Mimosaceae (Inga spp.) fruit fromFebruary through April when fruit produc-tion is highest (Simmen and Sabatier,1996). The diversity of fruiting species con-sumed by the largest monkeys is similar,though when considering these togetherwith the number of species whose leaveswere consumed (at least 19 species), thediet of howler monkeys is much more var-ied (67 items) than that of spider monkeys(23 items) (Simmen and Sabatier, 1996; seealso Guillotin et al., 1994). When restrictedto highly disturbed, flooded forest remnantswith leafless trees, an isolated troop ofhowler monkeys survived for some time byfeeding exclusively on leaves of Araceae(Philodendron spp.) and Cyclanthaceae(Ludovia lancifolia) (de Thoisy andRichard-Hansen, 1997).
A fourth important Guianan monkey,the golden-handed tamarind (Saguinusmidas midas) is insectivorous–frugivorousall year round, with important seasonalvariation in dietary composition. Insects(64% of diet) are predominately taken dur-ing the period of high fruit production(Pack et al., 1998). A total of 31 mainlysmall-seeded species, belonging to 25 plantfamilies, were consumed by tamarins dur-ing the course of Pack et al.’s (1998) study.Tamarins have a small home range of about31–48 ha, with an average density of 19.4individuals/km2 (Day, 1997) and captureinsects (e.g. Acrididae: K.S. Pack, O. Henry,personal communication) on leaves andlianas at between 10 and 20 m heightwithin low-statured forest types. In contrastto larger monkeys, tamarins prefer edge anddisturbed habitat types (Mittermeir and vanRoosmalen, 1981; Kessler, 1995), such asforests dominated by lianas orDimorphandra spp. on well-drained, nutri-
242 P.-M. Forget and D.S. Hammond
ent-poor soils which are susceptible to fre-quent treefall or fire events (see Chapters 2and 7). This preference for disturbed habi-tats is reflected by the low diversity of plantfamilies eaten (Pack et al., 1998).
Troops of brown bearded sakis(Chiropotes satanus) in Suriname dependalmost entirely upon the immature seedsand ripe fruits of 53 tree species (vanRoosmalen et al., 1988), other plant parts(flower, leaves) accounting for only a mar-ginal portion of their diet. Van Roosmalenet al. (1988) observed that fruit comprises96% (of which 69% are seeds) of the diet ofbrown bearded saki. According to Kinzeyand Norconk (1993), fruit and seeds(52–91% of total) account for 91–99% ofthe annual dietary intake of brown beardedsaki, with substantial variation in themonthly totals occurring as a result of sea-sonal and habitat differences in resourceavailability.
Details of the frugivorous diet ofGuianan sakis are fragmentary (e.g. Oliveiraet al., 1985; Setz, 1993, 1996; for details ofa closely related species, P. albicans, fromnortheast Brazil, see also Peres, 1993a).Mittermeier and van Roosmalen (1981)report that the diet of Guianan sakis is com-posed of 93% fruit (of which 36% areseeds), 6.7% flowers, and no leaves at a sitein Suriname. Setz (1992, 1993, 1996)showed that Guianan sakis rely upon 189species in 51 families found within a 10-hafragment in north-central Amazonia (seeBierregaard et al., 1992), which representsthe longest list of plants consumed byGuianan sakis to date. More recently, Vié(personal communication) studied Guianansakis at two sites in French Guiana, onecovered by primary forest (Vié, 1997, 1998;Vié and Richard-Hansen, 1997; see also Viéet al., 2001; Richard-Hansen et al., 1999),and the other on a 30–40 ha island near tothe Saint Eugene research station situatedwithin the fragmented Petit Saut Dam area(see Granjon et al., 1997; Claessens et al.,2001). Based on more than 1500 visualfeeding counts on the island, Vié (personalcommunication) found that the diet ofGuianan sakis was primarily composed offruits and seeds (78%), with some alternate
consumption of buds, stems and leaves(10%) and flowers (1%). This is consistentwith the 79% figure for fruit consumption(of which 22% are immature seeds) in aconspecific troop in Brazil (Oliveira et al.,1985). Although ongoing, an incompleteidentification of fruits and seeds in Vié’sstudy covers a total of 33 plant families, ofwhich two were not present in Setz’s (1993)inventory. Apart from intensive seed preda-tion by saki monkeys, capuchins (browncapuchin and wedge-capped capuchin, C.olivaceus) also act as seed predators duringthe Guianan dry season, consuming imma-ture fruit and seeds of palms in particularand discarding the fruits of many otherspecies on the ground below the parent tree(e.g. Zhang, 1994).
Foliage
In the canopy, the folivorous pale-throatedthree-toed sloth (Bradypus tridactylus) andthe southern two-toed sloth (Cloelopusdidactylus) may reach high densities insome Guianan forests (see Charles-Dominique et al., 1981), though the impactof high densities upon the amount of leafmatter consumed (see Foley et al., 1995) isas yet unknown. Red howler monkeys alsoconsume a large amount of young (3% ofobservational feeding units) and mature(54%) leaves, especially in the dry seasonwhen fruit resources are scarce atNouragues field station (Julliot andSabatier, 1993). By studying the stomachcontents of howler monkeys, Guillotin et al.(1994) found similar mean percentages(53%) of leaves ingested, with a maximumin June–September (73%) within theArataye area, 8 km from Nouragues. A totalof 96 plant species were recorded as beingconsumed by howler monkeys during a 2-year period at Nouragues (Julliot, 1993).The Leguminosae (Caesalpiniaceae,Fabaceae and Mimosaceae), Burseraceae,Chrysobalanaceae and Araceae are particu-larly important in the leaf diet of howlermonkeys, accounting for 71% of all species(N=29 species) consumed by monkeys inthe wet season (Simmen and Sabatier, 1996;see also Julliot and Sabatier, 1993). Leaves
Rainforest Vertebrates and Food Plant Diversity 243

eaten by monkeys are poor in lipids, havelow concentrations of soluble sugar andhave a higher protein content than fruits –young leaves being richer than matureleaves (Simmen and Sabatier, 1996).
Gum
While Ficus fruit may serve as a staple keyresource in the dry season (Terborgh, 1986),Peres (2000) suggested that other plantitems such as gum of Parkia spp. pods(Mimosaceae) play the same role for severalarboreal, flying and terrestrial vertebrates inAmazonian and Guianan rainforests. Forinstance, among arboreal diurnal foragers,Peres reports that seeds and gums of Parkiapods were one of the most important dry-season food items for brown capuchin mon-keys in Amazonian forests (Peres, 1994a,2000). In Suriname, golden-handedtamarins and spider monkeys also consumegum of Parkia pendula and P. nitida (vanRoosmalen, 1985, personal communication,in Peres, 2000).
Nocturnal foragers
Nocturnal, arboreal mammals of theGuianan forests have also received muchattention. Charles-Dominique and hisresearch team analysed resource use andniche partitioning in three rodents, fivemarsupials and one carnivore in an 80-year-old secondary forest (Cabassou) near anurban centre in French Guiana. Arborealrodents typically eat immature seeds,whereas marsupials and the kinkajou Potosiflatus are principally nectar and pulp-eat-ing, disseminating the seeds of many short-lived (e.g. Decrepit spp., Ficus spp., Vismiaspp., Melastomataceae) and longer-living(Inga spp., Virola spp., Mimosaceae,Lauraceae) species in the process (Charles-Dominique et al., 1981). A total of 31 plantspecies in 19 families (of 127 species and 55families; Charles-Dominique et al., 1981)accounts for the majority of resources uti-lized by the bare-tailed woolly opossum(Caluromys philander), the common opos-sum (Didelphis marsupialis) and the com-
mon grey four-eyed opossum (Philanderopossum) (Atramentowicz, 1988). Whenconsidering the feeding records of the sameanimal species in the mature forest of Pistede Saint Elie in addition to those fromCabassou, the number of plant speciesincreases to 44 species in 21 families, ofwhich only 19 species, all with seeds lessthan 1 cm in length (largest werePassiflora), are dispersed after ingestionand defecation (Atramentowicz, 1988). Thediet of the bare-tailed woolly opossum iscomposed mainly of fruit pulp (75%) andarthropods (25%) during periods of heavyfruitfall, but includes nectar and tree exu-dates (gum) when fruit become less avail-able (see also Julien-Laferrière andAtramentowicz, 1990). The diets of themainly terrestrial common opossum andcommon grey four-eyed opossum are morevaried, fruits accounting for only 50% ofthe diet, amphibians and small mammalsmaking up the difference (Atramentowicz,1982, 1988). At Piste de Saint-Elie, bare-tailed woolly opossum feed upon 23 plantspecies in 13 families (Julien-Laferrière,1989, 1999b; for information on foragingbehaviour, see also Julien-Laferrière, 1990,1995, 1997, 1999a). Up to 30 plant speciesin 21 families were consumed over thecourse of a year by kinkajou at Piste deSaint-Elie (Julien-Laferrière, 1989, 1999a).Combining feeding records collected atNouragues station (dry season, Julien-Laferrière, 1993; wet season, Julien-Laferrière, 1999b, 2001) and at Cabassou(Charles-Dominique et al., 1981), it is possi-ble to state that at least 61 species in 34families are included in the diet of thekinkajou, many of them being dispersedvia defecation (Julien-Laferrière, 1989,1999a,b).
Ground-dwelling Mammals
Ungulates
Red brocket deer (Mazama americana),grey brocket deer (M. gouazoubira), white-tailed deer (Odocoileus virginianus), col-lared peccaries (Tayassu tajacu),
244 P.-M. Forget and D.S. Hammond
white-lipped peccaries (T. pecari) andBrazilian tapir (Tapirus terrestris) arethought to feed at least in part on seeds orfruit in the Guianas. Here, we documenttheir diet after reviewing the literature fromthe Guianas and countries outside the limitof the Guianan Shield extending through-out Amazonia where the same speciesoccur. We also briefly consider data on rel-ative species from Central America whenlittle information is available for Amazoniain general.
Deer
Deer in Suriname consume fruit and seedsprimarily during the months encompassingthe maximum and minimum periods ofrainfall, vegetative plant parts being pre-ferred during the intervening transitionalperiods (Branan et al., 1985; Gayot, 2000),when new leaf production is likely to behighest (see Aide, 1988, 1993). An increasein the consumption of reproductive plantparts from October to December is synchro-nous with the birth of red brocket offspringduring these months (Branan andMarchinton, 1986). Red brocket deer (57species in 36 families; N=57 stomachs) hada richer diet than either grey brocket deer(15 species in 12 families; N=5 stomachs) orwhite-tailed deer (14 species in 10 families;N=13 stomachs) (Branan et al., 1985).Stomach content analyses of plant con-sumption by deer in French Guiana (Gayot,2000; Gayot et al., 2004) showed that redbrocket deer (N=28 stomachs) and greybrocket deer (N=34) share a total of 30 fam-ilies (of N=38 and 40 plant families identi-fied so far, respectively). Symphoniaappears to be an important resource for redbrocket deer, while both Bellucia grossular-ioides (Melastomataceae) and Swartzia ben-thamiana (Caesalpiniaceae) are importantcomponents of the grey brocket deer diet inSuriname. In French Guiana, four familiesare dominant so far in both deer’s stomachs,including Myristicaceae (seeds of Virolasurinamenis, V. michelii, V. kwatae),Caesalpiniaceae (seeds of Dicorynia guia-nensis, flowers of Eperua falcata),Lecythidaceae (flowers and seeds of
Eschweilera spp.) and Moraceae (fruits ofFicus spp.). Seeds and fruits from otherimportant neotropical plant families suchas Palmae and Leguminosae in general werealso commonly observed in stomach con-tents of these species in Suriname (Brananet al., 1985) and French Guiana(Oenocarpus bacaba; Gayot, 2000) as wellas in Amazonian Peru (except Odocoileus,which is absent) (e.g. Bodmer, 1990b).Stalling (1984) lists a total of 23 plant fami-lies from which leaves, fruits, twigs andflowers are consumed by grey brocket deerin Paraguay. Because the number of identi-fiable plant species from stomach contentsis often limited, our current knowledge ofdietary preferences and composition indeer remains fragmentary. However, fieldobservations suggest that most deer inten-sively browse the young seedlings of manyspecies following the decline in fruitfalland increase in germination which takesplace from May to July each year. AtMabura Hill, red brocket deer repeatedlybrowsed over 100 seedlings of the large-seeded sapotaceae, Pouteria speciosa,beneath a single parent tree, often returningmore than ten times to consume the com-pensatory growth (Hammond, unpublishedresults), which is a typical response oflarge-seeded species to initial loss of above-ground seedling biomass (Harms andDalling, 1997; Hammond and Brown,1998).
Tapir
Recently, inspection of the tapir’s dietarypatterns at Nouragues, French Guiana andon Maracá Island, Roraima, Brazil, hasshown that Brazilian tapir may ingest anddisperse a large number of small- to large-seeded species while foraging in terra firmeforest (Fragoso, 1997; Fragoso andHuffman, 2000; Henry et al., 2000). Forinstance, in French Guiana, 81% of tapirstomachs (N=27) contained intact seeds, amajority of them being less than 1 cm indiameter, but occasionally swallowingseeds up to 2.5 cm in diameter, in this casebelonging to the liana Elephantomeneeburnea (Menispermaceae) (F. Feer, per-
Rainforest Vertebrates and Food Plant Diversity 245

sonal communication). The most abundantspecies found were Spondias mombin(Anacardiaceae), Bagassa guianensis(Moraceae) and the liana Landolfia guia-nensis (Apocynaceae). In contrast, the dom-inant species in faeces of tapirs at MaracáIsland, Roraima, Brazil are Mauritia flexu-osa and Maximiliana maripa (Attaleamaripa) (Arecaceae), Cassia moschata, andEnterolobium schomburgkii (Fabaceae),Spondias mombin and Anacardium gigan-teum (Anacardiaceae). Contrasting dietaryregimes are likely a consequence of differ-ence of habitat dominance between sites(Fragoso and Huffman, 2000; see alsoFragoso, 1998a, 1998b). Salas and Fuller(1996) and Salas (1996) documented habitatuse and the diet of tapir in VenezuelanGuayana (see description of this forest inRollet, 1969), and recorded that it ate fruitof 33 species of trees, palms and lianasbelonging to 12 plant families and browsedat least 88 different species of plants, themost common being Cecropia sciadophylla(Cecropiaceae). In contrast, the large faecaldeposits (up to 10 kg fresh weight, N=8) oftapir in central Guyana are composedalmost totally of leaf with no discernibleseed remnants, though a number of smallseeds (e.g. Solanum) were enmeshed withinthe fibrous mass (D. Hammond, unpub-lished data) of the few samples observed.The predisposition of tapirs to defecate inwater (D. Hammond, personal observation;Janzen, 1981b, 1983b; Fragoso, 1997) wouldnot make for effective dispersal of seeds,unless they are adapted to a swamp orriparian environment (e.g. Catostemmacommune, Palmae, Rapateaceae). Whilesampling effort varied tremendously, thedifferences in seed abundance in freshdung recorded from different sites in theGuianas suggests that diet and dietarychoice are being affected by seasonal and/orspatial variation in fruit and seed resourcesand tapir feeding behaviour.
At a neotropical location outside of theGuiana Shield, Rodrigues et al. (1993)found numerous seeds of the palm Euterpeedulis, the liana Maytenus sp.(Celastraceae) and the tree Virola oleifera(Myristicaceae), in addition to twigs and
leaves of the giant bamboo, Guadea augus-tifolia, in two dung samples taken from theAtlantic forest in Brazil. Bodmer (1990a)analysed gut (stomach and caecal) contentand faecal samples of tapir in AmazonianPeru and found that tapirs consumed alarge quantity of fruit (33% of dry weight),principally from the families Arecaceae(Mauritua flexuosa, Jessenia sp., Scheeleasp.), Sapotaceae, Araceae, Chrysobal-anaceae, Leguminosae and Menisperma-ceae. By comparison, Foerster (personalcommunication; see Foerster and Vaughan,2002) tallied a total of 126 for the plant fam-ilies ingested by a Baird’s tapir during a 10-month period in Corcovado National Park,Costa Rica (see Matola and Todd, 1997). Ofthis total, 35% were vines, 34% trees, 16%shrubs and 15% herbs (C. Foerster, per-sonal communication). This is of similarmagnitude to the 94 plant species (45 fami-lies) listed by Terwillinger (1978) as beingeaten by Baird’s tapir on Barro ColoradoIsland, Panama. Araceae (Monstera sp.vine), Lauraceae (Persea sp. fruit) andRubiaceae (Psychotria sp. bark) accountedfor 40% of diet in Costa Rica. In bothCentral American forests, occurrence offruits in the diet is small, accounting for19% of diet according to Foerster (1998,personal communication) and only threefruit species in Terwillinger (1978), whichcontrast with a high frugivorous diet oftapir in Amazonian Peru (Bodmer, 1990a)and Guianas (F. Feer, personal communica-tion). Such differences are possibly relatedto the nature of the habitats foraged by ani-mals, i.e. essentially secondary vegetationin Central America (Terwillinger, 1978;Foerster and Vaughan, 2002) (despitethe clumped population of Attalea palms)versus primary tall rainforest in theGuianas.
Peccaries
Information on the diet, feeding behaviourand habits of peccaries is rare, perhapsbecause these species are threatened withlocal extinction in many parts of their for-mer geographic range (see Bodmer, 1995;Peres, 1996; Beck, 2005). Virtually no infor-
246 P.-M. Forget and D.S. Hammond

mation of this kind exists for peccaries inthe Guiana Shield, though most accountsfrom local people and researchers suggestthat their populations are largely intactacross much of the Guianan interior. Arecent study by Judas and Henry (1999)shows that seasonal variation in homerange size is correlated with fruit availabil-ity: the size of the core area was smallerduring the low-fruit season (June–September) than during the high-fruit sea-son (February–May). In addition, Judas(1999) was able to test casual fruits andseeds encountered by a captive collaredpeccary that was kept on a lead along foresttrails: up to 17 plant families and species offruits and seeds were eaten by the peccary.Leaves of at least five plant families(Araceae, Heliconiaceae, Marantaceae,Melastomataceae and Sapotaceae) were alsoconsumed; the ratio leaves:fruit dependedon fruit seasonality, the greatest amount offruit and seeds being harvested during thehigh fruiting season. Reproductive plantparts represent a major part (>60%) of stom-ach contents of collared and white-lippedpeccaries in Amazonian Peru and theGuianas (Bodmer, 1991; Henry, 1994a,1996; Feer et al., 2001a). Data from otherneotropical countries are informative herebecause many of the same plant species orclosely related plant species occur in theGuianas. Fragoso (1999) list some specieseaten by white-lipped and collared pec-caries in Amazonian Brazil. Attalea(Maximiliana) maripa and Mauritia flexu-osa, two palms abundant in terra firmeforests and palm wetlands, are consumedby both peccary species either in the wet orthe dry season. Other plant items eateninclude pulp and/or seeds of Caes-alpiniaceae, Mimosaceae and Sapotaceae.Based on the analyses of faecal samples col-lected over an 11-month period, Altrichterand colleagues (Altrichter et al., 2000,2001; see also Altrichter and Almeida,2002) similarly found a high proportion offruit (62% of contents) being consumed fre-quently (95% of samples) by white-lippedpeccaries in Corcovado National Park,Costa Rica; at least 30 different species wereidentified, mainly belonging to the
Moraceae, Arecaceae, Chrysobalanaceae,Myristicaceae and Anacardiaceae; palmfruits were also the most common dietaryconstituent for peccaries in westernAmazonian forests (Bodmer, 1990b; Kiltie,1980, 1981; see also Kiltie, 1982).Vegetative parts of the families Araceae,Cyclanthaceae, Heliconiaceae and Sapin-daceae and flowers of Araceae, Arecaceaeand Clusiaceae were also ingested by white-lipped peccaries (Altrichter et al., 2000;Beck, 2005).
Fruit-eating rodents
Most caviomorphs in the Guianas are rela-tively large-bodied, dedicated seed-eaters,while myomorphs are smaller and tend tobe more omnivorous (Eisenberg, 1989 andreferences therein). In Trinidad, Rankin(1978) found that seeds of a Guianan tree,Clathrotropis brachypetala (Fabaceae)(hereafter Clathrotropis), contained signifi-cant quantities of the known toxicants,anagyrine and cytisine. Oral administrationof Clathrotropis extract was fatal to miceand Rankin (1978) suggested that, despiteits high average protein (15.8%), lipid(20.4%) and moisture (82.2%) content, thesecondary chemicals render Clathrotropisan undesirable resource. She found thatattack on Clathrotropis was the lowest offive species studied, though attack wasmonitored for only less than a month, and itis clear that caviomorph rodents may turnto large, persistent seeds of species, likeClathrotropis, during periods of resourcescarcity (Hammond et al., 1999).Interestingly, seeds of the congener, C.macrocarpa, are heavily attacked inGuyana (Hammond et al., 1992) and con-sumed or scatterhoarded by agouti individ-uals in 20 × 20 m paddocks, despite theavailability of poorly defended resources,such as coconut (M. Swagemakers and J.van Essen, personal communication).Uncooked beans (Phaseolus vulgaris,Fabaceae) contain high concentrations oftoxic phytohemagglutinins (lectins) (Janzenet al., 1976a) and are fatal to the myomorphrat Liomys in Costa Rica (Janzen, 1981a), yet
Rainforest Vertebrates and Food Plant Diversity 247

are readily consumed by the caviomorphagouti in Guyana (D. Hammond et al.,unpublished data). In French Guiana, how-ever, the common rice rat Oryzomys capito(Muridae) and spiny rat Proechimys spp.(Echimyidae) both consumed the seeds ofmost species offered while in captivity(Guillotin, 1982a; see also Adler, 1995).
Information on the diet of free-rangingred-rumped agoutis is vague and anecdotal(e.g. for congener D. punctata, Smythe et al.,1982; Sabatier, 1983; van Roosmalen, 1985).Using different sources and observations inPanama and French Guiana (Smythe, 1970;Sabatier, 1983, P.-M. Forget, personal obser-vation), however, one may establish a pre-liminary list of 37 plant families as the basisof the agouti diet in the Guianas (seeAppendix 4.2). This is also true for the paca(Cuniculus paca), which feeds upon 21plant families in Central America (Smytheet al., 1982; Beck-King et al., 1999).
Similar to granivorous birds, many ter-restrial rodents are wholly dependent uponthe type and quantity of fruitfall. In manycases, these rodents profit from the disper-sal of seeds by flying and non-volant, arbo-real mammals, especially where theseresources may not be available due toabsence of parent trees within their limitedhome ranges (Hammond et al., 1999). Thehome ranges of pacas and agoutis areunusually small in comparison to theirrespective body sizes (1.0–5.5 kg and 6–14kg) and the immigration of resourcesthrough frugivore dispersal may play a cru-cial role if the seed production within theirhome ranges is insufficient to meet basemetabolic requirements throughout the year(e.g. Smythe et al., 1982; Beck-King et al.,1999). If fat reserves (Smythe, 1970) andhoarded seeds (Smythe et al., 1982) areinsufficient to meet demands during peri-ods of resource scarcity in pacas andagoutis, respectively, then they may shift toalternate resources such as insects (spinyrats, agoutis: Guillotin, 1982a,b; Henry,1994a), lizards (agoutis: R. Thomas, per-sonal communication) and/or seedlings(pacas, agoutis: Smythe et al., 1982) whenseeds and fruit are scarce.
Little is known of the three squirrel
species that are expected to occur inGuianan forests, and a large number ofarboreal and terrestrial rats and mice(mainly Muridae) have yet to be studied inany great detail. Information concerning thefeeding ecology of the long-haired, prehen-sile-tailed porcupine, Coendou prehensilis(Erethizontidae) is scant (but see Husson,1978). Most of these rodents are relativelysmall in size and the cumulative impact ofthese groups upon plant regenerationremains unclear.
Other plant-eating terrestrial mammals
Several neotropical carnivores, such as thetayra (Eira barbara) and the SouthAmerican coati (Nasua nasua) are alsoknown to consume fruits (Emmons andFeer, 1990; Feer et al., 2001b), most of theavailable information being from BarroColorado Island, Panama. On BarroColorado Island, both the tayra and CentralAmerican coati (N. narica) consumeDipteryx panamensis fruits in the dry sea-son (Bonaccorso et al., 1980; P.-M. Forget,personal observation) and Spondias mom-bin in the wet season (Anacardiaceae)(Gompper, 1995). Important resources ofcoatis include palm fruit (Attaleabutyracea, formerly Scheelea zonensis),Ficus insipida (Moraceae) and Tetragastrispanamensis (Burseraceae). Overall, coatiswill consume fruits from 54 species in 27plant families on BCI (Gompper, 1994).Though there are eight to ten non-felinespecies of carnivores found commonlythroughout Guianan tropical forests, next tonothing is known about their ecology,dietary habits and the extent to which theymay influence forest dynamics (seeTerborgh, 1988).
Birds
Snow (1981) described tropical frugivorousbirds as: (i) endozoochorous seed-dis-persers; (ii) seed-predators; or (iii) scatter-hoarding dispersers (e.g. jays: Vander Wall,1990), though the last type is not known to
248 P.-M. Forget and D.S. Hammond

occur in the neotropics. In this section, onlythe first group will be discussed, the secondbeing developed in the section on seed pre-dation.
According to Snow (1981), the mostimportant resources for avian fruit special-ists are found in the Annonaceae,Burseraceae, Lauraceae, Melastomataceae,Myristicaceae and Rubiaceae. Studies offrugivorous birds in the Guianas have doc-umented the dietary breadth of many com-mon terrestrial and canopy frugivores.Erard et al. (1991) and Théry et al. (1992)analysed the stomach contents of 76 com-mon trumpeters (Psophia crepitans, here-after Psophia, Psophiidae) and 43 marailguans (Penelope marail, hereafter Penelope,Cracidae), respectively. Despite comparablebody weights (1071 vs. 990 g, respectively),the diet of trumpeters is more diverse thanthat of marail guans: 55 species in 21 fami-lies versus 24 species in 17 families.Interestingly, dietary overlap between thetwo species in the dry season, i.e. fromAugust to November when fruitfall is at itslowest, is only important with regard to theuse of two important resources, Eugeniacoffeifolia (Myrtaceae) and Euterpe olera-caea (Palmae) (Erard and Théry, 1994).Trumpeters are also able to subsist oninvertebrates during this season (Théry etal., 1992). The largely ground-dwellingtrumpeters find most of their food on theforest floor, moving into the forest canopyonly to sleep or to hide from predators. Incontrast, marail guans actively feed in thecanopy. The contrast in forage zone prefer-ence and the concomitant differences inresource availabilities between forestcanopy and floor might explain, in part,why trumpeters exploit more fruit speciesthan marail guans and the apparent parti-tioning of habitat resources (Théry et al.,1992).
Erard et al. (1989) observed the cock-of-the-rock (Rupicola rupicola) while it wasnesting, and identified fruit species thatwere taken to young. They completed theirlist by observing females during foragingbouts. As a result, 65 species in 31 familieswere identified. Species in the Annonaceae(Pseudoxandra cuspidata), Burseraceae
(Protium apiculatum) and Lauraceae(Ocotea spp.) accounted for more than half(52.9%) of all feeding observations.Supplementary information on the biologyand diet of the related Peruvian cock-of-the-rock (R. peruviana) are available inBenalcázar and Silva de Benalcázar (1984),completing the list of plant families eatenby these birds.
Another important bird group in theGuianas, the Pipridae, is mainly composedof specialized frugivores (Snow, 1981;Théry, 1990b; see also Théry, 1997). Pipridsare often the most abundant (or most easilynetted) birds in the neotropics, accountingfor the largest number of individuals caughtat a variety of sites in Central and SouthAmerica (Karr et al., 1990). In FrenchGuiana, Théry (1990b) showed that a com-munity of seven piprids exploits a total of20 and 22 species of Melastomataceae(Miconia, Clidemia, Henrietella, Loreyamespiloides) and Rubiaceae (Psychotria),respectively, two families that are typical ofthe early phase of regrowth following natu-ral and anthropogenic disturbance events(see also Poulin et al., 1999). Other plantscommonly consumed included species inthe Flacourtiaceae (Laetia procera),Goupiaceae (Goupia glabra), Moraceae(Ficus guianensis) and Ulmaceae (Tremaguianensis), all being typically long-lived,early colonizers after disturbance in theGuianas. The most complete informationon piprid diet was collected by Snow(1962a,b) in Trinidad for the black andwhite manakin Manacus manacus and thegolden-headed manakin Pipra erythro-cephala, two species which are also presentin the Guianas (Théry, 1990b, 1992). Directobservations of feeding birds in addition tothe collection of regurgitated seeds frombelow nests, from display grounds and fromtrapped birds, allowed Snow (1962a) toestablish a list of 73 species belonging to 27plant families. Fruits from the Rubiaceaeand Melastomataceae were the most repre-sentative families, with 17 and 15 species,respectively, while other families were rep-resented by 1–4 species (14 families withonly one species). In addition, at least 43species in 18 plant families were consumed
Rainforest Vertebrates and Food Plant Diversity 249

by the golden-headed manakin (Snow,1962b), 15 of them also being eaten by blackand white manakins (Snow, 1962a). InTrinidad, Snow (1964) found that 19species of light-demanding Miconia(Melastomataceae) formed a large part ofthe diet of several manakin species, alsoknown to occur in Guianan forests, thesebirds efficiently dispersing seeds into gapsand disturbed areas. In comparison, thered-capped manakin (Pipra mentalise) andthe golden-collared manakin (Manacusvitellinus), studied near Barro ColoradoIsland, Panama were recorded as consum-ing 62 species in 23 families, most of thesebeing light-demanding epiphytes (e.g.Anthurium spp.) and short (e.g. Palicoureaelliptica) or long-lived (e.g. syn. Scheffleramorototoni) pioneers (Worthington, 1982).Together, data from Trinidad and Panamagive 40 plant families that may be expectedto provide food for piprids (Appendix 4.2).
Members of the Cotingidae are amongthe most frugivorous bird species in theneotropics (Erard et al., 1989) and consti-tute the most speciose frugivorous birdgroup in the tropics. The relatively largebody size and gape width of many cotingidsmeans that they are able to feed on many ofthe largest fruits which other smaller, sym-patric frugivores, such as manakins, mustforego. A particularly important componentof the large avian frugivore diet is fruitsfrom Ocotea and Nectandra (Lauraceae),probably due to the combination of a largediameter (Wheelwright, 1985) and rela-tively high fat and protein content of theirpericarp (e.g. Snow, 1981). Lauraceae con-stituted 74% of the seeds and fruits col-lected below the nest of a bearded bellbird(Procnias averano) in Trinidad during thefledging period (May–June); lauraceousfruits, such as Ocotea oblonga andCinnamomum elongatum are known tohave a relatively high nutritional value(Snow, 1970). Snow (1971) noted that thepurple-throated fruit-crow (Querula purpu-rata) consumed eight different kinds offruits in the wet season (January–April) inGuyana, 90% of the feeding records con-sisting of only four species (Didymopanax(=Schefflera) morototoni, Araliaceae;
Guarea trichiloides, Meliaceae; Hirtellasp., Chrysobalanaceae; an unidentifiedLauraceae). Fruit of Cecropia sp.(Moraceae) were also consumed and thelargest seed ingested was a lauraceousspecies 2.7 × 1.5 cm. Snow (1972) listed 37species of seeds found beneath the perchesof the lek-forming capuchinbird(Perissocephalus tricolour) in Guyana andTrinidad, of which 12 species were foundin the Lauraceae (lek: an assembled groupor assembly area for communal courtshipdisplay). Many of the largest, fleshy fruits inthese genera can be found in the Guianas(e.g. in Guyana: Nectandra grandis, 12.2 gfresh weight; Endilicheria chalisea, 14.3 g;Ocotea sp. nov., 9.8 g) and the unusuallyhigh number of cotingas (10 species),including large numbers of several of thelargest-bodied species (3 of 11 species >250g body weight), co-occurring in the KanukuMountains was duly noted as one of themost prominent features of the area byParker et al. (1993). Cotinga communities atMabura Hill (ter Steege et al., 1996),Iwokrama (Ridgely and Agro, 1999) andNouragues (Thiollay, 1994) also appear tobe relatively rich, and are dominated by thescreaming piha, Lipaugus vociferans(Cotingidae). The bearded bellbird(Procnias averano) is one of the largestcotingids and most abundant componentsof the Brownsberg avifauna in Suriname(Reichart, 1991). Trail and Donahue (1991)observed the Guianan red cotinga(Phoenicircus carnifex) in the early wet sea-son (December–March) at Brownsberg andreport casual data on their diet whichincludes Myrtaceae (Eugenia sp.),Clusiaceae (Clusia sp.), Melastomataceae(Miconia sp.) and an unidentifiedLauraceae. Though many cotingids enjoy apan-Amazonian distribution, severalspecies, including the screaming piha,appear to be particularly abundant atGuianan sites compared to other neotropi-cal regions. As part of ConservationInternational’s Rapid AssessmentProgramme, team-member Ted Parker iden-tified 11 cotingids and only six of thesmaller-bodied piprids during the KanukuMountains survey, whereas lowland forest
250 P.-M. Forget and D.S. Hammond

site surveys in southwestern Amazoniayielded seven cotingids and 10 piprids atTambopata, Peru and five and seven,respectively, at Alto Madidi, Bolivia (Parkeret al., 1991, 1993; Foster et al., 1994).
Fish
The vegetarian diet of Amazonian fish iswell-documented and examples of icthy-ochory abound. Several species ofEuphorbiaceae and Gnetum venosum(Gnetaceae) are regularly transported byfish during the high-water season in varzeaforest (Kubitski, 1985). In the Guianas,however, little published information existsregarding fish dietary selection and seeddispersal in particular. Beebe (1925) foundplant parts in the stomachs of 35% of the 77species of fish examined, but only one ofthese, Doras granulosus (syn. Pterodorasgranulosus), was found to have been feed-ing on seeds at the time. One-third of thespecies feeding on plant parts were exclu-sively vegetarian, mainly in the familySerrasalmidae (subfamily Myleinae). Thesespecies feed mainly on Podostemaceaewhich grow in the shallow waters along thewaters edge. The true Brazilian pacu,Myleus rhomboidalis, feeds on the hardseeds of the palms Euterpe oleracea(49–69% of items) and Mauritia flexuosa,other large-seeded species such as Dipteryxsp. (Fabaceae), Carapa guianensis (Meli-aceae), Virola surinamensis, Macrolobiumsp. (Caesalpiniaceae), Psidium sp. (Myr-taceae) and Inga spp. (Mimosaceae) duringthe wet season and turns to the aquaticplants, Mourera fluviatilis and Apinagiarichardiana (Podostemaceae), when thewaters recede (Boujard et al., 1990;Planquette et al., 1996). However, only thesmall seeds of the common climber,Passiflora laurifolia, were found whollyintact in stomachs from individuals caughtin the Approuague and Sinnamary Riversin French Guiana (Boujard et al., 1990). Incontrast, the diet of the congeneric, Myleusternetzi, appears to consist mainly ofallochthonous leaves, from such riverinespecies as Inga meissneriana and Cydista
aequinoctialis (Bignoniaceae) (Boujard etal., 1990).
More substantial data on the diet ofherbivorous species inhabiting the rivers ofthe Guianas can be gleaned from studies ofthe Rio Negro aquatic community in south-ern Venezuelan Guayana and Brazil(Goulding et al., 1988). Along the course ofthis enormous blackwater river, there are 79species of fish which feed on the fruits andseeds of riverine plants, nearly 28% ofthese also feeding on the leaves and flowersof woody plants. Herbaceous, mainlyaquatic, vegetation also figures prominentlyin the community dietary intake, nearly 50species regularly feeding on the roots,stems and leaves of plants in the familiesPodostemaceae, Araceae, Lentibulariaceae,Pontederiaceae, Salviniaceae and Poaceae.The berries of Montrichardia arborescens(muku-muku), a giant, semi-woody aroidtypical of most Guianan waterways are reg-ularly consumed by Rio Negro fish.
Fish in the Rio Negro consume theseeds and fruits of 94 genera in 32 families,though only a fraction of these appear to bedefecated or regurgitated intact (Table 4.7).
Rainforest Vertebrates and Food Plant Diversity 251
Table 4.7. Fish food and the potential for dispersalin the Rio Negro based on whether seed materialfound in stomach contents was intact or had beenmasticated. Adapted from Goulding et al. (1988).Note how the seeds of several small-seededfamilies (*) always remain intact while many of thetypically large-seeded families are mainly brokendown (‡).
Family No. of genera Masticated Intact
Annonaceae 2 + +Arecaceae‡ 3 + +Bignoniaceae 6 +Chrysobalanaceae 3 +Euphorbiaceae 6 + +Lauraceae 1 + +Lecythidaceae‡ 1 +Leguminosae‡ 16 +Malphigiaceae 4 +Melastomataceae* 3 +Moraceae* 3 +Myristicaceae 1 +Polygonaceae 2 + +Quiinaceae 1 + +Rubiaceae* 11 + +Simaroubaceae 1 + +

Foremost among these food items are palmfruits, which represent an important dietaryitem for the catfish Phractocephalus spp.(Pimelodidae) and Megaladoras spp.(Doradidae) as well as numerous large-bodied characins and serrasalmids, mostnotably in the genera Hemigrammus,Metynnis, Moenkhausia and Myleus. Therole of fish in the dispersal of palms alongrivers is exemplified by the success of theaggressive colonizer Astrocaryum jauaryalong newly formed point-slope bardeposits (Piedade, 1985). Other importantwoody plant families include theChrysobalanaceae (Couepia, Licania,Hirtella), Leguminosae and Myrtaceae(Eugenia, Psidium, Myrcia, Myrciaria).Plant matter is a relatively importantcontributor to the energetic needs of theRio Negro fish community, but this is sea-sonally dependent. Species which feed onterrestrial plant parts, typically during thewet season, turn to aquatic vegetation whenthe river level lowers (Goulding et al.,1988).
Lizards and Turtles
Very few reptiles and no amphibians havebeen recorded as feeding on fruits or othervegetable matter in the Guianas, which isconsistent for South American herpeto-faunas in general (Duellman, 1990). Beebe(1925) found that of the 30 lizard speciesinhabiting Kartabo, Guyana, only one,Iguana iguana, was strictly vegetarian andonly half the diet of another iguanid,Polychrus marmoratus, was found to con-sist of berries and leaves. The diet of themore common Guianan macroteiid,Cnemidophorus lemniscatus lemniscatus,consisted of only 2% fruit and 1% flowermaterial. Several other species, notablybasaliscs, Basaliscus spp., are known tofeed on fruit and other plant material butare rare, introduced or absent from Guiananforests. Of the ten species of turtle known toinhabit Guianan forestlands, the most fru-givorous is the common, mainly terrestrial,red-footed tortoise Geochelone denticulata(Testudinidae), which feeds on leaves,
fruits, seeds (up to 1.5 × 1.0 cm in size) andinsects on the forest floor, and its con-generic sympatric, G. carbonaria, which ismore frequently found along savannaedges. Faeces of the Amazon mud turtle,Kinosternon scorpioides (Kinosternidae),were found to contain fragments of palmfruits in French Guiana and Phrynops nasu-tus (Chelidae) was observed to consume thefruits of the common aroid climber,Philodendron dolimoesense (Métrailler andLe Gratiet, 1996), but few systematic stud-ies of reptilian dietary patterns have beenundertaken in the Guianas. The giantAmazon river turtle, Podocnemis expansa(Pelomedusidae), which is thought to occurin Guyana and whose herbivorous relativeP. unifilis is found throughout the Guianas,has a diet consisting largely of fruit(80–90%) and leaves and stems (4%)(Ojasti, 1967). Typically Guianan taxafound in the diet of P. expansa includeCampsiandra comosa (Caesalpiniaceae), acommon riverine species in centralGuyana, Bactris sp., Astrocaryum spp.,Micropholis sp. (Sapotaceae), Symphoniaglobulifera, Simaba guianensis and Heveaspp. (Euphorbiaceae) (Best, 1984).
Plant–Vertebrate Relationships:Dispersal vs. Predation
Plant pollination
By bats
Bats that feed on flower nectar(Glossophaginae) are represented by at leastseven species in the Guianas (Emmons andFeer, 1990; Brosset et al., 1996; Smith andKerry, 1996; Simmons and Voss, 1998)(Appendix 4.1). Several species of long-tongued bats (e.g. Glossophaga soricina) arespecific to edge habitats and are rarelyfound in primary forest, unless this is dis-sected by roads linking its interior to moreopen habitats such as littoral savannas(Brosset et al., 1996). There are almost nostudies on flower–bat interactions in theGuianas, and most information on neotrop-ical glossophaginids was reviewed by
252 P.-M. Forget and D.S. Hammond

Heithaus (1982). Any information on theglossophaginid bats inhabiting the Guianasis currently based on the few studies ofthese species carried out in other neotropi-cal countries, mainly in Central America
(see also Heithaus et al., 1974,1975).
Typical bat-pollinated flowers have sta-mens, pistil and nectar that are fullyexposed (shaving brush or penicillateeffect), often positioned away from foliage,open at night, often without colour, have astale, fermenting odour, and produce copi-ous pollen (Heithaus, 1982). In the Guianas,many Bombacaceae, such as Pachira aquat-ica (Fig. 4.1), and Caesalpiniaceae andCaryocaraceae are likely to be pollinated bybats. The flowers of Eperua falcata (Fig.4.2), which hang at the end of a long pedi-cel, are often visited by Anoura spp. andLichonycteris spp. (P. Charles-Dominique,personal communication) as are the lightyellow, capitulate inflorescences of theemergent tree, Parkia pendula(Mimosaceae), visited by G. soricina at
Rainforest Vertebrates and Food Plant Diversity 253
Fig. 4.1. Numerous elongated stamens in thebat-polinated riverine tree, Pachira aquatica(Sterculiaceae). Photo P.-M. Forget.
Fig. 4.2 Pendulate flower position in the bat-pollinated Eperua falcata (Caesalpiniaceae). Photo P.-M.Forget.

Mabura Hill, Guyana (D. Hammond, per-sonal observation; for a focused look atParkia spp., see also Hopkins and Hopkins,1983).
By other mammals
Apart from bats, at least 13 species of non-flying, frugivorous mammals may consumeflowers and pollen as alternative resourcesto fruits (e.g. Prance, 1980; Janson et al.,1981; van Roosmalen, 1985; Julien-Laferrière and Atramentowicz, 1990).Because visiting animals do not damageflowers, Janson et al. (1981) postulated thatthey might act as pollinators. Plants thatwere visited by non-flying mammals in thedry season in Peru include species in thefamily Bombacaceae (Ceiba pentandra,Quararibea cordata, Ochroma pyramidale),Combretaceae (Combretum fruticosum) andFabaceae (Erythrina spp.). The night mon-key Aotus trivirgatus, marsupials(Caluromysiops irrupta, Didelphis marsupi-alis, Caluromys lanatus), and procyonids(kinkajou and olingo, Bassaricyon alleni)were observed foraging at flowers of Q. cor-data (Janson et al., 1981). Several monkeys,including common squirrel monkeys(Saimiri sciureus), brown capuchins, Cebusapella (hereafter Cebus) and spider mon-keys (A. paniscus) exploited the infructes-cence of C. pentandra, their heads coveredwith pale yellow pollen as a result (Jansonet al., 1981). The authors also casuallyobserved other Amazonian monkeys feed-ing on the flowers of species in theAnacardiaceae, Bignoniaceae, Clusiaceaeand Moraceae. The flowers and nectar ofSymphonia globulifera (hereafterSymphonia) (Clusiaceae) are a preferredfood item for many non-flying mammalsthroughout the neotropics (e.g. FrenchGuiana: Julien-Laferrière andAtramentowicz, 1990; Brazil: Peres, 1994b).
In French Guiana, Caluromys philan-der L., Philander opposum L., Didelphismarsupialis L. (hereafter Caluromys,Philander, Didelphis), Marmosa cinereaand Potos were also observed feeding onnectar, especially when fruit was scarce inthe September–November dry season
(Charles-Dominique et al., 1981; Julien-Laferrière and Atramentowicz, 1990). Forinstance, Caluromys visits flowers of Ingathibaudiana, I. ingoides (Mimosaceae),Hymenaea courbaril (Caesalpiniaceae),Eperua falcata (Caesalpiniaceae),Symphonia, and many other unidentifiedplant species whose anthers were foundamong the stomach contents (Charles-Dominique et al., 1981; Julien-Laferrièreand Atramentowicz, 1990). A closelyrelated species, C. lanatus, forages at flow-ers of Quararibea cordata (Bombacaceae) inPeru and Ecuador (Janson et al., 1981), andGribel (1988) observed that flowers ofPseudobombax tomentosum (Bomba-caceae) were also visited by C. lanatus incentral Brazil.
By birds
Bittrich and Amaral (1996) studied the pol-lination biology of Symphonia in Manaus,Brazil. The flowers of this typicallyGuianan tree were mainly pollinated byhummingbirds, the blue-chinned sapphire,Chlorestes notatus, and the fork-tailedwoodnymph, Thalurania furcata. Othernectar-feeding birds included flocks of theicterid Cacicus cela. In the Guianas, polli-nation by birds so far is poorly known. In arecent study Gill and colleagues (1998)observed birds visiting Symphonia globulif-era flowers in central French Guiana: thesemostly belong to the family Thraupidae, i.e.the black-faced dacnis, blue dacnis, greenhoneycreeper, purple honeycreeper andred-legged honeycreeper. Other casual visi-tors feeding on floral nectar included threetanagers, two Parulidae, the bananaquit andthe waved woodpecker, with humming-birds only infrequently and briefly visitingflowers. Given the accessibility of the axil-lary inflorescences to birds, the flowerstructure and colour (staminal tube, red,glued pollen) and the diurnal availability ofsugar-poor nectar, Gill et al. (1998) wereprompted to suggest that Thraupidae arethe most important pollinators ofSymphonia globulifera, whereas humming-birds are merely incidental visitors or evennectar robbers.
254 P.-M. Forget and D.S. Hammond
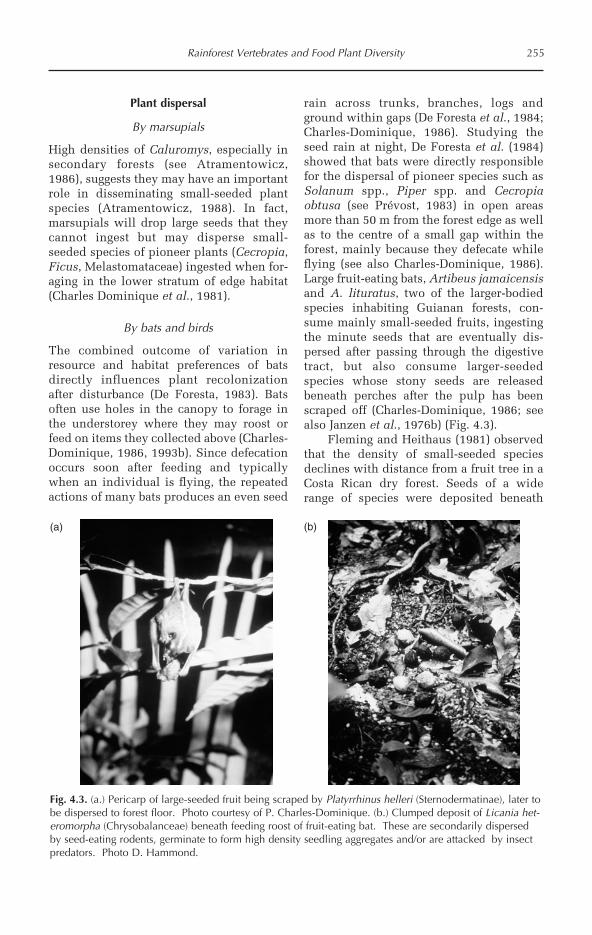
Plant dispersal
By marsupials
High densities of Caluromys, especially insecondary forests (see Atramentowicz,1986), suggests they may have an importantrole in disseminating small-seeded plantspecies (Atramentowicz, 1988). In fact,marsupials will drop large seeds that theycannot ingest but may disperse small-seeded species of pioneer plants (Cecropia,Ficus, Melastomataceae) ingested when for-aging in the lower stratum of edge habitat(Charles Dominique et al., 1981).
By bats and birds
The combined outcome of variation inresource and habitat preferences of batsdirectly influences plant recolonizationafter disturbance (De Foresta, 1983). Batsoften use holes in the canopy to forage inthe understorey where they may roost orfeed on items they collected above (Charles-Dominique, 1986, 1993b). Since defecationoccurs soon after feeding and typicallywhen an individual is flying, the repeatedactions of many bats produces an even seed
rain across trunks, branches, logs andground within gaps (De Foresta et al., 1984;Charles-Dominique, 1986). Studying theseed rain at night, De Foresta et al. (1984)showed that bats were directly responsiblefor the dispersal of pioneer species such asSolanum spp., Piper spp. and Cecropiaobtusa (see Prévost, 1983) in open areasmore than 50 m from the forest edge as wellas to the centre of a small gap within theforest, mainly because they defecate whileflying (see also Charles-Dominique, 1986).Large fruit-eating bats, Artibeus jamaicensisand A. lituratus, two of the larger-bodiedspecies inhabiting Guianan forests, con-sume mainly small-seeded fruits, ingestingthe minute seeds that are eventually dis-persed after passing through the digestivetract, but also consume larger-seededspecies whose stony seeds are releasedbeneath perches after the pulp has beenscraped off (Charles-Dominique, 1986; seealso Janzen et al., 1976b) (Fig. 4.3).
Fleming and Heithaus (1981) observedthat the density of small-seeded speciesdeclines with distance from a fruit tree in aCosta Rican dry forest. Seeds of a widerange of species were deposited beneath
Rainforest Vertebrates and Food Plant Diversity 255
(a) (b)
Fig. 4.3. (a.) Pericarp of large-seeded fruit being scraped by Platyrrhinus helleri (Sternodermatinae), later tobe dispersed to forest floor. Photo courtesy of P. Charles-Dominique. (b.) Clumped deposit of Licania het-eromorpha (Chrysobalanceae) beneath feeding roost of fruit-eating bat. These are secondarily dispersedby seed-eating rodents, germinate to form high density seedling aggregates and/or are attacked by insectpredators. Photo D. Hammond.

roosts, often in clumps. In French Guiana,with a home range of around 8–13 ha, thelittle fruit bats Rhinophylla pumilio dis-perse seeds at distances ranging from 100 to300 m. The seed rain generated by thisspecies is mainly composed of Evodianthusfunifer seeds, which are mainly dispersedin humid valleys as opposed to adjacent,drier ridges (Cockle, 1997).
Dispersal of small seeds by birds is alsoimportant when remnant trees allow themto perch in gaps or clearings during thedefecation process (Théry, 1990a).Consequently, both bats and birds (seeabove) contribute to the seed rain and thecontent and density of the seed bank, whichare characterized by bat/bird-dispersedspecies such as Cecropia spp. and Solanumspp. in secondary forests and degradedareas (Holthuijzen and Boerboom, 1982; DeForesta and Prévost, 1986), and Araceae,Cyclanthaceae and Melastomataceae inmature forests (Cockle, 1997; Krijger et al.,1997). The contribution of small-seededbat/bird dispersal to regeneration is nor-mally only important after the canopy isopened by either single or multiple treefalls(Riéra, 1985) or large, anthropogenic distur-bances, such as clear-cut logging operations(De Foresta, 1983), or along forest accessroads (D.S. Hammond, unpublished data).However, for some small-seeded, climbingspecies dispersed by bats, a closed canopyforest with a wide range of tree trunk sizesavailable for support provides the best con-ditions for establishment and reproduction(Cockle, 1997).
Though the relationships between fru-givorous bats and small-seeded species arewell described from both plant (De Foresta,1983; De Foresta et al., 1984; see alsoFleming and Heithaus, 1981; Fleming et al.,1985; Cockle, 1997) and animal (Charles-Dominique, 1991, 1995; Cockle, 1997;Charles-Dominique and Cockle, 2001; seealso Fleming et al., 1972) perspectives,scant literature is devoted to the role oflarge fruit-bats on the recruitment of large-seeded species which are typical ofGuianan rainforests (Hammond and Brown,1995). This group includes Andira spp. andDipteryx odorata (Fabaceae), Bocoa proua-
censis, Swartzia spp. (Caesalpiniaceae),Eschweilera spp. (Lecythidaceae),Symphonia globulifera (Guttiferae),Couepia spp., Parinari spp. and Licaniaspp. (Chrysobalanaceae) and Caryocarglabrum (Caryocaraceae). De Foresta et al.(1984) describe how a large fruit-eating batA. lituratus can disperse the seed of S. glob-ulifera up to 200 m into secondaryregrowth. Such seed dispersal by bats ismost likely responsible for the recuitmentof S. globulifera as well as that of otherlarge-seeded, bat-dispersed species in thefamilies Chrysobalanaceae (Licania spp.)and Lecythidaceae (Lecythis spp. andEschweilera micrantha) in areas of forestclearcut nearly 15 years ago (Larpin,1989).
Greenhall (1965) observed that thelarge spear-nosed bat, Phyllostomus hasta-tus, fed upon the fleshy aril attached to thelarge seeds of the common Guianan sapu-caia nut tree, Lecythis zabucajo. He alsonoted that piles of seeds developed belowthe roosts of the large spear-nosed bat P.hastatus, but not below those of the largefruit-eating bats A. jamaicensis or A. litura-tus, two other bats large enough to carry thenut. Given the high diversity of Lecythisspp. and other bat-adapted fruit species inGuianan rainforests, and given that thesemay be either eaten or secondarily dis-persed by scatterhoarding rodents (P.-M.Forget, personal observation), as is the casewith Dipteryx panamensis in Panama (seeForget, 1993), the ultimate effect of bat seeddispersal on the recruitment of many large-seeded species in the Guianas is potentiallyof great consequence, yet still largelyunknown.
By monkeys
Despite their less diverse diet, spider mon-keys act as the main seed dispersers inGuianan forests, in terms of both the num-ber and the diversity of seeds ingested, andthe total forest area over which seeds aredispersed (van Roosmalen, 1985; Guillotinet al., 1994; Simmen and Sabatier, 1996; seereview in Simmen et al., 2001). AtVoltzberg, Suriname, van Roosmalen (1985)
256 P.-M. Forget and D.S. Hammond

recorded that 81%, 6% and 14% of 171species (in 58 families) were dispersed,dropped beneath trees and predated byblack spider monkeys, respectively. With ahome range of 225 ha, encompassingmostly high rainforest habitat (>90% ofsightings), spider monkeys can carry seedsinternally for more than 1 km and thendeposit these (72%) beneath both conspe-cific and allospecific trees (>25 m height)while travelling through the canopy (vanRoosmalen, 1985; see also Norconk andKinzey, 1994; Forget and Sabatier, 1997). Incomparison, Julliot (1996b) observed thathowler monkeys in Nouragues were capa-ble of carrying seeds internally over a dis-tance of 550 m, but more typicallydispersed seeds at a distance of 255 m fromthe parent tree. Of the 96 species consumedby howler monkeys at Nouragues, 94%were dispersed via defecation, oftenencased in a foliage-rich dung, anddeposited beneath sleeping areas (60% ofspecies) (Julliot, 1994; see also Julliot,1997). The concentrated deposition ofseeds beneath trees by both howler mon-keys and spider monkeys (Julliot et al.,2001) often creates localized patches ofhigh seed density which are then subse-quently preyed upon or scatterhoarded inlarge numbers by various ground-dwellingvertebrates (P.-M. Forget, personal observa-tion; F. Feer, personal communication).The largest seeds dispersed internally byeither spider monkeys or howler monkeysin Suriname and French Guiana arePlatonia insignis (4 × 2 cm, Clusiaceae; vanRoosmalen, 1985), Pouteria laevigata (4 ×2.5 cm, 9 g fresh weight, Sapotaceae; Julliot,1996a; F. Feer, personal communication)and Virola kwatae (up to 4 × 2 cm, 7 g freshweight, Myristicaceae; Sabatier, 1983;Forget and Sabatier, 1997).
In comparison, brown capuchins eatfruit pulp from 135 species (in 42 families),dispersing the smaller seeds of 113 speciesand discarding the larger-seeded species(14 families) beneath the parent trees(Zhang, 1994). The combination of a typicalhome range of 355 ha and daily forays aver-aging 2.3 km means that capuchins disperseseeds of many small-seeded species over
considerable distances in high forest. Seedsare often deposited below canopy trees, butunlike their larger primate cousins,capuchins will forage in the lower strata,especially during intermediate periods offruit availability in the upper strata (Zhang,1994).
Given their preference for disturbedhabitats, their limited gut volume and theirrelatively small body size, the smallerSaguinus are most likely dispersers of smallseeds of light-demanding ruderal (e.g.Convolvulaceae, Curcurbitaceae, Melas-tomataceae) and long-lived pioneer (e.g.Goupia glabra, Celastraceae) species in theGuianas. The most frequently (annualoccurrence greater than 10%, N=69 seeds)observed species in stomach contents(N=40) were Pourouma sp. (Cecropiaceae)in October–January (dry to early wet sea-son), and an unidentified Gesneriaceae andInga sp. (Mimosaceae) in February–September (wet to early dry season) (Pack etal., 1998).
There is no clear evidence that passagethrough the digestive tract increases germi-nation success of seeds ingested and defe-cated by spider monkeys, howler monkeysor capuchins (Julliot, 1994; Zhang, 1995;P.-M. Forget, personal observation).Moreover, seed dispersal effectiveness candiffer between monkey species based on thenumber of dispersed seeds which actuallyestablish (Zhang and Wang, 1995b).However, it is difficult to predict the fate ofseeds dispersed in monkey faeces since thepatterns of deposition may vary accordingto season, the distance between fruitingtrees which are visited during a foray, thediversity of plant parts consumed and theactivity levels of these arboreal frugivores atthe time of consumption.
By carnivores
Kinkajou disperse seeds of a much broadersize range (Julien-Laferrière, 1999a). Giventhe breadth of their diet, the importance ofkinkajou as a seed disperser is probablyunderestimated due to their highly noctur-nal habit. In forests where populations ofdiurnal primates have been severely
Rainforest Vertebrates and Food Plant Diversity 257
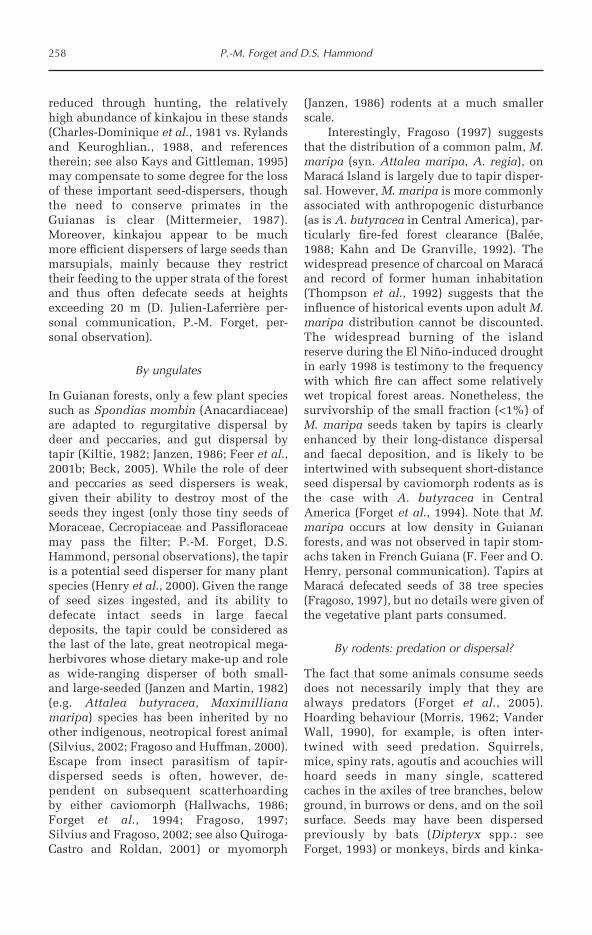
reduced through hunting, the relativelyhigh abundance of kinkajou in these stands(Charles-Dominique et al., 1981 vs. Rylandsand Keuroghlian., 1988, and referencestherein; see also Kays and Gittleman, 1995)may compensate to some degree for the lossof these important seed-dispersers, thoughthe need to conserve primates in theGuianas is clear (Mittermeier, 1987).Moreover, kinkajou appear to be muchmore efficient dispersers of large seeds thanmarsupials, mainly because they restricttheir feeding to the upper strata of the forestand thus often defecate seeds at heightsexceeding 20 m (D. Julien-Laferrière per-sonal communication, P.-M. Forget, per-sonal observation).
By ungulates
In Guianan forests, only a few plant speciessuch as Spondias mombin (Anacardiaceae)are adapted to regurgitative dispersal bydeer and peccaries, and gut dispersal bytapir (Kiltie, 1982; Janzen, 1986; Feer et al.,2001b; Beck, 2005). While the role of deerand peccaries as seed dispersers is weak,given their ability to destroy most of theseeds they ingest (only those tiny seeds ofMoraceae, Cecropiaceae and Passifloraceaemay pass the filter; P.-M. Forget, D.S.Hammond, personal observations), the tapiris a potential seed disperser for many plantspecies (Henry et al., 2000). Given the rangeof seed sizes ingested, and its ability todefecate intact seeds in large faecaldeposits, the tapir could be considered asthe last of the late, great neotropical mega-herbivores whose dietary make-up and roleas wide-ranging disperser of both small-and large-seeded (Janzen and Martin, 1982)(e.g. Attalea butyracea, Maximillianamaripa) species has been inherited by noother indigenous, neotropical forest animal(Silvius, 2002; Fragoso and Huffman, 2000).Escape from insect parasitism of tapir-dispersed seeds is often, however, de-pendent on subsequent scatterhoardingby either caviomorph (Hallwachs, 1986;Forget et al., 1994; Fragoso, 1997;Silvius and Fragoso, 2002; see also Quiroga-Castro and Roldan, 2001) or myomorph
(Janzen, 1986) rodents at a much smallerscale.
Interestingly, Fragoso (1997) suggeststhat the distribution of a common palm, M.maripa (syn. Attalea maripa, A. regia), onMaracá Island is largely due to tapir disper-sal. However, M. maripa is more commonlyassociated with anthropogenic disturbance(as is A. butyracea in Central America), par-ticularly fire-fed forest clearance (Balée,1988; Kahn and De Granville, 1992). Thewidespread presence of charcoal on Maracáand record of former human inhabitation(Thompson et al., 1992) suggests that theinfluence of historical events upon adult M.maripa distribution cannot be discounted.The widespread burning of the islandreserve during the El Niño-induced droughtin early 1998 is testimony to the frequencywith which fire can affect some relativelywet tropical forest areas. Nonetheless, thesurvivorship of the small fraction (<1%) ofM. maripa seeds taken by tapirs is clearlyenhanced by their long-distance dispersaland faecal deposition, and is likely to beintertwined with subsequent short-distanceseed dispersal by caviomorph rodents as isthe case with A. butyracea in CentralAmerica (Forget et al., 1994). Note that M.maripa occurs at low density in Guiananforests, and was not observed in tapir stom-achs taken in French Guiana (F. Feer and O.Henry, personal communication). Tapirs atMaracá defecated seeds of 38 tree species(Fragoso, 1997), but no details were given ofthe vegetative plant parts consumed.
By rodents: predation or dispersal?
The fact that some animals consume seedsdoes not necessarily imply that they arealways predators (Forget et al., 2005).Hoarding behaviour (Morris, 1962; VanderWall, 1990), for example, is often inter-twined with seed predation. Squirrels,mice, spiny rats, agoutis and acouchies willhoard seeds in many single, scatteredcaches in the axiles of tree branches, belowground, in burrows or dens, and on the soilsurface. Seeds may have been dispersedpreviously by bats (Dipteryx spp.: seeForget, 1993) or monkeys, birds and kinka-
258 P.-M. Forget and D.S. Hammond

jous (Virola spp., Myristicaceae: see Forgetand Milleron, 1991). Only those seedsburied several centimetres deep (e.g.Vouacapoua americana, Caesalpiniaceae:Forget, 1990; Moronobea coccinea: Forget,1991a; Carapa procera, Meliaceae: Forget,1996) or covered by litter (Astrocaryumparamaca, Arecaceae: Forget, 1991b)would be placed in the most favourablemicrosites for recruitment (Forget, 1991a,1994, 1997a), since this increases thechance that they are not recovered later orfound by other rodents and peccaries(Kiltie, 1981). Finally, although they mayultimately consume many cached seedslater on, many may be left to establishunder the favourable microsite conditionscreated through the burial and the local
redistribution of seeds (Feer et al., 2001b;Feer, 1999).
Another understated aspect ofseed–granivore interactions is the notion ofsub-lethal attack. Seeds of many Guianantrees and lianas are capable of germinationand seedling establishment after withstand-ing substantial loss in seed mass(Hammond and Brown, 1998). In manyinstances, the embryo in these seeds is posi-tioned so that the most common feedingmethods employed by vertebrates leave theembryo intact (Fig. 4.4). In some cases, par-tial consumption of seed mass stimulatesgermination (e.g. Clathrotropis brachy-petala), similar to the effect that burial dur-ing caching can have on other species.
Whether a rodent acts as a disperser or
Rainforest Vertebrates and Food Plant Diversity 259
Fig. 4.4. Intact seed of Catostemma commune (Bombacaceae) with fleshy seed coat and subject to vari-ous levels of seed mass loss as a consequence of rodent feeding. Note intact and differentiating embryoat left end of major axis and its persistence despite considerable loss of surrounding storage tissue. PhotoD. Hammond.

predator with respect to any given resourcedepends largely on phylogeny (Forget et al.,1998) and the characteristics which definethe resource base, i.e. (i) how much fruit isavailable over the home range; (ii) how largeis the seed reward; (iii) how toxic are theseeds, especially ungerminated seeds com-pared to those which have germinated; (iv)what is the risk of predation during forag-ing; and (v) how important are food reservesto offspring survival and maternal care.
Once seeds have been released fromthe parent through natural dehiscence orthrough the feeding activities of arborealand flying frugivores, they fall into the for-aging realm of terrestrial granivores, amongwhich rodents such as spiny rats, acouchiesand agoutis are potential secondary seeddispersers. The potential role of rodents inthe regeneration and recruitment of tropicalplants is enormous, given their relativelyhigh densities and reproductive rates. Sincethese animals have relatively small homeranges, the probability of seeds being trans-ported long distances is low, although dis-tances of up to 30–50 m are possible. Ingeneral, seeds will be taken and cachedshort distances (<10–20 m) from the site ofinitial deposition. Because most of the largeseeds (those that offer ample energeticreward and yet can still be handled byrodents) are in the first instance transportedby frugivores such as toucans and largemonkeys that avoid gaps, it is likely thatsuch seeds will be secondarily dispersed inthe understorey, along forest edges, and to alesser degree in the centre of a forest clear-ing if this offers some protection to rodentsfrom their own predators through dense,low-lying logs and branches (e.g. Schuppand Frost, 1989). Through a complex net ofseed consumption, caching and dropping,rodents can influence the spatial distribu-tion of regeneration and, ultimately, thehierarchy in which juvenile, woody plantsmust compete at any particular microsite.This process is particularly important forlarge-seeded species.
Often there are few alternative agentscapable of effectively redistributing theseseeds which are, for the most part,deposited beneath the parent tree. Escape
(after Howe and Smallwood, 1982) fromdensity-dependent attack by insects via dis-persal away from adult trees is one possiblemeans in which rodents might positivelyinfluence a species success in an area.Alternatively, dispersal away from trees byarboreal frugivores may decrease the likeli-hood of seeds being encountered by largelypredaceous rodents. However, most tropi-cal rodents appear not to attack seeds withregard to distance from parent trees(Hammond and Brown, 1998), since theytend to forage for a wide range of seeds andfruits within a limited, but plastic, homerange (e.g. Smythe, 1978). Thus, the puta-tive advantage of dispersal by arboreal fru-givores may be offset by thedistance-independent foraging behaviour ofseed-eating rodents (e.g. Janzen, 1982;Forget, 1993).
Due to the high relative abundance oflarge-seeded woody plants (Hammond andBrown, 1995) with fruits adapted for syn-zoochorous dispersal (van Roosmalen,1985), seed- and fruit-eating rodents mustrank among the most important vertebrateherbivores in Guianan forests. For the off-spring of many canopy tree species, itappears that removal by rodents is the mosteffective means of avoiding an early deathfrom their density/distance-dependentinvertebrate or fungal predators (e.g.Chlorocardium rodiei in Guyana (Hammondet al., 1999), Carapa guianensis in Trinidad(Rankin, 1978) and Guyana (Hammond etal., 1992)) and colonizing suitable uplandsites on ridges and hillsides (Hammond etal., 1992; Forget, 1992a). Thus, the way inwhich those factors which shape resourceavailability (Hammond and Brown, 1998)and use (Janzen, 1969) by seed foragersinterplay is paramount in determining theoutcome of rodent attack on seeds (e.g.Schupp, 1988; Forget et al., 1994; Forget,1994). For example, there are thought to bedistinct differences in the capacity ofcaviomorph and myomorph rodents to copewith the relatively large concentrations oftoxic secondary chemicals in seeds (Rankin,1978), possibly due to contrasting detoxifi-cation pathways (Williams, 1972; Freelandand Janzen, 1974).
260 P.-M. Forget and D.S. Hammond

By birds
Birds often systematically carry fruit awayfrom the source tree. Toucans, for instance,regularly fly on a round-trip schedule witha few large fruits or seeds taken at each pas-sage, and then rapidly regurgitate these at ashort distance (e.g. <40 m) from the focalfruiting trees (Howe and Primack, 1975;Howe et al., 1985). Smaller birds, such asmanakins, which intensively visit fruitingtrees, disperse seeds along a gradient ofmicrohabitats extending from mature forestto the largest clearings while foraging forresources or displaying at lekking sites(Théry, 1990a,b,c, 1992; Krijger et al.,1997). Defecation can be rapid (around12–15 min; Worthington, 1989) and takesplace from isolated trees in open vegeta-tion, along gap edges, roads and riverbanks,and other sites far from the parent source(Théry, 1990b). Many of the lek-formingPipridae feed rapidly during display bouts,and will disperse seeds directly into well-lit microhabitats which enhance colour dis-play and courtship behaviour (Théry,1987a, 1990b,c; Théry and Vehrencamp,1995; Endler and Théry, 1996). Some light-demanding Melastomataceae species arepreferentially disseminated by pipridswhich display at forest edges, in gaps or inhigh closed forest (Krijger et al., 1997; seealso Poulin et al., 1999).
The cock-of-the-rock (R. rupicola)illustrates another example of directional(after Howe and Smallwood, 1982) seeddispersal by birds. The cock-of-the-rockforms leks, feeds upon a wide variety offruits (1–3 cm in length) collected fromsmall shrubs and trees up to 40 m into thecanopy (Schuchmann, 1984; Erard et al.,1989) and deposits the seeds on to the arena(Théry and Larpin, 1993). The arena itself isoften located at the centre of a dense thicketof saplings, shrubs and treelets which mayhave grown from long-term seed depositionby the cock-of-the-rock (Théry and Larpin,1993).
A faithfully frugivorous diet can have atremendous long-term effect on a species’behaviour. The elaborate mating rituals,especially lekking and communal behav-
iour, displayed by manakins and othercommon frugivorous birds in the Guianas(e.g. cotingids) are thought to be largely aproduct of their specialization on fruits andnectar, which are more rapidly located andconsumed than other resources. This effi-cient capture of resources has made thepaternal role in offspring care redundant,leading to the display behaviour character-istic of these groups (Snow, 1963). In turn,the evolution of such displays in manakinswould solidify the consummate nature oftheir frugivory, enhancing the co-evolution-ary relationship between consumer andproducer.
Seed predation and seedling recruitmentlimitation
Pre-dispersal predation
BY MONKEYS While most of the Guiananmonkeys (see ‘Arboreal HerbivorousMammals’, above) do not damage the seedscontained within the fruits they feed on, thebrown bearded saki and the Guianan sakiare known as true canopy seed-predators,spending 95–99% of their feeding time eat-ing fruit whose seeds they digest (vanRoosmalen et al., 1988; Kinzey andNorconk, 1993; Norconk et al., 1997). Theaverage crushing resistance value of seedseaten by Pithecia is intermediate in hard-ness between those eaten by Chiropotes andthose swallowed intact by spider monkeys(Kinzey and Norconk, 1993). Seeds masti-cated by brown bearded saki are soft com-pared with seeds masticated by theGuianan saki, and especially soft comparedwith those swallowed by spider monkeys(Kinzey and Norconk, 1993). A closelyrelated species, the white-nosed beardedsaki (C. albinasus) was observed eating theswollen receptacle of Anacardium excel-sum (Anacardiaceae), the mesocarp of thebabaçu palm Orbyginia martiana (Ferrari,1995) and the fruit pulp of Astrocaryumvulgare (Arecaceae) in Brazil (Ayres, 1981,1989). Apart from intensive seed pre-dation by saki monkeys, capuchins alsoact as seed predators during the Guianan
Rainforest Vertebrates and Food Plant Diversity 261

dry season, consuming immature fruit andseeds of palms in particular and discardingthe fruits of many other species on theground below the parent tree (e.g. Zhang,1994).
BY BIRDS Snow (1981) also identified twomain groups of seed-eating birds: (i) thosethat consume seeds adapted to dispersal byother frugivores; and (ii) those that feedupon seeds adapted for abiotic, often wind,dispersal. In the Guianas, as in mostneotropical forests, the first group wouldinclude such frugivorous–granivorous birdsas guans and curassows, which pick upfresh fruit and seeds (here below referred toas ripe fruit) on the ground after they aredropped by arboreal consumers or dehisce.The second group consists mainly of par-rots and macaws, whose strong, powerfulbeaks allow them to exploit the soft, greenseeds which are contained within theindurate pericarp of unripe fruit. Parrotsmanipulate fruit with their feet, beak andtongue. They open hardened fruits andseeds and then sculpt the softer seed massinto a bolus of a size and shape that is eas-ily swallowed (Hopkins and Hopkins, 1983;Norconk et al., 1997). As has been generallyobserved elsewhere in the neotropics (e.g.Higgins, 1979), the large confamilial groupof parrots, parakeets and macaws(Psittacidae) destroy vast quantities ofgreen fruit and seeds in the Guianas everyyear. Often these are from wind-dispersedtree species such as Dicorynia guianensis(Caesalpiniacaeae), Couratari guianensis(Lecythidaceae) and Qualea rosea(Voshysiaceae), and bat-dispersed speciessuch as Swartzia remiger, S. schomburgkii,S. leiocalycina (Caesalpiniacaeae) (Forget,1988; Loubry, 1993; D. Hammond, personalobservation). Another important foodsource for parrots is the long, black legumesof trees in the genus Parkia, which arelocally known as macaw-bean soup tree(‘faveira arra tucupi’) in Brazil (Hopkinsand Hopkins, 1983). Several species ofParkia have been recorded as being regu-larly attacked by parrots and macaws, suchas Pionus fuscus at P. panurensis, and Araaraurana, A. macao, Deropytus acciptrinus
in Manaus, Brazil; similar damage wasrecorded from herbarium specimens of P.multijuga, P. pendula and P. nitida fromGuyana (Hopkins and Hopkins, 1983).Norconk et al. (1997) report that Arachloroptera fed upon seeds of Anacardi-aceae (Spondias mombin), Burseraceae(Protium tenuifolium), Euphorbiaceae(Sapium glandulosum), Fabaceae(Centrolobium paraense, Pterocarpus aca-pulcensis) and Sapotaceae (Chrysophyllumlucentifolium) in nearby Guri Lake,Venezuela. Rankin (1978) noted that imma-ture pods of Mora excelsa were attacked byparrots in Trinidad. Such destruction,unfortunately, is rarely quantified, despiteits potential regulatory role in seedlingestablishment and recruitment. Forget(1988) estimated that up to 63% of the cropof green fruit of a single Swartzia remigertree was attacked by the large parrotAmazona farinosa. As a consequence,many intact and partly damaged seeds weredropped beneath the parent tree, but thiswaste (after Howe, 1980) had little effect onearly recruitment, since very few seedswere subsequently attacked by insects orrodents (Forget, 1988). At another tree withno apparent parrot activity, most fruitsmatured, the pods opened and the lack ofregeneration beneath the tree crown sug-gests that bats may have effectively dis-persed seeds in the absence of pre-dispersalattack by parrots.
Post-dispersal predation
BY BIRDS Erard et al. (1991) analysed thestomach contents of 69 crested curassows(Crax alector, Cracidae) and 17 great tina-mous (Tinamus major, Tinamidae) andidentified the debris of fruits and seeds asbelonging to 80 (in 28 families) and 38species (in 18 families), respectively.Despite the fact that both birds restrict theirforaging to the forest floor, there is a weakoverlap of their diet (Erard and Théry,1994). Erard et al. (1991) also remarked thatMeliaceae (Guarea spp.) and Myristicaceae(Virola spp.) accounted for more than 50%of the diet (in terms of g dry weight) incrested curassows and great tinamous,
262 P.-M. Forget and D.S. Hammond
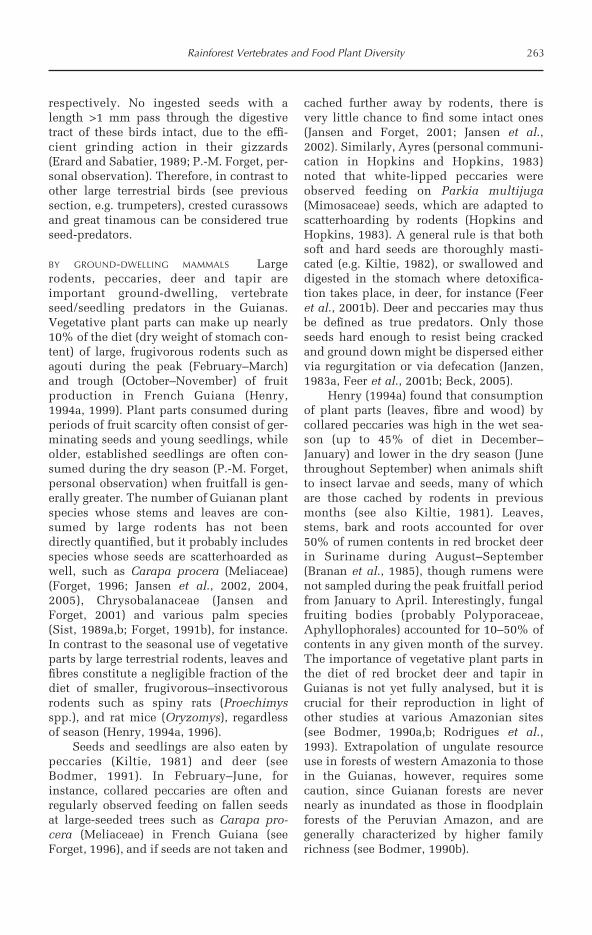
respectively. No ingested seeds with alength >1 mm pass through the digestivetract of these birds intact, due to the effi-cient grinding action in their gizzards(Erard and Sabatier, 1989; P.-M. Forget, per-sonal observation). Therefore, in contrast toother large terrestrial birds (see previoussection, e.g. trumpeters), crested curassowsand great tinamous can be considered trueseed-predators.
BY GROUND-DWELLING MAMMALS Largerodents, peccaries, deer and tapir areimportant ground-dwelling, vertebrateseed/seedling predators in the Guianas.Vegetative plant parts can make up nearly10% of the diet (dry weight of stomach con-tent) of large, frugivorous rodents such asagouti during the peak (February–March)and trough (October–November) of fruitproduction in French Guiana (Henry,1994a, 1999). Plant parts consumed duringperiods of fruit scarcity often consist of ger-minating seeds and young seedlings, whileolder, established seedlings are often con-sumed during the dry season (P.-M. Forget,personal observation) when fruitfall is gen-erally greater. The number of Guianan plantspecies whose stems and leaves are con-sumed by large rodents has not beendirectly quantified, but it probably includesspecies whose seeds are scatterhoarded aswell, such as Carapa procera (Meliaceae)(Forget, 1996; Jansen et al., 2002, 2004,2005), Chrysobalanaceae (Jansen andForget, 2001) and various palm species(Sist, 1989a,b; Forget, 1991b), for instance.In contrast to the seasonal use of vegetativeparts by large terrestrial rodents, leaves andfibres constitute a negligible fraction of thediet of smaller, frugivorous–insectivorousrodents such as spiny rats (Proechimysspp.), and rat mice (Oryzomys), regardlessof season (Henry, 1994a, 1996).
Seeds and seedlings are also eaten bypeccaries (Kiltie, 1981) and deer (seeBodmer, 1991). In February–June, forinstance, collared peccaries are often andregularly observed feeding on fallen seedsat large-seeded trees such as Carapa pro-cera (Meliaceae) in French Guiana (seeForget, 1996), and if seeds are not taken and
cached further away by rodents, there isvery little chance to find some intact ones(Jansen and Forget, 2001; Jansen et al.,2002). Similarly, Ayres (personal communi-cation in Hopkins and Hopkins, 1983)noted that white-lipped peccaries wereobserved feeding on Parkia multijuga(Mimosaceae) seeds, which are adapted toscatterhoarding by rodents (Hopkins andHopkins, 1983). A general rule is that bothsoft and hard seeds are thoroughly masti-cated (e.g. Kiltie, 1982), or swallowed anddigested in the stomach where detoxifica-tion takes place, in deer, for instance (Feeret al., 2001b). Deer and peccaries may thusbe defined as true predators. Only thoseseeds hard enough to resist being crackedand ground down might be dispersed eithervia regurgitation or via defecation (Janzen,1983a, Feer et al., 2001b; Beck, 2005).
Henry (1994a) found that consumptionof plant parts (leaves, fibre and wood) bycollared peccaries was high in the wet sea-son (up to 45% of diet in December–January) and lower in the dry season (Junethroughout September) when animals shiftto insect larvae and seeds, many of whichare those cached by rodents in previousmonths (see also Kiltie, 1981). Leaves,stems, bark and roots accounted for over50% of rumen contents in red brocket deerin Suriname during August–September(Branan et al., 1985), though rumens werenot sampled during the peak fruitfall periodfrom January to April. Interestingly, fungalfruiting bodies (probably Polyporaceae,Aphyllophorales) accounted for 10–50% ofcontents in any given month of the survey.The importance of vegetative plant parts inthe diet of red brocket deer and tapir inGuianas is not yet fully analysed, but it iscrucial for their reproduction in light ofother studies at various Amazonian sites(see Bodmer, 1990a,b; Rodrigues et al.,1993). Extrapolation of ungulate resourceuse in forests of western Amazonia to thosein the Guianas, however, requires somecaution, since Guianan forests are nevernearly as inundated as those in floodplainforests of the Peruvian Amazon, and aregenerally characterized by higher familyrichness (see Bodmer, 1990b).
Rainforest Vertebrates and Food Plant Diversity 263

Food Plant and Vertebrate DietaryDiversity: a Synthesis
After reviewing the diet of 23 animal orspecies groups (six birds, eight arboreal andnine terrestrial mammals), with bodyweights ranging from several grams (averag-ing 15 g in four piprid species) to 300 kg,one may rank plant families by their rela-tive contribution to the diet of the faunalcommunity (Appendix 4.2) and discusssuch diversity in light of dietary choice.Except for species-rich families such asOrchidaceae, Piperaceae, Bromeliaceae,Cyperaceae and Poaceae, which contributelittle to dietary diversity, the 32 familiescontributing to the diet of at least 50% ofthe studied vertebrate species (i.e. fed uponby at least 12 species) are among the richestfamilies with the number of species fedupon ranging from 4 to 69 (Table 4.8). Themost frequent families occurring in the dietof (mainly French) Guianan vertebrates areMoraceae (100% of vertebrate species con-suming at least one species from the fam-ily), Burseraceae, Annonaceae, Arecaceae(see previous subsection), Rubiaceae,Myrtaceae and Sapotaceae. Most of theseare among the 20 most-abundant familieswith diameter at breast height >10 cm at theNouragues forest in French Guiana (Poncyet al., 1998; Belbenoit et al., 2001), butseveral families which are abundant inFrench Guiana, notably the Moraceae,Burseraceae and Arecaceae, tend to declinesignificantly as one sweeps northwestwardtowards Roraima and Venezuelan Guayana(see Fig. 7.8, Chapter 7) and are sub-stantially less important in northern andcentral Guyana than more easterly orsoutherly sites in the Guianas (Ek, 1997; terSteege and Hammond, 2001; ter Steege,1998).
The larger the body size of an animal,the greater the movement across its homerange (Swihart et al., 1988) and the higherthe diversity of plants it may encounter.Also, regardless of feeding niche, i.e.frugivore–omnivore/herbivore/granivore/browser, there is a significant relationshipbetween body mass and population density(Robinson and Redford, 1986). When plot-
ting body weight against the percentage ofall known Guianan forest plant familiesincluded in the diet, we only found a sig-nificantly positive relationship for arborealmammals (r2=0.653, P=0.015, N=8 species)(Fig. 4.5).
One may remark that, for most arborealvertebrates, the information obtained fromvisual records of feeding in the wild, espe-cially when whole troops of monkeys werefollowed for several years, or from stomachcontent analyses is likely to be incomplete.Stomach content analysis alone does not
264 P.-M. Forget and D.S. Hammond
Table 4.8. Rank occurrence of plant familiesrepresented in the diet of 23 herbivorous verte-brate species or groups and the number of plantspecies in these families found at Nouragues (thisstudy, Poncy et al. 1998; Belbenoit et al., 2001).
Family In diet In forest
Moraceae 23 29Burseraceae 21 24Annonaceae 20 26Rubiaceae 20 69Myrtaceae 19 37Arecaceae 18 23Lauraceae 18 37Sapotaceae 18 64Clusiaceae 17 20Anacardiaceae 16 9Euphorbiaceae 16 27Mimosaceae 16 65Myristicaceae 16 8Sapindaceae 16 25Chrysobalanaceae 15 37Caesalpiniaceae 14 30Cucurbitaceae 14 6Fabaceae 14 23Melastomataceae 14 46Meliaceae 14 19Convolvulaceae 13 6Flacourtiaceae 13 9Bombacaceae 12 9Humiriaceae 12 5Lecythidaceae 12 29Menispermaceae 12 6Polygalaceae 12 6Sterculiaceae 12 7Apocynaceae 11 23Araceae 11 57Bignoniaceae 11 14Boraginaceae 11 6

always allow a correct description of thediet diversity because it merely represents asingle moment in feeding history, delimitedby the time between ingestion and assimila-tion/defecation and, thus, wholly depend-ent on gut retention times. For thesereasons, it is more than likely that the smallsamples for some frugivorous species (e.g.large birds) has underestimated the range ofplant families consumed. In the pipridgroup, on the contrary, our expectation ofthe diet diversity is high, with at least 32%of plant families likely to be eaten by thesesmall birds, weighing 11–17 g on average.Note that many of these families have smallfruits and, except Rubiaceae andMelastomataceae, are represented by a rela-tively small number of species in theGuianas. There is a trend though, not sig-nificant, among terrestrial mammals for anincreased body size to be associated with a
more diverse diet, especially after incorpo-rating the large number of grass speciesconsumed by deer and tapir. However,information remains incomplete for manyless apparent, small-bodied rodents andbats and, in particular, for the much larger-bodied paca and peccaries.
Palms: an Outstanding Plant Group inthe Guianas
Despite the predominance of the fig familyin the diet of all studied vertebrates (seeprevious section) and unlike many Newand Old World tropical forests, figs (Ficusspp.) are relatively rare in most undisturbedmature Guianan forests. There is very littleevidence to suggest that this genus acts as akeystone (after Terborgh, 1986) plantresource where it does occur and may not
Rainforest Vertebrates and Food Plant Diversity 265
Body weight (g)
Die
tary
Bre
adth
(a
s in
% p
lan
t fa
mili
es)
Pip
Oc
P spp
Rr
Cphi
Sm
Pm
PcTm
Cal
Nn
DlCs
Pf
Cpac
Tp
Ma
Mg
Tt
As
Pp
Apan
Ca
10
15
20
25
30
35
40
45
50
55
60
10 100 1000 10,000 100,000 1,000,000
Birds
Terrestrial mammals
Arboreal mammals
Fig. 4.5. Relationship between body mass and dietary breadth within three Guianan bird and mammalspecies or groups. Dietary breadth is the known number of plant families consumed for each vertebratespecies at Nouragues as a percentage of the overall number of plant families present at the site. Speciesname abbreviations: Birds – Pip: Piprid group; Rr: Rupicola rupicola; Tm: Tinamus major; Pm: Penelopemarail; Pc: Psophia crepitans; Cal: Crax alector. Arboreal mammals – Cp: Caluromys philander; Sm:Saguinus midas; Pp: Pithecia pithecia; Pf: Potos flavus; Cs: Chiropotes satanas; Cap: Cebus apella; As:Alouatta seniculus; Apan: Ateles paniscus. Terrestrial mammals – Oc: Oryzomys capito; P spp.:Proechimys cuvieri and P. guianensis; Nn: Nasua narica; Dl: Dasyprocta leporina; Apac: Agouti paca; Mg:Mazama gouazoubira; Ma: Mazama americana; Tp: Tayassu pecari; Tt: Tapirus terrestris. See text for datasources. Regression line is for arboreal mammals: r2=0.61, P=0. 018, N=8 species.
Die
tary
bre
adth
(as
in %
pla
nt f
amili
es)
Body weight (g)

fulfil a pivotal role in sustaining vertebratefrugivores in eastern Amazonia (e.g. Peres,1993b, 1994b) as is suggested for sites intropical lowland Peru (Terborgh, 1986) orparts of SE Asia (Leighton and Leighton,1983). However, in comparison, palms areone of the most successful woody plantfamilies in the Guianan forest ecosystems(e.g. Sist, 1989b,c), albeit never reaching thepervasiveness, in terms of density or diver-sity, of their confamilials in westernAmazonia or Central America (Kahn and DeGranville, 1992).
Much of the success of palms could beattributed to their many relationships withanimals, foremost among these being seeddispersal (Zona and Henderson, 1989). Abroad spectrum of animals, invertebrateand vertebrate, rely upon the pulp andseeds of palms for their survival and repro-duction throughout the year. In our surveyat least 18 animal species or groups of birds,primates and ground-dwelling mammalsare the predominant consumers and dis-persers of palm fruit and seeds, thoughother arboreal and flying mammals occa-sionally feed on palms as well.
Fruit from the palm Jessenia bataua areintensively exploited by brown capuchinsin Nouragues forests (Zhang, 1994) due tothe extended period of fruiting in the dryseason (September–November), when over-all fruit availability is low (Sist, 1989c; Sistand Puig, 1987; Zhang and Wang, 1995a;see also Peres, 1994a). Several species ofpalms in central Guyana are known to fruitmainly during the trough in productionamong sympatric woody dicots(June–December) (ter Steege et al., 1996), orfruit continuously throughout the year (D.Hammond, unpublished data; e.g.Astrocaryum aculeatum, Bactris humilis,Euterpe oleracea). Oenocarpus oligocarpaproduces fruit mainly between peaks incommunity-wide production at Piste deSaint Elie (Sabatier, 1985). In secondaryforests of French Guiana, fruits of Attalearegia and Astrocaryum vulgare are pro-duced during several months in the wetseason and are two important foodresources for marsupials, kinkajou androdents, this last group of animals being
largely responsible for seed dispersal(Charles-Dominique et al., 1981). Attaleamaripa fruit is also an important resourcefor tapirs, rodents and other mammalswhen they ripen during the lull in overallfruitfall on Maracá Island, Brazil (Fragoso,1997; Silvius, 2002). Sist and Puig (1987)noted that parrots consume large fruit ofJessenia, dropping many seeds beneath theparent stem and adjacent trees used asperches. Their role as seed dispersers istherefore somewhat weak in comparison tothat of toucans (e.g. Rhamphastos tucanus)and other large frugivorous birds, and spi-der monkeys (van Roosmalen, 1985), whichare capable of dispersing seeds much fur-ther than parrots. Because J. batauaseedlings require a period of growth inshade before reaching adulthood, it isunlikely that aggregated seeds andseedlings beneath parents will findfavourable conditions in the immediatevicinity of parents which often remainstanding after large disturbance events (DeGranville, 1978).
Other palms, such as species ofAstrocaryum and Bactris, are often under-storey specialists, and exclusively dis-persed by scatterhoarding rodents,acouchis, agoutis and squirrels (vanRoosmalen, 1985; Sist, 1989a,b; Forget,1991b). It is probable that seed dispersalefficiency (i.e. the ratio between hoardingrate and predation rate) may vary accordingto the degree of habitat specificity of eitherrodent (see Dubost, 1988) or palm (Sist,1989c) as well as the overall diversity ofresources available at the time of fruit mat-uration in palms (‘frequency-dependentselection’, after Greenwood, 1985).
Palm fruit is also likely to be a majorresource for ungulates in Guianan forests.However, compared to the predominance ofMauritia flexuosa fruits in the diet of ungu-lates in varzea forests in central and west-ern Amazonia (Bodmer, 1990b, 1991), it isunlikely that this resource would representsuch an important resource for ungulates inGuianan forests where well-drained soilspredominate and M. flexuosa is poorly rep-resented (P.-M. Forget, personal communi-cation). Localized depressions and perched
266 P.-M. Forget and D.S. Hammond

catchments along dolerite dykes in centralGuyana are often exclusively inhabited byM. flexuosa and J. bataua and the impor-tance of these concentrations of monotypicpalm resources to ungulates and other for-est fauna requires investigation. At theMabura Hill Forest Reserve, the incidenceof tapir tracks and faeces is two to fourtimes higher in palm swamps during thedry season compared to other riverine andupland forest types (D. Hammond, unpub-lished data). Conversely, the role of rodentsand ungulates as either predators or dis-persers of palm seeds is poorly understoodin Guianan forests, despite the advancesmade in this regard at other neotropicalsites (e.g. Smythe, 1989; Forget et al., 1994).Many aquatic vertebrates, most notablyriver turtles and fish, inhabiting Guiananblackwater rivers and streams also utilizepalm fruits extensively as an importantsource of energy in an otherwise relativelyoligotrophic habitat.
Once dispersed by vertebrates, palmseeds may eventually be damaged byinsects if they have not already infestedfruit prior to dispersal. Smythe (1989)showed that buried Astrocaryum stand-leyanum seeds are protected from bruchidinfestation when pulp is scraped off byrodents before scatterhoarding them. Forgetet al. (1994) suggested that removal (preda-tion and hoarding) of A. butyracea seeds byrodents may limit the bruchid populationby reducing the number of ovipositionsites.
Palms not only provide food but theyalso serve as roosts and dens. Indeed, witha high diversity and density of juvenileswith large leaves in the understorey (Sist,1989c), palms in the genera Astrocaryum,Bactris, Geonoma and Scheelea provideshelter for many bats (e.g. Artibeus spp.),which either perch at night during feedingsessions or during the day while sleeping ingroups (Brosset and Charles-Dominique,1990; Charles-Dominique, 1993c; see alsoFoster and Timm, 1976). Spiny leaves of thepalm Astrocaryum sciophyllum, an abun-dant palm in the Guianan forest under-storey (Sist, 1989b), are also used byCampylopterus largipennis (Trochilidae) to
nest (Théry, 1987b) as well as by otherhummingbirds in French Guiana (Tostainet al., 1992). Litter cones which form at thebase of A. paramaca palms (De Granville,1977) are inhabited by a diverse communityof amphibians and reptiles (Gasc, 1986;Kahn and De Granville, 1992). Low-lyingpalm cones are also often used bycaviomorph rodents as deposition sites dur-ing scatterhoarding (Forget, 1990), whichthey or other terrestrial seed-eaters (e.g.peccaries; Kiltie, 1981) may use to relocatecached seeds.
Forest Management and Implications forConservation
In the Guianas, mixed forests (afterRichards, 1996) growing on both poorly andwell-drained soils (ter Steege et al., 1993;Sabatier et al., 1997) offer a diversity of fruitto local fauna (see above, ‘Forest habitatand mammalian diet diversity’) and thusare most likely to maintain a diverse assort-ment of animal–plant relationships. In con-trast, inundated areas on hydromorphicsoils, where flooded forests are dominatedby one or several tree species with seedsdispersed by gravity, explosion or water,often provide little reward to vertebrate andinvertebrate herbivores (see Chapter 5). Incomparison to other neotropical forests, theGuianas also host a very large proportion oftrees with seeds weighing more than 1 g inaverage, even when the very largest seeds(often with unassisted mode of dispersal)are excluded from the calculation(Hammond and Brown, 1995). Most plantfamilies which together constitute themajor portion of vertebrate diets in theGuianas also contain commercial timbertrees (Hammond et al., 1996), the remainingdietary items coming from understoreytrees in the families Annonaceae,Myrtaceae, Rubiaceae, Melastomataceae,and other plants such as palms, epiphytes(Araceae) and lianas (e.g. Convolvulaceae,Curcurbitaceae, Gnetaceae, Malpighiaceae,Passifloraceae).
According to Hammond et al. (1996), avast majority of the medium- to large-
Rainforest Vertebrates and Food Plant Diversity 267

seeded plants are primarily dispersed bymammals (44%) and birds (38%), 20% ofthe remaining species also being secondar-ily dispersed by other vertebrates, such ascaviomorph rodents. Comparing dispersalmodes of harvested and unharvested timberspecies, Hammond et al. (1996) stressed theimportance of animals for recruitment ofGuianan timber species. Of 172 potentialtimber species, 132 (76.7%) are currentlyharvested in at least one of the threeGuianan countries, almost 50% and 21% ofthem being transported by mammals andbirds, respectively (Hammond et al., 1996;see also Hammond et al., 1992).Animal–plant relationships may thereforecontribute to the coexistence of the mosaicof forest patches through seed dispersal andseed predation processes, two key mecha-nisms of tree regeneration, and contributeto maintenance of diversity in Guiananforests (see Janzen, 1974; Connell andLowman, 1989; Hart et al., 1989).
Forest management and timber extrac-tion which does not account for the supportservices provided by vertebrate dispersalagents may reduce the breadth of largemammal dietary items by commerciallyextinguishing those species which yieldlarge, edible fruits or seeds but are rela-tively rare (e.g. Pouteria spp., Ocotea spp.)in comparison to the dominant species, anumber of which are not harvested at all(e.g. Dicymbe altsonii (Caesalpiniaceae) inGuyana). Combined with a reduction ofpopulation sizes of larger vertebrates due tothe increased wildlife harvesting whichaccompanies logging, the formative roleplayed by the relationship between large-bodied vertebrate and large-seeded trees inshaping Guianan forests will diminish. Thechange in the mosaic of microhabitat struc-ture which accompanies logging will favourlight-demanding species and the frugivo-rous bats or birds which disperse theirsmall seeds (Johns, 1997). Recruitment islikely to decline for those trees losing theirspecialist seed dispersers (see Hammond etal., 1992).
The impact of logging necessarilyvaries between central Guyana, Surinameand French Guiana, depending on the level
of harvesting imposed, being highest in theformer region and lowest in the latter(Hammond et al., 1996). In light of the greatdiversity of plant families upon which ver-tebrates depend and they, in turn, servicethrough pollination and seed dispersal, themaintenance of forest habitat diversity,from monodominant stands to species-richmixed forest, is paramount if sustainedrecruitment of these species is to beachieved in Guianan and other neotropicalrainforests. Forest management modelsneed to embrace the future cost of dwin-dling plant family diversity and increasedstructural fragmentation. The design of for-est operational procedures should attemptto offset these costs through well-coordi-nated preharvest planning and the adoptionof low-impact harvesting routines. Thiswould decrease future losses due to inade-quate seed dispersal by allowing animals toforage effectively across their entire homerange, which often includes all types of for-est habitats, i.e. from hilltops to creek, riverand lake edges (see, for instance, Bodmer,1990b), with the consequent scattering ofseeds enhancing seedling survival andgrowth and, ultimately, contributing to themaintenance of large-seeded tree speciesdiversity in the Guianas. Meanwhile, anincrease in the density of light-demanding,small-seeded species, most often dispersedby small vertebrates and wind in Guiananforests (Sabatier, 1983, 1985; Hammondand Brown, 1995) is unavoidable, and maylead to a lower diversity and density oflarge frugivores in logged areas (Hammondet al., 1992), preventing a rapid return topreharvest conditions, given the slow paceof recruitment in vertebrate-dispersed,large-seeded species (e.g. Forget, 1991a,1994, 1997b). With a reduced volume ofseeds being distributed at larger scales,regional forests may evolve at smallerscales alone, producing a patchwork ofpolarized forest processes where someareas are dominated by small-seeded, verte-brate-dispersed species (see Charles-Dominique et al., 1981) and others bypoor-mixed forests, dominated by large-seeded species, such as Eperua spp., withlife-history traits adapted to regenerate in a
268 P.-M. Forget and D.S. Hammond

world without vertebrates (Forget, 1989,1992a; see also Connell and Lowman,1989). Data available on the composition offorests over a 15 million ha area in Guyanasuggest that forests undergo a form of spa-tial character convergence, with smaller-seeded wind, bird and primate-dispersedspecies being typical of more diverse foresttree communities in the south, while rodentand unassisted dispersal of large seeds istypical of relatively species-poor forestswhich are subject to fewer catastrophic dis-turbances in the central region (ter Steegeand Hammond, 2001). The growing body ofinformation on seed dispersal and preda-tion and the influence of varying plantattributes upon this process in Guiananforests suggests that vertebrates provide animportant support service to forest manage-ment (Hammond, 1998), restocking areaspreviously depleted and regulating the mixof competing species after the canopy hasbeen opened.
Acknowledgements
The authors would like to acknowledge allpersons who took some time correcting thetext, sharing unpublished material andcommunicating published information notavailable to us. So many thanks toMarianna Altricher, Mark Angstrom,Harald Beck, Pierre Charles-Dominique,Gérard Dubost, François Feer, CharlesFoerster, Matt Gompper, Cécile Hansen,Olivier Henry, M. Hoogmoed, Didier Julien-Laferrière, Burton Lim, Elisabeth Kalko,Andy Plumptre, Nancy Simmons, PeterSherman, Marc Théry, Jean-Christophe Viéand Robert Voss. Our appreciation to theZoological Library at the WildlifeConservation Society, Bronx Zoo for accessto unpublished archival material andreprints.
Rainforest Vertebrates and Food Plant Diversity 269
Notes
1 Throughout text nomenclature follows Emmons and Feer (1990).2 Sources: Mammals: Beebe (1919), Tate (1939), Husson (1978), Eisenberg (1989), Ochoa (1995), Voss andEmmons (1996), Brosset et al. (1996), ter Steege et al. (1996), Simmon and Voss (1998), Voss et al. (2001),P. Charles-Dominique (personal communication), R. Voss (personal communication), B. Lim (personal com-munication), M. Engstrom (personal communication), Lim and Engstrom (2001a,b), Engstrom and Lim(2002). Birds: Beebe (1925), Haverschmidt (1968), Meyer de Schauensee and Phelps (1978), Parker et al.(1993), Thiollay (1994), ter Steege et al. (1996). Fish, skates and eels: Eigenmann (1912), Puyo (1949),Boesman (1952), Lowe-McConnell (1964), Géry (1972), Planquette et al. (1996), Ouboter and Mol (1993).Reptiles and Amphibians: Parker (1935), Beebe (1946), Gasc (1976, 1981), Hoogmoed (1973), Hoogmoedand Lescure (1975), Hoogmoed (1979), Gasc and Rodrigues (1980), Abuys (1982a,b,c,d, 1983a,b,c,d,1984a,b), Chippaux (1986), Métrailler and Le Gratiet (1996).
References
Abuys, A. (1982a) De slangen van Suriname, deel I: De wormslangen. Litteratura Serpentium 2, 64–82.Abuys, A. (1982b) De slangen van Suriname, deel II: De families Anilidae en Boidae. Litteratura Serpentium
2, 112–133.Abuys, A. (1982c) De slangen van Suriname, deel III: De families Colubridae. Litteratura Serpentium 2,
226–245.Abuys, A. (1982d) De slangen van Suriname, deel IV: Onderfamilie Colubrinae. Litteratura Serpentium 2,
274–287.Abuys, A. (1983a) The snakes of Surinam, part V: Subfamily Colubrinae (genera Geophis, Leptophis,
Mastigodryas and Spilotes). Litteratura Serpentium 3, 22–31.Abuys, A. (1983b) The snakes of Surinam, part VI: Subfamily Xenodontinae (general data and genus Atractus).
Litteratura Serpentium 3, 66–81.

Abuys, A. (1983c) The snakes of Surinam, part VII: Subfamily Xenodontinae (genera Clelia and Dipsas).Litteratura Serpentium 3, 111–120.
Abuys, A. (1983d) The snakes of Surinam, part VIII: Subfamily Xenodontinae (genera Erythrolamprus,Helicops and Hydrodynastes). Litteratura Serpentium 3, 203–212.
Abuys, A. (1984a) The snakes of Surinam, part IX: Subfamily Xenodontinae (genera Hdrops, Imantodes andLeimadophis). Litteratura Serpentium 4, 63–74.
Abuys, A. (1984b) The snakes of Surinam, part X: Subfamily Xenodontinae (genera Leptodeira, Liophis andLygophis). Litteratura Serpentium 4, 160–172.
Adler, G.H. (1995) Fruit and seed exploitation by central American spiny rats, Proechimys semispinosus.Studies on Neotropical Fauna and Environment 30, 237–244.
Aide, T.M. (1988) Herbivory as a selective agent on the timing of leaf production in a tropical understorycommunity. Nature 336, 574–575.
Aide, T.M. (1993) Patterns of leaf development and herbivory in a tropical understory community. Ecology74, 455–466.
Altrichter, M. and Almeida, R. (2002) Exploitation of white-lipped peccaries Tayassu pecari (Artiodactyla:Tayassuidae) on the Osa Peninsula, Costa Rica. Oryx 36, 126–132.
Altrichter, M., Saenz, J.C., Carrillo, E. and Fuller, T.K. (2000) Dieta estacional del Tayassu pecari(Artiodactyla: Tayassuidae) en el Parque Nacional Corcovado, Costa Rica. Revista Biologia Tropicale48, 689–702.
Altrichter, M., Carrillo, E., Saenz, J. and Fuller, T.K. (2001) White-lipped peccary (Tayassu pecari,Artiodactyla: Tayassuidae) diet and fruit availability in a Costa Rican rain forest. Revista de BiologiaTropical 49, 1183–1192.
Atramentowicz, M. (1982) Influence du milieu sur l’activité locomotrice et le reproduction de Caluromysphilander (L.). Revue d’Ecologie (Terre et Vie) 36, 373–395.
Atramentowicz, M. (1986) Dynamique de population chez trois marsupiaux Didelphidés de Guyane.Biotropica 18, 136–149.
Atramentowicz, M. (1988) La frugivorie opportuniste de trois marsupiaux Didelphidés de Guyane. Revued’Ecologie (Terre et Vie) 43, 47–57.
Ayres, J.M. (1981) Observacoes sobre a ecologia e o comportamento dos cuxiús (Chiropotes albinasus eChiropotes satanas, Cebidae, Primates). MSc thesis, University of Amazonas, Manaus, Brazil.
Ayres, J.M. (1989) Comparative feeding ecology of the uakari and bearded saki, Cacajao and Chiropotes.Journal of Human Evolution 18, 697–716.
Balée, W. (1988) Indigenous adaptation to Amazonian palm forests. Principes 32, 47–54.Beck, H. (2005) Seed predation and dispersal by peccaries throughout the Neotropics and its consequences:
a review and synthesis. In: Forget, P.-M., Lambert, J.E., Hulem, P.E. and Vander Wall, S.B. (eds)Seed fate: predation, dispersal and seedling establishment. CABI Publishing, Wallingford, UK, pp.77–115.
Beck-King, H., von Helversen, O. and Beck-King, R. (1999) Home range, population density, and foodresources of Agouti paca (Rodentia: Agoutidae) in Costa Rica: a study using alternative methods.Biotropica 31, 675–685.
Beebe, W. (1917) Tropical Wild Life in British Guiana. New York Zoological Society, New York.Beebe, W. (1919) The higher vertebrates of British Guiana with special reference to the fauna of the Bartica
district, no. 7. List of Amphibia, Reptilia and Mammalia. Zoologica 2, 205–238.Beebe, W. (1925) Studies of a tropical jungle. One quarter of a square mile of jungle at Kartabo, British
Guiana. Zoologica 6, 1–193.Beebe, W. (1946) Field notes on the snakes of Karatabo, British Guiana, and Caripito, Venezuela. Zoologica
31, 11–52.Belbenoit, P., Poncy, O., Sabatier, D., Prévost, M.-F., Riéra, B., Blane, P., Larpin, D. and Sarthou, C. (2001)
Appendix 1, Floristic checklist of the Nouragues area. In: Bongers, F., Charles-Dominique, P., Forget,P.-M. and Thery, M. (eds) Nouragues: dynamics and plant-animal interactions in a neotropical rainfor-est. Kluwer Academic Publisher, Dordrecht, The Netherlands, pp. 301–341.
Benalcázar, C.E. and Silva de Benalcázar, F. (1984) Historia natural del gallo de roca andino. Cespedesia47–48, 59–92.
Bernard, E. and Fenton, M.B. (2002) Species diversity of bats (Mammalia: Chiroptera) in forest fragments, pri-mary forests, and savannas in central Amazonia, Brazil. Canadian Journal of Zoology – RevueCanadienne de Zoologie 80, 1124–1140.
Best, R.C. (1984) The aquatic mammals and reptiles of the Amazon. In: Sioli, H. (ed.) The Amazon.
270 P.-M. Forget and D.S. Hammond
Limnology and Landscape Ecology of a Mighty Tropical River and its Basin. Junk Publishers, Dordrecht,The Netherlands, pp. 371–412.
Bierregaard, Jr, R.O., Lovejoy, T.E., Kapos, V., dos Santos, A.A. and Hutchings, R.W. (1992) The biologicaldynamics of tropical rainforest fragments. Bioscience 42, 859–866.
Bierregaard, Jr, R.O., Gascon, C., Lovejoy, T.E. and Mesquita, R. (2001) Lessons from Amazonia: the Ecologyand Conservation of a Fragmented Forest. Yale University Press, New Haven, Connecticut.
Bittrich, V. and Amaral, C.E. (1996) Pollination biology of the tree Symphonia globulifera (Clusiaceae). PlantSystematics and Evolution 200, 101–110.
Bodmer, R.E. (1990a) Fruit patch size and frugivory in the lowland tapir (Tapirus terrestris). Journal ofZoology of London 222, 121–128.
Bodmer, R.E. (1990b) Responses of ungulates to seasonal inundations in the Amazon floodplain. Journal ofTropical Ecology 6, 191–201.
Bodmer, R.E. (1991) Strategies of seed dispersal by ungulates and seed predation in Amazonian ungulates.Biotropica 23, 255–261.
Bodmer, R.E. (1995) Susceptibility of mammals to overhunting in Amazonia. In: Bissonette, J.A. andKrausman, P.R. (eds) Integrating People and Wildlife for a Sustainable Future. The Wildlife Society,Bethesda, Maryland, pp. 292–295.
Boesman, M. (1952) A preliminary list of Surinam fishes not included in Eigenmann’s enumeration of 1912.Zoologica Medelingenen Leiden 31, 179–200.
Bonaccorso, F.J., Glanz, W.E. and Sandford, C.M. (1980) Feeding assemblages of mammals at fruitingDipteryx panamensis (Papilionaceae) trees in Panama: seed predation, dispersal, and parasitism. RevistaBiologia Tropical 28, 61–72.
Bongers, F., Charles-Dominique, P., Forget, P.-M. and Théry, M. (2001) Nouragues: Dynamics andPlant–Animal Interactions in a Neotropical Rainforest. Kluwer Academic, Dordrecht, The Netherlands.
Boucher, D.H. (ed.) (1985) The Biology of Mutualism. Oxford University Press, Oxford, UK.Boucher, D.H., James, S. and Keeler, K.H. (1982) The ecology of mutualism. Annual Review Ecology
Systematics 13, 315–347.Boujard, T., Sabatier, D., Rojas-Beltran, R., Prévost, M.-F. and Renno, J.-F. (1990) The food habits of three
allochthonous feeding characoids in French Guiana. Revue d’Ecologie (Terre et Vie) 45, 247–258.Branan, W.V. and Marchinton, R.L. (1986) Reproductive ecology of white-tailed and red brocket deer in
Suriname. In: Wemmer, C. (ed.) Biology and Management of the Cervidae. Smithsonian InstitutionPress, Washington, DC, pp. 972–976.
Branan, W.V., Werkhoven, M.C.M. and Marchinton, R.L. (1985) Food habits of brocket and white-tailed deerin Suriname. Journal of Wildlife Management 49, 972–976.
Brosset, A. and Charles-Dominique, P. (1990) The bats from French Guiana: a taxonomic, faunistic and eco-logical approach. Mammalia 54, 509–560.
Brosset, A., Cosson, J.-F., Gaucher, P. and Masson, D. (1995) Les chiroptères d’un marécage côtier deGuyane; composition du peuplement. Mammalia 59, 527–535.
Brosset, A., Charles-Dominique, P., Cockle, A., Cosson, J.-F. and Masson, D. (1996) Bat communities anddeforestation in French Guiana. Canadian Journal of Zoology 74, 1974–1982.
Charles-Dominique, P. (1986) Inter-relations between frugivorous vertebrates and pioneer plants, Cecropia,birds and bats in French Guyana. In: Estrada, A. and Fleming, T.H. (eds) Frugivores and Seed Dispersal.Dr. W. Junk Publishers, The Hague, pp. 119–135.
Charles-Dominique, P. (1991) Feeding strategy and activity budget of the frugivorous bat Carollia perpicil-lata (Chiroptera: Phyllostomidae) in French Guiana. Journal of Tropical Ecology 7, 243–256.
Charles-Dominique, P. (1993a) Ecologie des mammifères forestiers de Guyane française: origines biogéo-graphiques et organisation du peuplement. In: Gestion de l’Ecosystème Forestier et Aménagement del’Espace Régional. Nature Guyanaise (supplement), 145–152.
Charles-Dominique, P. (1993b) Speciation and coevolution: an interpretation of frugivory phenomena.Vegetatio 107/18, 75–84.
Charles-Dominique, P. (1993c) Tent-use by the bat Rhinophylla pumilio (Phyllostomidae: Carolliinae) inFrench Guiana. Biotropica 25, 111–116.
Charles-Dominique, P. (1995) Interactions plantes–animaux frugivores, conséquences sur la disséminationdes graines et la régénération forestière. Revue d’Ecologie (Terre Vie) 50, 223–237.
Charles-Dominique, P. and Cockle, A. (2001) Frugivory and seed dispersal by bats. In: Bongers, F., Charles-Dominique, P., Forget, P.-M. and Théry, M. (eds) Nouragues: Dynamics and Plant–Animal Interactionsin a Neotropical Rainforest. Kluwer Academic, Dordrecht, The Netherlands, pp. 207–215.
Rainforest Vertebrates and Food Plant Diversity 271

272 P.-M. Forget and D.S. Hammond
Charles-Dominique, P., Atramentowicz, M., Charles-Dominique, M., Gérard, H., Hladik, A., Hladik, C.-M.and Prévost, M.-F. (1981) Les mammifères frugivores arboricoles nocturnes d’une forêt guyanaise: inter-relations plantes–animaux. Revue d’Ecologie (Terre Vie) 35, 341–435.
Chippaux, J.-P. (1986) Les Serpents de la Guyane française. Faune Tropicale XXVII. ORSTOM, Paris.Claessens, O., Granjon, L., De Massary, J.-C. and Ringuet, S. (2002) La station de recherche de Saint-Eugène:
situation, environment et présentation générale. In: Forget, P.-M. (ed.) Fragmentation of tropical rain-forest: Petit Saut dam, Sinnamary river, French Guiana. Revue d’Ecologie (Terre et Vie), Supplement 8,Paris, pp. 21–37.
Cockle, A. (1997) Modalités de dissémination et d’établissement de lianes de sous-bois (Cylanthaceae etPhilodendron) en forêt guyanaise. Thèse de doctorat de l’Université Paris VI, Paris.
Connell, J.H. and Lowman, M.D. (1989) Low-diversity tropical rain forests: some possible mechanisms fortheir existence. American Naturalist 134, 88–119.
Cosson, J.-F. (1994) Dynamique de population et dispersion de la Chauve-Souris frugivore Carollia perspic-illata en Guyane Française. Thèse de doctorat de l’Université Paris XI, Villetaneuse.
Davis, T.A.W. and Richards, P.W. (1933) The vegetation of Moraballi creek, British Guiana: an ecologicalstudy of a limited area of tropical forest. Parts I. Journal of Ecology 21, 350–384.
Davis, T.A.W. and Richards, P.W. (1934) The vegetation of Moraballi creek, British Guiana: an ecologicalstudy of a limited area of tropical forest. Part II. Journal of Ecology 22, 106–155.
Day, R. (1997) Behavioural ecology of the tamarin, Saguinus midas midas, in a Guianense primate commu-nity. PhD thesis, The Queen’s University of Belfast, UK.
De Foresta, H. (1983) Hétérogénéité de la végétation pionnière en forêt tropicale humide: exemple d’unecoupe papetière en forêt guyanaise. Acta Oecologica, Oecologia Applicata 4, 221–235.
De Foresta, H. and Prévost, M.-F. (1986) Végétation pionnière et graines du sol en forêt guyanaise. Biotropica18, 279–286.
De Foresta, H., Charles-Dominique, P., Erard, C. and Prévost, M.-F. (1984) Zoochorie et premiers stades dela régénération naturelle après coupe en forêt guyanaise. Revue d’Ecologie (Terre et Vie) 39, 369–400.
De Granville, J.J. (1977) Notes biologiques sur quelques palmiers guyanais. Cahier ORSTOM, Série Biologievol. XII, 4, 347–353.
de Thoisy, B. and Richard-Hansen, C. (1997) Diet and social behaviour in a red howler monkey (Alouattaseniculus) troop in a highly degraded rainforest. Folia Primatologica 68, 357–361.
Dubost, G. (1987) Une analyse écologique de deux faunes de mammifères forestiers tropicaux. Mammalia51, 415–436.
Dubost, G. (1988) Ecology and social life of the red acouchy, Myoprocta exilis; comparisons with the orange-rumped agouti, Dasyprocta leporina. Journal of Zoology of London 214, 107–123.
Duellman, W.E. (1990) Herpetofaunas in neotropical rainforests: comparative composition, history andresource use. In: Gentry, A.H. (ed.) Four Neotropical Forests. Yale University Press, New Haven,Connecticut, pp. 455–505.
Eigenmann, C.H. (1912) The fresh water fish of British Guiana, including a study of the ecological groupingof species and relation of the fauna of the plateau to that of the lowlands. Memoirs of the CarnegieMuseum 5, 1–578.
Eisenberg, J.F. (1989) Mammals of the Neotropics. The Northern Neotropics; Vol. 1. University of ChicagoPress, Chicago, Illinois.
Ek, R. (1997) Botanical Diversity in the Tropical Rain Forest of Guyana. Tropenbos-Guyana Series 4.Tropenbos-Guyana, Georgetown.
Emmons, L.H. and Feer, F. (1990) Neotropical Rainforest Mammals: a Field Guide. University of ChicagoPress, Chicago, Illinois.
Endler, J.A. and Théry, M. (1996) Interactions effects of lek placement, display behavior, ambient light, andcolor patterns in three neotropical forest-dwelling birds. The American Naturalist 148, 421–452.
Engstrom, M.D. and Lim, B.K. (2002) Mamíferos de Guyana. In: Ceballos, G. and Simonetti, J.A. (eds)Diversidad y conservación de los mamiferos neotropicales. Comisión Nacional para el Conocimientoy Uso de la Biodiversidad, Mexico, pp. 329–375.
Erard, C. and Sabatier, D. (1989) Rôle des oiseaux frugivores terrestres dans la régénération forestière enGuyane française. Proceedings of International Ornithological Congress 19, 803–815.
Erard, C. and Théry, M. (1994) Frugivorie et ornithochorie en forêt guyanaise: l’exemple des grands oiseauxterrestres et de la pénélope marail. Alauda 62, 27–31.
Erard, C., Théry, M. and Sabatier, D. (1989) Régime alimentaire de Rupicola rupicola (Cotingidae) en Guyanefrançaise: relations avec le frugivorie et la zoochorie. Revue d’Ecologie (Terre et Vie) 44, 47–74.
Erard, C., Théry, M. and Sabatier, D. (1991) Régime alimentaire de Tinamus major (Tinamidae), Crax alec-tor (Cracidae) et Psophia crepitans (Psophidae), en forêt guyanaise. Gibier Faune Sauvage 8, 183–210.
Feer, F. and Charles-Dominique, P. (2001) Mammals of the Nouragues and lower Arataye areas. In: Bongers,F., Charles-Dominique, P., Forget, P.-M. and Théry, M. (eds) Nouragues: Dynamics and Plant–AnimalInteractions in a Neotropical Rainforest. Kluwer Academic, Dordrecht, The Netherlands, pp. 351–355.
Feer, F., Henry, O., Forget, P.-M. and Gayot, M. (2001a) Frugivory and seed dispersal by terrestrial mam-mals. In: Bongers, F., Charles-Dominique, P., Forget, P.-M. and Théry, M. (eds) Nouragues: Dynamicsand Plant–Animal Interactions in a Neotropical Rainforest. Kluwer Academic, Dordrecht, TheNetherlands, pp. 207–215.
Feer, F., Julliot, C., Simmen, B., Forget, P.M., Bayart, F. and Chauvet, S. (2001b) Recruitment, a multi-stageprocess with unpredictable result: the case of a Sapotaceae in French Guianan forest. Revue d’EcologieTerre et Vie 56, 119–145.
Ferrari, S.F. (1995) Observations on Chiropotes albinasus from the Rio dos Marmelos, Amazonas, Brazil.Primates 36, 289–293.
Fitzgerald, K.A. (2003) Utilizing ecological indicators to assist in the management of Brownsberg NaturePark, Suriname, South America. MSc thesis, Washington State University.
Fitzgerald, K.A., de Dijn, B.P.E. and Mitro, S. (2002) Brownsberg Nature Park Ecological Research andMonitoring Program: 2001–2006. STINASU, Paramaribo, Suriname.
Fleming, T.H. (1991) Fruiting plant–frugivore mutualism: the evolutionary theater and the ecological play. In:Price, P.W., Lewinsohn, T.M., Fernandes, G.W. and Benson, W.W. (eds) Plant–Animal Interactions:Evolutionary Ecology in Tropical and Temperate Regions. John Wiley & Sons, New York, pp. 119–144.
Fleming, T.H. and Heithaus, E.R. (1981) Frugivorous bats, seed shadows, and the structure of tropical forests.Biotropica (supplement Reproductive Botany), 45–53.
Fleming, T.H., Hooper, E.T. and Wilson, D.E. (1972) Three Central American bat communities: structure,reproductive cycles, and movement patterns. Ecology 53, 555–569.
Fleming, T.H., Williams, C.F., Bonaccorso, F.J. and Herbst, L.H. (1985) Phenology, seed dispersal, and col-onization in Muntingia calabura, a neotropical pioneer tree. American Journal of Botany 72, 383–391.
Foerster, C.R. and Vaughan, C. (2002) Home range, habitat use, and activity of Baird’s tapir in Costa Rica.Biotropica 34, 423–437.
Foley, W.J., Engelhardt, W.V. and Charles-Dominique, P. (1995) The passage of digesta, particle size, and invitro fermentation rate in three-toed sloth Bradypus tridactylus (Edentata: Bradypodidae). Journal ofZoology of London 236, 681–696.
Forget, P.-M. (1988) Dissémination et régénération naturelle de huit espèces d’arbres en forêt Guyanaise.Thèse de l’Université Pierre et Marie Curie, Paris VI.
Forget, P.-M. (1989) La régénération naturelle d’une espèce autochore de la forêt guyanaise: Eperua falcataAublet (Caesalpiniaceae). Biotropica 21, 115–125.
Forget, P.-M. (1990) Seed-dispersal of Vouacapoua americana (Caesalpiniaceae) by caviomorph rodents inFrench Guiana. Journal of Tropical Ecology 6, 459–468.
Forget, P.-M. (1991a) Comparative recruitment pattern of two non-pioneer tree species in French Guiana.Oecologia 85, 434–439.
Forget, P.-M. (1991b) Scatterhoarding of Astrocaryum paramaca by Proechimys in French Guiana: compar-ison with Myoprocta exilis. Tropical Ecology 32, 155–167.
Forget, P.-M. (1992a) Regeneration ecology of Eperua grandiflora (Caesalpiniaceae), a large-seeded tree inFrench Guiana. Biotropica 24, 146–156.
Forget, P.-M. (1992b) Seed removal and seed fate in Gustavia superba (Lecythidaceae). Biotropica 24,408–414.
Forget, P.-M. (1993) Post-dispersal predation and scatterhoarding of Dipteryx panamensis (Papilionaceae)seeds by rodents in Panama. Oecologia 94, 255–261.
Forget, P.-M. (1994) Regeneration pattern of Vouacapoua americana (Caesalpiniaceae), a rodent-dispersedtree species in French Guiana. Biotropica 26, 420–426.
Forget, P.-M. (1996) Removal of seeds of Carapa procera (Meliaceae) by rodents and their fate in rainforestin French Guiana. Journal of Tropical Ecology 12, 751–761.
Forget, P.-M. (1997a) Effect of microhabitat on seed fate and seedling performance in two rodent-dispersedtree species in rainforest in French Guiana. Journal of Ecology 85, 693–703.
Forget, P.-M. (1997b) Ten-year seedling dynamics in Vouacapoua americana in French Guiana: a hypothe-sis. Biotropica 29, 124–126.
Forget, P.-M. and Milleron, T. (1991) Evidence for secondary seed dispersal in Panama. Oecologia 87, 596–599.
Rainforest Vertebrates and Food Plant Diversity 273
Forget, P.-M. and Sabatier, D. (1997) Dynamics of a seedling shadow in a frugivore-dispersed tree species inFrench Guiana. Journal of Tropical Ecology 13, 767–773.
Forget, P.-M., Munoz, E. and Leigh Jr, E.G. (1994) Predation on seeds falling late in the fruiting season ofScheelea palm on Barro Colorado Island, Panama. Biotropica 26, 408–419.
Forget, P.-M., Milleron, T. and Feer, F. (1998) Patterns in post-dispersal seed removal by neotropical rodentsand seed fate in relation with seed size. In: Newbery, D.M., Prins, H.T.T. and Brown, N.D. (eds)Dynamics of Tropical Communities. Blackwell Scientific, Cambridge, UK, pp. 25–50.
Forget, P.-M., Lambert, J., Hulme, P. and Vander Wall, S.B. (2005) Seed fate: predation, dispersal and seed-ing establishment. CAB International, Wallingford, UK.
Foster, M.S. and Timm, R.M. (1976) Tent-making by Artibeus jamaicensis (Chiroptera Phyllostomatidae) withcomments on plants used by bats for tents. Biotropica 8, 265–269.
Foster, R.A., Parker III, T.A., Gentry, A.H., Emmons, L.H., Chicchón, A., Schulenberg, T., Rodríguez, L.,Lamas, G., Ortega, H., Icochea, J., Wust, W., Romo, M., Castillo, J.A., Phillips, O., Reynel, C., Kratter,A., Donahue, P.K. and Barkley, L.J. (1994) The Tambopata-Candamo Reserved Zone of SoutheasternPerú: A Biological Evodianthus funifer Assessment. RAP Working Papers 6. Conservation International,Washington, DC.
Fragoso, J.M.V. (1997) Tapir-generated seed shadows: scale-dependent patchiness in the Amazon rain for-est. Journal of Ecology 85, 519–529.
Fragoso, J.M.V. (1998a) Home range and movement patterns of white-lipped peccary (Tayassu pecari) herdsin the Northern Brazilian Amazon. Biotropica 30, 458–469.
Fragoso, J.M.V. (1998b) White-lipped peccaries and palms on the ilha de Maraca. In: Milliken, W. andRatter, J.A. (eds) Maraca: the Biodiversity and Environment of an Amazonian Rainforest. John Wiley,Chichester, UK, pp. 151–163.
Fragoso, J.M.V. (1999) Perception of scale and resource partitioning by peccaries: behavioral causes and eco-logical implications. Journal of Mammalogy 80, 993–1003.
Fragoso, J.M.V. and Huffman, J.M. (2000) Seed-dispersal and seedling recruitment patterns by the lastneotropical megafaunal element in Amazonia, the tapir. Journal of Tropical Ecology 16, 369–385.
Freeland, W.J. and Janzen, D.H. (1974) Strategies in herbivory by mammals: the role of plant secondary com-pounds. American Naturalist 108, 269–289.
Gasc, J.-P. (1976) Contribution á la connaissance des Squamates (Reptilia) de la Guyane française. Nouvelleslocalités pour les Sauriens. Comptes Rendus de la Société Biogéographique 454, 17–36.
Gasc, J.-P. (1981) Quelques nouvelles données sur le répartition et l’écologie des sauriens en Guyanefrançaise. Revue d’Ecologie (Terre et Vie) 35, 273–325.
Gasc, J.-P. (1986) Le peuplement herpétologique d’Astrocaryum paramaca (Areacaceae), un palmier impor-tant dans la structure de la forêt en Guyane française. Mémoires du Muséum National d’Histoirenaturelle, Nouvelle Série, Série A, Zoologie 132, 97–107.
Gasc, J.-P. and Rodrigues, M.T. (1980) Liste préliminaire des serpents de Guyane française. Bulletin duMuseum National Histoire Naturelle, Serie 4, 2, 559–598.
Gayot, M. (2000) Stratégie alimentaire de deux espèces de Cervidés de Guyane française (Mazama spp.) etcomparaison avec des Bovidés du Gabon (Cephalophus pp.). DEA thesis, Université Pierre et MarieCurie, Paris.
Gayot, M., Henry, O., Dubost, G. and Sabatier, D. (2004) Comparative diet of the two forest cervids of thegenus Mazama in French Guiana. Journal of Tropical Ecology 20, 31–43.
Genoways, H.H. and Williams, S.L. (1979) Records of bats (Mammalia: Chiroptera) from Suriname. Annalsof the Carnegie Museum 48, 323–335.
Géry, J. (1972) Poissons characoïdes des Guyanes. I. Généralités. II. Famille des Serrasalmidae. ZoologicaVerhandelening 122, 1–260.
Gill Jr, G.E., Fowler, R.T. and Mori, S.A. (1998) Pollination biology of Symphonia globulifera (Clusiaceae) incentral French Guiana. Biotropica 30, 139–144.
Gompper, M.E. (1994) The importance of ecology, behavior, and genetics in the maintenance of coati (Nasuanarica) social structure. PhD thesis, University of Tennessee, Knoxville.
Gompper, M.E. (1995) Nasua narica. Mammalian Species 487, 1–10.Goulding, M., Leal Carvalho, M. and Ferreira, E.G. (1988) Rio Negro, Rich Life in Poor Water. SPB
Academic, The Hague, The Netherlands.Greenhall, A.M. (1959) Bats of Guiana. Journal of the British Guiana Museum 22, 55–57.Greenhall, A.M. (1965) Sapucaia nut dispersal by greater spear-nosed bats in Trinidad. Caribbean Journal of
Science 5, 167–171.
274 P.-M. Forget and D.S. Hammond
Greenwood, J.J.D. (1985) Frequency-dependent selection by seed-predators. Oikos 44, 195–210.Gribel, R. (1988) Visits of Caluromys lanatus (Didelphidae) to flowers of Pseudobombax tomentosum
(Bombacaceae): a probable case of pollination by marsupials in central Brazil. Biotropica 20, 344–347.Guillotin, M. (1982a) Activités et régimes alimentaires: leurs interactions chez Proechimys cuvieri et
Oryzomys capito velutinus (Rodentia) en forêt guyanaise. Revue d’Ecologie (Terre et Vie) 36, 337–371.Guillotin, M. (1982b) Place de Proechimys cuvieri (Rodentia, Echimidae) dans les peuplements micromam-
maliens terrestres de la forêt guyanaise. Mammalia 46, 299–318.Guillotin, M., Dubost, G. and Sabatier, D. (1994) Food choice and food composition among three major pri-
mate species of French Guiana. Journal of Zoology 233, 551–579.Hallwachs, W. (1986) Agoutis Dasyprocta punctata: the inheritors of guapinol Hymenaea courbaril
(Leguminosae). In: Estrada, A. and Fleming, T.H. (eds) Frugivores and Seed Dispersal. Dr. W. JunkPublishers, The Hague, pp. 119–135.
Hammond, D.S. (1998) Biodiversity conservation as a sustainable forest management tool. In: Zagt, R.J. (ed.)Research in Tropical Rain Forests: Its Challenges for the Future. Tropenbos Foundation, Wageningen,The Netherlands, pp. 231–247.
Hammond, D.S. and Brown, V.K. (1995) Seed size of woody plants in relation to disturbance, dispersal, soiltype in wet neotropical forests. Ecology 76, 2544–2561.
Hammond, D.S. and Brown, V.K. (1998) Disturbance, phenology and life-history characteristics: factorsinfluencing distance/density-dependent attack on tropical seeds and seedlings. In: Newbery, D.M.,Prins, H.T.T. and Brown, N.D. (eds) Dynamics of Tropical Communities. Blackwell Scientific,Cambridge, UK, pp. 51–78.
Hammond, D.S., Schouten, A., van Tienen, L., Weijerman, M. and Brown, V.K. (1992) The importance ofbeing a forest animal: implications for Guyana’s timber trees. Proceedings of the 6th AnnualNARI/CARDI Review Conference, Georgetown, pp. 144–151.
Hammond, D.S., Gourlet-Fleury, S., van der Hout, P., ter Steege, H. and Brown, V.K. (1996) A compilationof known Guianan timber trees and the significance of their dispersal mode, seed size and taxonomicaffinity to tropical rain forest management. Forest Ecology and Management 83, 99–116.
Hammond, D.S., Brown, V.K. and Zagt, R.J. (1999) Spatial and temporal patterns of seed attack and germi-nation in a large-seeded neotropical tree species. Oecologia 119, 208–218.
Harms, K.E. and Dalling, J.W. (1997) Damage and herbivory tolerance through resprouting as an advantageof large seed size in tropical trees and lianas. Journal of Tropical Ecology 13, 617–621.
Hart, T.B., Hart, J.A. and Murphy, P.G. (1989) Monodominant and species-rich forests of the humid tropics:causes for their co-occurrence. American Naturalist 133, 613–633.
Haverschmidt, F. (1968) Birds of Surinam. Oliver and Boyd, London.Heithaus, E.R. (1982) Coevolution between bats and plants. In: Kuntz, T.H. (ed.) Ecology of Bats. Plenum
Press, London, pp. 327–367.Heithaus, E.R., Opler, P.A. and Baker, H.G. (1974) Bat activity and pollination of Bauhinia pauletia:
plant–pollinator coevolution. Ecology 55, 412–419.Heithaus, E.R., Fleming, T.H. and Opler, P.A. (1975) Foraging pattern and resources utilization in seven
species of bats in a seasonal tropical forest. Ecology 56, 841–854.Henry, O. (1994a) Caractéristiques et variations saisonnières de la reproduction de quatre mammifères
forestiers terrestres de Guyane française: Oryzomys capito velutinus (Rodentia, Cricetidae), Proechimyscuvieri (Rodentia, Echimyidae), Dasyprocta leporina (Rodentia, Dasyproctidae) and Tayassu tajacu(Artiodactyle, Tayassuidae). Influence de l‘age, des facteurs environnementaux et de l’alimentation.Thèse de doctorat de l’Université Paris VII, Paris.
Henry, O. (1994b) Saisons de reproduction chez trois Rongeurs et un Artiodactyle en Guyane française, enfonction des facteurs du milieu et de l’alimentation. Mammalia 58, 183–200.
Henry, O. (1996) The influence of sex and reproductive state on diet preference in four terrestrial mammalsof the French Guianan rainforest. Canadian Journal of Zoology 75, 929–935.
Henry, O. (1999) Dietary choice of the orange-rumped agouti (Dasyprocta leporina) in French Guiana.Journal of Tropical Ecology 13, 291–300.
Henry, O., Feer, F. and Sabatier, D. (2000) Diet of the lowland tapir (Tapirus terrestris L.) in French Guiana.Biotropica 32, 364–368.
Higgins, M.L. (1979) Intensity of seed predation on Brosimum utile by mealy parrots (Amazona farinosa).Biotropica 11, 80.
Holthuijzen, A.M.A. and Boerboom, J.H.A. (1982) The Cecropia seedbank in the Surinam lowland rain for-est. Biotropica 14, 62–68.
Rainforest Vertebrates and Food Plant Diversity 275

Hoogmoed, M.S. (1973) Notes on the Herpetofauna of Surinam, IV. The Lizards and Amphisbaenians ofSurinam. Biogeographica No. 4. Junk, The Hague, The Netherlands.
Hoogmoed, M.S. (1979) The herpetofauna of the Guianan region. In: Duellman, W.E. (ed.) The SouthAmerican Herpetofauna: Its Origin, Evolution and Dispersal. Monographs of the Museum of NaturalHistory University of Kansas 7, 241–279.
Hoogmoed, M.S. and Lescure, J. (1975) An annotated checklist of the lizards of French Guiana, mainly basedon two recent collections. Zoologischen Mededlingen 49, 141–171.
Hopkins, H.C. and Hopkins, M.J.G. (1983) Fruit and seed biology of the neotropical species of Parkia. In:Sutton, S.L., Whitmore, T.C. and Chadwick, A.C. (eds) Tropical Rain Forest Ecology and Management.Blackwell, Oxford, UK, pp. 197–209.
Howe, H.F. (1980) Monkey dispersal and waste of a neotropical fruit. Ecology 61, 944–959.Howe, H.F. (1986) Seed dispersal by fruit-eating birds and mammals. In: Murray, D.R. (ed.) Seed Dispersal.
Academic Press Australia, Sydney, pp. 123–189.Howe, H.F. and Primack, R.B. (1975) Differential seed dispersal by birds of the tree Casearia nitida
(Flacourtiaceae). Biotropica 7, 278–263.Howe, H.F. and Smallwood, J.H. (1982) Ecology of seed dispersal. Annual Review of Ecology and
Systematics 13, 201–228.Howe, H.F. and Westley, L.C. (1988) Ecological Relationships of Plants and Animals. Oxford University
Press, Oxford, UK.Howe, H.F., Schupp, E.W. and Westley, L.C. (1985) Early consequences of seed dispersal for a neotropical
tree (Virola surinamensis). Ecology 66, 781–791.Husson, A.M. (1962) The Bats of Suriname. Zoologische Verhandelingen No. 58. E.J. Brill, Leiden, The
Netherlands.Husson, A.M. (1978) The Mammals of Suriname. Zoöl. Monogr. Rijksmuseum Nat. Historie No. 2. E.J. Brill,
Leiden, The Netherlands.Jansen, P.A. and Forget, P.-M. (2001) Scatterhoarding by rodents and tree regeneration in French Guiana. In:
Bongers, F., Charles-Dominique, P., Forget, P.-M. and Théry, M. (eds) Nouragues: Dynamics andPlant–Animal Interactions in a Neotropical Rainforest. Kluwer Academic Publishers, Dordrecht, TheNetherlands, pp. 275–288.
Jansen, P.A., Bartholomeus, M., Bongers, F., Elzinga, J.A., Den Ouden, J. and van Wieren, S.E. (2002) Therole of seed size in dispersal by a scatter-hoarding rodent. In: Levey, D.J., Silva, W.R. and Galetti, M.(eds) Seed Dispersal and Frugivory: Ecology, Evolution and Conservation. CAB International,Wallingford, UK, pp. 209–225.
Jansen, P.A., Bongers, F. and Hemerik, L. (2004) Seed mass and mast seeding enchance dispersal by aneotropical scatter-hoarding rodents. Ecological Monographs 74, 569–589.
Jansen, P. A. and den Ouden, J. (2005) Observing seed removal: remote video monitoring of seed selection,predation and dispersal. In: Forget, P.-M., Lambert, J.E., Hulme, P.E. and Vander Wall, B. (eds) Seedfate: predation, dispersal and seedling establishment. CAB International, Wallingford, UK, pp. 363–378.
Janson, C.H., Terborgh, J.W. and Emmons, L.H. (1981) Nonflying mammals as pollinating agents in theAmazonian forests. Biotropica 13 (supplement), 1–6.
Janzen, D.H. (1969) Seed-eaters versus seed size, number, toxicity and dispersal. Evolution 23, 1–27.Janzen, D.H. (1970) Herbivores and the number of species in tropical forests. American Naturalist 104, 501–528.Janzen, D.H. (1971) Seed predation by animals. Annual Review of Ecology and Systematics 2, 465–
492.Janzen, D.H. (1974) Tropical black water rivers, animals, and mast fruiting by the Dipterocarpaceae.
Biotropica 6, 69–103.Janzen, D.H. (1981a) Lectins and plant–herbivore interactions. Recent Advances in Phytochemistry 15,
241–258.Janzen, D.H. (1981b) Digestive seed predation by a Costa Rican Baird’s tapir. Biotropica 13, 59–63.Janzen, D.H. (1982) Removal of seeds from horse dung by tropical rodents: influence of habitat and amount
of dung. Ecology 63, 1887–1900.Janzen, D.H. (1983a) Dispersal of seeds by vertebrates guts. In: Futuyma, D.J. and Slatkin, M. (eds)
Coevolution. Sinauer Associates, Sunderland, pp. 232–262.Janzen, D.H. (1983b) Tapirus bairdii. In: Janzen, D.H. (ed.) Costa Rican Natural History. University of
Chicago Press, Chicago, Illinois, pp. 496–497.Janzen, D.H. (1986) Mice, big mammals, and seeds: it matters who defecate what where. In: Estrada, A. and
Fleming, T.H. (eds) Frugivores and Seed Dispersal. Dr. W. Junk Publishers, The Hague, pp. 251–271.
276 P.-M. Forget and D.S. Hammond

Janzen, D.H. and Martin, P.S. (1982) Neotropical anachronisms: the fruits the gomphotheres ate. Science215, 19–27.
Janzen, D.H., Juster, H.B. and Liener, I.E. (1976a) Insecticidal action of the phytohemagglutinin in blackbeans on a bruchid beetle. Science 192, 795–796.
Janzen, D.H., Miller, G.A., Hackforth-Jones, J., Pond, C.M., Hooper, K. and Janos, D.P. (1976b) TwoCosta Rican bat-generated seed shadow of Andira inermis (Leguminosae). Ecology 57, 1068–1075.
Johns, A.G. (1997) Timber Production and Biodiversity Conservation in the Tropical Rain Forests. CambridgeUniversity Press, Cambridge, UK.
Judas, J. (1999) Ecologie du Pécari à collier (Tayassu tajacu) en forêt tropicale humide de Guyane française.Thèse de doctorat de l’Université F. Rabelais, Tours, France.
Judas, J. and Henry, O. (1999) Seasonal variation of home range of collared peccary in tropical rain forest ofFrench Guiana. Journal of Wildlife Management 63, 546–552.
Julien-Laferrière, D. (1989) Utilisation de l’espace et des ressources alimentaires chez Caluromys philander(Marsupiala, Didelphidae) en Guyane Française. Comparaison avec Potos flavus (Eutheria,Procyonidae). Thèse de doctorat de l’Université Paris XIII, Villetaneuse.
Julien-Laferrière, D. (1990) Actographie chez Caluromys philander (Marsupiala, Didelphidae) en Guyanefrançaise. Compte Rendus de l’Académie des Sciences Paris, Série III, 311, 25–30.
Julien-Laferrière, D. (1993) Radio-tracking observations on ranging and foraging patterns by kinkajous (Potosflavus) in French Guiana. Journal of Tropical Ecology 9, 19–32.
Julien-Laferrière, D. (1995) Use of space by the woolly opossum Caluromys philander (Marsupiala,Didelphidae) in French Guiana. Canadian Journal of Zoology 73, 1280–1289.
Julien-Laferrière, D. (1997) The influence of moonlight on activity of woolly opossum (Caluromys philander).Journal of Mammalogy 78, 251–255.
Julien-Laferrière, D. (1999a) Foraging strategies and food partitioning in the neotropical frugivorous mam-mals Caluromys philander and Potos flavus. Journal of Zoology, London 247, 71–80.
Julien-Laferrière, D. (1999b) Fruit consumption, seed dispersal and seed fate in the vine Strychnos erichsoniiin a French Guianan forest. Revue d’ Ecologie (Terre et Vie) 54, 315–326.
Julien-Laferrière, D. (2001) Frugivory and seed dispersal by Kinkajous. In: Bongers, F., Charles-Dominique,P., Forget, P.-M. and Théry, M. (eds) Nouragues: Dynamics and Plant–Animal Interactions in aNeotropical Rainforest. Kluwer Academic, Dordrecht, The Netherlands, pp. 217–225.
Julien-Laferrière, D. and Atramentowicz, M. (1990) Feeding and reproduction of three Didelphid Marsupialsin two neotropical forests (French Guiana). Biotropica 22, 404–415.
Julliot, C. (1993) Diet of the red howler monkeys (Alouatta seniculus) in French Guiana. International Journalof Primatology 14, 527–550.
Julliot, C. (1994) Frugivory and seed dispersal by red howler monkeys: evolutionary aspect. Revue d’Ecologie(Terre et Vie) 49, 331–341.
Julliot, C. (1996a) Fruit choice by red howler monkeys (Alouatta seniculus) in a tropical rain forest. AmericanJournal of Primatology 40, 261–282.
Julliot, C. (1996b) Seed dispersal by red howler monkeys (Alouatta seniculus) in the tropical rain forest ofFrench Guiana. International Journal of Primatology 17, 239–258.
Julliot, C. (1997) Impact of seed dispersal by red howler monkeys (Alouatta seniculus) on the seedling pop-ulation in the understorey of tropical rainforest. Journal of Ecology 85, 431–440.
Julliot, C. and Sabatier, D. (1993) Diet of the red howler monkey (Alouatta seniculus) in French Guiana.International Journal of Primatology 14, 527–550.
Julliot, C., Simmen, B. and Zhang, S.Y. (2001) Frugivory and seed dispersal by monkeys at the Nouraguesstation in French Guiana. In: Bongers, F., Charles-Dominique, P., Forget, P.-M. and Théry, M. (eds)Nouragues: Dynamics and Plant–Animal Interactions in a Neotropical Rainforest. Kluwer Academic,Dordrecht, The Netherlands, pp. 197–215.
Kahn, F. and De Granville, J.J. (1992) Palms in Forest Ecosystems of Amazonia. Ecological Studies No. 95.Springer, Berlin.
Kalko, E.K.V. (1997) Diversity in tropical bats. In: Ulrich, H. (ed.) Tropical Biodiversity and Systematics.Proceedings of the international symposium on biodiversity and systematics in tropical ecosystems.Zoologisches Forschunginstitut und Museum Alexander Koenig, Bonn, pp. 13–43.
Kalko, E.K.V. and Handley, C.O. (2001) Neotropical bats in the canopy: diversity, community structure, andimplications for conservation. Plant Ecology 153, 319–333.
Kalko, E.K.V., Handley Jr, C.O. and Handley, D. (1996) Organization, diversity and long-term dynamics of
Rainforest Vertebrates and Food Plant Diversity 277

a neotropical bat community. In: Cody, M.L. and Smallwood, J.A. (eds) Long-term Studies of VertebrateCommunities. Academic Press, New York, pp. 503–533.
Karr, J.R., Robinson, S.K., Blake, J.G. and Bierregaard Jr, R.O. (1990) Birds of four neotropical forests. In:Gentry, A.H. (ed.) Four Neotropical Forests. Yale University Press, London, pp. 237–269.
Kay, R.F., Madden, R.H., van Schaik, C. and Higdon, D. (1997) Primate species richness is determined byplant productivity: implications for conservation. Proceedings of the National Academy of Sciences,USA 94, 13023–13027.
Kays, R.W. and Gittleman, J.L. (1995) Home range size and social behavior of kinkajous (Potos flavus) in theRepublic of Panama. Biotropica 27, 530–534.
Kessler, P. (1995) Preliminary field study of the red-handed tamarin, Saguinus midas, in French Guiana.Neotropical Primates 3, 184–185.
Kiltie, R.A. (1980) Stomach content of rain forest peccaries (Tayassu tajacu and T. pecari). Biotropica 13,234–236.
Kiltie, R.A. (1981) Distribution of palm fruit on a rain forest floor: why white-lipped peccaries forage nearobjects. Biotropica 6, 69–103.
Kiltie, R.A. (1982) Bite force as a basis for niche differentiation between rain forest peccaries (Tayassu tajacuand T. pecari). Biotropica 14, 188–195.
Kinzey, W.G. and Norconk, M.A. (1993) Physical and chemical properties of fruit and seeds eaten byPithecia and Chiropotes in Surinam and Venezuela. International Journal of Primatology 14, 207–228.
Krijger, C.L., Opdam, M., Théry, M. and Bongers, F. (1997) Courtship behaviour of manakins and seed bankcomposition in a French Guianan rain forest. Journal of Tropical Ecology 13, 631–636.
Kubitski, K. (1985) Ichthyochory in Gnetum venosum. Anais da Academia Brasiliera de Ciéncia 57, 513–516.Kunz, T.H. and Diaz, C.A. (1995) Folivory in fruit-eating bats, with new evidence from Artibeus jamaicensis
(Chiroptera: Phyllostomatinae). Biotropica 27, 106–120.Larpin, D. (1989) Evolution floristique et structurale d’un recru forestier en Guyane française. Revue
d’Ecologie (Terre et Vie) 44, 209–224.Lehman, S.M. (2000) Primate community structure in Guyana: a biogeographic analysis. International
Journal of Primatology 21, 333–351.Leighton, M. and Leighton, D.R. (1983) Vertebrate responses to fruiting seasonality within a Bornean rain for-
est. In: Sutton, S.L., Whitmore, T.C. and Chadwick, A.C. (eds) Tropical Rain Forest: Ecology andManagement. Blackwell Scientific, London, pp. 181–196.
Lescure, J.-P. (1981) La végétation et la flore dans la région de la Piste de Saint-Ellie. Bulletin d’ECEREX 3,4–23.
Lescure, J.-P. and Boulet, R. (1985) Relationships between soil and vegetation in a tropical rain forest inFrench Guiana. Biotropica 17, 155–164.
Lewis, D.H. (1985) Symbiosis and mutualism: crisp concepts and soggy semantics. In: Boucher, D.H. (ed.)The Biology of Mutualism. Oxford University Press, Oxford, UK, pp. 29–39.
Lim, B.K. and Engstrom, H.D. (2000) Preliminary survey of bats from the upper Mazaruni of Guyana.Chiroptera Neotropical 6, 119–123.
Lim, B.K. and Engstrom, M.D. (2001a) Bat community structure at Iwokrama Forest, Guyana. Journal ofTropical Ecology 17, 647–665.
Lim, B.K. and Engstrom, M.D. (2001b) Species diversity of bats (Mammalia: Chiroptera) in Iwokrama Forest,Guyana, and the Guianan subregion: implications for conservation. Biodiversity and Conservation 10,613–657.
Lim, B.K., Engstrom, H.D., Timm, R.M., Anderson, R.P. and Watson, L.C. (1999) First records of 10 batspecies in Guyana and comments on diversity of bats in Iwokrama forest. Acta Chiropterologica 1,179–190.
Lim, B.K., Peterson, A.T. and Engstrom, M.D. (2002) Robustness of ecological niche modeling algorithms formammals in Guyana. Biodiversity and Conservation 11, 1237–1246.
Loubry, D. (1993) Les paradoxes de l’angélique (Dicorynia guianensis Amshoff): dissémination et parasitismedes graines avant dispersion chez un arbre anémochore de forêt guyanaise. Revue d’Ecologie (Terre etVie) 48, 353–363.
Lowe-McConnell, R.H. (1964) The fishes of the Rupununi savanna district of British Guiana, Pt. 1. Groupingsof fish species and effects of the seasonal cycles on the fish. Journal of the Linnean Society (Zoology)45, 103–144.
Marinho-Filho, J.S. (1991) The coexistence of two frugivorous bats species and the phenology of their foodplants in Brazil. Journal of Tropical Ecology 7, 59–67.
278 P.-M. Forget and D.S. Hammond
Maury-Lechon, G. and Poncy, O. (1986) Dynamique forestière sur 6 hectares de forêt dense humidede Guyane française, à partir des données de quelques espèces de forêt primaire et de cicatris-ation. Mémoires du Muséum national d’Histoire naturelle, Nouvelle Série, Série A, Zoologie 132,211–242.
Matola, S. and Todd, S. (1997) Tapir specialist group. Current field work. Species 29, 52.Métrailler, S. and Le Gratiet, G. (1996) Tortues Continentales de Guyane Française. PMS, Bramois,
Switzerland.Meyer de Shauensee, R. and Phelps Jr, W.H. (1978) A Guide to the Birds of Venezuela. Princeton University
Press, London.Mittermeier, R.A. (1987) Hunting and its effects on wild primate populations in Suriname. In: Robinson, J.G.
and Redford, K.H. (eds) Neotropical Wildlife Use and Conservation. University of Chicago Press,Chicago, Illinois, pp. 93–110.
Mittermeier, R.A. and van Roosmalen, M.G.M. (1981) Preliminary observations on habitat utilisation and dietin eight Suriname monkeys. Folia Primatologica 36, 1–39.
Morris, D.O. (1962) The behavior of the green acouchi (Myoprocta pratti) with special reference to scatter-hoarding. Proceedings of the Royal Zoological Society 139, 701–732.
Muckenhirn, N.A., Mortensen, B., Vessey, S., Fraser, C.E. and Singh, B. (1976) Report on a Primate Surveyin Guyana. Pan-American Health Organization, Washington, DC.
Norconk, M.A. and Kinzey, W.G. (1994) Challenge for neotropical frugivory: travel patterns of spider mon-keys and bearded sakis. American Journal of Primatology 34, 171–183.
Norconk, M.A., Wertis, C. and Kinzey, W.G. (1997) Seed predation by monkeys and macaws in EasternVenezuela: preliminary findings. Primates 38, 177–184.
Ochoa, J.G. (1995) Los mamiferos de la region de Imataca, Venezuela. Acta Cientifica Venezolana 46,274–287.
Ochoa, J.G. (2000) Effects of logging on small-mammal diversity in the lowland forests of the VenezuelanGuyana region. Biotropica 32, 146–164.
Ojasti, J. (1967) Consideraciones sobre la ecologia y conservación de la tortuga Podocnemis expansa(Chelonia: Pelomedusidae). Atlas Simposios de Biota Amazônica 7, 201–206.
Oliveira, J.M.S., Lima, M.G., Bonvincino, C., Ayres, J.M. and Fleagle, J.G. (1985) Preliminary note on theecology and behavior of the Guianan saki (Pithecia pithecia, Linnaeus 1766; Cebidae, Primate). ActaAmazonica 15, 249–263.
Ouboter, P. and Mol, J.H.A. (1993) The fish fauna of Suriname. In: Ouboter, P. (ed.) The FreshwaterEcosystems of Suriname. Kluwer Academic, Dordrecht, The Netherlands, pp. 133–154.
Pack, K.S., Henry, O. and Sabatier, D. (1999) The insectivorous-frugivorous diet of the golden-handedtamarin (Saguinus midas midas) in French Guiana. Folia Primatologica 70, 1–7.
Parker, H.W. (1935) The frogs, lizards, and snakes of British Guiana. Proceedings Zoological Society ofLondon 2, 505–530.
Parker III, T.A., Foster, R.B., Emmons, L.H., Gentry, A.H., Beck, S., Estenssoro, S. and Hinojosa, F. (1991) ABiological Assessment of the Alto Madidi Region. RAP Working Papers 1. Conservation International,Washington, DC.
Parker III, T.A., Foster, R.B., Emmons, L.H., Freed, P., Forsyth, A.B., Hoffman, B. and Gill, B.D. (1993) ABiological Assessment of the Kanuku Mountain Region of Southwestern Guyana. RAP Working Papers5. Conservation International, Washington, DC.
Peres, C.A. (1993a) Notes on the ecology of buffy saki monkeys (Pithecia albicans, Gray 1860): a canopyseed-predator. American Journal of Primatology 31, 129–140.
Peres, C.A. (1993b) Structure and spatial organization of an Amazonian terra firme forest primate commu-nity. Journal of Tropical Ecology 9, 259–276.
Peres, C.A. (1994a) Composition, density, and fruiting phenology of arborescent palms in an Amazonianterra firm forest. Biotropica 26, 285–294.
Peres, C.A. (1994b) Primate responses to phenological changes in an Amazonian terra firme forest.Biotropica 26, 98–112.
Peres, C.A. (1996) Population status of while-lipped Tayassu pecari and collared peccaries T. tajacu inhunted and unhunted Amazonian forests. Biological Conservation 77, 115–123.
Peres, C.A. (2000) Identifying keystone plant resources in tropical forests: the case of gums from Parkia pods.Journal of Tropical Ecology 16, 287–317.
Piedade, M.T.F. (1985) Ecologia e biologia reproductiva de Astrocaryum jauaru Mart. (Palmae) como exem-plo de populacão adaptada as areas inundáveis do Rio Negro (Igapós). MSc thesis, INPA.
Rainforest Vertebrates and Food Plant Diversity 279

Planquette, P., Keith, P. and Le Bail, P.-Y. (1996) Atlas des Poissons d’Eau Douce de Guyane. Tome 1.MNHN, Paris.
Poncy, O., Riéra, B., Larpin, D., Belbenoit, P., Jullien, M., Hoff, M. and Charles-Dominique, P. (1998) Thepermanent field research station ‘Les Nouragues‘ in the tropical forest of French Guiana: current proj-ects and preliminary results on tree diversity, structure, and dynamics. In: Dallmeier, F. and Comiskey,J.A. (eds) Forest Diversity in North, Central and South America and the Caribbean: Research andMonitoring. Measuring and Monitoring Tropical Forest Diversity: a Network of Biodiversity Plots. Manand the Biosphere Series 21. Pergamon Press, Washington, DC, pp. 385–410.
Pons, J.M. and Cosson, J.F. (2002) Use of forest fragments by animalivorous bats in French Guiana. Revued’Ecologie (Terre et Vie), 117–130.
Poulin, G., Wright, S.J., Lefebvre, G. and Calderon, O. (1999) Interspecific synchrony and asynchrony in thefruiting phenologies of congeneric bird-dispersed plants in Panama. Journal of Tropical Ecology 15,213–227.
Prance, G. (1980) Pollination of Combretum by monkeys. Biotropica 12, 239.Prévost, M.F. (1983) Les fruits et les graines des espèces végétales pionnières de Guyane française. Revue
d’Ecologie (Terrre et Vie) 38, 122–145.Puyo, J. (1949) Poissons de la Guyane française. Faune de l’empire Français XII. Office de la Recherche
Scientifique d’Outre-mer, Paris.Quelch, J.J. (1892) The bats of British Guiana. Timehri 6, 90–109.Quiroga-Castro, V.D. and Roldan, A.I. (2001) The fate of Attalea phalerata (Palmae) seeds dispersed to a tapir
latrine. Biotropica 33, 472–477.Rankin, J.M. (1978) The influence of seed predation and plant competition on tree species abundances in
two adjacent tropical rain forest communities in Trinidad, West Indies. PhD thesis, University ofMichigan.
Reichart, H.A. (1991) Brownsberg Nature Park Management Plan 1991–1995. WWF and StichtingNatuurbehoud Suriname, Paramaribo, Suriname.
Richard-Hansen, C., Vié, J.-C., Vidal, N. and Kéravec, J. (1999) Body measurements of 40 species of mam-mals from French Guiana. Journal of Zoology 247, 419–428.
Richards, P.W. (1996) The Tropical Rain Forest, 2nd edn. Cambridge University Press, Cambridge,UK.
Ridgely, R. and Agro, D. (1999) Birds of the Iwokrama Forest. Iwokrama International Centre, Georgetown,Guyana.
Riéra, B. (1985) Importance des buttes de déracinement dans la régénération forestière en Guyane française.Revue d’Ecologie (Terre et Vie) 40, 1–9.
Robinson, J.G. and Redford, K.H. (1986) Body size, diet, and population density of neotropical forest mam-mals. American Naturalist 128, 665–680.
Rodrigues, M., Olmos, F. and Galetti, M. (1993) Seed dispersal by tapir in Southeastern Brazil. Mammalia57, 460–462.
Rollet, B. (1969) La régénération naturelle en forêt dense humide sempervirente de plaine de la guyanevénézuelienne. Bois et Forêts des Tropiques 124, 19–38.
Rylands, A.B. and Keuroghlian, A. (1988) Primate populations in continuous forest and forest fragments inCentral Amazonia. Acta Amazonica 18, 29–1307.
Sabatier, D. (1983) Fructification and dissémination en Forêt Guyanaise. L’exemple de quelques espècesligneuses. Thèse de doctorat de l’Université USTL, Montpellier, France.
Sabatier, D. (1985) Saisonnalité et déterminisme du pic de fructification en forêt guyanaise. Revue d’Ecologie(Terre et Vie) 40, 289–320.
Sabatier, D. and Prévost, M.-F. (1990) Quelques données sur la composition floristique et la diversité despeuplements forestiers de Guyane française. Bois et Forêts des Tropiques 219, 31–55.
Sabatier, D., Grimaldi, M., Prévost, M.-F., Guillaume, J., Godron, M., Dosso, M. and Curmi, P. (1997) Theinfluence of soil cover organization on the floristic and structural heterogeneity of a Guianan rain for-est. Plant Ecology 131, 81–108.
Salas, L.A. (1996) Habitat use by lowland tapirs (Tapirus terrestris L.) in the Tabaro River valley, southernVenezuela. Canadian Journal of Zoology 74, 1452–1458.
Salas, L.A. and Fuller, T.K. (1996) Diet of the lowland tapir (Tapirus terrestris L.) in the Tabaro River valley,southern Venezuela. Canadian Journal of Zoology 74, 1444–1451.
Schuchmann, K.L. (1984) Zur ernährung des Cayenne Felsenhahnes (Rupicola rupicola, Cotingidae). Journalfür Ornithologie 125, 239–241.
280 P.-M. Forget and D.S. Hammond

Schupp, E.W. (1988) Factors affecting post-dispersal seed survival in a tropical forest. Oecologia 76,526–530.
Schupp, E.W. and Frost, E.J. (1989) Differential predation of Welfia georgii seeds in treefall gaps and the for-est understorey. Biotropica 21, 200–203.
Setz, E. (1992) Comportamento de alimentação de Pithecia pithecia (Cebidae, Primatas) em um fragmentoflorestal. Primatologia no Brasil 3, 327–330.
Setz, E.Z.F. (1993) Ecologia alimentar de um grupo de paravacus (Pithecia pithecia chrysocephala) em umfragmento florestal na amazonia central. PhD thesis, University of Campinas, Brazil.
Setz, E.Z.F. (1996) Foraging ecology of golden-faced sakis in a forest fragment in central Amazon. XVIthCongress of the International Primatological Society and the XIXth Conference of the American Societyof Primatologists, 11–16 August, University of Wisconsin-Madison, p. 157.
Silvius, K.M. (2002) Spatio-temporal patterns of palm endocarp use by three Amazonian forest mammals:granivory or ‘grubivory’? Journal of Tropical Ecology 18, 707–723.
Silvius, K.M. and Fragoso, J.M.V. (2002) Pulp handling by vertebrate seed dispersers increases palm seed pre-dation by bruchid beetles in the northern Amazon. Journal of Ecology 90, 1024–1032.
Simmen, B. and Sabatier, D. (1996) Diet of some French Guianan primates: food composition and foodchoice. International Journal of Primatology 17, 661–693.
Simmen, B., Julliot, C., Pagès, E. and Bayart, F. (2001) The primate community: population densities andfeeding ecology. In: Bongers, F., Charles-Dominique, P., Forget, P.-M. and Théry, M. (eds) Nouragues:Dynamics and Plant–Animal Interactions in a Neotropical Rainforest. Kluwer Academic, Dordrecht,The Netherlands, pp. 89–101.
Simmons, N.B. and Voss, R.S. (1998) Mammals of Paracou, French Guiana: a neotropical rainforest fauna,part 1. Bats. Bulletin of the American Museum of Natural History 237, 1–219.
Simmons, N.B., Voss, R.S. and Peckham, H.C. (2000) The bat fauna of the Saul region, French Guiana. ActaChiropterologica 2, 23–36.
Sist, P. (1989a) Demography of Astrocaryum sciophilum, an understorey palm of French Guiana. Principes33, 142–151.
Sist, P. (1989b) Stratégies de régénération de quelques palmiers en forêt guyanaise. Thèse de doctorat del’Université Paris VI, Paris.
Sist, P. (1989c) Peuplement et phénologie des palmiers en forêt guyanaise (Piste de St Elie). Revue d’Ecologie(Terre et Vie) 44, 113–151.
Sist, P. and Puig, H. (1987) Régénération, dynamique des populations et dissémination d’un palmier deGuyane française: Jessenia bataua (Mart.) Burret subsp. Oligocarpa (Griseb. and H. Wendl.) Balick.Bulletin du Muséum national d’Histoire naturelle, 4ème Série, 9, section B, Adansonia 3, 317–336.
Smith, P.G. and Kerry, S.M. (1996) The Iwokrama Rain Forest Programme for sustainable development: howmuch of Guyana’s bat (Chiroptera) diversity does it encompass? Biodiversity and Conservation 5,921–942.
Smythe, N. (1970) Relationships between fruiting seasons and seed dispersal methods in a neotropical for-est. The American Naturalist 104, 25–35.
Smythe, N. (1978) The natural history of the Central American agouti (Dasyprocta punctata) SmithsonianContribution to Zoology 257, 1–52.
Smythe, N. (1989) Seed survival in the palm Astrocaryum standleyanum: evidence for dependence upon itsseed dispersers. Biotropica 21, 50–56.
Smythe, N., Glanz, W.E. and Leigh Jr, E.G. (1982) Population regulation in some terrestrial frugivores. In:Leigh Jr, E.G., Rand, A.S. and Windsor, D.M. (eds) The Ecology of a Tropical Forest. SmithsonianInstitution Press, Washington, DC, pp. 227–238.
Snow, B.K. (1970) A field study of the beared bellbird in Trinidad. Ibis 112, 299–329.Snow, B.K. (1972) A field study of the calfird Perissocephalus tricolor. Ibis 114, 139–162.Snow, D.W. (1962a) A field study of the black and white manakin, Manacus manacus in Trinidad. Zoologica:
New York Zoological Society 47, 65–63.Snow, D.W. (1962b) A field study of the golden-headed manakin, Pipra erythrocephala, in Trinidad, W. I.
Zoologica: New York Zoological Society 47, 183–198.Snow, D.W. (1963) The evolution of manakin displays. In: Proceedings of the XIIIth Ornithological Congress.
Syracuse University, Ithaca, New York, pp. 553–561.Snow, D.W. (1964) A possible selection factor in the evolution of fruiting seasons in tropical forest. Oikos
15, 274–281.Snow, D.W. (1971) Observations on the purple-throated fruit-crow in Guyana. The Living Bird 10, 5–17.
Rainforest Vertebrates and Food Plant Diversity 281

Snow, D.W. (1981) Tropical frugivous birds and their food plant: a world survey. Biotropica 13, 1–14.Stalling, J.R. (1984) Notes on the feeding habits of Mazama gouazoubira in the Chaco boreal of Paraguay.
Biotropica 16, 155–157.Swihart, R.K., Slade, N.A. and Bergstrom, B.J. (1988) Relating body size to the rate of home range use in
mammals. Ecology 69, 393–399.Tate, G.H.H. (1939) The mammals of the Guiana region. Bulletin of the American Museum of Natural
History 76, 151–229.ter Steege, H. (1998) The use of forest inventory data for a National Protected Area Strategy in Guyana.
Biodiversity and conservation. Biodiversity and Conservation 7, 161–170.ter Steege, H. and Hammond, D.S. (2001) Character convergence, diversity, and disturbance in tropical rain
forest in Guyana. Ecology 82, 3197–3212.ter Steege, H. and Zondervan, G. (2000) A preliminary analysis of large-scale forest inventory data of the
Guiana Shield. In: ter Steege, H. (ed.) Plant Diversity in Guyana. Tropenbos Foundation, Wageningen,The Netherlands, pp. 35–54.
ter Steege, H., Jetten, V., Polak, M. and Werger, M. (1993) Tropical rain forest types and soils of a watershedin Guyana, South America. Journal of Vegetation Science 4, 705–716.
ter Steege, H., Boot, R.G.A., Brouwer, L.C., Caesar, J.C., Ek, R.C., Hammond, D.S., Haripersaud, P.P.,van der Hout, P., Jetten, V.G., van Kekem, A.J., Kellman, M.A., Khan, Z., Polak, A.M., Pons, T.L.,Pulles, J., Raaimakers, D., Rose, S.A., van der Sanden, J.J. and Zagt, R. (1996) Ecology and Logging ina Tropical Rain Forest in Guyana. Tropenbos Series 14. Tropenbos Foundation, Wageningen, TheNetherlands.
Terborgh, J.W. (1986) Keystone plant resources in the tropical forest. In: Soule, M.E. (ed.) ConservationBiology II. Sinauer, Sunderland, pp. 330–344.
Terborgh, J.W. (1988) The big things that run the world – a sequel to E. O. Wilson. Conservation Biology 2,402–403.
Terborgh, J.W. (1992) Maintenance of diversity in tropical forests. Biotropica (supplement) 24, 283–292.Terwillinger, V.J. (1978) Natural history of Baird’s tapir on Barro Colorado Island, Panama Canal Zone.
Biotropica 10, 211–220.Théry, M. (1987a) Influence des caractéristiques lumineuses sur la localisation des sites traditionnels, parade
et baignade des manakins (Passeriformes, Pipridae). Compte Rendus de l’Académie des Sciences, Paris,Série III (1), 304, 19–24.
Théry, M. (1987b) Nidification de Campylopterus largipennis (Trochilidae) en Guyane française. L’oiseau etR.F.O. 57, 141–144.
Théry, M. (1990a) Display repertoire and social organization of the white-fronted and white-throated man-akins. The Wilson Bulletin 102, 123–130.
Théry, M. (1990b) Ecologie et comportement des oiseaux Pipridae en Guyane: leks, frugivorie et dissémina-tion des graines. Thèse de doctorat de l’Université Paris VI, Paris.
Théry, M. (1990c) Influence de la lumière sur le choix de l’habitat et le comportement sexuel des Pipridae(Aves: Passeriformes) en Guyane française. Revue d’Ecologie (Terre et Vie) 45, 215–236.
Théry, M. (1992) The evolution of leks through female choice: differential clustering and space utilization insix sympatric manakins. Behavioral Ecology and Sociobiology 30, 227–237.
Théry, M. (1997) Wing-shape variation in relation to ecology and sexual selection in five sympatric lekkingmanakins (Passeriformes: Pipridae). Ecotropica 3, 9–19.
Théry, M. and Larpin, D. (1993) Seed dispersal and vegetation dynamics at a cock-of-the-rock’s lek in thetropical forest of French Guiana. Journal of Tropical Ecology 9, 109–116.
Théry, M. and Vehrencamp, S.L. (1995) Light patterns as cues for mate choice in the lekking white-throatedmanakin (Corapipo gutturalis). The Auk 112, 133–145.
Théry, M., Erard, C. and Sabatier, D. (1992) Les fruits dans le régime alimentaire de Penelope marail (Aves,Cracidae) en Guyane française: frugivorie stricte et sélective. Revue d’Ecologie (Terre et Vie) 47, 383–401.
Thiollay, J.-M. (1994) Structure, density and rarity in an Amazonian rainforest bird community. Journal ofTropical Ecology 10, 449–481.
Thompson, J., Proctor, J., Viana, V., Milliken, W., Ratter, J.A. and Scott, D.A. (1992) Ecological studies on alowland evergreen rain forest on Maracá Island, Roraima, Brazil. I. Physical environment, forest struc-ture and leaf chemistry. Journal of Ecology 80, 689–703.
Timm, R.M. (1994) The mammal fauna. In: McDade, L.A., Bawa, K.S., Hespenheide, H.A. and Hartshorn,G.S. (eds) La Selva: Ecology and Natural History of a Neotropical Rain Forest. The University of ChicagoPress, Chicago, Illinois, pp. 229–237.
282 P.-M. Forget and D.S. Hammond
Tostain, O., Dujardin, J.-L., Erard, C. and Thiollay, J.-M. (1992) Oiseaux de Guyane. Biologie, Ecologie,Protection et Répartition. Sociétés d’études ornithologiques, MNHN, Brunoy, France.
Trail, P.W. and Donahue, P. (1991) Notes on the behavior and ecology of the red-cotingas (Cotingidae:Phoenicircus). The Willson Bulletin 103, 539–551.
Vander Wall, S.B. (1990) Food Hoarding in Animals. Chicago University Press, Chicago, Illinois.van Roosmalen, M.G.M. (1985) Habitat preferences, diet, feeding strategy and social organization of the black
spider monkey (Ateles paniscus Linnaeus 1758) in Surinam. Acta Amazonica (supplement) 15, 1–238.van Roosmalen, M.G.M., Mittermeier, R.A. and Fleagle, J.G. (1988) Diet of the northern bearded saki
(Chiropotes satanas chiropotes): a neotropical seed predator. American Journal of Primatology 14,11–36.
Vié, J.-C. (1997) Ecology and behavior of white-faced sakis (Pithecia pithecia) in French Guiana. Preliminaryresults. XVIth Congress of the International Primatological Society and the XIXth Conference of theAmerican Society of Primatologists. 11–16 August, University of Wisconsin-Madison.
Vié, J.-C. (1998) Les effets d’une perturbation majeure de l’habitat sur deux espèces de primates en Guyanefrançaise: translocation de singes hurleurs roux (Alouatta seniculus) et translocation et insularisation desakis à face pâle (Pithecia pithecia). Thèse de l’Université de Montpellier II, Montpellier, France.
Vié, J.-C. and Richard-Hansen, C. (1997) Primate translocation in French Guiana. A preliminary report.Neotropical Primates 5, 1–3.
Vié, J.-C., Volobouev, V., Patton, J.L. and Granjon, L. (1996) A new species of Isothrix (Rodentia: echimyi-dae) from French Guiana. Mammalia 60, 393–406.
Vié, J.-C., Richard-Hansen, C. and Fournie-Chambrillon, C. (2001) Abundance, use of space, and activitypatterns of white-faced sakis (Pithecia pithecia) in French Guiana. American Journal of Primatology 55,203–221.
Voss, R.S. and Emmons, L.H. (1996) Mammalian diversity in neotropical lowland rainforests: a preliminaryassessment. Bulletin of the American Museum of Natural History 230, 1–230.
Voss, R.S., Lunde, D.P. and Simmons, N.B. (2001) Mammals of Paracou, French Guiana: a neotropical rain-forest fauna part 2. Nonvolant species. Bulletin of the American Museum of Natural History 263, 1–236.
Wheelwright, N.T. (1985) Fruit size, gape width, and the diets of fruit-eating birds. Ecology 66, 808–818.Wheelwright, N.T. and Orians, G.H. (1982) Seed dispersal by animals: contrasts with pollen dispersal, prob-
lem with terminology, and constraint on coevolution. American Naturalist 119, 402–413.Williams, R.T. (1972) Species variations in drug biotransformations. In: La Du, B.N., Mandel, H.G. and Way,
E.L. (eds) Fundamentals of Drug Metabolism and Drug Distribution. Williams and Wilkins, Baltimore,Maryland, pp. 187–205.
Worthington, A.H. (1982) Population sizes and breeding rhythms of two species of manakins in relation tofood supply. In: Leigh Jr, E.G., Rand, A.S. and Windsor, D.M. (eds) The Ecology of a Tropical Forest.Smithsonian Institution Press, Washington, DC, pp. 213–225.
Worthington, A.H. (1989) Adaptations for avian frugivory: assimilation efficiency and gut transit time ofManacus vitellinus and Pipra mentalis. Oecologia 80, 381–389.
Zhang, S.-Y. (1994) Utilisation de l’espace, stratégies alimentaires et rôle dans la dissémination des grainesdu singe capucin (Cebus apella) en Guyane Française. Thèse de doctorat de l’Université Paris VI, Paris.
Zhang, S.-Y. (1995) Activity and ranging patterns in relation to fruit utilization by brown capuchins (Cebusapella) in French Guiana. International Journal of Primatology 16, 489–507.
Zhang, S.-Y. and Wang, L.-X. (1995a) Comparison of three fruit census methods in French Guiana. Journalof Tropical Ecology 11, 281–294.
Zhang, S.-Y. and Wang, L.-X. (1995b) Fruit consumption and seed dispersal of Ziziphus cinnamomum(Rhamnaceae) by two sympatric primates (Cebus apella and Ateles paniscus) in French Guiana.Biotropica 27, 397–401.
Zona, S. and Henderson, A. (1989) A review of animal-mediated seed dispersal of palms. Selbyana 11, 6–21.
Rainforest Vertebrates and Food Plant Diversity 283

284P.-M
. Forget and D.S. H
amm
ondAppendix 4.1. Plant families found to be part of the diet of 22 herbivorous vertebrates in Guiana Shield forests.

Rainforest V
ertebrates and Food Plant Diversity
285
continued

286P.-M
. Forget and D.S. H
amm
ondAppendix 4.1. continued

Rainforest V
ertebrates and Food Plant Diversity
287
Species name abbreviations: Birds – Pip: Piprids; Rr: Rupicola rupicola; Tm: Tinamou major; Pm: Penelope marail; Pc: Psophia crepitans; Ca: Crax alector.Arboreal mammals - Cp: Caluromys philander; Sm: Saguinus midas; Pp: Pithecia pithecia; Pf: Potos flavus; Cs: Chiropotes satanas; Ca: Cebus apella; As:Alouatta seniculus; Ap: Ateles paniscus. Terrestrial mammals - Oc: Oryzomys capito; P spp: Proechimys cuvieri and P. guianensis; Nn: Nasua narica; Dl:Dasyprocta leporina; Cpac: Cuniculus paca; Mg: Mazama gouazoubira; Ma: Mazama americana; Tp: Tayassu pecari; Tt: Tapirus terrestris.Body mass is according to Erard et al. (1989), Erard et al. (1991) and Théry et al. (1992) for birds, and Robinson and Redford (1986) for all mammals but Nn(Gompper, 1994), Oc, P spp, Dl (Henry, 1994a), and Tt (Emmons and Feer, 1990) after taking the average between male and female or the midpoint for rangeof values.
Symbols: x, data from Guianas; +, data from outside the Guianan region.
References: Birds – Pip : Thery (1990b), Worthington (1982); Rr: Erard et al. (1989); Tm, Pm and Ca: Erard et al. (1991); Pm Théry et al. (1992). Arborealmammals – Cp: Julien-Laferrière (1989); Sm: Pack et al. (1997); Pp: J.C. Vié (pers. comm.), Kinzey and Norconk 1993; Pp: Zetz (1993), Oliveira et al. (1985),Peres (1993); Pf: Julien-Laferrière (1989), (1993), (pers. comm.); Cs: Roosmalen et al. (1988), Kinzey and Norconk (1993), Norconk et al. (1997); Ca: Shu-Yi(1994), Guillotin et al. (1994), Simmen and Sabatier (1996); As: Julliot (1992), (1994); Ap: Roosmalen (1980), Guillotin et al. (1994), Simmen and Sabatier(1996). Terrestrial mammals – Oc: Guillotin (1982); P spp.: Guillotin (1982), Adler (1995); Nn: Gompper (1994); Dl: D. Sabatier (1983), P.-M. Forget, (personalobservation), Smythe et al. (1982); Ap: Beck et al. (1998); Mg: Gayot et al. (2004), Bodmer (1990b); Ma: Gayot et al. (2004), Stallings (1984); Tp: F. Feer (per-sonal communication), Bodmer (1990a), M. Altrichter, (personal communication), Tt: Salas and Fuller (1996), Bodmer (1990a), Terwillinger (1978).

288P.-M
. Forget and D.S. H
amm
ond
Appendix 4.2. List of mammalian species present in the three Guianas (G: Guyana; S: Suriname; FG: French Guiana) characterizing their activity (N: noctur-nal; D: diurnal), their habit (A: arboreal; Aq: aquatic; B: arboreal/terrestrial; F: flying; T: terrestrial) and their diet (Fr: fruit; S: seed; L: leaves/shoots; Po:pollen/nectar; E: exudates; Fu: fungi; Pu: pulp; I: insects; V: vertebrates; Bl: blood) after Emmons and Feer (1990), Eisenberg (1990), Voss and Emmons(1996) and Brosset et al. (1996).

Rainforest V
ertebrates and Food Plant Diversity
289
continued

Appendix 4.2. continued
290P.-M
. Forget and D.S. H
amm
ond

Rainforest V
ertebrates and Food Plant Diversity
291
continued

292P.-M
. Forget and D.S. H
amm
ond
Appendix 4.2. continued
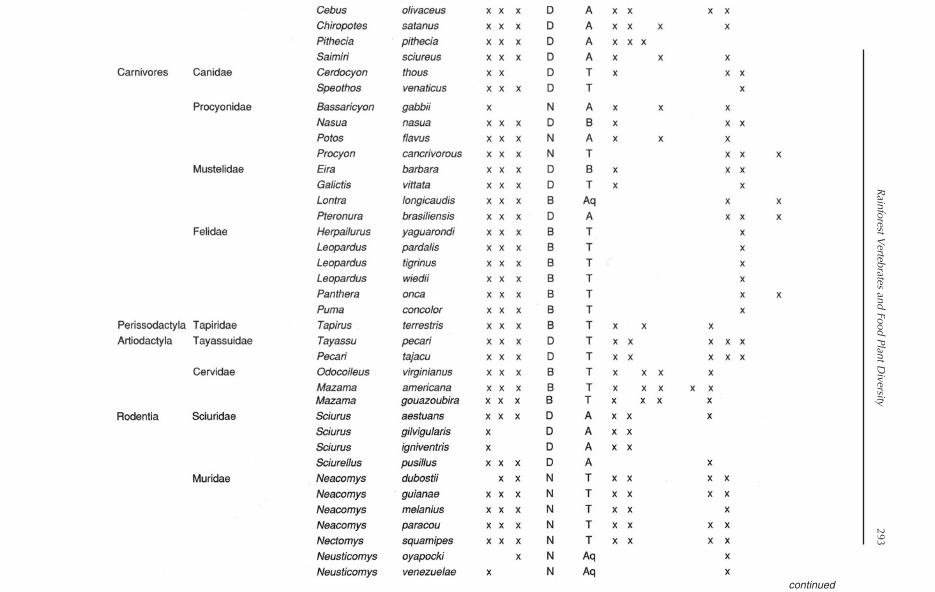
Rainforest V
ertebrates and Food Plant Diversity
293
continued
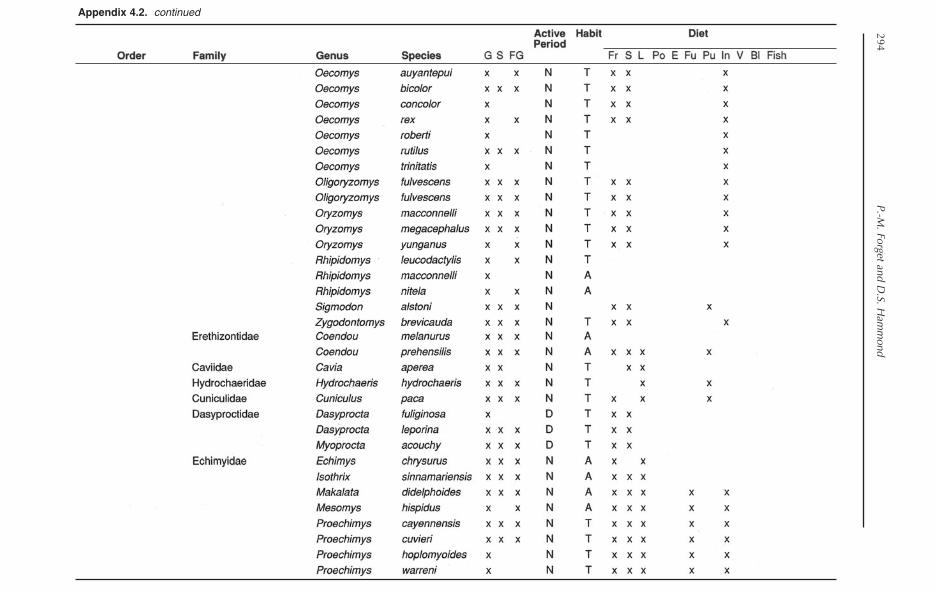
294P.-M
. Forget and D.S. H
amm
ond
Appendix 4.2. continued

Introduction
Unsurprisingly, insect–plant interactions inthe neotropical region have been best stud-ied where long-term taxonomic and eco-logical programmes exist at well-endowedresearch stations. In countries near theGuianas, this is evident in Costa Rica (e.g.Guanacaste Conservation Area: Janzen,1983, 1988; La Selva: Marquis and Braker,1993), Panama (e.g. Barro Colorado Island:Leigh, 1996), Puerto Rico (e.g. LuquilloStation: Reagan and Waide, 1996),Venezuela (Rancho Grande: Beebe andCrane, 1947; Huber, 1986), Trinidad (SimlaResearch Station, Arima Valley: Beebe,1952) and Brazil (National Institute forAmazonian Research, INPA, at Manaus:Adis and Schubart, 1984; Adis, 1997). Incontrast, long-term ecological programmesin French Guiana (e.g. Les Nouragues:Charles-Dominique, 1995; Poncy et al.,1999), Suriname and Guyana (Mabura Hill:ter Steege et al., 1996) rarely had the oppor-tunity to generate substantial insect collec-tions from rainforest habitats andconcomitant studies on the ecology ofinsect herbivores. A notable exception maybe the insect collections made at theKartabo field station in Guyana which were,unfortunately, discontinued as early as1924 (Beebe, 1925). As a consequence, the
literature relating to insect–plant inter-actions in the rainforests of the Guianas islimited and, in addition, scattered in vari-ous sources dealing with insect, vertebrateor plant ecology and biology. Thus, thepresent compilation is unavoidably selec-tive and represents only a starting point formore elaborate literature searches on spe-cific insect–plant interactions.
Traditionally, insect–plant interactionsare classified in the categories of either pri-mary consumption (‘herbivory’) or mutual-ism, which largely overlap (e.g. Whitham etal., 1991). Others have argued that moder-ate insect damage to plants can be benefi-cial in promoting growth and nutrientrecycling (e.g. Owen, 1980). These viewsare rather phytocentric and may be of sec-ondary interest to entomologists interestedin elucidating patterns of host use byGuianan insects. The present review takesan entomocentric approach in order tostimulate deeper analyses of patterns ofhost use, as more and better data becomeavailable. The review concentrates on leafand sap resources provided by vascularplants and used by folivorous insects (leaf-chewing and sap-sucking insects) in therainforests of the Guianas (French Guiana,Suriname and Guyana). Other plantresources used by insects, such as epi-phylls, flowers (see Chapter 6), seeds, extra-
295© CAB International 2005. Tropical Forests of the Guiana Shield (ed. D.S. Hammond)
5 Folivorous Insects in the Rainforests ofthe Guianas
Yves Basset,1 Neil D. Springate2 and Elroy Charles3
1Smithsonian Tropical Research Institute, Balboa, Ancon, Panama; 2Department ofEntomology, The Natural History Museum, London, UK; 3Faculty of
Agriculture/Forestry, University of Guyana, Turkeyen, Georgetown, Guyana

floral nectaries, fruit bodies, stems (includ-ing ants nesting in stems, ant-gardens andphytotelmata), wood and roots, are nottreated here. Papers focusing mainly oninsect taxonomy or crop pests are notaccounted for, unless reporting general pat-terns of host use or host records.
A brief outline of entomological activi-ties in the rainforests of the three countriesis essential to appreciate the degree towhich our present knowledge of theseinsect–plant interactions may be biasedtowards particular insect groups and/orplant resources. Information available onthe main groups of sap-sucking and leaf-chewing insects is then detailed. Particularsections are dedicated to leaf damage (her-bivory) and to leaf-cutting ants, given thesubstantial information available on thesepopular subjects. We conclude by dis-cussing several contentious issues particu-larly worthy of further investigation in theGuianas.
Rainforest Entomology in the Guianas:a Brief Outline
French Guiana
Entomological investigations in the rain-forests of French Guiana have often beenassociated with the activity of isolated ama-teurs and professionals based in metropoli-tan France (e.g. Balachowsky, 1970). Manyspecimens from Maroni River and similarlocalities are also common in many majorcollections, including the Smithsonian andBritish museums. These mostly came viaFrench dealers such as Le Moult (1955).
Recently, the laboratories of the InstitutFrançais de Recherche Scientifique pour leDéveloppement en Coopération (ORSTOM)at Cayenne and of the Institut National deRecherche Agronomique (INRA) at Kourouinvolved several entomological projects. Ofrelevance to this review, recent studies con-centrated on the taxonomy of grasshoppers(Orthoptera) and on seedling attack by leaf-chewing insects. The ‘Canopy Raft’, a plat-form made of inflated beams and nettingwhich allows access to the canopy, had two
scientific missions in French Guiana, in1989 and 1996 (see Hallé and Blanc, 1990;Hallé, 1998). Thus, there is some informa-tion on insect–plant interactions in thecanopy (e.g. Delvare and Aberlenc, 1990;Lechat et al., 1990; Sterck et al., 1992;Dejean et al., 1998; Lowman et al., 1998). Inaddition, the grasshopper fauna of the for-est canopy in French Guiana is well-known(see review in Amédégnato, 1997). In con-trast, canopy collections and data are virtu-ally non-existent for Suriname and Guyana,with the exception of samples obtained bythe National Zoological Collection (seebelow) with yellow pan traps set up10–25 m high in the canopy of Akintosoela,80 km SSE of Paramaribo, as well as sam-ples obtained from felled trees in a centralrainforest of Guyana (Basset et al., 1999).
The Department of Entomology ofORSTOM at Cayenne has one collection ofCerambycidae, including about 8000 speci-mens and 1500 species. The Laboratoired’Environment Hydreco, created in 1990with private funding from Electricité deFrance (EDF), owns a collection of about1000 insect species and nearly 6000 speci-mens identified. However, many of thespecimens collected in French Guiana aredeposited in a few private collections andat the Museum National d’HistoireNaturelle, Paris, which is to establish anannexe near ORSTOM-Herbarium atCayenne (see reviews in Amédégnato, 1997,2003). Tavakilian (1993) reviews the stateof knowledge of entomological research inFrench Guiana.
Suriname
The first scientific study of insect–plantinteractions in the Americas may well bethat of Maria Sybilla Merian (1705, 1719;Valiant, 1992), who was a remarkable natu-ralist and made beautiful illustrations ofseveral Surinamese insects. She spent mostof her time in coastal plantations and manyof her rearings and illustrations concerncrop insects, particularly moths and butter-flies (Geijskes, 1951). Unfortunately, hernomenclature pre-dated that of Linnaeus,
296 Y. Basset et al.

so that host records are difficult to extractfrom her studies.
More recently, entomological researchin Suriname has been dominated by thestudies of the resident Dutch entomologistDirk Cornelis Geijskes, who was active from1940 to 1986 (for a review of entomologicalactivities in Suriname, see Geijskes, 1951,1957). Although Geijskes was mainly inter-ested in the taxonomy of dragonflies(Odonata), he made some general insectcollections in rainforests (e.g. Geijskes,1968) and studied some aspects of the biol-ogy of the leaf-cutting ants. Nowadays, aprogramme in bee ecology exists at theUniversity of Suriname and studies of agri-cultural insect pests have been and are stillprominent in the country.
The country has two sizeable insectcollections. The National ZoologicalCollection of Suriname at the Universityincludes a strong invertebrate section withabout 1400 insect species, 900 of which areidentified, and close to 10,000 individuals.Bee specimens are particularly well-repre-sented. The collection is linked to a data-base which includes nearly 500 records oninsect–plant interactions (Hiwat, personalcommunication). An additional 40,000insect specimens collected fromAtkintosula, 80 km SSE of Paramaribo (DeDijn, 2003), as well as a rainforest on lat-erite, have been sorted to various taxo-nomic levels and will be incorporatedgradually in the general collections (DeDijn, 2003). In addition, informationsources for entomologists at the library ofthe University are very good. The secondcollection is at the Agricultural FieldStation of the Ministry of Agriculture andFisheries, and holds approximately 4000insect specimens. A few entomologicalmonographs have been published in thejournal Studies on the Fauna of Surinameand other Guyanas.
Guyana
The British Guiana Tropical ResearchStation at Kartabo was founded by the NewYork Zoological Society and was operated
by William Beebe from 1916 to 1924(Beebe, 1925). Extensive insect collectionswere made in the rainforest there (e.g.Beebe and Fleming, 1945; Fisher, 1944;Fleming, 1945, 1949, 1950). Miller (1994)considers Kartabo as one of the nine placesin the neotropical region that had been sam-pled for moths fairly intensively duringmost months over a period of years. In addi-tion, there have been several expeditions byentomologists based in the UK (e.g. O.W.Richards, Oxford University expedition,1929), in the USA (e.g. University ofMichigan expedition; M. Collins, T.M.Forbes, P. Spangler, W. Steiner, F.X.Williams) or in Canada (H.S. Parish), so thatthe entomological fauna of Guyana is rela-tively well-known, although collections arescattered overseas. For example, a rela-tively comprehensive catalogue of butter-flies was compiled for Guyana as early as1940 (Hall, 1940).
Today, pest crops are the target of mostentomological studies in Guyana and thereis substantial information on leaf-cuttingants. Two sizeable insect collections existin Guyana. The National Insect Collectionis housed at the National AgriculturalResearch Institute, Mon Repos, East CoastDemerara. It includes 160 insect drawers,mostly including insect pests and associ-ated enemies, but rainforest specimens arepoorly represented (Munroe, 1993). TheCenter for Biodiversity at the University ofGuyana houses a small collection of butter-flies and about 21,000 specimens of rainfor-est insect herbivores collected at MaburaHills, central Guyana. Entomological infor-mation relevant to Guyana can often befound in the journals Timehri andZoologica (New York).
In short, the state of entomologicalknowledge in the Guianas cannot comparewith that of other countries in Central andSouth America, particularly Costa Rica,Panama or Brazil. Overall, the insect faunaof Guyana is probably the best known of thethree countries, but the best insect collec-tions relevant to the Guianas may be foundin Suriname, French Guiana, at theMuseum d’ Histoire Naturelle (Paris), theNatural History Museum (London), the
Folivorous Insects 297

Smithsonian Museum (Washington), theAmerican Museum of Natural History (NewYork), the Zoological Museum (Leiden), theMuseo del Instituto de Zoologia Agricola(Maracay) or the Museo E. Goeldi (Belem).Some taxonomic information exists for cer-tain conspicuous, traditionally well-col-lected, insect taxa such as butterflies, mothsand longicorn beetles. However, thepaucity of taxonomic as well as ecologicalinformation on the main groups of rainfor-est folivores, Cicadellidae, Fulgoroidea,Chrysomelidae and some Curculionidae, isstriking. Arguably, these groups, togetherwith wood-boring insects (mainlyCerambycidae, Curculionidae and Scoly-tinae), represent an appreciable part ofinsect–plant interactions and biodiversityin the rainforests of the Guianas.
Sap-sucking Insects
Thysanoptera and Heteroptera
Rainforest host-plant records in the litera-ture for sap-sucking insects in the Guianasare probably very incomplete and all origi-nate from Guyana (Table 5.1). Althoughsap-sucking insects (Thysanoptera andHemiptera) are the main sap consumers inrainforests, leaf-cutting ants (see later) ofteningest directly the sap from cut leaves(Littledyke and Cherrett, 1976) and studiesby Cherrett (1980) showed that this repre-sents an appreciable part of energy require-ments of a colony. Information aboutThysanoptera is limited to a generalaccount originating from Suriname, with-out host-plant records (Priesner, 1923). Inthe rainforests near Kartabo, Beebe (1925)considered the Pentatomidae, Coreidae andLygaeidae dominant among herbivorousheteropterans. In Suriname, van Doesburg(1966) treated the families Largidae andPyrrhocoridae, detailed some host recordsand, in particular, indicated that somespecies of largids feed on Inga spp.(Mimosaceae).
Auchenorrhyncha and Stenorrhyncha
In Kartabo, the most abundant homopteransinclude Cicadellidae, Membracidae, Coc-coidea and Cercopidae (Beebe, 1925), whileCicadellidae, Membracidae, Achilidae andCiixidae are particularly abundant in theunderstorey near Mabura Hills (Charles,1998; Basset and Charles, 2000). Limitedinformation is available on the mealybugscollected near Kartabo, particularly thespecies feeding on ant plants (Morrison,1922). Some species appear to be wide gen-eralists (Table 5.1). Another source of infor-mation for the mealybugs of the Guianas isWilliams and Willink (1992), although thistargets mostly pests of various crops andeconomic plants (but see one record inTable 5.1).
Metcalf (1945) reported about 39 speciesof Fulgoroidea collected in the rainforestsnear Kartabo. Many species are also foundelsewhere in Central and South America, butno host records are available. Similarly,Metcalf (1949) reported on 23 species ofxylem-feeding Cicadellidae (Tettigellidaeand Gyponidae, now in subfamilyCicadellinae) collected at Kartabo, withoutmention of host records. Haviland (1925) col-lected 75 species of Membracidae collectedat Kartabo during a 5-month period. Thesalient features of this fauna include the widegeographical distribution of the species, pref-erence of most species for clearings over deepshade forest, many species being attended byants but, when unattended, being solitary asadults. Haviland provided only two hostrecords (Table 5.1), but suggested that manyspecies were monophagous, or at leastrestricted to a few species of plants. However,published host records of sap-sucking insectsin Mabura Hill, Guyana, indicated a largerrange of plants used, particularly forCicadellidae, Membracidae and Cixiidae(Basset and Charles, 2000; Table 5.1). Thestudies of Haviland (1925) and Funkhouser(1942) stress that many Membracidae foundin Guyana are widely distributed in SouthAmerica.
298 Y. Basset et al.

Folivorous Insects299
Table 5.1. Host-plant records indicated in the literature for sap-sucking insects in the Guianas. All records originate from Guyana.See additional information in the text.
Insect species Family Host-plant(s)a Source
Herpis vittata F. Derbidae A, B, C, D, E Basset and Charles, 2000Plectoderes collaris F. Achilidae A, B, C, D, E Basset and Charles, 2000Sevia bicarinata F. Achilidae A, B, C, D, E Basset and Charles, 2000Sevia consimile Fennah Achilidae A, B, C, D, E Basset and Charles, 2000Taosa muliebris Walker Dictyopharidae B, E Basset and Charles, 2000Toropa ferrifera (Walker) Dictyopharidae A, B, C, D, E Basset and Charles, 2000Toropa picta Walker Dictyopharidae B, E Basset and Charles, 2000Nogodina reticulata F. Nogodinidae A, B, C, D, E Basset and Charles, 2000Boethoos globosa Haviland Membracidae Vismia ferruginea Kunth (Clusiaceae) Haviland, 1925Darnis lateralis F. Membracidae A, B, C, D, E Basset and Charles, 2000Endoastus productus Osborn Membracidae Tachigali paniculata Aubl. (Caesalpiniaceae) Osborn, 1921Potnia gladiator Walker Membracidae A, C, E Basset and Charles, 2000Stegaspis fronditia L. Membracidae B, E Basset and Charles, 2000Tragopa guianae Haviland Membracidae Vismia ferruginea Kunth Haviland, 1925Acrocampsa pallipes F. Cicadellidae A, B, C, D, E Basset and Charles, 2000Amblyscarta invenusta Young Cicadellidae A, B, C, D, E Basset and Charles, 2000Baluba parallela Nielson Cicadellidae A, B, C, D, E Basset and Charles, 2000Barbatana extera Freytag Cicadellidae A, B, D Basset and Charles, 2000Cardioscarta quadrifasciata L. Cicadellidae A, B, C, E Basset and Charles, 2000Dasmeusa basseti Cavichioli and Chiamolera Cicadellidae A, B, C, D, E Basset and Charles, 2000Dasmeusa pauperata Young Cicadellidae A, B, C, D, E Basset and Charles, 2000Docalidia o’reilly Nielson Cicadellidae D, E Basset and Charles, 2000Gypona bulbosa DeLong and Freytag Cicadellidae A, B, C, D, E Basset and Charles, 2000Gypona flavolimbata Metcalf Cicadellidae A, C, D Basset and Charles, 2000Gypona flavolimbata Metcalf Cicadellidae A, C, E Basset and Charles, 2000Gypona funda DeLong Cicadellidae B, C Basset and Charles, 2000Gypona glauca F. Cicadellidae B, C, E Basset and Charles, 2000Gypona offa DeLong and Freytag Cicadellidae C Basset and Charles, 2000Joruma coccinea McAtee Cicadellidae A, B, C, E Basset and Charles, 2000Ladoffa aguilari Lozada Cicadellidae A, B, C, D, E Basset and Charles, 2000Ladoffa comitis Young Cicadellidae A, B, C, D, E Basset and Charles, 2000Ladoffa ignota Walker Cicadellidae A, B, C, D, E Basset and Charles, 2000
continued

300Y
. Basset et al.
Table 5.1. continued
Insect species Family Host-plant(s)a Source
Macugonalia moesta (F.) Cicadellidae A, B, C, D, E Basset and Charles, 2000Mattogrossus colonoides (Linnavuori) Cicadellidae A Basset and Charles, 2000Planocephalus flavicosta (Stal.) Cicadellidae A, E Basset and Charles, 2000Poeciloscarta cardinalis F. Cicadellidae A, B, C, D, E Basset and Charles, 2000Soosiulus fabricii Metcalf Cicadellidae A, B, C, D, E Basset and Charles, 2000Soosiulus interpolis Young Cicadellidae A, B, C, D, E Basset and Charles, 2000Xedreota tuberculata (Osborn) Cicadellidae A, B, C, D, E Basset and Charles, 2000Xestocephalus desertorum (Berg) Cicadellidae A, E Basset and Charles, 2000Cryptostigma quinquepori (Newstead) Coccidae Cecropia, Ficus, Pithecellobium, Microlobium Newstead, 1917a; Morrison,
1922Akermes secretus Morrison Coccidae Inga, Haematoxylum, Triplaris Morrison, 1922Ceroplastes cirripediformis Comstock Coccidae Argyreia nervosa, Hura crepitans (generalist) Newstead, 1917bEucalymnatus decemplex (Newstead) Coccidae Lecythis sp. (Lecythidaceae) Newstead, 1920Saissetia hurae (Newstead) Coccidae Hura crepitans L. (Euphorbiaceae) Newstead, 1917aLecanodiaspis ingae Howell and Kosztarab Lecanodiaspididae Inga spp. (Mimosaceae) Howell and Kosztarab, 1972Cataenococcus rotundus (Morrison) Pseudococcidae Cecropia angulata I.W. Bailey (Cecropiaceae) Williams and Willink, 1992Dysmicoccus probrevipes (Morrison) Pseudococcidae Cordia, Tachigali Morrison, 1929Farinococcus multispinosus Morrison Pseudococcidae Triplaris, Cecropia Morrison, 1922Pseudococcus bromeliae Bouché Pseudococcidae Tachigali, Cecropia, Cordia, Ananas Wheeler, 1921; Morrison,
1922Trionymus petiolicola (Morrison) Pseudococcidae Tachigali paniculata Aubl. Morrison, 1922Arocera equinoxia (Westwood) Pentatomidae B, C, D, E Basset and Charles, 2000Mormidea ypsilon (L.) Pentatomidae E Basset and Charles, 2000
aA=Chlorocardium rodiei (Scomb.), B=Mora gonggrijpii (Kleinh.) Sandw., C=Eperua rubiginosa Miq., D=Pentaclethra macroloba (Willd.) O. Kuntze,E=Catostemma fragrans Benth.

Recently, the sap-sucking insects feed-ing on the seedlings of five common treespecies have been studied near MaburaHill, Guyana, on a relatively large scale:Catostemma fragrans Benth. (Bombaca-ceae), Chlorocardium rodiei (Scomb.)(Lauraceae), Eperua rubiginosa Miq., Moragonggrijpii (Kleinh.) Sandw. (bothCaesalpiniaceae) and Pentaclethra macro-loba (Willd.) O. Kuntze (Mimosaceae)(Basset 1999, 2000; Basset and Charles,2000). Monthly surveys of almost 10,000seedlings were performed over a 2-yearperiod in a forest plot of 1 km2. Collectionsincluded over 24,000 specimens and 425species. The most speciose families wereCicadellidae (including many Cicadellinae,Coelidiinae and Idiocerinae), Derbidae,Membracidae (particularly Smiliinae),Achilidae and Cixiidae. The most abundantfamilies were Psyllidae, Cicadellidae,Cixiidae, Derbidae and Pseudococcidae.Plataspididae were the only conspicuousfamily of Heteroptera, being abundant butnot speciose. A small fraction of thematerial was identified to species level(Table 5.1). Although feeding records aredifficult to ascertain in most cases, the mag-nitude of collections allows inference ofsome degree of host specificity. Somespecies are almost certain to be wide gener-alists. For example, among Cicadellidae, astriking pattern was the high proportion ofCicadellinae in the collections, which areall xylem-feeders and often highlypolyphagous (Basset, 1999, 2000; Bassetand Charles, 2000; Basset et al., 1999,2001). Many such species were collectedfrom the five hosts studied and observedfeeding in situ. On E. rubiginosa, the domi-nant sap-sucking insect was an unidentifiedspecies of Isogonoceraia (Psyllidae) (Hollis,personal communication). Similarly,Gombauld (1996) observed that in FrenchGuiana, among sap-sucking insects feedingon the seedlings of Eperua grandiflora(Aubl.), Psylloidea were the dominantgroup.
Herbivory
In the understorey, Newbery and de Foresta(1985) observed that the percentage of leafarea lost to herbivores was greater in theprimary forest than in pioneer vegetation atLa Piste de St Elie in French Guiana. Intotal, it averaged 5.5% of leaf area lost.Mature leaves of the shaded forest under-storey were more heavily grazed than thoseon pioneer trees and those on small treeswhich grew in large, well-illuminated gaps.In the canopy, Sterck et al. (1992) measuredherbivory among trees, lianas and epi-phytes at the stations of Petit Saut and LesNouragues in French Guiana. Overall dam-age levels of both canopies were just over5%, individual samples ranging from 0.8%to 12.8% damage, without clear differencesbetween life forms. Similarly, Lechat et al.(1990) measured leaf damage in a transectfrom the ground to the canopy at Petit Saut.Individual samples ranged from 0% to20%, but 90% of the samples had below10% damage and 60% below the 5% dam-age level. Leaf damage was not correlatedwith the height of the samples. On average,preliminary results of Lowman et al. (1998)indicated 4.7% damage in the canopy nearParacou, with trees supporting vines aver-aging over twice as much herbivory as treesdevoid of vines.
Gombauld and Rankin de Merona(1998) measured leaf damage on Eperua fal-cata (Aubl.), E. grandiflora, Dicorynia guia-nensis Amshoff (Caesalpiniaceae), Goupiaglabra Aubl. (Celestraceae) and Qualearosea Aubl. (Vochysiaceae) by taggingleaves at Paracou (and see Gombauld,1996). For E. falcata, in non-limiting lightconditions (as in tree fall gaps), low levelsof insect damage on leaves are correlatedwith increased height and stem diametergrowth, whereas high levels of damage arecorrelated with a decrease in these para-meters. E. grandiflora, which depends oncotyledon reserves for growth, is not influ-enced by damage by leaf-eating insects(Gombauld, 1996). Among the five speciesstudied, D. guianensis is unique in main-
Folivorous Insects 301

taining leaf production throughout the dryseason. In this case, the relative impact ofherbivory is reduced during the periodwhen groundwater deficits create condi-tions unfavourable for plant growth. E. fal-cata, E. grandiflora and Q. rosea experiencehigh levels of herbivory during the dry sea-son and display significantly lower meanheight growth during the rainy season thanduring the dry season. In contrast, D. guia-nensis and G. glabra have similar heightgrowth regardless of the season. Despite therainy season being the more favourableperiod for the activity of leaf-eating insects(Gombauld, 1996), ratios of damage (leafarea eaten/total leaf area) do not differ sig-nificantly between the rainy and the dryseason, with the exception of E. grandiflora.This pattern confirms that the proportion ofleaf area produced and eaten varies simi-larly during the year (Gombauld andRankin de Merona, 1998).
In Guyana, Isaacs et al. (1996) meas-ured apparent leaf damage on Dicymbe alt-sonii Sandw. (Caesalpiniaceae), whichforms monodominant stands on bleachedsand soils (albic arenosols). Across fourtransects, damage ranged from 10.7% to12.9% and leaf-cutting ants accounted forabout half of the leaf area lost. Ter Steege(1990) mentioned that leaf damage was<10% for most seedlings of anotherCaesalpiniaceae, morabukea (Mora gonggri-jpii) at Mabura Hill, Guyana, though thelevel of apparent damage, due mainly toleaf-scraping Chrysomelidae and leaf-chew-ing Tettigoniidae, increases considerably inlarge treefall gaps (Hammond, unpublisheddata), possibly due to an increase in youngleaf availability. On Maracá Island, inRoraima, Brazil (bordering Guyana),Nascimento and Proctor (1994) measuredherbivory on Peltogyne gracilipes Ducke(Caesalpiniaceae). P. gracilipes forms mono-dominant stands on this river island andrelated species of Peltogyne are common inthe Guianas (Hammond et al., 1996).Apparent leaf damage on P. gracilipesamounted to 11.4%, but in 1992 severedefoliation occurred. Nearly 60% of treesshowed heavy and extreme damage (from
50% and greater of the crown defoli-ated). The insect responsible wasEulepidotis phrygionia Hampson, a general-ist moth (Noctuidae), which is widespreadin Brazil.
Coley and Aide (1991) reviewed her-bivory in temperate and tropical forests andfound that annual rates of herbivory in thelatter amounted to 10.9%. Therefore, avail-able data for the Guianas suggest that levelsof herbivory there may not be extremely dif-ferent from those elsewhere in the tropics,with perhaps a tendency to be lower. BothNewbery and de Foresta (1985) and Stercket al. (1992) remarked that, being measuredin the dry season, level of leaf damage mayhave been underestimated. Indeed, leafdamage in French Guiana is often higher inthe late wet and early dry seasons whennew leaves are produced than during thedry season (Gombauld, 1996; on Panama,see also Aide, 1988). This also correlateswith the seasonality of large leaf-chewinginsects, such as grasshoppers, whose densi-ties are highest during that period of theyear (Amédégnato, personal communica-tion). A second complication is that all thevalues reported for the Guianas, with theexception of Gombauld (1996), concernapparent leaf damage (percentage of arealost), which typically does not account forleaves eaten entirely and therefore under-estimates leaf damage (e.g. Lowman, 1984).This could be a serious bias when densitiesof large-bodied leaf-chewing insects, suchas grasshoppers, are locally high. In theseinstances, whole herbaceous plants can beconsumed within 2 h (Amédégnato, per-sonal communication). Monitoring grazingrates by tagging leaves is an alternative tothis problem (Lowman, 1984).
Leaf-chewing insects
Leaf-chewing insects include mostlygrasshoppers, stick insects, beetles, moths,butterflies, sawflies and leaf-cutting ants(see below). Host records for these rainfor-est insects in the Guianas are summarizedin Table 5.2.
302 Y. Basset et al.
Folivorous Insects303
Table 5.2. Host-plant records indicated in the literature for leaf-chewing insects in the Guianas. See additional information in the text.
Insect species Family Host-plant(s) Country Source
Colpolopha spp. Romaleidae Dicotyledons (generalist) French Guiana Descamps, 1978, 1979a
Maculiparia guyanensis Amedegnato Romaleidae Monocotyledons (specialist) French Guiana Descamps, 1978, 1979a
Phaeoparia lineaalba L. Romaleidae Monocotyledons (specialist) French Guiana Descamps, 1978, 1979a
Abacris flavalineata (De Geer) Acrididae Eperua grandiflora (Aubl.) (Caesalpiniaceae) French Guiana Gombauld, 1996Clematodina sastrei Amedegnato & Descamps Acrididae Dicotyledons (generalist) French Guiana Descamps, 1978, 1979a
Copiocera spp. Acrididae Euterpe oleracea Mart. (Arecaceae) French Guiana Amédégnato, 1996Cryptocloeus fuscipennis Bruner Acrididae Loreya mespiloides Miq. (Melastomataceae) French Guiana Descamps, 1978, 1979a
Ommatolampis perspiscillata Johanssen Acrididae Dicotyledons (generalist) French Guiana Descamps, 1978, 1979a
Prionolopha serrata (L.) Acrididae Eperua falcata (Aubl.), E. grandiflora French Guiana Gombauld, 1996Schistocerca pallens (Thunberg) Acrididae Eperua falcata French Guiana Gombauld, 1996Arawakella unca Rehn and Rehn Eumastacidae Vismia sp. (Clusiaceae) French Guiana Descamps, 1978, 1979a
Eneoptera guyanensis Chopard Gryllidae Eperua grandiflora French Guiana Gombauld, 1996Lutosa brasiliensis (Brunner) Tettigoniidae Eperua falcata (Aubl.) (Caesalpiniaceae) French Guiana Gombauld, 1996Huradiplosis surinamensis Nijveldt Cecidomyiidae Hura crepitans L. (Euphorbiaceae) Suriname Nijveldt, 1968Asphaera abbreviate F. Chrysomelidae Dicorynia guianensis, Eperua falcata French Guiana Gombauld, 1996Asphaera nobilitata F. Chrysomelidae Eperua falcata, E. grandiflora French Guiana Gombauld, 1996Chalcophyma collaris Lef. Chrysomelidae Eperua falcata, E. grandiflora French Guiana Gombauld, 1996Chalcophyma fulgida Lef. Chrysomelidae Eperua falcata French Guiana Gombauld, 1996Chalcophyma tarsalis Baly Chrysomelidae Eperua falcata French Guiana Gombauld, 1996Coelomera cajennensis F. Chrysomelidae Cecropia peltata L. (Cecropiaceae) Guyana Bodkin, 1919Cryptocephalus esuriens Suffrian Chrysomelidae Mora, Eperua, Pentaclethra, Catostemma Guyana Basset and Charles, 2000Naupactus albulus Boheman Curculionidae Eperua falcata French Guiana Gombauld, 1996Naupactus bellus Hustache Curculionidae Dicorynia, Eperua, Goupia, Qualea French Guiana Gombauld, 1996Naupactus ornatus Schönherr Curculionidae Eperua falcata French Guiana Gombauld, 1996Plectrophoroides unicolor Chevrolat Curculionidae Eperua falcata French Guiana Gombauld, 1996Eurytides ariarathes Esper Papilionidae Rollinia sp. (Annonaceae) French Guiana Brévignon, 1990Eurytides protesilaus (L.) Papilionidae Duroia eriopila L. (Rubiaceae) Suriname Merian, 1705Papilio torquatus Cramer Papilionidae Moniera trifolia L. (Rutaceae) French Guiana Brévignon, 1990Phoebis sennae (L.) Pieridae Inga ingoides (L.C. Richard) Will. (Mimosaceae) Suriname Merian, 1705Lycorea ilione Cramer Nymphalidae Ficus spp. (Moraceae) Guyana Ackery, 1988Napeocles jucunda Hübner Nymphalidae Ruellia inflata Rich. (Acanthaceae) French Guiana Brévignon, 1990Chalybs janais (Cramer) Lycaenidae Pentaclethra macroloba (Mimosaceae) Guyana Basset and Charles, 2000Thestius phloeus (Cramer) Lycaenidae Vouacapoua americana, Catostemma fragrans F. Guiana, Joly, 1996; Basset and
Guyana Charles, 2000continued
304Y
. Basset et al.
Table 5.2. continued
Insect species Family Host-plant(s) Country Source
Cremna thasus Stoll Riodinidae Tilliandsia bulbosa Hook (Bromeliaceae) French Guiana Brévignon, 1992Euselasia thusnelda Möschler Riodinidae Caraipa (Clusiaceae) French Guiana Brévignon, 1995, 1997Euselasia arcana Brévignon Riodinidae Clusia (Clusiaceae) French Guiana Brévignon, 1995, 1997Euselasia euryone (Hewitson) Riodinidae Mahurea (Clusiaceae) French Guiana Brévignon, 1995, 1997Euselasia midas F. Riodinidae Tovomita (Clusiaceae) French Guiana Brévignon, 1995, 1997Napaea beltiana Bates Riodinidae Catasetum barbatum Lindl. (Orchidaceae) French Guiana Brévignon, 1992Arsenura armida (Cramer) Saturniidae Erythrina fusca Loureio (Fabaceae) Suriname Merian, 1705Syssphinx molina Cramer Saturniidae Inga sp. (Mimosaceae) Suriname Robinson and Kitching,
1997Aleuron carinata Walker Sphingidae Ambelania tenuiflora Muell. Arg. (Apocynaceae) French Guiana Robinson and Kitching,
1997Oryba kadeni Schaufuss Sphingidae Palicourea sp. (Rubiaceae) French Guiana Robinson and Kitching,
1997Thysania agrippina (Cramer) Noctuidae Bursea simaruba (L.) (Burseraceae) Suriname Merian, 1705Atomacera pubicornis F. Argidae Ipomoea sp. (Convolvulaceae) Guyana, McCallan, 1953;
Suriname Smith, 1992Hemidianeura leucopoda Cameron Argidae Inga sp. (Mimosaceae) Guianas Smith, 1992Ptilia brasiliensis Lepeletier Argidae Lecythis sp. (Lecythidaceae) French Guiana McCallan, 1953; Smith,
1992Ptilia peletieri Gray Argidae Cnestidium rufescens Planch. (Connaraceae) Guyana, Benson, 1930; Smith,
Suriname 1992Themos surinamensis Klug Argidae Ceiba pentandra (L.) Gaertn. (Bombacaceae) Guianas Smith, 1992
aAnd C. Amedegnato, Paris, 1998, personal communication.
Folivorous Insects 305
Phasmids and Orthoptera
Host records for rainforest Phasmida in theGuianas proved difficult to find. In FrenchGuiana, the communities of arboricolousgrasshoppers (Orthoptera: Acridoidea) donot appear to be very different from else-where in Amazonia (Amédégnato andDescamps, 1980). Typically, these commu-nities include a high number of very closelyrelated sympatric species which often liveon the same tree (Amédégnato, 1997).Descamps (1978) recorded at least 44genera and 57 species in the familiesRomaleidae, Acrididae, Eumastacidae andProscopiidae (in order of decreasing impor-tance) from these communities. Grass-hopper density in tree crowns appears rela-tively low: on average, 22 individuals and10 species per tree (i.e. about 0.2–0.5 indi-vidual per m2 of leaf area) in the Amazon,reaching 16.5 individuals per tree in FrenchGuiana in particular. Grasshopper speciesrichness is lowest on nutrient-poor soils inFrench Guiana (Amédégnato, personalcommunication). Densities also appear tobe higher in the upper canopy than in themid canopy or understorey (Amédégnato,1997, 2003). Most grasshoppers either feedon tree foliage, or bark and small epiphytes,or on larger epiphytes.
However, host-plant records are rare(Table 5.2). Many species are ratherpolyphagous, such as most Eumastacidae.Of particular interest is the specializationon palms of a number of species within theCopiocerinae (Acrididae). In the Guianas,this concerns about 10 species in the generaCopiocerina, Copiocera and Eumecacris(Amédégnato, 1996). Usually, Lauraceae,Combretaceae and Myristicaceae support arich and abundant grasshopper fauna, incontrast with Leguminosae and Lecythid-aceae (Amédégnato, 1997).
Coleoptera and Diptera
Beebe (1925) commented on the richness ofthe phytophagous beetle families Chryso-melidae and Curculionidae in Kartabo, stat-ing that the variety of the former was‘unbelievable’. Chrysomelidae were the
most species-rich and abundant leaf-chew-ing taxa feeding on seedlings in centralGuiana (Basset and Charles, 2000).Unfortunately, the present state of taxo-nomic knowledge of the rainforest materialin the Guianas, particularly Chrysomelidae,precludes any useful analysis beyondBeebe’s enthusiastic statement (Jolivet, per-sonal communication). However, one par-ticular genus of Galerucinae has beenrelatively well studied. At least 35 speciesof Coelomera (Chrysomelidae, Galerucinae)are known to feed on Cecropia spp. andother Cecropiaceae, and are widely distrib-uted in the neotropical region (Jolivet,1987). Unfortunately, the confusing state ofthe taxonomy of both Coelomera andCecropia does not allow investigation as towhether there is a one-to-one correspon-dence between the beetle and the plantspecies (Jolivet, 1987). Jolivet and Salinas(1993) described oviposition by Coelomeracajennensis F. inside the internodes ofCecropia peltata L. in Venezuela, in a fash-ion similar to that of the ants inhabitingthe hollow twigs. The outcome of thisbehaviour appears to be an improvedprotection of the egg masses. The larvaeare free-living and often considerablydamage the leaves of their host plant.Adults avoid ants by reflex bleeding, orthanatosis, and their larvae by enteric orbuccal discharge. In particular, the larvae ofsome species exhibit a peculiar form ofdefence, cycloalexy (Vasconcellos-Neto andJolivet, 1994). They form a circle, head tohead, and their supra-anal shields andenteric secretions at the periphery of thecircle protect them against ant or bugattack. Depending on local conditions,ants and beetles may cohabit or excludethemselves on the foliage, but this situa-tion is not well understood (Jolivet, 1987,1989).
Records of rainforest Curculionidaeand Diptera feeding on leaves in theGuianas were even more difficult to extractfrom the literature (Table 5.2). In particular,literature on insect galling and leaf-miningin the Guianas is very limited, other thanNijveldt’s (1968) description of one gallmidge from Suriname (Table 5.2).

Lepidoptera
Although there is considerable taxonomicinformation about the moth fauna of theGuianas, the larval biology of most speciesis unknown. For example, in FrenchGuiana, Haxaire and Rasplus (1986, 1987)list 50 species of Sphingidae and deToulgoet (1987) lists 200 species ofArctiidae, but no host-plant information isprovided. De Jong (1983) lists 426 reportedspecies of Hesperiidae in Suriname andstresses the wide distribution of mostspecies in South America. Similarly,Lindsey (1928), Beebe and Fleming (1945)and Fleming (1945, 1949, 1950) providespecies lists for several moth and butterflyfamilies at Kartabo. Beebe (1925) furtherreported that Noctuidae, Geometridae andPyralidae collected at lights at Kartabo rep-resent about 55% of the species richness inmacrolepidopteran moths, so it is probablethat these families also contribute in largepart to the caterpillar fauna in rainforests,although care must be taken extrapolatingfrom such data. Further, Beebe (1925) con-siders Ithomiinae and Heliconinae (both inNymphalidae) to be typical butterfly taxabelonging to the rainforest habitat, andPieridae and Hesperiidae to be also com-mon butterfly families in the rainforestsnear Kartabo.
The few host records available in thebutterfly catalogue for Guyana (Hall, 1940)include records from crops and orchardtrees. The information more particularlyrelevant to rainforest butterflies often needsto be tracked in the databases and rearingreports of keen professional and amateurlepidopterists (Table 5.2). Of interest, thefew host records available involving epi-phytic plants mainly concern riodinid but-terflies (e.g. Brévignon, 1992; Table 5.2).
Hymenoptera
Knowledge of the phytophagous sawflies(Hymenoptera, ‘Symphyta’) of the Guianasis extremely limited. At least 60 specieshave been recorded from the Guianas in thefamilies Argidae, Pergidae and Tenthred-inidae, although the exact number is likely
to be many times greater (Benson, 1930;McCallan, 1953; Smith, 1988, 1990, 1992).The faunas are best known from Guyana,but very little is known about their ecology,particularly the host plants of the larvae(Table 5.2). Of the recorded species, themajority are found within the generaScobina, Hemidianeura, Manaos, Ptilia (allArgidae), Perreyiella, Decameria, Aula-comerus (all Pergidae), Stromboceros,Adiaclema and Waldheimia (all Tenthred-inidae).
It is probable that phytophagousspecies of the parasitoid superfamiliesCynipoidea and Chalcidoidea are morecommon in the Guianas than the data in thecollections and the literature suggest. Forexample, the genus Eschatocerus, of thegall-forming Cynipidae (Cynipoidea), israther diverse and, usually, host-specific oncertain Leguminosae (Fergusson, personalcommunication). Leaf-cutting ants of thetribe Attini (Formicidae) are discussedlater.
Studies of Particular Host Plants
Leaf-chewing insects feeding on theseedlings of several tree species have beenrelatively well studied in French Guiana.Mature leaves of Eperua spp. are not greatlydamaged by insects, and herbivory does notappear to cause major seedling mortality incomparison with the effect of vertebrateherbivores. In contrast with young leaves ofE. falcata, those of Eperua grandiflora aredamaged frequently by invertebrate herbi-vores, and are often defoliated totally, lead-ing to high seedling mortality (Forget,1992). Gombauld (1996) studied in moredetail the insect herbivores feeding on theseedlings of E. falcata and E. grandiflora atParacou, French Guiana. Patterns of attackand consequences for seedling growth andsurvival were contrasted between differenttreatments and canopy openness. A total of16 leaf-chewing species were collectedfrom the families Tettigoniidae (genusLutosa), Acridoidea (Abacris, Prionolopha,Schistocerca, Colpolopha), Gryllidae(Eneoptera), Chrysomelidae (Eumolpinae:
306 Y. Basset et al.

Chalcophyma; Alticinae: Asphaera),Curculionidae (Entiminae: Naupactus,Plectrophoroides) and Saturniidae. Fewspecies appeared to be host specific andGombauld noted that Asphaera andNaupactus, for example, were feeding onother tree species (Goupia, Dicorynia,Qualea). Leaf damage appeared occasional,without permanent setting on the seedlings.Chrysomelids were the dominant group ofleaf-chewing insects on Eperua, but it wasnot known whether herbivores wererestricted to the understorey or fed also onEperua leaves in the canopy. Rates of attackon Eperua seedlings were correlated posi-tively with leaflet production and some-times increased at higher seedlingdensities. However, damage remained lowin the primary forest, presumably since sec-ondary hosts for eumolpine beetles wereless common there. Gombauld also stressedthat Eperua seedlings represent a lowresource for herbivorous insects and thatthe energy needed for insect dispersal andfeeding may be considerable. This patternwas similar for insects feeding on seedlingsin Mabura Hill (Basset, 1999, 2000). Thecase of E. grandiflora is interesting; since itsseeds are dispersed by various rodents(Forget, 1992), seedlings may sometimesestablish at some distance from the parenttrees. In this situation, Gombauld (1996)predicted that populations of specialistinsects would become more fragmented(and less successful) with increasing dis-tance between individuals.
Forget (1994, 1996) studied theseedling dynamics of Vouacapoua ameri-cana (Caesalpiniaceae) at Piste de St Elie,and assumed that a majority of seedlingsdied due to development of fungi on stemsobserved during the establishment phase.Complementary observations were made byJoly (1996) in Les Nouragues, where youngred leaves of sprouting seedlings of V.americana were heavily attacked (up to100%) by Thestius pholeus (Cramer)(Lycaenidae) in June–July, i.e. in the latewet season. This species appears to berather host-specific and it did not consumeeither mature leaves or other leaves sam-pled at random in the understorey (Joly,
1996; but consider an observation made inGuyana below). In addition, the intensity ofattack by the caterpillar was not evenly dis-tributed, and only V. americana seedlingsgrowing in areas with high density of con-specific trees were damaged (Joly, personalcommunication). It is possible that theoccurrence of the caterpillar is related tothe density of V. americana and/or overalltree diversity at the community level, bothof which may vary widely between forestareas, thus having different impact betweensites. Given that V. americana may formdense patches, as well as other similarlylarge-seeded species in the Guianas (e.g.Chlorocardium rodiei) that are subjected toinsect herbivory, it would be interesting toquantify the impact of such herbivores onjuvenile recruitment in light of tree patchdensity.
Although many species of Cecropia areinhabited by ants, this genus has beendeemed ‘the most hospitable tree of thetropics’ (Skutch, 1945). Many animalspecies feed on its leaves, nectar and inflo-rescences, food bodies and on the antsthemselves. The insect fauna feeding onCecropia spp. is reasonably well-known(e.g. Fiebrig, 1909; Wheeler, 1942; Jolivet,1987) and includes many species ofAleyrodidae, Chrysomelidae, Curculion-idae and Nymphalidae, but few recordsoriginate from the Guianas.
The leaf-chewing insects feeding onthe seedlings of various tree species werestudied extensively at Mabura Hill, Guyana(Basset, 1999; Basset and Charles, 2000).Collections included over 3100 specimens,179 species and 16 insect families. Themost abundant and speciose familiesincluded Chrysomelidae (particularlyGalerucinae, Eumolpinae, Alticinae andCryptocephalinae) and Curculionidae (par-ticularly Entiminae). The majority of theremainder included 13 families ofLepidoptera, with Gelechiidae dominating.Many of these species, particularly amongEumolpinae and Entiminae, were able tofeed on the seedlings of the five hosts stud-ied. Interestingly, the lycaenid Thestiuspholeus, which severely damages theseedlings of V. americana in French Guiana
Folivorous Insects 307
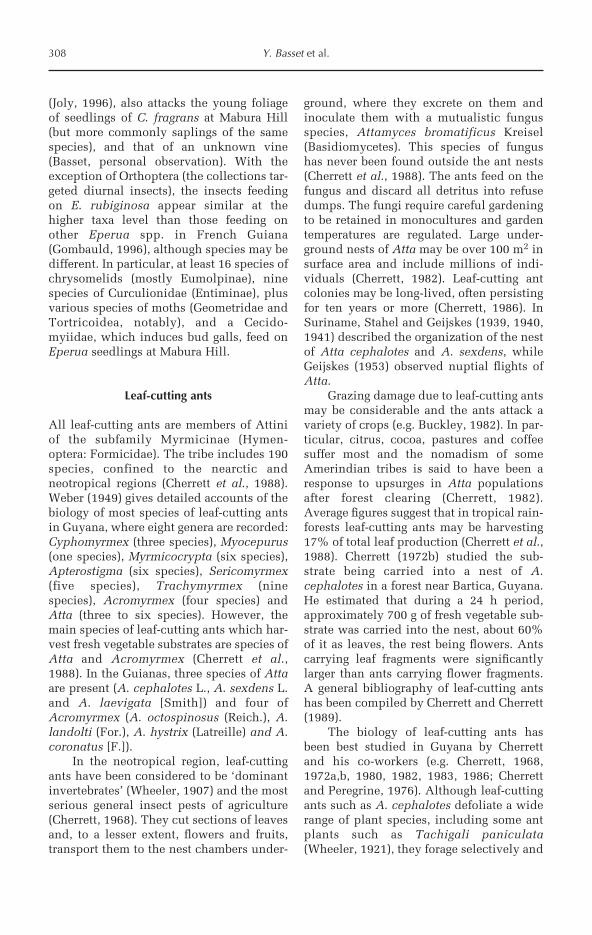
(Joly, 1996), also attacks the young foliageof seedlings of C. fragrans at Mabura Hill(but more commonly saplings of the samespecies), and that of an unknown vine(Basset, personal observation). With theexception of Orthoptera (the collections tar-geted diurnal insects), the insects feedingon E. rubiginosa appear similar at thehigher taxa level than those feeding onother Eperua spp. in French Guiana(Gombauld, 1996), although species may bedifferent. In particular, at least 16 species ofchrysomelids (mostly Eumolpinae), ninespecies of Curculionidae (Entiminae), plusvarious species of moths (Geometridae andTortricoidea, notably), and a Cecido-myiidae, which induces bud galls, feed onEperua seedlings at Mabura Hill.
Leaf-cutting ants
All leaf-cutting ants are members of Attiniof the subfamily Myrmicinae (Hymen-optera: Formicidae). The tribe includes 190species, confined to the nearctic andneotropical regions (Cherrett et al., 1988).Weber (1949) gives detailed accounts of thebiology of most species of leaf-cutting antsin Guyana, where eight genera are recorded:Cyphomyrmex (three species), Myocepurus(one species), Myrmicocrypta (six species),Apterostigma (six species), Sericomyrmex(five species), Trachymyrmex (ninespecies), Acromyrmex (four species) andAtta (three to six species). However, themain species of leaf-cutting ants which har-vest fresh vegetable substrates are species ofAtta and Acromyrmex (Cherrett et al.,1988). In the Guianas, three species of Attaare present (A. cephalotes L., A. sexdens L.and A. laevigata [Smith]) and four ofAcromyrmex (A. octospinosus (Reich.), A.landolti (For.), A. hystrix (Latreille) and A.coronatus [F.]).
In the neotropical region, leaf-cuttingants have been considered to be ‘dominantinvertebrates’ (Wheeler, 1907) and the mostserious general insect pests of agriculture(Cherrett, 1968). They cut sections of leavesand, to a lesser extent, flowers and fruits,transport them to the nest chambers under-
ground, where they excrete on them andinoculate them with a mutualistic fungusspecies, Attamyces bromatificus Kreisel(Basidiomycetes). This species of fungushas never been found outside the ant nests(Cherrett et al., 1988). The ants feed on thefungus and discard all detritus into refusedumps. The fungi require careful gardeningto be retained in monocultures and gardentemperatures are regulated. Large under-ground nests of Atta may be over 100 m2 insurface area and include millions of indi-viduals (Cherrett, 1982). Leaf-cutting antcolonies may be long-lived, often persistingfor ten years or more (Cherrett, 1986). InSuriname, Stahel and Geijskes (1939, 1940,1941) described the organization of the nestof Atta cephalotes and A. sexdens, whileGeijskes (1953) observed nuptial flights ofAtta.
Grazing damage due to leaf-cutting antsmay be considerable and the ants attack avariety of crops (e.g. Buckley, 1982). In par-ticular, citrus, cocoa, pastures and coffeesuffer most and the nomadism of someAmerindian tribes is said to have been aresponse to upsurges in Atta populationsafter forest clearing (Cherrett, 1982).Average figures suggest that in tropical rain-forests leaf-cutting ants may be harvesting17% of total leaf production (Cherrett et al.,1988). Cherrett (1972b) studied the sub-strate being carried into a nest of A.cephalotes in a forest near Bartica, Guyana.He estimated that during a 24 h period,approximately 700 g of fresh vegetable sub-strate was carried into the nest, about 60%of it as leaves, the rest being flowers. Antscarrying leaf fragments were significantlylarger than ants carrying flower fragments.A general bibliography of leaf-cutting antshas been compiled by Cherrett and Cherrett(1989).
The biology of leaf-cutting ants hasbeen best studied in Guyana by Cherrettand his co-workers (e.g. Cherrett, 1968,1972a,b, 1980, 1982, 1983, 1986; Cherrettand Peregrine, 1976). Although leaf-cuttingants such as A. cephalotes defoliate a widerange of plant species, including some antplants such as Tachigali paniculata(Wheeler, 1921), they forage selectively and
308 Y. Basset et al.

the impact on particular plant species maybe much greater than on the plant commu-nity as a whole (Buckley, 1982). For exam-ple, A. cephalotes tends to damagebroad-leaved plants only, whereas A. laevi-gata cuts both grasses and broad-leavedplants (Cherrett, 1972a). Thorough studiesof the foraging patterns of A. cephalotes byCherrett, based on relatively long-termobservations of a nest near Bartica inGuyana (e.g. Cherrett, 1968, 1972b; and seeCherrett et al., 1988), showed that the antsare mostly nocturnal. A. cephalotes cut leafsections from 36 out of 72 available plantspecies in the study area, concentrating ona few of these. Most foraging activity tookplace up to 30–45 m away from the nestand, in the canopy, above 12 m. The antsprefer young leaf material, flowers andbuds, and, in particular, plant tissues bothless tough and dense and those with highmoisture. Plants are particularly at riskwhen flowering or flushing. The less densethe plant material, the more successful thesmall workers will be in cutting and carry-ing it back to the nest.
Several other studies led Cherrett andhis co-workers (see references above) toconclude in substance that:
1. Whilst the interaction between leaf-cut-ting ants and the fungi that they cultivate ishighly specialized, it is relatively unspe-cialized with regard to the use of plantspecies;2. Only 5% of the energy requirements of anant colony is provided by the fungus, therest being supplied directly by plant sap;however, the fungus provides essentialnutrients;3. The outcome of the mutualistic relation-ship between the ants and the fungus is amost unusual degree of ecological domi-nance in diverse tropical vegetation,brought about by wide polyphagy; in short,both ant and fungus can utilize a far widerrange of host plants than either could aloneand, in doing so, they attain large popula-tion sizes (Cherrett et al., 1988);4. A. cephalotes has developed a conserva-tive grazing system which prevents it fromover-exploiting, and hence destroying, the
vegetation in the area around the nest; and5. The introduction of agriculture disruptsthe pattern in (4) above, and may contributeto the pest status of this species.
Discussion
Although the overall body of publishedinformation on insect–plant interactions inthe rainforests of the Guianas may appearconsiderable, it concerns mainly pollina-tors, leaf-cutting ants, ant gardens and otherant–plant interactions (Table 5.3). Mostother interactions have been neglected, par-ticularly those involving folivorous insects,including leaf-mining and gall-makingspecies. Despite these caveats, it is of inter-est to discuss whether leaf and sapresources and insect–plant interactions inthe Guianas may be different than at other,better studied locations in tropical rain-forests. We concentrate on monodominanceof tree species and host specificity of foliv-orous insects in order to extend the debateto the diversity of insect–plant interactionsin the rainforests of the Guianas.
Monodominance of tree species and hostspecificity of folivorous insects
As emphasized elsewhere in this book, treediversity in the rainforests of the Guianasdepends mostly on local conditions such assoil type, drainage class and topographicalfeatures. Floristically-rich mixed foreststend to occur on well-drained soils,whereas on poorly drained soils dominanceof one or a few species of Leguminosae iscommonplace. Typically, these monodomi-nant stands exhibit a much lower vegeta-tional diversity than mixed forests (e.g.Davis and Richards, 1933, 1934; ter Steegeet al., 1996). Monodominant species ofLeguminosae are found in Eperua, Mora,Dicymbe, Peltogyne, Dicorynia, Dimorph-andra and Vouacapoua. In addition, thereis often a trend for certain species in generasuch as Chlorocardium, Carapa(Meliaceae), Eschweilera spp. and Lecythisspp. (Lecythidaceae), Catostemma spp.,
Folivorous Insects 309
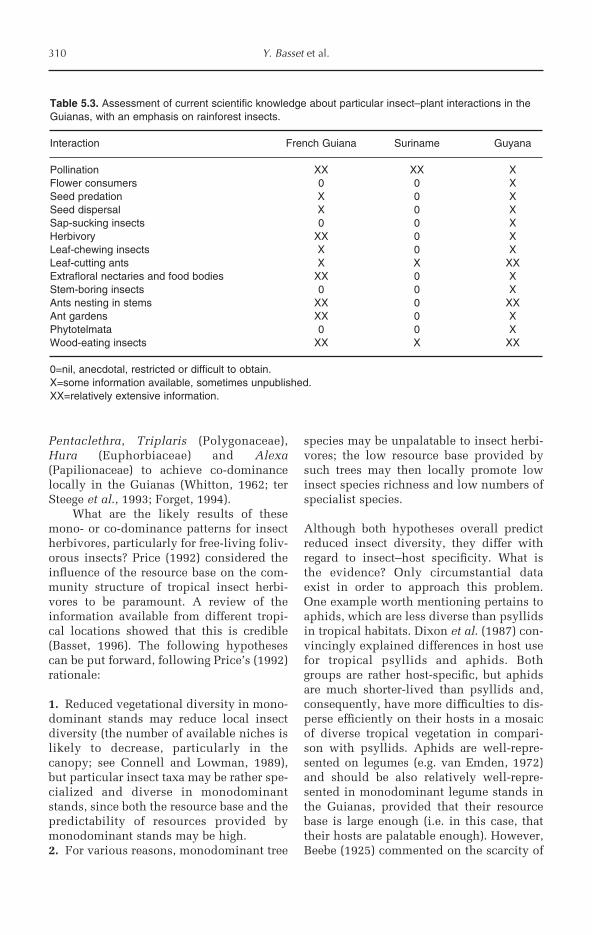
Pentaclethra, Triplaris (Polygonaceae),Hura (Euphorbiaceae) and Alexa(Papilionaceae) to achieve co-dominancelocally in the Guianas (Whitton, 1962; terSteege et al., 1993; Forget, 1994).
What are the likely results of thesemono- or co-dominance patterns for insectherbivores, particularly for free-living foliv-orous insects? Price (1992) considered theinfluence of the resource base on the com-munity structure of tropical insect herbi-vores to be paramount. A review of theinformation available from different tropi-cal locations showed that this is credible(Basset, 1996). The following hypothesescan be put forward, following Price’s (1992)rationale:
1. Reduced vegetational diversity in mono-dominant stands may reduce local insectdiversity (the number of available niches islikely to decrease, particularly in thecanopy; see Connell and Lowman, 1989),but particular insect taxa may be rather spe-cialized and diverse in monodominantstands, since both the resource base and thepredictability of resources provided bymonodominant stands may be high.2. For various reasons, monodominant tree
species may be unpalatable to insect herbi-vores; the low resource base provided bysuch trees may then locally promote lowinsect species richness and low numbers ofspecialist species.
Although both hypotheses overall predictreduced insect diversity, they differ withregard to insect–host specificity. What isthe evidence? Only circumstantial dataexist in order to approach this problem.One example worth mentioning pertains toaphids, which are less diverse than psyllidsin tropical habitats. Dixon et al. (1987) con-vincingly explained differences in host usefor tropical psyllids and aphids. Bothgroups are rather host-specific, but aphidsare much shorter-lived than psyllids and,consequently, have more difficulties to dis-perse efficiently on their hosts in a mosaicof diverse tropical vegetation in compari-son with psyllids. Aphids are well-repre-sented on legumes (e.g. van Emden, 1972)and should be also relatively well-repre-sented in monodominant legume stands inthe Guianas, provided that their resourcebase is large enough (i.e. in this case, thattheir hosts are palatable enough). However,Beebe (1925) commented on the scarcity of
310 Y. Basset et al.
Table 5.3. Assessment of current scientific knowledge about particular insect–plant interactions in theGuianas, with an emphasis on rainforest insects.
Interaction French Guiana Suriname Guyana
Pollination XX XX XFlower consumers 0 0 XSeed predation X 0 XSeed dispersal X 0 XSap-sucking insects 0 0 XHerbivory XX 0 XLeaf-chewing insects X 0 XLeaf-cutting ants X X XXExtrafloral nectaries and food bodies XX 0 XStem-boring insects 0 0 XAnts nesting in stems XX 0 XXAnt gardens XX 0 XPhytotelmata 0 0 XWood-eating insects XX X XX
0=nil, anecdotal, restricted or difficult to obtain.X=some information available, sometimes unpublished.XX=relatively extensive information.

aphids in the rainforests near Kartabo.Further, seedlings of the legumes Eperuaspp., Mora spp. and Pentaclethramacroloba rarely support aphid species,but the two former genera often supporthigh loads of psyllids (Gombauld, 1996;Basset and Charles, 2000). This observationsuggests that monodominant stands mayprovide a low resource base for aphids,which is in support of hypothesis 2.
Forget (1992; see also Richards, 1996)suggested that chemical and structuraldefences in Eperua spp. leaves, in additionto understorey tolerance at all stages ofdevelopment, are likely to participate inpromoting tree dominance of this speciesgroup in the forests of the Guianas, consis-tent with hypothesis 2. As emphasized pre-viously, monodominant stands occurmostly on nutrient-poor or poorly drainedlocations (e.g. Beard, 1946; ter Steege et al.,1993). The leaves of slow-growing mono-dominant trees may not only be well-pro-tected chemically and physically, they mayalso be relatively nutrient-poor (e.g. totalnitrogen in sapling leaves of mono- or co-dominant species at Mabura Hill do notappear to exceed 1.8% of dry weight:Raaimakers et al., 1994, Table 2.1). It iswell known that herbivores of nutrient-impoverished plants tend to be morepolyphagous than those feeding on nutri-ent-rich plants (Mattson and Scriber, 1987).An analogous situation to that in theGuianas could well be the dominant forestsof dipterocarps in South-east Asia, whichare low in nutrients and support very fewlepidopteran defoliators, most of thembeing polyphagous (Holloway, 1989). Datafrom Barro Colorado Island, Panama, alsosuggest that Membracidae feeding on slow-growing, shade-tolerant hosts are lessdiverse than those feeding on fast-growinghosts, but, consistent with hypothesis 1,they appear to be rather specialized (Loye,1992).
Further, many species in several insectgroups (e.g. Acridoidea, Fulgoroidea,Membracidae, Cerambycidae, Scolytidae,Platypodidae, Hesperiidae, etc.) appear toexhibit a relatively wide geographical dis-tribution, unconfined to the Guiana Shield.
Generalist insect herbivores tend to belarger than specialists, and larger herbi-vores tend to have a wider geographicalrange (e.g. Gaston and Lawton, 1988). Thus,a wide geographical range of many speciesof insect herbivore would tend to supporthypothesis 2. An alternative explanation isthat insects are relatively specialized(monophagous or oligophagous), but theirhosts are widely distributed. De Granville(1988) considered that about 35% of plantspecies (within certain plant taxa) areendemic to the Guianas. Further, manymono- or co-dominant species present inthe Guianas are near-endemic and do notextend much beyond that region (e.g. terSteege, 1990). For example, Nascimentoand Proctor (1994) commented that mono-dominant stands are rare in Brazil (forexample, Peltogyne gracilipes on MaracáIsland). Thus, the relatively high level ofendemism of several tree species in theGuianas would not suggest a pattern of highlevel of insect specialization on widely dis-tributed host trees in Amazonia.
Overall, there appears to be more cir-cumstantial evidence to accept hypothesis2, although hypothesis 1 may be moreappropriate for certain insect taxa.However, at present, we are reluctant toaccept hypothesis 2 before two furtherpoints can be clarified. First, tropicalinsects which have been formally identifiedand whose geographical range can beinferred are more likely to be better knowngeneralists, these often being insect pests.Although there has been speculation overthe tremendous local endemism inAmazonian canopy insects (e.g. Erwin,1983), the impression of high insectendemism in the lowland tropics may bemerely a consequence of poor sampling(e.g. Gaston et al., 1996). For example,before exchanging information with his col-leagues in French Guiana, the present firstauthor thought that the lycaenid Thestiuspholeus was relatively specialized, feedingon Catostemma at Mabura Hill, Guyana. Infact, this species also feeds on Vouacapouain French Guiana, with apparent host-specificity (Joly, 1996). This case of appar-ent local specialization, but with rather
Folivorous Insects 311

polyphagous habits over the entire geo-graphical range of the species, has beendocumented in several cases (e.g. Fox andMorrow, 1981) and may indeed be rela-tively common in tropical insect herbivores(e.g. Janzen, 1981). Further, poor samplingincreases the difficulty of recognizing mor-phological variation associated with manywidespread species (Gaston et al., 1996).
Secondly, most insect collecting in theGuianas has been from the understorey.The abundance and the diversity of insectherbivores are typically higher in thecanopy of rainforests than in their under-storey, because, as can be again argued, theresource base is higher in the former (e.g.Basset et al., 1992, 1999, 2003). Similarly,understorey insects may be less specialized(and have a wider geographical range) thanin the canopy. We have limited evidencethat some free-living insects feeding onseedlings in the understorey appear to berather generalist (Gombauld, 1996; Basset,1999).
In summary, we believe that futurestudies upon the host-specificity of insectherbivores foraging in the canopy will helpgreatly to evaluate whether hypothesis 2 isgenerally correct and not an artefact of thelimited information presently available.These studies should be supported by ade-quate sampling effort (sufficient numbers ofinsects collected from sufficient numbers ofhost plants) and adequate taxonomic effort.
Diversity of insect–plant interactions in therainforests of the Guianas
It is well known that mammalian diversityin Amazonia is least in the Guiana sub-region (Voss and Emmons, 1996). What ofinsect–plant interactions, and particularlyinsect herbivores, in this regard? First, ento-mological knowledge in arguably the beststudied of the three Guianas, Guyana, isnotoriously low (e.g. Munroe, 1993; Funk,1997) and this greatly impedes analyses ofhost specificity and endemism. Second,generalizations are difficult since, for exam-ple, patterns of mammalian diversity do notfollow those of butterflies worldwide
(Robbins and Opler, 1997). Third, patternsmay be dissimilar for different insect taxabelonging to different feeding guilds. Forexample, whereas folivorous insects couldbe less diverse in monodominant stands(see discussion above), bee diversityappears to be poorer in diverse forests(Roubik, 1990). Flowers represent a muchless protected resource, both physically andchemically, than leaves and, as such, pat-terns of host use may well be very differentbetween respective insect feeding guildsusing these different resources.
There are no suitable data (i.e. samplesize large enough and comparable in differ-ent locations) to compare the fauna ofinsect herbivores in the Guianas with thoseelsewhere, particularly in Amazonia.However, it may be argued that the interac-tions in ant gardens are clearly less diversein the Guianas than in Peru (Davidson,1988). Further, circumstantial evidencesuggests that the diversity of insects, partic-ularly of herbivores, may indeed be rela-tively low in the Guianas. For example,Tavakilian (1993) concluded, from exten-sive observation, that light trapping ofColeoptera in French Guiana yields poorerresults than in Africa or Asia. Incidentally,the present first author was also surprisedat the low occurrence, all year long, ofinsects attracted to light at Mabura Hill,Guyana, in comparison with other locationsin the tropics.
Further, leaf-cutting ants are abundantin the neotropical region and common inthe Guianas. Yet, despite this, leaf damagein the rainforests of the Guianas appearsrelatively low in comparison with else-where in the tropics (see Coley and Aide,1991). This might be a consequence of lowgrazing rates on leaf resources low in nutri-ents, or an indication of the low abundanceand diversity of insect herbivores otherthan leaf-cutting ants. It is well known thatforests growing on nutrient-poor whitesands, for example, are less prone to attackby free-living insect herbivores (e.g. Janzen,1974). The data of Isaacs et al. (1996) inGuyana indeed suggest that apparent leafdamage unrelated to leaf-cutting antsamounted to about 5%, a rather low value.
312 Y. Basset et al.

However, care must be exercised in thistype of extrapolation, since it is notoriouslydifficult to relate insect abundance anddiversity to apparent leaf damage (e.g.Marquis, 1991; Basset and Höft, 1994).
These patterns of relatively low diver-sity, if actually correct, may be partlyrelated to monodominance of certain hostplants, as discussed previously for folivo-rous insects. Since monodominance pat-terns may increase with respect to soiltypes from the series French Guiana–Suriname–Guyana, to culminate in the lat-ter country, it would be interesting to testwhether the diversity of particular insecttaxa also decreases along this series, asmore and better data become available. Onerelated question would be to assess localdifferences in insect species richnessbetween well-drained and poorly drainedforests. The extent of structural and vegeta-tional differences in these two habitats issuch (e.g. ter Steege et al., 1993) that this islikely to affect many taxa of insect herbi-vores. For example, De Dijn (2004) reportedsuch differences for bee assemblages inSuriname.
To conclude, it is clear that there aresevere gaps in our knowledge ofinsect–plant interactions in the Guianas.We believe that it may be difficult, if notfutile, to discuss possible patterns andspeculate further beyond that which wehave suggested above without additionaldata. We hope that this review will stimu-late entomologists and ecologists to under-take much needed studies of insect–plant interactions in the rainforests of
the Guianas. The Guianan Shield, withits unique large and often undisturbed for-est formations, including some peculiarmonodominant stands, represents a poten-tial wealth of information for scientists,which may challenge some commonly heldviews in tropical ecology. Our immediateresponsibilities are to study thoroughlythese habitats before they disappear,and to conserve most of them for futuregenerations.
Acknowledgements
Many colleagues helped collating the infor-mation presented in this review, providedus with unpublished information, oftenwith great rapidity, or discussed varioussections of the text: H.-P. Aberlenc, J. Adis,C. Amédégnato, H. Barrios, G. Beccaloni, V.Becker, C. Brévignon, G. Delvare, P.-M.Forget, D.S. Hammond, H. Hiwat, P. Jolivet,I. Kitching, R.L. Kitching, D. Matile, J.Miller, S.E. Miller, M.P.A. Quik-Stregels,G.S. Robinson, L.S. Springate, H. ter Steege.In particular, J. Adis, C. Amédégnato, G.Delvare, B. De Dijn, G.W. Fernandes, P.Gombauld, S.E. Miller and S.P. Ribeirocommented on the full version of earlierdrafts. Studies on insect herbivores inGuyana by the first and third authors werefunded by the Darwin Initiative forthe Protection of the Species (UK) andthe DfID (UK), respectively, and werelogistically supported by the Tropenbos-Guyana Programme and Demerara TimbersLtd.
Folivorous Insects 313
References
Ackery, P.R. (1988) Hostplants and classification: a review of nymphalid butterflies. Biological Journal of theLinnean Society 33, 95–203.
Adis, J. (1997) Terrestrial invertebrates: survival strategies, group spectrum, dominance and activity patterns.In: Junk, W.J. (ed.) The Central Amazon Floodplain. Ecology of a Pulsing System. Springer, Berlin, pp.318–330.
Adis, J. and Schubart, H.O.R. (1984) Ecological research on arthropods in Central Amazonian forest ecosys-tems with recommendation for study procedures. In: Cooley, J. and Golley, F.B. (eds) Trends inEcological Research for the 1980s. Plenum Press, New York, pp. 111–144.
Aide, T.M. (1988) Herbivory as a selective agent on the timing of leaf production in a tropical understorycommunity. Nature 336, 574–575.
Amédégnato, C. (1996) L’acridofaune palmicole neotropicale: diversité et origine. In: Couturier, G. (ed.) La

faune entomologique des palmiers dans les écosystèmes forestiers de l’Amazonie péruvienne.Programme SOFT, Convention ORSTOM 224. Rapport Ministère de l’Environnement, Paris, pp. 1–28.
Amédégnato, C. (1997) Diversity in an Amazonian canopy grasshoppers community in relation to resourcepartition and phylogeny. In: Stork, N.E., Adis, J. and Didham, R.K. (eds) Canopy Arthropods. Chapmanand Hall, London, pp. 281–319.
Amédégnato, C. (2003) Microhabitat distribution of forest grasshoppers in the Amazon. In: Basset, Y.,Novotny, V., Miller, S.E. and Kitching, R.L. (eds) Arthropods of Tropical Forests. Spatio-temporalDynamics and Resource Use in the Canopy. Cambridge University Press, Cambridge, UK, pp. 237–255.
Amédégnato, C. and Descamps, M. (1980) Etude comparative de quelques peuplements acridiens de la forêtneotropicale. Acrida 9, 171–216.
Balachowsky, A.S. (1970) La mission d’exploration entomologique du Muséum National d’Histoire Naturelleen Guyane française (octobre–décembre 1969). Introduction. Annales de la Société Entomologique deFrance (N.S.) 6, 563–570.
Basset, Y. (1996) Local communities of arboreal herbivores in Papua New Guinea: predictors of insect vari-ables. Ecology 77, 1906–1919.
Basset, Y. (1999) Diversity and abundance of insect herbivores foraging on seedlings in a rain forest inGuyana. Ecological Entomology 24, 245–259.
Basset, Y. (2000) Insect herbivores foraging on seedlings in an unlogged rain forest in Guyana: spatial andtemporal considerations. Studies on Neotropical Fauna and Environment 35, 115–129.
Basset, Y. and Charles, E. (2000) An annotated list of insect herbivores foraging on the seedlings of five for-est trees in Guyana. Anais da Sociedade Entomológica do Brasil 29, 433–452.
Basset, Y. and Höft, R. (1994) Can apparent leaf damage in tropical trees be predicted by herbivore load orhost-related variables? A case study in Papua New Guinea. Selbyana 15, 3–13.
Basset, Y., Aberlenc, H.-P. and Delvare, G. (1992) Abundance and stratification of foliage arthropods in alowland rain forest of Cameroon. Ecological Entomology 17, 310–318.
Basset, Y., Charles, E.L. and Novotny, V. (1999) Insect herbivores on parent trees and conspecific seedlingsin a Guyana rain forest. Selbyana 20, 146–158.
Basset, Y., Charles, E., Hammond, D.S. and Brown, V.K. (2001) Short-term effects of canopy openness oninsect herbivores in a rain forest in Guyana. Journal of Applied Ecology 38, 1045–1058.
Basset, Y., Novotny, V., Miller, S.E. and Kitching, R.L. (2003) Conclusion: arthropods, forest types and inter-pretable patterns. In: Basset, Y., Novotny, V., Miller, S.E. and Kitching, R.L. (eds) Arthropods of TropicalForests. Spatio-temporal Dynamics and Resource Use in the Canopy. Cambridge University Press,Cambridge, UK, pp. 394–405.
Beard, J.S. (1946) The Mora forests of Trinidad, British West Indies. Journal of Ecology 33, 173–192.Beebe, W. (1925) Studies of a tropical jungle; one quarter of a square mile of jungle at Kartabo, British
Guiana. Zoologica 6, 4–193.Beebe, W. (1952) Introduction to the ecology of the Arima Valley, Trinidad, B.W.I. Zoologica 37, 157–183.Beebe, W. and Crane, J. (1947) Ecology of Rancho Grande, a subtropical cloud forest in Northern Venezuela.
Zoologica 32, 43–61.Beebe, W. and Fleming, H. (1945) The Sphingidae (moths) of Kartabo, British Guiana, and Caripito,
Venezuela. Zoologica 30, 1–6.Benson, R.B. (1930) Sawflies collected by the Oxford University Expedition to British Guiana, 1929. Annals
and Magazine of Natural History 6, 620–621.Bodkin, G.E. (1919) Notes on the Coleoptera of British Guiana. The Entomologist’s Monthly Magazine 55,
264–272.Brévignon, C. (1990) Quelques élevages guyanais: Napeocles jucunda Hübner (Lep. Nymphalidae), Papilio
torquatus Cramer, Papilio anchisiades Esper, Eurytides ariarathes Esper (Lep. Papilionidae). SciencesNat 68, 19–21.
Brévignon, C. (1992) Elevage de deux Riodininae guyanais, Napaea beltiana Bates et Cremna thasus Stoll. I.A propos de la myrmécophilie des chenilles. Alexanor 17, 403–413.
Brévignon, C. (1995) Description de nouveaux Riodinidae de Guyane française (Lepidoptera). Lambillionea95, 553–560.
Brévignon, C. (1997) Notes sur les Nemeobiinae de Guyane française. II – Le groupe de Euselasia euryone(Hewitson, 1856) (Lepidoptera Riodinidae). Lambillionea 97, 116–120.
Buckley, R.C. (1982) Ant–plant interactions: a world review. In: Buckley, R.C. (ed.) Ant–Plant Interactions inAustralia. W. Junk, The Hague, The Netherlands, pp. 111–162.
Charles, E.L. (1998) The impact of natural gap size on the communities of insect herbivores within a rain for-
314 Y. Basset et al.
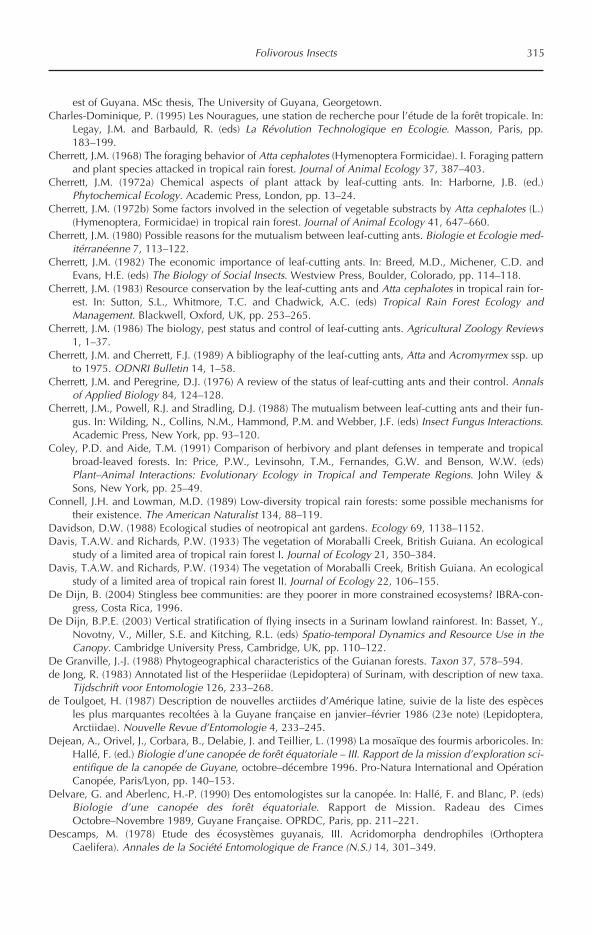
est of Guyana. MSc thesis, The University of Guyana, Georgetown.Charles-Dominique, P. (1995) Les Nouragues, une station de recherche pour l’étude de la forêt tropicale. In:
Legay, J.M. and Barbauld, R. (eds) La Révolution Technologique en Ecologie. Masson, Paris, pp.183–199.
Cherrett, J.M. (1968) The foraging behavior of Atta cephalotes (Hymenoptera Formicidae). I. Foraging patternand plant species attacked in tropical rain forest. Journal of Animal Ecology 37, 387–403.
Cherrett, J.M. (1972a) Chemical aspects of plant attack by leaf-cutting ants. In: Harborne, J.B. (ed.)Phytochemical Ecology. Academic Press, London, pp. 13–24.
Cherrett, J.M. (1972b) Some factors involved in the selection of vegetable substracts by Atta cephalotes (L.)(Hymenoptera, Formicidae) in tropical rain forest. Journal of Animal Ecology 41, 647–660.
Cherrett, J.M. (1980) Possible reasons for the mutualism between leaf-cutting ants. Biologie et Ecologie med-itérranéenne 7, 113–122.
Cherrett, J.M. (1982) The economic importance of leaf-cutting ants. In: Breed, M.D., Michener, C.D. andEvans, H.E. (eds) The Biology of Social Insects. Westview Press, Boulder, Colorado, pp. 114–118.
Cherrett, J.M. (1983) Resource conservation by the leaf-cutting ants and Atta cephalotes in tropical rain for-est. In: Sutton, S.L., Whitmore, T.C. and Chadwick, A.C. (eds) Tropical Rain Forest Ecology andManagement. Blackwell, Oxford, UK, pp. 253–265.
Cherrett, J.M. (1986) The biology, pest status and control of leaf-cutting ants. Agricultural Zoology Reviews1, 1–37.
Cherrett, J.M. and Cherrett, F.J. (1989) A bibliography of the leaf-cutting ants, Atta and Acromyrmex ssp. upto 1975. ODNRI Bulletin 14, 1–58.
Cherrett, J.M. and Peregrine, D.J. (1976) A review of the status of leaf-cutting ants and their control. Annalsof Applied Biology 84, 124–128.
Cherrett, J.M., Powell, R.J. and Stradling, D.J. (1988) The mutualism between leaf-cutting ants and their fun-gus. In: Wilding, N., Collins, N.M., Hammond, P.M. and Webber, J.F. (eds) Insect Fungus Interactions.Academic Press, New York, pp. 93–120.
Coley, P.D. and Aide, T.M. (1991) Comparison of herbivory and plant defenses in temperate and tropicalbroad-leaved forests. In: Price, P.W., Levinsohn, T.M., Fernandes, G.W. and Benson, W.W. (eds)Plant–Animal Interactions: Evolutionary Ecology in Tropical and Temperate Regions. John Wiley &Sons, New York, pp. 25–49.
Connell, J.H. and Lowman, M.D. (1989) Low-diversity tropical rain forests: some possible mechanisms fortheir existence. The American Naturalist 134, 88–119.
Davidson, D.W. (1988) Ecological studies of neotropical ant gardens. Ecology 69, 1138–1152.Davis, T.A.W. and Richards, P.W. (1933) The vegetation of Moraballi Creek, British Guiana. An ecological
study of a limited area of tropical rain forest I. Journal of Ecology 21, 350–384.Davis, T.A.W. and Richards, P.W. (1934) The vegetation of Moraballi Creek, British Guiana. An ecological
study of a limited area of tropical rain forest II. Journal of Ecology 22, 106–155.De Dijn, B. (2004) Stingless bee communities: are they poorer in more constrained ecosystems? IBRA-con-
gress, Costa Rica, 1996.De Dijn, B.P.E. (2003) Vertical stratification of flying insects in a Surinam lowland rainforest. In: Basset, Y.,
Novotny, V., Miller, S.E. and Kitching, R.L. (eds) Spatio-temporal Dynamics and Resource Use in theCanopy. Cambridge University Press, Cambridge, UK, pp. 110–122.
De Granville, J.-J. (1988) Phytogeographical characteristics of the Guianan forests. Taxon 37, 578–594.de Jong, R. (1983) Annotated list of the Hesperiidae (Lepidoptera) of Surinam, with description of new taxa.
Tijdschrift voor Entomologie 126, 233–268.de Toulgoet, H. (1987) Description de nouvelles arctiides d’Amérique latine, suivie de la liste des espèces
les plus marquantes recoltées à la Guyane française en janvier–février 1986 (23e note) (Lepidoptera,Arctiidae). Nouvelle Revue d’Entomologie 4, 233–245.
Dejean, A., Orivel, J., Corbara, B., Delabie, J. and Teillier, L. (1998) La mosaïque des fourmis arboricoles. In:Hallé, F. (ed.) Biologie d’une canopée de forêt équatoriale – III. Rapport de la mission d’exploration sci-entifique de la canopée de Guyane, octobre–décembre 1996. Pro-Natura International and OpérationCanopée, Paris/Lyon, pp. 140–153.
Delvare, G. and Aberlenc, H.-P. (1990) Des entomologistes sur la canopée. In: Hallé, F. and Blanc, P. (eds)Biologie d’une canopée des forêt équatoriale. Rapport de Mission. Radeau des CimesOctobre–Novembre 1989, Guyane Française. OPRDC, Paris, pp. 211–221.
Descamps, M. (1978) Etude des écosystèmes guyanais, III. Acridomorpha dendrophiles (OrthopteraCaelifera). Annales de la Société Entomologique de France (N.S.) 14, 301–349.
Folivorous Insects 315

Descamps, M. (1979) Eumastacoidea néotropicaux. Diagnoses, signalisations, notes biologiques. Annales dela Société Entomologique de France (N.S.) 15, 117–155.
Dixon, A.F.G., Kindlmann, P., Leps, J. and Holman, J. (1987) Why there are so few species of aphids, espe-cially in the tropics. The American Naturalist 129, 580–592.
Erwin, T.L. (1983) Beetles and other insects of tropical forest canopies at Manaus, Brazil, sampled by insec-tidal fogging. In: Sutton, S.L., Whitmore, T.C. and Chadwick, A.C. (eds) Tropical Rain Forest: Ecologyand Management. Blackwell, Oxford, UK, pp. 59–75.
Fiebrig, K. (1909) Cecropia peltata und ihr Verhältnis zu Azteca alfari, zu Atta sexdens und anderen Insekten,mit einer Notiz über Ameisen-Dornen bei Acacia cavenia. Biologische Centralblatt 29, 1–16, 33–55,65–77.
Fisher, W.S. (1944) New American Cerambycidae (Coleoptera) from British Guiana and Costa Rica.Zoologica 29, 1–2.
Fleming, H. (1945) The Saturnioidea (moths) of Kartabo, British Guiana, and Caripito, Venezuela. Zoologica30, 73–80.
Fleming, H. (1949) The Pericopidae (moths) of Kartabo, British Guiana, and Caripito, Venezuela. Zoologica34, 19–20.
Fleming, H. (1950) The Eurochromiidae (moths) of Kartabo, British Guiana, and Caripito, Venezuela.Zoologica 35, 209–216.
Forget, P.-M. (1992) Regeneration ecology of Eperua grandiflora (Caesalpiniaceae), a large-seeded tree inFrench Guiana. Biotropica 24, 146–156.
Forget, P.-M. (1994) Regeneration pattern of Vouacapoua americana (Caesalpiniaceae), a rodent-dispersedtree species in French Guiana. Biotropica 26, 420–426.
Forget, P.-M. (1996) Removal of seeds of Carapa procera (Meliaceae) by rodents and their fate in rainforestin French Guiana. Journal of Tropical Ecology 12, 751–761.
Fox, L.R. and Morrow, P.A. (1981) Specialization: species property or local phenomenon? Science 211,887–893.
Funk, V.A. (1997) Using collection data and GIS to examine biodiversity information levels in Guyana. In:Hoagland, K.E. and Rossman, A.Y. (eds) Global Genetics Resources: Access, Ownership, andIntellectual Property Rights. Association of Systematics Collections, Washington, DC, pp. 117–128.
Funkhouser, W.D. (1942) Membracidae (Homoptera) from British Guiana. Zoologica 27, 125–129.Gaston, K.J. and Lawton, J.H. (1988) Patterns in body size, population dynamics and regional distribution of
bracken herbivores. The American Naturalist 132, 662–680.Gaston, K.J., Gauld, I.D. and Hanson, P. (1996) The size and composition of the hymenopteran fauna of
Costa Rica. Journal of Biogeography 23, 105–113.Geijskes, D.C. (1951) General entomological research in Surinam up to 1950. In: Nederlandse
Entomologische Vereniging (ed.) Entomology in the Netherlands and their Overseas Territories. TheNetherlands Entomological Society, Amsterdam, pp. 46–54.
Geijskes, D.C. (1953) Nuptial flighttime of Atta-ants in Suriname. Tijdschrift over Plantenziekten 59,181–184.
Geijskes, D.C. (1957) The zoological exploration of Suriname. Studies on the Fauna of Suriname and otherGuyanas 1, 1–12.
Geijskes, D.C. (1968) Insect collecting in Suriname with the help of ‘Malaise’ traps. Studies on the Fauna ofSuriname and other Guyanas 10, 101–109.
Gombauld, P. (1996) Variabilité de la phyllophagie par les insectes chez deux arbres de la forêt guyanaise,Eperua falcata et E. grandiflora (Caesalpiniaceae): impact des diminutions de surface foliaire et dumicroclimat sur la croissance et la survie des plantules. PhD thesis, Université Paris 6, Paris, France.
Gombauld, P. and Rankin de Merona, J.M. (1998) Influence de la saison sur la phénologie et la phyllophagiepar les insectes de jeunes individus de 5 espèces d’arbre de forêt tropicale en Guyane (Fr.). Annales desSciences Forestières 55, 715–725.
Hall, A. (1940) Catalogue of the Lepidoptera Rhopalocera (butterflies) of British Guiana. British GuianaDepartment of Agriculture Entomological Bulletin 3, 1–88. Reprinted from Agricultural Journal of BritishGuiana 10, 25–41, 96–104, 146–169, 215–252 (1939).
Hallé, F. (ed.) (1998) Biologie d’une canopée de forêt équatoriale – III. Rapport de la mission d’explorationscientifique de la canopée de Guyane, octobre–décembre 1996. Pro-Natura International andOpération Canopée, Paris/Lyon.
Hallé, F. and Blanc, P. (eds) (1990) Rapport de Mission. Radeau des Cimes Octobre–Novembre 1989,Guyane Française. OPRDC, Paris.
316 Y. Basset et al.

Hammond, D.S., Gourlet-Fleury S., Hout, P. van der, Brown, V.K. and ter Steege, H. (1996) A compilationof known Guianan timber trees and the significance of their dispersal mode, seed size and taxonomicaffinity to tropical rain forest management. Forest Ecology and Management 83, 99–116.
Haviland, M.D. (1925) The Membracidae of Kartabo, Bartica District, British Guiana. Zoologica 6, 229–290+ errata.
Haxaire, J. and Rasplus, J.-Y. (1986) Contribution a la connaissance des Sphingidae de Guyane Francaise.1re partie. (Lep.). Bulletin de la Société Entomologique de France 91, 275–285.
Haxaire, J. and Rasplus, J.-Y. (1987) Contribution à la connaissance des Sphingidae de Guyane Francaise, 2ePartie (Lep.). Bulletin de la Société Entomologique de France 92, 45–55.
Holloway, J.D. (1989) Moths. In: Lieth, H. and Werger, M.J.A. (eds) Tropical Rain Forest Ecosystems.Biogeographical and Ecological Studies. Elsevier, Amsterdam, pp. 437–453.
Howell, J.O. and Kosztarab, M. (1972) Morphology and systematics of the adult females of the genusLecanodiaspis (Homoptera: Coccoidea: Lecanodiaspididae). Research Division Bulletin VirginiaPolytechnic Institute and State University, Blacksburg 70, 1–248.
Huber, O. (1986) La Selva Nublada de Rancho Grande, Parque Nacional ‘Henri Pittier’. Fondo Editorio ActaCientifica Venezolana, Caracas.
Isaacs, R., Gillman, M.P., Johnston, M., Marsh, F. and Wood, B.C. (1996) Size structure of a dominantneotropical forest tree species, Dicymbe altsonii, in Guyana and some factors reducing seedling leafarea. Journal of Tropical Ecology 12, 599–606.
Janzen, D.H. (1974) Tropical blackwaters rivers, animals, and mast fruiting by the Dipterocarpaceae.Biotropica 6, 69–103.
Janzen, D.H. (1981) Patterns of herbivory in a tropical deciduous forest. Biotropica 13, 271–282.Janzen, D.H. (1983) Costa Rican Natural History. The University of Chicago Press, Chicago, Illinois.Janzen, D.H. (1988) Ecological characterization of a Costa Rican dry forest caterpillar fauna. Biotropica 20,
120–135.Jolivet, P. (1987) Remarques sur la biocénose des Cecropia (Cecropicaeae). Biologie des Coelomera
Chevrolat avec la description d’une nouvelle espèce du Brésil (Coleoptera Chrysomelidae Galerucinae).Bulletin mensuel de la Société Linnéenne de Lyon 56, 255–276.
Jolivet, P. (1989) The Chrysomelidae of Cecropia (Cecropiaceae): a strange cohabitation. Entomography 6,391–395.
Jolivet, P. and Salinas, P.J. (1993) Ponte de Coelomera cajennensis (Fabricius, 1787) dans la tige des Cecropia(Col. Chrys.). Bulletin de la Société Entomologique Française 98, 472.
Joly, A. (1996) Dynamique de régéneration de deux espèces de Caesalpiniaceae, Vouacapoua americana etEperua falcata, en Guyane. Diplome d’Etude Approfondies, Université Pierre et Marie Curie (Paris VI), Paris.
Lechat, F., Limier, F., Salager, J.L. and Roy, J. (1990) Profils de masse surfacique, teneur en azote et dégâtsdes herbivores dans une canopée tropicale. In: Hallé, F. and Blanc, P. (eds) Biologie d’une canopée deforêt équatoriale. Rapport de Mission. Radeau des Cimes Octobre–Novembre 1989, Guyane Française.OPRDC, Paris, pp. 178–189.
Leigh, E.G.J. (1996) Epilogue: Research on Barro Colorado Island, 1980–94. In: Leigh Jr, E.G., Rand, A.S. andWindsor, D.M. (eds) The Ecology of a Tropical Forest, 2nd edn. Smithsonian Tropical Research Institute,Washington, DC, pp. 469–503.
Le Moult, E. (1955) Mes chasses aux papillons. Editions Pierre Horey, Paris.Lindsey, A.W. (1928) Hesperioidea from Kartabo district of British Guiana. Journal of the Scientific
Laboratories/Denison University (Denison, Iowa) 23, 231–235.Littledyke, M. and Cherrett, J.M. (1976) Direct ingestion of plant sap cut leaves by the leaf cutting ants Atta
cephalotes (L.) and Acromyrmex octospinosus (Reich) (Form. Attini). Bulletin of Entomological Research66, 205–217.
Lowman, M.D. (1984) An assessment of techniques for measuring herbivory: is rainforest defoliation moreintense than we thought? Biotropica 16, 264–268.
Lowman, M.D., Foster, R., Wittman, P. and Rinker, H.B. (1998) Herbivory and insect load on epiphytes,vines, and host trees in the rain forest canopy of French Guiana. In: Hallé, F. (ed.) Biologie d’unecanopée de forêt équatoriale – III. Rapport de la mission d’exploration scientifique de la canopée deGuyane, octobre–décembre 1996. Pro-Natura International and Opération Canopée, Paris/Lyon, pp.116–128.
Loye, J.E. (1992) Ecological diversity and host plant relationships of treehoppers in a lowland tropical rain-forest (Homoptera: Membracidae and Nicomiidae). In: Quintero, D. and Aiello, A. (eds) Insects ofPanama and Mesoamerica. Selected Studies. Oxford University Press, Oxford, UK, pp. 280–289.
Folivorous Insects 317
McCallan, E. (1953) Sawflies (Hym., Tenthredinidae and Argidae) from Trinidad, British Guiana andVenezuela. The Entomologist’s Monthly Magazine 99, 126.
Marquis, R.J. (1991) Herbivore fauna of Piper (Piperaceae) in a Costa Rican wet forest: diversity, specificityand impact. In: Price, P.W., Levinsohn, T.M., Fernandes, G.W. and Benson, W.W. (eds) Plant–AnimalInteractions: Evolutionary Ecology in Tropical and Temperate Regions. John Wiley & Sons, New York,pp. 179–208.
Marquis, R.J. and Braker, E.H. (1993) Plant–herbivore interactions: diversity, specificity, and impact. In:McDade, L.A., Hespenheide, H.A. and Hartshorn, G.S. (eds) La Selva, Ecology and Natural History ofa Neotropical Rain Forest. University of Chicago Press, Chicago, Illinois, pp. 261–281.
Mattson, W.J. and Scriber, J.M. (1987) Nutritional ecology of insect folivores of woody plants: water, nitro-gen, fiber and mineral considerations. In: Slansky, F. and Rodriguez, J.G. (eds) Nutritional Ecology ofInsects, Mites, Spiders and Related Invertebrates. John Wiley & Sons, New York, pp. 105–146.
Merian, Maria Sybilla (1705) Metamorphosis Insectorum Surinamensis. Ofte Verandering der SurinaamscheInsecten. Priv. Ed., Amsterdam. [Reprinted by Pion Books, London, 1982].
Merian, Maria Sybilla (1719) Dissertatio de Generatione et Metamorphosibus Insectorum Surinamensium.Joannes Oosterwyk, Amsterdam.
Metcalf, Z.P. (1945) Fulgoroidea (Homoptera) of Kartabo, Bartica District, British Guiana. Zoologica 30,125–143.
Metcalf, Z.P. (1949) Tettigellidae and Gyponidae (Homoptera) of Kartabo, Bartica District, British Guiana.Zoologica 34, 259–279.
Miller, S.E. (1994) Systematics of the neotropical moth family Dalceridae (Lepidoptera). Bulletin of theMuseum of Comparative Zoology 153, 301–495.
Morrison, H. (1922) On some trophobiotic Coccidae from British Guiana. Psyche 29, 132–152.Morrison, H. (1929) Some neotropical scale insects associated with ants (Hemiptera – Coccidae). Annals of
the Entomological Society of America 22, 33–60.Munroe, L.A. (1993) The status of biosystematics in Guyana. In: Jones, T. and Cook, M.A. (eds) Proceedings
of the Caribbean LOOP Planning Meeting, Santo Domingo, 26–27 November 1993. CAB International,Wallingford, UK, pp. 22–26.
Nascimento, M.T. and Proctor, J. (1994) Insect defoliation of a monodominant Amazonian rainforest. Journalof Tropical Ecology 10, 633–636.
Newbery, D.M. and Foresta, H.D. (1985) Herbivory and defense in pioneer gap and understory trees of trop-ical rain forest in French Guiana. Biotropica 17, 238–244.
Newstead, R. (1917a) Observations on scale-insects (Coccidae) – III. Bulletin of Entomological Research 7,343–380.
Newstead, R. (1917b) Observations on scale-insects (Coccidae) – V. Bulletin of Entomological Research 8,125–134.
Newstead, R. (1920) Observations on scale-insects (Coccidae) – VI. Bulletin of Entomological Research 10,175–207.
Nijveldt, W. (1968) Two gall midges from Surinam (Diptera, Cecidomyiidae). Studies on the Fauna ofSuriname and other Guyanas 10, 61–66.
Osborn, H. (1921) Two Tachigalia membracids. Zoologica 3, 233–234.Owen, D.F. (1980) How plants may benefit from the animals that eat them. Oikos 35, 230–235.Poncy, P. Riéra, B., Larpin, L., Belbenoit, P., Jullien, M., Hoff, M. and Charles-Dominique, P. (1999) The per-
manent field station ‘Les Nouragues’ in the tropical rain forest of French Guiana: current projects and pre-liminary results on tree diversity, structure and dynamics. In: Dallmeier, F. and Comiskey, J.A. (eds) ForestBiodiversity in North, Central and South America, and the Carribean: Research and Monitoring. Man andthe Biosphere Series 21. UNESCO and the Parthenon Publishing Group, Carnforth, UK, pp. 385–410.
Price, P.W. (1992) The resource-based organization of communities. Biotropica 24, 273–282.Priesner, H. (1923) Ein Beitrag zur Kenntnis der Thysanopteren Surinams. Tijdschrift voor Entomologie 66,
88–111.Raaimakers, D., den Ouden, F., van der Marel, M. and Boot, R. (1994) N and P as possible limiting factors
for tree growth on acid sandy soils in tropical rain forest in Guyana. In: Raaimakers, D. (ed.) Growth ofTropical Rain Forest Trees as Dependent on Phosphorus Supply. Tree Saplings Differing in RegenerationStrategy and their Adaptations to a low Phosphorus Environment in Guyana. Tropenbos Series 11. TheTropenbos Foundation, Wageningen, The Netherlands, pp. 9–21.
Reagan, D.P. and Waide, R.B. (1996) The Food Web of a Tropical Rain Forest. University of Chicago Press,Chicago, Illinois.
318 Y. Basset et al.
Richards, P.W. (1996) The Tropical Rain Forest, an Ecological Study, 2nd edn. Cambridge University Press,Cambridge, UK.
Robbins, R.K. and Opler, P.A. (1997) Butterfly diversity and a preliminary comparison with bird and mam-mal diversity. In: Reaka-Kudla, M.L., Wilson, D.E. and Wilson, E.O. (eds) Biodiversity II. Joseph HenryPress, Washington, DC, pp. 69–82.
Robinson, G.S. and Kitching, I. (1997) Database ‘Hosts’. The Natural History Museum, London. Records asfrom April 1997.
Roubik, D.W. (1990) Niche preemption in tropical bee communities: a comparison of neotropical andMalesian faunas. In: Sakagami, S.F. and Ohgushi, R.I. (eds) Natural History of Social Wasps and Beesin Equatorial Sumatra. Hokkaido University Press, Sapporo, pp. 245–257.
Skutch, A.F. (1945) The most hospitable tree (Cecropia). The Scientific Monthly (New York) 60, 1–17.Smith, D.R. (1988) A synopsis of the sawflies (Hymenoptera: Symphyta) of America south of the United
States: introduction, Xyelidae, Pamphilidae, Cimbicidae, Diprionidae, Xiphydriidae, Siricidae,Orussidae, Cephidae. Systematic Entomology 13, 205–261.
Smith, D.R. (1990) A synopsis of the sawflies (Hymenoptera: Symphyta) of America south of the UnitedStates: Pergidae. Revista Brasileira de Entomologia 34, 7–200.
Smith, D.R. (1992) A synopsis of the sawflies (Hymenoptera: Symphyta) of America south of the UnitedStates: Argidae. Memoirs of the American Entomological Society 39, 1–201.
Stahel, G. and Geijskes, D.C. (1939) Ueber den Bau der Nester von Atta cephalotes L. und Atta sexdens L.(Hym. Formicidae). Revista de Entomologia 10, 27–78.
Stahel, G. and Geijskes, D.C. (1940) Observations about temperature and moisture in Atta-nests. Revista deEntomologia 11, 766–775.
Stahel, G. and Geijskes, D.C. (1941) Weitere Untersuchungen über Nestbau und Gartenpilz von Attacephalotes L. und Atta sexdens L. (Hym. Formicidae). Revista de Entomologia 12, 243–268.
Sterck, F., van der Meer, P. and Bongers, F. (1992) Herbivory in two rain forest canopies in French Guyana.Biotropica 24, 97–99.
Tavakilian, G. (1993) L’entomofaune de la forêt Guyanaise. In: SEPANGUY (ed.) Gestion de l’écosystèmeforestier et aménagement de l’espace régional (Congrès SEPANGUY, Cayenne 1990). SEPANGUY,Cayenne, pp. 125–130.
ter Steege, H. (1990) A monograph of Wallaba, Mora and Greenheart. Tropenbos Technical Series 5. TheTropenbos Foundation, Wageningen, The Netherlands.
ter Steege, H., Jetten, V., Polak, M. and Werger, M. (1993) Tropical rain forest types and soils of a watershedin Guyana, South America. Journal of Vegetational Science 4, 705–716.
ter Steege, H., Boot, R.G.A., Brouwer, L., Caesar, J.C., Ek, R.C., Hammond, D.S., Haripersaud, P., van derHout, P., Jetten, V.G., van Kekem, A.J., Kellman, M.A., Khan, Z., Polak, A.M., Pons, T.L., Pulles, J.,Raaimakers, D., Rose, S.A., van der Sanden, J.J. and Zagt, R.J. (1996) Ecology and Logging in a TropicalRain Forest in Guyana, with recommendations for Forest Management. Tropenbos Series 14. TheTropenbos Foundation, Wageningen, The Netherlands.
Valiant, S.D. (1992) Questioning the caterpillar. Natural History 12/92, 46–59.van Doesburg Jr, P.H. (1966) Heteroptera of Suriname. I. Largidae and Pyrrhocorridae. Studies on the Fauna
of Suriname and other Guyanas 9, 1–60.van Emden, H.F. (1972) Aphids as phytochemists. In: Harborne, J.B. (ed.) Phytochemical Ecology. Academic
Press, London, pp. 25–42.Vasconcellos-Neto, J. and Jolivet, P. (1994) Cycloalexy among chrysomelid larvae. In: Jolivet, P.H., Cox, M.L.
and Petitpierre, E. (eds) Novel Aspects of the Biology of Chrysomelidae. Kluwer Academic, Amsterdam,pp. 303–309.
Voss, R.S. and Emmons, L.H. (1996) Mammalian diversity in neotropical lowland rainforests: a preliminaryassessment. Bulletin of the American Museum of Natural History 230, 1–115.
Weber, N.A. (1949) The biology of the fungus-growing ants. Part IX. The British Guiana species. Revista deEntomologia 17, 114–172.
Wheeler, W.M. (1907) The fungus-growing ants of North America. Bulletin of the American Museum ofNatural History 23, 669–807.
Wheeler, W.M. (1921) A study of some social beetles in British Guyana and of their relation to the ant-plantTachigalia. Zoologica 3, 35–126.
Wheeler, W.M. (1942) Studies of neotropical ant-plants and their ants. Bulletin of the Museum ofComparative Zoology, Harvard University 90, 1–263.
Whitham, T.G., Maschinski, J., Larson, K.C. and Paige, K.N. (1991) Plant responses to herbivory: the contin-
Folivorous Insects 319

uum from negative to positive and underlying physiological mechanisms. In: Price, P.W. Lewinsohn,T.M., Fernandes, G.W. and Benson, W.W. (eds) Plant–Animal Interactions: Evolutionary Ecology inTropical and Temperate Regions. Wiley, New York, pp. 227–256.
Whitton, B.A. (1962) Forests and dominant legumes of the Amatuk Region, British Guiana. CaribbeanForester 23, 35–57.
Williams, D.J. and de Willink, M.C.G. (1992) Mealybugs of Central and South America. CAB International,Wallingford, UK.
320 Y. Basset et al.

Introduction
The importance of insects as pollen vectorsor ‘flying (plant) genitalia’ has been knownsince the late eighteenth century (Barth,1991), and the broad topic of pollinationhas been reviewed repeatedly and popular-ized (e.g. Knuth, 1906–9; Meeuse, 1961;Faegri and van der Pijl, 1979; Proctor et al.,1996). Several recent reviews have pro-vided general coverage of plant–pollinatorinteractions in tropical rainforests (Bawa,1990) and in the context of certain neotrop-ical forest regions (Amazonia by Prance,1985; Central America by Schatz, 1990).From these reviews it is clear that mostrainforest plants are pollinated by insects,and that neotropical pollination biology ismore about insect–flower interactions thananything else. Literature from earlier in thelast century in particular (e.g. Knuth,1906–9) focused on the ‘harmonious’ co-adaptation between pollinators and flowers.This concept of harmony between floweringplants and archetypical pollinators lives onin an important part of the modern scien-tific community, as exemplified by recordsof flower visitation in which the visitors,certainly when they are bees, are automati-cally assumed to be pollinators. There is,however, more to flower visitation than pol-lination. Certainly in the neotropics not allthe flower visitors are pollinators, and not
all flowers visited are pollinated. To com-plicate matters further, certain flower visi-tors – not least the many stingless bees(Apidae: Meliponinae) – may be best char-acterized as thieves and robbers. These vis-itors will often destructively collect thefloral reward ‘intended’ for pollinating visi-tors, failing to pollinate the host flowerthemselves and deterring actual pollinatorsin the process (Roubik, 1989). Still othervisitors which are consistently associatedwith flowering plant parts have interestsother than the flowers themselves; they arethere primarily to find mates or animalprey. Despite the non-pollinating purposesthat insects may have for visiting flowers,many neotropical insects do pollinate. Inmost cases, these pollinators are cross-pol-linating as evident from the fact that most ofthe tree species in a neotropical forest areself-incompatible and require an animalpollen vector (Bawa et al., 1985a,b). A per-tinent first question to address in relation tothe Guiana Shield rainforest is thus whichflowers are visited by whom, why andwhether visits by insects result in(cross-)pollination.
To begin to describe and quantify thesebasic components of flower–insect inter-actions requires a considerable length andbreadth of field work. Currently, there areinsufficient baseline data, let alone compre-hensive studies, on flower visitation and
321© CAB International 2005. Tropical Forests of the Guiana Shield (ed. D.S. Hammond)
6 Flower-visiting Insects in Guianan Forests:Pollinators, Thieves, Lovers and Their Foes
Bart P.E. De DijnNational Zoological Collection, University of Suriname, Leysweg, Paramaribo,
Suriname
pollination in Guiana Shield forests. Muchof what will be presented below is based onextrapolation from studies done elsewhere(e.g. Central America and CentralAmazonia). Fortunately, field observationssuggest that most studies from otherneotropical regions appear to be highly rel-evant to the rainforest of the Guiana Shield(De Dijn, personal observation). From thescientific point of view, however, the puta-tive correspondence between Guianan andother neotropical pollinator systems mustbe regarded as a preliminary hypothesis inneed of testing, viz. ‘Are insect pollinatorsassociated in the same way with the sameor related host-plant species in the GuianaShield, Central America and the AmazonBasin?’ In essence, this is a question aboutregional diversity shifts in Amazonia andthe neotropics. This chapter focuses on theflower-visiting insects in Guiana Shieldrainforests. However, insects visiting flow-ering plant parts to feed on leaves (e.g.Lepidoptera larvae), young fruits (e.g.Hemiptera) or plant sap (e.g. Homoptera)will not be discussed here, as they are dealtwith in Chapter 5 of this volume. Flower-visiting vertebrates are discussed inChapter 4. The subject will be approachedin the first instance by looking at therewards available at flowers; most of theserewards are substances produced by theplant for the specific purpose of enticinginsects to visit more flowers. The pollina-tion syndrome and flower type concept ofFaegri and van der Pijl (1979) will be usedhere to more comprehensively outline thevarious kinds of flower–insect interactions.The rewards at flowering plant parts areresources for insect visitors in the ecologi-cal sense, often being essential for their sur-vival, which they access opportunisticallyand use selfishly to increase their fitnessand reproductive success. This means thatin addition to the archetypical pollinators,there are a whole host of other visitorswhich typically parasitize on the mutual-ism associated with a particular pollinationsyndrome. Once the scope of the mutualismwe are dealing with is clear, I attempt toassess the diversity of flower-visitinginsects in the Guiana Shield, as well as pol-
lination systems, and based on these attrib-utes, discuss several issues in relation toflowering plants and flower-visiting insectsin Guiana Shield rainforests.
Rewards, Pollination Syndromes andFlower Types
Most insects visit flowers to obtain therewards available, which in Amazonia canbe pollen, nectar, oil, resin, fragrances orflower tissue (Prance, 1985). Some insectsfrequent flowers to find mates or prey(Gentry, 1978; De Dijn, personal observa-tion; see also Roubik, 1989). In an attemptto impose some order on the variety offlower morphologies, visitor taxa, pollinat-ing behaviours, etc., Faegri and van der Pijl(1979) introduced the concept of ‘pollina-tion syndromes’, which – at least wherepollination by animals is concerned – canbe regarded as stereotypical mutual adapta-tions of flowering plants and pollinators.The syndromes are most often named afterthe legitimate pollinator taxa involved,such as moth, bird or bee, and can be sub-divided further on the basis of flower type.Flower shape, colour and time of anthesisare part of a syndrome; each syndrome hasits stereotypes, some of which are listed inTable 6.1 (for detailed descriptions andexceptions, see Faegri and van der Pijl,1979, and Proctor et al., 1996). The descrip-tion of syndromes gravitates towards themore specific, ‘specialist’ ones. This is mis-leading in the sense that it creates theimpression that most interactions betweenflowers and animals are essentially veryspecific and that other, non-pollinating ani-mals have no business at specialist flowers,which is not the case (Janzen, 1983; DeDijn, personal observation). Many of thespecialist syndromes are defined largely bythe kind of animals that are being prevented– often very imperfectly (e.g. Roubik et al.,1985) – from illegitimately (i.e. by damag-ing or destroying) accessing the floralrewards. Another reality is that a specialistflower will often also be visited by a widerange of legitimate (non-destructive) visi-tors, e.g. a hummingbird flower also being
322 B.P.E. De Dijn
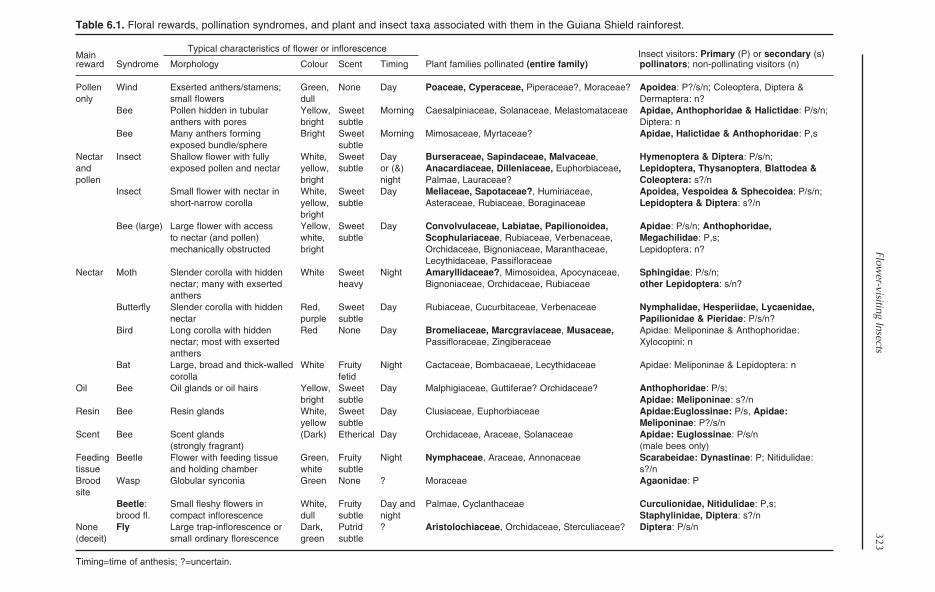
Flower-visiting Insects
323
Table 6.1. Floral rewards, pollination syndromes, and plant and insect taxa associated with them in the Guiana Shield rainforest.
MainTypical characteristics of flower or inflorescence Insect visitors: Primary (P) or secondary (s)
reward Syndrome Morphology Colour Scent Timing Plant families pollinated (entire family) pollinators; non-pollinating visitors (n)
Pollen Wind Exserted anthers/stamens; Green, None Day Poaceae, Cyperaceae, Piperaceae?, Moraceae? Apoidea: P?/s/n; Coleoptera, Diptera &only small flowers dull Dermaptera: n?
Bee Pollen hidden in tubular Yellow, Sweet Morning Caesalpiniaceae, Solanaceae, Melastomataceae Apidae, Anthophoridae & Halictidae: P/s/n;anthers with pores bright subtle Diptera: n
Bee Many anthers forming Bright Sweet Morning Mimosaceae, Myrtaceae? Apidae, Halictidae & Anthophoridae: P,sexposed bundle/sphere subtle
Nectar Insect Shallow flower with fully White, Sweet Day Burseraceae, Sapindaceae, Malvaceae, Hymenoptera & Diptera: P/s/n;and exposed pollen and nectar yellow, subtle or (&) Anacardiaceae, Dilleniaceae, Euphorbiaceae, Lepidoptera, Thysanoptera, Blattodea &pollen bright night Palmae, Lauraceae? Coleoptera: s?/n
Insect Small flower with nectar in White, Sweet Day Meliaceae, Sapotaceae?, Humiriaceae, Apoidea, Vespoidea & Sphecoidea: P/s/n; short-narrow corolla yellow, subtle Asteraceae, Rubiaceae, Boraginaceae Lepidoptera & Diptera: s?/n
brightBee (large) Large flower with access Yellow, Sweet Day Convolvulaceae, Labiatae, Papilionoidea, Apidae: P/s/n; Anthophoridae,
to nectar (and pollen) white, subtle Scophulariaceae, Rubiaceae, Verbenaceae, Megachilidae: P,s;mechanically obstructed bright Orchidaceae, Bignoniaceae, Maranthaceae, Lepidoptera: n?
Lecythidaceae, PassifloraceaeNectar Moth Slender corolla with hidden White Sweet Night Amaryllidaceae?, Mimosoidea, Apocynaceae, Sphingidae: P/s/n;
nectar; many with exserted heavy Bignoniaceae, Orchidaceae, Rubiaceae other Lepidoptera: s/n?anthers
Butterfly Slender corolla with hidden Red, Sweet Day Rubiaceae, Cucurbitaceae, Verbenaceae Nymphalidae, Hesperiidae, Lycaenidae,nectar purple subtle Papilionidae & Pieridae: P/s/n?
Bird Long corolla with hidden Red None Day Bromeliaceae, Marcgraviaceae, Musaceae, Apidae: Meliponinae & Anthophoridae:nectar; most with exserted Passifloraceae, Zingiberaceae Xylocopini: nanthers
Bat Large, broad and thick-walled White Fruity Night Cactaceae, Bombacaeae, Lecythidaceae Apidae: Meliponinae & Lepidoptera: ncorolla fetid
Oil Bee Oil glands or oil hairs Yellow, Sweet Day Malphigiaceae, Guttiferae? Orchidaceae? Anthophoridae: P/s;bright subtle Apidae: Meliponinae: s?/n
Resin Bee Resin glands White, Sweet Day Clusiaceae, Euphorbiaceae Apidae:Euglossinae: P/s, Apidae:yellow subtle Meliponinae: P?/s/n
Scent Bee Scent glands (Dark) Etherical Day Orchidaceae, Araceae, Solanaceae Apidae: Euglossinae: P/s/n(strongly fragrant) (male bees only)
Feeding Beetle Flower with feeding tissue Green, Fruity Night Nymphaceae, Araceae, Annonaceae Scarabeidae: Dynastinae: P; Nitidulidae: tissue and holding chamber white subtle s?/nBrood Wasp Globular synconia Green None ? Moraceae Agaonidae: Psite
Beetle: Small fleshy flowers in White, Fruity Day and Palmae, Cyclanthaceae Curculionidae, Nitidulidae: P,s;brood fl. compact inflorescence dull subtle night Staphylinidae, Diptera: s?/n
None Fly Large trap-inflorescence or Dark, Putrid ? Aristolochiaceae, Orchidaceae, Sterculiaceae? Diptera: P/s/n(deceit) small ordinary florescence green subtle
Timing=time of anthesis; ?=uncertain.
visited by butterflies and bees, which mayalso be pollinators (cf. case studies:Willmer and Corbet, 1981; Roubik, 1982a;Roubik et al., 1985). Thirdly, many plants,including those in Guiana Shield forests (cf.below), would seem ‘intentionally’ unspe-cialized (i.e. generalist) as to the kind of vis-itors they attract as pollinators. This isparticularly true in relation to insect polli-nation, but poorly investigated, at least inAmazonia, as remarked by Prance (1985).Based on the literature (cf. below), miscel-laneous field observations in the Guianas(De Dijn, personal observation) and pub-lished descriptions and drawings of theregional flora (Lindeman and Mennega,1963; Wessels Boer et al., 1976; Gentry,1993; Polak, 1992), an attempt is made inTable 6.1 to list important Guiana Shieldplant families and flower visitors as a func-tion of floral resources, pollination syn-dromes and flower types.
Pollen: from ancestral reward to specialistsyndromes
It seems safe to assume that pollen was themain ancestral reward for the earliest polli-nating flower visitors (beyond leaf-likeflower parts). One can imagine a situationin Mesozoic times (cf. Proctor et al., 1996)where phytophagous and scavenging bee-tles, cockroaches and other insects visitflowers and eat pollen at easily accessiblegeneralist flowers, not unlike they do todayin the Guiana Shield (see below). Althoughvarious flower-visiting insect taxa, such asbeetles, wasps and moths, consume pollento some extent, bees are strictly dependenton pollen for their survival. Bee larvaerequire pollen as a protein source, exceptthose of a few divergent neotropical car-rion-feeding species which also occur inthe Guiana Shield (Trigona hypogea group;Roubik, 1982b). The females of most beespecies will collect pollen at flowers andtransfer it to their nest (Roubik, 1989). Onthe other hand, throughout the neotropics,Lestrimelitta (Apidae: Meliponinae) robswhat has been collected by other socialbees, while a whole range of bees, such as
Coelioxys (Megachilidae), parasitize ready-made nests. In the Guiana Shield, flowersoffering pollen as the sole reward arelargely limited to those with tubular, pori-cidal anthers (so-called ‘buzz’ flowers; DeDijn, personal observation). These flowershave special adapted ‘closed’ anthers thatare specifically adapted to buzz pollinationby specialist bees of the common neotropi-cal taxa Eulaema, Euglossa, Melipona,Bombus (all Apidae), Augochloropsis(Halictidae), Centris, Xylocopa andExomalopsis (Anthophoridae) (Wille, 1963;Buchmann, 1985; De Dijn, personal obser-vation). The pollen remains hidden insidethe anther and will only dislodge via a nar-row pore when vibrated properly, orbuzzed, by specialist bees. The buzzingbees are dusted with pollen and pollinateby rubbing their pollen-dusted bodiesagainst the floral stigmas. Neotropicalplants also found in the Guianas thatrequire buzzing include many Solanum s.l.(Solanaceae), Cassia s.l. (Caesalpiniaceae),and various Melastomataceae (Buchmann,1983). These flowers are also visited by ahost of non-buzzing bees, some of whichare robbers that chew open the anthers,especially Trigona s.s. (Apidae:Meliponinae; Renner, 1983), while othersare ‘gleaners’ that mop up pollen dusted onplant parts (e.g. some Trigona s.l.; Wille,1963). Remarkably, some flowers with ordi-nary anthers (not poricidal) also offer onlypollen and have been observed to bebuzzed, especially those referred to as‘shaving brush’ flowers, i.e. those havingmany stamens protruding to form a com-pact bundle (Buchmann, 1985). This flowertype can be expanded to include the globu-lar Mimosa (Mimosoidea) inflorescencesbuzzed by Melipona (Apidae: Meliponinae)in French Guiana and Suriname (Roubik,1996a; De Dijn, personal observation).Other non-buzzing visitors that collectpollen at such flowers are equally non-destructive (e.g. Trigona, Apis mellifera).Grasses and sedges growing along creeksand in swamp forest and along forest-edgehabitats in the Guiana Shield are also vis-ited by insects such as bees (De Dijn, per-sonal observation; see also Thomas, 1984).
324 B.P.E. De Dijn

These monocots produce only pollen andare generally assumed to be primarilywind-pollinated (Proctor et al., 1996). Beesas well as flies and beetles may actually bepollinators of many neotropical grasses andsedges, such as Pariana (Poaceae) inVenezuelan cloud forest (Ramirez, 1989).Two very important Guiana Shield planttaxa that also only offer pollen from their‘catkin’-like flowers should be mentioned:Piper (Piperaceae) and Cecropia (Moraceae)(De Dijn, personal observation). Cecropia isassumed to be primarily wind pollinated(Ramalho et al., 1990; Kress and Beach,1994); and the same assumption can bemade for Piper on the basis of its similarinflorescence shape (De Dijn, personalobservation; Proctor et al., 1996). Cecropiapollen is heavily collected by stingless beesand Apis in many neotropical forests(Ramalho et al., 1990). In Suriname, bothCecropia and to a lesser extent Piper areimportant pollen sources for stingless bees(Biesmeijer et al., 1992) and Apis (Kerkvlietand Beerlink, 1991). Whether these plantsare also pollinated by these bees isunknown.
Nectar: from all-taxa to specialist reward
Floral nectar as a reward is the rule with themajority of angiosperms in Amazonia,although there are many striking andimportant exceptions (Prance, 1985). Nectaris an important currency used by plants topay their pollinating flower visitors, whichis easily understood when considering therelationship: nectar = dissolved sugars =energy to burn (Heinrich and Raven, 1972).Nectar composition (mainly dissolved sug-ars, but also amino acids), as well as sugarconcentration and volume (or rate of secre-tion) will influence the kind of visitor (e.g.Proctor et al., 1996), the rate of visitation(e.g. Heinrich and Raven, 1972) and ulti-mately plant reproductive output. Nectar isimportant to a variety of adult insects tofuel their daily activities, not least energy-consuming flight. In an evolutionary con-text, nectar can be regarded as a rewardwhich has developed to attract the more
energetic and therefore energy-demandingflying insects that tend to visit more flowersand through their longer flying distancesprove to better cross-pollinators. Mostfemale bees use the nectar they collect asthe main carbohydrate source for theirprogeny (Roubik, 1989). Ants may also col-lect floral nectar to feed their larvae, butapparently to a lesser extent – possibly aconsequence of toxins or repellents in thenectar (Haber et al., 1981) or the fact thatants are the main visitors to extra-floral nec-taries on plants where these occur. Below,it will be attempted to (re)define some syn-dromes and flower types that are primarilyrelated to nectar, in a way that makes sensefrom a Guiana Shield perspective.
Generalist insect syndromes
Several common neotropical plant taxa,such as Sapindaceae and Anacardiaceae,have small, shallow ‘open’ flowers whichoffer uninhibited nectar and pollen accessto a wide variety of insects, such as cock-roaches, beetles, bees, wasps, flies, butter-flies and moths (Janzen, 1983). Thediversity of insect species visiting a singletree with a generalist flower type can beamazing, in contrast to the usually limitedset of taxa visiting a patch of specialist flow-ers. Beetle diversity can be particularlystriking, as there may be many species ofChrysomelidae, Curculionidae, Nitidu-lidae, Cantharidae and Mordellidae pres-ent, as well as some Dermestidae,Cerambicidae, Brentidae and Scarabaeidae(De Dijn, personal observation). All of thesevaried visitors may be legitimate pollina-tors, although this largely remains anassumption given the scarcity of directobservational studies on the pollination ofplants with generalist flowers in theneotropics, or at least in Amazonia (Prance,1985). There are detailed studies ofAmazonian palms visited mainly by beesand a variety of beetles. These are reviewedby Henderson (1995); a more recent studyon Euterpe precatoria suggests this palm isalso heavily visited by bees (Kuchenmeisteret al., 1997). It may not be strictly possible
Flower-visiting Insects 325

to distinguish between what can be called‘shallow’ (small, open) flower pollinationand ‘small-tube’ flower pollination byinsects. Both flower types conform to thegeneralist model in the sense that they arevisited by a large number of insects belong-ing to a variety of taxa. Visiting taxa, how-ever, are often restricted access to one of thetwo types. The small-tube flowers, such asthose found in the family Meliaceae, hidetheir nectar and pollen inside a short, tubu-lar (fused) corolla. This type of flowerallows larger insects with a well-developedproboscis easy access to floral nectar, whilefor those large insects without a proboscisproper, access is nearly impossible (DeDijn, personal observation). While access toshallow flowers is unrestricted, it isrestricted to aculeate Hymenoptera (waspsand bees), long-tongued flies (e.g.Syrphidae) and Lepidoptera (e.g.Hesperiidae and Lycaenidae) in small-tubeflowers; very minute insects can also accessthe resources of small-tube flowers, such assmall beetles, the ubiquitous Thysanoptera,and minute Plebeia and Trigonisca(Apidae: Meliponinae).
Large bee pollination syndrome
A more specialized syndrome, involvingflowers with a large, tubular corolla, andlarge, mostly long-tongued bees as the mainpollinators, appears to be distinctlyneotropical (Frankie et al., 1983; Janzen,1983; De Dijn, personal observation). A typ-ical large bee flower type is the ‘large-tube’flower, a flower with a long (often fused)corolla which is usually narrow at theflower base, but may be very broad distally.Large bee flowers tend to be large, conspic-uous and zygomorphic; they can only belegitimately visited by forceful bees whichare able to overcome the physical andmechanical barriers which separate the flo-ral nectar from the outside world (see Barth,1991). Barriers include such simple devicesas dense patches of hairs or an internal ringof stamens blocking the narrow tubular partof the corolla. The corolla base which holdsthe nectar is usually either thick-walledand tough, or is protected on the outside by
a tough calyx. In the Guiana Shield, thistype of design can be found within somePsychotria (Rubiaceae), Stachytarphetum(Verbenaceae) and Scrophulariaceae (DeDijn, personal observation). Flowers withlarger, broader corollas tend to have differ-ent built-in barriers: a tough constriction atthe corolla base requiring forceful insertionof the proboscis (e.g. with Convolvulaceaeand many Bignoniaceae), or asymmetricalcorolla ‘deformations’ or lips partially hid-ing and closing off the corolla mouth (e.g.with many Maranthaceae and Labiatae) orthe nectar spur (e.g. with manyOrchidaceae). A different flower designwith the same effect, the flag-blossom, isfound within most Papilionaceae. Theseflowers have tough, asymmetrical petalsthat hide nectar and pollen, and requirecunning and force to push apart (Proctor etal., 1996). A uniquely neotropical design isfound with most Lecythidaceae: a fleshyasymmetrical hood serves to cover or hidethat part of the flower which holds nectarand pollen and a strong and agile visitor isrequired to lift it (Mori and Boeke, 1987).Although legitimate access to the nectar ofmost of these flower types is obtained by avariety of Lepidoptera in the Guiana Shield,large bees, such as Euglossa, Eulaema,Bombus, Melipona, Centris and Xylocopa,as well as Ptiloglossa (Colletidae) andMegachile (Megachilidae) always seem tobe the main pollinators (De Dijn, personalobservation; Janzen, 1983; see also visita-tion records in Roubik (1979) and Heithaus(1979), and the discussion on Bignoniaceaein Gentry (1974), and on Lecythidaceae inMori and Boeke (1987)). Shorter-tonguedXylocopa, and also the small Trigona arecommon robbers of these big-tube flowers;they perforate the corolla base from the out-side and in so doing illegitimately accessthe floral nectar. The large bees appear tohave the required behavioural repertoireand learning capacity, as well as the largebody, to visit the flowers legitimately; theywill often insert not just their proboscis, buttheir entire head or body in the corolla togain access to the nectar. In the GuianaShield, many smaller, shorter-tongued bees,such as Augochloropsis and Trigona, also
326 B.P.E. De Dijn

legitimately visit a variety of large bee flow-ers, but for pollen which, as opposed tonectar, tends to be easily accessible (DeDijn, personal observation).
Butterfly and moth syndromes
Typical butterfly- or moth-pollinated flow-ers have a narrow tubular corolla or nectarspur (Haber and Frankie, 1989; Proctor etal., 1996), and are thus similar in generalshape to that of flowers pollinated by large,long-tongued bees. However, they generallylack the obstructive morphological featuresfound inside large bee flowers (De Dijn, per-sonal observation). Many flowers pollinatedby Lepidoptera have relatively short corol-las, shorter than one might expect on thebasis of the often long proboscis ofLepidoptera, and have long filaments andstyles that effectively position the anthersand styles well beyond the corolla proper.This is referred to as a ‘brush’ design, but amuch more unusual one than the earliermentioned shaving brush flower. The‘hairs’ of the brush will often hinder theflower-visiting moth or butterfly, and forcethe latter to keep their bodies away from thecorolla. These flower visitors will conse-quently use their long tongue ‘from a dis-tance’ to probe for nectar, and in theprocess collect pollen dust on their body.Bird- and bat-pollinated flowers may have asimilar brush design (see Proctor et al.,1996, and Chapter 4 and Table 6.1, this vol-ume). Flower-visiting Nymphalidae,Hesperiidae and Lycaenidae position theirbodies just above or to the side of thecorolla proper (De Dijn, personal observa-tion), while hawkmoths (Sphingidae) willusually remain in hovering flight, directlyin front or well above the corolla (Proctor etal., 1996). The narrow corolla is an adapta-tion to the long, thin tongue of the majorityof flower-visiting Lepidoptera. As in otherneotropical areas (Haber and Frankie,1989), the moth-flower design is taken tothe extreme in some plant families in theGuiana Shield, such as the Rubiaceae,Amaryllidaceae and Orchidaceae, whicheach have at least one species with a corollaor nectar spur exceeding 10 cm in length
(De Dijn, personal observation). Whileflower visitation in a neotropical habitathas been investigated at least once in a com-prehensive manner in relation to hawk-moths (dry forest in Costa Rica: Haber andFrankie, 1989), there is no equally compre-hensive data on the rest of the Lepidopteraat that location, nor on Lepidoptera pollina-tion at other neotropical locations (but seeJanzen, 1983).
Feeding tissue and brood-flowers
Several neotropical plants occurring in theGuiana Shield, e.g. Nymphaea(Nymphaeaceae), Annona (Annonaceae)and Philodendron (Araceae), have floralparts that attract large beetles during thefemale phase of flowering (Gottsberger,1986). Beetles entering the large inflores-cence at night gnaw at special feeding tis-sue (fleshy and nutritive flower parts) andbecome entrapped when the flower or inflo-rescence closes towards the morning. Thenext night – when the inflorescence isalready in its male phase – the beetles getdusted with pollen and are allowed toescape (Proctor et al., 1996). These inflores-cences heat up in their female phase andproduce a smell that attracts thebeetles, most conspicuously Dynastinae(Scarabaeidae) of the genus Cyclocephala;the latter were observed visiting Nymphaeain Suriname (Cramer et al., 1975). At leastsome Annonaceae may only attract smallerbeetles (e.g. Nitidulidae) and flies, asobserved in Guyana (van Tol andMeijendam, 1991) and elsewhere (e.g. Maasand Westra, 1992). Small Nitidulidae andCurculionidae are attracted by the hun-dreds or thousands to certain palm species,as recorded at several places in Amazonia(Henderson, 1995), and also observed withAstrocaryum in Suriname (De Dijn, per-sonal observation). Liestabarth (1996)observed that Phyllotrox (Curculionidae)and Epurea (Nitidulidae) visit the inflores-cences of certain Amazonian palm speciesand in the process pollinate; he alsoobserved that they oviposit in the flowers.The minute beetle larvae develop rapidly inthe flower tissue; a single palm inflores-
Flower-visiting Insects 327
cence is a major breeding site for these bee-tles. Several Phyllotrox have been recordedto visit and oviposit at the inflorescences offive species of Cyclanthaceae in Venezuelancloud forest (Seres and Ramirez, 1995). Acharacteristic of the beetle pollination syn-drome would appear to be the sharing ofseveral plant species by just a few pollinatorspecies (Gottsberger, 1986; Liestabarth,1996). Another type of brood-flower pollina-tion syndrome occurring in the neotropics isdistinctly one-on-one species-specific, andinvolves figs (Ficus: Moraceae) and figwasps (Agaonidae). This fig wasp syndromehas been reviewed repeatedly (e.g. Janzen,1979; Berg, 1990). It is quite complex andinvolves (chronologically, as the fig synco-nia develop):
1. Attraction of parent female wasps tofemale(-stage) fig synconia, resulting in pol-lination;2. Oviposition and the development ofwasp larvae in part of the fig florets;3. Copulation of offspring wingless malesand winged females in the synconia; and4. Escape of pollen-laden female waspsfrom male(-phase) synconia.
Oils: food or an aid for bees
Most neotropical Malpighiaceae and manyMelastomataceae have flowers with well-developed epithelial oil glands (Renner,1989; Vogel, 1990). Other neotropicalplants, such as the Commelinaceae, haveflowers with fields of ‘oil-hairs’ (Faden,1992). Epithelial flower oil is used in pref-erence to nectar by some specializedneotropical bees, most notably femaleCentris (Buchmann, 1987). In the GuianaShield, Malpighiaceae with oil flowers suchas Byrsonima and Stigmaphyllon arequite common, as are oil-flower-visitingCentridini and Exomalopsini (Anthophori-dae; e.g. Centris and Paratetrapedia; DeDijn, personal observation). These bees rubthe oil from flowers they visit with theirlegs and have a peculiar toolkit, such asbristles to scratch open oil-bearing tissue,and brushes to mop up and transport theexudate oil (Neff and Simpson, 1981).
Although it is quite clear that Centris is agood oil-flower pollinator, and that it usesoil as the main energy-rich food componentfor its larvae (Vinson et al., 1989), the situ-ation is less obvious for other oil-collectinganthophorids and oil-flower-visiting beeswithout special oil-collecting devices, suchas Meliponinae. The latter are assumed touse the oil as a nest-building component oras pollenkit (a substance which makespollen grains stick to their bodies; Roubik,1989). There are, however, indications thatat least two stingless bee species have atight association with oil flowers inSuriname, and may thus act as importantpollinators: (i) Trigona kaieteurensis,which has been found on numerous flower-ing Stigmaphyllon and never on other flow-ers; and (ii) Cephalotrigona capitata, whichis commonly found on the oil-hair-coveredflowers of Vismia cayennensis (togetherwith Exomalopsis), but with difficulty onother flowers (De Dijn, personal observa-tion).
Resin: building material for bees
Resin is offered by neotropical Clusia(Clusiaceae) and Dalechampia (Euphorbi-aceae) flowers as a reward that is used bybees as a high-quality nest constructionmaterial (Armbruster, 1984). Clusia isdiverse and common in the Guiana Shield,and is visited by a variety of Euglossinaeand Meliponinae (Apidae), many of whichcollect floral resin, while some collect onlypollen (Bittrich and Amaral, 1996, 1997; DeDijn, personal observation). There appearsto be a great diversity of floral designs andbreeding systems within Clusia, whichhave only recently begun to be investigatedfrom a pollination biology perspective. Thelarger resin-flower-visiting bees, such asEuglossa and Eufriesea (Euglossinae),Melipona and larger Trigona (Meliponinae),seem to have the body size required for effi-cient pollination, while smaller Meli-poninae may be infrequent pollinatorsor not pollinate at all. There are indica-tions of a particularly tight associationbetween at least one bee species and Clusiaspecies in the Guiana Shield (De Dijn,
328 B.P.E. De Dijn

personal observation; Roubik, personalcommunication) and presumably inAmazonia in general (cf. visitation recordedby Mesquita and Franciscon, 1995; Bittrichand Amaral, 1996, 1997). The large andenigmatic stingless bee Duckeola ghilianiihas been found frequently on Clusia flow-ers, but not anywhere else. In addition, theotherwise quite elusive small bees of theTrigona subgenus Frieseomelitta can com-monly be found on Clusia flowers, andwould also appear to interact tightly, possi-bly as pollinators.
Scents: reward for male orchid bees
Orchid bees (Apidae: Euglossinae) onlyoccur in the neotropics, and a limited set ofneotropical plant taxa attract the males ofthese bees with very specific scents pro-duced by ‘fragrant’, etherical chemicals,such as vanillin, cineole and eugenol(Dressler, 1982). Each orchid speciesappears to produce a distinct cocktail of fra-grant chemicals, and different cocktailsappear to attract different sets of maleorchid bee species. The reward for the malebees are the fragrant chemicals themselves;these chemicals are mopped off the flowerwith the front legs and transferred to a glan-dular storage organ in the large hind tibia(Barth, 1991). Away from the flowers, maleorchid bees release the evaporating chemi-cals present in their hind tibial glandsthroughout their territorial domain. Thispeculiar behaviour appears to have a func-tion in mating, but the exact role remainsunclear (Dressler, 1982; Roubik, 1989). InSuriname, a whole range of orchid species,such as Catasetum and Gongora, attracteuglossine males, commonly Eulaema,Euglossa and Eufriesea (Werkhoven, 1986;De Dijn, personal observation). Orchids are,however, by no means the only GuianaShield plants using chemicals to attractmale euglossine bees. In French Guiana, atleast two species of Lecythidaceae producechemicals that attract male euglossines(Knudsen and Mori, 1996), as does onespecies of Cyphomandra (Solanaceae;Gracie, 1993). In Suriname, euglossineshave in addition been observed on strongly
fragrant Spathiphyllum (De Dijn, personalobservation), in agreement with observa-tions elsewhere (Williams and Dressler,1976).
Fly pollination syndrome: deception
Flies that breed in rotting organic materialand fungi are attracted to flowers producingsmells which are unpleasant (to humans),such as those of Aristolochia (Aristol-ochiaceae; Proctor et al., 1996). Flies arelured into the oil lamp-shaped inflores-cence of Aristolochia when it is in itsfemale phase. At that time most visitors failto find the escape route out of the flowerbecause they try to exit at the base, wherethe reproductive parts are, and where thesurrounding plant tissue is translucent(suggestive of an exit-opening). In the sub-sequent male phase, the flies get dustedwith pollen while the tissue near the inflo-rescence base darkens; this enables thetrapped visitors to find the actual openingat the opposite end of the inflorescence.What deceives the flies in the first place is asmell resembling that of decaying plantmaterial or fungi emanating from inside theflower. Aristolochia does, however, offersome nectar or other secretion upon whichthe trapped visitors appear to feed. SomeSurinamese orchids (Werkhoven, 1986),and some Amazonian Sterculiaceae(Prance, 1985) also appear to selectivelylure flies to their flowers by means of olfac-tory deception.
Rewards for insects at non-insect flowers
There are a variety of angiosperms in theGuiana Shield with flowers adapted for pol-lination by birds and bats (see Chapter 4,this volume, and Prance, 1985). While thesetypically large flowers (red ones for birds;white ones for bats; see Table 6.1) rewardtheir vertebrate visitors with large amountsof dilute nectar, the flowers are also visitedby insects. In Suriname, many of the insectvisitors to these flowers are essentiallyscavengers, collecting pollen or surplusnectar, and do not appear to pollinate at all(De Dijn, personal observation). Several of
Flower-visiting Insects 329

these insects, most notably Trigona, willactually chew a hole in the flower base toget at the nectar which is difficult to accessthrough the normal perianth opening, ashas been observed in Guyana with bird-pollinated Passiflora (Dalessi, 1993),and in Suriname with Norantea (Marc-graviaceae) and Symphonia (Guttiferae) (DeDijn, personal observation). Another com-mon illegitimate visitor at hummingbirdflowers is Xylocopa, a big bee that makesslits in the base of corollas to access thehidden nectar (Roubik, 1989). Yet other vis-itors are secondary robbers, mainly smallstingless bees, which rob nectar via the per-forations made by the primary robbers.
Non-floral rewards: mates and animal prey
When the attractiveness of flowers to visi-tors is discussed, there rarely is explicitmention of mates and prey as rewards. Acrucial attraction for some visitor taxa, cer-tainly for many bee species, is a high con-centration of suitable mates. This is mostobvious when observing male bees at flowerpatches that only offer pollen and thereforedo not offer any resource for male bees.Male bees in the genus Centris have beenobserved patrolling at Cassia flowers inSuriname (De Dijn, personal observation).Male Ancyloscelis (Anthophoridae) can beobserved patrolling Ipomaea (Convolv-ulaceae) flowers and accosting, in flight,anything resembling a conspecific female ora competing male. Various Halictidae canbe observed doing the same at, for example,inflorescences of Compositae. It is obviousthat brood-flowers and trap-flowers act asimportant sites where both sexes can meetand mate (Liestabarth, 1996; Proctor et al.,1996).
For many predators, flowers are idealsites for finding prey. The main arthropodpredator taxa at flowers in the GuianaShield are assassin bugs (Reduviidae), rob-ber flies (Asilidae), dragonflies (Odonata)and spiders (Araneae); preying mantises(Mantodea) and predatory carabid beetleshave also been observed occasionally (DeDijn, personal observation). Reduviids areoften found at flowers, trying to ambush
small bees or wasps. Asilids can be seenmost of the time staking out potential preyon a prominent flower or vegetative part inthe immediate vicinity of a larger patch offlowers. Dragonflies occasionally do thesame but appear to spend most of their timein flight right above the flowering vegeta-tion. Some Reduviidae and Asilidae arenear-perfect colour mimics of similar-sizedcommon bees. This resemblance may serveeither as a protection against predators or tomislead their prey (Roubik, 1989). Flower-visiting crab spiders (Thomisidae) inSuriname are particularly common on yel-low or white flowers and often have a bodywith the same colour as the flower, whichstrongly suggests a camouflage function.These cryptic-coloured predators are rarelyencountered anywhere else but on flowers(De Dijn, personal observation), indicatingthat a consistent association has developedover evolutionary time between these pred-ators, the host-plant flowers and their visit-ing prey. Predatory sphecid wasps, as wellas parasitic wasps and bees – most com-monly Coelioxys (Megachilidae) – are oftenfound on flowers, but all these appear to bethere to forage for nectar, not to locate ahost (De Dijn, personal observation).Parasitic insects actually using flowers tolocate hosts for their offspring have rarelybeen observed in the Guiana Shield,although there is at least one record of arhipiphorid beetle (Coleoptera) larvae (andadults) on Borreria in French Guiana(observation by Falin and De Dijn).
Diversity of Host Plants, Flower Visitorsand Pollination Systems
One basic fact that needs to be establishedin relation to diversity in the Guiana Shieldis how many flower-visiting insects arethere compared to how many other flowervisitors and flowering plants. It is obviousthat ‘(insects) have to be somewhere’ (E.O.Wilson, cited by C.D. Michener, personalcommunication), which includes floweringplant parts, and that consequently thediversity of insects at flowers will tend to bea function of general insect diversity. The
330 B.P.E. De Dijn

type and extent of floral rewards that can befound in the natural world indicates thatmany insect taxa have compelling reasonsto spend a larger proportion of their timevisiting flowering plant parts than any-where else. Arguably more meaningfuldiversity facts to establish are: how manyflower visitors are actual pollinators andhow many plants are being pollinated byany particular insect taxon. The latter,referred to as ‘pollination systems’, is dis-cussed in much of the recent literature (e.g.Kress and Beach, 1994).
Host-plant diversity
On the basis of recent data on the GuianaShield flora, there are at least 7493 speciesof flowering plants in the three Guianas(Guyana, Suriname and French Guiana;Boggan et al., 1997) and 8622 inVenezuelan Guayana (Berry et al., 1995).Each of the Guianas harbours more or less5000 plant species (more in Guyana). Basedon estimates of subregional levels ofendemism (23% for Venezuelan Guayana,5% for Guyana), taking into account thatadditional species (endemics and wide-spread species) should occur in theBrazilian part of the Guiana Shield, andassuming a bit less than 40% overallregional endemism (Berry et al., 1995),there ought to be at least 10,000–11,000native angiosperm species in the entireGuiana Shield rainforest. Another impor-tant figure to know is not regional but ‘onthe spot’ (alpha) plant species richness inthe Guiana Shield. Based on data from Ek(1997) obtained at 1-ha forest plots inCentral Guyana, one plot will have some70–100 tree species, 40–70 liana speciesand 15–25 herb species. This may add up tosome 125–195 species of flowering plants,not counting epiphytes (which may be atleast a few dozen species/ha).
Alpha diversity of flower visitors
Estimating the number of flower-visitinginsect species (alpha species richness) at aGuiana Shield rainforest site is tricky, given
that a comprehensive data set on a neotrop-ical flower visitor community has to be puz-zled together using data on a forest habitatblock in Guanacaste province, Costa Rica.There, in a ‘complex’ lowland deciduousforest, Heithaus (1974, 1979) recorded atotal of 230 flowering plant species and 586flower visitor species, of which 573 wereinsects (170 were bees). Unfortunately,these figures are for diurnal visitors only,and data on predatory spiders, bugs and thelike appear to be excluded; also, fig waspsdo not seem to be included (fig trees mayhave been absent from the study site; if not,the three fig species in Guanacaste wouldcontribute at least as many fig wasp species;based on Janzen, 1983). From other studies,there are some data on important nocturnalflower-visiting taxa: 65 hawkmoth species(Sphingidae) were recorded at the samegeneral locality as used by Heithaus (basedon Haber and Frankie, 1989), andGuanacaste has five common species ofGlossophaginae and five other phyllostom-atid bats (Chiroptera) which are known tovisit flowers (based on Janzen, 1983). Thereare no comprehensive data whatsoever onnocturnal beetles and non-sphingid mothsvisiting flowers in Guanacaste. Based onthis still incomplete data set, more than95% of the flower visitor species areinsects, and about 25% are bees. This highproportion of insects seems to be in linewith the overwhelming richness of insectspecies in any tropical forest. The propor-tions of some insect taxa are not in linethough; bees, for instance, surely make upmuch less than 25% (i.e. their proportionalspecies richness based on the Guanacasteforest site flower visitation data) of the ani-mal species at any neotropical forest site.Given that angiosperm species richness atthe Guanacaste forest site would appear tobe comparable to that at a Central Guyanaforest plot (cf. above), flower visitor alphaspecies richness may be comparable too.
Regional diversity of flower visitors andpollinators
Given the paucity of data on the GuianaShield insect fauna, assessing the flower
Flower-visiting Insects 331
visitor diversity at a (sub)regional scale isfraught with problems. Nevertheless, dataon the diversity and natural history of sometaxa do exist, if only for other forested sub-regions in the neotropics which are – hope-fully – comparable to the Guiana Shield(Table 6.2). The diversity figures compiledhere – although surely very incomplete –suggest that there may be thousands offlower-visiting insect species in the GuianaShield, most of which are Coleoptera,Lepidoptera, Diptera and Hymenoptera.However, the majority of these speciesprobably do not pollinate or at best are partof a larger pool of generalist pollinators,each of which may be quite inefficient atpollen transfer in most situations. A fewinsect families seem to contain efficientspecialist pollinators, such as Agaonidaeand Sphingidae, while with other families,
just a small fraction of the species are suchspecialists, e.g. Scarabaeidae with specialistCyclocephala and Anthophoridae with spe-cialist Ancyloscelis. There seem to be manyefficient pollinators amongst the generalistbees (e.g. Halictidae and Meliponinae; cf.discussion below).
Host-plant diversity vs. visitor and pollinatordiversity
In each one of the three Guianas, there maythus be less than 1000 efficient pollinatinginsect species for some 5000 floweringplant species. For the Guiana Shield as awhole, the ratio of efficient pollinatinginsects to angiosperm species richness isprobably even lower, given that the major-ity of these pollinator species are wide-
332 B.P.E. De Dijn
Table 6.2. Regional species richness, and quantity of species visiting flowers and pollinating, for insecttaxa in the Guiana Shield and some other forested neotropical regions.
Expected species No. or % of species
Taxon Visitation type richness Visiting Pollinating Source
Thysanoptera sca/gen? ? ? ? –Blattodea sca/gen? SU: >48 >2? none? De Dijn, pers. obs.Mantodea pre SU: >10 >2? none? De Dijn, pers. obsOdonata pre SU: >260 ? none? Geijskes, 1967Dermaptera sca/gen? SU: >31 2 2? Brindle, 1968ColeopteraCarabidae pre SU: >31 >2 0? De Dijn, pers. obs.Staphylinidae sca/pre/gen? SU: > ? few? few? Ashe?
CR: >845 ? ? Ashe, 2000Cantharidae sca/gen? SU: >4 all? ? De Dijn, pers. obsMordellidae sca/gen? SU: >5 all? ? De Dijn, pers. obs.Scarabaeidae sca/fts/gen? SU: >>16 >5? few? De Dijn, pers. obs. Krikken?Bruchidae sca/gen? SU: >>3 >2? none? De Dijn, pers. obsNitidulidae sca/brd/gen? SU: ? >3? few? De Dijn, pers. obs. & Falin?Elateridae sca? SU: ? >2? few? De Dijn, pers. obsBuprestidae sca? SU: >>5 >1? none? De Dijn, pers. obs
CR: >245 ? ? Janzen, 1983Chrysomelidae sca/gen? SU: ? >10? many? De Dijn, pers. obs.
VE: ? ? ? Joly?Cerambicidae sca/gen? FG: >1500 5 %? <5 %? Hequet, 1996
VE: ? ? Joly?Curculionidae sca/brd? SU: ? >11? >3? De Dijn, pers. obs.& Brentidae gen? VE: ? Joly?
DipteraSyrphidae sca/gen SU: >140 all? many? van Doesburg, 1966Asilidae pre SU: >6 many? none? De Dijn, pers. obs.
spread (De Dijn, personal observation). It isthus tempting to agree with the conclusionsof Roubik (1992), expand a bit upon them,and conclude in analogy that in a tropicalforest there are ‘so few efficient pollinators(predominantly insects) and so manyangiosperms’. There is no evidence point-ing at non-insects, e.g. birds and bats,adding significantly to the number of effi-cient pollinators (but see Chapter 4). Theabove conclusion would, however, appearto be valid only at a broad scale, and not forany particular forest habitat at any particu-lar study site (e.g. a Guanacaste dry forestsite), nor during any particular short periodof time. At any particular site and time,there would appear to be a better balance
between the number of plant species actu-ally flowering and the number of efficientpollinating species. This and related mat-ters have been discussed in detail byRoubik (1992, 1996) for tropical bees. Hisconclusions are that, at smaller spatialand temporal scales, a generalist beespecies will visit a limited set of flower-ing plant species, and that an individualgeneralist bee will tend to visit the flowersof one plant species for a prolonged period.This would elegantly explain how abun-dant, generalist bees might be responsiblefor the pollination of numerous plantspecies in the Guiana Shield rainforestand in other botanically diverse tropicalforests.
Flower-visiting Insects 333
Sepsidae & dct SU: ? ? ? ?others BR: ? ? ? Brantjes, 1980
Calyptrata sca/gen? SU: ? many? few? ?LepidopteraPapilionidae sca/nec/gen FG: 37 all few–many? SEPANGUY, 1995–7
CR: 40 all Janzen, 1983Pieridae sca/nec/gen SU: >12 all? few–many? De Dijn, pers. obs.
CR: 70 all Janzen 1983Nymphalidae sca/nec/gen FG: >314 50% few–many? SEPANGUY, 1995–7
s.l. CR: 433 60% Janzen, 1983Hesperiidae sca/nec/gen SU: > 45 all? few–many? De Dijn, pers. obs.
CR: 250 all Janzen, 1983Lycaenidae s.l. sca/nec/gen SU: ? all? few–many? De Dijn, pers. obs.
CR: 250 all Janzen, 1983Sphingidae nec FG: ? ? ? HYDRECO
VE: 95 ? ? Chacin and Clavijo, 1995CR: 126 all? many? Janzen, 1983
Small moths sca/nec? SU: ? ? few? De Dijn, pers. obs.HymenopteraVespoidea sca/pre SU: >150 many many? De Dijn, pers. obs.Spheciformes sca/pre SU: >33 most many? De Dijn, pers. obs.Apiformes sca/nec/pol FG: 245 all most? references for the(=Apoidea s.s.) BR: 250 all most? first three areas in
CR: 200 all most? Roubik, 1992PA: 353 all most? Michener, 1954
Agaonidae brd SU: >10 all all Weiblen, pers. com.FG/SU: 38? all all? Boggan et al., 1997CR: 65? all all? Janzen, 1983
SU=Suriname; FG=French Guiana; BR=Brazil, around Belem; PA=Panama; CR=Costa Rica;VE=Venezuela, Amazonas state; sca=scavenging (non-pollinating); pol=pollen only foraging (pollinat-ing); gen=generalist (pollinating); nec=nectar foraging (pollinating); fts=feeding tissue (pollinating);brd=brood flower (pollinating); dct=deceit (pollinating); pre=predating (non-pollinating);?=unknown/uncertain. De Dijn, pers. obs. is based on inspection of the NZCS collection, and unpub-lished observations in Suriname.
Diversity of pollination systems
Several authors have described the ‘pollina-tion systems’ of neotropical plant commu-nities (Ramirez, 1989; Bawa, 1990; Kressand Beach, 1994; Seres and Ramirez, 1995).The pollination system concept wouldappear to be similar to that of pollinationsyndromes in that the systems are namedafter the main pollen vectors involved,most often animal taxa, and that the differ-ent classes are mutually exclusive. The fig-ures listed are usually percentages (of plantspecies assigned to a pollination systemclass or type), thus indicating the relativeimportance of various pollen vector typesin a plant community (Table 6.3). There isan impressive data set on the angiospermsof the rainforest at La Selva in Costa Rica(Bawa et al., 1985b, Bawa, 1990; Kress andBeach, 1994), which is, however, stillincomplete and biased against non-woodyplants (most notably epiphytes). There arealso data on the angiosperms of a high-alti-tude shrubland habitat (‘El Jardin’) inVenezuelan Guayana (Ramirez, 1989; theonly data set from the Guiana Shield) andon the monocotyledons of the cloud forest
at Rancho Grande in Venezuela (Seres andRamirez, 1995). The La Selva data may bethe most relevant in relation to the lowlandforests of the Guiana Shield, the other databeing representative of similar highlandecosystems in the Guiana Shield. One prob-lem with the data is that the authors useddifferent methods to determine the pollina-tion system and used different classes. Thebiggest problem lies in the comparison ofdata on plants pollinated by ‘small insects’;these plants are put in a separate class forLa Selva, while for the Venezuelan locali-ties they are always assigned to a variety ofother classes. At an ecosystem level, polli-nation by insects, mostly bees, appears tobe the general rule (see Table 6.3). Withmonocotyledons, beetle pollination wouldappear to surpass that by bees, mainlybecause of the many beetle-pollinatedpalms, Cyclanthaceae and Araceae (not justat Rancho Grande, but also at La Selva,based on inspection of the published tables).These plants belong mainly to the under-storey, which may explain the relativelyhigh occurrence of beetle pollination at thisforest stratum. Bee pollination seems to beparticularly important in the rainforest
334 B.P.E. De Dijn
Table 6.3. Pollination systems (Ps) in a lowland and highland neotropical plant community.
Location La Selva, Costa Rica Guayana, Venezuela
Ecosystem Lowland rainforest High altitude shrublandCommunity Trees (partial) Angiosperms (partial) Angiosperms Monocotyledons
Sub- Sub- Under- All Various MainlyStratum Canopy canopy Canopy canopy storey strata strata understorey
Small insect Ps 23 8 27 14 5 11 ? ?Small bee Ps 8 17 4 18 16 14 56 16Large bee Ps 44 22 37 20 22 24Wasp Ps 4 2 6 5 0 3 0Butterfly Ps 2 5 4 4 5 4 11 0Moth Ps 14 7 12 14 4 11 0Beetle Ps 0 16 2 12 17 13 3 34Fly Ps 0 0 0 0 3 2 10 11Bird Ps 2 18 4 4 24 15 12 24Bat Ps 4 4 4 8 1 4 0 5Wind Ps 0 3 0 1 4 3 8 8No. plant spp. 52 220 51 74 151 276 55 33
Source Bawa, 1990 Kress and Beach, 1994 Ramirez, 1989 Seres andRamirez, 1995.

canopy, where a much larger proportion ofthe plants (mainly trees) are pollinated bybig bees than in lower strata.
Structure and diversity of flower visitorcommunities
The Guiana Shield has been, and still is, animportant region for the study of bee com-munity structure and diversity, and theimpact of the exotic Africanized honeybee(Apis mellifera) on native bees and plants(see below). These studies are highly rele-vant for understanding the diversity andstructure of entire flower visitor communi-ties, which mainly consist of insects. It islogical that research has focused onstrongly flower-dependent taxa, such as thebees, if only because narrower communitiesmay be easier to comprehend. The diversityof flower visitor communities involved inone-on-one or few-on-few interactions withplants is logically a function of the numberof plant species. Thus, the diversity of figwasps is a reflection of the diversity of figtrees (see Janzen, 1983). For other more‘loosely’ interacting, generalist visitor taxa,often referred to as the product of ‘diffuse’coevolution, plant and visitor diversityshould not necessarily be so tightly linked.The most striking example of this may bethe relationship between plants and sting-less bees in the neotropics. Similar-sizedareas of humid lowland forest in the in-terior of the Guiana Shield, CentralAmazonia, the Andean lowlands andCentral America all appear to hold about35–50 stingless bee species (Roubik, 1989),despite the fact that plant composition anddiversity are quite different (Gentry, 1990;ter Steege et al., 2000). This fact is of greatinterest to ecologists who investigate theforces which shape community structureand diversity. A high diversity of exceed-ingly generalist flower visitors is difficult toexplain using ‘classical’ ecological equilib-rium concepts – where competition isinvoked as the structuring force – given thatall the species appear to fill the same foodniche, and thus must be regarded as strongcompetitors which ought not to coexist.Roubik (1992) proposes that tropical forests
are too heterogeneous and unpredictableover space and time for competitiveprocesses to continue until an equilibriumis reached, and that this is the explanationfor the high social bee diversity in theneotropics. De Dijn (2000) records signifi-cantly fewer stingless bee species in aswamp forest in Suriname, which he sees asthe result of low woody plant diversity andtree polydominance. Johnson (1983)explains the coexistence of many species ofstingless bees in part as a consequence ofthe different foraging styles of the species.The views of the latter two authors wouldappear to be more in line with the equilib-rium theory, at least to some extent.
The overall community structure offlower visitors may best be understood interms of guilds (as the bee guilds defined byRoubik, 1992) or functional groups (notunlike the ant groups of Andersen, 1997).This is something which remains to beelaborated further. The presence of certaingroups or guilds, e.g. oil bees, and the diver-sity of groups and guilds, may be a functionof general habitat characteristics and plantcomposition. Each guild or group has itsown ‘internal’ diversity, which may bestrongly influenced by plant diversity orspatio-temporal forest heterogeneity. Oneguild or group may have a strong impact onanother one. For instance, the presence ofsocial flower visitors, such as stingless bees,may lower the diversity of other visitortaxa, such as solitary bees. This impact ofone flower visitors group on another hasbeen a topic addressed repeatedly byRoubik (e.g. 1989, 1992); he concludes thathighly social bees pre-empt feedingresources and thus limit opportunities forthe establishment and speciation of morespecialized solitary bee species. This offersan elegant explanation why bee speciesdiversity is generally lower in tropicalforests than, for instance, in (sub)tropicaland Mediterranean-type habitats (Roubik,1990, 1996). Support for the ‘dominance’ ofstingless bees over other neotropical beetaxa, and arguably also over other flowervisitor taxa, comes from data on their highecosystem-wide abundance at flowers inneotropical ecosystems (Heithaus, 1974,
Flower-visiting Insects 335

1979; Roubik, 1979) and data on the widerange of flowering plants they visit in theneotropics (Ramalho et al., 1990; Biesmeijeret al., 1992).
A recently introduced flower visitorspecies in the neotropics is the Africanizedhoneybee, Apis mellifera. Its impact onnative stingless bees has been investigatedin French Guiana by Roubik (1978). Hefailed to find convincing evidence ofcolony-level competition between Apis andMelipona (Roubik, 1982c), but he didobserve some changes in the visitation andseed-set with Mimosa pudica(Mimosoidea), which he links to invasionby feral Apis (Roubik, 1996). The limitedimpact of an exotic flower visitor and thelarge ‘redundant’ diversity of generalistflower visitors, such as stingless bees, sug-gests that the pollination in forest ecosys-tems of the Guiana Shield may be quiteinsensitive to disturbances. What has sur-faced to date, however, is only a small partof the puzzle; more case studies on othervisitor and plant taxa need to be done, andmore long-term data need to be collected.This topic is important in relation to forestconservation. Very tight pollination mutu-alisms are surely vulnerable to forestdecline. Even some generalist pollinationin the neotropics may decline seriously as aconsequence of chronic forest degradation,as is probably happening in the Costa Ricandry forest (Frankie et al., 1997). A break-down of pollination mutualisms will havevery serious consequences for plant repro-duction and forest maintenance. Oneextreme consequence would be that manyplant species would no longer reproduceand would slowly disappear from their nat-ural habitats. Such a scenario is not improb-able for valuable timber species, where adecrease in density due to over-harvestingwill increase inter-individual distances,and could hamper cross-pollination.
Pollination Research in the GuianaShield: Pitfalls and Priorities
Much of the information reviewed above(Tables 6.1–6.3) is based on extrapolation,
and many of the data sets used are incom-plete and probably biased; worse, somedata sets may contain errors because of themany pitfalls related to recording and inter-preting the roles of visitors, and assessingtheir impact on pollination. One needs tobe cautious when using the data, and nottake the conclusions based on them forgranted. Pitfalls in relation to pollinationstudies in the neotropics could be summa-rized by the following:
1. Visitor vs. pollinator. Visitors are notnecessarily pollinators, and this is also thecase for archetypical pollinators such asbees (see discussion and examples above).2. Pollen carrying vs. inter-plant pollentransfer. Even visitors with pollen ‘at theright place’ on their body, and observed tocontact the style with parts of their bodydusted with pollen, are not necessarily pol-linators. Given that most neotropical plantsmay require cross-pollination (Bawa,1985a), they will only be pollinators whenin addition they move from one plant indi-vidual to the next. The latter will thus haveto be demonstrated, at least for self-incom-patible plant species (as done by Frankie etal., 1976).3. Occasional vs. consistently efficient pol-linators. Visitors may be very abundant ona flowering plant (like stingless bees oftenare), but may only occasionally move fromone conspecific plant to the next, and in sodoing cross-pollinate. This is very muchrelated to the amount of reward availableon one plant, the size and flight range of thevisitor and the distance between conspe-cific plants, as discussed in relation to nec-tar by Heinrich and Raven (1972).4. Pollinators vs. non-pollinating visitors.Flower visitors that (partially) deplete theresources attracting legitimate pollinatorsmay positively or negatively affect pollina-tion. For clover in temperate ecosystems, anincrease of seed set has been linked to thepresence of non-pollinating visitors(reviewed in Heinrich and Raven, 1972),while in a neotropical setting, seed set witha treelet has been shown to decrease as aresult of nectar robbing (Roubik et al.,1985).
336 B.P.E. De Dijn

5. Pollinators vs. aggressive non-pollinatingvisitors. Many of the flower visitors thatbehave aggressively at flowers may not actas pollinators themselves and in additionchase away the actual pollinators; hencethe term ‘anti-pollinators’, coined byGentry (1978). Such anti-pollinators, how-ever, may just as well promote cross-polli-nation by occasionally chasing or scaringaway pollinators while these are in theprocess of visiting flowers (Roubik, 1989).Aggressors that may cause such events areterritorial male bees, resource-monopoliz-ing Trigona and various predators (De Dijn,personal observation).
One can safely conclude that there is a seri-ous shortage of high-quality studies onflower visitation and pollination in theneotropics in general (let alone the GuianaShield); few studies go ‘all the way’ fromrecording visitors (and accurately interpret-ing their roles) to assessing the contributionof individual visitor species or classes topollination and seed production. Notableexceptions are:
1. A series of studies by Frankie and col-laborators in Costa Rica (mainly on thecanopy tree Andira inermis; reviewed inFrankie et al., 1990, 1997);2. A study of the pollination of the under-storey shrub Pavonia dasypetala in Panama(Roubik, 1982a);3. A study on flower visitors and reproduc-tion of the treelet Quassia amara (Roubik etal., 1985); and4. A study on social bee visitation and seedset of the creeping herb Mimosa pudica inFrench Guiana (Roubik, 1996a).
It is obvious that an important research pri-ority would be to undertake similar in-depth studies on the variety of key plantspecies in the Guiana Shield. Highest prior-ity would need to be given to:
1. Representatives of diverse plant familiesand genera (see ter Steege, 2000);2. Representatives of abundant plant fami-lies and genera (see data on trees in terSteege et al., 2000);
3. Plant species of great ecological impor-tance, such as pioneer species (e.g.Cecropia) and locally dominant species(e.g. Euterpe and Eperua); and4. Plant species of economic importance,such as timber tree species (e.g.Cholorocardium rodiei and Vouacapouaamericana), and plants yielding importantnon-timber forest products (e.g. many largerpalm species).
Another obvious Guiana Shield researchpriority is to undertake some ecosystem-wide studies on flower visitors and theirroles (also plant breeding system), in whichtaxonomic and growth form bias is avoidedas much as possible. Diverse ‘mixed’ low-land forest and the typical Guiana Shieldspecies-poor forest types would deservehigh priority here. Ecosystem-wide studiesmay need to precede the studies on indi-vidual plant species, in the spirit of theexemplary research strategy followed byFrankie and collaborators in Costa Rica (asexplained in Frankie et al., 1990). Along thelines of this strategy, the next step orresearch priority would be to study theecology of some of the most important pol-linator taxa, which will surely include mostof the bees. An ambitious priority researchprogramme for the Guiana Shield couldhave an even wider scope than the one inCosta Rica, and investigate plant reproduc-tion in a holistic manner. This would mean:(i) initially combining ecosystem-widestudies on flower visitation and pollinationwith studies on seed set and seed dispersal;(ii) then focusing on representative andimportant plant species; and (iii) ultimatelyinvestigating representative and importantanimal taxa involved in flower visitationand pollination.
Questions to address in relation to flowervisitation in the Guiana Shield
Flower visitation and the pollination mutu-alism in tropical forests have long been top-ics of considerable interest to ecologists(e.g. Heithaus, 1979; Janzen, 1983), mor-phologist-taxonomists and evolutionarybiologists (e.g. Gentry, 1974; Neff and
Flower-visiting Insects 337

Simpson, 1981). Although it is an idealtopic for crossover plant–animal studies,most of the hypotheses formulated and inpart also investigated to date have beeneither ‘botanical’ ones, e.g. on plant breed-ing systems and effective pollination, or‘zoological’ ones, e.g. on floral resource par-titioning and flower visitation. Some of themain hypotheses are summarized here; theone on flower visitor community structureand diversity will be discussed furtherbelow, given that it has already been thesubject of several influential studies con-ducted in the Guiana Shield.
A comprehensive review of some pre-dominantly botanical questions in relationto pollination in tropical rainforests can befound in Bawa (1990); they can be summa-rized as follows:
1. How is adequate pollen flow realized inheterogeneous forests?2. Do longevity and environmental pres-sures require rainforest tree populations tobe heterogeneous?3. What is the link between the various pol-lination syndromes and plant speciation?4. What factors promote coevolution, e.g. ofspecialist plants and pollinators?5. To what extent do plant–pollinator inter-actions shape (plant) community structure?6. Do the mutualistic plant–pollinator inter-actions make forests stable and resilient?
Some pertinent ‘zoological’ questions havebeen formulated in relation to tropical beesby Roubik (1989, 1990, 1992, 1996) and canbe restated more generally as follows:
1. How do flower visitors partition theresources at different spatial and temporalscales?2. Are flower visitor communities mainlyshaped by long-lived and highly socialspecies?3. Are flower visitor communities in com-petitive equilibrium or in constant flux?4. Do many-on-many pollinating interac-tions make forests less sensitive to distur-bance?
These research questions need to be
addressed in the Guiana Shield to furtherwider comparisons of the results from dif-ferent tropical forest regions in SouthAmerica, the neotropics and the tropics ingeneral. The Guiana Shield is an importantcomponent in any meta-analysis of pollina-tion. Have the many unique or rare (pre)his-torical and ecological characteristics of theregion similarly affected the way that plantsand pollinating insects interact today?Some of the region’s unique attributesmight include:
1. The forests cover one of the Earth’s mostancient and stable geological formations(see Chapters 1 and 2).2. There are extensive tree-species-poorforests, such as xeromorphic forests onexcessively drained sands, and hydrophyticforests in the poorly drained coastal plain(Chapters 2 and 7).3. There are isolated table mountain, rockoutcropping and savanna ecosystems withina sea of highly heterogeneous lowland rain-forest (Berry et al., 1995) (Chapter 2).4. Tree species diversity in comparable for-est ecosystems is lower than in CentralAmazonia and the Andean foothills (terSteege et al., 2000) (Chapter 7).
The fact that the Guiana Shield is one of thelargest, relatively unmodified forest areasremaining on Earth is another strong pointof this region. Its intact food chains andcommunities allow for the investigation ofecosystems which have optimal functionalintegrity, i.e. where all the interacting rain-forest organisms which define the systemunder study are still present. Such intactecosystems allow for more meaningfulresearch and ultimately a better under-standing of nature; also, they are of greatimportance to elucidate the impact ofhuman activities on nature, and provideclues on how to restore disturbed habitats(see Chapter 9).
Acknowledgements
Thanks to David Hammond and YvesBasset for timely feedback; George Weiblen,
338 B.P.E. De Dijn
Meindert Hielkema and Phillippe Cerdanfor information on fig wasps; Paul Ouboter,Harrold Sijlbing and Usha Raghoenandanfor facilitating the review work and Anil
Gangadin and Helene Hiwat for assistanceand discussions in the field (and commentson this manuscript).
Flower-visiting Insects 339
References
Andersen, A.N. (1997) Functional groups and patterns of organization in North American ant communities:a comparison with Australia. Journal Biogeography 24, 433–460.
Armbruster, W.S. (1984) The role of resin in angiosperm pollination: ecological and chemical considera-tions. American Journal Botany 71, 1149–1160.
Ashe, J.S. (2000) Rove beetles (Staphylinidae) of the Monteverde area. In: Nadkarni, N. and Wheelwright,N. (eds) Monteverde: Ecology and Conservation of a Tropical Cloud Forest. Oxford University Press,New York, pp. 108–111.
Barth, F.G. (1985) Insects and Flowers: the Biology of a Partnership (transl. M.A. Biederman-Thorsen).Princeton University Press, Princeton, New Jersey.
Barth, F.G. (1991) Insects and Flowers: the Biology of a Partnership. Princeton University Press, Princeton,New Jersey.
Bawa, K.S. (1990) Plant–pollinator interactions in tropical rain forests. Annual Review Ecology andSystematics 21, 399–422.
Bawa, K.S., Perry, D.R. and Beah, J.H. (1985a) Reproductive biology of tropical lowland rain forest trees. I.Sexual systems and incompatibility mechanisms. American Journal Botany 72, 331–345.
Bawa, K.S., Bullock, S.H., Perry, D.R., Coville, R.E. and Grayson, M.H. (1985b) Reproductive biology oftropical lowland rain forest trees. II. Pollination systems. American Journal Botany 72, 346–351.
Berg, C.C. (1990) Reproduction and evolution in Ficus (Moraceae): traits connected with the adequate rear-ing of pollinators. Memoirs New York Botanical Garden 55, 169–185.
Berry, P.E., Huber, O. and Holst, B.K. (1995) Floristic analysis and phytogeography. In: Berry, P.E., Holst,B.K. and Yatskievych, K. (eds) Flora of the Venezuelan Guayana, Vol. 1: Introduction. MissouriBotanical Garden, St Louis, Missouri, pp. 161–191.
Biesmeijer, J.C., van Marwijk, B., van Deursen, K., Punt, W. and Sommeijer, M.J. (1992) Pollen sources forApis mellifera (Hym, Apidae) in Surinam, based on pollen grain volume estimates. Apidologie 23,245–256.
Bittrich, V. and Amaral, C.E. (1996) Flower morphology and pollination biology of Clusia species from theGran Sabana (Venezuela). Kew Bulletin 51, 681–694.
Bittrich, V. and Amaral, C.E. (1997) Flower biology of some Clusia species from Central Amazonia. KewBulletin 52, 617–635.
Boggan, J., Funk, V., Kelloff, C., Hoff, M., Cremers, G. and Feuillet, C. (1997) Checklist of the Plants of theGuianas (Guyana, Surinam, French Guiana), 2nd edn. Centre Study Biological Diversity, Georgetown.
Brantjes, N.B.M. (1980) Flower morphology of Aristolochia species and the consequences for pollination.Acta Botanica Neerlandica 29, 121–213.
Brindle, A. (1968) The Dermaptera of Surinam and other Guyanas. Studies Fauna Suriname and OtherGuyanas X, 1–60.
Buchmann, S.L. (1983) Buzz-pollination in angiosperms. In: Jones, C.E. and Little, R.J. (eds) Handbook ofExperimental Pollination Biology. Van Nostrand Reinhold, New York, pp. 73–114.
Buchmann, S.L. (1985) Bees use vibration to aid pollen collection from non-poricidal flowers. JournalKansas Entomological Society 58, 517–525.
Buchmann, S.L. (1987) The ecology of oil flowers and their bees. Annual Review Ecology and Systematics18, 343–369.
Chacin, M.E. and Clavijo, J.A. (1995) Sphingidae (Insecta: Lepidoptera) del estado Amazonas, Venezuela.Boletin Entomologia Venezolana 10, 7–24.
Cramer, J.M., Meeuse, A.D.J. and Teunissen, P.A. (1975) A note on the pollination of nocturnally floweringspecies of Nymphaea. Acta Botanica Neerlandica 24, 489–490.
Dalessi, D.L.W.M. (1993) Flower visiting behaviour of Trigona (T.) williana on Passiflora coccinea andPassiflora glandulosa in Mabura, Guyana. MSc research report, Utrecht University, Utrecht, TheNetherlands.
De Dijn, B.P.E. (2000) Stingless bee communities: are they poorer in more constrained ecosystems? In:

Proceedings Sixth International Conference on Apiculture in Tropical Climates. IBRA, Cardiff, UK, pp.200–210.
Dressler, R.L. (1982) Biology of the orchid bees (Euglossini). Annual Review Ecology Systematics 13,373–394.
Ek, R.C. (1997) Botanical diversity in the tropical rain forest in Guyana. PhD thesis, Utrecht University.Tropenbos-Guyana Series 4. Tropenbos-Guyana, Georgetown.
Engel, M.S. and Dingemans-Bakels, F. (1980) Nectar and pollen resources for stingless bees (Meliponinae,Hymenoptera) in Surinam (South America). Apidologie 11, 341–350.
Faden, R.B. (1992) Floral attraction and floral hairs in the Commelinaceae. Annals Missouri Botanical Garden79, 46–52.
Faegri, K. and van der Pijl, L. (1979) The Principles of Pollination Ecology, 3rd edn. Pergamon Press, Oxford,UK.
Frankie, G.W., Opler, P.A. and Bawa, K.S. (1976) Foraging behavior of solitary bees: implications for out-crossing of a Neotropical forest tree species. Journal of Ecology 64, 1049–1057.
Frankie, G.W., Haber, W.A., Opler, P.A. and Bawa, K.S. (1983) Characteristics and organization of the largebee polllination system inthe Costa Rican dry forest. In: Jones, C.E. and Little, R.J. (eds) Handbook ofExperimental Pollination Biology. Van Nostrand Reinhold, New York, pp. 411–448.
Frankie, G.W., Vinson, S.B., Newstrom, L.E., Barthell, J.F., Haber, W.A. and Frankie, J.K. (1990) Plant phe-nology, pollination ecology, pollinator behaviour, and conservation of pollinators in a neotropical dryforest. In: Bawa, K.S. and Hadley, M. (eds) Reproductive Ecology of Tropical Forest Plants. Man and theBiosphere Series, Vol. 7. UNESCO, Paris and Parthenon, Park Ridge, New Jersey, pp. 37–47.
Frankie, G.W., Vinson, S.B., Rizzardi, M.A., Griswold, T.L., O’Keefe, S. and Snelling, R. (1997) Diversity andabundance of bees visiting a mass flowering tree species in disturbed seasonal dry forest, Costa Rica.Journal Kansas Entomological Society 70, 281–296.
Geijskes, D.C. (1967) De insektenfauna van Suriname, ook vergeleken met die van de Antillen, speciaal watbetreft de Odonata. Entomologische Berichten (Amsterdam) 27, 69–72.
Gentry, A.H. (1974) Coevolutionary patterns in Central American Bignoniaceae. Annals Missouri BotanicalGarden 61, 728–759.
Gentry, A.H. (1978) Anti-pollinators for mass-flowering plants? Biotropica 10, 68–69.Gentry, A.H. (1990) Floristic similarities and differences between Southern Central America and Upper and
Central Amazonia. In: Gentry, A.H. (ed.) Four Neotropical Rainforests. Yale University Press, NewHaven, Connecticut, pp. 141–157.
Gentry, A.H. (1993) A Field Guide to the Families and Genera of Woody Plants of Northwest South America(Colombia, Ecuador, Peru), with Supplementary Notes on Herbaceous Taxa. University of ChicagoPress, Chicago, Illinois.
Gottsberger, G. (1986) Some pollination strategies in neotropical savannas and forests. Plant SystematicsEvolution 152, 29–45.
Gracie, C. (1993) Pollination of Cyphomandra endopogon var. endopogon (Solanaceae) by Eufriesea spp.(Euglossini) in French Guiana. Brittonia 45, 39–46.
Haber, W.A. and Frankie, G.W. (1989) A tropical hawkmoth community: Costa Rican dry forest Sphingidae.Biotropica 21, 155–172.
Haber, W.A., Frankie, G.W., Baker, H.G., Baker, I. and Koptur, S. (1981) Ants like flower nectar. Biotropica13, 211–214.
Heinrich, B. and Raven, P.H. (1972) Energetics and pollination ecology. Science 176, 597–602.Heithaus, E.R. (1974) The role of plant–pollinator interactions in determining community structure. Annals
Missouri Botanical Garden 61, 675–691.Heithaus, E.R. (1979) Flower visitiation records and resource overlap of bees and wasps in northwest Costa
Rica. Brenesia 16, 9–52.Henderson, A. (1995) The Palms of the Amazon. Oxford University Press, New York.Hequet, V. (1996) Longicornes de Guyane. ORSTOM and Silvolab, Cayenne.Janzen, D.H. (1979) How to be a fig. Annual Review Ecology and Systematics 10, 13–51.Janzen, D.H. (ed.) (1983) Costa Rican Natural History. University of Chicago Press, Chicago, Illinois.Janzen, D.H. (1984) Two ways to be a tropical big moth: Santa Rosa saturniids and sphingids. Oxford Surveys
in Evolutionary Biology 1, 85–140.Johnson, L.K. (1983) Foraging strategies and the structure of stingless bee communities in Costa Rica. In:
Jaisson, P. (ed.) Social Insects in the Tropics, Vol. 2. Universite Paris-Nord, Paris, pp. 31–58.Johnson, L.K. (1987) Communication of food source location by the stingless bee Trigona fulviventris. In:
340 B.P.E. De Dijn

Eder, J. and Rembold, H. (eds) Chemistry and Biology of Social Insects. Verlag J. Peperny, München,Germany, pp. 698–699.
Kerkvliet, J.D. and Beerlink, J.G. (1991) Pollen analysis of honeys from the coastal plain of Surinam. JournalApicultural Research 30, 25–31.
Knudsen, J.T. and Mori, S.A. (1996) Floral scents and pollination in neotropical Lecythidaceae. Biotropica28, 42–60.
Knuth, P. (1906–9) Handbook of Flower Pollination (transl. J.A. Davis). Clarendon Press, Oxford.Kress, W.J. and Beach, J.H. (1994) Flowering plant reproductive systems. In: McDade, L.A., Bawa, K.S.,
Hespenheide, H.A. and Hartshorn, G.S. (eds) La Selva. Ecology and Natural History of a NeotropicalRain Forest. The University of Chicago Press, Chicago, Illinois, pp. 161–182.
Kuchenmeister, H., Silberbauer-Gottsberger, I. and Gottsberger, G. (1997) Flowering, pollination, nectarcrop, and nectaries of Euterpe precatoria (Arecaceae), an Amazonian rain forest palm. Plant SystematicsEvolution 206, 71–97.
Liestabarth, C. (1996) Pollination of Bactris by Phyllotrox and Eperua: implications of the palm breeding bee-tles on pollination at the community level. Biotropica 28, 69–81.
Lindeman, J.C. and Mennega, W.H.A. (1963) Bomenboek voor Suriname. Dienst LBB, Paramaribo.Maas, P.J.M. and Westra, L.Y.T. (1992) Rollinia. Flora Neotropica, Monograph 57. New York Botanical
Garden, New York.Meeuse, B.J.D. (1961) The Story of Pollination. Ronald Press, New York.Mesquita, R. de C.G. and Franciscon, C.H. (1995) Flower visitors of Clusia nemorosa G.F.W. Meyer
(Clusiaceae) in an Amazonian white-sand campina. Biotropica 27, 254–257.Michener, C.D. (1954) Bees of Panama. Bulletin American Museum Natural History 104, 1–175.Mori, S.A. and Boeke, J.D. (1987) Pollination. In: Mori, S.A. and collaborators The Lecythidaceae of a
Lowland Neotropical Forest: La Fumee Mountain, French Guiana. Memoirs New York BotanicalGarden 44, 137–155.
Neff, J.L. and Simpson, B.B. (1981) Oil-collecting structures in the Anthophoridae (Hymenoptera): morphol-ogy, function, and use in systematics. Journal Kansas Entomological Society 54, 95–123.
Polak, A.M. (1992) Major Timber Trees of Guyana. A Field Guide. Tropenbos Foundation, Wageningen, TheNetherlands.
Prance, G.T. (1985) The pollination of Amazonian plants. In: Prance, G.T. and Lovejoy, T.E. (eds) Amazonia.Pergamon Press, Oxford, UK, pp. 166–191.
Proctor, M., Yeo, P. and Lack, A. (1996) The Natural History of Pollination. Timber Press, Portland, Oregon.Ramalho, M., Kleinert-Giovannini, A. and Imperatriz-Fonseca V.L. (1990) Important bee plants for stingless
bees (Melipona and Trigona) and Africanized honeybees (Apis mellifera) in neotropical habitats.Apidologie 21, 469–488.
Ramírez, N. (1989) Biología de polinización en una comunidad arbustira tropical de la Alta GuayanaVenezolana. Biotropica 21, 319–330.
Renner, S. (1983) The widespread occurrence of anther destruction by Trigona. Biotropica 15, 251–256.Renner, S. (1989) A survey of reproductive biology in neotropical Melastomataceae and Memecylaceae.
Annals Missouri Botanical Gardens 76, 496–518.Roubik, D.W. (1978) Competitive interactions between neotropical pollinators and Africanized honey bees.
Science 201, 1030–1032.Roubik, D.W. (1979) Africanized honey bees, stingless bees, and the structure of tropical plant-pollinator
communities. In: Caron, D. (ed.) Proceedings IV International Symposium on Pollination. MarylandAgricultural Experiment Station Miscellaneous Publications 1, pp. 403–417.
Roubik, D.W. (1982a) The ecological impact of nectar-robbing bees and pollinating hummingbirds on a trop-ical shrub. Ecology 63, 354–360.
Roubik, D.W. (1982b) Obligate necrophagy in an social bee. Science 217, 1059–1060.Roubik, D.W. (1982c) Seasonality in colony food storage, brood production and adult survivorship: studies
of Melipona in tropical forest (Hymenoptera: Apidae). Journal Kansas Entomological Society 55,789–800.
Roubik, D.W. (1989) Ecology and Natural History of Tropical Bees. Cambridge University Press, Cambridge,UK.
Roubik, D.W. (1990) Niche preemption in tropical bee communities: a comparison of neotropical andMelanesian faunas. In: Sakagami, S.F., Ohgushi, R. and Roubik, D.W. (eds) Natural History of SocialWasps and Bees in Equatorial Sumatra. Hokkaido University Press, Sapporo, pp. 245–257.
Roubik, D.W. (1992) Loose niches in tropical communities: why are there so few bees and so many trees?
Flower-visiting Insects 341

In: Hunter, M.D., Ohgushi, T. and Price, P.W. (eds) Effects of Resource Distribution on Animal–PlantInteractions. Academic Press, London, pp. 327–354.
Roubik, D.W. (1996) African honey bees as exotic pollinators in French Guiana. In: Matheson, A.,Buchmann, S.L., O’Toole, C., Westrich, P. and Williams, I. (eds) The Conservation of Bees. IBRA,Cardiff, UK, pp. 173–182.
Roubik, D.W. (1996b) Measuring the meaning of honey bees. In: Matheson, A., Buchmann, S.L., O’Toole,C., Westrich, P. and Williams, I. (eds) The Conservation of Bees. IBRA, Cardiff, UK, pp. 163–172.
Roubik, D.W., Holbrook, N.M. and Parra, G.V. (1985) Roles of nectar robbers in reproduction of the tropi-cal treelet Quassia amara (Simaroubaceae). Oecologia (Berlin) 66, 161–167.
Schatz, G.E. (1990) Some aspects of pollination biology in Central American forests. In: Bawa, K.S. andHadley, M. (eds) Reproductive Ecology of Tropical Forest Plants, pp. 69-84. UNESCO, Paris.
SEPANGUY (1995–7) Papillons Diurnes de Guyane. SEPANGUY, Kourou, 9 posters.Seres, A. and Ramírez, N. (1995) Biología floral y polinización de algunas monocotiledoneas de un bosque
nublado venezolano. Annals of the Missouri Botanical Garden 82, 61–81ter Steege, H. (2000) A perspective on Guyana and its plant richness. In: ter Steege, H. (ed.) Plant Diversity
in Guyana. Tropenbos Series 18, Tropenbos Foundation, Wageningen, The Netherlands, pp. 11–17.ter Steege, H., Sabatier, D., Castellanos, H., van Andel, T., Duivenvoorden, J., de Oliveira, A.A., Ek, R.,
Lilwah, R., Maas, P. and Mori, S. (2000) A regional perspective: analysis of Amazonian floristic com-position and diversity that includes the Guiana Shield. In: ter Steege, H. (ed.) Plant Diversity in Guyana.Tropenbos Series 18. Tropenbos Foundation, Wageningen, The Netherlands, pp. 19–34.
Thomas, W.W. (1984) The systematics of Rhynchospora sect. Dichromena. Memoirs New York BotanicalGarden 37, 1–116.
van Doesburg Jr, P.H. (1966) Syrphidae from Suriname. Studies Fauna Surinam and Other Guyanas IX,61–107.
van Tol, I.A.V. and Meijendam, N.A.J. (1991) Field research on pollination and seed dispersal of Annonaceae(soursop family). Doctoral report 91191, Herbarium, Utrecht University, Utrecht, The Netherlands.
Vinson S.B., Williams H.J., Frankie, G.W. and Shrum, G. (1997) Floral lipid chemistry of Byrsonima crassi-folia (Malpighiaceae) and a use of floral lipids by Centris bees (Hymenoptera: Apidae). Biotropica 29,76–83.
Vogel, S. (1990) History of the Malpighiaceae in the light of pollination ecology. Memoirs New YorkBotanical Garden 55, 130–142.
Werkhoven, M.C.M. (1986) Orchids of Suriname. Vaco Press, Paramaribo.Wessels Boer, J.G., Hekking, W.H.A. and Schulz, J.P. (1976) Fa joe kan tak’ mi no moi. Stinasu, Paramaribo.Wille, A. (1963) Behavioural adaptations of bees for pollen collecting from Cassia flowers. Revista Biologia
Tropical 205–210.Williams, N.H. and Dressler, R.L. (1976) Euglossine pollination of Spathiphyllum (Araceae). Selbyana 1,
349–356.Willmer, P.G. and Corbet S.A. (1981) Temporal and microclimatic partitioning of the floral resources of
Justicia Aurea amongst a concourse of pollen vectors and nectar robbers. Oecologia (Berlin) 51, 67–78.
342 B.P.E. De Dijn
Geomorphic and Geographic Controls
The geological world consists of manyregions with tremendous topographic reliefand many regions of tremendous geologicalage, but few areas with both. Simply stated,this mutual exclusivity is a consequence ofthe regional balance between (epeirogenic)forces raising crustal mass and surfaceprocesses countering these forces. Overtime, local diastrophic forces invariablyquiesce and topographic relief declines asuplifting becomes less frequent and surfaceprocesses continue to eat away at theremaining exposed, and most resistant, fea-tures.
More specifically, diastrophic pro-cesses that regulate the rate anddistribution of tectonic and volcanic activ-ity slowly grow mountains and move conti-nents (see Chapter 2). They also deliverpyroclastic flows, lahars, lavas and seismicevents over smaller spatial scales that cata-strophically deflect forest communityprocesses within and near these areas.Expansion of ash clouds and aerosol trainsover much larger areas influence radiativeforcing effects on climate and deliver punc-tuated nutrient loads to affected forestareas. Volcanic eruptions and crustal uplift-ing create new weathering surfaces and
reinvigorate depleted erosion bevels. Thesechanges lead to injection of new materialsthrough accelerated erosion, exposure ofintrusive lithologies, outgassing and mag-matic flow. More importantly, adjacentlowland regions act as the first-stop deposi-tories of material conveyed downslope.
In contrast, where diastrophic activityis relatively quiescent, as in the case ofPrecambrian shield regions, these effects nolonger dominate the regional landscape.Ancient phases of uplifting, volcanism anderosion no longer act as significantproviders of new materials and life in theseregions becomes largely dependent oninternal recycling, atmospheric depositionand biological fixation routes to materialacquisition.
Together, tectonic and volcanic activityhave modulated the rate and spatial distri-bution of material flow into, within and outof the biosphere over geological time. Theyhave also created structural barriers thatalter the size and shape of contiguous cli-matic zones and force anisotropies in thedelivery of forest-sustaining rainfall pat-terns (see Chapter 2). As a consequence, cli-mates that sustain modern tropical forestcommunities have also varied tremen-dously.
Diastrophic effects, however, delimit
343© CAB International 2005. Tropical Forests of the Guiana Shield (ed. D.S. Hammond)
7 Guianan Forest Dynamics:Geomorphographic Control and Tropical
Forest Change Across Diverging Landscapes
David S. HammondIwokrama International Centre for Rain Forest Conservation and Development,Georgetown, Guyana. Currently: NWFS Consulting, Beaverton, Oregon, USA

only part of the story. Long-term changes inthe amount of incoming short-wave radia-tion (ISR), how this is distributed spatiallyand when it is delivered throughout theyear form the other part. Sunspot andMilankovitch cycling, volcanic outgassing,fossil-fuel burning, meteoric impacts andgeomagnetic reversals are leading externalfactors believed to force climate change byaltering the planet’s energy budget (seeChapter 2). Changes to the planetary budgettranslate into different regional climateresponses as the net increase or decrease ofglobal energy is variously transformed andtransferred through the global atmosphericand oceanic circulation (see ‘Climate’,Chapter 2). In turn, the paths of oceanic andatmospheric currents change with a slowlyshifting surface topography driven by thespatial distribution of diastrophic activity.Thus, the geographic position of tropicalforests in a way reflects the interplay oflong-term internal and external forcing fac-tors and constitutes a major role in deter-mining how these regions have beenshaped by these changes.
In the case of the neotropics, the grad-ual widening of the Atlantic as part of theGondwana break-up and final uplifting ofthe Panamanian land bridge fundamentallyaltered how climate was delivered to theGuiana Shield through their effects onregional oceanic circulation (Pitman et al.,1993; Coates and Obando, 1996) (seeChapter 2). More importantly, thesechanges were largely concurrent with theknown earliest phases of angiosperm andlater mammalian radiations and extinctionsacross the neotropics (Fig. 7.1) (Raven andAxelrod, 1974; Friis et al., 1987).
Geomorphographic Control?
Together, diastrophic, or geomorphic, vari-ation and geographic position exert a pro-nounced control on the main abioticfeatures shaping tropical forest environ-ments over a wide range of timescales. Thisgeomorphographic control defines a set ofconstraints exerted by the spatial distribu-tion of age-related geological features and
geographic location of these features onhabitat change trajectories.
Large-scale, structural constraints onthe trajectory of biological change andmeasured community diversity have beenproposed before, particularly as a means ofreconciling discordance in palaeontologicaland palaeoclimatic records (Ricklefs, 1987;Jackson, 1994), but also in pursuit of anexplanation for floristic differences acrossthe neotropics (Gentry, 1982).
Most efforts to understand the factorsunderlying changes in tropical forest diver-sity, structure and distribution throughstructural controls have arisen as a conse-quence of concepts delimiting Pleistocenerefugia (e.g. Haffer, 1969; Vuilleumier,1971; Prance, 1973, 1981). The idea of thechanging Pleistocene climate altering tropi-cal forests was an incredibly important stepforward (van der Hammen, 1972, 1974) butthe basis for spatially delimiting refugiaacross the neotropics based on zoologicaland botanical specimen collections hasproved unconvincing, particularly in lightof the built-in bias associated with theseapproaches in resolving spatial patterns(Nelson et al., 1990).
Almost as a counterweight to thisstructural explanation, recent efforts haveattempted to explain patterns through moregeneral dynamics linking biological behav-iour at population, community and meta-community levels with biogeographicchanges in tropical forest composition anddistribution over contemporary timescales(e.g. Hubbell, 2001). While these effortshave and will continue to merit consider-able attention, the scale of questionsaddressed and mechanisms proposed needto be clearly delimited. Exclusively seekingcontemporary climate and/or edaphic cor-relations with standing tree diversity maybe discounting important differences in his-torical timelines and structural controls.These may be constraining local commu-nity dynamics across the tropics in differ-ent ways. These structural differences cancreate significant non-stationarity whenanalysing spatial patterns of standing diver-sity, confounding attempts to realisticallyinterpolate point patterns. This may arise as
344 D.S. Hammond
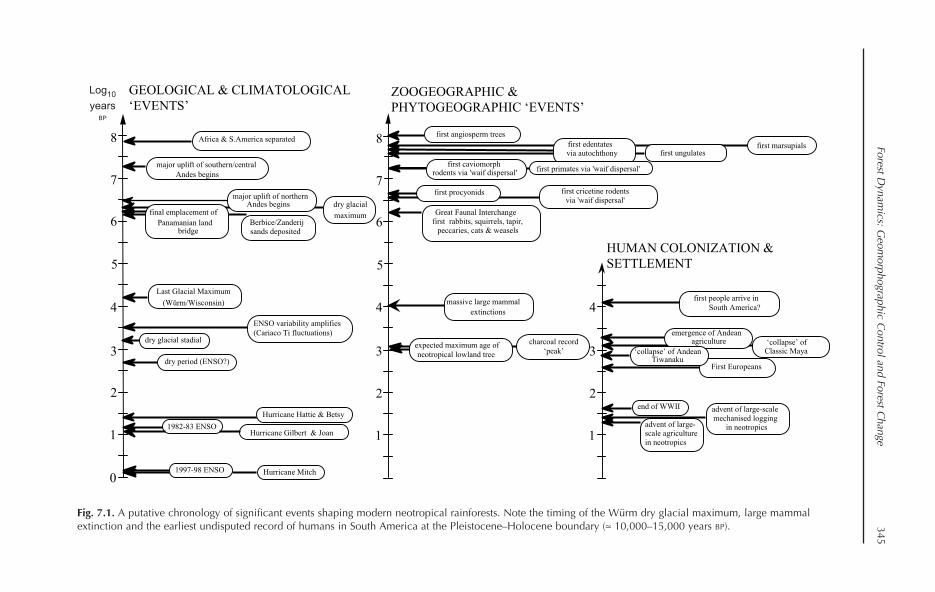
Forest Dynam
ics: Geom
orphographic Control and Forest C
hange345
final emplacement of
Panamanian land bridge
Africa & S.America separated
major uplift of northern Andes begins
major uplift of southern/central
expected maximum age of
neotropical lowland tree
Last Glacial Maximum
(Würm/Wisconsin)
dry glacial
maximum
dry glacial stadial
1
2
3
4
5
6
7
8 first angiosperm trees
1
2
3
4
5
6
7
8
first procyonids first cricetine rodents
via 'waif dispersal'
first edentates via autochthony first ungulates
first marsupials
first caviomorph rodents via 'waif dispersal'
first primates via 'waif dispersal'
Great Faunal Interchange first rabbits, squirrels, tapir,
peccaries, cats & weasels
massive large mammal
extinctions
0
charcoal record
‘peak’
dry period (ENSO?)
ENSO variability amplifies
(Cariaco Ti fluctuations)
1982-83 ENSO
first people arrive in
South America?
First Europeans
1
2
3
4
HUMAN COLONIZATION &
SETTLEMENT
emergence of Andean agriculture ‘collapse’ of
Classic Maya ‘collapse’ of Andean Tiwanaku
end of WWII advent of large-scale mechanised logging
in neotropicsHurricane Gilbert & Joan
1997-98 ENSO
Hurricane Hattie & Betsy
Hurricane Mitch
advent of large- scale agriculture in neotropics
Berbice/Zanderij sands deposited
Log10
years
BP
GEOLOGICAL & CLIMATOLOGICAL
‘EVENTS’ ZOOGEOGRAPHIC &
PHYTOGEOGRAPHIC ‘EVENTS’
Andes begins
Fig. 7.1. A putative chronology of significant events shaping modern neotropical rainforests. Note the timing of the Würm dry glacial maximum, large mammalextinction and the earliest undisputed record of humans in South America at the Pleistocene–Holocene boundary (≈ 10,000–15,000 years BP).
Log10
yearsBP

a consequence of anisotropic variation inpatch scales that implicitly underlie con-cepts of standing beta-diversity.
In effect, geomorphography controlsthe trajectory on which smaller-scale mech-anisms shape forest variation. If this is true,then scaling-up continuously proximatestate measures of these mechanisms overlarger spatial areas will lead to divergingoutcomes. These divergences should definethe transition across different geomorpho-graphic regions. The hypothetical conse-quences of geomorphographic variation onneotropical forest variation, and in particu-lar its role in the Guiana Shield, are dis-cussed later.
Spatial Segregation of Effects in theNeotropics
Visiting the Andean piedmont, theflooded Amazon varzea, the volcanic land-scapes of Central America and the GuianaShield interior conjures up distinctly differ-ent notions of tropical forests. While forestsin these contrasting landscapes share manygeneral attributes that traditionally havecharacterized tropical forests since the earli-est descriptions of the great naturalists, thephysical foundations underpinning them arerarely the same. Rock, soil and the surfacewaters that shape each of these show impor-tant variation across the neotropics. Grantedthis variation may seem insignificant whencontrasting neotropical with nearctic realms.But within respective realms, the geologicalunderpinnings continue to play an impor-tant role in defining the plant growth envi-ronment and, more specifically, how and atwhat rate environments are changing. Therole of geology in forest formation extendswell beyond the most commonly addressedquestion of parent material influence oversoil fertility that has sequestered the viewthat the intervening depth of lowland soilshas separated rock from playing any role intropical forest growth. At wider scales, it isthe indirect effects of juxtaposed geologies,and their inter-related ages, origins and geo-graphic positions that constitute a dis-cernible effect on forest patterns.
The contrast between the geomorphol-ogy of Precambrian shield areas andPhanerozoic, often Cenozoic, mountainbelts and sedimentary platforms across thetropics could not be more striking andreflects efforts to distinguish these broaddifferences as hydrogeochemical and geo-logical provinces (Fittkau, 1974; Putzer,1984; Räsänen, 1993). Shield regions aresenescent geological features. Remainingrock formations are those most resistant toerosion, and weathering rates are slow anddriven by chemical acidity. Conversely, theCenozoic belts defining the Andean,Central American and Caribbean volcanicarcs are dominated by young geological fea-tures. Rock formations are continuouslygrowing through uplift or volcanism, butalso easily eroded through mechanicalaction, releasing elevated concentrations ofnon-siliceous material that form hydrologi-cal and soil conditions that are only weaklyacidic and of higher nutrient status (see‘Soils’, Chapter 2). The interlink betweenrock age, geomorphology and aciditydefines an important axis of variation forneotropical forests.
Landscapes with contrasting geomor-phologies are also influenced by their geo-graphic distribution. Within the tropicalbelt, geographic location links a forest land-scape with the oceanic and atmosphericdrivers that regulate rainfall and its varia-tion within and across years (see ‘Climate’,Chapter 2). Over much longer periods, geo-graphic position defines the periodicity,extent and duration of rainfall decline thatcan precipitate large-scale contraction oftropical forest cover. Latitudinal distancefrom the long-term average position of theinter-tropical convergence zone (ITCZ), ormeteorological equator, is relevant, but aposition along the eastern or western rim ofan oceanic basin is also important. Westernrim regions currently receive considerablerainfall throughout the year, but sufferanomalous rainfall decline, often precipi-tously, when cross-basin oceanic andatmospheric circulatory features weaken orshift latitudes. In contrast, eastern rimregions are characterized by a regime of lowrainfall, punctuated by periods of tremen-
346 D.S. Hammond

dous precipitation. The precipitationresponse to this oscillatory feature, knownas the El Niño Southern Oscillation, orENSO, is strongly attached to geographicposition (see ‘Climate’, Chapter 2).
Interestingly, the effects of geographicposition on ENSO response will also influ-ence ISR received at the forest canopy.Surface ISR is strongly correlated withcloud cover and two cloud formation mech-anisms are believed to control large-scalecloud cover over neotropical forest regionsin particular. The first of these, convectiveand wave train formations, are associatedwith the movement of the ITCZ. Changes inITCZ behaviour are the most prominent fea-ture delivering ENSO rainfall anomalies,largely as a forced response to changes inthe annual distribution of sea surface tem-peratures and atmospheric pressure gradi-ents that govern their movement. Thesecond is linked to cloud deck formationalong mountain slopes through orographicuplift. ISR substantively declines alongslopes below cloud deck formation. Thelink between geographic location, rainfallvariation and ISR defines another importantaxis of variation in the neotropics.
In a modern context, the relativeimpact of geomorphic control in theneotropics is spatially segregated along pas-sive and active plate margins (Fig. 7.2A),while geographic control is principallylinked to juxtaposition of forest and oceanicbasins (Fig. 7.2B). The intersection of thetwo controls delimits broad zones varyingin long-term constraints on primary pro-ductivity due to relative deficiencies inlight, moisture and nutrient availability.Across the eastern Guiana Shield, perma-nent nutrient deficiencies are exacerbatedby fluctuation in ENSO-modulated rainfall,high levels of both ISR and OLR and hydro-logical isolation from the Andes. In com-parison, the western Amazon of southernColombia, Ecuador and northern Peru expe-rience localized, short-term nutrient defi-ciencies, consistently high moistureavailability and relatively low ISR and OLRlevels (see ‘Soils’ and ‘Climate’, Chapter 2).Southwestern Amazon, Central Americaand some parts of the Caribbean are gener-
ally characterized by long-term renewal ofnutrient availability from relatively younglithologies actively exposed to mechanicalweathering, long-term instability of rainfalleither driven by ENSO (Panama, some partsof Caribbean), easterly wave dynamics (thatinfluence large hurricane formations)and/or more permanent adjustments toITCZ ranging (southwestern Amazon) andintermediate levels of ISR and OLR (seeChapter 2).
Ramping and Dampening Ecosystems –Hypothetical Considerations
Geomorphographic control exerts a pro-found influence on regional differences inforest change trajectories for the simple rea-son that it embraces the principal mecha-nisms through which external energy flowsinto the system. Flat-line constancy ofinternal planetary and solar processes andthe astronomical relationships betweenthem would eliminate all discernible varia-tion, but does not represent a plausible statecondition capable of supporting life (see‘Longer-term climate forcing factors’,Chapter 2). Variation in the conformation ofthese influences, however, is a plausibleand potent driver of change rates that arealso spatially heterogeneous. This broadclassification clearly requires further expla-nation.
Geological age in the tropics, holdingclimate constant, is strongly correlated witha host of physical attributes, includingtopographic diversity, rock mineralogy,weathering rates, soil nutrient and metaltoxicity status, soil depth and physico-chemical characteristics of draining water-ways (see Chapter 2).
Climate variation in the tropics isstrongly correlated with geographic posi-tion through both a latitudinal and longitu-dinal component. Latitude effects arelinked to the ranging of the ITCZ as part ofthe global circulation and how this isaffected by changes in external forcingeffects. Regions along the broadest limits ofITCZ latitudinal ranging are likely to expe-rience more frequent fluctuations in rainfall
Forest Dynamics: Geomorphographic Control and Forest Change 347

as ITCZ narrows and extends along thesemargins in response to more modest shiftsin energy distribution. Only local maximaand minima along the most substantivephase variations in ITCZ ranging (e.g. dur-
ing glacial maxima) would reach regionscloser to the meteorological equator (see‘Prehistoric climates of the Guiana Shield’,Chapter 2).
Longitudinal effects, however, can alter
348 D.S. Hammond
Fig. 7.2. (A) Large-scale diastrophic and gradation-dominated zones across the neotropics based on distri-bution of volcanic (triangles), tectonic (solid lines on ocean floor), faults (short lines on land) andPrecambrian shield features. Ramping and dampening systems left and right of dividing line, respectively.(B) Overlay of hurricane storm tracks (1900–1998) in relation to position of exposed Precambrian ofGuiana Shield region.
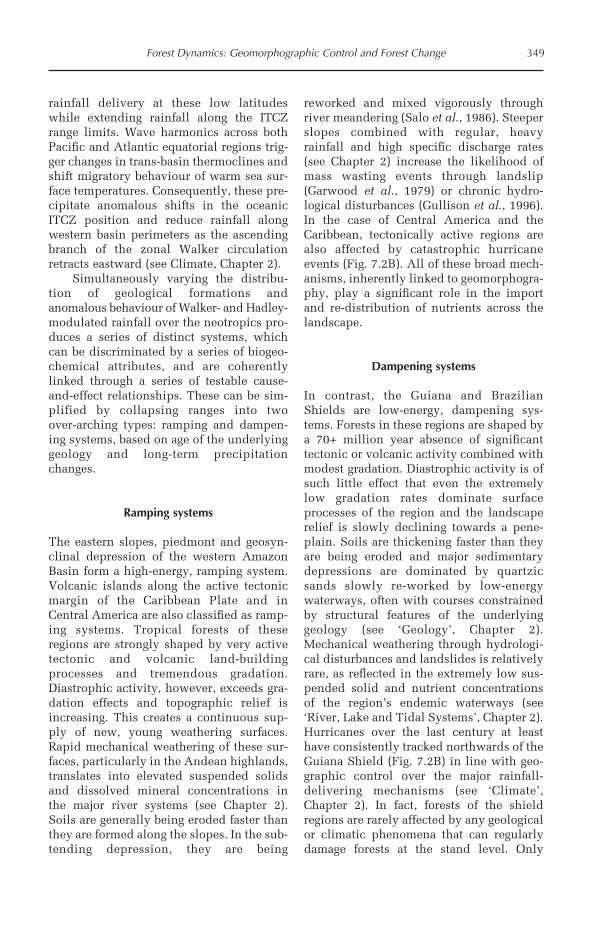
rainfall delivery at these low latitudeswhile extending rainfall along the ITCZrange limits. Wave harmonics across bothPacific and Atlantic equatorial regions trig-ger changes in trans-basin thermoclines andshift migratory behaviour of warm sea sur-face temperatures. Consequently, these pre-cipitate anomalous shifts in the oceanicITCZ position and reduce rainfall alongwestern basin perimeters as the ascendingbranch of the zonal Walker circulationretracts eastward (see Climate, Chapter 2).
Simultaneously varying the distribu-tion of geological formations andanomalous behaviour of Walker- and Hadley-modulated rainfall over the neotropics pro-duces a series of distinct systems, whichcan be discriminated by a series of biogeo-chemical attributes, and are coherentlylinked through a series of testable cause-and-effect relationships. These can be sim-plified by collapsing ranges into twoover-arching types: ramping and dampen-ing systems, based on age of the underlyinggeology and long-term precipitationchanges.
Ramping systems
The eastern slopes, piedmont and geosyn-clinal depression of the western AmazonBasin form a high-energy, ramping system.Volcanic islands along the active tectonicmargin of the Caribbean Plate and inCentral America are also classified as ramp-ing systems. Tropical forests of theseregions are strongly shaped by very activetectonic and volcanic land-buildingprocesses and tremendous gradation.Diastrophic activity, however, exceeds gra-dation effects and topographic relief isincreasing. This creates a continuous sup-ply of new, young weathering surfaces.Rapid mechanical weathering of these sur-faces, particularly in the Andean highlands,translates into elevated suspended solidsand dissolved mineral concentrations inthe major river systems (see Chapter 2).Soils are generally being eroded faster thanthey are formed along the slopes. In the sub-tending depression, they are being
reworked and mixed vigorously throughriver meandering (Salo et al., 1986). Steeperslopes combined with regular, heavyrainfall and high specific discharge rates(see Chapter 2) increase the likelihood ofmass wasting events through landslip(Garwood et al., 1979) or chronic hydro-logical disturbances (Gullison et al., 1996).In the case of Central America and theCaribbean, tectonically active regions arealso affected by catastrophic hurricaneevents (Fig. 7.2B). All of these broad mech-anisms, inherently linked to geomorphogra-phy, play a significant role in the importand re-distribution of nutrients across thelandscape.
Dampening systems
In contrast, the Guiana and BrazilianShields are low-energy, dampening sys-tems. Forests in these regions are shaped bya 70+ million year absence of significanttectonic or volcanic activity combined withmodest gradation. Diastrophic activity is ofsuch little effect that even the extremelylow gradation rates dominate surfaceprocesses of the region and the landscaperelief is slowly declining towards a pene-plain. Soils are thickening faster than theyare being eroded and major sedimentarydepressions are dominated by quartzicsands slowly re-worked by low-energywaterways, often with courses constrainedby structural features of the underlyinggeology (see ‘Geology’, Chapter 2).Mechanical weathering through hydrologi-cal disturbances and landslides is relativelyrare, as reflected in the extremely low sus-pended solid and nutrient concentrationsof the region’s endemic waterways (see‘River, Lake and Tidal Systems’, Chapter 2).Hurricanes over the last century at leasthave consistently tracked northwards of theGuiana Shield (Fig. 7.2B) in line with geo-graphic control over the major rainfall-delivering mechanisms (see ‘Climate’,Chapter 2). In fact, forests of the shieldregions are rarely affected by any geologicalor climatic phenomena that can regularlydamage forests at the stand level. Only
Forest Dynamics: Geomorphographic Control and Forest Change 349

ENSO-driven fire and modern human activ-ity appear as plausible stand-level catastro-phes affecting forests of the Guiana Shield(see below).
Fire
Fire may be the only significant forcing fac-tor, apart from modern human industry,capable of delivering sweeping change toforests of the Guiana Shield region.Periodic fires across many forest regions ofthe Guiana Shield have been well-docu-mented since the mid-18th century(McTurk, 1882; Hohenkerk, 1922; Oliphant,1938; Hughes, 1946; Fanshawe, 1954;Schulz, 1960; Vink, 1970; Bubberman,1973; Saldarriaga, 1994; Hammond and terSteege, 1998). Foresters recognized early onthe threat these posed to the commercial,mainly timber and balata, value of forests inthe region (Wood, 1926; British GuianaForest Department, 1935) and fire-abate-ment strategies formed a serious part of
early efforts to manage forests for timberproduction.
Early foresters also noticed that fireevents in closed-canopy forests of the inte-rior shield region were largely restricted to‘drought’ years. We now know that these‘drought’ years are in fact severe El Niñophases of the Southern Oscillation and thattropical forests on western rims of the equa-torial Atlantic and Pacific are susceptible toanomalous collapse of precipitation, partic-ularly during the normal seasonal dry peri-ods (see ‘Climate’, Chapter 2). Virtuallyevery year documented to coincide withforest fire events in Guyana and Surinamewas a strong to severe warm phase of ENSO(Fig. 7.3). More recent satellite monitoringof these events suggests that other regionsof Venezuela and Roraima state in Brazilare also highly susceptible to fire duringthese periods (Table 7.1).
The charcoal evidence also indicates along history of prehistoric fires affectingalmost every forest area at some stage overthe Holocene (see ‘Prehistoric climates of
350 D.S. Hammond
Table 7.1. The estimated number of pixels associated with fire events from June 1997 to June 2003across the Guiana Shield and selected parts of the wider neotropics. Pixel counts were obtained viaNOAA’s AVHRR-3 sensor. Data source: http://www.cptec.inpe.br, except Guianas estimated by authorbased on AVHRR saturated pixel counts.
Fire pixels (AVHRR-3)
Area of coverage All areas Closed forest % in forest
Venezuela 49,086 147 0.3Bolivar 7,606 111 1.5Amazonas 998 36 3.6Delta Amacuro 917 – 0.0
Guyana 450 36 8.0Suriname 230 35 15.2French Guiana 12 1 8.3Brazil 752,891 131,199 17.4
Amapa 3,097 1,104 35.6Roraima 9,735 3,236 33.2Para 74,714 74,563 99.8Para in GS 536 536 100.0Amazonas 6,190 4,154 67.1Amazonas in GS 1,460 950 65.1Maranhao 32,864 32,864 100.0
Peru 5,031 6 0.1Bolivia 80,560 260 0.3Total Guiana Shield 25,041 6,045 24.1
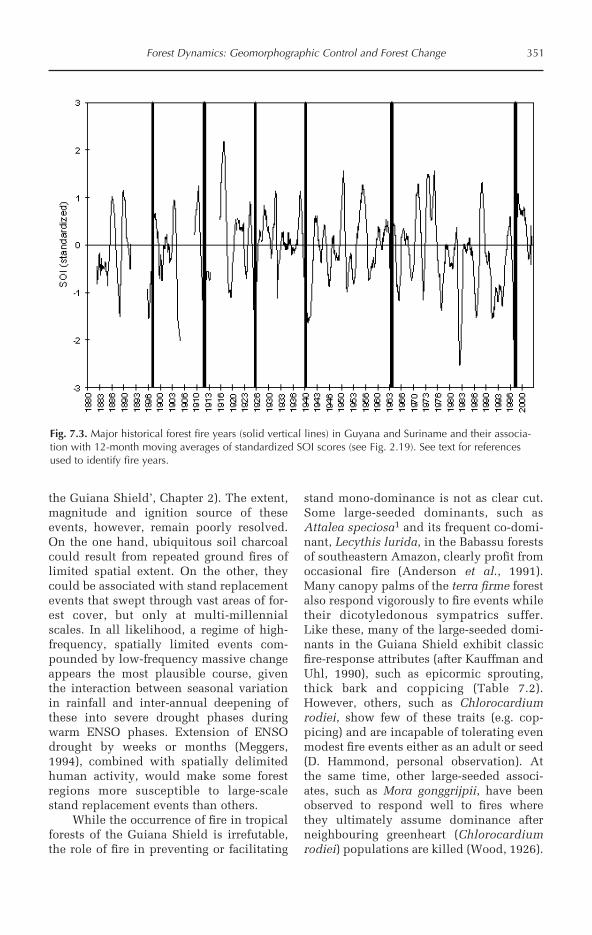
the Guiana Shield’, Chapter 2). The extent,magnitude and ignition source of theseevents, however, remain poorly resolved.On the one hand, ubiquitous soil charcoalcould result from repeated ground fires oflimited spatial extent. On the other, theycould be associated with stand replacementevents that swept through vast areas of for-est cover, but only at multi-millennialscales. In all likelihood, a regime of high-frequency, spatially limited events com-pounded by low-frequency massive changeappears the most plausible course, giventhe interaction between seasonal variationin rainfall and inter-annual deepening ofthese into severe drought phases duringwarm ENSO phases. Extension of ENSOdrought by weeks or months (Meggers,1994), combined with spatially delimitedhuman activity, would make some forestregions more susceptible to large-scalestand replacement events than others.
While the occurrence of fire in tropicalforests of the Guiana Shield is irrefutable,the role of fire in preventing or facilitating
stand mono-dominance is not as clear cut.Some large-seeded dominants, such asAttalea speciosa1 and its frequent co-domi-nant, Lecythis lurida, in the Babassu forestsof southeastern Amazon, clearly profit fromoccasional fire (Anderson et al., 1991).Many canopy palms of the terra firme forestalso respond vigorously to fire events whiletheir dicotyledonous sympatrics suffer.Like these, many of the large-seeded domi-nants in the Guiana Shield exhibit classicfire-response attributes (after Kauffman andUhl, 1990), such as epicormic sprouting,thick bark and coppicing (Table 7.2).However, others, such as Chlorocardiumrodiei, show few of these traits (e.g. cop-picing) and are incapable of tolerating evenmodest fire events either as an adult or seed(D. Hammond, personal observation). Atthe same time, other large-seeded associ-ates, such as Mora gonggrijpii, have beenobserved to respond well to fires wherethey ultimately assume dominance afterneighbouring greenheart (Chlorocardiumrodiei) populations are killed (Wood, 1926).
Forest Dynamics: Geomorphographic Control and Forest Change 351
Fig. 7.3. Major historical forest fire years (solid vertical lines) in Guyana and Suriname and their associa-tion with 12-month moving averages of standardized SOI scores (see Fig. 2.19). See text for referencesused to identify fire years.

Remote sensing of modern-day fires alsoshows considerable spatial variation in bothintensity and frequency of occurrence. InBrazil, South Pará alone accounted for morethan 50% of all AVHRR-saturated pixelsattributed to forest burning between 1997and 2002 (CPTEC, 2003). Forest burning inthe Guiana Shield contributed only 2–3% ofthe total fire pixels registered for Brazil andVenezuela. Fire across the three Guianas,even during peak ENSO events in early 1998and 2002, remained an order of magnitudelower than those spread across the southeast-ern Amazon basin. Yet, relative to closed-canopy forests of the western Amazon inPeru and Bolivia, modern burning across theGuiana Shield is elevated (Table 7.1).
The growth of South Pará as a conti-nental centre of forest fire is not surprisinggiven the geographic location of the regionin relation to Walker and Hadley circula-tory behaviour and the very different socio-economic and demographic changes takingplace in the region in comparison to theGuiana Shield. Nonetheless, the role of firein forest systems of the shield region clearlyrepresents one of very few forcing factorsthat catalyse change in an otherwise damp-ening system. Ironically, while active dis-turbance may invigorate the transfer ofweathered mineral nutrients across manyramping systems, fire events only appear tofurther the pace of dampening by acting as
a major export route for preciously scarcenutrients from a relatively closed and iso-lated regional nutrient cycle (see below).
Nutrient Balance and Migration
Fire plays such an important role not sim-ply because it can destroy or degrade forest.Rather, it is the disruption of the critical,internal nutrient recycling process that,from all available evidence, is dispropor-tionately important to forests in the GuianaShield. The region has very few autochtho-nous sources of nutrients compared toramping system regions across the neotrop-ics, and this makes it particularly vulnera-ble. Long-standing acidity, relativelymodest topographic relief over much of theregion and hydrogeochemical isolationfrom the younger, steeper ranges that typifymuch of western South America, CentralAmerica and the Caribbean, have left mostnutrients critical for plant productivity con-strained to the biomass itself or locked upas inaccessible stores (e.g. soil phosphorusunder low pH conditions) (see Chapter 2).Most available nutrients have been shownto be rapidly recycled at the soil surface(Jordan and Herrera, 1981). In fact, the clas-sic perception of tropical forests as ‘closed’nutrient systems was largely influenced bywork done within some of the poorest andwettest forests in the Guiana Shield(Richards, 1952; Herrera et al., 1978;Jordan, 1987). While tropical forests areincreasingly being viewed as open, or atleast as leaking closed systems, it is clearthat recycling dominates the mass balanceof nutrients in most forest systems of theGuiana Shield. Relative to other regions,however, this appears to represent theextreme low end of a much broader spec-trum defining the relative role of internalnutrient recycling to forest system mainte-nance.
A number of potential import path-ways can contribute to the nutrient balanceof tropical forests, including atmosphericdeposition, weathering of rocks either at thesite (autochthonous) or elsewhere(allochthonous) and biological fixation (Fig.
352 D.S. Hammond
Table 7.2. Examples of dominant species of theGuiana Shield with fire-type adaptations.
Adaptation to fire Species
Thick bark Manilkara bidentataLecythis zabacujoCedrelinga caeteniformisTabebuia insignisDimorphandra conjugata
Epicormic sprouting Dimorphandra conjugataCoppicing Dicymbe spp.
Mora gonggrijpiiPentaclethra macrolobaAttalea regiaAstrocaryum spp.
Root suckering Dimorphandra spp.Guadua spp.

7.4). These do not act as equal pathways forall of the mineral and organic nutrientsneeded to sustain tropical plant growth.Rhizobial bacteria and mycorrhizal fungisolely fix di-nitrogen from the atmosphereinto nitrate, while rock weathering pro-vides little nitrogen, but acts as a majorsource of minerals, such as calcium, mag-nesium and potassium.
Atmospheric deposition
The abundance of aerosol particulatesavailable for deposition is strongly influ-enced by the geographic location of
sources. Several major sources include vol-canoes, deserts (aeolian sediments), indus-trial centres and fires (Fig. 7.4).
The geographic location of the GuianaShield places it largely southeastward ofthe major volcanic chains of the Caribbean,Andes and Central America (see Fig. 7.2A).The only source of aeolian particulates isNorth Africa, but effective transport of sub-stantive quantities across the Atlantic isstrongly linked to easterly wave phenom-ena that tend to concentrate in the sub-equatorial regions north of the GuianaShield (Jones et al., 2003).
Few industrial regions are within theGuiana Shield region and emissions from
Forest Dynamics: Geomorphographic Control and Forest Change 353
Fig. 7.4. Schematic of the major pathways (arrows) influencing the regional nutrient balance of GuianaShield forests (grey box), emphasizing those making minimal (grey) and major (black) contributions.Striped arrow indicates an event-based contribution made through migrating fire emission particulates.
Dry–wetdeposition
Fluvialtransport
Fluvialdeposition
CommodityExport
Allochthonousweathering
BiologicalFixation
Marine
Fire
Erosion
Recruitment Mortality
Decay
Growth
Leaching
Volcanic
Eolian
Industrial
SmokeAerosols & particulates
Denitrification
Autochthonousweathering
BiomassExtraction
Atmosphere
Pedosphere
Standing ForestBiomass

these areas are nominal (Holzinger et al.,2001). The northern rim is, however, occu-pied by heavy industry, particularly aroundthe Ciudad Guayana–Lago Guri area, andmore industrialized areas can at least createhydrocarbon plumes that extend overremote areas of Venezuelan Guayana(Holzinger et al., 2001). Generally, how-ever, industrial impacts are relatively weak.This is well-illustrated by the very lowatmospheric sulphur aerosol concentra-tions measured in the region (see ‘Longer-term climate forcing factors’, Chapter 2).
Monitoring of mineral import viaatmospheric deposition suggests that thisroute has a nominal effect on the nutrientmass balance of forests in the GuianaShield, except to elevate concentrations ofsodium and chlorine as a consequence ofocean-sourced moisture (Haripersad-Makhanlal and Ouboter, 1993; Brouwer,1996). At Mabura Hill, internal recycling ofkey plant nutrients, such as P, Ca, K andMg, was measured at 20–85 times greaterthan contributions via atmospheric deposi-tion (Brouwer, 1996). Some events, how-ever, such as large fires, could lead todownwind migration of important nutrientswithin the region (Fearnside, 1990, p. 114)and act as important routes through whichfire-susceptible edaphic habitats, such ascampinarana, caatinga, dakama bush andmuri scrub, are formed and diminishthrough repeated export of fossil nutrients(Anderson, 1981).
Autochthonous weathering
Nutrients made available through weather-ing of underlying rock surfaces can be sub-stantial where forests are juxtaposeddownstream from extensive highland areassubject to the action of snow and glacial iceon exposed rock faces. Across the GuianaShield, few areas are located in such a way.Where upstream highlands are present,they consist largely of conglomerate sand-stones or silica-rich metamorphics (see‘Geology’, Chapter 2) rather than youngerformations with greater calcium and mag-
nesium concentrations. Thicker soil pro-files are typically associated with theseolder erosion bevels, creating additionalbarriers to autochthonous nutrient contri-butions to forest growth and maintenance.In some instances, significant rootingdepths combined with localized maficlithologies (e.g. dolerite intrusive) mightelevate contributions from in situ rockweathering of some minerals, such as mag-nesium (Brouwer, 1996). Generally speak-ing, however, this forms a nominal pathwayto import most mineral nutrients in theGuiana Shield (Fig. 7.4).
Fluvial deposition (allochthonousweathering)
Modest autochthonous weathering proba-bly characterizes most sedimentary depres-sions forming the bulk of the lowlandtropics, but the depth and extent of overly-ing sediments and soils would invariablymodulate the ability of forest plants to tapinto mineralization zones through deeproots prior to leaching. Far more important,however, is the arrival of these nutrients viafluvial deposition from distant weatheringsurfaces. Based on physico-chemical attrib-utes of draining waterways, this pathwayrepresents an insignificant route for bothimport and redistribution of most nutrientsacross the Guiana Shield (see ‘River, Lakeand Tidal Systems’, Chapter 2) (Fig. 7.4),particularly in comparison to other ramp-ing system regions of the neotropics con-nected to highland regions undergoingsignificant weathering of young lithologiesand tremendous site turnover through rela-tively high river migration rates (Kalliola etal., 1999).
Biological fixation
Import of nitrogen into tropical forestsoccurs mainly through fixation of di-nitro-gen by bacterial or mycorrhizal associates.This is believed to represent a mere 2–5%of the nitrogen available for uptake via
354 D.S. Hammond
internal recycling of organic matter, a levelcomparable to that deposited from atmos-pheric sources (Perreijn, 2002).Nonetheless, at the individual or foreststand level, it may be an important contrib-utor to the nitrogen economy. Many treespecies found in relatively high densitiesacross parts of the Guiana Shield have beenconfirmed as having rhizobial root nodules,including Chaemacrista spp., Dimorphandraspp., Inga spp., Pentaclethra macroloba,Clathrotropis spp., Diplotropis purpurea,Ormosia spp. and Swartzia spp. (Norris,1969; Raaimakers, 1995; Perreijn, 2002).Other dominants, including Mora spp.,Dicymbe spp., Eperua spp. and Vouacapouaspp., Chlorocardium rodiei, Catostemma fra-grans and Eschweilera sagotiana, have beenassociated with mycorrhizal, mainly arbus-cular but some ectotrophic, fungi(Moyersoen, 1993; Béreau and Garbaye,1994; Perreijn, 2002; T. Henkel, personalcommunication). Many of these taxa formboth rhizobial and mycorrhizal associa-tions.
Perreijn (2002) showed that bothimport of nitrogen via biological fixationand export via the main route of nitrogenloss from the system (denitrification) canvary considerably between forest types inthe Mabura Hill area. The type of mycor-rhizal associates formed, namely AM(arbuscular mycorrhizae) or ECM (ecto-mycorrhizae), and their association withrhizobia may also be linked to soil type(Moyersoen, 1993).
Long-term mineral emigration
The ratio of nutrient import to standing bio-mass in the Guiana Shield is likely to beone of the lowest in the world. With onlysmall quantities of nutrients to be gainedthrough atmospheric deposition, rockweathering, fluvial deposition and biologi-cal fixation, conservation through adeptinternal cycling appears the only plausiblemechanism sustaining standing forest bio-mass across most parts of the GuianaShield. The importance of this internal
cycling is likely to be greater in these foreststhan those on sites with greater exposure toautochthonous and/or allochthonous nutri-ent sources (Cuevas, 2001) as a conse-quence of geomorphography.
The fragility of the nutrient cycledepends on its ability to recover after majorlosses. In the case of systems acutelydependent on internal recycling, cata-strophic biomass loss will have a substan-tively greater impact on forest recoverytimes. Responses to these events acrossforested regions of the Guiana Shield arethus invariably more acute than in adjacentramping system regions, where recyclingefficiency is often offset by relatively activenutrient importation. Even putative smalland brief transitions associated with shift-ing cultivation are unlikely to recover topre-clearance biomass levels within a cen-tury in Venezuelan Amazonas (e.g.Saldarriaga, 1987). Repeated loss of all ormost of the standing biomass over a rela-tively brief period of time will eventu-ally lead to degraded woody plant commu-nities and grass-dominated savannas as anatural consequence of a system movingalong a dampening phase of the geomor-phic cycle.
A long-term process of mineral emigra-tion from the Guiana Shield to adjacentregions is taking place. Large or frequentfires extensively disrupt local nutrient recy-cling in the region and significant nutrientmigration occurs eastward through riverleachates and westward through wind-driven smoke as a consequence. Since the18th century, extraction of wood and non-wood products and subsequent export fromforests of the region have also contributedto significant nutrient emigration, particu-larly of mineral nutrients with few importsources, such as magnesium and calcium(see Chapter 9). As a consequence, periodiclarge-scale losses of sparse nutrients mayhave catalysed the dampening of ecosystemproductivity across the Guiana Shield andselected for species capable of achievinglarge growth gains using very small quanti-ties of nutrients (see Chapter 3, this volume;Raaimakers, 1995).
Forest Dynamics: Geomorphographic Control and Forest Change 355
Functional Consequences ofGeomorphographic Control
The way in which geomorphographydescribes a basket of inter-related systemattributes suggests a number of functionalconsequences linking productivity anddiversity of forest systems to underlyinggeology and geographic position.
Productivity
The consequences of energy state to forestchange is non-trivial. Long-term site stabil-ity and individual tree longevity areexpected to be, on average, relatively lowand stand turnover relatively high in ramp-ing systems. Yet, net ecosystem productiv-ity (NEP) is also expected to be relativelyhigher than in dampening systems. Thismay in part reflect the high import–exportfluxes that characterize ramping systemsover the long term. In effect, they are opensystems that continuously receive and losematerial, primarily through hydrological,but also atmospheric, transport. In contrast,dampening systems conform to the conven-tional view of tropical forests as closed sys-tems that rely principally on materialrecycling and nutrient conservation inorder to maintain productivity. Spatialanisotropies in nutrient flux effects drivenby geomorphographic controls across theneotropics complicate a picture of tropicalforests generally characterized at smallerspatial scales by a high rainfall–low nutri-ent–high productivity relationship (Huston,1994). Again, import flux and recyclingeffects co-occur, but fluxes should play amore important role in the long-term main-tenance of higher productivity levels thathave been shown to characterize rampingsystem regions. In contrast, dampening sys-tems such as the Guiana Shield are in astate of chronic nutrient decline as exportthrough leaching, fire and, more recently,human appropriation, far exceed importfrom weathering and atmospheric deposi-tion (see below). In fact, major lateral redis-tribution of nutrients in the Guiana Shieldmay arise principally through low-fre-
quency fire and at smaller continuousscales, through plant–animal relationships.
Scale of edaphic effects
Meaningful fractionation of soils in thewestern Amazon Basin based on theirchemical and physical attributes has oftenproven difficult over large areas of terrafirme forest (e.g. Duivenvoorden and Lips,1995). Geomorphographic controls wouldsuggest differences in edaphic patch sizedistribution among regions. In rampingregions, the effects of high-energy hydro-logical systems reworking thick sedimentsover a relatively recent geological timescaleshould work to decrease edaphic patch sizeover the long term. Conversely, theautochthonous processes dominatingedaphic change in dampening systemsexposed to a much longer history of geolog-ical change would lead to maintenance ofpatch sizes governed by geology rather thanhydrology. At smaller scales, the most dras-tic edaphic transitions in both regions are,however, governed primarily by water tabledynamics and position along the catenarather than nutrient availability (ter Steege,1993; ter Steege and Hammond, 2001). Thissmaller-scale hydrological, rather thanlarger-scale nutrient, gradient best discrim-inated differential mortality responses toENSO drought at a 50 ha scale on BarroColorado Island (Condit et al., 1996).
Disturbance and turnover
High NEP requires spare productive capac-ity (SPC). The route to high SPC depends onthe long-term stability of the system. Whereabiotic conditions are not limiting, varyingfrequency and amplitude of disturbance(after Huston, 1994) will trigger concomi-tant wave-like shifts in SPC. During inter-stitial phases characterized by modest (lowamplitude) disturbance, SPC will approachzero and variation in NEP will becomestrongly attached to the rate of turnover instanding biomass and how this varies inproportion to microbial activity. Hence,
356 D.S. Hammond

regions with high NEP could be: (i) in anon-equilibrium state, moving along alarger-scale response trajectory initiated bya disturbance phase or event of propor-tional amplitude that inflated SPC; or (ii) adynamic equilibrium state, responding to ahigh frequency–low amplitude regime ofdisturbance that creates continuous, low-level SPC, primarily through small-scalestand turnover. Neotropical forests arelikely a composite of both, but forest areasfollowing a non-equilibrium trajectory atany given time are hypothesized to accountfor a relatively larger proportion of rampingregions in comparison to those classified asdampening systems.
Attribute selection
If stand turnover rates are relatively high,this would place a premium on trees thatfunction as r, rather than K, strategists.Short-lived species with higher growth anddispersal rates and early reproductivematurity are known to benefit under a highturnover environment. In tropical forests,where the average tree longevities are con-siderably greater, the principal connectionbetween life-history and population attrib-utes has to be viewed at longer timescales.One proximate measure of longer-termcompositional responses to differences inforest change regimes is the relative fre-quency, and thus success, conferred upontaxa by their life-history attributes.
Small seed size in tropical forests isgenerally associated with greater dispersaldistances after accounting for plant sizeeffects. This is achieved largely as a trade-off against early low-light survivorshipnearer to parent trees. Other selective forcesthat enhance survivorship (e.g. ingestion,burial, chemical defence) can also exertpressure on seed size. But the main effectrests with the probability of achieving thecritical level of cohort survivorship neededto stabilize or expand a species populationand whether this is greater: (i) whenencountering elevated light levels or escap-ing distance-dependent predation throughenhanced dispersal; or (ii) through longer
post-germination residence times in low-light environments nearer to parent trees. Inthis general case, elevated turnover shouldconfer a comparative advantage to small-seeded individuals over the long term, ashighly clumped, large-seeded populationsare more susceptible to extinction in theface of externally driven disturbance. Thisoutcome would be consistent with a systemdriven at larger scales by density-independ-ent effects (after Huston, 1994), such as cat-astrophic geological or climatic events.These clearly figure more prominently inthe history of ramping systems, such aswestern Amazonia and Central America incomparison to the Guiana Shield.
Phylogenetic inertia
If higher forest turnover rates result inasymmetric survivorship of smaller seeds,then contribution of novel alleles amongsmall-seeded cohorts will over time exceedthose of larger seeded taxa that are moresusceptible to local extinction and declin-ing genetic diversity as a consequence oflimited dispersal. Consequently, it is plau-sible that smaller-seeded taxa will diversifyat rates that outstrip extinction and accountfor an increasing fraction of the standingdiversity in ramping as opposed to damp-ening systems. Taxa that benefit from ordepend upon chronic, widespread distur-bance should generally occur more fre-quently in ramping system environmentsbecause opportunities for population per-sistence are greater.
Phylogeographic responses
Ramping systems are more recent land-scapes borne along active tectonic platemargins. Prior to uplifting, many of thesewere dominated by shallow marine or epi-continental environments and offered rela-tively little, if any, area for terrestrialspecies to accumulate and evolve.Angiosperm evolution clearly pre-datescommencement of the Andean orogeny(about 20 Ma BP) and uplift of the
Forest Dynamics: Geomorphographic Control and Forest Change 357

Panamanian land-bridge (14–18 Ma BP) byas much as 120 million years and consider-able diversification is believed to havealready led to the presence of most commonneotropical plant families by the Eocene,approximately 20 Ma prior to the dias-trophic upheaval that would reshape theregion (Friis et al., 1987; Romero, 1993).The recent shaping of ramping systemregions intuitively suggests that thesewould support fewer archaic lineages andthat their forests should be dominated byderived, rather than ancestral, clades,unless alternating periods of regional forestextinction have led to significant phylogeo-graphic reversals.
Biological Consequences of Life inRamping and Dampening Systems
Seed size
Few comparisons of community seed sizedistributions between neotropical siteshave been made, the early work of Fosterand Janson (1985) being a leading excep-tion. General comparisons made byHammond and Brown (1995) using seedsize sets from Foster and Janson’s westernAmazon site (Manu, Peru), Foster’sPanamanian site (Barro Colorado Island –BCI) (Foster, 1982) and their own site inGuyana (Mabura Hill) illustrated the highrelative occurrence of large-seeded speciesin central Guyana relative to the other twosites. Based on forest compositional andseed size data, large-seededness appears tobe a typical trait of forests acrossVenezuelan Guayana, Guyana, Surinameand French Guiana. Ter Steege andHammond (2001) later showed that seedsize weighted by relative stem density inclustered 0.1 ha plots enumerated acrossGuyana declined southward from a peaknear the central part of the country. Thiscline was broadly associated with anincrease in tree alpha-diversity and certaindispersal syndromes. Seed size, while com-monly implicated as one of many factorsregulating plant–animal relationships, hadrarely been implicated directly as a factor
influencing patterns of standing plantdiversity in the tropics. This is despite thefact that the consequences of seed size toindividual survivorship and fitness havebeen broadly demonstrated for quite sometime (Harper et al., 1970; Baker, 1972;Salisbury, 1974), albeit only more recentlyin relation to long-lived tropical woodyplants (Foster, 1986). This paucity of atten-tion combined with the noticeable absenceof mechanistic explanations for describedgeographic variation in woody plant diver-sity within the tropical belt underscores thepotential significance of seed size as oneimportant determinant of long-term successof long-lived woody plants under varyingmacro-environmental conditions.
Dispersal, survivorship and growth plasticity
One logical role of seed size rests with twoprocesses that it clearly regulates, dispersaldistance and early survivorship. Largerseeds generally confer an early survivor-ship advantage in limiting environments.This advantage has been shown to be con-siderable for species with super-sized seeds(see Chapter 3) (e.g. Foster, 1986; Boot,1996; Dalling et al., 1997; Zagt, 1997;Hammond and Brown, 1998; Hammond etal., 1999; Rose, 2000). These species typi-cally fall within the upper 90th percentileof a community’s seed-size distribution(Hammond and Brown, 1995). Tree specieswith super-sized seeds also appear to sufferdisproportionately low mortality duringearly recruitment stages (i.e. smaller sizeclasses). Prioria copaifera (Fig. 26.4 inHubbell and Foster, 1990), Chlorocardiumrodiei and Dicymbe altsonii (Zagt, 1997, pp.188, 197) are good examples.2
Very high per capita survivorship oflarge-seeded tropical species also appearsto exact a trade-off with growth-rate plasti-city during early recruitment phases (seeChapter 3) (Boot, 1996; Rose, 2000), whichis consistent with much broader trendsbetween large-seededness and relativegrowth rate (via specific leaf area) (Lambersand Poorter, 1992; Westoby et al., 1997).Smaller-seeded tropical tree species, onaverage, express more plastic growth
358 D.S. Hammond

responses to increases in resource availabil-ity, but fail to maintain positive carbon bal-ances under scarce resource conditions thatare typically tolerated by many larger-seeded tree species. These distinctions,however, appear largely restricted tocanopy trees. Many understorey specialistsappear capable of tolerating low light levelsbut also have much smaller seed sizes.Adult plant size in this instance consis-tently explains a significant part of the dif-ference across a wide range of taxa andhabitats (Hammond and Brown, 1995;Leishman et al., 1995), underlining theimportance of segregating growth strategiesagainst growth objectives.
Generally speaking, unparalleled sur-vivorship of large-seeded juveniles comesat the cost of wider dispersability and lowerachievable growth rates. Large-seededspecies, in the absence of targeted move-ment by humans or water, are lousy trav-ellers and the expected outcome of thissluggish state is a hyper-clumped distribu-tion of reproductive adults borne from verylow per capita mortality rates. In fact, mosttropical trees show a clumped distribution(Hubbell, 1979), but most very large-seededtree populations are distributed this wayprincipally through dispersal limitation,rather than the combination of dispersaland suitable site availability, as is the casewith smaller-seeded pioneers or narrowedaphic specialists. The scale and ubiquityof large-seeded hyper-clumping across theGuiana Shield is reflected in the very highrelative abundances of these speciesrecorded through small-scale plot sampling(e.g. Davis and Richards, 1933; Fanshawe,1952; Schulz, 1960; Ogden, 1966; Maas,1971; Bariteau, 1992; ter Steege et al., 1993;Comiskey et al., 1994; Coomes and Grubb,1996; Dezzeo and Briceño, 1997; Ek, 1997;Salas et al., 1997; ter Steege, 2000; vanAndel, 2000) and the transition from oneoligarchy to another seen through forestinventories carried out at larger landscapescales across Venezuela, Guyana, Surinameand French Guiana (Hughes, 1946; Rollet,1969; de Milde and de Groot, 1970; Welchand Bell, 1971; de Milde and Inglis, 1974;ter Steege, 2000).
Seed size vs. stand evenness
Terra firme trees with large seeds may dom-inate most stands across the Guiana Shield,but this phenomenon dissipates somewhatin the central Amazon, declining further atsites located along the eastern Andeanpiedmont and foredeep and in many partsof wet tropical Central America, such asBCI, Panama. In these regions, evenness istypically greater and, on average, character-ized by species with smaller seeds. Not allsites within the Guiana Shield are necessar-ily composed of large numbers of large-seeded species (Maas, 1971; Thompson etal., 1992), nor have all sampled areas out-side the shield region proven substantiallymore even in the abundance of canopyspecies (e.g. Pentaclethra dominance at LaSelva – Hartshorn and Hammel, 1994).Where these occur, average seed size con-tinues to shift with changing evenness. Infact, it is difficult to find a measuredneotropical forest that is dominated by oneor several small-seeded species to the sameextent as that found associated with super-sized species.
Together, these plots show a consistentrelationship between the number of speciesneeded to account for half of the total plotstem count and the average of these species’seed size weighted by their respective rela-tive abundances in the plot. A power func-tion links the two (Fig. 7.5).3 Thisrelationship, if proven stable over a widerrange of plot data, would suggest a powerlaw describing the effects of seed size onspecies relative success, as measured by itsrelative abundance.
Fitted data suggest that a seed size-dominance effect is not perfectly segregatedby geomorphographic region. But even so,why would some regions, such as theGuiana Shield, tend to have a larger portionof their forest cover, which tends to be char-acterized by lower alpha diversity (terSteege et al., 2000), dominated by relativelylarge-seeded species? And why would therenecessarily be a link between seed size andthe degree of local success certain tree taxaachieved relative to other sympatrics? Toget at the heart of this role, we have to go
Forest Dynamics: Geomorphographic Control and Forest Change 359

back to basic concepts of population growthand the consequences of changes in repro-ductive output, early survivorship rates andtheir relationship with landscape-scaleenvironmental stability.
When is it good to be big?
Generally, large-seeded offspring travel rel-atively short distances, survive more fre-quently and longer, but also grow moreslowly. They generally tolerate biologicalattack better (Janzen, 1969; Dalling et al.,1997; Hammond and Brown, 1998), but arealso more frequently attacked, sometimesas a consequence of their poor dispersaland the effects of this as part of distanceand density-dependent relationships withtheir main predators (Janzen, 1969;Hammond and Brown, 1998).
Environmental stability at small, eco-logical scales in wet tropical forestlands is
generally characterized by relatively lowrates of canopy turnover and long-termedaphic continuity. Forest gap dynamicsare well explored as the leading mechanismresponsible for driving local populationrecruitment and species diversity (e.g.Grubb, 1977; Orians, 1982) and have beenvariously implicated in a wide range of eco-logical phenomena believed to impartselective (short-term) advantages to specieswith contrasting recruitment and life-his-tory attributes (e.g. Denslow, 1980; Schuppet al., 1989).
But early perceptions of disturbance inecology were in many ways driven by therelatively small range and scale of tropicalfield study. This was despite the well-documented record of cyclonic effects inthe Caribbean and Australasian domains(Webb, 1958; Wadsworth, 1959; Whitmore,1974) and the increasing assortment of evi-dence supporting a more prominent role for
360 D.S. Hammond
1
10
100
1000
0.01 0.1 1 10
S5
0
Fig. 7.5. Empirical relationship between the number of species accounting for half of all stems >10 cmdbh recorded in plots (S50) and the weighted average seed mass of those species. Weighting based onrelative abundance of stems. Relative abundance data: Davis and Richards (1933); Maas (1971); Comiskeyet al. (1994); Hartshorn and Hammel (1994); Valencia et al. (1994); Dezzeo and Briceño (1997); Ek(1997); Ferreira and Rankin-de-Merona (1998); van Andel (2000). Seed mass data: Foster (1982); Fosterand Janson (1985); Hammond and Brown (1995); D. Hammond (unpublished data). Seed mass wasassigned based on volume-mass or intra-generic relationships where direct seed mass values were notavailable. Mass was assigned as minimum of quarter logarithmic intervals to reduce error effects.
Mean seed size (g dry wt weighted by relative abundance)
larger-scale disturbance mechanisms,including prehistoric human occupation(see Chapter 8), in characterizing the extentof environmental stability across some low-land forests (Garwood et al., 1979;Saldarriaga and West, 1986; Salo et al.,1986; Nelson et al., 1994).
Large-seeded species disperse poorly,and in environments susceptible to theselarger-scale disturbances they are more sus-ceptible to extinction. Other adaptations(e.g. greater adult resistance to drought, fire,wind and pestilence) may offset some ofthis risk. But poor dispersal and the conse-quent increase in adult aggregation meanthat, over time, compacted meta-popula-tions of large-seeded taxa become moreprone to changes in environmental stabilityacross their range with little capacity torecolonize widely or quickly. High off-spring survivorship around remnant adultclusters and/or vegetative regrowth canmaintain the presence of these species, butthe slow progression to dominance is ineffect reset. Relatively high-frequencyand/or large-scale disturbances can perma-nently reduce the representation of thesetaxa as fewer and fewer clusters remain andmore agile taxa occupy canopy space.
Under high-frequency, but relativelysmall-scale disturbance regimes, large-seeded taxa will consistently be out-com-peted by smaller-seeded, more mobilespecies in the high light conditions gener-ally attached to higher disturbance rates.Alternatively, low-frequency, but large-scale events precipitate the likelihood ofcatastrophic population loss due to hyper-aggregation of adults and a limited capacityto recolonize large disturbance patches.More reproductive adults, and thus repro-ductive output, are lost per unit area asaggregation increases under these circum-stances. Ultimately, in this scenario large-seeded populations will dwindle in relativeabundance until disturbance effects dissi-pate. During these relatively stable periods,population aggregates of large-seeded iso-lates can reconstitute and eventually beginto expand as a consequence of their highper capita survivorship and the advantagethis brings during relatively stable environ-
mental phases. In-breeding depression, lowheterozygosity and high inter-patch vari-ability should be detected in these isolatesas sibling outcrossing rates bottleneck geneflow relative to more broadly dispersed, butlocally rare, species.
Hence, if relatively stable environ-ments persist in some regions much longerthan others, the relative abundance of large-seeded upland taxa should increase insmall sample plots as the aggregates expandacross the full, tolerated edaphic contin-uum. In some instances, adaptations to jux-taposed edaphic conditions may createfurther opportunities for expansion oflarge-seeded dominance (e.g. Mora spp.; terSteege, 1993) when the distinction betweenthese facies remains relatively stable as aconsequence of slow weathering rates andinfrequent allochthonous influence on localsubstrate development. In regions experi-encing more extensive and frequent sub-strate turnover due to mass wasting throughlandslips, erosion–deposition dynamics ofriver movement and flash-flooding events,opportunities for large-seeded, dicotyledo-nous trees to maintain and expand theirecological hegemony over forest communi-ties would be curtailed and more broadlydistributed, smaller-seeded species are pre-dicted to increase in relative abundance asthe comparative advantage of faster growthand greater mobility supersede those ofhigh juvenile survival rates.
Large-seeded hegemonies of the GuianaShield
Thus, large-seeded taxa can only proliferateand achieve relatively high local abun-dances over larger areas under relativelystable forest environments. While theyexhibit elevated per capita survivorshipunder resource-limited environments rela-tive to small-seeded species with compara-ble life-history objectives (canopy position,sexual reproduction), this advantage is lostwhen resources become less limiting andlarge-scale site stability decreases overlonger timescales.
The predominant scale, or scalar range,of events affecting environmental stability
Forest Dynamics: Geomorphographic Control and Forest Change 361

contrasts considerably based on varyinggeomorphographic control effects. If theselarge-scale, regional differences play a sig-nificant role in determining the success oflarge-seeded species, then relative abun-dance and species turnover should be highin ramping relative to dampening systems.Across the Guiana Shield, turnover (or betadiversity) can be quite high across a land-scape largely driven by long-standingautochthonous soil formation processesatop Proterozoic rock remnants. Fan-shawe’s (1952) system of forest associa-tions–fasciations for Guyana intuitivelymirrors this transition between hyper-clumped distributions of edaphically segre-gated, and dispersal-limited, large-seededspecies. Across the western Amazon low-lands, relatively recent allochthonous soilformation atop Quaternary sedimentarycover dominates. Here, the environment ischanging more rapidly and relative resi-dence time for substrate in any given areais, on average, lower (see ‘River, Lake andTidal Systems’, Chapter 2). The patchinessthat evolves in these regions is less pro-nounced than that seen on much olderlandscapes. The relatively low speciesturnover inferred through comparisons ofplots across the western lowland landscapewould be consistent with this longer-terminfluence (Condit et al., 2002). The associa-tion between dominance and large-seeded-ness and the relative frequency of theselocations in the Guiana Shield would sup-port a view of regional contrasts in site sta-bility. If the incorporation of further dataupholds the relationship and the most com-mon species from plots in ramping anddampening regions cluster along the log andlag phases, respectively, this would suggestthat species geographic ranges increase withhigher regional site turnover rates.
Wood density
Another functional attribute that holdsprospect as a surrogate for long-term selec-tion under varying levels of environmentalstability is wood density. Wood densitydescribes a weight–volume relationship of
lignin–cellulose under varying moisturecontent. Standardizing density measure-ments at a constant moisture content (12%is commonly employed) improves the com-parison between individuals, species andacross regions with varying moistureregimes. Growth in trees largely occursthrough accrual of lignin–cellulose, so aloose relationship between measured aver-age annual growth rates and wood densities(Brown and Lugo, 1990; ter Steege andHammond, 2001) is not entirely unex-pected. Arguably, the more pivotal questionin regard to tropical forest spread and per-sistence rests in identifying the main pres-sures affecting wood density variation and,like seed size, its rise or decline at commu-nity scales.
Tropical hardwoods exhibit a broaderrange of wood densities than any other for-est biome. Both the lightest and densestwoods measured are known from tropicalforest species (Williamson, 1984). Withinthis range, tree species in the Guiana Shieldachieve, on average, the highest wood den-sities in the world (Fig. 7.6). The regionmay ultimately prove to be one of severalareas with high spatial averages for wooddensity, but timber trees from the easternBrazilian Amazon have been noted as hav-ing elevated wood densities relative toother regions (Whitmore and da Silva,1990). This is not to say that species of lowdensity do not occur, but rather heavy-hardwood taxa, and the relative abundanceof these taxa, are elevated across the regionrelative to other areas. Light-wooded taxa(<0.5 g/cm3) are widely distributed acrossthe Guiana Shield (e.g. Apeiba, Ceiba,Cedrela, Jacaranda, Parkia, Schefflera,Trattinickia) and interestingly, are typifiedas pioneer or gap specialists with verysmall seed sizes. But why, like seed size,would tree species across the Guiana Shieldtend to have higher wood densities, onaverage, than other tropical regions?
High wood density is believed todevelop as a response to environmentallimitations placed on growth through lowlight and/or low moisture availability(Howe, 1974; Zobel and van Buijtenen,1989). Several studies within and between
362 D.S. Hammond

species suggest that tropical wood densityincreases in drier tropical forest conditions(Howe, 1974; Chudnoff, 1976; Wiemannand Williamson, 1989b; Gonzalez andFisher, 1998). In a study of balsa (Ochromapyramidale), arguably the least denseneotropical timber tree, Whitmore (1973)concluded that wood density decreased inCosta Rican life zones with shorter dry sea-sons.
However, sensitivity to environmentalconditions is also modulated by inherent,or phylogenetic, constraints on growthplasticity. Different species under the sameor very similar growth conditions havebeen shown to often have considerably dif-ferent growth responses, limiting the rangeof measured growth rates (see Chapter 3)and, inter alia, wood densities. The averagewood densities for SE Asian and GuianaShield forests, for example, may reflect the
high relative abundance of dipterocarpsand caesalpinoid legumes, respectively.The question is whether wood densities,and other life-history attributes, differamong these tropical forest regions throughthe selective advantages they have pro-vided in the face of different regional envir-onmental histories or simply radiated as theresult of periods of local isolation createdthrough these histories (Whitmore andPrance, 1987).
At landscape scales, low light and lowmoisture effects are inversely related, sinceclosed canopies that create low-light under-storey conditions are less likely to be main-tained in low moisture environments. Theeffects on wood density, however, couldprove similar in both open-canopy forestsexposed to chronic moisture deficits andclosed-canopy forests exposed (in the sub-canopy) to chronic light competition. In
Forest Dynamics: Geomorphographic Control and Forest Change 363
Fig. 7.6. Mean (± SE) wood density at 12% moisture content for species from the Guiana Shield and otherneotropical regions. Values for West African, SE Asian and temperate hardwood species are also presentedas a broader comparison. Values above SE bar are the number of species used to calculate mean. Speciesvalues based on one to six published sources. Data sources: Williams (1939); Record and Hess (1943);Suriname Forest Service (1955); van der Slooten and Martinez (1959); Longwood (1962); Hoheisel andKarstedt (1967); Hoheisel (1968); Mullins and McKnight (1981); Lavers (1983); CIRAD/CTFT (1989);INPA/CPPF (1991); Soerianegara and Lemmens (1993); Gerard et al. (1996); Brown (1997).
C.
Am
eric
a
Car
ibbe
an
W.
Am
azon
W.
Afr
ica
Tem
pera
te
SE
Asi
a
0.75
0.7
0.65
0.6
0.55
0.5
Woo
d de
nsity
(@
12%
M C
)
293
50 57
525
43
30
100
Gui
ana
Shi
eld

closed canopy forests that are also periodi-cally exposed to severe moisture deficits,taxa with much slower growth rates andmetabolic demands would achieve a pre-mium in relatively dark, but periodicallydry, conditions. In forests such as those ofthe Guiana Shield, where environmentalstability is relatively high, but significantseasonal and inter-annual drought phasesoccur (see Chapter 2), slow growth wouldappear advantageous. The advantage to taxaexhibiting lower growth rates in the face oflow light and moisture must come throughsurvivorship, since their poor carbonaccrual will ultimately make them loserswhere faster-growing species achieve simi-lar recruitment rates.
Radial gradients in specific gravity (acorrelate of wood density) provide someindication of the contrast in growth histo-ries in relation to varying climates. Very lit-tle, if any, data on radial wood densitygradients from species in the Guiana Shield
were known to the author. However, exam-ining radial gradients measured for long-lived hardwood species in various forestlife zones in Costa Rica (Wiemann andWilliamson, 1988, 1989a, 1989b) can helpto circumstantiate growth-history patternsof Guiana Shield species that have beenexplored from a physiological perspective(see Chapter 3). Wieman and Williamson’sassessment of the pith to bark changes inspecific gravity for tree species growing inthree tropical life zones illustrates how spe-cific gravity of less dense species, particu-larly in lowland wet forests, shows greaterincreases in density as they get older. Asinitial specific-gravity increases, the changein density later in life approaches zero (Fig.7.7). Dry forest trees appear to approachzero at lower densities than wet or montanespecies, logically as a consequence ofgreater moisture stress. Measured specificgravities of most dominant tree taxa in theGuiana Shield (Chrysobalanaceae: mean =
364 D.S. Hammond
Fig. 7.7. Inner and outer specific gravity values for a range of Costa Rican lowland wet, tropical dry andmontane forest tree species adapted from Wiemann and Williamson (1989a,b). Linear least-squaresregression lines fitted to each life zone set. Diagonal line represents no radial change in specific gravity fordifferent density values. Points above this line show an increase in density with age, those below adecrease.
Specific gravity – Inner 3 cm
Spe
cific
gra
vity
– O
uter
3 c
m

0.82 (n=14); Lecythidaceae: mean = 0.7(18); Caesalpiniaceae: mean = 0.74 (n=23))are invariably at the upper end of the CostaRican scale, tentatively suggesting very lit-tle increase or a decrease in wood densityover their growth histories, but this needsto be tested.
When is it good to be dense?
The differences in wood densities betweenthe Guiana Shield and other neotropicalregions thus may be attributed to a numberof divergent attributes of these forests.First, differences may simply be due to poorsampling of pith to bark gradients in wooddensity. If species in other forests are grow-ing more slowly later in life and many com-mon Guiana Shield species show relativelyconstant variation in wood density, due inpart to more modest changes in growthrates (e.g. Zagt, 1997), then the way inwhich samples are taken could account formuch of the difference between regionalgroupings. Secondly, patterns in radialwood density from Costa Rica and averagewood densities from the various neotropi-cal regions suggest that moisture may bemore limiting than light in achieving higherwood densities. If so, then forests acrossmany parts of the Guiana Shield would bemost impacted by this effect. Work bySchulz (1960, Fig. 68) supports the viewthat anomalous amplification of dry-seasonconditions can lead to substantial decreasesin growth rates, at least for some commontrees in Suriname. The susceptibility of theGuiana Shield region to ENSO-induced pre-cipitation anomalies and the relativelymodest drought response associated withthis signal in Costa Rica and westernAmazon (see ‘Climate’, Chapter 2) couldselect for higher wood density either as aconsequence of selection for lower meta-bolic cost requirements (low growth rates)or some other structural or resistanceadvantage. Thirdly, the greater mechanicalinvestment that higher wood densities rep-resent would only be advantageous toreproductive adult individuals withextended longevities. In forest regions morefrequently disturbed, the advantage of
investment would yield less return in termsof reproductive effort, particularly as seedcrop-size decreases with increasing seedsize. Saldarriaga (1987, Fig. 3.3) showedthat average tree wood density (specificgravity) certainly remains significantlylower in areas up to 80 years after shiftingcultivation relative to ‘mature’ forest inVenezuelan Amazonas, although overalldensities remained comparatively high(consistent with Fig. 7.6). Ramping systemswith higher site turnover rates should havemore canopy trees with lower wood densi-ties, holding moisture and light availabilityconstant. Together, closed canopy, periodicdrought and low site turnover mutuallyreinforce selection for higher wood densi-ties across many forested regions of theGuiana Shield.
Phylogenetic position
During the earliest period of angiospermevolution, most of the modern-day neo-tropical forestlands were believed to be epi-continental. That is, they were covered by ashallow marine environment. Considerablegeological evidence supports this view(Harrington, 1962). In fact, many of the fos-sil hydrocarbon deposits currently beingtapped across the sedimentary lowlands ofVenezuela, Colombia, Brazil and Ecuadorare formed in part from organic materials ofshield origin deposited during this period(e.g. Ramón et al., 2001).
This presents a rather simplistic viewof a more complex palaeogeographic land-scape, but also highlights the rational link-age between the incidence of tree speciesoccupying basal positions among tropicalangiosperm phylogenies and the occur-rence of Precambrian geologies.Precambrian regions have a longer terres-trial legacy and thus have been capable ofsupporting evolution of arboreal plantsover a much longer period.
This should not conjure up a view ofuniform antiquity across the Guiana Shieldspecifically and Precambrian regions ingeneral. Significant biogeographic changeshave invariably led to considerable
Forest Dynamics: Geomorphographic Control and Forest Change 365
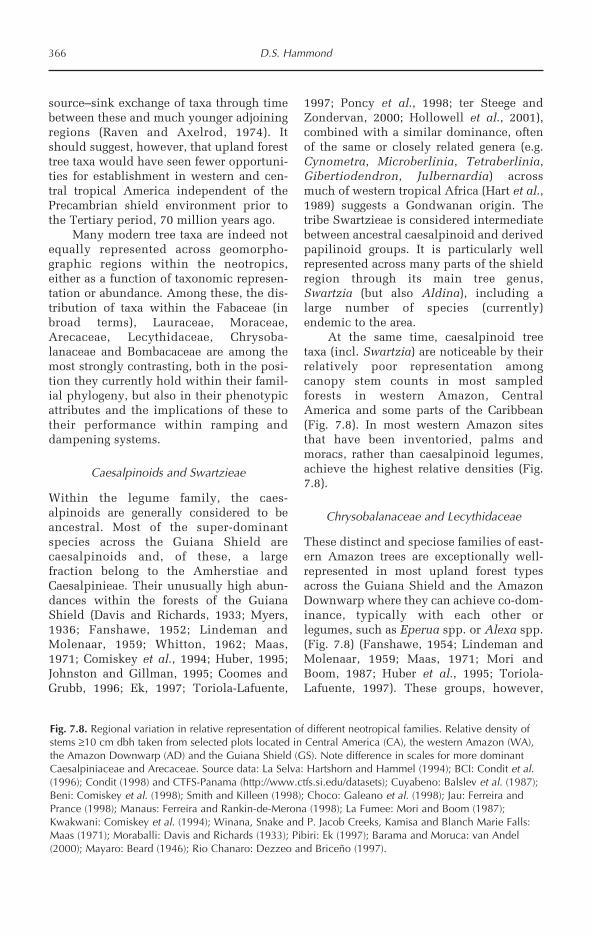
source–sink exchange of taxa through timebetween these and much younger adjoiningregions (Raven and Axelrod, 1974). Itshould suggest, however, that upland foresttree taxa would have seen fewer opportuni-ties for establishment in western and cen-tral tropical America independent of thePrecambrian shield environment prior tothe Tertiary period, 70 million years ago.
Many modern tree taxa are indeed notequally represented across geomorpho-graphic regions within the neotropics,either as a function of taxonomic represen-tation or abundance. Among these, the dis-tribution of taxa within the Fabaceae (inbroad terms), Lauraceae, Moraceae,Arecaceae, Lecythidaceae, Chrysoba-lanaceae and Bombacaceae are among themost strongly contrasting, both in the posi-tion they currently hold within their famil-ial phylogeny, but also in their phenotypicattributes and the implications of these totheir performance within ramping anddampening systems.
Caesalpinoids and Swartzieae
Within the legume family, the caes-alpinoids are generally considered to beancestral. Most of the super-dominantspecies across the Guiana Shield arecaesalpinoids and, of these, a largefraction belong to the Amherstiae andCaesalpinieae. Their unusually high abun-dances within the forests of the GuianaShield (Davis and Richards, 1933; Myers,1936; Fanshawe, 1952; Lindeman andMolenaar, 1959; Whitton, 1962; Maas,1971; Comiskey et al., 1994; Huber, 1995;Johnston and Gillman, 1995; Coomes andGrubb, 1996; Ek, 1997; Toriola-Lafuente,
1997; Poncy et al., 1998; ter Steege andZondervan, 2000; Hollowell et al., 2001),combined with a similar dominance, oftenof the same or closely related genera (e.g.Cynometra, Microberlinia, Tetraberlinia,Gibertiodendron, Julbernardia) acrossmuch of western tropical Africa (Hart et al.,1989) suggests a Gondwanan origin. Thetribe Swartzieae is considered intermediatebetween ancestral caesalpinoid and derivedpapilinoid groups. It is particularly wellrepresented across many parts of the shieldregion through its main tree genus,Swartzia (but also Aldina), including alarge number of species (currently)endemic to the area.
At the same time, caesalpinoid treetaxa (incl. Swartzia) are noticeable by theirrelatively poor representation amongcanopy stem counts in most sampledforests in western Amazon, CentralAmerica and some parts of the Caribbean(Fig. 7.8). In most western Amazon sitesthat have been inventoried, palms andmoracs, rather than caesalpinoid legumes,achieve the highest relative densities (Fig.7.8).
Chrysobalanaceae and Lecythidaceae
These distinct and speciose families of east-ern Amazon trees are exceptionally well-represented in most upland forest typesacross the Guiana Shield and the AmazonDownwarp where they can achieve co-dom-inance, typically with each other orlegumes, such as Eperua spp. or Alexa spp.(Fig. 7.8) (Fanshawe, 1954; Lindeman andMolenaar, 1959; Maas, 1971; Mori andBoom, 1987; Huber et al., 1995; Toriola-Lafuente, 1997). These groups, however,
366 D.S. Hammond
Fig. 7.8. Regional variation in relative representation of different neotropical families. Relative density ofstems ≥10 cm dbh taken from selected plots located in Central America (CA), the western Amazon (WA),the Amazon Downwarp (AD) and the Guiana Shield (GS). Note difference in scales for more dominantCaesalpiniaceae and Arecaceae. Source data: La Selva: Hartshorn and Hammel (1994); BCI: Condit et al.(1996); Condit (1998) and CTFS-Panama (http://www.ctfs.si.edu/datasets); Cuyabeno: Balslev et al. (1987);Beni: Comiskey et al. (1998); Smith and Killeen (1998); Choco: Galeano et al. (1998); Jau: Ferreira andPrance (1998); Manaus: Ferreira and Rankin-de-Merona (1998); La Fumee: Mori and Boom (1987);Kwakwani: Comiskey et al. (1994); Winana, Snake and P. Jacob Creeks, Kamisa and Blanch Marie Falls:Maas (1971); Moraballi: Davis and Richards (1933); Pibiri: Ek (1997); Barama and Moruca: van Andel(2000); Mayaro: Beard (1946); Rio Chanaro: Dezzeo and Briceño (1997).

Forest Dynamics: Geomorphographic Control and Forest Change 367
La S
elva
La S
elva
La S
elva
BC
IC
uyab
eno,
Ecu
ador
Ben
i, B
oliv
iaB
eni,
Bol
ivia
Ben
i, B
oliv
iaB
eni,
Bol
ivia
Ben
i, B
oliv
iaC
hoco
, C
olom
bia
Jau,
Bra
zil
Jau,
Bra
zil
Jau,
Bra
zil
Jau,
Bra
zil
Man
aus
La F
umee
, F
. G
uian
aK
wak
wan
i, G
uyan
aK
wak
wan
i, G
uyan
aW
inan
a C
k, S
urni
nam
eW
inan
a C
k, S
urni
nam
eS
nake
Ck,
Sur
inam
eP
. Ja
cob
Ck,
Sur
inam
eK
amis
a, S
urin
ame
Bla
nch
Mar
ie,
Sur
inam
eM
orab
alli,
Guy
ana
Mor
abal
li, G
uyan
aM
orab
alli,
Guy
ana
Mor
abal
li, G
uyan
aM
orab
alli,
Guy
ana
Pib
iri,
Guy
ana
Bar
ama,
Guy
ana
Bar
ama,
Guy
ana
Bar
ama,
Guy
ana
Mor
uca,
Guy
ana
Mor
uca,
Guy
ana
May
aro,
Trin
idad
May
aro,
Trin
idad
Rio
Cha
naro
, V
enez
uela
Rio
Cha
naro
, V
enez
uela
Rio
Cha
naro
, V
enez
uela
Rel
ativ
e de
nsity
(%
tot
al s
tem
s)R
elat
ive
dens
ity (
% t
otal
ste
ms)
Rel
ativ
e de
nsity
(%
tot
al s
tem
s)R
elat
ive
dens
ity (
% t
otal
ste
ms)
Rel
ativ
e de
nsity
(%
tot
al s
tem
s)R
elat
ive
dens
ity (
% t
otal
ste
ms)
Moraceae
Arecaceae
Lauraceae
Lecythidaceae
Caesaphilaceae
Chrysobalanaceae
GS (incl. TrinidadADWACA
are strikingly rare across most of the west-ern Amazon and Central America (Fig. 7.8).
Both Chrysobalanaceae and Lecythid-aceae (in the strict sense) are not knownfrom fossil records prior to the Oligocene,38 to 25 Ma BP, suggesting that these groupsradiated after, and in part as a consequenceof, significant separation between SouthAmerica and Africa (Romero, 1993) overthe Palaeogene. The widespread distribu-tion of closely related taxa across the trop-ics, however, indicates that ancestral lineswere in place before dispersal amongregions was extinguished (Raven andAxelrod, 1974). The Gondwanan associa-tion of these species, combined with wide-spread fruit morphologies among canopytree taxa, suggesting relatively sluggish dis-persal, may have limited colonization of thewestern Amazon and Central America dur-ing early periods of forest formation acrossthese ramping systems.
Lauraceae
The Lauraceae is a widespread tropicalfamily with considerable taxonomic repre-sentation across the neotropics (Fig. 7.8). Itis also one of the most phylogeneticallybasal tropical tree families, along with oth-ers included in the subclass Magnoliidae(Takhtajan, 1997). Greenheart (C. rodiei)and determa (Sextonia rubra), two verycommon tree species endemic to theGuianas, however, are believed to fall out-side these three recognized tribes of theLauraceae, based on morphological andmolecular evidence (Chanderballi et al.,2001). The substantial phylogenetic analy-ses of the tropical Lauraceae undertaken byChanderballi et al. (2001) clearly show acomplex formed by Chlorocardium,Sextonia, Mezilaurus and the monotypicAnaueria occupying the most basal posi-tion with the constructed lauraceous phy-logeny. The authors view this complex as aGondwanan relict. The ancestral position ofthe Guiana Shield dominants within thephylogeny of the Lauraceae is only paral-leled by the far less dominating presence ofChlorocardium venenosum across parts ofColombia, Ecuador and Peru, Mezilaurus
spp. across the Guiana Shield, Colombia,Peru and Bolivia, and the monotypicAnaueria genus in Brazil and Peru (Rohweret al., 1991; van der Werff, 1991).
Moraceae
Moraceae (s.l.) includes a group of pan-tropical taxa that are well-represented inthe fossil record as early as the LateCretaceous, prior to the break-up ofGondwana (Romero, 1993). Striking amongthe biogeographic patterns attached to thisgroup across the neotropics is the wide-spread occurrence of Poulsenia armata andPseudomeldia spp. throughout westernAmazon (Balslev et al., 1987; Foster, 1990a;Gullison et al., 1996; Smith and Killeen,1998) and Central America (Hubbell andFoster, 1990), where they achieve signifi-cant relative densities, often as consociatesof Iriartea deltoidea, Jessenia spp. or otherarborescent palm species (Fig. 7.8). Bothgenera occur throughout the Guiana Shield(Boggan et al., 1998), but rarely achieve thedensities and frequencies found across othergeomorphographic regions. Commonly rec-ognized pioneers, such as Ficus andCecropia, contribute significantly to flood-plain forests along upper Amazon tributar-ies (e.g. Foster, 1990b), but are noticeablyabsent from many seasonally or superannu-ally inundated river edges in the GuianaShield (Davis and Richards, 1933; Johnstonand Gillman, 1995; Aymard et al., 1998;van Andel, 2000). Two other genera,Pourouma and Coussapoa do not appear tocontribute significantly to these differencesand are typically rare throughout mostlonger-standing forests. Nonetheless,Moraceae are one of several ‘oligarchic’groups exhibiting widespread local abun-dance across forests of the sub-Andeantrough (Pitman et al., 2001).
Arecaceae
The stilt-rooted Iriartea deltoidea is presentas one of the most abundant arboreal speciesin plots across the western Amazon with sur-prising frequency. From the forests of low-land Bolivia (Gullison et al., 1996; Smith and
368 D.S. Hammond

Killeen, 1998), Peru (Gentry and Terborgh,1990) and Ecuador (Balslev et al., 1987)through to La Selva in Costa Rica (Hartshornand Hammel, 1994) and Nicaragua, thiscanopy palm consistently is found in rela-tively high abundances across much of itsrange throughout western Amazon andCentral America (Henderson et al., 1995)(Fig. 7.9). It is noticeably absent from theGuiana and Brazilian shield regions andSmith and Killeen (1998) commented on theabrupt disappearance of the species whencrossing from Quaternary to Precambriangeologies in the southeastern Amazon.
The dominant Orbignya (now Attaleaspeciosa) achieves hyper-dominance invast aggregates across the Brazilian Shieldfrom the Palaeozoic Tocantins basin to theQuaternary sediments of lowland Bolivia(Anderson et al., 1991; Henderson et al.,1995) (Fig. 7.9). This dominant species isvirtually absent north of the Amazon mainstem and found only in the southern region
of Guyana and Suriname, where it does notform hyper-dominant stands, possibly as aconsequence of human introduction (Kahnand Moussa, 1997). In this case, range andlocal abundance appear tied to geographicposition, rather than underlying geology.
It is clear that the arborescentArecaceae achieve higher taxonomic rich-ness and greater relative densities in terrafirme forests across the Amazon Downwarp,sub-Andean Foredeep and Central Americaland-bridge relative to the Guiana Shield(Kahn et al., 1988) (Fig. 7.8). In part, thisreflects the greater evenness among dicotyle-donous tree families in western Amazon andCentral America relative to many parts ofthe Guiana Shield. Palms are, however,well-represented in certain habitats withinthe Guiana Shield. Coastal swamp forests,savanna gallery forests and localizedperched catchments are often, but notalways, dominated by a single canopy palmspecies (e.g. Euterpe, Mauritia) (Fanshawe,
Forest Dynamics: Geomorphographic Control and Forest Change 369
Fig. 7.9. The hemispheric distribution of several well-known disturbance-driven taxa. Distributional cover-ages derived from: Swietenia spp.: Pennington (1981) and Lamb (1966); Iriartea deltoidea: Henderson etal. (1995) and Attalea speciosa: Anderson et al. (1991).

1954; Lindeman and Molenaar, 1959;Huber, 1995; van Andel, 2000). Most uplandforests are also typically characterized by amuch higher abundance and richness ofunderstorey palms (e.g. Ek, 1997), a traitthey share with most other neotropicalregions (Gentry, 1990; Kahn and deGranville, 1992). However, the greater pres-ence of arborescent palms in these areas rel-ative to the shield region is difficult tooverlook, even when considering some ofthe most diverse forests identified in theGuiana Shield (e.g. French Guiana: Moriand Boom, 1987; Poncy et al., 1998).
Disturbance, Mobility and Ranging Acrossthe Neotropics
The likelihood of ancient clades that origi-nated along the western rim of Gondwana(Raven and Axelrod, 1974) surviving in situto modern times would be much smallerthan along the eastern rim of modern SouthAmerica, where Precambrian landscapesdominate. Consequently, taxa with life-his-tory attributes supporting greater mobilityand shorter inter-generational times shouldhave radiated faster and/or more profusely(Marzluff and Dial, 1991). Where environ-mental stability was low, a premium wouldhave resided with highly mobile taxaspread across larger geographic ranges as abuffer to extinction. Over time, these line-ages would account for an increasing shareof the standing diversity as a consequenceof lower extinction rates in these areas.
In this case, taxa that are adapted tolow stability environments in ramping sys-tem regions should also be associated withspeciation centres as opportunities formobile, well-distributed taxa propagate andthose for species adapted to quiescent land-scapes, such as the Guiana Shield, dwindleor go locally extinct. Two pertinent exam-ples can be given to support this view.
One is the case of Inga, a widespreadneotropical genus of trees with small tomedium-sized seeds and sugar-rich arilattractive to a wide range of vertebrates.The colonization capacity of Inga spp. iswell-documented from forest inventories in
regions of known historic disturbancethroughout the Guiana Shield, where rela-tive density of the genus increases (van derHout, 1999; van Andel, 2000; ter Steege etal., 2002). Inga also contributes dispropor-tionately to species richness of neotropicalforests and high levels of alpha diversity inmany forests of the western Amazon, butalso across most regions (Gentry, 1990;Valencia et al., 1994).
Richardson et al. (2001) identified theeastern slopes of the Andes as the centre ofdiversification for the genus, arguing thatthe geological history of the region led toexplosive speciation, primarily due to life-history features of the taxon, especially itsrelatively short generation time. If true, thenone very speciose neotropical tree genus canbe associated with large-scale environmen-tal instability typical of a ramping system.
Similarly, Cecropia represents anothercase of a disturbance-loving taxon believedto have speciated rapidly in the westernAmazon as a consequence of Andean upliftand the environmental instability it created(Franco-Roselli and Berg, 2003). As a con-sequence, the eastern Andean slopes ofEcuador and western Colombia contain thehighest species richness within this genus.
Circumstantial evidence highlightingthe contrast between ramping and dampen-ing systems and the role of geomorpho-graphic control can also be gleaned fromthe contemporary distribution of treespecies known to associate with large-scaleor catastrophic disturbances. Swieteniaspp., Ochroma pyramidale, Attalea spe-ciosa and Iriartea deltoidea are commonfeatures of many forest habitats acrossmuch of Central America, the Caribbeanand western Amazon. These taxa also havea strong association with areas affected bywidespread, calamitous or heightened lev-els of disturbance, such as fire, hurricanesand hydrological events (Lamb, 1966;Foster, 1990b; Anderson et al., 1991;Gullison et al., 1996), yet are widely absentfrom the Guiana Shield region (Fig. 7.9).This is not to falsely imply that the shieldregion is devoid of disturbance-dependenttaxa. Rather, it emphasizes the significanceof near exclusion of these well-known indi-
370 D.S. Hammond
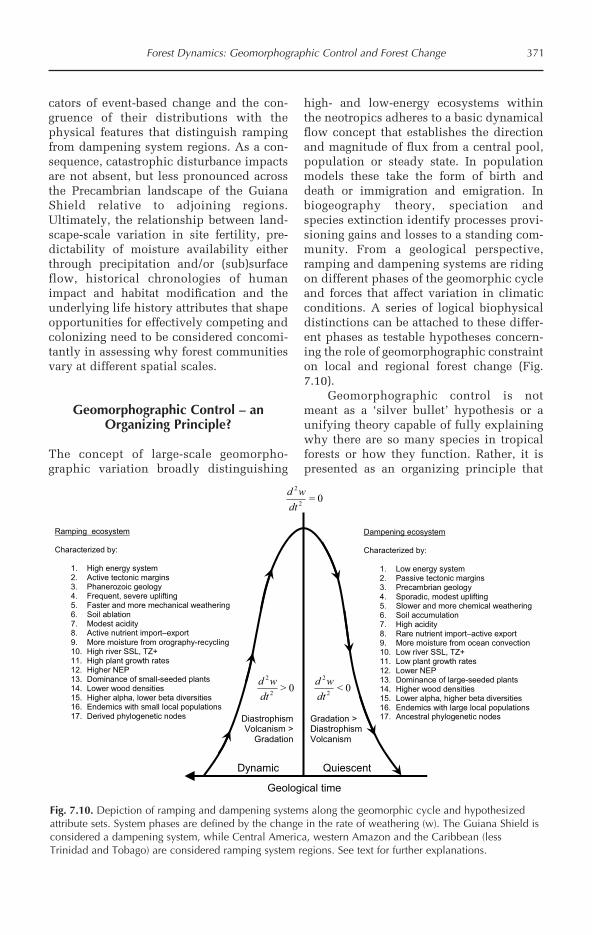
cators of event-based change and the con-gruence of their distributions with thephysical features that distinguish rampingfrom dampening system regions. As a con-sequence, catastrophic disturbance impactsare not absent, but less pronounced acrossthe Precambrian landscape of the GuianaShield relative to adjoining regions.Ultimately, the relationship between land-scape-scale variation in site fertility, pre-dictability of moisture availability eitherthrough precipitation and/or (sub)surfaceflow, historical chronologies of humanimpact and habitat modification and theunderlying life history attributes that shapeopportunities for effectively competing andcolonizing need to be considered concomi-tantly in assessing why forest communitiesvary at different spatial scales.
Geomorphographic Control – anOrganizing Principle?
The concept of large-scale geomorpho-graphic variation broadly distinguishing
high- and low-energy ecosystems withinthe neotropics adheres to a basic dynamicalflow concept that establishes the directionand magnitude of flux from a central pool,population or steady state. In populationmodels these take the form of birth anddeath or immigration and emigration. Inbiogeography theory, speciation andspecies extinction identify processes provi-sioning gains and losses to a standing com-munity. From a geological perspective,ramping and dampening systems are ridingon different phases of the geomorphic cycleand forces that affect variation in climaticconditions. A series of logical biophysicaldistinctions can be attached to these differ-ent phases as testable hypotheses concern-ing the role of geomorphographic constrainton local and regional forest change (Fig.7.10).
Geomorphographic control is notmeant as a ‘silver bullet’ hypothesis or aunifying theory capable of fully explainingwhy there are so many species in tropicalforests or how they function. Rather, it ispresented as an organizing principle that
Forest Dynamics: Geomorphographic Control and Forest Change 371
Fig. 7.10. Depiction of ramping and dampening systems along the geomorphic cycle and hypothesizedattribute sets. System phases are defined by the change in the rate of weathering (w). The Guiana Shield isconsidered a dampening system, while Central America, western Amazon and the Caribbean (lessTrinidad and Tobago) are considered ramping system regions. See text for further explanations.
Dampening ecosystem Characterized by:
1. Low energy system 2. Passive tectonic margins 3. Precambrian geology 4. Sporadic, modest uplifting 5. Slower and more chemical weathering 6. Soil accumulation 7. High acidity 8. Rare nutrient import–active export 9. More moisture from ocean convection 10. Low river SSL, TZ+ 11. Low plant growth rates 12. Lower NEP 13. Dominance of large-seeded plants 14. Higher wood densities 15. Lower alpha, higher beta diversities 16. Endemics with large local populations 17. Ancestral phylogenetic nodes
Ramping ecosystem Characterized by:
1. High energy system 2. Active tectonic margins 3. Phanerozoic geology 4. Frequent, severe uplifting 5. Faster and more mechanical weathering 6. Soil ablation 7. Modest acidity 8. Active nutrient import–export 9. More moisture from orography-recycling 10. High river SSL, TZ+ 11. High plant growth rates 12. Higher NEP 13. Dominance of small-seeded plants 14. Lower wood densities 15. Higher alpha, lower beta diversities 16. Endemics with small local populations 17. Derived phylogenetic nodes
Geological time
DiastrophismVolcanism >
Gradation
Gradation > Diastrophism Volcanism
Dynamic Quiescent
02
2
=dt
wd
02
2
>dt
wd0
2
2
<dt
wd

may bear consideration when attempting totake on such a mighty task. Perhaps moreimportantly, it brings into question whetherscaling-up interesting site-specific resultsfrom dampening (ramping) systems bearsmuch relevance to ramping (dampening)systems and whether concepts, such as‘Amazonia’ and ‘tropical rainforest’, con-structively clarify a (statistical) region ormerely perpetuate a perspective of tropicalenvironmental uniformity that does not
exist, and from all available evidence hasnever existed since the earliest known startof terrestrial angiosperm evolution. Thesewide-scale differences in standing forestcomposition and the large-scale factorsforcing change in these forests suggest thatapplying a uniform conservation and man-agement approach across these regions maylead to contrasting and unforeseen out-comes.
372 D.S. Hammond
Notes
1 Formerly Orbignya phalerata.2 The latter species have reached much greater relative abundances than the former at theirrespective study sites in Panama and Guyana, but it is interesting to note Prioria’s slow, butsteady, increase in stem number (>10 cm diameter breast height (dbh)) between 1980 and 2000within the 50 ha forest plot monitored on BCI (CTFS-Panama).3 This power function evolved as a consequence of exploring the relationship between forestevenness (or dominance) and seed size by empirically fitting a function on to plot data. The plotdata consisted of the number of stems ≥10 cm dbh per species as a proportion of total stems ofthis diameter or larger in a handful of 1 ha sites, mainly across the Guiana Shield, but also,where possible, from other neotropical regions. Time did not allow for the fitting of further datathat exist. The general relationship follows as:
S50 ≅ λ Σ w
where S50 is the number of most common species, S, needed to account for half of the total num-ber of stems, w is the mean seed weight (g) for each species S, i is the total number of stems foreach species S in plot t, n is the number of mean seed weight values for S species and λ is a seedsize scaling coefficient.
The function fits the distribution of empirical data well (r2=0.82) despite incorporating a widerange of plot data varying considerably in geographic location and soil types. It is important tonote, however, that stratification across geomorphographic regions is unbalanced and the largenumber of sites from the Guiana Shield may reflect a spatially bound scale of applicability,rather than a universal relationship. Also, seed sizes can vary at considerable magnitudes withinand between conspecific adults, particularly as minimum seed size increases. Thus again, this isa general trend excepted by local variation, but a decline in average seed size with decreasingdominance (or increasing evenness) appears sufficiently noteworthy to merit further exploration.
s
1 it
ns
is
–0.5
References
Anderson, A.B. (1981) White-sand vegetation of the Brazilian Amazonia. Biotropica 13, 199–210.Anderson, A.B., May, P.H. and Balick, M.J. (1991) The Subsidy from Nature – Palm Forests, Peasantry, and
Development on an Amazon Frontier. Columbia University Press, New York.Aymard, G., Cuello, N. and Schargel, R. (1998) Floristic composition, structure, and diversity in the moist
forest communities along the Casiquiare channel, Amazonas state, Venezuela. In: Dallmeier, F. andComiskey, J.A. (eds) Forest Biodiversity in North, Central and South America, and the Caribbean.Parthenon Publishing, Paris, pp. 495–506.

Baker, H.G. (1972) Seed weight in relation to environmental conditions in California. Ecology 53, 997–1010.
Balslev, H., Luteyn, J., Ollgaard, B. and Holm-Nielsen, L.B. (1987) Composition and structure of adjacentunflooded and floodplain forest in amazonian Ecuador. Opera Botanica 92, 37–57.
Bariteau, M. (1992) Régénératoin naturelle de la forêt tropical humide de Guyane: étude de la répartitionspatiale de Qualea rosea Aublet, Eperua falcata Aublet et Symphonia globulifera L. Annales desSciences Forestières 49, 382–395.
Beard, J.S. (1946) The mora forests of Trinidad, British West Indies. Journal of Ecology 33, 173–192.Béreau, M. and Garbaye, J. (1994) First observations on the root morphology and symbioses of 21 major tree
species in the primary tropical rain forest of French Guyana. Annales des Sciences Forestiere 51,407–416.
Boggan, J., Funk, V., Kelloff, C., Hoff, M., Cremers, G. and Feuillet, C. (1998) Checklist of the Plants of theGuianas (Guyana, Suriname, French Guiana), 2nd edn. BDGP – NMNH Smithsonian Institution,Washington, DC.
Boot, R.G.A. (1996) The significance of seedling size and growth rate of tropical forest seedlings for regen-eration in canopy openings. In: Swaine, M.D. (ed.) The Ecology of Tropical Forest Tree Seedlings.Parthenon, Paris, pp. 267–284.
British Guiana Forest Department (1935) Forestry in British Guiana. Supplementary statement prepared bythe Forest Department for presentation to the Fourth British Empire Forestry Conference (South Africa),1935. BGFD, Georgetown.
Brouwer, L. (1996) Nutrient Cycling in Pristine and Logged Tropical Rain Forest – A Study in Guyana.Tropenbos-Guyana Series 1. Tropenbos-Guyana, Utrecht, The Netherlands.
Brown, S. (1997) Estimating Biomass and Biomass Change of Tropical Forests. FAO Forestry Paper 134. FAO,Rome.
Brown, S. and Lugo, A.E. (1990) Tropical secondary forests. Journal of Tropical Ecology 6, 1–32.Bubberman, F.C. (1973) De bosbranden van 1964 in Suriname. Nieuwe West-Indische Gids 49, 163–173.Chanderballi, A.S., van der Werff, H. and Renner, S.S. (2001) Phylogeny and historical biogeography of
Lauraceae: evidence from chloroplast and nuclear genomes. Annals of the Missouri Botanical Garden88, 104–134.
Chudnoff, M. (1976) Density of tropical timbers as influenced by climatic life zones. Commonwealth ForestryReview 55, 203–217.
CIRAD/CTFT (1989) Bois des DOM-TOM. Tome 1 – Guyane. CIRAD-CTFT, Nogent-sur-Marne, France.Coates, A.G. and Obando, J.A. (1996) The geologica evolution of the Central American isthmus. In: Coates,
A.G. (ed.) Evolution and Environment in Tropical America. Chicago University Press, London, pp.21–56.
Comiskey, J.A., Aymard, G. and Dallmeier, F. (1994) Structure and composition of lowland mixed forest inthe Kwakwani region of Guyana. Biollonia 10, 13–28.
Comiskey, J.A., Dallmaier, F. and Foster, R.B. (1998) Forest structure and diversity in managed and unman-aged rainforest of Beni, Bolivia. In: Dallmaier, F. and Comiskey, J.A. (eds) Forest Biodiversity in North,Central and South America, and the Caribbean. Parthenon Publishing/UNESCO, Paris, pp. 663–680.
Condit, R. (1998) Tropical Forest Census Plots. Springer, Berlin.Condit, R., Hubbell, S.P. and Foster, R.B. (1996) Changes in tree species abundance in a neotropical forest:
impact of climate change. Journal of Tropical Ecology 12, 231–256.Condit, R., Pitman, N.C.A., Leigh, E.G.J., Chave, J., Terborgh, J., Foster, R.B., Nuñez-Vargas, P., Aguilar, S.,
Valencia, R., Villa, G., Muller-Landau, H.C., Losos, E. and Hubbell, S.P. (2002) Beta-diversity in tropi-cal trees. Science 295, 666–669.
Coomes, D.A. and Grubb, P.J. (1996) Amazonian caatinga and related communities at La Esmeralda,Venezuela: forest structure, physiognamy and floristics, and control by soil factors. Vegetatio 122,167–191.
CPTEC (2003) Histogramas dos focos de calor em Ombrofila Densa – NOAA-12 for Amapa, Amazonas,Roraima and Para states, Brazil, and Bolivar and Amazonias states, Venezuelan Guayana, 1998–2003.http://www.cptec.inpe.br/products/queimadas
Cuevas, E. (2001) Soil versus biological controls on nutrient cycling in terra firme forests. In: McClain, M.E.,Victoria, R.L. and Richey, J.E. (eds) The Biogeochemistry of the Amazon Basin. Oxford University Press,London, pp. 53–67.
Dalling, J.W., Harms, K.E. and Aizprúa, R. (1997) Seed damage tolerance and seedling resprouting ability ofPrioria copaifera in Panama. Journal of Tropical Ecology 13, 481–490.
Forest Dynamics: Geomorphographic Control and Forest Change 373

Davis, T.A.W. and Richards, P.W. (1933) The vegetation of Moraballi creek, British Guiana: an ecologicalstudy of a limited area of tropical rain forest. I. Journal of Ecology 21, 350–384.
de Milde, R. and de Groot, D. (1970) Forest Industries Development Survey – Guyana. ReconnaissanceSurvey of the More Accessible Forest Areas. UNDP/FAO, Georgetown.
de Milde, R. and Inglis, C. (1974) Inventory of the Fallawatra, Nassau and Kabalebo Areas. FAO, Paramaribo.Denslow, J.S. (1980) Gap partitioning among tropical rainforest trees. Biotropica 12 (Suppl.), 47–55.Dezzeo, N. and Briceño, E. (1997) La vegetacion en la cuenca del Rio Chanaro: medio Rio Caura. In: Huber,
O. and Rosales, J. (eds) Ecologia de la Cuenca del Río Caura, Venezuela II. Estudios Especiales. RefolitCA, Caracas, pp. 365–385.
Duivenvoorden, J.F. and Lips, J.M. (1995) A Land-ecological Study of Soils, Vegetation and Plant Diversityin Colombian Amazonia. Tropenbos Foundation, Wageningen, The Netherlands.
Ek, R.C. (1997) Botanical Diversity in the Tropical Rain Forest in Guyana. Tropenbos-Guyana Series 5.Tropenbos-Guyana Programme, Wageningen, The Netherlands.
Fanshawe, D.B. (1952) The Vegetation of British Guiana: a Preliminary Review. Imperial Forestry InstitutePaper 29. Imperial Forestry Institute, Oxford, UK.
Fanshawe, D.B. (1954) Forest types of British Guiana. Caribbean Forester 15, 73–111.Fearnside, P.M. (1990) Fire in the tropical rain forest of the Amazon basin. In: Goldammer, J.G. (ed.) Fire in
the Tropical Biota. Springer, Heidelberg, Germany, pp. 106–116.Ferreira, L.V. and Prance, G.T. (1998) Species richness and floristic composition in four hectares in the Jaú
National Park in upland forests in Central Amazonia. Biodiversity and Conservation 7, 1349–1364.
Ferreira, L.V. and Rankin-de-Merona, J.M. (1998) Floristic composition and structure of a one-hectare plot interra firme forest in central Amazonia. In: Dallmeier, F. and Comiskey, J.A. (ed.) Forest Biodiversity inNorth, Central and South America, and the Caribbean. UNESCO MAB, Paris, pp. 649–662.
Fittkau, E.J. (1974) On the ecological classification of Amazonia 1. The geological development ofAmazonia. Amazoniana 5, 77–134.
Foster, R.B. (1982) The seasonal rhythm of fruitfall on Barro Colorado Island. In: Leigh, E.G.J., Rand, A.S. andWindsor, D.M. (eds) The Ecology of a Tropical Forest – Seasonal Rhythms and Long Term Changes.Smithsonian Institution Press, Washington, DC, pp. 151–172.
Foster, R.B. (1990a) Floristic composition of the Manu floodplain forest. In: Gentry, A.H. (ed.) FourNeotropical Forests. Yale University Press, New Haven, Connecticut, pp. 99–111.
Foster, R.B. (1990b) Long-term change in the successional forest community of the Rio Manu floodplain. In:Gentry, A.H. (ed.) Four Neotropical Forests. Yale University Press, New Haven, Connecticut, pp.565–572.
Foster, R.B. and Janson, C.H. (1985) The relationship between seed mass and establishment conditions intropical woody plants. Ecology 66, 773–780.
Foster, S.A. (1986) On the adaptive value of large seeds for tropical moist forest trees: a review and synthe-sis. Botanical Review 52, 260–299.
Franco-Roselli, P. and Berg, C.C. (2003) Distributional patterns of Cecropia (Cecropiaceae): a panbiogeo-graphic analysis. Caldasia 19, 285–296.
Friis, E.M., Chaloner, W.G. and Crane, P.R. (eds) (1987) The Origins of Angiosperms and their BiologicalConsequences. Cambridge University Press, Cambridge, UK.
Galeano, G., Cediel, J. and Pardo, M. (1998) Structure and floristic composition of a one-hectare plot of wetforest at the Pacific coast of Chocó, Colombia. In: Dallmaier, F. and Comiskey, J.A. (eds) ForestBiodiversity in North, Central and South America, and the Caribbean. Parthenon Publishing/UNESCO,Paris, pp. 551–568.
Garwood, N.C., Janos, D.P. and Brokaw, N. (1979) Earthquake-caused landslides: a major disturbance totropical forests. Science 205, 997–999.
Gentry, A.H. (1982) Neotropical floristic diversity: phytogeographical connections between Central andSouth America, Pleistocene climatic fluctuations, or an accident of the Andean orogeny? Annals of theMissouri Botanical Garden 69, 557–593.
Gentry, A.H. (1990) Floristic similarities and differences between southern Central America and upper andcentral Amazonia. In: Gentry, A.H. (ed.) Four Neotropical Forests. Yale University Press, New Haven,Connecticut, pp. 141–157.
Gentry, A.H. and Terborgh, J. (1990) Composition and dynamics of the Cocha Cashu ‘mature’ floodplain for-est. In: Gentry, A.H. (ed.) Four Neotropical Forests. Yale University Press, New Haven, Connecticut, pp.542–564.
374 D.S. Hammond

Gerard, J., Miller, R.B. and ter Welle, B.J.H. (1996) Major Timber Trees of Guyana – Timber Characteristicsand Utilization. Tropenbos Series 15. Tropenbos Foundation, Wageningen, The Netherlands.
Gonzalez, J. and Fisher, R.F. (1998) Variation in selected wood properties of Vochysia guatemalensis fromfour site in Costa Rica. Forest Science 44, 185–191.
Grubb, P.J. (1977) The maintenance of species-richness in plant communities: the importance of the regen-eration niche. Biological Reviews 52, 107–145.
Gullison, R.E., Panfil, S.N., Strouse, J.J. and Hubbell, S.P. (1996) Ecology and management of mahogany(Swietenia macrophylla King) in the Chimanes Forest, Beni, Bolivia. Botanical Journal of the LinneanSociety 122, 9–34.
Haffer, J. (1969) Speciation in Amazonian forest birds. Science 165, 131–137.Hammond, D.S. and Brown, V.K. (1995) Seed size of woody plants in relation to disturbance, dispersal, soil
type in wet neotropical forests. Ecology 76, 2544–2561.Hammond, D.S. and Brown, V.K. (1998) Disturbance, phenology and life-history characteristics: factors
influencing distance/density-dependent attack on tropical seeds and seedlings. In: Newbery, D.M.,Prins, H.T.T. and Brown, N.D. (eds) Dynamics of Tropical Communities. Blackwell Scientific,Cambridge, UK, pp. 51–78.
Hammond, D.S. and ter Steege, H. (1998) Propensity for fire in the Guianan rainforests. Conservation Biology12, 944–947.
Hammond, D.S., Brown, V.K. and Zagt, R.J. (1999) Spatial and temporal patterns of seed attack and germi-nation in a large-seeded neotropical tree. Oecologia 119, 208–218.
Haripersad-Makhanlal, A. and Ouboter, P.E. (1993) Limnology: physico-chemical parameters and phyto-plankton composition. In: Ouboter, P.E. (ed.) The Freshwater Ecosystems of Suriname. KluwerAcademic, Dordrecht, The Netherlands, pp. 53–75.
Harper, J.L., Lovell, P.H. and Moore, K.G. (1970) The shape and size of seeds. Annual Review of Ecologyand Systematics 1, 327–356.
Harrington, H.J. (1962) Paleogeographic development of South America. Bulletin of the AmericanAssociation of Petroleum Geologists 46, 1773–1814.
Hart, T.B., Hart, J.A. and Murphy, P.G. (1989) Monodominant and species-rich forests of the humid tropics:causes for their co-occurrence. American Naturalist 133, 613–633.
Hartshorn, G.S. and Hammel, B.E. (1994) Vegetation types and floristic patterns. In: McDade, L.A., Bawa,K.S., Hespenheide, H.A. and Hartshorn, G.S. (eds) La Selva: Ecology and Natural History of aNeotropical Rain Forest. University of Chicago Press, London, pp. 73–119.
Henderson, A., Galeano, G. and Bernal, R. (1995) Field Guide to the Palms of the Americas. PrincetonUniversity Press, Princeton, New Jersey.
Herrera, R., Jordan, C.J., Klinge, H. and Medina, E. (1978) Amazon ecosystems – their structure and func-tioning with particular emphasis on nutrients. Interciencia 3, 223–231.
Hoheisel, H. (1968) Identification of Some Colombian Wood Species and Their Possible Use on the Basis ofPhysical and Mechanical Properties. IFLAIC, Merida.
Hoheisel, H. and Karstedt, P. (1967) Identification of Ecuadorian Wood Species for Possibilities of Utilizationon Basis of Technological Results. Instituto Forestal Latino Americano, Merida.
Hohenkerk, L.S. (1922) A review of the timber industry of British Guiana. Journal of the Board of Agricultureof British Guiana 15, 2–22.
Hollowell, T., Berry, P.E., Funk, V. and Kelloff, C. (2001) Preliminary Checklist of the Plants of the GuianaShield. Vol.1: Acanthaceae-Lythraceae. Biological Diversity of the Guianas Program Series. BDGP –Smithsonian Institution, Washington, DC.
Holzinger, R., Kleiss, B., Donoso, L. and Sanhueza, E. (2001) Aromatic hydrocarbons at urban, sub-urban,rural and remote sites iin Venezuela. Atmospheric Environment 35, 4917–4927.
Howe, J.P. (1974) Relationship of climate to the specific gravity of four Costa Rican hardwoods. Wood andFiber 5, 347–352.
Hubbell, S.P. (1979) Tree dispersion, abundance and diversity in a tropical dry forest. Science 203, 1299–1309.Hubbell, S.P. (2001) The Unified Theory of Biodiversity and Biogeography. Monographs in Population
Biology 32. Princeton University Press, Oxford, UK.Hubbell, S.P. and Foster, R.B. (1990) Structure, dynamics, and equilibrium status of old-growth forest on
Barro Colorado Island. In: Gentry, A.H. (ed.) Four Neotropical Forests. Yale University Press, NewHaven, Connecticut, pp. 522–541.
Huber, O. (1995) Vegetation. In: Berry, P.E., Holst, B.K. and Yatskievych, K. (eds) Flora of the VenezuelanGuayana. Timber Press, Portland, Oregon, pp. 97–160.
Forest Dynamics: Geomorphographic Control and Forest Change 375
Huber, O., Gharbarran, G. and Funk, V. (1995) Vegetation Map of Guyana (preliminary version). Centre forthe Study of Biological Diversity, University of Guyana, Georgetown.
Hughes, J.H. (1946) Forest resources. In: Roth, V. (ed.) Handbook of Natural Resources of British Guiana.The Daily Chronicle Ltd, Georgetown, pp. 47–191.
Huston, M.A. (1994) Biological Diversity: the Coexistence of Species on Changing Landscapes. CambridgeUniversity Press, Cambridge, UK.
INPA/CPPF (1991) Catálogo de Madeiras da Amazônia. INPE/CPPF, Manaus.Jackson, J.B.C. (1994) Constancy and change of life in the sea. Philosophical Transactions of the Royal
Society, London, Series B 343, 55–60.Janzen, D.H. (1969) Seed-eaters versus seed size, number, toxicity and dispersal. Evolution 23, 1–27.Johnston, M. and Gillman, M. (1995) Tree population studies in low-diversity forests, Guyana. I. floristic
composition and stand structure. Biodiversity and Conservation 4, 339–362.Jones, C., Mahowald, N. and Luo, C. (2003) The role of easterly waves on African desert dust transport.
Journal of Climate 16, 3617–3628.Jordan, C.J. (ed.) (1987) Amazonian Rain Forests – Ecosystem Disturbance and Recovery. Ecological Studies.
Springer, London.Jordan, C.J. and Herrera, R. (1981) Tropical rainforests: are nutrients really critical? American Naturalist 117,
167–180.Kahn, F. and de Granville, J.-J. (1992) Palms in the Forest Ecosystems of Amazonia. Springer, London.Kahn, F. and Moussa, F. (1997) El papel de los grupos humanos en la distribución geográfica de algunas pal-
mas en la Amazonía y su periferia. In: Rios, M. and Pedersen, H.B. (eds) Uso y manejo de recursos veg-etales. Ediciones Abya-Yala, Quito, pp. 83–99.
Kahn, F., Mejia, K. and de Castro, A. (1988) Species richness and density of palms in terra firme forests ofAmazonia. Biotropica 20, 266–269.
Kalliola, R.J., Jokinen, P. and Tuukki, E. (1999) Fluvial dynamics and sustainable development in upper RioAmazonas, Peru. In: Henderson, A. (ed.) Várzea – Diversity, Development and Conservation ofAmazonia’s Whitewater Floodplains. NYBG Press, New York, pp. 271–282.
Kauffman, J.B. and Uhl, C. (1990) Interactions of anthropogenic activities, fire, and rain forests in the Amazonbasin. In: Goldammer, J.G. (ed.) Fire in the Tropical Biota. Springer, Heidelberg, pp. 117–134.
Lamb, F.B. (1966) Mahogany of Tropical America: Its Ecology and Management. University of MichiganPress, Ann Arbor, Michigan.
Lambers, H. and Poorter, H. (1992) Inherent variation in growth rates between higher plants: a search forphysiological causes and higher consequences. Advances in Ecological Research 23, 188–261.
Lavers, G.M. (1983) The Strength Properties of Timber. HMSO, London.Leishman, M.R., Westoby, M. and Jurado, E. (1995) Correlates of seed size variation: a comparison among
five temperate floras. Journal of Ecology 83, 517–530.Lindeman, J.C. and Molenaar, S.P. (1959) The Vegetation of Suriname. Vol. 1. Part 2. Van Eedenfonds,
Amsterdam.Longwood, F.R. (1962) Present and Potential Commercial Timbers of the Caribbean – with Special Reference
to the West Indies, the Guianas, and British Honduras. Agriculture Handbook No. 207. USDA-ForestService, Washington, DC.
Maas, P.J.M. (1971) Floristic observations on forest types in western Suriname I. Proceedings of the Konikl.Nederl. Akademie van Wetenschappen – Amsterdam, Series C 74, 269–302.
Marzluff, J.M. and Dial, K.P. (1991) Life history correlates of taxonomic diversity. Ecology 72, 428–439.McTurk, M. (1882) Notes on the forests of British Guiana. Timehri 1, 173–215.Meggers, B.J. (1994) Archeological evidence for the impact of mega-Niño events on Amazonia during the
past two millennia. Climatic Change 28, 321–338.Mori, S.A. and Boom, B.M. (1987) Chapter II. The forest. Memoirs of the New York Botanical Garden 44,
9–29.Moyersoen, B. (1993) Ectomicorrizas y micorrizas vesiculo-arbusculares en caatinga amazónica del sur de
Venezuela. Scientia Guaianae, 3. Reflofit CA, Caracas.Mullins, E.J. and McKnight, T.S. (1981) Canadian Woods – Their Properties and Uses. University of Toronto
Press, Toronto, Canada.Myers, J.G. (1936) Savanna and forest vegetation of the interior Guiana plateau. Journal of Ecology 24,
162–184.Nelson, B.W., Ferreira, L.V., da Silva, M.F. and Kawaski, M.L. (1990) Endemism centres, refugia and botan-
ical collection density in Brazilian Amazonia. Nature 345, 714–716.
376 D.S. Hammond
Nelson, B.W., Kapos, V., Adams, J.B., Oliveira, W.J., Braun, O.P.G. and do Amaral I.L. (1994) Forest distur-bance by large blowdowns in the Brazilian Amazon. Ecology 75, 853–858.
Norris, D.O. (1969) Observations on the nodulation status of rainforest leguminous species in Amazonia andGuyana. Tropical Agriculture 46, 145–151.
Ogden, J. (1966) Ordination studies on a small area of tropical rain forest. MSc Forestry, University of Wales,Bangor, UK.
Oliphant, F.M. (1938) The Commercial Possibilities and Development of the Forests of British Guiana. TheArgosy Co. Ltd, Georgetown, Guyana.
Orians, G.H. (1982) The influence of tree-falls in tropical forests on tree species richness. Tropical Ecology23, 255–279.
Pennington, T.D. (1981) Meliaceae. Flora Neotropica Monographs 28. NYBG, New York.Perreijn, K. (2002) Symbiotic nitrogen fixation by leguminous trees in tropical rain forest in Guyana.
Tropenbos-Guyana Series 11. Tropenbos-Guyana, Georgetown.Pitman, W.C.I., Cande, S., LaBrecque, J.L. and Pindell, J.L. (1993) Fragmentation of Gondwana: the separa-
tion of Africa from South America. In: Goldblatt, P. (ed.) Biological Relationships between Africa andSouth America. Yale University Press, London, pp. 15–34.
Pitman, N.C.A., Terborgh, J., Silman, M.R., Nuñez-Vargas, P., Neill, D.A., Cerón, C.E., Palacios, W.A. andAulestia, M. (2001) Dominance and distribution of tree species in upper Amazonian terra firme forests.Ecology 82, 2101–2117.
Poncy, O., Riéra, B., Larpin, D., Belbenoit, P., Jullien, M., Hoff, M. and Charles-Dominique, P. (1998) Thepermanent field research station ‘Les Nouragues’ in the tropical rainforest of French Guiana: currentprojects and preliminary results on tree diversity, structure and dynamics. In: Dallmaier, F. andComiskey, J.A. (eds) Forest Biodiversity in North, Central and South America, and the Caribbean.Parthenon Publishing/UNESCO, Paris, pp. 385–410.
Prance, G.T. (1973) Phytogeographic support for the theory of Pleistocene forest refuges in the AmazonBasin, based on evidence from distribution patterns in Caryocaraceae, Chrysobalanaceae,Dichapetalaceae, and Lecythidaceae. Acta Amazonica 3, 5–28.
Prance, G.T. (1981) The changing forests. In: Prance, G.T. and Lovejoy, T.E. (eds) Key Environments:Amazon. Pergamon Press, London, pp. 146–165.
Putzer, H. (1984) The geological evolution of the Amazon basin and its mineral resources. In: Sioli, H. (ed.)The Amazon: Limnology and Landscape Ecology of a Mighty Tropical River and its Basin. Dr. W. Junk,Dordrecht, The Netherlands, pp. 15–46.
Raaimakers, D. (1995) Growth of Tropical Rainforest Trees as Dependent on Phosphorus Supply. TropenbosSeries 11. Tropenbos Foundation, Ede, The Netherlands.
Ramón, J.C., Dzou, L.I., Hughes, W.B. and Holba, A.G. (2001) Evolution of the Cretaceous organic facies inColombia: implications for oil composition. Journal of South American Earth Sciences 14, 31–50.
Räsänen, M. (1993) La geohistoria y geologia de la Amazonia Peruana. In: Danjoy, W. (ed.) AmazoniaPeruana. Vegetatcion Humeda Tropical en el Llano Subandino. PAUT/ONERN, Jyväskylä, Finland, pp.43–65.
Raven, P.H. and Axelrod, D.I. (1974) Angiosperm biogeography and past continental movements. Annals ofthe Missouri Botanical Garden 61, 539–673.
Record, S.J. and Hess, R.W. (1943) Timbers of the New World. Yale University Press, New Haven,Connecticut.
Richards, P.W. (1952) The Tropical Rain Forest. Cambridge University Press, Oxford, UK.Richardson, J.E., Pennington, R.T., Pennington, T.D. and Hollingsworth, P.M. (2001) Rapid diversification of
a species-rich genus of neotropical rain forest trees. Science 293, 2242–2245.Ricklefs, R.E. (1987) Community diversity: relative roles of local and regional processes. Science 235,
167–171.Rohwer, J., Richter, H. and van der Werff, H. (1991) Two new genera of neotropical Lauraceae and critical
remarks on their generic delimitation. Annals of the Missouri Botanical Garden 78, 388–400.Rollet, B. (1969) L’architecture des Forêts Denses Humides Sempervirentes de Plaine. CTFT, Nogent Sur
Marne, France.Romero, E.J. (1993) South American paleofloras. In: Goldblatt, P. (ed.) Biological Relationships between
Africa and South America. Yale University Press, New Haven, Connecticut, pp. 62–85.Rose, S.A. (2000) Seeds, Seedlings and Gaps – Size Matters. Tropenbos-Guyana Series 9. Tropenbos
Foundation, Wageningen, The Netherlands.Salas, L., Berry, P.E. and Goldstein, I. (1997) Composición y estructura de una comunidad de árboles grandes
Forest Dynamics: Geomorphographic Control and Forest Change 377
en el valle del Río Tabaro, Venezuela: una muestra de 18.75 ha. In: Huber, O. and Rosales, J. (eds)Ecologia de la Cuenca del Río Caura, Venezuela II. Estudios Especiales. Refolit CA, Caracas, pp. 291–308.
Saldarriaga, J.G. (1987) Recovery following shifting cultivation. In: Jordan, C.F. (ed.) Amazonian Rain Forests– Ecosystem Disturbance and Recovery. Springer, London, pp. 24–33.
Saldarriaga, J.G. (1994) Recuperación de la Selva de ‘Tierra Firme’ en el Alto Río Negro AmazoniaColombiana–Venezolana. Estudios en la Amazonia Colombiana 5. Tropenbos Colombia Programme,Bogotá.
Saldarriaga, J.G. and West, D.C. (1986) Holocene fires in the northern Amazon basin. Quaternary Research26, 358–366.
Salisbury, E.J. (1974) Seed size and mass in relation to environment. Proceedings of the Royal Society 186,83–88.
Salo, J., Kalliola, R., Hakkinen, I., Makinen, Y., Niemela, P., Puhakka, M. and Coley, P.D. (1986) Riverdynamics and the diversity of Amazon lowland forest. Science 322, 254–258.
Schulz, J.P. (1960) Ecological studies on rain forest in Northern Suriname. Verhandelingen der KoninklijkeNederlandse Akademie van Wetenschappen, Afd. Natuurkunde 163, 1–250.
Schupp, E.W., Howe, H.F., Augspurger, C.K. and Levey, D.J. (1989) Arrival and survival in tropical treefallgaps. Ecology 70, 562–564.
Smith, D.N. and Killeen, T.J. (1998) A comparison of the structure and composition of montane and lowlandtropical forest in the Serrania Pilón Lajas, Beni, Bolivia. In: Dallmaier, F. and Comiskey, J.A. (eds) ForestBiodiversity in North, Central and South America, and the Caribbean. Parthenon Publishing/UNESCO,Paris, pp. 681–700.
Soerianegara, I. and Lemmens, R.H.M.J. (eds) (1993) Plant Resources of South-East Asia. Pudoc,Wageningen, The Netherlands.
Suriname Forest Service (1955) Surinam Timber. Eldorado, Paramaribo.Takhtajan, A. (1997) Diversity and Classification of Flowering Plants. Columbia University Press, New York.ter Steege, H. (1993) Patterns in Tropical Rain Forest in Guyana. Tropenbos Series 3. Tropenbos Foundation,
Ede, The Netherlands.ter Steege, H. (2000) Plant Diversity in Guyana. Tropenbos Series 18. Tropenbos Foundation, Wageningen,
The Netherlands.ter Steege, H. and Hammond, D.S. (2001) Character convergence, diversity, and disturbances in tropical rain
forest in Guyana. Ecology 82, 3197–3212.ter Steege, H. and Zondervan, G. (2000) A preliminary analysis of large-scale forest inventory data of the
Guiana Shield. In: ter Steege, H. (ed.) Plant Diversity in Guyana. Tropenbos Foundation, Wageningen,The Netherlands, pp. 35–54.
ter Steege, H., Jetten, V.G., Polak, A.M. and Werger, M.J.A. (1993) Tropical rain forest types and soil factorsin a watershed area in Guyana. Journal of Vegetation Science 4, 705–716.
ter Steege, H., Sabatier, D., Castellanos, H., van Andel, T., Duivenvoorden, J.F., de Oliveira, A.A., Ek, R.C.,Lilwah, R., Maas, P.J.M. and Mori, S.A. (2000) An analysis of Amazonian floristic composition, includ-ing those of the Guiana Shield. Journal of Tropical Ecology 16, 801–828.
ter Steege, H., Welch, I.A. and Zagt, R. (2002) Long-term effect of timber harvesting in the Bartica Triangle,Central Guyana. Forest Ecology and Management 170, 127–144.
Thompson, J., Proctor, J., Viana, V., Milliken, W., Ratter, J.A. and Scott, D.A. (1992) Ecological studies on alowland evergreen rain forest on Maracá Island, Roraima, Brazil. I. Physical environment, forest struc-ture and leaf chemistry. Journal of Ecology 80, 689–703.
Toriola-Lafuente, D. (1997) Regeneration naturelle en Guyane française: ARBOCEL, une juene forêt sec-ondaire de 19 ans. Thèse de Doctorat. L’Université Paris 6. Paris.
Valencia, R., Balslev, H. and Paz y Miño, C.G. (1994) High tree alpha-diversity in Amazonian Ecuador.Biodiversity and Conservation 3, 21–28.
van Andel, T. (2000) Non-timber Forest Products of the North West District of Guyana. Part I. Tropenbos-Guyana Series 8A. Tropenbos-Guyana Programme, Georgetown.
van der Hammen, T. (1972) Changes in vegetation and climate in the Amazon basin and surrounding areasduring the Pleistocene. Geologie en Mijnbouw 51, 641–643.
van der Hammen, T. (1974) The Pleistocene changes of vegetation and climate in tropical South America.Journal of Biogeography 1, 3–26.
van der Hout, P. (1999) Reduced Impact Logging in the Tropical Rain Forest of Guyana. Ecological,Economic and Silvicultural Consequences. Tropenbos-Guyana Series 6. Tropenbos-GuyanaProgramme, Georgetown.
378 D.S. Hammond

van der Slooten, H.J. and Martinez, P. (1959) Descripcion y Propiedades de Algunas Maderas Venezolanas.Instituto Forestal Latino Americano, Merida.
van der Werff, H. (1991) A key to the genera of Lauraceae in the New World. Annals of the MissouriBotanical Garden 78, 377–387.
Vink, A.T. (1970) Forestry in Surinam – a Review of Policy, Planning, Projects, Progress. Suriname ForestService (LBB), Paramaribo.
Vuilleumier, B.S. (1971) Pleistocene changes in the fauna and flora of South America. Science 1973,771–779.
Wadsworth, F.H.G.H.E. (1959) Effects of the 1956 hurricane on forests in Puerto Rico. Caribbean Forester20, 38–51.
Webb, L.J. (1958) Cyclones as an ecological factor in the tropical lowland rain forest, North Queensland.Australian Journal of Botany 6, 220–230.
Welch, I.A. and Bell, G.S. (1971) Great Falls Inventory. Guyana Forest Department, Georgetown.Westoby, M., Leishman, M.R. and Lord, J. (1997) Comparative ecology of seed size and dispersal. In:
Silvertown, J., Franco, M. and Harper, J.L. (eds) Plant Life Histories: Ecology, Phylogeny and Evolution.The Royal Society, London, pp. 143–162.
Whitmore, J.L. (1973) Wood density variation in Costa Rican balsa. Wood Science 5, 223–229.Whitmore, T.C. (1974) Change with Time and the Role of Cyclones in Tropical Rain Forest on
Kolombangara, Solomon Islands. Paper 46. Commonwealth Forestry Institute.Whitmore, T.C. and da Silva, J.N.M. (1990) Brazil rain forest timbers are mostly very dense. Commonwealth
Forestry Review 69, 87–90.Whitmore, T.C. and Prance, G.T. (1987) Biogeography and Quaternary History in Tropical America. Oxford
Science, Oxford, UK.Whitton, B.A. (1962) Forests and dominant legumes of the Amatuk region, British Guiana. Caribbean Forester
23, 35–57.Wiemann, M.C. and Williamson, G.B. (1988) Extreme radial changes in wood specific gravity in some trop-
ical pioneers. Wood and Fiber Science 20, 344–349.Wiemann, M.C. and Williamson, G.B. (1989a) Radial gradients in the specific gravity of wood in some trop-
ical and temperate trees. Forest Science 35, 197–210.Wiemann, M.C. and Williamson, G.B. (1989b) Wood specific gravity gradient in tropical dry and montane
rain forest trees. American Journal of Botany 76, 924–928.Williams, L. (1939) Maderas Economicas de Venezuela. Boletin Tecnica No. 2. Ministerio de Agricultura y
Cria, Caracas.Williamson, G.B. (1984) Gradients in wood specific gravity of trees. Bulletin of the Torrey Botanical Club
111, 51–55.Wood, B.R. (1926) Report by the Conservator of Forests on the Valuation of the Forests of the Bartica-Kaburi
Area. BGFD, Georgetown.Zagt, R.J. (1997) Tree Demography in the Tropical Rain Forest of Guyana. Tropenbos-Guyana Series 3.
Tropenbos-Guyana Programme, Georgetown.Zobel, B.J. and van Buijtenen, J.P. (1989) Wood Variation, its Causes and Control. Springer, London.
Forest Dynamics: Geomorphographic Control and Forest Change 379

This page intentionally left blank
Lowland Tropical Forests, Limiting orLimited Environment?
Tropical forests are typically described andcategorized by their plant community com-position and structure and the animals thatuse them for shelter and food. The fact thatpeople, communities and societies, withtheir own unique cultural and socialdimensions, have inhabited much, if notmost, neotropical forests at one point oranother over the last 12,000–15,000 years isincreasingly difficult to dispute (Bryan,1973; Barse, 1990; Roosevelt, 1991a). Yetbiophysical and anthropological perspec-tives on the forces driving change in bothlowland forests and indigenous societieshave largely remained separate. From theanthropological perspective, this pigeon-holing has thrown discussion into a polem-ical, all-or-nothing, debate – either theprevailing environment has controlledsocio-cultural change (Meggers, 1954, 1973,1977, 1984, 1996; Steward, 1955;Lowenstein, 1973) or social structure hasstrongly influenced forest change (e.g. seeBalée, 1992, 1998; Denevan, 1992; Stahl,1996; Heckenberger et al., 1999, 2003).
On one side is the concept of prevailingenvironmental conditions limiting howsocieties in lowland forest regions devel-oped – what rituals they performed, howthey went about meeting basic needs and
the measure and magnitude of social organ-ization they achieved. Given an extremelyinfertile tropical landscape, prehistoric cul-tures remained at the most basic levels oforganization, practised few sophisticatedrituals (such as elaborate burial) and rarelyremained in one place through a genera-tion. Their capacity to alter a ‘pristine’ for-est was constrained as much as the forestconstrained their capacity to achieve highersocial complexity. However, by focusinglargely on the role of low-amplitude, con-tinuous environmental change in shapingprehistoric cultural development, environ-mental determinism fails to account for therole of social cooperation in overcomingenvironmental challenges (e.g. see argu-ments put forth by Erickson, 1999; Dillehayand Kolata, 2004). Cooperation, and itsmany benefits, is arguably one of the mostimportant factors sustaining social gregari-ousness.
Conversely, assuming that environ-mental factors rarely limit socioculturalgrowth and change fails to appropriatelyweight the influence of punctuated, highamplitude events or phases that (continueto) test the resiliency of societies around theworld. During these periods, the same gre-gariousness that assisted cooperation formutual benefit also catalysed catastrophicloss by accelerating the impact of disease,famine and war under growing environ-
381© CAB International 2005. Tropical Forests of the Guiana Shield (ed. D.S. Hammond)
8 Socio-economic Aspects of Guiana ShieldForest Use
David S. HammondIwokrama International Centre for Rain Forest Conservation and Development,Georgetown, Guyana. Currently: NWFS Consulting, Beaverton, Oregon, USA

mental limitations (and heightened socialinequities as a consequence). Tremendousevidence has accrued to the fact that cata-strophic loss and efforts to avoid theseevents were deeply inculcated in the spiri-tual and cultural beliefs that drove socialthinking even in the most successful civi-lizations. Incipient environmental chal-lenges can lead to subsequent culturaldecline through dissipation of dominantsocial structures, as in the case of the Maya(Curtis et al., 1996) and Tiwanaku (Binfordet al., 1997), particularly when sophisti-cated spiritual and cultural systems typicalof strongly hierarchical societies fail toovercome these challenges. Environmentalchallenges may also plausibly retardgrowth in social cohesion and populationwithin much smaller communities, particu-larly when their position within the socio-cultural landscape renders them lesscapable of weathering catastrophic environ-mental change relative to stronger, adjacentcommunities and cooperation betweenthese neighbours is weak or non-existent.1
Limiting and limited environment
The universal application of environmentallimits as a homogeneous force acting uponall pre-Hispanic Amerindian communitiesinhabiting the lowland neotropics appearscounterintuitive when considering the real-ity of biophysical variation across theregion (see Chapter 2) (Roosevelt, 1998, p.192; 1999, p. 372). At the same time, abelief that human inhabitation fundamen-tally altered most of ‘Amazonia’ and thatthis always led to an improvement in landcapability ostensibly lacks the material evi-dence needed to support this sweepingcounter-viewpoint (e.g. see Lavallée, 2000).Despite hyperbolic claims of forest manipu-lation, local examples of more advancedpre-Hispanic Amerindian settlements inthe neotropical lowlands have beenunearthed that clearly show land manage-ment techniques, such as raised fields,causeways, drainage canals and soil enrich-ment (Denevan, 1970; Parsons andDenevan, 1974; Spencer et al., 1994, 1998;
Erickson, 2000). These are akin to butarguably not as developed (or well pre-served) as those employed by advancedhighland civilizations in Mexico, CentralAmerica and the Andes (e.g. the chinampasof Lake Xochimilco and Chalco, Vallé deMexico) (see later, ‘Site types: earth engi-neering’).
Acceptance of a uniformly limitinglowland environment would have toaccount first for the interaction between thehistorical geography of prehistoric colo-nization and social development and thegeographic variation in biophysical dynam-ics across the region (see Chapter 2) in away that maintains communities in ahighly isolated state with little capacity ormotivation to innovate, build, trade or iden-tify more economic settlement locations.The colonization of all lowland regions ofSouth America could not have occurredsimultaneously. Available evidence sug-gests that this process occurred along linesof least risk and greatest familiarity, demar-cated by the major waterways and coast-lines (Rouse and Cruxent, 1963; Dillehay,2000; Lavallée, 2000) as has been argued inthe case of North America prehistory(Dixon, 1999). Common environmentalchanges, such as severe drought, flooding,fire, disease, mudslides, earthquakes, vol-canic eruptions, hurricanes and other envi-ronmental tests of social resiliency have notaffected all parts of the lowlands in thesame way or to the same degree over theQuaternary (see Chapters 2 and 7), so theenvironmental limitation theory mustassume these as redundant to high-fre-quency challenges presented by more pro-tracted (or low amplitude) attributes of achanging landscape, such as soil, rock andtopography. But these too are not uniformacross the lowlands of South America, evenby the strictest demarcation of the lowlandforest ecosystem (see Chapter 2). Moreimportantly, they could be engineered tosuit human needs – high amplitudechanges to the landscape conveyed by cata-strophic weather and diastrophic eventswere (and remain) less easily managed. Theinteraction of these varying environmentalconditions and human geographies sup-
382 D.S. Hammond

ports a multiplex view of human–forestrelationships – in some regions the rela-tionship was more likely driven principallyby sociocultural development and expan-sion, in others it was driven predominantlyby biophysical limitations.
Assumption of pristine beginnings
Ecologists, by seeking exclusive biophysi-cal explanations for spatial patterns ofstanding biological diversity, assumeimplicitly that past effects of human activ-ity were spatially uniform (see Roosevelt,1999, p. 385). By default the adopted viewis one of an environment uniformly limit-ing prehistoric sociocultural growth acrossthe lowland neotropics (Meggers, 1954)combined with an assumption that modernpatterns of inhabitation and land useroughly follow prehistoric ones. By select-ing remote locations, samples are stratifiedin relation to modern patterns and thusaddress the effects of broad-ranging varia-tion in prehistoric human impact. But thenan assumption of geological, pedologicaland climatic uniformity is made. Again,neither assumption is valid (see Balée,1992, 1998; Chapter 2, this volume).
In the case of highly organized pre-Columbian societies, such as the Maya orTiwanaku, both perspectives appearequally true – innovation and social struc-ture drove novel means of extremely pro-ductive, well-managed land use in someareas (Siemens and Puleston, 1972;Matheny, 1976) (e.g. around lakes, flood-plains, wetlands), but perhaps less so inothers (e.g. rocky upland slopes, sandyplateaux). The role of intensified drought asa social dismantling factor is increasinglydifficult to deny in the case of largeAmerindian civilizations, such as the Maya(Curtis et al., 1996; Gill, 2000; Hodell et al.,2001; Haug et al., 2003).
But how would drought resonatethrough such societies, leading to their dis-mantling and thus change in forest usepractices? Plausible avenues of decline maysimply mirror more recent agriculturalpractices. For indigenous communities
working within the ejido system acrosssouthern Mexico, community growth leadsto the formation of landholding and land-less groups within the farming collective, aminifundio, despite intentions to the con-trary (Simpson, 1937). In the case of theZoque of Chiapas, landless ejidatarios areforced to cultivate marginal lands on theboundary of the community holding. Themanagement of these rocky slopes for agri-cultural production is difficult, particularlyduring periods of extreme weather. In con-trast, the more fertile valleys below aremanaged more easily and extensively bythe few large, land-owning members(Hammond, 1991). Management tools inboth past and present Maya agroforestryand religious practices have also modifiedforest composition through the selectiveretention of useful trees and groves (e.g.Brosimum, Spondias, Manilkara)(Puleston, 1982; Gómez-Pompa, 1987;Gómez-Pompa et al., 1990; Hammond,1991). Many of the trees retained by theMaya, Uto-Azteca, Zoque, Zapotecs andtheir descendants are also commonly foundthroughout much of the mature forest areaacross modern-day southern Mexico,Guatemela and Belize (e.g. Breedlove,1981).
Thus, growing social inequalities, for-est management decisions and acceleratingphases of environmental change may havecombined to drive the rate, intensity andtype of forest use by prehistoric lowlandMayan communities, as they do today.Social and biophysical forces interacteddynamically to define the intensity and geo-graphic extent of forest modification by pre-Hispanic Mayan societies and, in turn, theeffects of environment on social change. Inthe lowland tropical forests of SouthAmerica, large permanent structures likethose that have assisted in defining the spa-tial distribution of Maya populationsremain largely undiscovered or non-exis-tent. Where structures are identified in low-land forest areas, they are typically linkedto exposed rock formations or large rivermargins and yield less insight into use ofthe surrounding forests growing on deepsoils of undulating terra firme. This unre-
Socio-economic Aspects of Forest Use 383
solved footprint of prehistoric humanimpact confounds efforts to demonstratecausal linkages between patterns of stand-ing forest diversity and biophysical attrib-utes, particularly where these attributesand those characterizing past human forestuse ultimately prove to be spatially concor-dant.
Do patterns of standing diversitypurely reflect geographic shifts in climate,topography and soil attributes or the influ-ence of people selectively manipulatingforests along these physical gradients?What if a fraction of remote sample plotsused to explore patterns of plant diversitywere under field-fallow management orfavoured as hunting grounds several thou-sand years ago? Would the inflection of thisforest use still resonate in the standingdiversity and structure registered today inremote forests? If so, then the biophysicaltrajectory defining forest change at a sitemay also be constrained by its positionalong an intensity gradient of prehistoricland use. Community, population and even(long-lived) individual responses measuredin modern time may partially reflect histor-ical modification of composition along aselection axis defined at one point byhuman resource decision-making, ratherthan by plant life history–populationdynamics alone.
Evidence accruing through archaeologi-cal, ethnobotanical, phytolithic and char-coal studies increasingly supports thisview. Many lowland neotropical forest sitespreviously considered as pristine are nowin fact considered modified as a conse-quence of human use at various timesthroughout the Holocene (Eden et al., 1984;Piperno, 1990, 1994; Kennedy and Horn,1997; Wood and McCann, 1999; Pipernoand Jones, 2003). Balée refers to theseforests strongly shaped by past human useas ‘artefactual landscapes’ and suggests thatthey are the remnants of former agriculturalregression–expansion phases driven bysociopolitical, rather than environmental,forces. War, disease and poor decision-making forced large, organized chiefdomsto dissolve into nomadic bands. The rela-tive importance of foraging and horticul-
tural practices in sustaining livelihoods,and thus impacts on forest cover and com-position, oscillated with these changes insocial structure. Again, however, explana-tions ascribing total control over lowlandsocial structure to sociopolitical events failto integrate the clear relationship betweenresource scarcity and societal focus. Spatialand temporal variation in resource scarcitywould more likely have interacted with thestrength of sociocultural cohesion andinnovation to shape forest resource use pat-terns, as they do today (see Fig. 1.1, Chapter1).
Modern land-use and forest change
The relationship between contemporaryland-use patterns and forest change is, forobvious reasons of data availability, muchclearer. The web of feedback linkages is farfrom fully resolved, particularly in the caseof the lowland neotropics, but the relation-ship between socio-economic and biophys-ical drivers of forest change iswell-documented (Moran, 1982; Hecht,1985; Buschbacher, 1986). Interestingly,many causes of modern forest use in theAmazon appear to have very little to dowith rational land use and everything to dowith sociopolitics, a fact not to be over-looked while seeking to sculpt a robustinterpretation of relationships betweenscattered archaeological evidence and theprehistoric record of environmental change.
Dialogue on modern lowland forestland-use patterns unfortunately also suffersfrom an inherent tendency to scale-up site-specific findings. Much like the debate overthe prehistoric timing and extent of humanlowland occupation, the geographic varia-tion, scale-dependency and relative impactof modern lowland land-use practices oftenget lost in the drive to scale-up applicabil-ity. As a consequence, concepts of environ-mental and historical lowland uniformityare perpetuated (the ‘Amazon’). Continuousimpact gradients are transformed into bino-mial ones, despite considerable, high-qual-ity multidisciplinary field evidence arguingto the contrary. Deforestation and defauna-
384 D.S. Hammond

tion (both forms of liquidation) define theextreme end of a resource-use gradient thatequally embraces lower intensities of selec-tive logging, hunting, field agriculture andplant extraction, through to a minimumallowable use regime defining traditionalsacred and modern protected area concepts.The primacy of one end of the spectrumover the other varies geographically andwith spatial scale as socio-economic andbiophysical features intersect to define landuse and its consequences.
About This Chapter
The Guiana Shield defines one end of thisspectrum and the socio-economic and cul-tural influences on its past and future forestlandscape are not necessarily consonantwith other regions of the neotropics. Thus,this chapter aims to illustrate how theregion fits within the broader socio-eco-nomic and (pre)historic human landscape.It briefly describes and explores the interac-tion between prehistoric, historic and mod-ern socio-economic features and theirrelationship with forest resource usethroughout the Guiana Shield as a conduitto further exploring the changing geo-graphic extent and focus of human use.
Prehistoric archaeological evidenceand the historical record of colonizationcan assist in delimiting spatial variation ofanthropogenic impacts and the likely meas-ure of forest modification that occurred as aconsequence. It can also help establish howresource use objectives and methods havechanged, and the implications thesechanges have had for forest conservationand sustainable use and the way in whichpeople used and managed their local forestresources. The merging of immigrants,whether forced through slavery, offeredthrough indenture or undertaken throughthe prospect of opportunity, and indige-nous societies created a new forest-usedynamic that has in many areas changedthe forest trajectory for the foreseeablefuture.
The chapter also broadly characterizesthe modern historical trends in population
growth and distribution, socio-economicconditions and forest resource use as keyprocesses intertwining with biophysicalfeatures to shape tropical forest changeacross the Guiana Shield. It does not coverthe wide-ranging political dimension ofmodern forest use in the region, includingthe implications of land ownership, multi-national incorporation, public financialincentives (or subsidies) to forest-useindustries, or international relations,among others, although these are clearlyimportant and have been widely discussedelsewhere. History, health, education, lawand other facets of our social systems are,and historically have been, fundamentaldrivers of forest conservation and use pat-terns (see Fig. 1.1, Chapter 1). There is goodreason, and sufficient evidence, to believethat these also played an equally importantrole in pre-Columbian societies. Exploringbiophysical explanations alone uninten-tionally dismisses the role of humans inshaping modern-day forests of the regionprior to and following the arrival of the firstEuropeans. Given the vast and relativelyaccessible literature on modern history, anaccount of modern (post-1900) politicalchange in the Guiana Shield countries hasnot been included here, although it clearlyhas driven much of the forest use and pro-tection in the region.
As with all synthetic works of thiskind, it is far from definitive and the readeris referred to the many references includedin this and other chapters of the volume forroot perspectives and results. The chapterdoes not address the taxonomic relation-ships between the various archaeologicaltraditions, complexes and series that aretypically employed to distinguish cultural‘phases’ based on stylistic interpretation ofartefacts. Based on the review conductedhere, it appears that more often than not,new styles lead to new taxa, creating a pro-liferation of site-based classifications.These are less often explained as part of alarger, emerging picture of cultural devel-opment in South America (Lavallée, 2000,p. 107). Establishing a coherent chronologyamong the diverse artefacts at one site istypically beset by methodological issues,
Socio-economic Aspects of Forest Use 385

often steeped in controversy, let aloneamong the hundreds of excavated sites andsolitary artefact finds located along mostlowland rivers. While potentially resolvingthe long-term link between spatial and tem-poral patterns of forest use, an intensivelook at prehistoric migration across thelowland forests of the Guiana Shield isbeyond the scope of this chapter and refer-ences to the various traditions, phases andseries have been avoided intentionally. Abasic system comprised of Palaeo-Indian(earlier than 6.5 ka BP), Meso-Indian(6.5–3.0 ka BP), Neo-Indian (3.0–0.5) andIndo-Hispanic epochs (0.5–0.1) (after Rouseand Cruxent, 1963) has been adopted wherelarger time intervals require distinction, orevidence is assigned an age based onsimilarities with other styles rather thanmaterial dating.
Human Prehistory of the Guiana Shield
Entry, dispersal and population growth in theneotropics
Three facets of human prehistory in thelowland neotropics continue to remainunsatisfactorily resolved: (i) the timing andlocation(s) of initial arrival; (ii) the ensuingpattern of colonization across the region;and (iii) the maximum density the low-land populations achieved prior to thearrival of the first Europeans. All three havesubstantial bearing on the extent and inten-sity of prehistoric forest modificationbecause together they define how and inwhat way forest resources were utilized,and managed, over a period that wouldhave seen the standing forest biomassnaturally turnover between 20 and 2400times based on estimates for modern forestgap formation and stem mortality (seeChapter 7).
The peopling of the lowland neotropicsis believed by many anthropologists, archae-ologists and linguists to have commencedaround 12,000 years ago as a southwardmovement of the initial Clovis migrationacross the Bering Strait land bridge and icesheets. Many others, however, argue that
evidence increasingly points to a pre-Clovispeopling of South America, either througha more rapid seaborne southward move-ment along the Pacific coastline or as anentirely separate event not linked to theBering Strait route (Dixon, 1999; Dillehay,2000; Lavallée, 2000). Radiocarbon-datedmaterials associated with several archaeo-logical sites have been posited as supportfor an earlier inhabitation of lowland areas,although these thus far are clearly associ-ated with coastal, rather than deep interior,regions and only adjust the earliest knownentry by a millennium at most (Roosevelt etal., 1996; Sandweiss et al., 1998; Dillehay,1997).2 The exception is a series of cavesites near the São Francisco River valley inthe eastern Brazilian Shield that have asso-ciated charcoal radiocarbon dated between32 and 56+ ka BP (Guidon and Delibrias,1986; Bahn, 1993; Santos et al., 2003),based on new oxidation pretreatment tech-niques (Bird et al., 1999) (Fig. 8.1).3 Atanother site in the same region, submittedU-Th decay dates for putative quartzic arte-facts range from 204 to 295 ka BP (deLumley et al., 1988). Ancillary approachesbased on linguistic (Nichols, 1990) andmolecular (Torroni et al., 1994) analyseshave also argued for a significantly earlierentry date, some 20–30 ka BP, assumingentry through a single group. Studiesemploying alternative linguistic, molecu-lar and anthropological techniques, how-ever, have also yielded results that fullysupport the original view of a later, Clovisentry (Nettle, 1999; Brace et al., 2001;Zegura et al., 2004). The growing number ofnear Clovis dates for South Americanlocations combined with more extensivedocumentation and site validation(Dillehay, 1997) generally support the viewof an entry into South America occurringmuch faster and earlier than previouslythought.
The movement of prehistoric peoplesacross the neotropics has always remainedclouded by shifting theoretical perspectivesand the inability to resolve a clear spatialchronology from material finds that can becomplicated by patterns of trade (Lathrap,1973), nomadism (Rostain, 1994), commu-
386 D.S. Hammond

nity fission–fusion (Meggers, 1995), migra-tory overlap, material and site recycling(DeBoer et al., 1996; Meggers, 2003) andquestions regarding assigned provenance ofcharcoal and other artefacts typically usedto date occupation (Meltzer et al., 1994).This latter source of error is particularlyimportant in establishing the earlyHolocene occupations, since supportingevidence at virtually all of these sites isanchored by charcoal radiocarbon dates.
The error arises from the fact that charcoaldated to the early Holocene is not alwaysassociated with archaeological remains (seeChapter 2) (Hammond et al., unpublishedresults), is susceptible to size-dependentvertical and horizontal movement (e.g. inlake sediments: Whitlock and Millspaugh,1996) and lacks the calibration that wouldallow anthropogenic charcoal to be distin-guished as a matter of probability from thataccumulated as a consequence of vegeta-
Socio-economic Aspects of Forest Use 387
Fig. 8.1. Archaeological sites (solid triangles) proposed to reflect occupation by humans more than 8000years BP (late Pleistocene–early Holocene). Circled locations are those proposed as pre-Clovis (c. 12,500BP) inhabitation sites. Question mark number indicates relative lack of confidence/controversy in evidencesupporting antiquity of the occupation from considerable (??) to very little (0). Site locations and ageuncertainties adapted from assessments made by Lavallée (2000), Dillehay (2000) and Gassón (2002).Note the absence of any putative pre-Clovis sites from the Guiana Shield and larger lowland Amazonia.
??
????
??
?
?
0
?
Equator

tion fires across the neotropics (e.g. easternEngland: Bennett et al., 1990).
Assuming earliest charcoal dates faith-fully indicate timing of site occupation, apicture of wide-ranging colonizationbetween 14 ka and 8 ka BP is apparent.4 Bothcoastal and overland routes have been pro-posed at one time or another, but continueto shift as new sites are integrated and oth-ers removed from the accepted chronology(Meltzer, 1995; Dixon, 1999) (Fig. 8.1).Using the most recently proposedPleistocene–early Holocene sites, the mostfavoured early route would be along thePacific coastline, with subsequent move-ment eastward and down the Atlantic coasttowards southeastern Brazil with coloniza-tion occurring along the Caribbean coast ofVenezuela, the lower Amazon, and up theSão Francisco watershed along the easternrim of the Brazilian Shield. Sea level alongboth coasts would have been 20–100 mlower than present (see Fig. 2.36), depend-ing on timing and extent of local isostatic,steric and epeirogenic adjustments (see‘Sea-level change – Neogene’, Chapter 2). Ifearly settlers were largely engaged in mari-time livelihoods (Sandweiss et al., 1998),then many of the earliest settlements maycurrently be submerged along key coastalstretches (Dillehay, 2000). This would seemall the more likely along coastal lengthswhere the exposed Pleistocene continentalshelf was wide (e.g. along the Guiana coastbetween Isla de Margarita, Venezuela andParnaiba River in Maranhão state, easternBrazil) and less likely where there was onlya narrow shelf exposure (south of theParnaiba) (Fig. 2.37). Interestingly, the twooldest sites at Monte Verde, Chile and PedraPintura, Brazil (Fig. 8.1) are located adjacentto coastal regions with narrow shelves. Nomodern coastal sites of similar antiquityhave been identified along the much widertropical Atlantic shelf regions (see below).
Entry and early occupation in the GuianaShield (12–7 ka BP)
If early movement and colonization alongthe eastern rim of the Guiana Shield
occurred during the Pleistocene termina-tion, site evidence of these is probablyburied seaward of the current coastline.None of the existing archaeological, linguis-tic, molecular or anthropological data sup-port an occupation of the large, centralinterior (>300 km inland) of Amazonia ear-lier than 9200 years BP. The earliest physi-cal dates come from interior sites along theupper Orinoco (Barse, 1990), along thenorthern shield margin, at Monte Alegre(near the mouth of the Maicaru River, N.Pará), along the southern shield margin(Roosevelt et al., 1996), in the Serra doCarajás region of central Brazil and alongthe western shield margin at Peña Roja(Gnecco and Mora, 1997). The location ofall of these sites could also be seen asperipheral to the central Amazonian low-lands, given their proximity to extensiveshrub or grasslands (upper Orinoco, Serrado Carajás) or coastal river mouths (MonteAlegre), except Peña Roja, where uncer-tainty remains over the provenance of thedated charcoal deposits. No material fromsites within the central Guiana Shield thusfar have been dated to this early period. Theabsence of materials in the region dating tothe earliest millennia is, however, difficultto interpret in the context of entry into theGuiana Shield for several reasons.
First, considerable archaeologicalmaterials have been found throughoutmuch of the Guiana Shield but anchored byfew radiometric dates. Instead, seriationcombined with stratigraphic techniqueswere principally used in an attempt toreconstruct cultural timelines, migrationpathways and trade relationships across theregion (e.g. Howard, 1947; Evans andMeggers, 1960). These are exclusivelybased on the stylistic and stratigraphicalassociation of ceramic materials (see‘Material types: ceramics’, below), anapproach that governed archaeologicalfocus during the peak period of investiga-tion in the region from 1940 to 1980.Ancillary material amenable to direct dat-ing, such as charcoal, pollen, seeds, phy-toliths and bone material were lesscommonly the focus of investigations,although charcoal has long been the
388 D.S. Hammond

material of choice in anchoring timelinesfor ceramic and other midden remainsdespite changes in field archaeologicalmethods (see above). Another potential biasreducing the likelihood of older finds in theGuiana Shield is linked to the heightenedacidity of the region’s soils and rivers (seeChapter 2). Human skeletal remains, thesine qua non of human presence, are com-posed largely of calcium carbonate andwould dissolve at a much higher rate underthese very acidic conditions relative todrier and/or colder conditions presented inthe eastern Brazilian Shield and Andeanregions, respectively. Where skeletons havebeen found in the Guiana Shield, they areoften associated with raised, calcium-enriched shell middens (e.g. Williams,1996a, 1998) or rock outcrops along thesavanna periphery (e.g. Evans and Meggers,1960). Both site types act to buffer thebuild-up of acidity that otherwise occurs indeep tropical forest soils or coastal areaswith peat, cat clay or other stagnic proper-ties (see ‘Soils and Soil Fertility’, Chapter2). As a consequence, while occupation byprehistoric groups over most of the riverineand savanna regions along the periphery ofthe shield is probable, the earliest timing oftheir entry, duration of occupation andextent of forest use at the heart of theGuiana Shield remain unclear.
The finds along the upper Orinoco andat Monte Alegre and Carajás, along withthose at Pedra, preliminarily suggest thatsome of the earliest occupations of the low-land interior occurred along shield periph-eries. The advantages of long-term sitestability and upland escape from pestsafforded by rock formations along shieldperimeters combined with continuedaccess to the heightened productivity alongmajor river mainstems (Orinoco, Amazonand Tocantins) would make these loca-tions, in theory, ideally suited to a liveli-hood based predominantly on foraging,hunting and fishing (also proposed byGoulding et al., 1996, p. 21). For the samereasons, however, the selective discovery ofthese ancient materials may reflect aninherent spatial bias in material dating.Akin to peat bogs and lakes that selectively
offer superior pollen yields (see Chapter 2),habitation sites established along shieldperimeter regions are inherently morelikely to remain in a well-preserved condi-tion relative to those established in depres-sions continuously affected by severehydrological or diastrophic disturbances.The Amazon Depression, Sub-AndeanTrough and Coastal Shelf regions haveexperienced significantly higher substrateturnover rates throughout the Quaternaryover much of their area as a result of riverwandering and sea-level change. As a con-sequence, site mixing or ablation in theseareas is far more likely (Lathrap, 1968;Meggers, 1984, p. 642).
The earliest entry into the GuianaShield would appear consistent with thePalaeo-Indian epoch, dating before 6.5 kaBP, but no earlier than 9 ka BP. This is basedon the radiocarbon dates of pre-ceramicmaterials along the region’s perimeter(mentioned above) and selective finds oflithic remains (particularly projectilepoints) in Venezuelan Guayana (Dupouy,1956, 1960; Rouse and Cruxent, 1963),western and southern Guyana (Roth, 1924,1929; Evans and Meggers, 1960) and alongthe Rio Negro (Roosevelt, 1999, p. 378).Published data, however, thus far suggestthat the Guiana Shield was not a first pointof settlement for populations that moreplausibly moved southward along theCaribbean coast (Evans and Meggers, 1960),across the Venezuelan and Colombianllanos, along the Orinoco (Rouse andCruxent, 1963; Gassón, 2002), and along theAmazon River between the Atlantic andeastern Andes (Evans and Meggers, 1968)(Fig. 8.1), even though evidence supportingthese routes comes largely from assess-ments of more recent (<6 ka BP) prehistoriccultural connections. Whether these peoplein fact arrived as a southward extension ofthe Clovis migration along the spine of theCentral and South American cordilleras,via a Pacific coastal route, by transoceanicvoyage (e.g. waif arrival), or a combinationthereof, current data would indicate thatthe Guiana Shield was not the first region tobe colonized. The upper Orinoco–RioNegro axis may have been used as a thor-
Socio-economic Aspects of Forest Use 389

oughfare connecting the relatively produc-tive northern llanos and southern AmazonDownwarp, but archaeological evidencefrom the watersheds of both the Amazonand Orinoco does not to date support anearly, long-term occupation of the region.This early occupation is more plausiblyassigned to other physiographic regions,such as the Pacific coastal lowlands, easternBrazilian Shield, Central America or theAndean highlands. While long-term, seden-tary occupation over most of the GuianaShield interior by early foraging proto-hor-ticulturalists appears improbable, this the-sis still requires much more intensive studyto further argue the case either way. Giventhe incredibly small search and samplingeffort employed across the most remoteparts of the shield region (GuayanaHighlands, Tumucumaque Uplands), theinitial date and extent of occupation byPalaeo-Indian societies remains highlyspeculative.
Artefact evidence supporting prehistoricoccupation of the Guiana Shield
A wide array of artefacts, however, has beencollected from various locations within theGuiana Shield (Fig. 8.2). Most of thismaterial currently points to an Amerindianinhabitation dating back to at least 6 ka BP,although not all evidence has been easilyintegrated into a cultural timeline (e.g.ceramic styles), or typologically connectedwith other similar materials elsewhere (e.g.petroglyphs, stone implements). The mainforms of evidence known from the GuianaShield can be grouped into material artefactand site type categories. Material artefactshave been grouped here into: (i) lithic; (ii)ceramic; (iii) metalwork; and (iv) organicremains. Site type groups include: (i) caves,grottos and rockshelters; and (ii) earth-works.
Material types: lithic remains
Lithic remains include a diverse group ofart and artisanal tools and products. Rock
was often used as a canvas (petroglyphs,rock paintings), a medium (tools, stonearrangements, monoliths, jewellery) or aworkbench (polissoirs).
Petroglyphs (roche gravées, arte rupestre,rotstekeningen)
DISTRIBUTION Carved rock art has beendescribed from most parts of the world(Chippendale and Taçon, 1998) and in par-ticular across the Americas (Mallery 1893;Rouse, 1949; Dubelaar, 1986). Petroglyphsrepresent some of the earliest documentedevidence of prehistoric occupation, figuringprominently in the journals of early explor-ers, due largely to their relative visibilityand permanence compared to other indica-tors of prehistoric human presence. Theyhave been described from locationsthroughout the Guiana Shield over the last130 years by a large number of archaeolo-gists, anthropologists, geologists, foresters,surveyors and explorers (Brown, 1876; ImThurn, 1883; Rodway, 1919; Cruxent, 1950;McKenna, 1959; Evans and Meggers, 1960;Guppy, 1961; Hurault et al., 1963; Rouseand Cruxent, 1963; Bubberman, 1973; vonHildebrand, 1975; Dubelaar, 1976, 1981,1986; Poonai, 1978; Williams, 1978b,1979b; Dubelaar and Berrangé, 1979; Blair,1980; Hilbert and Hilbert, 1980; Rostain,1987, 1994; Rivas, 1993; Greer, 1995;Gassón, 2002) (Fig. 8.2, filled circles).Despite the geographical scale of their dis-tribution across northeastern SouthAmerica, petroglyph location in the shieldand adjacent regions typically adheres to atleast two of the following basic criteria, i.e:(i) the punctuated or isolated outcroppingof intrusive rock formations; (ii) proximityto water; and (iii) an association withwaterways or coastlines that link differentparts of the broader region.
Petroglyphs have been found least fre-quently in savannas encircling the shieldregion, despite these areas being moreamenable to surveying (Fig. 8.2). It isimportant to note that several significantpetroglyph groups have, however, beenrecorded in the Sipaliwini (Bubberman,1973), Parú (Frikel, 1969) and Rupununi
390 D.S. Hammond

Socio-economic Aspects of Forest Use 391
Fig. 8.2. Distribution of artefactual evidence of prehistoric occupation across the Guiana Shield. (A) Rockart: petroglyphs (solid circles), rock paintings (open squares), stone arrangements (crosses), locations ofsandstone formations suitable for cave formation and rock painting (open circles). (B) Pre-Columbianceramics (solid squares) identify sites ranging from Palaeo-Indian to Indo-Hispanic epochs. (C) Earthworks:shell mounds (solid triangles), earth mounds (solid circles), raised fields (solid squares), causeways(open squares with solid centre), highland terraced fields (open circles with solid centre). (D) Terra preta:site locations (solid squares) ranging in size from one to several hundred hectares. See Notes for source references.
A
BPre-Columbian
Ceramics
Rock art
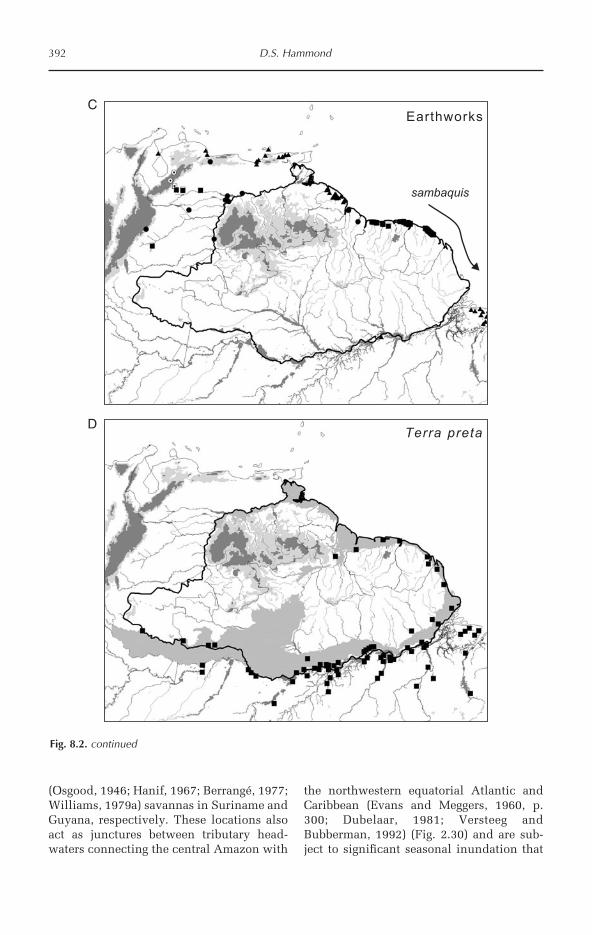
(Osgood, 1946; Hanif, 1967; Berrangé, 1977;Williams, 1979a) savannas in Suriname andGuyana, respectively. These locations alsoact as junctures between tributary head-waters connecting the central Amazon with
the northwestern equatorial Atlantic andCaribbean (Evans and Meggers, 1960, p.300; Dubelaar, 1981; Versteeg andBubberman, 1992) (Fig. 2.30) and are sub-ject to significant seasonal inundation that
392 D.S. Hammond
Fig. 8.2. continued
C
D
Earthworks
Terra preta
sambaquis
physically links or reduces the distancebetween divergent basins (Fig. 2.35). Thiswould make local savanna rock outcropsfunctional homologues to the exposeddykes and sills that yield rock drawingsmore often registered along rivers(Dubelaar, 1981).
Glyphs associated with mountainousterrain are even more poorly known.Several glyphs have been tentatively identi-fied along the rocky slopes of the IwokramaMountains, central Guyana (Plew, 2002),although these require further documenta-tion and validation. They are believed to bevirtually absent from the outcrops scatteredacross central Suriname and French Guiana(Dubelaar, 1986), but have been less com-prehensively surveyed in the Pakaraimahighlands of Guyana and Venezuela.Petroglyphs are much better known fromvarious watersheds across the southern faceof the Venezuelan Andes to the north (e.g.Novoa and Costas, 1998 in Gasson, 2002),and along the middle reaches of the Caura,Caroni, Ventauri, Cuyuni and OrinocoRivers in Venezuelan Guayana (Cruxent,1947; Evans et al., 1959; Blair, 1980;Dubelaar, 1986; Silva, 1996). But here tootheir occurrence appears to reflect somegeographic selection process. In mostinstances they are found near waterways,supporting the association of rock withwater, but more intensive surveying at vari-ous locations along the eastern Andeanslopes (Spencer, 1991) and southernGuyana (Berrangé and Johnson, 1972;Dubelaar and Berrangé, 1979; Williams,1979a) confirms that not all waterways thatoffer suitable sites for petroglyph manufac-ture, or are connected with lowland areas,are necessarily worked.
They also appear sparse or absent overmost of the coastal flatlands from theOrinoco to western French Guiana (Fig.8.2). Their absence from these areas may bemore easily understood, being consonantwith the distribution of deep Quaternarysediments that dominate most of the coastallandscape. Where these deposits thin alongthe coast north of the Orinoco(Guarapiché/Paria Peninsula) and in east-ern French Guiana (near Cayenne),
Precambrian or Palaeozoic rock is exposedand petroglyphs are present (Rouse andCruxent, 1963; Dubelaar, 1986; Rostain,1987; Versteeg, 1995). Similarly, sedimentsdominating the geosynclinal trough south-ward of the Venezuelan and ColombianAndes offered very few rock outcrops toprehistoric petroglyph artists. As a conse-quence, examples of rock art are also largelyabsent from the extensive wet grasslands ofthe Venezuelan and Colombian llanos(Gassón, 2002) (Fig. 8.2).
Williams (1979a) also notes, however,that petroglyphs have yet to be recorded inthe area of Guyana north of the MazaruniRiver (Fig. 8.2), despite the presence ofnumerous exposed rock lines along themajor rivers in this region. In the case of theupper river reaches and piedmonts of theadjacent Guayana Highlands, the little evi-dence of petroglyph writing available mayalso reflect the relatively low survey effortexpended to date in this rugged region.Local residents typically have a far morecomprehensive knowledge of site type andlocation that is rarely reflected in the litera-ture.
PURPOSE The incidence of petroglyphsacross the region is consistent withrock–water landscape controls on manufac-turing opportunities, but their absence isnot. Where petroglyphs occur, they are typ-ically found clustered along river sectionsor in savannas, but numerous sitesamenable to their manufacture have notbeen utilized. It is reasonable to proposethat prehistoric petroglyph artists selectedsites on the watershed scale, based on anapproximate distribution of known carv-ings (Fig. 8.2), the distribution of suitablerock formations and considering studieswhere the delineated study area has beenthoroughly surveyed (e.g. Berrangé andJohnson, 1972; Dubelaar and Berrangé,1979).
The notion of watershed-based siteselection would tentatively support the useof basin connectivity as a third criterion forselection and the view that petroglyphsmay represent trade or travel route markersin certain instances (e.g. Redmond and
Socio-economic Aspects of Forest Use 393
Spencer, 1990; Spencer, 1991). Efforts toattach them otherwise to existing ceramicchronologies have been attempted,although evidence is largely interpretive(Greer, 1995). Fishing guidelines (Williams,1979b), spiritual icons and shamanisticpractices (Rivas, 1993; Williams, 1993)have also been suggested as the purposeunderlying petroglyph manufacture at vari-ous locations, but in many ways these theo-ries lack the clear support required forcritical consideration. As an iconographicsystem that still lacks a robust translator,petroglyphs remain open to wide-ranginginterpretation. This fact is emphasized bythe apparent similarity in symbol use (e.g.concentric circles) between shield andother sites on multiple continents (e.g.Europe, Africa) that have no apparentchronological, cultural or geographic affili-ation within the timeframe of shield colo-nization and occupation over the Holocene.
TIMING OF MANUFACTURE Petroglyphs arenot readily or reliably dated using radiomet-ric techniques applied to other artefacts, inpart because their manufacture involves theremoval, rather than addition, of material.The absence of clear stylistic associationsacross the region and the possibility thatmany large, complicated works may in factrepresent palimpsests further confoundsefforts to figure these important remnants ofprehistoric culture into a functional time-line and establish the ultimate purposebehind their creation. Several authors havesuggested links with cultural phases rangingfrom late Prehispanic (500 years BP) throughto early Mesoindian (7000 BP) periods. Thewide range in time period offered illustratesthe uncertainty over their origins in theabsence of material dates.
Williams (1978b, 1979b) noted that anumber of petroglyph clusters in Guyanaalong the Kassikaityu, Mazaruni andBerbice were only exposed during anom-alously dry years (i.e. very strong El Niñoyears) when river stages were extremelylow. This is also the case at sites along themiddle Essequibo River (D. Hammond, per-sonal observation). Williams widely inter-preted this to suggest that river stages were
permanently lowered in the past as a con-sequence of sustained rainfall decline(‘mega-Niño events’ in the parlance ofMeggers (1994)). Surprisingly, trial recre-ations of petroglyph processing have notbeen undertaken to establish the amount oftime and effort required to create existingimages and whether these could be createdunder river stage extremes similar to thoseof today. It remains equally probable thatimages were simply manufactured duringdroughts of modern duration and accumu-lated through a succession of such periodsout of opportunity, as part of a ritualizedrecording of these periods or through place-ment of instructions or markers as histori-cal reference points denoting low riverstage extremes (i.e. El Niño severity).Alternatively, rock faces may have simplybeen dismantled by river currents (orhuman action) over the intervening period,lowering petroglyph levels. Further study isneeded to establish the most plausible routeand functional significance, if any, of theiremplacement level.
Stone arrangements (géoglyphes, assemblagesde pierres, stone rows and circles)
DISTRIBUTION Stone arrangements havebeen documented from the Calcoene Riverarea along the Amapá coast (Meggers andEvans, 1957), the Sipaliwini and Parúsavannas (Frikel, 1961, 1969; Bubberman,1973; Boomert, 1980b, 1981), the south(Williams, 1979c) and north (Schomburgk,1836; Brown, 1876) Rupununi savannas,the Rio Branco savannas (Henderson,1952), the south Pakaraimas/Ireng regionnear Kurukubaru (Brown, 1876; Roth,1929), the lower Ventauri River region ofVenezuelan Amazonas (Evans et al., 1959)and the Tumucumaque Uplands along thesouthern border of French Guiana (Huraultet al., 1963; Rostain, 1987, 1994) (Fig. 8.2,crosses). They have typically been foundresting atop the smooth, convex surfaces ofexposed outcrops of crystalline basementrock (granitoids, greenstones), often with agood view of the surrounding area (Meggersand Evans, 1957; Hurault et al., 1963;Frikel, 1969; Williams, 1979c).
394 D.S. Hammond

PURPOSE Stone alignments are widelyinterpreted as having a ceremonial, ritualis-tic and/or religious function in the beliefsystem of prehistoric societies (Farabee,1918; Meggers and Evans, 1957; Frikel,1969), supposedly since their function can-not be interpreted as serving any other prac-tical role. The variation in alignmentgeometry across shield-based examplessupports the view that they are not mono-thetic cultural insignia, but probablydeveloped by different societies in com-memoration of unrelated events or beliefs(Boomert, 1981, p. 144).
TIMING OF MANUFACTURE Boomert (1981)suggests that many of these alignments areof post-Columbian age, but little materialevidence is available that would improveconfidence in any assigned age. Historicalaccounts of stone pile-making byAmerindians combined with transcriptionof early oral traditions concerning stonealignments provide some support for amore recent (post-Columbian) manufactureof these, at least in the Rupununi–RioBranco region (Schomburgk, 1848; Brown,1876; Roth, 1929). Disturbance at manysites (e.g. Amapá: Meggers and Evans, 1957)would also suggest the possibility of activere-working of arrangements that woulderase any typological information presentin the stone patterning.
Polissoirs (grindstones)
DISTRIBUTION Sites believed to be used forthe manufacture of stone implements havebeen located along virtually all of the majorrivers in the interior of the shield (Evansand Meggers, 1960; Rouse and Cruxent,1963; Williams, 1979b, 1996b; Boomert,1980b; Rostain, 1994; Gassón, 2002). Unlikepetroglyphs, however, polissoirs are knownto occur along much smaller waterways andthose that do not link different basins (e.g.Fig. 66 in Rostain, 1994). Their associationwith water, while not exclusive (e.g. S.Rupununi: Williams, 1979c), is compellingbased on studies documenting their occur-rence across the shield region (Abonnenc,1952; Evans and Meggers, 1960).
PURPOSE Compared with other lithicremains, the functional purpose of grind-stone sites is relatively clear. Their proxim-ity to water would provide easy access tosorted abrasives, such as riverine quartzsands, and small stone materials, that arenot as easily obtained from the surroundingdeep, forest soils while offering a moreopen, hospitable workshop location to theartisan. The use of these workbench sitesfor the processing of other wood, fibre andfood materials is also likely.
TIMING OF MANUFACTURE Polissoirs remainpoorly integrated into the cultural timelineof prehistoric settlement and resource use.Some archaeologists have assigned them tolater Meso- or Neo-Indian (ceramic) epochs(Cruxent, 1947; Rouse and Cruxent, 1963;Williams, 1979a), albeit without radiomet-ric dating of the lithic or other site-associ-ated material. Like petroglyphs, theirpresence is established by the removal ofmaterial and this makes material datingequally difficult. Radiometric dating ofother materials found at grindstone sitescan be associated with these, but the pos-sibility of site recycling invariably fogsestablishment of earliest use without inde-pendent material dates.
Rock paintings (piedras pinturas, pictographs)
DISTRIBUTION Rock paintings, knownfrom scattered locations across the region,are typically found within caves, grottos,rockshelters and along protected cliff walls.They appear to occur most frequently alongthe highland perimeters across the regionadjacent to some of the larger rivers,including the upper and middle Orinoco(Cruxent, 1947, 1950; Perera and Moreno,1984; Tarble, 1991, 1999; Greer, 1995),the eastern slopes of the Guayana High-lands near the Mazaruni and Ireng Rivers(Brown, 1876; Storer-Peberdy, 1948;Henderson, 1952; Attenborough, 1956;Poonai, 1974), in the Chiribiquete complexin south-central lowland Colombia alongthe Vaupés River and along the southernrim at Monte Alegre, adjacent to the lowerAmazon River (Roosevelt et al., 1996) and
Socio-economic Aspects of Forest Use 395
the lower Rio Negro (Wallace, 1853a) (Fig.8.2, open squares). A vast numberof painted cave sites along the middle andupper São Francisco River in theeastern Brazilian Shield region have alsobeen documented (Prous et al., 1984;Guidon and Delibrias, 1986; Lavallée,2000).
Rock paintings are noticeable by theirabsence from French Guiana, Suriname,eastern Guyana and Amapá (Dubelaar,1986). They are not expected from areasnorth of Monte Alegre and its neighbour-ing hills (Morro Grande, Serra Azul, S.Parauaguara) or the upper Rio Negro. Thisis based on an interesting lithologicalfoundation that tentatively appears to linksites otherwise located in contrasting land-scapes. Most if not all rock painting sitesdocumented across eastern South Americaare associated with sedimentary rock types.The most detailed accounts, such as MonteAlegre and Pedra Furada, describe rockpaintings sandwiched between a sedimen-tary base formed from Palaeozoic clasticsand a siliceous or evaporitic precipitatecover (Roosevelt et al., 1996). Rock paint-ings along the lower Rio Negro reported byWallace (1853a) were also associated withsandstone escarpments that represent thewestward extension of the Palaeozoic beltof epicontinental sedimentaries that formthe Monte Alegre structures (Fig. 2.4). Sitesin Colombia, although less intensivelystudied, are also associated with Palaeozoicsandstones forming the Chiribiquete com-plex. In the Pakaraima region of Guyana,sandstones providing the canvas for rockpaintings belong to the PrecambrianRoraima Formation. The absence of suitablesedimentary rock formations acrossSuriname (except Tafelberg, Emma Range),French Guiana and much of the southernshield area would support the absence ofrecords from these areas. Notable excep-tions in this region include isolated siteswith sedimentary lithologies, such as theisolated Rio Novo mesa, Serra Araca (Jauri),Urupi Mountain, Ja and Uneuixi Mountainsand Makari Mountain that form the Quasi-Roraima sedimentaries (see Fig. 8.2, opencircles). This apparent lithological prereq-
uisite would also suggest that the majormassifs forming the Venezuelan Pantepuishould eventually yield further sites, if theprimacy of large river access seen to oper-ate elsewhere did not exclude these head-water locations from the site selectionprocess used by prehistoric, rock paintingsocieties of the Guayana Highlands.
Potential taphanomic (bias) effects oflithology on the distribution of prehistoricrock paintings are substantial (Bednarik,1994). Porous, sedimentary rocks mayenhance pigment adsorption relative tomore dense types. Sedimentary rocks formcaves and rockshelters more readily as aconsequence of their higher rates of chem-ical weathering (see ‘River, Lake and TidalSystems’, Chapter 2) and paintings pro-tected from exposure may remain visiblelonger. Chemical precipitates are alsomore likely to form on the inside surface ofcaves than on exposed rock surfaces, creat-ing a protective cover over the dyed sand-stone surfaces. Alternatively, prehistoricpainters may have recognized thelongevity offered by a sedimentary canvasand selected known sites for this reason.Alone, it remains unclear whether rockpainting sites mark important prehistoricpopulation centres, such as the Santarémor Puerto Ayacucho areas, or are the rem-nants of a much more widespread practice.
PURPOSE Painted caves and rocksheltersare believed to have been used as bothhabitation (Roosevelt et al., 1996) andsacred (Tarble, 1991, 1999) sites based onartefactual evidence recovered from floordeposits. Variation in pictographic stylesand overlap of motifs suggest that thesefunctions may have been employed by dif-ferent groups during alternating periods oftime (Greer, 1995), but too few sites havebeen studied in any detail to synthesizethe role of cave art in regional prehistoricsocieties.
TIMING OF MANUFACTURE Unlike petro-glyphs, polissoirs or stone arrangements,organic paint pigments offer an opportu-nity to employ radiometric techniques tomaterially date the age of rock paintings.
396 D.S. Hammond

More intensively studied rock shelters andcaves with paintings have been dated to thePleistocene termination, around 10 ka BP
(Guidon and Delibrias, 1986; Roosevelt etal., 1996). On the other side of the shield,however, several sites along the upper andmiddle Orinoco region have been tenta-tively assigned to periods extending only to2450 years BP (Greer, 1995; Gassón, 2002).Most known sites within the Guiana Shieldremain poorly studied (e.g. Tramen Cliffs,Guyana) despite their intriguing topo-graphic and artefactual attributes anddespite local knowledge and historical ref-erence to their existence. Herrera (1987,cited in Gasson, 2002) believes that pic-tographs from the Andean piedmont, aswell as the Puerto Ayacucho region, arepalimpsests of work carried out during dif-ferent periods. If true, material dating ofpigment samples from all images would berequired to develop an accurate timeline ofmanufacture.
Stone implements
DISTRIBUTION Tools shaped from stoneare some of the most common archaeologi-cal finds in the Guiana Shield and through-out the wider neotropics. They have beenfound at most archaeological sites in theshield region, including numerous sitesalong the Caribbean coast, Orinoco Riverand its major tributaries in Venezuela(Osgood and Howard, 1943; Rouse andCruxent, 1963; Sanoja and Vargas, 1983;Wagner and Arvelo, 1986), along most ofthe coastal and interior rivers of Guyana(Brett, 1852; Im Thurn, 1883; Verill, 1918a;Roth, 1924; Carter, 1943; Osgood, 1946;Evans and Meggers, 1960; Poonai, 1978;Williams, 1978a, 1996a), Suriname (TenKate, 1889; Penard and Penard, 1917;Geijskes, 1960; Boomert, 1979, 1980a),French Guiana (Reichlen and Reichlen,1944; Abonnenc, 1952; Rostain, 1994) andAmapá (Meggers and Evans, 1957), Pará,Roraima and Amazonas (Becker and deMello Filho, 1963; Boomert, 1979; Hilbertand Hilbert, 1980) (Fig. 8.2). While stoneimplements have not been found at allexcavated sites, a clustered pattern akin to
that resolved for petroglyph locations isnot apparent based on available surveyresults. In fact, stone implements are sowidely dispersed across the region that themany isolated collections made over thepast several centuries have contributedmore than site excavations to typologicalcomparisons (e.g. stone axes, Boomert,1979, Table 1).
PURPOSE The functional purposeassigned to stone implements is wide-rang-ing. Size, form and edging characteristicsare typically used to infer function of stoneimplements, along with wear patterns andassociation with other artefactual materials.Manufactured stone implements have beencharacterized principally as: (i) projectilepoints; (ii) cutting tools, such as axes, chis-els and adzes; (iii) grinding and poundingtools; (iv) polishing tools; and (v) hammer-stones.
Of all the implement types recovered,projectile points and axe heads are perhapsmost indicative of direct forest resource useby prehistoric inhabitants. Projectile pointsalso hold a particularly important positionin the matrix of material evidence under-pinning the prehistoric timing of Palaeo-Indian immigration, assignment ofsubsistence lifestyles and geographic con-nections (Dillehay, 2000; Lavallée, 2000).Williams (1998) assigns a spear-fishingfunction to points excavated from shellmounds along the Guyana coast, althoughthe basic form of these and most other bi-facial projectiles leaves these open to inter-pretation. Primary function is typicallyassigned based on site location or the com-position of accompanying artefacts (e.g.animal remains). Similarly formed pointswere also found in the Ireng, Cuyuniand Mazaruni Rivers (Evans and Meggers,1960; Williams, 1978a), near Salto deHacha, Caroni river (Rouse and Cruxent,1963), at Tapaquen (Cruxent, 1972) andalong the Paragua (Dupouy, 1960), upperOrinoco rivers (Barse, 1990) and GranSabana (Dupouy, 1956) in VenezuelanGuayana.
Stone axe heads from the shield andadjacent regions have been typologically
Socio-economic Aspects of Forest Use 397

classified by ten Kate (1889) and Boomert(1979). More than 90% of the specimensclassified are believed to have been prima-rily used as wood-working tools in themanufacture of house framing materials,agricultural plot establishment and corial(canoe) production. Smaller axe heads havebeen assigned a ceremonial function orviewed as tokens of social rank (Boomert,1979).
TIMING OF MANUFACTURE The earliestassigned projectile point ages are associatedwith two sites on the shield periphery, onenear Puerto Ayacucho on the upperOrinoco (Barse, 1990), and the other atMonte Alegre, near the lower Amazon(Roosevelt et al., 1996). To date, no pointsexcavated in the Guiana Shield have beengiven a materially dated age older than the11 ka BP assigned to the stemmed, wingedpoints found by Roosevelt et al. Cruxent(1972) considered points unearthed atTapequén, Bolivar State, Venezuela to be atleast 13,000 years old, but this antiquity hasnot been confirmed through radiometricdating. Barse assigned a later age of 7 ka BP
to points associated with hearth charcoal athis study sites. Williams (1998) asserts thatseveral isolated finds of projectile pointsfrom rivers indicate colonization of coastalGuyana earlier than 7.2 ka BP.5 Axe headsand other stone implement finds from theGuianas have been almost entirely assignedto more recent, Neo-Indian (<3 ka BP) peri-ods based on accompanying ceramic ma-terials (Evans and Meggers, 1960; Versteegand Bubberman, 1992), but a few locationsassociated with earlier periods suggest thattheir use pre-dates the manufacture ofceramics (Gassón, 2002). Many of the axeheads recovered along the Atlantic coastsites are shaped from mafic rock types thatare found inland of the Quaternary sedi-ments. This further complicates age assign-ments from coastal sites since it opens upthe prospect of inter-generational reuse ofstone implements and/or trade with inte-rior communities prior to deposition at theexcavated location.
Material types: ceramics
Distribution
Complete or fragmented remains of ceramicwares are associated with most excavatedsites in the Guiana Shield (Fig. 8.2).Consequently, the distribution of ceramicartefacts across the region principallyreflects spatial variation in sampling effort.Effort spent can be stratified at two spatiallevels: (i) watershed; and (ii) river proxim-ity. At the watershed level, the Cuyuni,Mazaruni, Caroni, Caura, Ventauri, Branco,middle Rio Negro, Uaupes/Vaupés,Uatuma, Jatapu, Mapuera and Jari havebeen sparsely explored, although existingevidence, both lithic and ceramic, indicatesthat many of these were important thor-oughfares connecting people living alongthe Caribbean and Atlantic coast and thelarge floodplain corridor along the AmazonRiver prior to European arrival (Lathrap,1973; Boomert, 1987; Rostain, 1994).
The distribution of ceramic finds alsoreflects on the substantial under-samplingof terra firme forest sites outside flood-plains (Fig. 8.2). The depiction of the earli-est lowland inhabitants as varzea dwellers(Roosevelt, 1998), while logical, has notbeen adequately tested by documenting theabsence of similar inhabitation sites atupland forest locations throughout theshield region. Information available regard-ing early use of upland areas is almostentirely limited to savanna and rockshelterlocations (e.g. see Rostain, 1994; Gassón,2002). Given the record of artefact recoveryfrom floodplain excavations to date, it is tobe expected that most future floodplainexcavations along major rivers will yieldceramics.
Purpose
Ceramic wares are generally believed tohave coincided with a sedentary, if notagrarian, lifestyle. This relationship, ifstrictly true, is crucial in assessing both thetiming and magnitude of changes in size,social organization and lifestyle of prehis-toric populations in the lowland neotrop-
398 D.S. Hammond

ics. Most excavated ceramic materials arethe broken remnants (sherds) of vessels,probably used for carrying, processing,cooking and storing the basic staples ofeveryday life. Ceramic griddles, believed tohave been used to make cassava and/ormaize bread, have been found at variouslocations (see references in Gassón, 2002).Still other more elaborate, but less func-tional, finds are believed to have been usedfor ceremonial purposes or as trade objects.In many instances, vessels were used tohouse buried remains (e.g. Evans andMeggers, 1960).
Timing of manufacture
Ceramic artefacts excavated at Taperinha,along the south bank of the lower Amazonnear Santarém, Brazil are believed to be theoldest thus far unearthed in the lowlandneotropics (Roosevelt, 1991a). These mater-ials, found in a shell midden, were radio-metrically dated to more than 7.0 ka BP.Williams (1981a) also found ceramic sherdstaken from a coastal Guyanese shell mound(Piraka) that he associated with charcoalradiocarbon-dated to 7.2 ka BP. Severalother sites along the lower Amazon River(Marajó, Monte Alegre) and the Atlanticcoast of the shield region (Venezuela,Guyana, Amapá) have also been assigned toperiods earlier than 4.0 ka BP (summarizedin Roosevelt, 1995). Among the best knownof these is the sequence of pottery typesexcavated at Parmana and adjacent sitesalong the Orinoco immediately down-stream from its confluence with the Apure(Gassón, 2002). Roosevelt (1980) assignedthe earliest pottery types found at Parmanato a period dating back 4.45 ka BP, whileLathrap and Oliver found pottery at nearbyAgüerito that they believe was manufac-tured more than 5.2 ka BP. Both earlyassignments, however, have been ques-tioned on several accounts (Zucchi et al.,1984; Barse, 2000).
The majority of ceramic artefacts eitherdated directly or by stratigraphic associa-tion are of late Meso-Indian, Neo-Indian orIndo-Hispanic age, less than 4.0 ka BP. LateNeo-Indian and Indo-Hispanic ceramic
styles are particularly common. Thisincludes virtually all of the sites excavatedto date along the upper (Zucchi, 1991), mid-dle (Simões, 1987) and lower (Simões,1974; Heckenberger et al., 1998) Rio Negro,southern Guyana and Suriname (Evans andMeggers, 1960; Boomert, 1981; Williams,1981b), the lower Orinoco (see references inGassón, 2002, pp. 288–291) and coasts ofSuriname, French Guiana and Amapá(Meggers and Evans, 1957; Rostain, 1994).
Material types: metalworkings
Very few examples of worked metalcrafthave been recorded for the Guiana Shieldregion. Whitehead (1990) mentions the dis-covery of a gold pendant on the upperMazaruni River, but suggests that this is atrade object obtained through routes linkingtribes of the region with highland metal-workers of Colombia. Compared to high-land Andean sites, however, metalworkedartefacts are virtually absent from theregional record until the appearance andproliferation of European trade goods, suchas metal axeheads, in the 17th century.
Material types: organic remains
Organic remains are the most readily datedartefacts recovered from archaeologicalsites and often represent the only materialdates available for anchoring sequences ofexcavated strata. Among the most com-monly recovered organic remains are char-coal, woody endocarps, worked andunworked animal bones, pollen and/orphytoliths. Less commonly, human remainshave been recovered at lowland neotropicalsites.
Human remains, particularly whenthese are presented in a manner that indi-cates ceremonial burial, are unequivocalproof of human occupation. Radiometricdating of these finds directly places thisoccupation along an absolute timeline ofhuman inhabitation and land use, ratherthan one defined purely by stratigraphy andinterpretation. Remains, however, have
Socio-economic Aspects of Forest Use 399

been excavated at only a handful of thehundreds of sites studied across the GuianaShield, Venezuelan llanos and AmazonDownwarp.
Along the coastal rim of Amapá,Meggers and Evans (1957) unearthed hun-dreds of funeral urns at 21 sites. Most con-tained cremated remnants, but several werefound with uncremated remains, partiallycremated remains or a mixture of both. Ineastern French Guiana, remains of an adultand infant have been found interned in oneof several funeral caves located in theMontagne Bruyere, between the Ouanaryand Oyapock Rivers, although accompany-ing objects suggest they are of Indo-his-panic age (Cornette, 1985, cited in Rostain,1994), as is the case for many of the othersites (Petitjean Roget, 1983). More than 300archaeological sites have been studiedacross Suriname (Versteeg and Bubberman,1992), but only a few coastal sites associ-ated with the Hertenrits (includingBuckleburg, Wageningen sites), Tingiholoand Barbaekoeba earth mound-drained fieldcomplexes have yielded human remains(Boomert, 1980a, 1993; Versteeg, 1985;Khudabux et al., 1991). These finds arebelieved to coincide with an earlier, prehis-toric period, probably dating to the Neo-Indian epoch. A similar situation existsalong the Guyana coastlands where humanremains have been recovered, but fromshell mounds near the Waini and PomeroonRivers of the northwest district (Williams,1981a, 1996a). Unlike Amapá, FrenchGuiana or Suriname, however, few cachesof badly decomposed or partially crematedhuman bones have been documented fromburial jar sites examined in the interior.These are located in rockshelters and cavesfound along the piedmont of the PakaraimaMountains of southwest Guyana (Evans andMeggers, 1960), where local people know ofmany other sites containing burial urns (J.James, personal communication). Accom-panying materials of European and NorthAmerican manufacture indicate, however,that most of these burials occurred duringthe 18th and 19th centuries. The Atlantic
coast of Venezuela has also yielded severalsites with human remains. Like those alongthe northwestern littoral of Guyana, thesehave largely been excavated with or withoutburial urns from the many shell moundspopulating the coastal stretch between theOrinoco Delta and Maracaibo (Rouse andCruxent, 1963) (Fig. 8.2). Sites in the interiorregion of Venezuelan Guayana are generallyfew, although a series of funeral sites areknown from explorations of the PuertoAyacucho cave complex (Perera, 1971) andremains recovered from sites further down-stream at Parmana (Roosevelt, 1980; van derMerwe et al., 1981). Sites excavated alongthe upper Rio Negro and headwater tributar-ies of the Orinoco have not included verifi-able human remains (Evans et al., 1959;Zucchi, 1991). Major sites along the south-ern rim of the shield region have also notincluded human remains among the recov-ered artefacts (Roosevelt, 1991a; Rooseveltet al., 1996).
Animal remains are noticeably morecommon among artefacts excavated acrossthe Guiana Shield, although these tooare found more frequently and ingreater amounts (or reported more often)at sites along the Atlantic coastline andlower Amazon (Verill, 1918a; Carter,1943; Meggers and Evans, 1957; Evans andMeggers, 1960; Boomert, 1980a,1993; Williams, 1981a, 1998; Versteeg,1983; Versteeg and Bubberman, 1992;Rostain, 1994; Roosevelt et al., 1996)than the interior (Cruxent, 1950; Evanset al., 1959; Evans and Meggers, 1960;Frikel, 1969; Boomert, 1980b, 1981;Hilbert and Hilbert, 1980; Williams, 1981b;Zucchi, 1991). Remains from coastaland riverine sites emphasize many ofthe same aquatic resources currentlyharvested from the adjacent freshwater,estuarine and marine habitats, althoughchanges in relative sea-level and dischargedynamics over the Holocene have alsoaltered resource opportunities in many ofthese areas (e.g. molluscs, bivalve distri-butions) (e.g. Altena and van Regteren,1975).
400 D.S. Hammond

Site types: earth engineering
Earth engineering exemplifies, perhapsmore than any other material evidence, theability of prehistoric societies to modifytheir local environment as a means ofimproving their living conditions.Although known worldwide, studies docu-menting engineered earth sites in the low-land tropics are particularly significant astestimony to the innovative environmentalsolutions employed by prehistoric societiesto expand otherwise limited human carry-ing capacities (Denevan, 1970; Parsons andDenevan, 1974; Williams, 1979a; Versteeg,1983; Roosevelt, 1991b; Wood andMcCann, 1999; Erickson, 2000; Mann,2000a,b; Wood and Mann, 2000).
Raised fields (champs drainés, montones),causeways (calzados) and earth mounds
DISTRIBUTION Arguably the best knownexample of lowland earth engineering is theextensive network of raised fields and con-necting causeways that are found across theseasonally flooded expanse of the Mojosplains in Bolivia (Denevan, 1970; Parsonsand Denevan, 1974). A similar complex ofdrained fields and causeways exists withinthe seasonally flooded savanna along theApure River in Venezuela linked to thegolden age of prehistoric chiefdoms at ElGaván and El Cedral (Zucchi, 1972, 1973,1978, 1984; Spencer, 1991; Spencer et al.,1994, 1998) (Fig. 8.2) and extensive raisedfield complexes at Caño Ventosidad(Zucchi, 1985). A less extensive system wasalso discovered along the piedmont of theupper Meta River in Colombia (Reichel-Dolmatoff, 1974). Earth engineering of sim-ilar or greater magnitude is known fromhighland lake shores such as Titicaca inBolivia and Xochimilco in Mexico, but noother systems of comparable range andcomplexity have been documented to occurin the lowland neotropics.
Other, more modest, systems that havebeen well-documented from the lowlandsoccur almost exclusively along the rim ofthe Guiana Shield (Fig. 8.2). These consistof raised field and earthen mound com-
plexes along the Suriname and FrenchGuiana coastlands (Boomert, 1980a, 1993;Versteeg, 1983, 1985; Rostain, 1994), scat-tered earthen mounds between the Abaryand Canje Rivers in northeast Guyana (ImThurn, 1884; Verill, 1918b; Osgood, 1946;Poonai, 1962; Boomert, 1978; Thompson,1979) and mound clusters along the middleOrinoco, particularly at the regional centreof Parmana (Roosevelt, 1980; Gassón, 2002)(Fig. 8.2).
PURPOSE Raised field-mound complexesare believed to have created a productivecapacity that exceeded basic subsistencerequirements in the western Llanos deVenezuela. Maize is believed to have beenthe primary crop, unlike historical subsis-tence systems in the Guiana Shield thatfocused on manioc production. Connectedby causeways, raised fields supported foodsurpluses that allowed for ritualistic feast-ing and other activities that maintainedsocial alliances in an advanced politicallandscape of competing chiefdoms(Spencer, 1991; Spencer et al., 1998;Redmond et al., 1999).
In contrast, materials recovered fromearthen mounds and raised field-moundcomplexes studied along the Orinoco andGuianan coastlands do not support assign-ment of a similar level of social complexity.Ceramic evidence from mounds inSuriname and French Guiana, such as grid-dles and smoothers, suggest manioc was thecultigen of choice (Boomert, 1993; Rostain,1994),6 although the presence of grindingstones (metates) at some sites suggest maizeas an alternative staple (Boomert, 1980a).Along the Orinoco, it is believed that initialmanioc cultivation was replaced by maizeas this crop was introduced eastwardthrough the Colombian/Venezuelan llanos(Roosevelt, 1980; Gassón, 2002). The size offield complexes and cultural artefactsfound from within earthen mounds point torelatively large Amerindian populations(Marajó Island: Roosevelt, 1991b; 20,000+in French Guiana: see Rostain, 1994; lowerRio Negro: Heckenberger et al., 1999) livingin communities bound by increasinglycomplex social interactions, trade and reli-
Socio-economic Aspects of Forest Use 401

gious beliefs prior to final abandonment inthe centuries preceding European arrival(Boomert, 1980a; Versteeg and Bubberman,1992).
TIMING OF MANUFACTURE Raised field andearthen mound complexes spread betweenthe northern llanos and French Guianancoastline have been assigned noticeablyconcurrent Neo-Indian dates, based onradiometric analysis of in situ charcoal,wood and peat materials. The Hertenritsmound of western Suriname is believed tohave been constructed through successivelayering over a period of 150 years, from 1.2to 1.1 ka BP (Boomert, 1980a). Developmentof the Buckleburg mounds is believed toante-date Hertenrits by several hundredyears, being built from 1650 to 1350 yearsBP. The field-mound complexes of easternSuriname and French Guiana that in partcontain Barbakoeba-type pottery were usedbetween 1800 and 750 years BP (Versteeg,1983; Boomert, 1993; Rostain, 1994).Marajoara mound-builders at the mouth ofthe Amazon are believed to have beenactive from 1540 to 650 years BP (Meggersand Evans, 1957; Roosevelt, 1991b). Moreextensive complexes at Gaván and ElCedral in the Apure Basin of Venezuela arethought to have been constructed andintensively used from 1400 to 950 years BP
(Spencer et al., 1994, 1998), while thosefurther downriver at Caño Ventosidad wereactive thereafter between 750 years BP andthe arrival of Europeans, 450 years BP
(Zucchi, 1985). No earth engineering of thistype has been justifiably assigned to aperiod earlier than 2000 years BP and over-lap with intensive use of adjacent shellmounds along the coastal region appearsminimal.
Shell mounds (sambaquis)
DISTRIBUTION Many early inhabitants ofthe eastern neotropical rim are believed tohave relied substantively on the estuarineand marine resources offered by the shal-low, but rising, coastal waters of theHolocene (Fairbridge, 1976). Along certaincoastal stretches of the eastern shield
perimeter, the earthen mounds and raisedfields disappear and mounds formed fromthe heaping of discarded crab, mollusc andsnail shells speckle the landscape. Theshell mounds spread in clusters along acoastal belt ranging from Panama andColombia, across the Guajira Peninsula innorth Venezuela and along the coasts ofeastern Venezuela, northwestern Guyana,Marajó Island, Pará, Maranhao, Bahia andsouthward to Rio Grande do Sul. More than1000 known shell mounds form this coastalbelt, with over 90% of these occurringalong the Brazilian coast south of the RioSaõ Francisco. Far fewer mounds are docu-mented along the lower Amazon (Marajó,Santarém) (Roosevelt, 1991a,b), northwestGuyana (Verill, 1918a; Osgood, 1946; Evansand Meggers, 1960; Williams, 1981a,1996a), around the Guiria Peninsula(Sanoja and Vargas, 1983), along the GolfoTriste, and through to the Guajira Peninsulaand the Caribbean coasts of Colombia andPanama (Rouse and Cruxent, 1963;Williams, 1996a). The documented sitefrom northwest Guyana is the only moundcluster known to exist within the GuianaShield.
Shell mounds are excellent pointsources of alkaline agents in an otherwiseacidic tropical environment. EarlyEuropeans quickly recognized their utilityfor a wide range of applications that hadsimilarly motivated prehistoric coast-landers to initially construct the mounds.As a result, documented sites probably rep-resent only a subset of a much larger, origi-nal population diminished throughselective mining as a source of agriculturalfertilizer, liming agents, road-buildingmaterials and stable building sites, amongother uses (Rouse and Cruxent, 1963, p. 75;Gaspar, 1998).
PURPOSE The distribution of shellmounds emphasizes the widespread tech-nological adaptation of coastal societiesalong the western tropical Atlantic to theprevailing environmental conditions. Theharvesting and processing of crustaceans,molluscs, snails and bonefish are clearlyseen as principal activities from the pre-
402 D.S. Hammond

served animal remains and various boneand wood fishing tools recovered (Evansand Meggers, 1960; Williams, 1981a). Yet,human remains in many mounds combinedwith a wide range of lithic and ceramic arte-facts not related to resource use of the lit-toral environment indicate that thestructures were also used at various stagesas domiciles and burial grounds (Simões,1961; Williams, 1993, 1996a; Gaspar, 1998).
TIMING OF MANUFACTURE Basal contents ofnumerous mounds have been dated radio-metrically to give an approximate age oftheir earliest construction and use. The ear-liest dates assigned to shell mounds withinthe coastal belt range from 7500 to 1480years BP. Among the earliest of these arethose assigned to the Taperinha mound(>7.5 ka) near Santarém (Roosevelt, 1991a),the Piraka mound (>7.2 ka) in northwestGuyana (Williams, 1981a), Banwari Trace(>7.1 ka) in Trinidad (Table 10 in Williams,1996a), Cerro Iguanas and Guayana (>5.5ka) in Venezuela (Rouse and Cruxent, 1963;Williams, 1996a) and the Forte and GeribaII sites from southeastern Brazil (Gaspar,1998). Numerous other mounds inter-spersed with these older sites have beenassigned initial use dates as late as 700years BP. The stratification of cultural arte-facts and ceramic styles combined withanchor material dates of charcoal and pot-tery sherds indicate that many largemounds grew through successive, thoughpossibly discontinuous, occupations overseveral millennia.
Terra preta (do índio) (Indian black earth,terre noire)
Terra preta are recognized by their dark,humus-rich horizons, intercalated charcoal,abundance of ceramic sherds and unusu-ally high agricultural productivity(Sombroek, 1966; Glaser et al., 2001). Theyalso have been identified by a geochemicalsignature of high plant nutrient and anom-alously low arsenic levels that is distinctfrom background ferrasolic soils (Lima daCosta and Kern, 1999).
Unlike the short-term spike in nutri-
ents available immediately following slash-and-burn, areas of terra preta are consonantwith sustained elevation of nutrient levels.Experiments suggest that the incorporationof massive charcoal layers assist in theselective retention of phosphorus, potas-sium, calcium and other micronutrientsthat are poorly retained in areas dominatedby upland forest soils (Ferrasols, Oxisols,Podzols) otherwise susceptible to rapidleaching (see sections on ‘Soils and SoilFertility’ and ‘River, Lake and TidalSystems’, Chapter 2). Nutrient elevation isinitiated by an enrichment process. Massdeposition of organic garbage, such as fishbones, freshwater snail and turtle shells(Roosevelt, 1999), provides a slow-releasesource of scarce micronutrients and pHbuffers that reduce the loss of otherwisegrowth-limiting nutrients, such as phos-phorus, and suppress dissolution of alu-minium and iron that can be toxic to plants.Agricultural productivity is substantiallyincreased as a consequence of these enrich-ment and buffering effects (Lehmann et al.,2003).
Terra preta soils are widely distributedthroughout the Amazon Downwarp, alongmajor rivers draining the Brazilian Shield,such as the Tocantins and Xingu(Heckenberger et al., 1999), and along theQuaternary sediment belt encircling theGuiana Shield. These latter sites includeseveral known from the Atlantic coast ofAmapá, French Guiana (Rostain, 1994) andSuriname (Versteeg and Bubberman, 1992;Boomert, 1993) and along the Caquetá Riverin Colombia (Eden et al., 1984). Sites acrossthe interior of the Guiana Shield are, bycomparison, rare. Only a few or no siteshave been located in the middle and upperRio Negro basin (Sombroek et al., 2002),interiors of French Guiana, Suriname,Roraima, Guyana and Venezuela Guayana.Williams (1994) noted a single site that iscurrently cultivated at Kurupukari, centralGuyana along the southern limit of theBerbice Formation, but this site needs fur-ther documentation (Fig. 8.2).
Given the widespread role of tropicalacidity in promoting agriculturally adversenutrient leaching, heavy metal mobility and
Socio-economic Aspects of Forest Use 403

formation of chelated, metallo-organic com-plexes, the development of terra preta rep-resents a significant feat of environmentalengineering that arguably outstrips the suc-cess achieved by modern efforts to improvethe agricultural productivity of tropicalforestlands. This interpretation of terrapreta, however, is not universal. Instead,some view the development of these soilsas merely the consequence of continuousrefuse disposal (Balée, 1992).
While the heightened nutrient reten-tion properties of terra preta are well-docu-mented, the limits to agriculturalintensification on these putative anthroso-lic soils remain unclear in the absence ofcontrolled manipulative experiments.Sombroek et al. (2002) indicate that wheremodern agricultural use exceeds severalconsecutive years, crops begin to showsigns of malnutrition. The extent to whichthese soils are linked to hypothesized pre-historic population densities dependsentirely upon their ability to sustain agri-cultural production. The combination oftotal area and rate of productivity attachedto terra preta provides a calculable basis forestimating prehistoric human populationsizes in regions where these are known toexist.
Most terra preta deposits are associatedwith site artefacts dated between 900 and400 years BP (Roosevelt, 1991b; Rostain,1994; McCann et al., 2001). The Kaurikreeksite in Suriname, however, has beenassigned a much earlier date, between 3.6and 2.5 ka BP (Versteeg and Bubberman,1992). Williams (1994) assigns a radiocar-bon date of 3 ka BP to the Kurupukari sitein central Guyana, making this arguably theoldest known terra preta site in the forestedneotropics. The age of charcoal samplestaken from other sterile arenosolic sitesnorth of the area, a history of ENSOdrought, the great longevity of many treespecies from the region (see ‘Prehistoric cli-mates of the Guiana Shield’, Chapter 2) andabsence of any artefacts pointing to char-coal as an event-specific product of humanactivity, seriously questions the connectionbetween charcoal age and human occupa-tion in this instance.
Comparison with prehistory of otherneotropical regions
Mounting archaeological evidence supportsthe view of a prehistoric neotropical low-land that was colonized at or near the sametime that highland and temperate regions ofthe Americas began to house early arrivalsfrom Asia. While certain assumptionsregarding the interpretation of evidencestill leave the possibility of a more recent,post-Clovis arrival of humans in SouthAmerica, the growing geographic range ofsites, the broad assortment of researchersand institutions exploring these sites andthe use of a broadening spectrum of tech-nologies for processing artefactual evi-dence, argues for a pre-Clovis colonization(for comprehensive assessment of argu-ments see Dillehay, 2000). This earliest col-onization, in a manner probably repeatednumerous times thereafter, remained closeto the coast. The coastal fringe of the conti-nent is the environment that has arguablyexperienced the longest, most continuousand most intense history of human impact.
The prehistoric timeline and magnitudeof lowland tropical forest occupation in theinterior is another matter. Archaeologicalevidence suggests quite different settlementand livelihood patterns for the main physio-graphic regions of the neotropics. Evidenceof early Palaeo-Indian occupation is largelyrestricted to worked lithic remains exca-vated from prehistoric hearths. These havebeen found at several locations in the north-ern Guiana Shield, such as the Sipaliwinisavanna (Boomert, 1980b), GuayananHighlands and Gran Sabana (Dupouy, 1956,1960; Rouse and Cruxent, 1963; Cruxent,1972), and near Puerto Ayacucho (Barse,1990). More substantial, but equally contro-versial, finds of early Palaeo-Indian occupa-tion have been found along the SaõFrancisco River among the Palaeozoic sand-stone canyons fringing the eastern rim of theBrazilian Shield (see overview by Lavallée,2000). The Amazon Downwarp east ofManaus is also increasingly being viewed asa landscape of early occupation through siteexcavations at Taperinha and Monte Alegre(Roosevelt, 1991a; Roosevelt et al., 1996).
404 D.S. Hammond
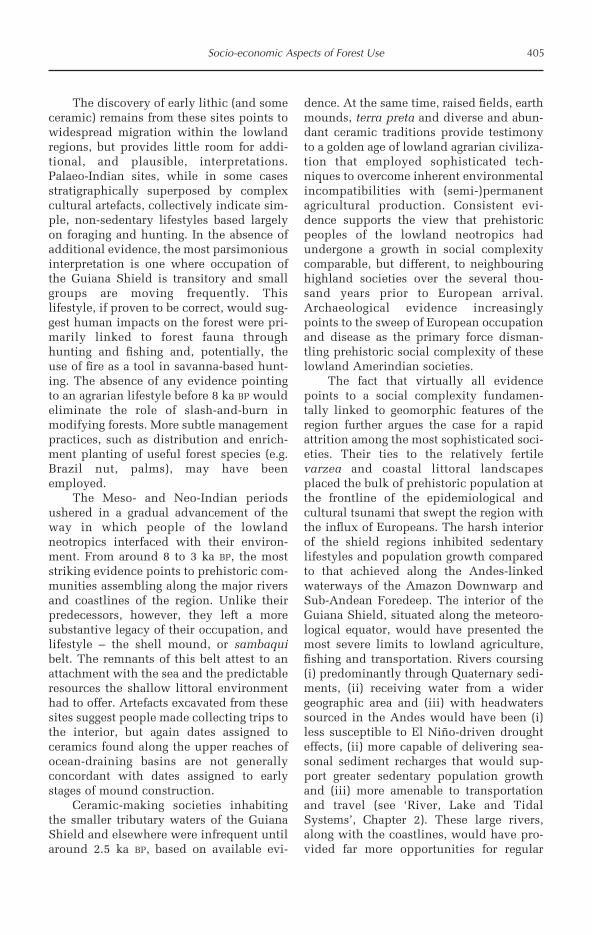
The discovery of early lithic (and someceramic) remains from these sites points towidespread migration within the lowlandregions, but provides little room for addi-tional, and plausible, interpretations.Palaeo-Indian sites, while in some casesstratigraphically superposed by complexcultural artefacts, collectively indicate sim-ple, non-sedentary lifestyles based largelyon foraging and hunting. In the absence ofadditional evidence, the most parsimoniousinterpretation is one where occupation ofthe Guiana Shield is transitory and smallgroups are moving frequently. Thislifestyle, if proven to be correct, would sug-gest human impacts on the forest were pri-marily linked to forest fauna throughhunting and fishing and, potentially, theuse of fire as a tool in savanna-based hunt-ing. The absence of any evidence pointingto an agrarian lifestyle before 8 ka BP wouldeliminate the role of slash-and-burn inmodifying forests. More subtle managementpractices, such as distribution and enrich-ment planting of useful forest species (e.g.Brazil nut, palms), may have beenemployed.
The Meso- and Neo-Indian periodsushered in a gradual advancement of theway in which people of the lowlandneotropics interfaced with their environ-ment. From around 8 to 3 ka BP, the moststriking evidence points to prehistoric com-munities assembling along the major riversand coastlines of the region. Unlike theirpredecessors, however, they left a moresubstantive legacy of their occupation, andlifestyle – the shell mound, or sambaquibelt. The remnants of this belt attest to anattachment with the sea and the predictableresources the shallow littoral environmenthad to offer. Artefacts excavated from thesesites suggest people made collecting trips tothe interior, but again dates assigned toceramics found along the upper reaches ofocean-draining basins are not generallyconcordant with dates assigned to earlystages of mound construction.
Ceramic-making societies inhabitingthe smaller tributary waters of the GuianaShield and elsewhere were infrequent untilaround 2.5 ka BP, based on available evi-
dence. At the same time, raised fields, earthmounds, terra preta and diverse and abun-dant ceramic traditions provide testimonyto a golden age of lowland agrarian civiliza-tion that employed sophisticated tech-niques to overcome inherent environmentalincompatibilities with (semi-)permanentagricultural production. Consistent evi-dence supports the view that prehistoricpeoples of the lowland neotropics hadundergone a growth in social complexitycomparable, but different, to neighbouringhighland societies over the several thou-sand years prior to European arrival.Archaeological evidence increasinglypoints to the sweep of European occupationand disease as the primary force disman-tling prehistoric social complexity of theselowland Amerindian societies.
The fact that virtually all evidencepoints to a social complexity fundamen-tally linked to geomorphic features of theregion further argues the case for a rapidattrition among the most sophisticated soci-eties. Their ties to the relatively fertilevarzea and coastal littoral landscapesplaced the bulk of prehistoric population atthe frontline of the epidemiological andcultural tsunami that swept the region withthe influx of Europeans. The harsh interiorof the shield regions inhibited sedentarylifestyles and population growth comparedto that achieved along the Andes-linkedwaterways of the Amazon Downwarp andSub-Andean Foredeep. The interior of theGuiana Shield, situated along the meteoro-logical equator, would have presented themost severe limits to lowland agriculture,fishing and transportation. Rivers coursing(i) predominantly through Quaternary sedi-ments, (ii) receiving water from a widergeographic area and (iii) with headwaterssourced in the Andes would have been (i)less susceptible to El Niño-driven droughteffects, (ii) more capable of delivering sea-sonal sediment recharges that would sup-port greater sedentary population growthand (iii) more amenable to transportationand travel (see ‘River, Lake and TidalSystems’, Chapter 2). These large rivers,along with the coastlines, would have pro-vided far more opportunities for regular
Socio-economic Aspects of Forest Use 405

trade and interaction among the many peo-ples inhabiting the region than oligotrophicwaterways terminating in the forestedGuayana Highlands and TumucumaqueUplands. With the first Europeans arrivingin the Americas, the golden age ofAmerindian lowland societies along therim of the Guiana Shield reached its termi-nus and a new age of human influence onthe forests of the region began.
Colonial History: AD 1500–1900
Gold and the search for El Dorado
The Guiana Shield was from the beginningan important entry point in the explorationof the New World and consequent exploita-tion of its inhabitants and resources by themonarchies of Europe. On Columbus’ thirdvoyage, he and his crew travelled to thedelta of the Orinoco, crudely charting itscontours and channels in the process.Several years later, Alonso de Ojeda trav-elled further up the Orinoco and in 1500Vicente Yáñez Pinzón charted all of thechannels of the Orinoco delta. Less than 25years after the arrival of Columbus in theCaribbean islands and his subsequentexploration of the Orinoco mouth, theSpanish had established settlements alongthe shoreline of present-day Venezuela andthe nearby island of Margarita. By the early1500s, Trinidad was being established as animportant staging ground for Spain and itsrepresentatives to exert their claim over thelands of the northwestern Guiana Shield, avast area that was virtually unknown tothem. During the 1530s, the Spanish led aseries of reconnaissance forays up the lowerreaches of the Orinoco, under the commandof the doradista Diego de Ordaz (Hemming,1978b). From 1528 to 1566 the House ofWelser, a German banking firm, receivedthe ‘right’ to exploit large areas of westernVenezuela from Emperor Charles V in pay-ment of a debt owed to them by the SpanishCrown. Two German explorers, Phillip vonHutton and Nikolaus Federmann, were sentby the Welser group to establish the extentof their control and to search for gold in
eastern Venezuela. While the Welser groupwere apparently driven in their exploita-tion of the people and the land during their38-year lease, von Hutton and Federmannfailed to find gold. The exploits of Ordaz,von Hutton and Federmann were the first ina subsequent chronology of encountersbetween the gold-seeking Europeans andthe traditional inhabitants of theselands spurred by the competing regionalinterests of expanding European empires.Stories of a magnificent city accrued fromsubsequent expeditions up the OrinocoRiver by Diego Fernandez de Serpa, PedroMaraver de Silva and, most famously,Antonio de Berrio, increased the anticipa-tion of great wealth to be found in the hin-terland of the shield (Ojer, 1960; Hemming,1978a).
By the time the English explorer SirWalter Raleigh arrived off the coast ofGuiana in 1594, small gold artefacts andvery large stories from the region had madetheir way into the hands and thoughts ofSpanish, Dutch and German explorers. Thestories, low on fact and rich in speculation,confirmed in Raleigh’s mind the existenceof a great kingdom, Manoa, located withinthe heart of the Guiana Shield. The object ofthe early doradistas’ quest in the region, ElDorado,7 or the Golden Man, was not with-out precedence and represented justanother chapter in a long line of expedi-tions mounted in obsessive pursuit of ill-gotten wealth. The substantive collectionsof worked gold and silver that had beendiscovered and extricated from the templesand burial grounds of highly developedcity-states in Colombia, Peru and Mexicocatalysed a widely held belief that allindigenous societies of South America heldin equal esteem and skill the working ofgold and silver (Whitehead, 1997).Raleigh’s record of his first trip to theGuiana coast in search of the mythic ElDorado exemplifies the magnitude ofexpectation borne from decades of nearlyunfathomable effort made by Spanishdoradistas in quest of the great treasurehouses, real and fabled, of the pre-Columbian inhabitants of South andCentral America:
406 D.S. Hammond

The Empyre of Guiana is directly east fromPeru towards the sea, and lieth under theEquinoctial line, and it hath more abun-dance of Golde then any part of Peru, andas many or more great Cities then ever Peruhad when it flourished most: it is governedby the same lawes, and the Emperour andpeople observe the same religion, and thesame forme and policies in government aswas used in Peru, not differing in any part:as I have beene assured by such of theSpanyardes as have seene Manoa theemperiall Citie of Guiana, with theSpanyardes cal el Dorado, that for thegreatnes, for the riches, and for the excel-lent seate, it farre exceedeth any of theworld, at least of so much of the world asis knowen to the Spanish nation: it isfounded upon a lake of salt water of 200leagues long like unto mare caspium.(Raleigh, 1596)
If there was an El Dorado in South America,he and his empire had long disappearedbefore European arrival in the GuianaShield. The image of Manoa on the shoresof Lake Parima, however, remained centralto the European perceptions of the GuianaShield region long after Raleigh’s demise.Other explorers continued to chaseRaleigh’s dream (e.g. Nicolas Horstman in1740 (Bancroft, 1769)) and as late as themid-19th century, some European mapmak-ers were still showing the fabled lake as aprominent landscape feature in the region(Fig. 8.3). It wasn’t until Richard and RobertSchomburgk, under commission by thePrussian Emperor, carried out an extensivesurvey of the boundaries of the growingBritish colony in the 1830s, that the exis-tence of the lake and its great golden citywere finally put to rest in most Europeanminds (Schomburgk, 1848).8 In its steadwere the deflated reality of an overgrown,seasonally enlarged lake, called Amacu,located in the Rupununi savannas and theexistence of a small Macushi village, Pirara,on the unflooded rise adjacent to its shores(Schomburgk, 1840). The early expectationsof quick wealth, largely bred by the earlySpanish and English explorers, gave way tothe realization that if the Guiana Shield hadsomething to offer to its constantly fightingEuropean colonizers, then it would have to
be pursued through more orthodox forms ofproduction and trade.
Early trade and colonization
Gold wasn’t the only potential that the earlyEuropeans were exploring in the 17th-cen-tury Guiana Shield, albeit the most coveted.As early as the late 1500s, Dutch, Frenchand English traders were seeking to developcommerce with Amerindians along theGuianan coast and up the Amazon andNegro Rivers, starting with the exchange oftheir simple manufactured goods for nativeplant products, foremost being dye-wood (Brazilwood), annatto and tobacco(Edmundson, 1901, 1904a,b; Lorimer, 1979).
The historical record suggests that theDutch had already established trading out-posts and commenced with rudimentarycultivation of cash crops in the Corentyne,Essequibo and Pomeroon regions of Guyanaby 1620 (Whitehead, 1988). In 1621, theDutch monarchy began to formalize itscommercial presence in the Guiana regionby establishing an outpost for a new tradingcompany, the Dutch West Indies Company,created to oversee its crown interests in theNew World. This outpost, Fort Kyk-over-al,was situated on an island in the D’Essekebe,or Essequibo, River9 downstream from thepresent-day town of Bartica and wouldcoordinate Dutch trade in the region fromthis location and other satellite outposts upuntil the mid-1700s. Trade outposts wereestablished along the Barima and PomeroonRivers and trade missions sent up theMazaruni and Cuyuni Rivers with mixedsuccess (Whitehead, 1988).
At the same time, several Englishmen,most notably Captain Charles Leigh andRobert Harcourt, attempted unsuccessfullyto establish British colonies along the lowerOyapock River (Harcourt, 1613; Purchas,1906). The French, also seeking to establisha foothold in the Guianas, suffered evengreater difficulties in founding coloniesalong the coastal zone of French Guiana.Attempts by Gaspar de Sostelle to settle atthe mouth of the Montsinery and CayenneRivers in the late 1500s ended in conflict
Socio-economic Aspects of Forest Use 407
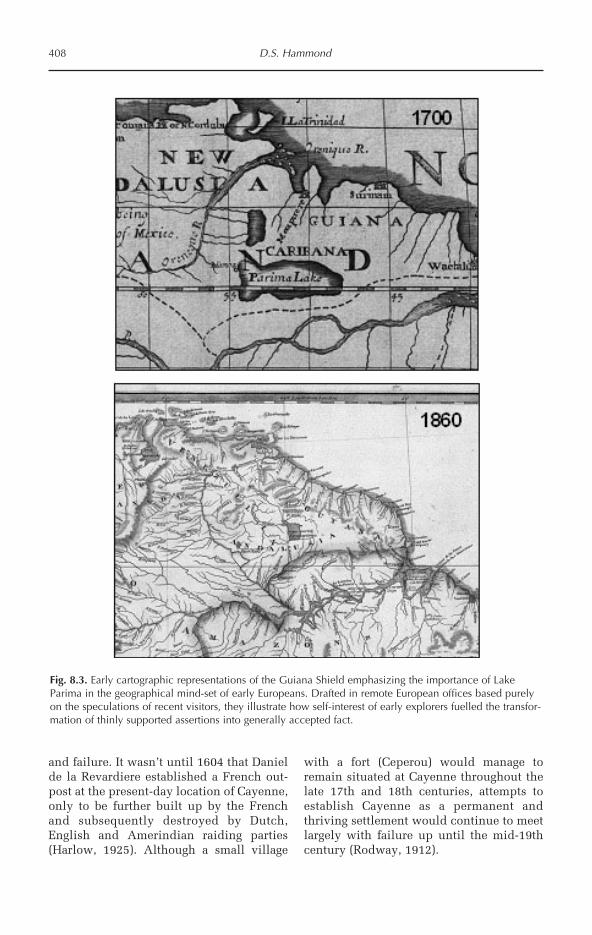
and failure. It wasn’t until 1604 that Danielde la Revardiere established a French out-post at the present-day location of Cayenne,only to be further built up by the Frenchand subsequently destroyed by Dutch,English and Amerindian raiding parties(Harlow, 1925). Although a small village
with a fort (Ceperou) would manage toremain situated at Cayenne throughout thelate 17th and 18th centuries, attempts toestablish Cayenne as a permanent andthriving settlement would continue to meetlargely with failure up until the mid-19thcentury (Rodway, 1912).
408 D.S. Hammond
Fig. 8.3. Early cartographic representations of the Guiana Shield emphasizing the importance of LakeParima in the geographical mind-set of early Europeans. Drafted in remote European offices based purelyon the speculations of recent visitors, they illustrate how self-interest of early explorers fuelled the transfor-mation of thinly supported assertions into generally accepted fact.

Spanish settlements during the 1600sfor the most part remained restricted to afew neglected and frequently overrun andrebuilt outposts, first at Santo Tomé andlater at Moitaco, located along the lowerOrinoco River (Fig. 8.4) (Ojer, 1966;Whitehead, 1988). The Kingdom of NewGranada was considered by the Spanish toextend much further southeastward fromthis position, but the wealth flowing fromthe Spanish Main in Mexico, Colombia,Peru and Bolivia preoccupied resourcesand interest. The Spanish hold on theregion throughout this period was largelyaffected by the frequent raiding and tradingactivities of Dutch and Caribs coming fromthe Essequibo (Whitehead, 1988). Deterredby a lack of crown resolve and frequent con-flict with Carib inhabitants and Europeanrivals, the Spanish colonial developmentand occupation of the modern-dayVenezuelan Guayana was virtually absentup until the early 1700s (Ojer, 1966).10
The Portuguese, preoccupied with cashcrop production along the Atlantic coastbetween present-day Belém and São Pauloand bound to the east by the Treaty ofTordasillas signed with Spain in 1494, hadhardly ventured inland along the AmazonRiver and its northern tributaries during the17th century. This left much of the trade inthese parts to the Dutch West IndiesCompany, which established outpostsalong the lower Amazon and Negro Rivers(Edmundson, 1904a,b). The Portuguese did,however, establish a fort in 1616 along thelower Amazon at the present-day site ofBelém in defiance of the treaty with Spainand had extended their reach along thesouthern rim of the Guiana Shield by estab-lishing a fort at the confluence of theAmazon and Negro Rivers – called Manaos– by 1669 (Fig. 8.4). Up until the 18th cen-tury, however, the southern and westernpart of the Guiana Shield remained for allintents and purposes unaffected by the col-onization sweeping the coastal shores andhighlands of South America and theCaribbean. Trade in dyes, timber andtobacco were undertaken with the residentsof these lands, but few permanent settle-ments were established. The interior of the
southern shield area was virtuallyunknown to the Europeans, but the diseasesthey brought with them were rapidly estab-lishing their presence among the indige-nous peoples inhabiting the area.
Sugar and souls
The Dutch West Indies Company (DWIC),working from its base on the Essequibo,continued to expand and develop its com-mercial interests in dyes, tobacco, cotton,coffee and, increasingly, sugar. The com-pany had begun to cultivate cane along thebanks of the Essequibo and PomeroonRivers in the 1530s and by 1638 sugarbecame the major source of revenue for thecompany in its Essequibo and Demeraraholdings. Cotton and tobacco were increas-ingly unable to compete with productionfrom the more fertile lands of the BritishNorth American colonies and their cultiva-tion was ultimately discontinued, leavingcane and coffee as the major agriculturalproducts. The inland sugar estates of theDutch continued to expand as far inland asthe lower Mazaruni River, but were increas-ingly seen to be uneconomic as diminishingsoil fertility reduced yields. Realizing thedwindling land capability of the interior,the DWIC relocated its commercial head-quarters in 1738 to Fort Island (Zeelandia)at the mouth of the Essequibo River andconcentrated sugar cane production in newplantations along the lower Essequiboislands and the lower Demerara River. Theappointment of Laurens Storm van’sGravesvande as secretary, then commanderand finally director general of the Essequiboand Demerara holdings from 1738 to 1772led to a rapid expansion of the sugar estatebetween the Pomeroon and Berbice Riversand saw a massive influx of (mainly)English planters leaving the fragile anddensely packed croplands of the BritishCaribbean (Storm van’s Gravesande, 1911).The rapid and successful development ofthe lower Demerara River became theengine behind Storm van’s Gravesande’ssuccess and later the transition from Dutchto British colonial control.
Socio-economic Aspects of Forest Use 409
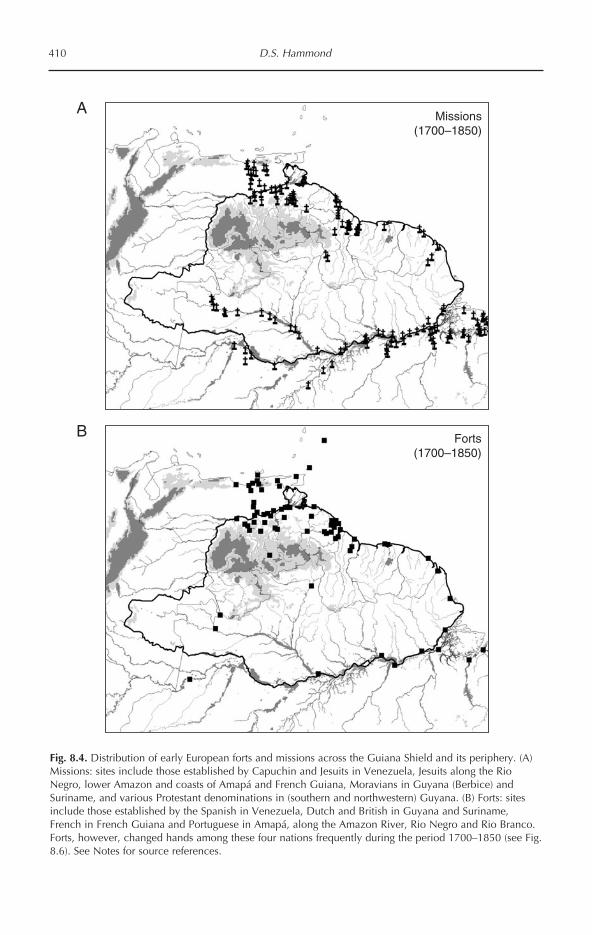
410 D.S. Hammond
Fig. 8.4. Distribution of early European forts and missions across the Guiana Shield and its periphery. (A)Missions: sites include those established by Capuchin and Jesuits in Venezuela, Jesuits along the RioNegro, lower Amazon and coasts of Amapá and French Guiana, Moravians in Guyana (Berbice) andSuriname, and various Protestant denominations in (southern and northwestern) Guyana. (B) Forts: sitesinclude those established by the Spanish in Venezuela, Dutch and British in Guyana and Suriname,French in French Guiana and Portuguese in Amapá, along the Amazon River, Rio Negro and Rio Branco.Forts, however, changed hands among these four nations frequently during the period 1700–1850 (see Fig.8.6). See Notes for source references.
A
B Forts(1700–1850)
Missions(1700–1850)

During the same period, an Englisharistocrat, Francis Willoughby, successfullyestablished a permanent settlement near topresent-day Paramaribo in Suriname afterdisastrous attempts sponsored by the Dukeof Corland in 1639 and Earl of Warwick in1642 to settle the Pomeroon River(Edmundson, 1901). Willoughby’s settle-ment eventually led to the creation of one ofthe first sugar plantocracies in the shieldregion and, importantly, the full-scaledevelopment of the deplorable practice ofimporting slave labour from Africa to workthe cane fields that was first initiated by theDutch in their Essequibo, Demerara andBerbice patroons (holdings). Within 20years of founding the first permanentEuropean settlement in Suriname, morethan 500 plantations had been established.At the Treaty of Brede in 1667, theSuriname plantations and lands betweenthe Courentyne and Maroni Rivers werepermanently handed over by the English to
the Dutch in exchange for the NorthAmerican colony of New Amsterdam(Manhattan Island, New York) (Dalton,1855). Combined with their patroons inGuyana, the Dutch effectively controlledthe production of agricultural commoditiesover a 5000 km2 area by the end of the 17thcentury (Fig. 8.5). Most of this area had pre-viously been coastal swamp forest and estu-arine plains.
Throughout the 1700s, the colonialdevelopment of the Guiana Shield wouldrest principally with the shifting political,religious, economic and military objectivesshaping regional relationships betweenSpain and Holland. The majority of colo-nial activity would be concentrated alongthe coastal margins between the Orinocoand Maroni Rivers and sugar productionwould reign supreme among these consid-erations. Trade in other forest materials,such as letterwood (Brosimum) and annatto(Bixa orellana) also continued to influence
Socio-economic Aspects of Forest Use 411
Fig. 8.5. Distribution of early Dutch trading posts in Guyana (solid triangles), distribution of sugarplantations at their peak across Guyana, Suriname (shaded areas) and French Guiana (arrows) and theregion settled by Maroons in eastern Suriname–western French Guiana after fleeing coastal plantations(solid squares). Long arrow indicates possible 18th-century trade connection between Dutch and RioNegro Amerindians through the upper Rio Branco-Rupununi. See Notes for source references.
Sugar plantations,trading posts and Maroon
villages (1700–1850)
?

the economic success and cultural impactof European colonization. Dutch tradingoutposts and forts were establishedthroughout Guyana during the 1700s, mostnotably at Mahaicony, Abary, Wironie andCanje in the Berbice region, along theCuyuni, Pomeroon and Maruca Rivers andmuch further inland at Arinda near the con-fluence of the Siparuni and EssequiboRivers (Fig. 8.5) (Whitehead, 1988). Asmall, 60 km2 French colony at Cayennehad several small plantations, but the expo-sure of the Precambrian basement rock upto the coast effectively limited opportuni-ties for sugar production to the smallstretches of riverine alluvium along thelower Approuague, Mahury, Cayenne andMontsinery waterways (Rodway, 1912).Instead, annatto and coffee were cultivatedas principal cash crops.
While the Dutch, British and Frenchcontinued to expand their imperial inter-ests in the region through trade withAmerindians and the cultivation of sugarand coffee, Spain’s effort to extend its colo-nial interests in Guayana were stronglylinked to the activities of the Capuchin,Franciscan and Jesuit missions. Spain hadundergone a tumultuous collapse duringthe late 17th century and much of its initialimperial grandeur had been taken away byraiding Dutch and English. When Philip ofAnjou succeeded to the Spanish throne, hecommitted the resources of the Spanishcrown to consolidating their control overtheir remaining American colonies in anattempt to prevent further economic ero-sion caused by the expanding Dutch andEnglish settlements. Building upon aknowledgebase accrued through earlierunsuccessful expeditions deep into theGuayana region along the Orinoco, Caroniand Caura Rivers (Gumilla, 1741), the earlymissionaries rapidly expanded their net-work of forts and missions as Spain fullycommitted military support to their effortsto subdue the Carib population and elimi-nate the threat of further Dutch expansionfrom their established hold in theEssequibo. Despite considerable resistancefrom the Orinoco, Imataca and BarimaCarib populations, the persistent efforts of
the Capuchin and Franciscan missions withsupport from the Spanish crown had thor-oughly eliminated the ‘Dutch-Carib threat’by the end of the 18th century (Whitehead,1988). By 1780, the Spanish missions hadestablished over 35 new settlements, orreducciones,11 along all of the main south-ern tributaries of the Orinoco, facilitatedthe foundation of a provincial capital ofGuayana at Angostura (Ciudad Bolivar) andextended their entradas against the Caribsas far south as the Uraricoera River in pres-ent-day Roraima state and as far east as thePomeroon and lower Cuyuni Rivers (Fig.8.3). The economic spin-off of the mission-ary activity was the establishment of a sugarmill at the Caroni mission and a cattle herdnumbering more than 145,000 head alongthe Yuruari River in the Imataca region(Whitehead, 1988). The Dutch, by nowincreasingly focused on returns from theproduction of sugar and coffee from theirestates in Guyana and Suriname, and lessso on the trade in dyes and other forestproducts, allowed their 150-year alliancewith the Caribs against the Spanish to dis-solve in an effort to avert Spanish reprisalsagainst their burgeoning, and increasinglysedentary, economic interests in the region(Storm van’s Gravesande, 1911).
The French and Portuguese were alsobusy consolidating and partitioning theircontrol over parts of the southern GuianaShield during the 18th century. Forciblepursuit of their respective claims came at aprice – paid by the native inhabitants ofAmapá. During the early years of the 18thcentury, the Portuguese furthered theirhold over the region by eliminating tribesthat did not support their claim. As a con-sequence, several thousand people wereeither forcibly removed to Marajó Island bythe Portuguese or fled to the French-heldpart of the Oyapock watershed or thecoastal region of Cayenne (Hurault, 1972).
Finally, at the Treaty of Utrecht in 1713they agreed to define the Oyapock River asthe boundary between French andPortuguese territorial interests in the south-eastern corner of the shield. This expandedthe Portuguese system of donatários, or cap-taincies (akin to the Dutch patroon system)
412 D.S. Hammond

created first at São Vicente in 1535, to anarea north of the Amazon River’s mouth.The French, however, would not gain com-plete control over French Guiana until 1816,when agreement, through the Treaty ofParis, was reached with Britain and Portugalover France’s claim to the present-dayextent of French Guiana. As a consequence,the British would hand back the colony afteran 8-year period of occupation (Fig. 8.5).
Portuguese control over the great low-land forest area stretching across the west-ern rim of the Guiana Shield was restrictedto their early settlements at Belém andManaus during much of the early 17th cen-tury, but this changed dramatically by1750. Portugal agreed a new delimitation oftheir colonial interests in South Americawith Spain through the Treaty of Madrid.This redefined the boundary originally setin 1494 through the Treaty of Tordasillas.The Treaty of Madrid gave extensive claimrights to Portugal over the entire AmazonBasin, but not the southern part of theGuiana Shield extending north from theAmazon River (Fig. 8.3). Combined withthe agreement reached with the French in1713 through the Treaty of Utrecht, thePortuguese ‘paper’ control over the south-ern rim of the Guiana Shield area was nowcomplete. Despite the vast expansion oftheir interests in South America under theTreaty of Madrid, the Portuguese monarchywould never see material control over thesouthern province of the Guiana Shield thatwas later to become the Brazilian states ofRoraima, North Pará and Amapá. ThePortuguese had, however, commenced withthe colonization of the Amazon properthrough two different routes, namely regu-lar trading missions along the Amazon trib-utaries and the missionary activities of theJesuits. Both were inextricably bound toone another. Trade with Amerindians con-tinued along a similar line as that estab-lished by the Dutch in the 16th and 17thcenturies. Cacao, or cocoa, was the majortrade item, though other forest productswere also sought, including oils from thecopaiba (Copaifera spp.) and andiroba(Carapa guianensis) trees, vanilla and otheraromatic plants. Cacao would account for
the lion’s share of trade from the Amazonduring much of the mid-1700s.
While trade in forest plant productswas increasing, the Jesuit mission was rap-idly expanding its presence on the Amazonand Negro Rivers. By the mid-1700s, morethan 60 major settlements had been estab-lished along the Amazon River and morethan 50,000 Amerindians lived and workedwithin the confines of these Jesuit-run com-pounds, or aldeias (Fig. 8.4) (Hemming,1978a). In many ways, the Jesuit aldeiaswere similar to the Capuchin reduccionesthat were being established concurrently inthe northwestern part of the Guiana Shieldalong the Orinoco and its tributaries. Most(albeit exclusively European) historicalaccounts suggest that the approach taken bythe Jesuits, however, relied less on forcedresettlement through the use of the militarythan was typically used by the Capuchins,although their cooperation with ‘ransommissions’ aimed at procuring Amerindianslaves was far from benign (Hemming,1978a). The Jesuits’ missions wouldbecome the mainstay of European agricul-tural expansion along the Rio Negro regionup until the late 1700s. The toll on thenative inhabitants of the Rio Negro regionwas staggering. By 1750, Franciscan diariesestimate that nearly three million peoplehad been exported from the region as slavesto work the coastal sugar estates (Hemming,1978a). By 1785, more than 400,000 coffeeand cacao trees had been planted in clearedforest areas along the lower and middle RioNegro as part of the Jesuit network ofAmerindian-fuelled agro-industry and theregion had been widely depopulated (Reis,1943). Cattle-ranching was promoted as asecondary use of cleared land no longerable to support intensive crop production,but this too quickly exhausted the meagrenutrition afforded livestock in a deforestedlandscape near the mission centres(Chernela, 1998).
Colonial consolidation and decline
Less than 50 years after the Spanish mis-sions and Dutch West Indies Company had
Socio-economic Aspects of Forest Use 413

firmly established their control over themain ports and waterways in the region andwere reaping profit from their activities, thetides of change were already beginning torise. The Dutch colonial administration oftheir Demerera, Essequibo, Berbice andSuriname holdings were increasingly occu-pied with the control of ill-treated slaves ontheir sugar and cotton plantations (Collis,1965). The pillaging of the Dutch holdingsin Suriname by the French and the subse-quent flight of many slaves to the forestedinterior during the chaos bolstered theAfrican population living free of the planta-tions in Suriname. An African slave revoltat Berg-en-Daal in 1730 and a major rebel-lion that shook the Berbice estates in 1763added to this growing population (Rodway,1912). The Suriname plantations werethereafter continuously harried by rebellionand runaway slaves that escaped into theforest interior during the late 18th and early19th century. These escaped slaves, calledMaroons or Bushland Negroes, numberedmore than 10,000 in Suriname, Berbice,Demerara and Essequibo by the 1770s (Fig.8.5) (de Groot, 1977; Rose, 1989) and theplantation owners in Suriname wererequired to expend more and more effort inorder to maintain their tenuous hold on aslave population that outnumbered them bymore than 10 to 1 by the late 18th century(Whitehead, 1988). Eventually, peacetreaties were signed between the Dutch andthe Aucans and Saramaccans in 1761(Rodway, 1912), but fighting continuedwith the Bonni and Baron groups (Collis,1965). Contracts were established withAmerindians to recapture those slaves thatmanaged to escape into the hinterland anddefences to protect the plantation marginsfrom marauding Maroons had to be con-structed. The sum of these actions began totake their toll on the DWIC’s ability to prof-itably operate their sugar estate holdings inthe Guianas. The growing resistance to slav-ery among plantation workers preoccupiedthe Dutch to such an extent that they werealso unable to respond in kind to theincreasingly provocative Spanish move-ments eastward through Guayana duringthe 1700s. Trading outposts on the Barama,
Moruca and upper Cuyuni Rivers wereburned and briefly occupied in the 1760sand the extent of influence the Dutchenjoyed in the Guiana Shield during their‘golden age of trade’ in the 17th and 18thcenturies was eventually restricted to thecoastal sugar estates by the early 1800s.
The age of Capuchin and Franciscancontrol over Venezuelan Guayana and itsCarib inhabitants came to an abrupt end in1817 as the Spanish empire reached thepinnacle of its expanse and then recoiledunder the weight of Napoleonic France andrevolution in its colonies. The war of inde-pendence, fought between 1810 and 1818in Venezuela, led to the formation ofGrancolombia, a vast nation centred on thespine of the Andes and extending betweenGuayana and Ecuador (Fig. 8.6). TheCatholic missions that had virtually ruledparts of Guayana since the early 1700s pro-vided assistance to the royalist forces dur-ing the struggle for independence. By 1818they had been completely removed frompower in the Guiana Shield as a result ofthese loyalist sympathies. No further poli-cies were developed to subjugate the Caribinhabitants, though the effect of the missionon Carib regional domination was clearfrom the catastrophic decline in the popu-lation through disease and death in thereducciones and immigration to theEssequibo/Cuyuni area (Whitehead, 1988).Twelve years later, Grancolombia was dis-solved and the republic of Venezuela wasborn. Through the break up ofGrancolombia, Venezuela (and Colombia)became the first of the modern-day coun-tries in the Guiana Shield to achieve inde-pendence (Fig. 8.6). Brazil, while severinglinks with the Portuguese royal familyaround the same time as Simon Bolivar andother revolutionaries were fighting for inde-pendence from Spain, would continue to beruled through its own monarchy up untilthe conversion to a rudimentary republic in1889 (Fig. 8.6).
The Dutch hold on the coastland of theGuianas collapsed altogether as theyentered the 19th century. Napoleon’stakeover of the Netherlands and subsequentwar with Great Britain severely weakened
414 D.S. Hammond

Socio-economic Aspects of Forest Use 415
Fig. 8.6. Timeline of occupation and European colonization of the Guiana Shield according to country.Each country timeline (separated by vertical lines) consists of four levels of control represented by fourvertical bars. One bar signifies trading missions, expeditions and the presence of a few scattered tradingposts, two bars signifies the establishment of several forts and/or missions, three bars signifies the presenceof towns and cites and four bars indicates complete political authority over the area.
BP 6000
AD 1500
1600
1700
1800
1900
2000
AmerindiansGreat BritainFranceNetherlandsSpainPortugalBrazilian EmpireVenezuelaGrancolombiaSurinameBrazilGuyana
Guy
ane
Sur
inam
e
Guy
ana
Ven
ezue
la
Bra
zil

the ability of the Dutch to administer theircolonies. The Dutch West Indies Companywas increasingly being seen to lack theskills necessary to improve the profitabilityof the sugar estates and maintain controlover a growing resentment among small-holder planters and resistance from slaves.In 1796, the Dutch allowed the DWIC’s con-tract to expire and assumed direct responsi-bility for the Demerara and Essequiboholdings. The change in administrationproved to have little effect on the decline inDutch control over the area. The French(and French-controlled Batavian Republicof The Netherlands) briefly controlled theEssequibo and Demerara region in 1782,establishing a new capital, Longchamps, atthe mouth of the Demerara River. TheDutch regained full control in 1784, renam-ing the French settled town Stabroek anddesignating it as the new capital of theirGuiana holdings (Fig. 8.6). British forces,already occupying Suriname since 1775,were sent in 1796 to occupy the Essequiboand Demerara holdings yet again. Six yearslater, the area was returned to Dutch controlin accordance with the Treaty of Amiens(Fig. 8.6). Less than a year later, Britishtroops returned to Stabroek and the Britishwould retain lasting control over all of thesugar estates, though Dutch interests andproperties were not forfeited. In 1814, theDutch formally agreed to hand over allthree of its former patroons, Berbice,Demerara and Essequibo, to the Britishthrough the Treaty of London. Two yearslater, the British returned the former colo-nial lands in Suriname to the Dutch andagreed through the Treaty of Paris to returnGuyane to French control after 8 years ofoccupation in collaboration with thePortuguese (Fig. 8.6). By 1831, Stabroek wasrenamed Georgetown and the three colonieswere united under a single colonial admin-istration until Guyana’s independence in1966. Suriname, or Dutch Guiana, wouldremain a Dutch colony for the next 155years until independence in 1975. Cayenneand the lands of present-day Guyane wouldremain as a French colony until 1945, whenit would be given full department (state orcounty) status (Fig. 8.6).
By the end of the 18th century, theJesuit missions of the Rio Negro region alsohad all but disappeared. As agriculturalproductivity was exhausted within thealdeias landholdings and the population ofAmerindian workers dwindled in the faceof disease, forced emigration and hardship,the focus of Jesuit and Portuguese exploita-tion shifted to the Solimões and its westerntributaries (Reis, 1943). Over the next 50–80years, the region would be virtually aban-doned by the Portuguese and Spanishcolonists, until global economic expansionwould reignite interest in the region as thesource of a traditional product being widelysought for its new industrial applications –rubber (Chernela, 1998).
Emancipation and new immigration
The period 1810–1840 proved to be one ofthe most important junctures in the historyof the Guiana Shield. While the productionof coffee and cotton in the plantations of theSouth American east coast from theEssequibo to Bahia largely declined overthe first part of the nineteenth century,sugar exports rose precipitously. Planta-tions in the Demerara, Essequibo andBerbice colonies had only recently comeunder final control of the British and thesugar industry was expanding in these pos-sessions while well-established plantocra-cies in the West Indies had reached theirmaterial limits to expansion. The prospectsfor a burgeoning agricultural estate inBritish Guiana that would bring consider-able profits to the plantation ownersappeared good and the drive for furtherslave labour to feed estate production andexpansion was in full motion. By 1810,forced emigration of Africans as slaves hadreached its highest rates and the standingpopulation of slaves measured more than1.4 million in the British colonies, 460,000in the Dutch colonies and 1.8 million inBrazil (Curtin, 1969). Buoyant sugar prices,steady market demand and the free-flow ofslave labour augured well for the continueddominance of the plantocracy in the life ofcolonial America.
416 D.S. Hammond

Several factors, however, began to alterthis prospect by 1840. Incessant war amongthe major regional empires since the 1790sbegan to take its toll on sugar returnsthrough shipping and infrastructural losses.At the same time, a voice of social justicecalling for the end of the slave trade, andeventually slavery, began to be heard in thehalls of the British political system. Anti-slave abolitionists, led by missionarygroups, began to exert enormous pressureon the political justification for this abhor-rent practice. By 1807, the use of Britishships to transport slaves was made a crownoffence (Waddell, 1967).
In part driven by the constant fear oftheir enormous slave populations and thememory of past revolts, particularly thegreat Haitian rebellion of 1793 led byToussaint L’Ouverture, the 1763 Berbicerevolts and a growing Maroon population,plantation owners became even morerepressive in their treatment of the sugarworkers. Combined with increasing effi-ciency demands, declining supply of newslave labour and a dropping sugar price,owners placed an increasing burden ontheir existing slave populations (Higman,1984). As a consequence, a series of revoltserupted in 1823 (Demerara, British Guiana)(da Costa, 1994), 1831 (Jamaica), 1835(Salvador, Bahia) and 1838 (Rio de Janeiro,Maranhão) (Skidmore, 1999). Spurred onby the great Demerara slave rebellion inBritish Guiana and the vociferous foment ofthe Anti-slavery Society, all slaves withinthe British Atlantic colonies were emanci-pated with the passage of the SlaveEmancipation Act in 1833 (Fig. 8.7).
First deprived of their inflow of newslave labour, and then plantation labouraltogether, British sugar interests foundthemselves competitively disadvantaged.The gradual remission of the Sugar Act by1850 increased the competing flow of sugarfrom outside the existing colonial planta-tions to the UK. British interests quicklyredressed this imbalance by proactivelypromoting the widespread end of slaverythroughout the sugar-producing regions ofthe Americas. Fifteen years later, slaverywas similarly abolished in French colonies,
in the Danish islands by 1848 after a seriesof revolts, in Venezuela by 1854, and acrossthe Dutch West Indian holdings (includingGuiana) in 1863 (Fig. 8.7). Brazil, the onlyslave-owning country in the Americas by1865, would continue this deplorable prac-tice until legally outlawed in 1888 throughimperial decree, the Lei Áurea, after a seriesof earlier stop-gap actions that circum-vented release of the labour force by pro-viding first for the freedom of newbornchildren and then seniors exceeding the ageof 65 rightfully failed to quell discontent(Toplin, 1972). The ending of the slavetrade decimated a sugar industry that hadseemingly passed its prime and wasincreasingly being challenged by otherindustrial sectors, including sugar beet pro-duction in Europe and North America. Theadvent of the industrial revolution inEurope also ushered sugar to the rank of sta-ple commodity, which supported the devel-opment of more lucrative, manufacturingsectors rather than acted as a point sourceof profit on its own. By 1845, cotton was nolonger exported from the Guianas and sugarreceipts declined precipitously (Waddell,1967) (Fig. 8.7).
The rise and fall of plantation slaveryin the Guianas also had an impact on theforests of the near interior. During theexpansionary years of the plantation systemin the late 18th-century Guianas and Brazil,considerable amounts of timber and landwere put to use in the construction of hous-ing, millworks, sugar punts, bridges, canalrevetments and empoldering that formedthe infrastructural foundation of the plan-tocracy. These were continuously main-tained through the extraction of timberfrom upland forests adjacent to the coastalswamplands. Constant military actionbetween European powers in the regionduring the 18th and early 19th centuriesrequired timbers for ship-building and fortconstruction. By the 1840s, nearly 2% ofthe population along the coast of BritishGuiana alone was believed to be employedin the extraction of wood products, eitheras independent suppliers or as part of nineregistered businesses that would have pro-vided materials to over 300 sugar, coffee
Socio-economic Aspects of Forest Use 417

418 D.S. Hammond
500
450
400
350
300
280
1,000
2,000
4,000
6,000
8,000
10,000
260
240
220
200
180
160
140
120
100
Coastal Plain Amazon Orinoco Savannas Forest Uplands
Bi-facial points
Ceramics
Petroglyphs ?
Stone arrangements ?
Shell mounds
Raised fields
Raised fields
Ceramics
Ceramics
Search for El Dorado
Spanish in Trinidad
Sugar (Guianas)
Anatto
Pau do
Brasil
Emancipation
British Guiana
Brazil
1820
1860
1900
1780
1740
1700
1600
1500
BP
Greenheart exported
Capuchin/ Franciscan Reducciones Caroni-Imataca (cattle)
Jesuit Aldeias Rio Negro (cattle, coffee, cacao)
Balata
Gold
East Indian, Madeiran, Javanese, Chinese immigration to Guianas
Maroons
Tonka Bean
Rubber (Rio Negro)
Capuchin Missions (Rio Negro)
Coffee Cotton (Guianas)
Dutch Moravian & British Protestant Missions (Guianas)
Anglican Missions (Rupununi)
French Catholic Missions (Cayenne, Oyapock)
Fig. 8.7. Timeline of archaeological artefact dates and colonial phases across the three main ecosystems ofthe Guiana Shield up to the end of the 19th century. Colonial phases are designated by principal mission,trade, agriculture, mining and timber extraction periods.
BP
1000
2000
4000
6000
8000
10000
AD
and cotton plantations (Schomburgk, 1840).In addition to this trade, timber trees in theGuianas were increasingly recognized fortheir density, durability and strength inmaritime and industrial applications over-seas and a growing export trade had devel-oped by the time the sugar industry was inpost-emancipation decline. By 1850, nearly70% of the sugar plantations operating atthe turn of the century had closed and theexport of timber (mainly greenheart) fromBritish Guiana alone amounted to over5000 m3 (Fig. 8.6) (Schomburgk, 1840).
Africans fleeing slavery in the coastalplantations would also have begun to mod-ify the forests of eastern Suriname’s nearinterior as they started to utilize forestresources to sustain their growing popula-tions (Fig. 8.5). Across the middleMaroni, Commewijne, Suriname, Nickerie,Courentyne and Berbice watersheds,Maroons were establishing their ownrenewed social order independent of theplantocracy. This independence was at itsgreatest in eastern Suriname and in all like-lihood had the greatest impact on theforests of that region.
In contrast, the revolutionary fightagainst Spain across Venezuela, the expul-sion of the Capuchin mission from Guayanaand the collapse of the Jesuit system alongthe Rio Negro, combined with the devasta-tion of disease and forced emigration uponthe native populations, meant that much ofthe western Guiana Shield remained largelyas it was prior to colonization or had effec-tively been emptied of its human inhabi-tants. In many areas, this is the forest thatwould ultimately be encountered by travel-ling natural historians documenting, andpreparing, the misperception of a uniformlyverdant and pristine system devoid ofhuman influence.
By the 1850s, the sugar industry of theAtlantic coastline had diminished substan-tively due to a shortage of labour afteremancipation. Dutch and British sugarinterests began a mass programme of indeb-turement that would (in part) see the arrivalof new sugar workers, mainly from Indiaand Java (Indonesia). In the case of Guyana,this migration would see nearly 250,000
East Indians arrive between 1850 and 1920(Bisnauth, 2000). The consequence of thisand other immigration, mainly fromMadeira (Portugal) and China, was toincrease the coastal populations, reinvigo-rate the sugar industry, establish anexpanding rice industry and invariablyplace greater demands on the forestresources of the near interior. As the cen-tury came to a close, coastal agriculture wasin full swing, but it was the growth of for-est-based industries that would rapidlyextend the range of industrial forest use tothe deepest reaches of the Guiana Shield.
The new El Dorado: rubber, timber andplacer gold
In 1818 Charles Macintosh created a fash-ion revolution in England with his rain-repelling jackets made from a clothimpregnated with natural rubber. He wouldpatent the process in 1837 and the demandfor this new kind of outerwear would starta drive for natural rubber that lasted morethan a century. The British fashion for prac-tical outwear, however, would pale in com-parison to the tremendous industrialdemand that emerged as the IndustrialRevolution moved into high gear. The prop-erties of rubber, balata and other naturallatex materials were soon recognized fortheir wide range of uses, particularly after aseries of inventions that assisted in thedevelopment of new product lines.
In 1842, Charles Goodyear patented thevulcanization process and a vibrant exportmarket for the raw material developed overthe next several decades. Vulcanizationextended rubber’s natural elasticity over awide range of temperatures, an importantconsideration when manufacturing goodsfor use in the harsh winters of Europe andNorth America. As the first cars and theirpneumatic rubber tyres became a commonsight in many parts of North Americaand Europe, demand boomed and theAmazon rubber industry was born. By the1880s, seringa (or Indian) rubber (Heveabrasiliensis) production was operatingacross much of the Rio Negro basin and
Socio-economic Aspects of Forest Use 419

effort was underway to establish planta-tions in the Guianas and Venezuela. Brazilremained the sole supplier of naturalrubber, a native plant of the Amazonlowlands, until 1876 when a British expa-triate exported (many say illegally) seeds ofHevea to Trinidad. Soon thereafter, Britishand Dutch colonial companies shippedthese to Malaya and Indonesia, where plan-tation production of rubber flourished forthe next 100 years and effectively elimi-nated the Brazilian monopoly on supplyduring the peak decades of demand.Nonetheless, Brazil remained a major sup-plier of rubber throughout this period, par-ticularly to the USA and Germany (Barhamand Coomes, 1996).
At the same time, another natural rub-ber, balata, was increasingly recognized forits useful properties, particularly in themanufacture of machine belting, golf ballsand later, telegraph cable insulation. A con-current balata boom across the GuianaShield created a drive into the forest inte-rior that had up until the mid-1800s onlyexperienced sporadic establishment of out-posts trading for annatto, dyewood, tobaccoand selected timbers and a few missions. Bythe close of the 19th century, thousands ofbalata bleeders were traversing the forestedinterior of the shield seeking new bullet-wood trees (purguo, nisperillo, boletri, bal-ata franc, maçaranduba) (Manilkarabidentata, M. huberi) to tap.12
Logging also was beginning to developas an export industry in many parts of theshield during the latter half of the 19th cen-tury. In (the then) British Guiana, produc-tion of timber (mainly logs and squares)totalled more than 406,000 m3 between1850 and 1900 and led the region in hard-wood exports. The bulk of timber extractionoccurred along the northern strip of forestsrunning parallel to the Coastal Plain, alongthe savannas and lower and middle reachesof the major Amazon and Orinoco tributar-ies below the first major impediments totransport, the falls. Nearly all timber wasextracted via the rivers below these falls(e.g. McTurk, 1882).
The increase in the use of forests forlatex and timber during the 19th century
was only one part of the transformationexperienced by the forested interior and thepeople living there. The intended purposeof the earliest shield explorers was to findhidden gold of a forgotten Indian empire.Nearly 400 years later, gold was extractedcommercially, only as placer dust ratherthan the ornate workings of Manoan metal-smiths envisioned by Raleigh and others.Commercial working of gold commenced ina series of deposits throughout the Guianasand Venezuelan Guayana between 1860and 1880, but as early as the 1840s in thecase of the Imataca region of VenezuelanGuayana (e.g. Holmes and Campbell, 1858)(Fig. 8.6). By 1900, several tens of thou-sands of miners had moved into theforested shield interior of the Guianas andVenezuela. In French Guiana, gold minersalone accounted for nearly 25% of the totalpopulation (49,000, including 6500 con-victs) by this time and mining was the prin-cipal economic activity undertaken in theterritory (Rodway, 1912).
The Guiana Shield as a place of refuge,1500–1900
The archaeological, ethnological and histor-ical evidence indicates that the Europeancolonization that followed Columbus’arrival must represent one of the most rapidand complete ethnic turnovers ever experi-enced in human history. Patterns of colo-nization along the shield rim reconstructedfrom archaeological and historical evidencepoint to parallels between the firstAmerindians and Europeans. Both arrivedby boat along the continental coastline andlower river reaches through a wave-likeseries of small settlements that had mixed,long-term success. As populations estab-lished a modicum of permanence, popula-tion centres grew and spread, innovatedand explored new avenues of agriculturalproduction and trade. War, hardship andpolitical discordance forced populations tomigrate and invariably clash with or beabsorbed by resident societies upon theirarrival. Consequently, the human history ofthe shield region is one defined by frequent
420 D.S. Hammond
cycles of migration, displacement andestablishment.
The striking difference between cyclesreconstructed for pre-Hispanic Amerindiansocieties from archaeological evidence andthose historically documented forEuropeans hinges on an important differ-ence – the maintenance of an external, con-tinuous, flow of immigrants that foreversought to benefit through familiar socio-economic and ideological links withEurope, often even after political independ-ence was achieved. Evidence suggests thatAmerindian societies, particularly thosealong major rivers and the coast, also main-tained contacts with other groups, but thesewere largely limited to the same lowlandenvironment (but see a narrative on tradelinks between lowland Manau (Manao) ofthe Rio Negro and highland Chibcha inColombia in Hemming (1978a, p. 440)). It isnot unreasonable to assume that they had inturn an independent and more perceptiveunderstanding of the wider risks andopportunities associated with the lowlandneotropical landscape and a better ability toidentify the most suitable living locationsfrom both a biophysical and socio-eco-nomic perspective. Tragically, what theyshared with the first Europeans was anignorance of the risks and opportunitiesthat each other’s cultures brought with con-tact. The immediate consequences con-veyed through epidemic disease,displacement and enslavement establisheda trend of counterproductive land-use thathas lasted for centuries.
By the time the majority of nativeinhabitants realized the dangers of contact,the topology of turnover had transformedfrom points, to lines and finally areas ofimpact, especially as initial points sparkedsecondary spread of disease and slave-export among Amerindian communitiesthemselves (Colchester, 1997a). Flightbecame the sine qua non of the Amerindianresponse. As a result, the shield interiorwould become a regional refuge forAmerindian groups fleeing the plantations,encomiendas, missions, aldeias, reduc-ciones and slave-raiding parties forming thecolonial Guiana Shield (Evans and
Meggers, 1960; Riviére, 1969; Hemming,1978a; Boomert, 1981). For much of the18th century and early 19th century, thisproved for some to be an effective strategyfor cultural survival. However, with therenewed push into the interior forestlandsand savannas by late 19th-century naturalresource companies, missions and govern-ment outposts, only the most remote forestsof the Tumucumaque Uplands andGuayana Highlands remained at a distancefrom the management of commercial andpolitical interests still largely aimed at fos-tering wealth through overseas export andcultural change through import.
The flight of Amerindian groups intothe heart of the Guiana Shield appearsacross virtually every part of the region,although the movement out of the RioNegro, North Pará and Amapá regions ofBrazil was without doubt the greater (Reis,1943; Hemming, 1978a; Skidmore, 1999).The intense and sustained enslavement ofAmerindians from these regions for 300years between AD 1600 and 1900 compelledmany of the remaining groups to move intothe relative protection of the remote interiorregions of the Guianas and southeasternVenezuela. Hurault (1972) details the dias-pora of the Palikur fleeing Portuguese slave-raiders along the Amapá coast and thearrival of the Wayana and Wayapi movingupstream along the northern tributaries ofthe Amazon in Pará only to arrive at theirnew home along the upper Oyapock.Maroons fleeing sugar plantations in east-ern Dutch Guiana also pushed Amerindiangroups, such as the Emerillon, further upthe Maroni, Suriname, Saramacca andTapanahoni Rivers. Archaeological and eth-nohistorical evidence also supports themigration of the Taruma from the middleRio Negro across the Acarai Mountains intosouthern Guyana, a feat subsequentlyrepeated by the Atorai, Wai-Wai (Evans andMeggers, 1960), Wapishana and Macushi(Macuxi). A similar geography of flightdeveloped from the eastern part ofVenezuelan Guayana into western Guyanaand the Caura basin as Carib (Kari’ña) com-munities fled the 18th century Spanish mil-itary and internment in the Capuchin
Socio-economic Aspects of Forest Use 421

reducciones (Whitehead, 1988). Later, dur-ing the late 19th century, the Yekuana andSanema (Yanomami) migrated northwardfrom their ancestral lands along the upperOrinoco and Parima Rivers towards theupper Ventauri, Erebato and Caura water-sheds in order to avoid capture by othergroups slave-trading with the Portuguese orto obtain forest products for exchange withDutch and British traders (Colchester,1997a, pp. 114–119). The headwaters of themajor rivers draining the shield continue toact as a place of refuge for Amerindiangroups seeking to escape the pressuresexerted by a spreading mestizo (caboclo)lifestyle, where they have traditionallybeen forced to the bottom of the developingsocial class system (e.g. upper Caura River:Silva, 1996).
Commercial Use of Guiana ShieldForests, 1900–2000
The earliest decades of the 20th centurywitnessed the beginnings of modern com-mercial forest transformation across muchof the Guiana Shield. Many of theAmerindian societies once firmly estab-lished along the rim of the shield hadmigrated into the deep interior, fleeing thesweeping changes that had already alteredthe social and economic dynamic of theAtlantic coastal plains and floodplains ofthe Amazon, Negro and Orinoco Rivers.The Industrial Revolution created a globalsurge of new demand for natural productsas the steam engine and line assembly cata-lysed the manufacturing processes onceperformed by hand.
The growth of commercial forest use inthe Guiana Shield widely preceded a simi-lar rise in our understanding of what it con-tained, how it worked and its role inmodulating local, regional and globalchange. These invisible services wereunderstood but rarely articulated fully bypeople who acquired many years, if not alifetime, of observations in the forestedregions. This included several earlyEuropean tropical foresters, natural histori-ans and, in a different way, Amerindian
inhabitants. To most others, the vastness ofthe forest frontier appeared immeasurablewhen considered in proportion to the stateof technological capacity. Most earlycommentators believed the main limitationto development was the lack of technologi-cal capacity to exploit this vastness,rather than the sustainability of thisexploitation. Focus was dominated by aproduct–by–product dissection of the forestsystem and the relative, saleable value ofeach, typically without thought to themounting opportunity costs transferred onto other forest users.
In a manner widely duplicatedthroughout the remaining natural forests ofthe world, the business of locating, quanti-fying, removing and refining the naturalresources of forestlands proceeded at a pacethat was principally driven by humanlabour at first. By 1920, more than 60,0000people were engaged in the extraction oftimber, gold, bauxite, diamonds, balata,seringa rubber and other minor forest prod-ucts across the interior of the GuianaShield. At the same time that employmentin the forest sector was booming, the com-mercial extraction of forest products wasconceded to a few, large companies operat-ing under licence from the colonial govern-ments (e.g. timber, rubber: British GuianaLands and Mines Dept, 1920) or was con-trolled by an autochthonous class of mid-dlemen that ruthlessly managed tradebetween producers and buyers. In the caseof rubber-tapping, this further promoted theformation of an underclass from the large,mainly Amerindian, population of extrac-tivists (e.g. the rubber ‘patrões’ of the RioNegro) (Barham and Coomes, 1996;Chernela, 1998).
As the enormous surge towards theinterior grew, a number of botanists andforesters in (the then) British Guiana beganto question the wisdom of unmitigatedextraction and the absence of any effort tomanage resources as a means of securingtheir future contribution to economicgrowth (McTurk, 1882; Jenman, 1885;Davis, 1933). At the same time, other natu-ral historians and anthropologists recog-nized the proactive collusion of regional
422 D.S. Hammond
administrators and local power figures inforcibly pressing Amerindian inhabitantsalong the Rio Negro into extractivist work(Wallace, 1853a; Koch-Grünberg, 1909;Nimuendajú, 1950) and inculcating bothlocal and migrant labourers in a complexexchange, or aviamento, system throughwhich rubber was traded to isolated tappersfor goods sold at prices sufficiently inflatedin order to maintain indebtedness (Bunker,1985). The growth and development of for-est-based commodities in the region duringthe late 19th century has increasingly dom-inated the regional economies, as they oncedid in the early 16th century. Overlappingboom-and-bust cycles of commodity pro-duction dominate the history of forest useand forest livelihoods across many parts ofthe region over the last 100 years.
Commercial mining
The Guiana Shield has figured prominentlyin the global production of several metaland gemstone commodities over the pastcentury. More than 60 metal and non-metalmineral products have been extracted fromthe region in various quantities since 1900,but most are restricted to only a few sites(e.g. manganese) and/or are of low-gradecontent. These are, for purposes here, con-sidered of marginal significance both interms of global trade and regional socio-economic and environmental impacts.Among the minerals that have fundamen-tally shaped the 20th-century economies ofthe region, gold, bauxite, diamonds andiron rank far above the others.
Gold
This precious metal has been known tooccur in commercial quantities in theGuianas since as early as the 1820s(Rodway, 1912), but was first brought to theattention of Europe’s political and businesssectors through discoveries at Tapaquen (ElCallao) in Venezuelan Imataca in 1849, onthe Mana River in French Guiana in 1864,and along the Suriname and Saramacca
Rivers of Suriname in 1876 (Rodway, 1888).The earliest commercial gold-mining activ-ity of any significance began in 1849 at ElCallao, the oldest active gold mine in theshield region (Gibbs and Barron, 1993). In1882, a large expansion of production com-menced in (the then) British Guiana whenplacer (alluvial) deposits of commercialgrade were discovered on the Cuyuni River.Placer, or alluvial, gold deposits were soonbeing worked along most of the major riversdraining the greenstone belt runningbehind the northern coastal rim of theshield region (see Chapter 2) (Gibbs andBarron, 1993). Gold production from theGuiana Shield, however, has consistentlyamounted to less than 1% of total globaloutput (Table 8.1). Spurred on by the out-put of several large mines, the contributionof the region to global gold productionexceeded 1% for the first time in 1995 andhas continued to expand.
Greenstones and gold
The distribution of greenstone formations isthe key to understanding the spatial patternof historic, present and future gold miningand its associated impacts across theregion. Representing one of the most widelydistributed and most well-establishedsources of auriferous ore across the globalPrecambrian landscape (Goldfarb et al.,2001), more than 90% of the major golddeposits worked in the region over the pastcentury are closely associated with the spa-tial distribution of the greenstone belt (Fig.8.8) and are cited as first-order explorationtargets for large tonnage–low grade golddeposits (Voicu et al., 2001). Greenstonesare unusually widespread across theGuiana Shield and represent the largestareal exposure of this Precambrian forma-tion in South America (see ‘Greenstonebelts’, Chapter 2). They also occur acrossthe Brazilian (Guapore) Shield (e.g. Bahia,Goias, Minas Gerais), where they have beenmined extensively since the early 18th cen-tury and continue to account for the majorshare of Brazil’s declared gold production(US Bureau of Mines, 1923–2002).
Socio-economic Aspects of Forest Use 423
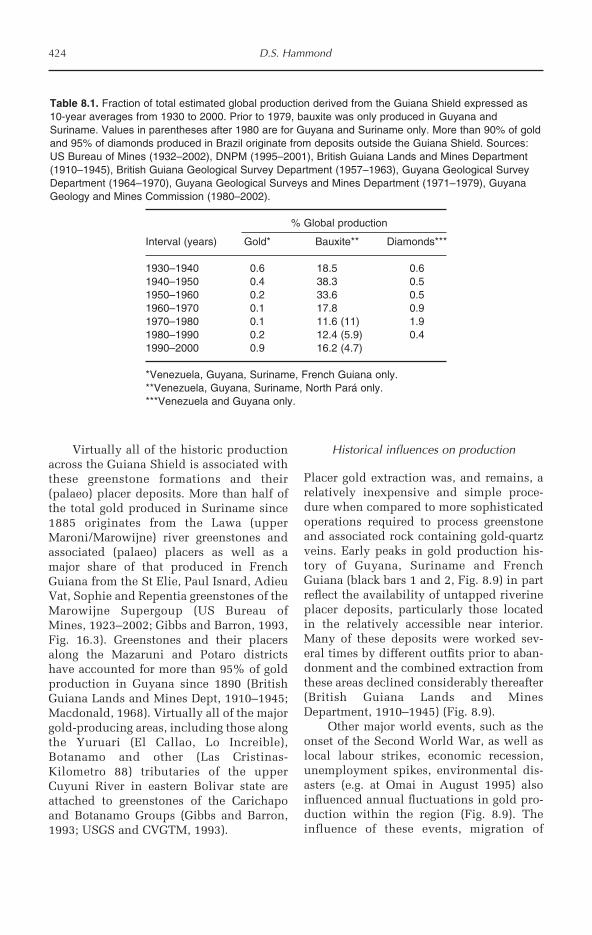
Virtually all of the historic productionacross the Guiana Shield is associated withthese greenstone formations and their(palaeo) placer deposits. More than half ofthe total gold produced in Suriname since1885 originates from the Lawa (upperMaroni/Marowijne) river greenstones andassociated (palaeo) placers as well as amajor share of that produced in FrenchGuiana from the St Elie, Paul Isnard, AdieuVat, Sophie and Repentia greenstones of theMarowijne Supergoup (US Bureau ofMines, 1923–2002; Gibbs and Barron, 1993,Fig. 16.3). Greenstones and their placersalong the Mazaruni and Potaro districtshave accounted for more than 95% of goldproduction in Guyana since 1890 (BritishGuiana Lands and Mines Dept, 1910–1945;Macdonald, 1968). Virtually all of the majorgold-producing areas, including those alongthe Yuruari (El Callao, Lo Increible),Botanamo and other (Las Cristinas-Kilometro 88) tributaries of the upperCuyuni River in eastern Bolivar state areattached to greenstones of the Carichapoand Botanamo Groups (Gibbs and Barron,1993; USGS and CVGTM, 1993).
Historical influences on production
Placer gold extraction was, and remains, arelatively inexpensive and simple proce-dure when compared to more sophisticatedoperations required to process greenstoneand associated rock containing gold-quartzveins. Early peaks in gold production his-tory of Guyana, Suriname and FrenchGuiana (black bars 1 and 2, Fig. 8.9) in partreflect the availability of untapped riverineplacer deposits, particularly those locatedin the relatively accessible near interior.Many of these deposits were worked sev-eral times by different outfits prior to aban-donment and the combined extraction fromthese areas declined considerably thereafter(British Guiana Lands and MinesDepartment, 1910–1945) (Fig. 8.9).
Other major world events, such as theonset of the Second World War, as well aslocal labour strikes, economic recession,unemployment spikes, environmental dis-asters (e.g. at Omai in August 1995) alsoinfluenced annual fluctuations in gold pro-duction within the region (Fig. 8.9). Theinfluence of these events, migration of
424 D.S. Hammond
Table 8.1. Fraction of total estimated global production derived from the Guiana Shield expressed as10-year averages from 1930 to 2000. Prior to 1979, bauxite was only produced in Guyana andSuriname. Values in parentheses after 1980 are for Guyana and Suriname only. More than 90% of goldand 95% of diamonds produced in Brazil originate from deposits outside the Guiana Shield. Sources:US Bureau of Mines (1932–2002), DNPM (1995–2001), British Guiana Lands and Mines Department(1910–1945), British Guiana Geological Survey Department (1957–1963), Guyana Geological SurveyDepartment (1964–1970), Guyana Geological Surveys and Mines Department (1971–1979), GuyanaGeology and Mines Commission (1980–2002).
% Global production
Interval (years) Gold* Bauxite** Diamonds***
1930–1940 0.6 18.5 0.61940–1950 0.4 38.3 0.51950–1960 0.2 33.6 0.51960–1970 0.1 17.8 0.91970–1980 0.1 11.6 (11) 1.91980–1990 0.2 12.4 (5.9) 0.41990–2000 0.9 16.2 (4.7)
*Venezuela, Guyana, Suriname, French Guiana only.**Venezuela, Guyana, Suriname, North Pará only.***Venezuela and Guyana only.

Socio-economic Aspects of Forest Use 425
Fig. 8.8. Commercial-grade gold, bauxite, diamond and iron ore deposits (empty circles) of the GuianaShield and their affiliated geological formations (grey areas). Deposit locations taken from USGS andCVGTM (1993). Geological coverages adapted from Gibbs and Barron (1993). Arrows indicate location ofworking bauxite and iron mines that have supplied the major share of production depicted in time seriesof Fig. 8.9. General region of greenstone (and placer) gold deposits being heavily worked (illegally) byBrazilian garimperos in Guyana, Suriname and French Guiana are indicated by open stars.
Bauxite &Phanerozoic
sediments
Gold &greenstones
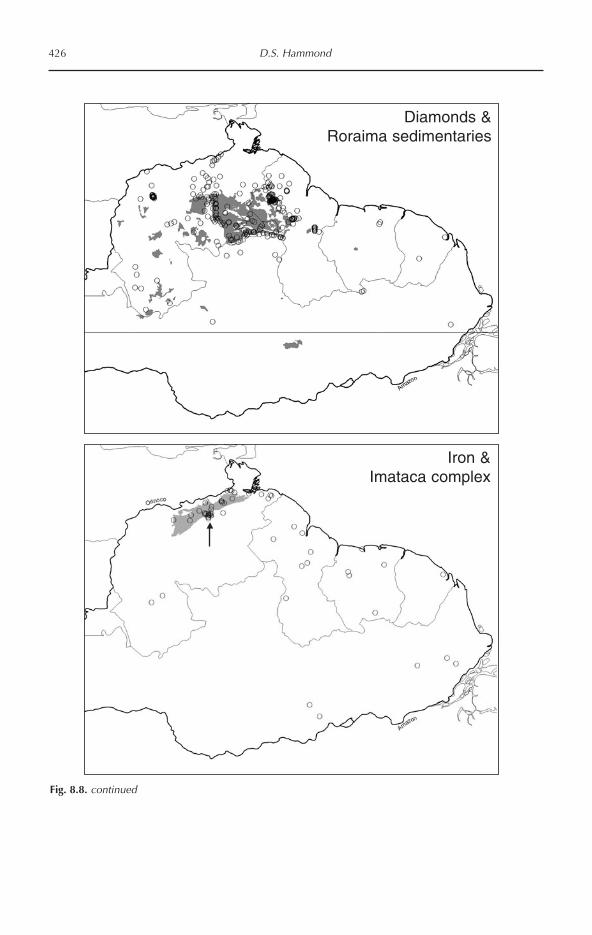
426 D.S. Hammond
Diamonds &Roraima sedimentaries
Iron &Imataca complex
Fig. 8.8. continued
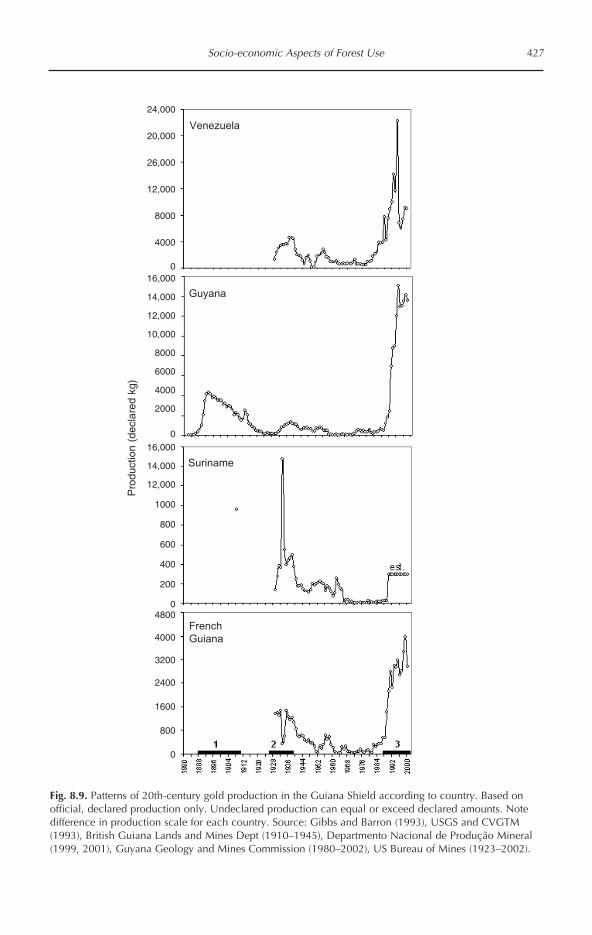
Socio-economic Aspects of Forest Use 427
Fig. 8.9. Patterns of 20th-century gold production in the Guiana Shield according to country. Based onofficial, declared production only. Undeclared production can equal or exceed declared amounts. Notedifference in production scale for each country. Source: Gibbs and Barron (1993), USGS and CVGTM(1993), British Guiana Lands and Mines Dept (1910–1945), Departmento Nacional de Produção Mineral(1999, 2001), Guyana Geology and Mines Commission (1980–2002), US Bureau of Mines (1923–2002).
24,000
20,000
26,000
12,000
8000
4000
016,000
14,000
12,000
10,000
8000
6000
4000
2000
016,000
14,000
12,000
1000
800
600
400
200
04800
4000
3200
2400
1600
800
0
Pro
duct
ion
(dec
lare
d kg
)Venezuela
Guyana
Suriname
FrenchGuiana

labour between countries and the strongpolitical and economic ties binding most ofthe region to Europe and North America arereflected in the synchronicity of productionspikes across the region (Figs 8.9 and 8.10).Similarly, when the Bretton WoodsAgreement was signed in 1944, fixing theworld gold price at US$35/oz, productiondeclined and remained flat in all of thegold-producing countries forming theGuiana Shield (Fig. 8.10). When the BrettonWoods fixed gold price was abandoned in1972, a new gold industry emergedthroughout the region as previously uneco-nomic reserves could be profitablyextracted at the rapidly inflating unitprices. In 1980, gold reached its historicalmaximum at US$850/oz, as gold produc-tion rates remained flat but demand byspeculators and for new electronic applica-tions surged upward shortly after the end ofthe Bretton Woods price control (Fig. 8.10).By the early 1980s, production had begunto increase worldwide, the increase in sup-ply and speculator sales began to meet moreof the early demand and the unit pricedeclined to under US$400/oz. The begin-ning of the 1990s witnessed exponentialgrowth in declared gold production inVenezuela, Guyana and French Guiana,albeit at varying magnitudes (Fig. 8.10).Spurred on by political change, attractiveincentives to foreign investment, improvedexploration and extraction technologiesand the prospects of a post-Bretton Woodunit price of US$300+, several large mineswere commissioned or planned across thegreenstone belts of the north Guiana Shieldby the end of the century (Fig. 8.11).
Large-scale operations
By 2000, several large mining ventures hadbecome fully operational in Guyana (OmaiPhase II) and Venezuela Guayana (LaCamorra, Las Cristinas-Kilometro 88) (Fig.8.11) and several well-established sites inVenezuela (El Callao) had increased pro-cessing rates, sending declared productionto record levels (Fig. 8.9). For example, inits first year of operation in 1993, Omaialone accounted for 72% of total declared
gold produced nationally (Guyana Geologyand Mines Commission, 1994) and repre-sented one of the largest open-cast mines inthe Americas. These large operationsprocess vast quantities of low-grade, aurif-erous ore using heavy machinery extracting10,000 (330) to 50,000 (1660) g (troy oz.) perday. Given the immense capital investmentneeded to process greenstone ore, the prof-itability of large-scale operations is highlysensitive to the relationship between oregrade, recovery rates and the world goldprice. In 1999, when gold unit prices dippedbelow US$270, large-scale mining of lower-grade deposits operated along very narrowmargins, particularly where recovery ratesdeclined or ore grades failed to meet expec-tations. Operations were temporarily sus-pended in some instances (e.g. constructionof Placer Dome’s Las Cristinas mine (Torres,1999)). Sound investment strategies in thegold futures market13 are purported to haveoffset thin margins at one of these large oper-ations during this period, but this strategyonly further emphasizes the external socio-economic controls on commodity produc-tion, and forest use, in the region. Withoutflotation of the world gold price afterBretton-Woods, most of the existing (Omai,Konawaruk, El Callao Phase II, Las Cristinas)or planned (Gross Rosebel, Suriname; PaulIsnard Phase II, French Guiana; Las Brisas,Venezuela) lower-grade ore mining ventureswould not be economical (Fig. 8.11).
Medium-scale operations
While a few large operations account for thelion’s share of declared production,medium-scale operations that employ anintermediate level of capital account for thelargest operational area of forestland.Capital normally takes the form of diver-operated, bucket and/or ‘missile’ dredgesthat are designed to process smaller quanti-ties of unlithified sediment and soil fromriver channels and banks to produce 1000(33) to 10,000 (330) g (troy oz.) per day.During the early 20th century, dredges werethe most capital-intensive form of miningand accounted for the largest fraction ofannual production in Guyana (British
428 D.S. Hammond
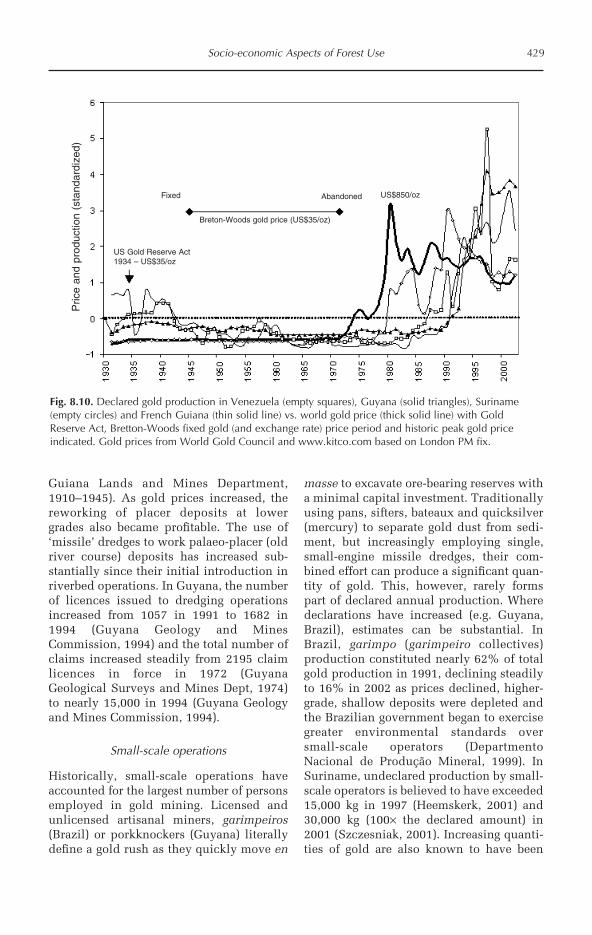
Guiana Lands and Mines Department,1910–1945). As gold prices increased, thereworking of placer deposits at lowergrades also became profitable. The use of‘missile’ dredges to work palaeo-placer (oldriver course) deposits has increased sub-stantially since their initial introduction inriverbed operations. In Guyana, the numberof licences issued to dredging operationsincreased from 1057 in 1991 to 1682 in1994 (Guyana Geology and MinesCommission, 1994) and the total number ofclaims increased steadily from 2195 claimlicences in force in 1972 (GuyanaGeological Surveys and Mines Dept, 1974)to nearly 15,000 in 1994 (Guyana Geologyand Mines Commission, 1994).
Small-scale operations
Historically, small-scale operations haveaccounted for the largest number of personsemployed in gold mining. Licensed andunlicensed artisanal miners, garimpeiros(Brazil) or porkknockers (Guyana) literallydefine a gold rush as they quickly move en
masse to excavate ore-bearing reserves witha minimal capital investment. Traditionallyusing pans, sifters, bateaux and quicksilver(mercury) to separate gold dust from sedi-ment, but increasingly employing single,small-engine missile dredges, their com-bined effort can produce a significant quan-tity of gold. This, however, rarely formspart of declared annual production. Wheredeclarations have increased (e.g. Guyana,Brazil), estimates can be substantial. InBrazil, garimpo (garimpeiro collectives)production constituted nearly 62% of totalgold production in 1991, declining steadilyto 16% in 2002 as prices declined, higher-grade, shallow deposits were depleted andthe Brazilian government began to exercisegreater environmental standards oversmall-scale operators (DepartmentoNacional de Produção Mineral, 1999). InSuriname, undeclared production by small-scale operators is believed to have exceeded15,000 kg in 1997 (Heemskerk, 2001) and30,000 kg (100× the declared amount) in2001 (Szczesniak, 2001). Increasing quanti-ties of gold are also known to have been
Socio-economic Aspects of Forest Use 429
Breton-Woods gold price (US$35/oz)
US Gold Reserve Act1934 – US$35/oz
Fixed US$850/ozAbandoned
Pric
e an
d pr
oduc
tion
(sta
ndar
dize
d)
Fig. 8.10. Declared gold production in Venezuela (empty squares), Guyana (solid triangles), Suriname(empty circles) and French Guiana (thin solid line) vs. world gold price (thick solid line) with GoldReserve Act, Bretton-Woods fixed gold (and exchange rate) price period and historic peak gold priceindicated. Gold prices from World Gold Council and www.kitco.com based on London PM fix.
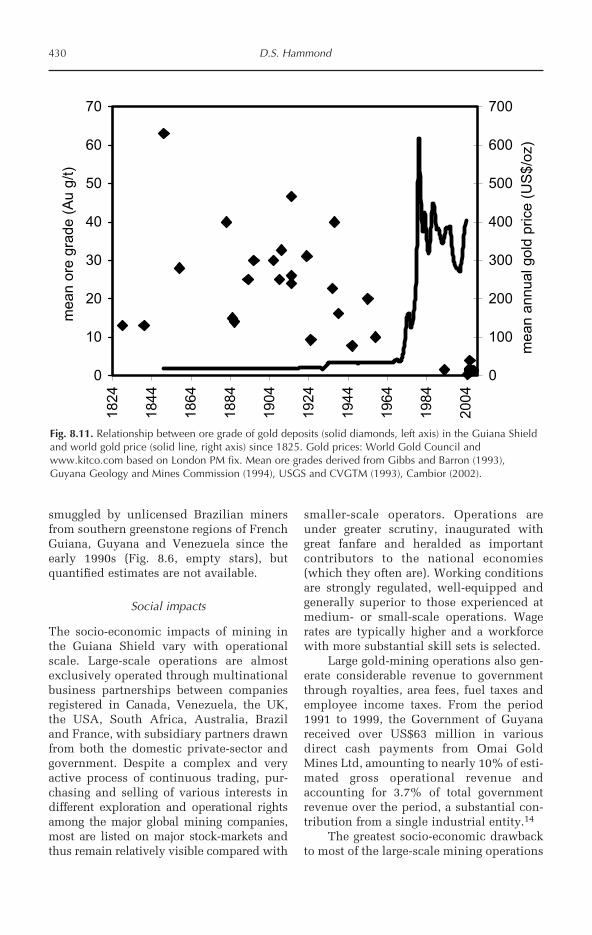
smuggled by unlicensed Brazilian minersfrom southern greenstone regions of FrenchGuiana, Guyana and Venezuela since theearly 1990s (Fig. 8.6, empty stars), butquantified estimates are not available.
Social impacts
The socio-economic impacts of mining inthe Guiana Shield vary with operationalscale. Large-scale operations are almostexclusively operated through multinationalbusiness partnerships between companiesregistered in Canada, Venezuela, the UK,the USA, South Africa, Australia, Braziland France, with subsidiary partners drawnfrom both the domestic private-sector andgovernment. Despite a complex and veryactive process of continuous trading, pur-chasing and selling of various interests indifferent exploration and operational rightsamong the major global mining companies,most are listed on major stock-markets andthus remain relatively visible compared with
smaller-scale operators. Operations areunder greater scrutiny, inaugurated withgreat fanfare and heralded as importantcontributors to the national economies(which they often are). Working conditionsare strongly regulated, well-equipped andgenerally superior to those experienced atmedium- or small-scale operations. Wagerates are typically higher and a workforcewith more substantial skill sets is selected.
Large gold-mining operations also gen-erate considerable revenue to governmentthrough royalties, area fees, fuel taxes andemployee income taxes. From the period1991 to 1999, the Government of Guyanareceived over US$63 million in variousdirect cash payments from Omai GoldMines Ltd, amounting to nearly 10% of esti-mated gross operational revenue andaccounting for 3.7% of total governmentrevenue over the period, a substantial con-tribution from a single industrial entity.14
The greatest socio-economic drawbackto most of the large-scale mining operations
430 D.S. Hammond
0
10
20
30
40
50
60
701824
1844
1864
1884
1904
1924
1944
1964
1984
2004
mea
n o
re g
rad
e (
Au
g/t
)
0
100
200
300
400
500
600
700
mean a
nnual gold
pri
ce (
US
$/o
z)
Fig. 8.11. Relationship between ore grade of gold deposits (solid diamonds, left axis) in the Guiana Shieldand world gold price (solid line, right axis) since 1825. Gold prices: World Gold Council andwww.kitco.com based on London PM fix. Mean ore grades derived from Gibbs and Barron (1993),Guyana Geology and Mines Commission (1994), USGS and CVGTM (1993), Cambior (2002).

is their relatively short operational life.Operational life expectancy of mostlarge-scale operations has been and contin-ues to be projected at less than 15 years (e.g.Omai, 1993–2005), although there areexceptions (e.g. El Callao). Large operationsprocessing low-grade deposits are also mostsusceptible to the vagaries of the interna-tional gold market. Low gold prices typi-cally curtail further exploration and miningat this scale. Combined with dwindling oregrades at operational sites, the GuianaShield region is exposed to economic rip-pling as successive large-scale operationscommence and then close, but with insuffi-cient overlap to maintain employment lev-els and benefits. Government revenue flow,personal disposable income and local eco-nomic liquidity all suffer through theseboom-and-bust cycles.
Considerable manpower is also mobi-lized and concentrated around large-scaleenterprises during the period of their oper-ation. For example, the Omai operation wasemploying more than 1000 skilled staff byits 10th year of operation. Closure creates atremendous economic vacuum in nearbycommunities that have rapidly geared toprovide goods and services during the wax-ing years of mineral production. With littledemand for these post-closure, much of theinfrastructure becomes redundant, unsus-tainable and what wealth that has accrueddeparts in search of other opportunities.
Medium- and small-scale operatorstend to be owned by an individual or fam-ily from within the country, increasinglywith Brazilian involvement, and typicallymaintain a lower operational profile. Smallartisanal miners are normally single indi-viduals or groups that are seeking toachieve some measure of cash income thatotherwise is unattainable due to slow or nodemand for their acquired skills, their lim-ited formal education and training andinability to emigrate. During periods of eco-nomic recession, Heemskerk (2001) sug-gests that artisanal mining may bemodulating the impacts of low wage-earn-ing opportunities by offering an outlet tothe unemployed during periods of high eco-nomic volatility in Suriname. This too is
clearly the case in Guyana (D. Hammond,personal observation). Increasingly, thisoutlet in the Guianas is being used byBrazilians garimpeiros that have seen theiropportunities diminish in Roraima, Paráand Amapá as the national governmentincreases its enforcement of federal lawsprotecting the environment andAmerindian lands.
But this open-ended opportunity toearn higher wages through small-scale min-eral extraction in the interior is not withoutsubstantive social costs (Heemskerk, 2001).Among the greatest concerns attached tosmall-scale operations are health issuesrelated to sexually transmitted diseases,mercury poisoning, occupational accidentsand insect vector-borne infections, such asmalaria, dengue and yellow fever. HIVprevalence among small-scale miners inGuyana can be very high (Palmer et al.,2002), as is their susceptibility to insect-borne diseases once a camp is infected.Accident rates are also comparably highamong medium- and small-scale operatorswhere safety guidelines, if existing, arerarely enacted and access to health care isinadequate. Prostitution services are fre-quently located near mining camps andHIV infection among these women isinvariably high. The return of miners totheir home villages leads to further spreadof these infections to their families andother community members.
Cultural attrition in gold-mining fron-tiers across the Guiana Shield is also com-monplace and has led extensively toviolence, abuse and exploitation of tradi-tional Amerindian communities acrossmany parts of the region when ore-bearingdeposits overlap with existing Amerindianlands and traditional resource space (Forte,1996, p. 96; Tierney, 2000).
Environmental impacts
FOREST LOSS Mining by definitioninvolves the rapid removal of the soil, sub-soil and/or upper parent rock strata. Thisalone constitutes a significant and unrecov-erable change to the local environment thatis not consonant with changes occurring to
Socio-economic Aspects of Forest Use 431
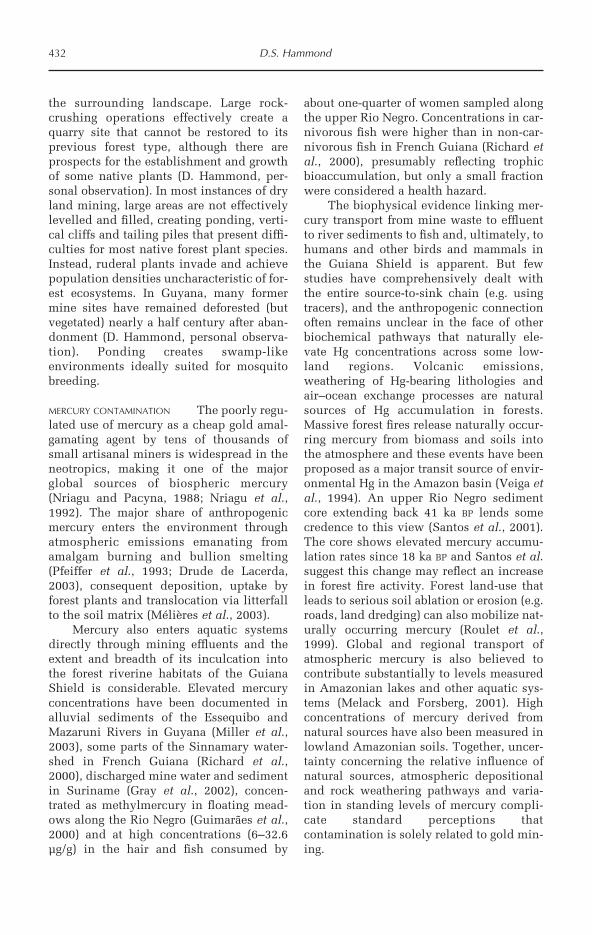
the surrounding landscape. Large rock-crushing operations effectively create aquarry site that cannot be restored to itsprevious forest type, although there areprospects for the establishment and growthof some native plants (D. Hammond, per-sonal observation). In most instances of dryland mining, large areas are not effectivelylevelled and filled, creating ponding, verti-cal cliffs and tailing piles that present diffi-culties for most native forest plant species.Instead, ruderal plants invade and achievepopulation densities uncharacteristic of for-est ecosystems. In Guyana, many formermine sites have remained deforested (butvegetated) nearly a half century after aban-donment (D. Hammond, personal observa-tion). Ponding creates swamp-likeenvironments ideally suited for mosquitobreeding.
MERCURY CONTAMINATION The poorly regu-lated use of mercury as a cheap gold amal-gamating agent by tens of thousands ofsmall artisanal miners is widespread in theneotropics, making it one of the majorglobal sources of biospheric mercury(Nriagu and Pacyna, 1988; Nriagu et al.,1992). The major share of anthropogenicmercury enters the environment throughatmospheric emissions emanating fromamalgam burning and bullion smelting(Pfeiffer et al., 1993; Drude de Lacerda,2003), consequent deposition, uptake byforest plants and translocation via litterfallto the soil matrix (Mélières et al., 2003).
Mercury also enters aquatic systemsdirectly through mining effluents and theextent and breadth of its inculcation intothe forest riverine habitats of the GuianaShield is considerable. Elevated mercuryconcentrations have been documented inalluvial sediments of the Essequibo andMazaruni Rivers in Guyana (Miller et al.,2003), some parts of the Sinnamary water-shed in French Guiana (Richard et al.,2000), discharged mine water and sedimentin Suriname (Gray et al., 2002), concen-trated as methylmercury in floating mead-ows along the Rio Negro (Guimarães et al.,2000) and at high concentrations (6–32.6µg/g) in the hair and fish consumed by
about one-quarter of women sampled alongthe upper Rio Negro. Concentrations in car-nivorous fish were higher than in non-car-nivorous fish in French Guiana (Richard etal., 2000), presumably reflecting trophicbioaccumulation, but only a small fractionwere considered a health hazard.
The biophysical evidence linking mer-cury transport from mine waste to effluentto river sediments to fish and, ultimately, tohumans and other birds and mammals inthe Guiana Shield is apparent. But fewstudies have comprehensively dealt withthe entire source-to-sink chain (e.g. usingtracers), and the anthropogenic connectionoften remains unclear in the face of otherbiochemical pathways that naturally ele-vate Hg concentrations across some low-land regions. Volcanic emissions,weathering of Hg-bearing lithologies andair–ocean exchange processes are naturalsources of Hg accumulation in forests.Massive forest fires release naturally occur-ring mercury from biomass and soils intothe atmosphere and these events have beenproposed as a major transit source of envir-onmental Hg in the Amazon basin (Veiga etal., 1994). An upper Rio Negro sedimentcore extending back 41 ka BP lends somecredence to this view (Santos et al., 2001).The core shows elevated mercury accumu-lation rates since 18 ka BP and Santos et al.suggest this change may reflect an increasein forest fire activity. Forest land-use thatleads to serious soil ablation or erosion (e.g.roads, land dredging) can also mobilize nat-urally occurring mercury (Roulet et al.,1999). Global and regional transport ofatmospheric mercury is also believed tocontribute substantially to levels measuredin Amazonian lakes and other aquatic sys-tems (Melack and Forsberg, 2001). Highconcentrations of mercury derived fromnatural sources have also been measured inlowland Amazonian soils. Together, uncer-tainty concerning the relative influence ofnatural sources, atmospheric depositionaland rock weathering pathways and varia-tion in standing levels of mercury compli-cate standard perceptions thatcontamination is solely related to gold min-ing.
432 D.S. Hammond

However, the geographic position andgeomorphic attributes of the Guiana Shieldsuggest that diastrophic sources, such asvolcanoes, are not major contemporary con-tributors to standing mercury levels in theregion. Active chains are located north orwest of the shield region and sub-stratos-pheric aerosol emissions move northwest-ward, reducing the likelihood of directdeposition from these sources. Physicalweathering of substrate is probably lowerover (most parts of) the Guiana Shield thanany other neotropical region so would notact as a significant contemporary contribu-tor to elevating mercury levels, althoughchemical weathering pathways would besubstantial (as for aluminium and iron). Theabsence of any commercial mercurydeposits in the region suggests concentratedpoint-source lithologies no longer exist ornever existed (Macdonald, 1968; Gibbs andBarron, 1993; USGS and CVGTM, 1993).The length and extent of past weathering,however, could have released mercury fromprevious depositional episodes that wouldhave been stored in the deep soil substratesand overlying vegetation and periodicallyreleased through fires. Over time, repeatedfires during dry periods and acceleratedchemical weathering during wet periodswould have eventually exported most mer-cury westward through prevailing tradewinds or eastward through the major water-ways, respectively.
However, the location and geology ofthe shield also makes it a potent bio-accu-mulating region once mercury is imported.Mercury complexes readily with both dis-solved and particulate organic matter(Roulet et al., 1999) in lowland forest envir-onments. Aquatic conditions of low pH andhigh DOC favour methylmercury produc-tion and the consequent bioaccumulationthrough the food chain. The Guiana Shieldrepresents the largest assemblage of lowpH/high DOC waterways in South America(and arguably the tropical world) (see‘River, Lake and Tidal Systems’, Chapter 2).High-level human mercury contaminationhas been positively correlated with lowriver pH and high DOC fractions,independent of mining activities in the
Amazon (Silva-Forsberg et al., 1999). Theprevalence of both predatory and benthic-feeding fish species in the aquatic systemsof the Guiana Shield would concentrateeffects as carbon-complexed mercury isaccumulated through the food chain. Theimpacts of repeated gold-mining activitieswith little pre-effluent settling and liberaluse of liquid mercury in blackwater-domi-nated watersheds are compounding back-ground mercury concentrations in a systemwith potentially severe downstream publicand environmental health consequences.
SEDIMENT LOADING Rivers draining theGuiana Shield have naturally low levels ofsuspended sediment (see ‘River, Lake andTidal Systems’, Chapter 2) and the magni-tude of sediment discharge from modernland-dredging operations is unprecedented.While sediment levels do vary among riversdraining the region, most are considerablylower than those documented for water-ways draining Andean areas dominated byactive physical weathering (see Fig. 2.34).The very recent influx of massive sedimentsassociated with gold mining is invariablyaltering long-standing attenuation of theaquatic systems to relatively slow rates ofbiophysical change. Aquatic and terrestrialhabitats of the shield are highly acidicenvironments dominated by chemical,rather than physical, weathering processes.The massive rise in suspended sedimentresulting from mining in the region is com-parable to natural mass wasting processesthat characterize intense physical weather-ing of the Andean piedmont and isunprecedented in the last several millenniaof the shield interior (see ‘River, Lake andTidal Systems’ and ‘Prehistoric Climates ofthe Guiana Shield’, Chapter 2). Forest lifethat is adapted to relatively static patternsof changing acidity, sediment loading anddeposition will be competitively disadvan-taged under the alien conditions created byhyper-rising sediment influx createdthrough poorly managed gold mining.Ruderal and alien species better suited tosediment-driven river systems are likely tobenefit if mining activities sustain elevatedsediment loads in these regions.
Socio-economic Aspects of Forest Use 433
Bauxite
In contrast to a gold-mining environmentembracing a wide range of operationalscales and controls, bauxite is mined exclu-sively at very large operational scales. Itsformation through chemical reduction, par-ticularly along ancient laterite surfacesburied by deep Quaternary sediments, con-centrates aluminum in a high clay matrix asiron dissolves under the extreme acidity.These coastal plain bauxites (after Gibbsand Barron, 1993) produced some of thepurest (claimed) bauxite and are stronglycorrelated with the distribution ofPhanerozoic sediments along the rim of theGuiana Shield (Fig. 8.8). The largest bauxitemines in Guyana (Linden, Intuit,Kwakwani: Fig. 8.8, A) and Suriname(Moengo, Onverdacht, Paranam andLelydorp: Fig. 8.8, B) form part of thisgroup.
Other, lower-grade deposits occur athigher elevations. The very large mines atTrombetas in Brazil (Fig. 8.8, D) are exploit-ing one of these, associated with a series oferosional surfaces extending to theCretaceous (Gibbs and Barron, 1993). LosPijiguaos, sole producer of bauxite inVenezuela, is located at an even higher ele-vation, and these deposits belong to a groupof much older, high-elevation or plateau,bauxites (after Gibbs and Barron, 1993).They are formed on dissected planationsurfaces of Mesozoic–Cenozoic age atop therapakivi granites forming the Parguazabatholith in north Amazonas state (Solerand Lasaga, 2000) (Fig. 8.8, C). Otherupland commercial deposits are found inthe Paru-Jari River area and in lower grades(higher iron content) at Nuria and LosGuaicos, Venezuela; Kopinang, Guyana;Bakhuys and Brownsberg Mountains inSuriname; and Monts Kaw, Tortue,Française and Lucifer in French Guiana.
Historical influences on production
Bauxite was first produced in 1917 in(British) Guiana and shortly thereafter in1922 production commenced in (Dutch)Suriname (Fig. 8.12) and was maintained in
both at comparably low levels until theSecond World War. The extremely highdemand for aluminium in the manufactur-ing of armaments and military suppliesbrought a rapid and unprecedented upsurgein mining activity to the relatively secureGuianas from 1939 to 1945 (Fig. 8.12). Bythe end of the war, British and DutchGuiana were the largest and longest pro-ducers of bauxite in a world with a growingdemand for aluminium products. Theyaccounted for nearly 40% of total globalbauxite production during this period(Table 8.1). Production in both countriespeaked immediately following independ-ence (1966–1975) and has experienced adecline since then (Fig. 8.12), in part due torapid growth in competition from Jamaica,Australia, Brazil and Venezuela after 1950(US Bureau of Mines, 1923–2002) and inpart due to increases in unit productioncosts due to the age of the deposit, manage-ment inefficiencies, social unrest andworker strike actions (Table 8.1). Despitethis, they remain significant sources of themore valuable refractory-grade and cal-cined bauxite. Mining of lower-gradedeposits over a 228 km2 concession embrac-ing the Kaw, Rouri and Mahury mountainsof French Guiana (near Cayenne) wasplanned from 1968 to 1972, but failed tomaterialize when Alcoa (CMAG) (USA) andPéchiney (France) allowed their miningrights to lapse in 1973 (US Bureau of Mines,1968–1973) as bauxite prices dropped andremained low after the post-war surge indemand was supplied from other existingsuppliers, making the prospect uneco-nomic. By 1983, production in Brazilexceeded both Guyana and Suriname, prin-cipally through activation of its Trombetasoperation in 1979, but also from lateractivation of mines along the BrazilianShield periphery in the states of MinasGerais and Santa Catarina (Fig. 8.12).Bauxite production in Venezuela com-menced in 1986 and has risen steadilythrough the massive-scale production at theLos Pijiguaos mine in the Parguaza districtof Venezuelan Guayana (Fig. 8.12). By the1990s, the Guianas contributed a mere 5%to global production, while deposits in
434 D.S. Hammond

Socio-economic Aspects of Forest Use 435
Fig. 8.12. Twentieth-century bauxite and diamond production trends in the Guiana Shield according tocountry. Only Venezuela and Guyana support significant diamond mining in the Guiana Shield. Source:British Guiana Lands and Mines Dept (1910–1945), Departmento Nacional de Produção Mineral (1999,2001), Guyana Geology and Mines Commission (1980–2002), US Bureau of Mines (1923–2002).
16,000
14,000
12,000
10,000
8000
6000
4000
2000
0
1400
1200
1000
800
600
400
200
0
Met
ric t
onne
s (×
1000
)M
etric
car
ats
(×10
00)

Brazilian and Venezuelan parts of theshield combined to account for nearly 12%,although little or none of this was of cal-cined or refractory grade.
Social impacts
Bauxite has dominated the 20th-centuryeconomies of Guyana and Suriname.Exports have accounted for unrivalled frac-tions of national GDP, foreign exchangeearnings and government revenues sincethe 1930s. In 1980, bauxite earningsaccounted for more than 30% and 20% ofSuriname’s and Guyana’s GDPs (at factorcost), respectively (Bank of Guyana, 1985).These contributions declined to 15% and4% by 2000, but still accounted for a signif-icant portion (70%) of foreign-exchangeearnings in Suriname, while declining to alittle above 15% in Guyana (Bank ofGuyana, 2000), mainly due to growth ingold mining and the agriculture sector. Thehistoric pre-eminence of bauxite produc-tion in the economies of Guyana andSuriname has clearly acted as an importantsource of foreign exchange and governmentrevenue. Yet one could argue that thedisproportionate weight of any single com-modity has deterred economic diversifica-tion and innovation as the wider public andprivate sectors maintain a focus on theneeds of one, or a few, dominant extractiveindustries. These needs are heavily affectedby fluctuating world market prices thatvary independent of mine performance.These prices are in part a reflection ofdownstream demand, but also changes inglobal competition from regions wherebauxite production plays a relatively minorrole in shaping the health of its parent econ-omy, while being produced at a much lowerproduction cost (e.g. Australia, China). Unitproduction costs of bauxite from Guyanaand Suriname are some of the highest in theindustry and unit export prices haveexceeded world unit prices in only eight ofthe last 20 years (US Bureau of Mines,1923–2002; Perez et al., 1997). As a conse-quence, the industry has contracted signifi-cantly, leaving communities established toservice mine complexes with few employ-
ment opportunities and stagnant economicdevelopment. Often these communitiesturn to artisanal (chainsaw) logging,wildlife collecting, gold mining and smug-gling to achieve a measure of householdincome when the structured prospects foremployment disappear in the miningindustry.
Environmental impacts
Like large gold-mining operations, bauxiteproduction in the Guiana Shield is open-cast, stripping soil and sediment from anarea of several square kilometres and creat-ing a new, more dramatic landscape of hillsand canyons formed from excavated andredistributed sediment. The physiographicand edaphic consequences of mining havehistorically involved little mitigation orrestoration effort, although the policy andregulatory trends across the region are mov-ing towards requirements for post-mininglandscape renewal (US Bureau of Mines,1923–2002). Forest restoration practiceshave been documented for the large PortoTrombetas (North Pará) operation along thesouth rim of the shield region. Results sug-gest that vegetation re-establishment is pos-sible, but the likelihood of early cohortrecovery of many important long-livedwoody taxa (e.g. Annonaceae, Chyrsobal-anceae, Lauraceae) is low due to poor dis-persal and establishment success andgreater management intervention may benecessary over a period extending decades(Parrotta et al., 1997; Parrotta and Knowles,1999).
Diamonds
Production from Minas Gerais, Brazil andthen the Kimberley fields of South Africahas dominated diamond production sincethe early 1700s (Svisero, 1995). Alluvialdeposits of diamonds were encountered inwestern Guyana as early as 1887, but thefirst declared commercial production in theGuiana Shield was not recorded until 1901(Fig. 8.12). Ten years later, production fromTepequen Mesa in northernmost Roraima
436 D.S. Hammond

state and the Caroni rivers commenced.Further finds in the Paragua, Cuchivero andGuaniamo Rivers draining the GuayanaHighlands and throughout the NorthPakaraima mountains in Guyana led to aseries of production peaks over the last cen-tury (Fig. 8.12), but the region has generallyfailed to supply more than 1% of totalglobal production (Table 8.1), althoughbrief peaks in the 1920s (in Guyana) and themid-1970s (in Venezuela) saw productionreach 4% and 2% of global output, respec-tively. More than 95% of production in theregion is restricted to Venezuela andGuyana. Production in Suriname, FrenchGuiana and Brazilian parts of the southernshield area is virtually non-existent, princi-pally due to the absence of Proterozoic sed-imentary lithologies associated with theRoraima Supergroup that are strongly corre-lated with alluvial deposits (Fig. 8.8) (see‘Prominent geological regions of the GuianaShield’, Chapter 2). Between 25% and 60%of recovered diamonds are typically of gem-stone quality, with the remainder gradedfor industrial or bort use (mainly for indus-trial abrasive and cutting applications) (USBureau of Mines, 1923–2002).
Roraima sedimentaries and diamonds
Major African diamond fields are associ-ated with Precambrian shield areas andkimberlite pipes (or diatremes) in particu-lar, where ore grades can reach commer-cially viable levels. Kimberlites ofcommercial quality are not believed tooccur widely across the Guiana Shield(Janse and Sheahan, 1995), probably due toexcessive erosion of their parent rock thatreleased the more friable diamond-contain-ing kimberlite. The 1989 find at QuebradaGrande in Venezuelan Guayana (CVG-TECMIN, 1991; Gibbs and Barron, 1993;USGS and CVGTM, 1993) suggests, how-ever, that pipe remnants may be rare, ratherthan entirely absent from the region.Virtually all of the historic production fromthe region has drawn from placer depositsalong the major streams draining theRoraima Supergroup of easternVenezuela/western Guyana. Diamond
deposits have not been successfully locatedfrom within the remnants of the Roraimasedimentaries, but most alluvial depositsare believed to have formed throughrepeated redistribution of material frompalaeo-placers associated with thesedeposits into more recent alluvial traps (e.g.behind falls) (Briceño, 1984).
Historical influences on production
The discovery of placer diamond depositsalong rivers in the region and subsequentworking of these deposits to exhaustion isprobably the primary pace-setter of historicproduction from the region. Relatively rarecommercial deposits are sufficiently scat-tered to effectively prevent any sustained,long-term trends in output. Most deposits,once discovered, appear to have a lifeexpectancy of between 5 and 15 years (Fig.8.8). For example, the 1968 discovery of theGuaniamo diamond placers in Venezuelaled to the largest and longest productionspike in the history of the shield region andaccounted for 85% of Venezuela’s declaredhistorical output (USGS and CVGTM, 1993,p. 87).
After the 1870 discovery of the vastKimberley fields in South Africa, diamondsbecame relatively common and the caratprice dropped to less than US$50 for aclear, cut one-carat stone. Realizing theirinvestment was at risk, the DeBeers syndi-cate or cartel was formed in 1889, 2 yearsbefore major commercial production in (thethen) British Guiana to restrict the globaldiamond supply and sustain the appear-ance, if not the reality, of diamonds as arare and valuable mineral commodity.Despite continued expansion of diamondproduction, unit prices reached nearlyUS$800 per carat (as above) in 1922 underthe management of global trade by DeBeers(Ball, 1934, Fig. 106). The rapid rise in dia-mond prices catalysed commercial produc-tion in (British) Guiana from 1922 to 1927(Fig. 8.12). As prices fell to US$500 percarat shortly after the stock market crashand onset of the Great Depression, produc-tion in (British) Guiana dropped to pre-1922 levels (Ball, 1934).
Socio-economic Aspects of Forest Use 437
Like gold, diamonds held value duringperiods of economic uncertainty whenpaper money and stock investments rapidlydevalued. During periods of prosperity,gold and diamonds were bought as invest-ments. When economic depressionrestricted income, gold and diamonds weresold, driving up supply in a market withdiminishing demand. The valuation of dia-monds, however, is more complex than theglobal supply–demand relationship govern-ing gold prices and the quantity of produc-tion alone is not a good indicator of itsvalue. Clarity, colour, size (caratage) andwhether stones are cut or uncut (rough)play significantly on their value. The ratioof gem to industrial grade diamond produc-tion has traditionally been higher inGuyana than Venezuela or Brazil, althoughtotal output has remained considerablylower (US Bureau of Mines, 1923–2002).
By 1950, DeBeers had inculcated thelargest growing economy, the USA, withthe perception that diamonds were an inte-gral part of courtship and marriage througha clever and sustained advertising cam-paign that shaped the post-war generation’sperception of diamonds as heirlooms not tobe re-sold. A soaring demand and tight con-trol on the release of supply sent pricesupwards, sparking further investment indiamond exploration and extraction inGuyana and Venezuela (Fig. 8.12).Combined with the location of placerdeposits, DeBeers’ cunning control over thediamond supply and a spreading percep-tion of diamonds as investments, tokens ofcommitment and family keepsakes, has sus-tained production in the Guiana Shield inthe face of significant supplies emanatingfrom south and west-central Africa, south-ern Brazil and most notably, Australia. Asthe main Guaniamo fields in Venezuelareached their productive lifespan, Guyanabecame the largest producer of diamonds inthe Guiana Shield in 2001, a position it hadnot held since 1967 (Fig. 8.12).
Social impacts
Diamonds are rarely mined through large-scale operations in the Guiana Shield and
the socio-economic costs and benefitsattached to small- and medium-scale gold-mining and diamond operations are simi-lar. In many instances, operations targetboth commodities where placers containboth. By far the largest placer deposits arefound in Guyana and Venezuelan Guayanaand these have attracted Braziliangarimpeiros as the few deposits knownfrom Brazilian Roraima (e.g. Tépequem,upper Cotinga and Ireng (Mau, Mutum)Rivers) near commercial depletion or havebeen fully claimed.
Environmental impacts
Extraction of diamonds from alluvial sedi-ments is done through a physical, ratherthan chemical, sorting process. Withoutany mercury to manage, vast quantities ofsediment are processed and flusheddirectly (back) into waterways without fur-ther consideration, although diamonds canbe associated with conglomeratic depositswith higher gravel content than those typi-cally worked for gold and the change in sus-pended sediment loads and otherphysicochemical attributes of waterwaysare probably, on average, less than thoseassociated with gold mining. In manyinstances, however, both commodities aremined from the same (palaeo)placers.
Commercial NTFP extraction
From a commercial perspective, the goldenage of the non-timber forest product tradecommenced in the late 1800s and lasteduntil the 1950s. During this time, a widerange of natural forest products were inhigh demand as new manufacturing indus-tries required vast supplies of natural ma-terials, but synthetics had not yet reachedtheir wide-ranging and encompassing dom-inance as the materials of choice in themanufacture of working parts. Advances intransportation made the connectionbetween remote interior supply and over-seas manufacturing centres economical. Asa consequence, a commercial drive ofunduplicated magnitude swept the Guiana
438 D.S. Hammond

Shield when businesses quickly organizedto supply raw forest materials to burgeon-ing European and North American indus-trial sectors. Among these, the extraction oftropical tree latexes exceeded all others interms of both socio-economic and environ-mental consequences to forests and forest-based livelihoods of the 20th-centuryGuiana Shield.
Balata and Pará rubber (borracho, seringa)(Fig. 8.14)
Unlike most production of mineral com-modities, rubber is largely now only a chap-ter in the history of forest use in the GuianaShield. Rubber production continues inwestern Amazon in part due to structuredgovernment subsidies and internationalfair-trading networks and environmentalorganizations attempting to generate somelivelihood support for rubber-tappers(extractivistas) in the wake of their well-known struggle to retain their livelihood inthe face of dominating interests, a periodthat was highly publicized after the murderof Chico Mendes. By 1995, production ofboth balata (Manilkara bidentata) and Parárubber (Hevea brasiliensis) had slowed to atrickle of its former documented levels asnew synthetics eclipsed the last (e.g. golfballs) of their formerly wide-ranging appli-cations and government subsidy pro-grammes terminated (Fig. 8.13).
The history of Pará rubber collection isdominated by large-scale extractive activi-ties in Brazil, Peru and Colombia. Very lit-tle commercial-scale production wasrecorded from the Guianas or VenezuelanGuayana, in part due to the relatively lowdensity of Hevea in the north Guiana Basinand the failure of early efforts to establishplantations in the Guianas. Production inBrazil was first recorded shortly after theEuropean recognition of the elastic proper-ties of gutta percha and its potential appli-cations. Large populations of Heveabrasiliensis, the Pará rubber tree, across thelowland Amazon made the industrial-scaleextraction from natural forests possible,although the rapid rate of patented inven-
tions that characterized the late 19th cen-tury continued to create a demand that out-stripped the natural supply. Unit pricessoared. Imports to the USA alone reached258,000 tonnes, ten times recorded exportsfrom Brazil, during the peak period of pro-duction between 1910 and 1920. Pará rub-ber production in Brazil peaked at 43,000tonnes in 1914, spurred on by inventions ofthe pneumatic tyre, telegraphic and othermass-manufacturing applications (Fig.8.13). But extracting rubber from such anextensive area added costs and though therubber tree was amenable to near-continu-ous tappings, supply became constrainedby the species’ natural abundance.Plantation trials in Brazil largely failed astrees succumbed to the rubber-tree fungus,Dothidella ulei (Barham and Coomes, 1996;Goulding et al., 1996). The rubber tree’sescape from this fungus in Asia allowed theBritish and Dutch to establish widespreadplantations by 1925. Tapping of these soonthereafter ended the Brazilian monopoly,flooded a market already dwindling in theface of further inventions, such as the wire-less telegraph, which reduced mass-scaledemand for cable-insulating materials (Fig.8.13). With the contraction of industry dur-ing the Great Depression, the Brazilian rub-ber extractivist economy was effectivelydead. Production in Brazil recovered tem-porarily during the Second World War,when most Japanese-occupied Asian plan-tations were unable to supply a growingwar-time demand in the USA and GreatBritain, but this abruptly declined at theend of the war in 1945 (Fig. 8.13). By theend of the Great Amazon Rubber Boom in1945, nearly 1.3 million tonnes of rubberhad been produced from Brazil alone.Perhaps one-fifth of this was produced fromthe forests of the southern Guiana Shieldalong the Jari River and the Rio Negro.
The story of balata production islargely derived from the Guianas, althoughrelatively small commercial quantities wereharvested up until the 1930s from northPará, Amapá and the Rio Negro basin(Pinton and Emperaire, 1992) and contin-ued to be collected sporadically from theseareas for domestic consumption and handi-
Socio-economic Aspects of Forest Use 439

440 D.S. Hammond
Fig. 8.13. Historical balata and Pará rubber (borracha, seringa) production in the Guiana Shield andBrazilian Amazon (including the Guiana Shield) with important events shaping the boom-and-bustcharacter of both industries highlighted. Note difference in balata and rubber production scales. Source:IBGE (2003a,b), British Guiana Lands and Mines Dept (1910–1945), Châtelain (1935), Bruleaux (1989),Jenman (1885).
Balata – others
Balata – Guyana
kilo
gram
s×
1000
kilo
gram
s×
1000
kilo
gram
s×
1000
Pará rubber – Brazil
1825
1835
1845
1855
1865
1875
1885
1895
1905
1915
1925
1935
1945
1955
1965
1975
1985
1995
Venezuela
Suriname
French Guiana
Synthetic golfball covers
Balatagolf ball covers
Polyethylenecable insulation
Great DepressionNylon & neoprene
Regular transatlanticwireless
telegraphy
Wireless telegraph
Pneumatic tyre
TelephoneFirst transatlantic telegraph cable
WWII
craft exports. Balata was first brought to theattention of French industry in 1855(Bruleaux, 1989) and British industry at theCrystal Palace International Exhibition of1862 (Davis, 1933). The following year sawthe first commercial-quantity exports fromthe Guiana Shield.
(British) Guyana was the earliest andlongest commercial producer of balata inthe region. From 1863 to 1988, nearly28,000 t of balata were produced from thiscountry, compared to 9300 t from FrenchGuiana over the period 1898–1936 (Fig.8.13). Commercial production began inVenezuelan Guayana and (Dutch) Surinamein 1894 (Gonggryp, 1923) and similarlyproved to have a shorter lifespan, althoughSuriname exports continued into the 1970s(Vink, 1970). Balata proved to have supe-rior insulating properties and it was usedwidely in the production of submarinetelegraph cable covering until the adventof commercial wireless telegraphy, andeventually phone services, rapidly curbeddemand (British Guiana Forest Depart-ment, 1935a). Remaining demand wasfurther eroded after replacement by poly-ethylene in the early 1950s (Fig. 8.13). Theintermediate elasticity of balata (morerigid than Pará rubber, but more flexiblethan gutta percha) also made it invaluableto the early manufacture of machinery drivebelts and, later, in the production of dim-pled golf ball covers and shoes (BritishGuiana Balata Committee, 1912; Coomes,1995). The gradual accumulation ofcheaper and more reliable synthetic alter-natives eroded balata’s usefulness in a man-ufacturing process that increasingly soughtcost reductions, supply certainty andtechnical improvement. Balata no longerhad any viable market niche and commer-cial production ceased altogether inSuriname by 1975 and in Guyana by 1982(Fig. 8.13).
Social impacts
The economic value of the rubber and bal-ata industries over the peak period ofdemand from 1890 to 1920 was tremendouswhen considering the relative modern-day
contribution of non-timber extractiveindustries to government revenue, employ-ment, export earnings and per capita GDP.By 1910, the Brazilian rubber industry wasestimated to have employed nearly 150,000(Bunker, 1985; Barham and Coomes, 1996).The balata industries in British, Dutch andFrench Guianas employed more than 8300,4000 and 500 the same year, while the num-ber of persons actively engaged in theindustry in Venezuela was estimated at10,000 (British Guiana Balata Committee,1912; Brett, 1916; Gonggryp, 1923). By1930, nearly half of the workingAmerindian male population of theRupununi district in (British) Guiana wasthought to have been employed as balatableeders (Davis, 1933).
Government, business and personalincome also rose substantively in rubber-and balata-bleeding regions during the peakproduction years. Gross regional incomefrom 1910 rubber sales in the BrazilianAmazon were comparable, in real terms, toincome levels in 1960 and real per capitaincome was nearly twice that estimated for1970 (Bunker, 1985). In Guyana, balata rev-enues collected in the form of royalties,export duties, rents (area fees) and surveyfees accounted for 43% (1925) to 80%(1905) of total annual government forestproduct revenue between 1900 and 1925(British Guiana Lands and Mines Dept,1910–1945; British Guiana BalataCommittee, 1912). By the 1950s, this contri-bution was reduced to a mere 2–3%.
Yet, the expected injection of greatwealth delivered by the booming rubberand balata years was quickly consolidatedunder patrões (patrons) and export busi-nesses that absorbed much of the benefitresulting from the labour of rubber-tappers,most of whom were Amerindians or formersubjects and descendants of the planto-cratic economy. Middlemen and licence-holders established themselves as soleproprietors of goods to their field labourerstypically working in remote frontier regionsin British Guiana (British Guiana BalataCommittee, 1912) and VenezuelanAmazonas (Sizer, 1991, cited in Richards,1993). Equally, in Brazilian Amazonas,
Socio-economic Aspects of Forest Use 441

hyper-inflated provision prices wouldquickly eat up earnings, and many rubber-tappers remained in debt servitude as sup-ply prices were increased in line withearnings (Bunker, 1985; Barham andCoomes, 1996).
The overseas demand for natural latex atthe beginning of the 20th century was ofsuch magnitude that it quickly outstrippedlabour capacity of the meagre native popula-tion remaining in the Amazon region after300 years of enslavement, disease and forcedemigration. Vast numbers of former sugarworkers from Bahia in Brazil and Berbice in(British) Guyana moved to rubber and balataproduction regions as a consequence. WhereAmerindian populations remained, such asthe upper Rio Negro and Uaupes/VaupésRiver, they were often forced into service orcruelly treated by rubber traders(Nimuendajú, 1950; Chernela, 1993;Saldarriaga, 1994) and then forced to reinte-grate into (Salesian) missionary compoundsas the only means of escaping continuousharassment (Chernela, 1998). Working crewsin British and (particularly) Dutch Guianaappear to have been employed on more rea-sonable terms, but systems of extendingcredit against provisions appear to have beena commonplace method of ensuring tappersreceived the least benefit from the balata pro-duction process (British Guiana BalataCommittee, 1912).
With the collapse of the rubber trade inBrazil, the vast majority of non-residentmestizo (Brazil, caboclo; Guyana, coast-lander) tappers remained in the Amazonwhere many fell into a continuation of theaviamento system, but increasingly basedon other extractive commodities, such asfish, skins, bushmeat, Brazil nuts, spicesand plant fibres and oils (Santos, 1968).Several major regional market centresemerged during the rubber boom period inthe Brazilian part of the Guiana Shield,most notably at Manaus and Barcelos(Lescure and de Castro, 1990). This post-rubber period established the foundationfor the modern-day, mixed-market rurallivelihoods commonly documentedthroughout the Rio Negro, Amazon,Orinoco and Solimões basins.
Environmental impacts
Rubber and balata bleeding satisfied some-what different industrial demands, werepursued around separate geographic cen-tres of peak production and employed dif-ferent tapping techniques (Fig. 8.14 forbalata). Hevea was amenable to a nearlycontinuous regime of bleeding, as vesselsdistributing latex around the tree’s sub-barkwere connected. In contrast, onceManilkara was initially bled, further bleed-ing of the same area did not yield anyappreciable quantity of latex. In Manilkara,sub-bark latex storage occurs in separate,vertical vessels that are not refilled, andlatex is only produced when new ones areformed (Gonggryp, 1923). Davis (1933) andothers anticipated a 15+ year recharge timefor a tapped tree to again yield commercialquantities of latex.
This distinction affected the way inwhich latex was collected between the twosources and, ultimately, the impact latex-collecting would have had on the metapop-ulations of these species across the GuianaShield over the last 100–130 years. WhilePará rubber collecting worked continuouslyaround the same Hevea stands, balata col-lectors had to initially roam over vast areasof forest within each concession in order tolocate additional trees that had yet to betapped. During the early years of industrialbalata collecting, latex was collected byfelling the entire tree. In effect, the resourcewas liquidated in an effort to achieve themaximum volume of latex at the currentmarket price. The timber value of the tree(at the time 20× that of balata) was left torot in the forest.15 As relatively access-ible stands dissolved or disappeared,tapping practices were placed underincreasing scrutiny (Jenman, 1885), andfelling of bulletwood trees was banned inBritish and Dutch Guiana by 1895.Recommendations by Jenman (1885) thatonly half of the bark be bled over a singlecycle were eventually incorporated into theBritish Guiana Crown Lands Regulations of1919. This reduced the amount of latex col-lected per tree during the initial tapping(Hohenkerk, 1919), but was intended to
442 D.S. Hammond

increase the proportion of trees survivinguntil the next extraction cycle. Tapping theentire circumference of Manilkara trees(20–90 cm dbh) typically resulted in 8–50%mortality, while bleeding only half of thebark area killed only 4–14% of exploitedindividuals (Davis, 1933). Full circumfer-ence tapping typified extraction from bothDutch and French Guiana throughout theperiod, leading to larger volumes being har-vested from fewer trees over a shorterperiod relative to British Guiana.Invariably, mortality was higher too. InVenezuela, virtually the entire supply ofbalata originating from forests of theGuayana region came from felled trees(Brett, 1916; Gonggryp, 1923). Stockingrates of bulletwood (purguo) were consider-ably higher across the main bleedingregions between Maturin and the upperCuyuni, between Ciudad Bolivar andTumeremo, around La Peragua on theCaroni and Caicara on the Orinoco River.
As a consequence, the production peak wasearly, intense and brief as the extractablereserves diminished with each felled tree(Fig. 8.13). Felling restrictions were not putin force until 1918, since the balata indus-try believed felling was the most efficientmethod of extracting latex from a tree thatwould die regardless of the techniqueemployed (Brett, 1916). Some early experi-mental trials indicated that latex yieldswere lower on felled trees compared toother methods that left trees standing(Anderson, 1914; Bancroft and Bayley,1914), but experimental design was poorlyconstructed and results were not entirely inline with the conclusions (Gonggryp, 1923).Balata and maçaranduba (Manilkarahuberi) trees were also bled in small com-mercial quantities across parts of NorthPará and Roraima states in Brazil as late asthe 1980s (Lescure and de Castro, 1990). Asin Venezuela, Manilkara latex was com-monly collected through tree-felling across
Socio-economic Aspects of Forest Use 443
Orinoco
Fig. 8.14. Approximate spatial distribution of most productive balata-bleeding regions and concessionsexploited throughout the late 19th and early 20th century. Based on descriptions in Brett (1916),Gonggryp (1923), Jenman (1885), Châtelain (1935) and Guyana Forestry Commission (1985). Maps ofSuriname balata concessions in Struycken de Roysoncour and Gonggrijp (1912) and produced forOrdinance of 1914 were not consulted. Areas in Suriname are thus less accurately located.

many parts of the Brazilian Amazon, a tech-nique that remained in practice as late asthe 1990s in South Pará (D. Hammond, per-sonal observation).
The estimable impacts of different latexproduction strategies on bulletwood popu-lations across the Guiana Shield are stagger-ing, even when adopting conservativemortality figures and liberal latex produc-tion rates.16 During the peak period of balataproduction from 1910 to 1920 (1905–1915in Venezuela), between 4.2 and 13.2 millionManilkara trees are estimated to have beenkilled either through felling or tappingacross the North Guiana Basin region of theshield, based on mortality and yield ratesdocumented at the time (Jenman, 1885;Hohenkerk, 1919; Gonggryp, 1923; Davis,1933; Châtelain, 1935). Commercial bleed-ing in Guyana alone is estimated to havekilled between 900,000 and 4.8 millionManilkara trees across the major producingregions of the country during the entire 125-year history of balata production.
Other latexes, oils, resins, fibres and foods
Pará rubber and balata extraction domi-nated the early 20th-century foresteconomies in the Guiana Shield, but a hugevariety of natural forest products com-monly forming an integral part ofAmerindian traditional culture also beganto balloon into fully fledged regional,national and international trade networks.Of these, a dozen or so reached significantlevels of production during the 20th cen-tury. These can be divided into two groups,namely: (i) latexes, oils and resins; and (ii)fibres and foods.
Generally speaking, the latex–oil–resingroup characterized a pattern of boom-and-bust production similar to rubber and bal-ata. Their production peaked with the firsthalf of the 20th century and diminishedsubstantially as demand outstripped sup-plies of naturally sourced materials andsynthetic alternatives were successfullydeveloped to overcome these supply con-straints on demand by the 1950s. As withrubber and balata, small quantities contin-
ued to be produced for local and nationalconsumption, but these represent an ever-diminishing source of income for ruralinhabitants across the Guiana Shield andother regions of the neotropics (e.g.Anderson and Ioris, 1992). It is not unrea-sonable to say that their status as commer-cial NTFPs was founded simply on the lagbetween accelerating rates of innovation inmanufacturing (1860–1920) and chemical(1920–1970) engineering. Rosewood oil(Aniba spp.), cumarin (Dipteryx spp.) andtanning bark (Rhizophora mangle) evolvedinternational markets only to decline asalternative sources were developed andcommercially accessible quantitiesdeclined through destructive harvesting(Rhizophora bark) or competing uses (e.g.Dipteryx lumber) (Homma, 1992).
Commercial rosewood oil production inthe Guiana Shield was driven mainly byextraction from forests in French Guiana andBrazil from 1880 to 1930 to feed a growingperfume industry. Commercial extinction ofrosewood trees due to destructive harvestingof the oil and competition from synthetics(linalool) and other exporting countries (e.g.Mexico) led to a price decline and eventualclosure of distillation operations, leading tothe collapse of the rosewood oil industry bythe 1930s (Homma, 1992). Production con-tinued sporadically up until the 1960s inFrench Guiana (Bruleaux, 1989) and smallproduction quantities are still reported fromBrazil (IBGE, 2000), but the process of min-ing slow-growing Aniba trees for their oil inthe states of Pará and Amazonas has led todeep contraction of the industry since itspeak in the 1960s.
The seeds of the sarrapia, or tonkabean, tree were also in great commercialdemand during the early 1900s for use incigarettes and perfume (Anon., 1936;Fanshawe, 1950). More than 1600 tonnes ofthe bean were produced in VenezuelanGuayana from 1926 to 1936, accounting forthe bulk of the export from the shieldregion. Nearly all of this volume was col-lected from the middle Caura andCuchivero watersheds, where relativelyhigh stocking rates of Dipteryx wereencountered. Annual production fluctuated
444 D.S. Hammond

by two orders of magnitude, due to interan-nual variation in fruit crop size. Synthesisof coumarin in the 1930s effectively elimi-nated supply variations due to the vagariesof natural phenology and the demand fornatural sources declined precipitously.Cumarin is still produced in Brazil, withnearly 90% of the 10–50 annual tonnesreported to originate from the North Paráregion of the Guiana Shield between 1990and 2002 (IBGE, 2003b).
The story of food and fibre productsfollowed a different course over the 20thcentury and many have retained or growninto viable national and international mar-kets. Most prominent within this group isthe production of the heart and fruits of theaçai (pinot, manicole, cabbage, manaka)palm, Brazil nuts and piaçaba(chiquichiqui) fibre.
Heart-of-palm
Commercial palm-heart production wasrecorded from Guyana as early as 1920(British Guiana Lands and Mines Dept,1910–1945). In the 1960s, palm-heart pro-
duction moved from southern Brazil to Paráand Amapá as stocks of Euterpe edulisdeclined below commercial quantities as aconsequence of overharvesting (Richards,1993). The Amazon estuary has been a par-ticularly important centre of palm-heartproduction since this time, generatingnearly US$300 million per annum andemploying 30,000 (Pollak et al., 1995).
All of the modern production of theGuiana Shield is drawn from operations inAmapá (IBGE, 2003b), French Guiana (Ricci,1989), northwestern Guyana (van Andel,2000) and the Delta Amacuro region basedon both E. oleracea and E. precatoria har-vesting. Although levels have been decliningdue to unsustainable harvesting rates andlower market prices, palm-heart productionstill ranks highly in contribution to total rev-enue generated from forest extractive indus-tries in both Guyana (van Andel, 1998, 2000)and Brazil (IBGE, 2003b). Over the lastdecade, however, production in Amapá hasbeen declining, while increasing in Guyana(Fig. 8.15), making this country the largestproducer in the Guiana Shield by the end ofthe millennium.
Socio-economic Aspects of Forest Use 445
Fig. 8.15. Heart-of-palm (palmito) production trends for main Guiana Shield producers in Amapá andGuyana at the end of the 20th century. Production reflects commercial harvesting of Euterpe spp. only.Sources: van Andel (2000), Guyana Forestry Commission (1980–2002), IBGE (2003b).
4500
4000
3500
3000
2500
2000
1500
1000
500
0
Pal
m h
eart
s (t
onne
s)
1990 1991 1992 1993 1994 1995 1996 1997 1998 1999 2000 2001 2002
Amapá
Guyana

Açai fruit
Commercial harvest of fruit from theEuterpe palm is a relatively modern devel-opment based on production almost exclu-sively carried out in the eastern BrazilianAmazon with only a small percentage(1–2.5%) derived from the Guiana Shield(Amapá). Virtually all of the commercialproduce in Brazil is destined for consump-tion in Macapá and Belem with little or noexport (Strudwick and Sobel, 1988) andprovides the largest contribution of anyNTFP to rural household incomes in thelower Amazon area (Anderson and Jardim,1989) and second largest revenue-earner atthe national level (IBGE, 2003b).Production in Amapá has been declining incontrast to the expanding production frommunicipios along the Amazon River and itsmajor southern tributaries (Table 8.2).
Brazil nuts
When the rubber boom busted in the 1920s,many of the former rubber tappers soughtother work in extracting Brazil nuts for agrowing international market. The centre ofBrazilian production originated in SouthPará, moving westward to Amazonas andfinally Acré, where the majority of nutswere produced up until the early 1990s(along with neighbouring Bolivian andPeruvian lowland regions). By the end ofthe 20th century, IBGE records indicate asteady decline in declared production fromAcré and (southern) Amazonas state is nowthe top contributor to national production.Nationally, production has nearly halvedover the period 1990 (51.2 kt) to 2002 (27.4kt) and a mere quarter of peak productionachieved in 1976 (104.5 kt), mainly due to adecline in production from Acré (IBGE,1985, 2003b). Despite this decline, Brazilnut production remains the second mostsignificant contributor to the extractive for-est economy in the post-rubber Amazonbasin. The Brazil nut industry has (thus far)avoided the more severe boom-and-bust lifehistory typifying many other internationalcommodities (Homma, 1992), despite hav-ing a mixed history of recurrent inequities
very similar to the oligopolistic aviamentosystem that structured the rubber economythroughout the early 20th-century lowlandneotropics.
Declared production from municipiosin the Guiana Shield account for a signifi-cant part of modern Brazil nut production,ranging between 16% (1998) and 55%(1995) during the 1990s (IBGE, 2003b).17
Small quantities of Brazil nuts wererecorded as having been shipped for sale inGuyana and Venezuela during the first halfof the 1900s (Fanshawe, 1950), but theextremely low stocking rates or absence ofBertholletia over most of the Guianas andVenezuelan Guayana has precluded anyserious commercial extraction from theNorth Guiana Basin region of the shield.This absence and the fact that most pro-duction emanates from terra firme forestsin municipios along or adjacent tothe Amazon Downwarp or other largerivers lends some support, when com-pared with the archaeological record (see‘Human prehistory’, above), that thisspecies owes much of its current distribu-tion and local abundance (in groves, or cas-tanhais) to past human manipulation(Balée, 1989).
Piaçaba (chiqui-chiqui) fibre
Piaçaba fibre is collected from the leaves ofthe palm Leopoldinia piassaba and manu-factured into a wide range of basic house-hold consumables (see Table 8.2) for sale inregional markets in Venezuelan andBrazilian Amazonas states and Colombia(Putz, 1979; Saldarriaga, 1994; Narváez andStauffer, 1999). During the late 19th–early20th century, piaçaba was exported forbroom manufacturing in Europe (Wallace,1853b), but is now largely restricted toregional markets (Puerto Ayacucho,Barcelos) that are within close proximity toraw materials sources. Leopoldiniapiassaba (and L. major) is narrowlyrestricted to the Rio Negro whitesand–blackwater habitat (Goulding et al.,1988; Henderson et al., 1995) that domi-nates the faulted depression crossing thecentral shield region (see ‘Major faults,
446 D.S. Hammond

Socio-economic A
spects of Forest Use
447
Table 8.2. Selected past and present non-timber forest products extracted for commerce from the Guiana Shield region, the peak decade of production andtheir commercial applications. (+) denotes small quantities with no or unknown peak period.
Country or statea
Scientific name Common names from region DA BOL VE-AM GUY SUR FG RR AP PA BR-AM General commercial use
Euterpe spp. acai uassai, guassai, baboen pine, pina + 1980s 2000s 2000s Juice, ice cream flavouringsEuterpe spp. palmito, cabbage + 1990s + 1080s Palm heartCarapa spp. andiroba, crabwood, krabba + + Soap, candlesCopaifera spp. copaiba + + + + 1970s Scented soaps and oilHeteropsis spp. nibbi, cipo titica + 1990s + Furniture, handicraftClusia spp. kufa 1990s FurnitureMauritia flexuosa lte, miriti, buriti, moriche 2000s + 2000s + + + + Handicraft, flour drinkBertholletia excelsa Brazil nut, castanha, noix du Bresil + + + 1960s 1970s 1970s NutsRhizophora mangle tanning bark 1925/1945 Leather tanningCouma utilis sorva, leche caspi + + + 1925 Chewing gum, paints, varnishLeopoldinia piassabe piacava, chiqui-chiqui 2000s 2000s Handicrafts, rope, brooms, mats, brushesDipteryx spp. cumaru, sarrapia, tonka bean 1940s 1930s 1940/1980s 1940s Tobacco flavouring, vanilla substituteOrchidaceae tropical orchids 1920s Horticulture tradeAniba spp. Pau rosa, bois de rose, rosewood 1920s 1960s 1960s Eau de toilette, perfumeHymenaea spp. locust resin, copal jatoba 1925 1960s Faux amber, varnish
Source: IBGE, GFC, Fanshawe (1950), Richards (1963), van Andel (2000), Bruleaux (1989), Homma (1992), Lescure & de Castro (1990).aDA, Delta Amacuro; BOL, Bolivar; VE-AM, Venezuelan Amazonas; GUY, Guyana; SUR, Suriname; FG, French Guiana; RR, Roraima; AP, Amapá; PA, Pará; BR-AM, Brazilian Amazonas.

downwarps, rift valleys and geosynclines’and ‘Upland and sedimentary plain soils’,Chapter 2). Production increased signifi-cantly in the Rio Negro basin at the close ofthe 20th century (from 1200 to 8000 tonnesper annum), but still only accounted for arelatively small fraction of total nationalproduction (<10%) (IBGE, 2003b), due tothe widespread harvesting of a similar,rament-like fibre (also called piaçava) fromAttalea funifera along the Atlantic coast ofnortheastern Brazil, especially in Bahia.Despite potential inter-regional competi-tion, piassaba production provides animportant contribution to rural incomesalong the upper Rio Negro region. The non-destructive harvesting of the rament fromeach adult plant dampens the likelihoodthat commercial extinction of the baseresource will curtail long-term, regionaldemand as in the case of other NTFPs. It iseasily transported and does not requiremajor capital investments in order toexpand marketing reach that otherwise lim-its more perishable products, such as açaifruit (Richards, 1993).
Commercial timber extraction
The commercial extraction of tropical tim-ber in the countries of the Guiana Shielddates back to the late 1500s, but only beganto compete in economic significance withthe long-standing agricultural sector as the19th century concluded. In many areas, thedemise of the early NTFP industriessparked a revaluation of the forestresources. In the Guianas, this shifted prin-cipally along a view that timber had failedto reach its full potential and that theGuianas held unsurpassed quantities ofsuperior timbers (Rodway, 1912;Hohenkerk, 1922; Furse et al., 1924; Valeixand Mauperin, 1989). In Brazil andVenezuela, a focus on alternative forms ofNTFP extraction and traditional agricul-tural and livestock-rearing dominated.Timber production, apart from high-gradedSwietenia macrophylla extraction,remained of relatively minor regionalimportance. Through a series of technologi-
cal, policy and economic transitions overthe course of the 20th century, timberextraction has grown from modest begin-nings into a recognized economic sectorthroughout most of the region. Parallelingthis growth in production is a growingrecognition of the considerable socio-eco-nomic and biological consequences of thisform of forest land-use, although timberproduction in the Guiana Shield has takenmany forms that, like the scale of miningoperations, vary in their socio-economicand environmental consequences.
Production trends
Up until the end of the 19th century, timberproduction had been restricted to only ahandful of species (e.g. Brosimum, Cedrela,Chlorocardium, Carapa, Manilkara, Mora,Ocotea) extracted in small quantities meas-uring no more than several thousand cubicmetres per year (Schomburgk, 1840;Malfoy, 1989; Valeix and Mauperin, 1989).Efforts to establish commercial plantationsof these and other native and exotic speciesduring the early 20th century largely faileddue to biological invasion of the monocul-tures and higher-than-expected costs ofplantation maintenance (Dawkins andPhilip, 1998). In the Guianas, concepts ofeconomic development remained squarelyfixed on the timber-driven largessebestowed upon North American economies,that were nonetheless rapidly exhaustingtheir hardwood supplies by the early 1900s(Williams, 1989). The increase in NorthAmerican demand, combined with contin-ued favourable performance of heavyhardwoods in maritime applications (ship-building, coastal defence works, canallocks, wharves) in Europe and the WestIndies, sparked increased demand for tim-ber products from the region. But the early20th century timber industries of theGuianas were poorly geared to fulfil themarket demand for industrial heavy hard-woods in The Netherlands, Great Britain,France, Martinique, Belgium, the USA,Canada and Bermuda, among others (e.g.Furse et al., 1924). By the time investment
448 D.S. Hammond

mobilized to increase production, the GreatDepression hit most national economies,weakening commercial investment in andmarket demand for timber products fromthe region (Oliphant, 1938), but increasingdomestic and regional demand in theCaribbean (British Guiana ForestDepartment, 1935b).
The greatest increase in global tropicaltimber production occurred from 1940 to1980 in the aftermath (and in part as a con-sequence) of the Second World War andoutput from the Guiana Shield paralleledthis worldwide trend (Fig. 8.16). Timberproduction from the Guianas increased rap-idly with the initiation of reconstruction inEurope and economic overdrive of a post-war North America, reaching new historicalhighs in annual production in Guyana,Dutch Guiana and French Guiana by 1965(Fig. 8.16). The establishment of the ill-fated Jari paper pulp plantation project over16k km2 of lower Amapá boosted totalwood production, but low growth rates and
poor performance of the ill-advised selec-tion of a fast-growing exotic, Gmelinaarborea, thwarted efforts to recapture themassive financial investment (Rollet, 1980;Palmer, 1986). With independence inGuyana and Suriname, productionincreased further only to decline across theGuianas in the early 1980s as worldwiderecession hit wood product demand.Production during the 1980s remaineddepressed and erratic. But by 1990, esti-mated timber production in the Guianassince the end of the Second World Wartotalled nearly 17.9 million cubic metres.Over the course of the early 1990s, consid-erable foreign investment in Guyana’s tim-ber industry propelled annual productionabove 500,000 m3/year (Fig. 8.16), a levelnever previously achieved in the GuianaShield. Production from Amapá during theearly 1990s also peaked during a period oftimber extraction from national forest tooffset shortfall in the Jari project, nowunder new management and objectives
Socio-economic Aspects of Forest Use 449
Fig. 8.16. Tropical timber production trends in the Guianas 1940–2002 for wood extracted from naturalforest sources only. Sources: British Guiana Forest Dept (1940–1965), Guyana Forest Department(1966–1976), Vink (1970), Guyana Forestry Commission (1980–2002), Office National des Forêts (1992,1997a), IBGE (2003a,b), ITTO (2003), FAOSTAT (2003).
Suriname
Guyana
French Guyana
(Table 8.3). At the end of the 20th century,Guyana had become the region’s largestcommercial producer of wood products,with Suriname, Bolivar state in Venezuelaand North Pará (less Jari) trailing (Table8.3). From 1990 to 2002, an estimated 14.1million cubic metres of wood was extractedfrom natural forests in the Guiana Shield,nearly 80% of the volume produced overthe preceding 40 years. Placing this volumein a larger geographic perspective, how-ever, it represents a mere 4% of the totaltropical roundwood production reportedfor Brazil from 1990 to 2002 (Table 8.3).This nominal figure reflects both the inac-cessibility created by the geomorphology ofthe region and the traditional avoidance offorest conversion approaches to timber pro-duction that have been more commonlyemployed across the southern Amazonregion of Brazil (see Chapter 9).
Forest area exploited or managed for timberproduction
Virtually all of the timber extracted fromforests of the region prior to 1950 wasfloated or loaded on punts (ballahoos inGuyana) or barges for downstream transportto sawmills and loading docks. As a conse-quence, the rapids interrupting virtuallyevery major waterway in the Guiana Shielddelimited the region of major productionprior to road-building. Commercial extinc-tion of forests below the falls over centuriesof repeated creaming was inevitable(McTurk, 1882; Hohenkerk, 1922). ImThurn (1883) described the late 19th cen-tury perception of this limitation in (thethen) British Guiana:
Next to [the sugar tract] is the timber tract,from which alone timber has as yet beenremuneratively brought to market. Thisextends toward the interior as far as thelowest cataracts on the various rivers. It ispresently impossible to cut timberprofitably beyond these cataracts, owing tothe difficulty which there would be in car-rying any cut beyond that to market; so thatan imaginary line, roughly parallel to thesea-coast, and cutting each of the great
rivers at their lowest cataracts, marks thefurther limit from the coast of this tract.
Im Thurn’s imaginary line extends aroundthe rim of the Guiana Shield (e.g. Gouldinget al., 1988, p. 25), effectively creating a bar-rier to transport of heavy consignments,particularly the dense woods that typifiedmost of the commercial timber volumessought for industrial applications. InSuriname, this imaginary line formed a620,000 ha exploitable forest belt, and sim-ilar problems of rapid overharvesting andcommercial depletion of merchantablespecies below the cataract line (Vink, 1970).
As the limitation of navigable water-ways in the region was overcome through aseries of road-building campaigns (e.g.British Guiana Forest Department, 1935a,1940–1965; Valeix and Mauperin, 1989),the exploitable forest estate expanded andnew forest reserves dedicated for timber ormultiple use purposes were established(Fig. 8.17). By 2000, an estimated 12.4% ofthe Guiana Shield had been allocated totimber production (Table 8.4), although thestatus of forests within these areas variedfrom heavily exploited and commerciallydepleted through to largely unexploited(Guyana Forestry Commission, 1980–2002;Office National des Forêts, 1997b; Mirandaet al., 1998).
Technological and transport transitions
The expansion of commercial timber pro-duction forests in many ways accompaniedtechnological advances that conditionallyrendered road-building and longer trans-port distances economically feasible.
Up until the 1950s, felling was carriedout exclusively by hand-axe and manyoperations still transported logs manuallyover rolling sticks (‘grey stick method’ inGuyana) and using draft animals (BritishGuiana Forest Department, 1940–1965;Vink, 1970). Logs of low-density wood (e.g.Cedrela, Carapa) were ‘worked’ overcataracts by hand and floated to the mill,while high-density timbers were assistedusing a punt or barge (Viera, 1980). In other
450 D.S. Hammond
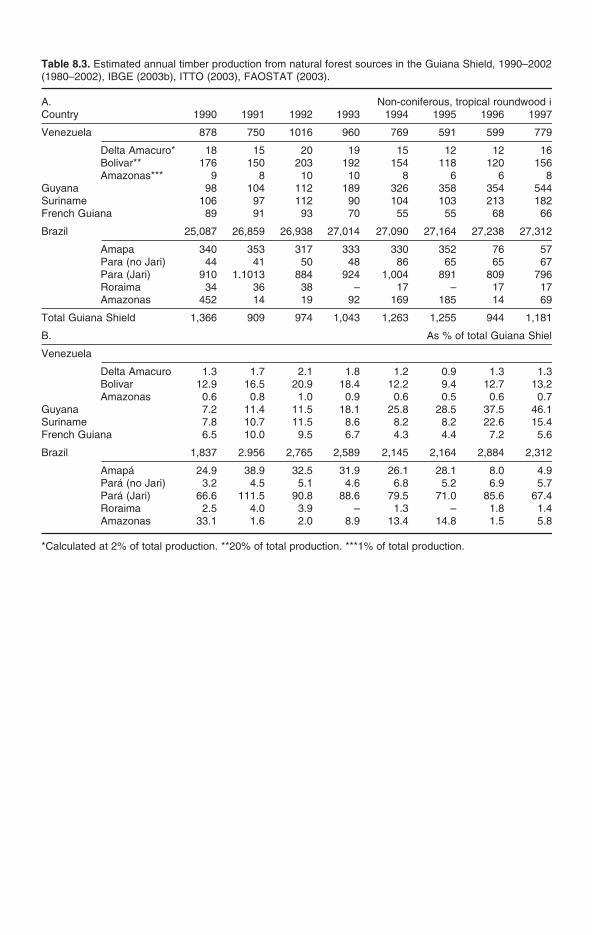
Table 8.3. Estimated annual timber production from natural forest sources in the Guiana Shield, 1990–2002(1980–2002), IBGE (2003b), ITTO (2003), FAOSTAT (2003).
A. Non-coniferous, tropical roundwood iCountry 1990 1991 1992 1993 1994 1995 1996 1997
Venezuela 878 750 1016 960 769 591 599 779
Delta Amacuro* 18 15 20 19 15 12 12 16Bolivar** 176 150 203 192 154 118 120 156Amazonas*** 9 8 10 10 8 6 6 8
Guyana 98 104 112 189 326 358 354 544Suriname 106 97 112 90 104 103 213 182French Guiana 89 91 93 70 55 55 68 66
Brazil 25,087 26,859 26,938 27,014 27,090 27,164 27,238 27,312
Amapa 340 353 317 333 330 352 76 57Para (no Jari) 44 41 50 48 86 65 65 67Para (Jari) 910 1.1013 884 924 1,004 891 809 796Roraima 34 36 38 – 17 – 17 17Amazonas 452 14 19 92 169 185 14 69
Total Guiana Shield 1,366 909 974 1,043 1,263 1,255 944 1,181
B. As % of total Guiana Shiel
Venezuela
Delta Amacuro 1.3 1.7 2.1 1.8 1.2 0.9 1.3 1.3Bolivar 12.9 16.5 20.9 18.4 12.2 9.4 12.7 13.2Amazonas 0.6 0.8 1.0 0.9 0.6 0.5 0.6 0.7
Guyana 7.2 11.4 11.5 18.1 25.8 28.5 37.5 46.1Suriname 7.8 10.7 11.5 8.6 8.2 8.2 22.6 15.4French Guiana 6.5 10.0 9.5 6.7 4.3 4.4 7.2 5.6
Brazil 1,837 2.956 2,765 2,589 2,145 2,164 2,884 2,312
Amapá 24.9 38.9 32.5 31.9 26.1 28.1 8.0 4.9Pará (no Jari) 3.2 4.5 5.1 4.6 6.8 5.2 6.9 5.7Pará (Jari) 66.6 111.5 90.8 88.6 79.5 71.0 85.6 67.4Roraima 2.5 4.0 3.9 – 1.3 – 1.8 1.4Amazonas 33.1 1.6 2.0 8.9 13.4 14.8 1.5 5.8
*Calculated at 2% of total production. **20% of total production. ***1% of total production.

instances, timber production above rapidsremains largely a local subsistence activity.Few roads had been developed to provideaccess to upland timber stocks and virtuallyall timber extracted during this period wastaken from an area bound by the course of
the major waterways. In Suriname, ditch-blasting was approached as a means ofaccessing valuable peeler log species(mainly Virola) growing in difficult swamplocations (Bubberman and Vink, 1966), butwith unexpected consequences.
452 D.S. Hammond
Table 8.4. Estimated area allocated for timber production in the Guiana Shield including privateplantations (Jari), national forest area allocated for sustainable use, long-term concessions andshort-term cutting leases. Amerindian and agricultural lands are not included. Sources: GuyanaForestry Commission (1980–2002), Vink (1970), G. Zondervan (personal communication), OfficeNational des Forêts (1997b), Rollet (1980), IBAMA, MARNR.
Country Area (km2) % of natural area in GS % of GS
Venezuela 103,348 22.8 4.5Guyana 55,565 25.8 2.4Suriname 13,700 8.8 0.6French Guiana 3,930 4.5 0.2Brazil 107,036 10.3 5.7Colombia – – –
Total 283,579 12.4
Orinoco
Amazon
Fig. 8.17. Cumulative distribution of official timber producing regions (solid black) across the GuianaShield by end of the 20th century. Only one large plantation (Jari, arrow) has been established in theregion. Levels of commercial stocking and use vary within allocated areas. GIS coverage sources: GFC,MARNR, WRI-GFW, IBAMA, LBB, Office National des Forêts (1997b), Iwokrama International Centre.

As timber industries benefited fromincreased (multilateral) governmental sup-port and favourable unit prices, new tech-nologies were introduced that increasedharvesting rates and milling capacities,spurring further demand for a larger com-mercial timber estate (Vink, 1970; Viera,1980). The introduction of tractors, open-bed trucks and eventually bulldozers andskidders increased hauling rates and capac-ities tremendously. Larger, more mar-ketable logs (e.g. square pilings) could behauled intact along roads built for timberextraction. The introduction of the chain-saw to industries in Suriname and Guyanain the late 1960s further transformed timberproduction methods as both felling andhaulage rates increased. Downstream pro-cessing facilities began to employ gangsaws and band-saw riggings, increasingmilling capacities and reducing machine-borne wastage associated with the tradi-tional use of circular saws. Installation ofplywood and particle board manufacturingfacilities, first in Suriname during the1950s, then in Guyana during the early1990s, opened up tremendous processingcapacities for low-density peeler speciesthat previously had contributed little toannual production (Vink, 1970; GuyanaForestry Commission, 1980–2002). Thepresence of large, relatively modern millfacilities spawned booms in timber extrac-tion and led to expansion of the area of for-est under consideration (e.g. Suriname:Sizer and Rice, 1995), or eventually allo-cated (e.g. Guyana) to timber production.Recent improvements in forest operationaltechnologies and methods (e.g. GPS, GIS,sonar distance measuring) now offer oppor-tunities to further increase production effi-ciencies through preharvest planning,better road alignment and residual standprotection measures that form part of thereduced-impact logging basket of selectivelogging techniques.
Cataracts, wood density, market prices andcosts of commercial extraction
The role of the river cataracts in checkingthe rapid penetration of timber production
into the interior cannot be overstated.Unlike extraction industries along theAmazon varzéa or selective mahoganyextraction from western Amazonia, the tim-ber industry across the Guiana Shield wasfaced with limited river navigability com-bined with a confounding, but ultimatelyprofitable, abundance of extremely densetropical timber species.
The density of these timbers spurreddemand during the early 20th century, inpart based on a reputation established dur-ing the 18th and 19th centuries (Bancroft,1769; Schomburgk, 1840; Walker, 1878;McTurk, 1882; Rodway, 1912) and, later,through research assessments of their phys-ical and structural properties (e.g. Findley,1938; Horn, 1948; Edmondson, 1949). Thefew alternative materials, mainly temperatehardwoods, had been depleted to such anextent that they could no longer satisfygrowing industrial demand (e.g. oak), didnot exist at the time (e.g. composites) orwere not competitively priced against theunusually high volumes of heavy hard-woods found in the forests of the GuianaShield (e.g. steel).
A series of inventories and assessmentswere undertaken to establish and promotethe commercial wood production potentialof the shield region during the first half ofthe 20th century by highlighting the abun-dance of dense tropical timbers (Benoist,1931; Williams, 1939; Ducke, 1943;Hughes, 1946; Corothie, 1948; Detienne andChanson, 1996).
Large-scale, commercial timber pro-duction in the Guiana Shield was ulti-mately formed around the wholesaleextraction of these heavy hardwoods aspost-war conditions, combined withfavourable government subsidies and largeurban-industrial developments (CiudadBolivar) led to the final depletion of mostmajor timber species from the forests of thenear interior. Road construction offered theonly feasible solution to the river navigabil-ity problem, but would create a seriouschallenge to profitability.
As early as the 1920s, foresters in(British) Guiana recognized the relationshipbetween the uncommonly high wood den-
Socio-economic Aspects of Forest Use 453

sity of commercial species in the region andthe rising costs of transporting this overlong distances without the use of river cur-rents (Hohenkerk, 1922). Kiln drying wasprescribed as a means of minimizing thehigher cost of transporting dense timberproducts by reducing water content prior totransport and reducing incidence of warp-ing and staining. Prices for structural tim-bers, unlike those used in joinery such astrue mahogany, were more exposed to fluc-tuating market prices as competing materi-als were more readily adopted and highvariable costs attached to poor operationaldecision-making quickly eroded profit mar-gins. Ultimately, the commercial extractionof the region’s heavy hardwoods above thefalls in Suriname, French Guiana, NorthPará and Roraima had yet to take place bythe end of the 20th century. Transport costsassociated with accessing commercialforests of the shield’s interior continue toquell investment and (unsubsidized) profitin heavy hardwood extraction at modernmarket prices and only government-financed road-building and other incentivesmaintain industrial expansion. Growingconcerns over the negative environmentaland socio-economic impacts of large-scale,commercial forestry operations in theregion (Colchester, 1997b; Miranda et al.,1998) and the wider tropics (e.g. Fimbel etal., 2001) has also had a significant effect onboth short-term costs of extraction anddemand in traditional export markets, achallenge that is reviewed in Chapter 9 ofthis book.
Production and consumption of energy
The production and consumption of energyplay a fundamental role in the way andextent forest lands are used worldwide andhow they contribute to national economicgrowth. Hydrocarbon extraction facilitiescreate new road networks and require local-ized production facilities that are potentialpoint sources of environmental contamina-tion. The production of hydrocarbons alsoplays an important role in offsetting thecosts and exposure of importing economies
to the vagaries of the international energymarkets and provides a measure of nationalsecurity. Even without refinement capabili-ties, hydrocarbon production can, if ration-ally invested, provide a foundation foreconomic expansion and diversification,alleviate pressure to liquidate short-termforest land values, and drive social devel-opment through better education, healthcare and law enforcement. The transforma-tion of value derived from liquidation ofhydrocarbon reserves into broader socio-economic benefits has historically experi-enced substantive leakages or dominantcapture by a very small group.
Installation and development of non-thermal, electricity-generating sources canalso create a stable national energy econ-omy, but with different costs and benefits.Hydroelectric generation offers an indige-nous source of power independent of com-modity markets, but also entirelydependent on regional climate patterns.Large areas of prime forest land are sub-merged and the cost to local residents ofaccruing economic benefit for distanteconomies remains a prominent challengein achieving sustainable development intropical lowland areas. Non-traditionalrenewables, such as wind, tidal and solarpower, hardly register on the world energymap and tropical forest regions globallyshow virtually no installed capacity (USEnergy Information Administration, 2003),despite clear opportunities to profitablygenerate electricity using these sources.
Fossil hydrocarbon reserves
The Guiana Shield sits as a geologicalisland surrounded by rivers of oil (Fig.8.18). To the north, the largest exploitableoil fields in the neotropics dominate thesedimentary basins from Lake Maracaibo toTrinidad and Tobago. South and west of theshield, oil fields run along the upperAmazon Downwarp and throughout theSub-Andean Foredeep. The relationshipbetween continental-scale geomorphic fea-tures and the proven or prospective loca-tion of fossil hydrocarbon depositsprecludes any significant finds within the
454 D.S. Hammond

interior of the Guiana Shield. The onlyprospective line of exploration follows thesediment-filled fault of the Takutu Grabenand the along-shore and offshore extensionof the Berbice Basin (the Tamboredjo field)(Fig. 8.18). Several drilling attempts tolocate commercial deposits in theRupununi area of the Takutu Graben havemet with only marginal success (Gibbs andBarron, 1993). Berrangé (1977) suggests thatthe shallowing of the graben westwardwould make any hydrocarbon find of mar-ginal commercial prospect. While the use ofmodern exploration techniques may alterthis view, the poor performance of previousdrilling efforts and lack of any furtherexploration in the area since the early 1990swould seem to support this assessment.
Efforts to procure commercial-scaleproduction offshore have met with substan-tially greater success, most significantlyalong the south rim of Trinidad and sea-ward of the mouth of the Courantyne Riverin the Guyana–Suriname Basin (Fig. 8.18).Both the Guyana–Suriname and TacutuBasins rank as two of the smallest provenpetroleum reserves assessed in the USGS’sWorld Energy Survey, with less than 100million and 10 million barrels of estimatedreserves, respectively. By comparison, theeastern Venezuela Basin immediately northof the shield region and embracing the east-ern Venezuelan llanos and Trinidad andTobago is ranked 13th globally, with areserve estimate of 52.6 billion barrels,albeit based in a large part on heavy-gradeoils (US Energy Information Adminis-tration, 2003).
However, the prospects for future oilproduction from the Guyana–SurinameBasin are good. An analysis of the basin aspart of the USGS World PetroleumAssessment ascribes a 95% probability ofan actual reserve measuring at least 2.793billion barrels of oil (Schenk et al., 2000),one of the largest undiscovered reserve esti-mates in South America.
Petroleum production
The potential for oil production in theCretaceous sedimentaries off the
Guyana–Suriname coast was suspectedsince the 1960s (Lawrence and Coster,1965), but physical exploration didn’t beginuntil the mid-1970s, when several multi-national oil companies began to drill wild-cat wells and conduct geophysical andseismic assessments (Theofilos, 1975).Exploratory work and wildcatting contin-ued until production began from a shallowheavy-oil deposit near Groningen on theSuriname coast in 1984, producing around1000 barrels per day (Velasco andEnsminger, 1984). By 1990, activation ofthe Tambaredjo oil field raised this produc-tion rate to over 4000 barrels (Table 8.5). By2002, production reached 14,000 barrelsper day and further exploration was under-taken to expand facilities in both Guyaneseand Surinamese territorial waters. The ini-tiation of oil production from Guyana isexpected before 2010. Estimated undiscov-ered reserves off the French Guiana coast areof marginal prospect (Schenk et al., 2000). Inaddition to low gas and oil production, thethree Guianas had little or no refinementcapacity during the later 20th century andimported all of their gasoline and other prod-ucts. Venezuela, Brazil, Trinidad andTobago and Colombia all had significant andgrowing domestic refineries by 2000.
Hydroelectricity
Without any significant petroleum reservesin the shield region, but many cataracts andample rainfall, water power dominates theregional energy economies. Hydroelectricpower in the region is generated throughfive main installations: (i) Guri dam (andsmaller Macagua complex), south of CiudadBolivar on the Caroni River in Bolivar state,Venezuela; (ii) Afobakka Dam south ofParamaribo on the Suriname River inSuriname; (iii) Petit Saut, southwest of theKourou Space Centre on the SinnamaryRiver in French Guiana; (iv) Alto Jatapu, inRoraima state; and (v) Balbina dam on theUatumã River in northeast Amazonas state.There are two smaller Brazilian hydroelec-tric facilities, on the Araguari River inAmapá (Couracy Nunes) and on the PitingaRiver in Amazonas (Pitinga). Several other
Socio-economic Aspects of Forest Use 455

456 D.S. Hammond
Fig. 8.18. (A) Ring of oil and natural gas fields (filled circles) circumscribing the Guiana Shield. Stippledarea demarcates Phanerozoic sediment cover in the shield area based on Gibbs and Barron (1993). Filledgrey areas >1100 m asl. Acronyms represent basin nomenclature used in Fig. 8.18B. Source: Schenk et al.(1999). (B) Ranked hydrocarbon reserves of 406 basins assessed in USGS World Energy Assessment Team(2000) with position of main basins surrounding and intersecting Guiana Shield identified. Assessed basinsaccount for >99% of known global deposits.
(A)
(B)
TB

small plants have been developed in thepast to provide power to mining operationsand small towns (e.g. Moco-Moco complexproviding electricity to Lethem, Rupununi,south Guyana).
The Guri (Raul Leoni) facility inVenezuelan Guayana dominates bothhydroelectric generation and installedcapacity from the Guiana Shield region(Table 8.5). French Guiana, and Amapá andAmazonas states in Brazil also derive a sig-nificant fraction of their generating capacityfrom hydroelectric facilities. Guyana, NorthPará and Roraima currently have little or nosignificant generating capacity. Furtherfacilities are under construction or plannedin Brazil along the Jari River (SantoAntonio), Oiapoque (Salto Cafesoca)(ANEEL, 2003) and in Venezuela down-stream of existing facilities along the lowerCaroni River (US Energy InformationAdministration, 2003) and along theKuribrong River in the PakaraimaMountains of western Guyana.
Renewable sources
Hydroelectric generation from tidal energyis another approach that could prospec-tively be employed at small scales along thecoast of Guyana, Suriname, French Guianaand Amapá. In fact, tidal energy was har-nessed by small-scale facilities in
Suriname, French Guiana and the Amazonestuary, possibly as early as the 1700s, andhas the potential to contribute to local gen-eration (Anderson et al., 1999), particularlywhere tidal gates are already employed toprotect reclaimed coastal lowlands duringpeak daily and seasonal stages. Wind gener-ation is also a traditional technology thatcould be employed at commercial scalesalong many parts of the shield coastline(Persaud et al., 1999). Solar cell units arecurrently employed throughout many partsof the interior that are not connected tomore traditional thermal or hydroelectricsources as part of the national transmissiongrid.
Seasonal and interannual variation in sourceenergies
A steady, uninterrupted supply of fuels andelectricity brings tremendous socio-eco-nomic benefit, but the heavy reliance ofmany parts of the shield region on a singleenergy source continues to expose regionaleconomies to growth-dampening fluctua-tions and foreign debt accrual.
The list of factors potentially influenc-ing world oil market prices is wide-rangingand expanding. Guyana and French Guianaare the largest per capita importers of petro-leum products in the shield region and thisreliance is increasing (Fig. 8.19). In con-
Socio-economic Aspects of Forest Use 457
Table 8.5. Installed electricity generation capacity (kW) in the Guiana Shield by 2003. Thermal electricis based on hydrocarbon (mainly diesel) use only. Power from geothermal, solar, wind or nuclearsources was negligible. Hydroelectric power in French Guiana and Amapá includes non-public genera-tional capacity, mainly for Kourou and Jari facilities, respectively. Per capita generation in watts (W)based on population presented in Table 8.6. Sources: ANEEL (2003), US Energy InformationAdministration (2003).
Country/State Hydroelectric Thermal electric Total % hydro W per capita
Venezuela Guayana 15,461.0 – 15,461.0 100.0 10.008Guyana <0.01 0.8 0.8 <0.01 0.001Suriname 0.2 0.2 0.4 48.6 0.001French Guiana 116.0 0.5 116.5 99.6 0.741Amapá 68.0 138.7 206.7 32.9North Pará – 22.7 22.7 –North Amazonas 250.0 66.0 316.0 79.1Roraima 5.0 189.7 194.7 2.6 0.187*
15,900.2 418.5 16,318.7 97.4 4.157
*Based on total Brazilian population in Guiana portions of states.

trast, Suriname’s new petroleum produc-tion industry, combined with the hydro-electric facility at Afobakka, has steadilydampened its per capita requirement foroverseas oil products, making the country anet exporter for the first time briefly in1999. Suriname’s transition mimics thatachieved, albeit at a much greater scale, byVenezuela in its installation of hydroelec-tric facilities along the Caroni River anddevelopment of extensive oil fields that hasmade it the largest exporter of energy inSouth America. Currently it exports excesshydroelectric capacity to Colombia andRoraima, Brazil through a growing nationaltransmission grid and has consistentlyexported between 30 and 50 barrels of oilper person each year since 1980 (US EnergyInformation Administration, 2003).
Installation of oil production facilitiesin Suriname and Guyana could bode wellfor their economies in the future as theglobal peak in hydrocarbon production ispassed (between 2010 and 2020) and theworld petroleum economy begins itsdescent towards commercial extinction.
Bringing their reserves on-line during thislate post-peak phase should see consider-ably higher world market oil prices andgreater revenues from the relativelysmall proven offshore reserves of theGuyana–Suriname Basin and reviseviews on how best to achieve benefit fromtheir relatively large per capita forest cover(see Chapter 1).
Brazil generates a massive 80%+ of itsnational electricity requirement throughhydroelectric facilities, mainly locatedsouth of the Amazon River, while maintain-ing a relatively stable per capita reliance onoverseas oil imports (Table 8.4). The largehydroelectric capacity assists in bufferingthe Brazilian economy from the vagaries ofthe world oil market, but exposes it to rain-fall variations that commonly affect theregion as a consequence of ENSO. Facilitiesplanned or located along rivers draining theGuiana Shield and northeastern Brazil areparticularly susceptible to large-scale sea-sonal failure in rainfall (see ‘Climate’,Chapter 2). Countering this interannual fail-ure in generating capacity is the fact that
458 D.S. Hammond
Fig. 8.19. Variation in the amount of oil imported in each of the net importing countries of the GuianaShield region. Calculated as difference between annual hydrocarbon consumption and net productiondivided by population. Brazilian imports are for entire country. Data source: US Energy InformationAuthority (2003).
Per
cap
ita p
etro
leum
impo
rts
(bar
rels
per
per
son
pa)
Suriname
Guyana
French Guiana
Brazil
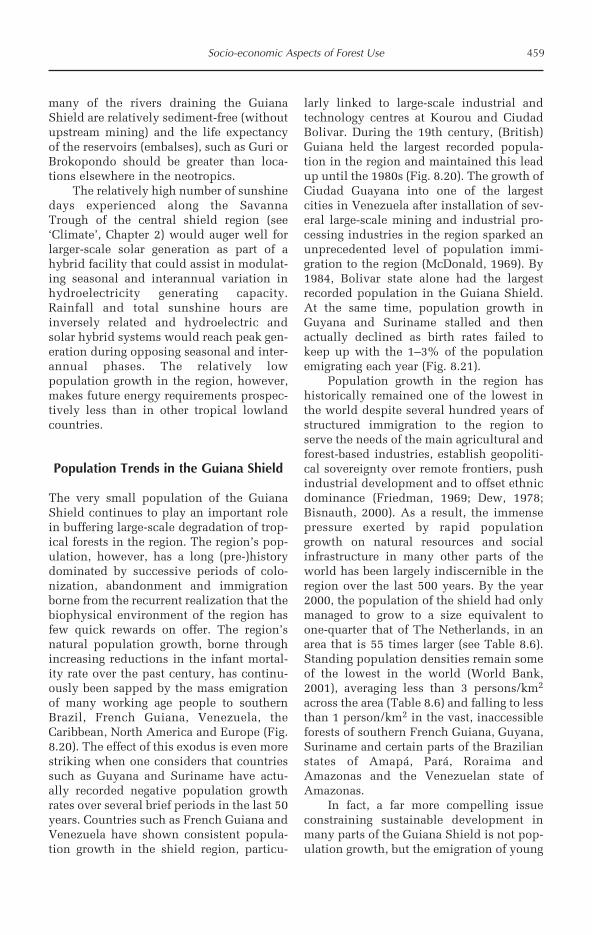
many of the rivers draining the GuianaShield are relatively sediment-free (withoutupstream mining) and the life expectancyof the reservoirs (embalses), such as Guri orBrokopondo should be greater than loca-tions elsewhere in the neotropics.
The relatively high number of sunshinedays experienced along the SavannaTrough of the central shield region (see‘Climate’, Chapter 2) would auger well forlarger-scale solar generation as part of ahybrid facility that could assist in modulat-ing seasonal and interannual variation inhydroelectricity generating capacity.Rainfall and total sunshine hours areinversely related and hydroelectric andsolar hybrid systems would reach peak gen-eration during opposing seasonal and inter-annual phases. The relatively lowpopulation growth in the region, however,makes future energy requirements prospec-tively less than in other tropical lowlandcountries.
Population Trends in the Guiana Shield
The very small population of the GuianaShield continues to play an important rolein buffering large-scale degradation of trop-ical forests in the region. The region’s pop-ulation, however, has a long (pre-)historydominated by successive periods of colo-nization, abandonment and immigrationborne from the recurrent realization that thebiophysical environment of the region hasfew quick rewards on offer. The region’snatural population growth, borne throughincreasing reductions in the infant mortal-ity rate over the past century, has continu-ously been sapped by the mass emigrationof many working age people to southernBrazil, French Guiana, Venezuela, theCaribbean, North America and Europe (Fig.8.20). The effect of this exodus is even morestriking when one considers that countriessuch as Guyana and Suriname have actu-ally recorded negative population growthrates over several brief periods in the last 50years. Countries such as French Guiana andVenezuela have shown consistent popula-tion growth in the shield region, particu-
larly linked to large-scale industrial andtechnology centres at Kourou and CiudadBolivar. During the 19th century, (British)Guiana held the largest recorded popula-tion in the region and maintained this leadup until the 1980s (Fig. 8.20). The growth ofCiudad Guayana into one of the largestcities in Venezuela after installation of sev-eral large-scale mining and industrial pro-cessing industries in the region sparked anunprecedented level of population immi-gration to the region (McDonald, 1969). By1984, Bolivar state alone had the largestrecorded population in the Guiana Shield.At the same time, population growth inGuyana and Suriname stalled and thenactually declined as birth rates failed tokeep up with the 1–3% of the populationemigrating each year (Fig. 8.21).
Population growth in the region hashistorically remained one of the lowest inthe world despite several hundred years ofstructured immigration to the region toserve the needs of the main agricultural andforest-based industries, establish geopoliti-cal sovereignty over remote frontiers, pushindustrial development and to offset ethnicdominance (Friedman, 1969; Dew, 1978;Bisnauth, 2000). As a result, the immensepressure exerted by rapid populationgrowth on natural resources and socialinfrastructure in many other parts of theworld has been largely indiscernible in theregion over the last 500 years. By the year2000, the population of the shield had onlymanaged to grow to a size equivalent toone-quarter that of The Netherlands, in anarea that is 55 times larger (see Table 8.6).Standing population densities remain someof the lowest in the world (World Bank,2001), averaging less than 3 persons/km2
across the area (Table 8.6) and falling to lessthan 1 person/km2 in the vast, inaccessibleforests of southern French Guiana, Guyana,Suriname and certain parts of the Brazilianstates of Amapá, Pará, Roraima andAmazonas and the Venezuelan state ofAmazonas.
In fact, a far more compelling issueconstraining sustainable development inmany parts of the Guiana Shield is not pop-ulation growth, but the emigration of young
Socio-economic Aspects of Forest Use 459
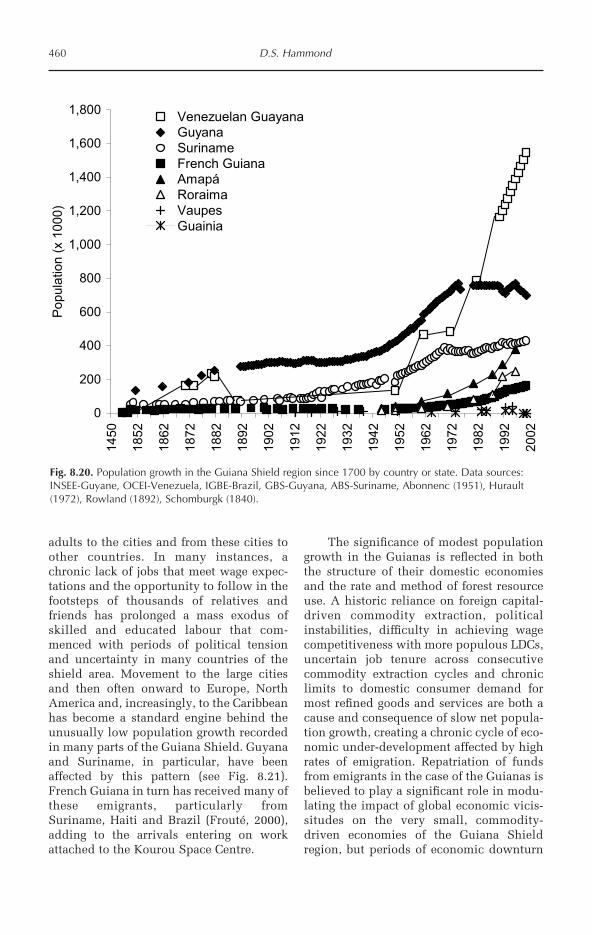
adults to the cities and from these cities toother countries. In many instances, achronic lack of jobs that meet wage expec-tations and the opportunity to follow in thefootsteps of thousands of relatives andfriends has prolonged a mass exodus ofskilled and educated labour that com-menced with periods of political tensionand uncertainty in many countries of theshield area. Movement to the large citiesand then often onward to Europe, NorthAmerica and, increasingly, to the Caribbeanhas become a standard engine behind theunusually low population growth recordedin many parts of the Guiana Shield. Guyanaand Suriname, in particular, have beenaffected by this pattern (see Fig. 8.21).French Guiana in turn has received many ofthese emigrants, particularly fromSuriname, Haiti and Brazil (Frouté, 2000),adding to the arrivals entering on workattached to the Kourou Space Centre.
The significance of modest populationgrowth in the Guianas is reflected in boththe structure of their domestic economiesand the rate and method of forest resourceuse. A historic reliance on foreign capital-driven commodity extraction, politicalinstabilities, difficulty in achieving wagecompetitiveness with more populous LDCs,uncertain job tenure across consecutivecommodity extraction cycles and chroniclimits to domestic consumer demand formost refined goods and services are both acause and consequence of slow net popula-tion growth, creating a chronic cycle of eco-nomic under-development affected by highrates of emigration. Repatriation of fundsfrom emigrants in the case of the Guianas isbelieved to play a significant role in modu-lating the impact of global economic vicis-situdes on the very small, commodity-driven economies of the Guiana Shieldregion, but periods of economic downturn
460 D.S. Hammond
0
200
400
600
800
1,000
1,200
1,400
1,600
1,8001
450
18
52
18
62
18
72
18
82
18
92
19
02
19
12
19
22
19
32
19
42
19
52
19
62
19
72
19
82
19
92
20
02
Po
pu
latio
n (
x 1
000
)
Venezuelan GuayanaGuyanaSurinameFrench GuianaAmapáRoraimaVaupesGuainia
Fig. 8.20. Population growth in the Guiana Shield region since 1700 by country or state. Data sources:INSEE-Guyane, OCEI-Venezuela, IGBE-Brazil, GBS-Guyana, ABS-Suriname, Abonnenc (1951), Hurault(1972), Rowland (1892), Schomburgk (1840).

still drive many of the unemployed toengage in forest extraction activities (e.g.Heemskerk, 2001). Only VenezuelanGuayana has been able to overcome theselimitations, principally through liquidationof forestland resources across eastern
Bolivar state and downstream refinementinto energy, metals and other durable goodsfor both domestic and overseas use. Themodern development of the Guiana Shieldforestlands, however, has not been pursuedwithout significant social and environmen-
Socio-economic Aspects of Forest Use 461
4
3
2
1
0
–1
–2
–3
–4
Mig
ratio
n (%
pop
ulat
ion
over
qui
nque
nniu
m)
1950
–55
1955
–60
1960
–65
1965
–70
1970
–75
1975
–80
1980
–85
1985
–90
1990
–95
1995
–200
0
Fig. 8.21. Net migration rate as a percentage of population over quinquennium in Guyana (diagonallyhatched columns), Suriname (empty), and French Guiana (solid). Negative and positivevalues reflect net emigration and immigration, respectively. Data source: UN-CEPAL (2003).
Table 8.6. Population, land area and population density of the Guiana Shield. Values are based oncensus numbers for administrative districts falling within the shield area. Data sources: CIA World FactBook (2000), OCEI (2000), IBGE (2003a), Guyana Bureau of Statistics (2000), Algemeen Bureau voorde Statistiek (2000), Frouté (2000).
PopulationPopulation Land area Density As % contribution to
Country (no. persons)* (km2) (no. km2) total Guiana Shield As % of country’s
Brazil 1,041,595 1,204,279 0.9 26.5 0.6Colombia 53,650 170,500 0.3 1.4 0.1French Guiana 157,213 88,150 1.8 4.0 100.0Guyana 697,286 214,980 3.2 17.8 100.0Suriname 431,303 156,000 2.8 11.0 100.0Venezuela 1,544,915 453,950 3.4 39.4 6.4
Guiana Shield 3,925,962 2,287,859 1.7 100.0
*Year 2000.

tal costs (Sizer and Rice, 1995; Miranda etal., 1998).
Amerindian populations and titled lands
The fact that a disproportionate bulk of thesocial costs associated with forestland usein the Guiana Shield has been borne by theoriginal inhabitants is irrefutable. From theearliest waves of disease, enslavement, debtservitude and forced emigration, pre-Columbian populations along the shieldrim declined from reasonable estimates inthe millions to a sparse and scattered popu-lation measured in thousands. Estimates ofAmerindian populations in French Guianaduring the 17th century consistentlyexceeded 30,000, but by 1750 had declinedto less than 3000 due to waves of epidemicdisease exacerbated by concentration ofpopulations in missions (Hurault, 1972;Zonzon and Prost, 1996). A nearly identicalchronology of decline along the rim andsubsequent flight to the remote interior ofthe shield region has been conveyed forVenezuela Guayana (Whitehead, 1988) andthe Rio Negro basin (Hemming, 1978a;Chernela, 1998). In most instances, thenumber of distinct sociolinguistic culturesdisappearing over the first 200 years of con-tact with Europeans is simply impossible toestimate, although the demise of manygroups (e.g. the Norak along theApprouague in French Guiana) is clearlydocumented (Hurault, 1972).
Nineteenth-century indigenous peoplecontinued to struggle under the sweepingcultural, economic and epidemiologicalchanges advanced by continued Europeancolonization. Little population growth wasachieved over most of the 19th and early20th centuries and many groups (e.g.Taruma, Atorais), and their unique culturalcontributions, disappeared altogether dur-ing this period. Schomburgk (1840) esti-mates that a mere 7000 Amerindiansassociated with 10 groups lived in the 19thcentury boundaries of (the then) BritishGuiana. This figure changed little up untilthe end of the 1800s, although arguablybased on relatively little effort in account-
ing for people living in the far interior,where many had fled from the RioNegro–Branco region and the coastlands ofthe Guianas. The plight of indigenous peo-ples remained subject to disparate colonialperspectives on their role in the rapidlychanging society, represented by commentsmade by Schomburgk (1840):
History informs us that the discoverers ofSouth America found the continent denselypeopled by Indians. What then has becomeof the millions of aborigines who onceinhabited these regions? Driven from theirlands, now in possession of the Europeansand their descendants, they have wanderedfrom their ancient homes, strangers in theirown country; and diseases and vices intro-duced by the settlers, and feuds amongthemselves, have all but annihilated therightful owners of the soil. It is a melan-choly fact, but too well founded, that wher-ever Europeans have settled, theextermination of the native tribes has suc-ceeded their arrival. (Schomburgk, 1840,pp. 48–49)
and almost unbelievably later by Rowland (1892):
The Aborigines number on the schedules7,463 or 3,917 male and 3,546 females. Tothe total population this is 4 per cent. TheRegistrar-General gives 10,000 more of thisrace as estimated to be wandering about theinterior of the colony. The number on theschedule shows a decrease on the figures of1881, when 7,762 were returned. This raceis of little or no social value and their earlyextinction must be looked upon asinevitable in spite of the sentimental regretof Missionaries. At the same time it isunnecessary to hasten the process in anyway, for in this matter, nature, as ever, ismuch more gentle than man. (Rowland,1892, pp. 55–56)
While commentaries at the time clearly var-ied between sincere empathetic and out-right racist perspectives on the Amerindiancondition, both seemed agreed on theinevitable loss of Amerindian society fromBritish Guiana. By the 1930s, however,many communities had begun to expandand Amerindian societies across much ofthe shield region entered a period of sus-
462 D.S. Hammond

tained growth that continues into the 21stcentury. By 1960, estimates of theAmerindian population in British Guianahad increased to nearly 23,000 (Anon.,1960), although in part this also probablyreflects the use of more accurate assessmenttechniques. At the end of the 20th century,nearly 53,000 Amerindians contributed tomodern Guyanese society.
Nearly a quarter of a millionAmerindians are estimated to have livedwithin various regions of the Guiana Shieldby the end of the millennium,18 largely inthe Guayana Highlands, Gran Sabana,Rupununi and Sipaliwini savannas and therivers draining the forested TumucumaqueUplands. Belonging to at least six major lin-guistic groups, Amerindian peoples inhabitvirtually all parts of the shield region, butthe upper Corentyne and lower Amapá, RioNegro and Amazon regions are notable by
their relatively sparse coverage (Fig. 8.22).In part, the modern distribution is a reflec-tion of long-standing historical migrationtowards the central highlands of the shield,but also shaped by the distribution of(nearly) exclusive legal title to variouslysized fragments of their former homelands(Fig. 8.23). Only Brazil and Guyana hadprovided some form of official land title toAmerindian communities by the close ofthe 20th century (Fig. 8.23), althoughinfringements upon these lands, overlap-ping allocation of commercial land-usedriven by disparate ministerial prioritiesand legal exclusions to land use rightsremain commonplace in many areas.Location of Amerindian communities inareas allocated for commercial timberand/or mining have been particular pointsof conflict in Guyana (e.g. Forte, 1996;Colchester, 1997b) and Brazil (e.g. Tierney,
Socio-economic Aspects of Forest Use 463
Fig. 8.22. Generalized distribution of different Amerindian peoples according to linguistic family (A:Arawak (Lokono), C: Creole (Maroon), K: Karib (Kariña), T: Tupi, Tu: Tukano, Y: Yanomami, S: Saliva, W:Warrau). Adapted from Queixalos and Renault-Lescure (2000).
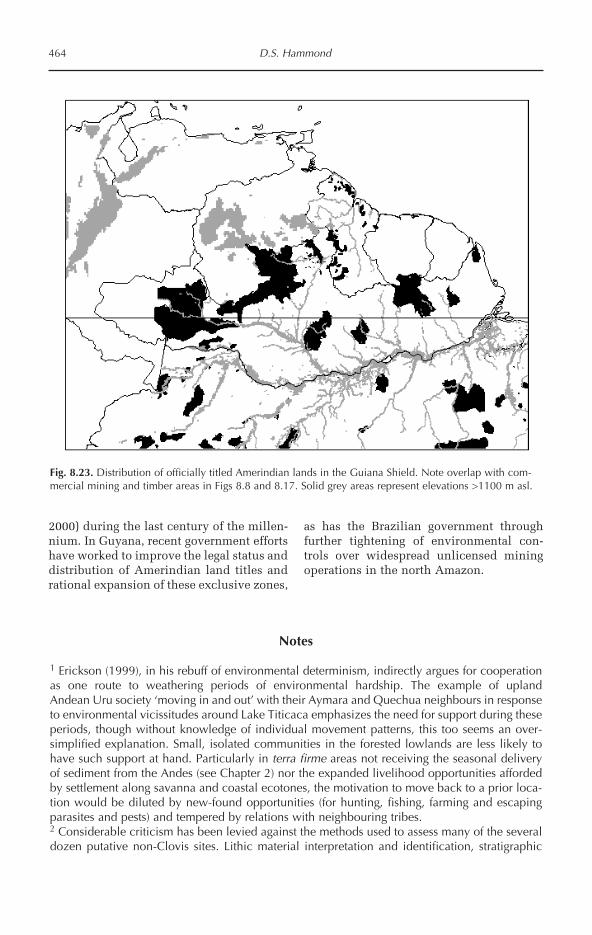
2000) during the last century of the millen-nium. In Guyana, recent government effortshave worked to improve the legal status anddistribution of Amerindian land titles andrational expansion of these exclusive zones,
as has the Brazilian government throughfurther tightening of environmental con-trols over widespread unlicensed miningoperations in the north Amazon.
464 D.S. Hammond
Fig. 8.23. Distribution of officially titled Amerindian lands in the Guiana Shield. Note overlap with com-mercial mining and timber areas in Figs 8.8 and 8.17. Solid grey areas represent elevations >1100 m asl.
Notes
1 Erickson (1999), in his rebuff of environmental determinism, indirectly argues for cooperationas one route to weathering periods of environmental hardship. The example of uplandAndean Uru society ‘moving in and out’ with their Aymara and Quechua neighbours in responseto environmental vicissitudes around Lake Titicaca emphasizes the need for support during theseperiods, though without knowledge of individual movement patterns, this too seems an over-simplified explanation. Small, isolated communities in the forested lowlands are less likely tohave such support at hand. Particularly in terra firme areas not receiving the seasonal deliveryof sediment from the Andes (see Chapter 2) nor the expanded livelihood opportunities affordedby settlement along savanna and coastal ecotones, the motivation to move back to a prior loca-tion would be diluted by new-found opportunities (for hunting, fishing, farming and escapingparasites and pests) and tempered by relations with neighbouring tribes.2 Considerable criticism has been levied against the methods used to assess many of the severaldozen putative non-Clovis sites. Lithic material interpretation and identification, stratigraphic

assignment and radiocarbon dating methods and analyses rank high among the criticisms(Meltzer, 1995; Haynes, 1997; Reanier, 1997; Barse, 1997; Dillehay, 2000; Lavallée, 2000).Nonetheless, physical dating of several of the earliest sites appears to have measured up to thesecriticisms (e.g. Monte Verde in Chile: Dillehay (1997); Quabrada Jaguay, south coast of Peru:Sandweiss et al. (1998)). None of these are found in the lowland forests of Amazonia and pointto a more specific early peopling of the Pacific coast and Western Cordillera of South Americathat is consistent with a coastal route to early southward migration.3 All before present (BP) dates mentioned in the text are uncalibrated (i.e. 14C dates) unless indi-cated otherwise (calibrated).4 The very early date (>30 ka BP) of charcoal associated with the Pedra Pintura site in easternBrazil remains highly isolated, particularly when considering the Clovis/pre-ceramic radiocarbondates determined for associated site materials that are without doubt indicative of a human pres-ence, such as rock painting pigment (12 ka to 6 ka BP), teeth (12.21±0.04 14C ka BP: Peyre et al.(2000)) and skeletal remains (9.67±0.14 14C ka BP: Peyre (1993)). This alone does not refute thepossibility that people inhabited South America before (the end of) the LGM, but additional siteswith similar dates would be needed to support the notion. Even presupposing the link betweencharcoal and human site use is correct, other concurrent site ages would be needed to indicatea colonization process that was more than an isolated waif dispersal event, perhaps along ENSO-enhanced equatorial currents, that failed to lead to widespread population growth.5 It is important to note that all ages are inferred by radiocarbon dating of material stratigraphi-cally associated with the points. This approach to dating lithic artefacts, while commonplace,cannot be considered unequivocal proof of age and rarely receive widespread concurrence(Meltzer et al., 1994; Barse, 1997; Haynes, 1997; Dillehay, 2000) due to uncertainty concerningstratigraphic interpretation and the role of human vs. natural depositional processes.6 Perry (2002) analysed starch grains adhered to ceramic griddle fragments found at Pozo AzulNorte I, an archaeological site near Puerto Ayacucho on the Orinoco where some of the earliestsigns of human occupation have been assigned (Barse, 1990). Her results indicate ceramic grid-dles were used to process a wide variety of starchy flours, including those made from palms,arrowroot, maize and manioc.7 El Dorado is used today to generally describe a land of great untapped wealth, prospect orpotential. The real El Dorado, however, had arguably already been discovered by the time thatCortez, Pizarro and de Quesada established Spain’s colonial grip on the New World by dispos-sessing the Aztec (1521), Inca (1530) and Chibcha (1533) empires of the gold and silver they hadaccrued. It is not surprising that the flame of anticipation surrounding the location of another ElDorado in the Guiana Shield was fuelled by stories of a supreme ruler, a city and a lake. Previoussuccesses of the Spanish conquistadores in Mexico, Peru and Colombia included a ruler(Moctezuma, Atahualpa and Zipa), a city (Tenochtitlan, Cuzco, Bogota), and a nearby lake(Texcoco, Titicaca, Guatavita). The existence of the city Manoa, called Meta by the Spanish, onthe shores of a Lake Parima (or Parime), and ruled by an Amerindian emperor that dusted hisbody in gold each day, had considerable inspiration.8 It has been commonly suggested that to the native American perpetuating tales of wealth to befound just over the next ridge, river or mountain was a means of ensuring that the unwelcomeattentions and demands of the doradistas did not stay long in their villages (Whitehead, 1997).9 The root of the word Essequibo has been suggested by many 19th-century authors as the nameof one of Cristobal Columbus’ lieutenants, Juan de Esquivel (=Esquibel=Essequibel=Essequibo)(Schomburgk, 1840; Dalton, 1855). Kirke (1898), Rodway (1911) and more recently, Benjamin(1982) suggest, however, that the name in fact is derived from an Arawak (Lokono) word. Theetymological roots of many names of prominent physical and biological features of the GuianaShield are equally difficult to identify and may never be resolved (e.g. greenheart).10 An interesting, although undoubtedly dramatized, account of the Spanish efforts to control theOrinoco and Trinidad from 1592 to 1813 is given by Naipaul (1969).11 A reduccion, or compound, was a Capuchin mission where Caribs were forcibly resettled
Socio-economic Aspects of Forest Use 465

through the use of the military. In this way, the missions could maintain central control over thewidely scattered Amerindians.12 Bulletwood trees do not continuously produce balata latex. The latex is stored in elongatedcells wedged between the corky and vascular cambia that run parallel to the main trunk axis.When cut, the latex flows downwards from that portion of the cell chamber above the cut. Thesesections empty through the cut before coagulated latex closes the opening but do not immedi-ately refill with latex. Studies conducted during the peak balata production period in the early20th century indicate that these areas of bark would require 10–15 years before they were againable to produced latex in commercial quantities (Hohenkerk, 1919; Gonggryp, 1923).13 Basically, predicting the future gold unit price at time t and being paid (or paying) the differ-ence between predicted and actual price at t. In this instance, the producer is selling the gold atthe futures price, which was predicted higher than actual.14 Data source: Omai Gold Mines Limited (2000) and Bank of Guyana (2000). Gross revenuesat Omai estimated based on annual average world gold price multiplied by total annual pro-duction (futures dealings may alter this relationship as would held reserves). Government shareof this gross revenue based on value of 5% royalties, income taxes, duty and consumption taxes,and payments made to government corporations and departments from 1991 to 1999.15 In Trinidad and Tobago, where timber resources were scarce, bleeding of bulletwood trees fortheir balata latex was prohibited entirely as a consequence of its effects on tree survivorship(Gonggryp, 1923).16 Estimates of tree mortality associated with latex bleeding are based on the following:
Guyana Suriname Venezuela French Guiana
Minimum impact scenarioMortality, % (M) 4 8 90 8Latex yield, kg (Y) 1.4 2.3 6.4 2.3
Maximum impact scenarioMortality, % 20 50 100 50Latex yield, kg 0.9 1.6 2.3 1.6
Source: mortality – Davis 1933; yield – Gonggryp 1923, Brett 1917, Hohenkerk 1919.
where
P being the declared production, Y being the yield, M being the mortality rate, S being the impactscenario, C being the country.17 Production from municipios (Pará: Prainha; Amazonas: Coari, Codajás, Itacoatiara,Manacapuru) spread across both the Amazon Downwarp and Guiana Shield are included herebut accounted for no more than 9% of the amount attributed to shield forests over the period1990–2002 (IBGE, 2003).18 Taken from censii of various national statistical offices, including IBGE (Brazil), DANE(Colombia), OCEI (Venezuela), and INSEE (French Guiana).
466 D.S. Hammond
∑Pyc
Ysc
c
1
Msc
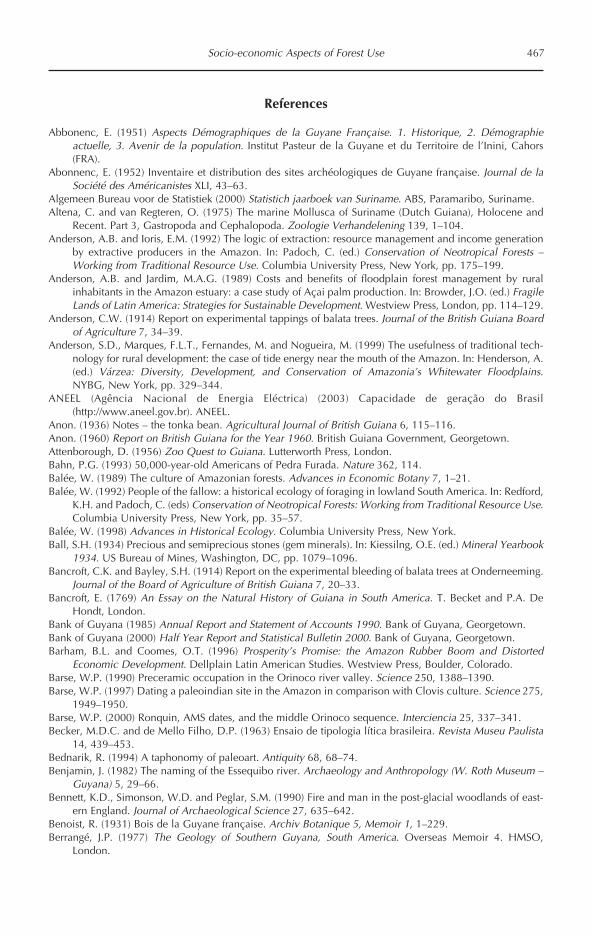
References
Abbonenc, E. (1951) Aspects Démographiques de la Guyane Française. 1. Historique, 2. Démographieactuelle, 3. Avenir de la population. Institut Pasteur de la Guyane et du Territoire de l’Inini, Cahors(FRA).
Abonnenc, E. (1952) Inventaire et distribution des sites archéologiques de Guyane française. Journal de laSociété des Américanistes XLI, 43–63.
Algemeen Bureau voor de Statistiek (2000) Statistich jaarboek van Suriname. ABS, Paramaribo, Suriname.Altena, C. and van Regteren, O. (1975) The marine Mollusca of Suriname (Dutch Guiana), Holocene and
Recent. Part 3, Gastropoda and Cephalopoda. Zoologie Verhandelening 139, 1–104.Anderson, A.B. and Ioris, E.M. (1992) The logic of extraction: resource management and income generation
by extractive producers in the Amazon. In: Padoch, C. (ed.) Conservation of Neotropical Forests –Working from Traditional Resource Use. Columbia University Press, New York, pp. 175–199.
Anderson, A.B. and Jardim, M.A.G. (1989) Costs and benefits of floodplain forest management by ruralinhabitants in the Amazon estuary: a case study of Açai palm production. In: Browder, J.O. (ed.) FragileLands of Latin America: Strategies for Sustainable Development. Westview Press, London, pp. 114–129.
Anderson, C.W. (1914) Report on experimental tappings of balata trees. Journal of the British Guiana Boardof Agriculture 7, 34–39.
Anderson, S.D., Marques, F.L.T., Fernandes, M. and Nogueira, M. (1999) The usefulness of traditional tech-nology for rural development: the case of tide energy near the mouth of the Amazon. In: Henderson, A.(ed.) Várzea: Diversity, Development, and Conservation of Amazonia’s Whitewater Floodplains.NYBG, New York, pp. 329–344.
ANEEL (Agência Nacional de Energia Eléctrica) (2003) Capacidade de geração do Brasil(http://www.aneel.gov.br). ANEEL.
Anon. (1936) Notes – the tonka bean. Agricultural Journal of British Guiana 6, 115–116.Anon. (1960) Report on British Guiana for the Year 1960. British Guiana Government, Georgetown.Attenborough, D. (1956) Zoo Quest to Guiana. Lutterworth Press, London.Bahn, P.G. (1993) 50,000-year-old Americans of Pedra Furada. Nature 362, 114.Balée, W. (1989) The culture of Amazonian forests. Advances in Economic Botany 7, 1–21.Balée, W. (1992) People of the fallow: a historical ecology of foraging in lowland South America. In: Redford,
K.H. and Padoch, C. (eds) Conservation of Neotropical Forests: Working from Traditional Resource Use.Columbia University Press, New York, pp. 35–57.
Balée, W. (1998) Advances in Historical Ecology. Columbia University Press, New York.Ball, S.H. (1934) Precious and semiprecious stones (gem minerals). In: Kiessilng, O.E. (ed.) Mineral Yearbook
1934. US Bureau of Mines, Washington, DC, pp. 1079–1096.Bancroft, C.K. and Bayley, S.H. (1914) Report on the experimental bleeding of balata trees at Onderneeming.
Journal of the Board of Agriculture of British Guiana 7, 20–33.Bancroft, E. (1769) An Essay on the Natural History of Guiana in South America. T. Becket and P.A. De
Hondt, London.Bank of Guyana (1985) Annual Report and Statement of Accounts 1990. Bank of Guyana, Georgetown.Bank of Guyana (2000) Half Year Report and Statistical Bulletin 2000. Bank of Guyana, Georgetown.Barham, B.L. and Coomes, O.T. (1996) Prosperity’s Promise: the Amazon Rubber Boom and Distorted
Economic Development. Dellplain Latin American Studies. Westview Press, Boulder, Colorado.Barse, W.P. (1990) Preceramic occupation in the Orinoco river valley. Science 250, 1388–1390.Barse, W.P. (1997) Dating a paleoindian site in the Amazon in comparison with Clovis culture. Science 275,
1949–1950.Barse, W.P. (2000) Ronquin, AMS dates, and the middle Orinoco sequence. Interciencia 25, 337–341.Becker, M.D.C. and de Mello Filho, D.P. (1963) Ensaio de tipologia lítica brasileira. Revista Museu Paulista
14, 439–453.Bednarik, R. (1994) A taphonomy of paleoart. Antiquity 68, 68–74.Benjamin, J. (1982) The naming of the Essequibo river. Archaeology and Anthropology (W. Roth Museum –
Guyana) 5, 29–66.Bennett, K.D., Simonson, W.D. and Peglar, S.M. (1990) Fire and man in the post-glacial woodlands of east-
ern England. Journal of Archaeological Science 27, 635–642.Benoist, R. (1931) Bois de la Guyane française. Archiv Botanique 5, Memoir 1, 1–229.Berrangé, J.P. (1977) The Geology of Southern Guyana, South America. Overseas Memoir 4. HMSO,
London.
Socio-economic Aspects of Forest Use 467
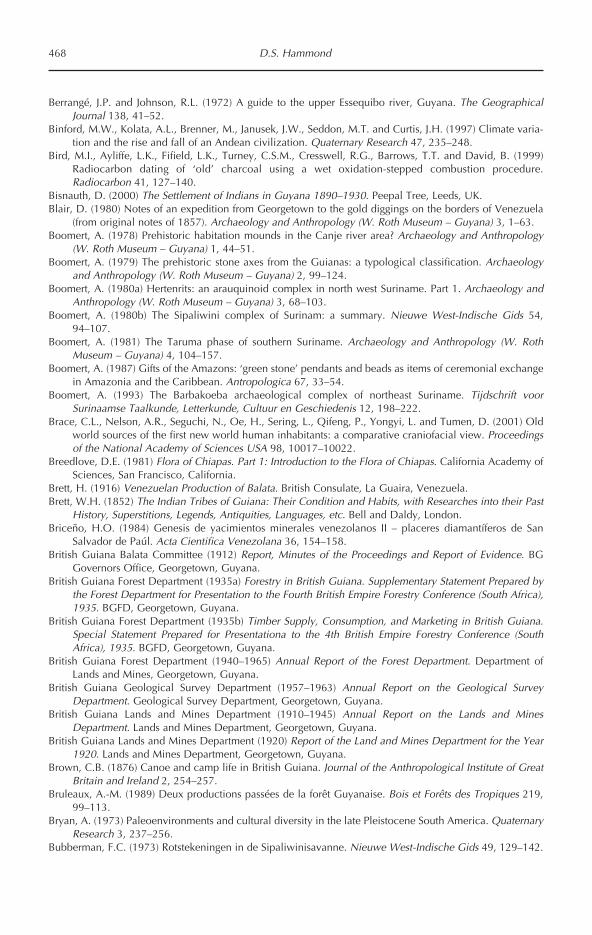
Berrangé, J.P. and Johnson, R.L. (1972) A guide to the upper Essequibo river, Guyana. The GeographicalJournal 138, 41–52.
Binford, M.W., Kolata, A.L., Brenner, M., Janusek, J.W., Seddon, M.T. and Curtis, J.H. (1997) Climate varia-tion and the rise and fall of an Andean civilization. Quaternary Research 47, 235–248.
Bird, M.I., Ayliffe, L.K., Fifield, L.K., Turney, C.S.M., Cresswell, R.G., Barrows, T.T. and David, B. (1999)Radiocarbon dating of ‘old’ charcoal using a wet oxidation-stepped combustion procedure.Radiocarbon 41, 127–140.
Bisnauth, D. (2000) The Settlement of Indians in Guyana 1890–1930. Peepal Tree, Leeds, UK.Blair, D. (1980) Notes of an expedition from Georgetown to the gold diggings on the borders of Venezuela
(from original notes of 1857). Archaeology and Anthropology (W. Roth Museum – Guyana) 3, 1–63.Boomert, A. (1978) Prehistoric habitation mounds in the Canje river area? Archaeology and Anthropology
(W. Roth Museum – Guyana) 1, 44–51.Boomert, A. (1979) The prehistoric stone axes from the Guianas: a typological classification. Archaeology
and Anthropology (W. Roth Museum – Guyana) 2, 99–124.Boomert, A. (1980a) Hertenrits: an arauquinoid complex in north west Suriname. Part 1. Archaeology and
Anthropology (W. Roth Museum – Guyana) 3, 68–103.Boomert, A. (1980b) The Sipaliwini complex of Surinam: a summary. Nieuwe West-Indische Gids 54,
94–107.Boomert, A. (1981) The Taruma phase of southern Suriname. Archaeology and Anthropology (W. Roth
Museum – Guyana) 4, 104–157.Boomert, A. (1987) Gifts of the Amazons: ‘green stone’ pendants and beads as items of ceremonial exchange
in Amazonia and the Caribbean. Antropologica 67, 33–54.Boomert, A. (1993) The Barbakoeba archaeological complex of northeast Suriname. Tijdschrift voor
Surinaamse Taalkunde, Letterkunde, Cultuur en Geschiedenis 12, 198–222.Brace, C.L., Nelson, A.R., Seguchi, N., Oe, H., Sering, L., Qifeng, P., Yongyi, L. and Tumen, D. (2001) Old
world sources of the first new world human inhabitants: a comparative craniofacial view. Proceedingsof the National Academy of Sciences USA 98, 10017–10022.
Breedlove, D.E. (1981) Flora of Chiapas. Part 1: Introduction to the Flora of Chiapas. California Academy ofSciences, San Francisco, California.
Brett, H. (1916) Venezuelan Production of Balata. British Consulate, La Guaira, Venezuela.Brett, W.H. (1852) The Indian Tribes of Guiana: Their Condition and Habits, with Researches into their Past
History, Superstitions, Legends, Antiquities, Languages, etc. Bell and Daldy, London.Briceño, H.O. (1984) Genesis de yacimientos minerales venezolanos II – placeres diamantíferos de San
Salvador de Paúl. Acta Cientifica Venezolana 36, 154–158.British Guiana Balata Committee (1912) Report, Minutes of the Proceedings and Report of Evidence. BG
Governors Office, Georgetown, Guyana.British Guiana Forest Department (1935a) Forestry in British Guiana. Supplementary Statement Prepared by
the Forest Department for Presentation to the Fourth British Empire Forestry Conference (South Africa),1935. BGFD, Georgetown, Guyana.
British Guiana Forest Department (1935b) Timber Supply, Consumption, and Marketing in British Guiana.Special Statement Prepared for Presentationa to the 4th British Empire Forestry Conference (SouthAfrica), 1935. BGFD, Georgetown, Guyana.
British Guiana Forest Department (1940–1965) Annual Report of the Forest Department. Department ofLands and Mines, Georgetown, Guyana.
British Guiana Geological Survey Department (1957–1963) Annual Report on the Geological SurveyDepartment. Geological Survey Department, Georgetown, Guyana.
British Guiana Lands and Mines Department (1910–1945) Annual Report on the Lands and MinesDepartment. Lands and Mines Department, Georgetown, Guyana.
British Guiana Lands and Mines Department (1920) Report of the Land and Mines Department for the Year1920. Lands and Mines Department, Georgetown, Guyana.
Brown, C.B. (1876) Canoe and camp life in British Guiana. Journal of the Anthropological Institute of GreatBritain and Ireland 2, 254–257.
Bruleaux, A.-M. (1989) Deux productions passées de la forêt Guyanaise. Bois et Forêts des Tropiques 219,99–113.
Bryan, A. (1973) Paleoenvironments and cultural diversity in the late Pleistocene South America. QuaternaryResearch 3, 237–256.
Bubberman, F.C. (1973) Rotstekeningen in de Sipaliwinisavanne. Nieuwe West-Indische Gids 49, 129–142.
468 D.S. Hammond

Bubberman, F.C. and Vink, A.T. (1966) Ditch-blasting as a method of opening up the tropical swamp forestin Suriname. Netherlands Journal of Agricultural Science 14, 10–15.
Bunker, S.G. (1985) Underdeveloping the Amazon – Extraction, Unequal Exchange, and the Failure of theModern State. University of Illinois Press, Chicago, Illinois.
Buschbacher, R.J. (1986) Tropical deforestation and pasture development. Bioscience 36, 22–28.CAMBIOR (2002) Rosebel Project Technical Report. Cambior, Paramaribo.Carter, J.E.L. (1943) An account of some recent excavations at Seba, British Guiana. American Antiquity 9,
89–99.Central Intelligence Agency (2000) The World Factbook. CIA, Washington, DC.Châtelain, G. (1935) La balata et la gomme de balata en Guyane française. l’Agronomie Coloniale 209,
148–151.Chernela, J.M. (1993) The Wanano Indian of the Brazilian Amazon: A Sense of Space. University of Texas
Press, Austin, Texas.Chernela, J.M. (1998) Missionary activity and indian labor in the upper Rio Negro of Brazil, 1680–1980: a
historical–ecological approach. In: Balée, W. (ed.) Advances in Historical Ecology. Columbia UniversityPress, New York, pp. 313–333.
Chippendale, C. and Taçon, P.S.C. (1998) The Archaeology of Rock Art. Cambridge University Press,London.
Colchester, M. (1997a) Ecología social de los Sanema. In: Rosales, J. (ed.) Ecología de la Cuenca del RíoCaura, Venezuela II. Estudios Especiales. Refolit, C.A., Caracas, pp. 111–140.
Colchester, M. (1997b) Guyana: Fragile Frontier. Earthscan Publications, London.Collis, L. (1965) Soldier in Paradise: the Life of Captain John Stedman, 1744–1797. Michael Joseph, London.Coomes, O.T. (1995) A century of rain forest use in western Amazonia: lessons for extraction-based conser-
vation of tropical forest resources. Forest and Conservation History 39, 108–120.Corothie, H. (1948) Maderas de Venezuela. Impreta Nacional, Caracas.Cruxent, J. (1947) Pinturas rupestres de El Carmen, en el Rio Parguaza, Estado Bolivar, Venezuela. Acta
Venezolana 11, 1–60.Cruxent, J. (1950) Archaeology of Cotúa Island, Amazonas Territory, Venezuela. American Antiquity 16,
10–16.Cruxent, J. (1972) Tupuquén: un yacimiento con lítica de tipo Paleo-Indio. Acta Cientifica Venezolana 23,
1–17.Curtin, P.B. (1969) The Atlantic Slave Trade: A Census. University of Wisconsin, Madison, Wisconsin.Curtis, J.H., Hodell, D.A. and Brenner, M. (1996) Climate variability on the Yucatan peninsula (Mexico) dur-
ing the past 3500 years, and implications for Maya cultural evolution. Quaternary Research 46, 37–47.CVG-TECMIN (1991) Proyecto Inventario de los Recursos Naturales de la Región Guayana. CVG-TECMIN,
Ciudad Bolivar, Venezuela, pp. 1–15.da Costa, E.V. (1994) Crowns of Glory, Tears of Blood – the Demerara Slave Rebellion of 1823. Oxford
University Press, Oxford, UK.Dalton, H.G. (1855) The History of British Guiana. Longman, Brown and Green, London.Davis, T.A.W. (1933) Report on the Balata Industry with Special Reference to the Rupununi District. British
Guiana Legislative Council No. 4. Georgetown, Demerara, British Guiana.Dawkins, H.C. and Philip, M.S. (1998) Tropical Moist Forest Silviculture and Management – a History of
Success and Failure. CAB International, Wallingford, UK.de Lumley, H., de Lumley, M.A., Beltrão, M.C., Yokoyama, Y., Labeyrie, J., Danon, J., Delibrias, G., Falguers,
C. and Bischoff, J. (1988) Decouverte d’outils taillès associes a des faunes du Pleistocene moyen dansla Toca da Esperança, Etat de Bahía, Bresil. Comptes Rendus de l’Académie des Sciences de Paris 306,307–317.
de Groot, S.W. (1977) From Isolation Towards Integration – the Surinam Maroons and their Colonial Rulers.Martinus Nijhoff, The Hague, The Netherlands.
DeBoer, W.R., Kintigh, K. and Rostoker, A.G. (1996) Ceramic seriation and site reoccupation in lowlandSouth America. Latin American Antiquity 7, 263–278.
Denevan, W.D. (1970) Aboriginal drained field cultivation in the Americas. Science 169, 647–654.Denevan, W.M. (1992) The pristine myth: the landscape of the Americas in 1492. Annals of the Association
of American Geographers 82, 369–385.Departmento Nacional de Produção Mineral (1999) Indicadores da Produção Mineral 1998. Divisão de
Economia Mineral, Brasilia.Departmento Nacional de Produção Mineral (2001) Anuário Mineral Brasiliero 2001. DNPM, Brasilia.
Socio-economic Aspects of Forest Use 469

Detienne, P. and Chanson, B. (1996) L’éventail de la densité du bois des feuillus. Bois et Forêt des Tropiques250, 19–30.
Dew, E. (1978) The Difficult Flowering of Suriname – Ethnicity and Politics in a Plural Society. MartinusNijhoff, The Hague, The Netherlands.
Dillehay, T.D. (1997) Monte Verde: A Late Pleistocene Settlement in Chile, Vol. 2: the ArchaeologicalContext and Interpretation. Smithsonian Institution Press, Washington, DC.
Dillehay, T.D. (2000) The Settlement of the Americas – a New Prehistory. Basic Books, New York.Dillehay, T.D. and Kolata, A.L. (2004) Long-term human response to uncertain environmental conditions in
the Andes. Proceedings of the National Academy of Sciences 101, 4325–4330.Dixon, E.J. (1999) Bones, Boats and Bison: Archaeology and the First Colonization of Eestern North America.
University of New Mexico Press, Albuquerque, New Mexico.DNPM (Departmento Nacional de Produção Mineral) (1995–2001) Anuário Mineral Brasileiro. DNPM,
Brasilia.Drude de Lacerda, L. (2003) Updating global Hg emissions from small-scale gold mining and assessing its
environmental impacts. Environmental Geology 42, 308–314.Dubelaar, C.N. (1976) Jeannine Sujo Volsky, el estudio del arte rupestre en Venezuela. Journal de la Société
des Américanistes 52, 322–327.Dubelaar, C.N. (1981) Petroglyphs in Suriname: a survey. Archaeology and Anthropology (W. Roth Museum
– Guyana) 4, 64–80.Dubelaar, C.N. (1986) The Petroglyphs in the Guianas and Adjacent Areas of Brazil and Venezuela: An
Inventory. Monumenta Archaeologica 12. Institute of Archaeology, University of California, LosAngeles, California.
Dubelaar, C.N. and Berrangé, J.P. (1979) Some recent petroglyph finds in southern Guyana. Archaeology andAnthropology (W. Roth Museum – Guyana) 2, 61–78.
Ducke, A. (1943) The most important woods of the Amazon valley. Tropical Woods 74, 1–15.Dupouy, W. (1956) Dos piezas de tipo paleolítico de la Gran Sabana, Venezuela. Boletín del Museo de
Ciencias Naturales, Caracas 2/3, 95–102.Dupouy, W. (1960) Tres puntas líticas de tipo paleo-indio de la Paragua, Estado Bolivar, Venezuela. Boletín
del Museo de Ciencias Naturales, Caracas 5/6, 7–14.Eden, M.J., Bray, W., Herrera, L. and McEwan, C. (1984) Terra preta soils and their archaeological context
in the Caquetá basin of southeast Colombia. American Antiquity 49, 125–140.Edmondson, J.R. (1949) Reaction of woods from South America and Caribbean areas to marine borers in
Hawaiian waters. Caribbean Forester 10, 37–41.Edmundson, G. (1901) The Dutch in western Guiana. English Historical Review 16, 640–675.Edmundson, G. (1904a) The Dutch on the Amazon and Negro in the 17th century. Part 1. Dutch trade on
the Amazon. English Historical Review 18, 642–663.Edmundson, G. (1904b) The Dutch on the Amazon and Negro in the 17th century. Part 2. Dutch trade in the
Rio Negro basin. English Historical Review 19, 1–25.Erickson, C.L. (1999) Neo-environmental determinism and agrarian ‘collapse’ in Andean prehistory.
American Antiquity 73, 634–642.Erickson, C.L. (2000) An artificial landscape-scale fishery in the Bolivian Amazon. Nature 408, 190–193.Evans, C. and Meggers, B.J. (1960) Archeological Investigations in British Guiana. Bulletin of the Bureau of
American Ethnology, 177. Smithsonian Institution Press, Washington, DC.Evans, C. and Meggers, B.J. (1968) Archeological Investigations on the Rio Napo, Eastern Ecuador.
Smithsonian Contributions to Anthropology, 6. Smithsonian Institution Press, Washington, DC.Evans, C., Meggers, B.J. and Cruxent, J. (1959) Preliminary results of archeological investigations along the
Orinoco and Ventuari rivers, Venezuela. Actas del XXXIII Congreso Internacional de Americanistas, SanJosé, Costa Rica.
Fairbridge, R.W. (1976) Shellfish-eating Indians in coastal Brazil. Science 191, 353–359.Fanshawe, D.B. (1950) Forest Products of British Guiana II. Minor Forest Products. Forest Department, British
Guiana, Georgetown, Guyana.FAOSTAT (2003) FAOSTAT – Forestry Data (http://www.apps.fao.org/faostat). FAO, Rome.Farabee, W.C. (1918) The Central Arawaks. Anthropological Publications, 10. The University Museum,
Philadelphia.Fimbel, R.A., Grajal, A. and Robinson, J.G. (eds) (2001) The Cutting Edge – Conserving Wildlife in Logged
Tropical Forests. Biology and Resource Management Series. Columbia University Press, NewYork.
470 D.S. Hammond
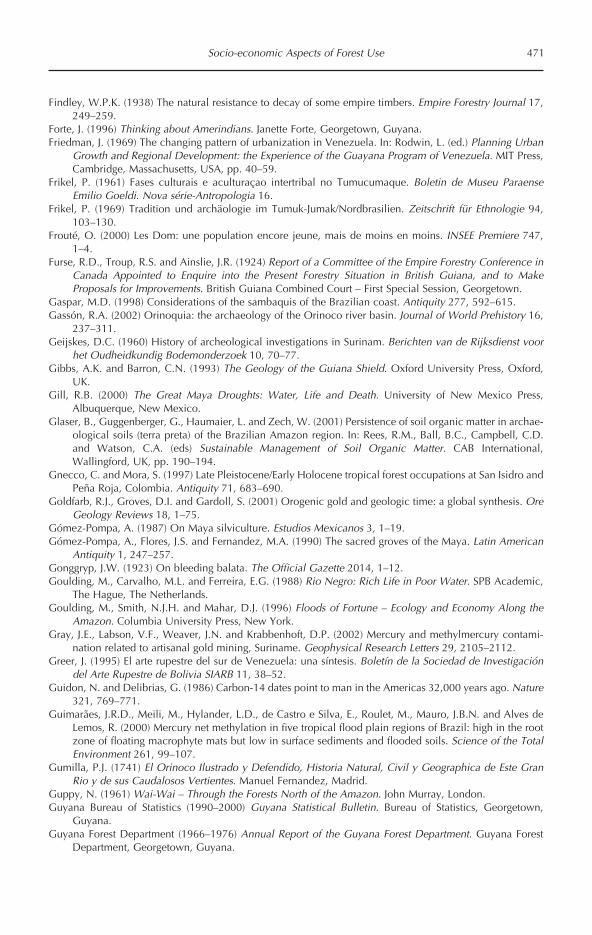
Findley, W.P.K. (1938) The natural resistance to decay of some empire timbers. Empire Forestry Journal 17,249–259.
Forte, J. (1996) Thinking about Amerindians. Janette Forte, Georgetown, Guyana.Friedman, J. (1969) The changing pattern of urbanization in Venezuela. In: Rodwin, L. (ed.) Planning Urban
Growth and Regional Development: the Experience of the Guayana Program of Venezuela. MIT Press,Cambridge, Massachusetts, USA, pp. 40–59.
Frikel, P. (1961) Fases culturais e aculturaçao intertribal no Tumucumaque. Boletin de Museu ParaenseEmilio Goeldi. Nova série-Antropologia 16.
Frikel, P. (1969) Tradition und archäologie im Tumuk-Jumak/Nordbrasilien. Zeitschrift für Ethnologie 94,103–130.
Frouté, O. (2000) Les Dom: une population encore jeune, mais de moins en moins. INSEE Premiere 747,1–4.
Furse, R.D., Troup, R.S. and Ainslie, J.R. (1924) Report of a Committee of the Empire Forestry Conference inCanada Appointed to Enquire into the Present Forestry Situation in British Guiana, and to MakeProposals for Improvements. British Guiana Combined Court – First Special Session, Georgetown.
Gaspar, M.D. (1998) Considerations of the sambaquis of the Brazilian coast. Antiquity 277, 592–615.Gassón, R.A. (2002) Orinoquia: the archaeology of the Orinoco river basin. Journal of World Prehistory 16,
237–311.Geijskes, D.C. (1960) History of archeological investigations in Surinam. Berichten van de Rijksdienst voor
het Oudheidkundig Bodemonderzoek 10, 70–77.Gibbs, A.K. and Barron, C.N. (1993) The Geology of the Guiana Shield. Oxford University Press, Oxford,
UK.Gill, R.B. (2000) The Great Maya Droughts: Water, Life and Death. University of New Mexico Press,
Albuquerque, New Mexico.Glaser, B., Guggenberger, G., Haumaier, L. and Zech, W. (2001) Persistence of soil organic matter in archae-
ological soils (terra preta) of the Brazilian Amazon region. In: Rees, R.M., Ball, B.C., Campbell, C.D.and Watson, C.A. (eds) Sustainable Management of Soil Organic Matter. CAB International,Wallingford, UK, pp. 190–194.
Gnecco, C. and Mora, S. (1997) Late Pleistocene/Early Holocene tropical forest occupations at San Isidro andPeña Roja, Colombia. Antiquity 71, 683–690.
Goldfarb, R.J., Groves, D.I. and Gardoll, S. (2001) Orogenic gold and geologic time: a global synthesis. OreGeology Reviews 18, 1–75.
Gómez-Pompa, A. (1987) On Maya silviculture. Estudios Mexicanos 3, 1–19.Gómez-Pompa, A., Flores, J.S. and Fernandez, M.A. (1990) The sacred groves of the Maya. Latin American
Antiquity 1, 247–257.Gonggryp, J.W. (1923) On bleeding balata. The Official Gazette 2014, 1–12.Goulding, M., Carvalho, M.L. and Ferreira, E.G. (1988) Rio Negro: Rich Life in Poor Water. SPB Academic,
The Hague, The Netherlands.Goulding, M., Smith, N.J.H. and Mahar, D.J. (1996) Floods of Fortune – Ecology and Economy Along the
Amazon. Columbia University Press, New York.Gray, J.E., Labson, V.F., Weaver, J.N. and Krabbenhoft, D.P. (2002) Mercury and methylmercury contami-
nation related to artisanal gold mining, Suriname. Geophysical Research Letters 29, 2105–2112.Greer, J. (1995) El arte rupestre del sur de Venezuela: una síntesis. Boletín de la Sociedad de Investigación
del Arte Rupestre de Bolivia SIARB 11, 38–52.Guidon, N. and Delibrias, G. (1986) Carbon-14 dates point to man in the Americas 32,000 years ago. Nature
321, 769–771.Guimarães, J.R.D., Meili, M., Hylander, L.D., de Castro e Silva, E., Roulet, M., Mauro, J.B.N. and Alves de
Lemos, R. (2000) Mercury net methylation in five tropical flood plain regions of Brazil: high in the rootzone of floating macrophyte mats but low in surface sediments and flooded soils. Science of the TotalEnvironment 261, 99–107.
Gumilla, P.J. (1741) El Orinoco Ilustrado y Defendido, Historia Natural, Civil y Geographica de Este GranRio y de sus Caudalosos Vertientes. Manuel Fernandez, Madrid.
Guppy, N. (1961) Wai-Wai – Through the Forests North of the Amazon. John Murray, London.Guyana Bureau of Statistics (1990–2000) Guyana Statistical Bulletin. Bureau of Statistics, Georgetown,
Guyana.Guyana Forest Department (1966–1976) Annual Report of the Guyana Forest Department. Guyana Forest
Department, Georgetown, Guyana.
Socio-economic Aspects of Forest Use 471
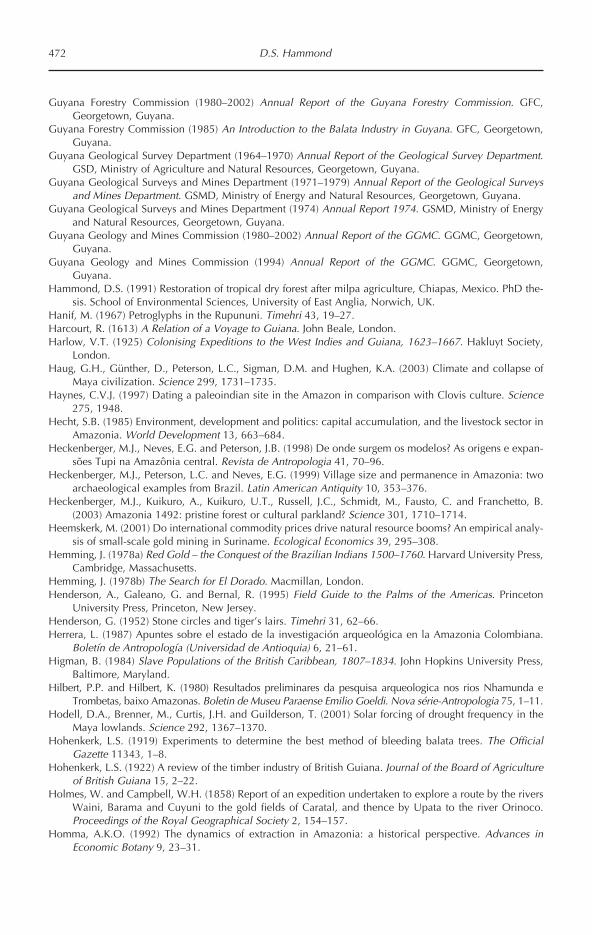
Guyana Forestry Commission (1980–2002) Annual Report of the Guyana Forestry Commission. GFC,Georgetown, Guyana.
Guyana Forestry Commission (1985) An Introduction to the Balata Industry in Guyana. GFC, Georgetown,Guyana.
Guyana Geological Survey Department (1964–1970) Annual Report of the Geological Survey Department.GSD, Ministry of Agriculture and Natural Resources, Georgetown, Guyana.
Guyana Geological Surveys and Mines Department (1971–1979) Annual Report of the Geological Surveysand Mines Department. GSMD, Ministry of Energy and Natural Resources, Georgetown, Guyana.
Guyana Geological Surveys and Mines Department (1974) Annual Report 1974. GSMD, Ministry of Energyand Natural Resources, Georgetown, Guyana.
Guyana Geology and Mines Commission (1980–2002) Annual Report of the GGMC. GGMC, Georgetown,Guyana.
Guyana Geology and Mines Commission (1994) Annual Report of the GGMC. GGMC, Georgetown,Guyana.
Hammond, D.S. (1991) Restoration of tropical dry forest after milpa agriculture, Chiapas, Mexico. PhD the-sis. School of Environmental Sciences, University of East Anglia, Norwich, UK.
Hanif, M. (1967) Petroglyphs in the Rupununi. Timehri 43, 19–27.Harcourt, R. (1613) A Relation of a Voyage to Guiana. John Beale, London.Harlow, V.T. (1925) Colonising Expeditions to the West Indies and Guiana, 1623–1667. Hakluyt Society,
London.Haug, G.H., Günther, D., Peterson, L.C., Sigman, D.M. and Hughen, K.A. (2003) Climate and collapse of
Maya civilization. Science 299, 1731–1735.Haynes, C.V.J. (1997) Dating a paleoindian site in the Amazon in comparison with Clovis culture. Science
275, 1948.Hecht, S.B. (1985) Environment, development and politics: capital accumulation, and the livestock sector in
Amazonia. World Development 13, 663–684.Heckenberger, M.J., Neves, E.G. and Peterson, J.B. (1998) De onde surgem os modelos? As origens e expan-
sões Tupi na Amazônia central. Revista de Antropologia 41, 70–96.Heckenberger, M.J., Peterson, L.C. and Neves, E.G. (1999) Village size and permanence in Amazonia: two
archaeological examples from Brazil. Latin American Antiquity 10, 353–376.Heckenberger, M.J., Kuikuro, A., Kuikuro, U.T., Russell, J.C., Schmidt, M., Fausto, C. and Franchetto, B.
(2003) Amazonia 1492: pristine forest or cultural parkland? Science 301, 1710–1714.Heemskerk, M. (2001) Do international commodity prices drive natural resource booms? An empirical analy-
sis of small-scale gold mining in Suriname. Ecological Economics 39, 295–308.Hemming, J. (1978a) Red Gold – the Conquest of the Brazilian Indians 1500–1760. Harvard University Press,
Cambridge, Massachusetts.Hemming, J. (1978b) The Search for El Dorado. Macmillan, London.Henderson, A., Galeano, G. and Bernal, R. (1995) Field Guide to the Palms of the Americas. Princeton
University Press, Princeton, New Jersey.Henderson, G. (1952) Stone circles and tiger’s lairs. Timehri 31, 62–66.Herrera, L. (1987) Apuntes sobre el estado de la investigación arqueológica en la Amazonia Colombiana.
Boletín de Antropología (Universidad de Antioquia) 6, 21–61.Higman, B. (1984) Slave Populations of the British Caribbean, 1807–1834. John Hopkins University Press,
Baltimore, Maryland.Hilbert, P.P. and Hilbert, K. (1980) Resultados preliminares da pesquisa arqueologica nos rios Nhamunda e
Trombetas, baixo Amazonas. Boletin de Museu Paraense Emilio Goeldi. Nova série-Antropologia 75, 1–11.Hodell, D.A., Brenner, M., Curtis, J.H. and Guilderson, T. (2001) Solar forcing of drought frequency in the
Maya lowlands. Science 292, 1367–1370.Hohenkerk, L.S. (1919) Experiments to determine the best method of bleeding balata trees. The Official
Gazette 11343, 1–8.Hohenkerk, L.S. (1922) A review of the timber industry of British Guiana. Journal of the Board of Agriculture
of British Guiana 15, 2–22.Holmes, W. and Campbell, W.H. (1858) Report of an expedition undertaken to explore a route by the rivers
Waini, Barama and Cuyuni to the gold fields of Caratal, and thence by Upata to the river Orinoco.Proceedings of the Royal Geographical Society 2, 154–157.
Homma, A.K.O. (1992) The dynamics of extraction in Amazonia: a historical perspective. Advances inEconomic Botany 9, 23–31.
472 D.S. Hammond
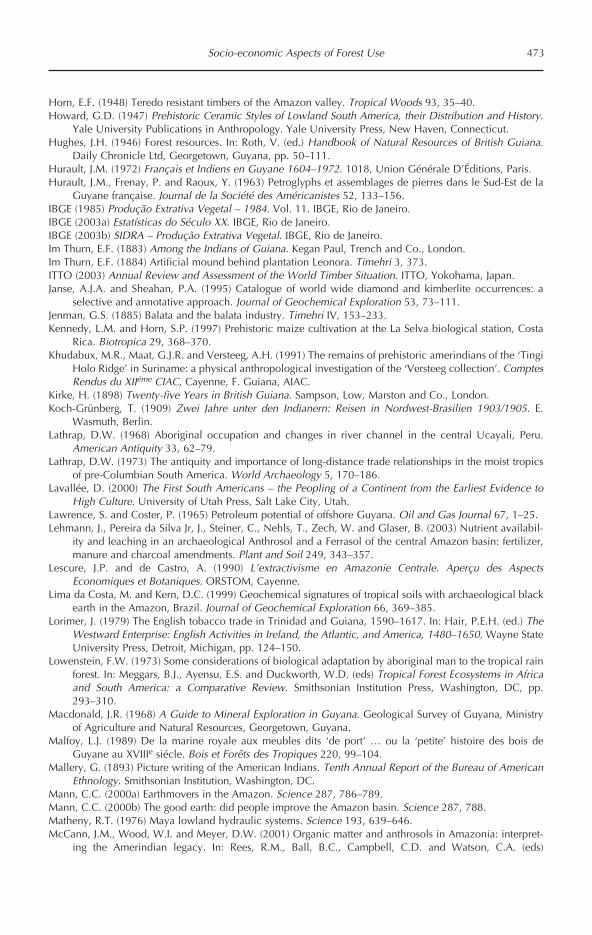
Horn, E.F. (1948) Teredo resistant timbers of the Amazon valley. Tropical Woods 93, 35–40.Howard, G.D. (1947) Prehistoric Ceramic Styles of Lowland South America, their Distribution and History.
Yale University Publications in Anthropology. Yale University Press, New Haven, Connecticut.Hughes, J.H. (1946) Forest resources. In: Roth, V. (ed.) Handbook of Natural Resources of British Guiana.
Daily Chronicle Ltd, Georgetown, Guyana, pp. 50–111.Hurault, J.M. (1972) Français et Indiens en Guyane 1604–1972. 1018, Union Générale D’Éditions, Paris.Hurault, J.M., Frenay, P. and Raoux, Y. (1963) Petroglyphs et assemblages de pierres dans le Sud-Est de la
Guyane française. Journal de la Société des Américanistes 52, 133–156.IBGE (1985) Produção Extrativa Vegetal – 1984. Vol. 11. IBGE, Rio de Janeiro.IBGE (2003a) Estatísticas do Século XX. IBGE, Rio de Janeiro.IBGE (2003b) SIDRA – Produção Extrativa Vegetal. IBGE, Rio de Janeiro.Im Thurn, E.F. (1883) Among the Indians of Guiana. Kegan Paul, Trench and Co., London.Im Thurn, E.F. (1884) Artificial mound behind plantation Leonora. Timehri 3, 373.ITTO (2003) Annual Review and Assessment of the World Timber Situation. ITTO, Yokohama, Japan.Janse, A.J.A. and Sheahan, P.A. (1995) Catalogue of world wide diamond and kimberlite occurrences: a
selective and annotative approach. Journal of Geochemical Exploration 53, 73–111.Jenman, G.S. (1885) Balata and the balata industry. Timehri IV, 153–233.Kennedy, L.M. and Horn, S.P. (1997) Prehistoric maize cultivation at the La Selva biological station, Costa
Rica. Biotropica 29, 368–370.Khudabux, M.R., Maat, G.J.R. and Versteeg, A.H. (1991) The remains of prehistoric amerindians of the ‘Tingi
Holo Ridge’ in Suriname: a physical anthropological investigation of the ‘Versteeg collection’. ComptesRendus du XIIéme CIAC, Cayenne, F. Guiana, AIAC.
Kirke, H. (1898) Twenty-five Years in British Guiana. Sampson, Low, Marston and Co., London.Koch-Grünberg, T. (1909) Zwei Jahre unter den Indianern: Reisen in Nordwest-Brasilien 1903/1905. E.
Wasmuth, Berlin.Lathrap, D.W. (1968) Aboriginal occupation and changes in river channel in the central Ucayali, Peru.
American Antiquity 33, 62–79.Lathrap, D.W. (1973) The antiquity and importance of long-distance trade relationships in the moist tropics
of pre-Columbian South America. World Archaeology 5, 170–186.Lavallée, D. (2000) The First South Americans – the Peopling of a Continent from the Earliest Evidence to
High Culture. University of Utah Press, Salt Lake City, Utah.Lawrence, S. and Coster, P. (1965) Petroleum potential of offshore Guyana. Oil and Gas Journal 67, 1–25.Lehmann, J., Pereira da Silva Jr, J., Steiner, C., Nehls, T., Zech, W. and Glaser, B. (2003) Nutrient availabil-
ity and leaching in an archaeological Anthrosol and a Ferrasol of the central Amazon basin: fertilizer,manure and charcoal amendments. Plant and Soil 249, 343–357.
Lescure, J.P. and de Castro, A. (1990) L’extractivisme en Amazonie Centrale. Aperçu des AspectsEconomiques et Botaniques. ORSTOM, Cayenne.
Lima da Costa, M. and Kern, D.C. (1999) Geochemical signatures of tropical soils with archaeological blackearth in the Amazon, Brazil. Journal of Geochemical Exploration 66, 369–385.
Lorimer, J. (1979) The English tobacco trade in Trinidad and Guiana, 1590–1617. In: Hair, P.E.H. (ed.) TheWestward Enterprise: English Activities in Ireland, the Atlantic, and America, 1480–1650. Wayne StateUniversity Press, Detroit, Michigan, pp. 124–150.
Lowenstein, F.W. (1973) Some considerations of biological adaptation by aboriginal man to the tropical rainforest. In: Meggars, B.J., Ayensu, E.S. and Duckworth, W.D. (eds) Tropical Forest Ecosystems in Africaand South America: a Comparative Review. Smithsonian Institution Press, Washington, DC, pp.293–310.
Macdonald, J.R. (1968) A Guide to Mineral Exploration in Guyana. Geological Survey of Guyana, Ministryof Agriculture and Natural Resources, Georgetown, Guyana.
Malfoy, L.J. (1989) De la marine royale aux meubles dits ‘de port’ … ou la ‘petite’ histoire des bois deGuyane au XVIIIe siécle. Bois et Forêts des Tropiques 220, 99–104.
Mallery, G. (1893) Picture writing of the American Indians. Tenth Annual Report of the Bureau of AmericanEthnology. Smithsonian Institution, Washington, DC.
Mann, C.C. (2000a) Earthmovers in the Amazon. Science 287, 786–789.Mann, C.C. (2000b) The good earth: did people improve the Amazon basin. Science 287, 788.Matheny, R.T. (1976) Maya lowland hydraulic systems. Science 193, 639–646.McCann, J.M., Wood, W.I. and Meyer, D.W. (2001) Organic matter and anthrosols in Amazonia: interpret-
ing the Amerindian legacy. In: Rees, R.M., Ball, B.C., Campbell, C.D. and Watson, C.A. (eds)
Socio-economic Aspects of Forest Use 473
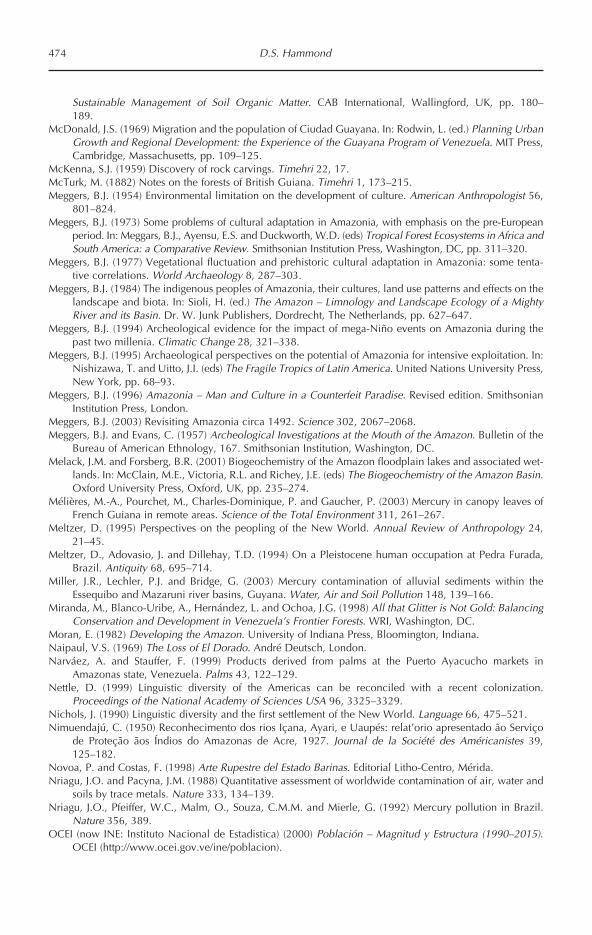
Sustainable Management of Soil Organic Matter. CAB International, Wallingford, UK, pp. 180–189.
McDonald, J.S. (1969) Migration and the population of Ciudad Guayana. In: Rodwin, L. (ed.) Planning UrbanGrowth and Regional Development: the Experience of the Guayana Program of Venezuela. MIT Press,Cambridge, Massachusetts, pp. 109–125.
McKenna, S.J. (1959) Discovery of rock carvings. Timehri 22, 17.McTurk, M. (1882) Notes on the forests of British Guiana. Timehri 1, 173–215.Meggers, B.J. (1954) Environmental limitation on the development of culture. American Anthropologist 56,
801–824.Meggers, B.J. (1973) Some problems of cultural adaptation in Amazonia, with emphasis on the pre-European
period. In: Meggars, B.J., Ayensu, E.S. and Duckworth, W.D. (eds) Tropical Forest Ecosystems in Africa andSouth America: a Comparative Review. Smithsonian Institution Press, Washington, DC, pp. 311–320.
Meggers, B.J. (1977) Vegetational fluctuation and prehistoric cultural adaptation in Amazonia: some tenta-tive correlations. World Archaeology 8, 287–303.
Meggers, B.J. (1984) The indigenous peoples of Amazonia, their cultures, land use patterns and effects on thelandscape and biota. In: Sioli, H. (ed.) The Amazon – Limnology and Landscape Ecology of a MightyRiver and its Basin. Dr. W. Junk Publishers, Dordrecht, The Netherlands, pp. 627–647.
Meggers, B.J. (1994) Archeological evidence for the impact of mega-Niño events on Amazonia during thepast two millenia. Climatic Change 28, 321–338.
Meggers, B.J. (1995) Archaeological perspectives on the potential of Amazonia for intensive exploitation. In:Nishizawa, T. and Uitto, J.I. (eds) The Fragile Tropics of Latin America. United Nations University Press,New York, pp. 68–93.
Meggers, B.J. (1996) Amazonia – Man and Culture in a Counterfeit Paradise. Revised edition. SmithsonianInstitution Press, London.
Meggers, B.J. (2003) Revisiting Amazonia circa 1492. Science 302, 2067–2068.Meggers, B.J. and Evans, C. (1957) Archeological Investigations at the Mouth of the Amazon. Bulletin of the
Bureau of American Ethnology, 167. Smithsonian Institution, Washington, DC.Melack, J.M. and Forsberg, B.R. (2001) Biogeochemistry of the Amazon floodplain lakes and associated wet-
lands. In: McClain, M.E., Victoria, R.L. and Richey, J.E. (eds) The Biogeochemistry of the Amazon Basin.Oxford University Press, Oxford, UK, pp. 235–274.
Mélières, M.-A., Pourchet, M., Charles-Dominique, P. and Gaucher, P. (2003) Mercury in canopy leaves ofFrench Guiana in remote areas. Science of the Total Environment 311, 261–267.
Meltzer, D. (1995) Perspectives on the peopling of the New World. Annual Review of Anthropology 24,21–45.
Meltzer, D., Adovasio, J. and Dillehay, T.D. (1994) On a Pleistocene human occupation at Pedra Furada,Brazil. Antiquity 68, 695–714.
Miller, J.R., Lechler, P.J. and Bridge, G. (2003) Mercury contamination of alluvial sediments within theEssequibo and Mazaruni river basins, Guyana. Water, Air and Soil Pollution 148, 139–166.
Miranda, M., Blanco-Uribe, A., Hernández, L. and Ochoa, J.G. (1998) All that Glitter is Not Gold: BalancingConservation and Development in Venezuela’s Frontier Forests. WRI, Washington, DC.
Moran, E. (1982) Developing the Amazon. University of Indiana Press, Bloomington, Indiana.Naipaul, V.S. (1969) The Loss of El Dorado. André Deutsch, London.Narváez, A. and Stauffer, F. (1999) Products derived from palms at the Puerto Ayacucho markets in
Amazonas state, Venezuela. Palms 43, 122–129.Nettle, D. (1999) Linguistic diversity of the Americas can be reconciled with a recent colonization.
Proceedings of the National Academy of Sciences USA 96, 3325–3329.Nichols, J. (1990) Linguistic diversity and the first settlement of the New World. Language 66, 475–521.Nimuendajú, C. (1950) Reconhecimento dos rios Içana, Ayari, e Uaupés: relat’orio apresentado ão Serviço
de Proteção ãos Índios do Amazonas de Acre, 1927. Journal de la Société des Américanistes 39,125–182.
Novoa, P. and Costas, F. (1998) Arte Rupestre del Estado Barinas. Editorial Litho-Centro, Mérida.Nriagu, J.O. and Pacyna, J.M. (1988) Quantitative assessment of worldwide contamination of air, water and
soils by trace metals. Nature 333, 134–139.Nriagu, J.O., Pfeiffer, W.C., Malm, O., Souza, C.M.M. and Mierle, G. (1992) Mercury pollution in Brazil.
Nature 356, 389.OCEI (now INE: Instituto Nacional de Estadistica) (2000) Población – Magnitud y Estructura (1990–2015).
OCEI (http://www.ocei.gov.ve/ine/poblacion).
474 D.S. Hammond

Office National des Forêts (1992) Rapport du Gestion 1992 – Dirrection Régionale de l’ONF – Guyane.ONF-Guyane, Cayenne.
Office National des Forêts (1997a) L’exportation des bois guyanais. Bois et Forêts de Guyane 5, 6–7.Office National des Forêts (1997b) Schéma d’aménagement forestier en Guyane. Bois et Forêts de Guyane
5, 2.Ojer, P. (1960) Don Antonio de Berrio – Gobernador del Dorado. Universidad Católica Andrés Bello,
Caracas.Ojer, P. (1966) La formación del oriente Venezolano. I. Creación de las gobernaciones. Universidad Católica
Andrés Bello, Caracas.Oliphant, F.M. (1938) The Commercial Possibilities and Development of the Forests of British Guiana. The
Argosy Co. Ltd, Georgetown, Guyana.Omai Gold Mines Limited (Cambior) (2000) Statement of Total Investment, Royalties and Taxes Paid,
Purchase of Local Goods and Services and Infrastructural Development over the period 1991–2000.Public Communications Department, OGML, Georgetown, Guyana.
Osgood, C. (1946) British Guiana Archaeology to 1945. Yale University Press, New Haven, Connecticut.Osgood, C. and Howard, G.D. (1943) An Archaeological Survey of Venezuela. Yale University Press, New
Haven, Connecticut.Palmer, C.J., Validum, L., Loeffke, B., Laubach, H.E., Mitchell, C., Cummings, R. and Cuadrado, R.R. (2002)
HIV prevalence in a gold mining camp in the Amazon region, Guyana. Emerging Infectious Diseases 8,330–331.
Palmer, J.R. (1986) Lessons for land managers in the tropics. Revue Bois et Forêts des Tropiques 212, 16–27.Parrotta, J.A. and Knowles, O.H. (1999) Restoration of tropical moist forests on bauxite-mined lands in the
Brazilian Amazon. Restoration Ecology 7, 103–116.Parrotta, J.A., Knowles, O.H. and Wunderle, J.M.J. (1997) Development of floristic diversity in 10-year-old
restoration forests on a bauxite mined site in Amazonia. Forest Ecology and Management 99, 21–42.Parsons, J.J. and Denevan, W.D. (1974) Pre-Columbian ridged fields. In: Zubrow, E.B.W., Fritz, M.C. and
Fritz, J.M. (eds) New World Archaeology: Theoretical and Cultural Transformations. WH Freeman andCo., San Francisco, California, pp. 240–248.
Penard, A.P. and Penard, T.E. (1917) Popular notions pertaining to primitive stone artifacts in Surinam. TheJournal of American Folk-Lore 30, 251–261.
Perera, M.A. (1971) Contribución al conocimiento de la espeleología histórica en Venezuela. Parte II. Laarqueología hipogea del Orinoco medio, Territorio Federal Amazonas. Boletín de la SociedadVenezolana de Espeleología 3, 151–163.
Perera, M.A. and Moreno, H. (1984) Pictografías y cerámica de dos localidades hipogeas en la penillanuradel norte, Territorio Federal Amazonas y Distrito Cedeño del Estado Bolivar. Boletín de la SociedadVenezolana de Espeleología 21, 21–32.
Perez, L., van Beek, F., Justice, G., Shah, S. and Zandamela, R. (1997) Recent Economic Developments andSelected Issues. IMF, Washington, DC.
Perry, L. (2002) Starch analyses reveal multiple functions of quartz ‘manioc’ grater flakes from the Orinocobasin, Venezuela. Interciencia 27, 635–639.
Persaud, S., Flynn, D. and Fox, B. (1999) Potential for wind generation on the Guyana coastlands. RenewableEnergy 18, 175–189.
Petitjean Roget, H. (1983) Evolution et décadence de l’art funéraire des sites pré et post-colombiens de labaie de l’Oyapock. Compte Rendu du IXéme CIECPPA, Santo Domingo, D.R. CRC, Université deMontréal.
Peyre, E. (1993) Nouvelle découverte d’un homme préhistorique américain: une femme de 9,700 ans auBrésil. Comptes Rendus de l’Académie des Sciences de Paris 316 (série II), 839–842.
Peyre, E., Guérin, C., Guidon, N. and Coppens, Y. (2000) Resultados da datação de dentes humanos da Tocado Garrincho, Piaui, Brésil. Anais da X Reunião Cientifica da SAB, Recife, Brazil, Universidade Federalde Pernambuco.
Pfeiffer, W.C., Drude de Lacerda, L., Salomons, W. and Malm, O. (1993) Environmental fate of mercury fromgold mining in the Brazilian Amazon. Environmental Review 1, 26–37.
Pinton, F. and Emperaire, L. (1992) L’extractivisme en Amazonie brésilienne: un système en crise d’identité.Cahiers de Sciences Humaines 28, 685–703.
Piperno, D. (1990) Fitolitos, arqueología y cambios prehistóricos de la vegetación en un lote de cincuentahectáreas de la isla de Barro Colorado. In: Leigh, E.G.J., Rand, A.S. and Windsor, D.M. (eds) Ecologíade un Bosque Tropical. STRI, Balboa, Panama, pp. 153–156.
Socio-economic Aspects of Forest Use 475

Piperno, D.R. (1994) Phytolith and charcoal evidence for prehistoric slash-and-burn agriculture in the Darienrain forest of Panama. The Holocene 4, 321–325.
Piperno, D.R. and Jones, J.G. (2003) Paleoecological and archaeological implications of a LatePleistocene/Early Holocene record of vegetation and climate from the Pacific coastal plain of Panama.Quaternary Research 59, 79–87.
Plew, M.G. (2002) A Report on an Archaeological Survey in the Iwokrama Mountains withRecommendations Regarding the Development of Protocols Relating to Archaeologcial Sites. IwokramaInternational Centre, Georgetown, Guyana.
Pollak, H., Mattos, M. and Uhl, C. (1995) A profile of palm heart extraction in the Amazon estuary. HumanEcology 23, 357–386.
Poonai, N.O. (1962) Archaeological sites on the Corentyne coast. Timehri 33, 52–53.Poonai, N.O. (1974) Recollections of a naturalist. Timehri 44, 31–44.Poonai, N.O. (1978) Stone age Guyana. Archaeology and Anthropology (W. Roth Museum – Guyana) 1,
5–23.Prous, A., Junqueira, P.A. and Malta, I.M. (1984) Arqueología do alto médio São Francisco – região de
Janúaria e Montalvânia. Revista de Arquelogia (Museu Paraense Emilio Goeldi) 2, 59–72.Puleston, D.E. (1982) The role of Ramón in Maya subsistence. In: Flannery, K.V. (ed.) Maya Subsistence.
Academic Press, New York, pp. 353–365.Purchas, S. (1906) Hakluytus Posthumus or Purchas his Pilgrimes, 6. James Maclehose and Sons, Glasgow,
UK.Putz, F.E. (1979) Biology and human use of Leopoldinia piassaba. Principes 23, 149–156.Queixalos, F. and Renault-Lescure, O. (2000) As Linguas Amazonicas Hoje. Instituto Socoiambiental, São
Pãulo.Raleigh, W. (1596) The Discoverie of the large, rich, and bewtiful empyre of Guiana, with a relation of the
great and golden citie of Manoa (which the Spanyards call El Dorado) and of the provinces of Emeria,Arromaia, Amapaia, and othe countries, with their rivers, adjoyning. Robert Robinson, London.
Reanier, R.E. (1997) Dating a paleoindian site in the Amazon in comparison with Clovis culture. Science275, 1948–1949.
Redmond, E.M. and Spencer, C.S. (1990) Investigaciones arqueologicas en el piedemonte y los llanos altosde Barinas, Venezuela. Boletin de la Asociacion Venezolana de Arqueologia 5, 4–24.
Redmond, E.M., Gassón, R.A. and Spencer, C.S. (1999) A macroregional view of cycling chiefdoms in thewestern Venezuelan llanos. In: Bacus, E. and Lucero, L. (eds) Complex Polities in the Ancient TropicalWorld. AAA, Arlington, Virginia, pp. 109–129.
Reichel-Dolmatoff, A. (1974) Un sistema de agricultura prehistórica de los Llanos Orientales. RevistaColombiana de Antropologia 17, 253–262.
Reichlen, H. and Reichlen, P. (1944) Contribution à l’archéologie de la Guyane française. Journal de laSociété des Américanistes 35, 1–24.
Reis, A.C.F. (1943) O Processo Histórico da Economia Amazonense. Editora Paralelo, Rio de Janeiro.Ricci, J.-P. (1989) Les pinotières. Revue Bois et Forêts des Tropiques 220 (spécial Guyane), 55–63.Richard, S., Arnoux, A., Cerdan, P., Reynouard, C. and Horeau, V. (2000) Mercury levels of soils, sediments
and fish in French Guiana, South America. Water, Air and Soil Pollution 124, 221–244.Richards, E.M. (1993) Commercialization of Non-timber Forest Products in Amazonia. NRI, Chatham, UK.Rivas, P. (1993) Estudio preliminar de los petroglifos de Punta Cedeño, Caicara del Orinoco, estado Bolivar.
In: Fernández, F. and Gassón, R.A. (eds) Contribuciones a la Arqueología Regional de Venezuela.Fondo Editorial Acta Científica, Caracas, pp. 165–196.
Riviére, P.G. (1969) Marriage Among the Trio, A Principle of Social Organisation. Oxford University Press,Oxford, UK.
Rodway, J. (1888) The gold industry in Guiana. Timehri 1, 75–96.Rodway, J. (1911) Our river names. Timehri 1, 53–56.Rodway, J. (1912) Guiana: British, Dutch and French. South American Series. T. Fisher Unwin, London.Rodway, J. (1919) Timehri or pictured rocks. Timehri 6, 1–11.Rollet, B. (1980) Jari: succès ou échec? Un exemple de développement agro-sylvo-pastoral et industriel en
Amazonie brésilienne. Bois et Forêts des Tropiques 192, 3–34.Roosevelt, A.C. (1980) Parmana. Prehistoric Maize and Manioc Subsistence Along the Amazon and Orinoco.
Academic Press, New York.Roosevelt, A.C. (1991a) Eighth millennium pottery from a prehistoric shell midden in the Brazilian Amazon.
Science 254, 1621–1624.
476 D.S. Hammond

Roosevelt, A.C. (1991b) Moundbuilders of the Amazon: Geophysical Archaeology on Marajo Island, Brazil.Academic Press, San Diego, California.
Roosevelt, A.C. (1995) Early pottery in Amazonia: twenty years of obscurity. In: Barnett, W. and Hoopes, J.(eds) The Emergence of Pottery. Smithsonian Institution Press, Washington, DC, pp. 115–132.
Roosevelt, A.C. (1998) Ancient and modern hunter-gatherers of lowland South America: an evolutionaryproblem. In: Balée, W. (ed.) Advances in Historical Ecology. Columbia University Press, New York, pp.190–212.
Roosevelt, A.C. (1999) Twelve thousand years of human–environment interaction in the Amazon floodplain. In:Padoch, C., Ayres, J.M., Pinedo-Vasquez, M. and Henderson, A. (eds) Várzea: Diversity, Development,and Conservation of Amazonia’s Whitewater Floodplains. NYBG, New York, pp. 371–392.
Roosevelt, A.C., Lima da Costa, M., Machado, C.L., Michab, M., Mercier, N., Vallada, H., Feathers, J.,Barnett, W., da Silveira, M.I., Henderson, A., Sliva, J., Chernoff, B., Reese, D.S., Holman, J.A., Toth, N.and Schick, K. (1996) Paleoindian cave dwellers in the Amazon: the peopling of the Americas. Science272, 373–384.
Rose, J.G. (1989) Runaways and Maroons in Guyana history. History Gazette (University of Guyana) 4, 1–14.Rostain, S. (1987) Roche gravées et assemblages de pierres en Guyane française. Equinox 24, 35–69.Rostain, S. (1994) L’occupation amerindienne ancienne du littoral de Guyane. Thèse de Doctorat. Universite
de Paris I-Pantheon/Sorbonne, Paris.Roth, W.E. (1924) An Introductory Study of the Arts, Crafts and Customs of the Guiana Indians. Annual
Report of the Bureau of American Ethnology, 38. Smithsonian Institution, Washington DC.Roth, W.E. (1929) Additions Studies of the Arts, Crafts and Customs of the Guiana Indians. Bulletin of the
Bureau of American Ethnology, 91. Smithsonian Institution, Washington DC.Roulet, M., Lucotte, M., Farella, N., Serique, G., Coelho, H., Sousa Passos, C.J., Jesus da Silva, E., Scavone
de Andrade, P., Mergler, D., Guimaraes, J.R.D. and Amorim, M. (1999) Effect of recent human colo-nization on the presence of mercury in Amazonian ecosystems. Water, Air and Soil Pollution 112,297–313.
Rouse, I. (1949) Petroglyphs. In: Steward, J.H. (ed.) Handbook of South American Indians, Vol. 5. US GPO,Washington, DC, pp. 493–502.
Rouse, I. and Cruxent, J. (1963) Venezuelan Archaeology. Caribbean Series, 6. Yale University Press,London.
Rowland, E.D. (1892) The census of British Guiana, 1891. Timehri 6, 40–68.Saldarriaga, J.G. (1994) Recuperación de la Selva de ‘Tierra Firme’ en el Alto Río Negro Amazonia
Colombiana–Venezolana. Estudios en la Amazonia Colombiana 5. Tropenbos Colombia Programme,Bogotá.
Sandweiss, D.H., McInnis, H., Burger, R.L., Cano, A., Ojeda, B., Paredes, R., del Carmen Sandweiss, M. andGlascock, M.D. (1998) Quebrada Jaguay: early South American maritime adaptations. Science 281,1830–1832.
Sanoja, M. and Vargas, I. (1983) New light on the prehistory of eastern Venezuela. Advances in WorldArchaeology 2, 205–244.
Santos, G.M., Bird, M.I., Parenti, F., Fifield, L.K., Guidon, N. and Hausladen, P.A. (2003) A revised chronol-ogy of the lowest occupation layer of the Pedra Furada rock shelte, Piauí, Brazil: the Pleistocene peo-pling of the Americas. Quaternary Science Reviews 22, 2303–2310.
Santos, G.M., Cordeiro, R.C., Silva Filho, E.V., Turcq, B., Lacerda, L.D., Fifield, L.K., Gomes, P.R.S.,Hausladen, P.A., Sifeddine, A. and Albuquerque, A.L.S. (2001) Chronology of the atmospheric mercuryin Lagoa da Pata basin, upper Rio Negro region of Brazilian Amazon. Radiocarbon 43, 801–808.
Santos, R. (1968) O equilíbrio da firma aviadora e a significação econômica institutional do aviamento. ParáDesenvolvimento 3, 7–30.
Schenk, C.J., Higley, D.K. and Magoon, L.B. (2000) Region 6 – Central and South America. In: USGS WorldEnergy Assessment Team (ed.), World Petroleum Assessment 2000. USGS, Washington, DC.
Schenk, C.J., Viger, R.J. and Anderson, C.P. (1999) Maps Showing Geology, Oil and Gas Fields and GeologicProvinces of South America. 97-470D. USGS, Denver, Colorado.
Schomburgk, R. (1836) Report of an expedition into the interior of British Guayana in 1835–1836. TheJournal of the Royal Geographic Society of London 6, 224–284.
Schomburgk, R.H. (1840) A Description of British Guiana. Simpkin, Marshall and Co., London.Schomburgk, R.H. (1848) Reisen in British Guiana den Jahren 1840–1844. J.J. Weber, Leipzig.Siemens, A.H. and Puleston, D.E. (1972) Ridge fields and associated features in southern Campeche: new
perspectives on lowland Maya. American Antiquity 37, 228–239.
Socio-economic Aspects of Forest Use 477
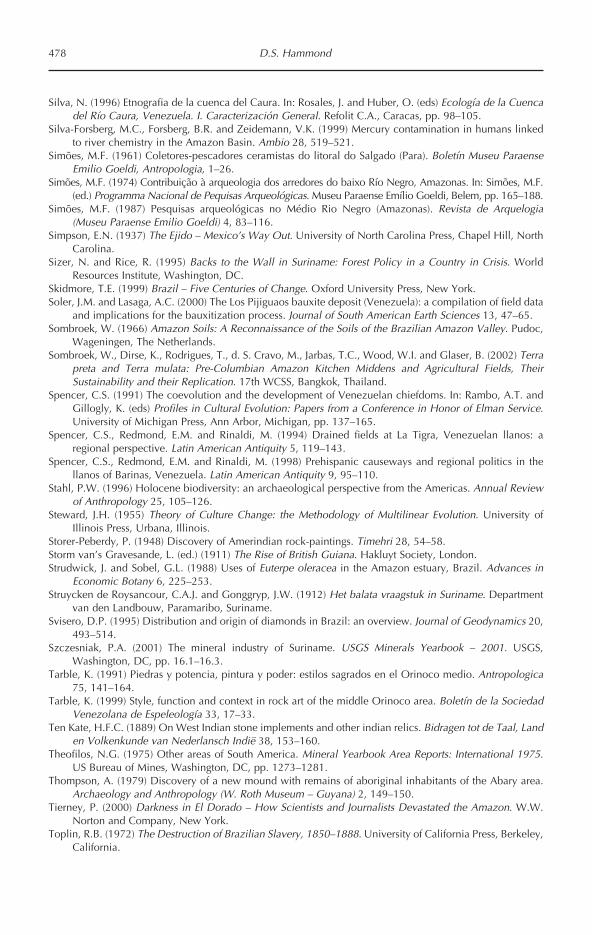
Silva, N. (1996) Etnografia de la cuenca del Caura. In: Rosales, J. and Huber, O. (eds) Ecología de la Cuencadel Río Caura, Venezuela. I. Caracterización General. Refolit C.A., Caracas, pp. 98–105.
Silva-Forsberg, M.C., Forsberg, B.R. and Zeidemann, V.K. (1999) Mercury contamination in humans linkedto river chemistry in the Amazon Basin. Ambio 28, 519–521.
Simões, M.F. (1961) Coletores-pescadores ceramistas do litoral do Salgado (Para). Boletín Museu ParaenseEmilio Goeldi, Antropologia, 1–26.
Simões, M.F. (1974) Contribuição à arqueologia dos arredores do baixo Río Negro, Amazonas. In: Simões, M.F.(ed.) Programma Nacional de Pequisas Arqueológicas. Museu Paraense Emílio Goeldi, Belem, pp. 165–188.
Simões, M.F. (1987) Pesquisas arqueológicas no Médio Rio Negro (Amazonas). Revista de Arquelogia(Museu Paraense Emilio Goeldi) 4, 83–116.
Simpson, E.N. (1937) The Ejido – Mexico’s Way Out. University of North Carolina Press, Chapel Hill, NorthCarolina.
Sizer, N. and Rice, R. (1995) Backs to the Wall in Suriname: Forest Policy in a Country in Crisis. WorldResources Institute, Washington, DC.
Skidmore, T.E. (1999) Brazil – Five Centuries of Change. Oxford University Press, New York.Soler, J.M. and Lasaga, A.C. (2000) The Los Pijiguaos bauxite deposit (Venezuela): a compilation of field data
and implications for the bauxitization process. Journal of South American Earth Sciences 13, 47–65.Sombroek, W. (1966) Amazon Soils: A Reconnaissance of the Soils of the Brazilian Amazon Valley. Pudoc,
Wageningen, The Netherlands.Sombroek, W., Dirse, K., Rodrigues, T., d. S. Cravo, M., Jarbas, T.C., Wood, W.I. and Glaser, B. (2002) Terra
preta and Terra mulata: Pre-Columbian Amazon Kitchen Middens and Agricultural Fields, TheirSustainability and their Replication. 17th WCSS, Bangkok, Thailand.
Spencer, C.S. (1991) The coevolution and the development of Venezuelan chiefdoms. In: Rambo, A.T. andGillogly, K. (eds) Profiles in Cultural Evolution: Papers from a Conference in Honor of Elman Service.University of Michigan Press, Ann Arbor, Michigan, pp. 137–165.
Spencer, C.S., Redmond, E.M. and Rinaldi, M. (1994) Drained fields at La Tigra, Venezuelan llanos: aregional perspective. Latin American Antiquity 5, 119–143.
Spencer, C.S., Redmond, E.M. and Rinaldi, M. (1998) Prehispanic causeways and regional politics in thellanos of Barinas, Venezuela. Latin American Antiquity 9, 95–110.
Stahl, P.W. (1996) Holocene biodiversity: an archaeological perspective from the Americas. Annual Reviewof Anthropology 25, 105–126.
Steward, J.H. (1955) Theory of Culture Change: the Methodology of Multilinear Evolution. University ofIllinois Press, Urbana, Illinois.
Storer-Peberdy, P. (1948) Discovery of Amerindian rock-paintings. Timehri 28, 54–58.Storm van’s Gravesande, L. (ed.) (1911) The Rise of British Guiana. Hakluyt Society, London.Strudwick, J. and Sobel, G.L. (1988) Uses of Euterpe oleracea in the Amazon estuary, Brazil. Advances in
Economic Botany 6, 225–253.Struycken de Roysancour, C.A.J. and Gonggryp, J.W. (1912) Het balata vraagstuk in Suriname. Department
van den Landbouw, Paramaribo, Suriname.Svisero, D.P. (1995) Distribution and origin of diamonds in Brazil: an overview. Journal of Geodynamics 20,
493–514.Szczesniak, P.A. (2001) The mineral industry of Suriname. USGS Minerals Yearbook – 2001. USGS,
Washington, DC, pp. 16.1–16.3.Tarble, K. (1991) Piedras y potencia, pintura y poder: estilos sagrados en el Orinoco medio. Antropologica
75, 141–164.Tarble, K. (1999) Style, function and context in rock art of the middle Orinoco area. Boletín de la Sociedad
Venezolana de Espeleología 33, 17–33.Ten Kate, H.F.C. (1889) On West Indian stone implements and other indian relics. Bidragen tot de Taal, Land
en Volkenkunde van Nederlansch Indië 38, 153–160.Theofilos, N.G. (1975) Other areas of South America. Mineral Yearbook Area Reports: International 1975.
US Bureau of Mines, Washington, DC, pp. 1273–1281.Thompson, A. (1979) Discovery of a new mound with remains of aboriginal inhabitants of the Abary area.
Archaeology and Anthropology (W. Roth Museum – Guyana) 2, 149–150.Tierney, P. (2000) Darkness in El Dorado – How Scientists and Journalists Devastated the Amazon. W.W.
Norton and Company, New York.Toplin, R.B. (1972) The Destruction of Brazilian Slavery, 1850–1888. University of California Press, Berkeley,
California.
478 D.S. Hammond
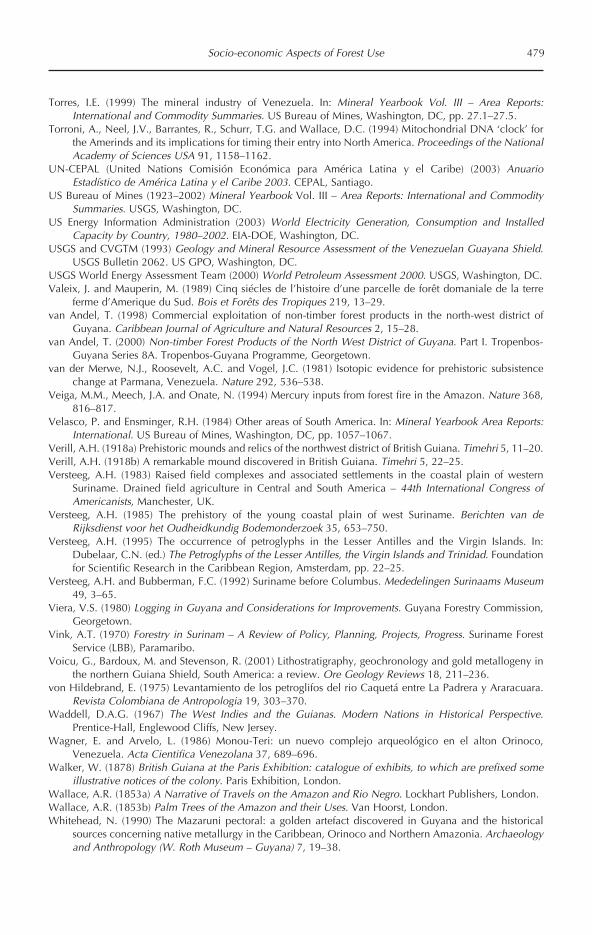
Torres, I.E. (1999) The mineral industry of Venezuela. In: Mineral Yearbook Vol. III – Area Reports:International and Commodity Summaries. US Bureau of Mines, Washington, DC, pp. 27.1–27.5.
Torroni, A., Neel, J.V., Barrantes, R., Schurr, T.G. and Wallace, D.C. (1994) Mitochondrial DNA ‘clock’ forthe Amerinds and its implications for timing their entry into North America. Proceedings of the NationalAcademy of Sciences USA 91, 1158–1162.
UN-CEPAL (United Nations Comisión Económica para América Latina y el Caribe) (2003) AnuarioEstadístico de América Latina y el Caribe 2003. CEPAL, Santiago.
US Bureau of Mines (1923–2002) Mineral Yearbook Vol. III – Area Reports: International and CommoditySummaries. USGS, Washington, DC.
US Energy Information Administration (2003) World Electricity Generation, Consumption and InstalledCapacity by Country, 1980–2002. EIA-DOE, Washington, DC.
USGS and CVGTM (1993) Geology and Mineral Resource Assessment of the Venezuelan Guayana Shield.USGS Bulletin 2062. US GPO, Washington, DC.
USGS World Energy Assessment Team (2000) World Petroleum Assessment 2000. USGS, Washington, DC.Valeix, J. and Mauperin, M. (1989) Cinq siécles de l’histoire d’une parcelle de forêt domaniale de la terre
ferme d’Amerique du Sud. Bois et Forêts des Tropiques 219, 13–29.van Andel, T. (1998) Commercial exploitation of non-timber forest products in the north-west district of
Guyana. Caribbean Journal of Agriculture and Natural Resources 2, 15–28.van Andel, T. (2000) Non-timber Forest Products of the North West District of Guyana. Part I. Tropenbos-
Guyana Series 8A. Tropenbos-Guyana Programme, Georgetown.van der Merwe, N.J., Roosevelt, A.C. and Vogel, J.C. (1981) Isotopic evidence for prehistoric subsistence
change at Parmana, Venezuela. Nature 292, 536–538.Veiga, M.M., Meech, J.A. and Onate, N. (1994) Mercury inputs from forest fire in the Amazon. Nature 368,
816–817.Velasco, P. and Ensminger, R.H. (1984) Other areas of South America. In: Mineral Yearbook Area Reports:
International. US Bureau of Mines, Washington, DC, pp. 1057–1067.Verill, A.H. (1918a) Prehistoric mounds and relics of the northwest district of British Guiana. Timehri 5, 11–20.Verill, A.H. (1918b) A remarkable mound discovered in British Guiana. Timehri 5, 22–25.Versteeg, A.H. (1983) Raised field complexes and associated settlements in the coastal plain of western
Suriname. Drained field agriculture in Central and South America – 44th International Congress ofAmericanists, Manchester, UK.
Versteeg, A.H. (1985) The prehistory of the young coastal plain of west Suriname. Berichten van deRijksdienst voor het Oudheidkundig Bodemonderzoek 35, 653–750.
Versteeg, A.H. (1995) The occurrence of petroglyphs in the Lesser Antilles and the Virgin Islands. In:Dubelaar, C.N. (ed.) The Petroglyphs of the Lesser Antilles, the Virgin Islands and Trinidad. Foundationfor Scientific Research in the Caribbean Region, Amsterdam, pp. 22–25.
Versteeg, A.H. and Bubberman, F.C. (1992) Suriname before Columbus. Mededelingen Surinaams Museum49, 3–65.
Viera, V.S. (1980) Logging in Guyana and Considerations for Improvements. Guyana Forestry Commission,Georgetown.
Vink, A.T. (1970) Forestry in Surinam – A Review of Policy, Planning, Projects, Progress. Suriname ForestService (LBB), Paramaribo.
Voicu, G., Bardoux, M. and Stevenson, R. (2001) Lithostratigraphy, geochronology and gold metallogeny inthe northern Guiana Shield, South America: a review. Ore Geology Reviews 18, 211–236.
von Hildebrand, E. (1975) Levantamiento de los petroglifos del rio Caquetá entre La Padrera y Araracuara.Revista Colombiana de Antropologia 19, 303–370.
Waddell, D.A.G. (1967) The West Indies and the Guianas. Modern Nations in Historical Perspective.Prentice-Hall, Englewood Cliffs, New Jersey.
Wagner, E. and Arvelo, L. (1986) Monou-Teri: un nuevo complejo arqueológico en el alton Orinoco,Venezuela. Acta Cientifica Venezolana 37, 689–696.
Walker, W. (1878) British Guiana at the Paris Exhibition: catalogue of exhibits, to which are prefixed someillustrative notices of the colony. Paris Exhibition, London.
Wallace, A.R. (1853a) A Narrative of Travels on the Amazon and Rio Negro. Lockhart Publishers, London.Wallace, A.R. (1853b) Palm Trees of the Amazon and their Uses. Van Hoorst, London.Whitehead, N. (1990) The Mazaruni pectoral: a golden artefact discovered in Guyana and the historical
sources concerning native metallurgy in the Caribbean, Orinoco and Northern Amazonia. Archaeologyand Anthropology (W. Roth Museum – Guyana) 7, 19–38.
Socio-economic Aspects of Forest Use 479
Whitehead, N.L. (1988) Lords of the Tiger Spirit – a History of the Caribs in Colonial Venezuela and Guyana1498–1820. Foris Publications, Dordrecht, The Netherlands.
Whitehead, N.L. (1997) The Discoverie of the Large, Rich, and Bewtiful Empyre of Guiana. ManchesterUniversity Press, Manchester, UK.
Whitlock, C. and Millspaugh, S.H. (1996) Testing the assumptions of fire-history studies: an examination ofmodern charcoal accumulation in Yellowstone National Park, USA. The Holocene 6, 7–15.
Williams, D. (1978a) A Mazaruni-type handaxe? Archaeology and Anthropology (W. Roth Museum –Guyana) 1, 32–33.
Williams, D. (1978b) Petroglyphs at Marlissa, Berbice river. Archaeology and Anthropology (W. RothMuseum – Guyana) 1, 24–31.
Williams, D. (1979a) Controlled resource exploitation in contrasting neotropical environments evidenced bymeso-indian petroglyphs in southern Guyana. Archaeology and Anthropology (W. Roth Museum –Guyana) 2, 141–148.
Williams, D. (1979b) Preceramic fishtraps on the upper Essequibo: a survey of unusual petroglyphs on theupper Essequibo and Kassikaityu rivers, 12–28 March 1979. Archaeology and Anthropology (W. RothMuseum – Guyana) 2, 141–148.
Williams, D. (1979c) A report on preceramic lithic artifacts in the south Rupununi savannas. Archaeologyand Anthropology (W. Roth Museum – Guyana) 2, 10–53.
Williams, D. (1981a) Excavation of the Barabina shell mound, North West District: an interim report.Archaeology and Anthropology (W. Roth Museum – Guyana) 2, 125–140.
Williams, D. (1981b) Three sites of the Taruma phase in southeast and east Guyana. Archaeology andAnthropology (W. Roth Museum – Guyana) 4, 81–103.
Williams, D. (1993) The forms of the shamanic sign in the prehistoric Guianas. Archaeology andAnthropology (W. Roth Museum – Guyana) 9, 3–21.
Williams, D. (1994) Annex C. Archaeology and Anthropology. Environmental Impact Assessment – theLinden Lethem Road. ERM, Georgetown.
Williams, D. (1996a) The origin, characterization and chronology of the Mabaruma subseries of the barran-coid tradition. Archaeology and Anthropology (W. Roth Museum – Guyana) 11, 3–53.
Williams, D. (1996b) Prehistoric Cultures of the Iwokrama Rain Forest. GNRA, Georgetown, Guyana.Williams, D. (1998) The archaic colonization of the Western Guiana Littoral and its aftermath. Archaeology
and Anthropology (W. Roth Museum – Guyana) 12, 22–41.Williams, L. (1939) Maderas Economicas de Venezuela. Ministerio de Agricultura y Cria, Caracas.Williams, M. (1989) Americans and their Forests. Cambridge University Press, Cambridge.Wood, W.I. and Mann, C.C. (2000) Earthmovers of the Amazon. Science 287, 786–789.Wood, W.I. and McCann, J.M. (1999) The anthropogenic origin and persistence of Amazonian dark earths.
Yearbook of the Conference of Latin American Geographers 25, 7–14.World Bank (2001) World Bank Development Indicators database. World Bank, Washington, DC.Zegura, S.L., Karafet, T.M., Zhivotovsky, L.A. and Hammer, M.F. (2004) High resolution SNPs and
microsatellite haplotypes point to a single, recent entry of Native American Y chromosomes into theAmericas. Molecular Biology and Evolution 21, 164–175.
Zonzon, J. and Prost, G. (1996) Histoire de la Guyane. Maison Neuve and Larose, Paris.Zucchi, A. (1972) La prehistoria de los llanos occidentales: investigaciones recientes. Acta Cientifica
Venezolana 23, 185–187.Zucchi, A. (1973) Prehistoric human occupations of the western Venezuelan llanos. American Antiquity 38,
182–190.Zucchi, A. (1978) La variabilidad ecologica y la intensificacion de la agricultura en los llanos venezolanos.
In: Wagner, E. and Zucchi, A. (eds) Unidad y Variedad Ensayos en Homenaje al Dr. J.M. Cruxent. IVIC-CEA, Caracas, pp. 349–374.
Zucchi, A. (1984) Alternative interpretations of pre-Columbian water management in the western llanos ofVenezuela. Indiana 9, 309–327.
Zucchi, A. (1985) Recent evidence for pre-Columbian water management systems in the western llanos ofVenezuela. In: Farrington, I.S. (ed.) Prehistoric Intensive Agriculture in the Tropics. Oxford UniversityPress, Oxford, UK, pp. 167–180.
Zucchi, A. (1991) El Negro–Casiquiare–Alto Orinoco como ruta conectiva entre el Amazonas y el Norte deSuramerica. Comptes rendus du XII, AIAC, Cayenne.
Zucchi, A., Tarble, K. and Vaz, J. (1984) The ceramic sequence and new TL and C14 dates for the Agüeritosite of the middle Orinoco. Journal of Field Archaeology 11, 155–180.
480 D.S. Hammond
Exposed Precambrian Landscapes – aPretext for Caution
More than 550 million years of weathering,with few or no major diastrophic events,can take its toll on the roots of landscapecarrying capacities. Most available informa-tion for the Guiana Shield converges alonga central theme – ancient surface geologycreates difficult conditions for human soci-eties. These difficult conditions are not cre-ated as a result of catastrophic impactscommonly associated with risk and calami-tous loss, such as volcanic eruptions, earth-quakes, hurricanes and landslides. Rather,it is their absence that created conditionschallenging early human society and itsadvance towards more sedentary and per-manent lifestyles.
The nexus of debate concerning theprehistory of human settlement across theAmazon in many ways reflects the transi-tion across geomorphographic regions.Accrued artefactual evidence supportingcomplex social units and long-term inhabi-tation in the lowland neotropics is drawnalmost exclusively from ramping systemregions (see ‘Ramping and dampening sys-tems’, Chapter 7), while depictions of pre-Columbian lowland forest inhabitants assmall bands of para-nomadic wanderersappears to have been strongly shaped byevidence derived from dampening systems
typified by Precambrian shield interiors(see Chapters 7 and 8). Hence, it is notunreasonable to state that existing archaeo-logical evidence points to a ‘ring of earlylowland civilization’ encircling the GuianaShield along the major sedimentary basinsseparating it from the Andean highlandsand other shield regions south of the equa-tor (see ‘Human Prehistory of the GuianaShield’, Chapter 8). Ceramic evidence iswidely distributed across the region, butmost submitted dates for those located inthe interior are of more recent, even Indo-Hispanic ages (see ‘Material types: ceram-ics’, Chapter 8). Together, this reflects onthe existing debate over levels and limits onpre-Columbian, lowland cultural develop-ment and sophistication in one importantway. It suggests that the upland terra firmeforest regions may have exerted a relativelypronounced limiting effect on human socialstructures, but that this was likely conse-quent, not parallel, to the development ofsophisticated, sedentary social centres inthe main sedimentary depressions acrossthe neotropics. Evidence also indicates thatlonger-term occupation of the shield inte-rior, and its more difficult environmentalconditions, occurred as groups fled inter-tribal or inter-clan conflict and later, thesweeping spread of colonizing Europe.Thus, historical anthropological characteri-zations post-AD 1500 probably reflected
481© CAB International 2005. Tropical Forests of the Guiana Shield (ed. D.S. Hammond)
9 Forest Conservation and Management inthe Guiana Shield
David S. HammondIwokrama International Centre for Rain Forest Conservation and Development,Georgetown, Guyana. Currently: NWFS Consulting, Beaverton, Oregon, USA

upon only a very small remnant of the cul-tural depth and complexity of lowland soci-eties that existed along the shield perimetermore than 600 years ago.
Globally, most known centres of earlysedentary human civilization are alsonoticeably absent from the Precambrianshield regions of the world, having estab-lished instead in the more suitablePhanerozoic sedimentary basins or moun-tainous landscapes. In the adjacentBrazilian Shield region, putative pre-Clovisartefacts have been discovered principallyalong the scattered Palaeozoic sedimentarycliffs delimiting the São Francisco water-shed, not in the heart of the adjoiningshield region (see Fig. 8.1). During the laterNeo-Indian period, signs of advancedAmerindian civilization are best knownfrom the raised field complexes of sedi-ment-filled wetlands, the Llanos de Mojosof Bolivia (Denevan, 1970), Llanos deBarinas of Venezuela (Spencer et al., 1998)and the sedimentary coasts along theAtlantic (see ‘Site types – earth engineer-ing’, Chapter 8). But was such a vast areaimmune from advanced human coloniza-tion because of a simple contrast betweensoil productivity conditions attached toterra firme and varzea forests? Probably not.Tropical forests in Precambrian landscapesmay have been less susceptible to earlyhuman colonization for a number of rea-sons, of which soil fertility counts impor-tantly. However, not all factors limitinghuman colonization across shield regionsare immediately attached to a general, buthopefully dwindling (Moran, 1995), mis-conception of uniform upland soil infertil-ity across the lowland tropics (Meggers,1996).
Soil fertility
Soil fertility throughout the wet tropics is,however, relatively low in comparison todrier or colder regions of the planet due tomuch higher acidity and chemical weather-ing rates, but relevant differences in soilnutrient content exist across geomorpho-graphic regions (see ‘Soils and soil fertility’,
Chapter 2). In part, this is due to a muchhigher fraction of area affected by high-energy fluvial systems, hurricanes, volcanicejecta and landslips across ramping systemregions, such as Central America and west-ern Amazon (Räsänen et al., 1987; Kalliolaet al., 1999) compared to shield regions.However, highly infertile and relatively fer-tile soil facies can be found across allregions. The difference is met when consid-ering the relative distribution of faciesacross the fertility spectrum. In this case,soils of the Guiana Shield are highly right-skewed towards uniformly low nutrient sta-tus, relative to other regions (see Fig. 2.15).Even floodplain soils offer relatively fewerincremental gains in soil fertility, in contrastto the well-established differences betweenvarzea soils and adjacent areas of terra firmein the downwarp and sub-Andean sedimen-tary basins, as well as across parts of CentralAmerica (see Fig. 2.12).
Acidity
From a hydrochemical perspective, theAmazon basin is a very large, spatiallyanisotropic, acid–base titration. Acidity isregulated westward by the relatively cold,alkaline base-rich contribution of theAndean slopes, but on average becomesincreasingly acidic eastward across thelowlands, particularly in the Precambrianshield regions (see Chapter 2). A large partof this change-over comes with the durationof exposure to much higher temperatures inthe lowlands. The interesting prospect oflower ambient temperatures across the LastGlacial Maximum (Liu and Colinvaux,1985; Colinvaux et al., 1996) (also see‘Prehistoric climates of the Guiana Shield’,Chapter 2) would suggest that these acidity-buffering contributions would be sustainedin much higher concentrations furtherdownstream during colder phases, creatingwith it expanded zones of more modestacidity and higher soil fertility across west-ern Amazon and the downwarp.Anticipating this type of extension acrossmost of the eastern shield regions wouldappear much less plausible.
482 D.S. Hammond

The southward location of theBrazilian Shield creates a drier seasonalenvironment that modulates to some extentthe impacts of high rainfall on acidityunder closed-forest conditions.Development of the Amazon Downwarpsurfaces from Andean-derived materialsalso assists in buffering these areas againsthigh acidity that is both spatially wide-spread and persistently low across theGuiana Shield. Similarly, across manyregions of Central America and theCaribbean, more seasonal climate combinedwith contemporary weathering of wide-ranging clastic, chemical (e.g. oolitic lime-stones) and organic-based (e.g. fossiliferouslimestones) sedimentary features work tocounter widespread tropical acidity.
Prospects for long-term, prehistoricoccupation at the centre of neotropical ter-restrial acidity, the interior Guiana Shield,would seem counterintuitive when moreamenable environments exist along theperiphery. Acidity is not only linked to ter-restrial productivity through regulation ofavailable phosphorus and the concentrationof heavy-metal concentrations that can cre-ate further physiological challenges to plantsurvival and growth (see Chapter 3). It alsoregulates aquatic productivity and struc-tures the trophic assemblage of primaryproducers, consumers and predators.
Aquatic productivity is arguably themost important determinant of long-termhuman occupation in tropical environ-ments. As the main source of protein, fishplay a pivotal role in sustaining subsistenceand buffering more tenuous productivitiesattached to upland tropical soils. Across thevarzea regions of the Amazon and its majortributaries, high aquatic productivity is theone attribute that distinguishes these areasfrom others. Perhaps only the presence ofengineered earth in the form of terra pretastrikes equivalence with relative fertility ofthe varzea across the eastern Amazon. Yet,these too appear largely restricted to thePhanerozoic sediment cover of the AmazonDownwarp and Atlantic rim of the GuianaShield see (Fig. 8.2).
Across the Guiana Shield, varzea-likefeatures are also largely restricted to the
periphery. In the interior, they are virtuallyabsent, being replaced by some of the mostacidic fluvial systems known from the trop-ics. Combined with high humic acid con-tents in many rivers, acidity and lowoxygenation causes aquatic productivity toplummet and with it the carrying capacitiesit may have offered to sedentary, prehis-toric societies (see ‘River, lake and tidal sys-tems’, Chapter 2). Only near the turbulencecreated by rock features cross-cutting riverchannels is productivity believed toincrease significantly. These ‘falls’ mayhave provided the greatest opportunities forlong-term occupation in an environmentotherwise disfavouring sedentarism.
Access
Perhaps of equal or greater importance isthe likelihood that forest-coveredPrecambrian areas posed more substantialchallenges to early settlers due to difficul-ties in access. Across the lowland neotrop-ics, people have traditionally traded,migrated and communicated along rivers.Yet, rivers draining shield regions becomesome of the most difficult to navigate assedimentary cover thins and exposedProterozoic structures create tremendousbarriers to movement. The role of the ‘falls’has been one of historically curtailing morerapid use of resources in the Guiana Shieldinterior and concentrating developmentalong the margins (e.g. McTurk, 1882; ImThurn, 1883; Goulding et al., 1988).
Control
Yet, today those same barriers are increas-ingly proving surmountable. Road con-struction and an expanding network ofaerodromes is increasingly connecting theshield interior and perimeter and with this,both the prospects and problems of modernforestland use. Improved and expandedaccess to the interior forested regions of theGuiana Shield has brought forest fire igni-tion sources (e.g. Hammond and ter Steege,1998), an upsurge in unregulated hunters
Forest Conservation and Management 483

and wildlife collectors, illicit smugglers,socially transmitted diseases (e.g. Palmer etal., 2002), pollution (see Chapter 8),cultural transformation and social upheavalto regions previously insulated from thewidespread effects of frontier naturalresource use by the constraints on rivernavigability.
Isolation
From many perspectives, the Precambriangeology of the Guiana Shield has been iso-lating. Whether viewed as isolation fromthe sediments of the Andes, from the fertil-ity of the varzea, through the geo-logical control on river navigability or fromthe sociocultural complexity thatappears to have and continues to typifythe shield perimeter, the Guiana Shieldinterior appears as an isolating environ-ment. It is precisely this long-standing iso-lation that characterizes the relativelyhigher risk attached to uncontrolled andpoorly managed forestland use in theGuiana Shield compared to other regionsarguably more strongly shaped by prehis-toric human occupation and catastrophicevents.
Modern forest cover and deforestation rates
Perhaps as a consequence of these factors,even today deforestation rates and forestarea coverages remain some of the lowestand highest in the world, forming a signifi-cant and growing part of the standing trop-ical forest area in South America and theworld (Table 9.1). As deforestation trendscontinue elsewhere, the Guiana Shield willincreasingly represent a greater share of theremaining closed forest cover, unless land-use practices and patterns change dramati-cally.
The purpose of this chapter is to reviewand synthesize available information on theconservation and management of the shieldregion. It characterizes the history, effortand modern approaches to habitat protec-tion in the region and offers a view on land-
scape-scale conservation gaps based on thissynthesis. The chapter also provides a briefoverview of approaches assessed andemployed in the quest for sustainable forestmanagement, including reduced impactlogging techniques, extractive reserves andconcession and community-based manage-ment. It explores some of the key challengesin achieving adequate conservation andhabitat protection across the region andthose facing efforts to sustainably utilizevarious forest resources towards furthereconomic development. The chapter con-cludes with a perspective on forest manage-ment that highlights briefly how lack ofindividual opportunity and a mismatch ofobjectives with biophysical processes canlimit success in achieving sustainable man-agement.
Conservation Patterns and Approaches
Areas designated for forest protection
The Guiana Shield contains a world-classsystem of protected areas that has grownfrom one of the first areas officially desig-nated for protection in South America(Kaieteur National Park, Guyana in 1929)through to the largest protected area everestablished in the neotropics in 2002(Tumucumaque National Park, Brazil)(Table 9.2). The region boasts three majorWorld Heritage Sites, including the CentralSuriname Reserve (designated 2000), theCentral Amazon Conservation Complex1 inBrazil (2003) and the oldest, CanaimaNational Park in eastern Venezuela (1994).Three coastal areas have also been desig-nated as Wetlands of InternationalImportance (Ramsar), two at Basse-Mana(established 1993) and Les Marais de Kaw(1993) along the French Guiana coast andanother covering the tropical mangrove sys-tem at Coppenamemonding in Surinamesince 1985.
The rate of growth in area allocated toprotection in the Guiana Shield hasmatched or exceeded the accrual rate glob-ally (Fig. 9.1). The establishment of newprotected areas around the world has
484 D.S. Hammond

Forest Conservation and M
anagement
485
Table 9.1. General status of tropical forest cover in the Guiana Shield in relation to continental and global standing area. Source: Land and total forest area –FAO (2000); land area in Guiana Shield – OCEI/MARNR (2000), IBGE (2000), FAO (2000); tropical forest area in Guiana Shield – FAO (2000), except Venezuelabased on Huber (1995) and Brazil based on IBGE municipio estimates.
Land Area (km2) Intact Forest Area (km2) Deforestation (%)Total in GS Total Tropical Tropical in GS 1990–2000
French Guiana 88,150 88,150 79,260 29,260 79,260 –Suriname 156,000 156,000 141,130 141,130 141,130 –Guyana 214,980 214,980 168,790 163,726 163,726 2.8Venezuela 882,060 453,950 495,060 346,542 287,630 4.2Brazil 8,456,510 1,204,279 5,439,050 4,133,678 945,573 4.1Colombia 1,038,710 170,500 490,601 412,105 170,500 3.7
Guiana Shield 10,836,410 2,287,859 6,813,891 1,342,246South America 17,547,510 8,856,180 5,490,832 26.9%
World 148,000,000 38,694,550 10,060,583 13.2%
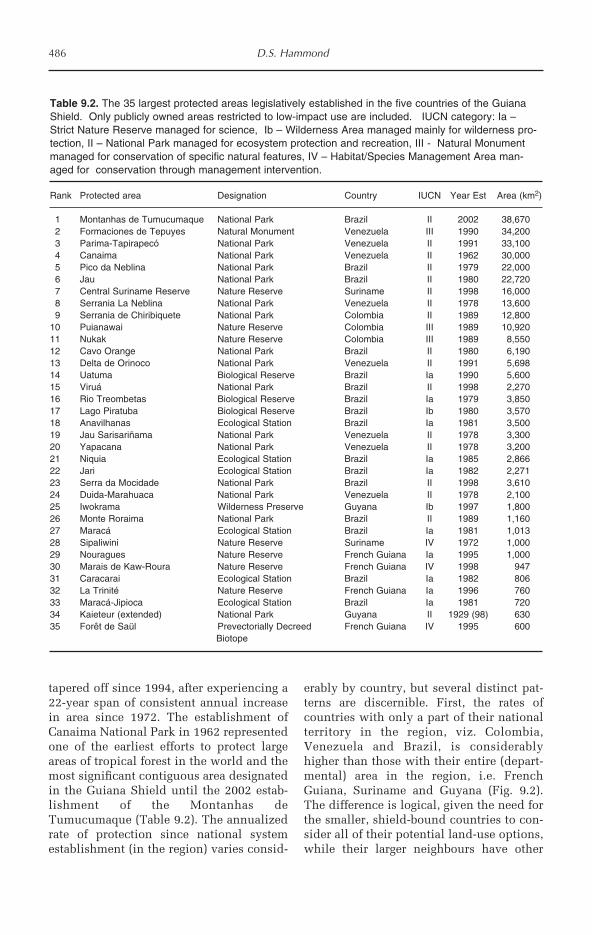
tapered off since 1994, after experiencing a22-year span of consistent annual increasein area since 1972. The establishment ofCanaima National Park in 1962 representedone of the earliest efforts to protect largeareas of tropical forest in the world and themost significant contiguous area designatedin the Guiana Shield until the 2002 estab-lishment of the Montanhas deTumucumaque (Table 9.2). The annualizedrate of protection since national systemestablishment (in the region) varies consid-
erably by country, but several distinct pat-terns are discernible. First, the rates ofcountries with only a part of their nationalterritory in the region, viz. Colombia,Venezuela and Brazil, is considerablyhigher than those with their entire (depart-mental) area in the region, i.e. FrenchGuiana, Suriname and Guyana (Fig. 9.2).The difference is logical, given the need forthe smaller, shield-bound countries to con-sider all of their potential land-use options,while their larger neighbours have other
486 D.S. Hammond
Table 9.2. The 35 largest protected areas legislatively established in the five countries of the GuianaShield. Only publicly owned areas restricted to low-impact use are included. IUCN category: Ia –Strict Nature Reserve managed for science, Ib – Wilderness Area managed mainly for wilderness pro-tection, II – National Park managed for ecosystem protection and recreation, III - Natural Monumentmanaged for conservation of specific natural features, IV – Habitat/Species Management Area man-aged for conservation through management intervention.
Rank Protected area Designation Country IUCN Year Est Area (km2)
1 Montanhas de Tumucumaque National Park Brazil II 2002 38,6702 Formaciones de Tepuyes Natural Monument Venezuela III 1990 34,2003 Parima-Tapirapecó National Park Venezuela II 1991 33,1004 Canaima National Park Venezuela II 1962 30,0005 Pico da Neblina National Park Brazil II 1979 22,0006 Jau National Park Brazil II 1980 22,7207 Central Suriname Reserve Nature Reserve Suriname II 1998 16,0008 Serrania La Neblina National Park Venezuela II 1978 13,6009 Serrania de Chiribiquete National Park Colombia II 1989 12,800
10 Puianawai Nature Reserve Colombia III 1989 10,92011 Nukak Nature Reserve Colombia III 1989 8,55012 Cavo Orange National Park Brazil II 1980 6,19013 Delta de Orinoco National Park Venezuela II 1991 5,69814 Uatuma Biological Reserve Brazil Ia 1990 5,60015 Viruá National Park Brazil II 1998 2,27016 Rio Treombetas Biological Reserve Brazil Ia 1979 3,85017 Lago Piratuba Biological Reserve Brazil Ib 1980 3,57018 Anavilhanas Ecological Station Brazil Ia 1981 3,50019 Jau Sarisariñama National Park Venezuela II 1978 3,30020 Yapacana National Park Venezuela II 1978 3,20021 Niquia Ecological Station Brazil Ia 1985 2,86622 Jari Ecological Station Brazil Ia 1982 2,27123 Serra da Mocidade National Park Brazil II 1998 3,61024 Duida-Marahuaca National Park Venezuela II 1978 2,10025 Iwokrama Wilderness Preserve Guyana Ib 1997 1,80026 Monte Roraima National Park Brazil II 1989 1,16027 Maracá Ecological Station Brazil Ia 1981 1,01328 Sipaliwini Nature Reserve Suriname IV 1972 1,00029 Nouragues Nature Reserve French Guiana Ia 1995 1,00030 Marais de Kaw-Roura Nature Reserve French Guiana IV 1998 94731 Caracarai Ecological Station Brazil Ia 1982 80632 La Trinité Nature Reserve French Guiana Ia 1996 76033 Maracá-Jipioca Ecological Station Brazil Ia 1981 72034 Kaieteur (extended) National Park Guyana II 1929 (98) 63035 Forêt de Saül Prevectorially Decreed French Guiana IV 1995 600
Biotope
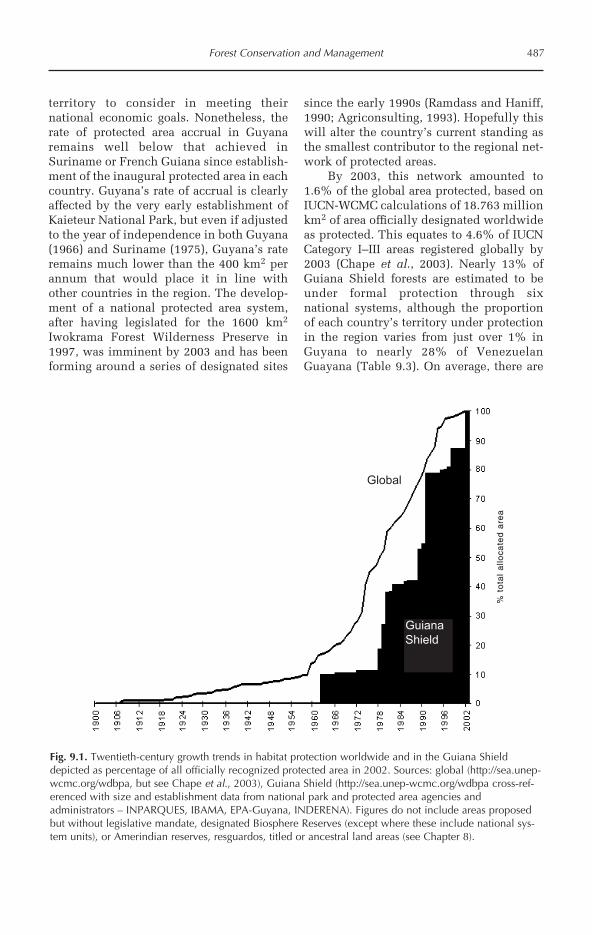
territory to consider in meeting theirnational economic goals. Nonetheless, therate of protected area accrual in Guyanaremains well below that achieved inSuriname or French Guiana since establish-ment of the inaugural protected area in eachcountry. Guyana’s rate of accrual is clearlyaffected by the very early establishment ofKaieteur National Park, but even if adjustedto the year of independence in both Guyana(1966) and Suriname (1975), Guyana’s rateremains much lower than the 400 km2 perannum that would place it in line withother countries in the region. The develop-ment of a national protected area system,after having legislated for the 1600 km2
Iwokrama Forest Wilderness Preserve in1997, was imminent by 2003 and has beenforming around a series of designated sites
since the early 1990s (Ramdass and Haniff,1990; Agriconsulting, 1993). Hopefully thiswill alter the country’s current standing asthe smallest contributor to the regional net-work of protected areas.
By 2003, this network amounted to1.6% of the global area protected, based onIUCN-WCMC calculations of 18.763 millionkm2 of area officially designated worldwideas protected. This equates to 4.6% of IUCNCategory I–III areas registered globally by2003 (Chape et al., 2003). Nearly 13% ofGuiana Shield forests are estimated to beunder formal protection through sixnational systems, although the proportionof each country’s territory under protectionin the region varies from just over 1% inGuyana to nearly 28% of VenezuelanGuayana (Table 9.3). On average, there are
Forest Conservation and Management 487
Fig. 9.1. Twentieth-century growth trends in habitat protection worldwide and in the Guiana Shielddepicted as percentage of all officially recognized protected area in 2002. Sources: global (http://sea.unep-wcmc.org/wdbpa, but see Chape et al., 2003), Guiana Shield (http://sea.unep-wcmc.org/wdbpa cross-ref-erenced with size and establishment data from national park and protected area agencies andadministrators – INPARQUES, IBAMA, EPA-Guyana, INDERENA). Figures do not include areas proposedbut without legislative mandate, designated Biosphere Reserves (except where these include national sys-tem units), or Amerindian reserves, resguardos, titled or ancestral land areas (see Chapter 8).
% t
ota
l a
lloca
ted
are
a%
to
tal
allo
cate
d a
rea
Global
GuianaShield

nearly 7.5 ha of forest under protection forevery person living in the shield region,based on 2000 population estimates (Table9.3).
The nearly 290,000 km2 (almost thesize of Guyana and French Guiana com-bined) of protected area already establishedacross the region covers an estimated12.3% of tropical humid forest area remain-ing globally (Chape et al., 2003). This is asubstantial figure and likely to rise whenprocesses in Guyana and French Guianalead to the formal expansion of theirnational (departmental) systems of protec-tion that currently lag other regional com-mitments (Table 9.3). At the same timetropical wet forest area elsewhere continuesto decline at a faster pace, pushing upwardseven further the fractional contribution ofGuiana Shield areas to global protection ofthis general forest biome.
The vast area under protection withinthe shield is distributed over 51 distinctunits exceeding 10 km2 (35 largest in Table9.1) (Fig. 9.3). Numerous units with an arealess than 10 km2 also contribute to forestprotection and research under systems ofecological reserves established directly bynational forestry services or as part ofrequired management planning in timber
concessions (e.g. biological reserves in tim-ber concessions, Guyana). Of course, sim-ple measures of proportional forest areareceiving legal protection do not adequatelyaddress whether the spatial distribution ofprotected area: (i) captures the main fea-tures of the forest landscape; (ii) is likely toretain long-term conservation value; or (iii)is functionally performing according to theconservation objectives established throughlegislative mandate. It does, however, iden-tify a continuing commitment to forest pro-tection in the region that exceeds thattypically encountered in most other regionsof the world.
Landscape conservation assessments
Several large global conservation and envir-onmental organizations have increasinglytaken on the self-designated task of assess-ing and classifying the terrestrial andmarine regions of the planet according totheir conservation value, immediacy of thethreats confronting their persistence andpriorities for investment in their protection.The Guiana Shield has formed part of thearea assessed through these approaches.The results and relevance of these global
488 D.S. Hammond
10
100
1000
10000
10,000 100,000 1,000,000 10,000,000
Land area in Guiana Shield (km2)
Annualiz
ed r
ate
of pro
tection (
km
2/
yr
)
Guyana
Suriname
French Guiana
Brazil Venezuela
Colombia
Fig. 9.2. Relationship between rate of area protection (log10) and total area (log10) within Guiana Shieldfor each of the six countries forming the region since inception of their respective protected area systems.
Land area in Guiana Shield (km2)

Forest Conservation and M
anagement
489
Table 9.3. General status of habitat protection in the Guiana Shield.
Venezuela Colombia Guyana Brazil Suriname French Guiana Guiana Shield
Total area in GS (km2) 453,950 170,500 214,980 1,204,279 156,000 88,150 2,287,859Population (yr 2000) 1,544,915 53,650 697,286 1,041,595 431,303 157,213 3,925,962Total PA (km2) 125,243 32,270 2594 120,816 16,359 4970 302,252% of GS area in PAs 27.6 18.9 1.2 10.0 10.5 5.6 13.2Year initial PA established 1962 1989 1929 1979 1961 1989Protected area per person (ha) 8.1 60.1 0.4 10.4 3.8 3.2 7.4

initiatives to shield features are summa-rized here.
Ecoregions
Olson et al. (2001) fractionated the plane-tary terrestrial surface area into 867 eco-regions based on a combination oflandforms, vegetation types and variationin ecological processes.2
As part of this global classification sys-tem, the Guiana Shield is dissected into 14ecoregions, the seven largest being endemic
to the shield area (as defined in this vol-ume) (Fig. 9.4). The four largest ecoregionseffectively dissect the shield area into quad-rants that embrace an archipelago formedfrom the three smaller, edaphic-basedunits. Other smaller units largely reflectvariation in coastal vegetation between theOrinoco delta and Amazon mouth andalong the upper Orinoco, Solimões and RioNegro.
While savanna, campinarana and tepuiformations define distinct, often abrupt,edaphic transitions, the four larger eco-
490 D.S. Hammond
Orinoco
Amazon
Negro
Orinoco
Amazon
Negro
1
2
3
4
5
6
7
8 9
10 11
12
13
14
15
16
20
18
19
21
33 31
23
25
26 32
27
2
29
30 34
22
24
15
Equator
Fig. 9.3. Spatial distribution of official protected area (solid black) across the Guiana Shield and widerneotropics (inset). Numbered units are consistent with rank in Table 9.2. Designated Biosphere Reservesextending beyond boundaries of protected areas (right diagonal hatching) and proposed conservation unitsin Guyana (left diagonal hatching) are also presented. Forest cover is solid grey. Spatial data sources:Brazil: IBAMA; Venezuela: INPARQUES and WCPA/WCMC; Guyana: Iwokrama, CI-Guyana, EPA;Suriname: CELOS; French Guiana and Colombia: WCPA/WCMC.

regions cover more territory and embraceconsiderably greater spatial variation in for-est composition. Forest-type classificationsin Guyana and the Guianas comprehen-sively analysed by ter Steege (1998) and terSteege and Zondervan (2000) more coher-ently delimit compositional transitions thatare not consistent with margins of theGuiana Moist Forest ecoregion. This dis-crepancy can for the most part be attributedto geology. Transitions between areas ofexposed crystalline basement dominated byTATE granitoids, greenstone belts andPhanerozoic sands (of the BerbiceFormation) (see ‘Greenstone belts’, Chapter2) provide a spatial delimiter of forest typeassociations that dissect Olson et al.’s
region into at least three distinct ecoregions(dashed lines in GMF ecoregion of Fig. 9.4).The Guayana Highland ecoregional area isconsistent with geological transitions asso-ciated with distributions of Roraima sedi-mentaries, Uatuma volcanics and Parguazagranites that dominate VenezuelanGuayana, although east to west precipita-tion gradients associated with the SavannaTrough are not fully delimited. The changefrom this unit to the adjacent Negro-BrancoMoist Forest unit overlying the CasiquiareRift reflects an important landscape foresttransition. Perhaps more importantly, thegeology also spatially defines the largestand growing threat to forest integrity andfunction: unregulated mining.
Forest Conservation and Management 491
Fig. 9.4. Seven major ecoregions unique to the Guiana Shield (after Olson et al., 2001). GMF: Guiananmoist forests; U-T MF: Uatuma-Trombetas moist forests; GS: Guyanan savannas; GH: Guayanan highlandsmoist forest; T: Tepuis; RNC: Rio Negro campinarana; J-S-N MF: Japurá-Solimões-Negro moist forest.Ecoregion spatial coverage: WWF-USA. Thick line demarcates southern boundary of Berbice Formation, aunique ecoregion candidate currently subsumed within the GMF.

Forest frontiers
A four-point classification of frontier forestthreat status by Bryant et al. (1997) identi-fies forests under medium or high threat ofdegradation along most of the perimeterarea of the Guiana Shield (Fig. 9.5A). Threecore areas of low threat were assigned to themain upland ‘islands’ forming the GuianaShield, i.e. the Tumucumaque Uplands,Guayana Highlands and ChiribiquetePlateau (and eastern Colombian lowlands)(see ‘Shield macro-features’, Chapter 2).The distribution of threat magnitudeassigned by Bryant et al. appears largelylinked to areas allocated to selective logging(Fig. 8.17) and, to a lesser degree, agricul-ture. Low threat status is widely assigned tomajor mining regions containing some ofthe largest greenstone belts in the world,including areas in Suriname, FrenchGuiana and Amapá (Fig. 9.5B). Miningactivity throughout the valleys and alongthe periphery of the Roraima sedimentariesin Venezuelan Guayana also suggests thatassignment of low risk status is not appro-priately weighting the history and future ofunregulated mining activity. Both geologi-cal groups are strongly associated with goldand diamond-bearing substrates that haveattracted vast numbers of small-scale min-ers seeking subsistence incomes (see‘Commercial mining’, Chapter 8).
The pressures to keep valuable green-stone formations open to mining are highand areas that have already been subjectedto mining are not normally considered forconservation. It is not surprising, therefore,that countries with large greenstone beltsand a large number of registered minesadjoining these areas have relatively littleof this area allocated for habitat protection(Fig. 9.6) and widely overlap with areasallocated for timber production (Fig. 9.7),although these two resource-use practicesand the regulations designed to moderatetheir impacts are often highly incompatible.For example, the Guyana ForestryCommission’s Code-of-Practice establishesa minimum creek buffer zone applicable inall commercial forestry operations. Thissensibly mitigates the impact of logging on
water quality and sedimentation and iswidely implemented as part of soundforestry practices globally (Dykstra andHeinrich, 1996). Yet, placer gold depositsare located in these very same creeks andrivers making them subject to massive sedi-ment influxes as a consequence of currentextraction techniques (see ‘Commercialmining’, Chapter 8), considerably reducingthe functional value of buffer zoning.
Hotspots
Areas of high conservation value that aredisproportionately threatened with loss ordegradation have been variously classifiedas biodiversity hotspots (Davis et al., 1997;Myers et al., 2000). None of these is locatedin the Guiana Shield region. Areas thathave extensive forest cover and face fewimminent threats are collectively includedas a Wilderness Area. Virtually the entireAmazon Downwarp, Sub-Andean Foredeepand Guiana Shield comprise the largesttropical Wilderness Area identified.
Hotspots are delimited by the esti-mated fraction of ‘original’ vegetation coverlost combined with the estimated fractionof endemics composing this original cover.While relatively little forest cover has beenlost across the Guiana Shield, severalimportant features suggest that an assess-ment of this kind based on recent popula-tion growth and deforestation trends alonemay not sufficiently embrace future vulner-abilities. The low-energy attributes thatcharacterize modern forest processes in theGuiana Shield (see Chapters 2, 3 and 7) sug-gest that this region’s susceptibility to cata-strophic change is disproportionatelyhigher than other regions of the neotropics.The large number of endemic plants in rel-atively high local abundances but restrictedgeographic ranges within the shield region(ter Steege, 2000) also argues for a rethinkon how methods for assessing conservationvalue cope with geomorphography and itsinfluence on the way climate, substrate,phylogeny and people combine to influenceforests across these regions. Across theneotropics, geomorphographic control onforest processes renders the Guiana Shield
492 D.S. Hammond
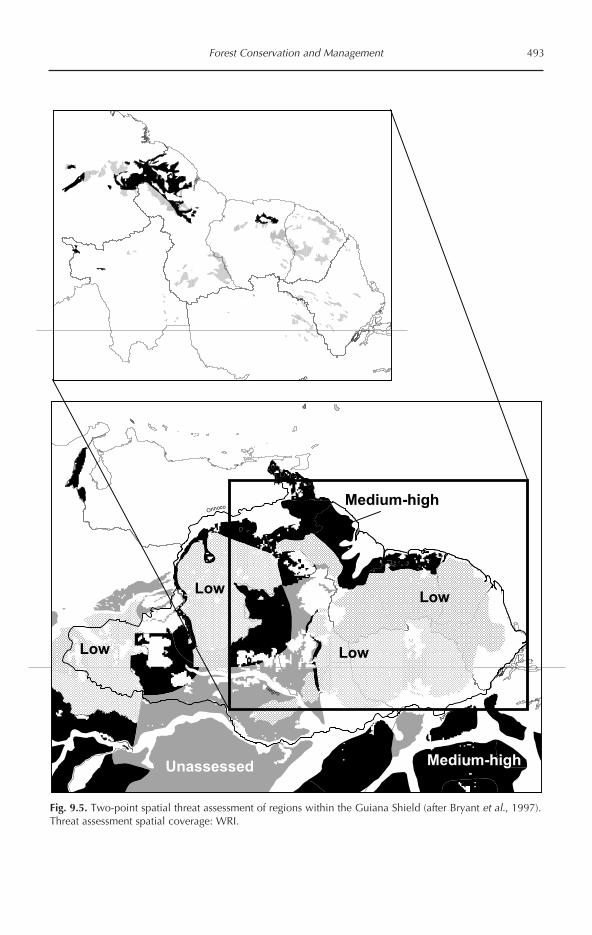
Forest Conservation and Management 493
Orinoco
Amazon
Negro
zon
Unassessed Medium-high
Low
Low
Low
Low
Medium-high
Fig. 9.5. Two-point spatial threat assessment of regions within the Guiana Shield (after Bryant et al., 1997).Threat assessment spatial coverage: WRI.
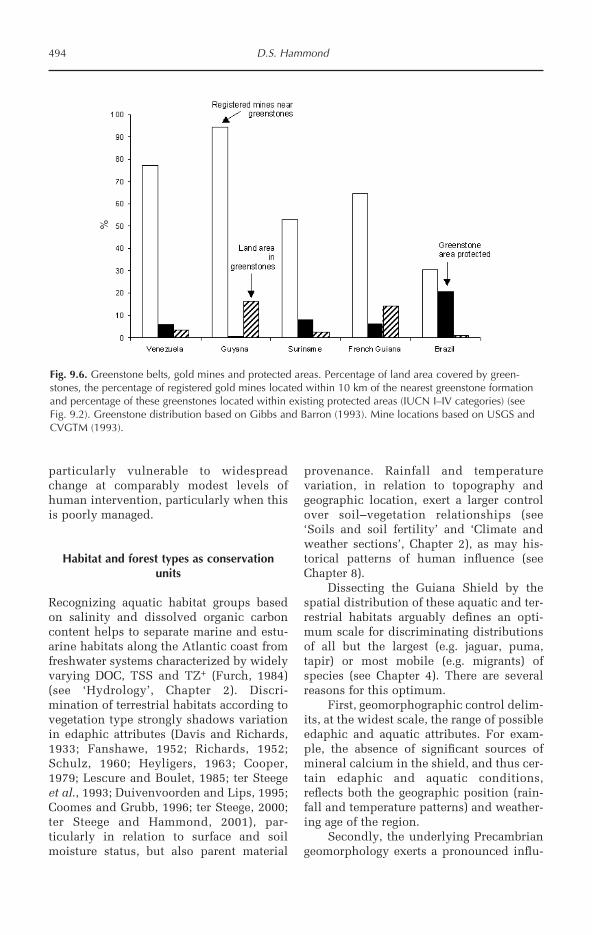
particularly vulnerable to widespreadchange at comparably modest levels ofhuman intervention, particularly when thisis poorly managed.
Habitat and forest types as conservationunits
Recognizing aquatic habitat groups basedon salinity and dissolved organic carboncontent helps to separate marine and estu-arine habitats along the Atlantic coast fromfreshwater systems characterized by widelyvarying DOC, TSS and TZ+ (Furch, 1984)(see ‘Hydrology’, Chapter 2). Discri-mination of terrestrial habitats according tovegetation type strongly shadows variationin edaphic attributes (Davis and Richards,1933; Fanshawe, 1952; Richards, 1952;Schulz, 1960; Heyligers, 1963; Cooper,1979; Lescure and Boulet, 1985; ter Steegeet al., 1993; Duivenvoorden and Lips, 1995;Coomes and Grubb, 1996; ter Steege, 2000;ter Steege and Hammond, 2001), par-ticularly in relation to surface and soilmoisture status, but also parent material
provenance. Rainfall and temperaturevariation, in relation to topography andgeographic location, exert a larger controlover soil–vegetation relationships (see‘Soils and soil fertility’ and ‘Climate andweather sections’, Chapter 2), as may his-torical patterns of human influence (seeChapter 8).
Dissecting the Guiana Shield by thespatial distribution of these aquatic and ter-restrial habitats arguably defines an opti-mum scale for discriminating distributionsof all but the largest (e.g. jaguar, puma,tapir) or most mobile (e.g. migrants) ofspecies (see Chapter 4). There are severalreasons for this optimum.
First, geomorphographic control delim-its, at the widest scale, the range of possibleedaphic and aquatic attributes. For exam-ple, the absence of significant sources ofmineral calcium in the shield, and thus cer-tain edaphic and aquatic conditions,reflects both the geographic position (rain-fall and temperature patterns) and weather-ing age of the region.
Secondly, the underlying Precambriangeomorphology exerts a pronounced influ-
494 D.S. Hammond
Fig. 9.6. Greenstone belts, gold mines and protected areas. Percentage of land area covered by green-stones, the percentage of registered gold mines located within 10 km of the nearest greenstone formationand percentage of these greenstones located within existing protected areas (IUCN I–IV categories) (seeFig. 9.2). Greenstone distribution based on Gibbs and Barron (1993). Mine locations based on USGS andCVGTM (1993).
%

ence over drainage dynamics and the extentand magnitude of hydrological disturbanceover the lowland edaphic environment.The low-energy system characterizing thesurface drainages of the shield region pro-mote autochthonous over allochthonouspathways to soil development. Thus, long-standing differences in parent material andclimate resonate more significantly throughthe soil development process. In regionswhere widespread import of externallysourced materials is delivered through rela-tively high-energy fluvial systems, more fre-quent soil turnover would reduce edaphicpatchiness and increase variation at muchsmaller mixing scales.
Thirdly, habitats in the Guiana Shieldrepresent one of the oldest existing terres-trial regions in the neotropics. During the
late Cretaceous and prior to the uplift ofboth the Andean mountains and thePanamanian land bridge, terrestrial andfreshwater life were already evolving on ashield landscape that was dominated byslow gradation and weak diastrophism. Incomparison, the western South Americanenvironment was believed to be largely epi-continental (shallow marine) (see Chapters2 and 7). This would suggest a much longerlegacy of continuous in situ terrestrial andfreshwater evolution across the majorshields relative to other regions of theneotropics. While proxy measures suggestclimate fluctuated significantly over at leastthe last 80 million years, no evidence cur-rently points to a wholesale extinctionacross the Guiana Shield. This cannot bediscounted, but neither can it be conclu-
Forest Conservation and Management 495
Fig. 9.7. Zones of overlapping mining (empty circles) and timber production (black) across the northGuiana Shield. See Figs 8.8 and 8.17 for data sources.
sively supported from palaeontological evi-dence derived from other parts of theneotropics and then scaled up across verylarge regions that have contributed few, ifany, fossilized remains.
While some lineages undoubtedly dis-appeared from the region duringunfavourable shifts in climate, it is difficultto counter a much earlier start to terrestrialevolution of life in the shield. Given the rel-ative stability of the region’s geographicposition over most of the Cenozoic, itwould have supported the accumulationof biotic attributes that bring a compara-tive advantage in low-energy environments.The primacy of meso-scale edaphic spe-cialization in defining opportunity inthis competitive environment trans-lates into a large number of modernforest types dominated by one or fewendemic species that are hyper-abundantwithin their highly restricted geographicranges and express attributes that place apremium on high per capita survival, notdispersal.
At larger classificatory scales, much ofthis important habitat variation is lost.Clear distinctions identified by foresters,ecologists, botanists and natural historiansover the last century or more are mergedinto single associations. The drawback atthese large scales is that the aggregation ofwide-ranging patchiness simply reinforcesnotions of tropical environmental unifor-mity. Ironically, viewing systems at thislarge scale supports the primacy of smaller-scale processes, that strongly influencealpha-diversity levels (e.g. Hubbell et al.,1999), as the nexus of conservation deci-sion-making. The important role of thephysical environment in structuring varia-tion at meso-scales is removed. Meso-scale,habitat or beta-diversity, is lost in the analy-sis.
Across much of the Guiana Shieldwhere alpha diversity is relatively low (terSteege et al., 2000), and large populationsof narrow-ranging endemics are common(Fanshawe, 1952; Richards, 1996), the col-lapse of habitat variation into larger unitsfails to emphasize the value of this uncom-mon feature. Endemic species in the shield
region are typified by a very high abun-dance to range ratio (e.g. Alexa spp.,Dicymbe spp., Eperua spp., Chlorocardiumrodiei, Dicorynia guianensis, Catostemmaspp., Micrandra spp., Mora gonggrijpii).Common species in Central America andwestern Amazon appear to have muchlarger geographic ranges with much lowerrelative abundances (e.g. Iriartea deltoidea,Poulsenia armata, Pseudomeldia spp.).Uniqueness, an important component ofconservation value, thus equates differentlyin the Guiana Shield than it does in otherneotropical regions affected by differentgeomorphographic controls. These regionsare also likely to express components ofconservation value differently.
In the Guiana Shield, delineationof conservation units based on foresttype characterization creates greater oppor-tunities for successfully meeting the chal-lenges that confront representativeconservation. Unique habitats or foresttypes across the northern shield regionwork well as working units because theseare strongly linked to transitions betweenrelatively large-seeded endemics with rap-idly diminishing representation at largerscales. Refined soil-type classificationcross-referenced with geographic ranging ofendemics, in this instance, would yield anoptimum conservation topology if theobjective is representative forest systemprotection.
Management Approaches and theirApplicability
Mainly protection
As a management approach, protected areas(after IUCN categories I–III) aim to carry outa series of functionally important roles, atleast in theory. According to the IUCN, pro-tected forest areas should: (i) maintain for-est ecological and genetic processes; (ii)minimize artificial disturbances; (iii) pro-vide opportunities for low-impact research,education and recreation; and (iv) protectoutstanding natural features and scenicareas of national or international signifi-
496 D.S. Hammond
cance. In practice, several of these broad-based, generic objectives can prove difficultto achieve without substantial tailoring atthe conservation unit level for a number ofreasons.
Ecological and genetic processes
One difficulty is defining measurable indi-cators of forest ecological and genetichealth that are appropriate to the systembeing protected. For example, protection offorests in the western United States over thelast half century has implicitly involvedthwarting significant disturbance from fire,largely as a consequence of the catastrophicforest and human loss caused by the GreatFires of 1910 (Pyne, 2001). Massive, stand-replacement fires at the turn of the 21st cen-tury have now prompted a re-think abouthow best to define ‘natural’ processes andhow best to ‘protect’ these. Fires are seennow as an inimical part of most forest eco-logical processes and subduing their influ-ence over decadal scales has createdconditions literally fuelling catastrophicstand replacement events at landscapescales.
Across the neotropics, regional forestsystems are also subject to different large-scale influences on local ecologicalprocesses. While these invariably overlap,the Guiana Shield area is clearly exposed tofar fewer of these (Fig. 7.2; see Chapters 2and 7). Charcoal and historical evidencepoint to fire as a widespread natural agentof catastrophic change across the shieldregion, other parts of the eastern Amazonand, possibly, parts of Panama and CentralAmerica. In contrast, the western Amazonhas yet to be characterized as a fire-affectedsystem. Rather, it appears more stronglycontrolled by high-energy hydrological dis-turbances (Räsänen et al., 1987) (seeChapters 2 and 7). Equally, the relativeimpact of pre-Columbian indigenous soci-eties appears to vary spatially (see Chapter8). The relative impacts of these differenttrajectories on smaller-scale ecologicalprocesses are not readily thrown under thesame definition or monitored using thesame criteria because they may:
1. Alter the standing forest stock of life-his-tory attributes (Hammond and Brown,1995; ter Steege and Hammond, 2001);2. Affect how these bring comparativeadvantage to different plant and animaltaxa under prevailing conditions;3. Shape the relative influence of determin-istic (e.g. historical human forest use) andstochastic (e.g. density-dependent mortal-ity) processes on forest change; and4. Regulate how fast the balance of standingtaxa and biomass is changing as a conse-quence.
‘Artificial’ disturbances
Consequently, separating disturbances thatform part of the ‘natural’ ecological processfrom those that are ‘artificial’ can also provedifficult, if forests being protected prove tohave been subject to widespread, long-last-ing and/or intensive prehistoric use. Manysmall protected areas in Central Americapreviously believed to have been ‘pristine’have subsequently proven affected in partby pre-Columbian agricultural use (e.g.Barro Colorado Island, Panama: Piperno,1990; La Selva, Costa Rica: Kennedy andHorn, 1997) as have many protected forestareas in the Guiana Shield (e.g. KanukuMountains, Guyana (proposed): Evans andMeggers, 1960; e.g. Iwokrama, Guyana:Williams, 1994; Nouragues, French Guiana:Ledru et al., 1997). Again, the problemarises in discriminating the relative effectsof these chronological series of events fromother stochastic processes at work. If theaccumulated archaeological evidencereflects the true distribution of prehistorichuman impacts, then chronologies ofhuman impact across the interior of theGuiana Shield should be compressed rela-tive to Central America, the AmazonDownwarp and Sub-Andean Foredeepregions.
Research, education and recreation
Unlike the more diffuse realities of environ-mental protection, these real-time activitiesare more amenable to practical manage-ment. The main difficulty in generalizing
Forest Conservation and Management 497
arises with the thresholding definition oflow-impact. Take the example of fire.Across many protected areas in theneotropics the creation of managed firetreatments as part of research would not beconsidered among the low-impact, allow-able uses. Yet, ecotonal forests in some pro-tected areas along the perimeter of tropicalsavannas are frequently affected by fire(Thompson et al., 1992). If the objective ofrestricting use is to minimize human influ-ence over ‘natural’ system processes, thenthe allowable range of activities associatedwith these general forms of low-impact useare again subject to local considerations ofsuitability. In the Guiana Shield many loca-tions would require significantly lowerimpact allowances than parallel communi-ties within ramping system regions.
Protected area management in the GuianaShield
Strategies and methods for prioritizing andselecting protected areas across the GuianaShield have dominated processes associ-ated with protected area management(Hoosein, 1996; Rodríquez and Rojas-Suárez, 1996; Huber, 1997; Stattersfield etal., 1998; ter Steege, 1998; Funk et al., 1999;ter Steege, 2000; Mittermeier et al., 2001;Funk and Richardson, 2002). Exploringappropriate objectives and methods of man-aging established areas has received lessregion-wide attention, although this isarguably the major constraint facing func-tional conservation in most areas. Bruner etal. (2001) concluded that the number ofpark guards was the best determinant ofprotection effectiveness in tropical parksbased on questionnaire surveys of parkmanagers and park staff (56%), NGOs andresearchers (30%) and protected area agen-cies (14%).3 Defending protected areasthrough enforcement and patrolling invari-ably plays an important role in deterringillegal activity. But taken as a top priority,enforcement and patrolling is a bluntinstrument that is symptomatic of failure,rather than success, in effectively demon-strating protected area benefits to local
communities to the same or greater degreethan has been done at international levels.
Significant areas across the shieldregion have been established for habitatprotection and this coverage already rivalsall other tropical forest regions for the titleof ‘best protected’. Only Guyana (and to alesser extent French Guiana) has yet to legi-slate for areas that have been under consid-eration since the 1990s, but this is likely tochange. The region boasts nearly 30% ofremaining closed tropical forest cover inSouth America and 13% of that estimatedto occur globally (Tables 9.1 and 9.2).Approximately 20% of lowland tropicalforest in the region is protected and this islikely to rise to 25% by 2010.
With one-quarter of the area protectedand all countries in the region already orexpected to have more than 10% of theirland area committed to strict habitat protec-tion, tailoring objectives and identifyingpractices that will lead to relevant conser-vation in these areas would appear crucial.Moreover, articulating these through well-considered management plans and coordi-nated actions has remained noticeablyabsent from many designated areas (e.g.Huber, 1995, 2001). In part this is due to ashortfall in resources needed to effectivelymanage for conservation in a region beingincreasingly used for its mineral, timberand wildlife resources and weighed downby excess external debt burdens, pooraccess to education and health care, boutsof social unrest, high rates of emigrationand mounting costs of infrastructural main-tenance (see Chapter 8).
Mainly timber
Management for timber production hasbeen a long-standing focus across manyregions of the Guiana Shield since the early1900s. Regional notions of sustainability,however, have broadened beyond mainte-nance of harvestable volume to includemany non-commodity benefits (e.g. formu-lated in the Tarapoto Agreement).Nonetheless, timber remains the largest for-est sector contribution to national GDP,apart from mining, and efforts to improve
498 D.S. Hammond

timber production and its managementhave explored several avenues (e.g. King,1963). These have focused principally onplantation and natural forest managementapproaches to timber production and thepotential for supplying material to paperpulp, (peeled and sliced) veneer, plywood,sawn split and hewn wood markets (e.g.Vink, 1970; Welch, 1975a).
Plantation forestry
The prospect of meeting domestic demandand supplying export markets with timbergrown in a plantation setting has largelyproven unworkable over most parts of theGuiana Shield where trials have been con-ducted (Vink, 1970; de Graaf, 1986). A widerange of native commercial timber specieshave been examined, including Simaruba,Carapa, Cedrela, Peltogyne, Dipteryx,Centrolobium, Caryocar, Anacardium,Virola, and Dicorynia with little success(British Guiana Forest Department,1940–1965; Welch, 1975a; de Graaf, 1986).The potential of faster-growing exotics suchas Pinus caribaea, Eucalyptus spp. andGmelina arborea, as well as valuable hard-woods, such as Swietenia, Khaya andTectona was also explored with mixed suc-cess due to the high costs of pest and weedmanagement combined with disappointinggrowth increments (Vink, 1970). For exam-ple, one trial of P. caribaea grown on ferra-solic soils in Guyana achieved an annualaverage increment of 1.8 m3/ha over a 20-year period, a figure only marginallyimproving on estimated volume accrual inmany natural forests of the region. Perhapsthe most outstanding example of plantationfailure is the case of the pulpwood opera-tion established along the lower Jari Riverin south Amapá/east Pará states (Rollet,1980; Palmer, 1986). MonoculturedGmelina and Pinus were battered by fungaland insect damage and rapid declines inproductivity, principally through disregardfor the role of internal nutrient cycling(Russell, 1987) and density-dependentattack in maintaining productivity. Overthe last 20 years, however, some productiv-ity gains have been made, primarily by
addressing these shortfalls and refining andredirecting pre-site management effort(McNabb and Wadouski, 1999), but nutri-ent emigration through biomass removal,particularly scarce calcium, continues toproceed at very high rates in stands ofEucalyptus urograndis (Spangenberg et al.,1996).
By the close of the 20th century, veryfew plantations were operating within theGuiana Shield region. Although Brazil pro-duced between 32 and 46 million m3 ofplantation wood fibre alone, a mere 4–5%of this originated in the Guiana Shield andvirtually all of this was associated with theJari pulpwood operation (IBGE, 2002). As of2000, no other commercial-scale planta-tions are producing significant quantities inthe region.
Plantations hold tremendous prospectin providing a reliable supply of light hard-wood and wood fibre to supply local down-stream industries and market demand (F.Wadsworth, personal communication).Little success has been met across theGuiana Shield in establishing commerciallyviable plantations of both natural andexotic species. The principal difficulty aris-ing is the cost-effectiveness of producingwood through this approach. Relativelyslow growth increments combined withelevated pest and weed management costsand stagnant prices for low-end tropicaltimber and fibre work to reduce or elimi-nate profit margins. Improving growth,cost-effectiveness of management or timberprices would potentially make plantationforestry a more attractive investment. Inmany parts of the Guiana Shield whereforests have been degraded through high-frequency selective logging, plantationsunder these circumstances might offer ameans of improving landscape fertility(Lugo, 1995), increasing wood supply andoffering greater flexibility in allocating nat-ural forest areas to lower-impact direct andindirect uses. It is unlikely, however, thatthe accelerated growth required from plan-tation-grown timber would foster the samestrength and durability properties (see‘Wood density’, Chapter 7) that have typi-fied the main line of exported timber prod-
Forest Conservation and Management 499

ucts from the Guiana Shield for centuries(e.g. Mackay, 1926).
Natural forest management
Managing standing mixed forests of theinterior for long-term production of theseheavy hardwood products holds consider-ably greater promise if natural regenerationis employed as the main avenue to restock-ing. Systematic selective logging has beenthe main route to timber production in theGuianas since the early 20th century(McTurk, 1882; Hohenkerk, 1922), althoughpro-active effort to manage forests for tim-ber was not taken up until the 1950s.
A number of silvicultural approacheshave been explored in an attempt to directnatural regeneration towards greater tim-ber-tree stocking. Among the most widelyknown are thinning (e.g. through poisoningand girdling) (King, 1965; Jonkers andSchmidt, 1984; de Graaf et al., 1999),enrichment planting, climber and lianaelimination (e.g. Putz, 1991), seed treeretention (e.g. Plumptre, 1995) and standdamage control (e.g. van der Hout, 2000).Combined, these techniques form a processthat aims to modify over time the existingmix of species and size classes in a way thatimproves timber value and manageabilityof the stand, often referred to as ‘domestica-tion’ of natural forest (Dickinson et al.,1996; de Graaf, 2000). Employed à la carte,they can act as effective tools in ensuringthat forest functioning remains largelyunimpeded, although (at least transitory)shifts in composition are inevitable at theharvesting intensities required to supportcapital-intensive, industrial approaches.
Reduced-impact logging
Stand damage control is arguably the raisond’être for employing reduced-impact log-ging (RIL) techniques (Hendrison, 1989).However, reducing the unit costs of extrac-tion is commonly submitted as the financialpay-off associated with controlling damage(Holmes et al., 1999; van der Hout, 1999,2000). This pay-off is intimately associatedwith the up-front investment in preharvest
planning of felling and extraction (e.g.Hammond et al., 2000). As a consequence,operational efficiency is improved andwood waste reduced in comparison withunplanned approaches (Boltz et al., 2003).Yet, many operators have been slow toimplement these practices, in part becausethe management of more complexapproaches to harvesting bear with themadditional costs beyond forest operationalconsiderations (Hammond et al., 2000). Thefinancial benefits of employing RIL tech-niques are often slim, neutral or slightlynegative (Barreto et al., 1988; Winkler,1997; van der Hout, 1999, 2000; Armstrongand Inglis, 2000), suggesting even short-term lapses in management rigour couldcreate further financial losses. These ‘other’costs become even more significant when itis apparent that they may not lead to anyimmediate financial benefits from a marketthat is slow to pay higher tropical timberprices (Barbier et al., 1994), despite effortsto structure incentives for better foreststewardship through certificationapproaches. Operators are largely unwillingto bear greater up-front costs and greaterfinancial risk in the face of longer-termpolitical instability and uncertain landtenure (Pearce et al., 2003). In effect, grow-ing and harvesting trees through naturalforest management approaches in the trop-ics requires adoption of an investment hori-zon that extends well beyond the limits ofnormal risk tolerance. Across the GuianaShield, this horizon may extend beyond thelifetime of the investor for a number of rea-sons linked to underlying geomorpho-graphic controls and the need to maintaincompetitiveness in a market characterizedby a wide range of interchangeable materialoptions.
Sustainability of harvest rates and intensities
A competitive real rate of financial returnon an investment is rarely characterized bya minimum 50+ year period of maturity.Yet, this may be what is required in order tosustain timber yields in the Guiana Shieldthrough up-front investments in refinedmanagement practices under operational
500 D.S. Hammond

and market conditions at the turn of the21st century. Several factors come into playin defining why the term of investmentshould be of such length.
First, stand-level increments for manyheavy hardwood timber trees are generallysome of the lowest in the industry (Prince,1971; Veillon, 1985; Silva et al., 1995;Zagt, 1997). Even after considerable loggingintensities, that should have strong liberat-ing effects, models indicate that foreststocking is unlikely to reach preharvestlevels within 40 years at sites in westerntropical Venezuela (Kammesheidt et al.,2001), Guyana (Zagt, 1997; ter Steege et al.,2002) and Suriname (de Graaf, 2000).On this basis, a cutting cycle of at least 60years has been recommended in order tomaintain forest biomass (Zagt, 1997;Kammesheidt et al., 2001), although theCELOS system in Suriname originally rec-ommended a 20–25-year cycle (de Graaf,1986).
Secondly, hidden defects such as hol-lowing or decay are very common in com-mercial size-classes, at least in most timbertrees of Suriname and Guyana (de Milde,1970; de Milde and Inglis, 1974; D.Hammond, personal observation). Whilenot normally considered in assessments offorest stand responses to silvicultural inter-vention, defect rates among many slower-growing, heavy hardwood species (e.g.Chlorocardium, Mora, Swartzia) are gener-ally greater than in faster-growing, long-lived colonizers that dominate timberindustries in many other parts of theneotropics (e.g. Swietenia, Cedrela,Cedrelinga). Defective logs, once mistak-enly felled, are normally left in the forest orat the consolidation market or mill yardonce detected. Most modern gang-saw oper-ations do not easily cope with these types ofdefects. Thus, the ‘processable’ volume canbe considerably lower than the standingcommercial volume often used as a measur-ing stick to gauge initial extraction opportu-nity and later postharvest standperformance.
Thirdly, investment in good forestmanagement practices, such as RIL tech-niques, can only yield a return below a
threshold of logging intensity. Above thisthreshold, the relative value of employingRIL techniques diminishes rapidly as thedensity of felling and extraction overridescanopy and potential crop-tree conserva-tion effects typically improved by RIL atlower intensities (Sist et al., 1998; van derHout, 2000). Consequently, a considerablevolume of harvestable timber is foregoneover the short-term as an investment inlonger-term timber quality and sustainedvolumes takes precedence. This creates analmost irreconcilable predicament for large-scale operators that work to achieve theeconomies of scale necessary in recoupinghefty capital investments in equipment anddownstream processing facilities.
Relatively high work rates must beachieved in order to financially warrant theuse of heavy machinery and large sawmills.In Guyana, initial efforts to mechanize thetimber industry focused precisely on thehigher work rates that could be achieved(Grayum, 1971). Expressed on a unit basis,costs were expected to be lower than morelabour-intensive methods (Fig. 9.8A).However, expressed as a function of time,increased use of machinery demandedhigher production rates, because daily costswere considerably higher (Fig. 9.8B).
In forests across the Guiana Shield,slow growth rates, high defect rates, size-able areas of non-commercial forest (e.g.bana, muri scrub, palm swamp) (Fanshawe,1954; Vink, 1970; Welch, 1975b), poor tim-ber price growth and increasing transportdistances combine to challenge the finan-cial sustainability of capital-intensive oper-ations. Yet, views persist that much shortercutting cycles and higher intensities shouldbe employed across some remote areas ofthe region (J. Leigh, personal communica-tion).
In reality, commercial logging intensi-ties have traditionally been self-limitingacross many forest areas because of thesefactors. Extraction rates of 6–10 m3/ha arenot uncommon in many modern, large-scale operations (van der Hout, 1999;Armstrong and Inglis, 2000). Yet, evenmodest increases to 20 m3/ha recom-mended as part of the CELOS Management
Forest Conservation and Management 501

System have not precipitated the expectedre-stocking necessary for another harvestafter 20 years, even after liberal applicationof refinement treatments (de Graaf et al.,1999).
Low, but highly concentrated, stockingof timber trees presents specific problemswhen heavy hardwood regeneration is opti-mized under relatively low levels of canopyopenness (ter Steege et al., 1995), but opti-mal harvest rates require extraction of alarger number of stems from these smaller
areas. Forests throughout the Guiana Shieldtypically show relatively high dominanceof 1–3 commercial taxa and their distribu-tion is always concentrated at scalesdefined by edaphic or dispersal limits (seeChapter 7), a feature not as commonlyencountered in other commercial forests inthe neotropics. Thus, the optimal in-tensity of logging that makes best useof the investment in RIL depends to a greatextent upon the distribution of commercialstems throughout the stand and how this
502 D.S. Hammond
Fig. 9.8. The calculated cost of employing chainsaws and mechanized skidders and loaders in forest oper-ations in central Guyana expressed as a function of volume extracted and operational time. Data source:Grayum (1971).
interacts with the balance of financial con-siderations, such as achievable marketprice, amount of rent (taxes, royalties) pay-ments and changing costs of operationalinputs, such as fuel, parts and staff remu-neration.
Fourthly, the absence of cost-effectivesilvicultural techniques also affects the rel-atively long term of investment required forsustainable timber production in theGuiana Shield. Most techniques, includingliberation and enrichment planting, havebeen shown to yield comparatively betterperformance of target timber species, buthave also proven far too costly (de Graaf etal., 1999). Moreover, decision-making at thetime of postharvest, silvicultural interven-tion may not adequately predict changingmarket demand and opportunities.Consequently treatment costs may be borneup-front, only to find they were incurred toeliminate species in demand at the time ofthe subsequent harvest. Non-commercialspecies may also play an important role inprovisioning forest stands with importantnutrient import (Perreijn, 2002) or dispersalservices (Hammond et al., 1996) (seeChapter 4). Vertebrate-dispersal of timbertree seeds is arguably greater in forests ofthe Guiana Shield than in any other tropicalregion (e.g. Jansen and Zuidema, 2001) andthese services form an important part ofnatural regeneration approaches to timbermanagement. The cost-ineffectiveness ofpostharvest intervention limits the range oftools that can be employed in stimulatingfaster growth, if that is the main objective intimber management, to the amount ofcanopy openness created during felling andextraction.
Quality vs. quantity as the timbermanagement objective
A focus on timber quality would appearintuitive given the conditions structuringoperational costs and constraints on forestproductivity across the region (Hammond,1999). Properties of high structuralstrength, resistance and durability definemost timbers in demand overseas, princi-pally for their load-bearing capacities
(docks and wharves), and resistance to wear(flooring, decking) and maritime infestation(locks, docking), among other applications(Fig. 9.9). Higher harvesting rates, however,will inevitably liberate the canopy andstimulate faster growth. For many forests inthe region, this will increase the rate ofcommercial volume accrual, but principallywith faster-growing, light-wooded species.Heavy hardwood species recruited duringthese periods into harvestable size classesmay also see a reduction in wood density asa consequence of growth stimulated bymore open canopy conditions (but see fac-tors affecting density in ‘Wood density’,Chapter 7 and ‘Growth in relation to canopyopenness’ in Chapter 3). Consequently,future timber production may revolvearound lower-density wood, a market thatis open to a wide range of species grownprincipally in plantation forests throughoutthe world (compare across regions in Fig.9.9). Given production levels within theGuiana Shield, this route would not appearto provide any comparative advantage overthat already existing through productionof increasingly scarce heavy hardwoodmaterial (Hammond, 1999). The trade-offrequired, however, is a focus on lower pro-duction volumes from forest managed fortimber through natural regeneration. Thereare, however, other non-timber benefitsattached to forests in the Guiana Shield andthese will for the most part continue toaccrue under low-impact systems of timberproduction. Compared with much higherrates of tropical forest loss elsewhere andremaining standing forest areas (seeTable 9.1), continued low-level woodproduction from forests in the GuianaShield should see increases in unit prices ifa focus on wood product quality is main-tained.
Operational waste and inefficiencies
RIL techniques measurably offset financialinvestments in planning by reducing opera-tional waste and inefficiency. However, forthe broader forest operation and forestrysector to achieve sustainability (afterGoodland and Daly, 1996), other point
Forest Conservation and Management 503

sources of waste and inefficiency must bewrangled and subdued if RIL is to achieveits measured objective of leaving a growing,non-depreciated forest without foregoingthe immediate financial objective of doingbusiness. Arguably, other factors may bespurring investment in marginal prospectsof financial return from timber in the shield
region in the first place, but these are toocomplex to be explored here (see Repettoand Gillis, 1988). It is clear, however, thatoperational waste and inefficiency infelling and extraction of timber form onlythe first links in a chain of waste (Fig. 9.10)that, depending on its length and strength,can terminate any prospect of positive
504 D.S. Hammond
0
0.1
0.2
0.3
0.4
0.5
0.6
0.7
Gu
ian
as
We
ste
rn
SA
C A
me
rica
SE
Asia
W. A
fric
a
Te
mp
era
te
0
20
40
60
80
100
120
140
0
2000
4000
6000
8000
10,000
12,000
14,000
16,000 Modulus of rupture
Modulus of elasticity
Specific gravity
g c
m-3
N
mm
-1
N m
m-1
Fig. 9.9. Mean (± SE) wood specific gravity and two of its mechanical property correlates for timber speciesgrouped by region. See Fig. 7.6 for data sources.
N/m
m2
N/m
m2
g/cm
3

financial return to timber operators aftermeeting reasonable tax burdens.4 As a con-sequence, accumulated costs associated withsmall, but frequent, wastages downstreamcan accrue (Fig. 9.11A, B), putting pressureto sell finished products at lower prices.Ironically, high losses to waste and increas-ing operational costs can spark furtherdemand for logs from the forest in an effort
to offset initial capital outlay and mountingdepreciation costs through economies ofscale. Residual commercial stems in logged-over stands in particular can be targeted, par-ticularly as transport distance between milland unlogged forests increases unit costs andmultiple re-entries, often within the sameyear, become commonplace (D. Hammond,personal observation).
Forest Conservation and Management 505
Fig. 9.10. Schematic describing the chain of waste that can exist in inefficient and poorly managed timberproduction companies. RIL techniques can reduce this waste up to the forest-to-mill phase (arrow). Costsavings of employing RIL can be rapidly eroded through inflated downstream waste.
Unskidded trees Undetected defects
Fungal-insect damage, splitting, drying
Fewer sales/lower sale price
Addedvolumeneeded tomeetcapitaloutlay
Poor protection,theft & accidents,poorly graded
FOREST
MILL
MARKET
Skidding damage
Transportaccidents
Bolesizing
For Sale
Mill conversionlosses
Warping,cupping, checking,
bowing, insect &fungal damage

Discount rates and heavy hardwood growthand mortality
Defining appropriate discount rates toapply when assessing the net present value(NPV) of commercial forests remains a mat-ter of almost arbitrary assignment. Yet NPVis a fundamental calculation influencingthe economic viability of investment intropical forests. Typically, discount ratesare applied as brackets around typical lend-ing rates when calculating forest NPV.However, the economic factors affectinglending rates are hardly sensitive tochanges in the forestry sector, particularlyacross the Guiana Shield where it typicallyaccounts for less than 5% of GDP (at factorcost). Presumably, when logged forests areviewed (solely) as timber assets, they appre-ciate based on the rate of increasing com-mercial stock, the cost of bringing theproduct to the market and the market price
achieved. Therefore, ecological factors thatinfluence the rate of increase should alsoshape the rate of asset appreciation, all elsebeing equal. The primary determinants ofthis rate are based on basic populationchanges defined by growth and mortalityrates. Yet, if growth is slow, as it is for manyheavy hardwoods common to the GuianaShield, then the fraction of these lost tomortality events while occupying commer-cially harvestable size classes will be con-siderably greater than faster growingspecies with typically shorter life spans (terSteege and Hammond, 1996). This wouldsuggest that discount rates based on appre-ciation of heavy hardwood timber stocksshould be set higher than stands appreciat-ing largely through growth of faster-grow-ing commercial species. Since theseinvariably form a larger part of future com-mercial growing stocks under natural forestmanagement regimes, discount rates
506 D.S. Hammond
Fig. 9.11. (A, B) Chasing waste. Extracting timber that is never processed creates unnecessary pressures onthe forest resource since more logs must be extracted in order to meet financial targets. Reducing wastethrough transport, storage and milling phases will yield higher returns and improve government revenue.(C, D) Changing face. The changes to the forest system created by surface mining in the Guiana Shieldcan be severe when rehabilitation effort is low. Tall grass in (D) is the common non-flooded savannaspecies, Andropogon bicornis.
applied to forest NPV should decrease withtime, all else being equal. Factors that stim-ulate greater mortality rates, such as cata-strophic disturbance events, and thereforegreater investment risk and higher lendingrates, would suggest spatial variation in theapplication of discount rates across geo-morphographic regions.
Mainly mining
The extraction of gold, bauxite, diamondsand iron is arguably the most substantialnon-timber use of forests in the GuianaShield (see Chapter 8). In terms of biophys-ical and socio-economic impact, the pro-duction of minerals spreads across a muchgreater portion of the region, figures moreprominently in the agenda of national eco-nomic development and conjures upgreater visions of rapidly accruing wealththan virtually any other forest-based activ-ity. Most mining operations open and shutover a 15-year period (see ‘Commercialmining’, Chapter 8), or are consumed byoperational inefficiencies as global com-modity markets fluctuate independent ofextraction costs. The long planning horizonof timber production appears almost slug-gish by comparison and mining does notneed to carry with it any visage of sustain-ability comparable to the timber industry.
It does, however, increasingly need todeflect growing criticism over the way inwhich it is being managed across the regionand the negative impacts that this is caus-ing through:
1. Little or no management of sedimentand mecury effluent;2. Rapid spread of a wide variety of com-municable diseases, including HIV andmalaria (Palmer et al., 2002);3. Breakdown of family units structures(Heemskerk, 2001);4. Negative impacts on neighbouring ruralcommunities that may have very differentforestland use priorities;5. Extirpation of local wildlife throughunrestricted hunting, fishing and live-ani-mal collecting; and
6. Large-scale surface degradation with lit-tle or no post-closure restoration effort (Fig.11C,D).
Mitigation of mining impacts
Although considerable attention has beenfocused traditionally on large, internationalmining consortia that are operating at vari-ous locations throughout the region (e.g.Colchester, 1997), small-scale miners aremore numerous, less easily regulated andmore often working illegally. When envir-onmental and social impacts become unac-ceptable, it is virtually impossible todetermine accountability in a way that ismore transparent with larger, stationaryoperations. Among these impacts, mercurypoisoning has arguably attracted the great-est attention because of the important pub-lic health consequences to people living inrural environments and dependent onaquatic resources for their livelihoods. Singet al. (1996) measured significantly highermean organic mercury levels (31.3 mg/l) inblood samples taken from Makuxi villagersalong the Cotingo River with high exposureto mining operation affluent. Levels of totalmercury in urine of Maroon gold workers inSuriname were significantly higher thanthose not involved in gold mining, althoughblood levels were generally low (de Kom etal., 1998). In French Guiana, dietary habitsaccounted for a significant part of mercury-level variation in hair samples of rural resi-dents, particularly among Amerindianchildren (Cordier et al., 1998). The dietaryconnection is largely based on fish thatreadily sequester and concentrate mercuryin their tissues. In Suriname, a survey of thefreshwater fish community showed thatpredatory fish had significantly higher con-centrations of mercury than non-predatoryspecies and that these levels were oftenexceeding maximum permissible concen-trations (Mol et al., 2001). River bottom sed-iments in Guyana tend to concentratemercury downstream from intensive min-ing districts (Miller et al., 2003), where it isavailable for uptake by benthic feeders.Although significant background mercurylevels have been detected throughout many
Forest Conservation and Management 507
parts of the region as a consequence of itslong history of weathering and exposure toforest fires (Veiga et al., 1994; Fostier et al.,2000; Santos et al., 2001), both importantsources of naturally occurring mercury, therole of mining in catalysing widespreadexposure to much higher concentrations ofthis toxic heavy metal is difficult to dispute(Nriagu et al., 1992; Roulet et al., 1999).Unfortunately, the hydrochemical proper-ties of most rivers in the Guiana Shieldmake them ideal transporters of metallo-organic complexes of methylated mercury(Silva-Forsberg et al., 1999).
Mainly non-timber forest products (NTFPs)
Non-timber approaches to forest use includea large basket of potential goods and services.Many studies do not discriminate commer-cially viable and subsistence-oriented materi-als, particularly when NTFP abundances arebeing inventoried. Frequently every plant hasseveral useful purposes within the traditionaluse system of most Amerindian people, soassessing NTFP status alone does not allowfor good discrimination of prospectiveincome-earners. Here an emphasis is placedon NTFPs in the Guiana Shield that have orcould generate sufficient market demand toprovide some measure of income support torural livelihoods.
Direct use forms include the produc-tion of plant oils, resins and latexes, fibresfor furniture and handicraft manufacture,food plants, collection of wildlife for thepet trade, and fish and bushmeat for marketsale. Biochemical components of plantsand animals can also be surveyed for theirprospective use in agro-chemical or phar-maceutical applications. Indirect usesinclude services provided by forests in theform of tourism, downstream water qualityand flow regulation, carbon storage andsequestration and more complex connec-tions associated with regulation ofland–ocean–atmosphere fluxes forming theglobal biogeochemical cycles. Non-useforms include existence value conceptsattached to philosophical or spiritualbeliefs supporting forest persistence.
Non-timber forest plant products
Historically, a number of important NTFPshave been commercialized across theGuiana Shield (Table 8.2), including balata(Manilkara), rosewood oil (Aniba), copalresin (Hymenaea), sarrapia (cumaru) beans(Dipteryx), curare (Strychnos), among oth-ers. Depending on the part of the plantrequired, the harvest of many NTFPs led tocommercial extinction across much of theirrange in a manner more commonly attrib-uted to timber production (see Chapter 8).Thus, concepts of sustainable use andharvest intensity apply equally to bothtimber and non-timber products. In theGuiana Shield, this has become particularlyimportant in those industries that havedeveloped industrial-scale demand for rawmaterials.
Palm-heart sustainability
Among these, palm-heart (Euterpe spp.)production has received the greatest atten-tion, both as a growing industry along theAtlantic margin of the Guiana Shield, butalso with a concern towards the long-termsustainability of current production meth-ods. The coastal Atlantic region of theGuiana Shield dominates the geographicdistribution of E. oleracea, the multi-stemmed species that accounts for mostpalm-heart production from the region. Incontrast, the single-stemmed E. precatoriais the primary source of material for theBolivian palm-heart industry (Bojanic,2001) and prior industries in southernBrazil centred on the single-stemmed E.edulis are now largely closed due to com-mercial extinction of the raw materialsource (Anderson and Jardim, 1989; Pollaket al., 1995). In fact, sustainable manage-ment of palm-heart production from single-stemmed Euterpe appears largelyunachievable at any reasonable timescaledue to slow growth rates (Peña andZuidema, 1999) and absence of root sucker-ing (Anderson, 1988; Johnston, 1995; vanAndel, 1998, 2000). Long-term productionfrom E. oleracea is feasible if size-basedharvesting limits, fractional shoot collec-
508 D.S. Hammond

tion and adequate fallow periods areadhered to by palm-heart harvesters (Pollaket al., 1995; van Andel, 2000). In mostcases, a fallow period of 4–5 years appearsadequate to ensure stability in the popula-tion size class distribution.
Thus, the industry across the GuianaShield has a striking comparative advan-tage based on its E. oleracea stands if it canbe managed sustainably. Competition inEuterpe heart production is restricted toareas in and around the Amazon estuarywhere palm-heart production must alsocompete with other profitable uses ofEuterpe that do not currently generate anysignificant domestic demand across theGuianas. Competition from palm-heart pro-duction in Bactris gasipaes, a semi-domes-ticate found throughout the neotropics(Henderson et al., 1995) is more substantial.According to Arkcoll and Clement (1989,cited in van Andel, 2000), this palm iscapable of producing palm hearts at sixtimes the rate of E. oleracea.
Palm-heart production appears capableof bring a modicum of livelihood support torural communities across the northernshield perimeter if strict, but simple, har-vesting rules are followed and enforced. Italso provides a source of income that is closeto their home communities, avoiding manyof the social impacts associated with menleaving to work for extended periods awayfrom home, a feature commonly associatedwith small-scale, gold-mining operations.
Wildlife use
The socio-economic issues attached towildlife use in tropical forests can be excep-tionally complex, as a wide variety of per-spectives and objectives view forestanimals in very different ways (Freese,1998). Forest wildlife use is seen through awide range of perspectives ranging from itsvalue as a protein source, as the focus of anesoteric, but potentially important, cultureof exotic pet-keeping through to their spiri-tual representations. The catalysts and con-sequent patterns of commercial wildlife useare, however, surprisingly similar (Fimbelet al., 2001).
Wildlife is the most important com-mercial NTFP across the Guianas.Registered exports of wildlife, composedmainly of psittacines (parrots, macaws),reptiles (snakes, lizards, turtles), monkeys(Cebus, Saguinas, Saimiri) and aquariumfish constitute a significant foreign-exchange earner and source of income forpeople in Guyana, Suriname and the RioNegro region of Brazil (Chao and Prang,1997; De Souza, 1997; Duplaix, 2001;Ouboter, 2001).
Despite its prominent figuring in NTFPrevenue generation across the region,wildlife use remains one of the least regu-lated of forest-based activities and littleinformation is available regarding popula-tion sizes, rates of use or how long thesecan be sustained. All indications suggestthat use is more targeted, less widespreadand less intensive compared to other low-land neotropical regions that have been vir-tually defaunated, but productivity in theshield is also typically much lower and lim-its defined elsewhere are unlikely to beapplicable across geomorphographicregions. Some species have already beenclearly over-harvested historically, sincetheir geographic ranges have contracted tomore remote locations (e.g. black caiman,arapaima). Sociocultural conditions arealso different. For example, monkeys arerarely hunted for bushmeat in Guyana,although consumptive rates across otherparts of the neotropics are often as high orhigher for primates than other taxa(Redford, 1993).
Unregulated collection of wildlife tomeet a growing commercial trade in bush-meat, fish and live specimens is arguablythe most important challenge facing verte-brate conservation and sustainable useacross the Guiana Shield. Significant con-cerns remain regarding how best to estab-lish functional quotas on the wildlife trade(Pilgrim, 1993) and the impact this tradehas on rural societies (Forte, 1989), but thelargest issue confronting the future ofwildlife across the region is the virtualabsence of any restrictions on hunting andfishing season, quantity or location(Duplaix, 2001). Unmitigated access to
Forest Conservation and Management 509

(mainly) public wildlife resources withoutany payment of taxes or rents similar tothose placed on plant products invariablystimulates wasteful commercial consump-tion of wildlife because it creates opportu-nities to make a solid return on investmentwithout the need to manage operations crit-ically. Like logging, a chain of waste ensuesfrom point of harvest to final market.Income derived from the use of wildlife thatshould bolster public revenues is insteadtaken as super-profit by operators or lost aswastage. Ultimately, local and nationalcommunities bear the cost of over-exploita-tion through a decreasing subsistence shareand lost government revenues. At thenational scale, the absence of any restric-tions on hunting and fishing is difficult toresolve with interest in developing viableecotourism industries, maintaining an effi-cient, profitable and legal export of livespecimens and protecting local rural com-munity subsistence use needs. All of theserepresent real comparative, but largelyunmarketed, advantages held in the regiondue to the high degree of forest integritythat has been maintained relative to otherregions that were capable of providing sim-ilar goods and services.
Managing forest roads and road-building
If lack of regulations, restrictions and theireffective enforcement can critically impedeprogress towards sustainable forest manage-ment across the Guiana Shield, then anexpanding road network is the main agentcapable of ensuring that it fails altogether.This is not to engender the view that signif-icant benefit cannot be derived from roadestablishment, but to emphasize that in theabsence of effective road management,costs attached to their use will invariablyoutweigh the benefits roads can deliver atlocal, national and regional scales. Themain cities of the region were connected byall-year roads by 2002 with the upgradingof the Georgetown to Lethem road inGuyana, although this remains unpaved(Fig. 9.12). The only other road prospec-tively connecting the main centres of popu-
lation that remains unpaved is theOiapoque to Macapa road in Amapá andthis is earmarked for paving under theAvança Brasil programme (Carvalho et al.,2001).
Pavement of the Georgetown to Lethemroad would connect all of the major citiesalong the shield periphery, Manaus, CiudadBolivar, Georgetown, Paramaribo andCayenne, in a way that would accommo-date much larger volumes of traffic carryingmuch larger payloads. The feasibility ofsuch an undertaking has been explored(Environmental Resources Management,1995), although the advantage of upgradingthe 585 km length of road to the residentGuyanese population of less than 750,000remains largely unclear in comparison tothe relative ease of access afforded Brazil’snorthernmost state, Roraima, with its popu-lation of 325,000 (Forte, 1990; Forte andBenjamin, 1993).
Roads across remote frontiers act asconduits for the legal transport of peopleand goods that can broaden cash income-earning opportunities for rural householdsthrough greater market access for their agri-cultural and timber products. But roadsalso can act as very effective thoroughfaresfor the transmission of disease, invasiveand exotic pests, smuggling, poaching ofwildlife, timber and other plant materials,unpermitted mining, violence and crime.Massive influxes of cash and working capi-tal can rapidly overwhelm and then erodeexisting rural community social structures.For example, even modest increases in traf-fic along the Georgetown to Lethem roadrunning through the Iwokrama Forest sawan increase in illegal hunting activities,timber poaching and conflicts regardinguses of roadside creeks that supplied waterto adjoining communities (Ousman, 1999).More substantial impacts are well-estab-lished for roads built in other parts of theAmazon, largely due to an absence of anyroad management presence capable oforganizing where and how roadside land isused and mitigating impacts created byroad-users. The Guiana Shield remains oneof the last forest frontiers largely due to itsinaccessibility. Improving access will bring
510 D.S. Hammond

further opportunities for economic devel-opment only if these roads are effectivelymanaged to prevent or mitigate the widerange of negative impacts that can followroad development.
Management Scale, Focus and Objective– a Perspective
Scale
Environmental concerns over the use oftropical forests in many ways have beentransfixed at the largest inclusive scales, butconsistently studied at some of the smallestscales. In fact, scaling-up interpretation ofmany site- and time-specific results hasunintentionally cemented the notion of
underlying environmental uniformity andperpetuated an implicit belief that all tropi-cal forests are the product of similar pasthistories and uniformly respond (nega-tively) to the same basket of destructiveland-use practices. Selective extraction andforest clearance approaches to timber pro-duction get muddled into a single mass.Non-wood products equally begin to form aconglomerate of economic alternatives.Shifting agriculturalists are melded into asingle group that ignores important varia-tion in the marginal utility they receive,impacts they exact and core competenciesthrough which they manage forestresources. The scale of mining operationsand the realistic costs and benefits attachedto these different levels are not always ade-quately considered. Thus studying the
Forest Conservation and Management 511
Fig. 9.12. Major road arteries connecting large towns and cities across the Guiana Shield and beyond.Note the pivotal position of Boa Vista in the overland flow of traffic between the Guianas, Brazil andVenezuela. Road development between Guyana and Venezuela (through Cuyuni-Nuria) (filled arrow) andFrench Guiana and Amapá (empty arrow) would diversify the transit access across the region.

socio-economic and environmental conse-quences of commercial-scale use of in situforestlands from a presumptive perspectiveof either net benefit or costs without faith-fully assessing the other can further fosterirrational decision-making and add apolemical coating to problem-solvingefforts. In the end, these efforts should seekto bring the maximum net benefit to thewidest cross-section of society. Implicitscaling-up of single case history examplesof success and failure or research findings isoften inappropriate when variation in bio-physical and socio-economic features atthese larger scales is considered. Gettingthe scale width of applicability correct isthe first step in identifying the necessarytolerance (or robustness) of forest manage-ment focus in the Guiana Shield.
Focus
Management focus must be sufficientlyrobust to weather the vagaries of larger-scale socio-economic and biophysical fluc-tuations. Chronic boom-and-bust cycling ofcommodity production that has typifiedeconomies of the Guiana Shield createsenormous employment and inflationary rip-ples that deflect progress towards socialand economic stability.
The resulting instabilities can drivefurther environmental degradation. Bustphases are dominated by large numbers ofsmall operators seeking to meet their short-term subsistence needs with very littlecapacity or motivation to minimize collat-eral damage (e.g. Heemskerk, 2001). Theiractivities are difficult to regulate and man-age. The sum total of their individualimpacts creates a ‘tragedy of the commons’scenario where compounded use of thesame resources leads to rapid commercialextinction and options for sustainable man-agement are limited to restoration.
Alternatively, large-scale industrialextraction of resources by a few corporateoperators can ease and reduce the cost ofmonitoring for sustainable management if
the political will is sufficient to enact legis-lation mandating appropriate forms of sus-tainable management and allow thislegislation to be actively implemented.Historically, where large companies havedominated commodity economies, theexcessive weight of their political leveragehas led to large-scale devaluation of forest-lands and minimized the flow of benefits asa result of their activities. A focus on eithersmall- or large-scale routes to forest use canlead to similar outcomes, only through dif-ferent routes to management failure.
How does management fail?
Few aspirations, few opportunities
The focus of forestland use is also shapedby human aspirations and these, in turn, byprevailing social norms at the time of deci-sion-making. Education, health, communi-cation, transport and the technologies thataffect changes in living conditions can alterthese social norms and aspirations attachedto forest use. When opportunities are few,aspirations are limited and concepts oflong-term management for future forestvalue rarely figure in the extremely short-term planning horizons of most people liv-ing in the commodity-driven economies ofthe Guiana Shield.
Extending the planning horizon is animportant precondition to sustainable man-agement, but this can only occur where eco-nomic and political processes culture asense within both public and private sec-tors that forests deliver a wider and morepermanent range of benefits. The distribu-tion of benefit as a result of forest use alsoinfluences perspectives on acceptable lev-els of waste and extraction intensity. Thosederiving the least direct benefit and bearingthe greatest indirect costs from extractionare most likely to be the most conservativein their perspectives of acceptable levels.This implies that the focus can change withlevel of ownership, rather than necessarilywith the scale of management.
512 D.S. Hammond
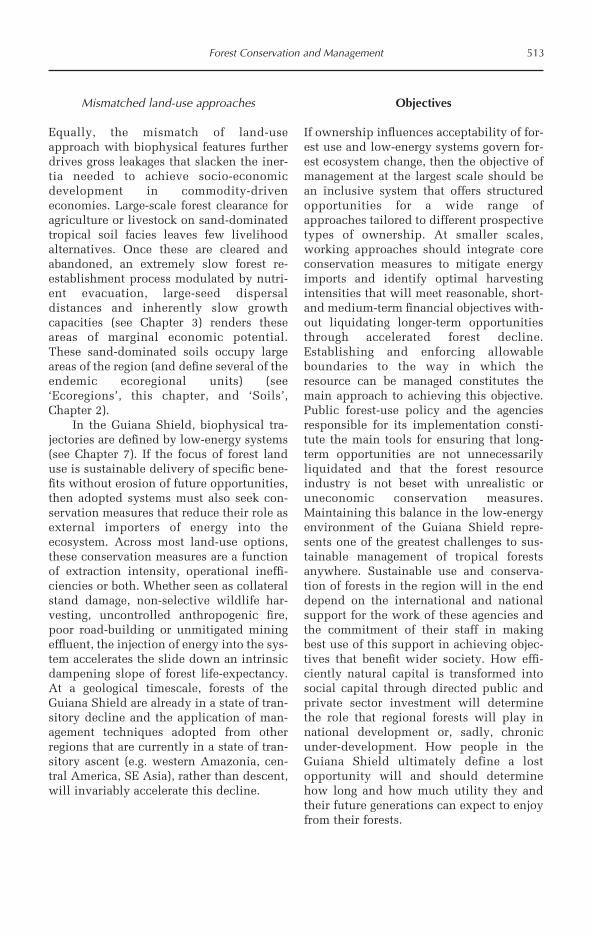
Mismatched land-use approaches
Equally, the mismatch of land-useapproach with biophysical features furtherdrives gross leakages that slacken the iner-tia needed to achieve socio-economicdevelopment in commodity-driveneconomies. Large-scale forest clearance foragriculture or livestock on sand-dominatedtropical soil facies leaves few livelihoodalternatives. Once these are cleared andabandoned, an extremely slow forest re-establishment process modulated by nutri-ent evacuation, large-seed dispersaldistances and inherently slow growthcapacities (see Chapter 3) renders theseareas of marginal economic potential.These sand-dominated soils occupy largeareas of the region (and define several of theendemic ecoregional units) (see‘Ecoregions’, this chapter, and ‘Soils’,Chapter 2).
In the Guiana Shield, biophysical tra-jectories are defined by low-energy systems(see Chapter 7). If the focus of forest landuse is sustainable delivery of specific bene-fits without erosion of future opportunities,then adopted systems must also seek con-servation measures that reduce their role asexternal importers of energy into theecosystem. Across most land-use options,these conservation measures are a functionof extraction intensity, operational ineffi-ciencies or both. Whether seen as collateralstand damage, non-selective wildlife har-vesting, uncontrolled anthropogenic fire,poor road-building or unmitigated miningeffluent, the injection of energy into the sys-tem accelerates the slide down an intrinsicdampening slope of forest life-expectancy.At a geological timescale, forests of theGuiana Shield are already in a state of tran-sitory decline and the application of man-agement techniques adopted from otherregions that are currently in a state of tran-sitory ascent (e.g. western Amazonia, cen-tral America, SE Asia), rather than descent,will invariably accelerate this decline.
Objectives
If ownership influences acceptability of for-est use and low-energy systems govern for-est ecosystem change, then the objective ofmanagement at the largest scale should bean inclusive system that offers structuredopportunities for a wide range ofapproaches tailored to different prospectivetypes of ownership. At smaller scales,working approaches should integrate coreconservation measures to mitigate energyimports and identify optimal harvestingintensities that will meet reasonable, short-and medium-term financial objectives with-out liquidating longer-term opportunitiesthrough accelerated forest decline.Establishing and enforcing allowableboundaries to the way in which theresource can be managed constitutes themain approach to achieving this objective.Public forest-use policy and the agenciesresponsible for its implementation consti-tute the main tools for ensuring that long-term opportunities are not unnecessarilyliquidated and that the forest resourceindustry is not beset with unrealistic oruneconomic conservation measures.Maintaining this balance in the low-energyenvironment of the Guiana Shield repre-sents one of the greatest challenges to sus-tainable management of tropical forestsanywhere. Sustainable use and conserva-tion of forests in the region will in the enddepend on the international and nationalsupport for the work of these agencies andthe commitment of their staff in makingbest use of this support in achieving objec-tives that benefit wider society. How effi-ciently natural capital is transformed intosocial capital through directed public andprivate sector investment will determinethe role that regional forests will play innational development or, sadly, chronicunder-development. How people in theGuiana Shield ultimately define a lostopportunity will and should determinehow long and how much utility they andtheir future generations can expect to enjoyfrom their forests.
Forest Conservation and Management 513

514 D.S. Hammond
Notes
1 This area incorporates the Jaú National Park (see Fig. 9.1 for location), Mamirauá and AmanaSustainable Development Reserves and the Anavilhanas Ecological Station (WCPA – WorldDatabase on Protected Areas).2 How the latter criterion was spatially discriminated is not clear to this author from the avail-able literature.3 Explanatory variables used in the analysis appear to violate assumption of orthogonality andare subject to unknown error structure (Vanclay, 2001). One could just as easily argue thatenforcement is proven most effective in maintaining tropical park integrity because other effortsto adequately pair protection with expanding livelihood opportunities and effort to demonstrateto people the purpose and benefits of habitat protection have been neglected or failed. In fact,degradation of adjoining habitat and effectiveness of guard density are not independent and maybe strongly correlated. A more appropriate conclusion would have stated that individualsinvolved in the establishment, management and funding of tropical parks believe that guard den-sity is the best predictor of park effectiveness. If local community residents did not form part ofthe survey, it is difficult to see how local support and participation variables were calculatedindependent of opinions expressed by park-associated respondents who may have quite differ-ent views on park performance and attribution of causality.4 This normal tax burden effectively equates to the appropriate level of economic rent sought bythe owner. In the case of the Guiana Shield, where most commercial forests are owned by thepublic and stewarded on their behalf by the relevant government agency, this rent would be thedifference between revenues and the sum of the production costs and a normal profit (oftenaround 30%). In effect, it is a rent for use of the land in its mature, timber-bearing condition.Often rent capture has been well below this difference and is believed to have formed one ofthe more important incentives for otherwise inefficient logging practices to persist. Rents,through the various forms they can take, have traditionally been very low in most countries inthe Guiana Shield (e.g. Oliphant, 1938; Palmer, 1996; Whiteman, 1999).
References
Agriconsulting (1993) Preparatory Study for the Creation of a Protected Area in the Kanuku MountainsRegion of Guyana. Agriconsulting, Rome.
Anderson, A.B. (1988) Use and management of native forests dominated by açai palm (Euterpe oleraceaMart.) in the Amazon estuary. Advances in Economic Botany 6, 144–154.
Anderson, A.B. and Jardim, M.A.G. (1989) Costs and benefits of floodplain forest management by ruralinhabitants in the Amazon estuary: a case study of Açai palm production. In: Browder, J.O. (ed.) FragileLands of Latin America: Strategies for Sustainable Development. Westview Press, London, pp.114–129.
Arkcoll, D. B. and Clement, C. (1989) Potential new crops for the Amazon. In: Wickens, G.E., Haq, N. andDay, P. (eds) New Crops for Food and Industry. Chapman and Hall, London, pp. 150–165.
Armstrong, S. and Inglis, C.J. (2000) RIL for real: introducing reduced impact logging techniques into a com-mercial forestry operation in Guyana. International Forestry Review 2, 17–23.
Barbier, E.B., Burgess, J.C., Bishop, J. and Aylward, B. (1994) The Economics of the Tropical Timber Trade.Earthscan Publications, London.
Barreto, P., Amaral, P., Vidal, E. and Uhl, C. (1988) Costs and benefits of forest management for timber pro-duction in eastern Amazonia. Forest Ecology and Management 108, 9–26.
Bojanic, A.J. (2001) Balance is Beautiful: Assessing Sustainable Development in the Rain Forests of theBolivian Amazon. PROMAB Scientific Series 4. PROMAB, Utrecht, The Netherlands.
Boltz, F., Holmes, T.P. and Carter, D.R. (2003) Economic and environmental impacts of conventional andreduced-impact logging in tropical South America: a comparative review. Forest Policy and Economics5, 69–81.

British Guiana Forest Department (1940–1965) Annual Report of the Forest Department. Department ofLands and Mines, Georgetown, Guyana
Bruner, A.G., Gullison, R.E., Rice, R.E. and da Fonseca, G.A.B. (2001) Effectiveness of parks in protectingtropical biodiversity. Science 291, 125–128.
Bryant, D., Nielsen, D. and Tangley, L. (1997) The Last Frontier Forests – Ecosystems and Economies on theEdge. World Resources Institute, Washington, DC.
Carvalho, G., Barros, A.C., Moutinho, P. and Nepstad, D. (2001) Sensitive development could protectAmazonia instead of destroying it. Nature 409, 131.
Chao, N.L. and Prang, G. (1997) Project Piaba – towards a sustainable ornamental fishery in the Amazon.Aquarium Sciences and Conservation 1, 105–111.
Chape, S., Blyth, S., Fish, L., Fox, P. and Spalding, M. (2003) 2003 United Nations List of Protected Areas.IUCN/UNEP-WCMC, Cambridge, UK.
Colchester, M. (1997) Guyana: Fragile Frontier. Earthscan Publications, London.Colinvaux, P.A., De Oliveira, P.E., Moreno, J.E., Miller, M.C. and Bush, M.B. (1996) A long pollen record
from lowland Amazonia: forest and cooling in glacial times. Science 274, 85–88.Coomes, D.A. and Grubb, P.J. (1996) Amazonian caatinga and related communities at La Esmeralda,
Venezuela: forest structure, physiognamy and floristics, and control by soil factors. Vegetatio 122,167–191.
Cooper, A. (1979) Muri and white sand savannah in Guyana, Surinam and French Guiana. In: Specht, R.L.(ed.) Heathlands and Related Shrublands. Elsevier, Amsterdam, pp. 471–481.
Cordier, S., Grasmick, C., Paquier-Passelaigue, M., Mandereau, L., Weber, J.P. and Jouan, M. (1998) Mercuryexposure in French Guiana: levels and determinants. Archives of Environmental Health 53, 299–303.
Davis, S.D., Heywood, V.H., Herrera-McBryde, O., Villa-Lobos, J. and Hamilton, A.C. (1997) Centres ofPlant Diversity. A Guide and Strategy for their Conservation. Volume 3 – the Americas. WWF-IUCN,Gland, Switzerland.
Davis, T.A.W. and Richards, P.W. (1933) The vegetation of Moraballi creek, British Guiana: an ecologicalstudy of a limited area of tropical rain forest. I. Journal of Ecology 21, 350–384.
de Graaf, N.R. (1986) A Silvicultural System for Natural Regeneration of Tropical Rain Forest in Suriname.Pudoc/WAU, Wageningen, The Netherlands.
de Graaf, N.R. (2000) Reduced impact logging as part of the domestication of neotropical rainforest.International Forestry Review 2, 40–44.
de Graaf, N.R., Poels, R.L.H. and van Rompaey, R.S.A.R. (1999) Effect of silvicultural treatment on growthand mortality of rainforest in Surinam, over long periods. Forest Ecology and Management 124,123–135.
de Kom, J.F., van der Voet, G.B. and de Wolff, F.A. (1998) Mercury exposure of maroon workers in the smallscale gold mining in Suriname. Environmental Research 77, 91–97.
de Milde, R. (1970) Assessment of Hidden Defects on Standing Trees During Inventory Work. TechnicalReport No. 4 (SF/GUY 9). FAO/UNDP, Georgetown, Guyana.
de Milde, R. and Inglis, C.J. (1974) Defect Assessment of Standing Trees. FAO Project Working DocumentNo. 14 FO/SF/SUR/71/506. FAO, Paramaribo, Suriname.
De Souza, B. (1997) Towards a Methodology for the Economic Valuation of Non-timber Forest Products: AView from Guyana. GNRA, Georgetown, Guyana.
Denevan, W.D. (1970) Aboriginal drained field cultivation in the Americas. Science 169, 647–654.Dickinson, M.B., Dickinson, J.C. and Putz, F.E. (1996) Natural forest management as a conservation tool in
the tropics: divergent views on possibilities and alternatives. Commonwealth Forestry Review 75,309–315.
Duivenvoorden, J.F. and Lips, J.M. (1995) A Land–Ecological Study of Soils, Vegetation and Plant Diversityin Colombian Amazonia. Tropenbos Foundation, Wageningen, The Netherlands.
Duplaix, N. (2001) Evaluation of the Animal and Plant Trade in the Guianas – Preliminary Findings. WWF-Guianas, Cayenne, French Guiana.
Dykstra, D. and Heinrich, R. (eds) (1996) Forest Codes of Practice – Contributing to Environmentally SoundForest Operations. FAO Forestry Paper 133. FAO, Rome.
Environmental Resources Management (1995) Environmental and Social Impact Assessment: Linden-LethemRoad, Guyana. ERM, London.
Evans, C. and Meggers, B.J. (1960) Archeological Investigations in British Guiana. Bulletin of the Bureau ofAmerican Ethnology, 177. Smithsonian Institution Press, Washington, DC.
FAO (2001) Global Forest Resources Assessment 2000. FAO Forestry Paper 140. FAO, Rome.
Forest Conservation and Management 515
Fanshawe, D.B. (1952) The Vegetation of British Guiana: A Preliminary Review. Institute paper 29. ImperialForestry Institute, Oxford, UK.
Fanshawe, D.B. (1954) Forest types of British Guiana. Caribbean Forester 15, 73–111.Fimbel, R.A., Grajal, A. and Robinson, J.G. (eds) (2001) The Cutting Edge – Conserving Wildlife in Logged
Tropical Forests. Biology and Resource Management Series. Columbia University Press, New York.Forte, J. (1989) Wildlife, timber and balata. In: Forte, J. (ed.) The Material Culture of the Wapishana People
of the South Rupununi Savannahs in 1989. ARU – University of Guyana, Turkeyen, pp. 41–44.Forte, J. (1990) A Preliminary Assessment of the Road to Brazil. ARU – University of Guyana. Turekeyen.Forte, J. and Benjamin, A. (1993) The Road from Roraima State. ARU – University of Guyana, Turkeyen.Fostier, A.H., Forti, M.C., Guimaraes, J.R.D., Melfi, A.J., Boulet, R., Espirito Santo, C.M. and Krug, F.J. (2000)
Mercury fluxes in a natural forested Amazonian catchment (Serra do Navio, Amapa state, Brazil).Science of the Total Environment 260, 201–211.
Freese, C.H. (1998) Wild Species as Commodities. Island Press, Washington, DC.Funk, V.A. and Richardson, K.S. (2002) Systematic data in biodiversity studies: use it or lose it. Systematic
Biology 51, 303–316.Funk, V.A., Fernanda Zermoglio, M. and Nazir, N. (1999) Testing the use of specimen collection data and
GIS in biodiversity exploration and conservation decision-making in Guyana. Biodiversity andConservation 8, 727–751.
Furch, K. (1984) Water chemistry of the Amazon basin: the distribution of chemical elements among fresh-waters. In: Sioli, H. (ed.) The Amazon. Limnology and Landscape Ecology of a Mighty Tropical Riverand its Basin. Dr. W. Junk, Dordrecht, The Netherlands, pp. 167–195.
Gibbs, A.K. and Barron, C.N. (1993) The Geology of the Guiana Shield. Oxford University Press, Oxford, UK.Goodland, R. and Daly, H. (1996) Environmental sustainability: universal and non-negotiable. Ecological
Applications 6, 1002–1017.Goulding, M., Carvalho, M.L. and Ferreira, E.G. (1988) Rio Negro: Rich Life in Poor Water. SPB Academic,
The Hague, The Netherlands.Grayum, G. (1971) Logging and Forest Management. UNDP Technical Report 12 (Guyana). UNDP,
Georgetown, Guyana.Hammond, D.S. (1999) Quality vs. Quantity in the Quest for Sustainable Forest Management in the Guiana
Shield. Sustainable Forest-Based Business Partnerships, Georgetown, Guyana, Iwokrama InternationalCentre.
Hammond, D.S. and Brown, V.K. (1995) Seed size of woody plants in relation to disturbance, dispersal, soiltype in wet neotropical forests. Ecology 76, 2544–2561.
Hammond, D.S. and ter Steege, H. (1998) Propensity for fire in the Guianan rainforests. Conservation Biology12, 944–947.
Hammond, D.S., Gourlet-Fleury, S., van der Hout, P., ter Steege, H. and Brown, V.K. (1996) A compilationof known Guianan timber trees and the significance of their dispersal mode, seed size and taxonomicaffinity to tropical rain forest management. Forest Ecology and Management 83, 99–106.
Hammond, D.S., van der Hout, P., Zagt, R., Marshall, G., Evans, J. and Cassells, D.S. (2000) Benefits, bot-tlenecks and uncertainties in the pantropical implementation of reduced impact logging techniques.International Forestry Review 2, 45–53.
Heemskerk, M. (2001) Do international commodity prices drive natural resource booms? An empirical analy-sis of small-scale gold mining in Suriname. Ecological Economics 39, 295–308.
Henderson, A., Galeano, G. and Bernal, R. (1995) Field Guide to the Palms of the Americas. PrincetonUniversity Press, Princeton, New Jersey.
Hendrison, J. (1989) Damage-controlled Logging in Managed Tropical Rain Forest in Suriname. WAU,Wageningen, The Netherlands.
Heyligers, P.C. (1963) Vegetation and soil of a white-sand savanna in Suriname. Verhandelingen derKoninklijke Nederlandse Akademie van Wetenschappen, Afd. Natuurkunde 54, 1–148.
Hohenkerk, L.S. (1922) A review of the timber industry of British Guiana. Journal of the Board of Agricultureof British Guiana 15, 2–22.
Holmes, T.P., Blate, G.M., Zweede, J.C., Pereira, R.J., Barreto, P., Boltz, F. and Bauch, R. (1999) FinancialCosts and Benefits of Reduced-impact Logging Relative to Conventional Logging in the Eastern Amazon.Phase 1 final report. TFF/USFS, Belem.
Hoosein, M. (1996) A Review of Protection Criteria in Previous Documentation for Protected Areas inGuyana. Guyana Environmental Protection Agency, Turkeyen, Guyana.
Hubbell, S.P., Foster, R.B., O’Brien, S.T., Harms, K.E., Condit, R., Wechsler, B., Wright, S.J. and de Lao, S.L.
516 D.S. Hammond
(1999) Light-gap disturbances, recruitment limitation, and tree diversity in a neotropical forest. Science283, 554–557.
Huber, O. (1995) Conservation of the Venezuelan Guayana. In: Berry, P.E., Holst, B.K. and Yatskievych, K.(eds) Flora of the Venezuelan Guayana. Timber Press, Portland, Oregon, pp. 193–218.
Huber, O. (1997) Pantepui region of Venezuela. In: Davis, S.L.D., Heywood, V.H., Herrera-MacBryde, O.,Villa-Lobos, J. and Hamilton, A.C. (eds) Centres of Plant Diversity – A Guide and Strategy for theirConservation. Vol. 3. The Americas. World Wildlife Fund for Nature (WWF) and The WorldConservation Union-IUCN. IUCN Publications Unit, Cambridge, UK, pp. 308–311.
Huber, O. (2001) Conservation and environmental concerns in the Venezuelan Amazon. Biodiversity andConservation 10, 1627–1643.
IBGE (2000) Cidades@. IBGE (http://www.ibge.gov.br/cidadesat).IBGE (2002) Banco de dados agregados-extração vegetal. IBGE (http://www.sidra.ibge.gov.br).Im Thurn, E.F. (1883) Among the Indians of Guiana. Kegan Paul, Trench and Co., London.Jansen, P.A. and Zuidema, P. (2001) Logging, seed dispersal by vertebrates, and natural regeneration of trop-
ical timber trees. In: Fimbel, R., Grajal, A. and Robinson, J.G. (eds) The Cutting Edge – ConservingWildlife in Logged Tropical Forests. Columbia University Press, New York, pp. 35–59.
Johnston, D.V. (1995) Report on the palm cabbage industry in northwest Guyana. In: Forte, J. (ed.)Indigenous Use of the Forest – Situation Analysis with Emphasis on Region 1. ARU – University ofGuyana, Georgetown, pp. 62–67.
Jonkers, W.B.J. and Schmidt, P. (1984) Ecology and timber production in tropical rain forest in Suriname.Interciencia 9, 290–298.
Kalliola, R.J., Jokinen, P. and Tuukki, E. (1999) Fluvial dynamics and sustainable development in upper RioAmazonas, Peru. In: Padoch, C., Ayres, J.M., Pinedo-Vasquez, M. and Henderson, A. (eds) Várzea –Diversity, Development and Conservation of Amazonia’s Whitewater Floodplains. NYBG Press, NewYork, pp. 271–282.
Kammesheidt, L., Köhler, P. and Huth, A. (2001) Sustainable timber harvesting in Venezuela: a modellingapproach. Journal of Applied Ecology 38, 756–770.
Kennedy, L.M. and Horn, S.P. (1997) Prehistoric maize cultivation at the La Selva biological station, CostaRica. Biotropica 29, 368–370.
King, K.F.S. (1963) The role of the forest in the future economy of British Guiana. Commonwealth ForestryReview 42, 237–241.
King, K F.S. (1965) The use of arboricides in the management of tropical high forest. Turrialba 15, 35–39.Ledru, M.-P., Blanc, P., Charles-Dominique, P., Fournier, M., Martin, L., Riera, B. and Tardy, C. (1997)
Reconstituion palynologique de la forêt guyanaise au cours des 3000 dernières années. Comptes Rendude l’Academie des Sciences, Paris 324, 469–476.
Lescure, J.-P. and Boulet, R. (1985) Relationships between soil and vegetation in a tropical rain forest inFrench Guiana. Biotropica 17, 155–164.
Liu, K.-b. and Colinvaux, P.A. (1985) Forest changes in the Amazon basin during the last glacial maximum.Nature 318, 556–557.
Lugo, A.E. (1995) Management of tropical biodiversity. Ecological Applications 5, 956–961.Mackay, M.S. (1926) The durability of Greenheart. Journal of the Board of Agriculture of British Guiana 19(1),
10–12.McNabb, K.L. and Wadouski, L.H. (1999) Multiple rotation yields for intensively managed plantations in the
Amazon basin. New Forests 18, 5–15.McTurk, M. (1882) Notes on the forests of British Guiana. Timehri 1, 173–215.Meggers, B.J. (1996) Amazonia – Man and Culture in a Counterfeit Paradise. Revised edition. Smithsonian
Institution Press, London.Miller, J.R., Lechler, P.J. and Bridge, G. (2003) Mercury contamination of alluvial sediments within the
Essequibo and Mazaruni river basins, Guyana. Water, Air and Soil Pollution 148, 139–166.Mittermeier, R.A., Mittermeier, C.G., Brooks, T.M., Pilgrim, J.D., Konstant, W.R., da Fonseca, G.A.B. and
Kormos, C. (2001) Wilderness and biodiversity conservation. Proceedings of the National Academy ofSciences USA 100, 10309–10313.
Mol, J.H., Ramlal, J.S., Lietar, C. and Verloo, M. (2001) Mercury contamination in freshwater, estuarine, andmarine fishes in relation to small-scale gold mining in Suriname, South America. EnvironmentalResearch 86, 183–197.
Moran, E.F. (1995) Rich and poor ecosystems of Amazonia: an approach to management. In: Nishizawa, T. andUitto, J.I. (eds) The Fragile Tropics of Latin America. United Nations University Press, Tokyo, pp. 45–67.
Forest Conservation and Management 517

Myers, N., Mittermeier, R.A., Mittermeier, C.G., Fonseca, G.A.B. and Kent, J. (2000) Biodiversity hotspots forconservation priorities. Nature 403, 853–858.
Nriagu, J.O., Pfeiffer, W.C., Malm, O., Souza, C.M.M. and Mierle, G. (1992) Mercury pollution in Brazil.Nature 356, 389.
OCEI/MARNR (2000) Densidad demográfica. OCEI (http://www.ocei.gov.ve).Oliphant, F.M. (1938) The Commercial Possibilities and Development of the Forests of British Guiana. The
Argosy Co. Ltd, Georgetown, Guyana.Olson, D.M., Dinerstein, E., Wikramanayake, E.D., Burgess, N.D., Powell, G.V.N., Underwood, E.C.,
D’Amico, J.A., Itoua, I., Strand, H.E., Morrison, J.C., Loucks, C.J., Allnutt, T.F., Ricketts, T.H., Kura, Y.,Lamoreux, J.F., Wettengel, W.W., Hedao, P. and Kassem, K.R. (2001) Terrestrial ecoregions of theworld: a new map of life on Earth. Bioscience 51, 933–938.
Ouboter, P. (2001) Assessment of the Traded Wildlife Species. WWF-Guianas, Paramaribo, Suriname.Ousman, S. (1999) A socio-economic and biophysical assessment of the Iwokrama road corridor, Guyana.
MSc thesis, University of West Indies – Mona, Kingston.Palmer, C.J., Validum, L., Loeffke, B., Laubach, H.E., Mitchell, C., Cummings, R. and Cuadrado, R.R. (2002)
HIV prevalence in a gold mining camp in the Amazon region, Guyana. Emerging Infectious Diseases 8,330–331.
Palmer, J.R. (1986) Lessons for land managers in the tropics. Revue Bois et Forêts des Tropiques 212, 16–27.Palmer, J.R. (1996) Report on Forest Revenue Systems. GFC DfID Support Project, Oxford, UK.Pearce, D., Putz, F.E. and Vanclay, J.K. (2003) Sustainable forestry in the tropics: panacea or folly? Forest
Ecology and Management 172, 229–247.Peña, M. and Zuidema, P. (1999) Limitaciones demográficas para el aprovechamiento sostenible de Euterpe
precatoria para producción de palmito en dos tipos de bosque de Bolivia. Ecología en Bolivia 33, 3–21.Perreijn, K. (2002) Symbiotic Nitrogen Fixation by Leguminous Trees in Tropical Rain Forest in Guyana.
Tropenbos-Guyana Series 11. Tropenbos-Guyana, Georgetown.Pilgrim, K. (1993) Guyana’s wildlife trade. Guyana Review 5, 8–10.Piperno, D. (1990) Fitolitos, arqueología y cambios prehistóricos de la vegetación en un lote de cincuenta
hectáreas de la isla de Barro Colorado. In: Leigh, E.G.J., Rand, A.S. and Windsor, D.M. (eds) Ecologíade un Bosque Tropical. STRI, Balboa, Panama, pp. 153–156.
Plumptre, A. (1995) The importance of ‘seed trees’ for the natural regeneration of selectively logged tropicalforest. Commonwealth Forestry Review 74, 253–258.
Pollak, H., Mattos, M. and Uhl, C. (1995) A profile of palm heart extraction in the Amazon estuary. HumanEcology 23, 357–386.
Prince, A.J. (1971) The rate of growth of Greenheart (Ocotea rodiaei Schomb.). Commonwealth ForestryReview 52, 143–146.
Putz, F.E. (1991) Silvicultural effects of lianas. In: Putz, F.E. and Mooney, H.A. (eds) The Biology of Vines.Cambridge University Press, Cambridge, UK, pp. 493–501.
Pyne, S.J. (2001) Year of the Fires – the Story of the Great Fires of 1910. Viking Press, New York.Ramdass, I. and Haniff, M. (1990) A Definition of Priority Conservation Areas in Amazonia. Guyana country
paper. Biological priorities for conservation in Amazonia. Conservation International, Washington,DC.
Räsänen, M.E., Salo, J.S. and Kalliola, R.J. (1987) Fluvial perturbance in the western Amazon basin: regula-tion by long-term sub-Andean tectonics. Science 238, 1398–1401.
Redford, K.H. (1993) Hunting in neotropical forests: a subsidy from nature. In: Hladik, C.M., Hladik, A.,Linares, O.F., Pagezy, H., Sample, A. and Hadley, M. (eds) Tropical Forests, People and Food.Parthenon Publishing, Paris, pp. 227–246.
Repetto, R. and Gillis, M. (eds) (1988) Public Policies and the Misuse of Forest Resources. CambridgeUniversity Press, Cambridge, UK.
Richards, P.W. (1952) The Tropical Rain Forest. Cambridge University Press, Cambridge, UK.Richards, P.W. (1996) The Tropical Rain Forest: An Ecological Study. Cambridge University Press,
Cambridge, UK.Rodríquez, J.P. and Rojas-Suárez, F. (1996) Guidelines for the design of conservation strategies for the ani-
mals of Venezuela. Conservation Biology 10, 1245–1252.Rollet, B. (1980) Jari: succès ou échec? Un exemple de développement agro-sylvo-pastoral et industriel en
Amazonie brésilienne. Bois et Forêts des Tropiques 192, 3–34.Roulet, M., Lucotte, M., Farella, N., Serique, G., Coelho, H., Sousa Passos, C.J., Jesus da Silva, E., Scavone
de Andrade, P., Mergler, D., Guimaraes, J.R.D. and Amorim, M. (1999) Effect of recent human colo-
518 D.S. Hammond
nization on the presence of mercury in Amazonian ecosystems. Water, Air and Soil Pollution 112,297–313.
Russell, C.E. (1987) Plantation forestry. In: Jordan, C.F. (ed.) Amazonian Rain Forests – EcosystemDisturbance and Recovery. Springer, Berlin, pp. 76–89.
Santos, G.M., Cordeiro, R.C., Silva Filho, E.V., Turcq, B., Lacerda, L.D., Fifield, L.K., Gomes, P.R.S.,Hausladen, P.A., Sifeddine, A. and Albuquerque, A.L.S. (2001) Chronology of the atmospheric mercuryin Lagoa da Pata basin, upper Rio Negro region of Brazilian Amazon. Radiocarbon 43, 801–808.
Schulz, J.P. (1960) Ecological studies on rain forest in Northern Suriname. Verhandelingen der KoninklijkeNederlandse Akademie van Wetenschappen, Afd. Natuurkunde 163, 1–250.
Silva, J.M.N., de Carvalho, J.O.P., Lopes, J.C.A., de Almeida, B.F., Costa, D.H.M., de Oliviera, L.C., Vanclay,J.K. and Skovs.gaard, J.P. (1995) Growth and yield of a tropical rain forest in the Brazilian Amazon 13years after logging. Forest Ecology and Management 71, 267–274.
Silva-Forsberg, M.C., Forsberg, B.R. and Zeidemann, V.K. (1999) Mercury contamination in humans linkedto river chemistry in the Amazon Basin. Ambio 28, 519–521.
Sing, K.A., Hryhorczuk, D.O., Saffirio, G., Sinks, T., Paschal, D.C. and Chen, E.H. (1996) Environmentalexposure to organic mercury among the Makuxi in the Amazon basin. International Journal ofOccupational and Environmental Health 2, 165–171.
Sist, P., Nolan, T., Bertault, J.-G. and Dykstra, D. (1998) Logging intensity versus sustainability in Indonesia.Forest Ecology and Management 108, 251–260.
Spangenberg, A., Grimm, U., Sepeda da Silva, J.R. and Fölster, H. (1996) Nutrient store and export rates ofEucalyptus urograndis plantations in eastern Amazonia (Jari). Forest Ecology and Management 80,225–234.
Spencer, C.S., Redmond, E.M. and Rinaldi, M. (1998) Prehispanic causeways and regional politics in thellanos of Barinas, Venezuela. Latin American Antiquity 9, 95–110.
Stattersfield, A.J., Crosby, M.J., Long, A.J. and Wege, D.C. (1998) Endemic Bird Areas of the World – Prioritiesfor Biodiversity Conservation. Birdlife Conservation Series No. 7. Birdlife International, London.
ter Steege, H. (1998) The use of forest inventory data for a National Protected Area Strategy in Guyana.Biodiversity Conservation 7, 1457–1483.
ter Steege, H. (2000) Plant Diversity in Guyana. Tropenbos Series 18. Tropenbos Foundation, Wageningen,The Netherlands.
ter Steege, H. and Hammond, D.S. (1996) Forest management in the Guianas: ecological and evolutionaryconstraints on timber production. BOS Nieuwsletter 15, 62–69.
ter Steege, H. and Hammond, D.S. (2001) Character convergence, diversity, and disturbances in tropical rainforest in Guyana. Ecology 82, 3197–3212.
ter Steege, H. and Zondervan, G. (2000) A preliminary analysis of large-scale forest inventory data of theGuiana Shield. In: ter Steege, H. (ed.) Plant Diversity in Guyana. Tropenbos Foundation, Wageningen,The Netherlands, pp. 35–54.
ter Steege, H., Jetten, V.G., Polak, A.M. and Werger, M.J.A. (1993) Tropical rain forest types and soil factorsin a watershed area in Guyana. Journal of Vegetation Science 4, 705–716.
ter Steege, H., Boot, R.G.A., Brouwer, L.C., Hammond, D.S., van der Hout, P., Jetten, V.G., Khan, Z., Polak,A.M., Raaimakers, D. and Zagt, R. (1995) Basic and applied research for sound rain forest managementin Guyana. Ecological Applications 5, 904–910.
ter Steege, H., Sabatier, D., Castellanos, H., van Andel, T., Duivenvoorden, J.F., de Oliveira, A.A., Ek, R.C.,Lilwah, R., Maas, P.J.M. and Mori, S.A. (2000) An analysis of Amazonian floristic composition, includ-ing those of the Guiana Shield. Journal of Tropical Ecology 16, 801–828.
ter Steege, H., Welch, I.A. and Zagt, R. (2002) Long-term effect of timber harvesting in the Bartica Triangle,Central Guyana. Forest Ecology and Management 170, 127–144.
Thompson, J., Proctor, J., Viana, V., Milliken, W., Ratter, J.A. and Scott, D.A. (1992) Ecological studies on alowland evergreen rain forest on Maracá Island, Roraima, Brazil. I. Physical environment, forest struc-ture and leaf chemistry. Journal of Ecology 80, 689–703.
USGS and CVGTM (1993) Geology and Mineral Resource Assessment of the Venezuelan Guayana Shield.USGS Bulletin 2062. US GPO, Washington, DC.
van Andel, T. (1998) Commercial exploitation of non-timber forest products in the north-west district ofGuyana. Caribbean Journal of Agriculture and Natural Resources 2, 15–28.
van Andel, T. (2000) Non-timber Forest Products of the North West District of Guyana. Part I. Tropenbos-Guyana Series 8A. Tropenbos-Guyana Programme, Georgetown.
van der Hout, P. (1999) Reduced Impact Logging in the Tropical Rain Forest of Guyana. Ecological,
Forest Conservation and Management 519
Economic and Silvicultural Consequences. Tropenbos-Guyana Series 6. Tropenbos-GuyanaProgramme, Georgetown.
van der Hout, P. (2000) Testing the applicability of reduced impact logging in greenheart forest in Guyana.International Forestry Review 2, 24–32.
Vanclay, J. (2001) The effectiveness of parks. Science 293, 1007.Veiga, M.M., Meech, J.A. and Onate, N. (1994) Mercury inputs from forest fire in the Amazon. Nature 368,
816–817.Veillon, J.P. (1985) El crecimiento de algunas bosques naturales de Venezuela en relación con los parámet-
ros del medio ambiente. Revista Forestal Venezolana 29, 5–121.Vink, A.T. (1970) Forestry in Surinam – a Review of Policy, Planning, Projects, Progress. Suriname Forest
Service (LBB), Paramaribo.Welch, I.A. (1975a) A Short History of the Guyana Forest Department 1925–1975. Guyana Forestry
Commission, Georgetown.Welch, I.A. (1975b) The Timber Resources of Guyana. Technical report. Guyana Forest Department,
Georgetown.Whiteman, A. (1999) Economic Rent from Forest Operations in Suriname and a Proposal for Revising its
Forest Revenue System. FAO, Rome.Williams, D. (1994) Annex C. Archaeology and anthropology. In: Environmental Impact Assessment – the
Linden Lethem Road. ERM, Georgetown, GuyanaWinkler, N. (1997) Environmentally Sound Forest Harvesting – Testing the Applicability of the FAO Model
Code in the Amazon in Brazil. Forest Harvesting Case Study No. 8. FAO, Rome.Zagt, R.J. (1997) Tree Demography in the Tropical Rain Forest of Guyana. Tropenbos-Guyana Series 3.
Tropenbos-Guyana Programme, Georgetown.
520 D.S. Hammond
açai see EuterpeAcarai Mountains 29, 38, 47, 136–137, 421Acrisols 49, 50, 52–54, 63–65, 153Acromyrmex see leaf-cutting antsAfobakka Dam 455Africanized honeybee 324, 334–335agoutis see Dasyproctaaldeias 413, 416, 421Alexa 238, 310, 366, 496Alfisols see Nitisolsallochthonous soil 61–62, 362Alter De Chaõ Formation 42, 45aluminium 17, 48, 53–55, 63, 66, 153,
196, 215–216, 222–224, 403,433–434
Amacu 407Amax see light saturated rate of
photosynthesisAmazon Downwarp 20, 40–42, 56, 60, 64,
71–72, 74, 98, 100, 153, 156,158–159, 161, 366, 369, 372, 390,400, 403–405, 446, 454, 483, 492,497
Amerindian land titles 464Amerindian populations 401, 442, 462annatto 407, 411–412, 420Annonaceae 250–251, 266, 269, 327Anoura 255ant plants 298, 308Anthrosols 58–59Antonio de Berrio 406Apis mellifera see Africanized honeybeeApoteri Suite 21Ara 264Araracuara Formation 39, 78
Arecaceae 247–249, 266, 366, 368–369, Arenosols 53–54, 60–61, 64, 157,
222–223, 302arrecife see lateritearte rupestre see petroglyphsArtibeus 243, 257, 269assemblages de pierres see stone
arrangementsAstrocaryum 241, 254, 261, 263, 268, 269,
327Ateles 238, 241Atlantic ENSO 88, 92–93Atmospheric Optical Depth 118Atorai 421, 462Atta see leaf-cutting antsAttalea 246–248, 250, 260, 268, 351,
369–370, 448autochthonous soils 61Avanavero Suite 21, 30, 36, 50, 52, 151Avança Brasil 510aviamento 423, 442, 446
Babaçu forests 42Bagassa 244, 247Bakhuys Mountains 24, 56, 96–97, 434,
39–40, 47balata 350, 419–420, 422, 439, 441,
443–444, 465balata franc see ManilkaraBalbina dam 455Barbaekoeba 400barriers to movement 483, 235Barro Colorado Island 65, 235, 248,
250–251, 295, 311, 356
Index
521

Bauxite 31, 55–56, 63, 70, 161, 422–423,434–435
BCI see Barro Colorado Islandbearded bellbird see Procniasbedload transport 149–150Bellucia 241, 246Belterra Clays 42Berbice Basin 9, 28, 31, 39, 40, 46, 53,
138–139, 161, 455Berbice Formation 45, 54–55, 403, 491biodiversity hotspots 492Bixa orellana see annattoBoa Vista 31, 44, 72, 80, 514Bombacaceae 239, 255–256, 301, 366boom-and-bust 431, 444, 446, 465,
512Bouger gravity 31, 42Bradypus 245Brazil nut 405, 442, 445–446Brazilwood 407, 420Bretton Woods Agreement 427brown-bearded sakis see ChiropotesBrownsberg 236, 252, 434Buckleburg 400, 402Bulletwood see Manilkara
C3 pathway 196–197Cacao 413cachicoera see natural impoundmentsCaesalpiniaceae 219, 222, 239, 241,
243–246, 248, 253–256, 258, 270,301–302, 307, 324, 365
Caluromys 245, 256–257calzados see causewaysCAM see Crassulacean acid metabolismcampinarana 354, 491Campsiandra 254CAMREX 147Canaima National Park 484, 486Caño Ventosidad 401–402Capuchin missions 412–414, 419, 421,
464Caquetá, 9, 31, 45, 53, 66, 134, 136, 139,
141, 145, 403Carapa 207, 209–211, 239, 253, 261–262,
309, 315, 413, 448, 450, 499carbon dioxide see greenhouse gasescarbonic acid 48, 63Caribs 409, 412Carollia 241–243Caryocar 241, 255, 258
Casiquiare 30–31, 36, 42–43, 101, 136,138–139, 141–142
cataracts see natural impoundmentscation exchange capacity 48, 50, 64, 153Catostemma 203–204, 209, 219, 239 , 247,
301, 309, 311, 355causeways 382, 401caviomorph rodents 249, 260, 262,
269–270Cebus 243–244, 256, 509Cecropia 199–200, 203, 206–207, 209,
217, 219, 223, 242, 245, 247, 252,257–258, 305, 307, 325, 336, 368,370
Cedrela 362, 448, 450, 499, 501CELOS system 501Central Granulite Belt 26Central Guiana Granulite Belt 28, 39Central Suriname Reserve 484Cerambycidae 296, 298, 311champs drainés see raised fieldschannel behaviour 138charcoal 102, 105, 106, 112, 260, 350, 384,
386–389, 399, 402–404, 497Charles Goodyear 419chiquichiqui see LeopoldiniaChiribiquete 9, 38, 46–47, 64, 78, 134,
136, 141, 395–396Chiropotes 245, 263chlorite 152Chlorocardium 198–200, 203, 207, 209,
217, 219, 223, 239, 262, 301, 307,309, 351, 355, 358, 368, 419, 448,496, 501
Chrysobalanaceae 241, 245, 248–249, 252,254, 258, 265, 364, 366
Chrysomelidae 298, 302, 305–307, 325Cicadellidae 298, 301Cixiidae 298, 301Clathrotropis 222, 249, 261, 355Cloelopus 245Clovis period 237, 386, 89, 404, 464, 482Clusia 197, 249, 252, 256, 259, 328Cnemidophorus 254cock-of-the-rock see RupicolaCoendou 250conservation units 494, 496, 514copaiba see CopaiferaCopaifera 413Coropina Formation 31, 45Cotingidae 252Crassulacean acid metabolism 196
522 Index

Crax 263–264crystalline basement complex 20, 34, 38,
97cumarin see DipteryxCurassows see CraxCurculionidae 298, 305, 307–308, 325,
327cutting cycle 501
dampening systems 349, 352, 356–358Daniel de la Revardiere 408Dasyprocta 237, 241, 249–250, 260, 262,
264, 268deforestation rates 484Demerara Formation 45diamonds 422–423, 435, 437–438, 507Dicorynia guianensis 198, 201–202,
210–211, 218–219, 246, 264, 496,499
Dicymbe 355, 358, 496, 217, 219, 239,270, 302, 309
Dipteryx 219, 250, 253, 258, 260, 444–445,499, 508
discharge rate 133, 140–146, 153, 155,158, 349
dissolved sediments 146, 154donatários 412drought 54, 62, 74, 85, 87, 92, 95, 98, 106,
112, 115, 210–212, 350–351, 356,361, 364–365, 382–383, 394,404–405
Dutch West Indies Company 407, 409,413, 416
DWIC see Dutch West IndiesCompany
dyewood see Brazilwood
ecoregions 490–491Eira 250El Dorado 6, 406–407, 419El Gaván 401El Niño see ENSOembalses see reservoirsEmerillon 421endemism 311–312, 331ENSO 75–76, 85, 87, 94, 145, 205, 210,
234–236, 260, 347, 350–351, 356,364, 394, 404, 458
entradas 412environmental determinism 381
environmental lapse rate 97, 113environmental uniformity 372, 496, 511epeirogenic adjustment 164, 166, 236,
343, 388Eucalyptus 499euglossines 329, 340Euphorbiaceae 253–254, 264, 310, 328Euterpe 247, 251, 253, 268, 325, 336, 369,
445–446, 448, 465, 508–509extractivistas 439
falls see natural impoundmentsfaunal diversity 234Ferralsols 49–52, 55, 60, 62–65, 222–223,
239, 403ferricrete see lateriteFicus 199, 242–243, 245–246, 251–252,
257, 267, 328fig wasps 328, 331, 334, 338fire 127, 132, 135, 142, 143, 251, 280, 354,
355, 356, 357, 359, 361, 363, 364,373, 389, 391, 393, 397, 399, 401,423, 471, 472, 485, 505–507, 523,532, 550, 551, 485, 532
flooding 54–56, 62, 87, 101, 111, 146, 154,211, 240, 361, 382
Fluvisols 56–57, 61–62, 64, 66forest roads 510forest trajectory 385forest turnover 357fossil pollen 106, 110–113, 131Francis Willoughby 411friagem 89
Galerucinae 305, 307garimpeiros 429, 431, 438GB see Guiana BasinGeochelone 254géoglyphes see stone arrangementsgeomorphography 346, 349, 355–356,
492giant Amazon river turtle see Podocnemisgibbsite 63, 152glaucony 163Gleysols 56–57, 61–62, 139global oceanic conveyor 82, 117Glossophaga 252Gnetum 253gold mining 423, 429–430, 432–434, 438,
506–507, 509
Index 523
Goupia glabra 197, 199–200, 203,206–221, 217, 219, 223, 251, 259,301, 307
Gran Sabana 29–31, 74, 101, 112, 141,234, 397, 404, 463
Grancolombia 414gray brocket deer see MazamaGreenheart see Chlorocardiumgreenhouse gases 63, 122, 128, 133, 148,
156, 159greenstones 20–21, 24–26, 28–30, 38, 41,
45, 63, 139, 394, 423–424, 428,491–492
grindstones see polissoirsGuiana (Guayana) Basin 135, 137, 148,
155, 165, 439, 444, 446Guiana Current 40, 44, 96, 131, 140Guri dam 455Guri Fault 41
Hadley Circulation 81–83, 88–89, 94, 107,116, 123, 130–131
Hertenrits 400, 402Hevea brasiliensis see rubberhidden defects in timber trees 501Histosols 52, 57–58, 61–62, 64, 104HIV 431, 507Holocene ‘Altithermal’ 127horsts 39–40, 96–97, 138House of Welser 406humic acid 157, 483humming birds 269hunting 260, 384–385, 389, 507, 509–510hydrocarbon production 31, 161, 454–455,
457–458, 466hydroelectric power 455Hymenaea 203, 209, 219, 256, 508
Iguana 254, 403illite 66, 152–53illuviation 52–53Imataca 21, 28, 34, 36, 41, 46, 52, 136,
412, 420, 423Indo-Hispanic 386, 399–400, 464,
478Inga 216, 219, 222, 241, 244–245, 253,
256, 259, 298, 355, 370Inselberg complexes 46Inter-Tropical Convergence Zone 74,
82–83, 85, 89, 90–93, 95–97,
100–101, 107, 117, 123, 127–128,130–132, 143–146, 160, 346–349
intrinsic water use efficiency 212–215,236
IPCC 76, 80, 128, 166Iriartea deltoidea 368, 370, 496isostatic adjustment 163, 166, 388ITCZ see Inter-Tropical Convergence ZoneIwokrama Forest 235–236, 250, 393, 487,
497, 510
Jacaranda 199, 203, 209, 211, 216Jari pulpwood operation 449–450, 465,
499Jesuit missions 412–413, 416, 419, 464
Kaieteur National Park 484, 487Kamoa Mountains 29, 47, 136Kanuku Horst 29, 39–40, 97Kanuku Mountains 32, 39, 44, 47, 50, 96,
136, 250, 497kaolinite 52, 54, 63, 115, 150–153Kartabo 236, 252, 295, 297–298, 305–306,
311Kelvin waves 82, 89–90kiln drying 454kinkajou see Potos flavusKinosternon 252Köppen climate classification 69Kourou 296, 455, 459–460Kyk-over-al 407
La Niña see ENSOLa Selva 66, 154, 235, 333, 359, 369, 372,
497Laetia procera 206, 219, 249land-dredging 433LAR see leaf area ratioLast Glacial Maximum 106, 112–113, 118,
127–128, 131, 160, 163, 165lateritas hydromórficas see Plinthosolslaterite 26, 47, 54–55, 62–64, 99, 100, 115,
137–138, 142, 240, 297, 434Lauraceae 238, 240, 244, 246, 249–250,
301, 305, 366, 368, 435Laurens Storm van Gravesvande 409leaf area ratio 206–207, 209leaf-cutting ants 296–298, 302, 306,
308–309, 312
524 Index

Lecythidaceae 240, 245, 256, 262, 305,309, 326, 329, 365–366, 368
Lei Áurea 417Leopoldinia 446–448letterwood 411LGM see Last Glacial MaximumLicania 252, 256light saturated rate of photosynthesis
197–201, 205–207, 218llanos 7, 36, 48, 69, 89, 107, 111, 155,
389–390, 393, 400–402, 455, 482logging 256, 268, 318, 385, 420, 435, 453,
484, 492, 499, 501–502, 510Los Pijiguaos 434
Mabura Hill 66, 112, 216, 222, 245, 250,254, 267, 295, 297–298, 301–302,307–308, 311–312, 354–355, 358
maçaranduba see Manilkaramahogany see Swieteniamaize 399, 401Makari Mountain 29–30, 396Manacus 249–250manicole see EuterpeManilkara 383, 420, 439, 442–444, 448,
508Manoa 6, 406–407, 420Marajó Island 401Maroons 414, 419, 421, 464Mauritia flexuosa 238, 246–247, 251, 266,
369Maximiliana see AttaleaMazama 244Melipona see stingless beesMembracidae 298, 301, 311mercury 157, 429, 431–433, 507–508 Meso-Indian 386, 399methane 128, 157–159Miconia 223, 249–250midden 105, 389, 399Milankovitch cycles 115, 118, 121,
123–124 126mineral provenance 56, 63Mitú Complex 25, 39, 42, 52Montanhas de Tumucumaque see
Tumucumaque National ParkMonte Alegre 42, 388–389, 395–396,
398–399, 404Monte Verde 388montmorillonite 66, 151–152Montrichardia 251
Mora 203, 207, 209, 211, 219, 223, 238,262, 301–302, 309, 311, 351, 355,361, 448, 496, 501
Moraceae 241–242, 245, 247–250, 254,258, 264, 325, 328, 368
Muri Suite 34mycorrhiza 215, 353–355Myleus 251–52Myoprocta 237Myrtaceae 249–252, 264, 267
NAB see North Amazon BasinNAO see North Atlantic OscillationNAR see net assimilation rateNasua 248natural forest management 450, 453–455,
499–500natural impoundments 138–139Neoindian 386, 395, 399–400, 402, 405,
482NEP see net ecosystem productivitynet assimilation rate 206net ecosystem productivity 81, 356–357Nickerian Episode 25, 40–41Nitisols 59–60, 64, 66, 153nitrogen fixation 196, 216, 219nodulation 219, 221North Amazon Basin 133, 135, 141, 148North Atlantic Oscillation 94–95, 101, 132 Nouragues 112, 201–202, 216, 242–245,
257, 264, 266, 307, 497
obliquity see Milankovitch cyclesOchroma 254, 363, 370oil see hydrocarbon productionOLR see outgoing long-wave radiationOmai 424, 428, 430–431operational waste 503–504orbital eccentricity see Milankovitch
cyclesOrmosia 219, 222, 355orographic uplift 96–97, 107, 114, 130,
347ortstein 53outgoing long-wave radiation 82, 100, 113,
128, 347
Pacu see MyleusPakaraima Mountains 26, 29–30, 32, 44,
Index 525

Pakaraima Mountains continued46–47, 50, 71–72, 88, 96, 136,393–394, 396, 400, 437, 457
Palaeoindian 386, 389, 390, 397, 401, 404,464
Palicourea 223, 250Palikur 421palm heart see EuterpePalmae see ArecaceaeParacou 216, 221, 235, 240, 306Parguaza Episode 25, 31, 42Parguaza granite 29, 34, 36, 39, 47, 78,
434, 491Parkia 219, 244, 253–254, 262–263, 362patrões 441patroons 411, 416Pedra Pintura 388peeler log species 452–453pegasse 57, 161Peltogyne 219, 302, 309, 311, 499Penelope 249Pentaclethra 209, 214, 219, 221–222, 225,
301, 310–311, 355, 359perhumidity index 69Petit Saut 159, 241, 243, 301, 455petroglyphs 390, 393–396, 464PFD see photon flux density Philodendron 241–242, 252, 327Phoenicircus 250photoinhibition 198, 203–204photon flux density 197, 199, 200,
201–203, 206photosynthetic rates 199, 201, 203, 205, 216Phractocephalus 252Phyllostomus 256physico-chemical transport 145phytolith 384, 388, 399piaçaba see LeopoldiniaPico de Neblina 30pictographs see rock paintingspiedras pinturas see rock paintingspinot see EuterpePinus caribaea 499Piper 199, 211, 221, 241, 255, 325Pipridae 249, 261Pirara 32, 407Pithecia 241, 261place of refuge 420, 422plantation forestry 499plantations, agricultural 296, 409,
411–412, 414, 416–417, 419–421,434, 448, 464, 499
plantocracy 416–417, 419plate tectonics 25, 42, 63, 491pleni-glacial 60Plinthosols 54–55, 57, 60–65plywood 453, 499Podocnemis 252Podostemaceae 251Podzols 53–54, 58–64, 157, 403Polissoirs 390, 395pollination syndromes 322, 324, 333, 337Pomeroon Formation 31, 45Pomeroon river 58, 139, 166, 400, 407,
409, 411–412population densities 2, 71, 404, 459population growth 386, 405, 459–461porknockers see garimpeirosPotos flavus 244, 254, 257–258, 266Poulsenia armata 368, 496Pouteria 245, 257, 268Precambrian Rolling Hills 45, 61precession see Milankovitch cyclesProcnias 250protected areas 484, 487–488, 496–498,
514Psamments 53, 238Pseudomeldia 368, 496Psophia 249, 263Puerto Ayacucho 29, 42, 396–398, 400,
404, 446Puerto Rico 76, 241, 295purguo see Manilkara
Querula 250
raised fields 382, 401–402, 405, 464ramping systems 349, 352, 356–357, 365,
368Rebalse de Macavacape 42Recent Coastal Plains 44–45, 61red brocket deer see Mazamared-footed tortoise see Geochelonereducciones 412–414, 421Reduced Impact Logging 500–504, 514relative growth rate 205–207, 217, 358remote forcing factors 93reservoirs 156, 158Rhinophylla 241, 256Rhizophora 494RIL see Reduced impact loggingripio see laterite
526 Index

roche gravees see petrogplyphsroches vertes see greenstonesrock paintings 390, 395–396, rockshelters 390, 395–396, 400Roraima Formation (SuperGroup), 12,
25–26, 29–30, 36, 46, 437rosewood oil 444, 508Rossby waves 81–82, 89–90, 100rubber 254, 416, 419–420, 422, 439,
441–442, 444, 446Rupicola 251, 262–263Rupununi savanna 32, 38, 44, 138, 395
sable blancs 53Saguinus 241–242, 257salto see natural impoundmentssambaquis see shell moundsSanema see Yanomamisaprolite 52, 61sarrapia see Dipteryxsaut see natural impoundmentsSavanna Trough 71, 76, 78, 80, 101, 130,
459, 491scatterhoarding 235, 248, 256, 258,
266–267Schefflera 250, 262Sclerolobium 209, 216, 219, 221–22, 225SCOPE 147screaming piha 250sea breeze 96–97, 100sea level change 30, 34, 42, 45, 60, 62, 99,
107, 131, 160–166sea surface temperature 14, 78, 82–83, 85,
87–95, 98, 100–102, 114, 117,127–128, 131, 349
seed dispersal 234, 251, 256–258, 261,266–269, 513
seed mass see seed sizeseed size 207, 209–210, 258–259, 262,
357–359, 362, 365, 372seringa see rubberSerra do Tucano 39, 135Serrasalmidae 251Sextonia 368shade tolerance 211, 216, 228, 251, 255,
257shell mounds 397, 400, 402, 403, 464silica dioxide 32, 63silicic acid 155silvicultural approaches 500Sipaliwini 137, 156, 390, 394, 404, 463
skidders 453slavery 385, 411, 413–414, 416–417,
421–422, 462Slave Emancipation Act 417slingmud see fluid mudssmectite see montmorilloniteSOI see Southern Oscillation soil classification 49Solanum 241, 246, 255–256, 324solar cycles see sunspotssolar power 454SOLTER 53, 58Southern Oscillation see ENSOspecific discharge rates 141Spondias 246, 248, 262, 383SST see sea surface temperature steric effects 163, 166, 358stingless bees 321, 324–330, 334–336stone arrangements 394, 464stone axeheads 397stream capture 137–138Sub-Andean Foredeep 19, 39, 40–41,
56–57, 60, 72–74, 83, 88, 96–98,100, 103–104, 151–153, 159, 163,368–369, 389, 405, 454, 492, 497
Sub-Andean Trough see Sub-AndeanForedeep
sugar 45, 409, 411–413, 416–419, 442, 450sulphur dioxide 117, 148sunflecks 203sunspots 115, 120–122surface albedo 96, 98–99, 133Swartzia 216, 219, 222, 245, 256, 262,
355, 366, 501Swietenia 370, 373, 448, 453–454, 499,
501
Tafelberg 30, 46–47, 396Takutu Graben 21, 26, 28, 31, 39–40, 44,
53, 60, 103, 138, 162Tambaredjo oil field 455tanning bark see RhizophoraTapequén 398Taperinha 399, 403–404tapir see TapirusTapirira 199, 216–217Tapirus 245–246, 258, 263, 265–267TATE 25, 42, 63, 491tepuis 30, 46, 58, 63, 69, 71, 78, 96, 104,
114, 151, 396, 491Terra preta 403–405, 464
Index 527
terra roxa estruturada see NitisolsTertiary Sandy Plains 45, 61Tettigoniidae 302, 306three-toed sloth see Bradypustimber production 350, 448–453, 492,
498–499, 503, 507–508, 511Tinamus 262Titicaca 401tobacco 407, 409, 420tonka bean see Dipteryxtotal suspended solids 105, 150–156,
494toucans 260–261, 266transgression sea 15, 21, 32, 40–41, 62, 64,
91, 133, 161–163see also sea-level change
Treaty of Brede 411Treaty of Madrid 413Trema 249Trigona see stingless beesTrumpeters see PsophiaTSS see total suspended solids Tumuc-Humac see TumucumaqueTumucumaque 36, 38–39, 46, 52–53, 78,
104, 133, 136–137, 151, 390, 394,406, 421, 463, 486, 492
Tumucumaque National Park 484two-toed sloth see Coelopus
Uatuma Supergroup 18, 21, 25, 29, 36, 46Udults 50, 52–53Ultisols 49–50, 53, 57, 65, 218
vermiculite 66
Virola 199, 203, 211, 213, 240, 244–246,251, 257–258, 262, 452, 499
Vismia 199, 241, 244, 328volcanic aerosols 117, 118volcanic explosivity index 117Voltzberg 256Vouacapoua 198, 201–202, 210, 218–219,
222–223, 238, 259, 307, 309, 311,354–355
Wai-Wai 421Walker Circulation 81, 85, 87–89, 91,
93–94, 96, 98, 107, 116, 123, 131,349, 352
Walter Raleigh 406Wapishana 421Wassarai 29, 47, 136Wayana 421weathering rate 48, 150–151, 346–347,
361, 482Western Hemisphere Warm Pool 92, 131wildlife use 509wood density 362–365, 453, 503World Energy Survey 455World Petroleum Assessment 9, 455
Xochimilco 382, 401
Yanomami 422Yekuana see Yanomami
Zanderij Formation 31, 45, 54
528 Index


![[Human and wild mammal parasitosis in French Guiana]](https://static.fdokumen.com/doc/165x107/633660bb02a8c1a4ec022a28/human-and-wild-mammal-parasitosis-in-french-guiana.jpg)