
CALCULATION OF PRP GENOTYPE AND NSP TYPE PROBABILITIES IN SLOVENIAN SHEEP
Upload
independentCategory
view
21download
0
55
Quantifying probabilities of eruption at a well-monitoredactive volcano: an application to Mt. Etna (Sicily, Italy)
A. BRANCATO1, S. GRESTA1, L. SANDRI2, J. SELVA2, W. MARZOCCHI3, S. ALPARONE4,D. ANDRONICO4, A. BONFORTE4, T. CALTABIANO4, O. COCINA4, R.A. CORSARO4,R. CRISTOFOLINI1, G. DI GRAZIA4, G. DISTEFANO1, C. FERLITO1, S. GAMBINO4,S. GIAMMANCO4, F. GRECO4, R. NAPOLI4, G. TUSA1 and M. VICCARO1
1 Dipartimento di Scienze Geologiche, University of Catania, Italy2 INGV – Sezione di Bologna, Italy3 INGV – Sezione di Roma, Italy4 INGV – Sezione di Catania, Italy
(Received: April 30, 2010; accepted: November 17, 2010)
ABSTRACT At active volcanoes, distinct eruptions are preceded by complex and differentprecursory patterns; in addition, there are precursory signals that do not necessarilylead to an eruption. The main purpose of this paper is to present an unprecedentedapplication of the recently developed code named BET_EF (Bayesian EventTree_Eruption Forecasting) to the quantitative estimate of the eruptive hazard at Mt.Etna volcano. We tested the model for the case history of the July-August 2001 flankeruption. Anomalies in geophysical, geochemical and volcanological monitoringparameters were observed more than a month in advance of the effective onset of theeruption. As a consequence, eruption probabilities larger than 90% were estimated. Animportant feature of the application of BET_EF to Mt. Etna was the probabilisticestimate of opening vent locations. The methodology allowed a clear identification ofassumptions and the monitoring of parameter thresholds and provided rational meansfor their revision if new data or information are incoming.
Key words: Mt. Etna, eruption forecasting, Bayesian event tree.
1. Introduction
The evaluation of volcanic hazard (i.e., the probability that a specific area will be affected byeruptive phenomena within a given time period) is mainly based on the past behaviour of thevolcano under study and on topographical parameters. Under the assumption that the character offuture events will most likely be similar to some of the past eruptions, the evaluation of volcanichazard requires an accurate knowledge of past events, mainly based on the historical recordscoupled with the modern monitoring surveillance procedures. A further important issue is tounderstand the dynamics of the studied volcano, such as its tectonic and geological environment,the magma supply into reservoirs below or within the volcanic edifice, the processes of magmareaching the surface, as well as the detailed knowledge of the monitoring time series precedingthe eruption events. The frequency and character of eruptions are largely under the control ofthese factors.
Mt. Etna is a basaltic stratovolcano with persistent volcanic activity. The volcano is located
Bollettino di Geofisica Teorica ed Applicata Vol. 53, n. 1, pp. 55-74; March 2012
DOI 10.4430/bgta0040
© 2012 – OGS
56
Boll. Geof. Teor. Appl., 53, 55-74 Brancato et al.
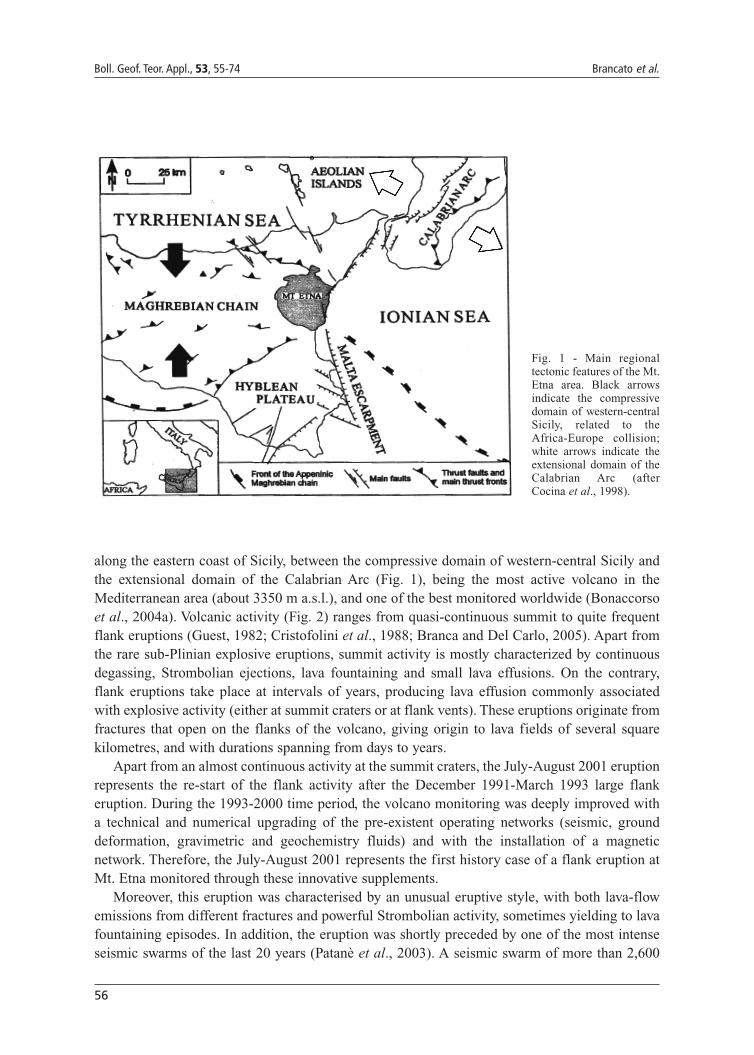
along the eastern coast of Sicily, between the compressive domain of western-central Sicily andthe extensional domain of the Calabrian Arc (Fig. 1), being the most active volcano in theMediterranean area (about 3350 m a.s.l.), and one of the best monitored worldwide (Bonaccorsoet al., 2004a). Volcanic activity (Fig. 2) ranges from quasi-continuous summit to quite frequentflank eruptions (Guest, 1982; Cristofolini et al., 1988; Branca and Del Carlo, 2005). Apart fromthe rare sub-Plinian explosive eruptions, summit activity is mostly characterized by continuousdegassing, Strombolian ejections, lava fountaining and small lava effusions. On the contrary,flank eruptions take place at intervals of years, producing lava effusion commonly associatedwith explosive activity (either at summit craters or at flank vents). These eruptions originate fromfractures that open on the flanks of the volcano, giving origin to lava fields of several squarekilometres, and with durations spanning from days to years.
Apart from an almost continuous activity at the summit craters, the July-August 2001 eruptionrepresents the re-start of the flank activity after the December 1991-March 1993 large flankeruption. During the 1993-2000 time period, the volcano monitoring was deeply improved witha technical and numerical upgrading of the pre-existent operating networks (seismic, grounddeformation, gravimetric and geochemistry fluids) and with the installation of a magneticnetwork. Therefore, the July-August 2001 represents the first history case of a flank eruption atMt. Etna monitored through these innovative supplements.
Moreover, this eruption was characterised by an unusual eruptive style, with both lava-flowemissions from different fractures and powerful Strombolian activity, sometimes yielding to lavafountaining episodes. In addition, the eruption was shortly preceded by one of the most intenseseismic swarms of the last 20 years (Patanè et al., 2003). A seismic swarm of more than 2,600
Fig. 1 - Main regionaltectonic features of the Mt.Etna area. Black arrowsindicate the compressivedomain of western-centralSicily, related to theAfrica-Europe collision;white arrows indicate theextensional domain of theCalabrian Arc (afterCocina et al., 1998).
57
Quantifying probabilities of eruption at Mt. Etna Boll. Geof. Teor. Appl., 53, 55-74
events in less than 4 days gave evidence that a dyke was emplaced on July 12 (Patanè et al.,2003), as confirmed by GPS and tilt data (Bonaccorso et al. 2002). By July, a system of dryfissures striking N-S opened south of the still erupting south-eastern crater (hereafter, SEC);whereas the eruption started on July 17. Three main eruptive vents and some further minoreruptive fractures opened at altitudes between 2100 m and 3000 m a.s.l. At least two differentuprising magma paths have been defined (Monaco et al., 2005). The whole southern flank of thevolcano was involved in the eruption (Fig. 3). The rate of lava emission suddenly dropped on July31 and on August 9, the eruption stopped completely (Falsaperla et al., 2005).
The aim of this paper is a retrospective analysis of the estimation of the eruption probabilityat Mt. Etna during the time period January-July 2001, by using an event tree probability[BET_EF: i.e., Marzocchi et al. (2004, 2008)]. This provides multiple possible outcomes. Thefirst step of the work will be the “elicitation” of the parameters for the different nodes of the tree.Then, anomalies in geophysical, geochemical and volcanological monitoring parameters will betaken into account, providing the probabilistic estimate of the flank eruption occurrence, as wellas of the rough location of the eruptive vents.
2. BET_EF (Bayesian Event Tree for Eruption Forecasting) code (version 2.1)
The BET_EF algorithm is a code implementing a Bayesian Event Tree to compute theprobabilities of specific volcanic events of interest (e.g., an eruption, an eruptive vent location,an eruption of a specific size/style) by merging all relevant, available information retrieved bytheoretical models, a priori beliefs, monitoring measurements, expert opinions, and past data (i.e.,all the information deriving from stratigraphy, geology, historic records, etc.).
The BET_EF model, based on the event tree philosophy proposed by Newhall andHoblitt (2002), further develops the concepts of vent location, epistemic and aleatoryuncertainties (respectively associated with the lack of knowledge of the processes involved in a
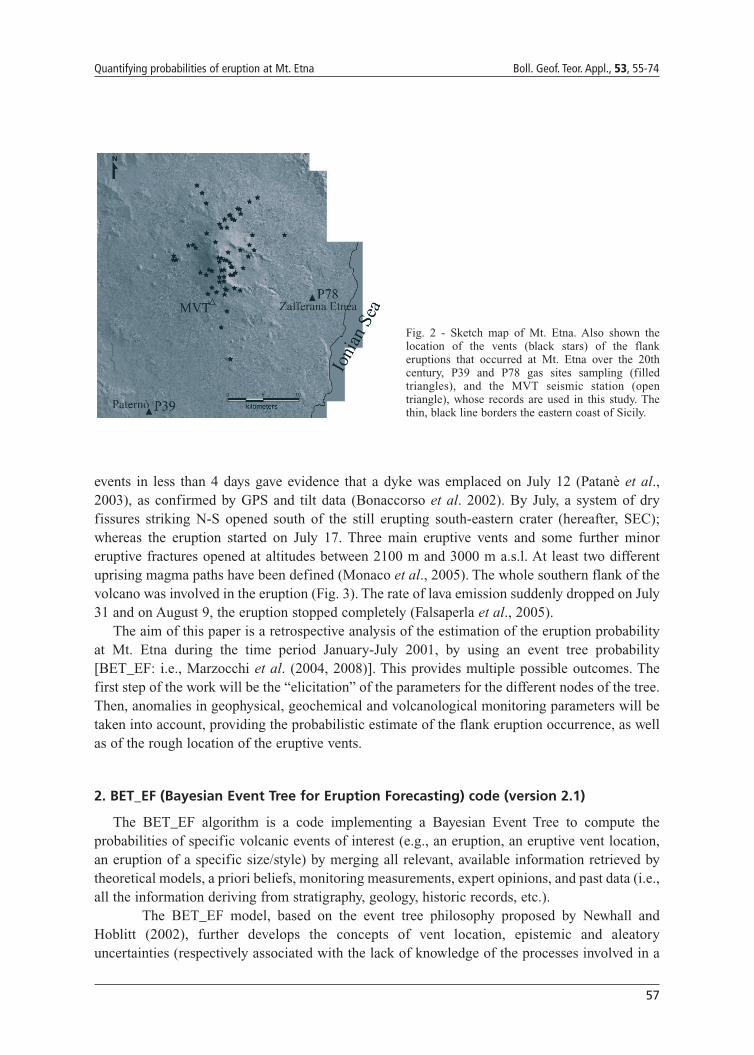
Fig. 2 - Sketch map of Mt. Etna. Also shown thelocation of the vents (black stars) of the flankeruptions that occurred at Mt. Etna over the 20thcentury, P39 and P78 gas sites sampling (filledtriangles), and the MVT seismic station (opentriangle), whose records are used in this study. Thethin, black line borders the eastern coast of Sicily.

58
Boll. Geof. Teor. Appl., 53, 55-74 Brancato et al.
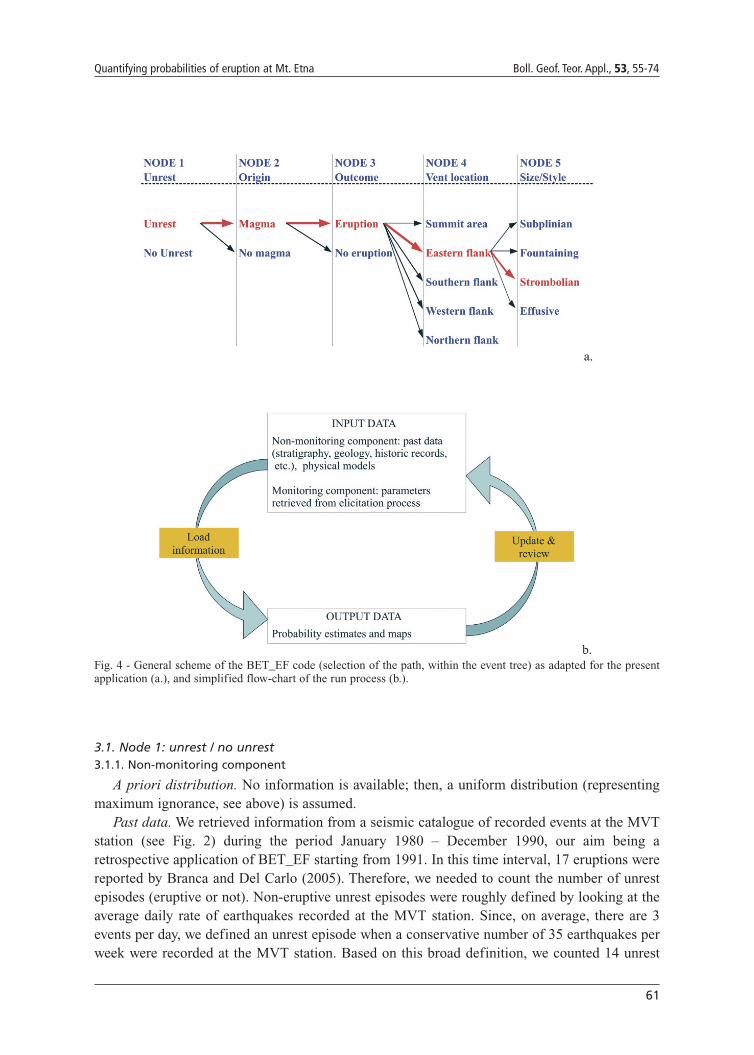
volcanic system, and with the intrinsic unpredictability of the phenomena), and a fuzzy approachfor monitoring measurements in order to simulate the expert opinion with a given anomaly degreeof the observed parameters. The method is discussed in Marzocchi et al. (2008), and we refer thereader to this paper for all the details. Here, we only remind you that the code is based on an eventtree, where individual branches are alternative steps from a general prior event, and evolve intoincreasingly specific subsequent states (Fig. 4a). The points on the graph where new branches areset are referred to as nodes (Newhall and Hoblitt, 2002; Marzocchi et al., 2004, 2008); in detail:Node 1: it is related to the probability of having an unrest over the time interval [t0, t0 + τ], where
t0 is the present time, and τ is the time window considered;Node 2: the unrest has a magmatic origin or is related to other causes (e.g., hydrothermal or
tectonic activity), providing that an unrest has been detected;Node 3: the magma will or will not erupt over the time interval [t0, t0 + τ], providing that the
unrest has a magmatic origin;Node 4: the vent will open at a specific location, provided that there is an eruption;Node 5: the eruption will be of a given size/style, provided that an eruption occurs at a specific
vent.In the BET_EF model, the forecast window time τ, to which the probability estimates are
referred, is not fixed a priori, but is set by the user on the grounds of the observed typical timescale of variations in the state of the volcano under study. For example, if the considered volcanoshows variations of its state typically with long-term behaviour (years), then mid-term probabilityestimates (e.g., a month) will be suitable. This application has been theoretically tested for long-time quiescent volcanoes [e.g., Vesuvius, see Marzocchi et al. (2004, 2008); Campi Flegrei, seeOrsi et al. (2009); Auckland Volcanic Field, see Lindsay et al. (2010)].
The BET_EF gives quantitative probability estimates of specific eruption-related outcomesthrough the evaluation of the probability density functions of the above five nodes by mergingpast data and models, and monitoring information. Generally speaking, the code (Marzocchi etal., 2004, 2008) consists of a non monitoring and monitoring components, computed throughBayesian inference (Fig. 4b). Regarding the non-monitoring component, the a priori distributionat each node describes a general knowledge about that specific node (e.g., expert opinion and/orexperiences gained from similar volcanic activity worldwide), represented by a ‘best guess’probability and a weight associated to such guess, expressed as ‘equivalent number of data’ (Λ).A guess with a low Λ has a very low reliability; in contrast, when there is a significantconvergence of the expert opinions on the best guess provided, Λ will be high. For further details,see Marzocchi et al. (2004, 2008).
The likelihood function of the non-monitoring section is shaped on the grounds of past data.If the number of past data is larger than the ‘equivalent number of data’, it yields to a largerinfluence on the final a posteriori distribution. On the contrary, if the number of past data iscomparable to the ‘equivalent number of data’, the a posteriori distribution will be the result of aweighted merging of both components.
The a priori distribution of the monitoring component is derived by using parameters usuallymanaged and measured during volcano surveillance activities. These parameters can be chosenby experts, along with their lower and upper thresholds in a fuzzy perspective, used to relate agiven anomaly degree in order to simulate the expert judgement (Marzocchi et al., 2008). At

59
Quantifying probabilities of eruption at Mt. Etna Boll. Geof. Teor. Appl., 53, 55-74
Fig. 3 - Map of the eruptive fracture systems and lava flows formed during the 2001 July 17-August 9 flank eruption.Three main fracture fields have been recognized on the basis of the time–space development of distinct segments: (a)Piano del Lago field; (b) Montagnola field; (c) Valle del Leone field. Gray arrows indicate the sense of migration ofeach fracture field (after Monaco et al., 2005).

60
Boll. Geof. Teor. Appl., 53, 55-74 Brancato et al.
nodes 2 and 3, the BET_EF needs to assign a weight to each monitored chosen parameter. Thisis because the code recognizes the capacity of some monitoring measurements (e.g.,earthquakes occurring, tremor and gravity data) to indicate much better than others theevolution of the state of the volcano. A weight equal to 2, implies that the parameter is astrong indicator for the relative node, and, for example, an anomalous parameter with weight2 is the equivalent of two anomalous parameters with weight equal to 1. The a prioridistribution is then adapted by the likelihood function if past data from actual monitoredunrest or eruptive events are available.
3. Setting up BET_EF for Mt. Etna
In general, any model and input data used to set up the code are selected by following the basicprinciples of simplicity and acceptance by a wide scientific community. In practice, the startingpoint is always assumed as a state of maximum ignorance (i.e., no possibility is excluded).Probability estimates are then revised (in a Bayesian framework) based on the availability ofrobust and widely accepted models and data.
First of all, it is necessary to define a suitable time window for the BET_EF forecast. It mustbe shorter than, or comparable to, the typical time scale of the variations in the state of thevolcano. As Mt. Etna is an open-conduit persistently active volcano, significant variations of themonitored parameters are expected to occur over time scales of hours (mainly for the activity atthe summit craters) to days or weeks (for flank eruptions). In this case, the most suitable forecasttime window will be necessarily short; therefore, we fixed τ = 1 week.
For short-term eruption forecasting, the monitoring has a leading role, primarily based onseismological data and volcanological observations, integrated with strain, fluidgeochemistry, gravimetric and magnetic data. As a consequence, relevant parameters andrelative thresholds were fixed before any run of the code during several expert elicitationsessions. The criteria of such a selection are based on what is the present surveillance systemon Mt. Etna. Nevertheless a magnetic network has been deployed in the last decade, relativedata is not included in the present running because of some incoherency in node 3. Therefore,in the case of the 2001 eruptive activity forecast, we collected 39 monitoring parameters,distinct for nodes and activity.
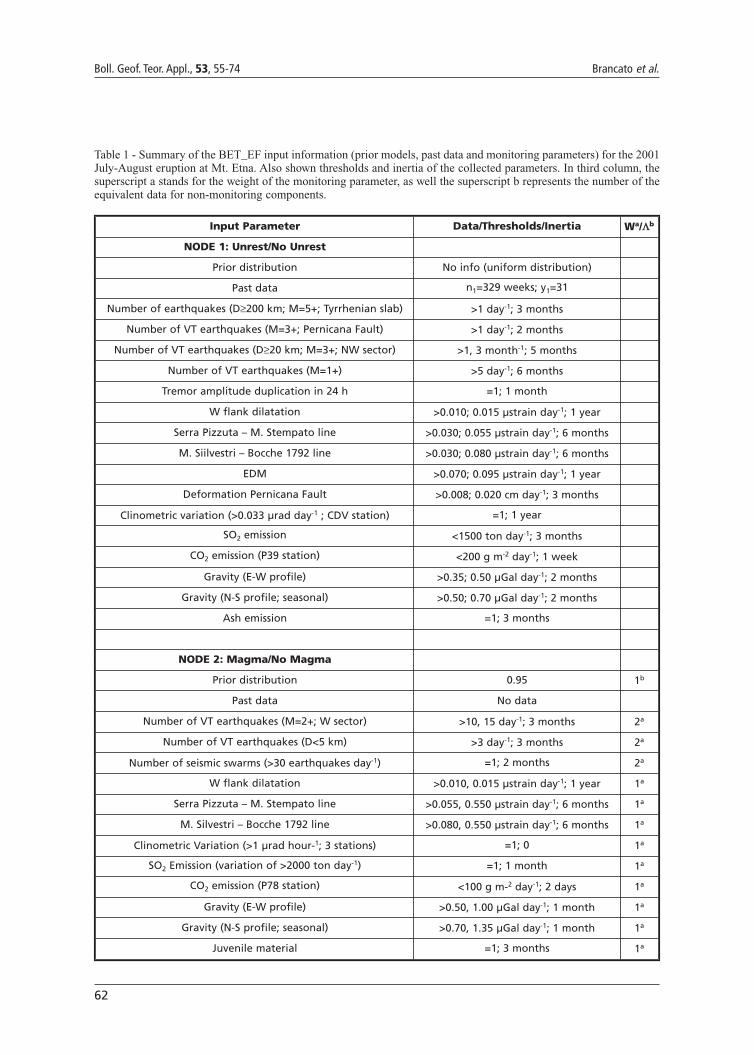
The “inertia” problem was also discussed and fixed. We used a boxcar shaped inertia timewindow. As a consequence, the contribution of any anomalous parameter to the definition ofnode probabilities will completely vanish after expiration of the inertia time. For example, atnode 1, for the parameter “Number of Volcanic-Tectonic (hereafter, VT) earthquakes(M=1+)”, a 6-month inertia means that, according to the experts, a daily VT number > 5 opensa 6 months window for the duration of the unrest activity. The parameter is slightly changedin nodes 2 and 3 [“Number of VT earthquakes (D<5 km)”] with different thresholds (>3 and>40 events per day, respectively), with different inertia times, although shorter in these nodes(3 months and 1 day, respectively). In Table 1, we report all the setting (monitoringparameters, and relative thresholds and “inertia” time periods), node by node, for theapplication of the BET_EF to Mt. Etna.
In the following, we give some brief explanation of the choices made at each node.
61
Quantifying probabilities of eruption at Mt. Etna Boll. Geof. Teor. Appl., 53, 55-74
3.1. Node 1: unrest / no unrest3.1.1. Non-monitoring component
A priori distribution. No information is available; then, a uniform distribution (representingmaximum ignorance, see above) is assumed.
Past data. We retrieved information from a seismic catalogue of recorded events at the MVTstation (see Fig. 2) during the period January 1980 – December 1990, our aim being aretrospective application of BET_EF starting from 1991. In this time interval, 17 eruptions werereported by Branca and Del Carlo (2005). Therefore, we needed to count the number of unrestepisodes (eruptive or not). Non-eruptive unrest episodes were roughly defined by looking at theaverage daily rate of earthquakes recorded at the MVT station. Since, on average, there are 3events per day, we defined an unrest episode when a conservative number of 35 earthquakes perweek were recorded at the MVT station. Based on this broad definition, we counted 14 unrest
Fig. 4 - General scheme of the BET_EF code (selection of the path, within the event tree) as adapted for the presentapplication (a.), and simplified flow-chart of the run process (b.).
62
Boll. Geof. Teor. Appl., 53, 55-74 Brancato et al.
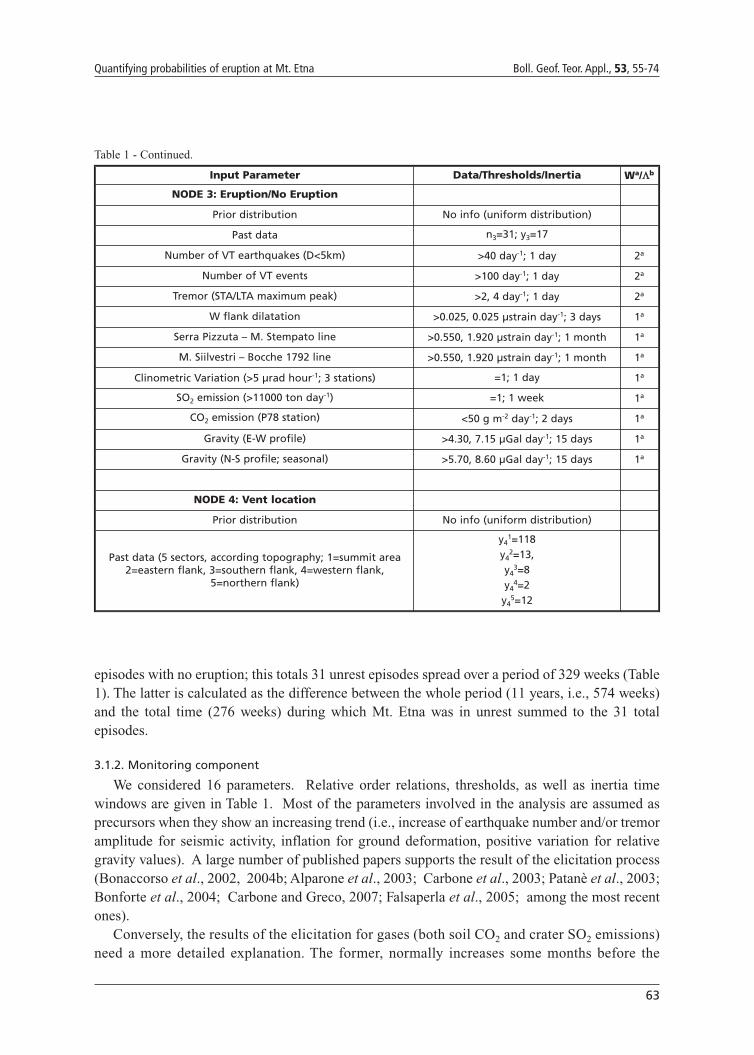
Table 1 - Summary of the BET_EF input information (prior models, past data and monitoring parameters) for the 2001July-August eruption at Mt. Etna. Also shown thresholds and inertia of the collected parameters. In third column, thesuperscript a stands for the weight of the monitoring parameter, as well the superscript b represents the number of theequivalent data for non-monitoring components.
Input Parameter Data/Thresholds/Inertia Wa/Λb
NODE 1: Unrest/No Unrest
Prior distribution No info (uniform distribution)
Past data n1=329 weeks; y1=31
Number of earthquakes (D≥200 km; M=5+; Tyrrhenian slab) >1 day-1; 3 months
Number of VT earthquakes (M=3+; Pernicana Fault) >1 day-1; 2 months
Number of VT earthquakes (D≥20 km; M=3+; NW sector) >1, 3 month-1; 5 months
Number of VT earthquakes (M=1+) >5 day-1; 6 months
Tremor amplitude duplication in 24 h =1; 1 month
W flank dilatation >0.010; 0.015 µstrain day-1; 1 year
Serra Pizzuta – M. Stempato line >0.030; 0.055 µstrain day-1; 6 months
M. Siilvestri – Bocche 1792 line >0.030; 0.080 µstrain day-1; 6 months
EDM >0.070; 0.095 µstrain day-1; 1 year
Deformation Pernicana Fault >0.008; 0.020 cm day-1; 3 months
Clinometric variation (>0.033 µrad day-1 ; CDV station) =1; 1 year
SO2 emission <1500 ton day-1; 3 months
CO2 emission (P39 station) <200 g m-2 day-1; 1 week
Gravity (E-W profile) >0.35; 0.50 µGal day-1; 2 months
Gravity (N-S profile; seasonal) >0.50; 0.70 µGal day-1; 2 months
Ash emission =1; 3 months
NODE 2: Magma/No Magma
Prior distribution 0.95 1b
Past data No data
Number of VT earthquakes (M=2+; W sector) >10, 15 day-1; 3 months 2a
Number of VT earthquakes (D<5 km) >3 day-1; 3 months 2a
Number of seismic swarms (>30 earthquakes day-1) =1; 2 months 2a
W flank dilatation >0.010, 0.015 µstrain day-1; 1 year 1a
Serra Pizzuta – M. Stempato line >0.055, 0.550 µstrain day-1; 6 months 1a
M. Silvestri – Bocche 1792 line >0.080, 0.550 µstrain day-1; 6 months 1a
Clinometric Variation (>1 µrad hour-1; 3 stations) =1; 0 1a
SO2 Emission (variation of >2000 ton day-1) =1; 1 month 1a
CO2 emission (P78 station) <100 g m-2 day-1; 2 days 1a
Gravity (E-W profile) >0.50, 1.00 µGal day-1; 1 month 1a
Gravity (N-S profile; seasonal) >0.70, 1.35 µGal day-1; 1 month 1a
Juvenile material =1; 3 months 1a
63
Quantifying probabilities of eruption at Mt. Etna Boll. Geof. Teor. Appl., 53, 55-74
episodes with no eruption; this totals 31 unrest episodes spread over a period of 329 weeks (Table1). The latter is calculated as the difference between the whole period (11 years, i.e., 574 weeks)and the total time (276 weeks) during which Mt. Etna was in unrest summed to the 31 totalepisodes.
3.1.2. Monitoring component
We considered 16 parameters. Relative order relations, thresholds, as well as inertia timewindows are given in Table 1. Most of the parameters involved in the analysis are assumed asprecursors when they show an increasing trend (i.e., increase of earthquake number and/or tremoramplitude for seismic activity, inflation for ground deformation, positive variation for relativegravity values). A large number of published papers supports the result of the elicitation process(Bonaccorso et al., 2002, 2004b; Alparone et al., 2003; Carbone et al., 2003; Patanè et al., 2003;Bonforte et al., 2004; Carbone and Greco, 2007; Falsaperla et al., 2005; among the most recentones).
Conversely, the results of the elicitation for gases (both soil CO2 and crater SO2 emissions)need a more detailed explanation. The former, normally increases some months before the
Input Parameter Data/Thresholds/Inertia Wa/Λb
NODE 3: Eruption/No Eruption
Prior distribution No info (uniform distribution)
Past data n3=31; y3=17
Number of VT earthquakes (D<5km) >40 day-1; 1 day 2a
Number of VT events >100 day-1; 1 day 2a
Tremor (STA/LTA maximum peak) >2, 4 day-1; 1 day 2a
W flank dilatation >0.025, 0.025 µstrain day-1; 3 days 1a
Serra Pizzuta – M. Stempato line >0.550, 1.920 µstrain day-1; 1 month 1a
M. Siilvestri – Bocche 1792 line >0.550, 1.920 µstrain day-1; 1 month 1a
Clinometric Variation (>5 µrad hour-1; 3 stations) =1; 1 day 1a
SO2 emission (>11000 ton day-1) =1; 1 week 1a
CO2 emission (P78 station) <50 g m-2 day-1; 2 days 1a
Gravity (E-W profile) >4.30, 7.15 µGal day-1; 15 days 1a
Gravity (N-S profile; seasonal) >5.70, 8.60 µGal day-1; 15 days 1a
NODE 4: Vent location
Prior distribution No info (uniform distribution)
Past data (5 sectors, according topography; 1=summit area2=eastern flank, 3=southern flank, 4=western flank,
5=northern flank)
y41=118
y42=13,
y43=8
y44=2
y45=12
Table 1 - Continued.

64
Boll. Geof. Teor. Appl., 53, 55-74 Brancato et al.
occurrence of an eruption, as a result of exsolution from deep (>5 km) magma sources (Brunoet al., 2001; Aiuppa et al., 2004). The monitoring of CO2 is performed by focusing on twoareas, characterized by the highest gas concentration anomalies in soils, and located,respectively, in the central area of the eastern flank (P78 station, see Fig. 2), and on the lowerSW flank of the volcano (P39 station, see Fig. 2). Both sites are known for being connectedto deep faults that allow the escape of magmatic gases. P39 is inferred to drain gas from adeep magma source (>15 km), whereas P78 is related to a shallower reservoir [5-10 km;Bruno et al. (2001)]. Crater SO2 emissions, conversely, are related to shallower (<4 km)magma dynamics. For both parameters, the volcano is considered in an unrest phase when ananomalous decreasing trend is observed (see Table 1), but relative meaning is different. Inparticular, CO2 decreases following anomalous increases when magma moves rapidly towardsshallower crustal levels at lower confining pressure. Therefore, large amounts of CO2 exsolvefrom the melt into gas bubbles that rise up in the conduits either by buoyancy or carried bythe moving magma, producing, then, a decreased flux of gases released into the enclosingrocks. The decrease in SO2 flux is usually observed prior to an eruptive activity and might berelated to periods of sealing of the magma body (Casadevall et al., 1981). Sometimes, it ispossible to relate it to a deep seismic activity producing a depressurization of the system thatdraws the exsolved gas into relatively deep opening fractures, thus decreasing the emissionfrom the summit craters (Caltabiano et al., 1994). The subsequent ascent of new magma isusually accompanied by a progressive rise in SO2 flux starting from minimum relative values(Caltabiano et al., 1994).
The decreasing trend therefore, continues for CO2 emissions before eruptions, whereas, SO2
emissions show an inverted trend after a minimum is reached, then an increase starts, that mayculminate in an eruption.
3.2. Node 2: magma / no magma3.2.1. Non-monitoring component
A priori distribution. Given the detection of an unrest episode, we assume that it has a 95%probability of having a magmatic origin; this value is what is usually assumed worldwide forvolcanoes such as Mt. Etna (C. Newhall personal communication), and it means that 95% of theunrest episodes are of magmatic origin. The number of equivalent data for this distribution is setto 1, thus, indicating large uncertainty.
Past data. There are no non-monitoring data that can be retrieved for this node.
3.2.2. Monitoring component
For this node, we chose 12 parameters (Table 1). The weight of each parameter is set to 1 bydefault, but when there is evidence of a particularly significant parameter, its weight is raised to2. Thus, a weight of 2 is assumed for seismicity and gravity parameters. No past monitored eventsare present.
3.3. Node 3: eruption / no eruption3.3.1. Non-monitoring component
A priori distribution. As for node 1, no information is available; again, a uniform distributionis assumed.

65
Quantifying probabilities of eruption at Mt. Etna Boll. Geof. Teor. Appl., 53, 55-74
Past data. Considering the period January 1980 – December 1990, 17 unrest episodes out of31 were marked by eruptions (see node 1).
3.3.2. Monitoring component
We chose 11 monitoring parameters (Table 1). As for node 2, a weight of 1 is assigned bydefault, whereas a weight of 2, again puts in evidence, the strong eruption forecasting capacity ofseismic and gravimetric parameters (Table 1).
3.4. Node 4: location of the vent3.4.1. Non-monitoring component
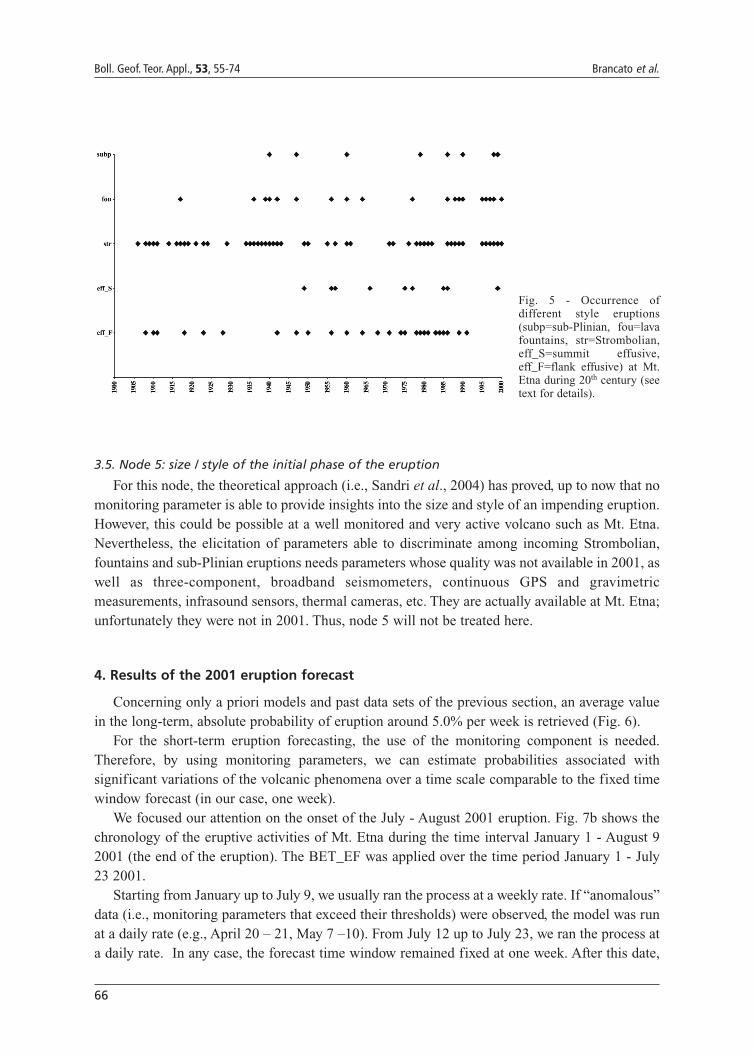
A priori distribution. We considered an a priori model for node 4 based on the present tectonicand volcanic structure of Mt. Etna, based in particular on past vent and fracture location data sets[eruptive history of the volcano during 20th century; Branca and Del Carlo (2005)]. We made thischoice for homogeneity. Even if information on the flank volcanic activity has been quite reliablesince the 18th century (Fig. 5), summit volcanic activity data are complete starting from 20th
century, only (Branca and Del Carlo, 2005).We provide a graphical frame (as each panel of Fig. 8), that takes into account the geography
and the geometry of the volcano. The lower left corner is set at the point (northing 4,155,000 m,and easting 482,500 m, UTM zone 33), while the upper right corner at the point (northing4,192,500 m, and easting 520,000 m). The centre of the frame is set in the summit crater area atthe point (northing 4,178,110 m, and easting 499,505 m).
The investigated area is a circle, centred at the last defined point, with an inner circle anda surrounding annulus, in turn divided into four quadrants. The inner circle encloses thesummit area and has a radius of 1 km; the annulus has an 11 km outer radius, and its quadrantsare defined by radii trending NE-SW and NW-SE. Thus, quadrant 1 corresponds to the easternflank, quadrant 2 to the southern one, quadrant 3 to the western one, and quadrant 4 to thenorthern one. The annulus comprises the area of the vents of the flank activity at Mt. Etnaduring 20th century (Branca and Del Carlo, 2005). Like nodes 1 and 3, a uniform distributionis assumed.
Past data. Following Branca and Del Carlo (2005), during 20th century Mt. Etna experienced153 eruptive episodes, distinct due to their summit or flank vent sites, and distributed over theabove zones (Fig. 5). Among these, 118 eruptive episodes involved the summit crater area, thathas experienced the largest variety of eruptive activities (degassing, Strombolian phenomena,lava fountaining, lava emissions), whereas at lateral vents the activity is mostly related to lavaflow emission. As in Marzocchi et al. (2008) the counts of past eruptive vents for each area (givenin Table 1) are used to shape the likelihood function.
3.4.2. Monitoring component
No specific monitoring parameters are set for this node, but all the parameters set forpreceding nodes could be suitable for assessing the future vent opening probability (Marzocchiet al., 2008).
In particular, we considered recorded seismic activities (both earthquakes and volcanictremor) set in nodes 1, 2 and 3 as the most significant for the next vent opening because stronglylocalized.
66
Boll. Geof. Teor. Appl., 53, 55-74 Brancato et al.
3.5. Node 5: size / style of the initial phase of the eruption
For this node, the theoretical approach (i.e., Sandri et al., 2004) has proved, up to now that nomonitoring parameter is able to provide insights into the size and style of an impending eruption.However, this could be possible at a well monitored and very active volcano such as Mt. Etna.Nevertheless, the elicitation of parameters able to discriminate among incoming Strombolian,fountains and sub-Plinian eruptions needs parameters whose quality was not available in 2001, aswell as three-component, broadband seismometers, continuous GPS and gravimetricmeasurements, infrasound sensors, thermal cameras, etc. They are actually available at Mt. Etna;unfortunately they were not in 2001. Thus, node 5 will not be treated here.
4. Results of the 2001 eruption forecast
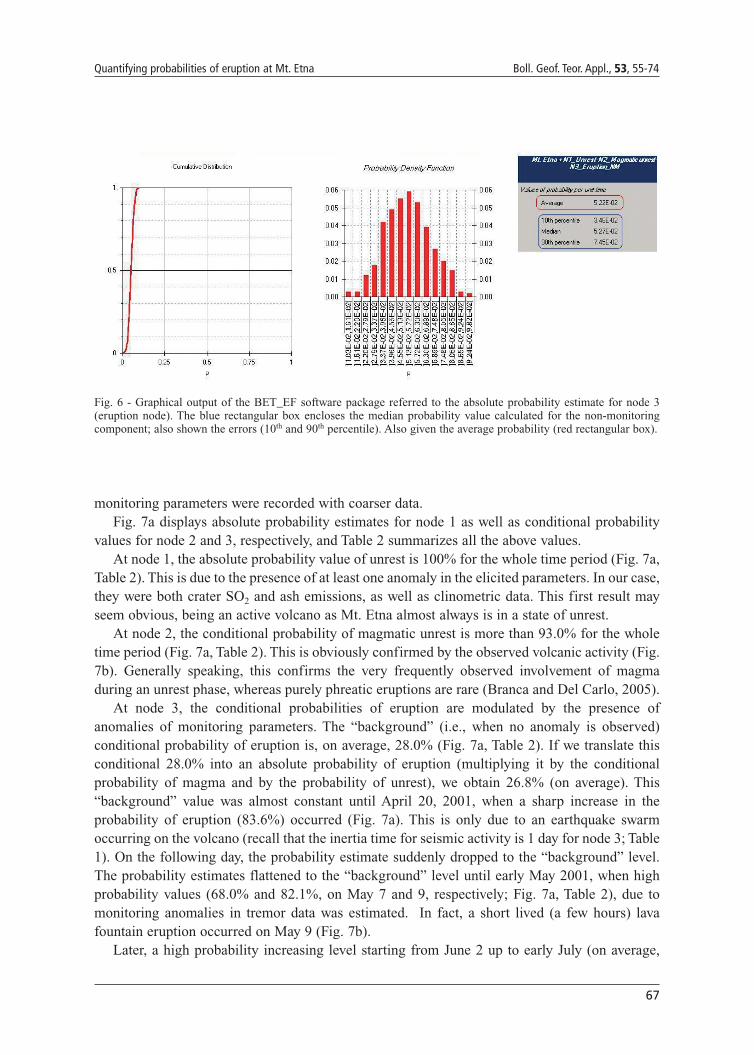
Concerning only a priori models and past data sets of the previous section, an average valuein the long-term, absolute probability of eruption around 5.0% per week is retrieved (Fig. 6).
For the short-term eruption forecasting, the use of the monitoring component is needed.Therefore, by using monitoring parameters, we can estimate probabilities associated withsignificant variations of the volcanic phenomena over a time scale comparable to the fixed timewindow forecast (in our case, one week).
We focused our attention on the onset of the July - August 2001 eruption. Fig. 7b shows thechronology of the eruptive activities of Mt. Etna during the time interval January 1 - August 92001 (the end of the eruption). The BET_EF was applied over the time period January 1 - July23 2001.
Starting from January up to July 9, we usually ran the process at a weekly rate. If “anomalous”data (i.e., monitoring parameters that exceed their thresholds) were observed, the model was runat a daily rate (e.g., April 20 – 21, May 7 –10). From July 12 up to July 23, we ran the process ata daily rate. In any case, the forecast time window remained fixed at one week. After this date,
Fig. 5 - Occurrence ofdifferent style eruptions(subp=sub-Plinian, fou=lavafountains, str=Strombolian,eff_S=summit effusive,eff_F=flank effusive) at Mt.Etna during 20th century (seetext for details).
67
Quantifying probabilities of eruption at Mt. Etna Boll. Geof. Teor. Appl., 53, 55-74
monitoring parameters were recorded with coarser data. Fig. 7a displays absolute probability estimates for node 1 as well as conditional probability
values for node 2 and 3, respectively, and Table 2 summarizes all the above values.At node 1, the absolute probability value of unrest is 100% for the whole time period (Fig. 7a,
Table 2). This is due to the presence of at least one anomaly in the elicited parameters. In our case,they were both crater SO2 and ash emissions, as well as clinometric data. This first result mayseem obvious, being an active volcano as Mt. Etna almost always is in a state of unrest.
At node 2, the conditional probability of magmatic unrest is more than 93.0% for the wholetime period (Fig. 7a, Table 2). This is obviously confirmed by the observed volcanic activity (Fig.7b). Generally speaking, this confirms the very frequently observed involvement of magmaduring an unrest phase, whereas purely phreatic eruptions are rare (Branca and Del Carlo, 2005).
At node 3, the conditional probabilities of eruption are modulated by the presence ofanomalies of monitoring parameters. The “background” (i.e., when no anomaly is observed)conditional probability of eruption is, on average, 28.0% (Fig. 7a, Table 2). If we translate thisconditional 28.0% into an absolute probability of eruption (multiplying it by the conditionalprobability of magma and by the probability of unrest), we obtain 26.8% (on average). This“background” value was almost constant until April 20, 2001, when a sharp increase in theprobability of eruption (83.6%) occurred (Fig. 7a). This is only due to an earthquake swarmoccurring on the volcano (recall that the inertia time for seismic activity is 1 day for node 3; Table1). On the following day, the probability estimate suddenly dropped to the “background” level.The probability estimates flattened to the “background” level until early May 2001, when highprobability values (68.0% and 82.1%, on May 7 and 9, respectively; Fig. 7a, Table 2), due tomonitoring anomalies in tremor data was estimated. In fact, a short lived (a few hours) lavafountain eruption occurred on May 9 (Fig. 7b).
Later, a high probability increasing level starting from June 2 up to early July (on average,
Fig. 6 - Graphical output of the BET_EF software package referred to the absolute probability estimate for node 3(eruption node). The blue rectangular box encloses the median probability value calculated for the non-monitoringcomponent; also shown the errors (10th and 90th percentile). Also given the average probability (red rectangular box).

68
Boll. Geof. Teor. Appl., 53, 55-74 Brancato et al.
more than 85.0%) was observed (Fig. 7a). During the same time period 13 lava fountain eruptionsoccurred at SEC (Fig. 7b), as well as the lava effusion from the fissure at the base of SEC wasstill ongoing (Behncke et al., 2006).
Starting from July 9 up to 23, the mean probability estimates were, on average, 92.5%, with amaximum peak that occurred on July 13 (95.8%; Fig. 7a, Table 2), the starting day of the VTseismicity that preceded the lava emission until July 18 (Patanè et al., 2003). On July 17, the dayof the flank eruption onset, the probability estimate reached a value of 95.2% (Fig. 7a, Table 2).
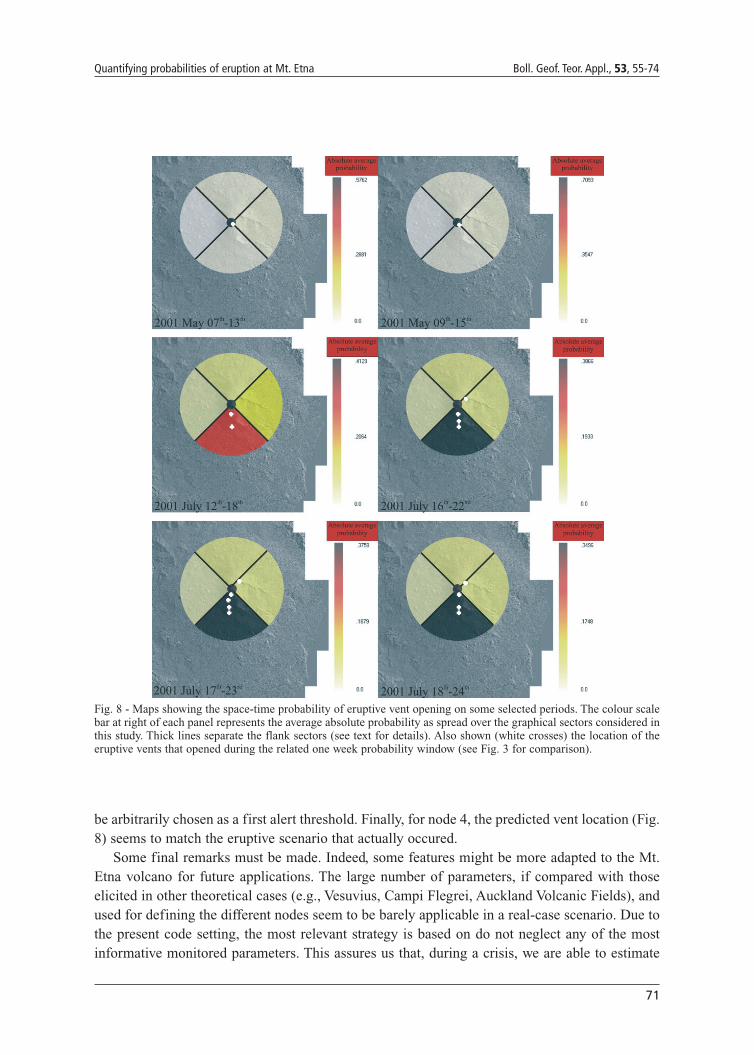
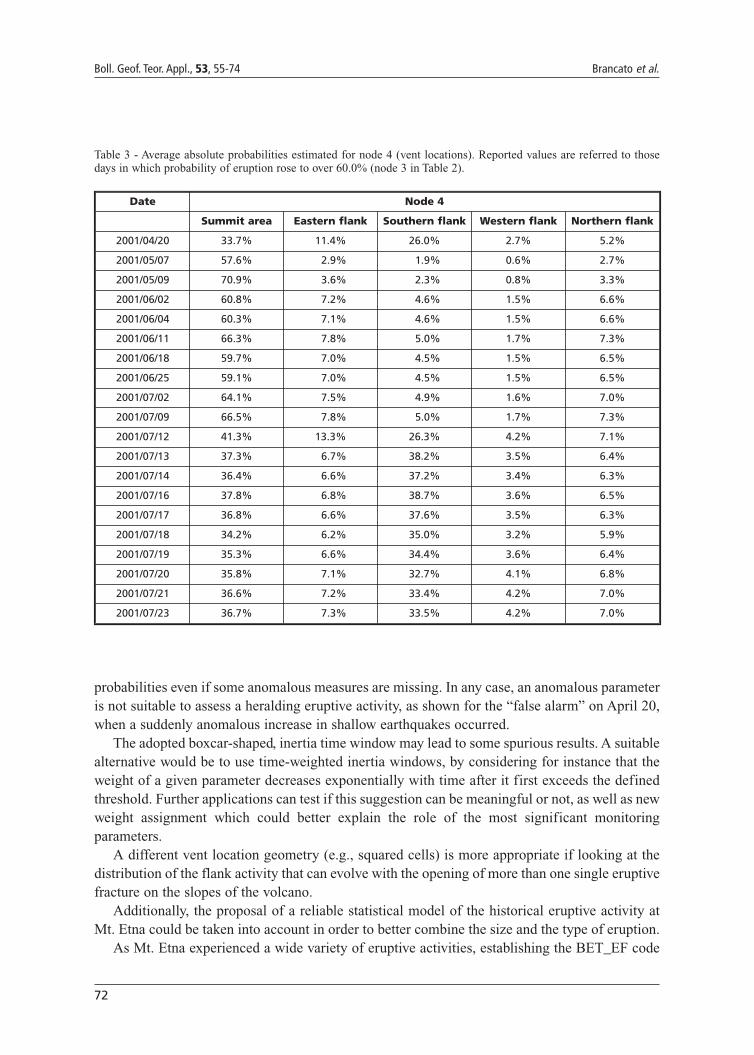
Concerning node 4 (vent location), VT earthquakes (depth < 5 km) and volcanic tremors arethe most significant anomalous parameters in the investigated period. Thus, by considering both,we generated maps showing relative probabilities of vent opening in the different zones, for earlyMay and middle July 2001 (Fig. 8). The eventual vent site fell consistently within the highestprobability zone on all of the maps (Fig. 8). Table 3, reports the absolute probability values spreadover the different sectors of the graphical frame defined above only for the days in which theprobability of eruption (node 3) rose up over 60% (Fig. 7a, Table 2). In May, a higher probabilityis observed in the summit crater zone (Fig. 7a). Indeed, the activity at SEC extended from earlyMay up to the middle of July, as described above (Fig. 7b).
Starting from July 12, the probability of eruptive activity, mostly effusive, became present in
Fig. 7 - (a.) Probability estimationsduring the 2001 January 1-July 23time period at Mt. Etna. Differentsymbols display different estimates:circles stand for absolute probabilityfor node 1 (unrest), diamonds standfor conditional probability for node2 (magmatic unrest, given an unrest),and triangles stand for conditionalprobability for node 3 (eruption,given a magmatic unrest). Grayboxes put in evidence periods ofanomalous signals in the monitoredparameters producing highprobability estimates. Yellow arrowindicates the onset of the June 7-July16 lava fountaining at SEC and redarrow indicates the July 17-August 9flank eruption activity. (b.) Eruptionstyles vs. time, during January 1-July 23 [data from Behncke et al.(2006)]. The y-axis as in Fig. 5.
a
b

69
Quantifying probabilities of eruption at Mt. Etna Boll. Geof. Teor. Appl., 53, 55-74
the southern quadrant, too. Starting from July 16 (Fig. 8) there is a strong increases there. Indeed,the first flank eruptive system opened on July 17 from 2900 to 2700 m a.s.l., while the lowereruptive fracture (2100 m a.s.l.) opened on July 18 (Monaco et al., 2005).
5. Final remarks
A recently-developed technique for probabilistic forecasting (BET_EF) has been applied toquiescent volcanoes [e.g., Vesuvius; Marzocchi et al. (2004, 2008)] or calderas [e.g., CampiFlegrei, Orsi et al. (2009) and Auckland Volcanic Field, Lindsay et al. (2010)] with differentelicitation experiments.
Before this application was used, it was unclear how the code might work on a persistentlyactive, open conduit volcano, such as Mt. Etna. The historical eruptive catalogue, coupled withthe modern monitoring records available makes it a reliable laboratory for testing the procedure.Our preliminary results suggest that the BET_EF can be applied to such kinds of volcanoes.
A very important aspect of this application was the monitoring setting experiment. Animproved workflow that created a direct interface between qualitative, process-based knowledge,and quantitative information is therefore significantly useful. For Mt. Etna, the adopted codemanages a relevant set of past data and a priori models set by the end user, as well as monitoringdata that must be gained by an advisory group of experts usually before a crisis. This code thenhas a huge potential for optimizing and clarifying decision-making procedures. In the light of thisview, the technique will rapidly translate (in near real time) our subjective decisions into objectiveprobabilities as information about unrest evolves, and may be used as a rational starting point forfurther discussions.
We focused our attention for the “well predictable” eruption as the one that occurred in 2001at Mt. Etna, the first case-history of an activity monitored with a good-quality multidisciplinarymonitoring system. Our estimated calculations seem suitable for managing eruptive crises with asufficient alert time, since they clearly showed an increase in the eruption probability at least onemonth before the eruption onset (Fig. 7a), as well as the fact that the space-time evolution of theeruptive scenario was roughly predicted (Fig. 8).
The monitoring parameters were set taking into account the present state of the surveillancesystem, and relative thresholds and inertia time window were fixed looking at the recentevolution of the relative time series.
Therefore, the present application shows that the monitoring had a primary role, because theestimated probabilities are able to trace the time evolution of the state of the volcano coherentwith what really occurred.
The strong evidence is based on the probability values of the unrest (node 1). The 100%estimate for the whole period (2001 January 1-July 23; Fig. 7a) indicates that Mt. Etna is almostalways under unrest, as expected for an active open-conduit volcano. The probability valueshigher than 93.0% for node 2 (magma/no magma; Fig. 7a) suggest that magma was stronglyinvolved during the 2001 unrest phase studied here. Concerning node 3 (eruption/no eruption),the probability values yield to fix a “background” level (28.0% on average; Fig. 7a) when nomonitoring anomalies are observed. In addition, when probabilities are estimated with valueshigher than 80.0% (Fig. 7a) an eruptive activity is incoming. Therefore, the value of 80.0% could

70
Boll. Geof. Teor. Appl., 53, 55-74 Brancato et al.
Table 2 - Average probability values as estimated for node 1 (absolute estimates), 2 (conditional estimates) and 3(conditional estimates). Values referred to node 1 (unrest/no unrest) are equal to 100% because of the presence of atleast an anomalous parameter, by definition (see text for details).
Date Node 1 Node 2 Node 3Absolute Absolute Conditional Absolute Conditional
2001/01/01 100% 95.6% 94.9% 28.3% 28.6%
2001/01/08 100% 95.9% 96.1% 28.1% 27.3%
2001/01/15 100% 94.6% 95.7% 27.4% 27.8%
2001/01/22 100% 96.7% 95.4% 26.3% 26.5%
2001/01/29 100% 96.9% 94.4% 27.0% 29.0%
2001/02/05 100% 95.8% 96.2% 27.7% 27.9%
2001/02/12 100% 94.6% 96.2% 25.9% 27.9%
2001/02/19 100% 96.0% 93.4% 25.6% 27.7%
2001/02/26 100% 93.7% 96.1% 26.7% 28.3%
2001/03/05 100% 94.9% 96.5% 27.0% 28.6%
2001/03/12 100% 96.9% 94.5% 26.1% 27.9%
2001/03/19 100% 96.9% 95.7% 26.9% 26.7%
2001/03/26 100% 94.5% 95.5% 26.7% 27.3%
2001/04/02 100% 95.6% 95.4% 26.7% 28.2%
2001/04/09 100% 95.5% 95.6% 27.7% 27.6%
2001/04/16 100% 95.8% 95.7% 25.8% 28.0%
2001/04/20 100% 94.0% 95.9% 77.8% 83.6%
2001/04/21 100% 95.6% 95.6% 25.3% 28.7%
2001/04/23 100% 96.2% 95.9% 27.0% 28.1%
2001/04/30 100% 96.2% 96.1% 26.9% 27.5%
2001/05/07 100% 97.2% 96.0% 66.1% 68.0%
2001/05/08 100% 96.1% 96.1% 26.1% 28.5%
2001/05/09 100% 97.5% 96.3% 81.1% 82.1%
2001/05/10 100% 96.7% 96.5% 27.7% 29.0%
2001/05/14 100% 97.4% 97.2% 26.7% 28.4%
2001/05/21 100% 96.7% 97.3% 27.8% 28.5%
2001/05/28 100% 96.9% 96.7% 27.6% 28.2%
2001/06/02 100% 96.6% 97.9% 80.6% 83.7%
2001/06/04 100% 97.7% 97.6% 80.4% 82.6%
2001/06/11 100% 97.2% 97.2% 89.1% 92.0%
2001/06/18 100% 97.8% 97.7% 80.7% 82.0%
2001/06/25 100% 97.6% 97.8% 80.7% 83.7%
2001/07/02 100% 97.5% 97.7% 86.7% 87.7%
2001/07/09 100% 98.2% 98.1% 88.4% 90.2%
2001/07/12 100% 96.7% 97.9% 93.7% 93.9%
2001/07/13 100% 96.6% 97.3% 94.9% 95.8%
2001/07/14 100% 97.3% 97.9% 91.4% 95.5%
2001/07/15 100% 97.7% 97.6% 92.8% 95.0%
2001/07/16 100% 97.8% 97.5% 92.5% 94.7%
2001/07/17 100% 98.1% 96.4% 91.8% 95.2%
2001/07/18 100% 97.5% 97.5% 86.4% 88.1%
2001/07/19 100% 96.7% 97.1% 87.7% 89.4%
2001/07/20 100% 97.4% 97.7% 88.9% 91.5%
2001/07/21 100% 97.2% 97.1% 88.4% 89.8%
2001/07/22 100% 97.2% 97.9% 88.2% 91.3%
2001/07/23 100% 97.9% 97.4% 86.7% 92.0%
71
Quantifying probabilities of eruption at Mt. Etna Boll. Geof. Teor. Appl., 53, 55-74
be arbitrarily chosen as a first alert threshold. Finally, for node 4, the predicted vent location (Fig.8) seems to match the eruptive scenario that actually occured.
Some final remarks must be made. Indeed, some features might be more adapted to the Mt.Etna volcano for future applications. The large number of parameters, if compared with thoseelicited in other theoretical cases (e.g., Vesuvius, Campi Flegrei, Auckland Volcanic Fields), andused for defining the different nodes seem to be barely applicable in a real-case scenario. Due tothe present code setting, the most relevant strategy is based on do not neglect any of the mostinformative monitored parameters. This assures us that, during a crisis, we are able to estimate
Fig. 8 - Maps showing the space-time probability of eruptive vent opening on some selected periods. The colour scalebar at right of each panel represents the average absolute probability as spread over the graphical sectors considered inthis study. Thick lines separate the flank sectors (see text for details). Also shown (white crosses) the location of theeruptive vents that opened during the related one week probability window (see Fig. 3 for comparison).
72
Boll. Geof. Teor. Appl., 53, 55-74 Brancato et al.
probabilities even if some anomalous measures are missing. In any case, an anomalous parameteris not suitable to assess a heralding eruptive activity, as shown for the “false alarm” on April 20,when a suddenly anomalous increase in shallow earthquakes occurred.
The adopted boxcar-shaped, inertia time window may lead to some spurious results. A suitablealternative would be to use time-weighted inertia windows, by considering for instance that theweight of a given parameter decreases exponentially with time after it first exceeds the definedthreshold. Further applications can test if this suggestion can be meaningful or not, as well as newweight assignment which could better explain the role of the most significant monitoringparameters.
A different vent location geometry (e.g., squared cells) is more appropriate if looking at thedistribution of the flank activity that can evolve with the opening of more than one single eruptivefracture on the slopes of the volcano.
Additionally, the proposal of a reliable statistical model of the historical eruptive activity atMt. Etna could be taken into account in order to better combine the size and the type of eruption.
As Mt. Etna experienced a wide variety of eruptive activities, establishing the BET_EF code
Table 3 - Average absolute probabilities estimated for node 4 (vent locations). Reported values are referred to thosedays in which probability of eruption rose to over 60.0% (node 3 in Table 2).
Date Node 4
Summit area Eastern flank Southern flank Western flank Northern flank
2001/04/20 33.7% 11.4% 26.0% 2.7% 5.2%
2001/05/07 57.6% 2.9% 1.9% 0.6% 2.7%
2001/05/09 70.9% 3.6% 2.3% 0.8% 3.3%
2001/06/02 60.8% 7.2% 4.6% 1.5% 6.6%
2001/06/04 60.3% 7.1% 4.6% 1.5% 6.6%
2001/06/11 66.3% 7.8% 5.0% 1.7% 7.3%
2001/06/18 59.7% 7.0% 4.5% 1.5% 6.5%
2001/06/25 59.1% 7.0% 4.5% 1.5% 6.5%
2001/07/02 64.1% 7.5% 4.9% 1.6% 7.0%
2001/07/09 66.5% 7.8% 5.0% 1.7% 7.3%
2001/07/12 41.3% 13.3% 26.3% 4.2% 7.1%
2001/07/13 37.3% 6.7% 38.2% 3.5% 6.4%
2001/07/14 36.4% 6.6% 37.2% 3.4% 6.3%
2001/07/16 37.8% 6.8% 38.7% 3.6% 6.5%
2001/07/17 36.8% 6.6% 37.6% 3.5% 6.3%
2001/07/18 34.2% 6.2% 35.0% 3.2% 5.9%
2001/07/19 35.3% 6.6% 34.4% 3.6% 6.4%
2001/07/20 35.8% 7.1% 32.7% 4.1% 6.8%
2001/07/21 36.6% 7.2% 33.4% 4.2% 7.0%
2001/07/23 36.7% 7.3% 33.5% 4.2% 7.0%

73
Quantifying probabilities of eruption at Mt. Etna Boll. Geof. Teor. Appl., 53, 55-74
for this volcano will address a scientific discussion on how a future eruption might progress.In conclusion, our results stressed the potential of the BET_EF procedure, through the quality
of the monitoring input data set, thus providing a rational means for their revision when new dataor information are incoming.
Acknowledgments. The authors wish to thank Chris Newhall for the fruitful discussions and suggestions.The constructive criticism of two anonymous reviewers has been greatly appreciated. The authors, also,wish to thank Dario Albarello and Carlo Meletti for their kind invitation in submitting this paper. Thepresent paper follows an oral contribution at the XXVIII Annual GNGTS Meeting (16-19 November 2009,Trieste, Italy). This research has benefited from funding provided by the Italian Presidenza del Consigliodei Ministri - Dipartimento della Protezione Civile (DPC, 2007-2009-10 V3 ‘Lava’ project). Scientificpapers funded by DPC do not represent any official opinion or policies.
REFERENCESAiuppa A., Allard P., D’Alessandro W., Giammanco S., Parello F. and Valenza M.; 2004: Magmatic gas leakage at
Mount Etna (Sicily, Italy): relationships with the volcano-tectonic structures, the hydrological pattern and theeruptive activity. In: Bonaccorso A., Calvari S., Coltelli M., Del Negro C. and Falsaperla S. (eds), Mt. Etna:Volcano Laboratory. American Geophysical Union, Washington DC, pp. 129-145, doi.: 10.1029/143GM09.
Alparone S., Andronico D., Lodato L. and Sgroi T.; 2003: Relationship between tremor and volcanic activity duringthe Southeast Crater eruption on Mount Etna in early 2000. J. Geophys. Res., 108 (B5), doi:10.1029/2002JB001866.
Behncke B., Neri M., Pecora E. and Zanon V.; 2006: The exceptional activity and growth of the Southeast Crater, MountEtna (Italy), between 1996 and 2001. Bull. Volcanol., 69, 149-173, doi: 10.1007/s00445-006-0061-x.
Bonaccorso A., Aloisi M. and Mattia M.; 2002: Dike emplacement forerunning the Etna July 2001 eruption modelledthrough continuous tilt and GPS data. Geophys. Res. Let., 29 (13), doi: 10.10129/2001GL014397.
Bonaccorso A., Calvari S., Coltelli M., Del Negro C. and Falsaperla S. (eds); 2004a: Mt. Etna: Volcano Laboratory.American Geophysical Union, Washington DC, 357 pp.
Bonaccorso A., D’Amico S., Mattia M. and Patanè D.; 2004b: Intrusive mechanism at Mt. Etna forerunning the July-August 2001 eruption. Pure Appl. Geophys., 161, doi: 10.1007/s00024-004-2515-4.
Bonforte A., Guglielmino F., Palano M. and Puglisi G.; 2004: A syn-eruptive round deformation episode measured byGPS, during the 2001 eruption on the upper southern flank of Mt. Etna. Bull. Volcanol., 66, 336-341, doi:10.1007/s0045-003-0314-x.
Branca S. and Del Carlo P.; 2005: Types of eruptions at Etna volcano AD 1670-2003: implications for short-termeruptive behaviour. Bull. Volcanol., 67, 737-742 doi: 10.1007/s00445-005-0412-z.
Bruno N., Caltabiano T., Giammanco S. and Romano R.; 2001: Degassing of SO2 and CO2 at Mount Etna (Sicily) asan indicator of pre-eruptive ascent and shallow emplacement of magma. J. Volcanol. Geotherm. Res., 110, 137-153.
Caltabiano T., Romano R. and Budetta G.; 1994: SO2 flux measurements at Mount Etna (Sicily). J. Geophys. Res., 99(D6), 12809-12819.
Carbone D. and Greco F.; 2007: Review of microgravity observations at Mt. Etna: a powerful tool to monitor and studyactive volcanoes. Pure Appl. Geophys., 164, 769-790, doi: 10.1007/s00024-007-0194-7.
Carbone D., Budetta G. and Greco F.; 2003: Bulk processes prior to the 2001 Mount Etna eruption, highlighted throughmicrogravity studies. J. Geophys. Res., 108, doi: 10.1029/2003JB002542.
Casadevall T.J., Johnston D.A., Harris D.M., Rose W.I., Malinconico L.L., Stoiber R.E., Bornhorst T.J., Williams S.N.,Woodruff L. and Thompson J.M.; 1981: SO2 emission rates at Mount St. Helens from March 29 through December,1980. In: Lipman P.W. and Mullineaux D.R. (eds), The 1980 eruptions of Mount St. Helens, U. S. Geol. Surv. Prof.Pap. 1250, pp. 193-200.
Cocina O., Neri G., Privitera E. and Spampinato S.; 1998: Seismogenetic stress field beneath Mt. Etna (South Italy)and possible relationship with volcano-tectonic features. J. Volcanol. Geotherm. Res., 83, 335-348.

74
Boll. Geof. Teor. Appl., 53, 55-74 Brancato et al.
Cristofolini R., Gresta S., Imposa S. and Patanè G.; 1988: Feeding mechanism of eruptive activity at Mt. Etna basedon seismological and petrological data. In: King L.Y. and Scarpa R. (eds), Modeling of Volcanic Processes. EarthEvol. Sci, pp. 73-93.
Falsaperla S., Alparone S., D’Amico S., Di Grazia G., Ferrari F., Langer H., Sgroi T. and Spampinato S.; 2005: Volcanictremor at Mt. Etna, Italy, preceding and accompanying the eruption of July-August 2001. Pure and App. Geophys.,162, 2111-2132, doi: 10.1007/s00024-005-2710-y.
Guest J.E.; 1982: Styles of eruptions and flow morphology on Mt. Etna (volcanological data). Mem. Soc. Geol. It., 23,49-73.
Lindsay J., Marzocchi W., Jolly G., Costantinescu R., Selva J. and Sandri L.; 2010: Towards real-time eruptionforecasting in the Auckland Volcanic Field: application of BET_EF during the New Zealand National DisasterExercise ‘Ruamoko’. Bull. Volcanol., 72, 185-204, doi: 10.1007/s00445-009-0311-9.
Marzocchi W., Sandri L., Gasparini P., Newhall C. and Boschi E.; 2004: Quantifying probabilities of volcanic events:the example of volcanic hazard at Mount Vesuvius. J. Geophys. Res., 109, B11201, doi: 10.1029/2004JB00315U.
Marzocchi W., Sandri, L. and Selva, J.; 2008: BET_EF: a probabilistic tool for long- and short-term eruptionforecasting. Bull. Volcanol., 70, 623-632, doi: 1007/s00445-007-0157-y, 2008.
Monaco C., Catalano S., Cocina O., De Guidi G., Ferlito C., Gresta S., Musumeci C. and Tortorici L.; 2005: Tectoniccontrol on the eruptive dynamics at Mt. Etna volcano (Sicily) during the 2001 and 2002-2003 eruptions. J.Volcanol. Geotherm. Res., 144, 211-233, doi: 10.1016/j.jvolgeores.2004.11.024.
Newhall C.G. and Hoblitt R.P.; 2002: Constructing event trees for volcanic crises. Bull. Volcanol., 64, 3-20 doi:10.1007/s004450100173.
Orsi G., Di Vito M.A., Selva J. and Marzocchi W.; 2009: Long-term forecast of eruption style and size at Campi Flegreicaldera (Italy). Earth Planet. Sci. Let., 287, doi: 10.1016/j.epsl.2009.08.013.
Patanè D., Privitera E., Gresta S., Akinci A., Alparone S., Barberi G., Chiaraluce L., Cocina O., D’Amico S., De GoriP., Di Grazia G., Falsaperla S., Ferrari F., Gambino S., Giampiccolo E., Langer H., Maiolino V., Moretti M.,Mostaccio A., Musumeci C., Piccinini D., Reitano D., Scarfì L., Spampinato S., Ursino A. and Zuccarello L.; 2003:Seismological constraints for the dike emplacement of July-August 2001 lateral eruption at Mt. Etna volcano, Italy.Ann. Geophys., 46, 599-608.
Sandri L., Marzocchi W. and Zaccarelli L.; 2004: A new perspective in identifying the precursory patterns of volcaniceruptions. Bull. Volcanol., 66, 263-275, doi: 10.1001/s00445-003-0309-7.
Corresponding author: Alfonso BrancatoDipartimento di Scienze Geologiche, Università degli Studi di CataniaCorso Italia 55, 95129 CataniaPhone: +39 095 7195709; fax: +39 095 7195728; e-mail: [email protected]
Copyright © 2022 FDOKUMEN