
Predicting the impact of lava flows at Mount Etna, Italy
38
Predicting the impact of lava flows at Mount Etna (Italy) Gino M. Crisci 1,4 , Maria V. Avolio 2,4 , Boris Behncke 3 , Donato D’Ambrosio 2,4 , Salvatore Di Gregorio 2,4 , Valeria Lupiano 1 , Marco Neri 3 , Rocco Rongo 1,4 , William Spataro 2,4 1 Department of Earth Sciences, University of Calabria, 87036 Rende, Italy 2 Department of Mathematics, University of Calabria, 87036 Rende, Italy 3 Istituto Nazionale di Geofisica e Vulcanologia, Sezione di Catania, 95123 Catania, Italy 4 High Performance Computing Centre, University of Calabria, 87036 Rende, Italy Submitted to: Journal of Geophysical Research
Transcript of Predicting the impact of lava flows at Mount Etna, Italy

Predicting the impact of lava flows at Mount Etna (Italy)
Gino M. Crisci1,4, Maria V. Avolio2,4, Boris Behncke3, Donato D’Ambrosio2,4, Salvatore Di
Gregorio2,4, Valeria Lupiano1, Marco Neri3, Rocco Rongo1,4, William Spataro2,4
1Department of Earth Sciences, University of Calabria, 87036 Rende, Italy 2Department of Mathematics, University of Calabria, 87036 Rende, Italy 3Istituto Nazionale di Geofisica e Vulcanologia, Sezione di Catania, 95123 Catania, Italy
4High Performance Computing Centre, University of Calabria, 87036 Rende, Italy
Submitted to:
Journal of Geophysical Research

2
Abstract
Forecasting the time, nature and impact of future eruptions is difficult at volcanoes such as Mount
Etna, in Italy, where eruptions occur from the summit and on the flanks, affecting areas distant from
each other. Nonetheless, the identification and quantification of areas at risk from new eruptions is
fundamental for mitigating potential human casualties and material damage. Here, we present new
results from the application of a methodology to define flexible high-resolution lava invasion
susceptibility maps based on a reliable computational model for simulating lava flows at Etna and
on a validation procedure for assessing the correctness of susceptibility mapping in the study area.
Furthermore, specific scenarios can be extracted at any time from the simulation database, for land-
use and civil defence planning in the long-term, to quantify, in real-time, the impact of an imminent
eruption, and to assess the efficiency of protective measures.
1. Introduction
Current efforts for hazard evaluation and contingency planning in volcanic areas draw heavily on
hazard maps and numerical simulations. In Italy, where future eruptions from historically active
volcanic centres like Vesuvius and Mount Etna threaten the lives and property of millions of
people, this is of particular relevance. At Vesuvius, recent work ranges from simulations of tephra
falls and pyroclastic flows (Barberi et al., 1990; Dobran et al., 1994) to calculations of the likely
mortality and building damage on a macroscopic scale (Spence et al., 2004; Zuccaro et al., 2008).
Although the next eruption of Vesuvius will most likely have a disastrous impact, many decades or
even centuries may pass before this eruption may occur (De Vivo, 2006).
By contrast, Etna in Sicily is almost continuously active. Frequently, its eruptions affect populated
areas or cultivated land, and the probability of one or more highly disruptive events is significant in
the next years to few decades (Behncke and Neri, 2003a; Behncke et al., 2005; Allard et al., 2006;
Neri et al., 2009). The major hazard related to Etna’s eruptions is from lava flows invading and

3
destroying land and property (Behncke et al., 2005; Bisson et al., 2009). Eruptions in 1669 and
1928 destroyed entire villages and, in the earlier case, portions of Catania, the main city of the
region (Duncan et al., 1996; Chester et al., 1999; Crisci et al., 2003) (Fig. 1a). More limited damage
to property has been caused by nearly half of Etna’s eruptions in the last 400 years. In recent
decades, the vulnerability of the Etnean area has increased exponentially due to continued
urbanization and growing living standards (Behncke et al., 2005; Dibben, 2008; Bisson et al.,
2009). Earth barriers and explosives have been used to divert lava flows during a number of
eruptions since 1983 (Barberi and Villari, 1984; Barberi et al., 1993, 2003), but such operations rely
heavily on available time and areas to divert the lava. To date, responses to eruptions of a religious
or ‘ritual’ nature remain common among the Etnean population (Chester et al., 2008).
Another problem is that Etna erupts from vents both at its summit and on its flanks (Chester et al.,
1985; Behncke and Neri, 2003b; Acocella and Neri, 2003; Walter et al., 2005; Neri et al., 2008), so
that future events may take place almost anywhere on the volcano (Guest and Murray, 1979).
Finally, some eruptions unfold very rapidly (e.g., 1928 and 1981), leaving little time for a
coordinated response (Guest et al., 1987). It is therefore imperative to predict the evolution of future
lava fields as early and swiftly as possible, in order to enable appropriate civil defence action such
as evacuation and other protective measures, and to allow more rational land use planning or, on the
contrary, avoid unnecessary alarm and emergency action in areas not directly threatened by an
eruption. One response to such challenges is the numerical simulation of lava flows, and the
possible alteration of lava flow paths by topography and artificial obstacles such as earth barriers,
and cooling with water (Ishihara et al., 1990; Crisci et al., 2004; Del Negro et al., 2008; Favalli et
al., 2009; Fujita et al., 2009).
Here, we address this problem with an elaborate approach in the numerical simulation of Etnean
lava flows, based on the results of 39,300 simulations of flows erupted from a grid of 393
hypothetical vents in the eastern sector of Etna (Fig. 1b). This sector was chosen because it is
densely populated and frequently affected by flank eruptions (Fig. 1a). Note that, for this first phase

4
of simulations of which this paper is the result, Valle del Bove was excluded from our study as it
does not have urbanised areas or significant infrastructures. Historically, most eruptions which have
originated from this area remain confined to the valley (Romano et al., 1979), without extending
into populated areas downslope, the most notable exception being the unusually voluminous and
long-lived 1991-1993 eruption (Barberi et al., 1993; Calvari and Pinkerton, 1998).
The simulations are based on our knowledge of past Etnean eruptions, derived from the integration
of historical and geological data. Information on historical eruptions of Etna is fairly accurate for
the past 400 years (Behncke et al., 2005; Branca and Del Carlo, 2005) but can be extrapolated
further into the past using geological data such as the spatial distribution and density of vents and
their concentration in rift zones (Guest and Murray, 1979; Acocella and Neri, 2003; Behncke et al.,
2005; Rust et al., 2005; Walter et al., 2005). We furthermore assume that Etna’s behaviour will not
change dramatically in the next few decades to centuries. A clear increase in the eruption frequency
and average output rate is evident for the past few decades (Behncke and Neri, 2003; Behncke et
al., 2005, 2006, 2008; Allard et al., 2006; Neri et al., 2006), but the current output rate is still about
half that of the period 1600-1669, which is included in the analysis. The largest eruptions to be
expected (based on the historical record) have therefore been accounted for in the simulations.
Summit eruptions are excluded from the analysis because no summit-fed lava flows are known to
have ever reached the currently populated areas.
2. The simulations
The computational model applied here belongs to the SCIARA family of lava flow simulation
models (Crisci et al., 2004). In the specific case this is the SCIARA-fv release, which is considered
to give the most accurate and efficient performance, given the extent (567 km2; Fig. 1b) of the study
area and the great number of simulations to be carried out. The model is based on the Cellular
Automata computational paradigm (Von Neumann, 1966; Chopard and Droz, 1998) and,

5
specifically, on the Macroscopic Cellular Automata approach for the modelling of spatially
extended dynamic systems (Di Gregorio and Serra, 1999).
Thanks to careful calibration and validation, a suitable set of model parameters was determined,
allowing SCIARA to reproduce Etnean lava flows with a high level of accuracy. At the same time,
many computational refinements were implemented, considerably speeding up the model. A
sensitivity analysis was also performed, by excluding unpredictable changes in simulation outcomes
when small changes are considered in input data, demonstrating the overall robustness of the
computational algorithm. Rongo et al. (2008) and Crisci et al. (2008) give details about this
application and preliminary results of the current simulation effort.
Based on the documented past behaviour of the volcano, the probability of new vents forming was
constrained, resulting in a subdivision of the study area into four zones that represent different
probabilities of new vents opening. In these zones, a grid of 393 hypothetical vents – composed of
two 1 km spaced sub-grids, shifted from each other by 500 m to the south and east – was defined as
the source for the simulations to be carried out (Fig. 1b).
In addition, all flank eruptions of Etna since AD 1600 were classified according to duration and
lava volume (Behncke et al., 2005; Rongo et al., 2008). Values for classes for which no events with
quantitative data are available in the eruption database were inferred by bivariate analysis. Highly
unlikely extreme events, such as exceptionally high volume-short duration and very low volume-
long duration eruptions, were excluded from the analysis. A total of 50 classes (out of 60) were thus
obtained. Frequencies were normalized into the range [0,1], obtaining the probability that a new
hypothetical eruption can occur, depending on which class it belongs to (Table 1). Then, a
representative eruption was selected for each class, considering in particular the highest volume and
longest duration within the class extremes.
Furthermore, two effusion rate trends were taken into account in order to characterise temporal lava
distribution for the considered representative eruptions. Values for each trend were obtained by

6
uniting randomly chosen points between two Gaussian-like curves, with maximum flow rate values
at 1/6 and 1/3 of the overall event duration, respectively. Obtained trends, assumed equiprobable,
basically reflect the effusive mean behaviour of Etnean lava flows (Kilburn and Lopes, 1988;
Hughes et al., 1990; Kilburn and Guest, 1993; Harris and Neri, 2002; Behncke and Neri, 2003b;
Calvari et al., 2003; Harris et al., 2008;). The examples displayed in Fig. 1c represent eruptions
lasting for 60 days with peak eruption rates of nearly 90 m3 s-1.
A total of 100 flow rate scenarios were obtained, by combining the two representative effusion rate
trends with the 50 representative eruptions, which plausibly represent the typical behaviour of the
volcano in the near future. Thanks to the adoption of Parallel Computing, each scenario was
simulated for each of the 393 vents of the grid, obtaining a database of 39,300 simulations in the
study area. An overall probability of occurrence, pe, was thus defined for each scenario, by
considering the product of the individual probabilities of its main parameters:
pe = ps pc pt (1)
where ps denotes the probability of eruption from a given location, pc the probability related to the
event’s membership class, and pt the probability related to its effusion rate trend.
Hence, lava flow invasion susceptibility was evaluated for each point of the study area by
considering the contributions of all simulations that affected the point in terms of their probability
of occurrence, with a resulting detail which exclusively depends on the resolution of the considered
Digital Elevation Model (DEM). Formally, if a given DEM cell of co-ordinates x,y was affected by
nx,y ≤ N simulations, its susceptibility was defined as the sum of the probabilities of occurrence of
involved lava flows, pe(i) (i=1, 2, ..., nx,y):
∑=
=yxn
i
ieyx ph
,
1
)(, (2)

7
The approach is characterised by an elevated degree of flexibility. If some basic hypotheses are not
correct, for instance in attributing the probabilities of occurrence to characteristic eruptions, a new
map can immediately be generated by considering new hypotheses and by reprocessing the
simulation database, without needing to perform new simulations. Moreover, even in the case of
new eruptions producing morphostructural changes in the study area, these modifications can be
incorporated into an updated DEM. Re-simulation will then only be necessary for those events in
the simulation database which affected the area modified by the new eruptions. Only if Etna were to
produce an amount of eruptions whose characteristics imply a modification of the pre-determined
representative set of lava flows, would a new overall simulation phase be required in order to obtain
a correct susceptibility scenario.
3. Susceptibility to lava flow invasion
The lava flow invasion susceptibility map resulting from the simulations and the application of
equation (2) is presented in Fig. 2 and represents the probability that future eruptions will affect the
study area. As a compromise between map readability and resolution, susceptibility was represented
by means of 10 classes, showing significant variations in the degree to which different portions of
the area are likely to be affected by future lava flows. In the southern sector of the area, it is evident
that the spatial distribution of vent activation probabilities and the morphology coincide in a manner
as to create conspicuous zones of funnelling of lava flows, putting a number of locations downslope
from those zones at extreme risk. The village of Malopasso (Fig. 3b) and the southern portion of
Zafferana Etnea (Fig. 2, bottom) are particularly exposed (up to class 9). The eastern parts of
Nicolosi and Pedara, as well as the areas immediately to the north of Trecastagni (which have seen
rapid urban development in recent years), are characterised by a medium/low susceptibility (up to
class 4) . Trecastagni and Viagrande, although in the same general area, are less exposed, because
much of them lies on and around a prehistoric pyroclastic cone, forming a morphological high

8
ground; lava invasion would only occur here if the eruptive vent were located on that elevation (Fig.
2).
On a quantitative level, nearly 4/5 of this sector coincides with classes 1-2 (lowest levels of
susceptibility), whereas less than 4% of the area falls into the upper five classes (moderate to high
levels of susceptibility; see Table 2). Relative to the total urbanized area, the proportion of high-
susceptibility classes is less favourable. Out of the total area occupied by the mentioned population
centres (about 13.5 km2), nearly 85% falls into the susceptibility classes 1-2, while 14.6% into
classes 3-7. By contrast, the only urban centre affected by susceptibility classes 8 is Zafferana
Etnea, coinciding with 6% of its southern suburb Malopasso (Fig. 3b). No urbanised areas are
affected by susceptibility classes 9-10.
As for the northern sector of the study area, a somewhat different scenario emerges due to a diverse
morphology, concentration of eruptions in the Northeast Rift, and lesser urbanization (Fig. 2, top).
Here, funnelling of lava flows is concentrated in one principal zone, downslope from the areas with
the highest vent densities and eruption frequencies, the Northeast Rift and the area around Monti
Sartorius. Furthermore, lavas moving through this funnelling zone are deviated further downslope
by a prominent fault scarp (the Pernicana fault; Acocella and Neri, 2005) located between Villaggio
Mareneve and Monte Crisimo (Fig. 3a) and thus less likely to encounter the town of Linguaglossa
(Fig. 2, top). On a general scale, the proportion of high-susceptibility level zones is much lower
than in the southern sector, with none of the higher 5 susceptibility levels occurring outside the
prominent funnelling zone. Among the population centres in this sector, only the villages of
Sant’Alfio, Puntalazzo and Passopisciaro are exposed to susceptibility levels up to 5 (Fig. 2, top).
What furthermore becomes clear is that areas located below an elevation of ~300 m are much less
exposed, and may be affected only in exceptional cases. A specific validation procedure, described
in the following, assesses the reliability of obtained results.

9
4. Validation of the susceptibility map.
The applications described in this text must be considered merely methodological examples of how
lava invasion susceptibility can be assessed in volcanic areas, unless objective evaluations confirm
the validity of the obtained results. This is mainly because our approach is based on tools,
hypotheses and analysis procedures, whose correctness determine the overall reliability of the
study. In order to evaluate the results of the applied methodology in advance (before new eruptions
affect the study area), we simulated a set of 13 documented real eruptions (Table 3) on the present-
day topography, using their actual parameters for the data input and then evaluating the overlapping
between the affected area and the susceptibility classes. This solution is plausible, given that the
adopted simulation model proved able to reproduce Etnean events with a high level of accuracy (it
probably represents the “stronger link” in the chain of choices that the methodology requires) and
that historical lava flows should logically assume a different shape on the present-day morphology
of the volcano with respect to the original one (Fig. 4).
Preliminarily, the extent of the portion of the i-th susceptibility class (i=1, 2, ..., r) that is expected
to be affected on average by future lava flows was evaluated as
ei = hi m(Ci) (3)
being m(Ci) the areal extent of the class and hi its mean susceptibility (Table 2). Moreover, the
mean extent of the area affected by the n=13 simulations, in comparison with the i-th susceptibility
class, was evaluated as
(∑ =− ∩=
n
j jii SCmno1
1 ) (4)
Sj being the area affected by the j-th simulation. Finally, the function
∑ =− −=
r
i ii eord1
1 || (5)

10
was considered, representing the mean distance between the observed and expected values defined
above. It is 0 if the two series perfectly fit, while its value becomes greater as the discrepancy
increases.
Figure 5 shows the trend of the above defined expected and observed series against various
numbers of susceptibility classes, the higher numbers of classes allowing for better fitting. Fig. 5
refers to the 10-classed susceptibility map shown in Fig. 2 (Table 2). As is seen, the two series
converge toward the higher susceptibility classes, and the discrepancy is fairly limited also for the
lower classes. Here, the greatest disagreement, about 0.65 km2, is obtained in correspondence of
class 2. This, however, can be considered a slight error in consideration of the total areal extent of
the class, which is about 298 km2. The mean distance between the two series, d=0.138 km2,
confirms the good overall agreement between the expected and observed affected areas.
To evaluate the consistency of the above result, a further analysis was performed by considering
four additional lava invasion susceptibility maps, with different levels of detail in terms of number
of classes (i.e., 5, 20, 40 and 198-classed maps; Fig. 5a,c,d,e). As shown in Fig. 5a (the five-classed
map), the discrepancy between the two series appears generally an overestimation. The fitting
considerably increases starting from the 10-classed map, matching best in the 198-classed map.
This latter map results from grouping susceptibility values of up to the third decimal digit and
quantifies the susceptibility in the study area with an elevated level of detail (Fig. 6). Fig. 5f
summarizes the above results by showing the trend of the metrics d with respect to the considered
numbers of classes. Here, a monotone fast convergence towards the optimal value is observed.
On the basis of this analysis, we can provide a first satisfactory evaluation of our methodology and,
specifically, of the prediction capability of the susceptibility map shown in Fig. 2. The good
agreement between the expected and observed invaded areas obtained for this map is, in fact, not
fortuitous. It is rather part of a general trend in which even better results are reached in more
detailed maps. Among those considered, the 10-classed map seems to be the better compromise
between reliability and readability and can therefore be considered of practical interest for lava flow
impact prediction and hazard evaluation, as well as for Civil Defence purposes and land use

11
planning in the considered eastern flank of Etna. Eventually, still on the basis of our analysis, we
can assert that a total of ~40,000 simulated lava flow scenarios, as those considered in this study,
are sufficient to characterise the susceptibility in the study area. What the necessary number of
scenarios is still remains an open question and requires additional analyses. This latter study,
together with further testing of the methodology, will be performed in the future, when an adequate
number of new, real, eruptions affect the study area.
5. Specific scenarios
Besides the definition of general susceptibility maps, the availability of a large number of lava
flows of different eruption types, magnitudes and locations simulated for this study allows the
instantaneous extraction of various scenarios on demand. This would be especially relevant once
premonitory signs such as localized seismicity and ground deformation indicate the possible site of
imminent eruptions. Such eruptions can even comprise complex events, which for Etna are fairly
typical, such as lava emission from an extensive system of eruptive fissures propagating downslope
over a length of several kilometres. We have performed an analysis for such an eruption on the east-
northeast flank of Etna, not far from the 1928 eruption site, with lava emission from a fissure
system ~7 km long, and consisting of three en echelon segments. The eruptive system was
approximated by a subset of vents of the simulation grid and all lava flows originated from them
selected from the simulation database (without needing to perform new simulations). On the basis
of this information, an ad hoc susceptibility scenario was obtained by applying equation (2), where
the vent activation probability ps in equation (1) is obtained by imposing a probability equal to 1 to
the overall eruptive system (which is considered as erupting). The resulting map is shown in Fig. 7,
where the village of Puntalazzo is seen to be at considerable risk, whereas the town of Mascali,
rebuilt after being destroyed in 1928, lies just outside the maximum extent of the simulated lava
flows, probably due to the new morphological conditions. Note that, characteristically, lava
emission is most voluminous and long-lived in the lower portions of Etnean eruptive fissure

12
systems. However, the worst case for each segment was considered in our analysis, as all the
characteristic lava flows originated by the set of vents which approximates the eruptive system were
taken into account. As a consequence, the resulting susceptibility map must be considered as a
worst case scenario.
In a further Civil Defence oriented application, it is possible to identify all source areas of lava
flows capable of affecting a given area of interest, such as a town or a major infrastructure. Indeed,
this application is rapidly accomplished by querying the simulation database, by selecting the lava
flows that affect the area of interest and by circumscribing their sources. For this application we
have chosen the town of Nicolosi, an important historical and cultural site, with many
administrative buildings and tourist facilities. The map of Fig. 8 shows a total of 34 vents belonging
to the simulation grid of Fig. 1b that produce lava flows affecting the town of Nicolosi, together
with the corresponding susceptibility scenario. This latter is obtained by considering the same
methodology applied for the definition of the lava invasion susceptibility map shown in Fig. 2, and
results from 2,742 simulations over a total of 3,400 lava flows (100 lava flows for each vent were in
fact considered during the simulation phase). The remaining 658 simulations resulted not affecting
the town of Nicolosi. The map also points out that, in case of an eruption starting from a source
located within the region defined by the considered vents, the centre of Nicolosi can be affected by
up to class 6 (areas in yellow), with a maximum probability to be invaded equal to 42.3%. The
valley at the eastern margin of the town shows still higher levels of susceptibility, with a maximum
probability of 63.4%. Eventually, the area at major risk is that located immediately north of the
town, which is characterized by a probability of up to 70.5%.
6. Protective measures
By means of the analysis of specific scenarios as defined in the previous section, the presence of
morphological weaknesses, which may favor the flowing of lava toward major infrastructures and/or

13
inhabited areas, can be easily detected. For instance, just North of the town of Nicolosi, it is possible to
individuate an area where lava can flow towards the town center, resulting in a susceptibility value of
about 40% (cf. C6 susceptibility class in Fig. 8). A further application can be therefore dedicated to the
assessment of protective measures, such as earth barriers, for mitigating lava invasion susceptibility. To
illustrate this kind of application, a northwest-southeast trending barrier, 2 km long and 20 m high, was
considered along the northern margin of Nicolosi for diverting lava flows into a valley at the eastern
margin of the town without, however, considering the legal and ethical aspects of such an operation. The
barrier is placed obliquely to the main direction of the expected lava flows, rather to divert them into a
new direction than to stop them. This is based on experience acquired during the 1983 and 1991-1993
eruptions of Etna, where it was demonstrated that barriers placed perpendicular to the flow direction
would provide only a temporary obstacle without causing any change in the flow direction, whereas
lateral confining of lava flows by barriers proved more efficient (Barberi and Villari, 1984; Barberi et al.,
1993, 2003). By querying the simulation database, all the lava flows that affected the barrier were
selected (as well as their sources − Fig. 9a) and thus re-simulated on the modified topography which
embeds the presence of the barrier. Similarly to the case of the application in Fig. 8, an ad hoc
susceptibility scenario was extracted by considering these new simulations (Fig. 9b).
Results show that the barrier would be necessary to effectively protect the town centre. The
susceptibility here decreases by three classes and, at the same time, the areas invaded by diverted
flows prove characterised by only a slightly higher susceptibility degree. In this specific case, the
protective measure has a substantially positive effect. If in other scenarios this were not the case,
further experiments with barriers in different positions and of different dimensions will reveal to
what degree damage from lava flow invasion can be minimized, or whether it would be preferable
to abandon any prospects of this kind of protective measure.
7. Advantages and shortcomings

14
The fundamental problem of assessing the impact of future eruptions of Etna lies mostly in the
uncertainty concerning their duration, effusion rate, and location. We tackled this issue by an
elaborate approach in the numerical simulation of a wide series of lava flows, which are typical of
Etna for duration and effusion rate, on a dense grid of vents, by attributing them a statistical
likelihood. The adoption of a proper criterion of evaluation permitted producing a general
susceptibility map in unprecedented detail for the considered study area, which we demonstrated to
be characterised by high flexibility and reliability.
Moreover, besides the possibility of assessing the efficiency of protective measures, a notable
advantage of the approach is that it allows extracting specific scenarios on demand. Consequently,
it is no longer necessary to wait for the next eruption and know its eruptive parameters and location
in order to run ad hoc simulations, as has been the practice until now. Instead, virtually all possible
eruption scenarios can be extracted either a priori or in real time as soon as the need arises, as in the
case of an imminent or incipient flank eruption.
The methodology here described can therefore represent a substantial advance in the field of lava
flow impact prediction and can also have immediate, far-reaching implications both in land-use and
civil defence planning.
However, an apparent limit to our approach lies in the fact that the risk of lava flow inundation
appears to be extremely small along the low-lying and coastal areas. During the past 1000 years,
lava flows have reached the sea on at least three occasions, in ~1030 and ~1160 (or possibly 1224)
AD (Tanguy et al., 2007; Guidoboni and Ciuccarelli, 2008), and in 1669 (Fig. 1a). This is due to the
fact that the development of lava tubes and ephemeral vents play a determining role in allowing
lava flows to extend to greater distances (Calvari and Pinkerton, 1998; Crisci et al., 2003).
Unfortunately, the timing and location of development of such features is currently unpredictable
and therefore cannot be simulated in the context of this methodology. A solution to this problem
would be to simulate, in a manner similar to the approach described in this paper, lava emission
from a dense network of hypothetical ephemeral vent locations on the lower slopes of Etna. This

15
would obtain a complete database for the entire area down to the coast, from which relevant
scenarios could be extracted once the position of lava tubes and ephemeral vents is known.
Acknowledgements We thank Prof Renato Guzzardi, Dr Federica Lucà and Dr Gaetano Robustelli
for their valuable support in refining the validation procedure for the lava invasion susceptibility
map. We also thank Dr Giancarlo Niceforo for his support in the simulation phase and Steve
Conway for the English revision. This work was sponsored by the Italian Ministry for Education,
University and Research, FIRB project n° RBAU01RMZ4 “Lava flow simulations by Cellular
Automata”, and by the National Civil Defence Department and INGV (National Institute of
Geophysics and Volcanology), project V3_6/09 “V3_6 – Etna”.
Correspondence and requests for materials should be addressed to Dr Rocco Rongo

16
References
Acocella, V. and M. Neri (2003), What makes flank eruptions? The 2001 Etna eruption and the
possible triggering mechanisms. Bull. Volcanol. 65, 517-529, doi:10.1007/s00445-003-0280-3.
Acocella, V., and M. Neri (2005), Structural features of an active strike-slip fault on the sliding
flank of Mt. Etna (Italy). J. Structural Geology, 27/2, 343-355, doi: 10.1016/j.jsg.2004.07.006.
Allard, P., B. Behncke, S. D’Amico, M. Neri, and S. Gambino (2006), Mount Etna 1993-2005:
Anatomy of an evolving eruptive cycle. Earth Sci. Rev. 78, 85-114,
doi:10.1016/j.earscirev.2006.04.002.
Barberi, F., F. Brondi, M.L. Carapezza, L.Cavarra and C. Murgia (2003), Earthen barriers to control
lava flows in the 2001 eruption of Mt. Etna. J. Volcanol. Geotherm. Res. 123, 231–243.
Barberi, F., M. L. Carapezza, M. Valenza and L. Villari (1993), The control of lava flow during the
1991-1992 eruption of Mt. Etna. J. Volcanol. Geotherm. Res. 56, 1–34, doi: 10.1016/0377-
0273(93)90048-V.
Barberi, F., G. Macedonio, M.T. Pareschi and R. Santacroce (1990), Mapping the tephra fallout
risk: an example from Vesuvius, Italy. Nature 344, 142-144, doi: 10.1038/344142a0.
Barberi, F. and L. Villari (1984), (eds.) Mt. Etna and its 1983 eruption. Bull. Volcanol. 47, 877–
1177.
Behncke, B. and M. Neri (2003a), The July-August 2001 eruption of Mt. Etna (Sicily). Bull.
Volcanol. 65, 461-47, doi: 10.1007/s00445-003-0274-1.
Behncke, B. and M. Neri (2003b), M. Cycles and Trends in the recent eruptive behaviour of Mount
Etna (Italy). Can. J. Earth Sci. 40, 1405–1411, doi: 10.1139/E03-052.

17
Behncke, B., M. Neri and A. Nagay (2005), Lava flow hazard at Mount Etna (Italy): New data from
a GIS-based study, in Kinematics and dynamics of lava flows edited by M. Manga and G. Ventura,
Spec. Pap. Geol. Soc. Am., 396-13, 187-205, doi: 10.1130/0-8137-2396-5.189.
Behncke, B., Neri, M., Pecora, E. and Zanon V. (2006), The exceptional activity and growth of the
Southeast Crater, Mount Etna (Italy), between 1996 and 2001. Bull. Volcanol. 69, 149-173,
doi:10.1007/s00445-006-0061-x.
Behncke, B., Calvari S., Giammanco S., Neri M. and Pinkerton H. (2008), Pyroclastic density
currents resulting from interaction of basaltic magma with hydrothermally altered rock: an example
from the 2006 summit eruptions of Mount Etna, Italy. Bull. Volcanol., 70:1249-1268,
doi:10.1007/s00445-008-0200-7.
Bisson, M., B. Behncke, A. Fornaciai and M. Neri (2009), Lidar-based digital terrain analysis of an
area exposed to the risk of lava flow invasion: the Zafferana Etnea territory, Mt. Etna (Italy),
Natural Hazards, 50(2), 321-334, doi:10.1007/s11069-009-9346-7.
Branca, S. and P. Del Carlo (2005), Types of eruptions of Etna volcano AD 1670–2003:
implications for short-term eruptive behaviour. Bull. Volcanol. 67, 8, 732-742, doi:
10.1007/s00445-005-0412-z.
Calvari S., M. Neri and H. Pinkerton (2003), Effusion rate estimation during the 1999 summit
eruption on Mt. Etna, and growth of two distinct lava flow fields. J. Volcanol. Geotherm. Res.,
119/1-4, 107-123, doi:10.1016/S0377-0273(02)00308-6.
Calvari, S. and H. Pinkerton (1998), Formation of lava tubes and extensive flow field during the
1991–93 eruption of Mount Etna. J. Geophys. Res. 103, 27291–27302.

18
Chester, D.K., A.M. Duncan and C.J.L. Dibben (2008), The importance of religion in shaping
volcanic risk perception in Italy, with special reference to Vesuvius and Etna. J. Volcanol.
Geotherm. Res. 172, 216–228, doi: 10.1016/j.jvolgeores.2007.12.009.
Chester, D.K., A.M. Duncan, C. Dibben, J.E. Guest and P.H. Lister (1999), Mascali, Mount Etna
Region Sicily: An Example of Fascist Planning During the 1928 Eruption and Its Continuing
Legacy. Natural Hazards 19, 29–46, doi: 10.1023/A:1008001003888.
Chester, D.K., A.M. Duncan, J.E. Guest and C.R.J. Kilburn (1985), Mount Etna – The anatomy of a
volcano (Chapman & Hall, London).
Chopard, B. and M. Droz (1998), Cellular Automata Modeling of Physical Systems (Cambridge
University Press).
Crisci, G.M., S. Di Gregorio, R. Rongo, M. Scarpelli, W. Spataro and S. Calvari (2003), Revisiting
the 1669 Etnean eruptive crisis using a cellular automata model and implications for volcanic
hazard in the Catania area. J. Volcanol. Geotherm. Res. 123, 211–230, doi: 10.1016/S0377-
0273(03)00037-4.
Crisci, G.M., G. Iovine, S. Di Gregorio and V. Lupiano (2008), Lava flow hazard on the SE flank of
Mt. Etna (Southern Italy). J. Volcanol. Geotherm. Res. 177, 778-796.
Crisci, G., R. Rongo, S. Di Gregorio and W. Spataro (2004), The simulation model SCIARA: the
1991 and 2001 lava flows at Mount Etna. J. Volcanol. Geotherm. Res. 132, 253–267.
De Vivo, B. (2006), Preface to Volcanism in the Campania Plain: Vesuvius, Campi Flegrei and
Ignimbrites (ed De Vivo, B.) vii-xii (Developments in Volcanology 9, Elsevier Amsterdam), doi:
10.1016/S1871-644X(06)80014-8.

19
Del Negro, C., L. Fortuna, A. Herault and A. Vicari (2008), Simulations of the 2004 lava flow at
Etna volcano using the magflow cellular automata model, Bull. Volcanol. 70, 805–812, doi:
10.1007/s00445-007-0168-8.
Di Gregorio, S. and R. Serra (1999), An empirical method for modelling and simulating some
complex macroscopic phenomena by cellular automata. Future Generation Computer Systems 16,
259–271, doi: 10.1016/S0167-739X(99)00051-5.
Dibben, C.J.L. (2008), Leaving the city for the suburbs – The dominance of ‘ordinary’ decision
making over volcanic risk perception in the production of volcanic risk on Mt Etna, Sicily. J.
Volcanol. Geotherm. Res. 172, 288–299, doi: 10.1016/j.jvolgeores.2007.12.014.
Dobran, F., A. Neri and M. Todesco (1994), Assessing the pyroclastic flow hazard at Vesuvius.
Nature 367, 551-554, doi: 10.1038/367551a0.
Favalli, M., F. Mazzarini, M.T. Pareschi, E. Boschi (2009), Topographic control on lava flow paths
at Mount Etna, Italy: Implications for hazard assessment, J. Geophys. Res., 114, F01019,
doi:10.1029/2007JF000918.
Fujita, E., M. Hidaka, A. Goto, S. Umino (2009), Simulations of measures to control lava flows,
Bull. Volcanol., 71, 401-408, doi:10.1007/s00445-008-0229-7.
Guest, J.E. and J.B. Murray (1979), An analysis of hazard from Mount Etna volcano. J. Geol. Soc.
Lond. 136, 347-354, doi: 10.1144/gsjgs.136.3.0347.
Guest, J.E., C.R.J. Kilburn, H. Pinkerton and A.M. Duncan(1987), The evolution of lava flow-
fields: observations of the 1981 and 1983 eruptions of Mount Etna, Sicily. Bull. Volcanol. 49, 527–
540, doi: 10.1007/BF01080447.
Guidoboni, E. and C. Ciuccarelli (2008), First historical evidence of a significant Mt. Etna eruption
in 1224. J. Volcanol. Geotherm. Res. 178, 693-700, doi: 10.1016/j.jvolgeores.2008.08.009.

20
Harris A.J.L., J. Dehn and S. Calvari (2008), Lava effusion rate definition and measurement: a
review. Bull. Volcanol. 70, 1-22, doi: 10.1007/s00445-007-0120-y.
Harris, A.J.L. and M. Neri (2002), Volumetric observations during paroxysmal eruptions at Mount
Etna: pressurized drainage of a shallow chamber or pulsed supply? J. Volcanol. Geotherm. Res.
116, 79-95, doi:10.1016/S0377-0273(02)00212-3.
Hughes, J.W., J.E. Guest and A.M. Duncan (1990), Changing styles of effusive eruption on Mount
Etna since AD 1600. in Magma storage and ascent (ed. M.P. Ryan) 385-406 (John Wiley,
Chichester).
Ishihara, K., M. Iguchi and K. Kamo (1990), Numerical simulation of lava flows on some
volcanoes in Japan, in Lava flows and domes: emplacement mechanisms and hazard implications
(ed Fink, J.K.) 174–207 (Springer, Berlin Heidelberg New York).
Kilburn, C.R.J. and J.E. Guest (1993), Aa lavas of Mount Etna Sicily, in Active Lavas: Monitoring
and Modelling (eds. Kilburn, C.R.J., Luongo, G.) 73–105 (UCL Press, London).
Kilburn, C.R.J. and R.M.C. Lopes (1988), The growth of aa lava flow fields on Mount Etna, Sicily.
J. Geophys. Res. 93, 14759-14772.
Neri, M., B. Behncke, M. Burton, S. Giammanco, E. Pecora, E. Privitera and D. Reitano (2006),
Continuous soil radon monitoring during the July 2006 Etna eruption. Geophys. Res. Lett., 33,
L24316, doi:10.1029/2006GL028394.
Neri, M., F. Casu, V. Acocella, G. Solaro, S. Pepe, P. Berardino, E. Sansosti, T. Caltabiano, P.
Lundgren, R. Lanari (2009), Deformation and eruptions at Mt. Etna (Italy): a lesson from 15 years
of observations. Geophys. Res. Lett., 36, L02309, doi:10.1029/2008GL036151.

21
Neri, M., F. Mazzarini, S. Tarquini, M. Bisson, I. Isola, B. Behncke, and M. T. Pareschi (2008), The
changing face of Mount Etna's summit area documented with Lidar technology, Geophys. Res.
Lett., 35, L09305, doi:10.1029/2008GL033740.
Romano, R., C. Sturiale, F. Lentini (coordinators) (1979), Carta Geologica del Monte Etna. Scale
1:50.000. C.N.R., P.F.G., I.I.V, Selca, Firenze.
Rongo, R., W. Spataro, D. D’Ambrosio, M.V. Avolio, G.A. Trunfio, and S. Di Gregorio (2008),
Lava flow hazard evaluation through cellular automata and genetic algorithms: an application to Mt
Etna volcano. Fundamenta Informaticae 8, 247-268.
Rust, D., B. Behncke, M. Neri and A. Ciocanel (2005), Nested zones of instability in the Mount
Etna volcanic edifice, Sicily. J. Volcanol. Geotherm. Res., 144, 137-153,
doi:10.1016/j.jvolgeores.2004.11.021
Spence, R.J.S., P. J. Baxter and G. Zuccaro (2004), Building vulnerability and human casualty
estimation for a pyroclastic flow: a model and its application to Vesuvius, J. Volcanol. Geotherm.
Res. 133, 321–343, doi: 10.1016/S0377-0273(03)00405-0.
Tanguy, J-C., M. Condomines, M. Le Goff, V. Chillemi, S. La Delfa, G. Patanè (2007), Mount Etna
eruptions of the last 2,750 years: revised chronology and location through archeomagnetic and
226Ra-230Th dating. Bull. Volcanol. 70, 55–83, 10.1007/s00445-007-0121-x.
Von Neumann, J. Theory of self reproducing automata (Univ. Illinois Press, Urbana, 1966).
Walter, T.R., V. Acocella, M. Neri and F. Amelung (2005), Feedback processes between
magmatism and E-flank movement at Mt. Etna (Italy) during the 2002-2003 eruption. J. Geophys.
Res., 110, B10205, doi:10.1029/2005JB003688.
Zuccaro, G., F. Cacace, R.J.S. Spence and P.J. Baxter (2008), Impact of explosive eruption
scenarios at Vesuvius. J. Volcanol. Geotherm. Res., doi: 10.1016/j.jvolgeores.2008.01.005.

22
Table captions
Table 1. Representative set of Etnean lava flows since 1600 AD, grouped in terms of duration and
lava volume. Values represent frequencies, inferred frequencies (in brackets) and inferred
frequencies in terms of probability (in square bracket). Inferred frequencies were obtained by
bivariate analysis, in order to represent events for which no data was available. Events marked by
an asterisk were considered unrealistic (i.e. high volume vs. short duration, low volume vs. long
duration) and not considered for analysis. Note that since the majority of analysed events fell into
the 0–30 days temporal class, this was split into two sub-classes, in order to better characterise the
statistical distribution.
Table 2. Areal distribution of the ten lava invasion susceptibility classes in the study area. For each
class Ci, the susceptibility range and the mean susceptibility value, hi, are reported in terms of
probabilities, together with the corresponding areal extent, m(Ci). The values ei denote the extents
of the areas within the susceptibility classes expected to be invaded on average by future lava flows.
The values oi denote the mean extent of the observed affected areas within the susceptibility classes,
resulting from the simulation of 13 historical lava flows on present-day topography (cf. Table 3).
Note that, ∑i ei represents the extent of the total area that is expected to be invaded in the eastern
sector of Etna, while ∑i oi the overall observed affected area.
Table 3. Main parameters of 13 historical lava flows considered for the validation of the
susceptibility map shown in Fig. 2. For each lava flow, the mean effusion rate is shown. Note that
the real effusion rate was considered for the 2002 lava flow, while a theoretical effusion rate trend
with a peak at 1/3 of the total duration was considered for lava flows for which only the final
volumes are known (cf. Fig. 1c).

23
Figure captions
Figure 1. Mount Etna and areas chosen for lava flow simulation. a, Map of historical lava flows,
distinguishing summit from flank eruptions. Flank eruptions are furthermore displayed in different
colours according to centuries. A selection of population centres are shown for reference. Lava
flows that reached the sea during the past 1000 years are shown by their emplacement dates. b, The
study area on the southeastern and northeastern flanks of Etna, showing active faults, location of
393 source vents for simulated lava flows, and zones of different vent activation probability
(obtained by considering the density of historical vents of each zone). The activation probability for
a generic vent was obtained as the overall activation probability of the area over the number of
vents in the area (corresponding to 4.23·10-5, 3.28·10-4, 2.24·10-3, 9.63·10-3, in ascending order). The
highest probabilities of vent activation coincide with the prominent Northeast and South Rift zones
of the volcano. c, Example of two representative effusion rate trends for typical Etnean eruptions,
referred to an event lasting 60 days, with peaks in the effusion rate of ~90 m3s-1 at 1/6 and 1/3 of the
overall duration. The trends were obtained by uniting randomly chosen points between two
Gaussian-like curves.
Figure 2. Lava flow invasion susceptibility on the eastern flank of Mount Etna. The map results
from the simulations of 39,300 lava flows originated from the source grid shown in Fig. 1b, with
100 different scenarios for each vent. Ten different classes of susceptibility are shown, highlighting
the elevated probability of lava flow funnelling by morphologically low areas. Interval associated
with each class represents the range of probability that the corresponding area is invaded by future
eruptions. This results in a fan-shaped distribution of high-susceptibility areas in the southern sector
of the study area, whereas in the northern sector a single major funnelling zone is evident, which

24
narrows downslope and is deflected eastward by a prominent fault scarp (see Fig. 1). The map
clearly shows that portions of several of the major population centres on the southeast flank are
exposed to lava flow invasion. Rapid urbanisation in recent years has furthermore taken place – and
is continuing – in many high-susceptibility areas outside the nuclei of the population centres.
Figure 3. High-susceptibility to lava flow invasion on the eastern flanks of Mount Etna. a, On the
northeast flank of Etna, funnelling of lava flows is heightened due to the concentration of vents in
the Northeast Rift (see Fig. 1) and to the particular morphology of the area. A prominent fault scarp
(south of Villaggio Mareneve) leads to an eastward deviation of lava flows, and consequently
lowers the risk for the town of Linguaglossa lying further downslope (see also Fig. 2). b, High-
resolution map of the southern portion of Zafferana Etnea, on the southeast flank, showing several
villages lying in zones of relatively high susceptibility. Blow-up shows that more than half of
Malopasso is affected by susceptibility classes higher than 5.
Figure 4. Set of 13 historical eruptions considered for the validation of the lava flows invasion
susceptibility map. a, Map showing the 13 historical lava flows since 1634 AD selected for the
validation procedure, covering in average an area of about 6.93 km2. b, Map showing the outline of
the same 13 lava flows as they would result on present-day topography. Each lava flow was
simulated by means of the SCIARA computational model by considering their real parameters
(such as duration and amount of emitted lava), and source location(s). On average, the affected area
covers about 6.499 km2. Note that both the real and simulated lava flow areas are comparable with
those expected to be invaded on average by future lava flows, which corresponds to the value of
6.004 km2 (cf. Table 2). Further details are given in Table 3.
Figure 5. Comparison between expected and observed affected areas. a, b, c, d, e, Comparison
between the observed and expected mean extents of the areas affected by 13 historical lava flows

25
simulated on present-day topography (cf. Table 3 and Figure 4), with respect to different lava
invasion susceptibility maps having 5, 10, 20, 40 and 198 classes, respectively (cf. Figure 6). f,
Trend of the mean distance between the observed and expected affected areas, d, with respect to the
number of classes, showing a considerable convergence for high-dense classed maps. The fitting is,
however, satisfying starting from the value d = 0.138 km2, which is obtained in correspondence of
the 10-classeed susceptibility map.
Figure 6. High-resolution lava flow invasion susceptibility map for the eastern flank of Mount
Etna, characterised by 198 different classes. It represents a refinement of the map shown in Fig. 2,
in which the susceptibility of the area is represented by 10 classes.
Figure 7. Susceptibility scenario for an extensive system of eruptive fissures (propagating
downslope over a length of ~7 km on the east-northeast flank of Mount Etna), obtained by
considering 1600 lava flows originated from a set of 16 vents that approximates the eruptive
system. The vent probability ps in equation (1) was set to 1/16 for each vent since the overall
eruptive system is considered as erupting. The village of Puntalazzo appears at considerable risk,
while S. Alfio and Nunziata are affected by a low-medium susceptibility. Similar scenarios can be
extracted for any location and eruption type as soon as this is required, allowing swift
understanding of the threat posed by an imminent or incipient eruption.
Figure 8. Map showing vents, belonging to the simulation grid of Fig. 1b, which can produce
eruptions capable of affecting the urban area of the town of Nicolosi, together with the resulting
susceptibility scenario, allowing to immediately assess the threat posed by an eruption exclusively
on the basis of its source location.
Figure 9. Simulated effect of an earth barrier to protect a town from lava flow invasion. a, Map
showing population centres on the densely urbanised south flank of Etna, the location of a set of

26
vents which originate a total of 1409 lava flows intersecting a hypothetical 2 km long and 20 m tall
earth barrier to protect the centre of Nicolosi (shown in b), together with susceptibility zonation
based on these simulations (without considering the effect of the barrier). The eastern sector of
Nicolosi appears to be the most exposed, with a narrower branch of medium-high susceptibility
passing straight through the centre of the town. The map in b shows the same area and the scenario
resulting from lava flows intersecting the barrier, which are re-simulated on a modified topography
that embeds the presence of the barrier. As can be seen, this embankment lowers the probability of
lava flows inundating the centre of the town to some extent, where the susceptibility decreases by
three classes. The residual susceptibility is a result of the high number of simulations performed and
large-scale events included in the modelling, which could allow lava flows to eventually surmount
the barrier. The barrier diverts lava into low-lying - already of high susceptibility - areas east of
Nicolosi, which are under virtually continuous urban housing (mostly single homes and small
apartment complexes). Here, only a slightly higher susceptibility degree emerges, even though legal
and ethical issues would have to be considered for operations of this kind.

Table 1
Volumes (millions of m3)
Duration (days) 0 ÷ 32 32 ÷ 64 64 ÷ 96 96 ÷ 128 128 ÷ 160
0 ÷ 15 19 (16.04) [0.23837] 3 (4.53) [0.06732] 0 (2.26) [0.03359] 0 (1.38) * 0 (0.98) *
15 ÷ 30 6 (7.76) [0.11532] 3 (2.19) [0.03255] 1 (1.09) [0.01620] 0 (0.67) [0.00996] 0 (0.47) *
30 ÷ 60 3 (7.85) [0.11666] 0 (2.22) [0.03299] 1 (1.10) [0.01635] 0 (0.67) [0.00996] 1 (0.48) [0.00713]
60 ÷ 90 1 (4.57) [0.06791] 2 (1.29) [0.01917] 0 (0.64) [0.00951] 1 (0.39) [0.00580] 0 (0.28) [0.00416]
90 ÷ 120 3 (2.71) [0.04027] 0 (0.76) [0.01129] 1 (0.23) [0.00342] 0 (0.17) [0.00253] 0 (0.17) [0.00253]
120 ÷ 150 1 (2.16) [0.03210] 1 (0.61) [0.00907] 1 (0.30) [0.00446] 0 (0.19) [0.00282] 0 (0.13) [0.00193]
150 ÷ 180 0 (1.52) [0.02259] 0 (0.42) [0.00624] 1 (0.21) [0.00312] 1 (0.13) [0.00193] 1 (0.09) [0.00134]
180 ÷ 210 0 (1.12) 0.01664] 1 (0.32) [0.00476] 0 (0.16) [0.00238] 0 (0.10) [0.00149] 1 (0.07) [0.00104]
210 ÷ 240 0 (0.92) * 0 (0.26) [0.00386] 0 (0.13) [0.00193] 0 (0.08) [0.00119] 0 (0.06) [0.00089]
240 ÷ 270 0 (0.83) * 0 (0.23) * 0 (0.12) [0.00178] 0 (0.07) [0.00104] 0 (0.05) [0.00074]
270 ÷ 300 0 (0.70) * 0 (0.20) * 0 (0.10) [0.00149] 1 (0.06) [0.00089] 0 (0.04) [0.00059]
300 ÷ 500 0 (2.51) * 0 (0.71) * 1 (0.35) [0.00520] 0 (0.22) [0.00327] 2 (0.15) [0.00223]

Table 2
Class
ID
Probability
range hi┴
m(Ci)
(km2)
m(Ci)
(%)
ei
(km2)
oi
(km2)
1 (0, 1.25·10-8] 6.25·10-9 126.036 24.792 7.9·10-7 0.024
2 (1.25·10-8, 0.022] 0.005 297.750 58.569 1.456 2.104
3 (0.022, 0.044] 0.031 45.696 8.989 1.447 1.649
4 (0.044, 0.066] 0.054 17.717 3.485 0.994 0.766
5 (0.066, 0.088] 0.075 9.679 1.904 0.733 0.651
6 (0.088, 0.109] 0.098 5.144 1.012 0.507 0.481
7 (0.109, 0.131] 0.12 3.095 0.609 0.371 0.389
8 (0.131, 0.153] 0.142 1.838 0.362 0.261 0.267
9 (0.153, 0.175] 0.162 1.142 0.225 0.185 0.136
10 (0.175, 0.197] 0.184 0.273 0.054 0.05 0.031
TOTAL 508.37 100.00 6.004 6.499
┴ is the mean probability of the i-th class. #Ci denotes the number of DEM cells within the class.∑∈
−=iCyx
yxii hCh,
,1)(#
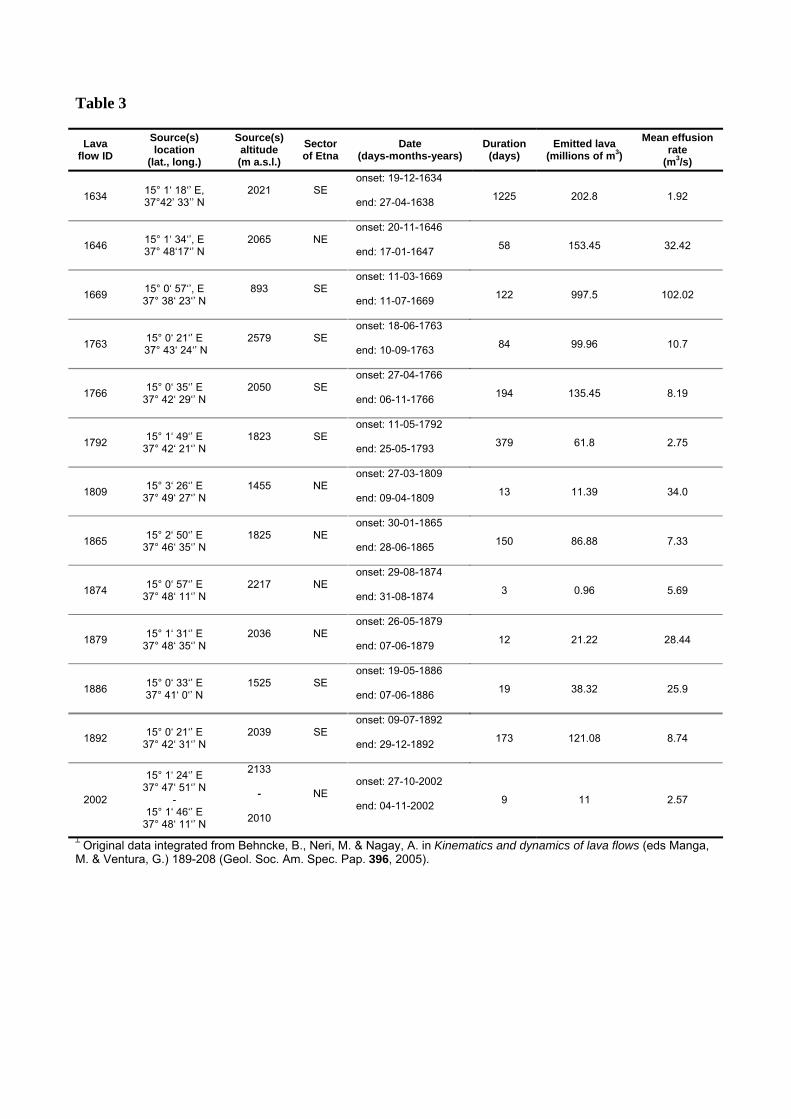
Table 3
Lava flow ID
Source(s) location
(lat., long.)
Source(s) altitude (m a.s.l.)
Sector of Etna
Date (days-months-years)
Duration(days)
Emitted lava (millions of m3)
Mean effusion rate
(m3/s)
1634 15° 1‘ 18‘’ E, 37°42’ 33’’ N
2021 SE onset: 19-12-1634
end: 27-04-1638 1225 202.8 1.92
1646 15° 1‘ 34‘’, E 37° 48‘17‘’ N
2065 NE onset: 20-11-1646
end: 17-01-1647 58 153.45 32.42
1669 15° 0‘ 57‘’, E 37° 38‘ 23‘’ N
893 SE onset: 11-03-1669
end: 11-07-1669 122 997.5 102.02
1763 15° 0‘ 21‘’ E 37° 43‘ 24‘’ N
2579 SE onset: 18-06-1763
end: 10-09-1763 84 99.96 10.7
1766 15° 0‘ 35‘’ E 37° 42‘ 29‘’ N
2050 SE onset: 27-04-1766
end: 06-11-1766 194 135.45 8.19
1792 15° 1‘ 49‘’ E 37° 42‘ 21‘’ N
1823 SE onset: 11-05-1792
end: 25-05-1793 379 61.8 2.75
1809 15° 3‘ 26‘’ E 37° 49‘ 27‘’ N
1455 NE onset: 27-03-1809
end: 09-04-1809 13 11.39 34.0
1865 15° 2‘ 50‘’ E 37° 46‘ 35‘’ N
1825 NE onset: 30-01-1865
end: 28-06-1865 150 86.88 7.33
1874 15° 0‘ 57‘’ E 37° 48‘ 11‘’ N
2217 NE onset: 29-08-1874
end: 31-08-1874 3 0.96 5.69
1879 15° 1‘ 31‘’ E 37° 48‘ 35‘’ N
2036 NE onset: 26-05-1879
end: 07-06-1879 12 21.22 28.44
1886 15° 0‘ 33‘’ E 37° 41‘ 0‘’ N
1525 SE onset: 19-05-1886
end: 07-06-1886 19 38.32 25.9
1892 15° 0‘ 21‘’ E 37° 42‘ 31‘’ N
2039 SE onset: 09-07-1892
end: 29-12-1892 173 121.08 8.74
2002
15° 1‘ 24‘’ E 37° 47‘ 51‘’ N
- 15° 1‘ 46‘’ E
37° 48‘ 11‘’ N
2133
-
2010
NE onset: 27-10-2002
end: 04-11-2002 9 11 2.57
┴ Original data integrated from Behncke, B., Neri, M. & Nagay, A. in Kinematics and dynamics of lava flows (eds Manga, M. & Ventura, G.) 189-208 (Geol. Soc. Am. Spec. Pap. 396, 2005).