village of mount prospect, illinois
264
-
Upload
khangminh22 -
Category
Documents
-
view
0 -
download
0
Transcript of village of mount prospect, illinois


VILLAGE OF MOUNT PROSPECT, ILLINOIS
COMPREHENSIVE ANNUAL
FINANCIAL REPORT
For the Year Ended
December 31, 2017
Prepared by: Finance Department
David O. Erb
Finance Director/Treasurer
Lynn M. Jarog
Deputy Finance Director

VILLAGE OF MOUNT PROSPECT, ILLINOIS
TABLE OF CONTENTS
Page(s)
INTRODUCTORY SECTION
Principal Officials ................................................................................................................... i
Organizational Chart .............................................................................................................. ii
Letter of Transmittal ............................................................................................................... iii-vii
Certificate of Achievement for Excellence in Financial Reporting ...................................... viii
FINANCIAL SECTION
INDEPENDENT AUDITOR’S REPORT ............................................................................ 1-3
Management’s Discussion and Analysis .................................................................... MD&A 1-11
GENERAL PURPOSE EXTERNAL FINANCIAL STATEMENTS
Basic Financial Statements
Government-Wide Financial Statements
Statement of Net Position ........................................................................................ 4-5
Statement of Activities ............................................................................................ 6-7
Fund Financial Statements
Governmental Funds
Balance Sheet ....................................................................................................... 8-9
Reconciliation of Fund Balances of Governmental Funds to
the Governmental Activities in the Statement of Net Position ......................... 10
Statement of Revenues, Expenditures, and Changes in Fund Balances ............. 11
Reconciliation of the Governmental Funds Statement of Revenues,
Expenditures, and Changes in Fund Balances to the Governmental
Activities in the Statement of Activities ........................................................... 12

VILLAGE OF MOUNT PROSPECT, ILLINOIS
TABLE OF CONTENTS (Continued)
Page(s)
FINANCIAL SECTION (Continued)
GENERAL PURPOSE EXTERNAL FINANCIAL STATEMENTS (Continued)
Basic Financial Statements (Continued)
Fund Financial Statements (Continued)
Proprietary Funds
Statement of Net Position .................................................................................... 13-14
Statement of Revenues, Expenses, and Changes in Net Position ....................... 15
Statement of Cash Flows ..................................................................................... 16-17
Fiduciary Funds
Statement of Fiduciary Net Position ................................................................... 18
Statement of Changes in Fiduciary Net Position ................................................ 19
Notes to Financial Statements ...................................................................................... 20-77
Required Supplementary Information
Schedule of Revenues, Expenditures, and Changes in Fund Balance -
Budget and Actual
General Fund ........................................................................................................... 78
Refuse Disposal Fund .............................................................................................. 79
Schedule of Funding Progress
Other Postemployment Benefits Plan ................................................................. 80
Schedule of Employer Contributions
Illinois Municipal Retirement Fund ........................................................................ 81
Police Pension Fund ................................................................................................ 82
Firefighters’ Pension Fund ................................................................................. 83
Other Postemployment Benefits Plan ................................................................. 84
Schedule of the Village’s Proportionate Share of the Net Pension Liability
Illinois Municipal Retirement Fund ...................................................................... 85
Schedule of Changes in the Employer’s Net Pension Liability
and Related Ratios
Police Pension Fund ................................................................................................ 86
Firefighters’ Pension Fund ...................................................................................... 87
VILLAGE OF MOUNT PROSPECT, ILLINOIS
TABLE OF CONTENTS (Continued)
Page(s)
FINANCIAL SECTION (Continued)
GENERAL PURPOSE EXTERNAL FINANCIAL STATEMENTS (Continued)
Required Supplementary Information (Continued)
Schedule of Investment Returns
Police Pension Fund ........................................................................................... 88
Firefighters’ Pension Fund ................................................................................. 89
Notes to Required Supplementary Information ....................................................... 90
COMBINING AND INDIVIDUAL FUND FINANCIAL STATEMENTS
AND SCHEDULES
MAJOR GOVERNMENTAL FUNDS
General Fund
Schedule of Revenues - Budget and Actual ............................................................ 91-93
Schedule of Expenditures - Budget and Actual ...................................................... 94
Schedule of Detailed Expenditures - Budget and Actual ....................................... 95-106
Special Revenue Fund
Refuse Disposal Fund
Schedule of Operating Revenues - Budget and Actual ....................................... 107
Debt Service Fund
Schedule of Revenues, Expenditures, and
Changes in Fund Balance - Budget and Actual .................................................... 108
NONMAJOR GOVERNMENTAL FUNDS
Combining Balance Sheet ............................................................................................ 109
Combining Statement of Revenues, Expenditures, and
Changes in Fund Balances ......................................................................................... 110
Nonmajor Special Revenue Funds
Combining Balance Sheet ....................................................................................... 111-112
Combining Statement of Revenues, Expenditures, and
Changes in Fund Balances .................................................................................... 113-114

VILLAGE OF MOUNT PROSPECT, ILLINOIS
TABLE OF CONTENTS (Continued)
Page(s)
FINANCIAL SECTION (Continued) COMBINING AND INDIVIDUAL FUND FINANCIAL STATEMENTS AND SCHEDULES (Continued)
NONMAJOR GOVERNMENTAL FUNDS (Continued)
Nonmajor Special Revenue Funds (Continued)
Motor Fuel Tax Fund
Schedule of Revenues, Expenditures, and
Changes in Fund Balance - Budget and Actual ................................................ 115
Schedule of Expenditures - Budget and Actual .................................................. 116
Community Development Block Grant Fund
Schedule of Revenues, Expenditures, and
Changes in Fund Balance - Budget and Actual ................................................ 117
Schedule of Expenditures - Budget and Actual .................................................. 118
Schedule of Revenues, Expenditures, and
Changes in Fund Balance - Budget and Actual
Asset Seizure Fund .............................................................................................. 119
Federal Equitable Share Fund ............................................................................. 120
DUI Fines Fund ................................................................................................... 121
Foreign Fire Insurance Fund ................................................................................ 122
Business District Fund ......................................................................................... 123
Prospect/Main TIF Fund ...................................................................................... 124
Nonmajor Capital Projects Funds
Combining Balance Sheet ....................................................................................... 125
Combining Statement of Revenues, Expenditures, and
Changes in Fund Balances .................................................................................... 126
Capital Improvement Fund
Schedule of Revenues, Expenditures, and
Changes in Fund Balance - Budget and Actual ................................................ 127
Schedule of Expenditures - Budget and Actual .................................................. 128
Nonmajor Capital Projects Funds
Flood Control Construction Fund
Schedule of Revenues, Expenditures, and
Changes in Fund Balance - Budget and Actual ................................................ 129
Schedule of Expenditures - Budget and Actual .................................................. 130
Street Improvement Construction Fund
Schedule of Revenues, Expenditures, and
Changes in Fund Balance - Budget and Actual ................................................ 131

VILLAGE OF MOUNT PROSPECT, ILLINOIS
TABLE OF CONTENTS (Continued)
Page(s)
FINANCIAL SECTION (Continued) COMBINING AND INDIVIDUAL FUND FINANCIAL STATEMENTS AND SCHEDULES (Continued)
MAJOR ENTERPRISE FUND Water and Sewer Fund Schedule of Revenues, Expenses, and Changes in Net Position - Budget and Actual ...................................................... 132 Schedule of Operating Revenues - Budget and Actual .......................................... 133 Schedule of Operating Expenses - Budget and Actual ........................................... 134-136
NONMAJOR ENTERPRISE FUNDS Combining Statement of Net Position ......................................................................... 137 Combining Statement of Revenues, Expenses, and Changes in Net Position ............ 138 Combining Statement of Cash Flows .......................................................................... 139-140 Parking System Revenue Fund Schedule of Revenues, Expenses, and Changes in Net Position - Budget and Actual ...................................................... 141 Schedule of Operating Expenses - Budget and Actual ........................................... 142 Village Parking System Fund Schedule of Revenues, Expenses, and Changes in Net Position - Budget and Actual ...................................................... 143 Schedule of Operating Expenses - Budget and Actual ........................................... 144 INTERNAL SERVICE FUNDS Combining Statement of Net Position ......................................................................... 145 Combining Statement of Revenues, Expenses, and Changes in Net Position ............ 146 Combining Statement of Cash Flows .......................................................................... 147-148 Computer Replacement Fund Schedule of Revenues, Expenses, and Changes in Net Position - Budget and Actual ...................................................... 149 Schedule of Operating Expenses - Budget and Actual ........................................... 150 Risk Management Fund Schedule of Revenues, Expenses, and Changes in Net Position - Budget and Actual ...................................................... 151 Schedule of Operating Revenues - Budget and Actual .......................................... 152 Schedule of Operating Expenses - Budget and Actual ........................................... 153

VILLAGE OF MOUNT PROSPECT, ILLINOIS
TABLE OF CONTENTS (Continued)
Page(s)
FINANCIAL SECTION (Continued) COMBINING AND INDIVIDUAL FUND FINANCIAL STATEMENTS AND SCHEDULES (Continued) INTERNAL SERVICE FUNDS (Continued) Vehicle Replacement Fund Schedule of Revenues, Expenses, and Changes in Net Position - Budget and Actual ...................................................... 154 Schedule of Operating Revenues - Budget and Actual .......................................... 155 Schedule of Operating Expenses - Budget and Actual ........................................... 156 Vehicle Maintenance Fund Schedule of Revenues, Expenses, and Changes in Net Position - Budget and Actual ...................................................... 157 Schedule of Operating Revenues - Budget and Actual .......................................... 158 Schedule of Operating Expenses - Budget and Actual ........................................... 159
FIDUCIARY FUNDS
PENSION TRUST FUNDS
Combining Statement of Net Position - Pension Trust Funds ............................... 160
Combining Statement of Changes in Net Position - Pension Trust Funds ............ 161
Schedule of Changes in Net Position - Budget and Actual
Police Pension Fund ............................................................................................ 162
Firefighters’ Pension Fund .................................................................................. 163
AGENCY FUNDS
Combining Statement of Changes in Assets and
Liabilities - Agency Funds .................................................................................... 164-165
SUPPLEMENTAL DATA
LONG-TERM DEBT PAYABLE BY GOVERNMENTAL FUNDS
Schedule of General Long-Term Debt ......................................................................... 166-167

VILLAGE OF MOUNT PROSPECT, ILLINOIS
TABLE OF CONTENTS (Continued)
Page(s)
FINANCIAL SECTION (Continued)
LONG-TERM DEBT REQUIREMENTS
General Obligation Bonds of 2009 .............................................................................. 168
General Obligation Refunding Bonds of 2009B ......................................................... 169
Taxable General Obligation Bonds of 2009C ............................................................. 170
General Obligation Bonds of 2011B ............................................................................ 171
General Obligation Bonds of 2012 .............................................................................. 172
General Obligation Bonds of 2013 .............................................................................. 173
General Obligation Bonds of 2014 .............................................................................. 174
General Obligation Refunding Bonds of 2016 ............................................................ 175
General Obligation Refunding Bonds of 2016A ......................................................... 176
General Obligation Bonds of 2017 .............................................................................. 177
IEPA Flood Loan (L17-1087) Contract Payable of 1999 ............................................ 178
Installment Note Payable of 2012 ................................................................................ 179
ADDITIONAL SUPPLEMENTAL DATA
Schedule of Insurance in Force .................................................................................... 180
STATISTICAL SECTION
Financial Trends
Net Position by Component ..................................................................................... 181-182
Change in Net Position............................................................................................. 183-186
Fund Balances of Governmental Funds ................................................................... 187-188
Changes in Fund Balances of Governmental Funds ................................................ 189-190
Revenue Capacity
Assessed Value and Actual Value of Taxable Property ........................................... 191
Property Tax Rates - Direct and Overlapping Governments ................................... 192-193
Principal Property Taxpayers ................................................................................... 194
Property Tax Levies and Collections ....................................................................... 195
Sales Taxes by Category .......................................................................................... 196
Business District Sales Taxes by Category .............................................................. 197
Home Rule Sales by Category .................................................................................. 198
Direct and Overlapping Sales Tax Rates.................................................................. 199
Debt Capacity
Ratios of Outstanding Debt by Type ........................................................................ 200
Ratios of General Bonded Debt Outstanding ........................................................... 201
Direct and Overlapping Governmental Activities Debt ........................................... 202
Schedule of Legal Debt Margin ............................................................................... 203

VILLAGE OF MOUNT PROSPECT, ILLINOIS
TABLE OF CONTENTS (Continued)
Page(s)
STATISTICAL SECTION (Continued)
Demographic and Economic Information
Demographic and Economic Information ................................................................ 204
Principal Employers ................................................................................................. 205
Operating Information
Full-Time Equivalent Employees ................................................................................. 206-207
Operating Indicators ..................................................................................................... 208-209
Capital Assets Statistics by Function ........................................................................... 210
Additional Disclosures Required by SEC Rule 15c2-12 .................................................. 211-218

- i -
VILLAGE OF MOUNT PROSPECT, ILLINOIS
PRINCIPAL OFFICIALS
DECEMBER 31, 2017
MAYOR
Arlene A. Juracek
TRUSTEES
William A. Grossi Richard F. Rogers
Eleni Hatzis Colleen E. Saccotelli Paul Wm. Hoefert Michael A. Zadel
ADMINISTRATION
Michael J. Cassady Village Manager Nellie S. Beckner Assistant to the Village Manager Karen Agoranos Village Clerk David O. Erb Finance Director/Treasurer William J. Cooney, Jr. Community Development Director William M. Schroeder Director of Building and Inspection Services Julie K. Kane Human Services Director Michael Eterno Acting Police Chief Brian Lambel Fire Chief Sean P. Dorsey Public Works Director

- ii -
VILLAGE OF MOUNT PROSPECT ORGANIZATIONAL STRUCTURE
Electorate
Village Board
Mayor
and Six Trustees Elected At Large
Village Services
Finance
Commission
Boards Commissions
Village Manager
Economic
Development
Commission
Transportation
Safety
Commission
Planning & Zoning
Commission
Special Events
Commission
Sister Cities
Commission
Village
AdministrationFinance Department
Community
Development
Department
Human Services
Department
Police Department Fire Department
Public Works
Department
Fire Pension BoardFire & Police
Commissioners
Police Pension BoardForeign Fire
Insurance Tax Board
Audit Committee
Centennial
Commission

- iii -
June 26, 2018 The Honorable Arlene A. Juracek, Village President Members of the Board of Trustees Village Manager Michael J. Cassady, and Citizens of the Village of Mount Prospect, Illinois The Comprehensive Annual Financial Report of the Village of Mount Prospect, Illinois for the fiscal year ended December 31, 2017 is submitted herewith. The report consists of management’s representations concerning the finances of the Village of Mount Prospect. Responsibility for both the accuracy of the data and the completeness and fairness of the presentation, including all disclosures, rests with the Village. To provide a reasonable basis for making these representations, management of the Village has established a comprehensive internal control framework that is designed both to protect the government’s assets from loss, theft or misuse and to compile sufficient reliable information for the preparation of the Village of Mount Prospect’s financial statements in conformity with Generally Accepted Accounting Principles (GAAP). Because the cost of internal controls should not outweigh their benefits, the Village’s comprehensive framework on internal controls has been designed to provide reasonable rather than absolute assurance that the financial statements will be free from material misstatement. The Village has implemented GASB Statement No. 34, Basic Financial Statements – and Management Discussion and Analysis - for state and local governments, including infrastructure reporting. As management, we assert that, to the best of our knowledge and belief, this financial report is complete and reliable in all material respects. The Village’s financial statements have been audited by Sikich LLP, a firm of licensed certified public accountants. The goal of the independent audit is to provide reasonable assurance that the financial statements of the Village of Mount Prospect for the year ended December 31, 2017, are free from material misstatement. The independent audit involved examining, on a test basis, evidence supporting the amounts and disclosures in the financial statements; assessing the accounting principles used and significant estimates made by management; and evaluating the overall financial statement presentation. The independent auditor concluded based upon their audit that there was a reasonable basis for rendering an unmodified opinion that the Village’s financial statements for the fiscal year ended December 31, 2017 are fairly presented in conformity with GAAP. The independent auditor’s report is presented as the first component of the financial section of this report.
Village of Mount Prospect 50 South Emerson Street, Mount Prospect, Illinois 60056
VILLAGE MANAGER
Michael J. Cassady
VILLAGE CLERK
Karen Agoranos
Phone: 847/392-6000
Fax: 847/392-6022
www.mountprospect.org
MAYOR
Arlene A. Juracek
TRUSTEES
William A. Grossi
Eleni Hatzis
Paul Wm. Hoefert
Richard F. Rogers
Colleen E. Saccotelli
Michael A. Zadel

- iv -
GAAP require that management provide a narrative introduction, overview and analysis to accompany the basic financial statements in the form of Management’s Discussion and Analysis (MD&A). This letter of transmittal is designed to complement the MD&A and should be read in conjunction with it. The Village’s MD&A can be found immediately following the report of the independent auditors. Profile of the Village of Mount Prospect The Village of Mount Prospect, a home rule community as defined by the Illinois Constitution, was incorporated February 3, 1917 and is located 22 miles northwest from downtown Chicago in Cook County. The Village currently has land area of 10.8 square miles and a population of 54,167 (2010 Census). The Village operates under the Council/Manager form of government. Policymaking and legislative authority are vested in the Village Board, which consists of a Mayor and six-member Board of Trustees. The Village Board is responsible for, among other things, passing ordinances, adopting the budget, appointing committee members and hiring the Village Manager. The Village Manager is responsible for carrying out the policies and ordinances of the Village Board, for overseeing the day-to-day operations of the Village, and for appointing the heads of the Village’s departments. The Board is elected on a non-partisan basis. Board members are elected to four-year staggered terms with three Board members elected every two years. The Mayor is elected to a four-year term. The Mayor and Village Trustees are elected at large. The Village provides a full range of services including police, fire, public works (including water and sewer), human services, finance, community development and communication (television) services. The annual budget serves as the foundation for the Village’s financial planning and control. All departments of the Village are required to submit their budget requests to the Finance Director by mid-July each year. Revenue estimates are completed by the Finance Department in preparation for departmental budget reviews with the Village Manager and Finance Director in early August. Initial budget requests are compiled by the end of August. A proposed budget is prepared and delivered to the Village Board and Finance Commission at the end of September. The proposed budget is also made available for public inspection in the Village Clerk’s Office, on the village website and at the Mount Prospect Public Library. A series of joint workshops are held with members of the Village Board and Finance Commission at two (2) Committee of the Whole meetings in October. The Finance Commission also meets separately with staff in October. The Village Board is required to hold a public hearing on the proposed budget and to adopt a final budget no later than December 31st of each year, the close of the Village's previous budget year. The budget is prepared by fund and by department. Expense cost centers are created within departments giving a true picture of the cost of providing a particular service (i.e. Police Department Investigations). Budget amendments require approval of the Village Board. Budget-to-actual comparisons are provided for each individual governmental fund for which an appropriated annual budget has been adopted. For the General Corporate Fund and major special revenue funds, this comparison is presented in the required supplementary information. For governmental funds, other than the General Corporate Fund and major special revenue funds, with appropriated annual budgets, this comparison is presented in the major and non-major governmental fund subsections of this report.
- v -
Major Initiatives The Village staff, following directives of the Village Board and the Village Manager, has been involved in a variety of projects throughout the year; projects which reflect initiatives found in the Village’s Strategic Plan and commitment to ensuring its citizens are able to live and work in an enviable environment. Below is a list of the more significant accomplishments that address various goals identified for 2017.
• Golf Plaza II – Village staff facilitated the opening of KD Market and continued to work with the owners of this important south-side plaza on further redevelopment of the site and provide assistance with filling remaining vacancies.
• Levee 37 Plan – An engineering study to address flooding along the Des Plaines River was completed, providing options for increasing the capacity of existing pump stations. Next steps include design engineering as recommended in the study.
• Water/Sewer Rate Study – A comprehensive utility rate study was completed that assessed the revenue stream for this enterprise function and determined the long-term renewal/replacement needs for maintaining the system. A 10-year funding plan was developed that provides for adequate funding of ongoing operations and improves the rate at which water system replacements can be made.
• Elk Grove Rural Fire Protection District Agreement (EGRFPD) – A resolution was approved that authorized the execution of an agreement between the Village and the EGRFPD. An agreement will allow for uninterrupted fire protection service in the newly annexed areas.
• Busse Triangle Development – Village staff helped facilitate the preliminary PUD approval of 20 West Triangle redevelopment project, and expedited downtown building demolition permit applications and projects. Ground breaking for the 20 West project is scheduled for mid-2018.
• Annexation Initiative – Continued annexation strategy to incorporate areas surrounded by the Mount Prospect corporate limits. Successful annexations included areas surrounding the United Airlines property and Birch Manor condominiums.
• Police Succession Plan – The Village Manager took a first step in developing a succession plan for the Police Department by hiring a new Police Chief. This position had been vacant due to the resignation of the previous Chief. With this position now filled, a long-term plan can be developed for filling other leadership and front-line positions within the department as they become open through retirements and other organizational changes.
Refer to the Strategic Plan tab of the 2018 Annual Budget document for a complete listing of major initiatives and accomplishments.
All Departments continue to perform extremely well in delivering high quality services to our residents and business community. Initiatives included in the Village’s strategic plan have provided a focus for these services. The Village’s Annual Budget and Audit Documents were again recognized for their clarity and usability and Mount Prospect was recognized as Tree City U.S.A. for the 33rd consecutive year.

- vi -
Factors Affecting Financial Condition The information presented in the financial statements is perhaps best understood when it is considered from the broader perspective of the specific environment within which the Village operates. Local economy. The Village continues to benefit from growth in the local economy. There are a number of factors that influence the economy of a specific community, and various measures are used to gauge the economic outlook. Perhaps four of the most objective measures are the level of retail sales, the employment level of the community, income levels in the community and building activity. In Illinois, sales taxes are allocated based upon the point-of-sale, and accordingly represent the sales in the community. Total state sales tax receipts received during the calendar year ended December 31, 2017 were $18,521,934 compared to $16,344,573 for the previous year, an increase of 13.3%. The increase from the prior year is due to strong growth in the drug and miscellaneous retail and automobile/filling station categories. Since the Village’s portion of sales tax receipts is based on a 1% tax rate, these receipts represent total retail sales of approximately $1.85 billion for 2017. The Village projects that this revenue source will increase 4.5% during 2018 and 2019. The Village will continue its efforts in the area of economic development and is optimistic that retail sales will grow in the coming years. Mount Prospect’s average unemployment during 2017 was 3.7%. This was a decrease from the prior year of 90 basis points (4.6% in 2016). The average unemployment rate for the State of Illinois for 2017 was decreased 80 basis points from the prior year coming in at 5.0%. During the 12 months of 2017, the average rate had been 5.8%. The rate for U.S. decreased 50 basis points from 4.9% to 4.4%. Mount Prospect’s median family income, $67,823 as of the 2010 Census (using 5-year estimates), was 26% higher than the median for Cook County ($53,942) and 22% higher than the median for the State of Illinois ($55,735). In a suburban setting where it is often difficult to distinguish the boundaries of one community from a neighboring community, the economic activity of the “region” is a major influence on the economies of the individual communities. The Village of Mount Prospect is located on the eastern edge of the “Golden Corridor” which extends along Interstate 90 from O’Hare Airport to Elgin, a stretch of approximately 25 miles. Along this corridor can be found the corporate headquarters of such corporations as Sears and Zurich North America. The corridor is also home to regional headquarters for such corporations as AT&T and Siemens. The Corridor will continue to grow, as thousands of acres remain available for development on its far western edge. Long-term financial planning. In 2003, the Village conducted its first long-range financial planning workshop. The workshop was held in response to the slowing economy and its impact to the Village’s financial condition. The goal of the workshop was to put the Village’s financial condition back on firm ground in such a manner as to not overburden residents and businesses from a tax standpoint or reduce the scope and quality of municipal services that would jeopardize the livability and curb appeal of the community. The goal of the workshop was accomplished through a series of revenue enhancements, budget cuts and the planned drawdown of fund balance. Subsequent workshops continued into 2017. During the 2017 workshop, financial status reports were provided for end-of-year results for 2016, updated projections for 2017 and a revised forecast for 2018. Two additional tools have been developed in managing the long-range finances of the Village. The first is a Five-Year Community Investment Program that outlines the major capital expenditure/project initiatives of the Village over the next five years and identifies funding sources. Over the next five years (2018-2022), the Village has identified $116.8 million in water and sewer, flood control, street, public building, equipment and other miscellaneous capital projects. The second is the Village Strategic Plan for 2020 completed in early 2016. The strategic plan provides the mission, vision, and goals for vision attainment along with the strategic action plan of the organization. An implementation guide was developed in October 2016 using the goals identified in the

- vii -
Strategic Plan. This implementation guide provides the objectives, short-term challenges and opportunities, and action items to be taken for accomplishing the goals of the Village. Action items were prioritized as top or high priority by the Village Board and fall into three categories; Policy Agenda, Management Agenda and Management in Progress. The implementation guide is updated annually reflecting work completed and changing priorities. Funding of initiatives identified in the strategic plan will receive a higher priority during the budget process. Awards. The Government Finance Officers Association of the United States and Canada (GFOA) awarded a Certificate of Achievement for Excellence in Financial Reporting to the Village of Mount Prospect for its comprehensive annual financial report for the year ended December 31, 2016. The Certificate of Achievement is a prestigious national award recognizing conformance with the highest standards for preparation of state and local government financial reports. In order to be awarded a Certificate of Achievement, a governmental unit must publish an easily readable and efficiently organized Comprehensive Annual Financial Report (CAFR) whose contents conform to program standards. Such CAFR must satisfy both generally accepted accounting principles and applicable legal requirements. A Certificate of Achievement is valid for a period of one year only. The Village of Mount Prospect has received a Certificate of Achievement since 1983. We believe our current report continues to conform to the Certificate of Achievement program requirements, and we are submitting it to GFOA for evaluation. In addition, the Village of Mount Prospect also received the Government Finance Officers Association’s Award for Distinguished Budget Presentation for its annual budget for the fiscal year beginning on January 1, 2017 and ending December 31, 2017. In order to qualify for the Distinguished Budget Presentation Award, a governmental unit must publish a budget document that meets program criteria as a policy document, as an operations guide, as a financial plan, and as a communications device. The Village of Mount Prospect has received this award each year since 1994. The Village is awaiting word as to whether it received the Budget Award for its 2018 Budget document. Acknowledgements The preparation of this report on a timely basis could not have been accomplished without the efficient and dedicated services of the entire staff of the Finance Department. I would like to express special appreciation to Lynn Jarog, Deputy Finance Director, Mike Grochocki, Accounting Supervisor and Accountants Nancy Warnock and Rumiana Nihtianova who contributed greatly to its preparation. Additionally, I would like to acknowledge the Mayor, the Board of Trustees, the Finance Commission and Village Manager for their leadership and support in planning and conducting the financial affairs of the Village in a responsible and progressive manner. Respectfully submitted,
David O. Erb Finance Director

- viii -

1415 West Diehl Road, Suite 400
Naperville, IL 60563
630.566.8400
INDEPENDENT AUDITOR’S REPORT
The Honorable Mayor Members of the Board of Trustees Village of Mount Prospect, Illinois Report on the Financial Statements
We have audited the accompanying financial statements of the governmental activities, the business-type activities, each major fund, and the aggregate remaining fund information of the Village of Mount Prospect, Illinois (the Village) as of and for the year ended December 31, 2017, and the related notes to the financial statements, which collectively comprise the Village’s basic financial statements as listed in the table of contents. Management’s Responsibility for the Financial Statements
Management is responsible for the preparation and fair presentation of these financial statements in accordance with accounting principles generally accepted in the United States of America; this includes the design, implementation, and maintenance of internal control relevant to the preparation and fair presentation of financial statements that are free from material misstatement, whether due to fraud or error. Auditor’s Responsibility
Our responsibility is to express opinions on these financial statements based on our audit. We
conducted our audit in accordance with auditing standards generally accepted in the United
States of America and the standards applicable to financial audits contained in Government
Auditing Standards, issued by the Comptroller General of the United States. Those standards
require that we plan and perform the audit to obtain reasonable assurance about whether the
financial statements are free from material misstatement.
An audit involves performing procedures to obtain audit evidence about the amounts and disclosures in the financial statements. The procedures selected depend on the auditor’s judgment, including the assessment of the risks of material misstatement of the financial statements, whether due to fraud or error. In making those risk assessments, the auditor considers internal control relevant to the Village’s preparation and fair presentation of the financial statements in order to design audit procedures that are appropriate in the circumstances, but not for the purpose of expressing an opinion on the effectiveness of the Village’s internal control. Accordingly, we express no such opinion. An audit also includes evaluating the appropriateness of accounting policies used and the reasonableness of significant accounting estimates made by management, as well as evaluating the overall presentation of the financial statements.
- 1 -

We believe that the audit evidence we have obtained is sufficient and appropriate to provide a basis for our audit opinions.
Opinions
In our opinion, the financial statements referred to above present fairly, in all material respects,
the respective financial position of the governmental activities, the business-type activities, each
major fund, and the aggregate remaining fund information of the Village of Mount Prospect,
Illinois, as of December 31, 2017, and the respective changes in financial position and, where
applicable, cash flows thereof for the year then ended in accordance with accounting principles
generally accepted in the United States of America.
Other Matters
Required Supplementary Information
Accounting principles generally accepted in the United States of America require that the
management’s discussion and analysis and other required supplementary information be
presented to supplement the basic financial statements. Such information, although not a part of
the basic financial statements, is required by the Governmental Accounting Standards Board,
who considers it to be an essential part of financial reporting for placing the basic financial
statements in an appropriate operational, economic, or historical context. We have applied
certain limited procedures to the required supplementary information in accordance with auditing
standards generally accepted in the United States of America, which consisted of inquiries of
management about the methods of preparing the information and comparing the information for
consistency with management’s responses to our inquiries, the basic financial statements, and
other knowledge we obtained during our audit of the basic financial statements. We do not
express an opinion or provide any assurance on the information because the limited procedures
do not provide us with sufficient evidence to express an opinion or provide any assurance.
Other Information
Our audit was conducted for the purpose of forming opinions on the financial statements that
collectively comprise the Village’s basic financial statements. The introductory section,
combining and individual fund financial statements and schedules, supplemental data, and
statistical section are presented for purposes of additional analysis and are not a required part of
the basic financial statements.
The combining and individual fund financial statements and schedules are the responsibility of
management and were derived from and relate directly to the underlying accounting and other
records used to prepare the basic financial statements. Such information has been subjected to
the auditing procedures applied in the audit of the basic financial statements and certain
additional procedures, including comparing and reconciling such information directly to the
underlying accounting and other records used to prepare the basic financial statements or to the
basic financial statements themselves, and other additional procedures in accordance with
auditing standards generally accepted in the United States of America. In our opinion, the
combining and individual fund financial statements and schedules are fairly stated, in all material
respects, in relation to the basic financial statements as a whole.
- 2 -

The introductory section, supplemental data, and statistical section have not been subjected to the
auditing procedures applied in the audit of the basic financial statements and, accordingly, we do
not express an opinion or provide any assurance on them.
Other Reporting Required by Government Auditing Standards
In accordance with Government Auditing Standards, we have also issued our report dated
June 26, 2018, on our consideration of the Village’s internal control over financial reporting and
on our tests of its compliance with certain provisions of laws, regulations, contracts, and grant
agreements and other matters. The purpose of that report is to describe the scope of our testing of
internal control over financial reporting and compliance and the results of that testing, and not to
provide an opinion on internal control over financial reporting or on compliance. That report is
an integral part of an audit performed in accordance with Government Auditing Standards in
considering the Village’s internal control over financial reporting and compliance.
Naperville, Illinois
June 26, 2018
- 3 -

GENERAL PURPOSE EXTERNAL
FINANCIAL STATEMENTS

(See independent auditor’s report.)
MD&A 1
VILLAGE OF MOUNT PROSPECT, ILLINOIS
MANAGEMENT’S DISCUSSION AND ANALYSIS
For Fiscal Year Ended December 31, 2017
The Village of Mount Prospect (the “Village”) Management’s Discussion and Analysis is designed to (1) assist the reader in
focusing on significant issues, (2) provide an overview of the Village’s financial activity, (3) identify changes in the Village’s
financial position (its ability to address the next and subsequent year challenges), (4) identify any material deviations from the
financial plan (the approved budget), and (5) identify individual fund issues or concerns.
Since the Management’s Discussion and Analysis (MD&A) is designed to focus on the current year’s activities, resulting
changes and currently known facts, please read it in conjunction with the Transmittal Letter (beginning on page iii), and the
Village’s financial statements (beginning on page 4).
USING THE FINANCIAL SECTION OF THIS COMPREHENSIVE ANNUAL FINANCIAL REPORT
The primary focus of local governmental financial statements had been to summarize fund type information on a
current financial resource basis. This approach was modified by Governmental Accounting Standards Board (GASB)
Statement No. 34. As a result, these financial statements now present two kinds of statements, each with a different
snapshot of the Village’s finances. The financial statement’s focus under GASB Statement No. 34 is on both the
Village as a whole (government-wide) and on the major individual funds. Both perspectives (government-wide and
major fund) allow the user to address relevant questions, broaden a basis for comparison (year to year or government
to government) and enhance the Village’s accountability.
Government-Wide Financial Statements
The government-wide financial statements (see pages 4-7) are designed to be corporate-like in that all of the
governmental and business-type activities are consolidated into columns that add to a total for the Primary
Government. The focus of the Statement of Net Position (the “Unrestricted Net Position”) found on pages 4-5 is
designed to be similar to bottom line results for the Village and its governmental and business-type activities. This
statement combines and consolidates the governmental fund’s current financial resources (short-term spendable
resources) with capital assets and long term obligations using the accrual basis of accounting and economic resources
measurement focus.
The Statement of Activities (see pages 6-7) is focused on both the gross and net cost of various activities (including
governmental and business-type), which are supported by the government’s general taxes and other resources. This
is intended to summarize and simplify the user’s analysis of the cost of various governmental services and/or subsidy
to various business-type activities.
The governmental activities reflect the Village’s basic services, including police, fire, public works, and administration.
Property taxes, sales and income taxes and local utility taxes finance the majority of these services. The business-type activities
reflect private sector type operations (water, sewer, and parking operations), where the fee for service typically covers all or
most of the cost of operation, including depreciation.
Fund Financial Statements
Traditional users of governmental financial statements will find the Fund Financial Statements presentation more familiar. The
focus is on major funds rather than (the previous model's) fund types.
The Governmental Major Fund (see pages 8-12) presentation is organized on a sources and uses of liquid resources basis. This
is the manner in which the financial plan (the budget) is typically developed. The flow and availability of liquid resources is a
clear and appropriate focus of any analysis of a government. Funds are established for various purposes and the Fund Financial
Statement allows the demonstration of sources and uses and/or budgeting compliance associated therewith.

VILLAGE OF MOUNT PROSPECT, ILLINOIS
MANAGEMENT’S DISCUSSION AND ANALYSIS (Continued)
(See independent auditor’s report.)
MD&A 2
The Fund Financial Statements also allow the government to address its Fiduciary Funds (Pension Trust and Agency Funds).
While these funds represent trust responsibilities of the government, these assets are restricted in purpose and do not represent
discretionary assets of the government. Therefore, these assets are not presented as part of the Government-Wide Financial
Statements.
While the Business-type Activities column on the Proprietary Fund Financial Statements (see pages 13-17) is the same as the
Business-type column on the Government-Wide Financial Statement, the Governmental Funds total column requires a
reconciliation because of the different measurement focus (current financial resources versus total economic resources) which
is reflected on the page following each statement (see pages 10 and 12). The flow of current financial resources will reflect
bond proceeds and interfund transfers as other financial sources, as well as capital expenditures and bond principal payments
as expenditures. The reconciliation will eliminate these transactions and incorporate the capital assets and long-term obligation
(bonds and others) into the Governmental Activities column (in the government-wide statements).
Infrastructure Assets
Historically, a government's largest group of assets (infrastructure – i.e. roads, bridges, storm sewers, etc.) have not been
reported nor depreciated in governmental financial statements. GASB Statement No. 34 requires that these assets be valued and
reported within the Governmental Activities column of the Government-wide Statements. Additionally, the government must
elect to either (1) depreciate these assets over their estimated useful life or (2) develop a system of asset management designed
to maintain the service delivery potential to near perpetuity. If the government develops the asset management system (the
modified approach), which periodically (at least every third year), by category, measures and demonstrates its maintenance of
locally established levels of service standards, the government may record its cost of maintenance in lieu of depreciation. The
Village of Mount Prospect has chosen to depreciate assets over their useful life. If a road project is considered maintenance - a
recurring cost that does not extend the road's original useful life or expand its capacity - the cost of the project will be expensed.
An “overlay" of a road will be considered maintenance whereas a "rebuild" of a road will be capitalized.
GOVERNMENT-WIDE STATEMENTS
Statement of Net Position
The Village’s combined net position for the primary government decreased from a negative $12.8 million to a negative
$14.8 million. The net decrease of $2.0 million is attributable to a decrease of $2.8 million in Governmental Activities
and an increase of $0.8 in Business-Type Activities.
Table 1 reflects the condensed Statement of Net Position. For more detailed information see the Statement of Net Position
found on pages 4-5. Table 2 focuses on the changes in net position of the governmental and business-type activities.
(This space is intentionally left blank.)

VILLAGE OF MOUNT PROSPECT, ILLINOIS
MANAGEMENT’S DISCUSSION AND ANALYSIS (Continued)
(See independent auditor’s report.)
MD&A 3
Table 1
Statement of Net Position
as of December 31, 2017 (in millions)
Normal Impacts
There are six basic (normal) transactions that will affect the comparability of the Statement of Net Position summary
presentation.
Net results of activities - which will impact (increase/decrease) current assets and unrestricted net position.
Borrowing for capital - which will increase current assets and long-term debt.
Spending borrowed proceeds on new capital - which will reduce current assets and increase capital assets. There is a second
impact, an increase in invested in capital assets and an increase in related net debt which will not change the net investment in
capital assets.
Spending of non-borrowed current assets on new capital - which will (a) reduce current assets and increase capital assets and
(b) will reduce unrestricted net position and increase net investment in capital assets.
Principal payment on debt - which will (a) reduce current assets and reduce long-term debt and (b) reduce unrestricted net
position and increase net investment in capital assets.
Reduction of capital assets through depreciation - which will reduce capital assets and net investment in capital assets.
2017 2016 2017 2016 2017 2016
Current and other assets 78.6$ 73.7$ 12.4$ 7.8$ 91.0$ 81.5$
Capital assets 63.4 64.3 36.7 36.6 100.1 100.9
Total assets 142.0$ 138.0$ 49.1$ 44.4$ 191.1$ 182.4$
Deferred outflows of resources 14.2 19.3 1.0 1.3 15.2 20.6
Total assets/deferred outflows 156.2$ 157.3$ 50.1$ 45.7$ 206.3$ 203.0$
Current liabilities 5.9$ 5.2$ 1.0$ 2.4$ 6.9$ 7.6$
Noncurrent liabilities 175.1 181.6 6.9 2.0 182.0 183.6
Total liabilities 181.0$ 186.8$ 7.9$ 4.4$ 188.9$ 191.2$
Deferred inflows of resources 32.0 24.5 0.2 0.1 32.2 24.6
Total liabilities/deferred inflows 213.0$ 211.3$ 8.1$ 4.5$ 221.1$ 215.8$
Net Position
Net investment in capital assets 34.2$ 43.0$ 36.0$ 36.6$ 70.2$ 79.6$
Restricted net position 4.1 4.6 - - 4.1 4.6
Unrestricted net position (95.1) (101.6) 6.0 4.6 (89.1) (97.0)
Total net position (56.8)$ (54.0)$ 42.0$ 41.2$ (14.8)$ (12.8)$
Total
Governmental
Activities
Business-type
Activities

VILLAGE OF MOUNT PROSPECT, ILLINOIS
MANAGEMENT’S DISCUSSION AND ANALYSIS (Continued)
(See independent auditor’s report.)
MD&A 4
Current Year Impacts
Governmental activities net position decreased $2.8 million while the business-type activities net position increased
by $0.8 million. The governmental activities total assets decreased by $1.1 million and the governmental activities
total liabilities/deferred inflows increased by $1.7 million. The total assets decrease of $1.1 million in governmental
activities was the result of an increase of $4.9 million in current and other assets a decrease of $0.9 million in capital
assets and a decrease in deferred outflows of $5.1 million. The $4.9 million increase in current assets was due to an
increase in cash of $6.8 million and a decrease in due from other governments of $1.9 million. Surplus from operations
in the General Fund and proceeds from the sale of bonds accounted for the increase in cash and investments. Amounts
due from the Mount Prospect Public Library related to their outstanding debt accounted for the decrease in due from
other governments. The increase in total net position of $0.8 million in business-type activities was due to an increase
in current assets of $4.6 million, an increase in capital assets of $0.1 million, a decrease in deferred outflows of $0.3
million, a net increase in current and noncurrent liabilities of $3.5 million, and an increase in deferred inflows of $0.1
million.
The decrease in deferred outflows of $5.1 million for the governmental activities was due to a decrease in pension-
related items for IMRF, Police and Fire. Total liabilities for governmental activities decreased $5.8 million due to an
increase in current liabilities of $0.7 million and a decrease in non-current liabilities of $6.5 million. The decrease in
non-current liabilities was due to a decrease in debt due in more than one year. Deferred inflows of resources increased
$7.5 million for pension-related items for IMRF, Police and Fire. Changes in the other categories resulted in the timing
related to the normal course of operations.
Liabilities and deferred inflows of resources for business-type activities increased from $4.5 million to $8.1 million.
This increase was due to an increase in non-current liabilities of $4.9 million and a decrease in current liabilities of
$1.4 million.
Changes in Net Position
The Village’s combined change in net position for the primary government in 2017 was a decrease of $2.1 million
versus a decrease of $7.3 million in 2016. Activities for the governmental activities saw a decrease in net position of
$2.9 million from 2016, while activities for the business-type funds saw an increase in net position of $0.8 million
from 2016. The following chart lists the revenues and expenses for the current and prior fiscal years.
(This space is intentionally left blank.)

VILLAGE OF MOUNT PROSPECT, ILLINOIS
MANAGEMENT’S DISCUSSION AND ANALYSIS (Continued)
(See independent auditor’s report.)
MD&A 5
Table 2
Changes in Net Position
as of December 31, 2017 (in millions)
(Note: There may be some slight differences in totals due to rounding).
Revenues 2017 2016 2017 2016 2017 2016
Program revenues
Charges for service 10.7$ 11.4$ 13.7$ 13.3$ 24.4$ 24.7$
Operating grants 2.7 2.6 - - 2.7 2.6
Capital grants/contrib. 0.2 - - 0.2 0.2 0.2
General revenues
Property taxes 18.4 20.5 1.5 1.5 19.9 22.0
Business district taxes 0.3 0.3 - - 0.3 0.3
Sales/Use taxes 25.3 23.2 - 0.1 25.3 23.3
Income taxes 5.0 5.3 - - 5.0 5.3
Utility taxes 3.5 3.6 - - 3.5 3.6
Other taxes 4.4 4.4 - - 4.4 4.4
Investment income 0.2 0.1 - - 0.2 0.1
Contributions - - - - - -
Other - - 0.1 0.1 0.1 0.1
Total revenue 70.7$ 71.4$ 15.3$ 15.2$ 86.0$ 86.6$
Expenses
General government 10.7$ 9.9$ -$ -$ 10.7$ 9.9$
Public safety 37.4 38.3 - - 37.4 38.3
Highways and streets 16.2 20.0 - - 16.2 20.0
Health 4.6 4.6 - - 4.6 4.6
Welfare 2.1 2.1 - - 2.1 2.1
Culture and recreation 0.6 0.5 - - 0.6 0.5
Interest 2.0 2.0 - - 2.0 2.0
Water and sewer - - 14.3 16.1 14.3 16.1
Parking - - 0.2 0.4 0.2 0.4
Total expenses 73.6$ 77.4$ 14.5$ 16.5$ 88.1$ 93.9$
Change in net position (2.9)$ (6.0)$ 0.8$ (1.3)$ (2.1)$ (7.3)$
Net Position, January 1 (54.0)$ (50.5)$ 41.2$ 41.9$ (12.8)$ (8.6)$
Change in accounting principal - 2.5 - 0.6 - 3.1
Prior Period Adjustment - - - - - -
Net Position (Deficit), January 1, Restated (54.0)$ (48.0)$ 41.2$ 42.5$ (12.8)$ (5.5)$
Net Position (Deficit), December 31 (56.9)$ (54.0)$ 42.0$ 41.2$ (14.9)$ (12.8)$
Total
Governmental Business-type
ActivitiesActivities

VILLAGE OF MOUNT PROSPECT, ILLINOIS
MANAGEMENT’S DISCUSSION AND ANALYSIS (Continued)
(See independent auditor’s report.)
MD&A 6
Normal Impacts
There are eight basic impacts on revenues and expenses and are reflected below.
Revenues:
Economic condition - This can reflect a declining, stable or growing economic environment and has a substantial impact
on state income, sales and utility tax revenue as well as public spending habits for building permits, elective user fees and
volumes of consumption.
Increase/decrease in Village approved rates - While certain tax rates are set by statute, the Village Board has significant
authority to impose and periodically increase/decrease rates (water, sewer, licenses and fees, home rule sales tax, utility
taxes, etc.).
Changing patterns in intergovernmental and grant revenue (both recurring and non-recurring) - Certain recurring
revenues (state shared revenues, etc.) may experience significant changes periodically while non-recurring (or one-time)
grants are less predictable and often distorting in their impact on year-to-year comparisons.
Market impacts on investment income - The Village's investment portfolio is managed using a short-term average
maturity and the market condition may cause investment income to fluctuate less than alternative longer-term options.
Expenses:
Introduction of new programs - Within the functional expense categories (Public Safety, Public Works, General
Government, etc.) individual programs may be added or deleted to meet changing community needs or unfunded mandates
from other governmental levels.
Increase/Decrease in authorized personnel - Changes in service demand may cause the Village Board to
increase/decrease authorized staffing levels. Staffing costs (salary and related benefits) represent approximately 80%
of the Village's General Fund operating costs.
Salary increases (annual adjustments and merit) - The ability to attract and retain human and intellectual resources
requires the Village to strive for a competitive salary range position in the marketplace. In addition, the Village has 4
separate bargaining units representing various segments of the employee population.
Inflation - While overall inflation appears to be reasonably low, the Village is a major consumer of certain commodities
such as supplies, fuels and parts. Some specific areas may experience unusually high price increases.
CURRENT YEAR IMPACTS
Governmental Activities
Revenue:
Total revenues for the Village’s Governmental Activities for 2017 were $70.7 million.
Sales/Use taxes are the largest revenue source for governmental activities accounting for $25.3 million or an
increase of $2.1 million from the prior year. The increase was due primarily to the steadily improving local
economy and additional new retail coming on line. The sales tax consists of a 1.0% state portion and 1.0% local
home-rule portion. Property taxes are the second highest revenue source with $18.4 million in revenue. This
revenue has historically been the most stable source for the Village. This was a decrease of $2.1 million from the
prior year due to the termination of the Downtown Redevelopment TIF District. There was a decrease of $0.7
million in charges for service. Other taxes and revenues did not change from the prior year.

VILLAGE OF MOUNT PROSPECT, ILLINOIS
MANAGEMENT’S DISCUSSION AND ANALYSIS (Continued)
(See independent auditor’s report.)
MD&A 7
Governmental Activities (cont.)
Expenses:
Total expenses for the Village’s Governmental Activities for 2017 were $73.6 million.
Public Safety, which includes Police and Fire, accounts for the largest portion of governmental expenses. Total
Public Safety expenses in 2017 were $37.4 million, a decrease of $0.9 million from 2016. Expenses for Highways
and Streets, which are made up of the public works divisions (excluding water and sewer) is the second largest
category of governmental expenses totaling $16.2 million, a decrease of $3.8 million from the prior year. The
decrease is primarily due to expenses related to capital projects.
Business-Type Activities
Revenues:
Total revenues for the Village’s Business-Type Activities for 2017 were $15.3 million.
Business-type activities in the Village consist of Water and Sewer Operations and Parking Operations. Charges
for service annually account for the largest share of revenue for business-type activities. Of the $13.7 million
generated in 2017, $10.5 million is from water sales, $2.7 million is from sewer fees and charges, $0.3 million is
from parking operations and the balance is from various penalties, tap and meter fees. For 2016, water sales
accounted for $10.1 million and sewer fees were $2.6 million. The Water and Sewer Fund also receives special
service area taxes in the amount of $1.5 million. This amount is unchanged from the prior year. These taxes
support the delivery of Lake Michigan Water to Village residents that are connected to the Village’s water system.
Expenses:
Total expenses for the Village’s Business-Type Activities for 2017 were $14.5 million.
Of the total expenses for business-type activities, $14.3 million is attributable to Water and Sewer while $0.2
million is attributable to parking. $6.5 million in Water and Sewer Fund expenses were for the acquisition of
water through the Northwest Suburban Municipal Joint Action Water Agency (JAWA). In comparison, of the
$16.5 million in expenses for 2016, $6.4 million were attributable to the acquisition of water through JAWA.
FINANCIAL ANALYSIS OF THE VILLAGE'S GENERAL FUND
The General Fund is the Village’s primary operating fund. It supports a majority of the day-to-day services delivered
to its residences and businesses. The fund balance of the General Fund saw an increase of $0.7 million in 2017 from
$18.7 million to $19.4 million. In 2017, General Fund revenues came in below final budget by $0.8 million while
expenditures and net transfers came in $1.5 million under budget. The final Village budget had anticipated a decrease
in the General Fund fund balance of $0.1 million.
No other significant deviations from the final budget were seen in revenues during 2017.

VILLAGE OF MOUNT PROSPECT, ILLINOIS
MANAGEMENT’S DISCUSSION AND ANALYSIS (Continued)
(See independent auditor’s report.)
MD&A 8
General Fund Budgeting Highlights
During 2017, the Village amended the budget four (4) times. Table 3 below reflects the original and revised budget
and the actual revenues and expenditures for the General Fund. More information can be found in the schedule of
revenues, expenditures and changes in fund balance beginning on page 94.
Table 3
General Fund Budgetary Changes
Calendar Year 2017 (in millions)
Other Major Funds
There are two (2) other Major Funds for Fiscal Year ended December 31, 2017. These two Funds are 1) Refuse Disposal
Fund, and 2) Debt Service Fund.
Refuse Disposal Fund – This Fund coordinates the Village’s comprehensive municipal solid waste program. Total
revenues for 2017 were $4.3 million, a decrease of $0.3 million from the prior year. Almost the entire amount of revenue
received during 2017 was due to charges for service. Total expenditures for 2017 were $4.2 million, a decrease of $0.2
million from the prior year. Ending fund balance increased $0.1 million to $1.5 million.
Debt Service Fund – This Fund is used to accumulate monies for payment of principal and interest on general obligation
bonds and other borrowings. Total revenues for 2017 were $4.9 million, a decrease of $0.1 million from the prior year.
Of this total revenue amount, $2.3 million is from property taxes, $1.6 million is from an intergovernmental transfer
from the Mount Prospect Public Library to pay for library related debt, and $1.0 million is from other taxes. Total
expenditures for 2017 were $4.9 million, a decrease of $0.4 from the prior year.
Original Revised
Budget Budget Actual
Revenues and Other Financing Sources
Taxes 23.7$ 23.8$ 23.2$
Intergovernmental 25.0 25.4 25.8
Other 4.6 5.5 4.8
Total Revenues 53.3$ 54.7$ 53.8$
Expenditures and Transfers
Expenditures 52.7$ 54.0$ 52.5$
Net Transfers 0.6 0.6 0.6
Total Expenditures and Transfers 53.3$ 54.6$ 53.1$
Change in Fund Balance -$ 0.1$ 0.7$
VILLAGE OF MOUNT PROSPECT, ILLINOIS
MANAGEMENT’S DISCUSSION AND ANALYSIS (Continued)
(See independent auditor’s report.)
MD&A 9
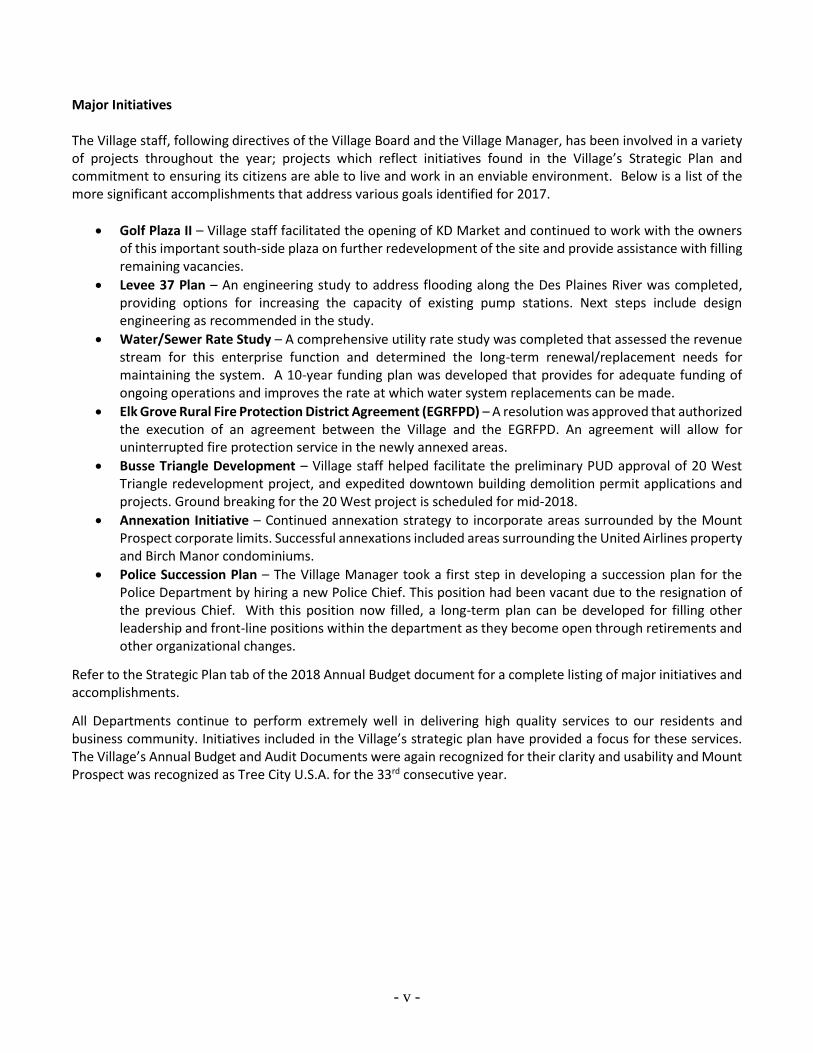
Capital Assets
At the end of 2017, the Village had a combined total of $100.2 million invested in a broad range of capital assets including
village facilities, roads, bridges, water/sewer lines and machinery and equipment (see Table 4 below). The following
reconciliation summarizes the changes in Capital Assets.
Table 4
Capital Assets at Year End
Net of Depreciation (in millions)
This amount represents a net decrease (including additions and deletions) of $0.7 million from 2016.
(This space is intentionally left blank.)
2017 2016 2017 2016 2017 2016
Land (including right-of-way) 10.3$ 10.3$ 17.6$ 17.6$ 27.9$ 27.9$
Construction in Progress 2.3 2.1 0.9 0.4 3.2 2.5
Buildings & Improvements 27.8 27.8 1.5 2.0 29.3 29.8
Vehicles 4.4 3.8 - - 4.4 3.8
Machinery & Equipment 1.5 1.1 1.7 1.9 3.2 3.0
Infrastructure 17.2 19.2 15.0 14.7 32.2 33.9
Total Capital Assets 63.5$ 64.3$ 36.7$ 36.6$ 100.2$ 100.9$
Total Primary
Government
Governmental
Activities
Business-type
Activities

VILLAGE OF MOUNT PROSPECT, ILLINOIS
MANAGEMENT’S DISCUSSION AND ANALYSIS (Continued)
(See independent auditor’s report.)
MD&A 10
Table 5
Change in Capital Assets (in millions)
Table 5 above shows the change in capital assets during 2017. This year's major additions to the capital assets include the
following (in millions):
Governmental Activities
Vehicles for Public Safety, Public Works and Village Fleet - $1.3
Building and other Infrastructure Improvements - $1.3
Various construction projects in-progress - $1.2
Purchases of various machinery & equipment - $0.6
Business-Type Activities
Various construction projects in-progress - $0.7
Infrastructure Improvements - $0.7
More detailed information on capital asset activity can be found in Note 4 of the notes to the financial statements beginning
on page 33.
Debt Outstanding
The Village of Mount Prospect had total long-term debt and loans payable of $182.0 million as of December 31, 2017. Long-
term debt is comprised of general obligation debt, compensated absences to employees, other post-employment benefits (OPEB),
loans payable, and pension liability for IMRF, police and fire. During the year, $10.8 million of general obligation debt and
notes payable were issued while compensated absences, claims and judgments, and post-employment benefits increased $2.5
million. Decreases in long term debt include the retirement of $3.1 million in general obligation debt, $9.0 million reduction
in pension liability for police and fire, and $0.6 million in notes and loan contracts.
The Village of Mount Prospect maintains an AA+ rating from Standard and Poor’s. As a home rule authority, the Village of
Mount Prospect does not have a legal debt limit.
More detailed information on long-term debt activity can be found in Note 6 of the notes to the financial statements beginning
on page 37.
Governmental Business-type
Activities Activities Total
Beginning Balance 64.3$ 36.6$ 100.9$
Additions
Depreciable 3.2 0.7 3.9
Non-Depreciable 1.2 0.7 1.9
Retirements
Depreciable (1.0) (0.4) (1.4)
Non-Depreciable (1.0) (0.2) (1.2)
Depreciation (4.1) (0.7) (4.8)
Retirement 0.9 - 0.9
Ending Balance 63.5$ 36.7$ 100.2$

VILLAGE OF MOUNT PROSPECT, ILLINOIS
MANAGEMENT’S DISCUSSION AND ANALYSIS (Continued)
(See independent auditor’s report.)
MD&A 11
Economic Factor's and Next Year's Budget
The General Fund, the Village’s main operating fund, ended with a solid surplus for calendar year 2017. The $0.7
million surplus increases the fund balance to 35% of the subsequent year budgeted expenditures. The Village Board
has set as its benchmark a level of reserves equal to 25% of subsequent year expenditures. Total village revenues for
2017 continued to see positive increases from the prior year. Conservative approaches to estimating revenue and
strong expenditure management by the various departments have allowed the Village to maintain a strong financial
condition through several lean years following the significant downturn in the economy that started at the end of 2008.
Continuing challenges in 2018 and years to come include, reductions in revenue due to state budgetary issues, rising
personnel related costs (wages, insurance, etc.) and the funding of the public safety pensions. Approximately 80% of
the operating budget is made up of these personnel and related costs.
The Village’s average unemployment for 2017 was 3.7%. This is below the state and national unemployment rate of 5.0%
and 4.4% respectively. The Village’s unemployment rate decreased 90 basis points from the prior year.
The 2018 Budget represents a 6.6% increase from the amended 2017 Budget and totals $123.7 million. The General
Fund increased $1.4 million, or 2.6% from the prior year. The Village’s Operating Budget (that part which funds the
Village’s day-to-day operations) shows an increase of 1.8% and totals $72.4 million. The Operating Budget includes
all General Fund expenditures as well as refuse disposal, water and sewer service, and various special revenue
activities.
Request for Information
This financial report is designed to provide a general overview of the Village of Mount Prospect's finances for all those with
an interest in the government's finances. Questions concerning any of the information provided in this report or requests for
additional financial information should be addressed to David O. Erb, Finance Director/Treasurer, Village of Mount Prospect,
50 South Emerson, Mount Prospect, Illinois 60056.

BASIC FINANCIAL STATEMENTS

Governmental Business-Type
Activities Activities Total
ASSETS
Cash and investments 40,200,592$ 8,108,897$ 48,309,489$
Receivables (net of allowance,
where applicable)
Property taxes 18,713,005 1,515,464 20,228,469
Other taxes 7,488,185 - 7,488,185
Accrued interest 17,731 4,009 21,740
Utility customers - 1,420,341 1,420,341
Miscellaneous 1,062,996 5,972 1,068,968
Prepaid items 508,212 16,404 524,616
Inventory 310,169 358,919 669,088
Due from fiduciary 5,654 - 5,654
Due from other governments 8,084,573 771 8,085,344
Deposits - insurance 2,190,074 - 2,190,074
Deposits with joint venture - 953,442 953,442
Capital assets not being depreciated 12,585,293 18,497,649 31,082,942
Capital assets being depreciated (net of
accumulated depreciation) 50,867,163 18,209,122 69,076,285
Total assets 142,033,647 49,090,990 191,124,637
DEFERRED OUTFLOWS OF RESOURCES
Pension items - IMRF 4,346,340 1,017,311 5,363,651
Pension items - Police Pension 3,373,499 - 3,373,499
Pension items - Firefighters' Pension 5,925,943 - 5,925,943
Unamortized loss on refunding 524,395 - 524,395
Total deferred outflows of resources 14,170,177 1,017,311 15,187,488
Total assets and deferred outflows of resources 156,203,824 50,108,301 206,312,125
LIABILITIES
Accounts payable 3,936,808 883,872 4,820,680
Accrued payroll 896,885 80,067 976,952
Accrued interest payable 105,674 - 105,674
Retainage payable 170,677 15,442 186,119
Other payables 68,622 1,877 70,499
Due to fiduciary funds 41,918 - 41,918
Unearned revenue 643,482 34,275 677,757
Due to other governments 9,099 - 9,099
Noncurrent liabilities
Due within one year 5,812,362 172,851 5,985,213
Due in more than one year 169,359,688 6,702,779 176,062,467
Total liabilities 181,045,215 7,891,163 188,936,378
DEFERRED INFLOWS OF RESOURCES
Deferred revenue - property taxes 18,713,005 - 18,713,005
Pension items - IMRF 788,153 184,476 972,629
Pension items - Police Pension 7,615,408 - 7,615,408
Pension items - Firefighters' Pension 4,916,780 - 4,916,780
Total deferred inflows of resources 32,033,346 184,476 32,217,822
Total liabilities and deferred inflows of resources 213,078,561 8,075,639 221,154,200
VILLAGE OF MOUNT PROSPECT, ILLINOIS
STATEMENT OF NET POSITION
December 31, 2017
Primary Government
(This statement is continued on the following page.)- 4 -

Governmental Business-Type
Activities Activities Total
NET POSITION
Net investment in capital assets 34,171,129$ 35,765,755$ 69,936,884$
Restricted for
Highways and streets 1,873,899 - 1,873,899
Public safety - police 334,030 - 334,030
Public safety - fire 352,417 - 352,417
Debt service 184,195 - 184,195
Refuse disposal 1,360,019 - 1,360,019
Unrestricted (deficit) (95,150,426) 6,266,907 (88,883,519)
TOTAL NET POSITION (DEFICIT) (56,874,737)$ 42,032,662$ (14,842,075)$
STATEMENT OF NET POSITION (Continued)
December 31, 2017
Primary Government
VILLAGE OF MOUNT PROSPECT, ILLINOIS
See accompanying notes to financial statements.- 5 -

Operating Capital
Charges Grants and Grants and
Expenses for Services Contributions Contributions
FUNCTIONS/PROGRAMS
PRIMARY GOVERNMENT
Governmental Activities
General government 10,690,075$ 4,178,495$ 17,087$ -$
Public safety 37,351,039 1,761,708 760,127 159,682
Highways and streets 16,176,313 169,389 1,430,753 -
Health 4,557,211 4,310,647 - -
Welfare 2,068,368 39,621 405,499 -
Culture and recreation 611,653 61,895 49,500 -
Interest 2,049,953 204,100 42,618 -
Total governmental activities 73,504,612 10,725,855 2,705,584 159,682
Business-Type Activities
Water and sewer 14,308,117 13,395,619 - -
Parking 229,873 343,314 - -
Total business-type activities 14,537,990 13,738,933 - -
TOTAL PRIMARY GOVERNMENT 88,042,602$ 24,464,788$ 2,705,584$ 159,682$
Program Revenues
VILLAGE OF MOUNT PROSPECT, ILLINOIS
STATEMENT OF ACTIVITIES
For the Year Ended December 31, 2017
- 6 -

Governmental Business-Type
Activities Activities Total
(6,494,493)$ -$ (6,494,493)$
(34,669,522) - (34,669,522)
(14,576,171) - (14,576,171)
(246,564) - (246,564)
(1,623,248) - (1,623,248)
(500,258) - (500,258)
(1,803,235) - (1,803,235)
(59,913,491) - (59,913,491)
- (912,498) (912,498)
- 113,441 113,441
- (799,057) (799,057)
(59,913,491) (799,057) (60,712,548)
General Revenues
Taxes
Property 18,396,040 1,514,452 19,910,492
Utility 3,491,473 - 3,491,473
Business district 322,936 - 322,936
Home rule sales 5,365,011 - 5,365,011
Food and beverage 1,222,166 - 1,222,166
Real estate transfer 1,190,331 - 1,190,331
Municipal motor fuel 706,715 - 706,715
Hotel/motel 479,927 - 479,927
Charitable games 6,236 - 6,236
Other 205,092 - 205,092
Intergovernmental - unrestricted
State sales and use tax 19,894,716 - 19,894,716
Income tax 4,975,194 - 4,975,194
Replacement tax 456,136 - 456,136
Investment income 196,995 25,334 222,329
Miscellaneous 125,949 92,905 218,854
Total 57,034,917 1,632,691 58,667,608
CHANGE IN NET POSITION (2,878,574) 833,634 (2,044,940)
NET POSITION (DEFICIT), JANUARY 1 (53,996,163) 41,199,028 (12,797,135)
NET POSITION (DEFICIT), DECEMBER 31 (56,874,737)$ 42,032,662$ (14,842,075)$
Net (Expense) Revenue and Change in Net Position
Primary Government
See accompanying notes to financial statements.- 7 -

Refuse Debt
General Disposal Service Nonmajor Total
Cash and investments 14,814,727$ 1,054,842$ 162,895$ 11,957,711$ 27,990,175$
Receivables (net, where applicable,
of allowances for uncollectibles)
Property taxes 16,333,702 - 2,379,303 - 18,713,005
Other taxes 6,220,011 - - 1,268,174 7,488,185
Accrued interest 9,571 - - - 9,571
Other 408,285 535,088 - 95,094 1,038,467
Due from other funds 92,845 - - - 92,845
Due from other governments 186,629 - 7,381,300 506,518 8,074,447
Inventories 1,936 - - - 1,936
Prepaid items 259,283 82,626 - 606 342,515
TOTAL ASSETS 38,326,989$ 1,672,556$ 9,923,498$ 13,828,103$ 63,751,146$
ASSETS
VILLAGE OF MOUNT PROSPECT, ILLINOIS
BALANCE SHEET
GOVERNMENTAL FUNDS
December 31, 2017
(This statement is continued on the following page.)- 8 -

Refuse Debt
General Disposal Service Nonmajor Total
LIABILITIES
Accounts payable 1,463,624$ 222,369$ -$ 2,121,364$ 3,807,357$
Accrued payroll 852,506 7,542 - - 860,048
Retainage payable 5,332 - - 165,345 170,677
Other payables 53,741 - - - 53,741
Compensated absences 23,650 - - - 23,650
Unearned revenue 144,446 - - 499,036 643,482
Due to other governments 9,099 - - - 9,099
Due to other funds - - - 87,192 87,192
Due to fiduciary funds 41,918 - - - 41,918
Total liabilities 2,594,316 229,911 - 2,872,937 5,697,164
DEFERRED INFLOWS OF RESOURCES
Unavailable revenue - property taxes 16,333,702 - 2,379,303 - 18,713,005
Unavailable revenue - other - - 7,360,000 - 7,360,000
Total deferred inflows of resources 16,333,702 - 9,739,303 - 26,073,005
Total liabilities and deferred inflows of resources 18,928,018 229,911 9,739,303 2,872,937 31,770,169
FUND BALANCES
Nonspendable
Inventory 1,936 - - - 1,936
Prepaid items 259,283 82,626 - 606 342,515
Restricted
Highways and streets - - - 6,688,899 6,688,899
Public safety - police - - - 334,030 334,030
Public safety - fire - - - 352,417 352,417
Debt service - - 184,195 - 184,195
Refuse disposal - 1,360,019 - - 1,360,019
Unrestricted
Assigned
Capital projects - - - 3,579,214 3,579,214
Unassigned 19,137,752 - - - 19,137,752
Total fund balances 19,398,971 1,442,645 184,195 10,955,166 31,980,977
TOTAL LIABILITIES, DEFERRED INFLOWS
OF RESOURCES, AND FUND BALANCES 38,326,989$ 1,672,556$ 9,923,498$ 13,828,103$ 63,751,146$
OF RESOURCES, AND FUND BALANCES
LIABILITIES, DEFERRED INFLOWS
VILLAGE OF MOUNT PROSPECT, ILLINOIS
BALANCE SHEET
GOVERNMENTAL FUNDS (Continued)
December 31, 2017
See accompanying notes to financial statements.- 9 -

FUND BALANCES OF GOVERNMENTAL FUNDS 31,980,977$
Amounts reported for governmental activities in the statement of net position are different because:
Capital assets used in governmental activities are not financial resources and, therefore, are not
reported in the governmental funds 63,452,456
Less internal service funds included below (6,748,340)
Differences between expected and actual experiences, assumption changes, net differences between
projected and actual earnings and contributions subsequent to the measurement date for the Illinois
Municipal Retirement Fund are recognized as deferred outflows of resources and deferred inflows
of resources on the statement of net position
Deferred outflows of resources 4,346,340
Deferred inflows of resources (788,153)
Differences between expected and actual experiences, assumption changes, and net differences
between projected and actual earnings for the Police Pension Plan are recognized as deferred
outflows of resources and deferred inflows of resources on the statement of net position
Deferred outflows of resources 3,373,499
Deferred inflows of resources (7,615,408)
Differences between expected and actual experiences, assumption changes, and net differences
between projected and actual earnings for the Firefighters' Pension Plan are recognized as deferred
outflows of resources and deferred inflows of resources on the statement of net position
Deferred outflows of resources 5,925,943
Deferred inflows of resources (4,916,780)
Long-term intergovernmental receivables are not available to pay for current period expenditures
and, therefore, are deferred inflows of resources in the governmental funds 7,360,000
Interest payable is not due and payable in the current period and, therefore, not reported in the
governmental funds (105,673)
Long-term liabilities are not due and payable in the current period and, therefore, are not reported
in the governmental funds
General obligation bonds payable (44,500,000)
Loan contracts payable (170,271)
Installment notes payable (1,105,000)
Business district limited tax note payable (32,525,273)
Compensated absences payable (3,591,958)
Net pension liability - Illinois Municipal Retirement Fund (6,289,542)
Net pension liability - Police Pension Plan (43,096,949)
Net pension liability - Firefighters Pension Plan (38,857,145)
Unamortized bond premiums (1,284,843)
Unamortized loss on refunding 524,395
Net other postemployment benefits obligation (1,979,837)
The net position of the internal service funds are included in the governmental activities in the
statement of net position 19,736,825
NET POSITION (DEFICIT) OF GOVERNMENTAL ACTIVITIES (56,874,737)$
VILLAGE OF MOUNT PROSPECT, ILLINOIS
RECONCILIATION OF FUND BALANCES OF GOVERNMENTAL FUNDS TO THE
GOVERNMENTAL ACTIVITIES IN THE STATEMENT OF NET POSITION
December 31, 2017
See accompanying notes to financial statements.- 10 -

Refuse Debt
General Disposal Service Nonmajor Total
REVENUES
Property taxes 16,112,039$ -$ 2,284,000$ -$ 18,396,039$
Other taxes 7,129,671 - 1,002,092 5,256,335 13,388,098
Licenses, permits, and fees 2,334,232 - - 1,648,265 3,982,497
Intergovernmental 25,833,177 - 1,621,718 1,744,417 29,199,312
Charges for services 1,527,168 4,283,563 - - 5,810,731
Fines and forfeits 415,189 - - - 415,189
Investment income 132,925 7,124 5,393 51,553 196,995
Other reimbursements - - - 19,824 19,824
Miscellaneous 317,562 27,084 - 247,706 592,352
Total revenues 53,801,963 4,317,771 4,913,203 8,968,100 72,001,037
EXPENDITURES
Current
General government 8,311,613 - - 1,749,291 10,060,904
Public safety 34,166,460 - - 112,602 34,279,062
Highways and streets 7,613,341 - - 1,148,795 8,762,136
Health 261,533 4,238,747 - - 4,500,280
Welfare 1,548,489 - - 404,566 1,953,055
Culture and recreation 585,907 - - - 585,907
Capital outlay - - - 5,786,667 5,786,667
Debt service
Principal retirement - - 3,518,904 - 3,518,904
Interest and fiscal charges - - 1,378,256 - 1,378,256
Total expenditures 52,487,343 4,238,747 4,897,160 9,201,921 70,825,171
EXCESS (DEFICIENCY) OF REVENUES
OVER EXPENDITURES 1,314,620 79,024 16,043 (233,821) 1,175,866
OTHER FINANCING SOURCES (USES)
Issuance of debt - - - 4,815,000 4,815,000
Premium on issuance of debt - - - 115,835 115,835
Transfers in - - - 600,000 600,000
Transfers (out) (600,000) - - - (600,000)
Total other financing sources (uses) (600,000) - - 5,530,835 4,930,835
NET CHANGE IN FUND BALANCES 714,620 79,024 16,043 5,297,014 6,106,701
FUND BALANCES, JANUARY 1 18,684,351 1,363,621 168,152 5,658,152 25,874,276
FUND BALANCES, DECEMBER 31 19,398,971$ 1,442,645$ 184,195$ 10,955,166$ 31,980,977$
VILLAGE OF MOUNT PROSPECT, ILLINOIS
STATEMENT OF REVENUES, EXPENDITURES,
GOVERNMENTAL FUNDS
For the Year Ended December 31, 2017
AND CHANGES IN FUND BALANCES
See accompanying notes to financial statements.- 11 -

NET CHANGE IN FUND BALANCES -
TOTAL GOVERNMENTAL FUNDS 6,106,701$
Amounts reported for governmental activities in the statement of activities are different because:
Governmental funds report capital outlay as expenditures; however, they are capitalized and depreciated
in the statement of activities 789,055
Depreciation in the statement of activities does not require the use of current financial resources and,
therefore, is not reported as an expenditure in governmental funds (4,137,386)
Less internal service funds included below 712,880
The issuance of long-term debt and related costs are shown on the fund financial statements as other
financing sources (uses) and current expenditures but are recorded as long-term liabilities and deferred
outflows and inflows of resources on the government-wide statements
Issuance of bonds (4,815,000)
Premium on issuance of bonds (115,835)
The repayment of long-term debt is reported as an expenditure when due in governmental funds but as a
reduction of principal outstanding in the statement of activities
General obligation bonds payable 2,910,000
Loan contracts payable 188,905
Installment notes payable 420,000
Some expenses in the statement of activities do not require the use of current financial resources and,
therefore, are not reported as expenditures in governmental funds
Accreted interest on business district limited tax note payable (758,020)
Amortization of premium 141,065
Amortization of gains and losses on refundings (61,853)
Increase in compensated absences (352,924)
Increase in net other postemployment benefits obligation (540,098)
Change in accrued interest 7,111
The change in the Illinois Municipal Retirement Fund net pension liability and deferred outflows and
inflows of resources is not a source or use of a financial resource (941,613)
The change in the Police Pension Plan net pension liability and deferred outflow/inflows of resources
is not a source or use of a financial resource (340,184)
The change in the Firefighters' Pension Plan net pension liability and deferred outflow/inflows of resources
is not a source or use of a financial resource (1,279,141)
Revenues in the statement of activities that are not available in governmental funds are not reported as a
revenue in governmental funds until received (1,375,000)
The change in net position of the internal service funds is reported with governmental activities 562,763
CHANGE IN NET POSITION (DEFICIT) OF GOVERNMENTAL ACTIVITIES (2,878,574)$
For the Year Ended December 31, 2017
VILLAGE OF MOUNT PROSPECT, ILLINOIS
RECONCILIATION OF THE GOVERNMENTAL FUNDS STATEMENT OF REVENUES,
EXPENDITURES, AND CHANGES IN FUND BALANCES TO THE
GOVERNMENTAL ACTIVITIES IN THE STATEMENT OF ACTIVITIES
See accompanying notes to financial statements.- 12 -

VILLAGE OF MOUNT PROSPECT, ILLINOIS
STATEMENT OF NET POSITION
PROPRIETARY FUNDS
December 31, 2017
Governmental
Activities
Water Nonmajor Internal
and Sewer Enterprise Total Service
CURRENT ASSETS
Cash and investments 7,577,274$ 531,623$ 8,108,897$ 12,210,417$
Receivables
Property taxes 1,515,464 - 1,515,464 -
Accounts - billed 653,381 - 653,381 -
Accounts - unbilled 766,960 - 766,960 -
Accrued interest 4,009 - 4,009 8,160
Other 5,972 - 5,972 24,529
Inventories 358,919 - 358,919 308,233
Prepaid items 16,404 - 16,404 165,697
Due from other governments 771 - 771 10,126
Total current assets 10,899,154 531,623 11,430,777 12,727,162
NONCURRENT ASSETS
Deposits - insurance - - - 2,190,074
Deposit with joint venture 953,442 - 953,442 -
Subtotal noncurrent assets 953,442 - 953,442 2,190,074
Capital assets
Capital assets not being depreciated 18,265,295 232,354 18,497,649 1,387,786 Capital assets being depreciated, cost 38,690,885 364,800 39,055,685 13,722,629 Accumulated depreciation (20,481,763) (364,800) (20,846,563) (8,362,075)
Net capital assets 36,474,417 232,354 36,706,771 6,748,340
Total noncurrent assets 37,427,859 232,354 37,660,213 8,938,414
Total assets 48,327,013 763,977 49,090,990 21,665,576
DEFERRED OUTFLOWS OF RESOURCES
Pension items - IMRF 1,017,311 - 1,017,311 -
Total assets and deferred outflows of resources 49,344,324 763,977 50,108,301 21,665,576
CURRENT LIABILITIES
Accounts payable 871,106 12,766 883,872 129,451
Accrued payroll 77,630 2,437 80,067 36,837
Retainage payable 15,442 - 15,442 -
Claims payable - - - 1,349,957
Unearned revenue - 34,275 34,275 -
Other payables 1,877 - 1,877 14,881
Bonds payable, current 125,000 - 125,000 -
Compensated absences payable 46,671 1,180 47,851 31,244
Total current liabilities 1,137,726 50,658 1,188,384 1,562,370
Business-Type Activities
(This statement is continued on the following page.)- 13 -

VILLAGE OF MOUNT PROSPECT, ILLINOIS
STATEMENT OF NET POSITION (Continued)
PROPRIETARY FUNDS
December 31, 2017
Governmental
Activities
Water Nonmajor Internal
and Sewer Enterprise Total Service
LONG-TERM LIABILITIES
Compensated absences payable 186,686$ 4,720$ 191,406$ 124,974$
Claims payable - - - 189,713
Bonds payable, noncurrent 4,938,964 - 4,938,964 -
Net other postemployment benefits obligation 96,370 3,899 100,269 51,694
Net pension liability - IMRF 1,472,140 - 1,472,140 -
Total long-term liabilities 6,694,160 8,619 6,702,779 366,381
Total liabilities 7,831,886 59,277 7,891,163 1,928,751
DEFERRED INFLOWS OF RESOURCES
Pension items - IMRF 184,476 - 184,476 -
Total liabilities and deferred inflows of resources 8,016,362 59,277 8,075,639 1,928,751
NET POSITION
Investment in capital assets 35,533,401 232,354 35,765,755 6,748,340
Unrestricted 5,794,561 472,346 6,266,907 12,988,485
TOTAL NET POSITION 41,327,962$ 704,700$ 42,032,662$ 19,736,825$
Business-Type Activities
See accompanying notes to financial statements.- 14 -

VILLAGE OF MOUNT PROSPECT, ILLINOIS
STATEMENT OF REVENUES, EXPENSES,
AND CHANGES IN NET POSITION
PROPRIETARY FUNDS
For the Year Ended December 31, 2017
Governmental
Activities
Water Nonmajor Internal
and Sewer Enterprise Total Service
OPERATING REVENUES
Charges for services 13,395,619$ 343,314$ 13,738,933$ 10,594,838$
Contributions - - - 1,398,673
Miscellaneous - - - 48,275
Total operating revenues 13,395,619 343,314 13,738,933 12,041,786
OPERATING EXPENSES
Administration and maintenance 13,548,366 229,873 13,778,239 2,651,323
Insurance and claims - - - 8,295,721
Depreciation 681,477 - 681,477 712,880
Total operating expenses 14,229,843 229,873 14,459,716 11,659,924
OPERATING INCOME (LOSS) (834,224) 113,441 (720,783) 381,862
NON-OPERATING REVENUES (EXPENSES)
Property taxes 1,514,452 - 1,514,452 -
Investment income 22,453 2,881 25,334 90,183
Interest and fiscal charges (75,893) - (75,893) -
Other income 92,905 - 92,905 -
Gain (loss) on the sale of capital assets (2,381) - (2,381) 90,718
Total non-operating revenues (expenses) 1,551,536 2,881 1,554,417 180,901
CHANGE IN NET POSITION 717,312 116,322 833,634 562,763
NET POSITION, JANUARY 1 40,610,650 588,378 41,199,028 19,174,062
NET POSITION, DECEMBER 31 41,327,962$ 704,700$ 42,032,662$ 19,736,825$
Business-Type Activities
See accompanying notes to financial statements.- 15 -

VILLAGE OF MOUNT PROSPECT, ILLINOIS
STATEMENT OF CASH FLOWS
For the Year Ended December 31, 2017
Governmental
Activities
Water Nonmajor Internal
and Sewer Enterprise Total Service
CASH FLOWS FROM OPERATING ACTIVITIES
Receipts from customers and users 13,291,171$ 332,646$ 13,623,817$ 2,266,508$
Receipts from interfund services - - - 9,715,705
Receipts from miscellaneous revenues 128,793 4,003 132,796 62,238
Payments to suppliers (11,974,496) (141,823) (12,116,319) (9,461,282)
Payments to employees (2,768,985) (92,726) (2,861,711) (1,210,512)
Net cash from operating activities (1,323,517) 102,100 (1,221,417) 1,372,657
CASH FLOWS FROM NONCAPITAL
FINANCING ACTIVITIES
Property taxes 1,514,452 - 1,514,452 -
Net cash from noncapital financing activities 1,514,452 - 1,514,452 -
CASH FLOWS FROM CAPITAL AND
RELATED FINANCING ACTIVITIES
Issuance of bonds 4,988,122 - 4,988,122 -
Proceeds from sale of capital assets - - - 97,091
Acquisition of capital assets (802,052) - (802,052) (2,523,123)
Net cash from capital and related
financing activities 4,186,070 - 4,186,070 (2,426,032)
CASH FLOWS FROM INVESTING ACTIVITIES
Investment income 20,644 2,881 23,525 86,408
Net cash from investing activities 20,644 2,881 23,525 86,408
NET INCREASE (DECREASE) IN
CASH AND CASH EQUIVALENTS 4,397,649 104,981 4,502,630 (966,967)
CASH AND CASH EQUIVALENTS,
JANUARY 1 3,179,625 428,260 3,607,885 13,177,384
CASH AND CASH EQUIVALENTS,
DECEMBER 31 7,577,274$ 533,241$ 8,110,515$ 12,210,417$
PROPRIETARY FUNDS
Business-Type Activities
(This statement is continued on the following page.)- 16 -

VILLAGE OF MOUNT PROSPECT, ILLINOIS
STATEMENT OF CASH FLOWS (Continued)
For the Year Ended December 31, 2017
Governmental
Activities
Water Nonmajor Internal
and Sewer Enterprise Total Service
RECONCILIATION OF OPERATING INCOME
(LOSS) TO NET CASH FLOWS FROM
OPERATING ACTIVITIES
Operating income (loss) (834,224)$ 113,441$ (720,783)$ 381,862$
Adjustments to reconcile operating income (loss) to
net cash from operating activities
Depreciation 681,477 - 681,477 712,880
Other income 92,905 - 92,905 -
Changes in assets and liabilities
Receivables (68,560) - (68,560) (19,950)
Inventories 51,368 - 51,368 (15,172)
Prepaid items (6,224) - (6,224) (3,667)
Deposits (71,678) - (71,678) 53,948
Accounts payable and retainage payable (1,415,302) (8,954) (1,424,256) (80,465)
Accrued payroll and compensated absences 13,602 1,272 14,874 17,839
Net other postemployment benefits obligation 12,723 1,388 14,111 8,232
Pension items - IMRF 220,396 - 220,396 -
Unearned revenues - (6,665) (6,665) -
Claims payable - - - 317,150
NET CASH FROM OPERATING ACTIVITIES (1,323,517)$ 100,482$ (1,223,035)$ 1,372,657$
PROPRIETARY FUNDS
Business-Type Activities
See accompanying notes to financial statements.- 17 -

VILLAGE OF MOUNT PROSPECT, ILLINOIS
STATEMENT OF FIDUCIARY NET POSITION
FIDUCIARY FUNDS
December 31, 2017
Pension
Trust Agency
Funds Funds
ASSETS
Cash and cash equivalents 2,300,683$ 1,126,624$
Investments
State and local obligations 2,528,079 -
U.S. Government and U. S. agency obligations 22,824,429 -
Corporate bonds and obligations 20,085,755 -
Real estate 3,183,460 -
Mutual funds 86,146,284 -
Accrued interest receivable 282,361 -
Prepaids 2,831 -
Due from other funds 41,918 -
Deposits - 7,140
Total assets 137,395,800 1,133,764$
LIABILITIES
Accounts payable 55,744 -$
Deposits payable - 1,133,764
Due to other funds 5,654 -
Total liabilities 61,398 1,133,764$
NET POSITION RESTRICTED
FOR PENSIONS 137,334,402$
See accompanying notes to financial statements.- 18 -

ADDITIONS
Contributions
Employer 7,144,659$
Plan members 1,938,948
Total contributions 9,083,607
Investment income
Interest earned 1,404,142
Net change in fair value 17,099,327
Less investment expenses (213,085)
Net investment income 18,290,384
Total additions 27,373,991
DEDUCTIONS
Administration 99,122
Benefits and refunds 10,261,982
Total deductions 10,361,104
NET INCREASE 17,012,887
NET POSITION RESTRICTED
FOR PENSIONS
January 1 120,321,515
December 31 137,334,402$
VILLAGE OF MOUNT PROSPECT, ILLINOIS
STATEMENT OF CHANGES IN FIDUCIARY NET POSITION
PENSION TRUST FUNDS
For the Year Ended December 31, 2017
See accompanying notes to financial statements.- 19 -

- 20 -
VILLAGE OF MOUNT PROSPECT, ILLINOIS
NOTES TO FINANCIAL STATEMENTS
December 31, 2017
1. SUMMARY OF SIGNIFICANT ACCOUNTING POLICIES
The Village of Mount Prospect, Illinois (the Village) was incorporated in 1917. The
Village operates under the Council/Manager form of government. The Village’s major
operations include public works, finance, police, fire, community development, human
services, and communications.
The financial statements of the Village have been prepared in conformity with accounting
principles generally accepted in the United States of America (hereinafter referred to as
generally accepted accounting principles (GAAP)), as applied to government units. The
Governmental Accounting Standards Board (GASB) is the accepted standard-setting body
for establishing governmental accounting and financial reporting principles. The more
significant of the Village’s accounting policies are described below.
a. Reporting Entity
The Village is a municipal corporation governed by an elected mayor and a
six-member board of trustees. In determining the financial reporting entity, the
Village complies with the provisions of GASB Statement No. 61, The Financial
Reporting Omnibus - an Amendment of GASB Statements No. 14 and No. 34, and
includes all component units that have a significant operational or financial
relationship with the Village. There are no component units for which the Village is
considered to be financially accountable for.
The Village’s financial statements include two pension trust funds.
Police Pension Employees Retirement System
The Village’s sworn police employees participate in the Police Pension Employees
Retirement System (PPERS). PPERS functions for the benefit of these employees
and is governed by a five-member pension board. Two members appointed by the
Village’s President, one elected pension beneficiary, and two elected police
employees constitute the pension board. The participants are required to contribute a
percentage of salary as established by state statute and the Village is obligated to
fund all remaining PPERS costs based upon actuarial valuations. The State of Illinois
is authorized to establish benefit levels and the Village is authorized to approve the
actuarial assumptions used in the determination of the Village’s contribution levels.
Although it is legally separate from the Village, PPERS is reported as if it were part
of the primary government because its sole purpose is to provide retirement benefits
for the Village’s police employees. PPERS is reported as a pension trust fund.
- 20 -

VILLAGE OF MOUNT PROSPECT, ILLINOIS
NOTES TO FINANCIAL STATEMENTS (Continued)
- 21 -
1. SUMMARY OF SIGNIFICANT ACCOUNTING POLICIES (Continued)
a. Reporting Entity (Continued)
Firefighters’ Pension Employees Retirement System
The Village’s sworn full-time firefighters participate in the Firefighters’ Pension
Employees Retirement System (FPERS). FPERS functions for the benefit of these
employees and is governed by a five-member pension board. Two members
appointed by the Village’s President, one elected pension beneficiary, and two
elected from active participants of the Firefighters’ Pension Fund constitute the
pension board. The participants are required to contribute a percentage of salary as
established by state statute and the Village is obligated to fund all remaining FPERS
costs based upon actuarial valuations. The State of Illinois is authorized to establish
benefit levels and the Village is authorized to approve the actuarial assumptions used
in the determination of contribution levels. Although it is legally separate from the
Village, FPERS is reported as if it were part of the primary government because its
sole purpose is to provide retirement benefits for the Village’s sworn full-time
firefighters. FPERS is reported as a pension trust fund.
b. Fund Accounting
The Village uses funds to report on its financial position, changes in its financial
position, and cash flows. Fund accounting is designed to demonstrate legal
compliance and to aid financial management by segregating transactions related to
certain government functions or activities.
A fund is a separate accounting entity with a self-balancing set of accounts. The
minimum number of funds are maintained consistent with legal and managerial
requirements.
Funds are classified into the following categories: governmental, proprietary, and
fiduciary.
Governmental funds are used to account for all or most of a government’s
general activities, including the collection and disbursement of restricted or
committed monies (special revenue funds), the funds committed, restricted, or
assigned for the acquisition or construction of capital assets (capital projects
funds), and the funds committed, restricted, or assigned for the servicing of
long-term debt (debt service funds). The General Fund is used to account for
all activities of the general government not accounted for in some other fund.
- 21 -

VILLAGE OF MOUNT PROSPECT, ILLINOIS
NOTES TO FINANCIAL STATEMENTS (Continued)
- 22 -
1. SUMMARY OF SIGNIFICANT ACCOUNTING POLICIES (Continued) b. Fund Accounting (Continued)
Proprietary funds are used to account for activities similar to those found in the
private sector, where the determination of net income is necessary or useful to
sound financial administration. Goods or services from such activities can be
provided either to outside parties (enterprise funds) or to other departments or
agencies primarily within the Village (internal service funds).
Fiduciary funds are used to account for assets held on behalf of outside parties,
including other governments, or on behalf of other funds within the Village. The Village utilizes pension trust funds and agency funds which are generally used to account for assets that the Village holds in a fiduciary capacity or on behalf of others as their agent.
c. Government-Wide and Fund Financial Statements
The government-wide financial statements (i.e., the statement of net position and the statement of activities) report information on all of the nonfiduciary activities of the Village. The effect of material interfund activity has been eliminated from these statements. Interfund services provided and used are not eliminated on these statements. Governmental activities, which normally are supported by taxes and intergovernmental revenues, are reported separately from business-type activities, which rely to a significant extent on fees and charges for support. The statement of activities demonstrates the degree to which the direct expenses of a given function, segment, or program are offset by program revenues. Direct expenses are those that are clearly identifiable with a specific function or segment. Program revenues include (1) charges to customers or applicants who purchase, use, or directly benefit from goods, services, or privileges provided by a given function or segment and (2) grants and contributions that are restricted to meeting the operational or capital requirements of a particular function or segment. Taxes and other items not properly included among program revenues are reported instead as general revenues. Separate financial statements are provided for governmental funds, proprietary funds, and fiduciary funds, even though the latter are excluded from the government-wide financial statements. Major individual governmental funds and major individual enterprise funds are reported as separate columns in the fund financial statements.
The Village reports the following major governmental funds:
The General Fund is the Village’s primary operating fund. It accounts for all
financial resources of the general government, except those accounted for in
another fund.
- 22 -

VILLAGE OF MOUNT PROSPECT, ILLINOIS
NOTES TO FINANCIAL STATEMENTS (Continued)
- 23 -
1. SUMMARY OF SIGNIFICANT ACCOUNTING POLICIES (Continued)
c. Government-Wide and Fund Financial Statements (Continued)
The Refuse Disposal Fund is a special revenue fund used to account for the
revenues and expenditures associated with providing solid waste collection
services. Financing is provided by restricted property taxes, user fees, and
recycling income. The Village has elected to present the Refuse Disposal Fund
as a major fund.
The Debt Service Fund is used to account for the servicing of general
long-term debt not being financed by proprietary funds.
The Village reports the following major proprietary fund:
The Water and Sewer Fund accounts for the activities of the water and sewer
operations. The Village operates sewerage pumping stations and collection
systems, and the water distribution system.
The Village reports the following internal service funds:
Internal Service Funds account for operations that provide services to other
departments or agencies of the Village, or to other governments, on a
cost-reimbursement basis.
The Computer Replacement Fund accounts for the acquisition of village
computer hardware. Financing is being provided by charges to various village
funds.
The Risk Management Fund accounts for the servicing and payment of claims
for liability, property/casualty coverage, workers’ compensation, and medical
benefits. Financing is being provided by charges to the various village funds.
The Vehicle Replacement Fund accounts for the acquisition and depreciation of
village vehicles. Financing is being provided by charges to the General, Water
and Sewer, Parking System Revenue, and Village Parking System Funds.
The Vehicle Maintenance Fund accounts for the maintenance and repair of all
village vehicles. Financing is being provided by charges to various village
funds.
- 23 -

VILLAGE OF MOUNT PROSPECT, ILLINOIS
NOTES TO FINANCIAL STATEMENTS (Continued)
- 24 -
1. SUMMARY OF SIGNIFICANT ACCOUNTING POLICIES (Continued)
c. Government-Wide and Fund Financial Statements (Continued)
The Village reports the following fiduciary funds:
The Pension Trust Funds account for the Police Pension Fund and Firefighters’
Pension Fund.
The agency funds account for the Escrow Deposits and Flexcomp Escrow.
d. Measurement Focus, Basis of Accounting, and Financial Statement Presentation
The government-wide financial statements are reported using the economic resources
measurement focus and the accrual basis of accounting, as are the proprietary fund and
fiduciary fund financial statements. Revenues and additions are recorded when earned
and expenses and deductions are recorded when a liability is incurred. Property taxes
are recognized as revenues in the year for which they are levied (i.e., intended to
finance). Grants and similar items are recognized as revenue as soon as all eligibility
requirements imposed by the provider have been met. Operating revenues and expenses
are directly attributable to the operation of the proprietary funds. Non-operating
revenue/expenses are incidental to the operations of these funds.
Governmental fund financial statements are reported using the current financial
resources measurement focus and the modified accrual basis of accounting. Under
the modified accrual basis of accounting, revenues are recognized when susceptible
to accrual (i.e., when they become both measurable and available). “Measurable”
means the amount of the transaction can be determined and “available” means
collectible within the current period or soon enough thereafter to be used to pay
liabilities of the current period, generally 60 days except for sales taxes and
telecommunication taxes which use 90 days. The Village recognizes property taxes
when they become both measurable and available in the year for which they are
levied (i.e., intended to finance). Expenditures are recorded when the related fund
liability is incurred. Principal and interest on general long-term debt are recorded as
expenditures when due.
Sales taxes owed to the state at year end, franchise taxes, licenses, charges for services,
and interest associated with the current fiscal period are all considered to be susceptible
to accrual and are recognized as liabilities or revenues of the current fiscal period.
Income and motor fuel taxes and fines collected and held by the state or county at
year end on behalf of the Village also are recognized as revenue. Fines and permits
revenues are not susceptible to accrual because generally they are not measurable
until received in cash.
- 24 -

VILLAGE OF MOUNT PROSPECT, ILLINOIS
NOTES TO FINANCIAL STATEMENTS (Continued)
- 25 -
1. SUMMARY OF SIGNIFICANT ACCOUNTING POLICIES (Continued)
d. Measurement Focus, Basis of Accounting, and Financial Statement Presentation
(Continued)
In applying the susceptible to accrual concept to intergovernmental revenues (e.g.,
federal and state grants), the legal and contractual requirements of the numerous
individual programs are used as guidelines. There are, however, essentially two types
of revenues. In one, monies must be expended on the specific purpose or project
before any amounts will be paid to the Village; therefore, revenues are recognized
based upon the expenditures recorded. In the other, monies are virtually unrestricted
as to purpose of expenditure and are generally revocable only for failure to comply
with prescribed eligibility requirements, such as equal employment opportunity.
These resources are reflected as revenues at the time of receipt or earlier if they meet
the availability criterion.
The Village reports unavailable/deferred and unearned revenue on its financial
statements. Unavailable/deferred revenues arise when a potential revenue does not
meet both the measurable and available or earned criteria for recognition in the
current period. Unearned revenues arise when resources are received by the
government before it has a legal claim to them such as when grant monies are
received prior to the incurrence of qualifying expenditures. In subsequent periods,
when both the revenue recognition criteria are met, or when the government has a
legal claim to the resources, the liability or deferred inflow of resources for unearned
and unavailable/deferred revenue is removed from the financial statements and
revenue is recognized.
e. Cash and Investments
For purposes of the statement of cash flows, the Village’s proprietary funds consider
all highly liquid investments with an original maturity of three months or less when
purchased to be cash equivalents.
f. Investments
Investments with a maturity of less than one year when purchased, non-negotiable
certificates of deposit and other nonparticipating investments are stated at cost or
amortized cost. Investments with a maturity greater than one year when purchased and
all investments of the pension trust funds are stated at fair value. Fair value is the price
that would be received to sell an asset or paid to transfer a liability in an orderly
transaction between market participants at the measurement date.
- 25 -

VILLAGE OF MOUNT PROSPECT, ILLINOIS
NOTES TO FINANCIAL STATEMENTS (Continued)
- 26 -
1. SUMMARY OF SIGNIFICANT ACCOUNTING POLICIES (Continued)
g. Interfund Receivables/Payables
Activity between funds that are representative of lending/borrowing arrangements
outstanding at the end of the fiscal year are referred to as either “due to/from other
funds” (i.e., the current portion of interfund loans) or “advances to/from other funds”
(i.e., the noncurrent portion of interfund loans). All other outstanding balances between
funds are reported as “due to/from other funds.”
Advances are offset by nonspendable fund balance in applicable governmental funds.
Interfund service transactions are accounted for as revenues, expenditures, or
expenses. Transactions that constitute reimbursements to a fund for
expenditures/expenses initially made from it that are properly applicable to another
fund are recorded as expenditures/expenses in the reimbursing fund and as reductions
of expenditures/expenses in the fund that is reimbursed. All other interfund
transactions are reported as transfers.
h. Inventories
Inventories are valued at cost, which approximates market, using the average cost
method. The costs of governmental fund inventories are recorded as expenditures
when consumed rather than when purchased.
i. Prepaid Items
Payments made to vendors for services that will benefit periods beyond the date of
this report are recorded as prepaid items. Prepaid items are recorded as
expenditures/expenses when consumed rather than when purchased.
j. Capital Assets
Capital assets, which include property, plant, equipment, and infrastructure assets (e.g.,
roads, bridges, stormsewers, and similar items), are reported in the applicable
governmental or business-type activities columns in the government-wide financial
statements. Capital assets, other than infrastructure, buildings and improvements,
purchased or acquired with an original cost of over $20,000 and infrastructure,
buildings and improvements with an original cost of over $50,000 are reported at
historical cost, or estimated historical cost. Donated capital assets are recorded at
acquisition value at the date of donation. Additions, improvements, and other capital
outlays that significantly extend the useful life of an asset are capitalized.
- 26 -

VILLAGE OF MOUNT PROSPECT, ILLINOIS
NOTES TO FINANCIAL STATEMENTS (Continued)
- 27 -
1. SUMMARY OF SIGNIFICANT ACCOUNTING POLICIES (Continued)
j. Capital Assets (Continued)
The costs of normal maintenance and repairs, including street overlays, that do not add
to the value or service capacity of the asset or materially extend asset lives, are not
capitalized.
Capital assets in the proprietary funds are capitalized in the fund in which they are
utilized. The valuation bases for proprietary fund capital assets are the same as those
used for the general capital assets. Donated capital assets are recorded at acquisition
value at the date of donation.
Major outlays for capital assets and improvements are capitalized as projects are
constructed. Interest incurred during the construction phase of capital assets of
business-type activities is included as part of the capitalized value of the assets
constructed. Property, plant, and equipment are depreciated using the straight-line
method over the following estimated useful lives:
Assets Years
Buildings and improvements 20-50
Machinery and equipment 2-20
Vehicles 2-20
Infrastructure 15-50
k. Compensated Absences
Vested or accumulated vacation and sick leave are reported as an expenditure and a
fund liability of the governmental fund that will pay it once retirement or separation
has occurred. Vested or accumulated vacation and sick leave of proprietary funds and
governmental activities are recorded as an expense and liability of those funds as the
benefits accrue to employees.
l. Rebatable Arbitrage
The Village reports rebatable arbitrage as a reduction of revenue. Where applicable,
any liability for rebatable arbitrage is reported in the fund in which the excess
investment income was recorded.
- 27 -

VILLAGE OF MOUNT PROSPECT, ILLINOIS
NOTES TO FINANCIAL STATEMENTS (Continued)
- 28 -
1. SUMMARY OF SIGNIFICANT ACCOUNTING POLICIES (Continued)
m. Long-Term Obligations
In the government-wide financial statements and proprietary funds in the fund financial
statements, long-term debt, and other long-term obligations are reported as liabilities in
the applicable governmental activities, business-type activities, or proprietary fund
financial statements. Bond premiums and discounts, as well as gains (losses) on
refundings, are deferred and amortized over the life of the bonds. Bonds payable are
reported net of the applicable bond premium or discount. Bond issuance costs are
reported as expenses at the time of issuance.
In the fund financial statements, governmental funds recognize bond premiums and
discounts during the current period. The face amount of debt issued is reported as other
financing sources. Premiums received on debt issuances are reported as other financing
sources while discounts on debt issuances are reported as other financing uses. Issuance
costs, whether or not withheld from the actual debt proceeds received, are reported as
expenditures.
n. Property Taxes
Property taxes for 2017 attached as an enforceable lien on January 1, 2017 on
property values assessed as of the same date. Taxes are levied by December of the
fiscal year (by passage of a Tax Levy Ordinance). Tax bills are prepared by the
County and issued on or about February 1, 2018 and August 1, 2018 and are payable
in two installments, on or about March 1, 2018 and September 1, 2018. The County
collects such taxes and remits them periodically. The allowance for uncollectible
taxes has been stated at 2% of the tax levy, to reflect actual collection experience.
Since the 2017 levy is intended to fund the 2018 fiscal year, the levy has been
recorded as a receivable and deferred inflow of resources.
o. Deferred Outflows/Inflows of Resources
In addition to assets, the statement of net position will sometimes report a separate
section for deferred outflows of resources. This separate financial statement element,
deferred outflows of resources, represents a consumption of net assets that applies to
a future period(s) and so will not be recognized as an outflow of resources
(expense/expenditure) until then. In addition to liabilities, the statement of net
position will sometimes report a separate section for deferred inflows of resources.
This separate financial statement element, deferred inflows of resources, represents
an acquisition of net assets that applies to a future period(s) and so will not be
recognized as an inflow of resources (revenue) until that time.
- 28 -

VILLAGE OF MOUNT PROSPECT, ILLINOIS
NOTES TO FINANCIAL STATEMENTS (Continued)
- 29 -
1. SUMMARY OF SIGNIFICANT ACCOUNTING POLICIES (Continued)
p. Fund Balances/Net Position
In the fund financial statements, governmental funds report nonspendable fund
balance for amounts that are either not in spendable form or that are legally or
contractually required to be maintained intact. Restrictions of fund balance are
reported for amounts constrained by legal restrictions from outside parties for a
specific purpose, or externally imposed by outside entities. None of the restricted
fund balance resulted from enabling legislation adopted by the Village. Committed
fund balance is constrained by formal actions of the Village’s Board of Trustees,
which is considered the Village’s highest level of decision-making authority. Formal
actions include ordinances approved by the Board of Trustees. Assigned fund
balance represents amounts constrained by the Village’s intent to use them for a
specific purpose. The authority to assign fund balance has been delegated to the
Village Manager through the fund balance policy adopted by the Village Board of
Trustees. Any residual fund balance of the General Fund and any deficit in other
governmental funds is reported as unassigned.
The Village’s flow of funds assumption prescribes that the funds with the highest
level of constraint are expended first. If restricted or unrestricted funds are available
for spending, the restricted funds are spent first. Additionally, if different levels of
unrestricted funds are available for spending the Village considers committed funds
to be expended first followed by assigned and then unassigned funds.
The Village’s policy states that the General Fund should maintain an unrestricted
fund balance level between 20% and 30% of the subsequent fiscal year’s annual
budgeted expenditures, the special revenue funds (except the CDBG Fund) should
maintain a fund balance level between 10% and 25% of the subsequent fiscal year’s
annual budgeted expenditures, not including capital, debt service and transfers, the
Debt Service Fund should maintain a fund balance level at a maximum of the amount
of the next principal and interest payment due, and the Capital Projects Fund should
maintain a fund balance level between 25% and 50% of the five-year average for
capital expenditures by the fund to a maximum of $1 million.
In the government-wide financial statements, restricted net position is legally
restricted by outside parties for a specific purpose. Net investment in capital assets
represents the book value of capital assets less any outstanding long-term debt issued
to acquire or construct the capital assets.
- 29 -

VILLAGE OF MOUNT PROSPECT, ILLINOIS
NOTES TO FINANCIAL STATEMENTS (Continued)
- 30 -
1. SUMMARY OF SIGNIFICANT ACCOUNTING POLICIES (Continued)
q. Use of Estimates
The preparation of financial statements in conformity with generally accepted
accounting principles requires management to make estimates and assumptions that
affect the reported amounts of assets, deferred outflows of resources, liabilities and
deferred inflows of resources and disclosure of contingent assets and liabilities at the
date of the financial statements, and the reported amounts of revenues and
expenditures/expenses during the reporting period. Actual results could differ from
those estimates.
2. DEPOSITS AND INVESTMENTS
The Village and pension funds categorize fair value measurements within the fair value
hierarchy established by generally accepted accounting principles. The hierarchy is based
on the valuation inputs used to measure the fair value of the asset. Level 1 inputs are
quoted prices in active markets for identical assets; Level 2 inputs are significant other
observable inputs; and Level 3 inputs are significant unobservable inputs. The Village does
not have any investments for which fair valuation is applicable. Refer to Note 12 for
relevant information related to the Police Pension Plan and Firefighters’ Pension Plan.
The Village maintains a cash and investment pool that is available for use by all funds,
except the pension trust funds. Each fund’s portion of this pool is displayed on the
financial statements as “cash and investments.” In addition, investments are separately held
by several of the Village’s funds. The deposits and investments of the pension trust funds
are held separately from those of other funds.
Village Deposits and Investments
The Village’s investment policy authorizes the Village to invest in all investments allowed
by Illinois Compiled Statutes (ILCS). These include deposits/investments in insured
commercial banks, savings and loan institutions, obligations of the U.S. Treasury and U.S.
agencies, insured credit union shares, money market mutual funds with portfolios of
securities issued or guaranteed by the United States Government or agreements to
repurchase these same obligations, repurchase agreements, short-term commercial paper
rated within the three highest classifications by at least two standard rating services, Illinois
Funds, and Illinois Metropolitan Investment Fund (IMET). The Village’s investment policy
does limit its deposits to financial institutions that are members of the FDIC system and are
capable of posting collateral for amounts in excess of FDIC insurance.
- 30 -

VILLAGE OF MOUNT PROSPECT, ILLINOIS
NOTES TO FINANCIAL STATEMENTS (Continued)
- 31 -
2. DEPOSITS AND INVESTMENTS (Continued)
Village Deposits and Investments (Continued)
It is the policy of the Village to invest its funds in a manner which will provide the highest
investment return with the maximum security while meeting the daily cash flow demands
of the Village and conforming to all state and local statutes governing the investment of
public funds, using the “prudent person” standard for managing the overall portfolio. The
primary objectives of the policy are, in order of priority, safety of principal, liquidity, and
rate of return.
Deposits with Financial Institutions
Custodial credit risk for deposits with financial institutions is the risk that in the event of
bank failure, the Village’s deposits may not be returned to it. The Village’s investment
policy requires pledging of collateral for all bank balances in excess of federal depository
insurance, at an amount not less than 105% of the fair market value of the funds secured,
with the collateral witnessed by a written collateral agreement and held by an independent
third party.
Investments
Interest rate risk is the risk that changes in interest rates will adversely affect the fair value
of an investment. In accordance with its investment policy, the Village limits its exposure
to interest rate risk by structuring the portfolio to provide liquidity for short and long-term
cash flow needs while providing a reasonable rate of return based on the current market.
Unless matched to a specific cash flow, maturities should not exceed two years from the
date of purchase.
Credit risk is the risk that the issuer of a debt security will not pay its par value upon
maturity. The Village limits its exposure to credit risk by permitting investments in only
those securities allowed under law and by specifically prohibiting investments in leveraged
or derivative securities.
The Illinois Public Treasurers’ Investment Pool, known as Illinois Funds, operates as a
qualified external investment pool in accordance with the criteria established in GASB
Statement No. 79, Certain External Investment Pools and Pool Participants, and thus,
reports all investments at amortized cost rather than market value. The investment in
Illinois Funds by participants is also reported at amortized cost. Illinois Funds does not
have any limitations or restrictions on participant withdrawals. The Illinois Treasurer’s
Office issues a separate financial report for Illinois Funds which may be obtained by
contacting the Administrative Office at Illinois Business Center, 400 West Monroe Street,
Suite 401, Springfield, Illinois 62704.
- 31 -

VILLAGE OF MOUNT PROSPECT, ILLINOIS
NOTES TO FINANCIAL STATEMENTS (Continued)
- 32 -
2. DEPOSITS AND INVESTMENTS (Continued)
Investments (Continued)
IMET is a not-for-profit investment trust formed pursuant to the Illinois Municipal Code
and managed by a Board of Trustees elected from the participating members. IMET is not
registered with the SEC as an investment company. Investments in IMET are valued at
IMET’s share price, the price for which the investment could be sold.
Custodial credit risk for investments is the risk that, in the event of the failure of the
counterparty to the investment, the Village will not be able to recover the value of its
investments that are in possession of an outside party. To limit its exposure, the Village’s
investment policy requires all security transactions that are exposed to custodial credit risk
to be processed on a delivery versus payment (DVP) basis with the underlying investments
held by an independent third party custodian and evidenced by safekeeping receipts and a
written custodial agreement. Illinois Funds, money market mutual funds, and IMET are not
subject to custodial credit risk.
Concentration of credit risk is the risk that the Village has too high a percentage of their
investments invested in one type of investment. The Village’s investment policy requires
diversification of investment to avoid unreasonable risk. The Village’s investment policy
states the Village’s portfolio shall be diversified in order to limit the investment holdings
of a specific issuer or business sector to avoid over concentration in any one institution or
area excluding investments in U.S. Treasury securities and authorized investment pools.
3. RECEIVABLES The following receivables are included in due from other governments on the statement of
net position:
GOVERNMENTAL ACTIVITIES
Court fines $ 26,918
Mount Prospect Public Library 7,360,000
Grants 648,662
Miscellaneous 48,993
TOTAL $ 8,084,573
The Series 2006 General Obligation Library Refunding Bonds, the Series 2011A General Obligation Refunding Bonds, and the Series 2016 General Obligation Refunding Bonds were issued to provide financing to the Mount Prospect Public Library (the Library). The Library is repaying these bonds issued by the Village. The Series 2006 General Obligation Library Refunding Bonds were refunded by the Series 2016 General Obligation Refunding
- 32 -

VILLAGE OF MOUNT PROSPECT, ILLINOIS
NOTES TO FINANCIAL STATEMENTS (Continued)
- 33 -
3. RECEIVABLES (Continued) Bonds during fiscal year 2016. The future principal and interest payments owed from the Library are as follows, with the principal portion recorded as an intergovernmental receivable in the debt service fund/governmental activities.
The annual debt service requirements are as follows:
Year Ending Principal Interest
2018 $ 1,400,000 $ 176,150 2019 1,425,000 148,150 2020 1,470,000 105,400 2021 1,515,000 61,300 2022 1,550,000 31,000
TOTAL $ 7,360,000 $ 522,000
4. CAPITAL ASSETS
Capital asset activity for the Village for the year ended December 31, 2017 was as follows:
Balances January 1
Additions
Retirements
Balances December 31
GOVERNMENTAL ACTIVITIES Capital assets not being depreciated Land (including right-of-ways) $ 10,291,446 $ - $ - $ 10,291,446 Construction in progress 2,110,797 1,198,858 1,015,808 2,293,847
Total capital assets not being depreciated
12,402,243
1,198,858
1,015,808
12,585,293
Capital assets being depreciated Buildings 38,009,332 769,166 - 38,778,498 Improvements other than buildings 436,273 - - 436,273 Vehicles 10,627,558 1,241,958 562,915 11,306,601 Machinery and equipment 3,596,799 554,278 376,995 3,774,082 Infrastructure 85,785,567 608,188 - 86,393,755
Total capital assets being depreciated
138,455,529
3,173,590
939,910
140,689,209
Less accumulated depreciation for Buildings 10,302,226 762,546 - 11,064,772 Improvements other than buildings 359,121 21,814 - 380,935 Vehicles 6,869,038 591,154 539,483 6,920,709 Machinery and equipment 2,450,361 216,882 349,592 2,317,651 Infrastructure 66,592,989 2,544,990 - 69,137,979
Total accumulated depreciation 86,573,735 4,137,386 889,075 89,822,046
Total capital assets being depreciated, net
51,881,794
(963,796)
50,835
50,867,163
GOVERNMENTAL ACTIVITIES CAPITAL ASSETS, NET
$ 64,284,037
$ 235,062
$ 1,066,643
$ 63,452,456
- 33 -

VILLAGE OF MOUNT PROSPECT, ILLINOIS
NOTES TO FINANCIAL STATEMENTS (Continued)
- 34 -
4. CAPITAL ASSETS (Continued)
Balances
January 1
Additions
Retirements
Balances
December 31
BUSINESS-TYPE ACTIVITIES
Capital assets not being depreciated
Land $ 17,551,172 $ - $ - $ 17,551,172
Construction in progress 418,164 726,529 198,216 946,477
Total capital assets not being
depreciated
17,969,336
726,529
198,216
18,497,649
Capital assets being depreciated
Buildings and improvements 4,875,816 - 376,008 4,499,808
Machinery and equipment 5,017,968 - - 5,017,968
Infrastructure 28,893,528 649,695 5,314 29,537,909
Total capital assets being
depreciated
38,787,312
649,695
381,322
39,055,685
Less accumulated depreciation for
Buildings and improvements 2,887,855 67,760 22,693 2,932,922
Machinery and equipment 3,190,989 152,641 - 3,343,630
Infrastructure 14,089,176 483,769 2,934 14,570,011
Total accumulated depreciation 20,168,020 704,170 25,627 20,846,563
Total capital assets being
depreciated, net
18,619,292
(54,475)
355,695
18,209,122
BUSINESS-TYPE ACTIVITIES
CAPITAL ASSETS, NET
$ 36,588,628
$ 672,054
$ 553,911
$ 36,706,771
Depreciation expense was charged to functions/programs of the governmental activities as
follows:
GOVERNMENTAL ACTIVITIES
General government $ 403,270
Public safety 384,790
Highways and streets 2,626,858
Health and welfare 2,349
Culture and recreation 7,240
Internal service funds 712,879
TOTAL $ 4,137,386
- 34 -

VILLAGE OF MOUNT PROSPECT, ILLINOIS
NOTES TO FINANCIAL STATEMENTS (Continued)
- 35 -
5. RISK MANAGEMENT The Village is exposed to various risks of loss related to torts; theft of, damage to, and
destruction of assets; errors and omissions; natural disasters; and injuries to the Village’s employees. These risks along with medical claims for employees and retirees are provided for through a limited self-insurance program. The Village is self-insured for the first $25,000 for property claims, $2,000,000 for liability claims, $2,000,000 for errors and omissions, and $650,000 for workers’ compensation claims. Commercial insurance is carried for amounts in excess of the self-insured amounts. There were no significant changes in insurance coverage from the prior year. For all programs, settlement amounts have not exceeded insurance coverage for the current or three prior years. The Village’s self-insurance activities are reported in the Risk Management Fund which is an internal service fund.
Premiums are paid into the Risk Management Fund by the departments of the General
Fund and other funds based upon historical cost estimates. Liabilities are reported when it is probable that a loss has occurred and the amount of the loss can be reasonably estimated. Reported liabilities are actuarially determined and include an amount for claims that have been incurred but not reported. The total claims liability as of December 31, 2017 was $1,539,670.
A reconciliation of claims liability for the current year and that of the preceding year
follows:
Auto
Workers’ Compensation
General Liability
Total
UNPAID CLAIMS, DECEMBER 31, 2015 $ 1,500 $ 770,868 $ 60,600 $ 832,968 Claims incurred - 2016 114,444 583,114 57,752 755,310 Claims payments - 2016 56,932 282,963 25,863 365,758
UNPAID CLAIMS, DECEMBER 31, 2016 59,012 1,071,019 92,489 1,222,520 Claims incurred - 2017 60,817 571,900 327,119 959,836 Claims payments - 2017 104,131 187,990 350,565 642,686
UNPAID CLAIMS, DECEMBER 31, 2017 $ 15,698 $ 1,454,929 $ 69,043 $ 1,539,670
a. High-Level Excess Liability Pool The Village participates in the High-Level Excess Liability Pool (HELP). HELP is a
public entity risk pool established by certain municipalities in Illinois to provide excess liability coverage ($13,000,000 of coverage after a $2,000,000 self-insurance retention). The Village’s payments to HELP are displayed on the financial statements as expenditures/expenses in appropriate funds.
- 35 -

VILLAGE OF MOUNT PROSPECT, ILLINOIS
NOTES TO FINANCIAL STATEMENTS (Continued)
- 36 -
5. RISK MANAGEMENT (Continued)
a. High-Level Excess Liability Pool (Continued)
HELP was organized on April 1, 1987 with the initial agreement extended to April 30,
2018. The purpose of HELP is to act as a joint self-insurance pool for the purpose of
seeking the prevention or lessening of liability claims for injuries to persons or property
or claims for errors and omissions made against the members and other parties
included within the scope of coverage of HELP.
HELP is governed by a Board of Directors which consists of one appointed
representative from each member municipality. Each director has an equal vote. The
officers of HELP are appointed by the Board of Directors. The Board of Directors
determines the general policy of HELP; makes all appropriations; approves contracts;
adopts resolutions providing for the issuance of debt by HELP; adopts bylaws, rules,
and regulations; and exercises such powers and performs such duties as may be
prescribed in the Agency Agreement or the by-laws.
The Village does not exercise any control over the activities of HELP beyond its
representation on the Board of Directors.
The Village of Elk Grove Village, Illinois (the initial Host Member) issued $5,000,000
of general obligation bonds in 1987 to provide initial funding for HELP. The bond
proceeds were put into escrow. An intergovernmental agreement among HELP, the
Village of Elk Grove Village, Illinois, and the members provided that HELP and its
members were obligated to the Village of Elk Grove Village, Illinois for payment of
principal and interest on the bonds until such bonds were retired. Additionally, each
member was liable for its proportionate share of any default by other members. The
obligations of HELP and its members are unconditional. The bonds were paid in full as
of April 30, 1997.
b. Intergovernmental Personnel Benefit Cooperative
The Village participates in the Intergovernmental Personnel Benefit Cooperative
(IPBC). IPBC is a public entity risk pool established by certain units of local
government in Illinois to administer some or all of the personnel benefit programs
(primarily medical, dental, and life insurance coverage) offered by these members to
their officers and employees and to the officers and employees of certain other
governmental, quasi governmental, and nonprofit public service entities. Management
consists of a Board of Directors comprised of one appointed representative from each
member. The officers of IPBC are chosen by the Board of Directors from among
their membership. The Village does not exercise any control over the activities of
IPBC beyond its representation on the Board of Directors.
- 36 -

VILLAGE OF MOUNT PROSPECT, ILLINOIS
NOTES TO FINANCIAL STATEMENTS (Continued)
- 37 -
5. RISK MANAGEMENT (Continued) b. Intergovernmental Personnel Benefit Cooperative (Continued) IPBC acts as an administrative agency to receive, process, and pay such claims as
may come within the benefit program of each member. IPBC maintains specific reinsurance coverage for claims in excess of $75,000 per individual employee participant. The Village pays premiums to IPBC based upon current employee participation and its prior experience factor with the pool. Current year overages and underages for the participation in the pool are adjusted into subsequent years experience factor for premiums. There were no significant changes in insurance coverages from the prior year and settlements did not exceed insurance coverage in any of the past three fiscal years.
6. LONG-TERM DEBT a. General Obligation Bonds The Village issues general obligation bonds to provide funds for the acquisition and
construction of major capital facilities. General obligation bonds are direct obligations and pledge the full faith and credit of the Village. Any general obligation bonds issued for proprietary funds are reported in the proprietary funds if they are expected to be repaid from proprietary revenues. General obligation bonds have been issued for general governmental activities and for the Library only. In addition, general obligation bonds have been issued to refund general obligation bonds.
On December 20, 2017, the Village issued General Obligation Bonds, Series 2017 in
the amount of $9,740,000. The proceeds were split into $4,815,000 used to fund activity in the new Prospect/Main TIF Fund and $4,925,000 to be used in the Water and Sewer Fund.
b. Installment Notes Payable The Village enters into installment notes payable to provide funds for acquisition of
capital assets. Installment notes payable have been issued for the governmental activities. Installment notes payable are direct obligations and pledge the full faith and credit of the Village.
- 37 -

VILLAGE OF MOUNT PROSPECT, ILLINOIS
NOTES TO FINANCIAL STATEMENTS (Continued)
- 38 -
6. LONG-TERM DEBT (Continued) c. Business District Limited Tax Note Payable The Village has issued a note payable related to a developer agreement. The limited
tax note payable has been issued for the governmental activities and is a limited obligation of the Village, payable solely from certain tax revenues as set forth in the developer agreement. The developer agreement term will expire upon the earlier to occur of (a) the expiration of the term of any bonds issued by the Village which yield developer proceeds equal to the maximum reimbursement amount, (b) the date which all obligations under this agreement have been discharged, including, but not limited to, payments on any bonds issued by the Village and on the note payable, or (c) 35 years following the issuance of the note payable. After a final accounting is completed and any remaining amounts are paid to the developer, the note payable shall be marked “cancelled” and returned to the Village.
d. Changes in Long-Term Liabilities
The following is a summary of changes in long-term debt for the year ended
December 31, 2017:
Debt
Retired by
Balances
January 1
Additions
Reductions
Balances
December 31
Current
Portion at
December 31
GOVERNMENTAL ACTIVITIES
$10,000,000 General Obligation Bonds,
Series 2009, due in annual installments
of $200,000 to $1,955,000, plus interest
at 3.005% to 4.500% through
December 1, 2028.
Debt
Service
$ 600,000
$ -
$ -
$ 600,000
$ -
$3,430,000 General Obligation
Refunding Bonds, Series 2009B, due in
annual installments of $230,000 to
$370,000, plus interest at 2.50% to
3.75% through December 1, 2021.
Debt
Service
1,720,000
-
320,000
1,400,000
330,000
$2,650,000 Taxable General Obligation
Bonds, Series 2009C, due in annual
installments of $25,000 to $1,000,000,
plus interest at 3.00% to 5.75% through
December 1, 2029.
Debt
Service
2,530,000
-
75,000
2,455,000
95,000
- 38 -

VILLAGE OF MOUNT PROSPECT, ILLINOIS
NOTES TO FINANCIAL STATEMENTS (Continued)
- 39 -
6. LONG-TERM DEBT (Continued)
d. Changes in Long-Term Liabilities (Continued)
Debt
Retired by
Balances
January 1
Additions
Reductions
Balances
December 31
Current
Portion at
December 31
GOVERNMENTAL ACTIVITIES
(Continued)
$5,160,000 General Obligation Bonds,
Series 2011B, due in annual installments
from $40,000 to $775,000, plus interest
at 2.52% through December 1, 2020.
Debt
Service
$ 2,980,000
$ -
$ 715,000
$ 2,265,000
$ 735,000
$2,975,000 General Obligation Bonds,
Series 2012C, due in annual installments
from $610,000 to $865,000, plus
interest at 3.10% through December 1,
2022.
Debt
Service
1,745,000
-
-
1,745,000
-
$9,800,000 General Obligation Bonds,
Series 2013, due in annual installments
of $555,000 to $885,000, plus interest at
3.000% to 4.125% through December 1,
2033.
Debt
Service
9,800,000
-
-
9,800,000
-
$6,290,000 General Obligation Bonds,
Series 2014, due in annual installments
of $290,000 to $1,265,000, plus interest
at 3% through December 1, 2023.
Debt
Service
5,385,000
-
305,000
5,080,000
405,000
$8,735,000 General Obligation Bonds,
Series 2016, due in annual installments
of $1,375,000 to $1,550,000, plus
interest at 2% to 3% through
December 1, 2022.
Debt
Service
8,735,000
-
1,375,000
7,360,000
1,400,000
$9,100,000 General Obligation Bonds,
Series 2016A, due in annual installments
of $120,000 to $1,905,000, plus interest
at 3% through December 1, 2028.
Debt
Service
9,100,000
-
120,000
8,980,000
120,000
$4,815,000 General Obligation Bonds,
Series 2017, due in annual installments
of $140,000 to $460,000, plus interest at
2.50% to 4.00% through December 1,
2037.
Debt
Service
-
4,815,000
-
4,815,000
-
Total bonds 42,595,000 4,815,000 2,910,000 44,500,000 3,085,000
- 39 -

VILLAGE OF MOUNT PROSPECT, ILLINOIS
NOTES TO FINANCIAL STATEMENTS (Continued)
- 40 -
6. LONG-TERM DEBT (Continued)
d. Changes in Long-Term Liabilities (Continued)
Debt
Retired by
Balances
January 1
Additions
Reductions
Balances
December 31
Current
Portion at
December 31
GOVERNMENTAL ACTIVITIES
(Continued)
$1,203,550 IEPA Flood Loan Contract
Payable of 1997 (L17-0855), due in
semiannual installments of $62,285 to
$79,035, plus interest at 2.89% through
November 1, 2017.
Debt
Service
$ 79,035
$ -
$ 79,035
$ -
$ -
$1,760,422 IEPA Flood Loan Contract
Payable of 1999 (L17-1087), due in
semiannual installments of $57,498 to
$112,771, plus interest at 2.625%
through June 3, 2019.
Debt
Service
280,140
-
109,869
170,271
112,771
Total IEPA flood loan
installment notes payable
359,175
-
188,904
170,271
112,771
$2,500,000 installment note payable of
2012, due in annual installments of
$25,000 to $590,000, plus interest at
0.91% through December 1, 2019.
Debt
Service
1,525,000
-
420,000
1,105,000
515,000
Total installment notes payable 1,525,000 - 420,000 1,105,000 515,000
$25,000,000 Business District limited
tax note payable of 2010, interest at
6.71% due in semiannual installments
contingent upon sufficient pledged
revenues.
Business
District
31,767,253
758,020
-
32,525,273
-
Total Business District limited
tax note payable
31,767,253
-
-
32,525,273
-
TOTAL GOVERNMENTAL
ACTIVITIES
$ 76,246,428
$ 5,573,020
$ 3,518,904
$ 78,300,544
$ 3,712,771
BUSINESS-TYPE ACTIVITIES
$4,925,000 General Obligation Bonds,
Series 2017, due in annual installments
of $125,000 to $405,000, plus interest
at 2.50% to 4.00% through December 1,
2037.
Water
$ -
$ 4,925,000
$ -
$ 4,925,000
$ 125,000
TOTAL BUSINESS-TYPE
ACTIVITIES
$ -
$ 4,925,000
$ -
$ 4,925,000
$ 125,000
- 40 -

VILLAGE OF MOUNT PROSPECT, ILLINOIS
NOTES TO FINANCIAL STATEMENTS (Continued)
- 41 -
6. LONG-TERM DEBT (Continued)
d. Changes in Long-Term Liabilities (Continued)
The following is a summary of changes in long-term liabilities during 2017:
Debt
Retired by
Balances
January 1, as
Restated
Additions
Reductions
Balances
December 31
Current
Portion at
December 31
GOVERNMENTAL ACTIVITIES
Compensated absences General $ 3,410,968 $ 1,013,041 $ 652,183 $ 3,771,826 $ 749,634
Claims and judgments Internal
Service
1,222,520
959,835
642,685
1,539,670
1,349,957
Net other postemployment benefit
obligation
General
1,483,201
548,330
-
2,031,531
-
General obligation bonds Debt Service 42,595,000 4,815,000 2,910,000 44,500,000 3,085,000
Unamortized bond premium 1,310,073 115,836 141,066 1,284,843 -
Loan contracts payable Debt Service 359,175 - 188,904 170,271 112,771
Installment notes payable Debt Service 1,525,000 - 420,000 1,105,000 515,000
Net pension liability - IMRF General 6,961,499 - 671,957 6,289,542 -
Net pension liability -
Police Pension
General
48,348,979
-
5,252,030
43,096,949
-
Net pension liability -
Firefighters’ Pension
General
42,652,737
-
3,795,592
38,857,145
-
Business District limited tax
note payable
Business
District
31,767,253
758,020
-
32,525,273
-
Total governmental activities 181,636,405 8,210,062 14,674,417 175,172,050 5,812,362
BUSINESS-TYPE ACTIVITIES
General obligation bonds Water - 4,925,000 - 4,925,000 125,000
Unamortized bond premium - 138,964 - 138,964 -
Compensated absences* 243,417 44,523 48,683 239,257 47,851
Net pension liability - IMRF** 1,629,419 - 157,279 1,472,140 -
Net other postemployment
benefit obligation*
86,158
14,111
-
100,269
-
Total business-type activities 1,958,994 5,122,598 205,962 6,875,630 172,851
TOTAL $ 183,595,399 $ 13,332,660 $ 14,880,379 $ 182,047,680 $ 5,985,213
Compensated absences, net pension liabilities, and the net other postemployment
benefit obligation of the governmental activities are primarily liquidated by the
General Fund.
*Compensated absences, net pension liabilities, and the net other postemployment
benefit obligation are retired by the Water and Sewer, Parking System Revenue, and
Village Parking System Funds.
**The IMRF net pension liability is retired by the Water and Sewer Fund.
- 41 -

VILLAGE OF MOUNT PROSPECT, ILLINOIS
NOTES TO FINANCIAL STATEMENTS (Continued)
- 42 -
6. LONG-TERM DEBT (Continued)
e. Debt Service Requirements to Maturity
Annual debt service requirements to maturity are as follows:
Year Governmental Activities
Ending General Obligation Bonds Loan Contracts Payable Installment Notes Payable
December 31, Principal Interest Principal Interest Principal Interest
2018 $ 3,085,000 $ 1,433,368 $ 112,771 $ 3,735 $ 515,000 $ 10,056
2019 3,200,000 1,363,682 57,500 754 590,000 5,369
2020 4,060,000 1,267,076 - - - -
2021 4,580,000 1,143,916 - - - -
2022 4,800,000 1,013,911 - - - -
2023 2,995,000 873,475 - - - -
2024 2,470,000 773,125 - - - -
2025 2,590,000 684,925 - - - -
2026 2,690,000 598,725 - - - -
2027 2,780,000 511,275 - - - -
2028 2,890,000 422,050 - - - -
2029 2,030,000 329,007 - - - -
2030 1,080,000 233,682 - - - -
2031 1,130,000 193,745 - - - -
2032 1,185,000 148,545 - - - -
2033 1,245,000 101,145 - - - -
2034 385,000 53,388 - - - -
2035 410,000 41,356 - - - -
2036 435,000 28,544 - - - -
2037 460,000 14,950 - - - -
TOTAL $ 44,500,000 $ 11,229,890 $ 170,271 $ 4,489 $ 1,105,000 $ 15,425
The repayment of the business district limited tax note payable is based on
incremental tax revenue received. As such, there is no debt service to maturity
schedule.
- 42 -

VILLAGE OF MOUNT PROSPECT, ILLINOIS
NOTES TO FINANCIAL STATEMENTS (Continued)
- 43 -
6. LONG-TERM DEBT (Continued)
e. Debt Service Requirements to Maturity (Continued)
Year Business-Type Activities
Ending General Obligation Bonds
December 31, Principal Interest
2018 $ 125,000 $ 157,363
2019 125,000 161,131
2020 140,000 156,131
2021 150,000 150,531
2022 160,000 144,531
2023 175,000 138,131
2024 190,000 131,131
2025 205,000 123,531
2026 220,000 115,331
2027 230,000 108,731
2028 245,000 102,981
2029 260,000 96,550
2030 275,000 89,400
2031 290,000 81,494
2032 305,000 69,894
2033 330,000 57,694
2034 345,000 47,381
2035 365,000 36,600
2036 385,000 25,194
2037 405,000 13,163
TOTAL $ 4,925,000 $ 2,006,893
f. Legal Debt Margin
The Village is a home rule municipality. Article VII, Section 6(k) of the 1970 Illinois
Constitution governs computation of the legal debt margin.
“The General Assembly may limit by law the amount and require referendum
approval of debt to be incurred by home rule municipalities, payable from ad
valorem property tax receipts, only in excess of the following percentages of the
assessed value of its taxable property . . . (2) if its population is more than 25,000
and less than 500,000 an aggregate of one percent: . . . indebtedness which is
outstanding on the effective date (July 1, 1971) of this constitution or which is
thereafter approved by referendum . . . shall not be included in the foregoing
percentage amounts.”
To date the General Assembly has set no limits for home rule municipalities.
- 43 -
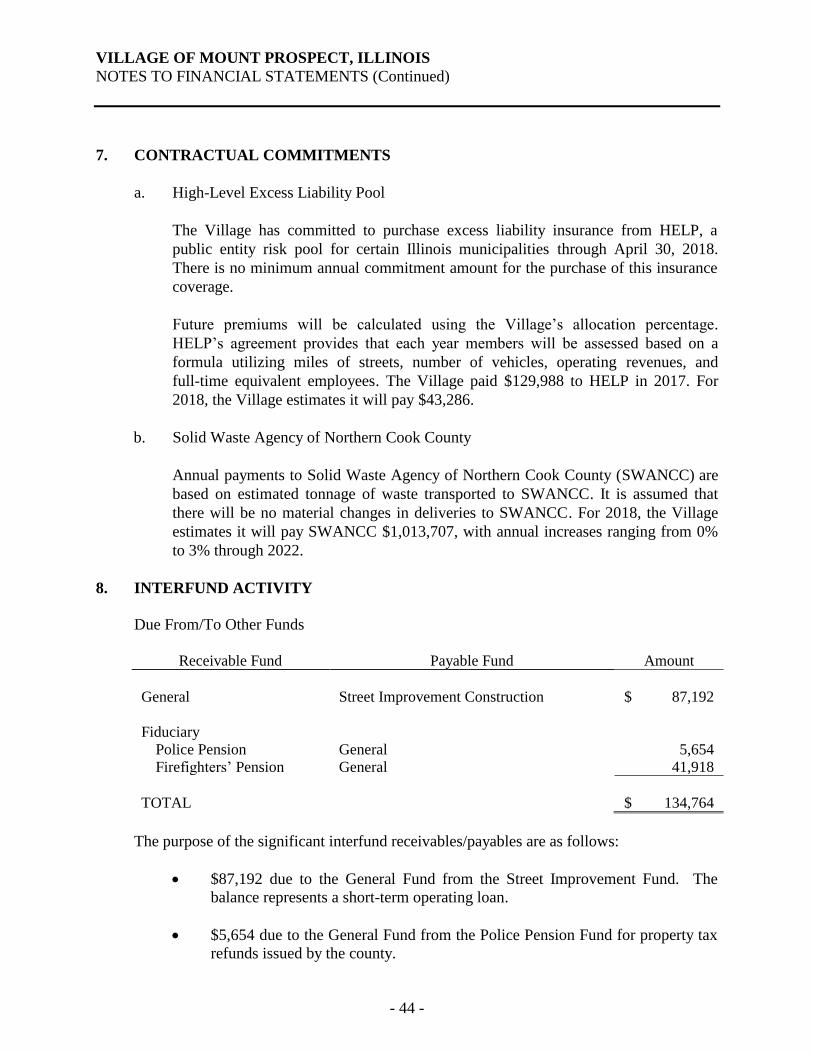
VILLAGE OF MOUNT PROSPECT, ILLINOIS
NOTES TO FINANCIAL STATEMENTS (Continued)
- 44 -
7. CONTRACTUAL COMMITMENTS
a. High-Level Excess Liability Pool
The Village has committed to purchase excess liability insurance from HELP, a
public entity risk pool for certain Illinois municipalities through April 30, 2018.
There is no minimum annual commitment amount for the purchase of this insurance
coverage.
Future premiums will be calculated using the Village’s allocation percentage.
HELP’s agreement provides that each year members will be assessed based on a
formula utilizing miles of streets, number of vehicles, operating revenues, and
full-time equivalent employees. The Village paid $129,988 to HELP in 2017. For
2018, the Village estimates it will pay $43,286.
b. Solid Waste Agency of Northern Cook County
Annual payments to Solid Waste Agency of Northern Cook County (SWANCC) are
based on estimated tonnage of waste transported to SWANCC. It is assumed that
there will be no material changes in deliveries to SWANCC. For 2018, the Village
estimates it will pay SWANCC $1,013,707, with annual increases ranging from 0%
to 3% through 2022.
8. INTERFUND ACTIVITY
Due From/To Other Funds
Receivable Fund Payable Fund Amount
General Street Improvement Construction $ 87,192
Fiduciary
Police Pension General 5,654
Firefighters’ Pension General 41,918
TOTAL $ 134,764
The purpose of the significant interfund receivables/payables are as follows:
• $87,192 due to the General Fund from the Street Improvement Fund. The
balance represents a short-term operating loan.
• $5,654 due to the General Fund from the Police Pension Fund for property tax
refunds issued by the county.
- 44 -
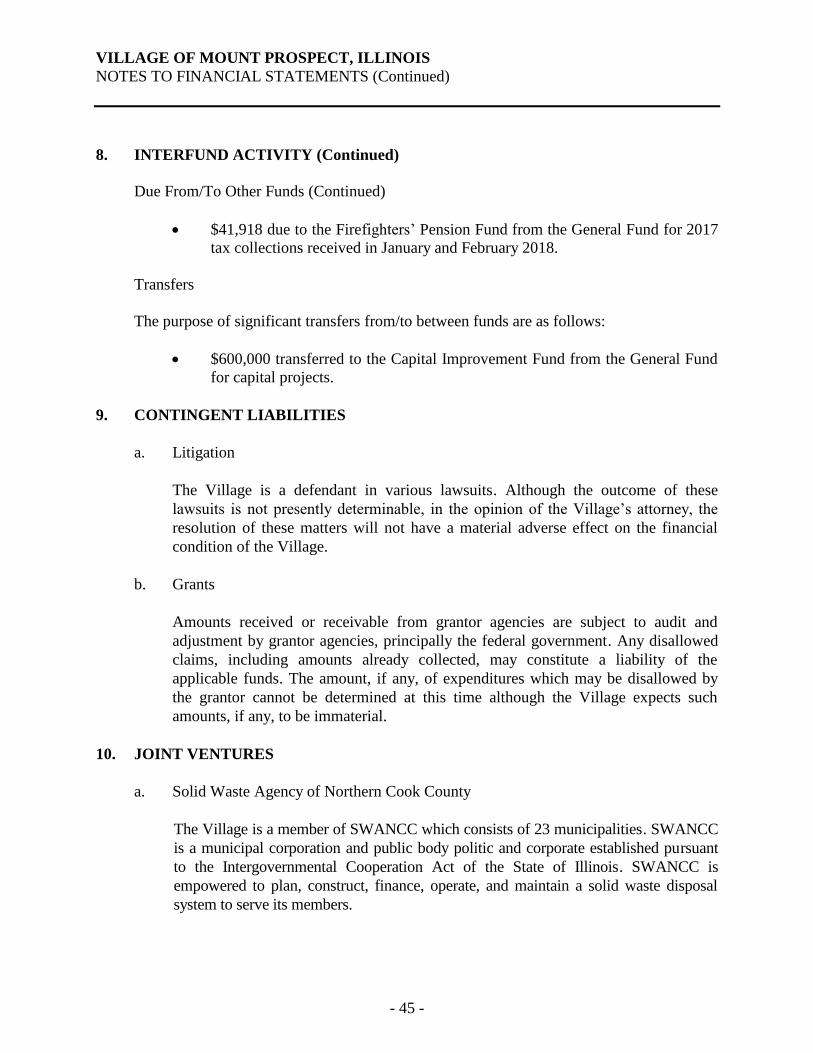
VILLAGE OF MOUNT PROSPECT, ILLINOIS
NOTES TO FINANCIAL STATEMENTS (Continued)
- 45 -
8. INTERFUND ACTIVITY (Continued)
Due From/To Other Funds (Continued)
• $41,918 due to the Firefighters’ Pension Fund from the General Fund for 2017
tax collections received in January and February 2018.
Transfers
The purpose of significant transfers from/to between funds are as follows:
• $600,000 transferred to the Capital Improvement Fund from the General Fund
for capital projects.
9. CONTINGENT LIABILITIES
a. Litigation
The Village is a defendant in various lawsuits. Although the outcome of these
lawsuits is not presently determinable, in the opinion of the Village’s attorney, the
resolution of these matters will not have a material adverse effect on the financial
condition of the Village.
b. Grants
Amounts received or receivable from grantor agencies are subject to audit and
adjustment by grantor agencies, principally the federal government. Any disallowed
claims, including amounts already collected, may constitute a liability of the
applicable funds. The amount, if any, of expenditures which may be disallowed by
the grantor cannot be determined at this time although the Village expects such
amounts, if any, to be immaterial.
10. JOINT VENTURES
a. Solid Waste Agency of Northern Cook County
The Village is a member of SWANCC which consists of 23 municipalities. SWANCC
is a municipal corporation and public body politic and corporate established pursuant
to the Intergovernmental Cooperation Act of the State of Illinois. SWANCC is
empowered to plan, construct, finance, operate, and maintain a solid waste disposal
system to serve its members.
- 45 -

VILLAGE OF MOUNT PROSPECT, ILLINOIS
NOTES TO FINANCIAL STATEMENTS (Continued)
- 46 -
10. JOINT VENTURES (Continued)
a. Solid Waste Agency of Northern Cook County (Continued)
SWANCC is governed by a board of directors which consists of the mayor or president
from each member municipality. Each director has an equal vote. The officers of
SWANCC are appointed by the Board of Directors. The Board of Directors determines
the general policy of SWANCC, makes all appropriations, approves contracts, provides
for the issuance of debt, adopts by-laws, rules and regulations, and exercises such
powers and performs such duties as may be prescribed in the agency agreement or the
by-laws.
Complete financial statements can be obtained from the Solid Waste Agency of
Northern Cook County administrative office at 77 West Hintz Road, Suite 200,
Wheeling, Illinois 60090 or online at www.swancc.org.
SWANCC’s outstanding bonds are revenue obligations. They are limited obligations of
SWANCC with a claim for payment solely from and secured by a pledge of the
revenues of the system and amounts in various funds and accounts established by
SWANCC resolutions. The bonds are not the debt of any member. SWANCC has no
power to levy taxes. Revenues of the system consist of (1) all receipts derived from solid waste disposal
contracts or any other contracts for the disposal of waste; (2) all income derived from the investment of monies; and (3) all income, fees, service charges, and all grants, rents, and receipts derived by SWANCC from the ownership and operation of the system. SWANCC covenants to establish fees and charges sufficient to provide revenues to meet all its requirements.
SWANCC has entered into solid waste disposal contracts with the member
municipalities. The contracts are irrevocable and may not be terminated or amended except as provided for in the contract. Each member is obligated, on a “take or pay” basis, to deliver a minimum amount of solid waste to the system. The obligation of the Village to make all payments as required by this contract is unconditional and irrevocable, without regard to performance or nonperformance by SWANCC of its obligations under the contract. The contract does not constitute an indebtedness of the Village within the meaning of any statutory or constitutional limitation.
In accordance with the contract, the Village made payments totaling $904,291 to
SWANCC in 2017. The payments have been recorded in the Refuse Disposal Fund. The Village does not have an equity interest in SWANCC at December 31, 2017.
- 46 -

VILLAGE OF MOUNT PROSPECT, ILLINOIS
NOTES TO FINANCIAL STATEMENTS (Continued)
- 47 -
10. JOINT VENTURES (Continued) b. Northwest Suburban Municipal Joint Action Water Agency Description of Joint Venture The Village is a member of Northwest Suburban Municipal Joint Action Water
Agency (JAWA) which consists of seven municipalities. JAWA is a municipal corporation and public body politic and corporate established pursuant to the Intergovernmental Cooperation Act of the State of Illinois. JAWA is empowered to plan, construct, improve, extend, acquire, finance, operate, and maintain a water supply system to serve its members and other potential water purchasers.
The seven members of JAWA and their percentage shares as of April 30, 2017 are as
follows:
Percent Share
Village of Elk Grove Village 17.66% Village of Hanover Park 8.79% Village of Hoffman Estates 16.19% Village of Mount Prospect 12.12% City of Rolling Meadows 7.42% Village of Schaumburg 27.12% Village of Streamwood 10.70%
TOTAL 100.00%
These percentage shares are based upon formulae contained in the water supply
agreement and are subject to change in future years based upon consumption by the
municipalities.
The members form a contiguous geographic service area which is located 15 to 30
miles northwest of downtown Chicago. Under the Agency Agreement, additional
members may join JAWA upon the approval of each member.
JAWA is governed by a Board of Directors which consist of one elected official from
each member municipality. Each director has an equal vote. The officers of JAWA are
appointed by the Board of Directors. The Board of Directors determines the general
policy of JAWA, makes all appropriations, approves contracts for sale or purchase of
water, provides for the issuance of debt, adopts by-laws, rules and regulations, and
exercises such powers and performs such duties as may be prescribed in the agency
agreement or the by-laws.
- 47 -

VILLAGE OF MOUNT PROSPECT, ILLINOIS
NOTES TO FINANCIAL STATEMENTS (Continued)
- 48 -
10. JOINT VENTURES (Continued)
b. Northwest Suburban Municipal Joint Action Water Agency (Continued)
Description of Joint Venture (Continued)
Complete financial statements can be obtained from the Northwest Suburban
Municipal Joint Action Water Agency, 901 Wellington Avenue, Elk Grove Village,
Illinois 60007.
Revenues of the system consist of: (a) all receipts derived from Water Supply
Agreements or any other contract for the supply of water; (b) all income derived from
the investment of monies; and (c) all income, fees, water service charges, and all
rates, rents, and receipts derived by JAWA from the ownership and operation of the
system and the sale of water. JAWA covenants to establish fees and charges
sufficient to provide revenues to meet all its requirements.
JAWA has entered into water supply agreements with the seven-member
municipalities for a term of 40 years, extending to 2022. The agreements are
irrevocable and may not be terminated or amended except as provided for in the
General Resolution. Each member is obligated, on a “take or pay” basis, to purchase or
in any event to pay for a minimum annual quantity of water.
JAWA has entered into an agreement with the City of Chicago (the City) under which
the City has agreed to sell quantities of Lake Michigan water sufficient to meet the
projected water needs of the members through the year 2020.
The obligation of the Village to make all payments as required by this agreement is
unconditional and irrevocable, without regard to performance or nonperformance by
JAWA of its obligations under this agreement.
The payments required to be made by the Village under this agreement shall be
required to be made solely from revenues to be derived by the Village from the operation of the Water and Sewer System. Members are not prohibited by the agreement; however, from using other available funds to make payments under the agreement. This agreement shall not constitute an indebtedness of the Village within the meaning of any statutory or constitutional limitation.
The obligation of the Village to make payments required by this agreement is payable from the Village’s Water and Sewer Fund.
In accordance with the joint venture agreement, the Village remitted $6,541,119 to JAWA for 2017. Deposits with JAWA in the amount of $953,442 represent amounts held for security for debt service.
- 48 -

VILLAGE OF MOUNT PROSPECT, ILLINOIS
NOTES TO FINANCIAL STATEMENTS (Continued)
- 49 -
11. OTHER POSTEMPLOYMENT BENEFITS
a. Plan Description
In addition to providing the pension benefits described, the Village provides postemployment health care benefits (OPEB) for retired employees through a single-employer defined benefit plan (the Plan). The benefits, benefit levels, employee contributions, and employer contributions are governed by the Village and can be amended by the Village through its personnel manual and union contracts. Certain benefits are controlled by state laws and can only be changed by the Illinois Legislature. The Plan is not accounted for as a trust fund, as an irrevocable trust has not been established to account for the Plan. The Plan does not issue a separate report. The activity of the Plan is reported in the Village’s governmental and business-type activities.
b. Benefits Provided
The Village provides pre and post-Medicare postretirement health insurance to
retirees, their spouses, and dependents (enrolled at time of employee’s retirement).
To be eligible for benefits, the employee must qualify for retirement under one of the
Village’s three retirement plans. The retirees pay the blended premium. Upon a
retiree becoming eligible for Medicare, the amount payable under the Village’s
health plan will be reduced by the amount payable under Medicare for those
expenses that are covered under both. All healthcare benefits are provided through
the Village’s health insurance plan. The benefit levels are the same as those afforded
to active employees. Benefits include general inpatient and outpatient medical
services; mental, nervous, and substance abuse care; and prescriptions. Upon a retiree
reaching 65 years of age, Medicare becomes the primary insurer and the Village’s
plan becomes secondary.
All retirees contribute 100% of the actuarially determined premium to the Plan. For
the fiscal year ended December 31, 2017, retirees contributed $753,141.
c. Membership
At December 31, 2017 membership consisted of:
Retirees and beneficiaries currently receiving
benefits and terminated employees entitled to
benefits but not yet receiving them
80
Active employees 294
TOTAL 374
Participating employers 1
- 49 -

VILLAGE OF MOUNT PROSPECT, ILLINOIS
NOTES TO FINANCIAL STATEMENTS (Continued)
- 50 -
11. OTHER POSTEMPLOYMENT BENEFITS (Continued)
d. Funding Policy
The Village is not required to and currently does not advance fund the cost of
benefits that will become due and payable in the future. Active employees do not
contribute to the Plan until retirement.
e. Annual OPEB Costs and Net OPEB Obligation
The Village’s annual OPEB cost, the percentage of annual OPEB cost contributed to
the Plan, and the net OPEB obligation for 2017 and the two preceding years was as
follows:
Fiscal
Year
Ended
Annual
OPEB
Cost
Employer
Contributions
Percentage of
Annual OPEB
Cost Contributed
Net OPEB
Obligation
2015 $ 682,426 $ 362,130 53.07% $ 1,243,267
2016 688,222 362,130 52.62% 1,569,359
2017 917,839 355,398 38.72% 2,131,800
The net OPEB obligation as of December 31, 2017 was calculated as follows:
Annual required contribution $ 913,356
Interest on net OPEB obligation 54,928
Adjustment to annual required contribution (50,445)
Annual OPEB cost 917,839
Contributions made (355,398)
Increase in net OPEB obligation 562,441
Net OPEB obligation, beginning of year 1,569,359
NET OPEB OBLIGATION, END OF YEAR $ 2,131,800
Funded Status and Funding Progress: The funded status and funding progress of the
Plan as of December 31, 2017 was as follows:
Actuarial accrued liability (AAL) $ 12,560,127
Actuarial value of plan assets -
Unfunded actuarial accrued liability (UAAL) 12,560,127
Funded ratio (actuarial value of plan assets/AAL) 0.00%
Covered payroll (active plan members) $ 25,199,376
UAAL as a percentage of covered payroll 49.84%
- 50 -

VILLAGE OF MOUNT PROSPECT, ILLINOIS
NOTES TO FINANCIAL STATEMENTS (Continued)
- 51 -
11. OTHER POSTEMPLOYMENT BENEFITS (Continued) e. Annual OPEB Costs and Net OPEB Obligation (Continued)
Actuarial valuations of an ongoing plan involve estimates of the value of reported amounts and assumptions about the probability of occurrence of events far into the future. Examples include assumptions about future employment, mortality, and the healthcare cost trend rate. Amounts determined regarding the funded status of the Plan and the annual required contributions of the employer are subject to continual revision as actual results are compared with past expectations and new estimates are made about the future. The schedule of funding progress, presented as required supplementary information following the notes to financial statements, presents multi-year trend information that shows whether the actuarial value of plan assets is increasing or decreasing over time relative to the actuarial accrued liabilities for benefits.
Actuarial methods and assumptions - projections of benefits for financial reporting
purposes are based on the substantive plan (the Plan as understood by the employer and plan members) and include the types of benefits provided at the time of each valuation and the historical pattern of sharing of benefit costs between the employer and plan members to that point. The actuarial methods and assumptions used include techniques that are designed to reduce short-term volatility in actuarial accrued liabilities and the actuarial value of assets, consistent with the long-term perspective of the calculations.
In the December 31, 2017 actuarial valuation (latest information available), the
entry-age normal actuarial cost method was used. The actuarial assumptions included a 3.50% investment rate of return and an initial healthcare cost trend rate of 9.00% with an ultimate healthcare inflation rate of 5.00%. Both rates include a 3.00% inflation assumption and 4.00% wage inflation assumption. The actuarial value of assets was not determined as the Village has not advance funded its obligation. The Plan’s unfunded actuarial accrued liability is being amortized as a level percentage of projected payroll on an open basis. The remaining amortization period at December 1, 2017 was 30 years.
12. EMPLOYEE RETIREMENT SYSTEMS The Village contributes to three defined benefit pension plans, the Illinois Municipal
Retirement Fund (IMRF), an agent multiple-employer public employee retirement system; the Police Pension Plan which is a single-employer pension plan; and the Firefighters’ Pension Plan which is also a single-employer pension plan. The benefits, benefit levels, employee contributions, and employer contributions for all three plans are governed by ILCS and can only be amended by the Illinois General Assembly. None of the pension plans issue separate reports on the pension plans. However, IMRF does issue a publicly available report that includes financial statements and supplementary information for the plan as a whole, but not for individual employers. That report can be obtained from IMRF, 2211 York Road, Suite 500, Oak Brook, Illinois 60523 or at imrf.org.
- 51 -

VILLAGE OF MOUNT PROSPECT, ILLINOIS
NOTES TO FINANCIAL STATEMENTS (Continued)
- 52 -
12. EMPLOYEE RETIREMENT SYSTEMS (Continued)
a. Plan Descriptions
Illinois Municipal Retirement Fund
All employees (other than those covered by the Police Pension Plan or Firefighters’
Pension Plan) hired in positions that meet or exceed the prescribed annual hourly
standard must be enrolled in IMRF as participating members. For financial reporting
purposes, the Village and Library participate in IMRF as a cost-sharing multiple-
employer pension plan. IMRF provides two tiers of pension benefits. Employees
hired prior to January 1, 2011, are eligible for Tier 1 benefits. For Tier 1 employees,
pension benefits vest after eight years of service. Participating members who retire at
age 55 (reduced benefits) or after age 60 (full benefits) with eight years of credited
service are entitled to an annual retirement benefit, payable monthly for life, in an
amount equal to 1 2/3% of their final rate of earnings, for each year of credited
service up to 15 years, and 2% for each year thereafter.
Employees hired on or after January 1, 2011, are eligible for Tier 2 benefits. For
Tier 2 employees, pension benefits vest after ten years of service. Participating
members who retire at age 62 (reduced benefits) or after age 67 (full benefits) with
ten years of credited service are entitled to an annual retirement benefit, payable
monthly for life, in an amount equal to 1 2/3% of their final rate of earnings, for each
year of credited service up to 15 years, and 2% for each year thereafter.
Participating members are required to contribute 4.50% of their annual salary to
IMRF. The Village is required to contribute the remaining amounts necessary to fund
IMRF as specified by statute. The employer required contribution rate for calendar
year 2017 was 11.53%.
Plan Membership
At December 31, 2016, IMRF membership consisted of:
Inactive plan members currently receiving benefits 232
Inactive plan members entitled to but not yet receiving benefits 162
Active plan members 254
TOTAL 648
The IMRF data included in the table above includes membership of both the Village
and the Library.
- 52 -
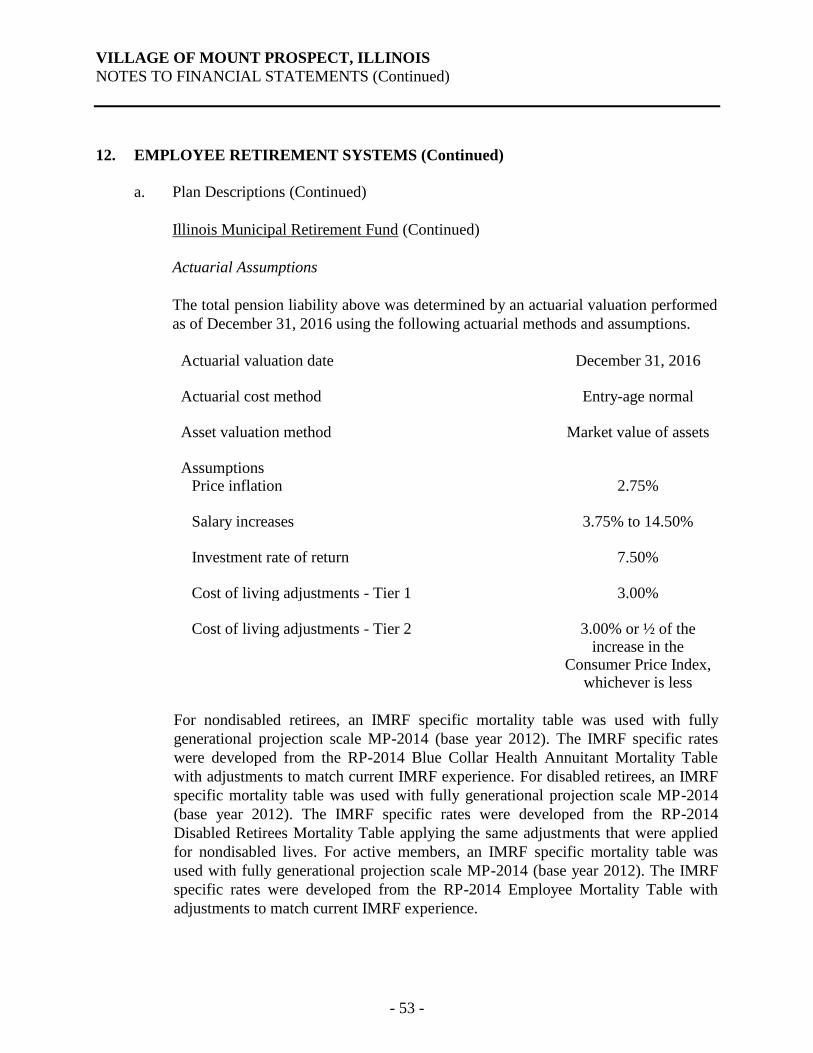
VILLAGE OF MOUNT PROSPECT, ILLINOIS
NOTES TO FINANCIAL STATEMENTS (Continued)
- 53 -
12. EMPLOYEE RETIREMENT SYSTEMS (Continued)
a. Plan Descriptions (Continued)
Illinois Municipal Retirement Fund (Continued)
Actuarial Assumptions
The total pension liability above was determined by an actuarial valuation performed
as of December 31, 2016 using the following actuarial methods and assumptions.
Actuarial valuation date December 31, 2016 Actuarial cost method Entry-age normal Asset valuation method Market value of assets Assumptions Price inflation 2.75% Salary increases 3.75% to 14.50% Investment rate of return 7.50% Cost of living adjustments - Tier 1 3.00% Cost of living adjustments - Tier 2 3.00% or ½ of the
increase in the Consumer Price Index,
whichever is less
For nondisabled retirees, an IMRF specific mortality table was used with fully
generational projection scale MP-2014 (base year 2012). The IMRF specific rates
were developed from the RP-2014 Blue Collar Health Annuitant Mortality Table
with adjustments to match current IMRF experience. For disabled retirees, an IMRF
specific mortality table was used with fully generational projection scale MP-2014
(base year 2012). The IMRF specific rates were developed from the RP-2014
Disabled Retirees Mortality Table applying the same adjustments that were applied
for nondisabled lives. For active members, an IMRF specific mortality table was
used with fully generational projection scale MP-2014 (base year 2012). The IMRF
specific rates were developed from the RP-2014 Employee Mortality Table with
adjustments to match current IMRF experience.
- 53 -
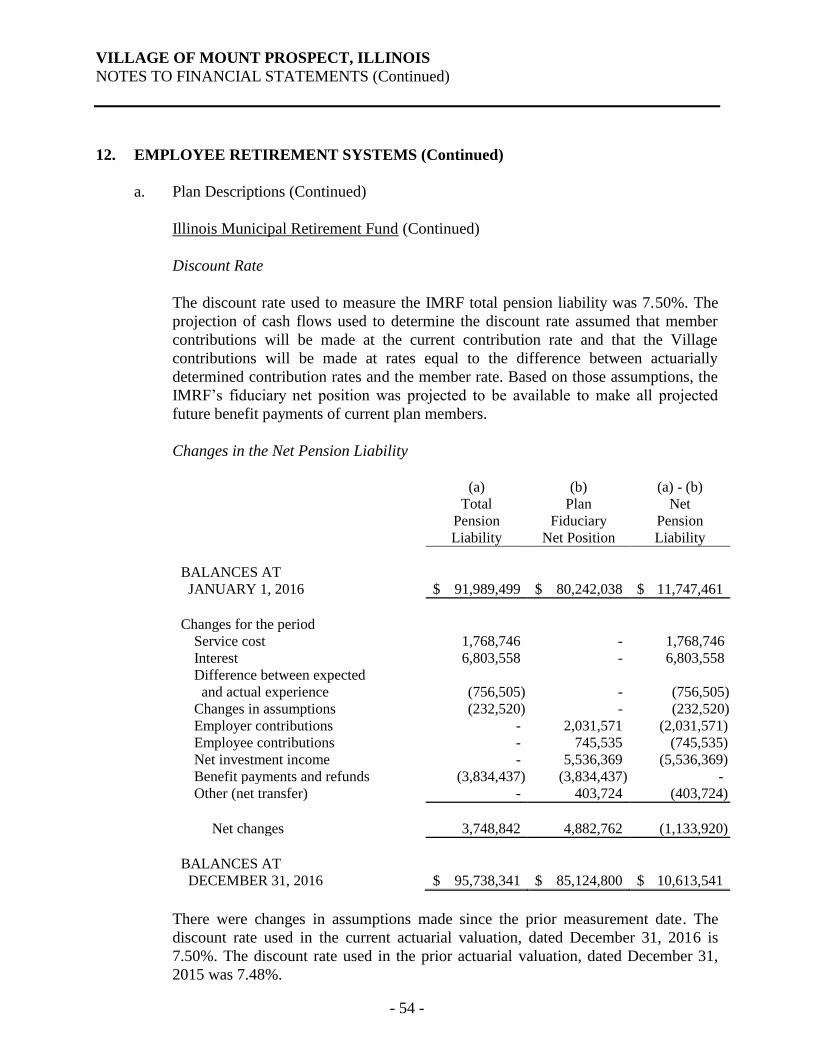
VILLAGE OF MOUNT PROSPECT, ILLINOIS
NOTES TO FINANCIAL STATEMENTS (Continued)
- 54 -
12. EMPLOYEE RETIREMENT SYSTEMS (Continued)
a. Plan Descriptions (Continued)
Illinois Municipal Retirement Fund (Continued)
Discount Rate
The discount rate used to measure the IMRF total pension liability was 7.50%. The
projection of cash flows used to determine the discount rate assumed that member
contributions will be made at the current contribution rate and that the Village
contributions will be made at rates equal to the difference between actuarially
determined contribution rates and the member rate. Based on those assumptions, the
IMRF’s fiduciary net position was projected to be available to make all projected
future benefit payments of current plan members.
Changes in the Net Pension Liability
(a)
Total
Pension
Liability
(b)
Plan
Fiduciary
Net Position
(a) - (b)
Net
Pension
Liability
BALANCES AT
JANUARY 1, 2016
$ 91,989,499
$ 80,242,038
$ 11,747,461
Changes for the period
Service cost 1,768,746 - 1,768,746
Interest 6,803,558 - 6,803,558
Difference between expected
and actual experience (756,505) - (756,505)
Changes in assumptions (232,520) - (232,520)
Employer contributions - 2,031,571 (2,031,571)
Employee contributions - 745,535 (745,535)
Net investment income - 5,536,369 (5,536,369)
Benefit payments and refunds (3,834,437) (3,834,437) -
Other (net transfer) - 403,724 (403,724)
Net changes 3,748,842 4,882,762 (1,133,920)
BALANCES AT
DECEMBER 31, 2016
$ 95,738,341
$ 85,124,800
$ 10,613,541
There were changes in assumptions made since the prior measurement date. The
discount rate used in the current actuarial valuation, dated December 31, 2016 is
7.50%. The discount rate used in the prior actuarial valuation, dated December 31,
2015 was 7.48%.
- 54 -

VILLAGE OF MOUNT PROSPECT, ILLINOIS
NOTES TO FINANCIAL STATEMENTS (Continued)
- 55 -
12. EMPLOYEE RETIREMENT SYSTEMS (Continued)
a. Plan Descriptions (Continued)
Illinois Municipal Retirement Fund (Continued)
Changes in the Net Pension Liability (Continued)
The table presented on the previous page includes amounts for both the Village and
the Library. The Village’s collective shares of the net pension liability at January 1,
2016, the employer contributions, and the net pension liability at December 31, 2016
were $8,590,918, $1,453,487, and $7,761,683, respectively. The Library’s collective
shares of the net pension liability at January 1, 2016, the employer contributions, and
the net pension liability at December 31, 2016 were $3,156,543, $534,295, and
$2,851,858, respectively.
Pension Expense and Deferred Outflows of Resources and Deferred Inflows of
Resources
For the year ended December 31, 2017, the Village recognized pension expense of
$2,615,497.
At December 31, 2017, the Village reported deferred outflows of resources and
deferred inflows of resources related to IMRF from the following sources:
Deferred
Outflows of
Deferred
Inflows of
Resources Resources
Difference between expected and actual experience $ 417,521 $ 1,157,679
Changes in assumptions 880,404 172,381
Employer contributions after the measurement date 1,856,899 -
Net difference between projected and actual earnings
on pension plan investments 4,179,715 -
TOTAL $ 7,334,539 $ 1,330,060
The net deferred outflows and inflows presented in the table above include amounts
for both the Village and the Library. The Village’s proportionate share of the net
deferred outflows and inflows of resources at December 31, 2017 was $4,391,022.
The Library’s proportionate share of the deferred outflows and inflows of resources
at December 31, 2017 was $1,613,457. The Village and the Library contributed an
additional $1,343,240 and $513,659, respectively, to the plan subsequent to the
measurement date of December 31, 2016 which are included in deferred outflows of
resources as of December 31, 2017.
- 55 -

VILLAGE OF MOUNT PROSPECT, ILLINOIS
NOTES TO FINANCIAL STATEMENTS (Continued)
- 56 -
12. EMPLOYEE RETIREMENT SYSTEMS (Continued)
a. Plan Descriptions (Continued)
Illinois Municipal Retirement Fund (Continued)
Pension Expense and Deferred Outflows of Resources and Deferred Inflows of
Resources (Continued)
$1,343,240 reported as deferred outflows of resources related to pensions resulting
from village contributions subsequent to the measurement date will be recognized as
a reduction of the net pension liability in the reporting year ending December 31,
2018. Other amounts reported as deferred outflows of resources and deferred inflows
of resources related to IMRF will be recognized as pension expense by the Village as
follows:
Year Ending
December 31,
2018 $ 1,506,785
2019 730,425
2020 729,034
2021 81,538
TOTAL $ 3,047,782
Discount Rate Sensitivity
The following is a sensitivity analysis of the net pension liability to changes in the
discount rate. The table below presents the net pension liability of the Village
calculated using the discount rate of 7.50% as well as what the Village’s net pension
liability would be if it were calculated using a discount rate that is 1 percentage point
lower (6.50%) or 1 percentage point higher (8.50%) than the current rate:
1% Decrease
Current
Discount Rate
1% Increase
(6.50%) (7.50%) (8.50%)
Net pension liability (Village) $ 16,937,655 $ 7,761,683 $ 234,683
Net pension liability (Library) 6,223,367 2,851,858 86,229
Net pension liability (Total) $ 23,161,022 $ 10,613,541 $ 320,912
- 56 -

VILLAGE OF MOUNT PROSPECT, ILLINOIS
NOTES TO FINANCIAL STATEMENTS (Continued)
- 57 -
12. EMPLOYEE RETIREMENT SYSTEMS (Continued)
a. Plan Descriptions (Continued)
Police Pension Plan
Plan Administration
Police sworn personnel are covered by the Police Pension Plan which is a defined
benefit single-employer pension plan. Although this is a single-employer pension
plan, the defined benefits and employee and employer contributions levels are
governed by Illinois Compiled Statutes (Chapter 40 - Article 5/3) and may be
amended only by the Illinois legislature. The Village accounts for the Police Pension
Plan as a pension trust fund.
The plan is governed by a five-member pension board. Two members are appointed
by the Village’s President, one member is elected by pension beneficiaries, and two
members are elected by active police employees.
Plan Membership
At December 31, 2017, the Police Pension Plan membership consisted of:
Inactive plan members currently receiving benefits 73
Inactive plan members entitled to but not yet receiving benefits 8
Active plan members 81
TOTAL 162
Benefits Provided
The Police Pension Plan provides retirement benefits as well as death and disability
benefits. Tier 1 employees (those hired prior to January 1, 2011) attaining the age of
50 or older with 20 or more years of creditable service are entitled to receive an
annual retirement benefit equal to one-half of the salary attached to the rank held on
the last day of service or for one year prior to the last day, whichever is greater. The
annual benefit shall be increased by 2.50% of such salary for each additional year of
service over 20 years up to 30 years to a maximum of 75% of such salary. Employees
with at least eight years but less than 20 years of credited service may retire at or
after age 60 and receive a reduced benefit. The monthly benefit of a police officer
who retired with 20 or more years of service after January 1, 1977 shall be increased
annually, following the first anniversary date of retirement and be paid upon reaching
the age of at least 55 years, by 3% of the original pension and 3% compounded
annually thereafter.
- 57 -

VILLAGE OF MOUNT PROSPECT, ILLINOIS
NOTES TO FINANCIAL STATEMENTS (Continued)
- 58 -
12. EMPLOYEE RETIREMENT SYSTEMS (Continued)
a. Plan Descriptions (Continued)
Police Pension Plan (Continued)
Benefits Provided (Continued)
Tier 2 employees (those hired on or after January 1, 2011) attaining the age of 55 or
older with ten or more years of creditable service are entitled to receive an annual
retirement benefit equal to the average monthly salary obtained by dividing the total
salary of the police officer during the 96 consecutive months of service within the
last 120 months of service in which the total salary was the highest by the number of
months of service in that period. Police officers’ salary for pension purposes is
capped at $106,800, plus the lesser of ½ of the annual change in the Consumer Price
Index or 3% compounded. The annual benefit shall be increased by 2.50% of such
salary for each additional year of service over 20 years up to 30 years to a maximum
of 75% of such salary. Employees with at least ten years may retire at or after age 50
and receive a reduced benefit (i.e., ½% for each month under 55). The monthly
benefit of a Tier 2 police officer shall be increased annually at age 60 on the
January 1st after the police officer retires, or the first anniversary of the pension
starting date, whichever is later. Noncompounding increases occur annually, each
January thereafter. The increase is the lesser of 3% or ½ of the change in the
Consumer Price Index for the preceding calendar year.
Contributions
Employees are required by ILCS to contribute 9.91% of their base salary to the
Police Pension Plan. If an employee leaves covered employment with less than 20
years of service, accumulated employee contributions may be refunded without
accumulated interest. The Village is required to contribute the remaining amounts
necessary to finance the plan and the administrative costs as actuarially determined
by an enrolled actuary. Effective January 1, 2011, the Village has until the year 2040
to fund 90% of the past service cost for the Police Pension Plan. However, the
Village has decided to fund 100% of the past service cost by 2040. For the year
ended December 31, 2017, the Village’s contribution was 44.86% of covered payroll.
The Village utilizes the entry-age normal actuarial cost method to fund the plan.
Investment Policy
The Police Pension Fund’s (the Fund) investment policy authorizes the Fund to
invest in all investments allowed by ILCS. These include deposits/investments in
insured commercial banks, savings and loan institutions, interest-bearing obligations
of the U.S. Treasury and U.S. agencies, interest-bearing bonds of the State of Illinois
- 58 -

VILLAGE OF MOUNT PROSPECT, ILLINOIS
NOTES TO FINANCIAL STATEMENTS (Continued)
- 59 -
12. EMPLOYEE RETIREMENT SYSTEMS (Continued) a. Plan Descriptions (Continued) Police Pension Plan (Continued)
Investment Policy (Continued)
or any county, township, or municipal corporation of the State of Illinois, direct obligations of the State of Israel, money market mutual funds whose investments consist of obligations of the U.S. Treasury or U.S. agencies, separate accounts managed by life insurance companies, mutual funds, common and preferred stock, Illinois Funds (created by the Illinois State Legislature under the control of the State Comptroller), and IMET, a not-for-profit investment trust formed pursuant to the Illinois Municipal Code and managed by a Board of Trustees elected from the participating members. IMET is not registered with the SEC as an investment company. Illinois Funds is an investment pool managed by the State of Illinois, Office of the Treasurer, which allows governments within the state to pool their funds for investment purposes.
It is the policy of the Fund to invest its funds in a manner which will provide the highest investment return with the maximum security while meeting the cash flow demands of the Fund and conforming to all state and local statutes governing the investment of public funds, using the “prudent person” standard for managing the overall portfolio. The primary objectives of the policy are, in order of priority, safety of principal, risk aversion, rate of return, and liquidity.
The Fund’s investment policy in accordance with ILCS establishes the following target allocation across asset classes:
Asset Class
Target
Long-Term Expected Real Rate
of Return
Fixed Income 45.00% 1.60% Large Cap Domestic Equities 38.50% 6.80% Small Cap Domestic Equities 11.00% 8.70% International Equities 5.50% 6.60%
- 59 -

VILLAGE OF MOUNT PROSPECT, ILLINOIS
NOTES TO FINANCIAL STATEMENTS (Continued)
- 60 -
12. EMPLOYEE RETIREMENT SYSTEMS (Continued)
a. Plan Descriptions (Continued)
Police Pension Plan (Continued)
Investment Policy (Continued)
Asset class returns and risk premium data are from Stocks, Bonds, Bills and Inflation
2013 Yearbook - Morningstar for the period December 31, 1925 through
December 31, 2017. The International Equity equals the MSCI EAFE Index for the
period December 31, 1977 through December 31, 2017. The long-term expected real
rates of return are net of inflation and investment expense. Long-term returns for the
asset classes are calculated on a geometric mean basis.
Investment Valuations
All investments are stated at fair value at December 31, 2017. Fair value is the price
that would be received to sell an asset or paid to transfer a liability in an orderly
transaction between market participants at the measurement date.
Investment Concentrations
Concentration of credit risk is the risk that the Fund has a high percentage of its
investments invested in one type of investment. The Fund’s investment policy
requires diversification of investment to avoid unreasonable risk. No financial
institution, except any securities custodians of the Fund, shall hold more than 10% of
the Fund’s portfolio at any time. Neither shall Illinois Funds hold more than 10% of
the Fund’s portfolio at any time. In addition, the following allocations are desired:
depository accounts and money market mutual funds at 1% to 5%, fixed income
securities at 40% to 44%, and equity securities at 55%.
At December 31, 2017, there were no significant investments (other than United
States Government guaranteed obligations or mutual funds) in any one organization
that represent 5% or more of the Fund’s investments.
Investment Rate of Return
For the year ended December 31, 2017, the annual money-weighted rate of return on
pension plan investments, net of pension plan investment expense, was 14.29%. The
money-weighted rate of return expresses investment performance, net of investment
expense, adjusted for the changing amounts actually invested.
- 60 -

VILLAGE OF MOUNT PROSPECT, ILLINOIS
NOTES TO FINANCIAL STATEMENTS (Continued)
- 61 -
12. EMPLOYEE RETIREMENT SYSTEMS (Continued) a. Plan Descriptions (Continued) Police Pension Plan (Continued) Interest Rate Risk
The following table presents the investments and maturities of the Fund’s debt
securities as of December 31, 2017:
Investment Maturities (in Years)
Investment Type
Fair Value
Less than 1
1-5
6-10
Greater than 10
U.S. Treasuries $ 3,999,032 $ 448,088 $ 1,712,996 $ 1,738,165 $ 99,783 U.S. agencies 6,513,197 11,686 254,091 1,045,917 5,201,503 State, local, and municipal bonds
2,046,737
49,537
246,273
105,200
1,645,727
Corporate bonds 10,620,264 698,111 6,609,650 3,138,845 173,658
TOTAL $ 23,179,230 $ 1,207,422 $ 8,823,010 $ 6,028,127 $ 7,120,671
Interest rate risk is the risk that changes in interest rates will adversely affect the fair
value of an investment. In accordance with its investment policy, the Fund limits its exposure to interest rate risk by structuring the portfolio to provide liquidity for all reasonably anticipated operating requirements while providing a reasonable rate of return based on the current market with a minimum return of 7% desired during a market cycle. In addition, no investment in a fixed income security shall have a maturity of greater than 30 years from the time of purchase.
The Fund has the following recurring fair value measurements as of December 31,
2017: the U.S. Treasury obligations and mutual funds were valued using quoted
prices in active markets for identical assets (Level 1 inputs) and U.S. agency
obligations; state, local, and municipal obligations, and corporate bond obligations
were valued using quoted matrix pricing models (Level 2 inputs).
Credit Risk
Credit risk is the risk that the issuer of a debt security will not pay its par value upon maturity. The Fund’s investment policy does not address the management of credit risk other than to limit investments to those allowed by state statutes. The U.S. Treasuries and agencies, money market mutual funds, and Illinois Funds are rated AAA. The state, local, and municipal bonds are rated AAA. The corporate bonds are rated BAA3 to AAA.
- 61 -
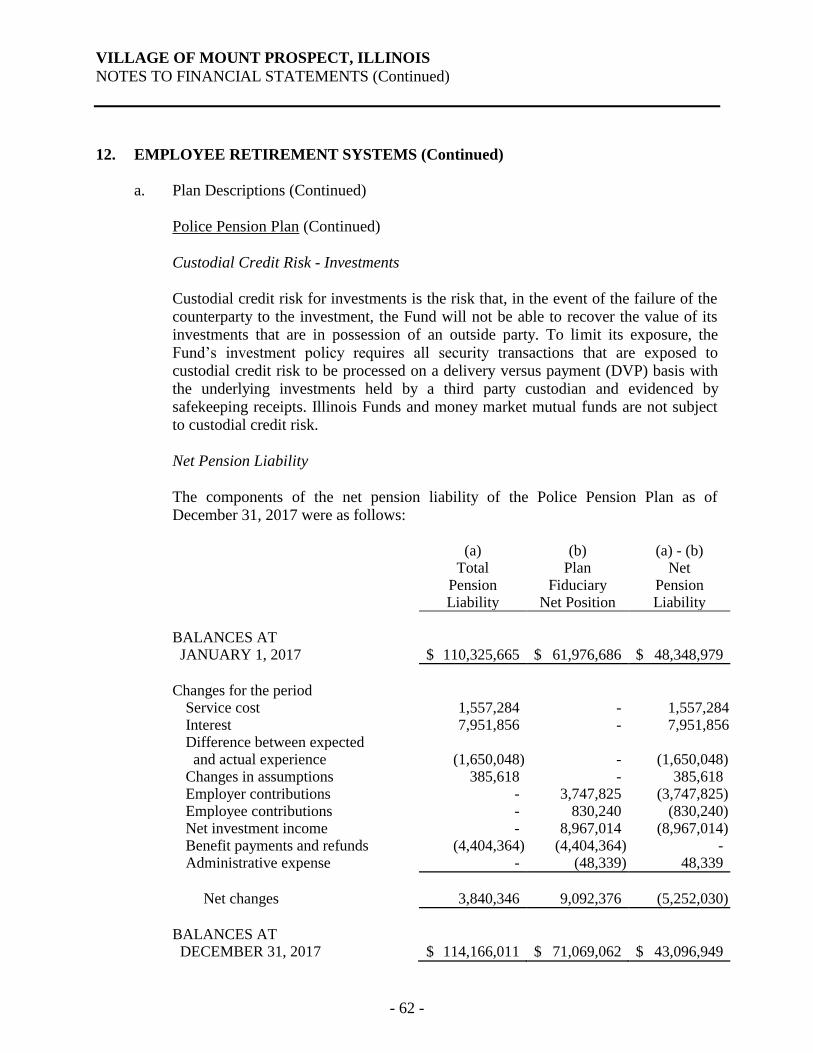
VILLAGE OF MOUNT PROSPECT, ILLINOIS
NOTES TO FINANCIAL STATEMENTS (Continued)
- 62 -
12. EMPLOYEE RETIREMENT SYSTEMS (Continued) a. Plan Descriptions (Continued) Police Pension Plan (Continued) Custodial Credit Risk - Investments
Custodial credit risk for investments is the risk that, in the event of the failure of the counterparty to the investment, the Fund will not be able to recover the value of its investments that are in possession of an outside party. To limit its exposure, the Fund’s investment policy requires all security transactions that are exposed to custodial credit risk to be processed on a delivery versus payment (DVP) basis with the underlying investments held by a third party custodian and evidenced by safekeeping receipts. Illinois Funds and money market mutual funds are not subject to custodial credit risk.
Net Pension Liability The components of the net pension liability of the Police Pension Plan as of
December 31, 2017 were as follows:
(a) Total
Pension
(b) Plan
Fiduciary
(a) - (b) Net
Pension Liability Net Position Liability
BALANCES AT JANUARY 1, 2017
$ 110,325,665
$ 61,976,686
$ 48,348,979
Changes for the period Service cost 1,557,284 - 1,557,284 Interest 7,951,856 - 7,951,856 Difference between expected and actual experience (1,650,048) - (1,650,048) Changes in assumptions 385,618 - 385,618 Employer contributions - 3,747,825 (3,747,825) Employee contributions - 830,240 (830,240) Net investment income - 8,967,014 (8,967,014) Benefit payments and refunds (4,404,364) (4,404,364) - Administrative expense - (48,339) 48,339
Net changes 3,840,346 9,092,376 (5,252,030)
BALANCES AT DECEMBER 31, 2017
$ 114,166,011
$ 71,069,062
$ 43,096,949
- 62 -
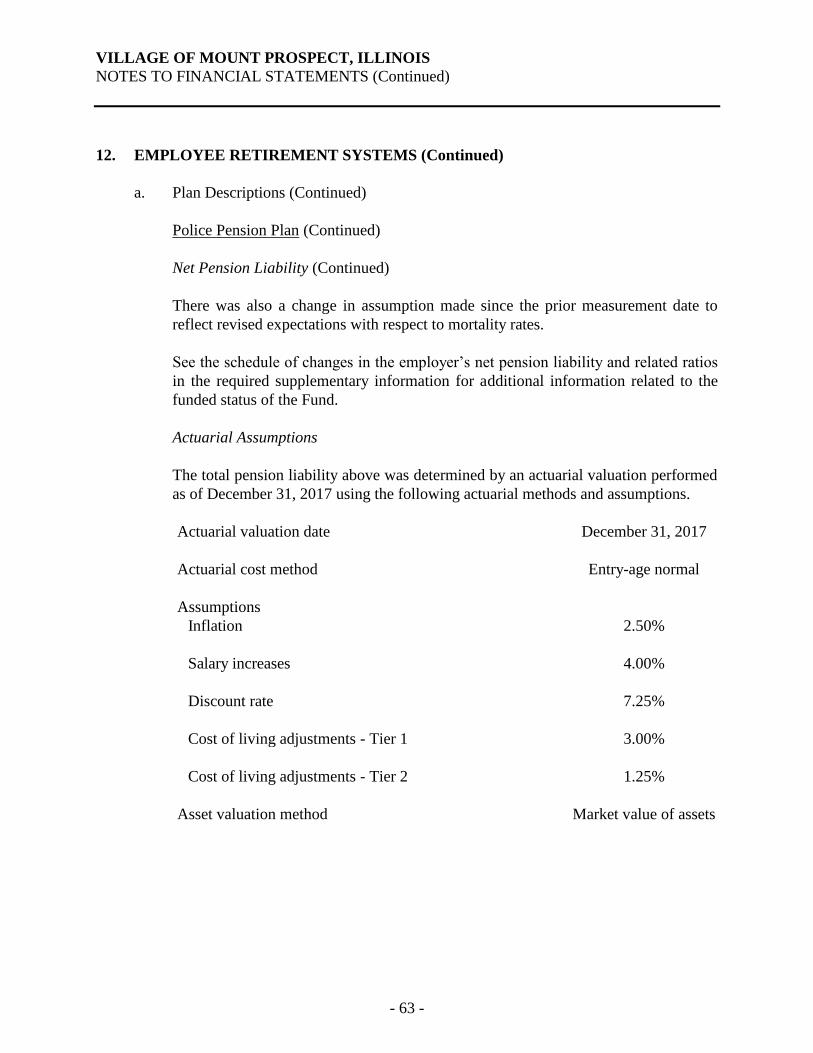
VILLAGE OF MOUNT PROSPECT, ILLINOIS
NOTES TO FINANCIAL STATEMENTS (Continued)
- 63 -
12. EMPLOYEE RETIREMENT SYSTEMS (Continued)
a. Plan Descriptions (Continued)
Police Pension Plan (Continued)
Net Pension Liability (Continued)
There was also a change in assumption made since the prior measurement date to
reflect revised expectations with respect to mortality rates.
See the schedule of changes in the employer’s net pension liability and related ratios
in the required supplementary information for additional information related to the
funded status of the Fund.
Actuarial Assumptions
The total pension liability above was determined by an actuarial valuation performed
as of December 31, 2017 using the following actuarial methods and assumptions.
Actuarial valuation date December 31, 2017
Actuarial cost method Entry-age normal
Assumptions
Inflation 2.50%
Salary increases 4.00%
Discount rate 7.25%
Cost of living adjustments - Tier 1 3.00%
Cost of living adjustments - Tier 2 1.25%
Asset valuation method Market value of assets
- 63 -

VILLAGE OF MOUNT PROSPECT, ILLINOIS
NOTES TO FINANCIAL STATEMENTS (Continued)
- 64 -
12. EMPLOYEE RETIREMENT SYSTEMS (Continued)
a. Plan Descriptions (Continued)
Police Pension Plan (Continued)
Actuarial Assumptions (Continued)
Mortality rates for healthy individuals were based on the RP-2014 Mortality Table
with a blue collar adjustment, projected from 2006 to 2018 using Scale MP-2016.
Mortality rates for disabled individuals were based on the RP-2000 Disabled
Mortality Table, projected from 2006 to 2018 using Scale MP-2016 The actuarial
assumptions used in the December 31, 2017 valuation were based on the results of
an actuarial experience study conducted by the Illinois Department of Insurance
dated October 5, 2017.
Discount Rate The discount rate used to measure the total pension liability was 7.25%. The
projection of cash flows used to determine the discount rate assumed that member contributions will be made at the current contribution rate and that the Village contributions will be made at rates equal to the difference between actuarially determined contribution rates and the member rate. Based on those assumptions, the Fund’s fiduciary net position was projected to be available to make all projected future benefit payments of current plan members. Therefore, the long-term expected rate of return on pension plan investments was applied to all periods of projected benefit payments to determine the total pension liability.
Interest Rate Sensitivity The following is a sensitivity analysis of the net pension liability to changes in the
discount rate. The table below presents the net pension liability of the Village calculated using the discount rate of 7.25% as well as what the Village’s net pension liability would be if it were calculated using a discount rate that is 1 percentage point lower (6.25%) or 1 percentage point higher (8.25%) than the current rate:
1% Decrease Current
Discount Rate
1% Increase (6.25%) (7.25%) (8.25%)
Net pension liability $ 56,340,206 $ 43,096,949 $ 31,230,231
- 64 -

VILLAGE OF MOUNT PROSPECT, ILLINOIS
NOTES TO FINANCIAL STATEMENTS (Continued)
- 65 -
12. EMPLOYEE RETIREMENT SYSTEMS (Continued)
a. Plan Descriptions (Continued)
Police Pension Plan (Continued)
Pension Expense and Deferred Outflows of Resources and Deferred Inflows of Resources For the year ended December 31, 2017, the Village recognized police pension expense of $4,088,009. At December 31, 2017, the Village reported deferred outflows of resources and deferred inflows of resources related to the police pension from the following sources: Deferred
Outflows of Deferred
Inflows of Resources Resources
Difference between expected and actual experience $ 39,385 $ 4,842,422 Changes in assumptions 3,334,114 - Net difference between projected and actual earnings on pension plan investments - 2,772,986
TOTAL $ 3,373,499 $ 7,615,408
Amounts reported as deferred outflows of resources and deferred inflows of
resources related to the police pension will be recognized in pension expense as
follows:
Year Ending
December 31,
2018 $ (141,376)
2019 (141,375)
2020 (1,782,000)
2021 (1,966,418)
2022 (210,740)
TOTAL $ (4,241,909)
- 65 -

VILLAGE OF MOUNT PROSPECT, ILLINOIS
NOTES TO FINANCIAL STATEMENTS (Continued)
- 66 -
12. EMPLOYEE RETIREMENT SYSTEMS (Continued)
a. Plan Descriptions (Continued)
Firefighters’ Pension Plan Plan Administration Fire sworn personnel are covered by the Firefighters’ Pension Plan which is a defined
benefit single-employer pension plan. Although this is a single-employer pension plan, the defined benefits as well as the employee and employer contributions levels are mandated by Illinois Compiled Statutes (Chapter 40 - Article 5/4) and may be amended only by the Illinois legislature. The Village accounts for the Firefighters’ Pension Plan as a pension trust fund.
The plan is governed by a five-member pension board. Two members are appointed
by the Village’s President, one member is elected by pension beneficiaries, and two members are elected by active firefighter employees.
Plan Membership At December 31, 2017, the Firefighters’ Pension Plan membership consisted of:
Inactive plan members currently receiving benefits 88 Inactive plan members entitled to but not yet receiving benefits - Active plan members 73
TOTAL 161
Firefighters’ Pension Plan
Benefits Provided
The Firefighters’ Pension Plan provides retirement benefits as well as death and
disability benefits. Tier 1 employees (those hired prior to January 1, 2011) attaining the age of 50 or older with 20 or more years of creditable service are entitled to receive an annual retirement benefit equal to one-half of the salary attached to the rank held at the date of retirement. The annual benefit shall be increased by 2.50% of such salary for each additional year of service over 20 years up to 30 years to a maximum of 75% of such salary. Employees with at least ten years but less than 20 years of credited service may retire at or after age 60 and receive a reduced benefit. The monthly benefit of a covered employee who retired with 20 or more years of service after January 1, 1977 shall be increased annually, following the first anniversary date of retirement and be paid upon reaching the age of at least 55 years, by 3% of the original pension and 3% compounded annually thereafter.
- 66 -

VILLAGE OF MOUNT PROSPECT, ILLINOIS
NOTES TO FINANCIAL STATEMENTS (Continued)
- 67 -
12. EMPLOYEE RETIREMENT SYSTEMS (Continued)
b. Plan Descriptions (Continued)
Firefighters’ Pension Plan (Continued)
Benefits Provided (Continued)
Tier 2 employees (those hired on or after January 1, 2011) attaining the age of 55 or
older with ten or more years of creditable service are entitled to receive an annual
retirement benefit equal to the average monthly salary obtained by dividing the total
salary of the firefighter during the 96 consecutive months of service within the last
120 months of service in which the total salary was the highest by the number of
months of service in that period. Firefighters’ salary for pension purposes is capped
at $106,800, plus the lesser of ½ of the annual change in the Consumer Price Index
or 3% compounded annually. The annual benefit shall be increased by 2.50% of such
salary for each additional year of service over 20 years up to 30 years to a maximum
of 75% of such salary. Employees with at least ten years may retire at or after age 50
and receive a reduced benefit (i.e., ½% for each month under 55). The monthly
benefit of a Tier 2 firefighter shall be increased annually at age 60 on the January 1st
after the firefighter retires or the first anniversary of the pension starting date,
whichever is later. Noncompounding increases occur annually, each January
thereafter. The increase is the lesser of 3% or ½ of the change in the Consumer Price
Index for the preceding calendar year.
Contributions
Covered employees are required to contribute 9.455% of their base salary to the Firefighters’ Pension Plan. If an employee leaves covered employment with less than 20 years of service, accumulated employee contributions may be refunded without accumulated interest. The Village is required to finance the Firefighters’ Pension Plan as actuarially determined by an enrolled actuary. Effective January 1, 2011, the Village has until the year 2040 to fully fund the past service costs for the Firefighters’ Pension Plan. However, the Village has decided to fund 100% of the past service cost by 2040. For the year ended December 31, 2017, the Village’s contribution was 46.63% of covered payroll. The Village utilizes the entry-age normal actuarial cost method to fund the plan.
Investment Policy The Firefighters’ Pension Fund’s (the Fund) investment policy authorizes the Fund to invest in all investments allowed by ILCS. These include deposits/investments in insured commercial banks, savings and loan institutions, interest-bearing obligations of the U.S. Treasury and U.S. agencies, interest-bearing bonds of the State of Illinois or any county, township, or municipal corporation of the State of Illinois, direct
- 67 -

VILLAGE OF MOUNT PROSPECT, ILLINOIS
NOTES TO FINANCIAL STATEMENTS (Continued)
- 68 -
12. EMPLOYEE RETIREMENT SYSTEMS (Continued) a. Plan Descriptions (Continued) Firefighters’ Pension Plan (Continued) Investment Policy (Continued)
obligations of the State of Israel, money market mutual funds whose investments consist of obligations of the U.S. Treasury or U.S. agencies, separate accounts managed by life insurance companies, mutual funds, common and preferred stock, Illinois Funds (created by the Illinois State Legislature under the control of the State Comptroller), and IMET, a not-for-profit investment trust formed pursuant to the Illinois Municipal Code and managed by a Board of Trustees elected from the participating members. IMET is not registered with the SEC as an investment company. Illinois Funds is an investment pool managed by the State of Illinois, Office of the Treasurer, which allows governments within the state to pool their funds for investment purposes.
It is the policy of the Fund to invest its funds in a manner which will provide the
highest investment return with the maximum security while meeting the daily cash
flow demands of the Fund and conforming to all state and local statutes governing
the investment of public funds, using the “prudent person” standard for managing the
overall portfolio. The primary objectives of the policy are, in order of priority, safety
of principal, risk aversion, liquidity, and return on investment.
The Fund’s investment policy in accordance with ILCS establishes the following
target allocation across asset classes:
Asset Class
Target
Long-Term
Expected Real
Rate of Return
U.S. Fixed Income 35% 2.50%
U.S. Equities 40% 7.50%
International Equities 16% 8.50%
Real Estate 9% 4.50%
The long-term expected real rate of return is based on an arithmetic calculation that
uses the GASB building block method. The arithmetic calculation was developed
through an evaluation process overseen by the Andco Consulting Investment Policy
Committee.
- 68 -
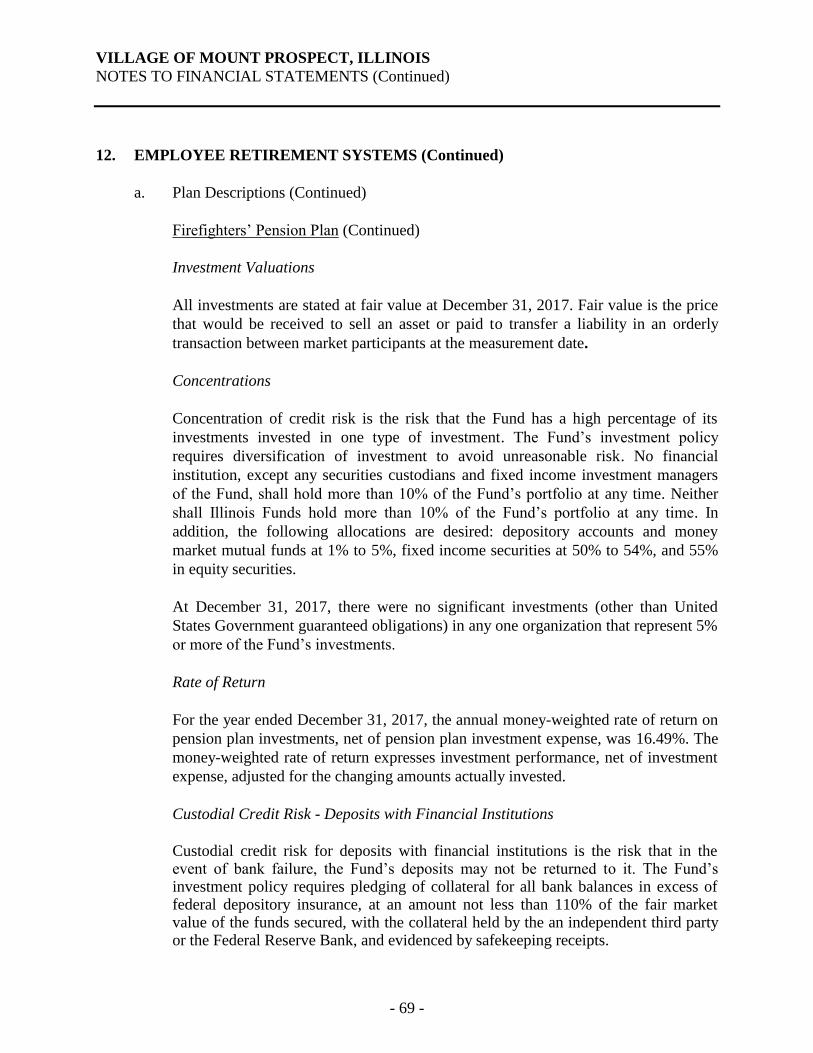
VILLAGE OF MOUNT PROSPECT, ILLINOIS
NOTES TO FINANCIAL STATEMENTS (Continued)
- 69 -
12. EMPLOYEE RETIREMENT SYSTEMS (Continued)
a. Plan Descriptions (Continued)
Firefighters’ Pension Plan (Continued)
Investment Valuations
All investments are stated at fair value at December 31, 2017. Fair value is the price
that would be received to sell an asset or paid to transfer a liability in an orderly
transaction between market participants at the measurement date.
Concentrations
Concentration of credit risk is the risk that the Fund has a high percentage of its
investments invested in one type of investment. The Fund’s investment policy
requires diversification of investment to avoid unreasonable risk. No financial
institution, except any securities custodians and fixed income investment managers
of the Fund, shall hold more than 10% of the Fund’s portfolio at any time. Neither
shall Illinois Funds hold more than 10% of the Fund’s portfolio at any time. In
addition, the following allocations are desired: depository accounts and money
market mutual funds at 1% to 5%, fixed income securities at 50% to 54%, and 55%
in equity securities.
At December 31, 2017, there were no significant investments (other than United
States Government guaranteed obligations) in any one organization that represent 5%
or more of the Fund’s investments.
Rate of Return
For the year ended December 31, 2017, the annual money-weighted rate of return on
pension plan investments, net of pension plan investment expense, was 16.49%. The
money-weighted rate of return expresses investment performance, net of investment
expense, adjusted for the changing amounts actually invested.
Custodial Credit Risk - Deposits with Financial Institutions
Custodial credit risk for deposits with financial institutions is the risk that in the event of bank failure, the Fund’s deposits may not be returned to it. The Fund’s investment policy requires pledging of collateral for all bank balances in excess of federal depository insurance, at an amount not less than 110% of the fair market value of the funds secured, with the collateral held by the an independent third party or the Federal Reserve Bank, and evidenced by safekeeping receipts.
- 69 -

VILLAGE OF MOUNT PROSPECT, ILLINOIS
NOTES TO FINANCIAL STATEMENTS (Continued)
- 70 -
12. EMPLOYEE RETIREMENT SYSTEMS (Continued)
a. Plan Descriptions (Continued)
Firefighters’ Pension Plan (Continued)
Interest Rate Risk
The following table presents the investments and maturities of the Fund’s debt
securities as of December 31, 2017:
Investment Maturities (in Years)
Investment Type
Fair Value
Less
than 1
1-5
6-10
Greater
than 10
U.S. Treasury $ 3,530,576 $ 298,933 $ 1,431,962 $ 1,799,681 $ -
U.S. agencies 8,781,624 537 741,800 1,419,658 6,619,629
State, local and
municipal bonds
481,342
50,000
272,139
159,203
-
Corporate bonds 9,465,491 363,414 6,068,752 2,935,921 97,404
TOTAL $ 22,259,033 $ 712,884 $ 8,514,653 $ 6,314,463 $ 6,717,033
Interest rate risk is the risk that changes in interest rates will adversely affect the fair
value of an investment. In accordance with its investment policy, the Fund limits its
exposure to interest rate risk by structuring the portfolio to provide liquidity for all
reasonably anticipated operating requirements while providing a reasonable rate of
return based on the current market with a minimum return of 7% desired during a
market cycle. In addition, no investment in a fixed income security shall have a
maturity of greater than 30 years from the time of purchase.
The Fund has the following recurring fair value measurements as of December 31,
2017: the U.S. Treasury obligations and mutual funds were valued using quoted
prices in active markets for identical assets (Level 1 inputs); and U.S. agency
obligations, state, local, and municipal obligations, corporate bond obligations, and
investments in real estate pools were valued using quoted matrix pricing models
(Level 2 inputs).
Credit Risk
Credit risk is the risk that the issuer of a debt security will not pay its par value upon
maturity. The Fund’s investment policy does not address the management of credit
risk other than to limit investments to those allowed by state statutes. The U.S.
Treasuries and agencies, money market mutual funds, and Illinois Funds are rated
AAA. The state, local, and municipal bonds are rated AA2 to AAA. The corporate
bonds are rated Ba1 to AAA.
- 70 -

VILLAGE OF MOUNT PROSPECT, ILLINOIS
NOTES TO FINANCIAL STATEMENTS (Continued)
- 71 -
12. EMPLOYEE RETIREMENT SYSTEMS (Continued)
a. Plan Descriptions (Continued)
Firefighters’ Pension Plan (Continued)
Custodial Credit Risk - Investments
Custodial credit risk for investments is the risk that, in the event of the failure of the
counterparty to the investment, the Fund will not be able to recover the value of its
investments that are in possession of an outside party. To limit its exposure, the
Fund’s investment policy requires all security transactions that are exposed to
custodial credit risk to be processed on a delivery versus payment (DVP) basis with
the underlying investments held by a third party custodian and evidenced by
safekeeping receipts. Illinois Funds and money market mutual funds are not subject
to custodial credit risk.
Net Pension Liability
The components of the net pension liability of the Firefighters’ Pension Plan as of
December 31, 2017 were as follows:
(a)
Total
Pension
(b)
Plan
Fiduciary
(a) - (b)
Net
Pension
Liability Net Position Liability
BALANCES AT
JANUARY 1, 2017
$ 100,997,566
$ 58,344,829
$ 42,652,737
Changes for the period
Service cost 1,426,033 - 1,426,033
Interest 7,228,968 - 7,228,968
Difference between expected
and actual experience 1,470,077 - 1,470,077
Changes in assumptions (572,774) - (572,774)
Employer contributions - 3,396,834 (3,396,834)
Employee contributions - 678,476 (678,476)
Net investment income - 9,323,369 (9,323,369)
Benefit payments and refunds (5,427,385) (5,427,385) -
Administrative expense - (50,783) 50,783
Net changes 4,124,919 7,920,511 (3,795,592)
BALANCES AT
DECEMBER 31, 2017
$ 105,122,485
$ 66,265,340
$ 38,857,145
- 71 -

VILLAGE OF MOUNT PROSPECT, ILLINOIS
NOTES TO FINANCIAL STATEMENTS (Continued)
- 72 -
12. EMPLOYEE RETIREMENT SYSTEMS (Continued)
a. Plan Descriptions (Continued)
Firefighters’ Pension Plan (Continued)
Net Pension Liability (Continued)
There was also a change in assumption made since the prior measurement date to
reflect revised expectations with respect to mortality rates.
See the schedule of changes in the employer’s net pension liability and related ratios
in the required supplementary information for additional information related to the
funded status of the Fund.
Actuarial Assumptions
The total pension liability above was determined by an actuarial valuation performed
as of December 31, 2017 using the following actuarial methods and assumptions.
Actuarial valuation date December 31, 2017
Actuarial cost method Entry-age normal
Assumptions
Inflation 2.50%
Salary increases 4.00%
Discount rate 7.25%
Cost of living adjustments - Tier 1 3.00%
Cost of living adjustments - Tier 2 1.25%
Asset valuation method Market value of assets
- 72 -

VILLAGE OF MOUNT PROSPECT, ILLINOIS
NOTES TO FINANCIAL STATEMENTS (Continued)
- 73 -
12. EMPLOYEE RETIREMENT SYSTEMS (Continued)
a. Plan Descriptions (Continued)
Firefighters’ Pension Plan (Continued)
Actuarial Assumptions (Continued)
Mortality rates for healthy individuals were based on the RP-2014 Mortality Table
with a blue collar adjustment, projected from 2006 to 2018 using Scale MP-2016.
Mortality rates for disabled individuals were based on the RP-2004 Disabled
Mortality Table, projected from 2006 to 2018 using Scale MP-2016 The actuarial
assumptions used in the December 31, 2017 valuation were based on the results of
an actuarial experience study conducted by the Illinois Department of Insurance
dated October 5, 2017.
Discount Rate
The discount rate used to measure the total pension liability was 7.25%. The
projection of cash flows used to determine the discount rate assumed that member
contributions will be made at the current contribution rate and that the Village
contributions will be made at rates equal to the difference between actuarially
determined contribution rates and the member rate. Based on those assumptions, the
Fund’s fiduciary net position was projected to be available to make all projected
future benefit payments of current plan members. Therefore, the long-term expected
rate of return on pension plan investments was applied to all periods of projected
benefit payments to determine the total pension liability.
Interest Rate Sensitivity
The following is a sensitivity analysis of the net pension liability to changes in the
discount rate. The table below presents the net pension liability of the Village
calculated using the discount rate of 7.25% as well as what the Village’s net pension
liability would be if it were calculated using a discount rate that is 1 percentage point
lower (6.25%) or 1 percentage point higher (8.25%) than the current rate:
1% Decrease
Current
Discount Rate
1% Increase
(6.25%) (7.25%) (8.25%)
Net pension liability $ 51,471,843 $ 38,857,145 $ 27,594,022
- 73 -

VILLAGE OF MOUNT PROSPECT, ILLINOIS
NOTES TO FINANCIAL STATEMENTS (Continued)
- 74 -
12. EMPLOYEE RETIREMENT SYSTEMS (Continued)
a. Plan Descriptions (Continued)
Firefighters’ Pension Plan (Continued)
Pension Expense and Deferred Outflows of Resources and Deferred Inflows of
Resources
For the year ended December 31, 2017, the Village recognized firefighter’s pension
expense of $4,675,975.
At December 31, 2017, the Village reported deferred outflows of resources and
deferred inflows of resources related to the firefighter’s pension from the following
sources:
Deferred
Outflows of
Deferred
Inflows of
Resources Resources
Difference between expected and actual experience $ 2,019,460 $ 1,065,019
Changes in assumptions 3,906,483 490,949
Net difference between projected and actual earnings
on pension plan investments - 3,360,812
TOTAL $ 5,925,943 $ 4,916,780
Amounts reported as deferred outflows of resources and deferred inflows of resources related to the firefighter’s pension will be recognized in pension expense as follows:
Year Ending
December 31,
2018 $ 827,814
2019 827,815
2020 310,446
2021 (1,056,974)
2022 (28,125)
Thereafter 128,187
TOTAL $ 1,009,163
- 74 -

VILLAGE OF MOUNT PROSPECT, ILLINOIS
NOTES TO FINANCIAL STATEMENTS (Continued)
- 75 -
12. EMPLOYEE RETIREMENT SYSTEMS (Continued)
b. Fiduciary Funds Summary Financial Information
The following is summary financial information for the Police Pension Plan and the
Firefighters’ Pension Plan.
Statement of Net Position
Police Pension
Firefighters’ Pension
Total
ASSETS Cash and cash equivalents $ 1,232,315 $ 1,068,368 $ 2,300,683 Investments State and local obligations 2,046,737 481,342 2,528,079 U.S. Government and U.S. agency obligations
10,512,229
12,312,200
22,824,429
Corporate bonds and obligations 10,620,264 9,465,491 20,085,755 Real estate - 3,183,460 3,183,460 Mutual funds 46,550,389 39,595,895 86,146,284 Accrued interest receivable 150,155 132,206 282,361 Due from other funds - 41,918 41,918 Prepaids 1,162 1,669 2,831
Total assets 71,113,251 66,282,549 137,395,800
LIABILITIES Accounts payable 38,535 17,209 55,744 Due to other funds 5,654 - 5,654
Total liabilities 44,189 17,209 61,398
NET POSITION $ 71,069,062 $ 66,265,340 $ 137,334,402
- 75 -

VILLAGE OF MOUNT PROSPECT, ILLINOIS
NOTES TO FINANCIAL STATEMENTS (Continued)
- 76 -
12. EMPLOYEE RETIREMENT SYSTEMS (Continued)
b. Fiduciary Funds Summary Financial Information (Continued) Schedule of Changes in Net Position
Police Pension
Firefighters’ Pension
Total
ADDITIONS Contributions Employer $ 3,747,825 $ 3,396,834 $ 7,144,659 Employee 1,260,472 678,476 1,938,948
Total contributions 5,008,297 4,075,310 9,083,607
Invest income Net appreciation in fair value of investments
8,325,232
8,774,095
17,099,327
Interest income 763,695 640,447 1,404,142 Less investment expense (121,912) (91,173) (213,085)
Net investment income 8,967,015 9,323,369 18,290,384
Total additions 13,975,312 13,398,679 27,373,991
DEDUCTIONS Administrative 48,339 50,783 99,122 Pension benefits and refunds 4,834,597 5,427,385 10,261,982
Total deductions 4,882,936 5,478,168 10,361,104
NET INCREASE 9,092,376 7,920,511 17,012,887 NET POSITION RESTRICTED FOR PENSIONS January 1 61,976,686 58,344,829 120,321,515
December 31 $ 71,069,062 $ 66,265,340 $ 137,334,402
- 76 -
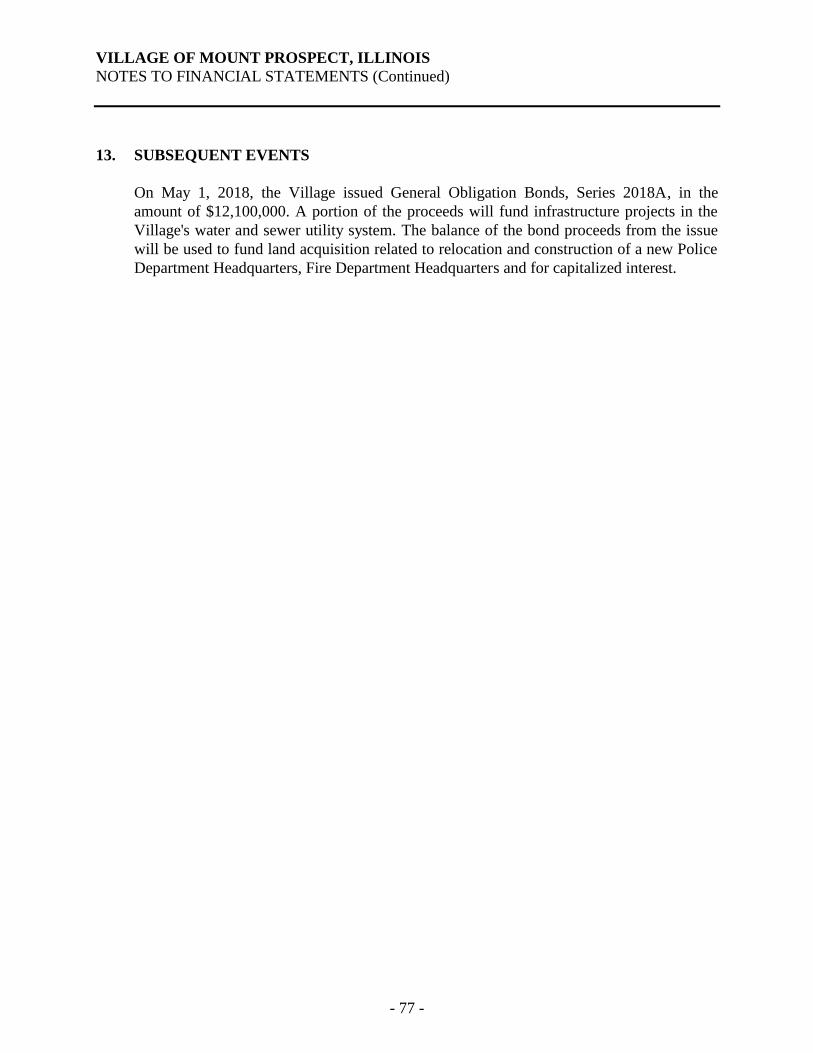
VILLAGE OF MOUNT PROSPECT, ILLINOIS
NOTES TO FINANCIAL STATEMENTS (Continued)
- 77 -
13. SUBSEQUENT EVENTS
On May 1, 2018, the Village issued General Obligation Bonds, Series 2018A, in the
amount of $12,100,000. A portion of the proceeds will fund infrastructure projects in the
Village's water and sewer utility system. The balance of the bond proceeds from the issue
will be used to fund land acquisition related to relocation and construction of a new Police
Department Headquarters, Fire Department Headquarters and for capitalized interest.
- 77 -

REQUIRED SUPPLEMENTARY INFORMATION

VILLAGE OF MOUNT PROSPECT, ILLINOIS
SCHEDULE OF REVENUES, EXPENDITURES, AND
CHANGES IN FUND BALANCE - BUDGET AND ACTUAL
GENERAL FUND
For the Year Ended December 31, 2017
Original Final
Budget Budget Actual
REVENUES
Property taxes 16,278,000$ 16,278,000$ 16,112,039$
Other taxes 7,383,000 7,524,500 7,129,671
Licenses, permits, and fees 2,281,000 2,347,000 2,334,232
Intergovernmental 25,008,040 25,426,540 25,833,177
Charges for services 1,582,955 1,582,955 1,527,168
Fines and forfeits 452,000 452,000 415,189
Investment income 43,000 151,000 132,925
Miscellaneous 303,600 908,100 317,562
Total revenues 53,331,595 54,670,095 53,801,963
EXPENDITURES
General government 7,881,577 8,509,156 8,311,613
Public safety 34,092,239 34,668,333 34,166,460
Highways and streets 8,282,369 8,282,369 7,613,341
Health 248,627 248,627 261,533
Welfare 1,591,611 1,613,704 1,548,489
Culture and recreation 635,172 635,172 585,907
Total expenditures 52,731,595 53,957,361 52,487,343
OTHER FINANCING SOURCES (USES)
Transfers (out) (600,000) (600,000) (600,000)
Total other financing sources (uses) (600,000) (600,000) (600,000)
NET CHANGE IN FUND BALANCE -$ 112,734$ 714,620
FUND BALANCE, JANUARY 1 18,684,351
FUND BALANCE, DECEMBER 31 19,398,971$
(See independent auditor's report.)- 78 -

VILLAGE OF MOUNT PROSPECT, ILLINOIS
SCHEDULE OF REVENUES, EXPENDITURES, AND
CHANGES IN FUND BALANCE - BUDGET AND ACTUAL
REFUSE DISPOSAL FUND
For the Year Ended December 31, 2017
Original Final
Budget Budget Actual
REVENUES
Charges for services 4,597,000$ 4,597,000$ 4,283,563$
Investment income 2,000 2,000 7,124
Miscellaneous 11,000 11,000 27,084
Total revenues 4,610,000 4,610,000 4,317,771
EXPENDITURES
Health
Refuse disposal division
Personal services 256,271 256,271 248,932
Employee benefits 113,666 113,666 115,363
Other employee costs 1,298 1,298 1,199
Contractual services 4,078,062 4,078,062 3,804,784
Utilities 465 465 303
Insurance 29,528 29,528 29,528
Commodities and supplies 39,975 39,975 38,638
Total expenditures 4,519,265 4,519,265 4,238,747
NET CHANGE IN FUND BALANCE 90,735$ 90,735$ 79,024
FUND BALANCE, JANUARY 1 1,363,621
FUND BALANCE, DECEMBER 31 1,442,645$
(See independent auditor's report.)- 79 -

(6)
(2) UAAL
Actuarial (4) as a
Actuarial (1) Accrued Unfunded Percentage
Valuation Actuarial Liability (3) AAL (5) of Covered
Date Value of (AAL) Ratio (UAAL) Covered Payroll
December 31, Assets Entry-Age (1) / (2) (2) - (1) Payroll (4) / (5)
2012 N/A N/A N/A N/A N/A N/A
2013 -$ 7,201,300$ 0.00% 7,201,300$ 24,540,441$ 29.34%
2014 N/A N/A N/A N/A N/A N/A
2015 - 10,485,116 0.00% 10,485,116 27,084,313 38.71%
2016 N/A N/A N/A N/A N/A N/A
2017 - 12,560,127 0.00% 12,560,127 25,199,376 49.84%
N/A - Information not available.
VILLAGE OF MOUNT PROSPECT, ILLINOIS
SCHEDULE OF FUNDING PROGRESS
OTHER POSTEMPLOYMENT BENEFITS PLAN
Last Six Fiscal Years
(See independent auditor's report.)- 80 -

FISCAL YEAR ENDED DECEMBER 31, 2015 2016 2017
Actuarially determined contribution 1,362,420$ 1,453,487$ 1,432,869$
Contributions in relation to the actuarially
determined contribution 1,362,420 1,453,487 1,432,869
CONTRIBUTION DEFICIENCY (Excess) -$ -$ -$
Covered-employee payroll 11,923,390$ 12,119,270$ 12,425,097$
Contributions as a percentage of
covered-employee payroll 11.43% 11.99% 11.53%
Notes to Required Supplementary Information
Ultimately, this schedule should present return information for the last ten years. However, until ten
years of information can be compiled, information will be presented for as many years as is available.
VILLAGE OF MOUNT PROSPECT, ILLINOIS
SCHEDULE OF EMPLOYER CONTRIBUTIONS
ILLINOIS MUNICIPAL RETIREMENT FUND
Last Three Fiscal Years
The information presented was determined as part of the actuarial valuations as of January 1 of the
prior fiscal year. Additional information as of the latest actuarial valuation presented is as follows: the
actuarial cost method was entry-age normal; the amortization method was level percent of pay, closed
and the amortization period was 27 years; the asset valuation method was five-year smoothed market;
and the significant actuarial assumptions were an investment rate of return at 7.50% annually,
projected salary increases assumption of 3.75% to 14.50% compounded annually and postretirement
benefit increases of 3.00% compounded annually.
(See independent auditor's report.)- 81 -

FISCAL YEAR ENDED DECEMBER 31, 2008 2009 2010 2011 2012 2013 2014 2015 2016 2017
Actuarially determined contribution 1,408,423$ 1,515,672$ 2,208,174$ 2,467,527$ 2,484,859$ 2,631,811$ 2,922,979$ 2,909,868$ 3,204,363$ 3,817,579$
Contributions in relation to the actuarially
determined contribution 1,420,452 1,565,009 2,210,670 2,504,701 2,511,349 2,631,038 2,924,226 2,918,395 3,232,887 3,747,825
CONTRIBUTION DEFICIENCY (Excess) (12,029)$ (49,337)$ (2,496)$ (37,174)$ (26,490)$ 773$ (1,247)$ (8,527)$ (28,524)$ 69,754$
Covered-employee payroll 7,142,505$ 7,421,123$ 7,183,594$ 7,591,498$ 7,871,917$ 8,121,622$ 7,848,795$ 8,049,995$ 8,276,985$ 8,354,290$
Contributions as a percentage of
covered-employee payroll 19.89% 21.09% 30.77% 32.99% 31.90% 32.40% 37.26% 36.25% 39.06% 44.86%
Notes to Required Supplementary Information
The information presented was determined as part of the actuarial valuations as of January 1 of the prior fiscal year. Additional information as of the latest actuarial valuation presented is as follows: the
actuarial cost method was entry-age normal; the amortization method was closed level percentage of pay; the amortization period was 23 years; the asset valuation method was five-year smoothing of asset
gains and losses; and the significant actuarial assumptions were an interest rate of 7.25%, annually, net of investment and administrative expenses; inflation of 2.50% annually; projected salary increases of
4.00% annually; and annual postretirement benefit increases of 3.00% for Tier 1 members and 1.25% for Tier 2 members.
POLICE PENSION FUND
SCHEDULE OF EMPLOYER CONTRIBUTIONS
VILLAGE OF MOUNT PROSPECT, ILLINOIS
Last Ten Fiscal Years
(See independent auditor's report.)- 82 -

FISCAL YEAR ENDED DECEMBER 31, 2008 2009 2010 2011 2012 2013 2014 2015 2016 2017
Actuarially determined contribution 1,389,833$ 1,414,110$ 1,925,375$ 2,140,664$ 2,224,122$ 2,323,609$ 2,468,554$ 2,526,101$ 2,589,599$ 3,206,186$
Contributions in relation to the actuarially
determined contribution 1,417,935 1,538,564 1,928,807 2,155,975 2,260,834 2,371,347 2,466,165 2,532,316 2,806,983 3,396,834
CONTRIBUTION DEFICIENCY (Excess) (28,102)$ (124,454)$ (3,432)$ (15,311)$ (36,712)$ (47,738)$ 2,389$ (6,215)$ (217,384)$ (190,648)$
Covered-employee payroll 5,862,887$ 6,181,788$ 5,896,317$ 6,201,120$ 6,150,974$ 6,436,911$ 6,495,510$ 6,441,588$ 6,981,704$ 7,284,199$
Contributions as a percentage of
covered-employee payroll 24.18% 24.89% 32.71% 34.77% 36.76% 36.84% 37.97% 39.31% 40.20% 46.63%
Notes to Required Supplementary Information
The information presented was determined as part of the actuarial valuations as of January 1 of the prior fiscal year. Additional information as of the latest actuarial valuation presented is as follows: the
actuarial cost method was entry-age normal; the amortization method was closed level percentage of pay; the amortization period was 23 years; the asset valuation method was five-year smoothing of asset
gains and losses; and the significant actuarial assumptions were an interest rate of 7.25%, annually, net of investment and administrative expenses; inflation of 2.50% annually; projected salary increases of
4.00% annually; and annual postretirement benefit increases of 3.00% for Tier 1 members and 1.25% for Tier 2 members.
Last Ten Fiscal Years
FIREFIGHTERS' PENSION FUND
SCHEDULE OF EMPLOYER CONTRIBUTIONS
VILLAGE OF MOUNT PROSPECT, ILLINOIS
(See independent auditor's report.)- 83 -

Annual
Required
Fiscal Employer Contribution Percentage
Year Contributions (ARC) Contributed
2012 609,856$ 442,722$ 137.75%
2013 275,814 582,335 47.36%
2014 287,447 605,628 47.46%
2015 362,130 679,933 53.26%
2016 362,130 679,933 53.26%
2017 355,398 913,356 38.91%
VILLAGE OF MOUNT PROSPECT, ILLINOIS
SCHEDULE OF EMPLOYER CONTRIBUTIONS
OTHER POSTEMPLOYMENT BENEFITS PLAN
December 31, 2017
(See independent auditor's report.)- 84 -
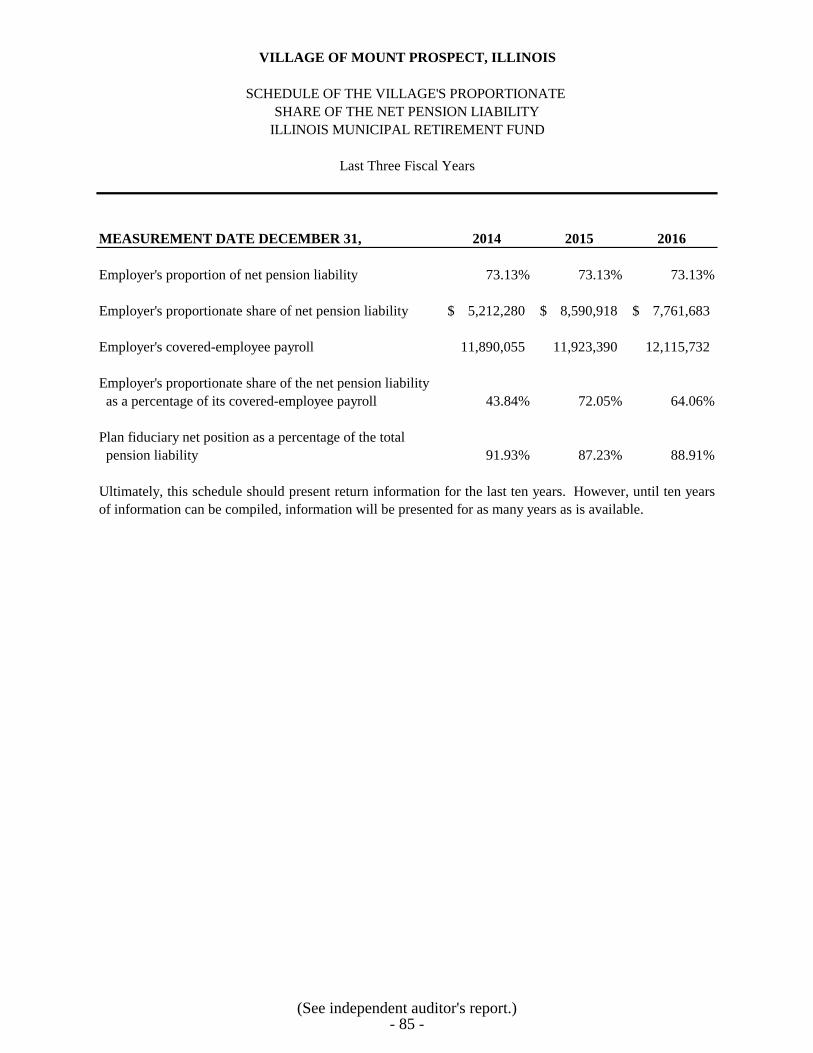
MEASUREMENT DATE DECEMBER 31, 2014 2015 2016
Employer's proportion of net pension liability 73.13% 73.13% 73.13%
Employer's proportionate share of net pension liability 5,212,280$ 8,590,918$ 7,761,683$
Employer's covered-employee payroll 11,890,055 11,923,390 12,115,732
Employer's proportionate share of the net pension liability
as a percentage of its covered-employee payroll 43.84% 72.05% 64.06%
Plan fiduciary net position as a percentage of the total
pension liability 91.93% 87.23% 88.91%
Ultimately, this schedule should present return information for the last ten years. However, until ten years
of information can be compiled, information will be presented for as many years as is available.
Last Three Fiscal Years
VILLAGE OF MOUNT PROSPECT, ILLINOIS
SCHEDULE OF THE VILLAGE'S PROPORTIONATE
SHARE OF THE NET PENSION LIABILITY
ILLINOIS MUNICIPAL RETIREMENT FUND
(See independent auditor's report.)- 85 -

MEASUREMENT DATE DECEMBER 31, 2014 2015 2016 2017
TOTAL PENSION LIABILITY
Service cost 1,890,407$ 1,777,310$ 1,732,924$ 1,557,284$
Investment income 6,479,504 7,210,826 8,221,483 7,951,856
Differences between expected and actual experience 860,183 95,650 (5,201,074) (1,650,048)
Changes of assumptions 4,844,398 7,268,193 29,971 385,618
Benefit payments, including refunds of member contributions (4,117,120) (4,529,962) (4,688,978) (4,404,364)
Net change in total pension liability 9,957,372 11,822,017 94,326 3,840,346
Total pension liability - beginning 88,451,950 98,409,322 110,231,339 110,325,665
TOTAL PENSION LIABILITY - ENDING 98,409,322$ 110,231,339$ 110,325,665$ 114,166,011$
PLAN FIDUCIARY NET POSITION
Contributions - employer 2,924,226$ 2,918,395$ 3,232,887$ 3,747,825$
Contributions - member 851,363 795,827 815,684 830,240
Net investment income 3,845,862 545,802 4,161,658 8,967,014
Benefit payments, including refunds of member contributions (4,117,120) (4,529,962) (4,688,978) (4,404,364)
Administrative expense (60,382) (49,947) (44,605) (48,339)
Net change in plan fiduciary net position 3,443,949 (319,885) 3,476,646 9,092,376
Plan fiduciary net position - beginning 55,375,976 58,819,925 58,500,040 61,976,686
PLAN FIDUCIARY NET POSITION - ENDING 58,819,925$ 58,500,040$ 61,976,686$ 71,069,062$
EMPLOYER'S NET PENSION LIABILITY 39,589,397$ 51,731,299$ 48,348,979$ 43,096,949$
Plan fiduciary net position
as a percentage of the total pension liability 59.77% 53.07% 56.18% 62.25%
Covered-employee payroll 7,848,795$ 8,049,995$ 8,276,985$ 8,354,290$
Employer's net pension liability
as a percentage of covered-employee payroll 504.40% 642.60% 584.10% 515.90%
Notes to Required Supplementary Information
Year Ended December 31, 2017 - There were changes in assumptions related to the mortality rates from December 31, 2016.
Ultimately, this schedule should present return information for the last ten years. However, until ten years of information can be compiled,
information will be presented for as many years as is available.
VILLAGE OF MOUNT PROSPECT, ILLINOIS
Last Four Fiscal Years
POLICE PENSION FUND
NET PENSION LIABILITY AND RELATED RATIOS
SCHEDULE OF CHANGES IN THE EMPLOYER'S
Year Ended December 31, 2015 - There was a change with respect to the actuarial assumptions from the prior year to reflect revised expectations
with respect to mortality rates, turnover rates, and retirement rates.
Year Ended December 31, 2014 - There was a change with respect to the actuarial assumptions from the prior year to reflect revised expectations
with respect to mortality rates, turnover rates, and retirement rates.
* The Village reported portability contributions as employee contributions in the basic financial statements, whereas the actuary has included these
amounts as part of the other components of changes in plan fiduciary net position.
Year Ended December 31, 2016 - There was a change in assumption related to the discount rate made since the prior measurement date. The
discount rate used in the current actuarial valuation, dated December 31, 2016, is 7.25%. The discount rate used in the prior actuarial valuation,
dated December 31, 2015, was 7.50%. There was also a change in assumption related to the projected rate for annual pay increases made since the
prior measurement date. The projected rate for annual pay increases used in the current actuarial valuation, dated December 31, 2016, is 4.00%. The
projected rate for annual pay increases used in the prior actuarial valuation, dated December 31, 2015, was 5.00%. There was also a change in
assumption made since the prior measurement date to reflect revised expectations with respect to mortality rates.
(See independent auditor's report.)- 86 -

MEASUREMENT DATE DECEMBER 31, 2014 2015 2016 2017
TOTAL PENSION LIABILITY
Service cost 1,673,836$ 1,515,101$ 1,429,810$ 1,426,033$
Investment income 5,780,241 6,270,507 7,296,444 7,228,968
Differences between expected and actual experience 225,575 1,603,162 (1,491,027) 1,470,077
Changes of assumptions 3,234,155 7,648,623 396,832 (572,774)
Benefit payments, including refunds of member contributions (4,158,988) (4,594,876) (4,981,207) (5,427,385)
Net change in total pension liability 6,754,819 12,442,517 2,650,852 4,124,919
Total pension liability - beginning 79,149,378 85,904,197 98,346,714 100,997,566
TOTAL PENSION LIABILITY - ENDING 85,904,197$ 98,346,714$ 100,997,566$ 105,122,485$
PLAN FIDUCIARY NET POSITION
Contributions - employer 2,466,165$ 2,532,317$ 2,806,983$ 3,396,834$
Contributions - member 644,384 606,932 668,070 678,476
Net investment income 3,963,252 1,806,126 3,049,538 9,323,369
Benefit payments, including refunds of member contributions (4,158,988) (4,594,876) (4,981,207) (5,427,385)
Administrative expense (62,889) (62,136) (55,257) (50,783)
Net change in plan fiduciary net position 2,851,924 288,363 1,488,127 7,920,511
Plan fiduciary net position - beginning 53,716,415 56,568,339 56,856,702 58,344,829
PLAN FIDUCIARY NET POSITION - ENDING 56,568,339$ 56,856,702$ 58,344,829$ 66,265,340$
EMPLOYER'S NET PENSION LIABILITY 29,335,858$ 41,490,012$ 42,652,737$ 38,857,145$
Plan fiduciary net position
as a percentage of the total pension liability 65.85% 57.81% 57.77% 63.04%
Covered-employee payroll 6,495,510$ 6,441,588$ 6,981,704$ 7,284,199$
Employer's net pension liability
as a percentage of covered-employee payroll 451.60% 644.10% 610.90% 533.40%
Notes to Required Supplementary Information
Year Ended December 31, 2017 - There were changes in assumptions related to the mortality rates from December 31, 2016.
Ultimately, this schedule should present return information for the last ten years. However, until ten years of information can be compiled,
information will be presented for as many years as is available.
VILLAGE OF MOUNT PROSPECT, ILLINOIS
Last Four Fiscal Years
FIREFIGHTERS' PENSION FUND
NET PENSION LIABILITY AND RELATED RATIOS
SCHEDULE OF CHANGES IN THE EMPLOYER'S
Year Ended December 31, 2015 - There was a change with respect to the actuarial assumptions from the prior year to reflect revised
expectations with respect to mortality rates, turnover rates, and retirement rates.
Year Ended December 31, 2014 - There was a change with respect to the actuarial assumptions from the prior year to reflect revised
expectations with respect to mortality rates, turnover rates, and retirement rates.
Year Ended December 31, 2016 - There was a change in assumption related to the discount rate made since the prior measurement date. The
discount rate used in the current actuarial valuation, dated December 31, 2016, is 7.25%. The discount rate used in the prior actuarial
valuation, dated December 31, 2015, was 7.50%. There was also a change in assumption related to the projected rate for annual pay increases
made since the prior measurement date. The projected rate for annual pay increases used in the current actuarial valuation, dated December 31,
2016, is 4.00%. The projected rate for annual pay increases used in the prior actuarial valuation, dated December 31, 2015, was 5.00%. There
was also a change in assumption made since the prior measurement date to reflect revised expectations with respect to mortality rates.
(See independent auditor's report.)- 87 -

FISCAL YEAR ENDED DECEMBER 31, 2014 2015 2016 2017
Annual money-weighted rate of return,
net of investment expense 6.92% 0.92% 7.15% 14.29%
Last Four Fiscal Years
POLICE PENSION FUND
SCHEDULE OF INVESTMENT RETURNS
VILLAGE OF MOUNT PROSPECT, ILLINOIS
Ultimately, this schedule should present return information for the last ten years. However, until ten years of
information can be compiled, information will be presented for as many years as is available.
(See independent auditor's report.)- 88 -

FISCAL YEAR ENDED DECEMBER 31, 2014 2015 2016 2017
Annual money-weighted rate of return,
net of investment expense 7.60% 3.38% 5.58% 16.49%
Ultimately, this schedule should present return information for the last ten years. However, until ten years of
information can be compiled, information will be presented for as many years as is available.
VILLAGE OF MOUNT PROSPECT, ILLINOIS
Last Four Fiscal Years
FIREFIGHTERS' PENSION FUND
SCHEDULE OF INVESTMENT RETURNS
(See independent auditor's report.)- 89 -

- 72 -
VILLAGE OF MOUNT PROSPECT, ILLINOIS
NOTES TO REQUIRED SUPPLEMENTARY INFORMATION
December 31, 2017
BUDGETS
a. All departments of the Village submit requests for appropriation to the Village Manager so
that a budget may be prepared. The budget is prepared by fund and includes information on
the past year, current year estimates, and requested appropriations for the next fiscal year.
Budgets are adopted on a basis consistent with generally accepted accounting principles.
Annual appropriated budgets are adopted for the General, Special Revenue, Debt Service,
Capital Projects, Enterprise, Internal Service, and Pension Trust Funds. All annual
appropriations lapse at fiscal year end.
The proposed budget is presented to the governing body for review. The governing body
holds public hearings and may add to, subtract from, or change appropriations, but may not
change the form of the budget.
The Village Manager is authorized to transfer budgeted amounts between departments
within any fund; however, any revisions that alter the total expenditures of any fund must
be approved by the governing body. Expenditures may not legally exceed budgeted
appropriations at the fund level. During the year, budget amendments were approved by
the Village Board of Trustees. The budget figures included in this report reflect all budget
amendments made during the year.
b. Excess of Actual Expenditures over Budget in Individual Funds
The following individual funds exceeded the budgets/appropriations in the following
amounts:
Fund
Actual
Expenditures/
Expenses
Final
Budget/
Appropriation
Risk Management Fund $ 8,752,275 $ 8,441,820
- 90 -

COMBINING AND INDIVIDUAL FUND
FINANCIAL STATEMENTS AND SCHEDULES

MAJOR GOVERNMENTAL FUNDS
GENERAL FUND
General Fund - to account for all financial resources of the general government, except those
accounted for in another fund.
SPECIAL REVENUE FUND
The Refuse Disposal Fund - to account for the revenues and expenditures associated with
providing solid waste collection services. Financing is provided by user fees and recycling
income. The Village has elected to present the Refuse Disposal Fund as a major fund.
DEBT SERVICE FUND
Debt Service Fund - to accumulate monies for payment of principal and interest on general
obligation bonds, IEPA loans, and installment notes.

SCHEDULE OF REVENUES - BUDGET AND ACTUAL
GENERAL FUND
For the Year Ended December 31, 2017
Original Final Actual
TAXES
Property taxes - general 10,089,000$ 10,089,000$ 9,969,346$
Property taxes - police pension 3,367,000 3,367,000 3,337,700
Property taxes - firefighters' pension 2,707,000 2,707,000 2,686,526
Road and bridge property taxes 115,000 115,000 118,467
Auto rental tax 20,000 20,000 17,967
Food and beverage tax 773,000 773,000 839,472
Real estate transfer tax 1,075,000 1,190,500 1,190,331
Hotel/motel tax 300,000 300,000 249,175
Telecommunications tax 2,100,000 2,100,000 1,890,752
Home rule sales tax 1,450,000 1,450,000 1,341,253
Gas utility tax 515,000 515,000 491,142
Electronic games tax - 26,000 -
Electric utility tax 1,150,000 1,150,000 1,109,579
Total taxes 23,661,000 23,802,500 23,241,710
LICENSES, PERMITS, AND FEES
Liquor licenses 180,000 180,000 181,523
Business licenses 160,000 160,000 148,514
Contractor licenses 55,000 55,000 52,835
Alarm licenses 44,000 44,000 46,130
Elevator licenses 25,000 25,000 34,150
Building permit fees 550,000 550,000 557,680
Electrical permit fees 8,000 8,000 7,200
Permit penalties 1,000 1,000 -
Reinspection fees 50,000 50,000 45,100
Vacant structure registration fees 2,000 2,000 11,500
Truck rental fees 1,000 1,000 2,005
Utility permit fees 4,000 4,000 4,950
Plan examination fees 7,000 7,000 15,402
Stormwater detention 10,000 10,000 -
Street opening fees 2,000 2,000 100
ZBA hearing fees 15,000 15,000 16,250
Public improvement inspections 15,000 81,000 80,502
Village impact fees - - 8,100
False alarm fees 8,000 8,000 10,250
Landlord/tenant fees 300,000 300,000 294,541
Cable TV franchise 844,000 844,000 817,500
Total licenses, permits, and fees 2,281,000 2,347,000 2,334,232
INTERGOVERNMENTAL
State sales tax 17,150,000 17,150,000 18,117,489
State income tax 5,543,000 5,543,000 4,975,194
State use tax 1,272,000 1,383,000 1,372,782
Charitable games tax 4,000 4,000 6,236
Budget
VILLAGE OF MOUNT PROSPECT, ILLINOIS
(This schedule is continued on the following pages.)- 91 -

SCHEDULE OF REVENUES - BUDGET AND ACTUAL (Continued)
GENERAL FUND
For the Year Ended December 31, 2017
Original Final Actual
INTERGOVERNMENTAL (Continued)
Replacement taxes 302,000$ 449,500$ 449,104$
Replacement taxes - road and bridge 8,000 8,000 7,032
Grant - tobacco enforcement 2,700 2,700 -
Grant - body armor 6,840 6,840 6,371
Grant - NACCHO 2,000 2,000 263
Grant - SAFER 717,500 717,500 739,024
Grant - AFG Grant - 160,000 159,682
Total intergovernmental 25,008,040 25,426,540 25,833,177
CHARGES FOR SERVICES
Water and sewer service charge - - 450
Maintenance of state highways 105,000 105,000 100,460
Ambulance transport fees 1,133,000 1,133,000 1,101,619
Forest River Rural FPD 53,000 53,000 52,950
Cable programming fees 27,255 27,255 -
Other programs 40,500 40,500 60,346
Special detail revenue 42,000 42,000 42,239
Police training revenue 5,000 5,000 7,633
Fire training revenue 20,000 20,000 21,563
Lease payments - cell tower 141,000 141,000 122,357
General store lease 16,200 16,200 17,551
Total charges for services 1,582,955 1,582,955 1,527,168
FINES AND FORFEITS
Fines - parking 250,000 250,000 254,101
Fines - local ordinances 5,000 5,000 100
Fines - code enforcement 20,000 20,000 9,859
Fines - circuit court 144,000 144,000 110,873
Fines - parental responsibility 3,000 3,000 1,050
Forfeited escrow funds 30,000 30,000 39,206
Total fines and forfeits 452,000 452,000 415,189
INVESTMENT INCOME
Investment income 41,000 149,000 126,693
Interest - escrow funds 2,000 2,000 6,232
Total investment income 43,000 151,000 132,925
MISCELLANEOUS
Reimburse - high school youth officer 95,500 95,500 94,955
Reimburse - Library 28,000 28,000 27,351
Shared cost - sidewalk 15,000 15,000 15,029
Shared cost - tree replacement 30,000 30,000 2,423
Reimburse - village property 15,000 15,000 4,498
VILLAGE OF MOUNT PROSPECT, ILLINOIS
Budget
(This schedule is continued on the following page.)- 92 -

SCHEDULE OF REVENUES - BUDGET AND ACTUAL (Continued)
GENERAL FUND
For the Year Ended December 31, 2017
Original Final Actual
VILLAGE OF MOUNT PROSPECT, ILLINOIS
Budget
MISCELLANEOUS (Continued)
Other reimbursements 25,000$ 25,000$ 17,087$
Human services revenue 16,000 16,000 12,270
Fire and police reports 5,000 5,000 5,755
Animal release fees 1,000 1,000 275
Subpoena fees 1,000 1,000 325
Other revenue 72,100 676,600 137,594
Total miscellaneous 303,600 908,100 317,562
TOTAL REVENUES 53,331,595$ 54,670,095$ 53,801,963$
(See independent auditor's report.)- 93 -

SCHEDULE OF EXPENDITURES - BUDGET AND ACTUAL
GENERAL FUND
For the Year Ended December 31, 2017
Original Final Actual
GENERAL GOVERNMENT
Public representation - administration 173,847$ 163,600$ 134,039$
Village administration 4,224,906 4,780,126 4,730,808
Finance department 2,570,392 2,570,392 2,466,917
Community development - administration 865,651 948,257 933,069
Benefit payments 46,781 46,781 46,780
Total general government 7,881,577 8,509,156 8,311,613
PUBLIC SAFETY
Community development - code enforcement 911,898 829,292 820,925
Police department 18,177,171 18,229,821 17,823,169
Fire department 15,003,170 15,609,220 15,522,366
Total public safety 34,092,239 34,668,333 34,166,460
HIGHWAYS AND STREETS
Public works department 8,282,369 8,282,369 7,613,341
Total highways and streets 8,282,369 8,282,369 7,613,341
HEALTH
Community development - health 248,627 248,627 261,533
WELFARE
Human services department 1,133,296 1,155,389 1,117,710
Community development - housing 458,315 458,315 430,779
Total welfare 1,591,611 1,613,704 1,548,489
CULTURE AND RECREATION
Public representation - community and
civic services 635,172 635,172 585,907
TOTAL EXPENDITURES 52,731,595$ 53,957,361$ 52,487,343$
Budget
VILLAGE OF MOUNT PROSPECT, ILLINOIS
(See independent auditor's report.)- 94 -

SCHEDULE OF DETAILED EXPENDITURES - BUDGET AND ACTUAL
GENERAL FUND
For the Year Ended December 31, 2017
Original Final Actual
GENERAL GOVERNMENT
Public representation - administration
Mayor and Board of Trustees
Personal services 43,524$ 36,657$ 37,280$
Employee benefits 11,523 8,143 7,749
Other employee costs 5,900 5,900 4,900
Contractual services 105,551 105,551 75,744
Utilities 449 449 410
Office equipment 1,800 1,800 -
Commodities and supplies 5,100 5,100 7,956
Total public representation - administration 173,847 163,600 134,039
Village administration
Village Manager's office
Personal services 424,922 424,922 467,322
Employee benefits 151,850 151,850 191,291
Other employee costs 21,100 21,100 12,894
Contractual services 82,611 82,611 58,479
Utilities 3,625 3,625 3,718
Commodities and supplies 6,466 6,466 5,215
Office and other equipment 200 200 -
Total Village Manager's office 690,774 690,774 738,919
Legal services
Contractual services 662,500 662,500 898,409
Human resources
Personal services 175,917 175,917 180,078
Employee benefits 120,614 120,614 174,627
Other employee costs 69,600 69,600 48,218
Contractual services 37,650 37,650 37,644
Commodities and supplies 1,200 1,200 800
Total human resources 404,981 404,981 441,367
Information technology
Personal services 543,294 543,294 543,599
Employee benefits 208,322 208,322 208,071
Other employee costs 13,864 20,364 11,773
Contractual services 768,471 768,471 608,885
Utilities 5,518 5,518 4,875
Commodities and supplies 4,645 4,645 1,008
Office and other equipment 5,760 5,760 465
Total information technology 1,549,874 1,556,374 1,378,676
Budget
VILLAGE OF MOUNT PROSPECT, ILLINOIS
(This schedule is continued on the following pages.)- 95 -

Original Final Actual
GENERAL GOVERNMENT (Continued)
Village administration (Continued)
Communication division
Communications
Personal services 81,601$ 81,601$ 82,903$
Employee benefits 41,880 41,880 44,950
Other employee costs 2,650 2,650 2,394
Contractual services 77,299 77,299 59,157
Commodities and supplies 1,624 1,624 1,425
Total communications 205,054 205,054 190,829
Television services
Personal services 61,202 61,202 59,498
Employee benefits 31,810 31,810 28,977
Contractual services 29,590 29,590 24,999
Utilities 1,678 1,678 1,515
Commodities and supplies 4,500 4,500 4,018
Office and other equipment 22,900 22,900 18,569
Total television services 151,680 151,680 137,576
Community engagement
Personal services 61,800 68,667 48,829
Employee benefits 30,400 33,780 24,403
Other employee costs 8,200 8,200 1,242
Contractual services 71,573 71,573 84,350
Utilities 920 920 785
Commodities and supplies 1,381 1,381 152
Total communication engagement 174,274 184,521 159,761
Total communication division 531,008 541,255 488,166
Property acquisition and relocation expense
Contractual services - 503,473 503,473
Village Clerk's office
Administration and support
Personal services 142,946 142,946 84,153
Employee benefits 75,437 75,437 35,755
Other employee costs 1,367 1,367 1,476
Contractual services 31,317 31,317 23,240
Utilities 839 839 758
Commodities and supplies 1,082 1,082 1,092
Total Village Clerk's office 252,988 252,988 146,474
Computer hardware/software
Office and other equipment 132,781 167,781 135,324
Total computer hardware/software 132,781 167,781 135,324
Total Village administration 4,224,906 4,780,126 4,730,808
Budget
For the Year Ended December 31, 2017
VILLAGE OF MOUNT PROSPECT, ILLINOIS
SCHEDULE OF DETAILED EXPENDITURES - BUDGET AND ACTUAL (Continued)
GENERAL FUND
(This schedule is continued on the following pages.)- 96 -

Original Final Actual
Budget
For the Year Ended December 31, 2017
VILLAGE OF MOUNT PROSPECT, ILLINOIS
SCHEDULE OF DETAILED EXPENDITURES - BUDGET AND ACTUAL (Continued)
GENERAL FUND
GENERAL GOVERNMENT (Continued)
Finance department
Administration and support
Personal services 148,341$ 148,341$ 148,339$
Employee benefits 41,586 41,586 43,436
Other employee costs 28,735 28,735 20,142
Contractual services 262,322 262,322 199,538
Utilities 5,500 5,500 4,741
Commodities and supplies 20,663 20,663 15,089
Office and other equipment 673,211 673,211 676,637
Total administration and support 1,180,358 1,180,358 1,107,922
Accounting
Personal services 361,627 361,627 349,979
Employee benefits 122,773 122,773 150,119
Other employee costs 1,530 1,530 -
Contractual services 4,392 4,392 1,910
Commodities and supplies 16,422 16,422 7,267
Total accounting 506,744 506,744 509,275
Insurance
Personal services 37,265 37,265 37,265
Employee benefits 10,578 10,578 12,216
Insurance 406,258 406,258 401,291
Total insurance 454,101 454,101 450,772
Customer service
Personal services 256,132 256,132 251,268
Employee benefits 83,887 83,887 81,532
Contractual services 70,955 70,955 57,304
Other employee costs 2,205 2,205 -
Commodities and supplies 16,010 16,010 8,844
Total customer service 429,189 429,189 398,948
Total finance department 2,570,392 2,570,392 2,466,917
Community development - administration
Administration and support
Personal services 232,909 290,922 272,413
Employee benefits 104,557 124,243 120,929
Other employee costs 4,846 7,066 4,575
Utilities 2,234 2,234 758
Commodities and supplies 1,082 1,082 328
Total administration and support 345,628 425,547 399,003
(This schedule is continued on the following pages.)- 97 -

Original Final Actual
Budget
For the Year Ended December 31, 2017
VILLAGE OF MOUNT PROSPECT, ILLINOIS
SCHEDULE OF DETAILED EXPENDITURES - BUDGET AND ACTUAL (Continued)
GENERAL FUND
GENERAL GOVERNMENT (Continued)
Community development - administration (Continued)
Planning and zoning
Personal services 210,905$ 210,905$ 204,708$
Employee benefits 89,120 89,120 96,015
Other employee costs 7,747 7,747 4,894
Contractual services 24,449 26,899 38,371
Utilities 1,298 580 643
Commodities and supplies 3,924 2,192 2,275
Total planning and zoning 337,443 337,443 346,906
Economic development
Personal services 37,387 40,074 77,772
Employee benefits 11,070 11,070 20,376
Other employee costs 1,623 1,623 1,188
Contractual services 132,500 132,500 87,824
Total economic development 182,580 185,267 187,160
Total community development - administration 865,651 948,257 933,069
Benefit payments
Contractual services 46,781 46,781 46,780
Total benefit payments 46,781 46,781 46,780
Total general government 7,881,577 8,509,156 8,311,613
PUBLIC SAFETY
Community development - code enforcement
Building inspections
Personal services 331,061 270,361 353,610
Employee benefits 163,124 143,438 172,245
Other employee costs 7,909 5,689 4,516
Contractual services 391,438 391,438 274,243
Utilities 9,861 9,861 8,766
Commodities and supplies 8,505 8,505 7,545
Total community development - code enforcement 911,898 829,292 820,925
Police department
Administration and support
Personal services 786,865 786,865 866,947
Employee benefits 4,236,887 4,236,887 4,266,050
Other employee costs 170,500 175,500 143,331
Contractual services 129,410 149,360 105,586
Utilities 33,973 33,973 27,705
Commodities and supplies 26,123 31,623 25,779
Office and other equipment 9,250 24,250 12,584
Total administration and support 5,393,008 5,438,458 5,447,982
(This schedule is continued on the following pages.)- 98 -

Original Final Actual
Budget
For the Year Ended December 31, 2017
VILLAGE OF MOUNT PROSPECT, ILLINOIS
SCHEDULE OF DETAILED EXPENDITURES - BUDGET AND ACTUAL (Continued)
GENERAL FUND
PUBLIC SAFETY (Continued)
Police department (Continued)
Records
Personal services 325,556$ 325,556$ 311,925$
Employee benefits 119,704 119,704 124,981
Total records 445,260 445,260 436,906
Patrol and traffic enforcement
Personal services 7,585,181 7,585,181 7,317,057
Employee benefits 1,349,136 1,349,136 1,359,300
Contractual services 599,050 593,550 583,639
Commodities and supplies 92,420 101,120 92,740
Office and other equipment 7,230 7,230 5,506
Total patrol and traffic enforcement 9,633,017 9,636,217 9,358,242
Crime prevention and public services
Personal services 130,841 130,841 133,614
Employee benefits 36,309 36,309 30,837
Other employee costs 2,500 2,500 2,445
Contractual services 4,252 4,252 710
Commodities and supplies 9,820 11,320 16,041
Total crime prevention and public services 183,722 185,222 183,647
Investigative
Personal services 1,476,240 1,476,240 1,407,849
Employee benefits 219,282 219,282 212,714
Contractual services 41,680 41,680 26,825
Utilities 13,650 13,650 10,049
Commodities and supplies 4,230 4,230 1,266
Office and other equipment 800 800 750
Total investigative 1,755,882 1,755,882 1,659,453
Equipment maintenance
Contractual services 741,282 738,782 713,389
Commodities and supplies 16,300 16,300 14,606
Office and other equipment 8,700 13,700 8,944
Total equipment maintenance 766,282 768,782 736,939
Total police department 18,177,171 18,229,821 17,823,169
(This schedule is continued on the following pages.)- 99 -

Original Final Actual
Budget
For the Year Ended December 31, 2017
VILLAGE OF MOUNT PROSPECT, ILLINOIS
SCHEDULE OF DETAILED EXPENDITURES - BUDGET AND ACTUAL (Continued)
GENERAL FUND
PUBLIC SAFETY (Continued)
Fire department
Administration and support
Personal services 643,488$ 643,488$ 663,456$
Employee benefits 3,720,719 3,821,719 3,818,296
Other employee costs 93,360 93,360 59,906
Contractual services 49,590 49,720 51,773
Commodities and supplies 11,015 11,270 8,930
Office and other equipment 1,350 1,795 1,487
Total administration and support 4,519,522 4,621,352 4,603,848
Fire department operations
Personal services 7,250,928 7,583,928 7,508,462
Employee benefits 1,215,768 1,215,768 1,296,726
Other employee costs 90,375 82,375 79,765
Contractual services 184,238 186,793 182,184
Commodities and supplies 15,270 15,970 14,559
Office and other equipment 107,817 282,982 277,268
Total fire department operations 8,864,396 9,367,816 9,358,964
Fire prevention
Personal services 270,708 264,708 256,170
Employee benefits 115,465 115,465 108,442
Other employee costs 5,850 5,850 4,449
Contractual services 10,500 10,500 9,768
Commodities and supplies 12,020 11,620 11,851
Total fire prevention 414,543 408,143 390,680
Communications
Contractual services 3,670 3,670 2,184
Utilities 62,860 62,860 51,197
Commodities and supplies 1,590 1,590 1,429
Office and other equipment 15,650 16,850 15,733
Total communications 83,770 84,970 70,543
Equipment maintenance
Contractual services 864,637 864,637 864,637
Total equipment maintenance 864,637 864,637 864,637
Emergency preparedness
Personal services 128,486 134,486 145,301
Employee benefits 49,872 49,872 47,413
Other employee costs 3,000 825 940
Contractual services 4,000 4,000 3,352
Commodities and supplies 6,520 8,695 8,228
Total emergency preparedness 191,878 197,878 205,234
(This schedule is continued on the following pages.)- 100 -

Original Final Actual
Budget
For the Year Ended December 31, 2017
VILLAGE OF MOUNT PROSPECT, ILLINOIS
SCHEDULE OF DETAILED EXPENDITURES - BUDGET AND ACTUAL (Continued)
GENERAL FUND
PUBLIC SAFETY (Continued)
Fire department (Continued)
Paid on call
Personal services 26,252$ 26,252$ 11,759$
Employee benefits 1,522 1,522 901
Other employee costs 11,150 11,150 4,285
Office and other equipment 1,660 1,660 1,660
Total paid on call 40,584 40,584 18,605
Computer hardware and software
Capital expenditure 23,840 23,840 9,855
Total fire department 15,003,170 15,609,220 15,522,366
Total public safety 34,092,239 34,668,333 34,166,460
HIGHWAYS AND STREETS
Public works department
Administration and support
Personal services 272,531 272,531 230,518
Employee benefits 171,700 171,700 162,312
Other employee costs 30,879 30,879 30,470
Contractual services 1,117,520 1,117,520 1,114,579
Utilities 14,744 14,744 12,714
Commodities and supplies 15,713 15,713 17,228
Office and other equipment 1,573 1,573 1,535
Total administration and support 1,624,660 1,624,660 1,569,356
Street and buildings division
Administration
Personal services 101,781 101,781 107,602
Employee benefits 45,462 45,462 72,333
Utilities 4,000 4,000 3,224
Commodities and supplies 270 270 -
Total administration 151,513 151,513 183,159
Maintenance - public buildings
Personal services 448,531 448,531 453,070
Employee benefits 159,427 159,427 180,430
Contractual services 376,011 376,011 302,497
Utilities 54,331 54,331 13,508
Commodities and supplies 123,351 123,351 110,201
Other expenditures 12,092 12,092 4,704
Total maintenance - public buildings 1,173,743 1,173,743 1,064,410
(This schedule is continued on the following pages.)- 101 -

Original Final Actual
Budget
For the Year Ended December 31, 2017
VILLAGE OF MOUNT PROSPECT, ILLINOIS
SCHEDULE OF DETAILED EXPENDITURES - BUDGET AND ACTUAL (Continued)
GENERAL FUND
HIGHWAYS AND STREETS (Continued)
Public works department (Continued)
Street and buildings division (Continued)
Street maintenance
Personal services 132,850$ 132,850$ 118,729$
Employee benefits 49,547 49,547 47,653
Contractual services 465,896 465,896 289,445
Commodities and supplies 163,105 163,105 136,329
Total street maintenance 811,398 811,398 592,156
Snow removal
Personal services 332,695 332,695 307,937
Employee benefits 124,742 124,742 121,753
Contractual services 124,867 124,867 75,297
Commodities and supplies 13,957 13,957 13,077
Office and other equipment 15,918 15,918 11,539
Total snow removal 612,179 612,179 529,603
Storm sewer/basin maintenance
Personal services 71,196 71,196 63,913
Employee benefits 23,662 23,662 21,064
Contractual services 12,634 12,634 9,380
Commodities and supplies 7,828 7,828 7,799
Total storm sewer/basin maintenance 115,320 115,320 102,156
Maintenance of state highways
Personal services 32,128 32,128 30,184
Employee benefits 13,271 13,271 12,169
Contractual services 19,204 19,204 15,859
Commodities and supplies 31,048 31,048 20,674
Total maintenance of state highways 95,651 95,651 78,886
Traffic sign maintenance
Personal services 86,773 86,773 85,385
Employee benefits 30,051 30,051 30,721
Commodities and supplies 24,999 24,999 24,915
Total traffic sign maintenance 141,823 141,823 141,021
Total street and buildings division 3,101,627 3,101,627 2,691,391
Forestry division
Administration and support
Personal services 104,011 104,011 98,605
Employee benefits 35,897 35,897 33,449
Commodities and supplies 450 450 270
Total administration and support 140,358 140,358 132,324
(This schedule is continued on the following pages.)- 102 -

Original Final Actual
Budget
For the Year Ended December 31, 2017
VILLAGE OF MOUNT PROSPECT, ILLINOIS
SCHEDULE OF DETAILED EXPENDITURES - BUDGET AND ACTUAL (Continued)
GENERAL FUND
HIGHWAYS AND STREETS (Continued)
Public works department (Continued)
Forestry division (Continued)
Maintenance of grounds
Personal services 264,292$ 264,292$ 260,240$
Employee benefits 95,056 95,056 92,446
Contractual services 142,777 142,777 126,061
Commodities and supplies 9,369 9,369 9,363
Office and other equipment 48,168 48,168 43,358
Total maintenance of grounds 559,662 559,662 531,468
Forestry program
Personal services 348,537 348,537 341,865
Employee benefits 143,907 143,907 140,141
Other employee costs 6,336 6,336 6,336
Contractual services 455,420 455,420 407,729
Utilities 3,356 3,356 3,791
Commodities and supplies 11,583 11,583 11,151
Total forestry program 969,139 969,139 911,013
Public grounds beautification
Personal services 29,037 29,037 28,103
Employee benefits 9,493 9,493 9,439
Contractual services 2,598 2,598 949
Commodities and supplies 34,844 34,844 34,182
Total public grounds beautification 75,972 75,972 72,673
Total forestry division 1,745,131 1,745,131 1,647,478
Engineering division
Engineering services
Personal services 645,042 645,042 630,954
Employee benefits 217,713 217,713 224,525
Other employee costs 5,346 5,346 5,414
Contractual services 102,752 102,752 107,234
Utilities 5,200 5,200 5,458
Commodities and supplies 5,743 5,743 5,581
Office and other equipment 2,361 2,361 1,513
Total engineering services 984,157 984,157 980,679
Traffic control and street lighting
Personal services 128,902 128,902 125,580
Employee benefits 49,233 49,233 55,288
Contractual services 16,469 16,469 15,649
Utilities 72,000 72,000 64,786
Commodities and supplies 26,990 26,990 22,341
Total traffic control and street lighting 293,594 293,594 283,644
Total engineering division 1,277,751 1,277,751 1,264,323
(This schedule is continued on the following pages.)- 103 -

Original Final Actual
Budget
For the Year Ended December 31, 2017
VILLAGE OF MOUNT PROSPECT, ILLINOIS
SCHEDULE OF DETAILED EXPENDITURES - BUDGET AND ACTUAL (Continued)
GENERAL FUND
HIGHWAYS AND STREETS (Continued)
Capital expenditures
Infrastructure
Resurfacing/curbs 250,200$ 250,200$ 233,480$
Miscellaneous - forestry 283,000 283,000 207,313
Total capital expenditures 533,200 533,200 440,793
Total highways and streets 8,282,369 8,282,369 7,613,341
HEALTH
Community development - health
Health inspections
Personal services 157,070 157,070 154,716
Employee benefits 76,637 76,637 75,198
Other employee costs 1,423 1,423 540
Contractual services 9,164 9,164 29,503
Utilities 1,935 1,935 606
Commodities and supplies 2,398 2,398 970
Total health 248,627 248,627 261,533
WELFARE
Human services department
Administration and support
Personal services 141,866 141,866 147,808
Employee benefits 82,598 82,598 89,455
Other employee costs 1,645 1,645 808
Contractual services 24,088 45,028 36,515
Utilities 7,030 7,030 4,781
Commodities and supplies 3,281 4,434 2,779
Office and other equipment 514 514 387
Total administration and support 261,022 283,115 282,533
Social services
Personal services 224,553 224,553 216,816
Employee benefits 83,411 83,411 79,715
Other employee costs 2,897 2,897 2,405
Commodities and supplies 520 520 185
Total social services 311,381 311,381 299,121
Nursing/health services
Personal services 114,318 114,318 110,129
Employee benefits 47,645 47,645 49,084
Other employee costs 819 819 593
Contractual services 411 411 -
Commodities and supplies 4,588 4,588 3,152
Total nursing/health services 167,781 167,781 162,958
(This schedule is continued on the following pages.)- 104 -

Original Final Actual
Budget
For the Year Ended December 31, 2017
VILLAGE OF MOUNT PROSPECT, ILLINOIS
SCHEDULE OF DETAILED EXPENDITURES - BUDGET AND ACTUAL (Continued)
GENERAL FUND
WELFARE (Continued)
Human services department (Continued)
Community Connections Center
Personal services 205,215$ 205,215$ 202,520$
Employee benefits 83,600 83,600 79,834
Other employee costs 1,968 1,968 1,460
Contractual services 97,250 97,250 85,494
Utilities 2,690 2,690 2,640
Commodities and supplies 2,389 2,389 1,150
Total Community Connections Center 393,112 393,112 373,098
Total human services department 1,133,296 1,155,389 1,117,710
Community development - housing
Housing inspections
Personal services 268,828 268,828 247,593
Employee benefits 108,761 108,761 111,348
Other employee costs 5,295 5,295 1,255
Contractual services 65,211 65,211 67,164
Utilities 5,298 5,298 606
Commodities and supplies 4,922 4,922 2,813
Total community development - housing 458,315 458,315 430,779
Total welfare 1,591,611 1,613,704 1,548,489
CULTURE AND RECREATION
Community groups and miscellaneous
Contractual services 155,230 155,230 179,837
Other expenditures 7,000 7,000 4,035
Total community groups and miscellaneous 162,230 162,230 183,872
Public relations - community and civic services
4th of July and civic events
Personal services 156,058 156,058 134,002
Employee benefits 50,590 50,590 40,622
Contractual services 59,353 59,353 41,746
Commodities and supplies 40,554 40,554 31,279
Total 4th of July and civic events 306,555 306,555 247,649
Centennial commission
Contractual services 19,800 19,800 21,040
Commodities and supplies 35,000 35,000 30,212
Total centennial commission 54,800 54,800 51,252
(This schedule is continued on the following page.)- 105 -

Original Final Actual
Budget
For the Year Ended December 31, 2017
VILLAGE OF MOUNT PROSPECT, ILLINOIS
SCHEDULE OF DETAILED EXPENDITURES - BUDGET AND ACTUAL (Continued)
GENERAL FUND
CULTURE AND RECREATION (Continued)
Public relations - community and civic services (Continued)
Holiday decorations
Personal services 10,198$ 10,198$ 8,152$
Employee benefits 2,845 2,845 2,435
Contractual services 71,726 71,726 66,580
Commodities and supplies 23,272 23,272 23,212
Total holiday decorations 108,041 108,041 100,379
Blood drive program
Personal services 1,844 1,844 1,843
Employee benefits 142 142 141
Commodities and supplies 1,560 1,560 771
Total blood drive program 3,546 3,546 2,755
Total culture and recreation 635,172 635,172 585,907
TOTAL EXPENDITURES 52,731,595$ 53,957,361$ 52,487,343$
(See independent auditor's report.)- 106 -
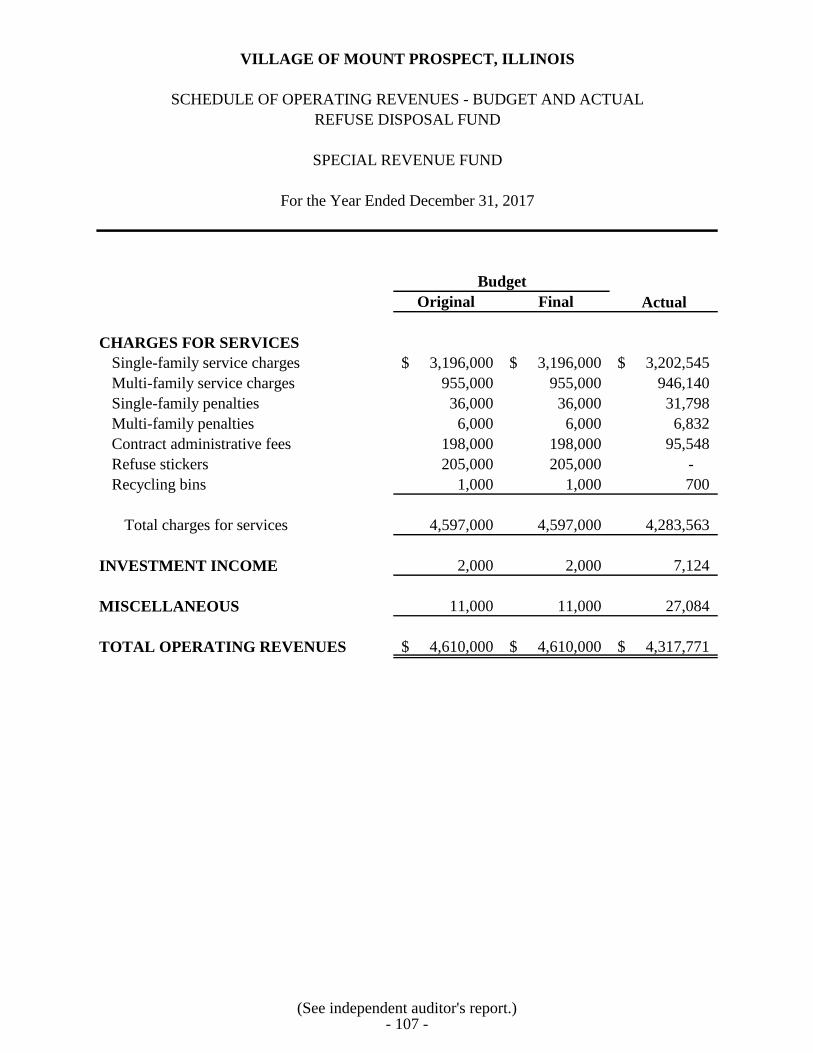
VILLAGE OF MOUNT PROSPECT, ILLINOIS
SCHEDULE OF OPERATING REVENUES - BUDGET AND ACTUAL
REFUSE DISPOSAL FUND
SPECIAL REVENUE FUND
For the Year Ended December 31, 2017
Original Final Actual
CHARGES FOR SERVICES
Single-family service charges 3,196,000$ 3,196,000$ 3,202,545$
Multi-family service charges 955,000 955,000 946,140
Single-family penalties 36,000 36,000 31,798
Multi-family penalties 6,000 6,000 6,832
Contract administrative fees 198,000 198,000 95,548
Refuse stickers 205,000 205,000 -
Recycling bins 1,000 1,000 700
Total charges for services 4,597,000 4,597,000 4,283,563
INVESTMENT INCOME 2,000 2,000 7,124
MISCELLANEOUS 11,000 11,000 27,084
TOTAL OPERATING REVENUES 4,610,000$ 4,610,000$ 4,317,771$
Budget
(See independent auditor's report.)- 107 -
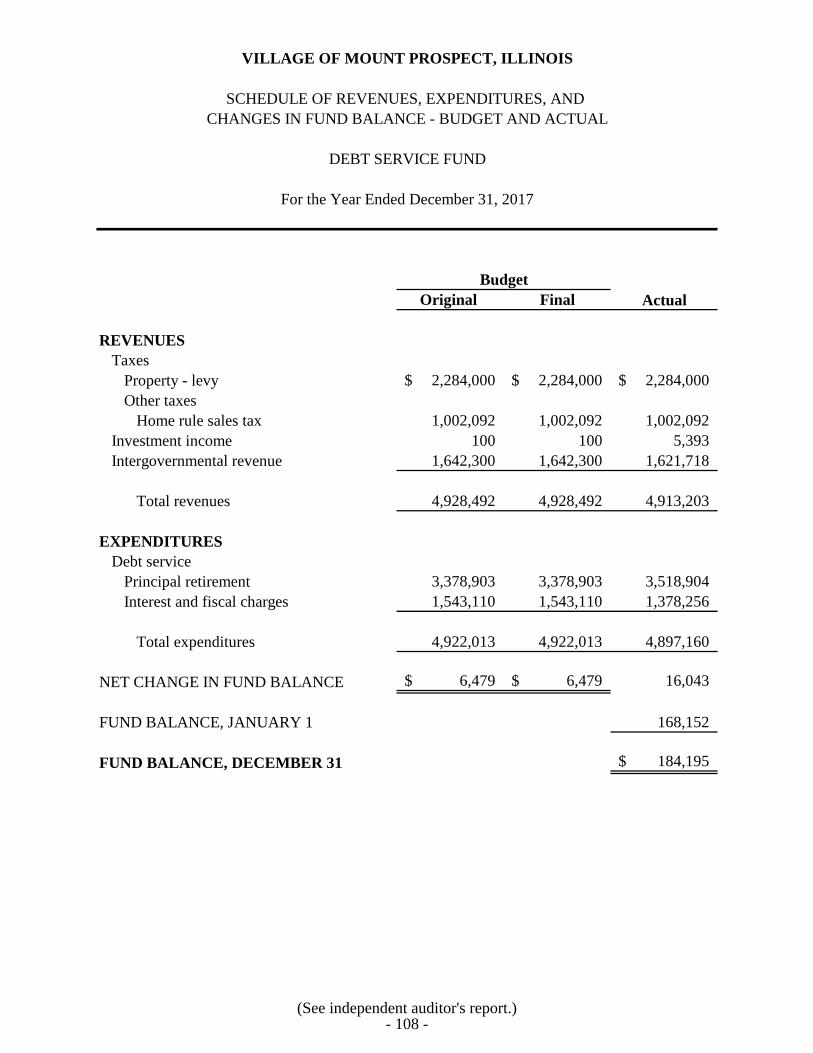
Original Final Actual
REVENUES
Taxes
Property - levy 2,284,000$ 2,284,000$ 2,284,000$
Other taxes
Home rule sales tax 1,002,092 1,002,092 1,002,092
Investment income 100 100 5,393
Intergovernmental revenue 1,642,300 1,642,300 1,621,718
Total revenues 4,928,492 4,928,492 4,913,203
EXPENDITURES
Debt service
Principal retirement 3,378,903 3,378,903 3,518,904
Interest and fiscal charges 1,543,110 1,543,110 1,378,256
Total expenditures 4,922,013 4,922,013 4,897,160
NET CHANGE IN FUND BALANCE 6,479$ 6,479$ 16,043
FUND BALANCE, JANUARY 1 168,152
FUND BALANCE, DECEMBER 31 184,195$
Budget
For the Year Ended December 31, 2017
VILLAGE OF MOUNT PROSPECT, ILLINOIS
SCHEDULE OF REVENUES, EXPENDITURES, AND
CHANGES IN FUND BALANCE - BUDGET AND ACTUAL
DEBT SERVICE FUND
(See independent auditor's report.)- 108 -

NONMAJOR GOVERNMENTAL FUNDS
NONMAJOR SPECIAL REVENUE FUNDS
Motor Fuel Tax Fund - to account for the activities involved with street maintenance and
construction. Financing is provided by the Village’s share of state gasoline taxes. State law
requires these gasoline taxes to be used to maintain streets.
Community Development Block Grant (CDBG) Fund - to account for the revenue and
expenditures associated with the CDBG. The grant is provided by the U.S. Department of
Housing and Urban Development to develop urban communities by expanding economic
opportunities and providing decent housing and a suitable living environment. The beneficiaries
of CDBG must be individuals with low and/or moderate incomes.
Asset Seizure Fund - to account for the revenues and expenditures associated with the asset
seizure program in which the Village participates. Funds received are restricted for use in the
fight against drugs.
Federal Equitable Share Fund - to account for the revenues and expenditures associated with the
Federal Shared Funds Program. The use of funds is restricted for use in the fight against drugs.
DUI Fines Fund - to account for revenues and expenditures associated with the Cook County
DUI fine program. Use of the funds is restricted to the fight against drunk driving.
Foreign Fire Insurance Fund - to account for revenues derived from the Foreign Fire Insurance
Tax and disbursement of these funds for the benefit, use, and maintenance related to the Fire
Department.
Business District Fund - to account for the revenues and expenditures associated with the
Business Districts within the Village. The Village currently has one Business District, the
Randhurst Village Business District Area.
Prospect/Main TIF District Fund - to account for the resources to acquire property and construct
certain improvements in the Prospect/Main Tax Incremental Financing District. Financing is
being provided by incremental property taxes and investment income.

NONMAJOR GOVERNMENTAL FUNDS (Continued)
NONMAJOR CAPITAL PROJECTS FUNDS
Capital Improvement Fund - to account for the resources to provide for certain capital
improvements and the replacement of village equipment. Financing is being provided by home
rule sales tax, developer contributions, transfers from other funds, and investment income.
Flood Control Construction Fund - to account for the resources to implement flood control
projects throughout the Village. Financing is provided by home rule sales taxes, service charges,
and investment income.
Street Improvement Construction Fund - to account for the resources to reconstruct the Village’s
streets. Financing is provided by various taxes, licenses, permits, fees, and investment income.

Special Capital
Revenue Projects Total
Cash and investments 8,748,239$ 3,209,472$ 11,957,711$
Receivables
Other taxes 209,724 1,058,450 1,268,174
Other 95,094 - 95,094
Due from other governments 506,518 - 506,518
Prepaid items 606 - 606
TOTAL ASSETS 9,560,181$ 4,267,922$ 13,828,103$
LIABILITIES
Accounts payable 1,682,689$ 438,675$ 2,121,364$
Retainage payable 2,504 162,841 165,345
Due to other funds - 87,192 87,192
Unearned revenue 499,036 - 499,036
Total liabilities 2,184,229 688,708 2,872,937
FUND BALANCES
Nonspendable
Prepaid items 606 - 606
Restricted
Highways and streets 6,688,899 - 6,688,899
Public safety - police 334,030 - 334,030
Public safety - fire 352,417 - 352,417
Assigned
Capital projects - 3,579,214 3,579,214
Total fund balances 7,375,952 3,579,214 10,955,166
TOTAL LIABILITIES AND
FUND BALANCES 9,560,181$ 4,267,922$ 13,828,103$
VILLAGE OF MOUNT PROSPECT, ILLINOIS
COMBINING BALANCE SHEET
NONMAJOR GOVERNMENTAL FUNDS
December 31, 2017
FUND BALANCES
ASSETS
LIABILITIES AND
(See independent auditor's report.)- 109 -

Special Capital
Revenue Projects Total
REVENUES
Other taxes 1,527,953$ 3,728,382$ 5,256,335$
Licenses, permits, and fees - 1,648,265 1,648,265
Intergovernmental 1,710,753 33,664 1,744,417
Investment income 27,991 23,562 51,553
Other reimbursements - 19,824 19,824
Miscellaneous 159,968 87,738 247,706
Total revenues 3,426,665 5,541,435 8,968,100
EXPENDITURES
Current
General government 1,749,291 - 1,749,291
Public safety 112,602 - 112,602
Highways and streets 1,148,795 - 1,148,795
Welfare 404,566 - 404,566
Capital outlay - 5,786,667 5,786,667
Total expenditures 3,415,254 5,786,667 9,201,921
EXCESS (DEFICIENCY) OF REVENUES
OVER EXPENDITURES 11,411 (245,232) (233,821)
OTHER FINANCING SOURCES (USES)
Issuance of debt 4,815,000 - 4,815,000
Premium on issuance of debt 115,835 - 115,835
Transfers in - 600,000 600,000
Total other financing sources (uses) 4,930,835 600,000 5,530,835
NET CHANGE IN FUND BALANCES 4,942,246 354,768 5,297,014
FUND BALANCES, JANUARY 1 2,433,706 3,224,446 5,658,152
FUND BALANCES, DECEMBER 31 7,375,952$ 3,579,214$ 10,955,166$
CHANGES IN FUND BALANCES
NONMAJOR GOVERNMENTAL FUNDS
For the Year Ended December 31, 2017
VILLAGE OF MOUNT PROSPECT, ILLINOIS
COMBINING STATEMENT OF REVENUES, EXPENDITURES, AND
(See independent auditor's report.)- 110 -

Community Federal
Motor Development Asset Equitable
Fuel Tax Block Grant Seizure Share
Cash and investments 2,695,243$ 24,583$ 180,542$ 20,194$
Receivables
Other taxes 119,690 - - -
Other 1,170 - - -
Due from other governments 9,247 495,820 1,451 -
Prepaid items - - - -
TOTAL ASSETS 2,825,350$ 520,403$ 181,993$ 20,194$
LIABILITIES
Accounts payable 80,878$ 20,633$ 9,085$ -$
Retainage payable - 734 - -
Unearned revenue - 499,036 - -
Total liabilities 80,878 520,403 9,085 -
FUND BALANCES
Nonspendable
Prepaid items - - - -
Restricted
Highways and streets 2,744,472 - - -
Public safety - police - - 172,908 20,194
Public safety - fire - - - -
Total fund balances 2,744,472 - 172,908 20,194
TOTAL LIABILITIES AND
FUND BALANCES 2,825,350$ 520,403$ 181,993$ 20,194$
ASSETS
LIABILITIES AND
FUND BALANCES
VILLAGE OF MOUNT PROSPECT, ILLINOIS
COMBINING BALANCE SHEET
NONMAJOR SPECIAL REVENUE FUNDS
December 31, 2017
- 111 -

Foreign
DUI Fire Business Prospect/Main
Fines Insurance District TIF Total
137,347$ 384,935$ 1,363,957$ 3,941,438$ 8,748,239$
- - 90,034 - 209,724
3,581 3,257 69,122 17,964 95,094
- - - - 506,518
- 6 - 600 606
140,928$ 388,198$ 1,523,113$ 3,960,002$ 9,560,181$
-$ 35,775$ 1,523,113$ 13,205$ 1,682,689$
- - - 1,770 2,504
- - - - 499,036
- 35,775 1,523,113 14,975 2,184,229
- 6 - 600 606
- - - 3,944,427 6,688,899
140,928 - - - 334,030
- 352,417 - - 352,417
140,928 352,423 - 3,945,027 7,375,952
140,928$ 388,198$ 1,523,113$ 3,960,002$ 9,560,181$
(See independent auditor's report.)- 112 -

Community Federal
Motor Development Asset Equitable
Fuel Tax Block Grant Seizure Share
REVENUES
Taxes -$ -$ -$ -$
Intergovernmental 1,381,615 273,344 29,172 -
Investment income 17,424 - 880 181
Miscellaneous 28,746 131,222 - -
Total revenues 1,427,785 404,566 30,052 181
EXPENDITURES
Current
General government - - - -
Public safety - - 30,223 -
Highways and streets 1,148,795 - - -
Welfare - 404,566 - -
Total expenditures 1,148,795 404,566 30,223 -
EXCESS (DEFICIENCY) OF REVENUES
OVER EXPENDITURES 278,990 - (171) 181
OTHER FINANCING SOURCES (USES)
Issuance of debt - - - -
Premium on issuance of debt - - - -
Total other financing sources (uses) - - - -
NET CHANGE IN FUND BALANCES 278,990 - (171) 181
FUND BALANCES (DEFICIT), JANUARY 1 2,465,482 - 173,079 20,013
FUND BALANCES, DECEMBER 31 2,744,472$ -$ 172,908$ 20,194$
VILLAGE OF MOUNT PROSPECT, ILLINOIS
COMBINING STATEMENT OF REVENUES, EXPENDITURES, AND
CHANGES IN FUND BALANCES
NONMAJOR SPECIAL REVENUE FUNDS
For the Year Ended December 31, 2017
- 113 -

Foreign
DUI Fire Business Prospect/Main
Fines Insurance District TIF Total
-$ 83,092$ 1,444,861$ -$ 1,527,953$
26,622 - - - 1,710,753
503 2,386 6,310 307 27,991
- - - - 159,968
27,125 85,478 1,451,171 307 3,426,665
- - 1,451,171 298,120 1,749,291
7,646 74,733 - - 112,602
- - - - 1,148,795
- - - - 404,566
7,646 74,733 1,451,171 298,120 3,415,254
19,479 10,745 - (297,813) 11,411
- - - 4,815,000 4,815,000
- - - 115,835 115,835
- - - 4,930,835 4,930,835
19,479 10,745 - 4,633,022 4,942,246
121,449 341,678 - (687,995) 2,433,706
140,928$ 352,423$ -$ 3,945,027$ 7,375,952$
(See independent auditor's report.)- 114 -

VILLAGE OF MOUNT PROSPECT, ILLINOIS
SCHEDULE OF REVENUES, EXPENDITURES, AND
CHANGES IN FUND BALANCE - BUDGET AND ACTUAL
MOTOR FUEL TAX FUND
For the Year Ended December 31, 2017
Original Final Actual
REVENUES
Intergovernmental
Motor fuel tax allotments 1,400,000$ 1,400,000$ 1,381,615$
Investment income 4,000 4,000 17,424
Miscellaneous 15,000 15,000 28,746
Total revenues 1,419,000 1,419,000 1,427,785
EXPENDITURES
Highways and streets
Street division 1,897,071 1,947,071 1,148,795
Total expenditures 1,897,071 1,947,071 1,148,795
NET CHANGE IN FUND BALANCE (478,071)$ (528,071)$ 278,990
FUND BALANCE, JANUARY 1 2,465,482
FUND BALANCE, DECEMBER 31 2,744,472$
NONMAJOR SPECIAL REVENUE FUNDS
Budget
(See independent auditor's report.)- 115 -

VILLAGE OF MOUNT PROSPECT, ILLINOIS
SCHEDULE OF EXPENDITURES - BUDGET AND ACTUAL
MOTOR FUEL TAX FUND
NONMAJOR SPECIAL REVENUE FUNDS
For the Year Ended December 31, 2017
Original Final Actual
HIGHWAYS AND STREETS
Public works department
Street division
Street maintenance
Contractual services 172,566$ 172,566$ 170,054$
Total street maintenance 172,566 172,566 170,054
Snow removal
Contractual services 79,591 79,591 73,938
Commodities and supplies 471,518 471,518 82,265
Total snow removal 551,109 551,109 156,203
Traffic control/street lighting
Contractual services 94,031 94,031 86,397
Utilities 162,365 162,365 149,800
Total traffic control/street lighting 256,396 256,396 236,197
Street improvement projects
Infrastructure 917,000 967,000 586,341
Total street improvement projects 917,000 967,000 586,341
TOTAL EXPENDITURES 1,897,071$ 1,947,071$ 1,148,795$
Budget
(See independent auditor's report.)- 116 -

VILLAGE OF MOUNT PROSPECT, ILLINOIS
SCHEDULE OF REVENUES, EXPENDITURES, AND
CHANGES IN FUND BALANCE - BUDGET AND ACTUAL
COMMUNITY DEVELOPMENT BLOCK GRANT FUND
NONMAJOR SPECIAL REVENUE FUNDS
For the Year Ended December 31, 2017
Original Final Actual
REVENUES
Intergovernmental
Grant - CDBG 530,921$ 554,718$ 273,344$
Miscellaneous
Program income 60,000 60,000 131,222
Total revenues 590,921 614,718 404,566
EXPENDITURES
Welfare
Administration 48,247 48,247 47,420
Community programs 44,000 67,797 56,230
Residential rehabilitation 498,674 498,674 300,916
Total expenditures 590,921 614,718 404,566
NET CHANGE IN FUND BALANCE -$ -$ -
FUND BALANCE, JANUARY 1 -
FUND BALANCE, DECEMBER 31 -$
Budget
(See independent auditor's report.)- 117 -

VILLAGE OF MOUNT PROSPECT, ILLINOIS
SCHEDULE OF EXPENDITURES - BUDGET AND ACTUAL
COMMUNITY DEVELOPMENT BLOCK GRANT FUND
For the Year Ended December 31, 2017
Original Final Actual
WELFARE
Administration and support
Personal services 27,291$ 27,291$ 27,857$
Employee benefits 13,478 13,478 17,233
Other employee costs 1,082 1,082 104
Contractual services 5,856 5,856 2,226
Commodities and supplies 540 540 -
Total administration and support 48,247 48,247 47,420
Community programs
Contractual services 44,000 67,797 56,230
Total community programs 44,000 67,797 56,230
Residential rehabilitation
Personal services 23,880 23,880 8,427
Employee benefits 11,794 11,794 1,589
Contractual services 463,000 463,000 290,900
Total residential rehabilitation 498,674 498,674 300,916
TOTAL EXPENDITURES 590,921$ 614,718$ 404,566$
NONMAJOR SPECIAL REVENUE FUNDS
Budget
(See independent auditor's report.)- 118 -
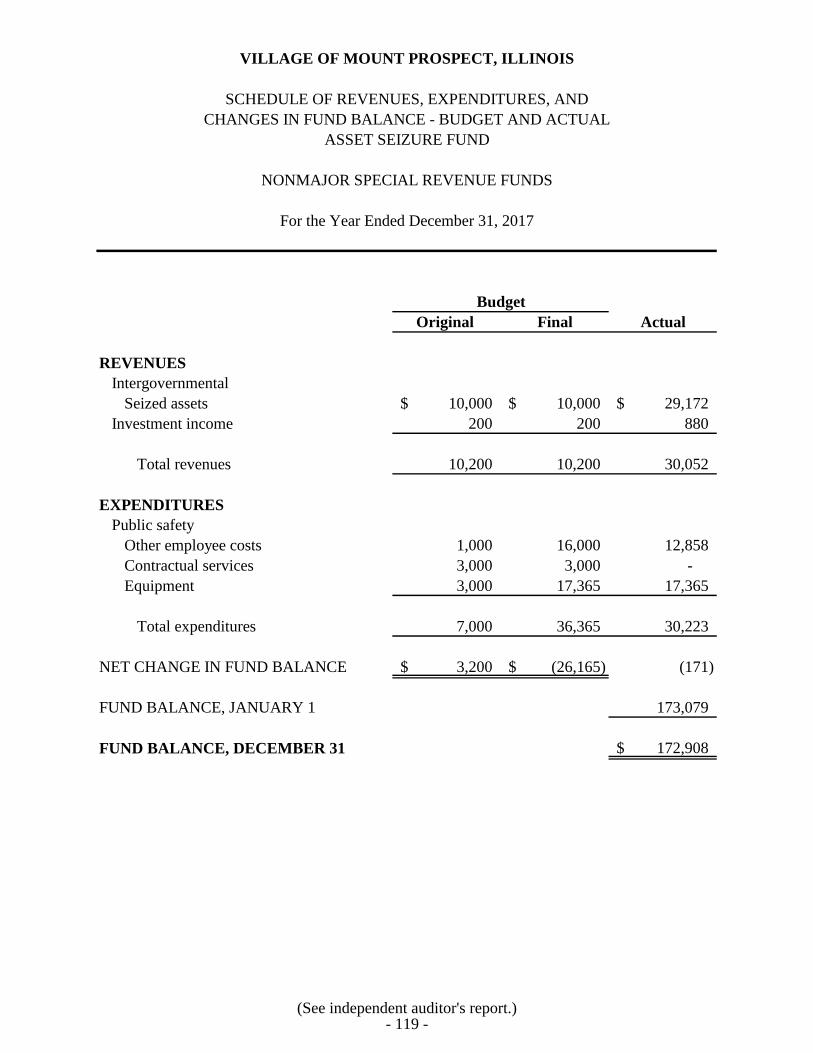
VILLAGE OF MOUNT PROSPECT, ILLINOIS
SCHEDULE OF REVENUES, EXPENDITURES, AND
CHANGES IN FUND BALANCE - BUDGET AND ACTUAL
ASSET SEIZURE FUND
NONMAJOR SPECIAL REVENUE FUNDS
For the Year Ended December 31, 2017
Original Final Actual
REVENUES
Intergovernmental
Seized assets 10,000$ 10,000$ 29,172$
Investment income 200 200 880
Total revenues 10,200 10,200 30,052
EXPENDITURES
Public safety
Other employee costs 1,000 16,000 12,858
Contractual services 3,000 3,000 -
Equipment 3,000 17,365 17,365
Total expenditures 7,000 36,365 30,223
NET CHANGE IN FUND BALANCE 3,200$ (26,165)$ (171)
FUND BALANCE, JANUARY 1 173,079
FUND BALANCE, DECEMBER 31 172,908$
Budget
(See independent auditor's report.)- 119 -

VILLAGE OF MOUNT PROSPECT, ILLINOIS
SCHEDULE OF REVENUES, EXPENDITURES, AND
CHANGES IN FUND BALANCE - BUDGET AND ACTUAL
FEDERAL EQUITABLE SHARE FUND
For the Year Ended December 31, 2017
Original Final Actual
REVENUES
Intergovernmental
Federal equitable shared funds 100$ 100$ -$
Investment income 100 100 181
Total revenues 200 200 181
EXPENDITURES
Public safety
Contractual services 1,000 1,000 -
Equipment 1,000 1,000 -
Total expenditures 2,000 2,000 -
NET CHANGE IN FUND BALANCE (1,800)$ (1,800)$ 181
FUND BALANCE, JANUARY 1 20,013
FUND BALANCE, DECEMBER 31 20,194$
NONMAJOR SPECIAL REVENUE FUNDS
Budget
(See independent auditor's report.)- 120 -

Original Final Actual
REVENUES
Intergovernmental
DUI fines 20,000$ 20,000$ 26,622$
Investment income 100 100 503
Total revenues 20,100 20,100 27,125
EXPENDITURES
Public safety
Patrol and traffic enforcement
Other employee costs 10,000 10,000 6,729
Equipment 10,000 10,000 917
Total expenditures 20,000 20,000 7,646
NET CHANGE IN FUND BALANCE 100$ 100$ 19,479
FUND BALANCE, JANUARY 1 121,449
FUND BALANCE, DECEMBER 31 140,928$
Budget
For the Year Ended December 31, 2017
NONMAJOR SPECIAL REVENUE FUNDS
VILLAGE OF MOUNT PROSPECT, ILLINOIS
SCHEDULE OF REVENUES, EXPENDITURES, AND
CHANGES IN FUND BALANCE - BUDGET AND ACTUAL
DUI FINES FUND
(See independent auditor's report.)- 121 -

VILLAGE OF MOUNT PROSPECT, ILLINOIS
SCHEDULE OF REVENUES, EXPENDITURES, AND
CHANGES IN FUND BALANCE - BUDGET AND ACTUAL
FOREIGN FIRE INSURANCE FUND
For the Year Ended December 31, 2017
Original Final Actual
REVENUES
Other taxes
Foreign fire insurance tax 85,000$ 85,000$ 83,092$
Investment income 1,000 1,000 2,386
Total revenues 86,000 86,000 85,478
EXPENDITURES
Public safety
Insurance 500 500 -
Training 15,000 15,000 4,054
Contractual services 15,000 15,000 8,457
Commodities and supplies 5,000 5,000 6,013
Equipment 30,000 56,500 56,209
Total expenditures 65,500 92,000 74,733
NET CHANGE IN FUND BALANCE 20,500$ (6,000)$ 10,745
FUND BALANCE, JANUARY 1 341,678
FUND BALANCE, DECEMBER 31 352,423$
NONMAJOR SPECIAL REVENUE FUNDS
Budget
(See independent auditor's report.)- 122 -

VILLAGE OF MOUNT PROSPECT, ILLINOIS
SCHEDULE OF REVENUES, EXPENDITURES, AND
CHANGES IN FUND BALANCE - BUDGET AND ACTUAL
BUSINESS DISTRICT FUND
For the Year Ended December 31, 2017
Original Final Actual
REVENUES
Other taxes
Food and beverage tax 440,000$ 440,000$ 382,694$
Hotel/motel tax 230,000 230,000 230,752
Movie theatre tax 110,000 110,000 104,034
Business district tax 370,000 370,000 322,936
State sales tax 570,000 570,000 404,445
Investment income 1,000 1,000 6,310
Total revenues 1,721,000 1,721,000 1,451,171
EXPENDITURES
General government 1,721,000 1,721,000 1,451,171
Total expenditures 1,721,000 1,721,000 1,451,171
NET CHANGE IN FUND BALANCE -$ -$ -
FUND BALANCE, JANUARY 1 -
FUND BALANCE, DECEMBER 31 -$
NONMAJOR SPECIAL REVENUE FUNDS
Budget
(See independent auditor's report.)- 123 -
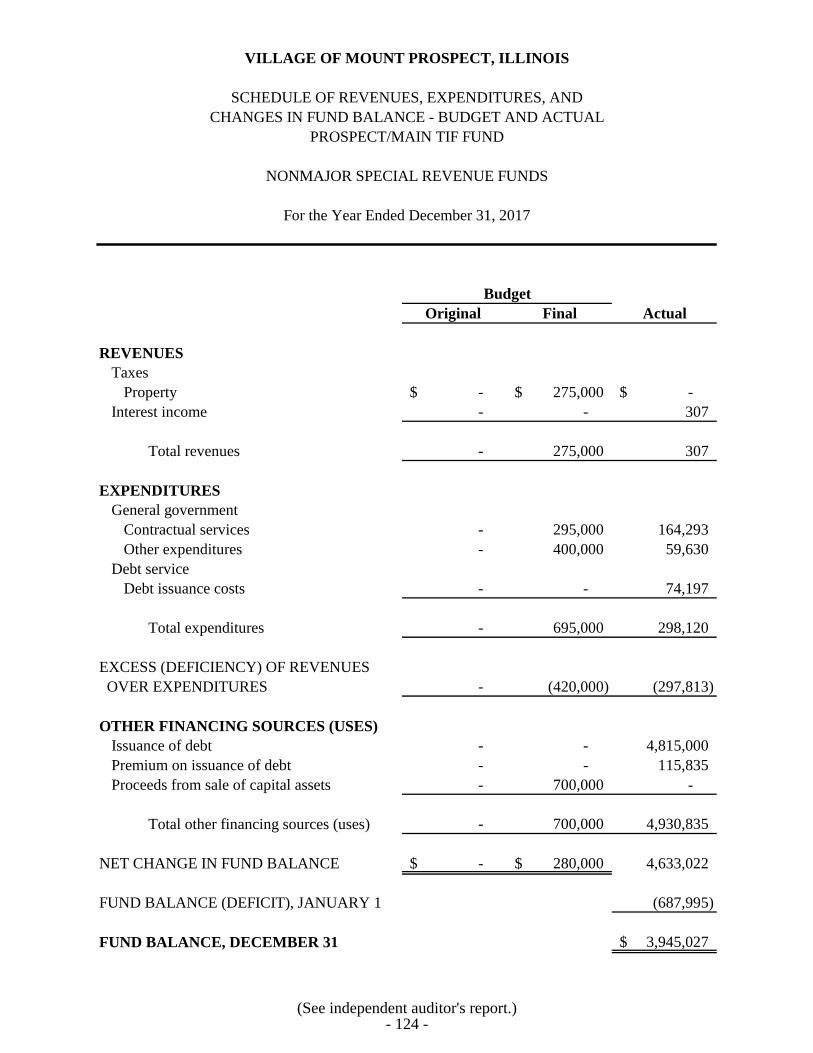
VILLAGE OF MOUNT PROSPECT, ILLINOIS
SCHEDULE OF REVENUES, EXPENDITURES, AND
CHANGES IN FUND BALANCE - BUDGET AND ACTUAL
PROSPECT/MAIN TIF FUND
For the Year Ended December 31, 2017
Original Final Actual
REVENUES
Taxes
Property -$ 275,000$ -$
Interest income - - 307
Total revenues - 275,000 307
EXPENDITURES
General government
Contractual services - 295,000 164,293
Other expenditures - 400,000 59,630
Debt service
Debt issuance costs - - 74,197
Total expenditures - 695,000 298,120
EXCESS (DEFICIENCY) OF REVENUES
OVER EXPENDITURES - (420,000) (297,813)
OTHER FINANCING SOURCES (USES)
Issuance of debt - - 4,815,000
Premium on issuance of debt - - 115,835
Proceeds from sale of capital assets - 700,000 -
Total other financing sources (uses) - 700,000 4,930,835
NET CHANGE IN FUND BALANCE -$ 280,000$ 4,633,022
FUND BALANCE (DEFICIT), JANUARY 1 (687,995)
FUND BALANCE, DECEMBER 31 3,945,027$
NONMAJOR SPECIAL REVENUE FUNDS
Budget
(See independent auditor's report.)- 124 -

Flood Street
Capital Control Improvement
Improvement Construction Construction Total
Cash and investments 1,446,155$ 1,763,317$ -$ 3,209,472$
Receivables
Other taxes 430,256 133,528 494,666 1,058,450
TOTAL ASSETS 1,876,411$ 1,896,845$ 494,666$ 4,267,922$
LIABILITIES
Accounts payable 97,801$ 45,569$ 295,305$ 438,675$
Due to other funds - - 87,192 87,192
Retainage payable 79,167 32,736 50,938 162,841
Total liabilities 176,968 78,305 433,435 688,708
FUND BALANCES
Unrestricted
Assigned
Capital projects 1,699,443 1,818,540 61,231 3,579,214
Total fund balances 1,699,443 1,818,540 61,231 3,579,214
TOTAL LIABILITIES AND
FUND BALANCES 1,876,411$ 1,896,845$ 494,666$ 4,267,922$
LIABILITIES AND
FUND BALANCES
ASSETS
VILLAGE OF MOUNT PROSPECT, ILLINOIS
COMBINING BALANCE SHEET
NONMAJOR CAPITAL PROJECTS FUNDS
December 31, 2017
(See independent auditor's report.)- 125 -

Flood Street
Capital Control Improvement
Improvement Construction Construction Total
REVENUES
Taxes
Other 1,341,253$ 339,161$ 2,047,968$ 3,728,382$
Licenses, permits, and fees - - 1,648,265 1,648,265
Intergovernmental 33,664 - - 33,664
Investment income 9,118 10,271 4,173 23,562
Other reimbursements - 19,824 - 19,824
Miscellaneous 33,900 26,783 27,055 87,738
Total revenues 1,417,935 396,039 3,727,461 5,541,435
EXPENDITURES
Capital outlay 1,269,450 596,631 3,920,586 5,786,667
Total expenditures 1,269,450 596,631 3,920,586 5,786,667
EXCESS (DEFICIENCY) OF REVENUES
OVER EXPENDITURES 148,485 (200,592) (193,125) (245,232)
OTHER FINANCING SOURCES (USES)
Transfers in 600,000 - - 600,000
NET CHANGE IN FUND BALANCES 748,485 (200,592) (193,125) 354,768
FUND BALANCES, JANUARY 1 950,958 2,019,132 254,356 3,224,446
FUND BALANCES, DECEMBER 31 1,699,443$ 1,818,540$ 61,231$ 3,579,214$
VILLAGE OF MOUNT PROSPECT, ILLINOIS
COMBINING STATEMENT OF REVENUES, EXPENDITURES, AND
CHANGES IN FUND BALANCES
NONMAJOR CAPITAL PROJECTS FUNDS
For the Year Ended December 31, 2017
(See independent auditor's report.)- 126 -

VILLAGE OF MOUNT PROSPECT, ILLINOIS
SCHEDULE OF REVENUES, EXPENDITURES, AND
CHANGES IN FUND BALANCE - BUDGET AND ACTUAL
CAPITAL IMPROVEMENT FUND
For the Year Ended December 31, 2017
Original Final Actual
REVENUES
Other taxes
Home rule sales tax 1,450,000$ 1,450,000$ 1,341,253$
Investment income 5,000 5,000 9,118
Intergovernmental - 34,000 33,664
Miscellaneous
Other - 34,000 33,900
Donations 10,000 10,000 -
Total revenues 1,465,000 1,533,000 1,417,935
EXPENDITURES
Capital outlay
Equipment 864,392 998,531 716,666
Building improvements 329,500 379,500 327,704
Infrastructure 1,055,000 1,490,832 225,080
Contractual services - 25,000 -
Total expenditures 2,248,892 2,893,863 1,269,450
EXCESS (DEFICIENCY) OF REVENUES
OVER EXPENDITURES (783,892) (1,360,863) 148,485
OTHER FINANCING SOURCES (USES)
Transfers in 600,000 600,000 600,000
NET CHANGE IN FUND BALANCE (183,892)$ (760,863)$ 748,485
FUND BALANCE, JANUARY 1 950,958
FUND BALANCE, DECEMBER 31 1,699,443$
NONMAJOR CAPITAL PROJECTS FUNDS
Budget
(See independent auditor's report.)- 127 -

VILLAGE OF MOUNT PROSPECT, ILLINOIS
SCHEDULE OF EXPENDITURES - BUDGET AND ACTUAL
CAPITAL IMPROVEMENT FUND
NONMAJOR CAPITAL PROJECTS FUNDS
For the Year Ended December 31, 2017
Original Final Actual
EXPENDITURES
Equipment
Computer software - Microsoft Office Suite -$ 77,139$ 74,212$
Wireless connectivity - other public facilities 52,000 52,000 -
Telephone system - village hall - 27,000 9,985
Desktop virtualization - 30,000 10,177
Cable TV equipment 60,650 60,650 43,449
Paramedic equipment 514,495 356,000 354,349
Police department software 110,000 110,000 -
Water recovery equipment - 32,000 31,976
Radio equipment - police/fire/public works 127,247 253,742 192,518
Total equipment 864,392 998,531 716,666
Building improvements
Salt storage building - - 16,044
HVAC replacements 25,000 75,000 16,745
Contractual services - brick sidewalks 76,500 76,500 75,000
Electrical panel 90,000 90,000 82,999
Other public building improvements 138,000 138,000 136,916
Total building improvements 329,500 379,500 327,704
Infrastructure
D/T Streetscape Program - 88,213 19,311
Residential street lights 75,000 75,000 43,819
Corridor improvements 200,000 200,000 -
Jogging path - 205,339 46,273
Kensington road improvement - 88,086 -
Detention pond improvements 280,000 310,000 20,047
Downtown pedestrian improvement 400,000 400,000 19,899
Parking deck maintenance 100,000 100,000 60,749
Bike route sign project - 24,194 14,982
Total infrastructure 1,055,000 1,490,832 225,080
Contractual services
Needs studies - traffic study/improvements - 25,000 -
Total contractual services - 25,000 -
TOTAL EXPENDITURES 2,248,892$ 2,893,863$ 1,269,450$
Budget
(See independent auditor's report.)- 128 -

VILLAGE OF MOUNT PROSPECT, ILLINOIS
SCHEDULE OF REVENUES, EXPENDITURES, AND
CHANGES IN FUND BALANCE - BUDGET AND ACTUAL
FLOOD CONTROL CONSTRUCTION FUND
NONMAJOR CAPITAL PROJECTS FUND
For the Year Ended December 31, 2017
Original Final Actual
REVENUES
Taxes
Other taxes
Home rule sales tax 450,000$ 450,000$ 339,161$
Miscellaneous
Fees 40,000 40,000 26,783
Other reimbursements - - 19,824
Investment income 6,000 6,000 10,271
Total revenues 496,000 496,000 396,039
EXPENDITURES
Capital outlay
Public improvements
Infrastructure 788,042 921,314 594,274
Other 7,702 7,702 2,357
Total expenditures 795,744 929,016 596,631
NET CHANGE IN FUND BALANCE (299,744)$ (433,016)$ (200,592)
FUND BALANCE, JANUARY 1 2,019,132
FUND BALANCE, DECEMBER 31 1,818,540$
Budget
(See independent auditor's report.)- 129 -
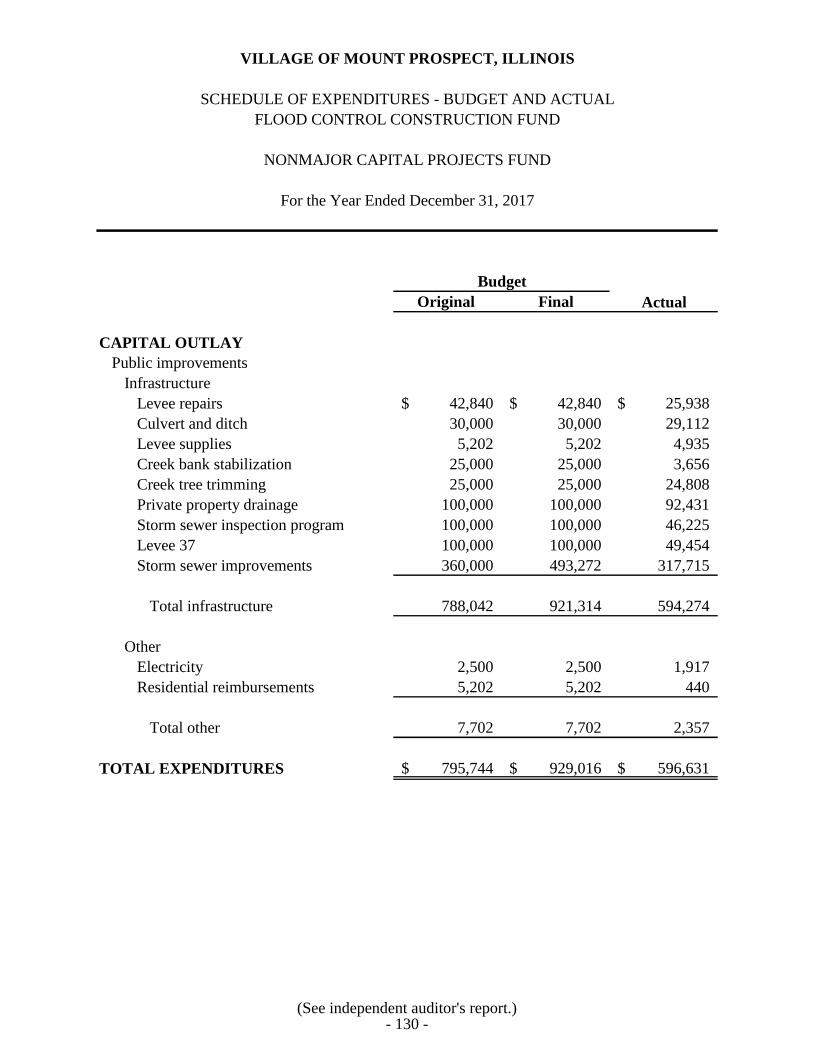
SCHEDULE OF EXPENDITURES - BUDGET AND ACTUAL
FLOOD CONTROL CONSTRUCTION FUND
NONMAJOR CAPITAL PROJECTS FUND
For the Year Ended December 31, 2017
Original Final Actual
CAPITAL OUTLAY
Public improvements
Infrastructure
Levee repairs 42,840$ 42,840$ 25,938$
Culvert and ditch 30,000 30,000 29,112
Levee supplies 5,202 5,202 4,935
Creek bank stabilization 25,000 25,000 3,656
Creek tree trimming 25,000 25,000 24,808
Private property drainage 100,000 100,000 92,431
Storm sewer inspection program 100,000 100,000 46,225
Levee 37 100,000 100,000 49,454
Storm sewer improvements 360,000 493,272 317,715
Total infrastructure 788,042 921,314 594,274
Other
Electricity 2,500 2,500 1,917
Residential reimbursements 5,202 5,202 440
Total other 7,702 7,702 2,357
TOTAL EXPENDITURES 795,744$ 929,016$ 596,631$
VILLAGE OF MOUNT PROSPECT, ILLINOIS
Budget
(See independent auditor's report.)- 130 -

VILLAGE OF MOUNT PROSPECT, ILLINOIS
SCHEDULE OF REVENUES, EXPENDITURES, AND
CHANGES IN FUND BALANCE - BUDGET AND ACTUAL
STREET IMPROVEMENT CONSTRUCTION FUND
NONMAJOR CAPITAL PROJECTS FUND
For the Year Ended December 31, 2017
Original Final Actual
REVENUES
Other taxes
Home rule sales tax 1,450,000$ 1,450,000$ 1,341,253$
Municipal motor fuel tax 675,000 707,000 706,715
License fees 1,670,000 1,670,000 1,648,265
Investment income 2,000 2,000 4,173
Miscellaneous income 50,000 50,000 27,055
Total revenues 3,847,000 3,879,000 3,727,461
EXPENDITURES
Capital outlay
Contractual services 40,000 40,000 37,076
Infrastructure
Street resurfacing 3,972,000 3,972,000 3,883,510
Total expenditures 4,012,000 4,012,000 3,920,586
NET CHANGE IN FUND BALANCE (165,000)$ (133,000)$ (193,125)
FUND BALANCE, JANUARY 1 254,356
FUND BALANCE, DECEMBER 31 61,231$
Budget
(See independent auditor's report.)- 131 -

MAJOR ENTERPRISE FUND
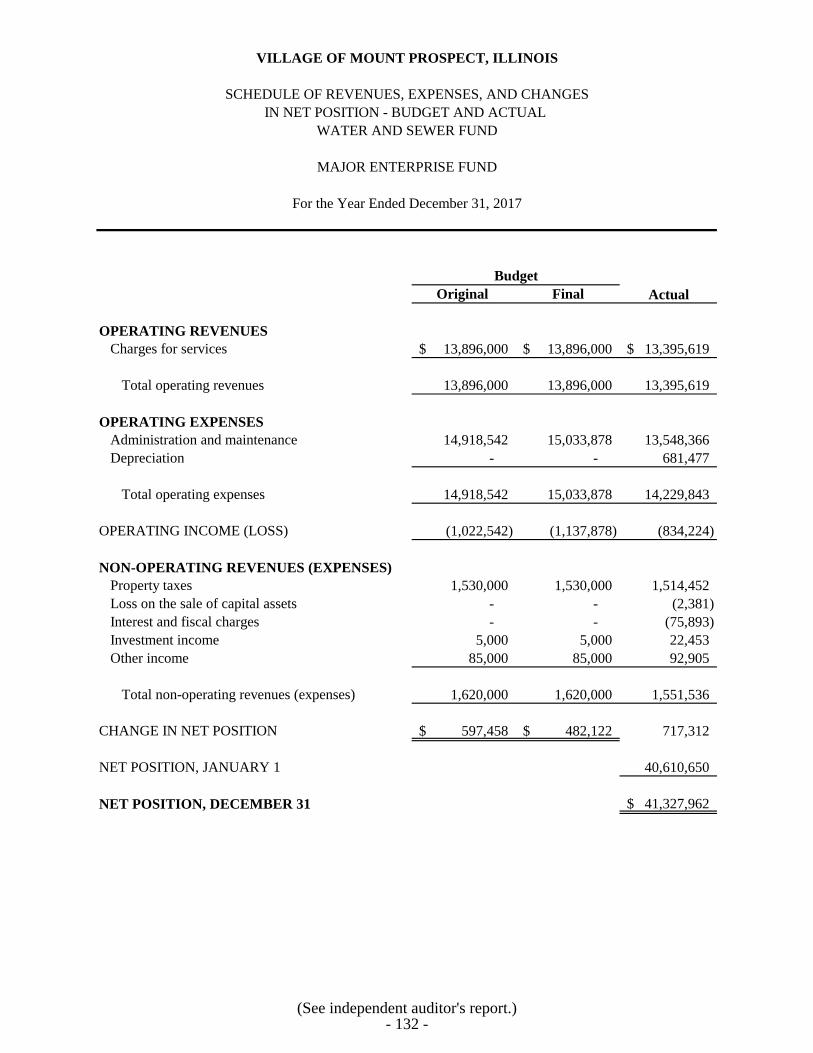
VILLAGE OF MOUNT PROSPECT, ILLINOIS
SCHEDULE OF REVENUES, EXPENSES, AND CHANGES
IN NET POSITION - BUDGET AND ACTUAL
WATER AND SEWER FUND
For the Year Ended December 31, 2017
Original Final Actual
OPERATING REVENUES
Charges for services 13,896,000$ 13,896,000$ 13,395,619$
Total operating revenues 13,896,000 13,896,000 13,395,619
OPERATING EXPENSES
Administration and maintenance 14,918,542 15,033,878 13,548,366
Depreciation - - 681,477
Total operating expenses 14,918,542 15,033,878 14,229,843
OPERATING INCOME (LOSS) (1,022,542) (1,137,878) (834,224)
NON-OPERATING REVENUES (EXPENSES)
Property taxes 1,530,000 1,530,000 1,514,452
Loss on the sale of capital assets - - (2,381)
Interest and fiscal charges - - (75,893)
Investment income 5,000 5,000 22,453
Other income 85,000 85,000 92,905
Total non-operating revenues (expenses) 1,620,000 1,620,000 1,551,536
CHANGE IN NET POSITION 597,458$ 482,122$ 717,312
NET POSITION, JANUARY 1 40,610,650
NET POSITION, DECEMBER 31 41,327,962$
MAJOR ENTERPRISE FUND
Budget
(See independent auditor's report.)- 132 -

VILLAGE OF MOUNT PROSPECT, ILLINOIS
SCHEDULE OF OPERATING REVENUES - BUDGET AND ACTUAL
WATER AND SEWER FUND
For the Year Ended December 31, 2017
Original Final Actual
CHARGES FOR SERVICES
Water sales 10,964,000$ 10,964,000$ 10,546,653$
Sewer fees 2,110,000 2,110,000 2,044,524
Sewer construction charge 682,000 682,000 654,601
Water penalties 80,000 80,000 81,478
Water meter fees 15,000 15,000 17,220
Water and sewer taps 25,000 25,000 23,900
Sewer penalties 20,000 20,000 21,392
Miscellaneous - - 5,851
TOTAL OPERATING REVENUES 13,896,000$ 13,896,000$ 13,395,619$
MAJOR ENTERPRISE FUND
Budget
(See independent auditor's report.)- 133 -

VILLAGE OF MOUNT PROSPECT, ILLINOIS
SCHEDULE OF OPERATING EXPENSES - BUDGET AND ACTUAL
WATER AND SEWER FUND
For the Year Ended December 31, 2017
Original Final Actual
ADMINISTRATION AND MAINTENANCE
Administration and support
Personal services 562,755$ 562,755$ 524,783$
Employee benefits 272,831 272,831 318,687
Other employee costs 42,404 42,404 40,313
Contractual services 191,637 191,637 231,574
Utilities 49,673 49,673 50,642
Insurance 100,042 100,042 100,042
Commodities and supplies 13,022 13,022 12,087
Capital expenditures 12,335 12,335 11,733
Total administration and support 1,244,699 1,244,699 1,289,861
Maintenance of buildings
Personal services 171,405 171,405 163,496
Employee benefits 79,128 79,128 94,895
Contractual services 17,509 17,509 6,271
Utilities 6,367 6,367 4,153
Commodities and supplies 1,592 1,592 1,555
Total maintenance of buildings 276,001 276,001 270,370
Maintenance of grounds
Personal services 69,071 69,071 58,513
Employee benefits 21,438 21,438 26,677
Contractual services 36,605 36,605 36,513
Commodities and supplies 6,276 6,276 6,272
Total maintenance of grounds 133,390 133,390 127,975
Water supply maintenance and repair
Personal services 445,602 445,602 406,793
Employee benefits 166,670 166,670 203,972
Contractual services 177,740 177,740 112,013
Utilities 90,203 90,203 57,537
Commodities and supplies 83,648 83,648 42,070
Total water supply maintenance and repair 963,863 963,863 822,385
MAJOR ENTERPRISE FUND
Budget
(This schedule is continued on the following pages.)- 134 -
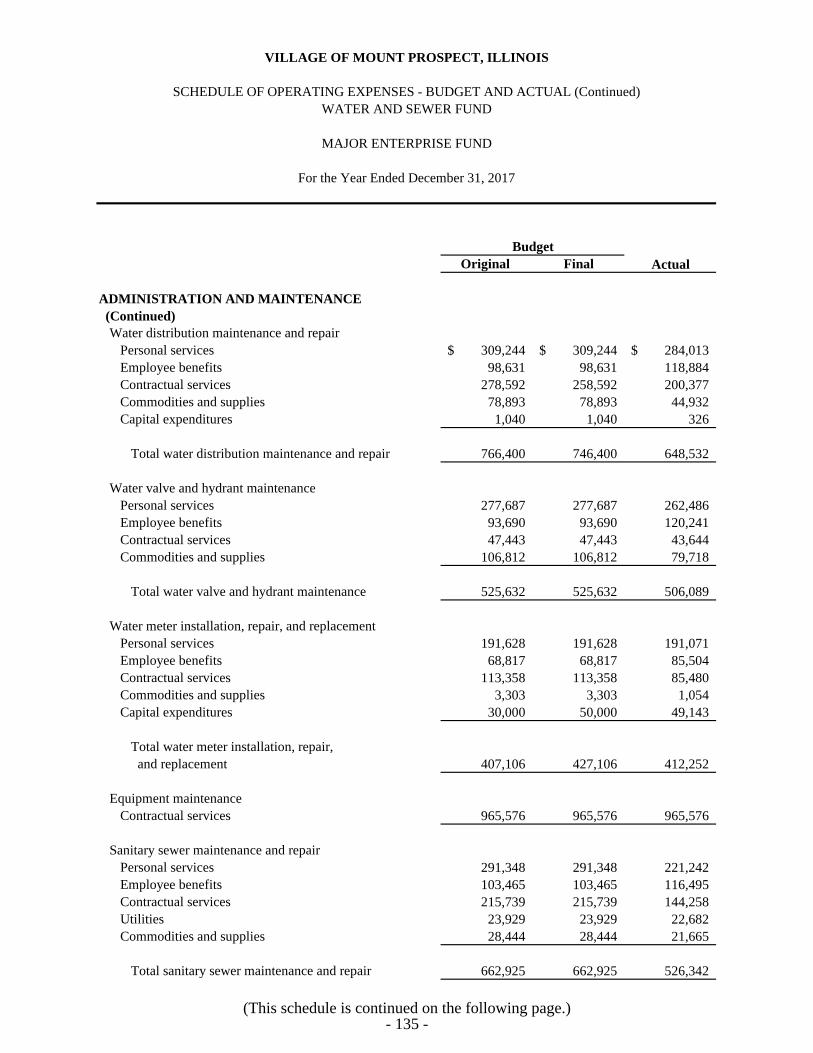
VILLAGE OF MOUNT PROSPECT, ILLINOIS
SCHEDULE OF OPERATING EXPENSES - BUDGET AND ACTUAL (Continued)
WATER AND SEWER FUND
For the Year Ended December 31, 2017
Original Final Actual
ADMINISTRATION AND MAINTENANCE
(Continued)
Water distribution maintenance and repair
Personal services 309,244$ 309,244$ 284,013$
Employee benefits 98,631 98,631 118,884
Contractual services 278,592 258,592 200,377
Commodities and supplies 78,893 78,893 44,932
Capital expenditures 1,040 1,040 326
Total water distribution maintenance and repair 766,400 746,400 648,532
Water valve and hydrant maintenance
Personal services 277,687 277,687 262,486
Employee benefits 93,690 93,690 120,241
Contractual services 47,443 47,443 43,644
Commodities and supplies 106,812 106,812 79,718
Total water valve and hydrant maintenance 525,632 525,632 506,089
Water meter installation, repair, and replacement
Personal services 191,628 191,628 191,071
Employee benefits 68,817 68,817 85,504
Contractual services 113,358 113,358 85,480
Commodities and supplies 3,303 3,303 1,054
Capital expenditures 30,000 50,000 49,143
Total water meter installation, repair,
and replacement 407,106 427,106 412,252
Equipment maintenance
Contractual services 965,576 965,576 965,576
Sanitary sewer maintenance and repair
Personal services 291,348 291,348 221,242
Employee benefits 103,465 103,465 116,495
Contractual services 215,739 215,739 144,258
Utilities 23,929 23,929 22,682
Commodities and supplies 28,444 28,444 21,665
Total sanitary sewer maintenance and repair 662,925 662,925 526,342
MAJOR ENTERPRISE FUND
Budget
(This schedule is continued on the following page.)- 135 -

VILLAGE OF MOUNT PROSPECT, ILLINOIS
SCHEDULE OF OPERATING EXPENSES - BUDGET AND ACTUAL (Continued)
WATER AND SEWER FUND
For the Year Ended December 31, 2017
Original Final Actual
MAJOR ENTERPRISE FUND
Budget
ADMINISTRATION AND MAINTENANCE
(Continued)
Water system improvements
Capital expenditures 1,243,950$ 1,499,286$ 1,248,136$
Less capital expenditures capitalized (650,000) (790,000) (622,060)
Total water system improvements 593,950 709,286 626,076
Sanitary system improvements
Capital expenditures 1,700,000 1,700,000 991,597
Less capital expenditures capitalized (179,000) (179,000) (179,941)
Total sanitary system improvements 1,521,000 1,521,000 811,656
Improvements to public buildings
Capital expenditures 70,000 70,000 67,128
Total improvements to public buildings 70,000 70,000 67,128
Lake Michigan water acquisition
Contractual services 6,788,000 6,788,000 6,474,124
Total Lake Michigan water acquisition 6,788,000 6,788,000 6,474,124
Total administration and maintenance 14,918,542 15,033,878 13,548,366
Depreciation - - 681,477
TOTAL OPERATING EXPENSES 14,918,542$ 15,033,878$ 14,229,843$
(See independent auditor's report.)- 136 -
NONMAJOR ENTERPRISE FUNDS
Parking System Revenue Fund - to account for the provision of public parking services with fees
shared with the commuter railroad. All activities are accounted for including administration,
operations, maintenance, and collection.
Village Parking System - to account for the provision of village-owned public parking services
including the Village Hall parking deck and leased commuter spaces. All activities are accounted
for including administration, operations, maintenance, financing, related debt service, and billing
and collection.

Parking Village
System Parking
Revenue System Total
CURRENT ASSETS
Cash and investments 178,066$ 353,557$ 531,623$
Total current assets 178,066 353,557 531,623
CAPITAL ASSETS
Capital assets not being depreciated - 232,354 232,354
Capital assets being depreciated, cost 364,800 - 364,800
Accumulated depreciation (364,800) - (364,800)
Net capital assets - 232,354 232,354
Total assets 178,066 585,911 763,977
CURRENT LIABILITIES
Accounts payable 10,872 1,894 12,766
Accrued payroll 1,030 1,407 2,437
Unearned revenues 15,360 18,915 34,275
Compensated absences payable 507 673 1,180
Total current liabilities 27,769 22,889 50,658
LONG-TERM LIABILITIES
Compensated absences payable 2,027 2,693 4,720
Net other postemployment
benefits obligation 809 3,090 3,899
Total long-term liabilities 2,836 5,783 8,619
Total liabilities 30,605 28,672 59,277
NET POSITION
Investment in capital assets - 232,354 232,354
Unrestricted 147,461 324,885 472,346
TOTAL NET POSITION 147,461$ 557,239$ 704,700$
December 31, 2017
VILLAGE OF MOUNT PROSPECT, ILLINOIS
COMBINING STATEMENT OF NET POSITION
NONMAJOR ENTERPRISE FUNDS
(See independent auditor's report.)- 137 -

Parking Village
System Parking
Revenue System Total
OPERATING REVENUES
Charges for services
Parking fees 154,564$ 178,086$ 332,650$
Rental fees - 6,661 6,661
Miscellaneous - 4 4
Convenience fees 1,317 2,682 3,999
Total operating revenues 155,881 187,433 343,314
OPERATING EXPENSES
Administration, maintenance, and improvements 149,203 80,670 229,873
Total operating expenses 149,203 80,670 229,873
OPERATING INCOME 6,678 106,763 113,441
NON-OPERATING REVENUES (EXPENSES)
Investment income 810 2,071 2,881
Total non-operating revenues (expenses) 810 2,071 2,881
CHANGE IN NET POSITION 7,488 108,834 116,322
NET POSITION, JANUARY 1 139,973 448,405 588,378
NET POSITION, DECEMBER 31 147,461$ 557,239$ 704,700$
VILLAGE OF MOUNT PROSPECT, ILLINOIS
COMBINING STATEMENT OF REVENUES, EXPENSES,
AND CHANGES IN NET POSITION
NONMAJOR ENTERPRISE FUNDS
For the Year Ended December 31, 2017
(See independent auditor's report.)- 138 -

Parking Village
System Parking
Revenue System Total
CASH FLOWS FROM OPERATING ACTIVITIES
Receipts from customers and users 152,484$ 180,162$ 332,646$
Receipts from miscellaneous revenues 1,317 2,686 4,003
Payments to suppliers (111,802) (30,021) (141,823)
Payments to employees (39,300) (53,426) (92,726)
Net cash from operating activities 2,699 99,401 102,100
CASH FLOWS FROM NONCAPITAL
FINANCING ACTIVITIES
None - - -
Net cash from noncapital financing activities - - -
CASH FLOWS FROM CAPITAL AND
RELATED FINANCING ACTIVITIES
None - - -
Net cash from capital and related
financing activities - - -
CASH FLOWS FROM INVESTING ACTIVITIES
Investment income 810 2,071 2,881
Net cash from investing activities 810 2,071 2,881
NET INCREASE IN CASH AND
CASH EQUIVALENTS 3,509 101,472 104,981
CASH AND CASH EQUIVALENTS,
JANUARY 1 174,557 253,703 428,260
CASH AND CASH EQUIVALENTS,
DECEMBER 31 178,066$ 355,175$ 533,241$
VILLAGE OF MOUNT PROSPECT, ILLINOIS
COMBINING STATEMENT OF CASH FLOWS
NONMAJOR ENTERPRISE FUNDS
For the Year Ended December 31, 2017
(This statement is continued on the following page.)- 139 -

Parking Village
System Parking
Revenue System Total
RECONCILIATION OF OPERATING INCOME
TO NET CASH FLOWS FROM
OPERATING ACTIVITIES
Operating income 6,678$ 106,763$ 113,441$
Adjustments to reconcile operating income to
net cash from operating activities
Changes in assets and liabilities
Accounts payable (1,126) (7,828) (8,954)
Accrued payroll and compensated absences 537 735 1,272
Net other postemployment benefits obligation (1,310) 2,698 1,388
Unearned revenues (2,080) (4,585) (6,665)
NET CASH FROM OPERATING ACTIVITIES 2,699$ 97,783$ 100,482$
For the Year Ended December 31, 2017
VILLAGE OF MOUNT PROSPECT, ILLINOIS
COMBINING STATEMENT OF CASH FLOWS (Continued)
NONMAJOR ENTERPRISE FUNDS
(See independent auditor's report.)- 140 -

Original Final Actual
OPERATING REVENUES
Charges for services
Parking fees 161,000$ 161,000$ 154,564$
Convenience fees - - 1,317
Total operating revenues 161,000 161,000 155,881
OPERATING EXPENSES
Administration, maintenance, and improvements 163,759 163,759 149,203
Total operating expenses 163,759 163,759 149,203
OPERATING INCOME (LOSS) (2,759) (2,759) 6,678
NON-OPERATING REVENUES (EXPENSES)
Investment income - - 810
Total non-operating revenues (expenses) - - 810
CHANGE IN NET POSITION (2,759)$ (2,759)$ 7,488
NET POSITION, JANUARY 1 139,973
NET POSITION, DECEMBER 31 147,461$
Budget
NONMAJOR ENTERPRISE FUNDS
VILLAGE OF MOUNT PROSPECT, ILLINOIS
SCHEDULE OF REVENUES, EXPENSES, AND CHANGES
IN NET POSITION - BUDGET AND ACTUAL
PARKING SYSTEM REVENUE FUND
For the Year Ended December 31, 2017
(See independent auditor's report.)- 141 -

Original Final Actual
ADMINISTRATION, MAINTENANCE,
AND IMPROVEMENTS
Personal services 27,691$ 27,691$ 27,054$
Employee benefits 13,104 13,104 11,473
Contractual services 100,040 100,040 99,830
Utilities 11,165 11,165 6,246
Insurance 1,382 1,382 1,382
Commodities and supplies 10,377 10,377 3,218
TOTAL OPERATING EXPENSES 163,759$ 163,759$ 149,203$
VILLAGE OF MOUNT PROSPECT, ILLINOIS
SCHEDULE OF OPERATING EXPENSES - BUDGET AND ACTUAL
PARKING SYSTEM REVENUE FUND
For the Year Ended December 31, 2017
Budget
NONMAJOR ENTERPRISE FUNDS
(See independent auditor's report.)- 142 -

Original Final Actual
OPERATING REVENUES
Charges for services
Parking fees 177,000$ 177,000$ 178,086$
Rental fees 6,600 6,600 6,661
Miscellaneous - - 4
Convenience fees - - 2,682
Total operating revenues 183,600 183,600 187,433
OPERATING EXPENSES
Administration, maintenance, and improvements 110,766 110,766 80,670
Total operating expenses 110,766 110,766 80,670
OPERATING INCOME 72,834 72,834 106,763
NON-OPERATING REVENUES (EXPENSES)
Investment income 500 500 2,071
Total non-operating revenues (expenses) 500 500 2,071
CHANGE IN NET POSITION 73,334$ 73,334$ 108,834
NET POSITION, JANUARY 1 448,405
NET POSITION, DECEMBER 31 557,239$
Budget
NONMAJOR ENTERPRISE FUNDS
VILLAGE OF MOUNT PROSPECT, ILLINOIS
SCHEDULE OF REVENUES, EXPENSES, AND CHANGES
IN NET POSITION - BUDGET AND ACTUAL
VILLAGE PARKING SYSTEM FUND
For the Year Ended December 31, 2017
(See independent auditor's report.)- 143 -

Original Final Actual
ADMINISTRATION, MAINTENANCE,
AND IMPROVEMENTS
Personal services 37,805$ 37,805$ 36,804$
Employee benefits 17,708 17,708 20,055
Contractual services 45,757 45,757 22,197
Insurance 1,596 1,596 1,596
Commodities and supplies 541 541 18
Capital expenditures 7,359 7,359 -
TOTAL OPERATING EXPENSES 110,766$ 110,766$ 80,670$
VILLAGE OF MOUNT PROSPECT, ILLINOIS
SCHEDULE OF OPERATING EXPENSES - BUDGET AND ACTUAL
VILLAGE PARKING SYSTEM FUND
For the Year Ended December 31, 2017
Budget
NONMAJOR ENTERPRISE FUNDS
(See independent auditor's report.)- 144 -

INTERNAL SERVICE FUNDS
Computer Replacement Fund - to account for the acquisition of village computer hardware.
Financing is being provided by charges to various village funds.
Risk Management Fund - to account for the servicing and payment of claims for liability,
property, casualty coverage, workers’ compensation, and medical benefits. Financing is being
provided by charges to the various village funds.
Vehicle Replacement Fund - to account for the acquisition and depreciation of village vehicles.
Financing is being provided by charges to the various village funds.
Vehicle Maintenance Fund - to account for the maintenance and repair of all village vehicles.
Financing is being provided by charges to various village funds.

VILLAGE OF MOUNT PROSPECT, ILLINOIS
COMBINING STATEMENT OF NET POSITION
INTERNAL SERVICE FUNDS
December 31, 2017
Computer Risk Vehicle Vehicle
Replacement Management Replacement Maintenance Total
CURRENT ASSETS
Cash and investments 671,253$ 2,213,537$ 8,555,938$ 769,689$ 12,210,417$
Receivables
Accrued interest - - 8,160 - 8,160
Other - 22,615 - 1,914 24,529
Due from other governments - - 2,338 7,788 10,126
Prepaid items - 165,686 - 11 165,697
Inventories - - - 308,233 308,233
Total current assets 671,253 2,401,838 8,566,436 1,087,635 12,727,162
NONCURRENT ASSETS
Deposits - insurance - 2,190,074 - - 2,190,074
CAPITAL ASSETS
Capital assets not being depreciated - - 1,387,786 - 1,387,786
Capital assets being depreciated, cost 133,797 - 13,496,770 92,062 13,722,629
Accumulated depreciation (85,816) - (8,184,197) (92,062) (8,362,075)
Net capital assets 47,981 - 6,700,359 - 6,748,340
Total assets 719,234 4,591,912 15,266,795 1,087,635 21,665,576
CURRENT LIABILITIES
Accounts payable 5,737 51,899 20,625 51,190 129,451
Accrued payroll - - - 36,837 36,837
Claims payable - 1,349,957 - - 1,349,957
Other payables - 14,881 - - 14,881
Compensated absences payable - - - 31,244 31,244
Total current liabilities 5,737 1,416,737 20,625 119,271 1,562,370
LONG-TERM LIABILITIES
Compensated absences payable - - - 124,974 124,974
Claims payable - 189,713 - - 189,713
Net other postemployment
benefits obligation - - - 51,694 51,694
Total long-term liabilities - 189,713 - 176,668 366,381
Total liabilities 5,737 1,606,450 20,625 295,939 1,928,751
NET POSITION
Investment in capital assets 47,981 - 6,700,359 - 6,748,340
Unrestricted 665,516 2,985,462 8,545,811 791,696 12,988,485
TOTAL NET POSITION 713,497$ 2,985,462$ 15,246,170$ 791,696$ 19,736,825$
(See independent auditor's report.)- 145 -

COMBINING STATEMENT OF REVENUES, EXPENSES,
AND CHANGES IN NET POSITION
INTERNAL SERVICE FUNDS
For the Year Ended December 31, 2017
Computer Risk Vehicle Vehicle
Replacement Management Replacement Maintenance Total
OPERATING REVENUES
Charges for services 240,829$ 6,667,747$ 1,656,298$ 2,029,964$ 10,594,838$
Contributions - 1,398,673 - - 1,398,673
Miscellaneous - 48,275 - - 48,275
Total operating revenues 240,829 8,114,695 1,656,298 2,029,964 12,041,786
OPERATING EXPENSES
Administration and maintenance 107,911 456,554 40,236 2,046,622 2,651,323
Insurance and claims - 8,295,721 - - 8,295,721
Depreciation 13,709 - 697,578 1,593 712,880
Total operating expenses 121,620 8,752,275 737,814 2,048,215 11,659,924
OPERATING INCOME (LOSS) 119,209 (637,580) 918,484 (18,251) 381,862
NON-OPERATING REVENUES (EXPENSES)
Investment income 3,407 17,170 64,686 4,920 90,183
Gain (loss) on disposal of capital assets - - 97,091 (6,373) 90,718
Total non-operating revenues (expenses) 3,407 17,170 161,777 (1,453) 180,901
CHANGES IN NET POSITION 122,616 (620,410) 1,080,261 (19,704) 562,763
NET POSITION, JANUARY 1 590,881 3,605,872 14,165,909 811,400 19,174,062
NET POSITION, DECEMBER 31 713,497$ 2,985,462$ 15,246,170$ 791,696$ 19,736,825$
VILLAGE OF MOUNT PROSPECT, ILLINOIS
(See independent auditor's report.)- 146 -

Computer Risk Vehicle Vehicle
Replacement Management Replacement Maintenance Total
CASH FLOWS FROM OPERATING ACTIVITIES
Receipts from customers and users -$ 2,266,508$ -$ -$ 2,266,508$
Receipts from interfund services 240,829 5,799,912 1,645,000 2,029,964 9,715,705
Miscellaneous receipts - 48,275 11,980 1,983 62,238
Payments to suppliers (107,254) (8,411,617) (98,537) (843,874) (9,461,282)
Payments to employees - - - (1,210,512) (1,210,512)
Net cash from operating activities 133,575 (296,922) 1,558,443 (22,439) 1,372,657
CASH FLOWS FROM NONCAPITAL
FINANCING ACTIVITIES
None - - - - -
Net cash from noncapital financing activities - - - - -
CASH FLOWS FROM CAPITAL AND
RELATED FINANCING ACTIVITIES
Proceeds from sale of capital assets - - 97,091 - 97,091
Acquisition of capital assets - - (2,523,123) - (2,523,123)
Net cash from capital and related
financing activities - - (2,426,032) - (2,426,032)
CASH FLOWS FROM INVESTING ACTIVITIES
Investment income 3,407 17,170 60,911 4,920 86,408
Net cash from investing activities 3,407 17,170 60,911 4,920 86,408
NET INCREASE (DECREASE) IN
CASH AND CASH EQUIVALENTS 136,982 (279,752) (806,678) (17,519) (966,967)
CASH AND CASH EQUIVALENTS,
JANUARY 1 534,271 2,493,289 9,362,616 787,208 13,177,384
CASH AND CASH EQUIVALENTS,
DECEMBER 31 671,253$ 2,213,537$ 8,555,938$ 769,689$ 12,210,417$
VILLAGE OF MOUNT PROSPECT, ILLINOIS
INTERNAL SERVICE FUNDS
For the Year Ended December 31, 2017
COMBINING STATEMENT OF CASH FLOWS
(This statement is continued on the following page.)- 147 -

Computer Risk Vehicle Vehicle
Replacement Management Replacement Maintenance Total
RECONCILIATION OF OPERATING INCOME
(LOSS) TO NET CASH FLOWS FROM
OPERATING ACTIVITIES
Operating income (loss) 119,209$ (637,580)$ 918,484$ (18,251)$ 381,862$
Adjustments to reconcile operating income (loss) to
net cash from operating activities
Depreciation 13,709 - 697,578 1,593 712,880
Changes in assets and liabilities
Receivables - (22,615) 682 1,983 (19,950)
Inventories - - - (15,172) (15,172)
Prepaid items - (3,668) - 1 (3,667)
Deposits - insurance - 53,948 - - 53,948
Accounts and others payable 657 (4,157) (58,301) (18,664) (80,465)
Accrued payroll and compensated absences - - - 17,839 17,839
Net other postemployment benefits obligation - - - 8,232 8,232
Claims payable - 317,150 - - 317,150
NET CASH FROM OPERATING ACTIVITIES 133,575$ (296,922)$ 1,558,443$ (22,439)$ 1,372,657$
For the Year Ended December 31, 2017
COMBINING STATEMENT OF CASH FLOWS (Continued)
VILLAGE OF MOUNT PROSPECT, ILLINOIS
INTERNAL SERVICE FUNDS
(See independent auditor's report.)- 148 -

VILLAGE OF MOUNT PROSPECT, ILLINOIS
SCHEDULE OF REVENUES, EXPENSES, AND
CHANGES IN NET POSITION - BUDGET AND ACTUAL
COMPUTER REPLACEMENT FUND
INTERNAL SERVICE FUNDS
For the Year Ended December 31, 2017
Original Final Actual
OPERATING REVENUES
Charges for services
Refuse Disposal Fund 713$ 713$ 713$
Water and Sewer Fund 15,264 15,264 15,264
General Fund 224,852 224,852 224,852
Total operating revenues 240,829 240,829 240,829
OPERATING EXPENSES
Administration
Capital outlay 314,310 314,310 107,911
Depreciation - - 13,709
Total operating expenses 314,310 314,310 121,620
OPERATING INCOME (LOSS) (73,481) (73,481) 119,209
NON-OPERATING REVENUES (EXPENSES)
Investment income 1,500 1,500 3,407
CHANGE IN NET POSITION (71,981)$ (71,981)$ 122,616
NET POSITION, JANUARY 1 590,881
NET POSITION, DECEMBER 31 713,497$
Budget
(See independent auditor's report.)- 149 -
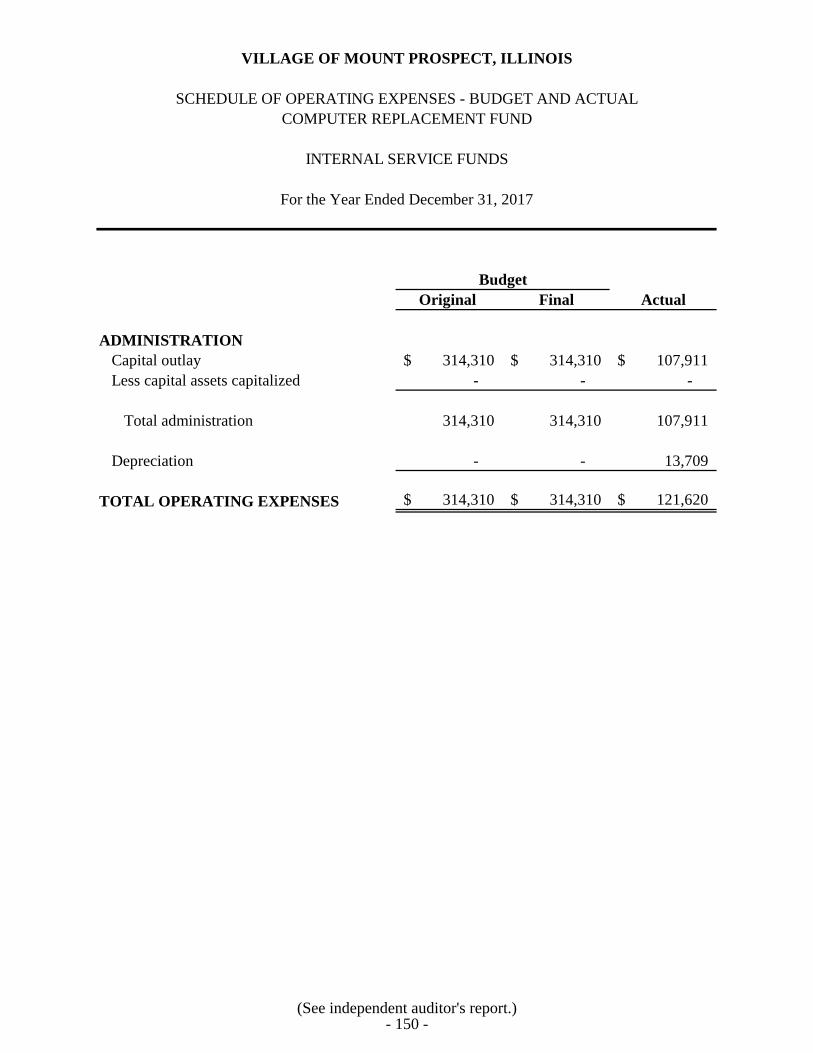
VILLAGE OF MOUNT PROSPECT, ILLINOIS
SCHEDULE OF OPERATING EXPENSES - BUDGET AND ACTUAL
COMPUTER REPLACEMENT FUND
INTERNAL SERVICE FUNDS
For the Year Ended December 31, 2017
Original Final Actual
ADMINISTRATION
Capital outlay 314,310$ 314,310$ 107,911$
Less capital assets capitalized - - -
Total administration 314,310 314,310 107,911
Depreciation - - 13,709
TOTAL OPERATING EXPENSES 314,310$ 314,310$ 121,620$
Budget
(See independent auditor's report.)- 150 -

SCHEDULE OF REVENUES, EXPENSES, AND
CHANGES IN NET POSITION - BUDGET AND ACTUAL
RISK MANAGEMENT FUND
INTERNAL SERVICE FUNDS
For the Year Ended December 31, 2017
Original Final Actual
OPERATING REVENUES
Charges for services 6,538,333$ 6,538,333$ 6,667,747$
Contributions 1,320,000 1,428,500 1,398,673
Miscellaneous 1,500 49,000 48,275
Total operating revenues 7,859,833 8,015,833 8,114,695
OPERATING EXPENSES
Administration 427,525 427,525 456,554
Insurance and claims 7,281,795 8,014,295 8,295,721
Total operating expenses 7,709,320 8,441,820 8,752,275
OPERATING INCOME (LOSS) 150,513 (425,987) (637,580)
NON-OPERATING REVENUES (EXPENSES)
Investment income 5,000 5,000 17,170
CHANGE IN NET POSITION 155,513$ (420,987)$ (620,410)
NET POSITION, JANUARY 1 3,605,872
NET POSITION, DECEMBER 31 2,985,462$
Budget
VILLAGE OF MOUNT PROSPECT, ILLINOIS
(See independent auditor's report.)- 151 -

VILLAGE OF MOUNT PROSPECT, ILLINOIS
SCHEDULE OF OPERATING REVENUES - BUDGET AND ACTUAL
RISK MANAGEMENT FUND
INTERNAL SERVICE FUNDS
For the Year Ended December 31, 2017
Original Final Actual
OPERATING REVENUES
Charges for services
General Fund 5,459,063$ 5,459,063$ 5,582,432$
Refuse Disposal Fund 35,942 35,942 35,942
Water and Sewer Fund 154,783 154,783 154,783
Parking System Revenue Fund 1,382 1,382 1,382
Village Parking Fund 1,596 1,596 1,596
Vehicle Maintenance Fund 23,777 23,777 23,777
Library 861,790 861,790 867,835
Total charges for services 6,538,333 6,538,333 6,667,747
Contributions
Employee
Health insurance 499,000 499,000 518,426
Dental insurance - 88,000 87,912
Additional life insurance 22,000 22,000 24,029
Retiree
Health insurance 799,000 799,000 748,157
Dental insurnace - 20,500 20,149
Total contributions 1,320,000 1,428,500 1,398,673
Miscellaneous
Other reimbursements 1,000 48,500 48,275
Miscellaneous income 500 500 -
Total miscellaneous 1,500 49,000 48,275
TOTAL OPERATING REVENUES 7,859,833$ 8,015,833$ 8,114,695$
Budget
(See independent auditor's report.)- 152 -

VILLAGE OF MOUNT PROSPECT, ILLINOIS
SCHEDULE OF OPERATING EXPENSES - BUDGET AND ACTUAL
RISK MANAGEMENT FUND
INTERNAL SERVICE FUNDS
For the Year Ended December 31, 2017
Original Final Actual
ADMINISTRATION
Casualty and property program
Claims administration 12,000$ 12,000$ 18,152$
Other contractual services 12,000 12,000 28,250
Total casualty and property program 24,000 24,000 46,402
Medical program
Claims administration 321,525 321,525 340,228
Workers' compensation
Claims administration 82,000 82,000 69,924
Total administration 427,525 427,525 456,554
INSURANCE AND CLAIMS
Casualty and property program
Property insurance 115,000 115,000 94,586
HELP excess liability insurance 128,000 128,000 129,988
Workers' compensation insurance 105,000 105,000 120,310
Faithful performance insurance 4,000 4,000 3,043
Surety bonds 500 500 450
Other insurance 3,000 3,000 3,380
Property claims 1,000 1,000 -
Liability claims 100,000 320,500 260,359
Workers' compensation claims 500,000 572,000 979,940
Auto claims 40,000 40,000 60,817
Village property claims 10,000 10,000 -
Unemployment compensation claims 10,000 10,000 1,837
Tree hazard study 10,000 10,000 6,630
Other claims 10,000 10,000 69
Total casualty and property program 1,036,500 1,329,000 1,661,409
Medical program
Medical expense - HMO plan 1,369,556 1,369,556 1,301,409
Medical expense - indemnity plan 4,811,339 5,063,339 5,084,026
Medical expense - dental - 188,000 187,813
Health and wellness supplies 20,000 20,000 14,705
Life insurance 44,400 44,400 46,359
Total medical program 6,245,295 6,685,295 6,634,312
Total insurance and claims 7,281,795 8,014,295 8,295,721
TOTAL OPERATING EXPENSES 7,709,320$ 8,441,820$ 8,752,275$
Budget
(See independent auditor's report.)- 153 -
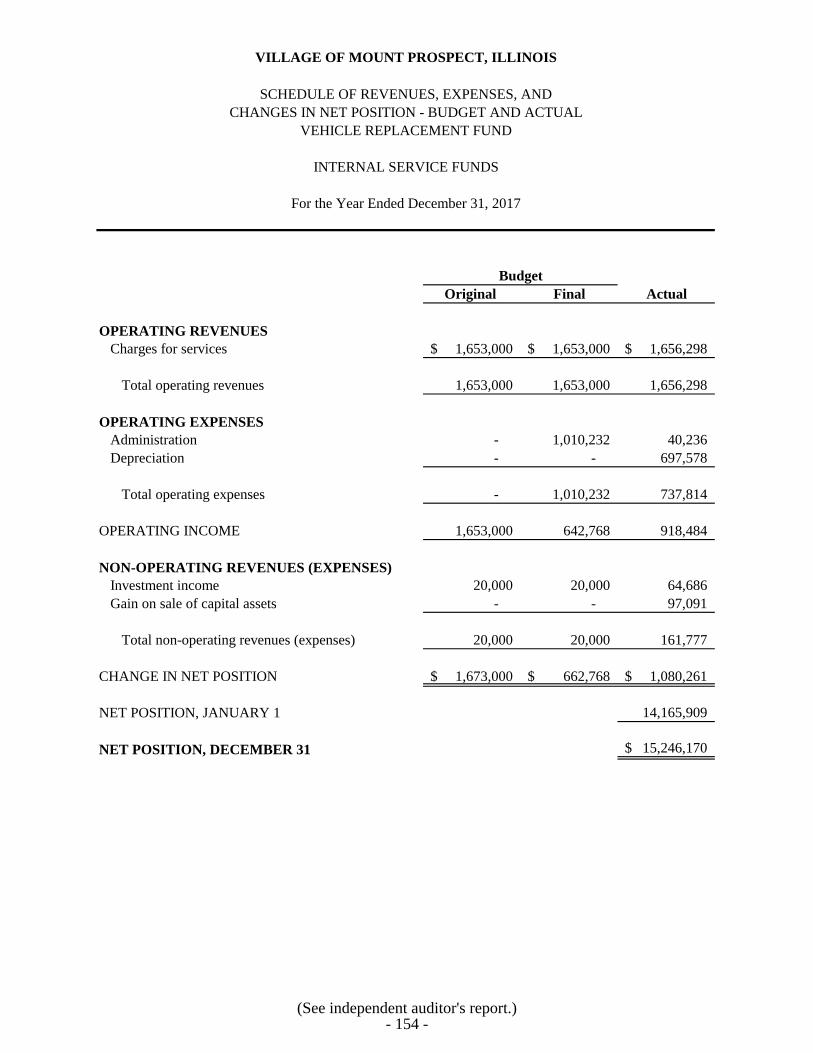
VILLAGE OF MOUNT PROSPECT, ILLINOIS
SCHEDULE OF REVENUES, EXPENSES, AND
CHANGES IN NET POSITION - BUDGET AND ACTUAL
VEHICLE REPLACEMENT FUND
INTERNAL SERVICE FUNDS
For the Year Ended December 31, 2017
Original Final Actual
OPERATING REVENUES
Charges for services 1,653,000$ 1,653,000$ 1,656,298$
Total operating revenues 1,653,000 1,653,000 1,656,298
OPERATING EXPENSES
Administration - 1,010,232 40,236
Depreciation - - 697,578
Total operating expenses - 1,010,232 737,814
OPERATING INCOME 1,653,000 642,768 918,484
NON-OPERATING REVENUES (EXPENSES)
Investment income 20,000 20,000 64,686
Gain on sale of capital assets - - 97,091
Total non-operating revenues (expenses) 20,000 20,000 161,777
CHANGE IN NET POSITION 1,673,000$ 662,768$ 1,080,261$
NET POSITION, JANUARY 1 14,165,909
NET POSITION, DECEMBER 31 15,246,170$
Budget
(See independent auditor's report.)- 154 -

VILLAGE OF MOUNT PROSPECT, ILLINOIS
SCHEDULE OF OPERATING REVENUES - BUDGET AND ACTUAL
VEHICLE REPLACEMENT FUND
INTERNAL SERVICE FUNDS
For the Year Ended December 31, 2017
Original Final Actual
CHARGES FOR SERVICES
General Fund
Manager's office 3,400$ 3,400$ 3,400$
Community development - planning 1,500 1,500 1,500
Community development - building 1,800 1,800 1,800
Community development - housing 7,300 7,300 7,300
Community development - health 1,500 1,500 1,500
Police department 143,700 143,700 143,700
Fire department 543,700 543,700 543,700
Public works department 451,700 451,700 451,700
Engineering division 10,600 10,600 10,600
Human services 400 400 400
Water and Sewer Fund 479,400 479,400 479,400
Other fee 8,000 8,000 11,298
TOTAL OPERATING REVENUE 1,653,000$ 1,653,000$ 1,656,298$
Budget
(See independent auditor's report.)- 155 -

VILLAGE OF MOUNT PROSPECT, ILLINOIS
SCHEDULE OF OPERATING EXPENSES - BUDGET AND ACTUAL
VEHICLE REPLACEMENT FUND
INTERNAL SERVICE FUNDS
For the Year Ended December 31, 2017
Original Final Actual
OPERATING EXPENSES
Administration
Capital outlay - police vehicles 403,000$ 433,078$ 344,076$
Capital outlay - pool vehicles 25,000 25,000 20,283
Capital outlay - fire 648,000 1,468,599 1,075,768
Capital outlay - public works 1,048,000 1,651,139 1,167,693
Less capital assets capitalized (2,124,000) (2,567,584) (2,567,584)
Total administration - 1,010,232 40,236
Depreciation - - 697,578
TOTAL OPERATING EXPENSES -$ 1,010,232$ 737,814$
Budget
(See independent auditor's report.)- 156 -

VILLAGE OF MOUNT PROSPECT, ILLINOIS
SCHEDULE OF REVENUES, EXPENSES, AND
CHANGES IN NET POSITION - BUDGET AND ACTUAL
VEHICLE MAINTENANCE FUND
INTERNAL SERVICE FUNDS
For the Year Ended December 31, 2017
Original Final Actual
OPERATING REVENUES
Charges for services 2,029,964$ 2,029,964$ 2,029,964$
Total operating revenues 2,029,964 2,029,964 2,029,964
OPERATING EXPENSES
Administration and maintenance 2,174,423 2,174,423 2,046,622
Depreciation - - 1,593
Total operating expenses 2,174,423 2,174,423 2,048,215
OPERATING INCOME (LOSS) (144,459) (144,459) (18,251)
NON-OPERATING REVENUES (EXPENSES)
Loss on sale of capital assets - - (6,373)
Investment income 600 600 4,920
Total non-operating revenues (expenses) 600 600 (1,453)
CHANGE IN NET POSITION (143,859)$ (143,859)$ (19,704)
NET POSITION, JANUARY 1 811,400
NET POSITION, DECEMBER 31 791,696$
Budget
(See independent auditor's report.)- 157 -

VILLAGE OF MOUNT PROSPECT, ILLINOIS
SCHEDULE OF OPERATING REVENUES - BUDGET AND ACTUAL
VEHICLE MAINTENANCE FUND
INTERNAL SERVICE FUNDS
For the Year Ended December 31, 2017
Original Final Actual
CHARGES FOR SERVICES
General Fund
Mayor and board -$ -$ -$
Manager's office 3,045 3,045 3,045
Television services division 3,248 3,248 3,248
Community development - planning 3,045 3,045 3,045
Community development - building 4,263 4,263 4,263
Community development - housing 21,315 21,315 21,315
Community development - health 3,045 3,045 3,045
Police department 517,032 517,032 517,032
Fire department 320,937 320,937 320,937
Public works department 631,725 631,725 631,725
Engineering division 33,088 33,088 33,088
Human service charges 3,045 3,045 3,045
Water and Sewer Fund 486,176 486,176 486,176
TOTAL OPERATING REVENUES 2,029,964$ 2,029,964$ 2,029,964$
Budget
(See independent auditor's report.)- 158 -

VILLAGE OF MOUNT PROSPECT, ILLINOIS
SCHEDULE OF OPERATING EXPENSES - BUDGET AND ACTUAL
VEHICLE MAINTENANCE FUND
INTERNAL SERVICE FUNDS
For the Year Ended December 31, 2017
Original Final Actual
ADMINISTRATION AND MAINTENANCE
Vehicle division administration
Personal services 115,797$ 115,797$ 115,148$
Employee benefits 66,271 66,271 86,159
Other employee costs 4,005 4,005 4,032
Contractual services 10,597 10,597 9,971
Utilities 3,259 3,259 5,076
Commodities and supplies 2,002 2,002 1,937
Office equipment 590 590 590
Total vehicle division administration 202,521 202,521 222,913
Vehicle maintenance program
Personal services 869,882 869,882 918,928
Employee benefits 335,233 335,233 346,644
Contractual services 95,886 95,886 85,674
Commodities and supplies 667,113 667,113 468,675
Other equipment 3,788 3,788 3,788
Total vehicle maintenance program 1,971,902 1,971,902 1,823,709
Total administration and maintenance 2,174,423 2,174,423 2,046,622
Depreciation - - 1,593
TOTAL OPERATING EXPENSES 2,174,423$ 2,174,423$ 2,048,215$
Budget
(See independent auditor's report.)- 159 -

FIDUCIARY FUNDS
PENSION TRUST FUNDS
Police Pension Fund - to account for the resources necessary to provide retirement and disability
benefits to personnel of the Mount Prospect Police Department. Revenues are provided by the
following: Village contributions (made possible by a property tax levy), employee withholdings,
and investment income.
Firefighters' Pension Fund - to account for the resources necessary to provide retirement and
disability benefits to personnel of the Mount Prospect Fire Department. Revenues are provided
by the following: Village contributions (made possible by a property tax levy), employee
withholdings, and investment income.
AGENCY FUNDS
Escrow Deposit Fund - to account for refundable deposits held by the Village to ensure the
completion of public improvements. The money is held by the Village until the improvements
are completed.
Flexcomp Escrow Fund - to account for employee payroll deductions pursuant to a Section 125
flexible compensation plan. The money is reimbursed to employees for qualified medical and
dependent care expenses.

VILLAGE OF MOUNT PROSPECT, ILLINOIS
COMBINING STATEMENT OF NET POSITION
PENSION TRUST FUNDS
December 31, 2017
Police Firefighters'
Pension Pension Total
ASSETS
Cash and cash equivalents 1,232,315$ 1,068,368$ 2,300,683$
Investments
State and local obligations 2,046,737 481,342 2,528,079
U.S. Government and U.S. agency obligations 10,512,229 12,312,200 22,824,429
Corporate bonds and obligations 10,620,264 9,465,491 20,085,755
Real estate - 3,183,460 3,183,460
Mutual funds 46,550,389 39,595,895 86,146,284
Total cash and investments 70,961,934 66,106,756 137,068,690
Accrued interest receivable 150,155 132,206 282,361
Due from other funds - 41,918 41,918
Prepaids 1,162 1,669 2,831
Total assets 71,113,251 66,282,549 137,395,800
LIABILITIES
Accounts payable 38,535 17,209 55,744
Due to other funds 5,654 - 5,654
Total liabilities 44,189 17,209 61,398
NET POSITION RESTRICTED
FOR PENSIONS 71,069,062$ 66,265,340$ 137,334,402$
(See independent auditor's report.)- 160 -

VILLAGE OF MOUNT PROSPECT, ILLINOIS
COMBINING STATEMENT OF CHANGES IN NET POSITION
PENSION TRUST FUNDS
For the Year Ended December 31, 2017
Police Firefighters'
Pension Pension Total
ADDITIONS
Contributions
Employer 3,747,825$ 3,396,834$ 7,144,659$
Plan members 1,260,472 678,476 1,938,948
Total contributions 5,008,297 4,075,310 9,083,607
Investment income
Interest earned 763,695 640,447 1,404,142
Net change in fair value 8,325,232 8,774,095 17,099,327
Less investment expenses (121,912) (91,173) (213,085)
Net investment income 8,967,015 9,323,369 18,290,384
Total additions 13,975,312 13,398,679 27,373,991
DEDUCTIONS
Administration 48,339 50,783 99,122
Benefits and refunds 4,834,597 5,427,385 10,261,982
Total deductions 4,882,936 5,478,168 10,361,104
NET INCREASE 9,092,376 7,920,511 17,012,887
NET POSITION RESTRICTED
FOR PENSIONS
January 1 61,976,686 58,344,829 120,321,515
December 31 71,069,062$ 66,265,340$ 137,334,402$
(See independent auditor's report.)- 161 -

VILLAGE OF MOUNT PROSPECT, ILLINOIS
SCHEDULE OF CHANGES IN NET POSITION - BUDGET AND ACTUAL
POLICE PENSION FUND
For the Year Ended December 31, 2017
Original Final Actual
ADDITIONS
Contributions
Employer 3,838,125$ 4,169,125$ 3,747,825$
Plan members 770,000 1,200,500 1,260,472
Other 500 500 -
Total contributions 4,608,625 5,370,125 5,008,297
Investment income
Interest earned 798,500 798,500 763,695
Net change in fair value 3,118,000 8,707,000 8,325,232
Less investment expenses (116,000) (116,000) (121,912)
Net investment income 3,800,500 9,389,500 8,967,015
Total additions 8,409,125 14,759,625 13,975,312
DEDUCTIONS
Administration 65,600 65,600 48,339
Benefits and refunds 4,756,710 4,856,210 4,834,597
Total deductions 4,822,310 4,921,810 4,882,936
NET INCREASE 3,586,815$ 9,837,815$ 9,092,376
NET POSITION RESTRICTED
FOR PENSIONS
January 1 61,976,686
December 31 71,069,062$
Budget
(See independent auditor's report.)- 162 -

VILLAGE OF MOUNT PROSPECT, ILLINOIS
SCHEDULE OF CHANGES IN NET POSITION - BUDGET AND ACTUAL
FIREFIGHTERS' PENSION FUND
For the Year Ended December 31, 2017
Original Final Actual
ADDITIONS
Contributions
Employer 3,410,580$ 3,819,080$ 3,396,834$
Plan members 680,000 680,000 678,476
Other 500 500 -
Total contributions 4,091,080 4,499,580 4,075,310
Investment income
Interest earned 625,500 625,500 640,447
Net change in fair value 3,286,000 9,091,000 8,774,095
Less investment expenses (91,000) (91,000) (91,173)
Net investment income 3,820,500 9,625,500 9,323,369
Total additions 7,911,580 14,125,080 13,398,679
DEDUCTIONS
Administration 68,600 68,600 50,783
Benefits and refunds 5,189,810 5,428,310 5,427,385
Total deductions 5,258,410 5,496,910 5,478,168
NET INCREASE 2,653,170$ 8,628,170$ 7,920,511
NET POSITION RESTRICTED
FOR PENSIONS
January 1 58,344,829
December 31 66,265,340$
Budget
(See independent auditor's report.)- 163 -

VILLAGE OF MOUNT PROSPECT, ILLINOIS
COMBINING STATEMENT OF CHANGES IN ASSETS AND LIABILITIES
AGENCY FUNDS
For the Year Ended December 31, 2017
Balances Balances
January 1 Additions Deductions December 31
Cash and investments 1,368,315$ 1,355,766$ 1,597,457$ 1,126,624$
Due from other funds - 10,601 10,601 -
Deposits 7,140 - - 7,140
Other receivables - 83 83 -
TOTAL ASSETS 1,375,455$ 1,366,450$ 1,608,141$ 1,133,764$
LIABILITIES
Deposits payable 1,375,455$ 1,024,514$ 1,266,205$ 1,133,764$
Due to other funds - 147,172 147,172 -
Other liabilities - 715,204 715,204 -
TOTAL LIABILITIES 1,375,455$ 1,886,890$ 2,128,581$ 1,133,764$
Cash and investments 1,342,992$ 1,085,803$ 1,329,344$ 1,099,451$
Due from other funds - 10,601 10,601 -
Other receivables - 83 83 -
TOTAL ASSETS 1,342,992$ 1,096,487$ 1,340,028$ 1,099,451$
Deposits payable 1,342,992$ 754,413$ 997,954$ 1,099,451$
Due to other funds - 140,953 140,953 -
Other liabilities - 715,204 715,204 -
TOTAL LIABILITIES 1,342,992$ 1,610,570$ 1,854,111$ 1,099,451$
All Funds
ASSETS
1. Escrow Deposit Fund
ASSETS
LIABILITIES
(This statement is continued on the following page.)- 164 -

VILLAGE OF MOUNT PROSPECT, ILLINOIS
COMBINING STATEMENT OF CHANGES IN ASSETS AND LIABILITIES (Continued)
AGENCY FUNDS
For the Year Ended December 31, 2017
Balances Balances
January 1 Additions Deductions December 31
Cash and investments 25,323$ 269,963$ 268,113$ 27,173$
Deposits 7,140 - - 7,140
TOTAL ASSETS 32,463$ 269,963$ 268,113$ 34,313$
LIABILITIES
Deposits payable 32,463$ 270,101$ 268,251$ 34,313$
Due to other funds - 6,219 6,219 -
TOTAL LIABILITIES 32,463$ 276,320$ 274,470$ 34,313$
2. Flexcomp Escrow Fund
ASSETS
(See independent auditor's report.)- 165 -

SUPPLEMENTAL DATA

LONG-TERM DEBT PAYABLE BY GOVERNMENTAL FUNDS
To account for the noncurrent portion of the Village’s General Obligation Bond Issues, IEPA
flood loans, installment contracts and notes payable, net pension liabilities, compensated
absences, and other postemployment benefits obligations.
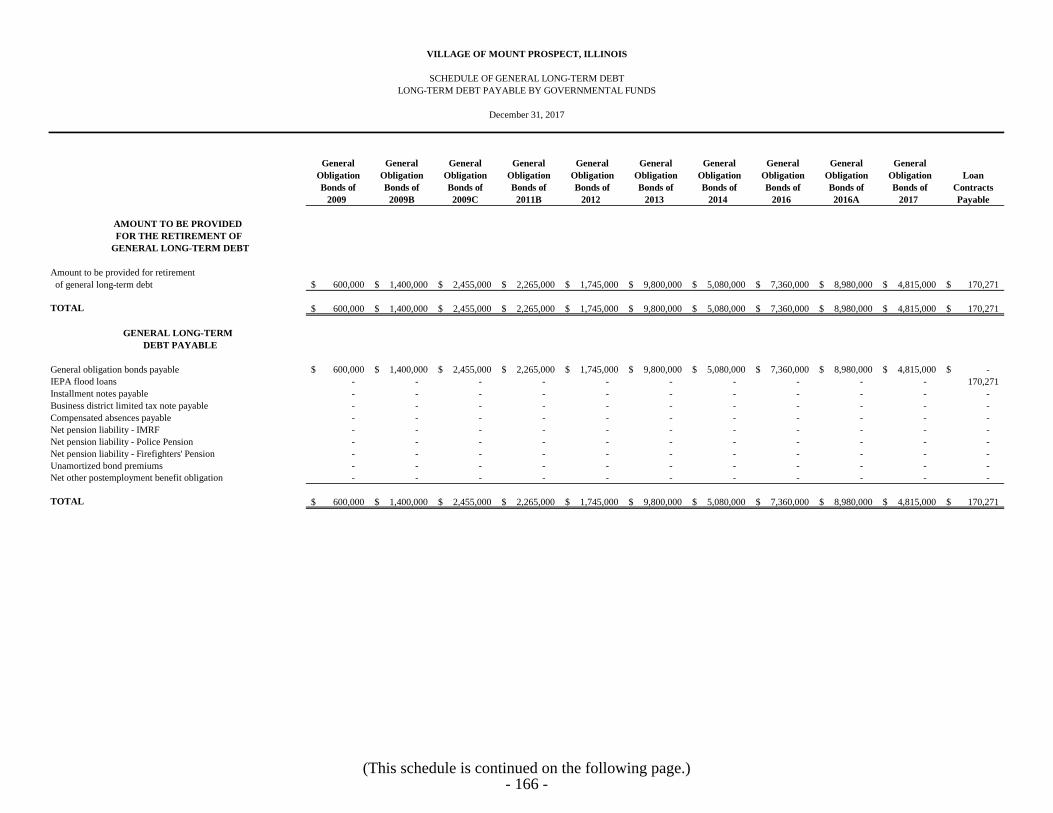
General General General General General General General General General General
Obligation Obligation Obligation Obligation Obligation Obligation Obligation Obligation Obligation Obligation Loan
Bonds of Bonds of Bonds of Bonds of Bonds of Bonds of Bonds of Bonds of Bonds of Bonds of Contracts
2009 2009B 2009C 2011B 2012 2013 2014 2016 2016A 2017 Payable
Amount to be provided for retirement
of general long-term debt 600,000$ 1,400,000$ 2,455,000$ 2,265,000$ 1,745,000$ 9,800,000$ 5,080,000$ 7,360,000$ 8,980,000$ 4,815,000$ 170,271$
TOTAL 600,000$ 1,400,000$ 2,455,000$ 2,265,000$ 1,745,000$ 9,800,000$ 5,080,000$ 7,360,000$ 8,980,000$ 4,815,000$ 170,271$
General obligation bonds payable 600,000$ 1,400,000$ 2,455,000$ 2,265,000$ 1,745,000$ 9,800,000$ 5,080,000$ 7,360,000$ 8,980,000$ 4,815,000$ -$
IEPA flood loans - - - - - - - - - - 170,271
Installment notes payable - - - - - - - - - - -
Business district limited tax note payable - - - - - - - - - - -
Compensated absences payable - - - - - - - - - - -
Net pension liability - IMRF - - - - - - - - - - -
Net pension liability - Police Pension - - - - - - - - - - -
Net pension liability - Firefighters' Pension - - - - - - - - - - -
Unamortized bond premiums - - - - - - - - - - -
Net other postemployment benefit obligation - - - - - - - - - - -
TOTAL 600,000$ 1,400,000$ 2,455,000$ 2,265,000$ 1,745,000$ 9,800,000$ 5,080,000$ 7,360,000$ 8,980,000$ 4,815,000$ 170,271$
DEBT PAYABLE
AMOUNT TO BE PROVIDED
FOR THE RETIREMENT OF
GENERAL LONG-TERM DEBT
GENERAL LONG-TERM
VILLAGE OF MOUNT PROSPECT, ILLINOIS
SCHEDULE OF GENERAL LONG-TERM DEBT
LONG-TERM DEBT PAYABLE BY GOVERNMENTAL FUNDS
December 31, 2017
(This schedule is continued on the following page.)- 166 -

Business Net Net Net Net Other
District Pension Pension Pension Unamortized Postemployment
Installment Limited Tax Compensated Liability - Liability - Liability - Bond Benefit
Notes Note Absences IMRF Police Firefighters Premiums Obligation Total
Amount to be provided for retirement
of general long-term debt 1,105,000$ 32,525,273$ 3,771,826$ 6,289,542$ 43,096,949$ 38,857,145$ 1,284,843$ 2,031,531$ 173,632,380$
TOTAL 1,105,000$ 32,525,273$ 3,771,826$ 6,289,542$ 43,096,949$ 38,857,145$ 1,284,843$ 2,031,531$ 173,632,380$
General obligation bonds payable -$ -$ -$ -$ -$ -$ -$ -$ 44,500,000$
IEPA flood loans - - - - - - - - 170,271
Installment notes payable 1,105,000 - - - - - - - 1,105,000
Business district limited tax note payable - 32,525,273 - - - - - - 32,525,273
Compensated absences payable - - 3,771,826 - - - - - 3,771,826
Net pension liability - IMRF - - - 6,289,542 - - - - 6,289,542
Net pension liability - Police Pension - - - - 43,096,949 - - - 43,096,949
Net pension liability - Firefighters' Pension - - - - - 38,857,145 - - 38,857,145
Unamortized bond premiums - - - - - - 1,284,843 - 1,284,843
Net other postemployment benefit obligation - - - - - - - 2,031,531 2,031,531
TOTAL 1,105,000$ 32,525,273$ 3,771,826$ 6,289,542$ 43,096,949$ 38,857,145$ 1,284,843$ 2,031,531$ 173,632,380$
AMOUNT TO BE PROVIDED
FOR THE RETIREMENT OF
GENERAL LONG-TERM DEBT
GENERAL LONG-TERM
DEBT PAYABLE
VILLAGE OF MOUNT PROSPECT, ILLINOIS
SCHEDULE OF GENERAL LONG-TERM DEBT (Continued)
LONG-TERM DEBT PAYABLE BY GOVERNMENTAL FUNDS
December 31, 2017
(See independent auditor's report.)- 167 -

LONG-TERM DEBT REQUIREMENTS

Date of Issue March 11, 2009
Date of Maturity December 1, 2028
Authorized Issue $10,000,000
Denomination of Bonds $5,000
Interest Rates 3.005% to 4.500%
Interest Dates June 1 and December 1
Principal Maturity Date December 1
Payable at The Bank of New York Mellon Trust Company
Tax
Levy Bond
Year Numbers Principal Interest Total June 1 Amount December 1 Amount
2017 - -$ 24,000$ 24,000$ 2018 12,000$ 2018 12,000$
2018 - - 24,000 24,000 2019 12,000 2019 12,000
2019 - - 24,000 24,000 2020 12,000 2020 12,000
2020 - - 24,000 24,000 2021 12,000 2021 12,000
2021 - - 24,000 24,000 2022 12,000 2022 12,000
2022 - - 24,000 24,000 2023 12,000 2023 12,000
2023 41-559 600,000 24,000 624,000 2024 12,000 2024 12,000
600,000$ 168,000$ 768,000$ 84,000$ 84,000$
Requirements Interest Due on
CURRENT AND FUTURE PRINCIPAL AND INTEREST REQUIREMENTS
VILLAGE OF MOUNT PROSPECT, ILLINOIS
LONG-TERM DEBT REQUIREMENTS
GENERAL OBLIGATION BONDS OF 2009
December 31, 2017
(See independent auditor's report.)- 168 -

Date of Issue December 22, 2009
Date of Maturity December 1, 2021
Authorized Issue $3,430,000
Denomination of Bonds $5,000
Interest Rates 2.50% to 3.75%
Interest Dates June 1 and December 1
Principal Maturity Date December 1
Payable at The Bank of New York Mellon Trust Company
Tax
Levy Bond
Year Numbers Principal Interest Total June 1 Amount December 1 Amount
2017 407-472 330,000$ 51,675$ 381,675$ 2018 25,837$ 2018 25,838$
2018 473-540 340,000 40,125 380,125 2019 20,062 2019 20,063
2019 541-612 360,000 27,375 387,375 2020 13,687 2020 13,688
2020 613-686 370,000 13,875 383,875 2021 6,937 2021 6,938
1,400,000$ 133,050$ 1,533,050$ 66,523$ 66,527$
Requirements Interest Due on
CURRENT AND FUTURE PRINCIPAL AND INTEREST REQUIREMENTS
VILLAGE OF MOUNT PROSPECT, ILLINOIS
LONG-TERM DEBT REQUIREMENTS
GENERAL OBLIGATION REFUNDING BONDS OF 2009B
December 31, 2017
(See independent auditor's report.)- 169 -

Date of Issue December 22, 2009
Date of Maturity December 1, 2029
Authorized Issue $2,650,000
Denomination of Bonds $5,000
Interest Rates 3.00% to 5.75%
Interest Dates June 1 and December 1
Principal Maturity Date December 1
Payable at The Bank of New York Mellon Trust Company
Tax
Levy Bond
Year Numbers Principal Interest Total June 1 Amount December 1 Amount
2017 40-58 95,000$ 127,655$ 222,655$ 2018 63,828$ 2018 63,827$
2018 59-82 120,000 123,380 243,380 2019 61,690 2019 61,690
2019 83-110 140,000 118,100 258,100 2020 59,050 2020 59,050
2020 111-142 160,000 111,520 271,520 2021 55,760 2021 55,760
2021 143-242 500,000 104,000 604,000 2022 52,000 2022 52,000
2022 243-330 440,000 79,500 519,500 2023 39,750 2023 39,750
2023 - - 57,500 57,500 2024 28,750 2024 28,750
2024 - - 57,500 57,500 2025 28,750 2025 28,750
2025 - - 57,500 57,500 2026 28,750 2026 28,750
2026 - - 57,500 57,500 2027 28,750 2027 28,750
2027 - - 57,500 57,500 2028 28,750 2028 28,750
2028 331-530 1,000,000 57,500 1,057,500 2029 28,750 2029 28,750
2,455,000$ 1,009,155$ 3,464,155$ 504,578$ 504,577$
Requirements Interest Due on
CURRENT AND FUTURE PRINCIPAL AND INTEREST REQUIREMENTS
VILLAGE OF MOUNT PROSPECT, ILLINOIS
LONG-TERM DEBT REQUIREMENTS
TAXABLE GENERAL OBLIGATION BONDS OF 2009C
December 31, 2017
(See independent auditor's report.)- 170 -

Date of Issue July 29, 2011
Date of Maturity December 1, 2020
Authorized Issue $5,160,000
Denomination of Bonds $5,000
Interest Rates 2.52%
Interest Dates June 1 and December 1
Principal Maturity Date December 1
Payable at JP Morgan Chase
Tax
Levy Bond
Year Numbers Principal Interest Total June 1 Amount December 1 Amount
2017 580-726 735,000$ 57,078$ 792,078$ 2018 28,539$ 2018 28,539$
2018 727-877 755,000 38,556 793,556 2019 19,278 2019 19,278
2019 878-1032 775,000 19,530 794,530 2020 9,765 2020 9,765
2,265,000$ 115,164$ 2,380,164$ 57,582$ 57,582$
Requirements Interest Due on
CURRENT AND FUTURE PRINCIPAL AND INTEREST REQUIREMENTS
VILLAGE OF MOUNT PROSPECT, ILLINOIS
LONG-TERM DEBT REQUIREMENTS
GENERAL OBLIGATION BONDS OF 2011B
December 31, 2017
(See independent auditor's report.)- 171 -

Date of Issue January 3, 2012
Date of Maturity December 1, 2022
Authorized Issue $2,975,000
Denomination of Bonds $5,000
Interest Rates 3.10%
Interest Dates June 1 and December 1
Principal Maturity Date December 1
Payable at JP Morgan Chase
Tax
Levy Bond
Year Numbers Principal Interest Total June 1 Amount December 1 Amount
2017 - -$ 54,096$ 54,096$ 2018 27,048$ 2018 27,048$
2018 - - 54,096 54,096 2019 27,048 2019 27,048
2019 - - 54,096 54,096 2020 27,048 2020 27,048
2020 247-418 860,000 54,096 914,096 2021 27,048 2021 27,048
2021 419-595 885,000 27,436 912,436 2022 13,718 2022 13,718
1,745,000$ 243,820$ 1,988,820$ 121,910$ 121,910$
Requirements Interest Due on
CURRENT AND FUTURE PRINCIPAL AND INTEREST REQUIREMENTS
VILLAGE OF MOUNT PROSPECT, ILLINOIS
LONG-TERM DEBT REQUIREMENTS
GENERAL OBLIGATION BONDS OF 2012
December 31, 2017
(See independent auditor's report.)- 172 -

Date of Issue September 10, 2013
Date of Maturity December 1, 2033
Authorized Issue $9,800,000
Denomination of Bonds $5,000
Interest Rates 3.000% to 4.125%
Interest Dates June 1 and December 1
Principal Maturity Date December 1
Payable at The Bank of New York Mellon Trust Company
Tax
Levy Bond
Year Numbers Principal Interest Total June 1 Amount December 1 Amount
2017 - -$ 369,956$ 369,956$ 2018 184,978$ 2018 184,978$
2018 - - 369,956 369,956 2019 184,978 2019 184,978
2019 1-111 555,000 369,956 924,956 2020 184,978 2020 184,978
2020 112-225 570,000 353,306 923,306 2021 176,653 2021 176,653
2021 226-342 585,000 336,206 921,206 2022 168,103 2022 168,103
2022 343-463 605,000 318,656 923,656 2023 159,328 2023 159,328
2023 464-588 625,000 300,506 925,506 2024 150,253 2024 150,253
2024 589-718 650,000 275,506 925,506 2025 137,753 2025 137,753
2025 719-853 675,000 249,506 924,506 2026 124,753 2026 124,753
2026 854-993 700,000 222,506 922,506 2027 111,253 2027 111,253
2027 994-1139 730,000 194,506 924,506 2028 97,253 2028 97,253
2028 1140-1291 760,000 165,307 925,307 2029 82,653 2029 82,654
2029 1292-1449 790,000 134,907 924,907 2030 67,453 2030 67,454
2030 1450-1613 820,000 103,307 923,307 2031 51,653 2031 51,654
2031 1614-1783 850,000 70,507 920,507 2032 35,253 2032 35,254
2032 1784-1960 885,000 36,507 921,507 2033 18,253 2033 18,254
9,800,000$ 3,871,101$ 13,671,101$ 1,935,548$ 1,935,553$
Requirements Interest Due on
CURRENT AND FUTURE PRINCIPAL AND INTEREST REQUIREMENTS
VILLAGE OF MOUNT PROSPECT, ILLINOIS
LONG-TERM DEBT REQUIREMENTS
GENERAL OBLIGATION BONDS OF 2013
December 31, 2017
(See independent auditor's report.)- 173 -

Date of Issue February 4, 2014
Date of Maturity December 1, 2023
Authorized Issue $6,290,000
Denomination of Bonds $5,000
Interest Rate 3%
Interest Dates June 1 and December 1
Principal Maturity Date December 1
Payable at The Bank of New York Mellon Trust Company
Tax
Levy Bond
Year Numbers Principal Interest Total June 1 Amount December 1 Amount
2017 243-323 405,000$ 152,400$ 557,400$ 2018 76,200$ 2018 76,200$
2018 324-435 560,000 140,250 700,250 2019 70,125 2019 70,125
2019 436-587 760,000 123,450 883,450 2020 61,725 2020 61,725
2020 588-780 965,000 100,650 1,065,650 2021 50,325 2021 50,325
2021 781-1005 1,125,000 71,700 1,196,700 2022 35,850 2022 35,850
2022 1006-1258 1,265,000 37,950 1,302,950 2023 18,975 2023 18,975
5,080,000$ 626,400$ 5,706,400$ 313,200$ 313,200$
Requirements Interest Due on
CURRENT AND FUTURE PRINCIPAL AND INTEREST REQUIREMENTS
VILLAGE OF MOUNT PROSPECT, ILLINOIS
LONG-TERM DEBT REQUIREMENTS
GENERAL OBLIGATION BONDS OF 2014
December 31, 2017
(See independent auditor's report.)- 174 -

Date of Issue
Date of Maturity
Authorized Issue $8,735,000
Denomination of Bonds $5,000
Interest Rate 2% to 3%
Interest Dates June 1 and December 1
Principal Maturity Date December 1
Payable at Zions Bancorporation
Tax
Levy Bond
Year Numbers Principal Interest Total June 1 Amount December 1 Amount
2017 0296-0573 1,400,000$ 176,150$ 1,576,150$ 2018 88,075$ 2018 88,075$
2018 0574-0860 1,425,000 148,150 1,573,150 2019 74,075 2019 74,075
2019 0861-1156 1,470,000 105,400 1,575,400 2020 52,700 2020 52,700
2020 1157-1461 1,515,000 61,300 1,576,300 2021 30,650 2021 30,650
2021 1462-1776 1,550,000 31,000 1,581,000 2022 15,500 2022 15,500
7,360,000$ 522,000$ 7,882,000$ 261,000$ 261,000$
Requirements Interest Due on
September 8, 2016
December 1, 2022
VILLAGE OF MOUNT PROSPECT, ILLINOIS
LONG-TERM DEBT REQUIREMENTS
GENERAL OBLIGATION REFUNDING BONDS OF 2016
December 31, 2017
CURRENT AND FUTURE PRINCIPAL AND INTEREST REQUIREMENTS
(See independent auditor's report.)- 175 -

Date of Issue
Date of Maturity
Authorized Issue $9,100,000
Denomination of Bonds $5,000
Interest Rates 3%
Interest Dates June 1 and December 1
Principal Maturity Date December 1
Payable at Zions Bancorporation
Tax
Levy Bond
Year Numbers Principal Interest Total June 1 Amount December 1 Amount
2017 0025-0048 120,000$ 269,400$ 389,400$ 2018 134,700$ 2018 134,700$
2018 - - 265,800 265,800 2019 132,900 2019 132,900
2019 - - 265,800 265,800 2020 132,900 2020 132,900
2020 - - 265,800 265,800 2021 132,900 2021 132,900
2021 - - 265,800 265,800 2022 132,900 2022 132,900
2022 0049-0151 515,000 265,800 780,800 2023 132,900 2023 132,900
2023 0152-0363 1,060,000 250,350 1,310,350 2024 125,175 2024 125,175
2024 0364-0711 1,740,000 218,550 1,958,550 2025 109,275 2025 109,275
2025 0712-1070 1,795,000 166,350 1,961,350 2026 83,175 2026 83,175
2026 1071-1439 1,845,000 112,500 1,957,500 2027 56,250 2027 56,250
2027 1440-1820 1,905,000 57,150 1,962,150 2028 28,575 2028 28,575
8,980,000$ 2,403,300$ 11,383,300$ 1,201,650$ 1,201,650$
Requirements Interest Due on
December 1, 2016
December 1, 2028
VILLAGE OF MOUNT PROSPECT, ILLINOIS
LONG-TERM DEBT REQUIREMENTS
GENERAL OBLIGATION REFUNDING BONDS OF 2016A
December 31, 2017
CURRENT AND FUTURE PRINCIPAL AND INTEREST REQUIREMENTS
(See independent auditor's report.)- 176 -

Date of Issue
Date of Maturity
Authorized Issue $9,740,000
Denomination of Bonds $5,000
Interest Rates 2.50% to 4.00%
Interest Dates June 1 and December 1
Principal Maturity Date December 1
Payable at Mesirow Financial
Tax
Levy
Year Principal Interest Total June 1 Amount December 1 Amount
2017 125,000$ 308,321$ 433,321$ 2018 145,571$ 2018 162,750$
2018 125,000 320,501 445,501 2019 160,250 2019 160,250
2019 140,000 315,501 455,501 2020 157,750 2020 157,750
2020 290,000 309,901 599,901 2021 154,950 2021 154,950
2021 315,000 298,301 613,301 2022 149,150 2022 149,150
2022 345,000 285,701 630,701 2023 142,850 2023 142,850
2023 375,000 271,901 646,901 2024 135,950 2024 135,950
2024 405,000 256,901 661,901 2025 128,450 2025 128,450
2025 440,000 240,701 680,701 2026 120,350 2026 120,350
2026 465,000 227,501 692,501 2027 113,750 2027 113,750
2027 500,000 215,876 715,876 2028 107,938 2028 107,938
2028 530,000 202,750 732,750 2029 101,375 2029 101,375
2029 565,000 188,175 753,175 2030 94,088 2030 94,088
2030 600,000 171,932 771,932 2031 85,966 2031 85,966
2031 640,000 147,932 787,932 2032 73,966 2032 73,966
2032 690,000 122,332 812,332 2033 61,166 2033 61,166
2033 730,000 100,770 830,770 2034 50,384 2034 50,384
2034 775,000 77,956 852,956 2035 38,978 2035 38,978
2035 820,000 53,738 873,738 2036 26,869 2036 26,869
2036 865,000 28,112 893,112 2037 14,056 2037 14,056
9,740,000$ 4,144,803$ 13,884,803$ 2,063,807$ 2,080,986$
December 1, 2037
VILLAGE OF MOUNT PROSPECT, ILLINOIS
LONG-TERM DEBT REQUIREMENTS
GENERAL OBLIGATION BONDS OF 2017
December 31, 2017
December 20, 2017
CURRENT AND FUTURE PRINCIPAL AND INTEREST REQUIREMENTS
Requirements Interest Due on
(See independent auditor's report.)- 177 -

Date of Issue December 1, 1999
Date of Maturity June 3, 2019
Authorized Issue $1,760,422
Interest Rates 2.625%
Interest Dates June 3 and December 3
Principal Maturity Date June 3
Payable at Illinois Environmental Protection Agency
Fiscal Payment
Year Numbers Principal Interest Total
2018 37-38 112,771$ 3,735$ 116,506$
2019 39 57,500 754 58,254
170,271$ 4,489$ 174,760$
Requirements
CURRENT AND FUTURE PRINCIPAL AND INTEREST REQUIREMENTS
VILLAGE OF MOUNT PROSPECT, ILLINOIS
LONG-TERM DEBT REQUIREMENTS
IEPA FLOOD LOAN (L17-1087) CONTRACT PAYABLE OF 1999
December 31, 2017
(See independent auditor's report.)- 178 -

Date of Issue December 31, 2012
Date of Maturity December 1, 2019
Authorized Issue $2,500,000
Denomination of Bonds $5,000
Interest Rates 0.91%
Interest Dates June 1 and December 1
Principal Maturity Date December 1
Payable at Mount Prospect State Bank
Fiscal Payment
Year Numbers Principal Interest Total June 1 Amount December 1 Amount
2018 11-12 515,000$ 10,056$ 525,056$ 2018 5,028$ 2018 5,028$
2019 13-14 590,000 5,369 595,369 2019 2,684 2019 2,685
1,105,000$ 15,425$ 1,120,425$ 7,712$ 7,713$
Requirements
VILLAGE OF MOUNT PROSPECT, ILLINOIS
LONG-TERM DEBT REQUIREMENTS
INSTALLMENT NOTE PAYABLE OF 2012
December 31, 2017
CURRENT AND FUTURE PRINCIPAL AND INTEREST REQUIREMENTS
Interest Due on
(See independent auditor's report.)- 179 -

ADDITIONAL SUPPLEMENTAL DATA

Expiration
Self-Insured Specific Aggregate Insurance Date of
Type of Coverage Retention Excess Limit Excess Limit Carrier Policy
Property & Inland Marine 25,000$ 101,804,765$ None Hartford 1/1/2018
Excess Workers' Compensation 650,000 Statutory 1,000,000$ Safety National Insurance Co. 1/1/2018
General Liability 2,000,000 None None Self-Insured N/A
Automobile Liability 2,000,000 None None Self-Insured N/A
Employment Practices Liability 2,000,000 None None Self-Insured N/A
Police Professional Liability 2,000,000 None None Self-Insured N/A
Public Officials' Liability (Errors and Omissions) 2,000,000 None None Self-Insured N/A
Excess Liability 2,000,000 13,000,000 13,000,000 High-Level Excess Liability Pool N/A
Fiduciary Liability - Police Pension 25,000 5,000,000 5,000,000 Federal Insurance Co./Chubb 8/1/2018
Fiduciary Liability - Firefighters' Pension 25,000 5,000,000 5,000,000 Federal Insurance Co./Chubb 8/1/2018
Public Employee Dishonesty 5,000 100,000 None Travelers 5/1/2018
Depositors Forgery 1,000 100,000 None Travelers 5/1/2018
Public Officials Bond - President - 100,000 100,000 Liberty Mutual 5/1/2018
Public Officials Bond - Manager - 100,000 100,000 Liberty Mutual 5/1/2018
Public Officials Bond - Village Treasurer - 250,000 250,000 Liberty Mutual 5/1/2018
Contingent Tax Interruption 25,000 5,000,000 5,000,000 Federal Insurance Co./Chubb/Hartford 1/1/2018
Employee and Retiree Health Insurance 35,000/125,000 None None Intergovernmental Personal Benefit Cooperative 6/30/2018
Third Party Administrators
Workers' Compensation Claims Administration N/A N/A N/A MCSA Cooperative (CCMSI third-party administrator) N/A
Liability Claims Administration N/A N/A N/A Gallagher Bassett N/A
VILLAGE OF MOUNT PROSPECT, ILLINOIS
SCHEDULE OF INSURANCE IN FORCE
December 31, 2017
(See independent auditor's report.)- 180 -

STATISTICAL SECTION
This part of the Village of Mount Prospect, Illinois’ comprehensive annual financial report
presents detailed information as a context for understanding what the information in the financial
statements, note disclosures, and required supplementary information says about the Village’s
overall financial health.
Contents Page(s)
Financial Trends
These schedules contain trend information to help the reader understand how
the Village’s financial performance and well-being have changed over time.
181-190
Revenue Capacity
These schedules contain information to help the reader assess the Village’s
most significant local revenue source, the property tax.
191-199
Debt Capacity
These schedules present information to help the reader assess the
affordability of the Village’s current levels of outstanding debt and the
Village’s ability to issue additional debt in the future.
200-203
Demographic and Economic Information
These schedules offer demographic and economic indicators to help the
reader understand the environment within which the Village’s financial
activities take place.
204-205
Operating Information
These schedules contain service and infrastructure data to help the reader
understand how the information in the Village’s financial report relates to the
services the Village provides and the activities it performs.
206-210
Sources: Unless otherwise noted, the information in these schedules is derived from the
comprehensive annual financial report for the relevant year.

Fiscal Year 2008 2009 2010 2011
GOVERNMENTAL ACTIVITIES
Net investment in capital assets 29,663,909$ 27,741,453$ 30,020,260$ 53,524,378$
Restricted 2,367,670 4,497,173 4,891,298 2,828,903
Unrestricted 21,216,625 20,277,880 18,296,001 20,019,184
TOTAL GOVERNMENTAL ACTIVITIES 53,248,204$ 52,516,506$ 53,207,559$ 76,372,465$
BUSINESS-TYPE ACTIVITIES
Net investment in capital assets 20,776,324$ 22,412,134$ 23,044,064$ 26,892,474$
Unrestricted 6,852,644 5,996,007 5,927,430 5,167,986
TOTAL BUSINESS-TYPE ACTIVITIES 27,628,968$ 28,408,141$ 28,971,494$ 32,060,460$
PRIMARY GOVERNMENT
Net investment in capital assets 50,440,233$ 50,153,587$ 53,064,324$ 80,416,852$
Restricted 2,367,670 4,497,173 4,891,298 2,828,903
Unrestricted 28,069,269 26,273,887 24,223,431 25,187,170
TOTAL PRIMARY GOVERNMENT 80,877,172$ 80,924,647$ 82,179,053$ 108,432,925$
* The unrestricted net position decreased in 2014 due to the recognition of the business district limited tax note payable.
**The Village implemented GASB Statement No. 68 in fiscal year 2015.
Data Source
Audited Financial Statements
VILLAGE OF MOUNT PROSPECT, ILLINOIS
NET POSITION BY COMPONENT
Last Ten Fiscal Years
- 181 -

2012 2013 2014* 2015** 2016 2017
48,521,357$ 48,152,760$ 46,326,047$ 43,755,661$ 33,224,875$ 34,171,129$
3,547,328 3,045,922 4,186,505 5,319,794 4,557,424 4,104,560
24,952,139 24,153,907 (10,441,020) (99,563,419) (91,778,462) (95,150,426)
77,020,824$ 75,352,589$ 40,071,532$ (50,487,964)$ (53,996,163)$ (56,874,737)$
26,566,375$ 26,352,289$ 26,854,967$ 36,336,899$ 36,588,628$ 35,765,755$
6,820,901 8,057,996 7,734,851 5,580,049 4,610,400 6,266,907
33,387,276$ 34,410,285$ 34,589,818$ 41,916,948$ 41,199,028$ 42,032,662$
75,087,732$ 74,505,049$ 73,181,014$ 80,092,560$ 79,613,503$ 69,936,884$
3,547,328 3,045,922 4,186,505 5,319,794 4,557,424 4,104,560
31,773,040 32,211,903 (2,706,169) (93,983,370) (96,968,062) (88,883,519)
110,408,100$ 109,762,874$ 74,661,350$ (8,571,016)$ (12,797,135)$ (14,842,075)$
- 182 -

Fiscal Year 2008 2009 2010 2011
EXPENSES
Governmental Activities
General government 6,682,541$ 7,192,572$ 6,541,405$ 6,992,107$
Public safety 26,646,855 27,172,360 27,303,165 27,276,948
Highways and streets 13,540,232 12,101,419 12,924,872 18,141,803
Health 4,163,354 4,194,045 4,133,883 4,289,103
Welfare 1,744,504 2,316,995 2,039,805 1,902,841
Culture and recreation 409,066 367,635 322,553 353,308
Interest 837,127 1,047,961 1,146,789 1,329,499
Total governmental activities expenses 54,023,679 54,392,987 54,412,472 60,285,609
Business-Type Activities
Water and sewer 9,179,399 9,393,148 9,950,591 10,444,247
Commuter parking 263,394 233,701 284,607 327,224
Total business-type activities expenses 9,442,793 9,626,849 10,235,198 10,771,471
TOTAL PRIMARY GOVERNMENTAL EXPENSES 63,466,472$ 64,019,836$ 64,647,670$ 71,057,080$
PROGRAM REVENUES
Governmental Activities
Charges for services
General government 5,045,338$ 6,705,200$ 6,271,966$ 6,343,828$
Public safety 2,242,952 1,580,052 1,486,144 1,545,333
Highway and streets 169,615 237,786 135,641 108,865
Other activities 320,488 65,933 70,964 32,040
Operating grants and contributions 1,800,781 2,551,348 2,338,965 2,749,168
Capital grants and contributions 764,283 406,734 443,278 65,905
Total governmental activities program revenues 10,343,457 11,547,053 10,746,958 10,845,139
Business-Type Activities
Charges for services
Water and sewer 8,774,681 8,500,396 8,916,621 9,081,731
Commuter parking 269,400 218,735 210,324 219,040
Capital grants and contributions - - - -
Total business-type activities program revenues 9,044,081 8,719,131 9,126,945 9,300,771
TOTAL PRIMARY GOVERNMENT
PROGRAM REVENUES 19,387,538$ 20,266,184$ 19,873,903$ 20,145,910$
NET REVENUE (EXPENSE)
Governmental activities (43,680,222)$ (42,845,934)$ (43,665,514)$ (49,440,470)$
Business-type activities (398,712) (907,718) (1,108,253) (1,470,700)
TOTAL PRIMARY GOVERNMENT NET
REVENUE (EXPENSE) (44,078,934)$ (43,753,652)$ (44,773,767)$ (50,911,170)$
VILLAGE OF MOUNT PROSPECT, ILLINOIS
CHANGE IN NET POSITION
Last Ten Fiscal Years
- 183 -

2012 2013 2014 2015* 2016 2017
6,233,324$ 7,356,433$ 10,171,883$ 11,514,091$ 9,949,082$ 10,690,075$
28,134,173 29,771,502 30,812,251 38,535,612 38,328,609 37,351,039
15,853,017 18,570,593 19,923,120 26,650,772 19,990,440 16,176,313
4,407,533 4,459,897 4,591,946 4,538,800 4,620,982 4,557,211
1,909,062 1,868,952 1,844,911 1,813,254 2,109,733 2,068,368
406,606 443,171 425,217 453,534 515,555 611,653
1,033,923 1,016,337 2,899,466 2,064,448 1,926,793 2,049,953
57,977,638 63,486,885 70,668,794 85,570,511 77,441,194 73,504,612
11,129,942 12,078,221 13,779,500 14,143,610 16,054,624 14,308,117
345,715 346,303 329,988 269,619 390,118 229,873
11,475,657 12,424,524 14,109,488 14,413,229 16,444,742 14,537,990
69,453,295$ 75,911,409$ 84,778,282$ 99,983,740$ 93,885,936$ 88,042,602$
7,068,010$ 6,908,188$ 7,785,745$ 4,458,450$ 4,496,290$ 4,178,495$
1,412,279 1,583,328 1,712,860 1,796,729 1,795,838 1,761,708
126,660 269,066 414,316 183,246 290,172 169,389
39,163 41,220 515,095 4,467,864 4,799,080 4,616,263
1,974,867 2,356,665 2,209,036 1,912,795 2,629,030 2,705,584
72,175 288,752 140,181 47,274 - 159,682
10,693,154 11,447,219 12,777,233 12,866,358 14,010,410 13,591,121
10,990,923 11,507,264 11,970,681 12,434,405 12,931,867 13,395,619
225,214 234,458 254,784 261,745 334,102 343,314
- - 373,498 8,889,998 244,423 -
11,216,137 11,741,722 12,598,963 21,586,148 13,510,392 13,738,933
21,909,291$ 23,188,941$ 25,376,196$ 34,452,506$ 27,520,802$ 27,330,054$
(47,284,484)$ (52,039,666)$ (57,891,561)$ (72,704,153)$ (63,430,784)$ (59,913,491)$
(259,520) (682,802) (1,510,525) 7,172,919 (2,934,350) (799,057)
(47,544,004)$ (52,722,468)$ (59,402,086)$ (65,531,234)$ (66,365,134)$ (60,712,548)$
- 184 -

Fiscal Year 2008 2009 2010 2011
GENERAL REVENUES AND OTHER CHANGES
IN NET POSITION
Governmental Activities
Taxes
Property 15,942,106$ 16,543,215$ 17,165,849$ 17,942,394$
Utility - 4,519,175 4,589,221 4,624,678
Business district - - - -
Home rule sales 14,862,634 4,061,202 4,392,753 4,673,134
Telecommunications 2,770,473 - - -
Other 10,346,444 1,524,823 1,598,056 1,976,997
Intergovernmental
State sales and use - 9,761,726 11,110,707 11,411,781
Income taxes - 4,573,162 4,428,176 4,328,196
Replacement taxes - 338,134 362,532 357,596
Property tax TIF rebate - - - -
Charitable games tax - - - 3,986
Investment income 416,673 187,793 67,001 29,043
Miscellaneous 93,781 605,006 633,902 235,167
Transfers - - 8,370 -
Contributions 51,120 - - -
Total governmental activities 44,483,231 42,114,236 44,356,567 45,582,972
Business-Type Activities
Property tax 1,505,394 1,520,602 1,513,114 1,526,828
Home rule sales tax 92,154 82,882 89,942 107,576
Investment income 159,150 26,646 1,653 836
Miscellaneous - 56,761 75,267 73,858
Transfers - - (8,370) -
Total business-type activities 1,756,698 1,686,891 1,671,606 1,709,098
TOTAL PRIMARY GOVERNMENT 46,239,929$ 43,801,127$ 46,028,173$ 47,292,070$
CHANGE IN NET POSITION
Governmental activities 803,009$ (731,698)$ 691,053$ (3,857,498)$
Business-type activities 1,357,986 779,173 563,353 238,398
TOTAL PRIMARY GOVERNMENT
CHANGE IN NET POSITION 2,160,995$ 47,475$ 1,254,406$ (3,619,100)$
* The Village implemented GASB Statement No. 68 in fiscal year 2015.
Data Source
Audited Financial Statements
Last Ten Fiscal Years
VILLAGE OF MOUNT PROSPECT, ILLINOIS
CHANGE IN NET POSITION (Continued)
- 185 -
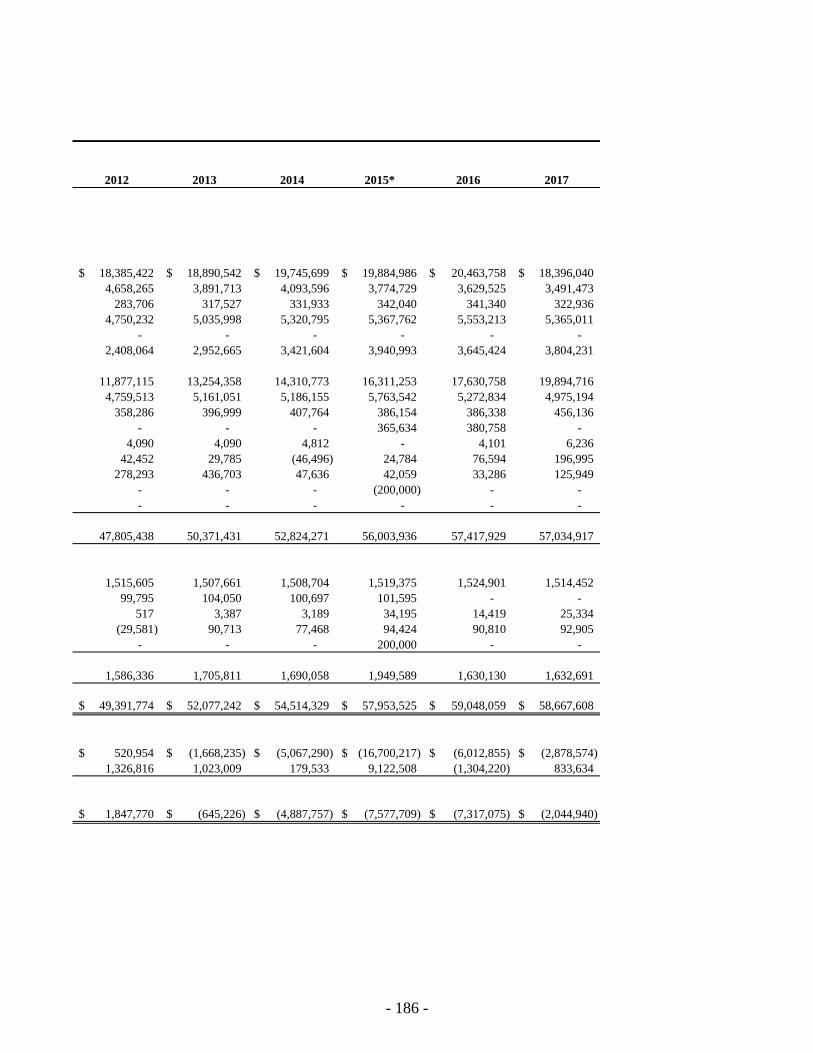
2012 2013 2014 2015* 2016 2017
18,385,422$ 18,890,542$ 19,745,699$ 19,884,986$ 20,463,758$ 18,396,040$
4,658,265 3,891,713 4,093,596 3,774,729 3,629,525 3,491,473
283,706 317,527 331,933 342,040 341,340 322,936
4,750,232 5,035,998 5,320,795 5,367,762 5,553,213 5,365,011
- - - - - -
2,408,064 2,952,665 3,421,604 3,940,993 3,645,424 3,804,231
11,877,115 13,254,358 14,310,773 16,311,253 17,630,758 19,894,716
4,759,513 5,161,051 5,186,155 5,763,542 5,272,834 4,975,194
358,286 396,999 407,764 386,154 386,338 456,136
- - - 365,634 380,758 -
4,090 4,090 4,812 - 4,101 6,236
42,452 29,785 (46,496) 24,784 76,594 196,995
278,293 436,703 47,636 42,059 33,286 125,949
- - - (200,000) - -
- - - - - -
47,805,438 50,371,431 52,824,271 56,003,936 57,417,929 57,034,917
1,515,605 1,507,661 1,508,704 1,519,375 1,524,901 1,514,452
99,795 104,050 100,697 101,595 - -
517 3,387 3,189 34,195 14,419 25,334
(29,581) 90,713 77,468 94,424 90,810 92,905
- - - 200,000 - -
1,586,336 1,705,811 1,690,058 1,949,589 1,630,130 1,632,691
49,391,774$ 52,077,242$ 54,514,329$ 57,953,525$ 59,048,059$ 58,667,608$
520,954$ (1,668,235)$ (5,067,290)$ (16,700,217)$ (6,012,855)$ (2,878,574)$
1,326,816 1,023,009 179,533 9,122,508 (1,304,220) 833,634
1,847,770$ (645,226)$ (4,887,757)$ (7,577,709)$ (7,317,075)$ (2,044,940)$
- 186 -

Fiscal Year 2008 2009 2010 2011*
GENERAL FUND
Reserved 228,750$ 88,492$ 53,536$ -$
Unreserved 12,312,075 10,110,989 10,364,455 -
Nonspendable - - - 100,590
Unassigned - - - 10,704,282
TOTAL GENERAL FUND 12,540,825$ 10,199,481$ 10,417,991$ 10,804,872$
ALL OTHER GOVERNMENTAL FUNDS
Reserved 2,523,221$ 4,762,560$ 2,188,376$ -$
Unreserved, reported in
Special Revenue Funds 2,043,378 1,674,387 2,148,898 -
Debt Service Funds (908,466) (485,274) (78,844) -
Capital Project Funds 303,492 1,965,761 2,459,761 -
Nonspendable - - - 147,130
Restricted - - - 2,828,903
Assigned - - - 3,564,914
Unassigned - - - (5,578)
TOTAL ALL OTHER
GOVERNMENTAL FUNDS 3,961,625$ 7,917,434$ 6,718,191$ 6,535,369$
* The Village implemented GASB Statement No. 54 in fiscal year 2011.
Data Source
Audited Financial Statements
VILLAGE OF MOUNT PROSPECT, ILLINOIS
FUND BALANCES OF GOVERNMENTAL FUNDS
Last Ten Fiscal Years
- 187 -

2012 2013 2014 2015 2016 2017
-$ -$ -$ -$ -$ -$
- - - - - -
98,150 297,762 337,165 204,023 188,247 261,219
11,466,179 11,580,820 12,508,457 17,016,920 18,496,104 19,137,752
11,564,329$ 11,878,582$ 12,845,622$ 17,220,943$ 18,684,351$ 19,398,971$
-$ -$ -$ -$ -$ -$
- - - - - -
- - - - - -
- - - - - -
144,114 132,464 147,412 107,609 96,771 83,232
3,625,715 3,166,583 13,941,797 5,212,985 4,557,424 8,919,560
7,525,930 15,705,506 7,371,630 3,679,129 3,224,446 3,579,214
(664) (689) (789) (448,034) (688,716) -
11,295,095$ 19,003,864$ 21,460,050$ 8,551,689$ 7,189,925$ 12,582,006$
- 188 -

Fiscal Year 2008 2009 2010 2011
REVENUES
Taxes 27,287,056$ 26,648,415$ 27,740,802$ 29,217,203$
Licenses, permits, and fees 3,094,828 3,748,456 3,394,211 3,356,816
Intergovernmental 19,104,781 17,274,500 18,719,087 18,895,261
Charges for services 3,618,419 3,832,341 3,789,976 3,974,677
Fines and forfeits 720,351 529,655 556,178 548,993
Investment income 416,673 137,142 55,457 23,103
Other reimbursements - - - -
Miscellaneous 533,460 834,738 781,149 406,118
Total revenues 54,775,568 53,005,247 55,036,860 56,422,171
EXPENDITURES
General government 5,725,191 5,796,151 5,240,716 5,284,168
Public safety 25,906,274 26,384,953 26,935,085 26,992,535
Highways and streets 9,168,071 8,291,493 7,450,823 7,681,534
Health 4,156,319 4,188,172 4,128,010 4,286,754
Welfare 1,736,791 2,316,995 2,039,805 1,902,841
Culture and recreation 381,892 358,207 313,125 346,068
Capital outlay 6,623,970 14,296,659 7,739,590 7,274,213
Debt service
Principal retirement 4,149,735 1,425,219 1,046,203 1,377,700
Interest and fiscal charges 891,181 1,023,907 1,124,236 1,057,464
Total expenditures 58,739,424 64,081,756 56,017,593 56,203,277
EXCESS (DEFICIENCY) OF REVENUES
OVER EXPENDITURES (3,963,856) (11,076,509) (980,733) 218,894
OTHER FINANCING SOURCES (USES)
Bonds issued - 16,080,000 - 5,160,000
Premium on bonds issued - 124,535 - -
Payment to escrow agent - (3,513,925) - (5,139,582)
Transfers in 809,422 635,100 450,000 80,089
Transfers (out) (833,242) (635,100) (450,000) (115,342)
Sale of capital assets 2,895 364 - -
Total other financing sources (uses) (20,925) 12,690,974 - (14,835.00)
NET CHANGE IN FUND BALANCES (3,984,781)$ 1,614,465$ (980,733)$ 204,059$
DEBT SERVICE AS A PERCENTAGE
OF NONCAPITAL EXPENDITURES 9.00% 4.55% 4.12% 4.35%
Data Source
Audited Financial Statements
VILLAGE OF MOUNT PROSPECT, ILLINOIS
CHANGES IN FUND BALANCES OF GOVERNMENTAL FUNDS
Last Ten Fiscal Years
- 189 -

2012 2013 2014 2015 2016 2017
30,485,689$ 31,088,445$ 32,564,624$ 33,433,891$ 34,113,260$ 31,784,137$
3,657,586 3,589,368 3,516,082 3,915,635 4,001,458 3,982,497
18,862,827 21,103,909 23,914,974 26,018,173 27,434,551 29,199,312
4,417,110 4,408,987 5,220,730 5,664,398 6,347,775 5,810,731
403,036 430,960 587,966 511,536 414,885 415,189
36,491 16,751 (46,495) 24,784 76,594 196,995
- - - - 35,000 19,824
629,892 1,167,196 983,623 656,877 549,816 592,352
58,492,631 61,805,616 66,741,504 70,225,294 72,973,339 72,001,037
5,827,275 7,452,147 7,050,018 7,598,649 9,435,601 10,060,904
28,022,943 29,233,562 30,706,685 30,350,270 32,512,612 34,279,062
7,734,185 9,094,846 8,291,698 7,744,122 8,148,696 8,762,136
4,405,184 4,457,548 4,590,027 4,589,156 4,585,572 4,500,280
1,909,062 1,868,952 1,865,265 1,961,516 1,994,918 1,953,055
399,366 435,931 421,517 467,611 499,208 585,907
4,761,739 8,588,414 12,075,460 20,998,508 10,718,553 5,786,667
1,479,732 1,537,312 2,987,587 3,048,912 3,243,840 3,518,904
959,812 913,882 1,914,718 1,799,590 2,017,192 1,378,256
55,499,298 63,582,594 69,902,975 78,558,334 73,156,192 70,825,171
2,993,333 (1,776,978) (3,161,471) (8,333,040) (182,853) 1,175,866
5,475,000 9,800,000 6,290,000 - 17,835,000 4,815,000
- - 294,697 - 1,022,839 115,835
(2,949,150) - - - (18,573,342) -
- 239,977 - 81,599 1,637,926 600,000
- (239,977) - (281,599) (1,637,926) (600,000)
- - - - - -
2,525,850 9,800,000 6,584,697 (200,000) 284,497 4,930,835
5,519,183$ 8,023,022$ 3,423,226$ (8,533,040)$ 101,644$ 6,106,701$
4.40% 4.01% 7.02% 6.20% 7.32% 6.99%
- 190 -

VILLAGE OF MOUNT PROSPECT, ILLINOIS
ASSESSED VALUE AND ACTUAL VALUE OF TAXABLE PROPERTY
Last Ten Levy Years
Estimated
Actual
Total Estimated Taxable
Total Taxable Direct Actual Value
Levy Residential Commercial Industrial Railroad Assessed Tax Taxable as a Percentage
Year Property Property Property Property Value Rate Value of Actual Value
2007 1,227,488,556$ 412,588,412$ 229,739,726$ 508,622$ 1,870,325,316$ 0.750 5,610,975,948$ 33.333%
2008 1,343,275,031 414,537,434 221,110,772 572,793 1,979,496,030 0.732 5,938,488,090 33.333%
2009 1,452,220,540 387,256,513 177,285,176 649,124 2,017,411,353 0.754 6,052,234,059 33.333%
2010 1,330,339,716 332,297,825 171,115,770 927,196 1,834,680,507 0.829 5,504,041,521 33.333%
2011 1,242,549,785 298,578,904 152,864,606 959,506 1,694,952,801 0.936 5,084,858,403 33.333%
2012 1,141,783,464 281,197,939 145,136,294 656,385 1,568,774,082 1.051 4,706,322,246 33.333%
2013 948,371,026 272,696,503 135,438,749 787,806 1,357,294,084 1.275 4,071,882,252 33.333%
2014 989,619,882 285,736,126 114,184,895 836,775 1,390,377,678 1.276 4,171,133,034 33.333%
2015 962,934,812 279,463,359 111,147,033 1,005,644 1,354,550,848 1.352 4,063,652,544 33.333%
2016 1,191,992,297 304,999,806 121,128,843 103,906 1,619,158,852 1.157 4,857,476,556 33.333%
Note: Property in the Village is reassessed every three years. Property is assessed at 33% of actual value.
Data Source
Office of the County Clerk
- 191 -

Tax Levy Year 2007 2008 2009 2010 2011 2012 2013 2014 2015 2016
VILLAGE DIRECT RATES
Corporate 0.416 0.393 0.399 0.377 0.444 0.501 0.688 0.724 - -
Bonds and interest 0.071 0.093 0.076 0.098 0.105 0.113 0.167 0.165 0.170 0.143
Garbage 0.110 0.090 0.089 0.098 0.109 0.121 0.026 - - -
Police Pension 0.077 0.078 0.102 0.137 0.147 0.167 0.214 0.208 0.236 0.211
Firefighters' Pension 0.076 0.078 0.088 0.119 0.131 0.149 0.180 0.179 0.190 0.170
Fire Protection - - - - - - - - 0.385 0.322
Police Protection - - - - - - - - 0.371 0.311
TOTAL DIRECT RATES 0.750 0.732 0.754 0.829 0.936 1.051 1.275 1.276 1.352 1.157
OVERLAPPING RATES
Mount Prospect Library 0.439 0.441 0.450 0.519 0.582 0.646 0.761 0.758 0.801 0.687
County of Cook 0.446 0.415 0.394 0.423 0.462 0.531 0.560 0.568 0.552 0.533
Consolidated Elections 0.012 - 0.021 - 0.025 - 0.031 - 0.034 -
Forest Preserve District 0.053 0.051 0.049 0.051 0.058 0.063 0.069 0.069 0.069 0.063
Metropolitan Water Reclamation District 0.263 0.252 0.261 0.274 0.320 0.370 0.417 0.430 0.426 0.406
Suburban TB Sanitarium - - - - - - - - - -
Township of Elk Grove 0.040 0.041 0.044 0.049 0.056 0.064 0.077 0.076 0.078 0.066
Township of Maine 0.065 0.064 0.067 0.075 0.085 0.096 0.120 0.119 0.124 0.108
Township of Wheeling 0.038 0.038 0.039 0.043 0.048 0.052 0.056 0.052 0.055 0.041
General Assistance Elk Grove 0.008 0.009 0.010 0.011 0.012 0.014 0.017 0.017 0.017 0.013
General Assistance Maine 0.015 0.015 0.016 0.018 0.021 0.023 0.029 0.029 0.031 0.027
General Assistance Wheeling 0.009 0.009 0.009 0.005 0.009 0.009 0.010 0.010 0.010 0.008
Road and Bridge Elk Grove 0.009 0.009 0.010 0.011 0.013 0.014 0.017 0.018 0.018 0.016
Road and Bridge Maine 0.034 0.033 0.034 0.038 0.043 0.049 0.061 0.062 0.065 0.056
Road and Bridge Wheeling 0.012 0.012 0.012 0.014 0.015 0.016 0.019 0.019 0.020 0.014
Northwest Mosquito Abatement District 0.008 0.008 0.008 0.009 0.010 0.011 0.013 0.013 0.011 0.010
Arlington Heights High School #214 1.621 1.587 1.636 1.839 2.067 2.324 2.768 2.776 2.881 2.527
Community College District #512 0.260 0.256 0.258 0.295 0.334 0.373 0.444 0.451 0.466 0.416
Arlington Heights Park District 0.404 0.379 0.392 0.450 0.496 0.545 0.633 0.636 0.626 0.488
Village of Mount Prospect
Special Service Area #5 0.101 0.096 0.095 0.105 0.114 0.122 0.140 0.138 0.142 0.119
School District #59 1.791 1.810 1.945 2.129 2.422 2.673 3.172 3.176 3.291 2.998
Mount Prospect Park District 0.411 0.407 0.411 0.453 0.502 0.557 0.657 0.654 0.681 0.594
VILLAGE OF MOUNT PROSPECT, ILLINOIS
PROPERTY TAX RATES - DIRECT AND OVERLAPPING GOVERNMENTS
Last Ten Levy Years
- 192 -

Tax levy Year 2007 2008 2009 2010 2011 2012 2013 2014 2015 2016
OVERLAPPING RATES (Continued)
School District #57 2.334 2.246 2.195 2.521 2.748 3.041 3.478 3.241 3.364 2.870
School District #25 2.890 2.807 2.510 2.813 3.101 3.416 3.659 3.678 3.990 3.424
River Trails Park District 0.428 0.422 0.433 0.510 0.553 0.632 0.747 0.748 0.769 0.665
School District #26 2.698 2.696 2.703 3.131 3.458 3.873 4.563 4.572 4.742 4.140
Prospect Heights Park District 0.561 0.544 0.523 0.595 0.661 0.746 0.856 0.884 0.912 0.770
School District #23 2.418 2.363 2.253 2.571 2.869 3.273 3.932 3.922 4.062 3.404
School District #21 3.154 3.161 3.209 3.658 4.164 4.556 4.841 5.430 5.642 4.966
Des Plaines Park District 0.312 0.300 0.317 0.338 0.379 0.425 0.531 0.529 0.556 0.485
Prospect Heights Old Town Sanitary 0.039 0.015 0.015 0.017 0.020 0.023 0.028 0.028 - -
Elk Grove Rural Fire Protection District 0.895 0.971 1.032 1.055 1.121 1.096 1.296 1.329 1.410 1.305
Prospect Heights Fire Protection District 0.693 0.677 0.652 0.755 0.845 0.934 1.091 1.102 1.148 0.979
High School District #207 1.602 1.577 1.617 1.782 1.995 2.215 2.722 2.739 2.901 2.507
Community College District #535 0.141 0.140 0.140 0.160 0.196 0.219 0.256 0.258 0.271 0.231
School District #62 2.350 2.329 2.492 2.741 3.107 3.490 4.255 4.293 4.487 3.921
TOTAL TAX RATE FOR PROPERTY LOCATED
IN THE VILLAGE OF MOUNT PROSPECT,
ELK GROVE TOWNSHIP, AND SCHOOL
DISTRICT #59 6.212 6.114 6.346 6.997 7.913 8.813 10.418 10.420 10.819 9.605
SHARE OF TOTAL TAX RATE LEVIED BY
THE VILLAGE OF MOUNT PROSPECT
FOR VILLAGE PURPOSES 12.1% 12.0% 11.9% 11.8% 11.8% 11.9% 12.2% 12.2% 12.5% 12.0%
TOTAL TAX RATE FOR PROPERTY LOCATED
IN THE VILLAGE OF MOUNT PROSPECT,
WHEELING TOWNSHIP, SCHOOL DISTRICT #26,
AND MOUNT PROSPECT PARK DISTRICT 7.121 7.000 7.100 7.990 8.940 9.998 11.783 11.786 12.242 10.715
SHARE OF TOTAL TAX RATE LEVIED BY
THE VILLAGE OF MOUNT PROSPECT
FOR VILLAGE PURPOSES 10.5% 10.5% 10.6% 10.4% 10.5% 10.5% 10.8% 10.8% 11.0% 10.8%
Note: Property tax rates are per $100 of assessed valuation.
Data Source
Office of the County Clerk
- 193 -

VILLAGE OF MOUNT PROSPECT, ILLINOIS
PRINCIPAL PROPERTY TAXPAYERS
Current Year and Nine Years Ago
Percentage Percentage
of Total of Total
Village Village
Taxable Taxable Taxable Taxable
Assessed Assessed Assessed Assessed
Taxpayer Type of Business Value Rank Valuation Taxpayer Type of Business Value Rank Valuation
DLC Management Corp. Management Corporation, 26,458,780$ 1 1.63% Randhurst Shopping Center 38,681,906$ 1 2.07%
Shopping Plaza
Home Properties Colony Apartments 18,963,895 2 1.17% CRP Holdings Real Estate 29,404,769 2 1.57%
Mount Prospect Plaza Shopping Center 16,479,990 3 1.02% Home Properties Colony Colony Square Apartments 22,430,491 3 1.20%
United Airlines Inc. Operations Center 13,911,530 4 0.86% Mount Prospect Plaza Shopping Center 21,982,090 4 1.18%
Individual Commercial 12,887,703 5 0.80% Golf Plaza Shopping Center 17,448,188 5 0.93%
Golf Plaza I & II Shopping Center 12,744,927 6 0.79% Costco Property Tax Commercial Sales Store 11,644,590 6 0.62%
First Industrial Rlty Real Estate 9,588,778 7 0.59% Huntington Square Apartments 11,509,007 7 0.62%
Cummins Alison Corp. Manufacturing 7,422,916 8 0.46% PFG 800 Biermann LP Pharmaceutical 11,255,616 8 0.60%
Costco Properties Commercial Sales Store 7,307,278 9 0.45% Cummins Alison Corp. Manufacturing 11,114,044 9 0.59%
LIT Industrial Limited Real Estate 7,012,558 10 0.43% First Industrial LP Property Management 11,005,324 10 0.59%
132,778,355$ 8.20% 186,476,025$ 9.97%
Total 2016 Equalized Assessed Valuation 1,619,158,852$ 100.00% Total 2008 Equalized Assessed Valuation 1,870,325,316$ 100.00%
* Collections received in 2017 for 2016 Tax Year
Data Source
Office of the County Clerk
2017 * 2008
Note: Every effort has been made to seek out and report the largest taxpayers. However, many of the taxpayers contain multiple parcels and it is possible that some parcels and their valuations were overlooked.
- 194 -

Last Ten Levy Years
Collections
Fiscal Levy Percentage in Subsequent Percentage
Year Year Tax Levied Amount of Levy Years Amount of Levy
2008 2007 14,014,838$ 13,648,416$ 97.39% (77,455)$ 13,570,961$ 96.83%
2009 2008 14,472,269 14,137,805 97.69% (13,619) 14,124,186 97.59%
2010 2009 15,194,636 14,856,084 97.77% (129,548) 14,726,536 96.92%
2011 2010 15,194,635 14,961,411 98.47% (57,871) 14,903,540 98.08%
2012 2011 15,852,352 15,614,490 98.50% (24,467) 15,590,023 98.35%
2013 2012 16,477,871 16,278,228 98.79% (56,444) 16,221,784 98.45%
2014 2013 17,301,436 17,064,355 98.63% (4,764) 17,059,591 98.60%
2015 2014 17,741,219 17,521,845 98.76% 17,305 17,539,150 98.86%
2016 2015 18,313,527 18,130,372 99.00% 27,853 18,158,225 99.15%
2017 2016 18,733,668 18,534,114 98.93% - 18,534,114 98.93%
Data Source
Office of the County Clerk
VILLAGE OF MOUNT PROSPECT, ILLINOIS
PROPERTY TAX LEVIES AND COLLECTIONS
Collected within the
Fiscal Year of the Levy Total Collections to Date
- 195 -

Fiscal Year 2008 2009 2010 2011 2012 2013 2014 2015 2016 2017
General merchandise 1,099,957$ 800,080$ 1,054,791$ 946,021$ 1,186,217$ 1,171,771$ 1,135,237$ 1,112,640$ 1,114,511$ 1,082,424$
Food 1,069,087 1,005,043 944,631 895,984 862,501 876,288 891,855 949,277 951,863 877,665
Drinking and eating places 564,572 522,897 544,118 596,008 661,285 764,653 778,314 825,994 884,477 879,654
Apparel 68,774 33,425 37,444 216,301 118,034 149,317 163,857 162,116 163,438 157,353
Furniture, H.H., and radio 243,339 225,436 224,221 237,392 255,967 240,289 221,977 220,663 209,712 202,302
Lumber, building hardware 704,972 650,987 668,852 683,905 670,057 750,191 756,113 791,285 821,872 846,377
Automobile and filling stations 1,277,713 1,176,389 1,358,572 1,585,870 1,681,146 1,508,700 1,578,004 1,540,910 1,492,452 1,676,338
Drugs and miscellaneous retail 3,608,854 3,272,273 3,699,398 3,393,072 3,422,047 4,081,740 4,574,353 5,460,292 6,594,754 8,965,486
Agriculture and all others 1,245,594 1,275,048 1,726,693 1,924,871 2,073,142 2,616,771 2,802,361 3,629,675 3,611,295 3,649,578
Manufacturers 184,057 93,616 129,476 135,019 110,009 182,433 383,370 433,798 500,199 184,759
TOTAL 10,066,919$ 9,055,194$ 10,388,196$ 10,614,443$ 11,040,405$ 12,342,153$ 13,285,441$ 15,126,650$ 16,344,573$ 18,521,934$
VILLAGE DIRECT SALES
TAX RATE 1.00% 1.00% 1.00% 1.00% 1.00% 1.00% 1.00% 1.00% 1.00% 1.00%
NUMBER OF TAXPAYERS 900 795 800 839 861 883 899 997 987 1,102
Data available for calendar year only. The fiscal year of the Village of Mount Prospect is same as the calendar year. Excludes Home Rule Sales Tax portion.
Data Source
Illinois Department of Revenue
VILLAGE OF MOUNT PROSPECT, ILLINOIS
SALES TAXES BY CATEGORY
Last Ten Fiscal Years
- 196 -

Fiscal Year 2008 2009 2010 2011 2012* 2013* 2014* 2015* 2016* 2017*
General merchandise -$ -$ -$ -$ 89,393$ 88,289$ 85,937$ 84,364$ 82,142$ 76,426$
Food - - - - 18,898 19,146 20,989 20,747 21,846 20,186
Drinking and eating places - - - - 29,413 40,954 48,185 51,419 54,393 51,629
Apparel - - - - 16,341 15,594 19,302 19,963 21,716 20,126
Furniture, H.H., and radio - - - - 16,287 17,106 16,461 16,088 15,551 14,438
Lumber, building hardware - - - - 90,668 101,338 104,434 107,339 108,479 109,058
Automobile and filling stations - - - - - - - - - -
Drugs and miscellaneous retail - - - - 17,747 29,896 32,071 37,063 31,889 25,843
Agriculture and all others - - - - 4,959 5,203 4,554 5,057 5,323 5,230
Manufacturers - - - - - - - - - -
TOTAL -$ -$ -$ -$ 283,706$ 317,526$ 331,933$ 342,041$ 341,339$ 322,936$
VILLAGE DIRECT
SALES TAX RATE 0.00% 0.00% 0.00% 0.00% 0.25% 0.25% 0.25% 0.25% 0.25% 0.25%
Data available for calendar year only. The fiscal year of the Village of Mount Prospect is the same as the calendar year.
* Amount reported net of IDOR 2% compliance administration and enforcement charge.
Data Source
Illinois Department of Revenue
VILLAGE OF MOUNT PROSPECT, ILLINOIS
BUSINESS DISTRICT SALES TAXES BY CATEGORY
Last Ten Fiscal Years
- 197 -

2008 2009 2010 2011 2012 * 2013 * 2014 * 2015 * 2016 * 2017 *
General merchandise 967,261$ 693,008$ 811,120$ 749,509$ 900,240$ 885,410$ 864,254$ 861,799$ 858,739$ 822,252$
Food 261,398 248,128 266,766 254,207 238,050 240,013 234,082 249,683 246,759 231,474
Drinking and eating places 558,908 519,177 539,414 592,596 656,376 754,898 766,264 808,304 862,052 831,312
Apparel 68,267 33,424 37,442 153,487 117,928 148,991 163,487 161,630 162,986 154,603
Furniture, H.H., and radio 240,192 223,116 220,694 232,711 251,253 235,936 218,184 217,031 206,542 196,588
Lumber, building hardware 701,258 646,990 665,409 680,356 665,891 743,492 752,301 787,000 817,396 828,391
Automobile and filling stations 640,842 596,221 697,383 891,042 922,948 948,339 956,255 893,301 831,269 937,688
Drugs and miscellaneous retail 413,511 407,587 484,085 432,639 454,001 509,608 508,772 488,963 439,702 473,116
Agriculture and all others 819,975 647,829 632,050 659,611 514,937 492,238 550,929 548,380 623,624 702,386
Manufacturers 180,157 89,263 126,598 131,640 107,183 179,710 380,685 431,129 497,623 179,655
TOTALS 4,851,769$ 4,104,743$ 4,480,961$ 4,777,798$ 4,828,806$ 5,138,635$ 5,395,213$ 5,447,220$ 5,546,692$ 5,357,465$
NUMBER OF TAXPAPERS 900 795 800 839 861 883 899 997 987 1102
VILLAGE HOME RULE SALES
TAX RATE 1.00% 1.00% 1.00% 1.00% 1.00% 1.00% 1.00% 1.00% 1.00% 1.00%
Data available for calendar year only. The fiscal year of the Village of Mount Prospect is the same as the calendar year.
Interest Income included in Warrants is not reflected in this schedule.
*Excluding additional allocations received (excluded from IDOR Online report)
** Amount reported net of IDOR 2% compliance administration and enforcement charge.
Data Source
Illinois Department of Revenue
VILLAGE OF MOUNT PROSPECT, ILLINOIS
HOME RULE SALES TAX BY CATEGORY
Last Ten Fiscal Years
- 198 -

VILLAGE OF MOUNT PROSPECT, ILLINOIS
DIRECT AND OVERLAPPING SALES TAX RATES
Last Ten Fiscal Years
Regional Village Home Rule
Fiscal State County Transportation Direct Sales Tax
Year Rate Rate Authority Rate Rate Total
2008 5.00% 2.00% 1.00% 1.00% 1.00% 10.00%
2009 5.00% 2.00% 1.00% 1.00% 1.00% 10.00%
2010 5.00% 1.50% 1.00% 1.00% 1.00% 9.50%
2011 5.00% 1.50% 1.00% 1.00% 1.00% 9.50%
2012* 5.00% 1.25% 1.00% 1.00% 1.00% 9.25%
2013* 5.00% 1.00% 1.00% 1.00% 1.00% 9.00%
2014* 5.00% 1.00% 1.00% 1.00% 1.00% 9.00%
2015* 5.00% 1.00% 1.00% 1.00% 1.00% 9.00%
2016 * 5.00% 2.00% 1.00% 1.00% 1.00% 10.00%
2017 * 5.00% 2.00% 1.00% 1.00% 1.00% 10.00%
* Business district is assessed additional 0.25% sales tax.
Data Source
State of Illinois
- 199 -

RATIOS OF OUTSTANDING DEBT BY TYPE
Last Ten Fiscal Years
Business-Type
Activities
Business
Fiscal General Tax Increment IEPA District General Total Percentage of
Year Obligation Financing Loan Installment Limited Tax Obligation Primary Personal Per
Ended Bonds Bonds Payable (1) Note (2) Note Payable Bonds Government Income* Capita*
2008 13,105,000$ -$ 3,805,678$ -$ -$ -$ 16,910,678$ 1.14% 301$
2009 24,770,000 - 3,305,459 - - - 28,075,459 1.89% 499
2010 24,240,000 - 2,789,256 - - - 27,029,256 1.50% 499
2011 23,630,000 - 2,256,556 - - - 25,886,556 1.44% 478
2012 22,790,000 - 1,706,824 2,500,000 - - 26,996,824 1.50% 498
2013 31,645,000 - 1,139,512 2,475,000 30,451,305 - 65,710,817 3.65% 1,213
2014 48,433,628 - 721,927 2,340,000 31,514,427 - 83,009,982 4.61% 1,532
2015 45,927,931 - 543,015 1,940,000 31,790,140 - 80,201,086 4.46% 1,481
2016 43,905,073 - 359,175 1,525,000 31,767,253 - 77,556,501 4.31% 1,432
2017 45,784,843 - 170,271 1,105,000 32,525,273 - 79,585,387 4.32% 1,432
* See the schedule of Demographic and Economic Information on page 204 for personal income and population data.
Note: Details of the Village's outstanding debt can be found in the notes to financial statements.
Data Source
Audited Financial Statements
VILLAGE OF MOUNT PROSPECT, ILLINOIS
Governmental Activities
(1) The Village entered into five installment contracts with the Illinois Environmental Protection Agency to provide funds for the construction of flood control projects.
The contracts are for a 20-year period with equal semiannual installments. Only two of the five original loans remain outstanding.
(2) The Village entered into an installment note to provide funding for the construction of certain flood control projects. The loan is payable in annual installments over
a seven-year period.
- 200 -

VILLAGE OF MOUNT PROSPECT, ILLINOIS
RATIOS OF GENERAL BONDED DEBT OUTSTANDING
Last Ten Fiscal Years
Percentage of
Less Amounts Estimated
General Available Actual Taxable
Fiscal Obligation In Debt Value of Per
Year Bonds Service Fund Total Property* Capita
2008 13,105,000$ -$ 13,105,000$ 0.23% 232.92$
2009 24,770,000 - 24,770,000 0.42% 440.24
2010 24,240,000 - 24,240,000 0.40% 430.82
2011 23,630,000 131,372 23,498,628 0.43% 433.82
2012 22,790,000 135,817 22,654,183 0.45% 418.23
2013 31,645,000 121,491 31,523,509 0.67% 581.97
2014 48,433,628 131,635 48,301,993 1.19% 891.72
2015 45,927,931 154,206 45,773,725 1.10% 845.05
2016 43,905,073 168,152 43,736,921 1.08% 807.45
2017 45,784,843 184,195 45,600,648 0.94% 841.85
Note: Details of the Village's outstanding debt can be found in the notes to financial statements.
Data Sources
Audited financial statements
Office of the County Clerk
*See the schedule of Assessed Value and Actual Value of Taxable Property on page 191 for property
value data.
- 201 -

VILLAGE OF MOUNT PROSPECT, ILLINOIS
DIRECT AND OVERLAPPING GOVERNMENTAL ACTIVITIES DEBT
December 31, 2017
(2) (3)
Percentage Village of
(1) Debt Applicable Mount Prospect
Gross to the Village of Share
Governmental unit Debt Mount Prospect of Debt
Village of Mount Prospect 79,585,387$ 100.000% 79,585,387$
County of Cook 3,085,186,750 1.128% 34,800,907
Forest Preserve District of Cook County 101,200,000 1.128% 1,141,536
Metropolitan Water Reclamation District 2,428,705,091 1.150% 27,930,109
Community College District #535 28,950,000 0.014% 4,053
Community College District #512 126,895,000 8.543% 10,840,640
School District #214 37,480,000 18.912% 7,088,218
School District #207 14,540,000 0.069% 10,033
School District #57 7,860,000 95.003% 7,467,236
School District #26 8,665,000 77.771% 6,738,857
School District #25 47,360,000 2.629% 1,245,094
School District #23 7,540,000 7.709% 581,259
School District #21 30,255,000 3.202% 968,765
School District #59 15,235,000 15.273% 2,326,842
Arlington Heights Park District 10,890,000 1.615% 175,874
Des Plaines Park District 2,050,000 1.749% 35,855
Mount Prospect Park District 3,758,788 65.520% 2,462,758
5,956,570,629 103,818,036
6,036,156,016$ 183,403,423$
(3) Amount in column (2) multiplied by amount in column (1).
Data Source
(1) Gross bonded debt excluding outstanding general obligation (alternate revenue bonds) which are
expected to be paid from sources other then general taxation.
(2) Determined by ratio of 2016 assessed value of property subject to taxation in overlapping unit to value
of property subject to taxation in the Village of Mount Prospect.
Governmental units and the percentage of overlapping debt from the County Clerk's office. Gross debt of
the overlapping governmental units obtained from publicly-available sources.
- 202 -

VILLAGE OF MOUNT PROSPECT, ILLINOIS
SCHEDULE OF LEGAL DEBT MARGIN
December 31, 2017
The Village is a home rule municipality.
The General Assembly may limit by law the amount and require referendum approval of debt
to be incurred by home rule municipalities, payable from ad valorem property tax receipts,
only in excess of the following percentages of the assessed value of its taxable property. . . (2)
if its population is more than 25,000 and less than 500,000 an aggregate of one percent: . . .
indebtedness which is outstanding on the effective date (July 1, 1971) of this constitution or
which is thereafter approved by referendum....shall not be included in the foregoing
percentage amounts.
Article VII, Section 6(k) of the 1970 Illinois Constitution governs computation of the legal debt
To date the General Assembly has set no limits for home rule municipalities. The government is a
home rule municipality.
- 203 -

VILLAGE OF MOUNT PROSPECT, ILLINOIS
DEMOGRAPHIC AND ECONOMIC INFORMATION
Last Ten Fiscal Years
(1)
Per
(2) Capita (3)
Fiscal (1) Equalized Personal Personal Unemployment
Year Population Assessed Value Income Income Rate
2008 56,265 1,979,496,030$ 1,488,996,960$ 26,464$ 4.50%
2009 56,265 2,017,411,353 1,488,996,960 26,464 7.90%
2010 56,265 1,834,680,507 1,488,996,960 26,464 7.80%
2011 54,167 1,694,952,801 1,798,831,903 33,209 7.40%
2012 54,167 1,568,774,082 1,798,831,903 33,209 6.60%
2013 54,167 1,357,294,084 1,798,831,903 33,209 6.70%
2014 54,167 1,390,377,678 1,798,831,903 33,209 5.50%
2015 54,167 1,354,550,848 1,798,831,903 33,209 4.30%
2016 54,167 1,304,972,506 1,798,831,903 33,209 4.60%
2017 54,167 N/A 1,841,190,497 33,991 3.70%
Note: 2017 Equalized Assessed Valuation is not available until 2018.
Data Sources
(1) U.S. Department of Commerce, Bureau of the Census
(2) Office of the Cook County Clerk
(3) IDES Local Area Unemployment Statistics
- 204 -

% of % of
Total Village Total Village
Employer Rank Employees Population Employer Rank Employees Population
CVS Caremark 1 1,445 2.67% Caremark, Inc. 1 800 1.42%
Robert Bosch Tool Corporation 2 650 1.20% Robert Bosch Tool Corp. 2 576 1.02%
Cummins-Allison Corporation 3 391 0.72% Metropolitan Life 3 445 0.79%
Village of Mount Prospect 4 380 0.70% Cummins-Allison Corporation 4 435 0.77%
Rauland Borg 5 300 0.55% Village of Mount Prospect 5 336 0.60%
Mount Prospect School District 57 6 293 0.54% Rauland Borg 6 300 0.53%
Carson Pirie Scott 7 291 0.54% Mount Prospect School District 57 7 298 0.53%
Jewel-Osco Food Stores 8 280 0.52% Prospect High School 8 250 0.44%
Rainbow Hospice & Palliative Care 9 240 0.44% Siemens Building Technologies 9 235 0.42%
Prospect High School 10 220 0.41% Jewel Food Stores 10 225 0.40%
Walmart 10 225 0.40%
Data Source
Village Records
VILLAGE OF MOUNT PROSPECT, ILLINOIS
PRINCIPAL EMPLOYERS
Current Year and Nine Years Ago
2017 2008
- 205 -

Function/Program 2008 2009 2010 2011
PUBLIC REPRESENTATION/COMMUNITY
AND CIVIC SERVICES 1.05 1.05 1.05 2.10
Total 1.05 1.05 1.05 2.10
GENERAL GOVERNMENT
Village administration
Administration 16.95 16.95 14.95 14.95
Finance 15.00 15.00 13.00 13.00
Total 31.95 31.95 27.95 27.95
Community development
Community development 23.40 23.15 20.48 20.48
Community development/CDBG 1.20 1.20 1.25 1.25
Total 24.60 24.35 21.73 21.73
Human services department 7.60 10.60 9.50 9.50
Total 7.60 10.60 9.50 9.50
PUBLIC SAFETY AND PROTECTION
Police Department 111.50 111.50 97.83 97.83
Fire Department 84.20 82.20 74.75 74.75
Total 195.70 193.70 172.58 172.58
PUBLIC WORKS DEPARTMENT
Administration 3.35 3.35 2.85 2.85
Streets/buildings/parking 14.60 14.80 11.35 11.85
Forestry 10.80 10.80 10.70 9.75
Engineering 8.30 8.30 8.00 8.00
Water/sewer 26.15 26.15 26.50 25.00
Refuse disposal 2.90 2.90 2.90 2.90
Parking - - - 0.90
Vehicle maintenance 9.10 10.90 10.90 10.90
Total 75.20 77.20 73.20 72.15
VILLAGE TOTAL 336.10 338.85 306.01 306.01
Data Source
Village budget
VILLAGE OF MOUNT PROSPECT, ILLINOIS
FULL-TIME EQUIVALENT EMPLOYEES
Last Ten Fiscal Years
- 206 -

2012 2013 2014 2015 2016 2017
2.10 2.10 2.05 2.15 2.20 2.10
2.10 2.10 2.05 2.15 2.20 2.10
15.45 15.45 15.45 16.85 16.75 17.35
13.00 13.00 13.00 13.00 13.00 13.00
28.45 28.45 28.45 29.85 29.75 30.35
17.75 18.50 18.50 18.50 18.75 18.75
1.25 1.00 1.00 1.00 0.75 0.75
19.00 19.50 19.50 19.50 19.50 19.50
9.50 9.50 9.50 9.50 9.50 9.55
9.50 9.50 9.50 9.50 9.50 9.55
99.50 100.50 100.50 99.50 101.50 102.50
74.50 74.50 74.50 75.00 81.00 81.00
174.00 175.00 175.00 174.50 182.50 183.50
2.85 2.85 2.85 2.85 3.85 3.35
11.85 12.45 12.40 12.40 12.35 12.35
9.75 9.25 9.35 9.25 8.35 8.35
8.00 8.00 8.00 8.00 8.00 8.00
25.00 24.75 24.75 24.75 2.90 25.25
2.90 2.90 2.90 2.90 24.75 2.90
0.90 0.90 0.90 0.90 0.90 0.90
10.90 10.75 10.75 10.75 10.75 10.75
72.15 71.85 71.90 71.80 71.85 71.85
305.20 306.40 306.40 307.30 315.30 316.85
- 207 -

Function/Program 2008 2009 2010 2011
FINANCE DEPARTMENT
Vehicle stickers issued 39,208 39,650 40,018 39,834
Utility bills 86,577 86,458 86,057 86,701
Real estate transfer tax stamps sold 947 986 1,086 1,022
COMMUNITY DEVELOPMENT
Building Division
Permits issued 2,687 2,415 2,922 2,821
Plan reviews 452 420 505 515
Building code inspections 7,631 8,564 8,783 8,508
Environmental Health Division
Inspections
Food service 340 394 400 394
Multi-family buildings 279 491 664 664
Swimming pools/spa 59 28 - -
PUBLIC SAFETY
Police
Number of crimes 4,242 3,921 3,696 3,359
Number of service calls 25,631 23,600 22,028 19,943
Number of arrests 1,769 1,736 1,898 1,845
Moving violations 8,723 10,355 10,139 7,026
Parking citations 10,690 10,256 11,317 9,363
Fire
Fire calls 2,019 1,817 1,888 2,350
EMS calls 3,487 3,535 3,465 3,590
Fire prevention inspections 3,264 4,258 3,790 3,418
Training hours 21,073 23,851 24,313 23,578
PUBLIC WORKS
Streets
Street reconstruction (miles)
Street resurfacing (miles) 5.00 5.80 5.00 4.70
Crack filling (lbs) 55,000 57,118 46,846 40,871
Leaves removed (cubic yards) 16,272 18,970 15,424 14,843
Water
Water mains installed (lineal feet) 8,079 5,475 5,475 -
Water billed (1,000 gallons) 1,369,479 1,346,272 1,296,556 1,287,525
Sanitary sewers cleaned (ft) 30,000 55,150 55,150 54,236
Refuse (single/multi-family)
Solid waste collected (tons) 32,101 30,231 31,963 32,264
Recycling (tons) 6,644 6,154 6,117 6,644
* 2017 are estimated amounts. Final figures are not available at time of printing report.
Data Source
Various village departments
VILLAGE OF MOUNT PROSPECT, ILLINOIS
OPERATING INDICATORS
Last Ten Fiscal Years
- 208 -

2012 2013 2014 2015 2016 2017*
43,092 43,490 42,789 41,964 41,323 41,601
90,147 152,312 152,649 152,703 152,872 152,733
1,282 1,451 1,426 1,433 1,541 1,512
2,278 2,383 2,653 2,490 2,500 2,400
595 524 471 536 513 490
9,154 7,824 10,952 10,590 9,535 9,500
405 393 434 409 400 400
565 568 1,068 1,043 1,000 1,000
- - - -
3,178 2,809 2,480 2,399 2,235 2,400
19,184 19,206 18,594 18,906 18,130 18,000
1,602 1,509 1,307 1,178 1,083 1,080
5,979 6,152 4,928 4,839 4,139 4,000
7,640 7,314 7,671 7,166 5,637 8,000
1,892 1,967 1,926 1,883 1,889 1,800
3,885 3,912 3,985 4,061 4,032 4,024
3,308 3,144 3,047 2,700 3,800 2,300
21,340 21,149 24,033 21,454 29,024 29,700
5.20 7.50 18.80 9.80 6.30 7.20
51,885 49,153 59,568 51,412 53,623 55,000
12,569 14,577 14,652 14,000 11,804 14,000
- - - 1,990 600 600
1,341,268 1,284,779 1,301,528 1,204,478 1,224,661 1,208,079
58,922 65,000 90,000 120,000 75,000 60,000
31,385 29,494 30,320 30,605 26,574 28,454
6,028 5,692 5,498 5,369 5,357 5,465
- 209 -
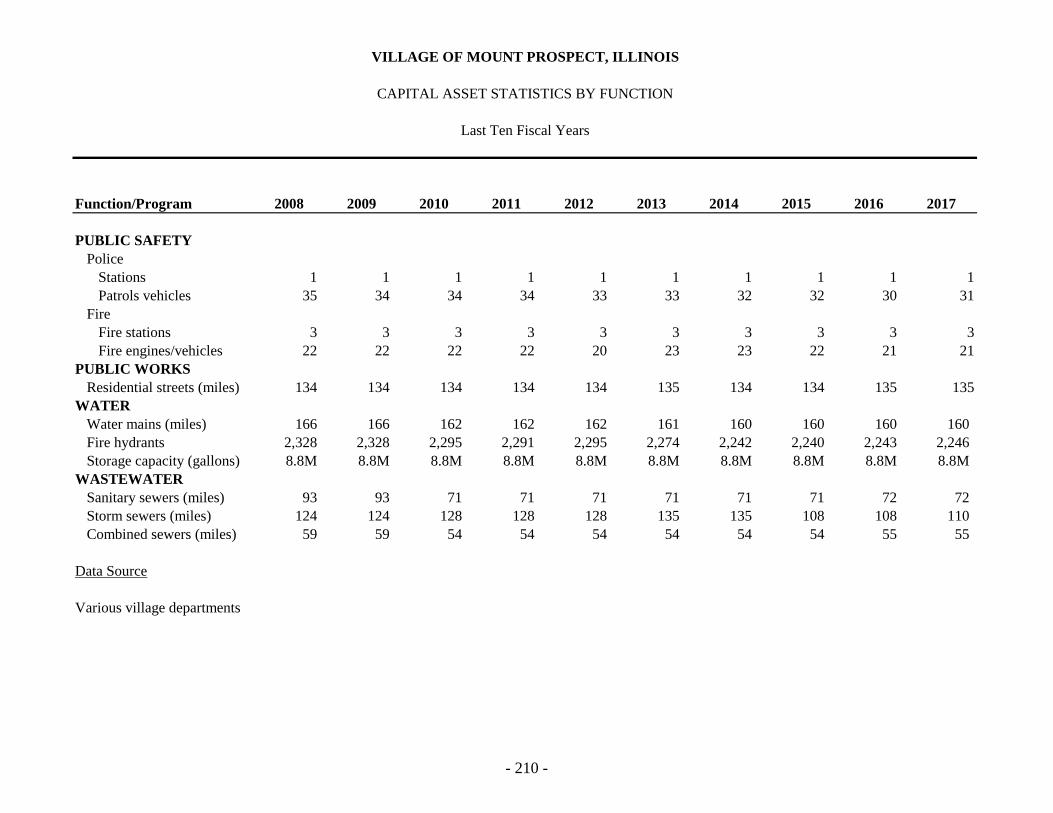
Function/Program 2008 2009 2010 2011 2012 2013 2014 2015 2016 2017
PUBLIC SAFETY
Police
Stations 1 1 1 1 1 1 1 1 1 1
Patrols vehicles 35 34 34 34 33 33 32 32 30 31
Fire
Fire stations 3 3 3 3 3 3 3 3 3 3
Fire engines/vehicles 22 22 22 22 20 23 23 22 21 21
PUBLIC WORKS
Residential streets (miles) 134 134 134 134 134 135 134 134 135 135
WATER
Water mains (miles) 166 166 162 162 162 161 160 160 160 160
Fire hydrants 2,328 2,328 2,295 2,291 2,295 2,274 2,242 2,240 2,243 2,246
Storage capacity (gallons) 8.8M 8.8M 8.8M 8.8M 8.8M 8.8M 8.8M 8.8M 8.8M 8.8M
WASTEWATER
Sanitary sewers (miles) 93 93 71 71 71 71 71 71 72 72
Storm sewers (miles) 124 124 128 128 128 135 135 108 108 110
Combined sewers (miles) 59 59 54 54 54 54 54 54 55 55
Data Source
Various village departments
Last Ten Fiscal Years
CAPITAL ASSET STATISTICS BY FUNCTION
VILLAGE OF MOUNT PROSPECT, ILLINOIS
- 210 -

ADDITIONAL DISCLOSURES REQUIRED BY SEC RULE 15c2-12

VILLAGE OF MOUNT PROSPECT, COOK COUNTY, ILLINOIS FINANCIAL INFORMATION
STATEMENT OF INDEBTEDNESS
Notes: 1. The Village is a home-rule unit under the Illinois constitution and, therefore, has no debt limit nor is it required to seek referendum approval for the issuance of general obligation debt.
2. See “Detailed Overlapping Bonded Indebtedness Payable From Property Taxes at December 31, 2017”.
RETIREMENT SCHEDULE OF OUTSTANDING VILLAGE GENERAL OBLIGATION BONDED DEBT (Note 1) (As of December, 31, 2017)
Notes: 1. The Village is a home rule unit under the 1970 Illinois Constitution and as such has no debt limit, nor is it required to seek referendum approval for the issuance of general obligation debt. The Village had entered into five installment contracts with the Illinois EPA (excluded from the table above) to provide funding for a portion of the Village’s storm water/flood control program. The remaining installment contract has a final maturity on June 3, 2019. Total principal outstanding on the IEPA installment contract was $170,271 as of December 31, 2017. Debt service is being paid from the Village’s ¼ cent home rule sales tax instituted effective September 1, 1991 for the purpose of funding the Village’s flood control program.
Amount Per Capita
Applicable as of Assessed Estimated 2000 Census
December 31, 2017 Value True Value 54,167
Assessed Valuation of Taxable Real Property, 2016 1,619,158,852$ 100.00% 33.33% 29,891.98$
Estimated True Value of Taxable Real Property, 2016 4,857,476,556 300.00% 100.00% 89,675.94
Direct Bonded Debt payable from Property Taxes (1)
Payable From Property taxes 45,784,843$ 2.83% 0.94% 845.25$
Self-Supporting Debt 33,800,544 2.09% 0.70% 624.01
Total Direct Bonded Debt 79,585,387$ 4.92% 1.64% 1,469.26$
Overlapping Bonded Debt Payable from Property Taxes (2)
Schools 37,270,997$ 2.30% 0.77% 688.08$
Other Than Schools 66,547,039 4.11% 1.37% 1,228.55
Total Overlapping Bonded Debt 103,818,036$ 6.41% 2.14% 1,916.63$
Total Direct and Overlapping Bonded Debt 183,403,423$ 11.33% 3.78% 3,385.89$
Total Direct and Overlapping Bonded Debt Excl. Self-Supporting 149,602,879$ 9.24% 3.08% 2,761.88$
As Percent of
Due Source of Payments
Calendar Property Annual Cumul. Levy Property
Date Taxes Amount Percent Year Taxes
2018 3,085,000 3,085,000 6.9% 2017 4,518,368
2019 3,200,000 3,200,000 14.1% 2018 4,563,682
2020 4,920,000 4,920,000 25.2% 2019 5,327,076
2021 4,605,000 4,605,000 35.5% 2020 5,723,916
2022 3,915,000 3,915,000 44.3% 2021 5,813,911
2023 2,995,000 2,995,000 51.1% 2022 3,868,475
2024 2,470,000 2,470,000 56.6% 2023 3,243,125
2025 2,590,000 2,590,000 62.4% 2024 3,274,925
2026 2,690,000 2,690,000 68.5% 2025 3,288,725
2027 2,780,000 2,780,000 74.7% 2026 3,291,275
2028 2,890,000 2,890,000 81.2% 2027 3,312,050
2029 2,030,000 2,030,000 85.8% 2028 2,359,006
2030 1,080,000 1,080,000 88.2% 2029 1,313,681
2031 1,130,000 1,130,000 90.7% 2030 1,323,744
2032 1,185,000 1,185,000 93.4% 2031 1,333,544
2033 1,245,000 1,245,000 96.2% 2032 1,346,144
2034 385,000 385,000 97.1% 2033 438,388
2035 410,000 410,000 98.0% 2034 451,356
2036 435,000 435,000 99.0% 2035 463,544
2037 460,000 460,000 100.0% 2036 474,950
$44,500,000 $44,500,000
Total Maturities Debt Service Tax Levies
Principal Maturities
- 211 -

DEBT RATIOS AND PER CAPITAL DEBT—LAST TEN GENERAL OBLIGATION BOND SALES (Note 1)
Notes: 1. Information in table pulled from applicable Official Statements.
2. Excludes the Village’s general obligation bonds which are payable from non-property taxes. 3. Village population estimates used in these calculations were 56,265 in 2001-2009, and 54,167 beginning in 2010.
EQUALIZED ASSESSED VALUATION FOR TAXING PURPOSES (Note 1)
Notes: 1. Property in Cook County is separated into two primary classifications for assessment purposes (10% for residential and 25% for commercial property). After the assessor establishes the fair market value of a parcel of land, the value is multiplied by one of the classification percentages to arrive at the assessed valuation for that parcel. The Illinois Department of Revenue furnishes each county with an adjustment factor (the equalization factor) to equalize the level of assessment between counties. After the equalization factor is applied, the valuation of the property for taxing purposes has been established—tax rates are applied to the equalized valuation.
2. Under the current triennial reassessment system in Cook County, the Village was most recently reassessed in 2016. 3. Excludes four categories of exemptions: the Senior Citizens’ Homestead Exemption; the General Homestead Exemption; the Senior
Citizens’ Tax Freeze Homestead Exemption and the Long-Term Homeowner Exemption. 4. The Village’s tax rate is calculated based on the village’s Net Equalized Assessed Valuation (shown in this table as “Net for General Taxing
Purposes”) and is extended against its entire Equalized Assessed Valuation (shown in this table as “Total for all Taxing Purposes”) excluding only the statuary exemptions. Of the taxes collected, that portion applicable to incremental valuation (valuation of tax increment districts) is remitted to the Village by the County Collector for deposit in the applicable tax allocation fund. The Equalized Assessed Valuation for which the Village receives its portion of the total tax rate for all non-TIF purposes is shown in this table as “Net for General Taxing Purposes”.
Including Excluding Including Excluding Including Excluding
Self- Self- Self- Self- Self- Self-
Sale Date Amount Supporting Supporting (2) Supporting Supporting (2) Supporting Supporting (2)
12,235,000 1.39% 1.05% 3.77% 3.43% 2,544.05 2,316.16
10,000,000 0.78% 0.69% 2.72% 2.63% 2,362.39 2,287.21
10,000,000 0.72% 0.72% 2.45% 2.45% 2,445.85 2,445.85
3,430,000 0.70% 0.70% 2.47% 2.47% 2,749.42 2,749.42
2,650,000 0.70% 0.70% 2.47% 2.47% 2,749.42 2,749.42
4,100,000 0.60% 0.60% 2.80% 2.80% 2,921.82 2,921.82
5,160,000 0.60% 0.60% 2.80% 2.80% 2,921.82 2,921.82
2,975,000 0.60% 0.60% 2.80% 2.80% 2,921.82 2,921.82
9,800,000 0.92% 0.92% 3.42% 3.42% 3,042.80 3,043.80
6,279,000 1.13% 1.09% 3.74% 3.71% 3,253.40 3,223.59
September 8, 2016 8,735,000 2.00% 1.16% 5.29% 4.45% 3,356.50 3,309.47
December 1, 2016 9,100,000 1.90% 1.09% 5.25% 4.43% 3,356.50 3,296.96
December 20, 2017 9,740,000 1.64% 1.04% 3.78% 3.19% 3,385.89 2,829.19
February 4, 2014
September 10, 2013
January 3, 2012
Direct Debt Direct & Overlapping Debt Direct & Overlapping Debt
Ratio to Estimated Actual Value Per Capita (3)
July 29, 2011
July 29, 2011
Village Issue
December 1, 2009
December 1, 2009
February 17, 2009
January 21, 2003
December 15, 2006
Tax Net For Plus Total For All Increase
Levy General Taxing Incremental Taxing Over
Year (2) Purposes (3) Valuation Purposes (4) Prior Year
2011 1,694,952,801 42,659,295 1,737,612,096 (7.7%)
2012 1,568,774,082 38,247,882 1,607,021,964 (7.5%)
2013 1,357,294,084 32,976,484 1,390,270,568 (13.5%)
2014 1,390,377,678 33,230,688 1,423,608,366 2.4%
2015 1,354,550,848 32,251,850 1,386,802,698 (2.6%)
2016 1,619,158,852 - 1,619,158,852 16.8%
Real Property
- 212 -

DETAILED OVERLAPPING BONDED INDEBTEDNESS PAYABLE FROM PROPERTY TAXES AT DECEMBER 31, 2017
Notes: 1. Village’s share based upon 2016 Real Property valuations.
TAX RATES PER $100 EQUALIZED ASSESSED VALUATION (Note 1)
Notes 1. As a home rule unit under the 1970 Illinois Constitution, the Village has no statutory tax rate or levy limitations. 2. Tax rate applicable to the largest tax code in the Village and most recent available from Cook County.
Percent of
Village's 2016
Real Property Gross
SCHOOL DISTRICTS: in Taxing Body Bonded Debt Percent Amount
Elementary Districts:
Mount Prospect No. 57 37.7% 7,860,000 95.003% 7,467,236
Community Consolidated No. 59 26.7% 15,235,000 15.273% 2,326,842
River Trails No. 26 26.4% 8,665,000 77.771% 6,738,857
Wheeling Community Consolidated No. 21 3.4% 30,255,000 3.202% 968,765
Arlington Heights No. 25 3.2% 47,360,000 2.629% 1,245,094
Prospect Heights No. 23 2.5% 7,540,000 7.709% 581,259
High School Districts:
Wheeling/Elk Grove No. 214 99.8% 37,480,000 18.912% 7,088,218
Maine Township No. 207 0.2% 14,540,000 0.069% 10,033
Community Colleges:
Oakton No. 535 0.2% 28,950,000 0.014% 4,053
Harper No. 512 99.8% 126,895,000 8.543% 10,840,640
Total Schools 37,270,997
OTHER THAN SCHOOL DISTRICTS:
Cook County, Including Forest Preserve District 100.0% 3,186,386,750 1.128% 35,942,443
Metropolitan Water Reclamation District 100.0% 2,428,705,091 1.150% 27,930,109
Park Districts:
Mount Prospect 66.8% 3,758,788 65.520% 2,462,758
River Trails 25.4% - - -
Arlington Heights 2.8% 10,890,000 1.615% 175,874
Des Plaines 1.8% 2,050,000 1.749% 35,855
Prospect Heights 3.3% - - -
Total Other Than Schools 66,547,039
Paid From Property Taxes (1)
Village's Applicable Share
of Gross Debt to be
Village of Mount Prospect: 2012 2013 2014 2015 2016
Bonds and Interest 0.113$ 0.167$ 0.165$ 0.170$ 0.143$
Pensions (Police, Fire) 0.316 0.393 0.387 0.426 0.381
Police Protection - - - 0.372 0.311
Fire Protection - - - 0.384 0.322
Corporate 0.501 0.689 0.724 - -
Garbage 0.121 0.026 - - -
Total Village 1.051$ 1.275$ 1.276$ 1.352$ 1.157$
Cook County, Including Forest Preserve District 0.594 0.629 0.637 0.621 0.596
Metropolitan Water Reclamation District 0.370 0.417 0.430 0.426 0.406
Mount Prospect Park District 0.557 0.657 0.654 0.681 0.594
Mount Prospect Public Library 0.646 0.761 0.758 0.801 0.687
Special Service Area No. 5 0.122 0.140 0.138 0.142 0.119
Community Consolidated School District No. 59 2.673 3.172 3.176 3.291 2.998
Township High School District No. 214 2.324 2.768 2.776 2.881 2.527
Harper College No. 512 0.373 0.444 0.451 0.466 0.416
All Other 0.103 0.155 0.124 0.158 0.105
Total (2) 8.813$ 10.418$ 10.420$ 10.819$ 9.605$
Village as a Percent of Total 11.9% 12.2% 12.2% 12.5% 12.0%
Levy Years
- 213 -

TAX EXTENSIONS AND COLLECTIONS (Village Purposes Only)
Notes: 1. Source: Cook County Treasurer’s Office. Tax payments, including late payments and proceeds from tax sales, are shown as collections
in the year when due. The “Amount Collected” is not the same as distributions to the Village because tax refunds (pursuant to court orders, first time homestead exemptions other exemptions, etc.) are deducted from “Amount Collected” and interest earnings are added to “Amount Collected” in calculating the distributions.
2. Cook County property taxes are payable in two installments: the first on March 1, and the second on the latter of August 1 or 30 days after the mailing of the tax bills. The first installment is an estimated bill and is 55% of the prior year’s bill. The second installment is based on the current levy, assessment and equalization and reflects any changes from the prior year in those factors.
TEN LARGEST TAXPAYERS
Notes: 1. Valuations as of January 1, 2016 for 2017 tax purposes. 2. Total 2016 Village valuation is $1,619,158,852.
Levy Collection Total Taxes
Year Year Extended Amount Percent (2)
2012 2013 16,477,871 16,278,228 98.79%
2013 2014 17,301,436 17,064,355 98.63%
2014 2015 17,741,219 17,521,845 98.76%
2015 2016 18,313,527 18,130,372 99.00%
2016 2017 18,733,668 18,534,114 98.93%
Total Taxes Collected as
of December 31, 2017 (Note 1)
Equalized
Assessed Percent of
Rank Taxpayer Business/Properties Valuation (1) Village (2)
1 DLC Management Corporation Shopping Center 26,458,780 1.63%
2 Home Properties Colony Square Apartments 18,963,895 1.17%
3 Mount Prospect Plaza Shopping Center 16,479,990 1.02%
4 United Airlines Inc. Operations Center 13,911,530 0.86%
5 Individual Commercial 12,887,703 0.80%
6 Golf Plaza I and II Shopping Center 12,744,927 0.79%
7 First Industrial Realty Real Estate 9,588,778 0.59%
8 Cummins Allison Corporation Manufacturing 7,422,916 0.46%
9 Costco Properties Warehouse Store 7,307,278 0.45%
10 LIT Industrial Limited Real Estate 7,012,558 0.43%
132,778,355$ 8.20%
- 214 -

2010 AND 2016 TAX BASE DISTRIBUTION BY PROPERTY CLASSIFICATION*
* A breakdown by property classification of the Village’s levy year 2017 valuation is not available as of the date of this report.
GENERAL FUND (Note 1)
Summary Statement of Revenues, Expenditures and Changes in Fund Balance (Fiscal Years Ending December 31)
Classification 2010 2016 % Increase 2010 2016
Residential 1,330,339,716 1,191,992,297 -10.40% 72.51% 73.66%
Commercial 332,297,825 304,999,806 -8.21% 18.11% 18.85%
Industrial 171,115,770 121,128,843 -29.21% 9.33% 7.49%
Railroad 927,196 103,906 -88.79% 0.05% 0.01%
Total 1,834,680,507 1,618,224,852 -11.80% 100.00% 100.00%
Percent of TotalTaxable Valuation
Village of Mount Prospect
Actual
Revenues: 2013 2014 2015 2016 Budget Actual
Property Taxes 12,645,791 14,392,732 15,317,183 15,917,480 16,278,000 16,112,039
Sales Taxes 13,627,166 14,640,814 16,370,735 17,202,418 18,600,000 19,458,742
State Income Taxes 5,161,051 5,186,155 5,763,542 5,272,834 5,543,000 4,975,194
Licenses, Permits & Fees 3,589,368 2,496,760 2,428,969 2,350,787 2,347,000 2,334,232
Utility Taxes 4,658,265 4,093,598 3,774,729 3,629,525 3,765,000 3,491,473
Charges for Service 1,858,829 1,928,223 1,699,217 1,782,869 1,582,955 1,527,168
Fines & Forfeits 430,960 470,466 511,536 414,885 452,000 415,189
Investment Income 6,561 (64,978) 8,612 49,202 151,000 132,925
Food & Beverage Tax 719,190 738,642 759,073 805,172 773,000 839,472
Real Estate Transfer Tax 853,617 954,644 1,371,699 1,049,770 1,190,500 1,190,331
All Other Revenues 1,445,740 2,450,829 2,315,618 3,076,582 3,987,640 3,325,198
Total Revenues 44,996,538$ 47,287,885$ 50,320,913$ 51,551,524$ 54,670,095$ 53,801,963$
Expenditures:
General Government
Public Representation Division 114,948 142,574 137,716 141,249 163,600 134,039
Village Manager's Office 3,185,452 3,166,149 3,529,065 4,031,450 4,780,126 4,730,808
Finance Department 1,843,581 2,007,010 1,945,587 1,972,523 2,570,392 2,466,917
Community Development - Administration 661,459 673,549 662,596 734,282 948,257 933,069
Benefit Payments 46,150 46,300 46,455 46,615 46,781 46,780
Total General Government 5,851,590$ 6,035,582$ 6,321,419$ 6,926,119$ 8,509,156$ 8,311,613$
Public Safety:
Code Enforcement 711,081 880,723 812,292 877,060 829,292 820,925
Police Department 15,783,921 16,578,937 16,277,671 17,067,883 18,229,821 17,823,169
Fire & Emergency Protection Department 12,678,986 13,166,937 13,171,002 14,473,302 15,609,220 15,522,366
Total Public Safety 29,173,988$ 30,626,597$ 30,260,965$ 32,418,245$ 34,668,333$ 34,166,460$
Highways & Streets 7,342,643 7,500,480 6,935,457 7,282,165 8,282,369 7,613,341
Health 142,062 151,586 148,731 160,555 248,627 261,533
Welfare 1,569,824 1,585,083 1,529,810 1,561,199 1,613,704 1,548,489
Culture & Recreation 435,931 421,517 467,611 499,208 635,172 585,907
Net Transfers (In)/Out 166,247 - 281,599 1,240,625 600,000 600,000
Total Expenditures 44,682,285$ 46,320,845$ 45,945,592$ 50,088,116$ 54,557,361$ 53,087,343$
Revenues Over (Under) Expenditures 314,253$ 967,040$ 4,375,321$ 1,463,408$ 112,734$ 714,620$
Ending Fund Balance 11,878,582$ 12,845,622$ 17,220,943$ 18,684,351$ 18,797,085$ 19,398,971$
2017
- 215 -

Balance Sheet – December 31
Notes: 1. This condensed financial information for the years ending December 31, 2013-2017 has been excerpted from the full Comprehensive Annual Financial Reports of the Village. The accounting policies of the Village conform to GAAP and are disclosed in the audited financial statements. A summary of some of the policies are: The General Fund is accounted for using the modified accrual basis of accounting. Revenues are recognized when they become measurable and available as net current assets. Expenditures are generally recognized when the related fund liability is incurred.
Assets: 2013 2014 2015 2016 2017
Cash & Investments 6,886,656$ 6,879,252$ 11,009,774$ 11,892,092$ 14,814,727$
Receivables
Property Taxes 14,543,097 15,160,497 15,733,573 16,087,246 16,333,702
Other Taxes 5,711,586 5,747,674 6,344,148 6,772,937 6,220,011
All Other 492,912 468,180 471,824 435,700 417,856
Due From Other Funds 212,603 154,882 473,348 735,763 92,845
Due From Other Governments 53,602 136,834 159,403 653,254 186,629
All Other Assets 297,762 337,165 204,023 188,247 261,219
Total Assets 28,198,218$ 28,884,484$ 34,396,093$ 36,765,239$ 38,326,989$
Liabilities & Fund Balance
Accounts Payable 334,043$ 216,535$ 578,648$ 833,274$ 1,463,624$
Deferred Revenues
Property Taxes 14,396,036 15,138,046 15,691,708 16,087,246 16,333,702
All Other Liabilities 1,589,557 684,281 904,794 1,160,368 1,130,692
Fund Balance:
Nonspendable 297,762 337,165 204,023 188,247 261,219
Restricted - - - - -
Committed - - - - -
Unassigned 11,580,820 12,508,457 17,016,920 18,496,104 19,137,752
Total Fund Balance 11,878,582$ 12,845,622$ 17,220,943$ 18,684,351$ 19,398,971$
Total Liabilities & Fund Balance 28,198,218$ 28,884,484$ 34,396,093$ 36,765,239$ 38,326,989$
- 216 -

COMBINED STATEMENT—ALL FUNDS (Note 1)
Fund Balances 2013-2016 and Summary 2017 Revenues, Excess Revenues and Fund Balance (Fiscal Years Ended December 31)
Notes: 1. This condensed financial information for the years ending December 31, 2013-2017 has been excerpted from the full Comprehensive Annual Financial Reports
of the Village. The accounting policies of the village conform to GAAP and are disclosed in the audited financial statements. A summary of some of the policies are: All Governmental Funds are accounted for using the modified accrual basis of accounting. Revenues are recognized when they become measurable and available as net current assets; expenditures are recognized when the related fund liability is incurred. All Proprietary Funds and Pension Trust Funds are accounted for using the accrual basis of accounting. This table excludes the Village’s Expendable Trust Funds and Agency Funds. The Village’s Comprehensive Annual Financial Report for the year ended December 31, 2017 included an unmodified “Independent Auditor’s Report”. Similar unqualified/unmodified opinions were included in the Village’s Comprehensive Annual Financial Reports for the years ending December 31, 2013-2016. The “Independent Auditor’s Report” included in the latest audit states, in part:
“In our opinion, the financial statements referred to above present fairly, in all material respects, the respective financial position
of the governmental activities, the business-type activities, each major fund, and the aggregate remaining fund information of the Village of Mount Prospect, Illinois, as of December 31, 2017, and the respective changes in financial position and, where applicable, cash flows thereof, for the year then ended in accordance with accounting principles generally accepted in the United States of America.”
2. The Village’s property tax revenue recognition policy conforms to the provisions of “NCGA Interpretation 3, Revenue Recognition Property Taxes.” The current
net tax levy receivable is recognized in the balance sheet along with a corresponding amount of deferred revenue. In addition, the debt service payments and liabilities related to the current net tax levy are not reflected in the Debt Service Funds; the un-matured principal is reflected in the General Long-Term Debt Account Group.
3. Includes the Capital Improvement Fund, which accounts for the resources used to provide for mid-sized capital projects. Financing is provided by one-quarter cent home rule sales tax, developer contributions, interfund transfers, investment income, and bond proceeds.
4. Fund balances shown for the Enterprise Funds are total fund equity, including contributed capital and retained earnings, and the column “Revenue Over Expenditures” represents the change in that amount.
5. The Village created a Risk Management Fund in 1984 to account for the servicing and payment of claims for liability, property, casualty coverage and Workers’ Compensation. Financing is provided by charges to the various Village funds. The Village created a Vehicle Replacement Fund in fiscal year 1991 to account for the acquisition and depreciation of Village vehicles. Financing is provided by charges to the General, Water and Sewer, and Parking Funds. The Village created a Vehicle Maintenance Fund in 1996 to account for maintenance and repair of all Village vehicles except Fire Department vehicles. In 1997, the Village created a Computer Replacement Fund to account for the acquisition and depreciation of Village computer hardware.
6. Excludes agency funds.
Revenue
Over
Property (Under) Fund
Governmental Fund Types (2): 2013 2014 2015 2016 Tax Total Expenditures Balance
General Fund * 11,878,582$ 12,845,622$ 17,220,943$ 18,684,351$ 16,112,039$ 53,801,963$ 714,620$ 19,398,971$
Special Revenue Funds:
Motor Fuel Tax 338,861$ 1,397,365$ 1,927,676$ 2,465,482$ -$ 1,427,785$ 278,990$ 2,744,472$
Community Development Block Grant - - - - - 404,566 - -
Refuse Disposal * 2,445,117 1,652,809 1,191,201 1,363,621 - 4,317,771 79,024 1,442,645
Asset Seizure 42,659 83,675 92,655 173,079 - 30,052 (171) 172,908
DEA shared Funds 11,514 19,938 19,951 20,013 - 181 181 20,194
DUI Fines 65,287 101,080 124,735 121,449 - 27,125 19,479 140,928
Foreign Fire Tax Fund 273,346 287,977 302,729 341,678 - 85,478 10,745 352,423
Business District Fund 83 - - - - 1,451,171 - -
Prospect/Main TIF - - - (687,995) - 4,931,142 4,633,022 3,945,027
Total Special Revenue 3,176,867 3,542,844 3,658,947 3,797,327 -$ 12,675,271$ 5,021,270 8,818,597
Debt Service * 121,491 131,635 154,206 168,152 2,284,000 4,913,203 16,043 184,195
Capital Projects (3) 15,705,506 17,785,571 4,738,536 3,224,446 - 5,541,435 354,768 3,579,214
Total Governmental 30,882,446$ 34,305,672$ 25,772,632$ 25,874,276$ 18,396,039$ 76,931,872$ 6,106,701$ 31,980,977$
Proprietary & Fiduciary Fund Types
Enterprise Funds (4):
Water and Sewer * 34,086,453 34,240,404 41,273,710 40,610,650 1,514,452$ 13,510,977$ 717,312$ 41,327,962
Village Parking System 323,832 349,414 643,238 588,378 - 346,195 116,322 704,700
Internal Service Funds (5) 14,587,299 15,797,609 17,537,531 19,174,062 - 12,222,687 600,653 19,774,715
Pension Trust Funds:
Police Pension 55,375,975 58,819,925 58,500,040 61,976,686 - 13,975,312 9,092,376 71,069,062
Firefighter's Pension 53,716,416 56,568,339 56,856,702 58,344,829 - 13,398,679 7,920,511 66,265,340
Total Proprietary & Fiduciary 158,089,975$ 165,775,691$ 174,811,221$ 180,694,605$ 1,514,452$ 53,453,850$ 18,447,174$ 199,141,779$
Total All Funds (Memo Only) 188,972,421$ 200,081,363$ 200,583,853$ 206,568,881$ 19,910,491$ 130,385,722$ 24,553,875$ 231,122,756$
* Designated as major funds.
Cash & Investments at 12/31 (6): 2013 2014 2015 2016 2017
General Fund 6,886,656$ 6,879,252$ 11,009,774$ 11,892,092$ 14,814,727$
Internal Service Funds 10,830,350 10,476,211 11,551,998 13,177,384 12,210,417
Refuse Disposal 2,231,180 1,365,133 844,053 960,475 1,054,842
Other Special Revenue Funds 1,575,858 2,716,735 3,541,745 4,399,893 8,748,239
Debt Service Funds 113,267 130,210 138,721 167,652 162,895
Subtotal 21,637,311$ 21,567,541$ 27,086,291$ 30,597,496$ 36,991,120$
Capital Project Funds 15,487,737 16,290,597 5,442,661 2,794,596 3,209,472
Water & Sewer 5,382,441 4,697,147 3,185,314 3,179,625 7,577,274
Other Enterprise Funds 316,808 300,258 488,612 428,260 531,623
Pension Trust Funds 108,760,597 115,091,487 115,116,154 119,963,475 137,068,690
Other Fiduciary Funds 1,511,610 1,209,488 1,136,998 1,368,315 1,126,624
Total 153,096,504$ 159,156,518$ 152,456,030$ 158,331,767$ 186,504,803$
Fiscal Year Ended December 31, 2017
Revenue Incl. Transfers
- 217 -

CAPITAL ASSETS (Note) (December 31, 2017)
Note: Capital assets, which include property, plant, equipment, and infrastructure assets (e.g., roads, bridges, storm sewers, and similar items), are reported in the applicable governmental or business-type activities columns in the government-wide financial statements. Capital assets are defined by the Village as assets with an initial, individual cost of more than $20,000, except for infrastructure for which the cost is $50,000 and an estimated useful life in excess of one year. Such assets are recorded at historical cost or estimated historical cost if purchased or constructed. Donated capital assets are recorded at estimated fair market value at the date of donation.
Governmental Business Type
Activities Activities
Capital Assets Not Being Depreciated Capital Assets Not Being Depreciated
Land 10,291,446$ Land 17,551,172$
Construction in Progress 2,293,847$ Construction in Progress 946,477$
Total Assets Not Being Depreciated 12,585,293$ Total Assets Not Being Depreciated 18,497,649$
Capital Assets Being Depreciated Capital Assets Being Depreciated
Buildings 38,778,498$ Buildings and Improvements 4,499,808$
Improvements Othern Than Buildings 436,273 Equipment 5,017,968
Infrastructure and All Other 101,512,328 Infrastructure 29,537,909
Total Capital Assets Being Depreciated 140,727,099$ Total Capital Assets Being Depreciated 39,055,685$
Less Accumulated Deprteciation 89,822,046$ Less Accumulated Deprteciation 20,846,563$
Total Capital Assets Being Depreciated, Net 50,905,053$ Total Capital Assets Being Depreciated, Net 18,209,122$
Net Assets 63,490,346$ Net Assets 36,706,771$
- 218 -