Dynamics of the Mount Nyiragongo lava lake
17
Dynamics of the Mount Nyiragongo lava lake P.-Y. Burgi 1,2 , T. H. Darrah 3 , D. Tedesco 4,5 , and W. K. Eymold 3 1 Society of Volcanology Geneva, Geneva, Switzerland, 2 IT Department, University of Geneva, Geneva, Switzerland, 3 Divisions of Solid Earth Dynamics and Water, Climate and the Environment, School of Earth Sciences, Ohio State University, Columbus, Ohio, USA, 4 DISTABIF, Second University of Naples, Caserta, Italy, 5 International Organization of Migrants, Geneva, Switzerland Abstract The permanent and presently rising lava lake at Mount Nyiragongo constitutes a major potential geological hazard to the inhabitants of the Virunga volcanic region in the Democratic Republic of Congo (DRC) and Rwanda. Based on two field campaigns in June 2010 and 2011, we estimate the lava lake level from the southeastern crater rim (~400 m diameter) and lava lake area (~46,550 m 2 ), which constrains, respectively, the lava lake volume (~9 × 10 6 m 3 ) and volume flow rate needed to keep the magma in a molten state (0.6 to 3.5 m 3 s 1 ). A bidirectional magma flow model, which includes the characterization of the conduit diameter and funnel-shaped lava lake geometry, is developed to constrain the amount of magma intruded/emplaced within the magmatic chamber and rift-related structures that extend between Mount Nyiragongo’ s volcanic center and the city of Goma, DRC, since Mount Nyiragongo’ s last eruption (17 January 2002). Besides matching field data of the lava lake level covering the period 1977 to 2002, numerical solutions of the model indicate that by 2022, 20 years after the January 2002 eruption, between 300 and 1700 × 10 6 m 3 (0.3 to 1.7 km 3 ) of magma could have intruded/emplaced underneath the edifice, and the lava lake volume could exceed 15 × 10 6 m 3 . 1. Introduction Mount Nyiragongo, located on the western branch of the East African Rift System (EARS) (Figure 1a), is considered Africa’ s most active volcano [Tedesco et al., 2007a; d’Oreye et al., 2008]. It is a steep stratovolcano that extends 3469 m above sea level and contains the world’ s largest continuously active lava lake within its crater. Within the last four decades, Mount Nyiragongo’ s lava lake has twice (1977 and 2002) drained catastrophically through its southern flank [Demant et al., 1994; Komorowski et al., 2002/2003; Tedesco et al., 2007a]. In January 2002, this drainage occurred through a set of conductive and pervasive fissures that visibly opened on the southern flank of the volcano (Figure 2). The 2002 eruption released voluminous lava flows (Figure 1b) that flowed through the city of Goma to Lake Kivu. This eruption devastated approximately 15% of the city, including part of the international airport, killed ~200 people, and displaced at least 250,000 additional residents [Baxter et al., 2002/2003; Tedesco et al., 2007b]. A future eruption similar to that in 2002 would pose a substantial threat to the health and social stability of this fragile geopolitical location. While the assessment of all regional geological hazards remains a challenge [e.g., Tassi et al., 2009; Cuoco et al., 2013], we have developed a mathematical model for the long-term evolution (over 40 years) of the lava lake. This model, which considers the geometry of the lava lake and the buoyancy-driven bidirectional magma flow, provides insight into the mechanisms that control the volume of magma presently in place versus the magmatic material that enters the volcanic edifice and is stored below. We use this model to differentiate these processes as a way to address the potential hazards associated with future eruptions. We also apply Witham and Llewellin’ s [2006] generic lava lake system model to account for observed instabilities of the lava lake conduit system occurring on a shorter timescale (from a few hours to several days). 2. Volcanic Setting Complete reviews of the tectonic, geologic, and volcanic setting of Mount Nyiragongo are available elsewhere in the literature [White and McKenzie, 1989; Nyblade et al., 2000; Ebinger , 2005; Sebai et al., 2006; Tedesco et al., 2007a, 2010; Smets et al., 2014]. Here we include a concise description of only parameters relevant to lava lake dynamics and our model. Since its “European” discovery in 1894 [Tazieff, 1984], Mount Nyiragongo’ s steep-walled, 1200 m wide summit crater has contained a semipermanent but highly fluctuating lava lake that has experienced several overflows BURGI ET AL. ©2014. American Geophysical Union. All Rights Reserved. 4106 PUBLICATION S Journal of Geophysical Research: Solid Earth RESEARCH ARTICLE 10.1002/2013JB010895 Key Points: • Long-term lava lake dynamics are simulated using a bidirectional magma flow model • Numerical solutions of intrusive to extrusive volume ratios are provided • The conduit diameter and funnel- shaped lava lake geometry are characterized Correspondence to: P.-Y. Burgi, [email protected] Citation: Burgi, P.-Y., T. H. Darrah, D. Tedesco, and W. K. Eymold (2014), Dynamics of the Mount Nyiragongo lava lake, J. Geophys. Res. Solid Earth, 119, 4106–4122, doi:10.1002/2013JB010895. Received 9 DEC 2013 Accepted 14 APR 2014 Accepted article online 17 APR 2014 Published online 13 MAY 2014
Transcript of Dynamics of the Mount Nyiragongo lava lake

Dynamics of the Mount Nyiragongo lava lakeP.-Y. Burgi1,2, T. H. Darrah3, D. Tedesco4,5, and W. K. Eymold3
1Society of Volcanology Geneva, Geneva, Switzerland, 2IT Department, University of Geneva, Geneva, Switzerland, 3Divisionsof Solid Earth Dynamics and Water, Climate and the Environment, School of Earth Sciences, Ohio State University, Columbus,Ohio, USA, 4DISTABIF, Second University of Naples, Caserta, Italy, 5International Organization of Migrants, Geneva, Switzerland
Abstract The permanent and presently rising lava lake at Mount Nyiragongo constitutes a major potentialgeological hazard to the inhabitants of the Virunga volcanic region in the Democratic Republic of Congo(DRC) and Rwanda. Based on two field campaigns in June 2010 and 2011, we estimate the lava lake level fromthe southeastern crater rim (~400m diameter) and lava lake area (~46,550m2), which constrains, respectively,the lava lake volume (~9 × 10⁶m3) and volume flow rate needed to keep the magma in a molten state (0.6 to3.5m3 s�1). A bidirectional magma flow model, which includes the characterization of the conduit diameterand funnel-shaped lava lake geometry, is developed to constrain the amount of magma intruded/emplacedwithin the magmatic chamber and rift-related structures that extend between Mount Nyiragongo’s volcaniccenter and the city of Goma, DRC, since Mount Nyiragongo’s last eruption (17 January 2002). Besides matchingfield data of the lava lake level covering the period 1977 to 2002, numerical solutions of themodel indicate thatby 2022, 20 years after the January 2002 eruption, between 300 and 1700 × 106m3 (0.3 to 1.7 km3) of magmacould have intruded/emplaced underneath the edifice, and the lava lake volume could exceed 15 × 106m3.
1. Introduction
Mount Nyiragongo, located on the western branch of the East African Rift System (EARS) (Figure 1a), isconsidered Africa’s most active volcano [Tedesco et al., 2007a; d’Oreye et al., 2008]. It is a steep stratovolcano thatextends 3469m above sea level and contains the world’s largest continuously active lava lake within its crater.Within the last four decades, Mount Nyiragongo’s lava lake has twice (1977 and 2002) drained catastrophicallythrough its southern flank [Demant et al., 1994; Komorowski et al., 2002/2003; Tedesco et al., 2007a].
In January 2002, this drainage occurred through a set of conductive and pervasive fissures that visibly openedon the southern flank of the volcano (Figure 2). The 2002 eruption released voluminous lava flows (Figure 1b)that flowed through the city of Goma to Lake Kivu. This eruption devastated approximately 15% of the city,including part of the international airport, killed ~200 people, and displaced at least 250,000 additionalresidents [Baxter et al., 2002/2003; Tedesco et al., 2007b]. A future eruption similar to that in 2002 would pose asubstantial threat to the health and social stability of this fragile geopolitical location.
While the assessment of all regional geological hazards remains a challenge [e.g., Tassi et al., 2009; Cuoco et al.,2013], we have developed a mathematical model for the long-term evolution (over 40 years) of the lava lake.This model, which considers the geometry of the lava lake and the buoyancy-driven bidirectional magmaflow, provides insight into the mechanisms that control the volume of magma presently in place versus themagmatic material that enters the volcanic edifice and is stored below. We use this model to differentiatethese processes as a way to address the potential hazards associated with future eruptions. We also applyWitham and Llewellin’s [2006] generic lava lake system model to account for observed instabilities of the lavalake conduit system occurring on a shorter timescale (from a few hours to several days).
2. Volcanic Setting
Complete reviews of the tectonic, geologic, and volcanic setting of Mount Nyiragongo are available elsewherein the literature [White and McKenzie, 1989; Nyblade et al., 2000; Ebinger, 2005; Sebai et al., 2006; Tedesco et al.,2007a, 2010; Smets et al., 2014]. Here we include a concise description of only parameters relevant to lava lakedynamics and our model.
Since its “European” discovery in 1894 [Tazieff, 1984], Mount Nyiragongo’s steep-walled, 1200m wide summitcrater has contained a semipermanent but highly fluctuating lava lake that has experienced several overflows
BURGI ET AL. ©2014. American Geophysical Union. All Rights Reserved. 4106
PUBLICATIONSJournal of Geophysical Research: Solid Earth
RESEARCH ARTICLE10.1002/2013JB010895
Key Points:• Long-term lava lake dynamics aresimulated using a bidirectionalmagma flow model
• Numerical solutions of intrusive toextrusive volume ratios are provided
• The conduit diameter and funnel-shaped lava lake geometryare characterized
Correspondence to:P.-Y. Burgi,[email protected]
Citation:Burgi, P.-Y., T. H. Darrah, D. Tedesco, andW. K. Eymold (2014), Dynamics of theMount Nyiragongo lava lake, J. Geophys.Res. Solid Earth, 119, 4106–4122,doi:10.1002/2013JB010895.
Received 9 DEC 2013Accepted 14 APR 2014Accepted article online 17 APR 2014Published online 13 MAY 2014

and major eruptions. Rising lava lake levels, along with seismic/tectonic events, likely triggered the N-Strending lateral 1977 and fissural 2002 eruptions that extend between Mount Nyiragongo and the city ofGoma [Carn, 2002/2003; Komorowski et al., 2002/2003; Poland, 2006; Tedesco et al., 2007a; d’Oreye et al.,2011]. The sequential increase in lava lake volume and rapid fissural eruptions are likely responsible forMount Nyiragongo’s peculiar crater morphology [Tazieff, 1984; Durieux, 2002/2003] that includes threedistinct volcanic platforms (P1 (prior to 1977), P2 (1995–2002), and P3 (2003 to present)) (Figure 3a).The sustained magma filling through the plumbing system (Figure 2) and active convection continueswithin this lava lake through the present [Durieux, 2002/2003; Platz et al., 2004; Tedesco et al., 2007a;Smithsonian Institution/U.S. Geological Survey Weekly Report, 2011–2013], which resulted in the formationof “Platform 3” (P3).
3. Observations and Methods
Our team conducted two field expeditions from 14 to 24 June 2010 and 30 May to 9 June 2011 to thevigorously active Mount Nyiragongo volcano. During these field campaigns, a comprehensive series of fieldobservations included monitoring the lava lake level, documenting the physical configuration and rate ofactivity at the lava lake, and topographic measurements.
3.1. Telemetry
The lava lake dimensions and surface level were measured by infrared laser rangefinder with embeddedtiltmeter to correct for elevation angle (TruPulse 200 device Laser Technology Inc.). While previousreports used the lava lake diameter to characterize its size, we provide the length of the main E-W and
Figure 1. Mount Nyiragongo within the western branch of the EARS. (a) Space shuttle radar topography image with themain landmarks of the western branch of the East African Rift highlighted. (b) Landsat 7 satellite image of the Virungavolcanic province, captured on 31 January 2003, on which Nyiragongo lava fields from the 2002 eruption are indicated withblack arrows. Mount Nyiragongo’s summit is located 18 km north of Goma city. Images, courtesy of NASA.
Journal of Geophysical Research: Solid Earth 10.1002/2013JB010895
BURGI ET AL. ©2014. American Geophysical Union. All Rights Reserved. 4107

N-S axes because of its marked elliptical shape and then calculate an average diameter for convenience.The N-S axis used direct telemetric measurements of the northern and southern rims, although lavalake infrared radiation required the need for longer measurement times. Because of the complextopography on P2, we relied on triangulation methods using two P2 observation points to determinethe E-W axis; these points were situated on the E-W axis and separated by a distance of 100m toimprove accuracy (< 1m).
Darkly colored (black) rocks reduced infrared laser beam reflection and limited the application of thismeasurement method on the lava lake. Fortunately, sustained periods of low lava lake activity produced whitedeposits on top of the floating slabs, allowing for efficient laser reflection. However, these light-colored(nearly white) areas were ephemeral and did not exist for sufficient periods of time during periods of intenselava lake activity. Under these conditions, the rangefinder accuracy was ~30 cm and ~1m for white anddarker floating slab targets, respectively. Because of the variable reflection between different color lavasurfaces, we apply the lowest error bounds to all calculations reported herein.
3.2. Lava Lake Activity
Mount Nyiragongo has a long-established reputation as an intensely active lava lake with rapid lake levelfluctuations and lava overflows. These phenomena were first reported at Mount Nyiragongo by Le Guern[1987], documented throughout the period from 2003 to 2009 [Tedesco et al., 2010], and also observed duringboth the 2010 and 2011 field campaigns. Activity included cycles of strong lava fountaining, continuousrelease of large gas plumes (predominantly H2O, CO2, and SO2 [Sawyer et al., 2008]), and rapid and chaoticmovement of partially cooled plates of fresh lava that either move to the lava lake margin or are reconsumedwith the lava lake by internal lava lake activity.
In June 2010, we performed near-continuous visual observations from 7A.M. to 10 P.M. for ten successivedays with more sporadic observations at night. In addition, photos and videos of the lava lake were takenfrom P2. Throughout most of the period of observation, the lava lake surface remained within a few metersbelow the top of the levee (Figures 3b). However, for four consecutive days (from 19 to 22 June), wewitnessed lava overflowing the levee and flooding P3, situated 15m below the top of the levee.
Figure 2. Topography of Mount Nyiragongo’s volcanic crater and conduit model. Schematic representation of the lava lakewith reference to the January 2002 erupting vents 1 and 2 [cf. Komorowski et al., 2002/2003]. The total declination fromthe SE rim (altitude 3425m, usual reference) to the crater floor (P3) is ~400m, with P2 and P1 corresponding respectively tothe 2002 and 1977 lava lake levels. The shallow reservoir (hc in range 1000 to 4000m) is connected to the lava lake througha vertical conduit (of diameter dc with mean height roughness εc), open to the atmosphere with PA = ~0.071MPa, with Plindicating pressure at the bottom of the lava lake. Conduit and reservoir pressures are indicated by Pc and Pr, respectively.Conduit model: Below a critical pressure (Pb), exsolution becomes significant and produces a bubble suspension in part ϕ ofthe conduit. Assuming the H2O mass fraction is 0.8wt %, and setting Pb to 20MPa, then hb = 309m. Inset: the inverted conemodel of the lava lake with the main geometric parameters indicated.
Journal of Geophysical Research: Solid Earth 10.1002/2013JB010895
BURGI ET AL. ©2014. American Geophysical Union. All Rights Reserved. 4108

Overflowing was the result of a slow rise of the lava lakelevel, which started early in the afternoon, with the largestoverflows occurring late in the day (Table 1). Small overflowswere the result of active lava fountains occurring next to thelake border concomitant to the rise of the lava lake levelreaching the top of the levee (but not overreaching it). Inthis case flooding was of limited span, of short duration (lessthan 10min), and generally stopped on the crater floor (P3) atthe foot of the levee (Figure 4a). Large overflows occurredwhenever the lava lake level overreached the top of the leveeand produced major floods lasting between 15 and 45min,covering P3 with several hundreds of square meters of freshlava (Figure 4b). All overflows occurred on the east andnortheast sides of the lava lake, corresponding to thedirection where lava fountains collide into the levee alongthe border of the lava lake.
The following field season (June 2011), during which we alsocumulated ten observation days, the lava lake level wasstable at about �12m (±1m) from the levee from 30 Mayuntil 3 June. During this time, we did not observe anyoverflows (Figure 5a) until the late afternoon of 3 June whenwe witnessed a major drainage (Figure 5b), concomitantwith a large burst within the lava lake; this drainage droppedthe lava lake level by ~25m in less than 1 min. In the hoursfollowing this drainage event, the convective motion of thelava lake stopped and was followed by a period of strongStrombolian activity in the northern part of the lava lake thatreached heights of ~50m with metric-sized bubbles.
The lava lake level continued to drop stepwise byincrements of ~2m during the next 3 days (from 4 June tothe morning of 6 June), with a total drop (including thefirst major pulse) of ~33m, placing the lava lake surface toalmost 45m below the levee on P3 (Figure 5c).
4. Results4.1. Lava Lake Level and Depth
Accurately, determining the lava lake level is critical to determining the risks associated with anyprospective Mount Nyiragongo eruptions. Past activities have shown rapid ascents of the lava lakelevel, followed by slower ascents (e.g., between 1953 and 1965), with quiescent periods duringwhich no lava lake activity was visible and the crust eventually solidified (e.g., 1965–1966, 1983–1994,
and 1995–2001) [Tazieff, 1984; Le Guern,1987; Durieux, 2002/2003]. Such quiescenttime periods have been followed by periodsof recrudescence in the activity that led tolava fountaining and rapid ascent of thelava lake level (e.g., between 1970 and1972 and between 1994 and 1995 [GlobalVolcanism Network (GVN), 1995; Durieux,2002/2003]).
Prior to the 1977 and 2002 eruptions, the lavalake surface was ~155m and ~250m below theSE crater rim, respectively [Durieux, 2002/2003]
Table 1. Occurrence Time and Magnitude of Lava Overflows
Day (2010) Time (GMT+ 2) Amplitude of the Overflows
19 June 14:30; 14:56; 15:38 Small15:57; 17:29 Large
20 June 17:09; 17:20; 19:07 Small17:50; 18:10; 19:20 Large
21 June 15:46; 16:31 Small19:29 Large
22 June 15:10 Small16:45 Large
P3
P2
P1
B
A
Figure 3. General view of Mount Nyiragongo’svolcanic crater. (a) View of the three platforms(P1, P2, and P3) taken from the SE rim along theN-S direction. Typical lava lake activity with lavafountains and glowing cracks surrounded bycooler crust (photo taken on 15 June 2010).(b) Lava lake configuration, about 15m higher thanP3, with magma close to top of the levee (phototaken on 19 June 2010).
Journal of Geophysical Research: Solid Earth 10.1002/2013JB010895
BURGI ET AL. ©2014. American Geophysical Union. All Rights Reserved. 4109

(Figures 6a and 6b and Table 2). Subsequent to the 1977and 2002 eruptions, the lowermost level of the newlyshaped crater, whose parameters are essential to estimatethe depth of the lava lake, has been estimated to between800m [Durieux, 2002/2003] and 900m [Tedesco et al.,2007a] below the SE crater rim, respectively.
Following the January 2002 drainage, the lava lake levelhas risen consistently (Durieux [2002/2003], Tedesco et al.[2007a], Durieux [2008], and present study) (Figure 6cand Table 3). In June 2010, the altitude of P3 wasestimated at 3025m (Figure 2), with the lava lake surface~15m above it (i.e., the lava lake was ~385m below theSE crater rim). In early June 2011, the elevation of P3 hadnot significantly changed, but the lava lake level wasabout 15m below P3 (i.e., the lava lake was ~415mbelow the SE crater rim). Lava lake depth is thus estimatedat ~500m at this time.
4.2. Crater Morphology and Lava Lake Size
The June 2010 field measurements indicate an elliptic lavalake shape 230m and 220m wide for the E-W and N-S axes,respectively (surface of 40,000m2). Those dimensionsexpanded respectively to 260m and 228m within a year(measured in June 2011), with an equivalent area of~46,550m2 (average diameter 244m).
The field measurements of the lava lake diameterperformed since 1982 (Tables 2 and 3) show a positivecorrelation with lava lake depth, appropriately modeledwith an inverted cone characterized by an averaged slope(repose angle) and width of the flat bottom (Figure 2). Usinglinear regression based on the least squares methodapplied to the 1982–2001 and 2002–2011 compiled data,one respectively gets 54.5° and 79° for the repose angle(γ in Figure 2) and 118m and 46m for the width of the flatbottom (Figure 7).
4.3. Conduit Diameter
To our knowledge there is no estimation in the literaturefor Mount Nyiragongo’s conduit diameter, contrary, forinstance, to Mount Erebus, where it has been suggested torange from 4 to 10m [Calkins et al., 2008; Zandomeneghiet al., 2013]. However, on 3 June 2011 (at around 08:00 P.M.)we witnessed a remarkable 25m drop in the lava lake levelin less than 1 min (a time lag representing an upper boundgiven a gas plume temporarily hindered visibility of thelava lake), which involved a magma volume estimated at~1.0 × 10⁶m3. From these results we observe that (1) theconduit length has only a minor effect on the maximumvolume flow rate (and thus on time length) and (2) aconduit diameter of 15m is the most consistent with ourobservations (draining of the lava lake in less than 1min). Thus, in the rest of this paper, we set dc to 15m(see Appendix A for calculations).
A
B
Figure 4. Levee overflows. (a) Small overflow on thesouth side of the levee due to a lava fountaincolliding against the levee cliff (photo taken on 21June 2010, at 3:45 P.M.). (b) Large overflow on the SEside (photo taken on 20 June 2010, at 6:50 P.M.).
A
B
C
Figure 5. Lava lake level from the levee in 2011; (a)�12m, 2 June (2:00P.M.); (b)�37m, 4 June (8:15A.M.);(c) �45m, 8 June (9:45 A.M.). White arrows in thethree panels indicate the �12m lava lake level.Photos courtesy of Patrick Marcel.
Journal of Geophysical Research: Solid Earth 10.1002/2013JB010895
BURGI ET AL. ©2014. American Geophysical Union. All Rights Reserved. 4110

A
B
C
Figure 6. Evolution of the lava lake level. (a) June 1953 to January 1977 [Durieux, 2002/2003]. (b) January 1977 to December2001 (Table 2); inactive periods between early 1983 and June 1994, and September 1995 to December 2001, are indicatedwith dashed lines. (c) January 2002 to June 2011 (Table 3). The 3425m SE rim is taken as reference.
Journal of Geophysical Research: Solid Earth 10.1002/2013JB010895
BURGI ET AL. ©2014. American Geophysical Union. All Rights Reserved. 4111

4.4. Effective Radiation Temperature and Energy Flux
The lava lake surface thermal fluxes (comprising radiative and convective components) are highly sensitive tothe effective radiation temperature (Te). The estimation of Te is dependent on the proportion of the lava lakesurface occupied by the crust (fcrust), the exposed molten material (flava) mainly consisting of active lavafountains, and the cracks (fcrack), the latter of which are composed of a red, glowing central core surroundedby a cooler crust (Figure 3a) [Burgi et al., 2002]. With the proportion values given in Appendix A, we obtainTe = 828 K. This value is smaller than field estimates of Te = 948 K based on lava lake activity in 1959 [LeGuern, 1987] and larger than the 2005–2006 estimates of Te = 650 K from satellite (Moderate ResolutionImaging Spectroradiometer) remote sensing data of the Mount Nyiragongo radiant flux [Wright and Pilger,2008]. However, our value is within the range of 803 to 835 K reported by Spampinato et al. [2013] basedon ground-based thermal imagery recorded for the first half of 2012. Taking Tair = 15.5°C (average fieldvalue measured on platform P3 in June 2011), the convective cooling component is calculated to be~350MW. Thus, the total heat loss (Φtot =Φr +Φconv) for the June 2011 lava lake is estimated to be 1.5 GW(see Appendix A for calculations).
4.5. Mass Flux
The sustained presence of an actively convecting lava lake requires exceptional geodynamic conditions[Tazieff, 1994; Harris et al., 1999; Oppenheimer et al., 2009]. In most volcanic systems, the exsolution ofmagmatic volatiles and the cooling of lava at ambient atmospheric temperatures are sufficient to reducethe system’s entropy and lead to rapid lava quenching or crystallization [Francis et al., 1993]. BecauseMount Nyiragongo contains the largest continuously active lava lake in the world, it is an optimal locationto explore these phenomena.
Table 2. Lava Lake Level and Diameter From January 1977 to January 2002a
Date Lava Lake Level (m) Lava Lake Diameter (m) References
13 January 1977 �800 - Durieux [2002/2003]26 June 1982 �730 250 SEAN [1982]27 June 1982 �630 309 Tazieff [1984]30 June 1982 �680 300 SEAN [1982]7 July 1982 �555 N/Ab Durieux [2002/2003]Early July 1982 �530 436 Tazieff [1984]23 July 1982 �500 600 SEAN [1982]4 August 1982 �380 727 Tazieff [1984]3 October 1982 �340 818 Tazieff [1984]23 June 1994 �340 N/A Durieux [2002/2003]20 August 1994 �310 N/A Durieux [2002/2003]10 December 1994 �295 800 Durieux [2002/2003] and GVN [1995]August 1995 to 17 January 2002 �250 900 Durieux [2002/2003] and GVN [2001]
aThe 3425m SE rim is taken as reference.bN/A: Data Not Available.
Table 3. Lava Lake Level and Diameter From January 2002 to June 2011a
Date Lava Lake Level (m) Lava Lake Diameter (m) References
24 January 2002 �900 - Tedesco et al. [2007a]18 December 2002 �830 50 GVN [2003]January 2003 �800 100 GVN [2003]August 2003 �700 N/Ab Durieux [2008]January 2006 �540 200 GVN [2006] and Sawyer et al. [2008]May 2006 �531 N/A Durieux [2008]July 2007 �476 N/A Durieux [2008]March 2008 �400 N/A Durieux [2008]June 2010 �385 225 Present study2 June 2011 �415 240 Present study8 June 2011 �445 ~240 Present study
aThe 3425m SE rim is taken as reference.bN/A: Data Not Available.
Journal of Geophysical Research: Solid Earth 10.1002/2013JB010895
BURGI ET AL. ©2014. American Geophysical Union. All Rights Reserved. 4112

There are two main end-memberenthalpy models, one corresponding todyke intrusion and the other to cumulativeemplacement [Francis et al., 1993; Harriset al., 1999]. Mount Nyiragongo is locatedin an extensional environment likely topromote rifting and dyking. Based ondata from the January 2002 eruptiveevent, d’Oreye et al. [2008] and Wauthieret al. [2012] used interferometricsynthetic aperture radar (InSAR) analysisto infer the presence of two dykeintrusions. One formed as a shallow dykeat ~2000m depth on average andassociated with a 20 km long eruptivefissure, while the second was 6000mdeep and extended to ~40 km. Bothdyke intrusions were emplaced alongfissures situated ~3000m below the cityof Goma. Thus, we hypothesize that atleast part of the erupted magma couldbe emplaced in these dyke intrusions.
Dyke intrusions in these conditions correspond to enthalpy model parameters of Δf = 0.25 and ΔTmagma = 50°C[Francis et al., 1993], which yields q=9230 kg s�1 or equivalently 0.2 kg s�1m�2 (Table 4; see Appendix A forcalculations). These values are similar to those reported for the year 1972 [Harris et al., 1999]. Assuming adegassed magma density of 2650 kgm�3 (corresponding to nephelinite density [Carn, 2002/2003]), qcorresponds to a volume flow rateQmo=q /ρd, that is, 3.48m
3 s�1 (see Appendix A for calculations). Alternatively,applying the cumulate emplacement enthalpy model wherein Δf = 1 and ΔTmagma = 400°C [Francis et al., 1993],we get q =1704kg s�1 and Qmo = 0.64m3 s�1 (Table 4; see Appendix A for calculations). These two modelsprovide end-member estimates. Thus, we consider that during the simultaneous operation of dyke intrusionand cumulate emplacement and/or reservoir mixing, the Qmo ranges between 0.6 and 3.5m3 s�1.
5. The Model
Complex interactions betweenmagma density and lithospheric subsidence rates control the ratio of intrusiveto extrusive volcanic activity. In the case of Mount Nyiragongo, the lava lake level provides a proxy forextrusive magma flow, although past eruptions have shown that only a fraction of magma erupts.Reasonable estimates of the volume of magma contained within the lava lake can be made accuratelythrough field measurements.
Conversely, estimating the intruded/emplaced volumes beneath Mount Nyiragongo requires numericalmodeling. We develop a model for emplacement volumes by considering a bidirectional magma flow in aconstrained system composed of the magmatic chamber (whose geometry is unknown) and the lava lake(whose geometry is calculated assuming an inverted cone, Figure 2) connected through a vertical conduit,which we take as cylindrical. To conform our model to field data, we consider the time evolution of the lava
Figure 7. Correlation between lava lake diameter (dl) and lava lake depth(hl). Circles and squares are field data corresponding respectively to theJune 1982 to December 2001 (Table 2) and December 2002 to June 2011(Table 3) periods. Linear regression (dashed lines) correspond to theinverted cone model (cf. Figure 2) with λ=1.42 and d0 = 118m (for circles)and λ=0.38 Qmo and d0 = 46m (for squares).
Table 4. Parameters for Mass Flux Calculations
High End-Member Low End-Member Range
Δf 0.25 1ΔTmagma 50°C 400°Cq 9230 kg s�1 1704 kg s�1
(0.2 kg s�1m�2)Qmo 3.48m3 s�1 0.64m3 s�1 0.6–3.5m3 s�1
αmo 7.5 × 10�5m3 s�1m�2 1.3 × 10�5m3 s�1m�2
Journal of Geophysical Research: Solid Earth 10.1002/2013JB010895
BURGI ET AL. ©2014. American Geophysical Union. All Rights Reserved. 4113

lake level from June 1982 to June 2011 (spanning nearly 30 years, Figures 6b and 6c), during which data onthe lava lake level evolution have been reported with sufficient sampling rates.
To express the evolution of the lava lake volume (Vl) and the volume of intruded/emplaced magma (Vin), weconsider two volume flow equations,
dVl
dt¼ Q tð Þ � Qmo tð Þ (1)
dV in
dt¼ Qmo tð Þ (2)
where the ascending volume flow rate at any time t is denoted by Q(t) and the volume flow rate needed tokeep the lava lake in a molten state, Qmo(t), is proportional to the lava lake surface Al (t):
Qmo tð Þ ¼ αmoAl tð Þ (3)
Qmo(t) provides a measure of the cooler, more degassed, and denser magma volume circulation flow withrespect to depth, which we relate to a single parameter, αmo, dependent on the chosen enthalpy model(Table 4). This parameter plays an important role in themodel as it determines (through equations (1)–(3)) theintrusive-extrusive magma ratio. We constrain its value to remain within the range of volume flow ratesestimated in section 4.5.
The downward volumetric flux of the denser degassed magma must be matched by an equal or higher (forthe lava lake to grow) upward flux of less dense magma from the magmatic chamber. A buoyancy-drivenpressure can account for such a bidirectional flow. Themagnitude of the involved (over)pressure is calculatedby applying Archimedes’ principle, which assumes the mass of the fluid displaced (Δρ Vin), times gravityacceleration (g), divided by the (ascending) conduit area. We take the density difference Δρ betweendegassed (descending) and gas-rich (ascending) magma to range from 70 to 120 kgm�3 [Witter et al., 2004;Huppert and Hallworth, 2007].
For a laminar flow (which applies given the ascending magma speed is typically< 0.1m s�1), the ascendingvolume flow rate in a vertical circular conduit follows Poiseuille’s law [e.g., Bansal, 2010],
Q tð Þ ¼ Pc tð Þ � ρaghl tð Þ � ρaghcð Þπd4a128μhc
(4)
whereby Pc(t) is the pressure at the base of the conduit, hl(t) is lava lake depth, hc is conduit length, and da andρa are the ascending conduit diameter and the density of gas-rich ascending magma, respectively, withρa= ρd�Δρ. For da, we account for the fact that the rising magma occupies a fraction of the conduit with theother part being occupied by descending magma. Consistent with previous experimental values [Stevensonand Blake, 1998], we set da to represent 60% of the total conduit diameter, dc.
Because of the inverted cone shape of the lava lake, whenever the lava lake volume (Vl) increases due to theinflux of fresh magma, both the lava lake surface (Al(t)) and lava lake depth (hl(t)) increase. Based on equation (4),we see that Q(t) must remain positive to ensure continuous upward flow, while any hl (t) increases will requirethat Pc(t) increases proportionally. Furthermore, to compensate for the increase of Qmo(t) as the lake areachanges (equation (3)), Pc(t) must further increase. However, from equation (2), we note that the volume ofthe descending magma is proportional to Qmo(t). This flow rate Qmo(t) is a function of Al(t), which variesaccording to the square of hl (t) (whose proportion factor depends on the inverted cone geometry; see Figure 2).
Consequently, the upward buoyancy force induced by the increase in the lava lake level is proportional to thesquare of hl(t) while the (downward) counter pressure (Pl) is linearly related to hl(t). This implies that thesystem of equations (1)–(4) forms a positive loop gain. Without regulation, the outcome would be a lava lakefilling unrealistically fast. In nature, fluid flow rates are inhibited by the physical parameters of the flow system(e.g., geometry of fluid flow conduits and fluid viscosities).
In general, the magmatic chambers that feed volcanoes have finite volumes. These volume restrictions implythat the mixing of resident magma with the intrusive degassed magma lessens the magma density contrast,which highly reduces the buoyancy force potential.
Journal of Geophysical Research: Solid Earth 10.1002/2013JB010895
BURGI ET AL. ©2014. American Geophysical Union. All Rights Reserved. 4114

Additionally, the similar viscosity of the descending and ascending magma enhances mixing and furtherdiminishes the buoyancy potential of ascending magmatic material [Huppert and Hallworth, 2007]. Takinginto account these fluid effects, Pc(t) can be expressed as
Pc tð Þ ¼ f V inð Þ gΔρ
πd2a=4(5)
where g Δρ represents the buoyancy force and f(Vin) stands for the regulatory fluidic component of the system.This parameter can conveniently be modeled as a nonlinear function,
f V inð Þ ¼ b V in
aþ V1=nin
� �n (6)
where a controls the slope of the function and b and n control its amplitude and shape, respectively. Equation (6)exhibits a progression from a low initial flow that accelerates and approaches saturation over time. Throughempirical bidirectional flow calculations, Huppert and Hallworth [2007] show that a higher mass flux occurswhenever either the viscosity ratio between descending and ascending fluid increases or the conduitshortens (shown numerically as smaller a in equation (6)). In order to ensure that f(Vin) does not provide apositive gain to the system (which is not considered physically realistic), the condition
V in=f V inð Þ < 1 (7)
must be verified (which puts constraints on parameters a, b, and n). The observed temporal evolution ofthe lava lake level requires additional constraints on some of the model’s physical parameters. For instance,if the conduit diameter (da) becomes too large or too small, either Δρ and/or αmo must change according tothe cumulate emplacement end-member model and may prove insufficient in supplying the required massfluxes to maintain equilibrium.
5.1. Numerical Solutions
We consider two time periods, June 1982 to December 2001 and December 2002 to June 2011, for whichfield data on the lava lake evolution are available from time periods immediately following complete lava lakedrainage; this is not the case for the period preceding the 1977 eruption for which the first documented lavalake level is�315m in 1928 [Durieux, 2002/2003]. For both periods of time, and apart from the intrinsic cratermorphology, the only parameter used to account for the different lava lake evolutions is Δρ, which is variedwithin the range of 70 to 120 kgm�3. Even though for each considered αmo the value of Δρmust be adaptedaccordingly, this is clearly an advantage of having one main parameter whose tuning can account for a widerange of lava lake evolutions. Furthermore, because we consider a mixed entropy model, we calculate thesolutions for αmo to range from 1.3 × 10�5 (cumulate emplacement end-member model) to 7.5 × 10�5
(intrusive end-member model). For Al = 46,550m2, this corresponds to Qmo varying from 0.6 to 3.5m3 s�1.Numerical solutions of equations (1)–(6) corresponding to middle range αmo are shown in Figure 8.5.1.1. Period June 1982 to December 2001During this ~20 year period, the lava lake level evolved through four main phases [Scientific Event AlertNetwork Research (SEAN), 1982; Tedesco, 2002/2003]. Within a short period spanning ~3months (26 June 1982to 3 October 1982) (phase 1), the lava lake level rose sharply before reaching a plateau, which lasted ~12 years(phase 2) (3 October 1982 to 22 June 1994). During this quiescent period, a solid crust formed on top of the lavalake. A resurgence of activity started on 22 June 1994 and continued through December 1994 (phase 3) duringwhich the intracrateric magmatic activity was characterized by the presence of a wide (and extremely active)lava lake occupying the whole crater. This eruptive phase continued through August 1995. During this time,lava lake activity was related to a small spatter cone located inside themain crater, which allowed fresh magmato gently pour out onto a solid crust (P2) and expand across the main crater [Tedesco, 2002/2003].
Previous workers suggest that most of the crater floor was covered by a thin crust of freshly solidified lava,lying above a molten, partially or completely degassed body of magma [Tedesco, 2002/2003]. A progressiveuplift of the crater floor between end of April and August of 1995 resulted from an accumulation of freshmagma at the base. In our model, this uplift corresponds to setting Qmo = 0 and having Q(t) set to a constantvalue in equation (1). From August 1995 through December 2001 (phase 4), uplift and fresh magma flowceased, and the lava lake level stabilized at ~250m below the crater rim (Table 2).
Journal of Geophysical Research: Solid Earth 10.1002/2013JB010895
BURGI ET AL. ©2014. American Geophysical Union. All Rights Reserved. 4115

For the periods when the lava lake was active (phases 1 and 3), we apply the default value range forαmo (1.3 × 10�5 to 7.5 × 10�5) (Table 4); otherwise, during periods of quiescence corresponding to phases 2 and 4,we set αmo to 2.0 × 10�9, which corresponds to an average magma supply rate of 3.0 kg s�1, consistent withreported values of mass flux rates for those quiescent periods [Harris et al., 1999]. This quiescent mass fluxrate is smaller than the volume flow rates necessary for keeping magma in a molten state, which allows forthe formation of a solidified crust as reported in September 1982 [Durieux, 2002/2003]. Finally, to fit the rise ofthe lava lake level during the resurgence of activity (phase 3), we have to decrease the initial value of Δρ by~10%. This range assumes that (small) changes in magma properties occurred in the magmatic chamber.
One potential numerical solution of equations (1)–(6) for the whole period (June 1982 to December 2001) isshown in Figure 8a. For phase 1, this simulation indicates that the lava lake volumes (measured at levels�500m (at t =1month) and�380m (at t = 2.6months)) amount to 29 × 106m3 and 68 × 106m3, respectively.These values represent good matches for Krafft’s [SEAN, 1982] and Tazieff ’s [1984] estimates of 36 × 106m3
and 65 × 106m3, respectively, at correspondingly similar lava lake levels. These similarities provide reassurancefor crater configuration consistent with the inverted cone model. Between June and December of 1994,~24 × 106m3 of fresh magma was extruded, which is consistent with the volume reported (~25 × 106m3)for this period of time [GVN, 1995]. At the end of phase 4 (December 2001), the numerical solution indicates thata total of 134 × 106m3 of magma had filled the crater, while 200 to 1400 × 106m3 of magma circulated backunder the edifice. These values are comparable to the range of intruded volumes estimated during differenttime periods (e.g., 500 to 1700 × 106m3 estimated by Harris et al. [1999] for the period 1959–1972).5.1.2. Period December 2002 to June 2011For this period of time, the lava lake activity has been continuous without reported quiescent phases. Thenumerical solutions of equations (1)–(6) for the whole time (Figure 8b) indicate that over this 9 year period,between 100 and 600 × 106m3 of magma must have cooled and circulated back under the edifice and8.5 × 106m3 of molten lava filled the lava lake.
We further explored the possible evolution of the lava lake by numerically extrapolating to year 2022. By thistime the lava lake surface might reach a level between �286 and �360m with a volume ranging from 10 to15 × 106m3, while between 300 and 1700 × 106m3 of magma could have been emplaced in the edifice or thecrust beneath it. The simulation in Figure 8b shows the middle range for which the lava lake reaches a level of�339m with a volume of 12 × 106m3 in the crater lake and 1100 × 106m3 of magma intruded/emplacedunderneath Mount Nyiragongo.
A B
Figure 8. Model for the evolution of the lava lake level. The small squares stand for the field measurements (visible also inFigure 6), and the solid curves are the fits obtained by numerical resolution of equations (1)–(6). (a) From June 1982 toDecember 2001. The model takes into account the quiescence periods between mid-September 1982 and June 1994 andAugust 1995 to December 2001 during which the mass flux rate has been set to ~3 kg s�1. The dashed line shows theprogression of the lava lake level if the quiescent period did not occur. From 24 June 1982 (month 65) to June 1994 (month 209),Δρ = 88 kgm�3; for the resurgence period from June 1994 (month 209) to August 1995 (month 223), Δρ = 79 kgm�3;between end of April 1995 (month 220) and August 1995 (month 223), Qmo = 0 and Q(t) set to 0.8m3 s�1 (correspondingto about 8 × 10⁶m3 of magma over this time period). (b) Simulation from December 2002 to December 2022 withparameter Δρ = 79 kgm�3. For all simulations αmo = 4.9 × 10�5m3 s�1m�2 (which corresponds to Qmo=2.3m
3 s�1 forAl = 46,550m2); n=4; a=0.33× 10⁶m3; b=1.9 × 10⁶; da = 9.0m; hc = 4000m; μ=60 Pa s; time step 60 s.
Journal of Geophysical Research: Solid Earth 10.1002/2013JB010895
BURGI ET AL. ©2014. American Geophysical Union. All Rights Reserved. 4116
burgipy
Inserted Text
(
burgipy
Inserted Text
)^1/4

5.2. Lava Lake Instabilities
To account for the observed transient variations of the lava lake level (e.g., the ~25m drop observed on 3June 2011) or the slow metric fluctuations of the lava lake surface in June 2010, we consider the physicalmodel developed by Witham and Llewellin [2006] for a generic lava lake system. According to their model,when the ratio of the cross-sectional areas of the conduit and lake is small (which is the case at MountNyiragongo, i.e., Ac/Al= 3.8 × 10� 3 in June 2011), and the conduit contains a bubbly layer (ϕ in Figure 2),then the lake is most likely unstable, causing small fluctuations from the loss of bubbly magma and/or moreamplified dropoffs in reservoir pressure.5.2.1. Drainage EventsDissolved H2O, which accounts for 0.5 to 0.8wt % of Mount Nyiragongo lavas (similar to other nepheliniticglasses) [Dixon, 1997], is the most significant volatile component in the melt [Sawyer et al., 2008]. Based onthese estimates for water content, we estimate that the volatile degassing of water at relatively low pressure(< 100MPa in the conduit) could produce a small pressure reduction in the shallow magma reservoir. Lavalake drainage would stop only when the pressure at the base of the conduit equilibrates with the reservoirpressure. This equilibrium point is a function of the gas volume contained in the conduit and the volumedisplaced by the descending degassed magma. According to the chosen model parameters (Figure 2), thedisplacement of a bubbly gas layer would account for a pressure drop on the order of 0.5MPa, andstabilization would occur at ~20m below the initial level. Therefore, we suggest that a partial displacement ofthe gas volume can explain the pressure drop and account for the observed drop in the lava lake level. Suchan explanation has previously been proposed to account for similar activity at other lava lake systems [e.g.,Tilling, 1987; Aster et al., 2003; Field et al., 2012; Spampinato et al., 2012]. Gas displacement is a nonreversibleprocess, and thus, in order to reach the initial (preperturbation) lava lake level, the reservoir pressure mustincrease beyond its initial value [Witham and Llewellin, 2006]. Because of the aforementioned self-regulatingmagmatic system (equations (1)–(6)), we predict that pressures will progressively build up and lava lake levelswill increase.5.2.2. Transient Rises of the Lava Lake LevelIn June 2010, we observed transient fluctuations in the lava lake level on the scale of a few meters overfour days. The scale of fluctuations was large enough to allow lava to flow over the rim (Figure 4b). Such aseries of overflow events occurred preferentially at the end of each day (as reported in Table 1). Similar lavalake activities following diurnal patterns have previously been reported for Nyiragongo [Tazieff, 1975]. A 2 mrise of lava column, which requires a pressure increase of 52 × 103 Pa, can be explained by assuming anaccumulated bubble layer in the upper conduit. The diurnal component of these fluctuations may result fromnegative barometric pressure variations (PA in Figure 2). For example, many tropical areas experience diurnal(and semidiurnal) barometric pressure oscillations on the order of 50–100 Pa [Dai and Wang, 1999; Ray, 2001]and may be one driver of this dynamic system.
To investigate this issue, we further utilize the model developed by Witham and Llewellin [2006] in order toestimate the amount of undegassed magma required to significantly modify the gas volume fraction of thebubbly layer within the magmatic conduit. Small, negative pressure variations in the range of 50–100 Pa canaugment the magma influx in the conduit by ~1–4%, with the effect of progressively (over 24 h) modifyingthe gas volume fraction in the upper portion of the conduit. Because the bubbly layer introduces a nonlinearcomponent, an increase of a few percent of its thickness (due to undegassed ascending magma) cantranslate into a reduction of the column pressure by ~0.01 to 0.1MPa, which in turn could lead to an increaseof the lava lake level on a range of a few meters.
The numerical model clearly demonstrates that magmatic degassing conditions can affect the stability ofthe lava lake without invoking contributions from negative barometric pressure. Although atmosphericpressure may play a role in the diurnal lava lake fluctuations, it is not required. Thus, we conclude that thefluctuations likely remain dependent on undetermined degassing conditions.
6. Discussion and Conclusions
In this paper, we consider the short- and long-term dynamics of Mount Nyiragongo’s lava lake. The field datagathered since January 2002 suggest that the Mount Nyiragongo volcano is slowly filling the volcanic edificefrom a shallow magma chamber. While little is known about the subsurface structures of Mount Nyiragongo,
Journal of Geophysical Research: Solid Earth 10.1002/2013JB010895
BURGI ET AL. ©2014. American Geophysical Union. All Rights Reserved. 4117
two main factors are relevant: (1) Mount Nyiragongo’s location in an extensional environment likelypromotes a strong interaction with the magmatic body, erupting magma, and faulting [Corti et al., 2002/2003; Shuler and Ekström, 2009] and (2) there appear to be two intermittently connected magmareservoirs at different depths, which feed the magma. The shallow reservoir occurs at 1000 to 4000m[Demant et al., 1994; Louaradi et al., 1993; Platz et al., 2004], while the deeper one is estimated to be at adepth of 10 to 14 km below the surface, as deduced from petrographic analysis [Demant et al., 1994; Platzet al., 2004], short-lived isotopes in lavas from the 2002 eruption [Chakrabarti et al., 2009], and seismicstudies [Shuler and Ekström, 2009].
In an attempt to quantify the intrusive/extrusive volume ratio, we developed a simplified bidirectionalflow model in which buoyancy force from (degassed) denser magma circulating back into the reservoirexerts a pressure sufficient to further push fresh magma into the lava lake. Numerical solutions of thisself-regulating magmatic system indicate that the lava lake volume and intruded/emplaced magmavolumes between January 1977 and December 2001 were 134 × 106m3 and 200 to 1400 × 106m3,respectively. These estimates indicate that 10% to 67% of the total magma resides in the volcanic edifice.By comparison, the simulations indicate that between 2002 and 2011 only ~100 to 600 × 106m3 ofmagma was emplaced with ~ 200 to 1100 × 106m3 of additional emplacement by 2022. Because the lavalake volumes range from 8.5 × 10⁶m3 in 2011 to possibly 15 × 106m3 by 2022, these calculations suggestthat the magma being emplaced as dykes represents approximately 10 to 100 times the volume ofmagma contained in the lava lake. This magma volume range highlights an important outcome of ourmodel and demonstrates the critical nature of the lava lake geometry in regulating the bidirectionalmagma flow (see section 5).
The last two eruptive events offer a benchmark to calculate the part of the lava lake volume that mayflow out of Mount Nyiragongo during a future eruptive event. Other than the period between 1959 and1972 when ~500 to 1700 × 106m3 of magma could have been emplaced below Mount Nyiragongo [Harriset al., 1999], there are no reliable estimates of the ratio of emplaced magma volume for most of the last halfcentury of lava lake activity (1928–1977). Approximately 22 × 106m3 of magma erupted from the lava lakeduring the January 1977 eruption, which represents about 10% of its total volume (~234 × 106m3) [Tazieff,1977]. Similarly, the 2002 eruption (which consisted of ~26 × 106m3 of erupted lava [Komorowski et al.,2002/2003]) had minimal sourcing from the lava lake. Instead, Tedesco et al. [2007a] infer that while thesmaller northern lava flows were probably supplied by the lava lake and shallow magma reservoir, themajority of the magmatic ejection occurred as part of the southern lava flows and was sourced from asecond, deeper, and larger reservoir. This unrelated source is probably located beneath the city of Gomaand Lake Kivu and encompasses a volume of ~136 × 106m3.
Wauthier et al. [2012] report that part of the January 2002 eruption was fed by a shallow dyke with a volumeof ~74 × 106m3, most likely supplied through the lava lake drainage. Also, the lava flows erupting from vents1 and 2 in the Shaheru area (Figure 2), which amount to ~2 × 10⁶m3, most likely were directly supplied by thelava lake conduit system. For the lava flows spilling from the other vents located at lower altitude, about6 × 106m3 and 15 × 106m3 were supposedly supplied by the shallow and deeper dyke, respectively.Thus, of the estimated 134 × 106m3 of magma that filled the crater in January 2002, only a portion of it(~55%) was apparently molten enough to drain into the shallow dyke, of which a small part (~10%)erupted. Of the rocky portion (~58 × 106m3), a minor part was expelled by the phreatomagmatic eruption,which followed the collapse of the inner parts of the crater [Komorowski et al., 2002/2003], but the largestpart had to disappear into fractures, similar to the January 1977 crater collapse [Tazieff, 1977]. Assumingthat activity within the last decades is representative of the long-term historical activity of Nyiragongo, thesmall fraction (< 10%) of lava erupted throughout time implies an efficient convective circulation thatremarkably preserves the lava lake and the shallow reservoir to a nearly constant volume.
One potential cause that may stimulate movement along the fragile and already widely fracturedsouthern flank of Mount Nyiragongo is the pressure that the lava within the crater creates on the internalcrater walls, a pressure that is proportional to lava lake depth. Also, given the present crater configurationwith a lava lake confined within a small part of the crater with a volume 10 times smaller than beforethe January 2002 crater collapse, an eruptive event likely needs an external seismic/tectonic event (suchas an earthquake) to trigger it.
Journal of Geophysical Research: Solid Earth 10.1002/2013JB010895
BURGI ET AL. ©2014. American Geophysical Union. All Rights Reserved. 4118
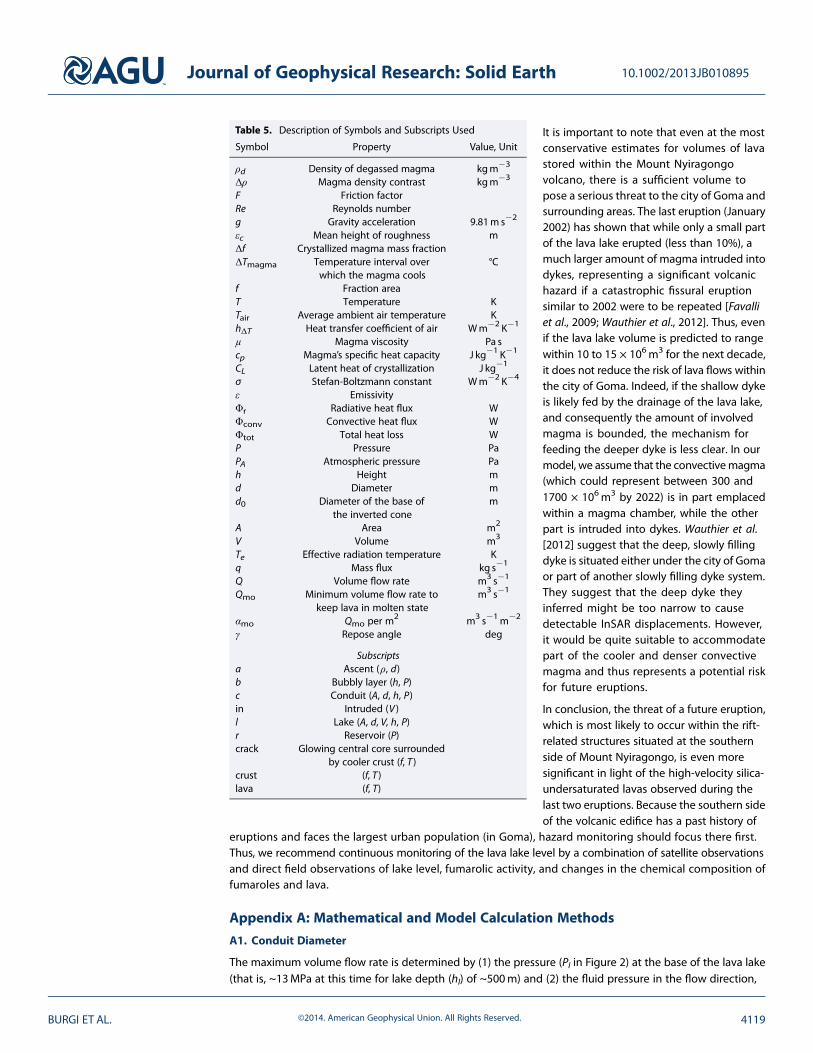
It is important to note that even at the mostconservative estimates for volumes of lavastored within the Mount Nyiragongovolcano, there is a sufficient volume topose a serious threat to the city of Goma andsurrounding areas. The last eruption (January2002) has shown that while only a small partof the lava lake erupted (less than 10%), amuch larger amount of magma intruded intodykes, representing a significant volcanichazard if a catastrophic fissural eruptionsimilar to 2002 were to be repeated [Favalliet al., 2009; Wauthier et al., 2012]. Thus, evenif the lava lake volume is predicted to rangewithin 10 to 15 × 106m3 for the next decade,it does not reduce the risk of lava flows withinthe city of Goma. Indeed, if the shallow dykeis likely fed by the drainage of the lava lake,and consequently the amount of involvedmagma is bounded, the mechanism forfeeding the deeper dyke is less clear. In ourmodel, we assume that the convectivemagma(which could represent between 300 and1700 × 106m3 by 2022) is in part emplacedwithin a magma chamber, while the otherpart is intruded into dykes. Wauthier et al.[2012] suggest that the deep, slowly fillingdyke is situated either under the city of Gomaor part of another slowly filling dyke system.They suggest that the deep dyke theyinferred might be too narrow to causedetectable InSAR displacements. However,it would be quite suitable to accommodatepart of the cooler and denser convectivemagma and thus represents a potential riskfor future eruptions.
In conclusion, the threat of a future eruption,which is most likely to occur within the rift-related structures situated at the southernside of Mount Nyiragongo, is even moresignificant in light of the high-velocity silica-undersaturated lavas observed during thelast two eruptions. Because the southern sideof the volcanic edifice has a past history of
eruptions and faces the largest urban population (in Goma), hazard monitoring should focus there first.Thus, we recommend continuous monitoring of the lava lake level by a combination of satellite observationsand direct field observations of lake level, fumarolic activity, and changes in the chemical composition offumaroles and lava.
Appendix A: Mathematical and Model Calculation Methods
A1. Conduit Diameter
The maximum volume flow rate is determined by (1) the pressure (Pl in Figure 2) at the base of the lava lake(that is, ~13MPa at this time for lake depth (hl) of ~500m) and (2) the fluid pressure in the flow direction,
Table 5. Description of Symbols and Subscripts Used
Symbol Property Value, Unit
ρd Density of degassed magma kgm�3
Δρ Magma density contrast kgm�3
F Friction factorRe Reynolds numberg Gravity acceleration 9.81m s�2
εc Mean height of roughness mΔf Crystallized magma mass fractionΔTmagma Temperature interval over
which the magma cools°C
f Fraction areaT Temperature KTair Average ambient air temperature KhΔΤ Heat transfer coefficient of air Wm�2 K�1
μ Magma viscosity Pa scp Magma’s specific heat capacity J kg�1 K�1
CL Latent heat of crystallization J kg�1
σ Stefan-Boltzmann constant Wm�2 K�4
ε EmissivityΦr Radiative heat flux WΦconv Convective heat flux WΦtot Total heat loss WP Pressure PaPA Atmospheric pressure Pah Height md Diameter md0 Diameter of the base of
the inverted conem
A Area m2
V Volume m3
Te Effective radiation temperature Kq Mass flux kg s�1
Q Volume flow rate m3 s�1
Qmo Minimum volume flow rate tokeep lava in molten state
m3 s�1
αmo Qmo per m2 m3 s�1m�2
γ Repose angle deg
Subscriptsa Ascent (ρ, d)b Bubbly layer (h, P)c Conduit (A, d, h, P)in Intruded (V )l Lake (A, d, V, h, P)r Reservoir (P)crack Glowing central core surrounded
by cooler crust (f, T )crust (f, T )lava (f, T)
Journal of Geophysical Research: Solid Earth 10.1002/2013JB010895
BURGI ET AL. ©2014. American Geophysical Union. All Rights Reserved. 4119

which depends on the conduit length(hc). Large drainage volumes in shortperiods of time involving low magmaviscosity (60 Pa·s for foiditic lavas[Giordano et al., 2007]) are characterizedby a high Reynolds number (Re > 104)and correspond to a turbulent flowregime. For a circular pipe in a turbulentregime, the volumetric flow rate can bedetermined using the Darcy-Weisbachequation [e.g., Bansal, 2010]
Q ¼ πd5=2c
ffiffiffiffiffiffiffiffiffiffiffiffiffiffiffiffiffiffiffiffiffiPl þ ρdghc8Fhcρd
s(8)
where (Table 5) g is gravity acceleration,F is a friction factor which depends onthe relative roughness of the conduitand the magnitude of the Reynoldsnumber, dc is the conduit diameter, hc isthe conduit length, the latter of which
has a range estimated between 1000 and 4000m [Demant et al., 1994; Louaradi et al., 1993; Platz et al., 2004],and ρd is density of degassed magma (2650 kg/m3 for nephelinite [Carn, 2002/2003]). Setting Pl= ρdghl, thetime needed to flush a magma volume V is
t ¼ V
πd5=2cg8F
� �1=21þ hl
hc
� �1=2(9)
From this last equation, it can be noted that conduit diameter rather than conduit length is the determinantfactor when calculating the volumetric flow rate. To constrain the conduit diameter, we consider values of7.5m, 10m, 12.5m, and 15m, which range within the reported values for basaltic volcanoes [Head andWilson, 1987; Harris and Ripepe, 2007; Keating et al., 2008; Molina et al., 2012; Zandomeneghi et al., 2013].Friction factor values are taken between 0.02 and 0.06 [Huppert and Sparks, 1985], which for the consideredrange of conduit diameters correspond (based on the Moody diagram [Moody, 1944]) to mean heights ofroughness of the pipe εc (Figure 2) from ~1 cm to ~50 cm. Figure 9 shows the calculated time lengths neededto flush 1.0 × 10⁶m3 of magma for the considered ranges of conduit diameters and friction factors.
A2. Effective Radiation Temperature and Energy Flux
Based on our 2010 and 2011 visual observation periods, we estimate that the average number of lavafountains that are simultaneously active is ~15, with base diameters in a range 5 to 15m. Taking an averagediameter of 10m, we get flava = 2.5%. Based on photographs, we estimate that the surface of the cracksrepresents about fcrack = 5% of the total surface, and we thus get fcrust = 92.5%, which allows us to calculatethe effective radiation temperature,
Te ¼ f lavaT4lava þ f crackT
4crack þ f crustT
4crust
� �0:25(10)
where Tlava = 1380 K [Sawyer et al., 2008], Tcrack = 1150 K, and Tcrust = 750 K [Spampinato et al., 2013]. With thesevalues, we get the effective radiation temperature Te = 828K.
Assuming that the emission of radiation by the gas plume is negligible [Sawyer et al., 2008], heat loss ismainly drivenby both radiative and convective cooling [Harris et al., 1999]. The radiative heat flux component is provided by
Φr ¼ σ εAl T4e (11)
with the Stefan-Boltzmann constant σ = 5.668 × 10�8Wm�2 K�4, Te the effective radiation temperature (828 K),ε the emissivity, set to 0.95, a conservative value at these considered wavelengths [Harris et al., 2005;Staudacher, 2010] (but see Le Guern et al. [1979] and Burgi et al. [2002] for lower emissivity values), and Althe lava lake area (46,550m2). With these values, we get Φr = 1.16 GW.
Figure 9. Time needed for flushing 1 × 10⁶ m3 of magma as a functionof friction factor (F) for a range of conduit diameters (equation (9)). Lavelake depth hl = 500m and conduit length hc = 1000m; for a conduitlength of 4000m, time increases by about 10%.
Journal of Geophysical Research: Solid Earth 10.1002/2013JB010895
BURGI ET AL. ©2014. American Geophysical Union. All Rights Reserved. 4120
For the convective cooling, we apply the equation describing the natural convection for heated horizontalsurfaces facing upward in the turbulent range [McAdams, 1959]
Φconv ¼ Al hΔTΔT (12)
where ΔT= Te�Tair, with Tair the average ambient air temperature (288.5 K) and hΔT =14Wm�2 K�1 the heattransfer coefficient of the air.
A3. Mass Flux
Themass flux (q) required to yield an amount of heat lossΦtot (1.5 GW) can be calculated using (see, for instance,in Francis et al. [1993])
q ¼ Φtot
CLΔf þ cpΔTmagma(13)
in which CL is latent heat of crystallization (4.2 × 10⁵ J kg�1), cp is the specific heat capacity of the magma(1150 J kg�1 K�1), Δf is the crystallized magma mass fraction, and ΔTmagma is the temperature interval overwhich the magma cools.
ReferencesAster, R., S. Mah, P. Kyle, W. McIntosh, N. Dunbar, J. Johnson, M. Ruiz, and S. McNamara (2003), Very long period oscillations of Mount Erebus
Volcano, J. Geophys. Res., 108(B11), 2522, doi:10.1029/2002JB002101.Bansal, R. K. (2010), A Textbook of Fluid Mechanics, Laxmi Publications Pvt Limited, New Delhi, India.Baxter, P., P. Allard, M. Halbwachs, J.-C. Komorowski, A. Woods, and A. Ancia (2002/2003), Human health and vulnerability in the Nyiragongo
Volcano eruption and humanitarian crisis at Goma, Democratic Republic of Congo, in Acta Vulcanologica, vol. 14(1–2), 2002 andvol. 15(1–2), 2003, pp. 109–114, Istituti Editoriali e Poligrafici Internazionali, Pisa – Roma.
Burgi, P.-Y., M. Caillet, and S. Haefeli (2002), Field temperature measurements at Erta ’Ale lava lake, Ethiopia, Bull. Volcanol., 64, 472–485.Calkins, J., C. Oppenheimer, and P. R. Kyle (2008), Ground-based thermal imaging of lava lakes at Erebus volcano, Antarctica, J. Volcanol.
Geotherm. Res., 177, 695–704.Carn, S. A. (2002/2003), Eruptive and passive degassing of sulphur dioxide at Nyiragongo volcano (D. R. Congo): The 17th January 2002 eruption and
its aftermath, in Acta Vulcanologica, vol. 14(1–2), 2002 and vol. 15(1–2) 2003, pp. 75–85, Istituti Editoriali e Poligrafici Internazionali, Pisa – Roma.Chakrabarti, R., A. R. Basu, A. P. Santo, D. Tedesco, and O. Vaselli (2009), Isotopic and geochemical evidence for a heterogeneous mantle
plume origin of the Virunga volcanics, Western rift, East African Rift system, Chem. Geol., 259, 273–289.Corti, G., M. Bonini, F. Innocenti, P. Manetti, G. Mulugeta, D. Sokoutis, and S. Cloetingh (2002/2003), Rift-parallel magma migration and
localisation of magmatic activity in transfer zones, in Acta Vulcanologica, vol. 14(1–2), 2002 and vol. 15(1–2) 2003, pp. 17–25, IstitutiEditoriali e Poligrafici Internazionali, Pisa – Roma.
Cuoco, E., D. Tedesco, R. J. Poreda, J. C. Williams, S. De Francesco, C. Balagizi, and T. H. Darrah (2013), Impact of volcanic plume emissions on rainwaterchemistry during the January 2010Nyamuragira eruptive event: Implications for essential potablewater resources, J. Hazard. Mater., 244, 570–581.
Dai, A., and J. Wang (1999), Diurnal and semidiurnal tides in global surface pressure fields, J. Atmos. Sci., 56, 3874–3891.Demant, A., P. Lestrade, R. T. Lubala, A. B. Kampunzu, and J. Durieux (1994), Volcanological and petrological evolution of Nyiragongo volcano,
Virunga volcanic field, Zaire, Bull. Volcanol., 56, 47–61.Dixon, J. E. (1997), Degassing of alkalic basalts, Am. Mineral., 82, 368–378.d’Oreye, N., et al. (2008), Systematic InSAR monitoring of African active volcanic zones: What we have learned in three years, or an harvest
beyond our expectations, in Use of Remote Sensing Techniques for Monitoring Volcanoes and Seismogenic Areas, pp. 1–6, IEEE, Naples, Italy,doi:10.1109/USEREST.2008.4740361.
d’Oreye, N., et al. (2011), Source parameters of the 2008 Bukavu-Cyangugu earthquake estimated from InSAR and teleseismic data, Geophys.J. Int., 184, 934–994.
Durieux, J. (2002/2003), Volcano Nyiragongo (D.R.Congo): Evolution of the crater and lava lakes from the discovery to the present, in ActaVulcanologica, vol. 14(1–2), 2002 and vol. 15(1–2) 2003, pp. 137–144, Istituti Editoriali e Poligrafici Internazionali, Pisa – Roma.
Durieux, J. (2008), Rapport de mission de terrain au volcan Nyiragongo, UNOPS.Ebinger, C. (2005), Continental break-up: The East African perspective, Astron. Geophys., 46, 16–21.Favalli, M., G. D. Chirico, P. Papale, M. T. Pareschi, and E. Boschi (2009), Lava flow hazard at Nyiragongo volcano, D.R.C, Bull. Volcanol., 71, 363–374.Field, L., T. Barnie, J. Blundy, R. A. Brooker, D. Keir, E. Lewi, and K. Saunders (2012), Integrated field, satellite and petrological observations of
the November 2010 eruption of Erta Ale, Bull. Volcanol., 74, 2251–2271.Francis, P., C. Oppenheimer, and D. Stevenson (1993), Endogenous growth of persistently active volcanoes, Nature, 366, 554–557.Giordano, D., M. Polacci, A. Longo, P. Papale, D. B. Dingwell, E. Boschi, and M. Kasereka (2007), Thermo-rheological magma control on the
impact of highly fluid lava flows at Mt. Nyiragongo, Geophys. Res. Lett., 34, L06301, doi:10.1029/2006GL028459.Global Volcanism Network (GVN) (1995), Bull Global Volcanism Net, 20(1).Global Volcanism Network (GVN) (2001), Bull Global Volcanism Net, 26(3).Global Volcanism Network (GVN) (2003), Bull Global Volcanism Net, 28(2, 5).Global Volcanism Network (GVN) (2006), Bull Global Volcanism Net, 31(3).Harris, A., and M. Ripepe (2007), Synergy of multiple geophysical approaches to unravel explosive eruption conduit and source dynamics—A
case study from Stromboli, Chem. Erde, 67, 1–35.Harris, A. J. L., L. P. Flynn, D. A. Rothery, C. Oppenheimer, and S. B. Sherman (1999), Mass flux measurements at active lava lakes: Implications
for magma recycling, J. Geophys. Res., 104, 7117–7136, doi:10.1029/98JB02731.Harris, A. J. L., R. Carniel, and J. Jones (2005), Identification of variable convective regimes at Erta Ale Lava Lake, J. Volcanol. Geotherm. Res.,
142, 207–223.
AcknowledgmentsWe gratefully acknowledge theEuropean Union and Swiss Cooperation(DDC) for their continuous support tothe UNOPS project “Analysis andPrevention of Natural Hazards in DRC.”Our gratitude goes to Marc Caillet,Nathalie Duverlie, Olivier Grunewald,Patrick Marcel, Pierre Vetsch, and EllenCampbell for their participation in theexpedition’s logistics and to all thescientists from the Goma VolcanoObservatory for their help and availability.We also thank Letizia Spampinato andan anonymous reviewer for their helpfulcomments and Jean-ChristopheKomorowski and Robert Poreda for theirrelevant comments on an earlier versionof this manuscript.
Journal of Geophysical Research: Solid Earth 10.1002/2013JB010895
BURGI ET AL. ©2014. American Geophysical Union. All Rights Reserved. 4121

Head, J. W., III, and L. Wilson (1987), Lava fountain heights at Pu’u ’O’o, Kilauea, Hawaii: Indicators of amount and variations of exsolved magmavolatiles, J. Geophys. Res., 92(B13), 13,715–13,719, doi:10.1029/JB092IB13P13715.
Huppert, H. E., and R. S. J. Sparks (1985), Cooling and contamination of mafic and ultramafic magmas during ascent through continental crust,Earth Planet. Sci. Lett., 74, 371–386.
Huppert, H. E., andM. A. Hallworth (2007), Bi-directional flows in constrained systems, J. FluidMech., 578, 95–112, doi:10.1017/S0022112007004661.Keating, G. N., G. A. Valentine, D. J. Krier, and F. V. Perry (2008), Shallow plumbing systems for small-volume basaltic volcanoes, Bull. Volcanol.,
70, 563–582.Komorowski, J.-C., et al. (2002/2003), The January 2002 flank eruption of Nyiragongo volcano (Democratic Republic of Congo): Chronology,
evidence for a tectonic trigger, and impact of lava flows on the city of Goma, in Acta Vulcanologica, vol. 14(1–2), 2002 and vol. 15(1–2)2003, pp. 27–61, Istituti Editoriali e Poligrafici Internazionali, Pisa – Roma.
Le Guern, F. (1987), Mechanism of energy transfer in the lava lake of Niragongo (Zaire), 1959–1977, J. Volcanol. Geotherm. Res., 31, 17–31.Le Guern, F., J. Carbonnelle, and H. Tazieff (1979), Erta’Ale lava lake: Heat and gas transfer to the atmosphere, J. Volcanol. Geotherm. Res., 6, 27–48.Louaradi, D., R. Clochiatti, F. Pineau, and M. Javoy (1993), Magma storage beneath Nyiragongo volcano (Zaire): Evidence from fluid and melt
inclusions, Terra Abstr., 5, 573.McAdams, W. H. (1959), Heat Transmission, McGraw-Hill, New York.Molina, I., A. Burgisser, and C. Oppenheimer (2012), Numerical simulations of convection in crystal-bearing magmas: A case study of the
magmatic system at Erebus, Antarctica, J. Geophys. Res., 117, B07209, doi:10.1029/2011JB008760.Moody, L. F. (1944), Friction factors for pipe flow, Trans. ASME, 66, 671–678.Nyblade, A. A., T. J. Owens, H. Gurrola, J. Ritsema, and C. A. Langston (2000), Seismic evidence for a deep upper mantle thermal anomaly
beneath east Africa, Geology, 28, 599–602.Oppenheimer, C., A. S. Lomakina, P. R. Kyle, N. G. Kingsbury, and M. Boichu (2009), Pulsatory magma supply to a phonolite lava lake,
Earth Planet. Sci. Lett., 284, 392–398.Platz, T., S. F. Foleyb, and L. André (2004), Low-pressure fractionation of the Nyiragongo volcanic rocks, Virunga Province, D.R. Congo, J. Volcanol.
Geotherm. Res., 136, 269–295.Poland, M. (2006), InSAR captures rifting and volcanism in East Africa, Alaska, Satell. Facil. News Notes, 3, 1–3.Ray, R. D. (2001), Comparisons of global analyses and station observations of the S2 barometric tide, J. Atmos. Sol. Terr. Phys., 63, 1085–1097.Sawyer, G. M., S. A. Carn, V. I. Tsanev, C. Oppenheimer, and M. Burton (2008), Investigation into magma degassing at Nyiragongo volcano,
Democratic Republic of the Congo, Geochem. Geophys. Geosyst., 9, Q02017, doi:10.1029/2007GC001829.Scientific Event Alert Network Research (1982), Bull Sci Event Alert Net Vol. 7(7, 10), Smithonian NationalMuseumof Natural History, Washington, D. C.Sebai, A., E. Stutzmann, J. P. Montagner, D. Sicilia, and E. Beucler (2006), Anisotropic structure of the African upper mantle from Rayleigh and
Love wave tomography, Phys. Earth Planet In., 155, 48–62.Shuler, A., and G. Ekström (2009), Anomalous earthquakes associated with Nyiragongo volcano: Observations and potential mechanisms,
J. Volcanol. Geotherm. Res., 181, 219–230.Smets, B., et al. (2014), Detailedmultidisciplinarymonitoring reveals pre- and co-eruptive signals at Nyamulagira volcano (North Kivu, Democratic
Republic of Congo), Bull. Volcanol., 76, 1–35.Smithsonian Institution/U.S. Geological Survey Weekly Report (2011–2013), New activity/unrest: Nyiragongo, 16 November-22 November
2011; 31 October-6 November 2012; 31 July-6 August 2013. [Available at http://volcano.si.edu/reports_weekly.cfm.]Spampinato, L., C. Oppenheimer, A. Cannata, P. Montalto, G. G. Salerno, and S. Calvari (2012), On the time-scale of thermal cycles associated
with open-vent degassing, Bull. Volcanol., 74, 1281–1292.Spampinato, L., G. Ganci, P. A. Hernández, D. Calvo, D. Tedesco, N. M. Pérez, S. Calvari, C. Del Negro, and M. M. Yalire (2013), Thermal insights
into the dynamics of Nyiragongo lava lake from ground and satellite measurements, J. Geophys. Res. Solid Earth, 118, 5771–5784,doi:10.1002/2013JB010520.
Staudacher, T. (2010), Field observations of the 2008 summit eruption at Piton de la Fournaise (Ile de La Réunion) and implications for the2007 Dolomieu collapse, J. Volcanol. Geotherm. Res., 191, 60–68.
Stevenson, D. S., and S. Blake (1998), Modelling the dynamics and thermodynamics of volcanic degassing, Bull. Volcanol., 60, 307–317.Tassi, F., O. Vaselli, D. Tedesco, G. Montegrossi, T. Darrah, E. Cuoco, M. Y. Mapendano, R. Poreda, and A. Delgado Huertas (2009), Water and gas
chemistry at Lake Kivu (DRC): Geochemical evidence of vertical and horizontal heterogeneities in a multi-basin structure, Geochem.Geophys. Geosyst., 10, Q02005, doi:10.1029/2008GC002191.
Tazieff, H. (1975), Niragongo ou le Volcan Interdit, Flammarion, Paris, France.Tazieff, H. (1977), An exceptional eruption: Mt Nyiragongo, Jan 10th 1977, Bull. Volcanol., 30, 189–200.Tazieff, H. (1984), Mt. Nyiragongo: Renewed activity of the lava lake, J. Volcanol. Geotherm. Res., 20, 267–280.Tazieff, H. (1994), Permanent lava lakes: Observed facts and induced mechanisms, J. Volcanol. Geotherm. Res., 63, 3–11.Tedesco, D. (2002/2003), 1995 Nyiragongo and Nyamulagira activity in the Virunga National Park: A volcanic crisis, in Acta Vulcanologica,
vol. 14(1–2), 2002 and vol. 15(1–2) 2003, pp. 149–155, Istituti Editoriali e Poligrafici Internazionali, Pisa – Roma.Tedesco, D., O. Vaselli, P. Papale, S. A. Carn, M. Voltaggio, G. M. Sawyer, J. Durieux, M. Kasereka, and F. Tassi (2007a), January 2002 volcano-
tectonic eruption of Nyiragongo volcano, Democratic Republic of Congo, J. Geophys. Res., 112, B09202, doi:10.1029/2006JB004762.Tedesco, D., et al. (2007b), Cooperation on Congo volcanic and environmental risks, Eos Trans. AGU, 88, 177–181, doi:10.1029/2007EO160001.Tedesco, D., F. Tassi, O. Vaselli, R. J. Poreda, T. Darrah, E. Cuoco, and M. M. Yalire (2010), Gas isotopic signatures (He, C, and Ar) in the Lake Kivu
region (western branch of the East African rift system): Geodynamic and volcanological implications, J. Geophys. Res., 115, B01205,doi:10.1029/2008JB006227.
Tilling, R. I. (1987), Fluctuations in surface height of active lava lakes during 1972–1974MaunaUlueruption, Kilauea volcano, Hawaii, J. Geophys. Res.,92, 13,721–13,730, doi:10.1029/JB092iB13p13721.
Wauthier, C., V. Cayol, F. Kervyn, and N. d’Oreye (2012), Magma sources involved in the 2002 Nyiragongo eruption, as inferred from an InSARanalysis, J. Geophys. Res., 117, B05411, doi:10.1029/2011JB008257.
White, R., and D. McKenzie (1989), Magmatism at rift zones: The generation of volcanic continental margins and flood basalts, J. Geophys. Res.,94, 7685–7729, doi:10.1029/JB094iB06p07685.
Witham, F., and E. W. Llewellin (2006), Stability of lava lakes, J. Volcanol. Geotherm. Res., 158, 321–332.Witter, J. B., V. C. Kress, P. Delmelle, and J. Stix (2004), Volatile degassing, petrology, and magma dynamics of the Villarrica Lava Lake, Southern
Chile, J. Volcanol. Geotherm. Res., 134, 303–337.Wright, R., and E. Pilger (2008), Radiant flux from Earth’s subaerially erupting volcanoes, Int. J. Remote Sens., 29, 6443–6466.Zandomeneghi, D., R. Aster, P. Kyle, A. Barclay, J. Chaput, and H. Knox (2013), Internal structure of Erebus volcano, Antarctica imaged by high-
resolution active-source seismic tomography and coda interferometry, J. Geophys. Res. Solid Earth, 118, 1067–1078, doi:10.1002/jgrb.50073.
Journal of Geophysical Research: Solid Earth 10.1002/2013JB010895
BURGI ET AL. ©2014. American Geophysical Union. All Rights Reserved. 4122