Topographic control on lava flow paths at Mount Etna, Italy: Implications for hazard assessment
34
Topographic control on lava flow paths at Mt. Etna (Italy): implications for hazard assessment 1 2 3 4 5 6 7 8 9 10 11 12 13 14 15 16 17 18 19 20 21 22 23 24 25 26 27 28 29 Massimiliano Favalli 1 , Francesco Mazzarini 1 , Maria Teresa Pareschi 1 , Enzo Boschi 1 1- Istituto Nazionale di Geofisica e Vulcanologia, Pisa, Italy Abstract Assessment of the hazard from lava flow inundation at the active volcano of Mt. Etna (Italy) was performed by calculating the probability of lava flow inundation at each position on the volcano. A probability distribution for the formation of new vents was calculated using geological and volcanological data from past eruptions. The simulated lava flows from these vents were emplaced using a maximum expected flow length derived from geological data on previous lava flows. Simulations were run using DOWNFLOW, a DEM-based model designed to predict lava flow paths. Different eruptive scenarios were simulated by varying the elevation and probability distribution of eruptive points. Inundation maps show that the city of Catania and the coastal zone may only be impacted by flows erupted from low-altitude vents (< 1500 m elevation), and that flank eruptions at elevations > 2000 m preferentially inundate the northeast and southern sectors of the volcano as well as the Valle del Bove. Eruptions occurring in the summit area (> 3000 m elevation) pose no threat to the local population. Discrepancies between the results of simple, hydrological models and those of the DOWNFLOW model show that hydrological approaches are inappropriate when dealing with Etnean lava flows. Because hydrological approaches are not designed to reproduce the full complexity of lava flow spreading, they underestimate the catchment basins when the fluid has a complex rheology. 1. Introduction The flanks of several basaltic volcanoes are highly populated, and the towns, cities and associated infrastructures may be impacted by lava flows during effusive eruptions. Lava flow hazards on the flanks of such volcanoes (e.g., Mauna Loa, Mt. Etna) are of great concern for the
-
Upload
independent -
Category
Documents
-
view
4 -
download
0
Transcript of Topographic control on lava flow paths at Mount Etna, Italy: Implications for hazard assessment

Topographic control on lava flow paths at Mt. Etna (Italy): implications for hazard assessment
1 2 3 4 5 6 7 8
9
10
11
12
13
14
15
16
17
18
19
20
21
22
23
24
25
26
27
28
29
Massimiliano Favalli1, Francesco Mazzarini1, Maria Teresa Pareschi1, Enzo Boschi1 1- Istituto Nazionale di Geofisica e Vulcanologia, Pisa, Italy Abstract
Assessment of the hazard from lava flow inundation at the active volcano of Mt. Etna (Italy)
was performed by calculating the probability of lava flow inundation at each position on the
volcano. A probability distribution for the formation of new vents was calculated using geological
and volcanological data from past eruptions. The simulated lava flows from these vents were
emplaced using a maximum expected flow length derived from geological data on previous lava
flows. Simulations were run using DOWNFLOW, a DEM-based model designed to predict lava
flow paths. Different eruptive scenarios were simulated by varying the elevation and probability
distribution of eruptive points. Inundation maps show that the city of Catania and the coastal zone
may only be impacted by flows erupted from low-altitude vents (< 1500 m elevation), and that flank
eruptions at elevations > 2000 m preferentially inundate the northeast and southern sectors of the
volcano as well as the Valle del Bove. Eruptions occurring in the summit area (> 3000 m elevation)
pose no threat to the local population. Discrepancies between the results of simple, hydrological
models and those of the DOWNFLOW model show that hydrological approaches are inappropriate
when dealing with Etnean lava flows. Because hydrological approaches are not designed to
reproduce the full complexity of lava flow spreading, they underestimate the catchment basins when
the fluid has a complex rheology.
1. Introduction
The flanks of several basaltic volcanoes are highly populated, and the towns, cities and
associated infrastructures may be impacted by lava flows during effusive eruptions. Lava flow
hazards on the flanks of such volcanoes (e.g., Mauna Loa, Mt. Etna) are of great concern for the

protection of civilians because of the frequent eruptions and the growing vulnerable population [e.g.
Trusdell 1995; Rowland et al., 2005]. It is difficult to assess lava hazard through computer
simulations of lava flow [e.g. Crisci et al., 2004a] because of the evolving topography during an
eruption: as new lava flows are emplaced, they produce new topographic features that can influence
the paths of subsequent lava flows. Lava flows are unconfined, multiphase and multicomponent
flows in which temperature, rheology and effusion rates all vary in time and space. Given the high
complexity of these processes, in most real case applications it would be impractical to perform a
direct numerical simulation of the complete set of flow conservation laws. Because the real-time
forecast of lava flow paths is essential during volcanic crises, a number of “simplified” models have
been developed; these models are mainly based on the assumption that lava follows the steepest
gradient downhill and spreads laterally according to its critical thickness and mass conservation
[e.g. Wadge et al., 1994]. Other models are based on a probabilistic definition of lava flow
spreading [e.g. Favalli et al., 2005]; they generally involve low CPU execution times and do not
require accurate specification of the physical properties of lava (e.g. flow rate, temperature,
cristallinity, viscosity, yield strength). Other models are based on cellular automata or neural
network approaches [e.g. Crisci et al., 2004a] or on various simplifications of the governing
physical equations [e.g. Dragoni et al., 1986; Harris and Rowland, 2001; Costa and Macedonio,
2005].
30
31
32
33
34
35
36
37
38
39
40
41
42
43
44
45
46
47
48
49
50
51
52
53
54
55
Here we use a modified version of DOWNFLOW [Favalli et al., 2005]. The previous versions
of the DOWNFLOW code [Favalli et al., 2005; Favalli et al., 2006] predicted which areas would be
inundated by lava flows erupting from a single vent. The new DOWNFLOW version adopts
probability distributions for vent opening and lava flow length distributions to create maps of lava
inundation probability.
We applied this new model to lava flow hazard assessment on Mt. Etna volcano, located on the
East coast of Sicily (Italy). Mt. Etna is characterized by numerous (near yearly) eruptions
accompanied by effusive and moderate explosive activity [Behncke and Neri, 2003; Neri and

Acocella, 2006; Allard et al., 2006]. Eruptions from both summit and flank vents at variable
effusion rates have produced numerous composite lava fields [e.g. Harris et al., 2000; Branca and
Del Carlo, 2004; Calvari and Pinkerton, 1998; Romano and Sturiale, 1982]. Much of the erupted
lava has flowed into a deep scar resulting from flank instability on the eastern flank of the volcano
(Valle del Bove) [Borgia et al., 1992].
56
57
58
59
60
61
62
63
64
65
66
67
68
69
70
71
72
73
74
75
76
77
78
79
80
81
Existing hazard zonation maps of Etna have been compiled considering the main volcanological
parameters of all eruptions since A.D. 1600 (e.g., including vent location, age, type of eruption,
volume of lava flow and tephra) and the areas invaded by lava flows since 700 B.C.; they assume
that the characteristics of future eruptions will be similar to those of past eruptions [Guest and
Murray, 1979; Andronico and Lodato, 2005; Behncke et al., 2005]. We propose a different hazard
assessment approach based not only on the frequency of coverage of past lava flows, but also on the
numerical simulation of possible lava flow paths, taking into account the actual topography over
which lavas flow. Updated high resolution digital elevation models (DEM) of Mt. Etna have
recently been derived from LiDAR (Light Detection and Ranging) data [Mazzarini et al., 2005;
2007]. Using vent and lava flow length distributions based on the statistical analysis of past
eruptions, DOWNFLOW performs simulations of all possible future lava flow paths and produces
detailed quantitative maps of the probability of inundation by lava flows. This is possible because:
i) DOWNFLOW accounts for the most relevant emplacement characteristics of real lava flows,
such as filling of topographic depressions, overriding of topographic obstacles and lava flow
spreading, without requiring detailed input parameters; ii) the code is able to compute invasion
areas from each vent in a very short computational time; iii) simulation outputs require relatively
little disk space. Lava flow paths from all possible vents can therefore easily be simulated and
stored, results can be post-processed to produce quantitative hazard maps for different scenarios,
and lava catchment areas can be identified rigorously by considering all the vents from which lava
flows can invade a target area.

2. Mt. Etna Digital Elevation Model 82
83
84
85
86
87
88
89
90
91
92
93
94
95
96
97
98
99
100
101
102
103
104
105
106
Airborne altimetric LiDAR data were used to generate a high-resolution (2 m) DEM of most of
Mt. Etna from data acquired during flights on September 29 (8:00-11:00 a.m. local time) and
September 30 (8:00-10:30 a.m. local time) 2005. LiDAR data have already proved useful in
analyzing the morphology of rapidly evolving features of the landscape, for example active
volcanoes [e.g. Mazzarini et al., 2005; Mazzarini et al., 2007; Ventura and Vilardo, 2007], as well
as in lava flow modeling [e.g. Harris et al., 2007].
An ALTM 3033 (Optech®) laser altimeter (see Table 1 for instrument characteristics) was used
to survey an area of 616 km2. Measurements were made at a frequency of 33 kHz, resulting in a
mean ground point density of 1 point per 2.4 m2 (generally one point every 1.5 x 1.5 m2). The
LiDAR survey consists of more than 2.57 x 10⁸ data points. These points (echoes) were distributed
along 34 NNE-SSW trending strips covering part of Etna’s western flanks and the majority of its
eastern flanks. The resulting DEM, geocoded to a UTM-WGS 84 projection, has an elevation
accuracy of ±0.4 m and a horizontal accuracy of ±1.5 m.
At the LiDAR operating wavelength (λ = 1.064 μm), atmospheric absorption is minimum;
however, during an eruption, ash and gases can greatly hamper data acquisition. Likewise,
persistent degassing such as that which feeds a constant plume at Etna can cause unwanted
atmospheric effects, especially near the summit craters. Our September 2005 LiDAR survey (with
flight altitudes ranging from 1500 to 3500 m) occurred during a period of low volcanic activity
characterized by clear atmospheric conditions. A 10 m step DEM was derived from the LiDAR
data. Outside the region covered by the LiDAR survey, the LiDAR DEM was merged with a 10 m
step DEM of all of Italy created by Tarquini et al. [2007].
3 Lava flow simulation
3.1 The DOWNFLOW probabilistic code

DOWNFLOW [Favalli et al., 2005] computes maximum slope paths on a stochastically
perturbed topography. It is based on an assessment of the steepest descent path, which is derived
multiple times (generally thousands of times) on a randomly perturbed topography in an attempt to
quantify all possible flow paths. For each emission point, only two model parameters must be input.
The first parameter (Δh) represents the maximum vertical perturbation (either positive or negative)
which is applied to the DEM during each iteration. The second parameter (n) represents the number
of steepest descent path calculations performed for any single run from a user-defined emission
point [Favalli et al., 2005; 2006].
107
108
109
110
111
112
113
114
115
116
117
118
119
120
121
122
123
124
125
126
127
128
129
130
131
132
Favalli et al. [2005] performed a dimensional analysis of steady-state lava flows on an inclined
plane; results indicated that lava spreading is controlled by the competing viscous and gravitational/
self-gravitational (hydrostatic) forces. These forces can be characterized by a vertical scale length H
that approximates the size of obstacles which can be overridden by the flow. Stochastic variations in
ground elevation by a characteristic vertical height equal to 2Δh ≅ H employed in the computation
of maximum slope paths therefore account for first-order variations in lava flow spreading. An
appropriate value of Δh can be obtained through the best fit of simulated and actual lava flows; such
a value relates to the characteristic height of obstacles capable of diverging the flow. In the case of
Mt. Etna, the best fit to lava flow maps for the 1991-1993, 2001 and 2002 flank eruptions is given
by Δh = 3 m and n = 10,000 [Favalli et al., 2005]. For example, the simulated inundation area of the
2001 flow covers 90% of the actual flow. We thus assume that these Δh and n values are
appropriate for typical flank eruptions at Etna. Comparison between real and simulated flow fields
at Etna and Nyiragongo indicates that the DOWNFLOW approach yields realistic emplacement
areas [Favalli et al., 2005; 2006].
We applied DOWNFLOW to Mt. Etna, for which a high resolution LIDAR-derived DEM is
available. We checked the sensitivity of DOWNFLOW against the DEM resolution in the case of
the southern 2001 lava flow at Mt. Etna [Favalli et al., 2005]. The 1998 DEM of Tarquini et al.
[2007], with a cell size of 10m, was used as a topographic base. The DEM root mean square (RMS)

133
134
135
136
137
vertical error in the study area is 1.43 m. By resampling the original DEM, we generated a series of
new DEMs with different cell sizes (up to 120 m) and vertical errors (up to 4.23 m), as reported in
Table 2. We then performed simulations with DOWNFLOW for each newly generated DEM, using
the 2001 vent as the starting point, with Δh = 3 m and n = 10,000. To compare the simulations with
the actual flow, for each simulation we calculated the parameter μ:
RS
RS
AAAA
∪∩
=μ 138
139
140
141
142
143
144
145
146
147
148
149
where AS is the area covered by our simulation and AR is the area covered by the actual 2001 flow;
μ is 1 when these two areas coincide. In the case of the 10-m DEM we obtained a μ value of 0.52,
which indicates that there is good agreement between the simulated flow and the actual flow. As
shown in Table 2, the agreement between the simulated flow and the actual 2001 lava flow is
almost constant up to grid cells of 90 m (or up to RMS vertical errors of 3.27 m), whereas μ values
gently decrease for higher cell dimensions. The probabilistic nature of DOWNFLOW is such that
intrinsic errors in the adopted DEM are overcome, since random perturbations of the topography
already add random ‘errors’ to the topography.
Recently DOWNFLOW was applied on DEMs of coarser resolution. In particular,
DOWNFLOW has successfully reproduced the 1977 and 2002 lava flows at Nyiragongo Volcano
using a 90-m pixel DEM derived from the Shuttle Radar Topographic Mission (SRTM;
http://www2.jpl.nasa.gov/srtm) as a topographic base [Favalli et al., 2008]. This indicates that
DOWNFLOW can be used with the SRTM digital elevation model for most volcanoes in the world
where high resolution data are not yet available.
150
151
152
153
154
155
156
157
However, the model allows neither a description of the time evolution of lava flows and of the
effects of effusion rates, nor the definition of flow lengths. Accordingly, the length distribution for
the simulated lava flow must be input.
3.2 Probability distribution of vents

Although eruptions at Mt. Etna occur from both the summit and flanks, we focus on the hazard
due to flank eruptions, which have proved to be the most dangerous in the past [Chester et al., 1985;
Mulargia et al., 1985; Crisci et al., 2004b; Andronico and Lodato, 2005; Behncke et al., 2005] and
often have the highest effusion rates [Harris et al., 2000; Wadge 1981]. According to Guest and
Murray [1979] and Chester et al. [1985], certain flank areas of Mt. Etna are more likely to produce
eruptions than others; these areas correspond to zones with a high density of cones and eruptive
fractures, i.e. the NE, S and W rift zones [e.g. Kieffer, 1975].
158
159
160
161
162
163
164
165
166
167
168
169
170
171
172
173
174
175
176
177
178
179
180
181
182
The probability of a vent opening in a certain location is usually based on the assumption that
future vents will form in zones with the highest density of old vents [Guest and Murray, 1979;
Behncke et al., 2005]. The location of more than 400 vents were thus extracted from LiDAR-based
DEMs of Mt. Etna and published maps [Mazzarini and Armienti, 2001]. From this discrete set of
points we estimated the vent opening probability distribution through a kernel smoothing technique
[Bowman and Azzalini, 2003] using a Gaussian kernel with a bandwidth of 1 km. In Fig. 1 we plot
the smoothing kernel over the vent spacing distribution. The distribution of vent spacing (vent
separation) was calculated by computing the distance between each vent and the nearest neighbor
vent. Results show that there is a very low probability that a vent will open less than 80 m from
another vent. The probability distribution for vent opening was thus assessed using the vent density
map and the 80 m proximity threshold (Fig. 2). This vent opening distribution does not, of course,
take into account the possibility of vents or vent clusters opening in areas where vents are currently
not exposed at the surface. This possibility is taken into account, as described in the following
sections, by using a uniform vent distribution.
3.3 Lava flow length distribution
Following Favalli et al. [2005], data from Guest [1982], Behncke et al. [2005], Allard et al.
[2006], and Neri and Acocella [2006] was plotted on a flow length versus vent elevation diagram
(Fig. 3). In the last two decades eruptions have occurred above 2000 m and have been characterized
by a maximum runout distance of 8.75 km [Behncke et al., 2005].
183
184
185
186
187
188
189
190
191
192
193
194
195
196
197
198
199
200
201
202
203
204
205
206
207
208
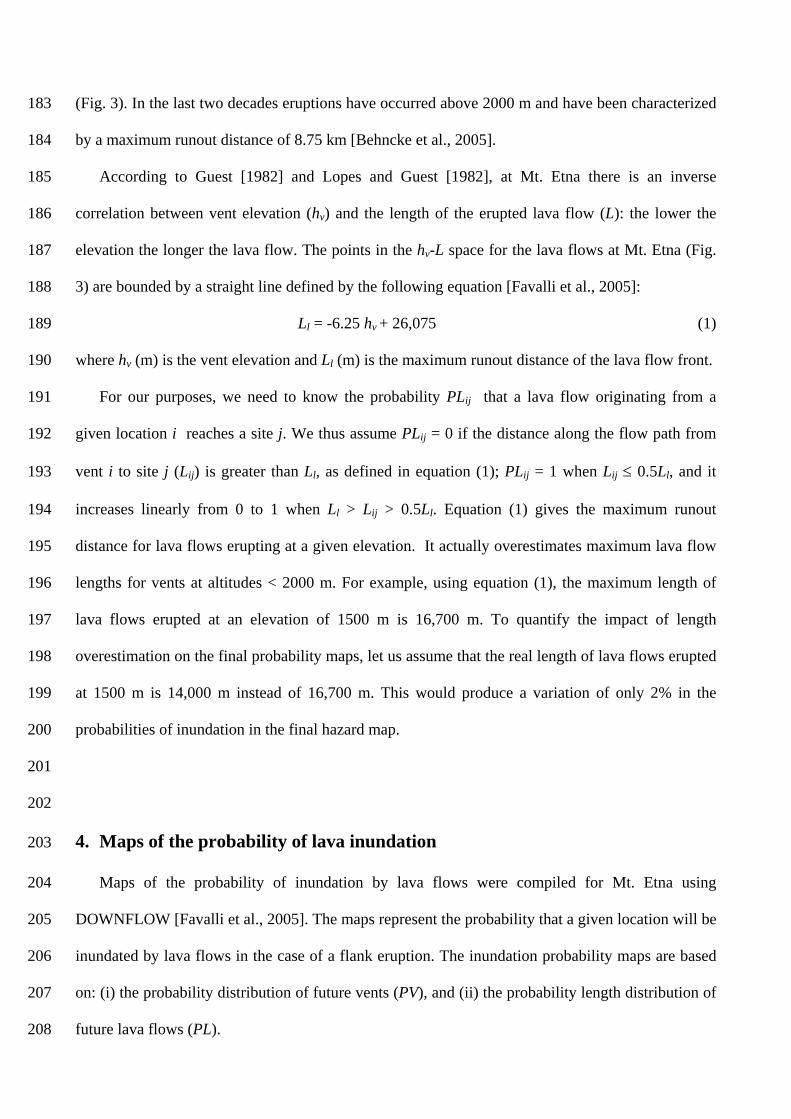
According to Guest [1982] and Lopes and Guest [1982], at Mt. Etna there is an inverse
correlation between vent elevation (hv) and the length of the erupted lava flow (L): the lower the
elevation the longer the lava flow. The points in the hv-L space for the lava flows at Mt. Etna (Fig.
3) are bounded by a straight line defined by the following equation [Favalli et al., 2005]:
Ll = -6.25 hv + 26,075 (1)
where hv (m) is the vent elevation and Ll (m) is the maximum runout distance of the lava flow front.
For our purposes, we need to know the probability PLij that a lava flow originating from a
given location i reaches a site j. We thus assume PLij = 0 if the distance along the flow path from
vent i to site j (Lij) is greater than Ll, as defined in equation (1); PLij = 1 when Lij ≤ 0.5Ll, and it
increases linearly from 0 to 1 when Ll > Lij > 0.5Ll. Equation (1) gives the maximum runout
distance for lava flows erupting at a given elevation. It actually overestimates maximum lava flow
lengths for vents at altitudes < 2000 m. For example, using equation (1), the maximum length of
lava flows erupted at an elevation of 1500 m is 16,700 m. To quantify the impact of length
overestimation on the final probability maps, let us assume that the real length of lava flows erupted
at 1500 m is 14,000 m instead of 16,700 m. This would produce a variation of only 2% in the
probabilities of inundation in the final hazard map.
4. Maps of the probability of lava inundation
Maps of the probability of inundation by lava flows were compiled for Mt. Etna using
DOWNFLOW [Favalli et al., 2005]. The maps represent the probability that a given location will be
inundated by lava flows in the case of a flank eruption. The inundation probability maps are based
on: (i) the probability distribution of future vents (PV), and (ii) the probability length distribution of
future lava flows (PL).

The probability of inundation (Pj) by lava flows at a generic site j is defined as: 209
210
211
212
213
214
215
216
217
218
219
220
221
222
223
224
225
226
227
228
229
230
231
232
233
234
Pj= Σi PVi x PSij x PLij (2)
where the sum is over all the vents i, PVi is the probability that a vent forms at location i, PSij is the
probability that site j is inundated by a lava flow erupted from a vent at location i (using the
DOWNFLOW simulation code), and PLij is the probability that a lava flow originating from
location i has the capability to reach site j, as defined in the previous section.
The 10 meter DEM was used as a computational grid for the simulations. The selected vent or
source region includes all areas with a vent opening probability higher than 0.1 %/km2, for a total
surface area of 320 km2. Computational vents were chosen on a regular mesh with a node
separation of 80 m.
To test the influence of the initial vent distribution, several inundation maps were prepared
(Figs. 4 to 7). The maps were compiled on the basis of 5 x 10⁴ simulations, i.e. simulations were run
from 5 x 10⁴ likely vent locations, which allowed the computation of a total of 5 x 10⁸ lava flow
paths. Each of these simulations took a few minutes. The vent probability threshold (0.1 %/km2 )
was used to obtain an acceptable compromise between CPU time and the accuracy of the final
inundation maps. The inclusion of regions with vent opening probabilities lower than 0.1 %/km2
contributes negligibly to the final maps but increases the computational time by more then 100
days.
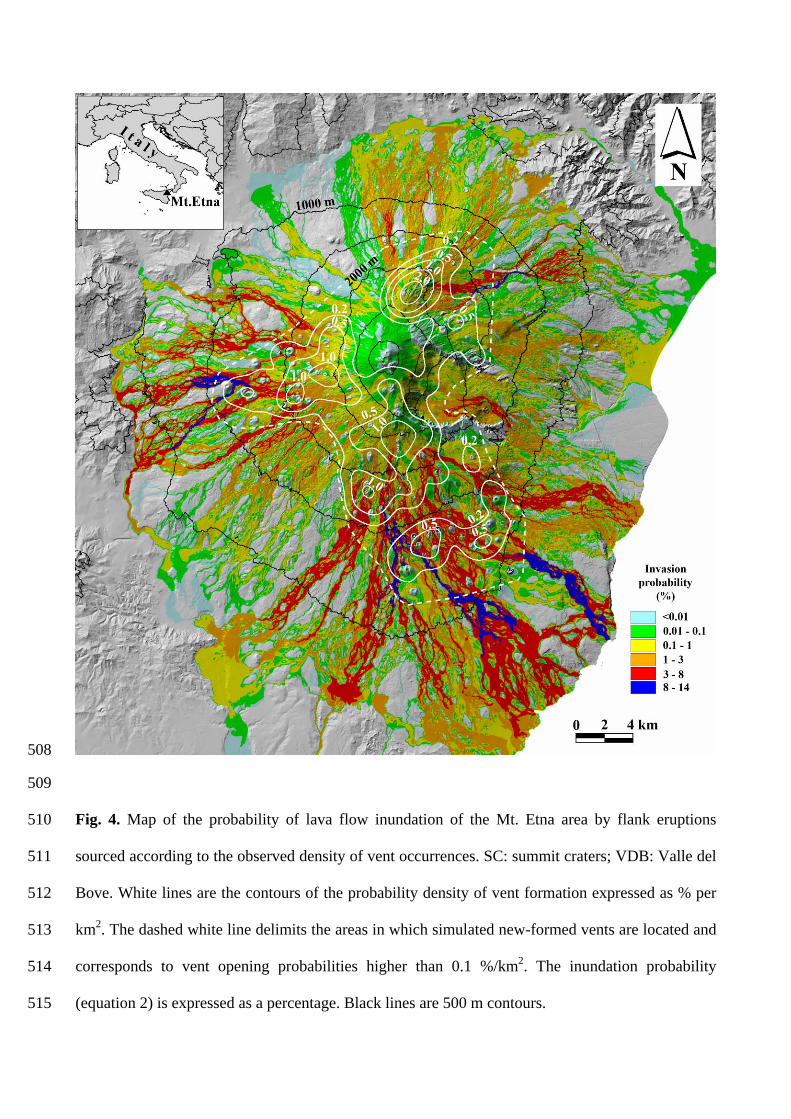
Using the total vent probability distribution as a source region (Fig. 2), the highest inundation
probabilities are in the south-southeastern, western, and northeastern sectors, at elevations below
1500 m above sea level (Fig. 4). The longest lava flows are able to impact Catania and the coastal
areas; these flows originate from source vents located in two main areas, one at an elevation of
about 1500 m and the other at about 800 m. Comparison of Fig. 4 with Fig. 3 in Guest and Murray
[1979] reveals that the main advantage of our approach is that it allows the quantification of hazard
(inundation probability): the Guest and Murray [1979] approach cannot be used to identify regions
most prone to inundation by lava flows, whereas their identification is straightforward in Fig. 4.
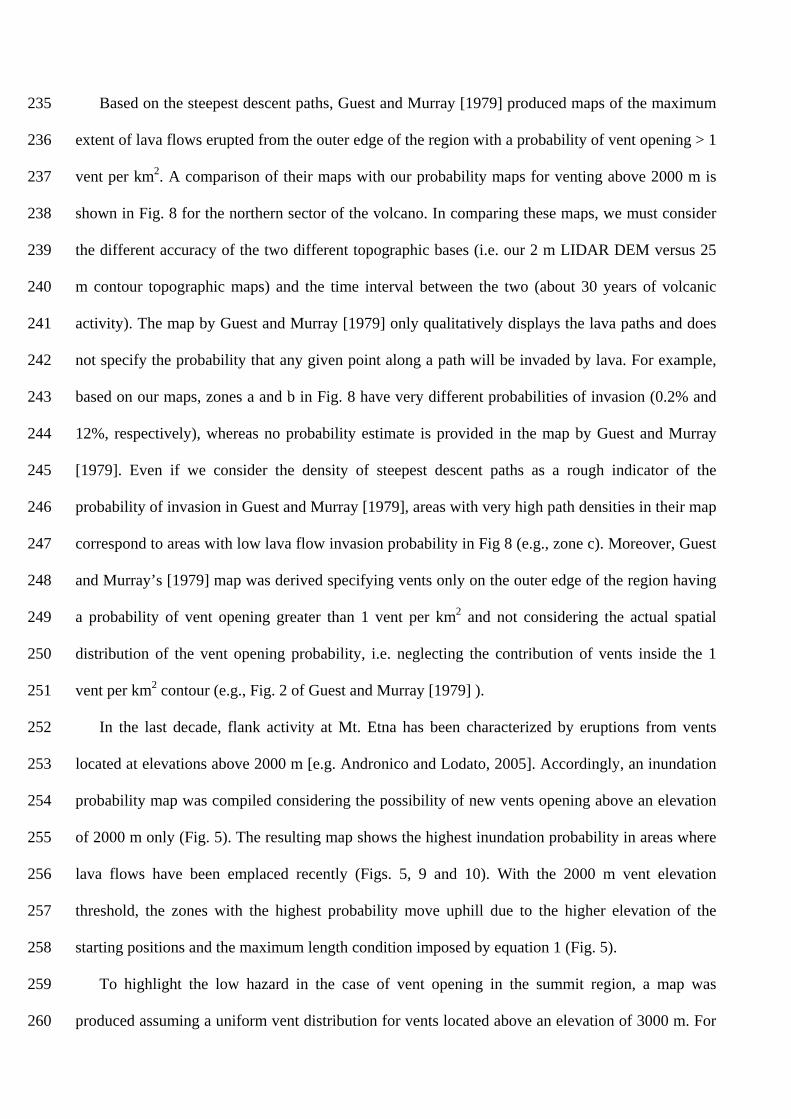
Based on the steepest descent paths, Guest and Murray [1979] produced maps of the maximum
extent of lava flows erupted from the outer edge of the region with a probability of vent opening > 1
vent per km2. A comparison of their maps with our probability maps for venting above 2000 m is
shown in Fig. 8 for the northern sector of the volcano. In comparing these maps, we must consider
the different accuracy of the two different topographic bases (i.e. our 2 m LIDAR DEM versus 25
m contour topographic maps) and the time interval between the two (about 30 years of volcanic
activity). The map by Guest and Murray [1979] only qualitatively displays the lava paths and does
not specify the probability that any given point along a path will be invaded by lava. For example,
based on our maps, zones a and b in Fig. 8 have very different probabilities of invasion (0.2% and
12%, respectively), whereas no probability estimate is provided in the map by Guest and Murray
[1979]. Even if we consider the density of steepest descent paths as a rough indicator of the
probability of invasion in Guest and Murray [1979], areas with very high path densities in their map
correspond to areas with low lava flow invasion probability in Fig 8 (e.g., zone c). Moreover, Guest
and Murray’s [1979] map was derived specifying vents only on the outer edge of the region having
a probability of vent opening greater than 1 vent per km2 and not considering the actual spatial
distribution of the vent opening probability, i.e. neglecting the contribution of vents inside the 1
vent per km2 contour (e.g., Fig. 2 of Guest and Murray [1979] ).
235
236
237
238
239
240
241
242
243
244
245
246
247
248
249
250
251
252
253
254
255
256
257
258
259
260
In the last decade, flank activity at Mt. Etna has been characterized by eruptions from vents
located at elevations above 2000 m [e.g. Andronico and Lodato, 2005]. Accordingly, an inundation
probability map was compiled considering the possibility of new vents opening above an elevation
of 2000 m only (Fig. 5). The resulting map shows the highest inundation probability in areas where
lava flows have been emplaced recently (Figs. 5, 9 and 10). With the 2000 m vent elevation
threshold, the zones with the highest probability move uphill due to the higher elevation of the
starting positions and the maximum length condition imposed by equation 1 (Fig. 5).
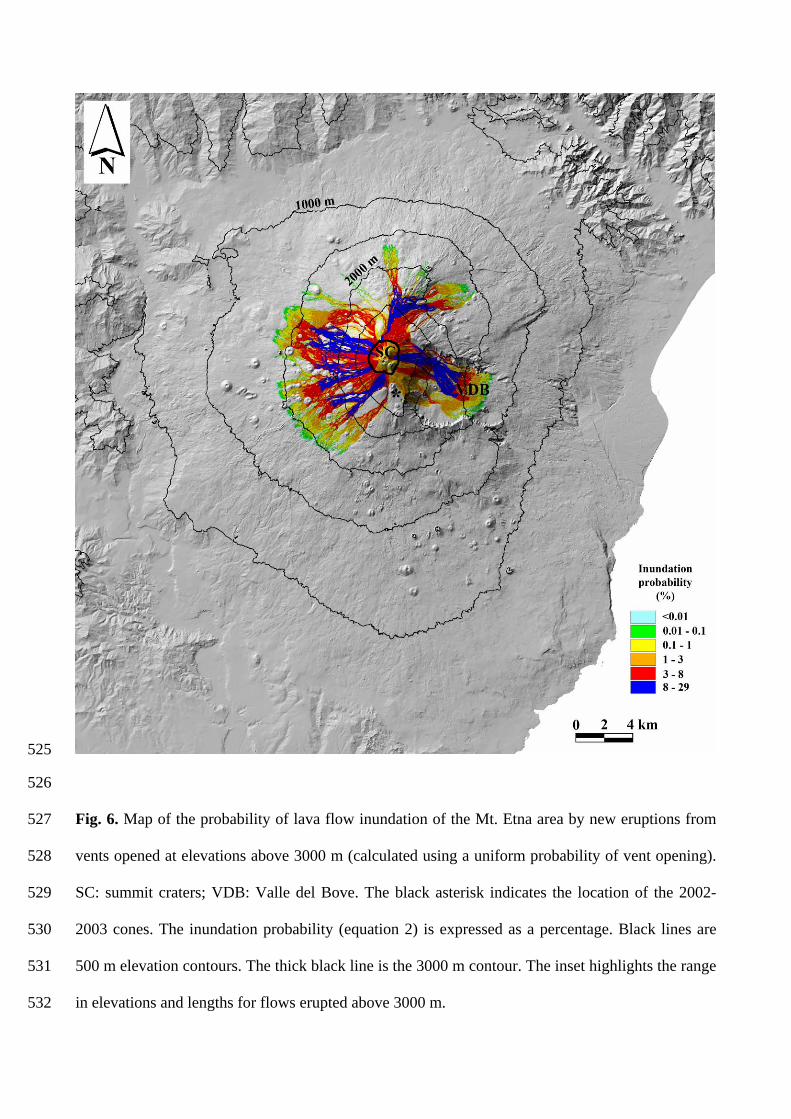
To highlight the low hazard in the case of vent opening in the summit region, a map was
produced assuming a uniform vent distribution for vents located above an elevation of 3000 m. For

eruptions from vents located above 3000 m, the inundation region is limited to a distance of about 7
km from the summit (Fig. 6), extending downhill to an elevation of 1500 m, thereby posing no
threat of lava flow inundation to inhabited areas. The rims of the Valle del Bove (VDB in Fig. 2)
clearly protect portions of the flank from summit eruptions, which are contained within the valley.
Moreover, the 2002-2003 cones and lava field play a role in controlling the path of simulated lava
flows: the newly formed volcanic constructs hinder the southward propagation of simulated lava
flows (Fig. 6).
261
262
263
264
265
266
267
268
269
270
271
272
273
274
275
276
277
278
279
280
281
282
283
284
285
286
Lava flows modify the landscape, generating new morphologies that may or may not hinder the
path of future flows. This process is evident from the fields emplaced during the 2001 and 2002-
2003 Mt. Etna eruptions. In the case of the southern 2001 eruption (Fig. 9), the highest probability
of inundation is mainly attained along a strip parallel to the 2001 flow, and the thick 2001 flow
front has a near-zero probability of inundation because it is now a topographic high. In contrast, the
2002-2003 flow (Fig. 10) was emplaced in a valley with a high probability of inundation, and future
flows will thus pile up on the 2002-2003 flow.
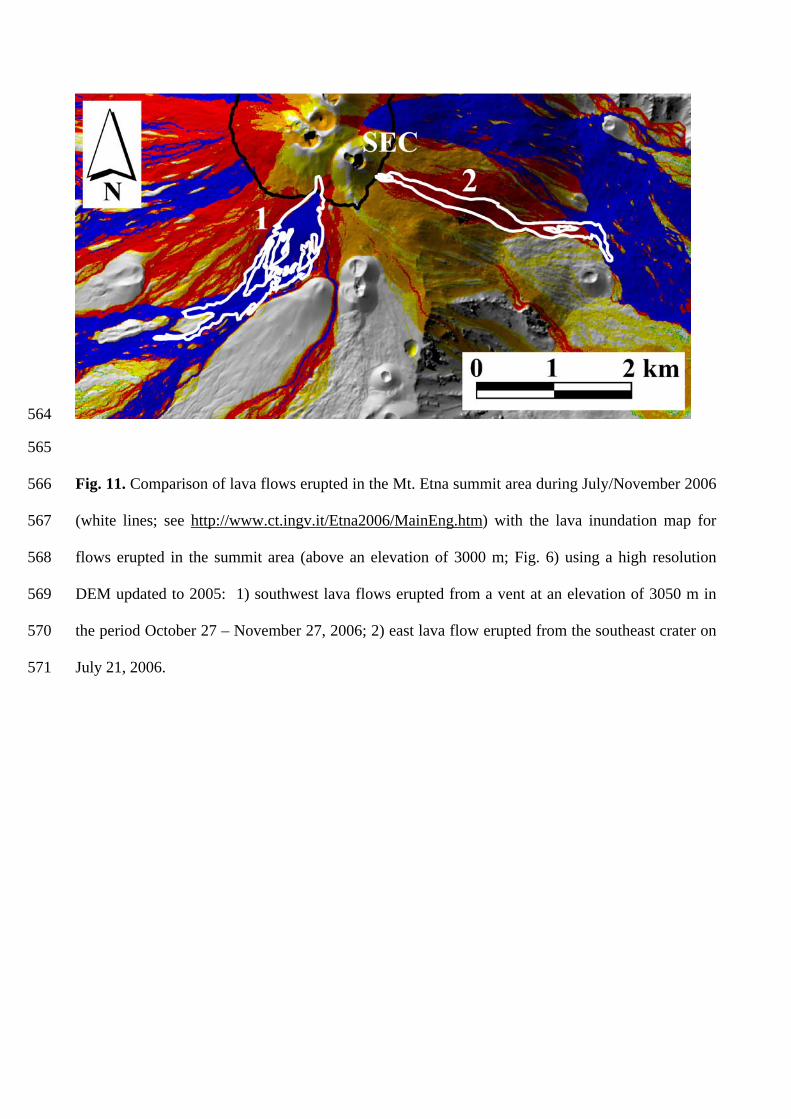
All the presented maps are based on the 2005 topography. During July-November 2006, a new
summit eruption occurred that produced two main lava flows: a southwest flow and an easterly flow
(http://www.ct.ingv.it/Etna2006/Default.htm). We used this eruption to check the accuracy of our
methodology. The probability map of flow inundation for a uniform vent distribution across the
summit zone (i.e. above an elevation of 3000 m) was compared with the actual flows erupted in
2006 (Fig. 11). The use of a uniform vent distribution does not completely account for the actual
vent distribution in the summit zone. For example, it underestimates the relevance of the small area
occupied by the SE Crater (SEC), which has been the principal site of effusive eruptions in the last
few years [Allard et al. 2006]. According to Fig. 6, this frequently inundated region downstream of
the SEC has low inundation probability values. This incongruity relates to the use of a uniform vent
distribution; the inundation probability values depend on the extent of the area where vents may
open: the larger the area, the higher the probability.

The area covered by the southwest lava flow, erupted from a fissure located on the southern
flank of the summit crater (Fig. 11), matches well with the predicted high probability zone in Figs. 6
and 10. The eastern lava flow (Fig. 11) erupted from the base of the SEC covers a medium-
probability (3-8%) zone; at the end of its path it enters the high-probability (8-16%) area supplied
by lava from the entire summit crater.
287
288
289
290
291
292
293
294
295
296
297
298
299
300
301
302
303
304
305
306
307
308
309
310
311
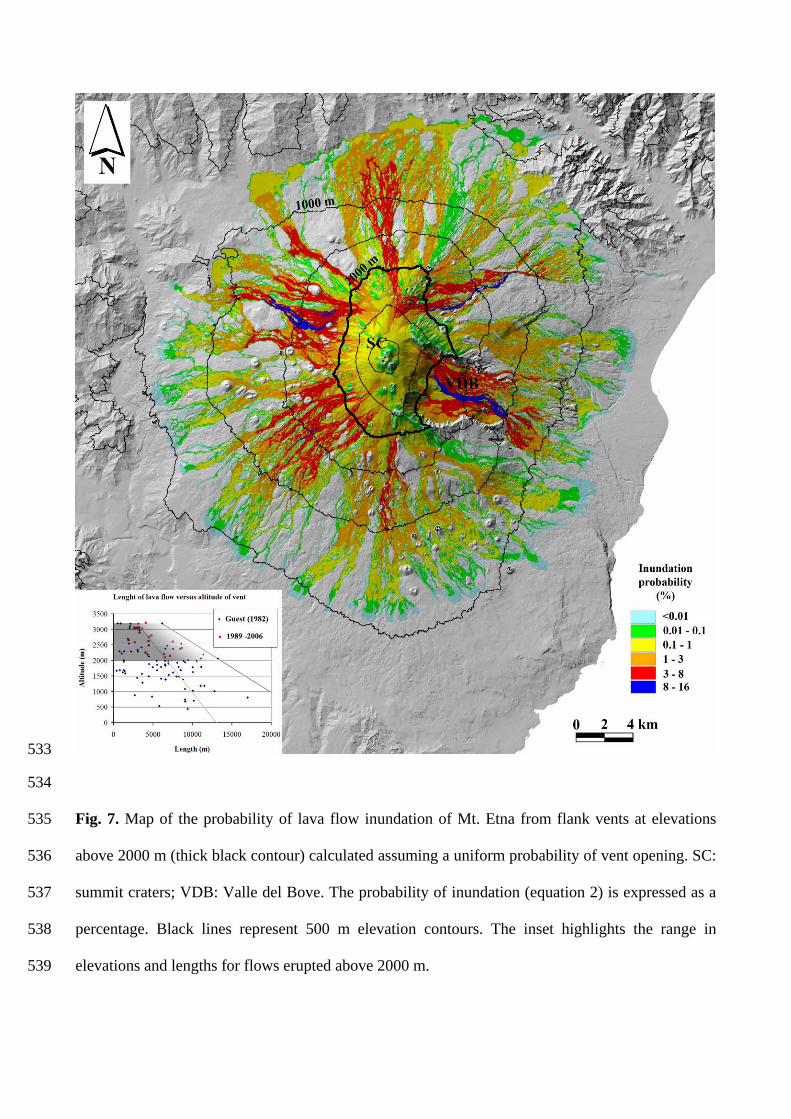
To highlight the importance of vent distribution, a map of the probability of inundation was
produced considering the possible opening of new vents above an elevation of 2000 m only and
assuming a uniform vent distribution (Fig. 7). The overall symmetry of the volcano’s edifice results
in an almost symmetrical distribution of inundation probabilities. Deviations from this general
pattern occur in the principal basins. For example, concavities in the 2000 m contour tend to focus
flow paths towards the center of each concavity, resulting in high inundation probabilities
downslope of such topographic features (Fig. 7). Comparison of the probability maps generated
using non-uniform (Fig. 5) and uniform (Fig. 7) vent distributions and considering the possible
opening of vents above 2000 m only reveals that the non-uniform simulation better accounts for the
effusive activity of the last 10 years. This is evident when comparing the probability maps with the
map of real lava flows at Mt. Etna from 1995 to 2005 (Fig. 1 in Allard et al., [2006]).
These probability maps give the spatial probability of inundation for the opening of a new vent.
We next considered the probability perupt(x,t) that, in a given time interval (t), a given location (x)
would be inundated by lava. To do this, we combined (1) the probability perupt(t) that at least one
eruption would occur during time t with (2) the probability pin(x) that each eruption would inundate
a given location. Figs. 4 to 7 display pin(x) values for each vent distribution scenario considered
herein.
Assuming that eruptions are randomly distributed in time and have an average recurrence
interval (T), following Kauahikaua et al. [1995] we used a Poisson distribution to estimate the
probability that at least one eruption would occur within time t:
( ) ( ) Tt
nnerupt etptp
−+∞
=
−== ∑ 11
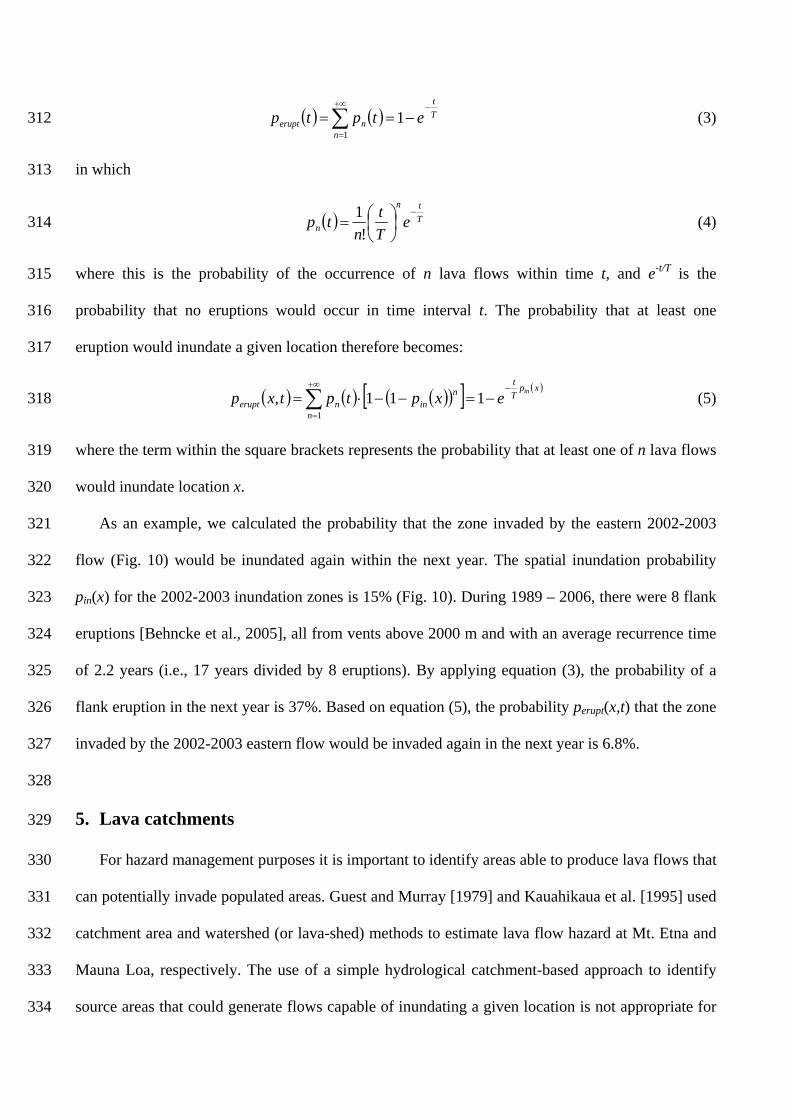
(3) 312
313 in which
( ) Ttn
n eTt
ntp
−⎟⎠⎞
⎜⎝⎛=
!1 (4) 314
315
316
317
where this is the probability of the occurrence of n lava flows within time t, and e-t/T is the
probability that no eruptions would occur in time interval t. The probability that at least one
eruption would inundate a given location therefore becomes:
( ) ( ) ( )( )[ ] ( )xpTt
nin
nnerupt
inexptptxp−+∞
=
−=−−⋅= ∑ 111,1
(5) 318
319
320
321
322
323
324
325
326
327
328
329
330
331
332
333
334
where the term within the square brackets represents the probability that at least one of n lava flows
would inundate location x.
As an example, we calculated the probability that the zone invaded by the eastern 2002-2003
flow (Fig. 10) would be inundated again within the next year. The spatial inundation probability
pin(x) for the 2002-2003 inundation zones is 15% (Fig. 10). During 1989 – 2006, there were 8 flank
eruptions [Behncke et al., 2005], all from vents above 2000 m and with an average recurrence time
of 2.2 years (i.e., 17 years divided by 8 eruptions). By applying equation (3), the probability of a
flank eruption in the next year is 37%. Based on equation (5), the probability perupt(x,t) that the zone
invaded by the 2002-2003 eastern flow would be invaded again in the next year is 6.8%.
5. Lava catchments
For hazard management purposes it is important to identify areas able to produce lava flows that
can potentially invade populated areas. Guest and Murray [1979] and Kauahikaua et al. [1995] used
catchment area and watershed (or lava-shed) methods to estimate lava flow hazard at Mt. Etna and
Mauna Loa, respectively. The use of a simple hydrological catchment-based approach to identify
source areas that could generate flows capable of inundating a given location is not appropriate for
lava flows. Lava flows are generally some meters thick: they can thus spread out and override
obstacles. Lava flows do not necessarily follow the maximum slope path, but can split into different
branches and form complex patterns. DOWNFLOW provides realistic emplacement areas, whereas
a single maximum slope path (which is the basic element in building hydrological catchment areas)
does not account for the actual extent of lava flows, e.g. as in the case of the 2001 south flank lava
flow (Fig. 9).
335
336
337
338
339
340
341
342
343
344
345
346
347
348
349
350
351
352
353
354
355
356
357
358
359
360
Our simulation-derived database allows the identification of all simulated flows that are able to
inundate a selected city, town or village. By identifying those vents from which simulated lava
flows are capable of reaching a given region (e.g., a village), we can create a map of areas posing a
threat to the region (lava catchments).
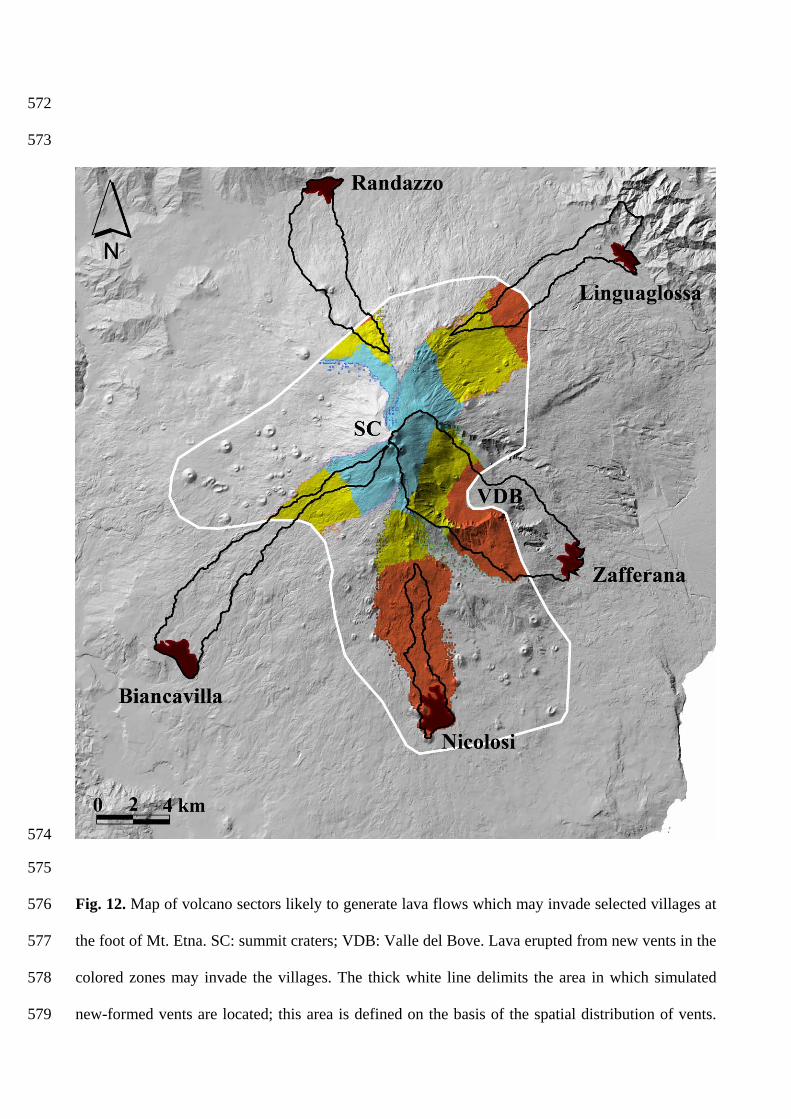
In Fig. 12, selected lava catchments (colored areas) are compared to the corresponding
hydrologically-derived catchments (black lines) for selected villages (brown areas). The computed
lava catchments were divided into three different subregions according to the length of the lava path
required to reach the villages. Catchments areas in Fig. 12 are thus color-coded according to the
three main regions in the elevation-length plot (Fig. 3). The cyan region in Fig. 12 corresponds to
source areas for which the length of the simulated lava flows is always shorter than the distance
between vent and village, i.e. the flow cannot reach the village. The orange region on Fig. 12
produces lava flows that, according to the simulations, are always able to reach the villages. The
yellow region represents source areas in which the probability that the simulated flow would reach
the village is between 0 and 1.
We note that lava-sheds generated by the hydrological approach may account for only minor
portions of those generated by the DOWNFLOW approach. Previous hydrological approaches (e.g.
see Fig. 6 of Guest and Murray, 1979) generally underestimate the hazard by lava flow inundation.
For example, in the case of the town of Nicolosi the hydrologically-derived area is about one
quarter of that obtained using the DOWNFLOW-based approach (Fig. 12).
6. Conclusions 361
362
363
364
365
366
367
368
369
370
371
372
373
374
375
376
377
378
379
380
381
382
383
384
The DOWNFLOW topography-based stochastic model requires very short computational times
and is as effective as more sophisticated physical models in assessing lava flow hazard.
DOWNFLOW does not require the specification of physical quantities such as effusion rates,
temperature, crystallinity, viscosity, yield strength, etc., and does not simulate the time evolution of
single lava flows. It determines, instead, the total area inundated by lava flows, i.e. an essential
parameter for producing hazard maps. Our lava flow hazard maps for Mt. Etna quantitatively define
the probability of inundation by lava flows based on a probabilistic approach dependent on the
topography, probable opening locations, and likely lava flow run-out distances. The reliability of
the proposed method requires the use of updated elevation models of the volcanic area. Simulations
were run on a DEM derived from 2005 LiDAR data. Depending on effusion rates and duration,
eruptions determine the formation of topographic features that may impede or favor inundation by
successive lava flows and our simulations support this.
Different vent opening probability distributions were used to simulate different eruptive
scenarios: (a) an unconstrained vent opening distribution (i.e., vents can open at any elevation); (b)
vent opening above 2000 m; (c) vent opening above 3000 m; and (d) a uniform distribution of vents
opening above 2000 m. Here, (a), (b) and (c) consider a non-uniform vent distribution, whereas (d)
assumes a uniform distribution. Based on the analysis of these maps we come to the following
conclusions:
1) The city of Catania and the coastal zone are only susceptible to inundation from flows originating
from low altitude vents (below 1500 m).
2) Flank eruptions above 2000 m preferentially inundate the northeast and southern sectors of the
volcano, as well as the Valle del Bove.
3) Eruptions in the summit area (above 3000 m) pose no threat to populated areas.
4) Simple hydrological approaches based on static topography are inappropriate when dealing with
Etnean lava flows. They tend to produce a single, overly simplified path, whereas DOWNFLOW is
calibrated to simulate the full complexity of lava flow spreading.
385
386
387
388
389
390
391
392
393
394
395
396
The inundation probability maps provide detailed spatial distributions of the possible lava flow
paths and are useful tools in long-term planning and decision-making for mitigation of lava flow
inundation hazard. This is a particularly important issue in the case of Mt. Etna because of its high
population density and the frequency of eruptions.
Acknowledgments. This work was funded by “Progetto INGV-DPC 2005-2006 – Vulcanologia -
Subproject - V3_6 – Etna – UR-31”, scientific coordinator M.T. Pareschi.
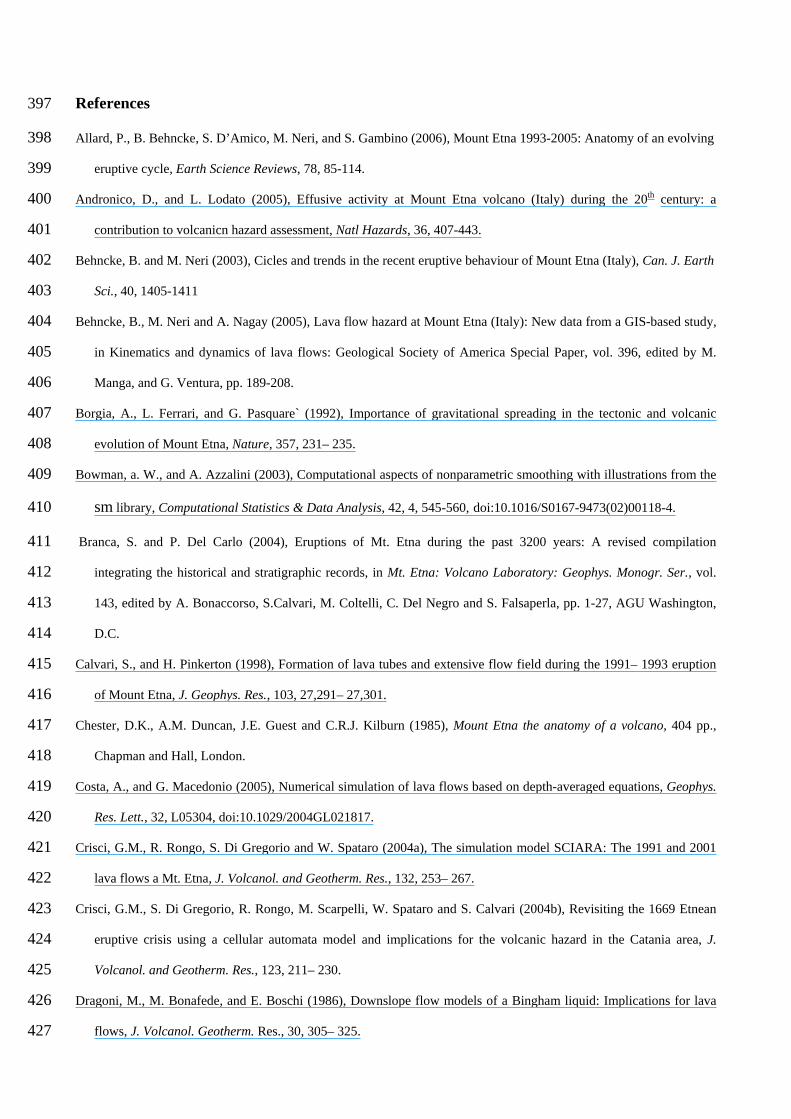
References 397
398
399
400
401
402
403
404
405
406
407
408
409
410
411
412
413
414
415
416
417
418
419
420
421
422
423
424
425
426
427
Allard, P., B. Behncke, S. D’Amico, M. Neri, and S. Gambino (2006), Mount Etna 1993-2005: Anatomy of an evolving
eruptive cycle, Earth Science Reviews, 78, 85-114.
Andronico, D., and L. Lodato (2005), Effusive activity at Mount Etna volcano (Italy) during the 20th century: a
contribution to volcanicn hazard assessment, Natl Hazards, 36, 407-443.
Behncke, B. and M. Neri (2003), Cicles and trends in the recent eruptive behaviour of Mount Etna (Italy), Can. J. Earth
Sci., 40, 1405-1411
Behncke, B., M. Neri and A. Nagay (2005), Lava flow hazard at Mount Etna (Italy): New data from a GIS-based study,
in Kinematics and dynamics of lava flows: Geological Society of America Special Paper, vol. 396, edited by M.
Manga, and G. Ventura, pp. 189-208.
Borgia, A., L. Ferrari, and G. Pasquare` (1992), Importance of gravitational spreading in the tectonic and volcanic
evolution of Mount Etna, Nature, 357, 231– 235.
Bowman, a. W., and A. Azzalini (2003), Computational aspects of nonparametric smoothing with illustrations from the
sm library, Computational Statistics & Data Analysis, 42, 4, 545-560, doi:10.1016/S0167-9473(02)00118-4.
Branca, S. and P. Del Carlo (2004), Eruptions of Mt. Etna during the past 3200 years: A revised compilation
integrating the historical and stratigraphic records, in Mt. Etna: Volcano Laboratory: Geophys. Monogr. Ser., vol.
143, edited by A. Bonaccorso, S.Calvari, M. Coltelli, C. Del Negro and S. Falsaperla, pp. 1-27, AGU Washington,
D.C.
Calvari, S., and H. Pinkerton (1998), Formation of lava tubes and extensive flow field during the 1991– 1993 eruption
of Mount Etna, J. Geophys. Res., 103, 27,291– 27,301.
Chester, D.K., A.M. Duncan, J.E. Guest and C.R.J. Kilburn (1985), Mount Etna the anatomy of a volcano, 404 pp.,
Chapman and Hall, London.
Costa, A., and G. Macedonio (2005), Numerical simulation of lava flows based on depth-averaged equations, Geophys.
Res. Lett., 32, L05304, doi:10.1029/2004GL021817.
Crisci, G.M., R. Rongo, S. Di Gregorio and W. Spataro (2004a), The simulation model SCIARA: The 1991 and 2001
lava flows a Mt. Etna, J. Volcanol. and Geotherm. Res., 132, 253– 267.
Crisci, G.M., S. Di Gregorio, R. Rongo, M. Scarpelli, W. Spataro and S. Calvari (2004b), Revisiting the 1669 Etnean
eruptive crisis using a cellular automata model and implications for the volcanic hazard in the Catania area, J.
Volcanol. and Geotherm. Res., 123, 211– 230.
Dragoni, M., M. Bonafede, and E. Boschi (1986), Downslope flow models of a Bingham liquid: Implications for lava
flows, J. Volcanol. Geotherm. Res., 30, 305– 325.

Favalli, M., and M.T. Pareschi (2004), Digital elevation model construction from structured topographic data: The
DEST algorithm, J. Geophys. Res., 109, F04004, doi:10.1029/2004JF000150.
428
429
430
431
432
433
434
435
436
437
438
439
440
441
442
443
444
445
446
447
448
449
450
451
452
453
454
455
456
Favalli, M., M.T. Pareschi, A. Neri and I. Isola (2005), Forecasting lava flow paths by a stochastic approach, Geophys.
Res. Lett., 32, L03305, doi:10.1029/2004GL021718.
Favalli, M., G.D. Chirico, P. Papale, M.T. Pareschi, M. Coltelli, N. Lucaya and E. Boschi (2006), Computer simulations
of lava flow paths in the town of Goma, Nyiragongo volcano, Democratic Republic of Congo, J. Geophys. Res.,
111, B06202, doi:10.1029/2004JB003527.
Favalli, M., G.D. Chirico, P. Papale, M.T. Pareschi and E. Boschi (2008) Lava flow hazard at Nyiragongo volcano,
D.R.C. 1. Model calibration and hazard mapping. Bull Volcanol, DOI 10.1007/s00445-008-0233-y.
Guest, J.E., and J.B. Murray (1979), An analysis of hazard from Mount Etna volcano, Journal of the Geological Society
of London, 136, 347-354.
Guest, J. E., (1982), Styles of eruption and flow morphology on Mount Etna, in Romano, R., ed., Mt. Etna Volcano: A
Review of the Recent Earth Science Studies, Memorie della Società Geologica Italiana, 23, 49– 73.
Harris, A.J.L., and S.K. Rowland (2001), FLOWGO: A kinematic thermo-rheological model for lava flowing in a
channel, Bull. Volcanol., 63, 20-44, doi:10.1007/s004450000120.
Harris, A.J.L., J.B. Murray, S.E. Aries, M.A. Davies, L.P. Flynn, M.J. Wooster, R. Wright and D.A. Rothery (2000),
Effusion rate trends at Etna and Krafla and their implications for eruptive mechanisms, J. Volcanol. Geotherm. Res.
102, 237–270
Harris, A., M. Favalli, F. Mazzarini, and M. T. Pareschi (2007), Best-fit results from application of a thermo-rheological
model for channelized lava flow to high spatial resolution morphological data, Geophys. Res. Lett., 34, L01301,
doi:10.1029/2006GL028126.
Kauahikaua, J., S. Margriter, J. Lockwood and F. Trusdell (1995), Applications of GIS to the estimation of lava flow
hazard on Mauna Loa Volcano, Hawai’I, AGU Geophys Monogr, 92, 315-125.
Kieffer, G., (1975), Sur l’existence d’une “riftzone” à l’Etna, Comptes Rendus de l’Académie des Sciences Paris, ser.
D, 280, 263-266.
Lopes, R., and J.E. Guest (1982), Lava flows on Etna, a morphometric study, in: The Comparative Study of Planets,
D.Reidel, Holland.
Mazzarini, F., and P. Armienti (2001), Flank cones at Mount Etna volcano; Do they have a power-law distribution, Bull.
Volcanol., 62, 420-430.

Mazzarini, F., M. T. Pareschi, M. Favalli, I. Isola, S. Tarquini, and E. Boschi (2005), Morphology of basaltic lava
channels during the Mt. Etna September 2004 eruption from airborne laser altimeter data, Geophys. Res. Lett., 32,
L04305, doi:10.1029/2004GL021815.
457
458
459
460
461
462
463
464
465
466
467
468
469
470
471
472
473
474
475
476
477
478
479
480
Mazzarini, F., M. T. Pareschi, M. Favalli, I. Isola, S. Tarquini, and E. Boschi (2007), Lava flow identification and aging
by means of lidar intensity: Mount Etna case, J. Geophys. Res., 112, B02201, doi:10.1029/2005JB004166.
Mulargia, F., S Tinti and E. Boschi (1985), A Statistical-Analysis of Flank Eruptions on Etna Volcano, J. Volcanol.
Geotherm. Res., 23 (3-4), .
Neri, M., and V. Acocella (2006), The 2004-2005 Etna eruption: Implications for flank deformation and structural
behaviour of the volcano, J. Volcanol. and Geotherm. Res., 158, 195-206.
Romano, R., and C. Sturiale (1982), The historical eruptions of Mt. Etna (Volcanological data), Memorie della Società
Geologica Italiana, 23, 75-97.
Rowland, S.K., H. Garbeil and A.J.L. Harris (2005), Lengths and hazards from channel-fed lava flows on Mauna Loa,
Hawai’I, determined from thermal and downslope modeling with FLOWGO, Bull Volcanol, 67, 634-647,
doi:10.1007/s00445-004-0399-x.
Tarquini, S., I. Isola, M. Favalli, F. Mazzarini, M. Bisson, M. T. Pareschi and E. Boschi (2007),TINITALY/01: a new
Triangular Irregular Network of Italy, Annals of Geophysics, 50, 3, in press.
Trusdell, F.A .,(1995) Lava flow hazards and risk assessment on Mauna Loa Volcano, Hawai‘I, AGU Geophys Monogr
92, 327–336
Ventura, G., and G. Vilardo (2007), Emplacement mechanism of gravity flows inferred from high resolution Lidar data:
The 1944 Somma–Vesuvius lava flow (Italy), Geomorphology, doi:10.1016/j.geomorph.2007.06.005
Wadge, G., (1981), The variation of magma discharge during basaltic eruptions. J. Volcanol. Geotherm. Res. ,11, 139–
168.
Wadge, G., P.A.V. Young and I..J. McKendrick (1994), Mapping lava flow hazard using computer simulation, J.
Geophys. Res., 99, 489– 504.

Table 1. ALTM 3033 (Optech®) laser altimeter characteristics. 481
482
Operating scan frequency 33 kHz up to 40 kHz
Operating altitude 80 to 3500 m
Maximum scan angle ± 40°
Horizontal accuracy 1/2000 x altitude at 1 sigma
Elevation accuracy ± 15 cm at 1.2 km and ± 35 cm at 3000 m at 1 sigma
Operating wavelength 1.064 μm
483
484
485
486
487
Table 2. RMS vertical error and measure (μ) of the agreement between simulated and actual lava
flows for various grid steps in the case of the 2001 southern lava flow.
Grid step (m)
RMS vertical error (m) μ
10 1.43 0.52 20 1.59 0.53 30 1.74 0.52 40 1.97 0.51 50 2.22 0.46 60 2.53 0.49 70 2.84 0.44 80 3.13 0.51 90 3.37 0.48 100 3.68 0.42 110 4.03 0.33 120 4.23 0.26

Figure Captions 488
489
490
491
492
493
494
495
Fig. 1. Plot of the vent spacing distribution. The thick black line is the frequency distribution of
vent spacing. The 80 m threshold used to locate new vents is represented as a thick vertical grey
line. The dashed line is the smoothing Gaussian kernel used to derive the vent opening probability
distribution.

496
497
498
499
Fig. 2. Map of the vent opening probability used in equation 2 (see text) to estimate the probability
(PVi) of vent formation at location i.

500
501
502
503
504
505
506
507
Fig. 3. Plot of lava flow length (L) vs. vent elevation (hv) for Mt. Etna (black diamonds after Guest,
1982). The orange color in the plot represents the zone in which the flow length is ≤ 0.5Ll , where Ll
is derived from equation 1 in the main text. In the yellow zone the length of flows is in the 0.5Ll < L
< Ll range. The cyan color represents zones in which the flow length is ≥ Ll. Red squares in the plot
are derived from new digital elevation models of the volcano and from data in Behncke et al.
(2005), Allard et al., (2006) and Neri and Acocella (2006).
508
509
510
511
512
513
514
515
Fig. 4. Map of the probability of lava flow inundation of the Mt. Etna area by flank eruptions
sourced according to the observed density of vent occurrences. SC: summit craters; VDB: Valle del
Bove. White lines are the contours of the probability density of vent formation expressed as % per
km2. The dashed white line delimits the areas in which simulated new-formed vents are located and
corresponds to vent opening probabilities higher than 0.1 %/km2. The inundation probability
(equation 2) is expressed as a percentage. Black lines are 500 m contours.

516
517
518
519
520
521
522
Fig. 5. Map of the probability of lava flow inundation of Mt. Etna from flank vents at elevations
above 2000 m (thick black contour). SC: summit craters; VDB: Valle del Bove. White lines are the
contours of the probability density of vent formation expressed as % per km2. The probability of
inundation (equation 2) is expressed as a percentage. Black lines represent 500 m elevation

contours. Lower left inset is the plot length vs. altitude of vents; the grey zone represents the
elevations and lengths of vents used to create this map.
523
524
525
526
527
528
529
530
531
532
Fig. 6. Map of the probability of lava flow inundation of the Mt. Etna area by new eruptions from
vents opened at elevations above 3000 m (calculated using a uniform probability of vent opening).
SC: summit craters; VDB: Valle del Bove. The black asterisk indicates the location of the 2002-
2003 cones. The inundation probability (equation 2) is expressed as a percentage. Black lines are
500 m elevation contours. The thick black line is the 3000 m contour. The inset highlights the range
in elevations and lengths for flows erupted above 3000 m.
533
534
535
536
537
538
539
Fig. 7. Map of the probability of lava flow inundation of Mt. Etna from flank vents at elevations
above 2000 m (thick black contour) calculated assuming a uniform probability of vent opening. SC:
summit craters; VDB: Valle del Bove. The probability of inundation (equation 2) is expressed as a
percentage. Black lines represent 500 m elevation contours. The inset highlights the range in
elevations and lengths for flows erupted above 2000 m.

540
541
542
543
544
545
Fig. 8. Comparison between the map of the probability of lava flow inundation of the northern flank
of Mt. Etna from flank vents at elevations above 2000 m (Fig. 5) and the possible maximum extent
of lava flows (white lines) erupted from the outer edge (black line) of the region with a vent
opening probability greater than 1 vent per km2 (from Fig. 3 of Guest and Murray [1979]).

546
547
548
549
550
551
552
553
554
Fig. 9. Effect of the 2001 flow along the southern flank of Mt. Etna (white line; Behncke et al.,
2005; Allard et al., 2006) on the map of the probability of lava flow inundation of Mt. Etna (see Fig.
5). The dashed white line is the maximum slope path computed on the 1998 DEM [Tarquini et al.,
2007] prior to the emplacement of the 2001 flow. Blue hues represent a high probability of
inundation, pale green hues a low probability of inundation (see legend in Fig. 5). The highest
probability of inundation occurs along a nearly N-S strip parallel to the 2001 flow. The 2001 flow
has zones which may be invaded and others (e.g. its front) that have a very low to zero probability
of inundation.

555
556
557
558
559
560
561
562
563
Fig. 10. Effect of the 2002-2003 flow in the northeastern sector of the volcano (white line; Behncke
et al., 2005; Allard et al., 2006) on the map of the probability of lava flow inundation of Mt. Etna
(see Fig. 5). Blue hues represent a high probability of inundation, pale green hues a low probability
of inundation (see legend in Fig. 5). The nearly E-W trending valley, along which the main portion
of the 2002-2003 lava flow was emplaced, corresponds to zones with high probabilities of
inundation, indicating that future lava flows will likely invade these areas. Other portions, such as
the NE-trending branch, show low to very low probabilities of inundation.
564
565
566
Fig. 11. Comparison of lava flows erupted in the Mt. Etna summit area during July/November 2006
(white lines; see http://www.ct.ingv.it/Etna2006/MainEng.htm) with the lava inundation map for
flows erupted in the summit area (above an elevation of 3000 m; Fig. 6) using a high resolution
DEM updated to 2005: 1) southwest lava flows erupted from a vent at an elevation of 3050 m in
the period October 27 – November 27, 2006; 2) east lava flow erupted from the southeast crater on
July 21, 2006.
567
568
569
570
571
572
573
574
575
576
577
578
579
Fig. 12. Map of volcano sectors likely to generate lava flows which may invade selected villages at
the foot of Mt. Etna. SC: summit craters; VDB: Valle del Bove. Lava erupted from new vents in the
colored zones may invade the villages. The thick white line delimits the area in which simulated
new-formed vents are located; this area is defined on the basis of the spatial distribution of vents.

Black lines are the hydrological catchment areas for each village. The color code of the lava
catchment subdivision refers to that used in figure 3: orange hues represent zones in which the
distance between the village and the vents is ≤ 0.5Ll; yellow hues are zones in which the distance
between the village and the vents is 0.5Ll < Lij < Ll; cyan hues represent zones in which the distance
between the village and the vents is ≥ Ll. According to the adopted model, lava flows from vents in
the cyan zones cannot reach the villages.
580
581
582
583
584
585
586