Separating the thermal fingerprints of lava flows and simultaneous lava fountaining using...
6
Separating the thermal fingerprints of lava flows and simultaneous lava fountaining using ground-based thermal camera and SEVIRI measurements Gaetana Ganci, 1 Mike R. James, 2 Sonia Calvari, 1 and Ciro Del Negro 1 Received 1 August 2013; revised 19 September 2013; accepted 20 September 2013. [1] During effusive eruptions, thermal satellite monitoring has proved well suited to map the thermal flux from lava flows. However, during lava fountaining events, thermal contributions from active flows and from the fountain itself cannot be separated in low resolution satellite data. Here using photogrammetry and atmospheric modeling techniques, we compare radiance estimates from long-range ground-based thermal camera data (from which the fountain can be excluded) with those from SEVIRI satellite images for a fountaining event at Mount Etna (12 August 2011). The radiant heat flux determined from the ground-based camera showed similar behavior to values retrieved from Spinning Enhanced Visible and Infrared Imager (SEVIRI); thus the SEVIRI signal is interpreted to be dominated by the lava flows, with minimal contribution from the fountain. Furthermore, by modeling the cooling phase of each pixel inundated by lava, the mean thickness and lava volume (~2.4 × 10 6 m 3 ) derived from camera images are comparable with those calculated from SEVIRI (~2.8 × 10 6 m 3 ). Citation: Ganci, G., M. R. James, S. Calvari, and C. D. Negro (2013), Separating the thermal fingerprints of lava flows and simultaneous lava fountaining using ground-based thermal camera and SEVIRI measurements, Geophys. Res. Lett., 40, doi:10.1002/ grl.50983. 1. Introduction [2] At Mount Etna, Sicily, paroxysmal eruptions are gener- ally characterized by increasing strombolian explosions, evolving to lava fountaining, sustained eruptive column, ash plume, and erupting lava flows. These lava fountain episodes typically only last a few hours, on rare occasions persist for more than a few days, and produce volumetrically small lava flows. Nevertheless, the ever-expanding use of areas near volcanoes increases the potential impact of these paroxysmal events, which could potentially produce sufficiently long lava flows to inundate vulnerable areas and to pose a threat to people and property [Ganci et al., 2012b; Cappello et al., 2013]. Therefore, these short-duration eruptive episodes require effective tools for monitoring their spatiotemporal evolution in order to make timely predictions of the areas likely to be inundated by lava flows. However, in most situations, measurements, especially regular measurements, of areas covered by the lava flows are difficult-to-impossible due to safety and logistical reasons. For example, during the early phases of a paroxysm, lava flows spread at high velocities, and explosions, fountaining, and lava spattering may occur, making close approach to the master vent hazardous and conditions for measurements unsafe. Given the hazard posed by abrupt and violent activity, the use of remote monitoring through fixed cameras and satellites has been increasing, particularly with thermal sensors [Wolff and Sumner, 2000; Calvari et al., 2011; Bonaccorso et al., 2011, 2013; Ramsey and Harris, 2013]. [3] Recent advances have been enabled through the use of frequent (every 15 min) mid- and thermal-infrared data from the Spinning Enhanced Visible and Infrared Imager (SEVIRI) [Aksakal, 2013; Ganci et al., 2011a], aboard the geostationary satellite Meteosat Second Generation (MSG), from which the detection of volcanic hot spots (thermal anom- alies that possibly relate to dynamic volcanic processes) and the construction of radiant heat flux time series during such short-lived explosive and effusive events can be determined [Vicari et al., 2011]. SEVIRI time series can also be used to yield volume and intensity of short-lived events, with the geostationary orbit meaning that data are always available for the targeted location [Ganci et al., 2012a; Hirn et al. 2008]. However, the low spatial resolution (~3 km at nadir) of such satellite data means that thermal contributions from different styles of simultaneous activity cannot be separated. In particular, the lava flow thermal signature could not be correctly extracted resulting in potential error when applying models to estimate maximum flow lengths [Wright et al., 2008; Vicari et al., 2011; Ganci et al. 2012a]. The additional consideration of higher spatial resolution, oblique, ground-based thermal data, that allow signatures from different volcanic processes to be isolated, offers a potential solution to this problem and can be used as an independent measurement for validation of satellite data analyses [Coppola et al., 2010]. Furthermore, ground-based thermal cameras are less prone to saturation and their higher spatiotemporal resolution data can also provide valuable information on the dynamics of flow emplacement. However, frequent and regular data are typically sourced from permanently installed monitoring instruments which can be at substantial distances from the activity. Consequently, for quantitative analyses of such data, significant atmospheric path length corrections must be applied. [4] Here, by developing a new technique to process long range ground-based thermal data, we compare simultaneous ground- and space-based thermal data from a lava fountain Additional supporting information may be found in the online version of this article. 1 Istituto Nazionale di Geofisica e Vulcanologia, Catania, Italy. 2 Lancaster Environment Centre, Lancaster University, Lancaster, UK. Corresponding author: C. Del Negro, Istituto Nazionale di Geofisica e Vulcanologia, Piazza Roma 2, Sezione di Catania, 95125, Italy. ([email protected]) ©2013. American Geophysical Union. All Rights Reserved. 0094-8276/13/10.1002/grl.50983 1 GEOPHYSICAL RESEARCH LETTERS, VOL. 40, 1–6, doi:10.1002/grl.50983, 2013
Transcript of Separating the thermal fingerprints of lava flows and simultaneous lava fountaining using...

Separating the thermal fingerprints of lava flows and simultaneouslava fountaining using ground-based thermal cameraand SEVIRI measurements
Gaetana Ganci,1 Mike R. James,2 Sonia Calvari,1 and Ciro Del Negro1
Received 1 August 2013; revised 19 September 2013; accepted 20 September 2013.
[1] During effusive eruptions, thermal satellite monitoringhas proved well suited to map the thermal flux from lavaflows. However, during lava fountaining events, thermalcontributions from active flows and from the fountainitself cannot be separated in low resolution satellite data.Here using photogrammetry and atmospheric modelingtechniques, we compare radiance estimates from long-rangeground-based thermal camera data (from which the fountaincan be excluded) with those from SEVIRI satellite imagesfor a fountaining event at Mount Etna (12 August 2011).The radiant heat flux determined from the ground-basedcamera showed similar behavior to values retrieved fromSpinning Enhanced Visible and Infrared Imager (SEVIRI);thus the SEVIRI signal is interpreted to be dominated by thelava flows, with minimal contribution from the fountain.Furthermore, by modeling the cooling phase of each pixelinundated by lava, the mean thickness and lava volume(~2.4× 10⁶ m3) derived from camera images are comparablewith those calculated from SEVIRI (~2.8 × 10⁶ m3).Citation: Ganci, G., M. R. James, S. Calvari, and C. D. Negro(2013), Separating the thermal fingerprints of lava flows andsimultaneous lava fountaining using ground-based thermal cameraand SEVIRI measurements, Geophys. Res. Lett., 40, doi:10.1002/grl.50983.
1. Introduction
[2] At Mount Etna, Sicily, paroxysmal eruptions are gener-ally characterized by increasing strombolian explosions,evolving to lava fountaining, sustained eruptive column, ashplume, and erupting lava flows. These lava fountain episodestypically only last a few hours, on rare occasions persist formore than a few days, and produce volumetrically small lavaflows. Nevertheless, the ever-expanding use of areas nearvolcanoes increases the potential impact of these paroxysmalevents, which could potentially produce sufficiently long lavaflows to inundate vulnerable areas and to pose a threat to peopleand property [Ganci et al., 2012b; Cappello et al., 2013].Therefore, these short-duration eruptive episodes requireeffective tools for monitoring their spatiotemporal evolution
in order to make timely predictions of the areas likely tobe inundated by lava flows. However, in most situations,measurements, especially regular measurements, of areascovered by the lava flows are difficult-to-impossible due tosafety and logistical reasons. For example, during the earlyphases of a paroxysm, lava flows spread at high velocities,and explosions, fountaining, and lava spattering may occur,making close approach to the master vent hazardous andconditions for measurements unsafe. Given the hazard posedby abrupt and violent activity, the use of remote monitoringthrough fixed cameras and satellites has been increasing,particularly with thermal sensors [Wolff and Sumner, 2000;Calvari et al., 2011; Bonaccorso et al., 2011, 2013; Ramseyand Harris, 2013].[3] Recent advances have been enabled through the use
of frequent (every 15 min) mid- and thermal-infrared datafrom the Spinning Enhanced Visible and Infrared Imager(SEVIRI) [Aksakal, 2013; Ganci et al., 2011a], aboard thegeostationary satellite Meteosat Second Generation (MSG),from which the detection of volcanic hot spots (thermal anom-alies that possibly relate to dynamic volcanic processes) andthe construction of radiant heat flux time series during suchshort-lived explosive and effusive events can be determined[Vicari et al., 2011]. SEVIRI time series can also be used toyield volume and intensity of short-lived events, with thegeostationary orbit meaning that data are always available forthe targeted location [Ganci et al., 2012a; Hirn et al. 2008].However, the low spatial resolution (~3 km at nadir) of suchsatellite data means that thermal contributions from differentstyles of simultaneous activity cannot be separated. In particular,the lava flow thermal signature could not be correctly extractedresulting in potential error when applying models to estimatemaximum flow lengths [Wright et al., 2008; Vicari et al.,2011; Ganci et al. 2012a]. The additional consideration ofhigher spatial resolution, oblique, ground-based thermal data,that allow signatures from different volcanic processes to beisolated, offers a potential solution to this problem and canbe used as an independent measurement for validation ofsatellite data analyses [Coppola et al., 2010]. Furthermore,ground-based thermal cameras are less prone to saturationand their higher spatiotemporal resolution data can also providevaluable information on the dynamics of flow emplacement.However, frequent and regular data are typically sourced frompermanently installed monitoring instruments which can beat substantial distances from the activity. Consequently, forquantitative analyses of such data, significant atmosphericpath length corrections must be applied.[4] Here, by developing a new technique to process long
range ground-based thermal data, we compare simultaneousground- and space-based thermal data from a lava fountain
Additional supporting information may be found in the online version ofthis article.
1Istituto Nazionale di Geofisica e Vulcanologia, Catania, Italy.2Lancaster Environment Centre, Lancaster University, Lancaster, UK.
Corresponding author: C. Del Negro, Istituto Nazionale di Geofisicae Vulcanologia, Piazza Roma 2, Sezione di Catania, 95125, Italy.([email protected])
©2013. American Geophysical Union. All Rights Reserved.0094-8276/13/10.1002/grl.50983
1
GEOPHYSICAL RESEARCH LETTERS, VOL. 40, 1–6, doi:10.1002/grl.50983, 2013
event and concurrent lava flow emplacement at Mount Etna,Sicily (12 August 2011). Extending the method of Jameset al. [2006, 2007], the technique combines a photogrammetricapproach (to account for the strongly oblique viewing anglestypical of ground-based thermal data) with atmosphericmodeling, to provide georeferenced information on lava flowextent, temperature distribution, and the associated radiant heatflux. The high resolution ground-based data thus enable thethermal fingerprint of the lava flow emplacement to be charac-terized in isolation from the fountain, and the interpretation ofSEVIRI retrievals to be independently assessed.[5] Hence, our aims here are to demonstrate “ground control”
for SEVIRI data analysis of short-duration paroxysmalevents as well as to identify how temporal changes in theSEVIRI- and ground-based temperature measurements relateto dynamic volcanic processes. Ground- and satellite-basedthermal data have already been used together for monitoringof volcanic eruptions [Harris et al., 2005; Calvari et al.,2010; Coppola et al., 2010], but this is the first time in whichthe evolution of a short-lived eruptive event has been observedwith such high detail and optimum weather conditions, thata comprehensive and thorough comparison of differenttechniques has been possible.
2. The 12 August 2011 Eruption, Mount Etna
[6] Recent eruptive activity at Mount Etna has beendominated by frequent (38 episodes between 2011 and 2013,at the time of writing), short-duration paroxysmal events(typically lasting a few hours), associated with fast-movinglava flows, occurring from the new vent (New SEC) thatgrew during 2011 on the east flank of the SE Crater[Bonaccorso et al., 2013]. The event of 12 August was thetenth and strongest episode of the 18 that occurred in2011 [Ganci et al., 2012a], with a total duration of ~33 h,comprising an initial period of strombolian activity (~27.0 h),followed by a lava fountain phase (~2.5 h), and associated lavaflows (~6.0 h). The flows spread within the Valle del Bove, alarge depression in the east flank of Etna, as in the case ofalmost all the eruptive events during 2011–2013. Throughoutthe 12 August event, cloudless skies allowed effective imagecollection from both the ground and from space.
3. Ground-Based Thermal Camera Dataand Processing
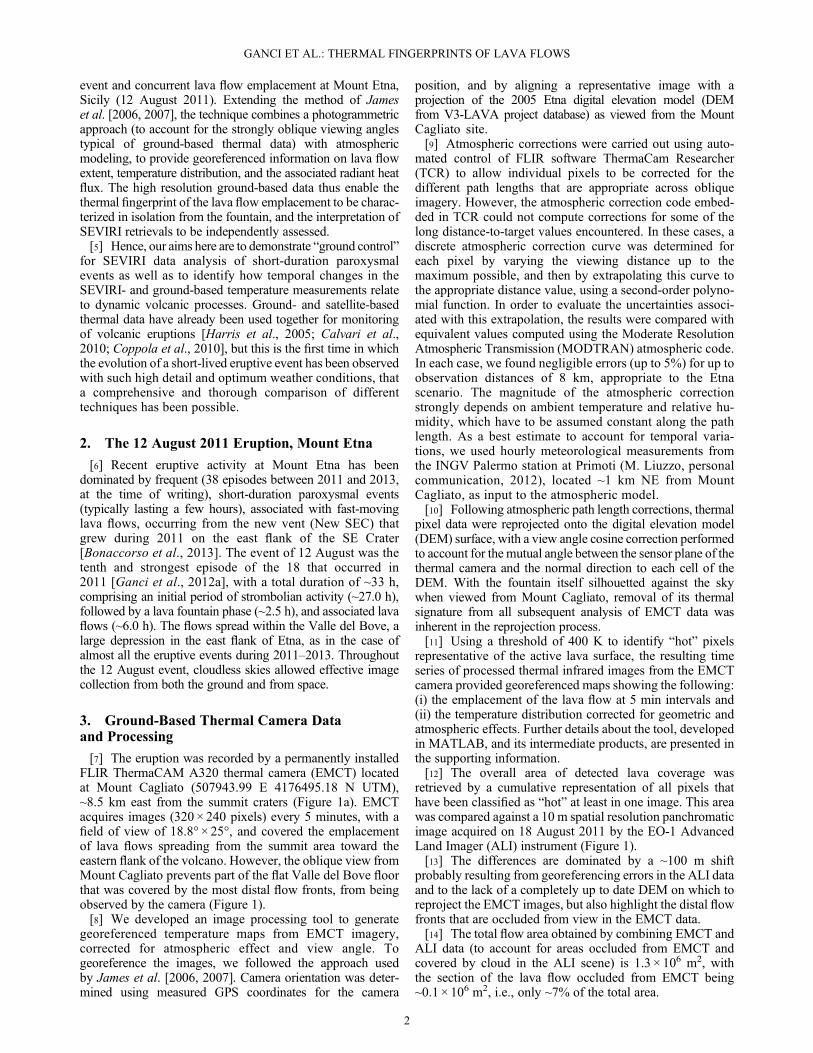
[7] The eruption was recorded by a permanently installedFLIR ThermaCAM A320 thermal camera (EMCT) locatedat Mount Cagliato (507943.99 E 4176495.18 N UTM),~8.5 km east from the summit craters (Figure 1a). EMCTacquires images (320 × 240 pixels) every 5 minutes, with afield of view of 18.8° × 25°, and covered the emplacementof lava flows spreading from the summit area toward theeastern flank of the volcano. However, the oblique view fromMount Cagliato prevents part of the flat Valle del Bove floorthat was covered by the most distal flow fronts, from beingobserved by the camera (Figure 1).[8] We developed an image processing tool to generate
georeferenced temperature maps from EMCT imagery,corrected for atmospheric effect and view angle. Togeoreference the images, we followed the approach usedby James et al. [2006, 2007]. Camera orientation was deter-mined using measured GPS coordinates for the camera
position, and by aligning a representative image with aprojection of the 2005 Etna digital elevation model (DEMfrom V3-LAVA project database) as viewed from the MountCagliato site.[9] Atmospheric corrections were carried out using auto-
mated control of FLIR software ThermaCam Researcher(TCR) to allow individual pixels to be corrected for thedifferent path lengths that are appropriate across obliqueimagery. However, the atmospheric correction code embed-ded in TCR could not compute corrections for some of thelong distance-to-target values encountered. In these cases, adiscrete atmospheric correction curve was determined foreach pixel by varying the viewing distance up to themaximum possible, and then by extrapolating this curve tothe appropriate distance value, using a second-order polyno-mial function. In order to evaluate the uncertainties associ-ated with this extrapolation, the results were compared withequivalent values computed using the Moderate ResolutionAtmospheric Transmission (MODTRAN) atmospheric code.In each case, we found negligible errors (up to 5%) for up toobservation distances of 8 km, appropriate to the Etnascenario. The magnitude of the atmospheric correctionstrongly depends on ambient temperature and relative hu-midity, which have to be assumed constant along the pathlength. As a best estimate to account for temporal varia-tions, we used hourly meteorological measurements fromthe INGV Palermo station at Primoti (M. Liuzzo, personalcommunication, 2012), located ~1 km NE from MountCagliato, as input to the atmospheric model.[10] Following atmospheric path length corrections, thermal
pixel data were reprojected onto the digital elevation model(DEM) surface, with a view angle cosine correction performedto account for the mutual angle between the sensor plane of thethermal camera and the normal direction to each cell of theDEM. With the fountain itself silhouetted against the skywhen viewed from Mount Cagliato, removal of its thermalsignature from all subsequent analysis of EMCT data wasinherent in the reprojection process.[11] Using a threshold of 400 K to identify “hot” pixels
representative of the active lava surface, the resulting timeseries of processed thermal infrared images from the EMCTcamera provided georeferenced maps showing the following:(i) the emplacement of the lava flow at 5 min intervals and(ii) the temperature distribution corrected for geometric andatmospheric effects. Further details about the tool, developedin MATLAB, and its intermediate products, are presented inthe supporting information.[12] The overall area of detected lava coverage was
retrieved by a cumulative representation of all pixels thathave been classified as “hot” at least in one image. This areawas compared against a 10 m spatial resolution panchromaticimage acquired on 18 August 2011 by the EO-1 AdvancedLand Imager (ALI) instrument (Figure 1).[13] The differences are dominated by a ~100 m shift
probably resulting from georeferencing errors in the ALI dataand to the lack of a completely up to date DEM on which toreproject the EMCT images, but also highlight the distal flowfronts that are occluded from view in the EMCT data.[14] The total flow area obtained by combining EMCT and
ALI data (to account for areas occluded from EMCT andcovered by cloud in the ALI scene) is 1.3 × 10⁶ m2, withthe section of the lava flow occluded from EMCT being~0.1 × 10⁶ m2, i.e., only ~7% of the total area.
GANCI ET AL.: THERMAL FINGERPRINTS OF LAVA FLOWS
2
[15] Finally, by modeling the cooling phase of the thermaldata from each pixel invaded by lava, a map of the emplacedflow thickness was determined. Following Ganci et al.[2012a], the assumptions inherent in straightforward coolingmodels limit their reliability for direct fitting to data from ther-mally complex surfaces in volcanic scenarios. Consequently,thickness was indirectly derived by dividing a lava volumeestimate that is consistent with best-fit upper and lower boundtheoretical cooling curves for each pixel, with the pixel area[Ganci et al., 2012a]. The quality of the estimate for each pixelis represented by the R2 value of the associated cooling curveand the temperature data.
4. MSG-SEVIRI Data and Processing
[16] The MSG-SEVIRI scenes encompassing the eruptionwere analyzed using the HOTSAT satellite thermal monitoringsystem [Ganci et al., 2011b]. HOTSAT is capable of managingmultispectral data at high sampling rates, and includes ahot spot detection algorithm and provides the radiant heat fluxfor each thermally anomalous pixel. HOTSAT calculations arebased on the middle infrared (MIR) radiance method [Woosteret al., 2003], thus the radiant heat flux is estimated to within±30%, for temperatures of 600–1500 K. We assumed thatroughness and emissivity (0.92 for Etna basalts) [Lee et al.,
Figure 1. (a) Viewshed analysis of the 2005 Etna DEM, highlighting in green the areas visible from the Mount Cagliato siteof the EMCT thermal camera. VdB=Valle del Bove, NEC=North East Crater, SEC= South East Crater. (b) Final lava flowarea calculated from EMCT data processing, overlain on an ALI panchromatic scene from 18 August 2011 (c). The ALI sceneand viewshed analysis and are overlain in (d) the purple area showing the part of the flow that cannot be imaged by the EMCTcamera. In Figure 1a, the dashed red rectangle gives the area expanded in Figures 1b, 1c, and 1d.
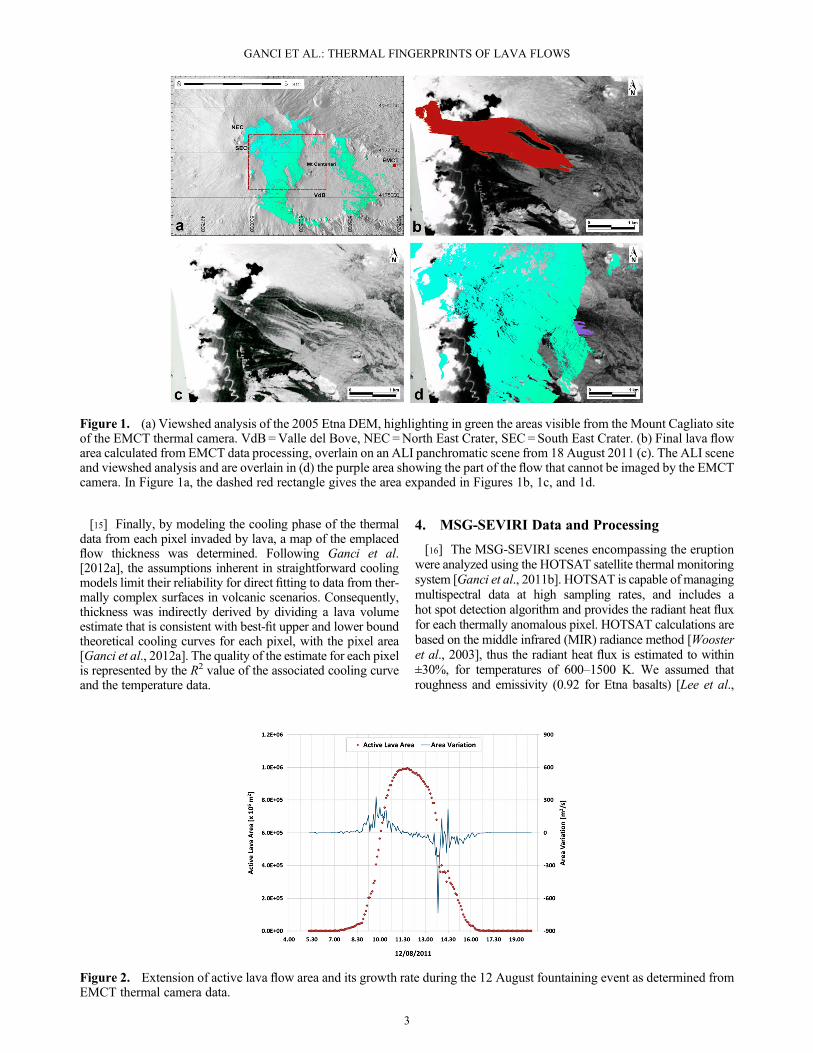
Figure 2. Extension of active lava flow area and its growth rate during the 12 August fountaining event as determined fromEMCT thermal camera data.
GANCI ET AL.: THERMAL FINGERPRINTS OF LAVA FLOWS
3

2013] did not change during the fountaining event, so that theerrors produced by these factors were stable (~ 2–7% of the es-timated temperature). The total radiant heat flux is computedfor each image as the sum of the radiant heat flux for all thehot-spot pixels.
5. Ground-Based Thermal Signature ofLava Emplacement
[17] The georeferenced EMCT time series demonstrates theevolution of the detected active flow area during the eruptiveevent (Figure 2). Effusion was first detected at 07:45, afterwhich the total flow area grew continuously, with the detectedactive area peaking at ~106 m2 at 11:45. Following this, theactive lava area decreased as cooling-dominated behavior
developed (Figure 2). The variation of active area also demon-strates significant variability over timescales of 10–15 min,which we ascribe to variations in both the slope of the topog-raphy being inundated, and in the eruption rate. The first sig-nificant peak occurred at 08:50, reflecting the rapid growthof the first lava flows on the flanks of the New SEC cone.The following decrease correlates with lava emplacement onlow angle topography at the base of the New SEC that reduceslava advance rates and is also difficult to detect from MountCagliato. The greatest peak, 330 m2s�1, occurred at 09:40,when explosive activity was very intense and the lava flowwas crossing the steepest wall of the Valle del Bove. After this,the fluctuations are likely to be dominated by effusion rate var-iability. After 11:30, area variation became generally negative,following the cessation of the fountaining.[18] The evolution of the temperature distribution (TD,
between 400 and 1200 K) demonstrates three phases relatedto the lava flow onset, emplacement during the mainfountaining period and then cooling-dominated. The transi-tions between the three different phases were recognized bythe sharp increase (or decrease) in the values of correctedtemperatures (Figure 3). The first phase (07:30–8:50) inwhich the lava flow emplacement begins, shows an almostuniform distribution of apparent temperatures between 400and 1100 K (orange surfaces in Figure 3). The second phase(09:00–11:00), corresponds to the main fountaining periodwhere apparent temperatures sharply increase and are focussedbetween 900 and 1200 K. The third phase (11:15–16:30) isrelated to the final part of the lava flow emplacement, afterthe drastic reduction of magma supply as fountaining ceased,and includes flow cooling, with peak temperatures slowlydeclining from 900 to 450 K and becoming increasinglynarrowly distributed.[19] In total, the lava emplacement covered 48,156 pixels
in the thermal imagery, of which cooling curves were suffi-ciently well defined for flow thickness estimates in 92%. Ofthese, 82% had R2> 0.6. The pixel thicknesses (Figure 4)show a right-skewed distribution with a peak at ~3.0 m,and an average value of 2.6 m for well-resolved pixels(R2> 0.6) or ~2.3 m for all fitted pixels (comparable withfield measurements for events of this rapid emplacementstyle [Calvari et al., 2011]). Summing the volume contribu-tions gives a total flow field volume of ~2.4 × 10⁶ m3 for
Figure 3. Surface temperature distributions throughout theanalyzed EMCT image sequence. The three phases charac-terizing the thermal signature of lava flow emplacement atMount Etna during the 12 August fountaining event are dis-tinguished in the data and show different trends associatedwith (a) the lava flow initial emplacement (orange), (b) themain fountaining (red), and (c) the cooling phase (pale blue).Three EMCT images, representative of these phases are alsoshown in the respective insets.
Figure 4. Lava thickness mapped throughout the flow field. Inset at the bottom left shows the thickness distribution forwell-resolved pixels (R2> 0.6), whereas inset at the top right reports the R2 distribution for all the hot pixels.
GANCI ET AL.: THERMAL FINGERPRINTS OF LAVA FLOWS
4
pixels with R2> 0.6 and ~2.5 × 10⁶ m3 for all fitted lavapixels. Furthermore, recognizing that this represents only92% of the “emplaced” pixels, and that ~7% of the flow fieldwas also occluded from view, this should be considered as alower bound. An upper bound of ~3.0 × 10⁶ m3 can be esti-mated by assuming the remaining area is covered with lavaof the average thickness (~2.3 m).
6. Comparison Between MSG-SEVIRI andGround-Based Thermal Camera Measurements
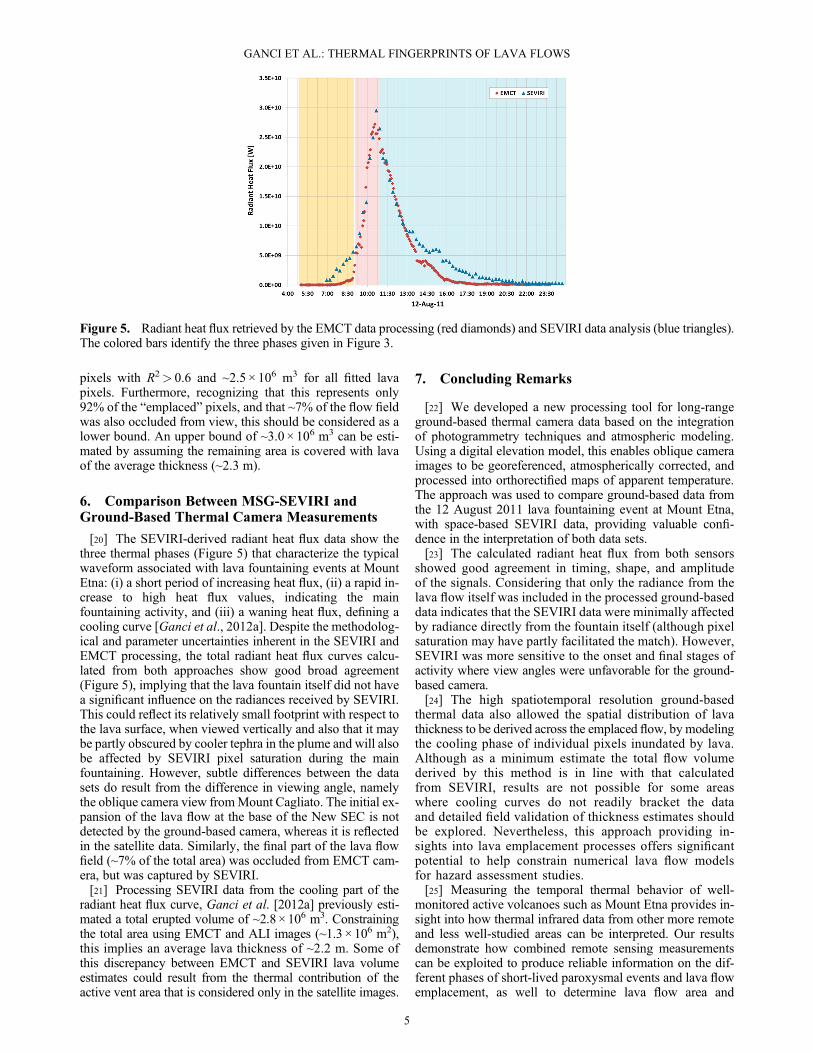
[20] The SEVIRI-derived radiant heat flux data show thethree thermal phases (Figure 5) that characterize the typicalwaveform associated with lava fountaining events at MountEtna: (i) a short period of increasing heat flux, (ii) a rapid in-crease to high heat flux values, indicating the mainfountaining activity, and (iii) a waning heat flux, defining acooling curve [Ganci et al., 2012a]. Despite the methodolog-ical and parameter uncertainties inherent in the SEVIRI andEMCT processing, the total radiant heat flux curves calcu-lated from both approaches show good broad agreement(Figure 5), implying that the lava fountain itself did not havea significant influence on the radiances received by SEVIRI.This could reflect its relatively small footprint with respect tothe lava surface, when viewed vertically and also that it maybe partly obscured by cooler tephra in the plume and will alsobe affected by SEVIRI pixel saturation during the mainfountaining. However, subtle differences between the datasets do result from the difference in viewing angle, namelythe oblique camera view fromMount Cagliato. The initial ex-pansion of the lava flow at the base of the New SEC is notdetected by the ground-based camera, whereas it is reflectedin the satellite data. Similarly, the final part of the lava flowfield (~7% of the total area) was occluded from EMCT cam-era, but was captured by SEVIRI.[21] Processing SEVIRI data from the cooling part of the
radiant heat flux curve, Ganci et al. [2012a] previously esti-mated a total erupted volume of ~2.8 × 10⁶ m3. Constrainingthe total area using EMCT and ALI images (~1.3 × 10⁶ m2),this implies an average lava thickness of ~2.2 m. Some ofthis discrepancy between EMCT and SEVIRI lava volumeestimates could result from the thermal contribution of theactive vent area that is considered only in the satellite images.
7. Concluding Remarks
[22] We developed a new processing tool for long-rangeground-based thermal camera data based on the integrationof photogrammetry techniques and atmospheric modeling.Using a digital elevation model, this enables oblique cameraimages to be georeferenced, atmospherically corrected, andprocessed into orthorectified maps of apparent temperature.The approach was used to compare ground-based data fromthe 12 August 2011 lava fountaining event at Mount Etna,with space-based SEVIRI data, providing valuable confi-dence in the interpretation of both data sets.[23] The calculated radiant heat flux from both sensors
showed good agreement in timing, shape, and amplitudeof the signals. Considering that only the radiance from thelava flow itself was included in the processed ground-baseddata indicates that the SEVIRI data were minimally affectedby radiance directly from the fountain itself (although pixelsaturation may have partly facilitated the match). However,SEVIRI was more sensitive to the onset and final stages ofactivity where view angles were unfavorable for the ground-based camera.[24] The high spatiotemporal resolution ground-based
thermal data also allowed the spatial distribution of lavathickness to be derived across the emplaced flow, by modelingthe cooling phase of individual pixels inundated by lava.Although as a minimum estimate the total flow volumederived by this method is in line with that calculatedfrom SEVIRI, results are not possible for some areaswhere cooling curves do not readily bracket the dataand detailed field validation of thickness estimates shouldbe explored. Nevertheless, this approach providing in-sights into lava emplacement processes offers significantpotential to help constrain numerical lava flow modelsfor hazard assessment studies.[25] Measuring the temporal thermal behavior of well-
monitored active volcanoes such as Mount Etna provides in-sight into how thermal infrared data from other more remoteand less well-studied areas can be interpreted. Our resultsdemonstrate how combined remote sensing measurementscan be exploited to produce reliable information on the dif-ferent phases of short-lived paroxysmal events and lava flowemplacement, as well to determine lava flow area and
Figure 5. Radiant heat flux retrieved by the EMCT data processing (red diamonds) and SEVIRI data analysis (blue triangles).The colored bars identify the three phases given in Figure 3.
GANCI ET AL.: THERMAL FINGERPRINTS OF LAVA FLOWS
5

volumes. Finally, the comparison of thermal camera andSEVIRI data used here provides confidence in the quantita-tive information that could be obtained during future similarepisodes if only satellite techniques are available.
[26] Acknowledgments. We thank E. Pecora, E. Biale, and M.Prestifilippo from INGV Catania for EMCT thermal camera images,EUMETSAT for SEVIRI data, USGS EROS Center for EO-1 ALI data,andM. Liuzzo from INGV Palermo for atmospheric temperature and humiditydata. The authors thank D. Coppola and M. Ramsey for their helpful andconstructive comments and are grateful to Andrew Newman for theeditorial handling.[27] The Editor thanks Michael Ramsey and Diego Coppola for their
assistance in evaluating this paper.
ReferencesAksakal, S. K. (2013), Geometric accuracy investigations of SEVIRI highresolution visible (HRV) level 1.5 Imagery, Remote Sens., 5, 2475–2491,doi:10.3390/rs5052475.
Bonaccorso, A., A. Bonforte, S. Calvari, C. Del Negro, G. Di Grazia, G. Ganci,M. Neri, A. Vicari, and E. Boschi (2011), The initial phases of the2008–2009 Mt. Etna eruptiona multi-disciplinary approach for hazardassessment, J. Geophys. Res., 116, B03203, doi:10.1029/2010JB007906.
Bonaccorso, A., S. Calvari, G. Currenti, C. Del Negro, G. Ganci, A. Linde,R. Napoli, S. Sacks, and A. Sicali (2013), From source to surface: dynam-ics of Etna’s lava fountains investigated by continuous strain, magnetic,ground and satellite thermal data, Bull. Volcanol., 75, 690, doi:10.1007/s00445-013-0690-9.
Calvari, S., L. Lodato, A. Steffke, A. Cristaldi, A. J. L. Harris, L. Spampinato,and E. Boschi (2010), The 2007 Stromboli eruption: Event chronologyand effusion rates using thermal infrared data, J. Geophys. Res., 115,B04201, doi:10.1029/2009JB006478.
Calvari, S., G. G. Salerno, L. Spampinato, M. Gouhier, A. La Spina,E. Pecora, A. J. L. Harris, P. Labazuy, E. Biale, and E. Boschi (2011),An unloading foam model to constrain Etna’s 11–13 January 2011 lavafountaining episode, J. Geophys. Res., 116, B11207, doi:10.1029/2011JB008407.
Cappello, A., G. Bilotta, M. Neri, and C. Del Negro (2013), Probabilisticmodelling of future volcanic eruptions at Mount Etna, J. Geophys. Res.Solid Earth, 118, 1925–1935, doi:10.1002/jgrb.50190.
Coppola, D., M. R. James, T. Staudacher, and C. Cigolini (2010), A compar-ison of field- and satellite-derived thermal flux at Piton de la Fournaise:Implications for the calculation of lava discharge rate, Bull. Volcanol., 72,341–356, doi:10.1007/s00445-009-0320-8.
Ganci, G., A. Vicari, S. Bonfiglio, G. Gallo, and C. Del Negro (2011a), A texton-based cloud detection algorithm for MSG-SEVIRI multispectral images,Geomatics Nat. Hazards Risk, 2, 1–12, doi:10.1080/19475705.2011.578263.
Ganci, G., A. Vicari, L. Fortuna, and C. Del Negro (2011b), TheHOTSAT volcano monitoring system based on a combined use ofSEVIRI and MODIS multispectral data, Ann. Geophys., 54(5), 544–550,doi:10.4401/ag-5338.
Ganci, G., A. J. L. Harris, C. Del Negro, Y. Guéhenneux, A. Cappello,P. Labazuy, S. Calvari, and M. Gouhier (2012a), A year of fountainingat Etna: Volumes from SEVIRI, Geophys. Res. Lett., 39, L06305,doi:10.1029/2012GL051026.
Ganci, G., A. Vicari, A. Cappello, and C. Del Negro (2012b), An emergentstrategy for volcano hazard assessment: From thermal satellite monitoringto lava flow modelling, Remote Sens. Environ., 119, 197–207,doi:10.1016/j.rse.2011.12.021.
Harris, A. J. L., J. Dehn, M. R. Patrick, S. Calvari, M. Ripepe, and L. Lodato(2005), Lava effusion rates from hand-held thermal infrared imagery: Anexample from the June 2003 effusive activity at Stromboli, Bull.Volcanol., 68, 107–117.
Hirn, B., C. Di Bartola, G. Laneve, E. Cadau, and F. Ferrucci (2008),SEVIRI onboard Meteosat Second Generation, and the quantitative mon-itoring of effusive volcanoes in Europe and Africa, in IEEE InternationalGeoscience and Remote Sensing Symposium (IGARSS 2008), pp. 374–377,Inst. of Electr. and Electron. Eng., New York.
James, M. R., S. Robson, H. Pinkerton, and M. Ball (2006), Oblique photo-grammetry with visible and thermal images of active lava flows, Bull.Volcanol., 69, 105–108.
James, M. R., H. Pinkerton, and Robson, S. (2007), Image-based measure-ment of flux variation in distal regions of active lava flows, Geochem.Geophys. Geosys., 8, Q03006, doi:10.1029/2006GC001448.
Lee, R. J., M. S. Ramsey, and P. L. King (2013), Development of a novellaboratory technique for high temperature thermal emission spectroscopyof silicate melts, J. Geophys. Res. Atmos., 118, 1525–1535, doi:10.1002/jgrb.50197.
Ramsey, M. S., and A. J. L. Harris (2013), Volcanology 2020: How willthermal remote sensing of volcanic surface activity evolve over nextdecade?, J. Volcanol. Geoth. Res., 249, 217–233.
Vicari, A., G. Ganci, B. Behncke, A. Cappello, M. Neri, and C. Del Negro(2011), Near-real-time forecasting of lava low hazards during the 12–13January 2011 Etna eruption, Geophys. Res. Lett., 38, L13317, doi:10.1029/2011GL047545.
Wolff, J. A., and J. M. Sumner (2000), Lava fountains and their products,in Encyclopedia of Volcanoes, edited by H. Sigurdsson, B. F. Houghton,S. R. Mcnutt, H. Rymer, and J. Stix, Academic Press, San Diego, Calif.,pp. 321–329.
Wooster, M. J., B. Zhukov, and D. Oertel (2003), Fire radiative energyfor quantitative study of biomass burning: Derivation from the BIRDexperimental satellite and comparison to MODIS fire products,Remote Sens. Environ., 86, 83–107.
Wright, R., H. Garbeil, and A. J. L. Harris (2008), Using infrared satellitedata to drive a thermo-rheological/stochastic lava flow emplacementmodel: A method for near-real-time volcanic hazard assessment,Geophys. Res. Lett., 35, L19307, doi:10.1029/2008GL035228.
GANCI ET AL.: THERMAL FINGERPRINTS OF LAVA FLOWS
6