Lava effusion rate definition and measurement: a review
22
REVIEW PAPER Lava effusion rate definition and measurement: a review Andrew J. L. Harris & Jonathan Dehn & Sonia Calvari Received: 15 December 2005 / Accepted: 3 January 2007 / Published online: 10 March 2007 # Springer-Verlag 2007 Abstract Measurement of effusion rate is a primary objective for studies that model lava flow and magma system dynamics, as well as for monitoring efforts during on-going eruptions. However, its exact definition remains a source of confusion, and problems occur when comparing volume flux values that are averaged over different time periods or spatial scales, or measured using different approaches. Thus our aims are to: (1) define effusion rate terminology; and (2) assess the various measurement methods and their results. We first distinguish between instantaneous effusion rate, and time-averaged discharge rate. Eruption rate is next defined as the total volume of lava emplaced since the beginning of the eruption divided by the time since the eruption began. The ultimate extension of this is mean output rate, this being the final volume of erupted lava divided by total eruption duration. Whether these values are total values, i.e. the flux feeding all flow units across the entire flow field, or local, i.e. the flux feeding a single active unit within a flow field across which many units are active, also needs to be specified. No approach is without its problems, and all can have large error (up to ∼50%). However, good agreement between diverse approaches shows that reliable estimates can be made if each approach is applied carefully and takes into account the caveats we detail here. There are three important factors to consider and state when measuring, giving or using an effusion rate. First, the time-period over which the value was averaged; second, whether the measurement applies to the entire active flow field, or a single lava flow within that field; and third, the measure- ment technique and its accompanying assumptions. Keywords Lava . Instantaneous effusion rate . Time-averaged discharge rate . Eruption rate . Monitoring Introduction The rate at which lava is erupted is commonly termed effusion rate. Upon eruption, lava may not necessarily flow across the surface, but can be tube-contained and/or injected into the interior of a flow or dome to cause inflation or endogenous growth (Calvari and Pinkerton 1998, 1999; Fink 1993; Fink et al. 1990; Fink and Griffiths 1998; Glaze et al. 2005; Greeley 1987; Guest et al. 1984; Hon et al. 1994; Iverson 1990; Kauahikaua et al. 1998; Mattsson and Höskuldsson 2005; Nakada et al. 1995; Ollier 1964; Peterson et al. 1994; Rossi and Gudmundsson 1996; Self et al. 1996, 1997; Thordason and Self 1996, 1998; Walker 1991). Whether exogenously or endogenously emplaced, effusion rate controls the way in which a lava body grows, extends and expands, influencing its dimen- sional properties, such as length, width, thickness, volume and/or area (Baloga and Pieri 1986; Blake 1990; Blake and Bruno 2000; Fink and Bridges 1995; Kilburn 2000; Kilburn Bull Volcanol (2007) 70:1–22 DOI 10.1007/s00445-007-0120-y Editorial responsibility: C Kilburn A. J. L. Harris (*) HIGP/SOEST, University of Hawai’i, 1680 East West Road, Honolulu, HI 96822, USA e-mail: [email protected] J. Dehn Alaska Volcano Observatory, Geophysical Institute, University of Alaska Fairbanks, Fairbanks, AK 99775, USA S. Calvari Instituto Nazionale di Geofisica e Vulcanologia, Sezione di CataniaPiazza Roma 2, 95123 Catania, Italy
Transcript of Lava effusion rate definition and measurement: a review

REVIEW PAPER
Lava effusion rate definition and measurement: a review
Andrew J. L. Harris & Jonathan Dehn & Sonia Calvari
Received: 15 December 2005 /Accepted: 3 January 2007 / Published online: 10 March 2007# Springer-Verlag 2007
Abstract Measurement of effusion rate is a primaryobjective for studies that model lava flow and magmasystem dynamics, as well as for monitoring efforts duringon-going eruptions. However, its exact definition remains asource of confusion, and problems occur when comparingvolume flux values that are averaged over different timeperiods or spatial scales, or measured using differentapproaches. Thus our aims are to: (1) define effusion rateterminology; and (2) assess the various measurementmethods and their results. We first distinguish betweeninstantaneous effusion rate, and time-averaged dischargerate. Eruption rate is next defined as the total volume oflava emplaced since the beginning of the eruption dividedby the time since the eruption began. The ultimateextension of this is mean output rate, this being the finalvolume of erupted lava divided by total eruption duration.Whether these values are total values, i.e. the flux feedingall flow units across the entire flow field, or local, i.e. theflux feeding a single active unit within a flow field acrosswhich many units are active, also needs to be specified. Noapproach is without its problems, and all can have large
error (up to ∼50%). However, good agreement betweendiverse approaches shows that reliable estimates can bemade if each approach is applied carefully and takes intoaccount the caveats we detail here. There are threeimportant factors to consider and state when measuring,giving or using an effusion rate. First, the time-period overwhich the value was averaged; second, whether themeasurement applies to the entire active flow field, or asingle lava flow within that field; and third, the measure-ment technique and its accompanying assumptions.
Keywords Lava . Instantaneous effusion rate .
Time-averaged discharge rate . Eruption rate .Monitoring
Introduction
The rate at which lava is erupted is commonly termedeffusion rate. Upon eruption, lava may not necessarily flowacross the surface, but can be tube-contained and/orinjected into the interior of a flow or dome to causeinflation or endogenous growth (Calvari and Pinkerton1998, 1999; Fink 1993; Fink et al. 1990; Fink and Griffiths1998; Glaze et al. 2005; Greeley 1987; Guest et al. 1984;Hon et al. 1994; Iverson 1990; Kauahikaua et al. 1998;Mattsson and Höskuldsson 2005; Nakada et al. 1995; Ollier1964; Peterson et al. 1994; Rossi and Gudmundsson 1996;Self et al. 1996, 1997; Thordason and Self 1996, 1998;Walker 1991). Whether exogenously or endogenouslyemplaced, effusion rate controls the way in which a lavabody grows, extends and expands, influencing its dimen-sional properties, such as length, width, thickness, volumeand/or area (Baloga and Pieri 1986; Blake 1990; Blake andBruno 2000; Fink and Bridges 1995; Kilburn 2000; Kilburn
Bull Volcanol (2007) 70:1–22DOI 10.1007/s00445-007-0120-y
Editorial responsibility: C Kilburn
A. J. L. Harris (*)HIGP/SOEST, University of Hawai’i,1680 East West Road,Honolulu, HI 96822, USAe-mail: [email protected]
J. DehnAlaska Volcano Observatory, Geophysical Institute,University of Alaska Fairbanks,Fairbanks, AK 99775, USA
S. CalvariInstituto Nazionale di Geofisica e Vulcanologia,Sezione di CataniaPiazza Roma 2,95123 Catania, Italy

and Lopes 1988; Kilburn et al. 1995; Malin 1980;Mayamoto and Sasaki 1998; Murray and Stevens 2000;Pieri and Baloga 1986; Pinkerton and Wilson 1994; Stasiukand Jaupart 1997; Swanson and Holcomb 1990; Wadge1978; Walker 1973). Effusion rate also influences pressureconditions within an inflating unit and the morphology ofthe flow surface (Anderson et al. 1998; Denlinger 1990;Fink and Griffiths 1992, 1998; Gregg and Fink 2000;Griffiths and Fink 1992; Iverson 1990; Rowland andWalker 1990). In addition, effusion rate and flow velocityaffects flow heat loss and cooling, and hence crystallizationrates (Crisp and Baloga 1994; Dragoni 1989; Dragoni andTallarico 1994; Dragoni et al. 1992; Harris et al. 1998,2005; Keszthelyi 1995; Keszthelyi and Self 1998; Pieri andBaloga 1986; Sakimoto and Zuber 1998). Thus, effusionrate, velocity and volume are important input parametersinto lava flow models and simulations, and/or have been theoutputs of others (e.g. Costa and Macedonio 2005; Crisci etal. 2003, 2004; Favalli et al. 2005; Glaze and Baloga 2001;Harris and Rowland 2001; Hikada et al. 2005; Ishihara etal. 1990; Keszthelyi and Self 1998; Keszthelyi et al. 2000;Macedonio and Longo 1999; Rowland et al. 2004, 2005;Wadge et al. 1994; Young and Wadge 1990). Finally, byrepresenting material supplied from a deeper source,effusion rates allow constraint of mass flux out of theshallow feeder system, allowing assessment and/or model-ling of the mass balance and dynamics of the effusing orextruding system, and of the source depth and conduitgeometry (e.g. Allard 1997; Allard et al. 1994; Barmin etal. 2002; Denlinger 1997; Denlinger and Hoblitt 1999;Dvorak and Dzurisin 1993; Dzurisin et al. 1984; Francis etal. 1993; Harris and Stevenson 1997; Harris et al. 2000,2003; Melnik and Sparks 1999, 2005; Naumann and Geist2000; Ripepe et al. 2005; Rowland and Munro 1993;Rowland et al. 2003; Wadge 1977, 1981–1983; Wadge etal. 1975).
All of these factors make measurement of effusion rate aprimary objective not just for studies that aim tounderstand and model lava flows and shallow systemdynamics, but also for monitoring efforts during on-goingeruptions (e.g. Barberi et al. 1993; Andronico et al. 2005;Calvari and INGV-Catania 2001; Calvari et al. 1994, 2003,2005; Kauahikaua et al. 2003; Sutton et al. 2003). Effusionrates can be used, for example, to determine whetheractivity is waxing or waning (Harris et al. 2000; Wadge1981) or to assess the long-term behaviour, and eruptive/hazard potential, of a system (Branca and Del Carlo 2005;Wadge 1977, 1981, 1983; Wadge et al. 1975). They canalso be used in predictive models designed to estimate thepossible extent, and thus hazard posed by, advancing flows(e.g. Calvari and Pinkerton 1998; Costa and Macedonio2005; Crisci et al. 2003, 2004; Favalli et al. 2005; Ishiharaet al. 1990; Rowland et al. 2005).
In spite of the importance of effusion rate, its definitioncan be a source of confusion, and problems occur whencomparing volume fluxes averaged over different timeperiods, or measured using different approaches. This wasthe crux of the Tanguy et al. (1996) argument, which notedthat variations in effusion rates measured during Etna’s1991–1993 eruption varied by a factor of 30. Some of thevariation likely resulted from actual changes in the eruptedflux; others, however, resulted from definition and mea-surement problems. The aims of this paper are to reviewand define a standard for effusion rate terminology, tocollate and describe the various methods available formeasuring effusion rates, and to discuss the value of timelyeffusion rate measurement in lava flow monitoring andhazard mitigation.
Definitions
Walker (1973) defined effusion rate as the instantaneouslava flow output by a vent, and eruption rate as theaverage lava output during a whole eruption. Subsequentlythere have been several interpretations of effusion rate anderuption (or discharge) rate, these terms often being usedinterchangeably, with eruption rates being averaged over avariety of time-periods from seconds to minutes, hours,days, months and years (e.g. Behncke and Neri 2003;Calvari et al. 1994; Fink et al. 1990; Glaze 1984; Harris andNeri 2002; Madeira et al. 1996; Nakada and Fujii 1993;Richter et al. 1970; Rowland and Munro 1993; Sutton et al.2003; Swanson et al. 1979; Tanguy et al. 1996; Tilling et al.1987; Wadge 1983; Wolfe et al. 1988; Zebker et al. 1996).This led Lipman and Banks (1987) to clarify that they wereusing “effusion rate” for instantaneous values, “dischargerate” for values averaged over a day, “mean effusion rate”for effusion rate averaged over a specified period of time,and “eruption rate” for values averaged over the wholeeruption. This definition helps immensely in that it clearlydefines the time over which the value is averaged(Fig. 1a).
Instantaneous effusion rate and time averaged dischargerate
Following Lipman and Banks (1987), instantaneous effu-sion rate can be defined as the volume flux of erupted lavathat is feeding flow at any particular point in time. Suchmeasurements, if made repeatedly over a short period oftime, are useful in defining short-lived surges in the lavaflux developing over seconds to minutes (e.g. Bailey et al.2006; Guest et al. 1987; Harris and Neri 2002; Harris et al.2006; Madeira et al. 1996; Lipman and Banks 1987) or foridentifying detailed temporal trends in the erupted volume
2 Bull Volcanol (2007) 70:1–22

flux developing over hours to days (e.g. Calvari et al. 2003,2005; Frazzetta and Romano 1984; Harris et al. 2000;Wadge 1981).
We also distinguish between instantaneous volume fluxmeasurements made at basaltic lava flows versus thosemade at silicic lava domes and flows, which we terminstantaneous effusion rate for the former case andinstantaneous extrusion rate for the later. This distinctionstresses the viscosity, emplacement and morphologicaldifferences between the two cases. It is also consistentwith the Chambers Dictionary definition of effusion, thisbeing “pouring or streaming out; emission” versus that forextrude, i.e. “to force out, to expel; to protrude” so thatextrusion is “the act of extruding, thrusting or throwingout” (Schwarz 1993). In both cases we have added the term“instantaneous” to avoid confusion over the temporalmeaning of the phrase, underscoring the fact that the valueis measured at a specific moment in time.
Time averaged discharge rates consider volume fluxesaveraged over a given time period (Fig. 1a). This istypically obtained by measuring the volume emplaced overa known interval, and dividing by the duration to givevolume flux over that interval (e.g. Andronico et al. 2005;Behncke and Neri 2003; Burton et al. 2005; Fink et al.1990; Harris and Neri 2002; Jackson et al. 1975; Mazzarini
et al. 2005; Nakada and Fujii 1993; Nakada et al. 1999;Richter et al. 1970; Rose 1972; Rossi 1997; Rowland 1996;Rowland et al. 1999; Sparks et al. 1998; Swanson andHolcomb 1990; Tilling et al. 1987; Wolfe et al. 1988;Zebker et al. 1996). For example, a daily discharge rate at alava flow or dome may be obtained by dividing volumeemplaced that day by 24 h (e.g. Behncke and Neri 2003;Zebker et al. 1996; Fig. 2a). Considering time-averagedvalues will begin to smooth any short-term variation in theinstantaneous effusion rate. As we consider discharge rateaveraged over longer time periods, the temporal detaildiminishes (Fig. 2a). One advantage of this measurementover instantaneous effusion rate, however, is that short-termvariations caused by short-lived changes in measurementconditions or bias introduced by the time of measurementcan be minimized. For example, an instantaneous effusionrate measurement made during a short-lived surge ineffusion is not representative of the typical flux for thelonger time period (Bailey et al. 2006). As a result, time-averaged discharge rate allows identification of longer-term(month-to-decadal scale) trends and systematic changes (orsimilarities) in the system output (e.g. Behncke and Neri2003; Burton et al. 2005; Fink et al. 1990; Nakada et al.1999; Richter et al. 1970; Rose 1972; Swanson andHolcomb 1990; Wadge 1983; Wadge et al. 1975).
Fig. 1 Schematic showinga temporal, and b spatial scalesto which each of our measure-ment definitions apply.IER = Instantaneous effusionrate, TADR = Time-averageddischarge rate, ER = eruptionrate, t0 = eruption start time,tstop = eruption stop time,CLF = compound lava flow
Bull Volcanol (2007) 70:1–22 3

Eruption rate and mean output rate
Eruption rate is defined here as the total volume of the lavaemplaced since the beginning of the eruption divided by thetime since the eruption began. The eruption rate on the 53rdday of an ongoing eruption, for example, is obtained bytaking the volume emplaced up to day 53 divided by those53 days (Fig. 1a). This differs from time averaged dischargerate in that time averaged discharge rates consider singleflow units or volumes emplaced during discrete timewindows within the eruption, whereas eruption ratesconsiders all lava erupted since the start of the eruption.
The ultimate extension of the eruption rate is meanoutput rate (Barberi et al. 1993; Walker 1973). Mean outputrate is the final volume of erupted lava divided by the totalduration of the eruption (Fig. 1a). It can thus only beobtained when the eruption is over (e.g. Barberi et al. 1993;Guest et al. 1987; Jackson et al. 1975; Romano and Sturiale1982; Rossi 1997; Rowland 1996; Swanson et al. 1979;Tanguy et al. 1996; Tilling et al. 1987). Mean output rate isthe ultimate level of temporal smoothing and gives no detail
regarding variations in effusion rate during the eruption(e.g. Fig. 2a).
Mean output rate is useful when comparing thevolumetric flux of many eruptions, being a measure of theeffusive intensity. Take, for example, the 1981 and 1984eruptions of Mount Etna. These formed 12±3 and 19±4±106 m3 lava flow fields, respectively, (Harris et al. 2000).Thus, volumetrically, the 1984 event was more significant.If we consider, however, that these two eruptions lasted 7and 172 days, respectively, we obtain mean output rates of29 and 1.3 m3/s. Thus, in terms of hazard, the 1981 eventwas more significant. Indeed, the 1981 flow advanced8.8 km in just a few hours threatening the town ofRandazzo (Guest et al. 1987; McClelland et al. 1989),whereas the 1984 flow remained confined to the summit,building a pile of short, overlapping flows no more than3.3 km in length (Harris et al. 2000; McClelland et al. 1989).
Considerations
Short-term effusion rate variation
An important issue is whether a measurement made at acertain time is representative of that particular hour or day. Inlava channels (and at flow fronts) flow velocity and depthcan be highly variable over the time scale of minutes tohours (e.g. Bailey et al. 2006; Guest et al. 1987; Lipman andBanks 1987).
Short-term variations in observed flow depth/level orvelocity (and hence derived effusion rate) may result fromvariations in supply, upstream blockage and blockagerelease, or changes in vesicularity (e.g. Bailey et al. 2006;Lipman and Banks 1987; Madeira et al. 1996). During the1984 eruption of Mauna Loa, for example, Lipman andBanks (1987) noted that release of ponded volumes behinddams would cause down-flow velocities to suddenly increasefrom a few meters per minute to a few meters per second.During May 2001 we observed pulses in lava effusion at anEtnean lava channel due to variations in the bulk supply, aswell as surges due to the failure of blockages (Bailey et al.2006). Over a 2-day-long observation period, a series of110–190-min-long cycles in effusion were observed, eachinvolving a relatively long period of low effusion rate flowand terminating in a period of high effusion rate flow lasting10–20 min. During the high effusion rate pulse, flowvelocity was observed to increase by a factor of two over atime scale of 30 min (Fig. 3). Depth of the flow alsoincreased, overflowing from the channel during a pulse tobuild a stack of pahoehoe overflow levées (Fig. 4a) anddecreasing again so that the flow level was well below thelevée rims between pulses (Fig. 4b). As a result, bulkeffusion rate calculated from the flow width, depth and
Fig. 2 a Instantaneous effusion rate (black points and line), timeaveraged discharge rate (grey bars) and mean output rate (dashed,horizontal, line) measured during the 17 October–5 November1999 eruption from Etna’s Bocca Nuova summit crater. The widthof each discharge rate bar indicates the time period to which itapplies. b Cumulative volume (grey area) and eruption rates (blackline) derived for the same eruption. Data from Harris and Neri(2002)
4 Bull Volcanol (2007) 70:1–22

velocity varied from a low of 0.1 m3/s between pulses to apeak of 0.9 m3/s during pulses (Bailey et al. 2006).
Temporal and spatial considerations
Figure 1a summarizes the temporal nature of the terms, andthe time scales over which each definition applies. Theterms vary in how they use time. Instantaneous effusionrate, time-averaged discharge rate, eruption rate and meanoutput rate each consider volumes emplaced over increas-ing time periods as we move through the definitionsequence. However, there are also spatial considerationsbecause all of these measurements can be made on lavabodies at any spatial scale (Fig. 1b). Following theterminology of Walker (1973) a flow unit is the smallestspatial component of a lava flow field. It is a single,discrete body defined by margins that have cooledsignificantly and solidified before another flow-unit issuperimposed upon it (Nichols 1936; Walker 1973). Suchbodies include individual pahoehoe toes/lobes and singleunit ′a′a flows. Compound lava flows and flow fields,however, are divisible into multiple flow units and multiplelava flows, respectively. Compound flows thus containseveral zones of active units fed by a braided channel ortube system extending from a single vent as during the1991 activity at Kalapana on Kilauea (Mattox et al. 1993).Likewise, a flow field will contain a number of compoundflows. Where more than one active vent is present, anumber of discrete zones of activity distributed around thevolcano will form several compound flows at differentlocations as during the 2001 and 2002–2003 eruptions ofEtna (Andronico et al. 2005; Behncke and Neri 2003;Calvari and INGV-Catania 2001). Together these form atotal or compound lava flow field, which comprises everysingle flow unit erupted during the entire eruption. Thus, onthe smallest spatial scale, a point or local effusion ratemeasurement will apply to a single flow unit within acompound lava flow, across which many units or flowsmay be active. On the largest spatial scale, the total volume
flux feeding all units across the entire compound flow fieldwill give the total effusion rate for all active units (Fig. 1b).
Total effusion rate should thus be measured at the ventor at the master channel/tube before bifurcation if onlyone vent is active. If multiple sources are active, then theflux at each source must be measured and summed. Atthe smallest spatial scale, a local effusion rate applies toa single flow unit (Calvari et al. 1994). Local effusionrate thus represents the instantaneous volume fluxfeeding a specific single flow unit or group of units,when many more are active within the flow field. It willthus be less than the total effusion rate (Fig. 1b). Forclarity the spatial scale of the measurement (point, local,regional or total) should be stated when measurements arepresented, as should the temporal scale (instantaneous
Fig. 4 a Pulse moving down a ∼3 m wide channel on Etna duringMay 2001 (Bailey et al. 2006). A series of Pahoehoe overflow levéesemplaced during previous pulses are apparent underlying the activepulse, and are marked “o.” Pulse front is ∼10 m wide. b The samechannel during normal flow (Bailey et al. 2006). Note overhanging rimsdue to repeated overflow to construct a pile of overflow units that wraparound and over the channel rim. This causes the channel width to benarrowest at the levée rim (∼1 m) and broaden downwards to anobservable maximum of 3–4m. Black arrows indicate high stand markscaused by lava accreted to the inner channel walls (at the flow surface–wall contact) during other higher (but below blank) flow levels
Fig. 3 Maximum surface flow velocity (with three-point-running-mean) as measured by Bailey et al. (2006) for the channel pictured inFig. 4 for a 3.5-h-long period. Measurements were made by trackingpieces of crust in a series of thermal images
Bull Volcanol (2007) 70:1–22 5

effusion rate, time averaged discharge rate, eruption rate ormean output rate).
Bulk versus Dense Rock Equivalent (DRE)
Bulk effusion rates (Ebulk) consider the total volumeincluding fluid, solids (crust and crystals) and voids (vesiclesand gaps between clinker). Dense rock effusion rates (EDRE)are defined as bulk effusion rates corrected for the vesiclevolume fraction (ϖ), i.e. EDRE ¼ Ebulk 1�ϖð Þ. Thus denserock effusion rates should include only the lava componentof the mixture. In the absence of directly measured valuesfor vesicularity, ϖ has been taken from the literature.Rowland et al. (1999), for example, corrected bulk volumesobtained at Kilauea using a void correction of 25% for ′a′aflows (from Wolfe et al. 1988), 60% for near-ventrheomorphic lava and 35% for tube-fed pahoehoe (fromWilmoth and Walker 1993; Cashman et al. 1994). Valuesfor Etnean ′a′a and pahoehoe given by Herd and Pinkerton(1997) and Gaonac’h et al. (1996) are 24±15, or 22±7% ifonly data within 1 standard deviation of the mean areconsidered. This, in turn, compares with the findings of Sparkset al. (1998) who corrected volume data for the SoufriereHills dome material (Montserrat) for a porosity of 8–21%.
Because bulk effusion rates are functions of the lava fluxas well its vesicularity, both of which can vary greatly inspace and time, changes in the bulk effusion rate may relateto a change in the bubble content, rather than the volume oferupted lava. During the Mauna Loa 1984 eruption, Lipmanand Banks (1987) noted down-channel decreases invesicularity causing a down-channel decrease in bulkvolume. This would have caused the bulk effusion ratemeasured at the vent versus the distal location to bedifferent, but the dense rock values to remain the same,provided that the correct vesicularity was used at eachstation. Likewise, Madeira et al. (1996) noted that post-eruption degassing of the lava during the 1995 Fogoeruption led to a 10% reduction in the bulk volume.
Variations in EDRE and Ebulk may thus have differentcauses, and therefore different implications. Differences inEDRE, for example, will point to variations in the rate atwhich lava is being supplied to the measurement point.This, in turn, can be used to make inferences about themass balance (the balance between volume supplied,intruded and erupted) for a volcano or the pressureconditions in the deep and shallow system (e.g. Allard1997; Denlinger 1997; Denlinger and Hoblitt 1999; Dvorakand Dzurisin 1993; Dzurisin et al. 1984; Harris et al. 2000).Also, because bulk values may be heavily influenced by thevariable presence of vesicles, if we want to compareerupted fluxes at different times during the same eruption,for different eruptions or at different volcanoes, dense rockvalues must be used.
Being a measure of the variation in fluid flux as well asits vesicularity, bulk effusion rate should be treated withcare. If differences are observed between values, the causeof the variation needs to be first isolated, before themeaning or significance of the change can be assessed.However, DRE values must also be treated with care,especially when this value is not obtained directly from lavasampled during the effusion rate measurements, but from amean vesicularity value taken from literature. In these casesvalues will have been measured during different eruptions,and maybe for different flow types, and a value appropriateto the case under consideration needs to be used. Thevesicularity values for Etnean lavas given in Gaonac’h et al.(1996), for example, range from ∼4% for channelized lavato 30% for pahoehoe.
Measurement of effusion rates
The measurement of effusion rates during eruptions hasevolved from field-based techniques, see Pinkerton (1993)for a review, to methodologies using geophysical andremote sensing technologies (e.g. Calvari et al. 2005; Harriset al. 1997a,b, 1998, 2006; Kauahikaua et al. 1996;Mazzarini et al. 2005; Rowland et al. 1999; Zebker et al.1996). We next describe each of the main methods,necessary considerations, the assumptions they make, andthe likely errors.
Field-based approaches
Channel-based measurements of instantaneous effusion rate
Instantaneous effusion rate can be obtained by multiplyingthe mean velocity (Vmean) at which lava flows through thecross-sectional area (A) of the channel or pipe within whichflow is contained. Cross-sectional area can be calculatedfrom the measured flow depth (d ) and/or width (w), eitherassuming a semi-circular or rectangular channel form(e.g. Barberi et al. 1993; Calvari et al. 1994, 2003; Guestet al. 1987; Harris and Neri 2002; Madeira et al. 1996;Pinkerton 1993; Pinkerton and Sparks 1976; Woodcock andHarris 2005).
In a channel, flow depth can be measured by plunging apiece of iron ‘re-bar’ into the flow and noting the level onthat bar (e.g. Calvari et al. 1994; Pinkerton 1993; Pinkertonand Sparks 1976). However, such measurements areimpossible when lava channels are very wide, very deep,or flow velocity is high (Pinkerton 1993), althoughdropping re-bars from helicopters has been attempted insuch cases (Lipman and Banks 1987). In addition, at largechannels radiant heat from the flow surface can prevent
6 Bull Volcanol (2007) 70:1–22

close approach even when wearing a thermal suit, and thepossibility of overflows or levée collapse may add furtherdanger. Lava stiffness coupled with rough levées or thicksurface crusts can also impede bar insertion. For flows thatare particularly viscous, of high yield strength and/orpossessing significant surface crusts, penetrating the surfacemay prove extremely difficult if not impossible.
Flow depth has also been approximated using themeasured height (H, Fig. 5) of the channel outer levees(e.g. Calvari et al. 2003; Guest et al. 1987; Pinkerton andSparks 1976). This assumes that the channel-base is levelwith the levée bottom. This was found to be a correctassumption in most of the 1999 Etnean flows measuredafter drainage by Calvari et al. (2003). In other cases theassumption may not hold (e.g. Guest et al. 1987; Pinkertonand Sparks 1976). For example, in cases where mechanicaland thermal erosion cause the channel bed to attain a levellower than the levee base, the use of the levee height willlead to an under-estimation of flow depth. On the otherhand where flow levels are lower than the levée rim(e.g. Woodcock and Harris 2005), this will lead to an over-estimate (e.g. Figs. 4b and 5). By noting the flow levelwithin the channel during flow a correction can be made(e.g. Bailey et al. 2006).
Flow width can be measured using standard surveyingtechniques, e.g. tape measure, triangulation, laser range-finder binoculars, etc. Alternatively channel width, as wellas levée height, can be obtained from laser altimeter data(e.g. Mazzarini et al. 2005) or from the dimensions onscaled digital visible-light or thermal images (e.g. Bailey etal. 2006; Harris et al. 2004). However, channel width mayvary with depth, invalidating the semi-circular or rectangu-lar shape assumption (e.g. Bailey et al. 2006; Guest et al.1987; Pinkerton 1993). This is most common at channelswith overhanging rims, where the resulting channel shape
needs to be taken into account in the calculation of thecross-sectional area (e.g. Fig. 4b).
Alternatively, it may be possible to verify channel depth,width and shape after drainage (e.g. Calvari et al. 2003;Harris and Neri 2002). In cases where mapped sections ofdrained channels are used to obtain cross-sectional area,derived depth may be conservative because it does not takeinto account un-drained flow material residing on thechannel floor. A flow level will also have to be assumed,and brim-full flow is not always the case (e.g. Fig. 4b). Insuch cases an assumption that the channel was full, so thatchannel depth equates to flow depth, will result in an over-estimate of effusion rate. Flow level within the channelduring flow can be obtained, however, from high-stand anddrain-back features following channel drainage, allowing acorrection for below-bank flow levels to be made (e.g.Woodcock and Harris 2005).
Flow velocity can be obtained from recording the timetaken for distinctive markers in the flow to travel a knowndistance (Guest et al. 1987; Pinkerton 1993). Flowvelocities, however, will vary with depth and width(Frazzetta and Romano 1984; Guest et al. 1987; Pinkertonand Sparks 1976). Velocities will decay horizontally andvertically away from a maximum velocity at the channelcentre (Figs. 5 and 6). Thus surface velocity obtained at theflow centre, or the flow margins, is not representative of themean flow velocity. An added complication is that the crustand core may advance at different velocities causing furthervertical velocity variation (e.g. Frazzetta and Romano 1984;Guest et al. 1987). For example, Pinkerton and Sparks(1976) estimated that during the 1975 Etna eruption crustsmoved at 0.7 times the velocity of the interior.
Flow velocity is probably easiest to measure at the flowcenter. At this location the measurement will approximatethe maximum flow velocity (Fig. 6). This maximum
Fig. 5 Summary of parametersrequired to estimate effusion ratein an active (main panel) and in-active, partially drained (inset)channel. Notation as follows:A = flow cross-sectional area,d = flow depth, du = depth ofun-drained flow, d1+du = depthof brim full flow, d2+du = depthof below bank flow revealed byinner-levee high stand mark,H = levee height, L = flow levelbelow levee rim (D=H−L),Vmax= maximum flow velocity,w= flow width
Bull Volcanol (2007) 70:1–22 7

velocity can then be used to recreate vertical and horizontalvelocity profiles for the lava flowing in a channel of knowndimensions and with a known or estimated rheology(e.g. Fig. 6). Integrating across these profiles provides oneway of obtaining a mean velocity for use in effusion ratecalculations (e.g. Dragoni 1989; Dragoni et al. 1986; Fink1993; Tallarico and Dragoni 1999).
If we calculate the mean velocity for the velocity profilegiven in Fig. 6, we obtain a mean velocity (vmean) that is67% of the maximum velocity. Thus, to simplify theproblem, the channel cross-section is considered rectangu-lar and mean flow velocity is taken as ∼2/3 of themaximum surface velocity, i.e. Er=0.67 Vmax d w, as usedby Calvari et al. (2003). This is an appropriate approximationfor most cases in which the flow is much wider than it is deep.
Model-based measurements
Flow velocity can also be model-calculated using lavadensity (ρ), acceleration due to gravity (g), channel-floorslope (α) and viscosity (η) in the Jeffreys (1925) equation:
vmean¼ ρ g sinðαÞd2�n η ð1aÞin which n is a constant dependant on channel width, valuesof 3 being used by Booth and Self (1973) for wide channelsand 8 for semi-circular channels (Moore 1987). Now,effusion rate (Er) can be calculated from the measuredchannel dimensions and underlying slope from:
Er¼vmean w d ¼ w ρ g sinðαÞd3� n η ð1bÞ(e.g. Baloga et al. 1995; Harris and Rowland 2001; Harrisand Neri 2002; Jurado-Chichay and Rowland 1995;Keszthelyi and Self 1998; Keszthelyi et al. 2000; Rowlandet al. 2003–2005). Effusion rates can also be obtained in
this manner by integrating the vertical velocity profilethrough the entire flow thickness (Dragoni 1989; Dragoni etal. 1986; Fink 1993; Oddone 1910; Tallarico and Dragoni1999; Soule et al. 2005). In a similar approach, velocityhas been calculated by assuming that the velocity forlava flowing around a super-elevated bend can becalculated following Newton’s second law of motion,i.e. v ¼ r g tan βð Þ½ �1=2, in which r is the radius of curvatureand β is the angle of super-elevation (Heslop et al. 1989).Effusion rate is then obtained by multiplying the cross-sectional area of the flow by the velocity (Heslop et al.1989; Woodcock and Harris 2005). Velocity, and henceeffusion rate, has also been obtained from run-up heights(hup) on cones, i.e. from the kinetic energy required to givethe run-up height via v ¼ 2hupg
� �1=2(Guest et al. 1995).
However, velocities and effusion rates obtained in theseways can sometimes be too high (Kauahikaua et al. 2002;Soule et al. 2004). Over-estimates may result from theassumption of bank-full channel flow in setting a value fordepth in Eqs. 1a and 1b. In channels where below-bank-flow was typical, and in which anomalously high leveesresulted from construction during short overflow eventsduring rare surges or overflow of volumes backed-upbehind blockages (e.g. Bailey et al. 2006; Lipman andBanks 1987), this would cause an over-estimate of thetypical volume flux. Soule et al. (2004) also point out thatapparent run-up features may instead be high stand marksleft by drainage of ponded flow. Use of such features forcalculated flow velocities for the 1823 Keaiwa flow ofKilauea may have resulted in a velocity over-estimate by afactor of 5.
Thus, applying Eqs. 1a and 1b to drained-channelsrequires some assumptions regarding flow depth. Assumingthat the channel was filled to the top would give maximumpossible flow depth and will yield a maximum value forvmean, and hence Er. This would give an over-estimate ofeffusion rates necessary to maintain typical, below-bankflow. Lower flow levels within the channel will reduce d,and hence the derived flow velocities and effusion rates.
As already discussed, channel may have been fed by arange of fluxes, hence leading to a variety of depths.Pulsing or variable flow levels can build characteristicchannel forms where a series of thin overflow units oflimited spatial extent will be emplaced during the pulse-induced overflows (Bailey et al. 2006). Likewise, variationsin the level of flow within the channel can produce high-stand marks on the inner channel wall as well as syn-channelbenches, levees and drain-back features such as driblettrains/ridges (e.g. Lipman and Banks 1987; Woodcock andHarris 2005; Figs. 4 and 7). In such cases, use of the brim-full depth will yield maximum effusion rates during the(possibly brief) periods of highest effusion that built themaximum channel depth. Level markers within the channel
Fig. 6 Velocity profile calculated for a channel of depth 2 m,containing lava with a density of 2,028 kg/m3 (assuming a dense rockvalue of 2,600 kg/m3 and 22% vesicularity) and a viscosity of3,000 Pa s flowing down a 5° slope. Position of the mean velocity ismarked with the dashed line and is 67% of the maximum, surfacevelocity
8 Bull Volcanol (2007) 70:1–22
can be used to estimate the lower (possibly more typical)fluxes that fed the channel. In all cases, the depth of un-drained lava on the channel needs to be considered if thefull depth is to be obtained (e.g. Fig. 7).
Tube-based measurements
As at channels, for lava tubes problems exist regardingmeasurements of tube dimensions and flow depth during, aswell as after, activity. In addition, the same flow velocityproblems apply in the tube as in the channel. These problemsare exaggerated by the impossibility of access to a tubeduring activity, and the unknown, possibly complex, tubeshape (e.g. Calvari and Pinkerton 1999). Where a view ofthe tube-contained lava stream is possible at a skylight,estimates of the stream width and velocity may be possible.The assumption of a semi-circular channel allows cross-sectional area to be estimated. If two skylights are present,velocity may be measured by timing the passage of a markerbetween the two skylights of known separation distance, asdetailed in Tilling and Peterson (1993). The assumptionshere are that the tube takes the straight-line course betweenthe two skylights, that the travel of the marker is notimpeded by cascades, pools or eddies (Tilling and Peterson1993; Tilling et al. 1987), and the marker is not detained bydrag on the roof or sides of the flow. As a result, this will bea minimum velocity, especially at a meandering tube (Tillinget al. 1987). If no skylights are present, then no velocity (andhence effusion rate) estimate is possible.
Drained tubes allow tube dimensions to be measuredafter an eruption, allowing for constraint of the tubedimension and shape. As with channel-contained flow,when calculating the flow cross-sectional area, the assump-
tion that the tube flowed full may yield an over-estimate.Tubes may not necessarily flow full (Kauahikaua et al.1998) and tube dimensions may be increased by thermaland mechanical erosion (e.g. Kauahikaua et al. 1998; Kerr2001). In these cases, the tube cross-section will becomemuch larger than that of the lava flowing in it. Non-tube-filling-flow levels can, however, be determined from stand-lines along the tube wall, as well as from the level of anyun-drained surface within the tube (e.g. Fig. 8).
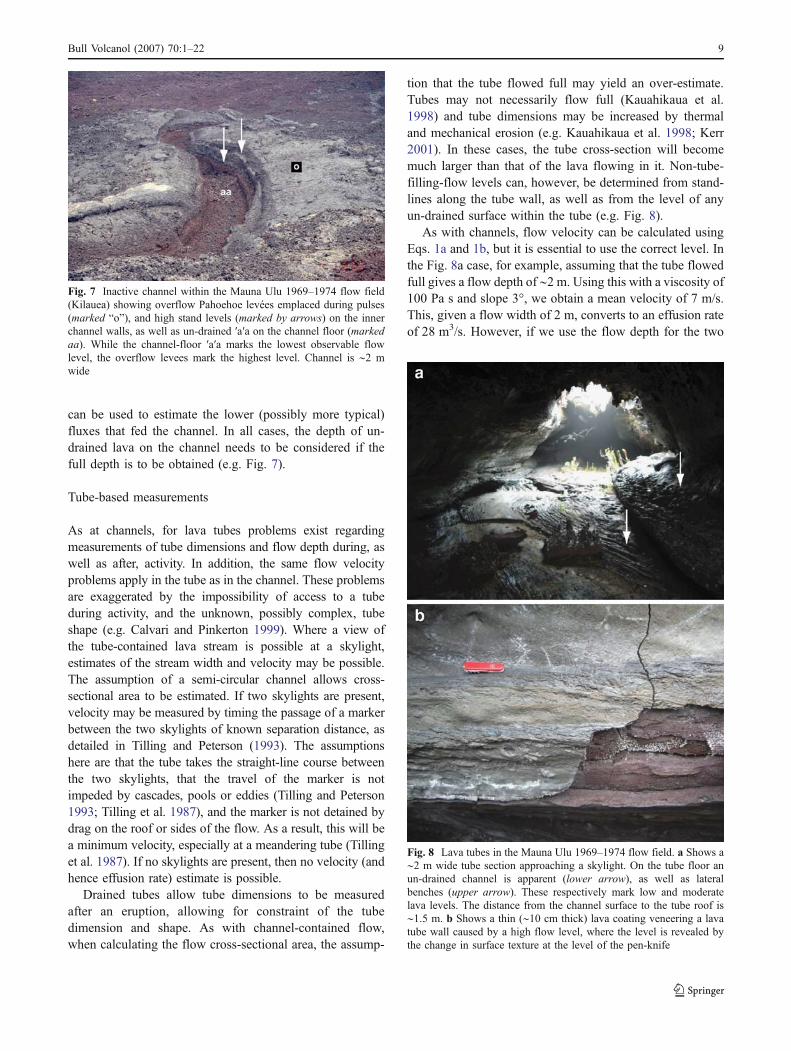
As with channels, flow velocity can be calculated usingEqs. 1a and 1b, but it is essential to use the correct level. Inthe Fig. 8a case, for example, assuming that the tube flowedfull gives a flow depth of ∼2 m. Using this with a viscosity of100 Pa s and slope 3°, we obtain a mean velocity of 7 m/s.This, given a flow width of 2 m, converts to an effusion rateof 28 m3/s. However, if we use the flow depth for the two
Fig. 8 Lava tubes in the Mauna Ulu 1969–1974 flow field. a Shows a∼2 m wide tube section approaching a skylight. On the tube floor anun-drained channel is apparent (lower arrow), as well as lateralbenches (upper arrow). These respectively mark low and moderatelava levels. The distance from the channel surface to the tube roof is∼1.5 m. b Shows a thin (∼10 cm thick) lava coating veneering a lavatube wall caused by a high flow level, where the level is revealed bythe change in surface texture at the level of the pen-knife
Fig. 7 Inactive channel within the Mauna Ulu 1969–1974 flow field(Kilauea) showing overflow Pahoehoe levées emplaced during pulses(marked “o”), and high stand levels (marked by arrows) on the innerchannel walls, as well as un-drained ′a′a on the channel floor (markedaa). While the channel-floor ′a′a marks the lowest observable flowlevel, the overflow levees mark the highest level. Channel is ∼2 mwide
Bull Volcanol (2007) 70:1–22 9

lower levels of 0.5–1.0 m then we obtain mean velocities of0.4–1.7 m/s, and effusion rates of 0.4–3.5 m3/s. Given thatthe bulk mean output rate reported during the eruption was∼3 m3/s (Swanson et al. 1979; Tilling et al. 1987) theselatter values seem more reasonable, with the low effusionrate representing a final, late stage flow that remained, un-drained, in the tube.
Geophysical approaches
Other ways of obtaining effusion rate from field surveysinvolve combining one of the methods listed before tocalculate flow surface velocity with a measurement of thechannel or tube “wet area,” i.e. the area of the channel/tubeoccupied by flowing lava. This can be obtained from geo-electrical, ground penetrating radar or VLF (Very LowFrequency) surveys (e.g. Bozzo et al. 1994; Budetta andDel Negro 1995; Jackson et al. 1987; Kauahikaua et al.1996; Miyamoto et al. 2005).
Volume-based measurements
This method of obtaining time-averaged discharge ratesinvolves measuring the change in volume of a lava flow ordome over a known period of time. The volume emplacedover the given time interval is then divided by time toobtain the time-averaged discharge rate (e.g. Andronico etal. 2005; Behncke and Neri 2003; Burton et al. 2005; Finket al. 1990; Harris and Neri 2002; Mazzarini et al. 2005;Nakada and Fujii 1993; Nakada et al. 1999; Richter et al.1970; Rose 1972; Rossi 1997; Rowland et al. 1999; Sparkset al. 1998; Swanson and Holcomb 1990; Wolfe et al. 1988;Zebker et al. 1996).
One quick and relatively simple means of gainingregular volume measurements at known time intervals isto measure the area of newly emplaced lava, and tomultiply this by a mean thickness estimated from fieldmeasurements (e.g. Andronico et al. 2005; Behncke and Neri2003; Mazzarini et al. 2005; Pinkerton and Sparks 1976;Rossi 1997; Zebker et al. 1996). Repeat (daily or weekly)measurements of any new lava flow areas allow the flowvolumes erupted over these periods to be estimated. Arapid means of measuring the flow area is by walking orflying around the flow perimeter carrying a continuouslyrecording GPS. Dividing the resulting volume by theemplacement time allows calculation of time averageddischarge rate, averaged over the time frame of a fewhours to days. This approach provided the dischargedata given in Fig. 2. For this calculation to be suitable,the emplacement time of the flow must be well known,many measurements of flow thickness need to beobtained along the flow margins, and the edge thicknessmust be representative of the lava body as a whole.
If significant thickening occurs away from the edges, anerror will result from the assumption that lava thicknessesmeasured at the flow edge are typical across the entire flowfield. This may induce large errors for complex flow fieldsemplaced over long periods of time, i.e. in cases wherethick piles of lava can develop within the flow field. Forexample, if we take the mean edge thickness of 3–10 m forthe 1991–1993 Etna lava flow field and multiply by thearea (7.2 km2) we obtain a volume of 22–72×106 m3. Thisis significantly smaller than the actual volume of 231±29×106 m3 due to substantial thickening by up to 96 m (with amean of 32 m) away from the flow field edges (Stevens etal. 1997).
Where accurate pre-, syn- or post-eruption DigitalElevation Models (DEMs) are available, measurements ofthe flow volume can be obtained from DEM subtraction.Given the duration of lava flow activity between the twoDEM-derived volumes time-averaged discharge rate can beobtained by dividing the residual volume by time. Based onan estimated flow thickness of 3 m and an area of 8.2 km2,Rowland (1996) estimated a DRE volume of 0.02 km3 forthe 1995 flow field of Fernandina. Rowland et al. (2003),however, were able to measure pre- and post-eruptiontopography for all locations across the flow, resulting in arevised, more accurate, volume of 0.04 km3. The relativeerror between two DEMs can also lead to significant errorin the volume calculation.
Other methods to estimate flow volumes, and hencetime-averaged discharge rates and mean output rates,include:
1. Generation of DEMs using digitised cartographic mapdata (Stevens et al. 1999).
2. Use of volumes erupted into, and thereby containedwithin, pit craters of known volume (Jackson et al.1975; Richter et al. 1970; Rowland and Munro 1993).
3. Repeat GPS-located laser-range finder measurementsonto an active dome or flow, and/or levelling measure-ments, plus use of maps, photographs, triangulation andphotogrammetry (Nakada and Fujii 1993; Nakada et al.1999; Rose 1972; Rowland and Munro 1993; Sparks etal. 1998).
4. Use of satellite optical or thermal data (Stevens et al.1997; Patrick et al. 2003), laser altimeter (Mazzarini etal. 2005) and/or interferometric radar data (Rowland1996; Rowland et al. 1999, 2003; Zebker et al. 1996)to obtain flow area and thickness, and hence volumeby integrating thickness over the area (e.g. Patrick etal. 2003).
Methodologies, issues, problems, and errors for thesevolume measurement techniques are considered in each ofthe cited studies, where some of the general considerationsdetailed here apply to all data sets.
10 Bull Volcanol (2007) 70:1–22
Sulphur flux based measurements
The petrographic method of Devine et al. (1984) estimatessulfur loss from a magma by comparing the concentrationof sulfur in pre-eruption melt inclusions with that in post-eruption glasses. Using this value of sulfur loss duringdegassing, the volume of magma required to give ameasured sulfur dioxide (SO2) flux can be calculated(e.g. Allard et al. 1994; Andres et al. 1989, 1991; Greenlandet al. 1988; Kazahaya et al. 1994; Stoiber et al. 1986;Sutton et al. 2001, 2003). In addition, Kazahaya et al.(1994) show howmass rates of magma degassingM (in kg/s)can be obtained from the emission rates of magmatic water(QH20), as well as SO2 (QSO2), in:
M ¼ 102QH20
�ΔCH20 ð2aÞ
or
MSO2 ¼ 106MSQSO2
�MSO2ΔCS ð2bÞ
in which ΔCH20 and ΔCS are the decrease in water andsulfur content (wt.%) of magma during degassing, and MS
and MSO2 are the molecular weights of sulfur and SO2.Given the average basaltic andesite sulfur loss (0.0495 wt.%Sulfur) and measured SO2 emission rates at Lascar (2,300±1,120 Mg/d) during 1989, Andres et al. (1991) calculated adegassed magma volume flux of 9.3×10⁵ m3/d.
If all degassed magma is then erupted, these degassedvolume fluxes will equate to effusion rates. Sutton et al.(2003) detail this technique for assessing daily dischargerates from SO2 fluxes for the Kupaianaha—Pu’u ’O’oeruption of Kilauea, where comparisons with VLF-derivedrates were in good agreement. However, this technique willprovide an under-estimate for the discharge rate if previ-ously degassed magma is erupted (e.g. Burton et al. 2005)or an over-estimate if not all of the degassed magma iserupted (e.g. Andres et al. 1991). At Lascar, for example,the degassed volume of 9.3×10⁵ m3/d calculated by Andreset al. (1991) compared with a two orders of magnitudesmaller time averaged-discharge rate for the extrudedvolume forming the Lascar lava dome of 6.3×10³ m3/d.
Use of deformation data
Volumes leaving shallow storage areas to contribute eruptedlava can be estimated from deflation as revealed by, forexample, tilt measurements (e.g. Rowland and Munro1993; Tilling 1987; Tilling et al. 1987; Tryggvason 1986)or synthetic aperture radar (e.g. Fukushima et al. 2005; Luet al. 2005; Massonnet et al. 1995). Complications resultingfrom the dynamic balance between supply to the shallowsystem and drainage of that system complicate any
assumption that the volume of deflation equates to theerupted volume (e.g. Denlinger 1997; Dvorak and Dzurisin1993; Dzurisin et al. 1984). A significant portion of thevolume leaving the shallow system may, for example, beintruded as well as extruded (e.g. Bjornsson et al. 1977;Denlinger 1997; Dvorak and Dzurisin 1993; Dzurisin et al.1984; Harris et al. 2000; Tryggvason 1986). These andother complications, e.g. source shape, sub-surface struc-ture and material property assumptions (e.g. Lu et al. 2005)mean that erupted volumes do not always equate tomeasured volumes of deflation (Fukushima et al. 2005;Lu et al. 2005; Massonnet et al. 1995).
Seismic approaches
Battaglia et al. (2005) present a method to estimate effusionrates from seismic amplitudes, using either the tremorsource amplitude or squared amplitude at any point in time.This was calibrated using data from the 1998 eruption ofPiton de la Fournaise, and tested using data from three othereruptions. Results showed that the use of amplitude in the5–10 Hz bands over-estimated the lava volume, possiblydue to the signal being not directly generated by magmaflow but by gas flow. For two of the three eruptions,however, lava volumes obtained using bands below 5 Hzwere ∼30% lower than field measured volumes, althoughfield measurements themselves may have been over-estimated (Battaglia et al. 2005).
Thermal approach
The thermal methodology for obtaining effusion rates isbased on the work of Pieri and Baloga (1986) and Crispand Baloga (1990). It was adapted to satellite thermal databy Harris et al. (1997a,b) and has since been developedusing thermal data obtained for active lava areas from avariety of satellite based sensors (Table 1) as well asground-based thermal imagers (Calvari et al. 2005; Harriset al. 2006).
The thermal method is based on a simple heat budgetfor an active lava flow in which all heat supplied to theactive flow unit (Qin) is lost from the flow surfaces (Qout), sothat Qin =Qout (Crisp and Baloga 1990; Harris et al. 1997a;Pieri and Baloga 1986). Heat is supplied by advection (Qadv)and crystallization (Qcryst) during cooling between eruptiontemperature and solidus (δT), i.e. Qin =Qadv+Qcryst. Whileheat losses from the flow surface are radiation (Qrad) andconvection (Qconv), heat loss by conduction (Qcond) will alsooccur through the flow base. Thus Qout ¼ Qrad þ Qconv þQcond (Harris and Rowland 2001; Harris et al. 1998, 2005;Keszthelyi and Self 1998; Keszthelyi et al. 2000).
Bull Volcanol (2007) 70:1–22 11

For simplicity, we assume that Qout is dominated by thesurface heat losses. These are defined by:
Qrad¼ A"s T4
surf�T4
amb
� �ð3Þ
Qconv¼ Ahc Tsurf�Tambð Þ ð4Þ
In which A and Tsurf are the area and surface temperatureof the active flow, Tamb is the ambient temperature, and ɛ, σand hc are the surface emissivity, the Stefan Boltzmann
constant and the convective heat transfer coefficients. Heatsupplied by advection and crystallization in cooling throughδT can be described by:
Qadv¼ Er r cp dT ð5Þ
Qcryst ¼ Er ρφcL ð6Þ
in which Er, ρ, cp, φ and cL are the discharge rate, lavadensity, specific heat capacity, crystallisation in coolingthrough δT, and latent heat of crystallisation of lava,
Table 1 Application and development of the thermal approach to extract lava discharge rates, showing the range of eruption types, data and lavasurface temperature assumptions used to calculate active lava area, and hence heat flux (Eqs. 3–4)
Volcano Eruption/years Eruption type / effusiveor extrusive style
Data Assumed Tsurfrange (°C)
Reference
AscraeusMons
Planetary Channelized martian flow Heat loss model Calculated Crisp andBaloga (1990)
Bezymianny 2000 Lava dome AVHRR, MODIS 100–500 Steffke (2005)Erebus 1985 & 1989 Lava lake TM Not assumed Harris et al. (1999a)Erebus 1980 Lava lake AVHRR 578–715 Harris et al. (1999b)Erta Ale 1986 Lava lake TM Not assumed Harris et al. (1999a)Etna 1991–1993 Flank eruption (channel &
tube fed ′a′a)AVHRR 100–500 Harris et al. (1997a)
Etna 1980–1999a Flank & summit eruptions(channel & tube fed ′a′a)
AVHRR, ATSR, TM 100–500 Harris et al. (2000)
Etna November 1999 Fountain-fed (channel fed ′a′a) AVHRR, ETM+ 100–1000 Harris andNeri (2002)
Etna 2001b Summit & flank eruption(channel & tube fed ′a′a)
AVHRR 100–1000 Lautze et al. (2004)
Fernandina 1995 Flank eruption (channel fed ′a′a) ATSR 75–500 Rowland et al.(2003)
Kilauea 1991 Tube-fed Pahoehoe AVHRR & TM 100–500 Harris et al. (1998)Kilauea 1991 Lava lake (Pu′u ′O′o) TM Not assumed Harris et al. (1999a)Krafla 1980–1984c Fissure eruptions (fountain & channel
fed ′a′a)AVHRR 97–425 Harris et al. (2000)
Mt.Cleveland
2001 ′A′a lava flow down the flanksof a stratocone
AVHRR 100–500 Smith (2005)
Nyiragongo 1987 Lava lake TM Not assumed Harris et al. (1999a)Okmok 1997 ′A′a lava flow (some of it ponded) AVHRR 100–500 Patrick et al. (2003)Santiaguito 1987–2000 Dome & silicic lava flow extrusion TM & ETM+ Not assumed Harris et al. (2003)Santiaguito 2000 Silicic lava flow extrusion ETM+ Not assumed Harris and
Neri (2002)Santiaguito 2000–2002 Silicic lava flow extrusion TM & ETM+ Not assumed Harris et al. (2004)Stromboli 1985–1986 Flank eruption (channel & tube fed ′a′a) AVHRR 100–500 Harris et al. (2000)Stromboli 2002–2003 Flank eruption (channel & tube fed ′a′a) AVHRR, MODIS 100–1,000 Calvari et al. (2005)Stromboli 2002–2003 Flank eruption (channel & tube fed ′a′a) FLIR Not assumed Harris et al. (2006)
Acronyms used are: AVHRR (Advanced Very High Resolution Radiometer), ATSR (Along Track Scanning Radiometer), TM (Thematic Mapper),ETM+(Enhanced Thematic Mapper Plus) and FLIR (Forward Looking Infrared Radiometer)
aMarch 1981, February 1981, 1983, 1984, March–July 1985, December 1985, 1986–87, September 1989, September–October 1989, 1991–1993,1996, and 1999 eruptions
b January–July SE Crater eruption and July–August S. Flank eruptionc July 1980, October 1980, January–February 1981 and 1984 eruptions.
12 Bull Volcanol (2007) 70:1–22

respectively. The two heat supply terms have discharge ratein common so that Qout =Qin can be written
QradþQconv¼ Erρ cpδTþφcL� � ð7Þ
Rearranging allows calculation of Er from
Er ¼ðQradþQconvÞ=ρ cpδTþ φcL� � ð8Þ
Given that this method takes into account the volumeflux necessary to account for cooling over a given time, thiswill yield time-averaged discharge rate (Wright et al.2001a). In all the cases given in Table 1, measured valuesfor Qrad and Qconv are used with assumed values for ρ, cp,δT, φ and cL. Assumed values for ρ, cp, and φ differ bycase, for example, post eruption crystallization is differentfor Etna and Kilauea, and differing vesicularities will causebulk values for ρ and cp to vary (Table 2). Harris et al.(2000) provide a sensitivity analysis for the effect of varyingeach of the assumed values in Eq. 8 on calculated Er.
Satellite-based methodology
Calculation of Qrad and Qconv have generally been obtainedfrom satellite data (e.g. Oppenheimer 1991; Oppenheimeret al. 1993; Harris et al. 1997a,b, 1998). In many cases avalue, or range of values, for the surface temperature of theactive flows is assumed in order to extract active flow area.In most cases, active lava flow areas have been obtainedfrom Advanced Very High Resolution Radiometer(AVHRR) or Thematic Mapper (TM) data using anassumed range of reasonable surface temperatures to obtainsurface area. This involved modeling a pixel containing
lava at an assumed temperature (Tsurf) surrounded byambient ground at a known temperature (Tback). Now thepixel portion occupied by active lava ( p) can be calculated,using the pixel integrated temperature (Tint) in the followingmixture model (Dozier 1981; Harris et al. 1997a, 1999a;Matson and Dozier 1981; Oppenheimer et al. 1993;Rothery et al. 1988):
L l;Tintð Þ¼ pL l;Tsurfð Þþ 1� pð ÞL l;Tbackð Þ ð9Þin which L is the Planck function for a blackbody atwavelength 1λ.
If p (i.e. lava area) is known, Eq. 9 can be solved for Tsurf(Dehn et al. 2002). Similarly a range of 100–1,000°C hasbeen assigned for Tsurf to solve for p (Table 1). In this case,the only variable in Eqs. 3 and 4 becomes A; Tsurf, σ, hc andTamb either being constant or assumed (Table 2). As pointedout by Wright et al. (2001a), in such a case all theassumptions causes Eq. 8 to reduce to:
Er¼mA = c ð10Þwhich can be further reduced to Er= x A, in which x=m/c,m and c being the coefficients that define a directrelationship between time-averaged DRE discharge rateand active lava flow area. The coefficients m and c are,respectively, defined by the values assumed for the heatloss and heat supply models:
m ¼ s T4surf�T4
surf
� �þhc Tsurf�Tambð Þ ð11Þ
c ¼ ρ cp δTþφcL� � ð12Þ
Table 2 Values used to calibrate the thermal approach at Kilauea (Harris et al. 1998), Etna (Harris et al. 2000), Krafla (Harris et al. 2000),Stromboli (Calvari et al. 2005) and Santiaguito (Harris et al. 2002, 2003) with resultant m, c and x values
Parameter Kilauea Etna Krafla Stromboli Santiaguito
Tsurf (°C) 100–500 100–500 100–500 100–500 125–250Tamb (°C) 35 0 0 0 20σ (W m−2 K−4) 5.67×10⁻⁸ 5.67×10⁻⁸ 5.67×10⁻⁸ 5.67×10⁻⁸ 5.67×10⁻⁸
Hc (W m−2K−1) 0 ∼10 ∼10 ∼10 35–75DRE ρ (kg m−3) 2,600±100 2,600 2,600 2,600 2,600DRE cp (J kg
−1 K−1) 1,225 1,150 1,150 1,150 1,150Vesicularity (%) 10–40 10–34 10–34 10–22 10–30Bulk ρ (kg m−3) 1,560–2,340 1,720–2,340 1,720–2,340 2,030–2,340 1,820–2,340Bulk cp (J kg
−1 K−1) 735–1,100 810–1,035 810–1,035 900–1,035 805–1,035Cooling range (K) 315–385 200–350 200–350 200–350 200–330φ (%) 2–45 45 45 45 0–45CL (J kg−1) 3.5×10⁵ 3.5×10⁵ 3.5×10⁵ 3.5×10⁵ 3.5×10⁵
m (×103 W m−2) 0.8–20 1.8–25 1.8–25 1.8–25 10–13C (×108 J m−3) 8.3–6.9 8.8–7.6 8.8–7.6 8.8–9.6 12–2.9X (×10−6 m s−1) 0.9–29 2.1–33 2.1–33 2.1–26 8.5–44
Moving across the table from basaltic to silicic flows, the latter typically have lower surface temperatures than the former (Harris et al. 2002).Note, also for Kilauea assumed post-eruption crystallization rates are the lowest and the range of vesicularities the highest. As a result x increasesto the right across the table, where increasing x means that to cover a given area a higher discharge rate will be required.
Bull Volcanol (2007) 70:1–22 13

so that
x ¼ m=c
¼ σ Tsurf4�Tamb
4� �þhc Tsurf�Tambð Þ� ��
ρ cpδTþ φcL� �� �
ð13Þ
As long as appropriate values are used in setting x,reasonable discharge rates should be obtained from Er = x A.In solving Eq. 13 the most contentious, or difficult to setvalues are hc, Tsurf and δT. These have been set on a case-by-case basis to suit the eruption conditions (lava temper-ature, crystallinity, vesicularity, etc.) appropriate for eachone. Published values used during application of thisapproach using satellite data for lava flows and domes atKilauea, Etna, Krafla, Stromboli and Santiaguito are givenin Table 2.
To illustrate the application of this approach, thecombinations of values used by Harris and Neri (2002) toextract time-averaged discharge rates from AVHRR data forthe October–November 1999 eruption of the Bocca Nuova(Etna) are given in Table 3. Each of these models was usedto provide a range of time-averaged discharge rates, takinginto account the full range of uncertainty in the assumedvalues. Results can be compared with the time-averageddischarge rates obtained from daily mapping of the flow
area and thickness using hand-held and helicopter flownGPS. For this case, the range of discharge rates obtainedfrom the ground-based and satellite-based approaches haveuncertainties of 18 and 50%, respectively. However, thetwo data sets show excellent consistency revealing the sametemporal trends, with the ground-based estimates having anarrower range of uncertainty, but typically falling with thesatellite-based range (Fig. 9). Generally, time-averageddischarge rates simultaneously measured on the groundand from satellite-sources show reasonable agreement(Table 4; Fig. 10), indicating that the assumed values foreach case have provided an appropriate value for Eq. 13.
By combining and re-arranging the equations thatcomprise the heat budget for an active lava flow we candraw a direct link between time-averaged discharge rate andactive lava flow area (Eqs. 9, 10, 11, and 12). Thus, inagreement with Pieri and Baloga (1986), the satellite-basedtechnique has assumed a linear relationship between time-averaged discharge rate and active lava flow area (Wright etal. 2001a). This has involved defining the linear propor-tionality relationship that Pieri and Baloga (1986) suggestedcould be formulated between discharge rate and flow areausing the typical thermal parameters for an active lava flow.This relationship is defined by the lava heat loss properties,which are mostly controlled by surface temperature, and theheat supply properties. In effect the underlying assumption
Table 3 Values used to calibrate the thermal approach at Etna using AVHRR data obtained during 1999–2002, and following the values andthermal models given in Harris and Neri (2002)
Parameter Cool model Hot model (1) Hot model (2) Hot model (3)
Tsurf (°C) 100 500 700 1,000Tamb (°C) 0 0 0 0σ (W m−2 K−4) 5.67×10⁻⁸ 5.67×10⁻⁸ 5.67×10⁻⁸ 5.67×10⁻⁸
Hc (W m−2 K−1) 5 9 10 11Qcond (W m−2) 545 6,550 6,550 6,550A (m2) Maximum Moderate Moderate MinimumDRE ρ (kg m−3) 2,600 2,600 2,600 2,600DRE cp (J kg
−1 K−1) 1,225 1,225 1,225 1,225Vesicularity (%) 10 22 22 22Bulk ρ (kg m−3) 2,340 2,020 2,020 2,020Bulk cp (J kg
−1 K−1) 1,100 955 955 955Cooling range (K) 200 350 350 350φ (%) 45 45 45 45CL (J kg−1) 3.5×10⁵ 3.5×10⁵ 3.5×10⁵ 3.5×10⁵
M (×103 W m−2) 1.8 31 64 167C (×108 J m−3) 8.9 10 10 10X (×10−6 m s−1) 2.1 31 64 167
Active flow area (A) is extracted from the satellite data using the relevant, assumed, Tsurf in Eq. 8. It is then used with the corresponding valuesgiven for each model to estimate effusion rate from Er= x A. Thus, a lower x value is used with the large flow area extracted for the cool modelcase (Tsurf = 100°C), than for the hot models (Tsurf = 500–1,000°C). Parameter m, in this case considers conduction through the flow base (Qcond),so that Eq. 10 is m ¼ σ T4
surf � T4amb
� �þ hc Tsurf � Tambð Þ þ Qcond: Qcond is calculated following Fouriers Law where heat is conducted over athermal boundary layer (the basal crust) of thickness h that separates the hot core at Tcore from the cooler, underlying surface at Tbase. ThusQcond ¼ k Tcore � Tbaseð Þ=h½ �, in which k is thermal conductivity of vesicular basalt. Following Harris et al. (2000), Qcond is set, for the coolmodel, using k, Tcore, Tbase and h of 3 W m−1 K−1 , 1,100°C, 580°C and 3 m. For the hot model values of 2.5 W m−1 K−1 , 1,100°C, 580°C and0.1 m are used.
14 Bull Volcanol (2007) 70:1–22

is that the potential area covered by a lava flow at any giveneffusion rate is cooling-limited (Guest et al. 1987). It willthus fail if the flow is volume or topographically limited(Patrick et al. 2003). Such problems and sources of errordue to the assumptions involved in obtaining area from thesatellite data are reviewed in Harris and Neri (2002) andPatrick et al. (2003). Thus, in cases where this approach hasbeen applied, a linear relationship between discharge rate andactive lava flow area has, in effect, been forced upon the data(Fig. 11). However, setting the x value appropriate to thevolcano, eruption or topographic conditions, the good fit withindependent ground data indicates that the approach isgenerally valid.
FLIR-based methodology
Acquisition of thermal data using hand-held imagers allowsthermal images of high spatial resolution and dynamicrange to be collected. At Stromboli thermal images of the
active flow field with a spatial resolution of ∼2 m werecollected on a near-daily basis during the 2002–2003effusive eruption to support routine monitoring (Calvari etal. 2005). Given detailed, unsaturated temperature data forthe active flow surface, heat losses were calculated on apixel-by-pixel basis. Discharge rates were then calculatedby summing the heat loss obtained for each lava pixel andapplying Eq. 8. This methodology, including issuesregarding identification of active lava pixels, is detailed inHarris et al. (2006). In this case, both flow area andtemperature are variable such that effusion rate is now notjust a function of flow area, but also temperature. However,
Table 4 Published comparisons of field-based instantaneous effusion rates and thermally-derived time-averaged discharge rates for cases wherenear-simultaneous measurements have been possible
Case Ground-basedmethod
Thermaldata
Ground-derivedvalue (m3 s−1)
Thermally-derivedvalue (m3 s−1)
Source
Kilauea, (23 July 1991) VLFa ETM+ 1.36±0.14 1.76±0.27 Harris et al. (1998)Kilauea, (11 October 1991) VLFa ETM+ 0.89±0.09 0.78±0.27 Harris et al. (1998)Etna (20 April 1983) Channel-based AVHRR 14.3±3.0 11.4±1.4 Harris et al. (2000)Etna (25 April 1983) Channel-based AVHRR 28.1±8.5 24.9±5.1 Harris et al. (2000)Etna (27 April 1983) Channel-based AVHRR 20.4±6.8 9.3±2.8 Harris et al. (2000)Etna (23 June 1983) Channel-based AVHRR 2.6±0.5 3.5±1.3 Harris et al. (2000)Santiaguito (23 January 2000) Channel-based ETM+ 0.48±0.17 0.48±0.09 Harris et al. (2003)Stromboli (31 May 2003) Channel-based FLIR 0.85±0.75 0.55±0.35 Harris et al. (2006)
a Following the method of Kauahikaua et al. (1996)
Fig. 9 Range of lava discharge rate calculated using the thermalapproach with AVHRR data (grey zone) and ground-based approaches(black zone) during the 1999 eruption of the Bocca Nouva (Etna).Range of satellite based estimated is obtained using the range of xvalues given in Table 3. The ground-based range is obtained frommeasuring flow area emplaced over a known time period, multiplyingby a thickness of 2.5–3.0 m and dividing by emplacement duration
Fig. 10 Comparison of same day satellite-based (thermally-derived)and ground-derived discharge rates. In each case, the mid-point ofeach measurement range is plotted. A slight difference between the45° line (dashed-line), the line along which all points should fall ifthere were perfect agreement, and the actual trend of the best fit (solid-line) between the two data sets is apparent. This shows that thesatellite-based approach provides a range of discharge rates with mid-points that are slightly higher than the ground-based range. Etna dataare from Calvari and Harris (unpublished data), Stromboli from Harriset al. (2006), Kilauea from Harris et al. (1998), and Santiaguito fromHarris et al. (2003, 2004)
Bull Volcanol (2007) 70:1–22 15

area is still one of the two variables used to calculatedischarge rate. The same applies for ground-basedapproaches where time-averaged discharge rate obtainedfrom mapping the flow area emplaced in a known time,multiplying by average thickness, and dividing by em-placement duration. In this case area is still one of the twovariables used to calculate discharge rate. In these cases, alinear relationship between discharge rate and flow area andtemperature, or between discharge rate and flow area andthickness, will be forced. Thus, these data also show apositive linear relationship between discharge rate andactive lava area (Fig. 12). The best fit to this relationshipimplies an x value (in Er = x A) in the vicinity of 20–40×10−6 m/s.
Use for hazard monitoring: a case study from MountEtna
The main threat from volcanic activity on Etna is posed byeffusion of lava flows either from the summit craters orfrom fissures on the lower flanks (Guest and Murray1979). During the past 25 years damage to buildings,infrastructure, and cultivated areas occurred during the1981, 1983, 1991–1993, 2001, and 2002–2003 eruptions.The 1981 eruption from vents between 1,800 and 2,250 mon the north–east flank, sent flows towards Randazzo(population 11,200) causing $10 million of damage(McClelland et al. 1989). The eruptions of 1983, 2001and 2002–2003 caused significant damage to south flankski facilities (Andronico et al. 2005; Barberi et al. 1993,2003; Frazzetta and Romano 1984) and posed a threat toNicolosi, a town of population 6,200 on the south flank.The 1991–1993 eruption posed a significant hazard toZafferana Etnea (population 8,100), requiring lava diver-sion to protect the town (Barberi et al. 1993). The 2002–2003 eruption destroyed the north flank ski-complex,damaged that of the south flank (Andronico et al. 2005),and posed a potential threat to the north flank town ofLinguaglossa (population 5,300). Opening of vents at lowelevations on the flanks of the volcano poses greaterhazard due to the higher concentration of towns andvillages at these elevations, as well as intensive agricul-ture, particularly below the 1,000 m elevation. Eruptionsfrom low-elevation vents in 1669 and 1928, respectively,damaged numerous towns, including portions of the city ofCatania (Crisci et al. 2003), and the town of Mascali(Chester et al. 1999; Duncan et al. 1996).
Measurement of effusion rate can play a role inassessing the likely hazard posed by an active flow. Peakeffusion rate has been shown to play a role in determiningmaximum flow length (Pinkerton and Wilson 1994;Walker 1973). On Etna there also appears to be an inverserelationship between vent elevation and maximum effu-sion rate (Wadge et al. 1994). It is thus a critical parameterwhen considering for maximum lava flow run-out distanceand hazard (Calvari and Pinkerton 1998; Kilburn 1996,2000, 2004; Rowland et al. 2005). Application ofempirical formulas designed to relate maximum flowlength to effusion rate can provide a good approximationfor potential extension of channel-fed single flow units(Calvari and Pinkerton 1998; Kilburn 2000; Pinkerton andWilson 1994). Such relationships have been extensivelyused on Etna for rapid hazard evaluation for civilprotection purposes during on-going eruptive crises. Insuch cases, preliminary estimation of the maximumdistance that a flow may reach, given the currentinstantaneous effusion rate, is required in a timely fashion.Use of finite element and thermo-rheological models also
Fig. 12 Discharge rate versus active lava flow area for Stromboli(2002–2003, white circles) derived by applying the thermal approachto FLIR data (Harris et al. 2006) and Etna (Bocca Nuova, 1999, blacksquares) using daily measurements of flow area and thickness (Harrisand Neri 2002)
Fig. 11 Satellite-derived lava area and discharge rates given by these,revealing the forced linear relationship between active lava area anddischarge rate. Data are from Harris et al. (2000) (for Etna, 1980–1999eruptions), Harris et al. (1998) (for Kilauea, 1991), Calvari et al.(2005) (for Stromboli, 2002–2003), Harris et al. (2003, 2004) (forSantiaguito, 1986–2003) and Rowland et al. (2003) (for Fernandina’s,1995). For clarity, only the relationships obtained for the minimum xvalue given in Table 2 are plotted
16 Bull Volcanol (2007) 70:1–22

allow likely inundation zones to be assessed (e.g. Costaand Macedonio 2005; Crisci et al. 2003, 2004; Favalli etal. 2005; Harris and Rowland 2001; Ishihara et al. 1990;Wadge et al. 1994).
Complications occur when prolonged lava supply pro-duces long-lived compound flow fields, often fed bycomplex tube systems. In these cases, insulation of lavaflowing in tubes greatly reduces cooling rates and thusincreases the cooling-limited distance that a flow canextend at a given effusion rate (Keszthelyi 1995; Keszthelyiand Self 1998). In such cases final flow lengths can bemuch longer than expected (Calvari and Pinkerton 1998;Kauahikaua et al. 1998; Pinkerton and Wilson 1994). It is,however, very difficult to model and predict lava tubedevelopment because tube formation depends on a numberof stochastic variables, including stability and duration oflava supply from the source (Calvari and Pinkerton 1998;Kauahikaua et al. 1998). Unfortunately, the influence ofthese parameters on the final size of a flow field cannot bestated a priori. One way to promptly evaluate the effect oflava tubes in increasing the maximum extent of a lava flowis through frequent thermal mapping (e.g. Andronico et al.2005; Burton et al. 2005), which allows detailed mappingof tubes and new breakouts (Kauahikaua et al. 2003). Inthese cases, new breakouts from the exits of lava tubes canbe recognised as first-order ephemeral vents (Calvari andPinkerton 1998) and used as source-vents of new arterialflows for successive simulations.
Direct field measurements of instantaneous effusion ratethroughout eruptions at Etna are often difficult (Bailey et al.2006; Behncke and Neri 2003; Calvari et al. 1994, 2003;Frazzetta and Romano 1984; Harris and Neri 2002;Pinkerton and Sparks 1976). Field surveys are challengingduring initial phases of an eruption when effusion rate is amaximum, lava flows are expanding at high speed, andstrong explosions, fountaining and lava spattering areoccurring at the master vent (Pinkerton 1993). Also,measurements are difficult during more complex eventswhen the eruptive fissure system is extremely long and lavaoutput takes place from a number of different vents to feedmultiple flows spread across a large area, such as duringEtna’s 2001 flank eruption (Behncke and Neri 2003;Calvari and INGV-Catania 2001). In all these cases, thesynoptic view afforded by satellite-based sensors hasproved effective in allowing flow-field-wide time-averageddischarge rate to be estimated (Harris et al. 1997a, 2000;Harris and Neri 2002; Lautze et al. 2004). Most of thesatellite-derived discharge rate estimates have involved theuse of 1 km pixel thermal data from AVHRR, available atleast four times a day (as summarized in Table 4). Duringthe July–August 2001 and 2002–2003 eruptions, AVHRR-derived discharge rates were calculated on a daily basis andused to update predictions for the likely maximum flow
length (L). This was achieved through applying of theempirical formula proposed by Calvari and Pinkerton(1998) and corrected in Wright et al. (2001b), i.e.L ¼ 103:11E
0:47
r . The length of 6.4 km calculated for flowfed at a peak Er of 30 m3/s during the 2001 eruption was inexcellent agreement with its final length of 6.5 km, whichmeant that it stopped ∼3 km short of Nicolosi.
Conclusions
A lack of precision in the measured or assumed valuesrequired to obtain reliable ground- and space-basedeffusion rate measurements means that estimates areusually subject to large errors and/or are quoted over arange of values. However, comparison of effusion ratesmeasured simultaneously using ground-based techniquesand/or satellite sensors show good cross-techniqueagreement (Table 4; Fig. 10). This agreement shows thatreliable estimates can be made if each approach is appliedconsistently.
The three most important factors to take into accountwhen giving an effusion rate measurement, or when using ameasurement taken from the literature, are as follows.
1. The time scale of the measurement, i.e. the time-periodover which a value was averaged. It then needs to bedetermined whether the degree of time averaging isappropriate to the application for which it is to be used.
2. The spatial scale of the measurement. Details as towhether the measurement considers total supply to theentire active flow field, or local supply to a single lavaflow within that field, need to be available.
3. The measurement technique, its accompanying assump-tions and potential errors.
Clarification of definitions used, as well as the temporaland spatial scales of effusion rate measurements, facilitateseffusion rate measurement using well-tested formulae.Definition and technique standardization improves thequality of data for input into higher level applications thatrely on volume flux data to understand and model lavaflows, shallow system dynamics, as well as monitoringefforts during on-going eruptions.
Acknowledgements This paper benefited of the many discussionsthroughout the years with Harry Pinkerton and John Guest, and wasstimulated by the many questions raised by Franco Barberi. Themanuscript benefited from reviews by Dave Rothery and LionelWilson, as well as by Lucia Gurioli. Alessandro Bonaccorso, INGV-CT Director, is thanked for having supported and funded thisresearch. Additional support for AJLH came from NASA GrantNNG04G064G “New Tools for Advanced Hot-Spot Tracking UsingMODIS Thermal Alerts”. Support for JD was provided through theAlaska Volcano Observatory and a grant from the United StatesGeological Survey.
Bull Volcanol (2007) 70:1–22 17

References
Allard P (1997) Endogenous magma degassing and storage at MountEtna. Geophys Res Lett 24:2219–2222
Allard P, Carbonnelle J, Metrich N, Loyer H, Zettwoog P (1994)Sulfur output and magma degassing budget of StromboliVolcano. Nature 368:326–330
Anderson SW, Stofan ER, Plaut JJ, Crown DA (1998) Block sizedistributions on silicic lava flow surfaces: implications foremplacement conditions. Bull Geol Soc Am 110:1258–1267
Andres RJ, Kyle PR, Stokes JB, Rose WI (1989) SO2 from episode48A eruption, Hawaii: sulfur dioxide emissions from the episode48A East Rift zone eruption of Kilauea Volcano, Hawaii. BullVolcanol 52:113–117
Andres RJ, Rose WI, Kyle PR, deSilva S, Francis P, Gardeweg M,Moreno Roa H (1991) Excessive sulfur dioxide emissions fromChilean volcanoes. J Volcanol Geotherm Res 46:323–329
Andronico D, Branca S, Calvari S, Burton M, Caltabiano T, CorsaroRA, Del Carlo P, Garfi G, Lodato L, Miragila L, Murè F, Neri M,Pecora E, Pompilio M, Salerno G, Spampinato L (2005) A multi-disciplinary study of the 2002–03 Etna eruption: insights into acomplex plumbing system. Bull Volcanol 67:314–330
Bailey JE, Harris AJL, Dehn J, Calvari S, Rowland SK (2006) Thechanging morphology of an open lava channel on Mt. Etna. BullVolcanol 68:497–515
Baloga S, Pieri D (1986) Time-dependent profiles of lava flows.J Geophys Res 91:9543–9552
Baloga S, Spudis PD, Guest JE (1995) The dynamics of rapidlyemplaced terrestrial lava flows and implications for planetaryvolcanism. J Geophys Res 100:24509–24519
Barberi F, Carapezza ML, Valenza M, Villarri L (1993) The control oflava flow during the 1991–1992 eruption of Mt. Etna. J VolcanolGeotherm Res 56:1–34
Barberi F, Brondi F, Carapezza ML, Cavarra L, Murgia C (2003)Earthen barriers to control lava flows in the 2001 eruption of Mt.Etna. J Volcanol Geotherm Res 123:231–243
Barmin A, Melnik O, Sparks RSJ (2002) Periodic behavior in lavadome eruptions. Earth Planet Sci Lett 199:173–184
Battaglia J, Aki K, Staudacher T (2005) Location of tremor sourcesand estimation of lava output using tremor source amplitude onthe Piton de la Fournaise volcano: 2. Estimation of lava output.J Volcanol Geotherm Res 147:291–308
Behncke B, Neri M (2003) The July–August 2001 eruption of Mt.Etna (Sicily). Bull Volcanol 65:461–476
Bjornsson A, Saemundsson K, Einarsson P, Tryggvason E, GronvoldK (1977) Current rifting episode in north Iceland. Nature266:318–322
Blake S (1990) Viscoplastic models of lava domes. In: Fink JH (ed)Lava flows and domes. Springer, Berlin Heidelberg New York,pp 88–126
Blake S, Bruno BC (2000) Modelling the emplacement of compundlava flows. Earth Planet Sci Lett 184:181–197
Booth B, Self S (1973) Rheological features of the 1971 Mount Etnalavas. Phil Trans R Soc Lond 274:99–106
Bozzo E, Coltelli M, Merlanti LSF, Tabacco I (1994) Geoelectro-magnetic survey on the lava tube of the 1991–1993 Etnaeruption. Acta Vulcanol 4:125–133
Branca S, Del Carlo P (2005) Types of eruptions of Etna volcano AD1670–2003: implications for short-term eruptive behaviour. BullVolcanol 67:732–742
Budetta G, Del Negro C (1995) Magnetic field changes on lava flowto detect lava tubes. J Volcanol Geotherm Res 65:237–248
Burton MR, Neri M, Andronico D, Branca S, Caltabiano T, Calvari S,Corsaro RA, Del Carlo P, Lanzafame G, Lodato L, Miraglia L,Salerno G, Spampinato L (2005) Etna 2004–2005: an archetype
for geodynamically-controlled effusive eruptions. Geophys ResLett 32:L09303, DOI 10.1029/2005GL022527
Calvari S, INGV-Catania (2001) Multidisciplinary approach yieldsinsight into Mt. Etna 2001 eruption. EOS Trans Am Geophys Un82:653–656
Calvari S, Pinkerton H (1998) Formation of lava tubes and extensiveflow field during the 1991–93 eruption of Mount Etna. J GeophysRes 103:27291–27302
Calvari S, Pinkerton H (1999) Lava tube morphology on Etna andevidence for lava flow emplacement mechanisms. J VolcanolGeotherm Res 90:263–280
Calvari S, Coltelli M, Neri M, Pompilio M, Scribano V (1994) The1991–93 Etna eruption: chronology and geological observations.Acta Vulcanol 4:1–15
Calvari S, Neri M, Pinkerton H (2003) Effusion rate estimations duringthe 1999 summit eruption on Mount Etna, and growth of twodistinct lava flow fields. J Volcanol Geotherm Res 119:107–123
Calvari S, Spampinato L, Lodato L, Harris AJL, Patrick MR, Dehn J,Burton MR, Andronico D (2005) Chronology and complexvolcanic processes during the 2002–2003 flank eruption atStromboli Volcano (Italy) reconstructed from direct observationsand surveys with a hand-held thermal camera. J Geophys Res110:B02201, DOI 10.1029/2004JB003129
Cashman KV, Mangan MT, Newman S (1994) Surface degassing andmodifications to vesicle size distributions in active basalt flows.J Volcanol Geotherm Res 61:45–68
Chester DK, Duncan AM, Dibben C, Guest JE, Liste PH (1999)Mascali, Mount Etna region, Sicily: an example of Fascistplanning during the 1928 eruption and its continuing legacy.Nat Haz 19:29–46
Costa A, Macedonio G (2005) Numerical simulation of lava flowsbased on depth-averaged equations. J Geophys Res 32:L05304,DOI 10.1029/2004GL021817
Crisci GM, Di Gregorio S, Rongo R, Scarpelli M, Spataro W, CalvariS (2003) Revisiting the 1669 Etnean eruptive crisis using acellular automata model and implications for volcanic hazard inthe Catania area. J Volcanol Geotherm Res 123:211–230
Crisci GM, Rongo R, Di Gregorio S, Spataro W (2004) Thesimulation model SCIARA: the 1991 and 2001 lava flows atMount Etna. J Volcanol Geotherm Res 132:253–267
Crisp J, Baloga S (1990) A method for estimating eruption rates ofplanetary lava flows. Icarus 85:512–515
Crisp J, Baloga S (1994) Influence of crystallization and entrainmentof cooler material on the emplacement of basaltic aa lava flows.J Geophys Res 99:11819–11831
Dehn J, Dean KG, Engle K, Izbekov P (2002) Thermal precursors insatellite images of the 1999 eruption of Shishaldin volcano. BullVolcanol 64:507–519, DOI 10.1007/s00445-002-0227-0
Denlinger RP (1990) A model for dome eruptions at Mount St.Helens, Washington based on subcritical crack growth. In: FinkJH (ed) Lava flows and domes. Springer, Berlin Heidelberg NewYork, pp 70–87
Denlinger RP (1997) A dynamic balance between magma supply anderuption rate at Kilauea Volcano, Hawaii. J Geophys Res102:18091–18100
Denlinger RP, Hoblitt RP (1999) Cyclic eruptive behavior of silicicvolcanoes. Geology 27:459–462
Devine JD, Sigurdsson H, Davies AN, Self S (1984) Estimates ofsulfur and chlorine yield to the atmosphere from volcaniceruptions and potential climatic effects. J Geophys Res89:6309–6325
Dozier JA (1981) A method for satellite identification of surfacetemperature fields of subsurface resolution. Rem Sens Environ11:221–229
Dragoni M (1989) A dynamical model of lava flows cooling byradiation. Bull Volcanol 51:88–95
18 Bull Volcanol (2007) 70:1–22

Dragoni M, Tallarico A (1994) The effect of crystallization on therheology and dynamics of lava flows. J Volcanol Geotherm Res59:241–252
Dragoni M, Bonafede M, Boschi E (1986) Downslope flow models ofa Bingham liquid: implications for lava flows. J VolcanolGeotherm Res 30:305–325
Dragoni M, Pondrelli S, Tallarico A (1992) Longitudinal deformationof a lava flow: the influence of Bingham rheology. J VolcanolGeotherm Res 52:247–254
Duncan AM, Dibben C, Chester DK, Guest JE (1996) The 1928eruption of Mount Etna Volcano, Sicily, and the destruction ofthe town of Mascali. Disasters 20:1–20
Dvorak JJ, Dzurisin D (1993) Variations in magma supply rate atKilauea Volcano, Hawaii. J Geophys Res 98:22255–22268
Dzurisin D, Koyanagi RY, English TT (1984) Magma supply andstorage at Kilauea Volcano, Hawaii. J Volcanol Geotherm Res21:177–206
Favalli M, Pareschi MT, Neri A, Isola I (2005) Forecasting lava flowpaths by a stochastic approach. Geophys Res Lett 32:L03305,DOI 10.1029/2004GL021718
Fink JH (1993) The emplacement of silicic lava flows and associatedhazards. In: Kilburn CRJ, Luongo G (eds) Active lavas. UCLPress, London, pp 5–24
Fink JH, Bridges NT (1995) Effects of eruption history and coolingrate on lava dome growth. Bull Volcanol 57:229–239
Fink JH, Griffiths RW (1992) A laboratory analog study of the surfacemorphology of lava flows extruded from point and line sources.J Volcanol Geotherm Res 54:19–32
Fink JH, Griffiths RW (1998) Morphology, eruption rates, and rheologyof lava domes: insights from laboratory models. J Geophys Res103:527–545
Fink JH, Malin MC, Anderson SW (1990) Intrusive and extrusivegrowth of the Mount St Helens lava dome. Nature 348:435–437
Francis P, Oppenheimer C, Stevenson D (1993) Endogenous growthof persistently active volcanoes. Nature 366:554–557
Frazzetta G, Romano R (1984) The 1983 Etna eruption: eventchronology and morphological evolution of the lava flow. BullVolcanol 47:1079–1096
Fukushima Y, Cayol V, Durand P (2005) Finding realistic models forinterferometric synthetic aperture radar data: the February 2000eruption at Piton de la Fournaise. J Geophys Res 110:B03206,DOI 10.1029/2004JB003268
Gaonac’h H, Stix J, Lovejoy S (1996) Scaling effects on vesicle shape,size and heterogeneity of lavas from Mount Etna. J VolcanolGeotherm Res 74:131–153
Glaze JA (1984) Rates of magma emplacement and volcanic output.J Volcanol Geotherm Res 20:177–211
Glaze LS, Baloga SM (2001) User’s manual for lava flow pathprediction algorithm. Proxemy Research, Laytonsville
Glaze LS, Anderson SW, Stofan ER, Baloga S, Smrekar SE (2005)Statistical distribution of tumuli on pahoehoe flow surfaces:analysis of examples in Hawaii and Iceland and potentialapplications to lava flows on Mars. J Geophys Res 110:B08202, DOI 10.1029/2004JB003564
Greeley R (1987) The role of lava tubes in Hawaiian volcanoes. USGeol Surv Prof Pap 1350:1589–1602
Greenland LP, Okamura AT, Stokes JB (1988) Constraints on themechanics of the eruption. US Geol Surv Prof Pap 1463:155–164
Gregg TKP, Fink JH (2000) A laboratory investigation into the effectsof slope on lava flow morphology. J Volcanol Geotherm Res96:145–149
Griffiths RW, Fink JH (1992) Solidification and morphology ofsubmarine lavas: a dependence on extrusion rate. J Geophys Res97:19729–19737
Guest JE, Murray JB (1979) An analysis of hazard from Mount Etnavolcano. Geol Soc London Mem 136:347–354
Guest JE, Wood C, Greeley R (1984) Lava tubes, terraces andmegatumuli on the 1614–24 Pahoehoe lava flow field, MountEtna, Sicily. Bull Volcanol 47:635–648
Guest JE, Kilburn CRJ, Pinkerton H, Duncan AM (1987) Theevolution of lava flow-fields: observations of the 1981 and1983 eruptions of Mount Etna, Sicily. Bull Volcanol 49:527–540
Guest JE, Spudis PD, Greeley R, Taylor GJ, Baloga SM (1995)Emplacement of xenolith nodules in the Kaupulehu lava flow,Hualalai Volcano, Hawaii. Bull Volcanol 57:179–184
Harris AJL, Neri M (2002) Volumetric observations during paroxys-mal eruptions at Mount Etna: pressurized drainage of a shallowchamber or pulsed supply? J Volcanol Geotherm Res 116:79–95
Harris AJL, Rowland SK (2001) FLOWGO: a kinematic thermo-rheological model for lava flowing in a channel. Bull Volcanol63:20–44
Harris AJL, Stevenson DS (1997) Magma budgets and steady-stateactivity of Vulcano and Stromboli Volcanoes. Geophys Res Lett24:1043–1046
Harris AJL, Blake S, Rothery DA, Stevens NF (1997a) A chronologyof the 1991 to 1993 Mount Etna eruption using advanced veryhigh resolution radiometer data: implications for real-timethermal volcano monitoring. Geophys Res Lett 102:7985–8003
Harris AJL, Butterworth AL, Carlton RW, Downey I, Miller P,Navarro P, Rothery DA (1997b) Low-cost volcano surveillancefrom space: case studies from Etna, Krafla, Cerro Negro, Fogo,Lascar and Erebus. Bull Volcanol 59:49–64
Harris AJL, Flynn LP, Keszthelyi L, Mouginis-Mark PJ, Rowland SK,Resing JA (1998) Calculation of lava effusion rates from LandsatTM data. Bull Volcanol 60:52–71
Harris AJL, Flynn LP, Rothery DA, Oppenheimer C, Sherman SB(1999a) Mass flux measurements at active lava lakes: implica-tions for magma recycling. J Geophys Res 104:7117–7136
Harris AJL, Wright R, Flynn LP (1999b) Remote monitoring ofMount Erebus volcano, Antarctica, using polar orbiters: progressand prospects. Int J Remote Sens 20:3051–3071
Harris AJL, Murray JB, Aries SE, Davies MA, Flynn LP, Wooster MJ,Wright R, Rothery DA (2000) Effusion rate trends at Etna andKrafla and their implications for eruptive mechanisms. J VolcanolGeotherm Res 102:237–270
Harris AJL, Flynn LP, Matías O, Rose WI (2002) The thermalstealth flows of Santiaguito: implications for the cooling andemplacement of dacitic block lava flows. Geol Soc Am Bull114:533–546
Harris AJL, Rose WI, Flynn LP (2003) Temporal trends in lava domeextrusion at Santiaguito 1922–2000. Bull Volcanol 65:77–89
Harris AJL, Flynn LP, Matias O, Rose WI, Cornejo J (2004) Theevolution of an active silicic lava flow field: an ETM+perspective. J Volcanol Geotherm Res 135:147–168
Harris A, Bailey J, Calvari S, Dehn J (2005) Heat loss measured at alava channel and its implications for down-channel cooling andrheology. Geol Soc Am Spec Pap 396:125–146
Harris AJL, Dehn J, Patrick MR, Calvari S, Ripepe M, Lodato L(2006) Lava effusion rates from hand-held thermal infraredimagery: an example from the June 2003 effusive activity atStromboli. Bull Volcanol 68(2):107–117
Herd RA, Pinkerton H (1997) Bubble coalesence in basaltic lava: itsimpact on the evolution of bubble populations. J VolcanolGeotherm Res 75:137–157
Heslop SE, Wilson L, Pinkerton H, Head III JW (1989) Dynamics of aconfined lava flow on Kilauea volcano, Hawaii. Bull Volcanol51:415–432
Hikada M, Goto A, Umino S, Fujita E (2005) VFTS project:development of the lava flow simulation code LavaSIM with amodel for three-dimensional convection, spreading, and solidifi-cation. Geochem Geophys Geosys 6:Q07008, DOI 10.1029/2004GC000896
Bull Volcanol (2007) 70:1–22 19

Hon K, Kauahikaua J, Denlinger R, Mackay K (1994) Emplacementand inflation of Pahoehoe sheet flows: observations and measure-ments of active lava flows on Kilauea Volcano, Hawaii. Geol SocAm Bull 106:351–370
Ishihara K, Iguchi M, Kamo K (1990) Numerical simulation of lavaflows on some volcanoes in Japan. In: Fink JH (ed) Lava flowsand domes. Springer, Berlin Heidelberg New York, pp 174–207
Iverson RM (1990) Lava domes modelled as brittle shells that enclosepressurized magma, with application to Mount St. Helens. In:Fink JH (ed) Lava flows and domes. Springer, Berlin HeidelbergNew York, pp 47–69
Jackson DB, Swanson DA, Koyanagi RY, Wright TL (1975) TheAugust and October 1968 east rift eruptions of Kilauea Volcano,Hawaii. US Geol Surv Prof Pap 890:1–33
Jackson DB, Hort MKG, Hon K, Kauahikaua J (1987) Detection andmapping of active lava tubes using the VLF induction technique,Kilauea Volcano, Hawaii. EOS Trans Am Geophys Union 68:1543
Jeffreys H (1925) Flow of water in an inclined channel of rectangularsection. Phil Mag J Sci 49:793–807
Jurado-Chichay Z, Rowland SK (1995) Channel overflows of thePohue Bay flow, Mauna Loa, Hawai’i: examples of the contrastbetween surface and interior lava. Bull Volcanol 57:117–126
Kauahikaua J, Mangan M, Heliker C, Mattox T (1996) A quantitativelook at the demise of a basaltic vent: the death of Kupaianaha,Kilauea Volcano, Hawai’i. Bull Volcanol 57:641–648
Kauahikaua J, Cashman KV, Mattox TN, Heliker CC, Hon KA, ManganMT, Thornber CR (1998) Observations of basaltic lava streams intubes from Kilauea volcano, Island of Hawaii. J Geophys Res103:27303–27323
Kauahikaua J, Cashman KV, Clague DA, Champion D, Hagstrum JT(2002) Emplacement of the most recent lava flows on HualalaiVolcano, Hawai’i. Bull Volcanol 64:229–253
Kauahikaua J, Sherrod DR, Cashman KV, Heliker C, Hon K, MattoxTN, Johnson JA (2003) Hawaiian lava-flow dynamics during thePu’u ’O’o—Kupaianaha eruption: a tale of two decades. US GeolSurv Prof Pap 1676:63–87
Kazahaya K, Shinohara H, Saito G (1994) Excessive degassing of Izu-Oshima Volcano: magma convection in a conduit. Bull Volcanol56:207–216
Kerr RC (2001) Thermal erosion by laminar lava flows. J GeophysRes 106:26453–26466
Keszthelyi L (1995) A preliminary thermal budget for lava tubes onthe Earth and planets. J Geophys Res 100:20411–20420
Keszthelyi L, Self S (1998) Some physical requirements for theemplacement of long basaltic lava flows. J Geophys Res103:27447–27464
Keszthelyi L, McEwen AS, Thordason T (2000) Terrestrial analogsand thermal models for Martian flood lavas. J Geophys Res105:15027–15049
Kilburn CRJ (1996) Patterns and unpredictability in the emplacementof subaerial lava flows and flow fields. In: Scarpa R, Tilling RI(eds) Monitoring and mitigation of volcanic hazards. Springer,Berlin Heidelberg New York, pp 491–537
Kilburn CRJ (2000) Lava flows and flow fields. In: Sigurdsson H,Houghton B, McNutt S, Rymer H, Stix J (eds) Encyclopedia ofvolcanoes. Academic Press, San Diego, pp 291–305
Kilburn CRJ (2004) Fracturing as a quantitative indicator of lava flowdynamics. J Volcanol Geotherm Res 132:209–224
Kilburn CRJ, Lopes RMC (1988) The growth of aa lava fields onMount Etna, Sicily. J Geophys Res 93:14759–14772
Kilburn CRJ, Pinkerton H, Wilson L (1995) Forecasting the behaviourof lava flows. In: McGuire B, Kilburn CRJ, Murray J (eds)Monitoring active volcanoes. UCL, London, pp 346–368
Lautze NC, Harris AJL, Bailey JE, Ripepe M, Calvari S, Dehn J,Rowland S, Evans-Jones K (2004) Pulsed lava effusion at MountEtna during 2001. J Volcanol Geotherm Res 137:231–246
Lipman PW, Banks NG (1987) Aa flow dynamics, Mauna Loa 1984.US Geol Surv Prof Pap 1350:1527–1567
Lu Z, Masterlark T, Dzurisin D (2005) Interferometric syntheticaperture radar study of Okmok Volcano, Alaska, 1992–2003:magma supply dynamics and postemplacement lava flowdeformation. J Geophys Res 1103:B02403, DOI 10.1029/2004JB003148
Macedonio G, Longo A (1999) Lava flow in a channel with abifurcation. Phys Chem Earth 24:953–956
Madeira J, da Silveira B, Torres PC (1996) Contradicao aparente entreos volumes finais dos derrames e a estimacao das taxas deefusao: o caso da erupcao do Fogo de 1995. SimposioInternacional sobre a erupcao vulcanica de 1995 na ilha doFogo, Cabo Verde, Lisboa, 1995:153–163
Malin MC (1980) Lengths of Hawaiian lava flows. Geology 8:306–308
Massonnet D, Briole P, Arnaud A (1995) Deflation of Mount Etnamonitored by spaceborne radar interferometry. Nature 375:567–570
Matson M, Dozier J (1981) Identification of subresolution hightemperature sources using a thermal IR sensor. Photogramm EngRemote Sensing 47:1311–1318
Mattox TN, Heliker C, Kauahikaua J, Hon K (1993) Development ofthe 1990 Kalapana flow field, Kilauea Volcano, Hawaii. BullVolcanol 55:407–413
Mattsson HB, Höskuldsson A (2005) Eruption reconstruction,formation of flow-lobe tumuli and eruption duration of the5900 BP Helgafell lava field (Heimaey), South Iceland. J VolcanolGeotherm Res 147:157–172
Mayamoto H, Sasaki S (1998) Numerical simulations of flood basaltlava flows: roles of parameters on lava flow morphologies.J Geophys Res 103:27489–27502
Mazzarini F, Pareschi MT, Favalli M, Isola I, Tarquini S, Boschi E(2005) Morphology of basaltic lava channels during the Mt. EtnaSeptember 2004 eruption from airborne laser altimeter data.Geophys Res Lett 32:L04305. DOI 10.1029/2004GL021815
McClelland L, Simkin T, Summers M, Nielsen E, Stein TC (1989)Global volcanism 1975–1985. Prentice-Hall, New Jersey
Melnik O, Sparks RSJ (1999) Nonlinear dynamics of lava domeextrusion. Nature 402:37–41
Melnik O, Sparks RSJ (2005) Controls on conduit magma flowdynamics during lava dome building eruptions. Geophys ResLett 110:B02209. DOI 10.1029/2004JB003183
Miyamoto H, Haruyama J, Kobayashi T, Suzuki K, Okada T,Nishibori T, Showman R, Lorenz AP, Mogi K, Crown DA,Rodriguez JAP, Rokugawa S, Tokunaga T, Maumoto K (2005)Mapping the structure and depth of lava tubes using groundpenetrating radar. Geophys Res Lett 32:L21316. DOI 10.1029/2005GL024159
Moore HJ (1987) Preliminary estimates of the rheological propertiesof 1984 Mauna Loa lava. US Geol Surv Prof Pap 1350:1569–1588
Murray JB, Stevens NF (2000) New formulae for estimating lava flowvolumes at Mt. Etna Volcano, Sicily. Bull Volcanol 61:515–526
Nakada S, Fujii T (1993) Preliminary report on the activity at UnzenVolcano (Japan), November 1990–November 1991: dacite lavadomes and pyroclastic flows. J Volcanol Geotherm Res 54:319–333
Nakada S, Miyake Y, Sato H, Oshima O, Fujinawa A (1995)Endogenous growth of dacite dome at Unzen Volcano (Japan),1993–1994. Geology 23:157–160
Nakada S, Shimizu H, Ohta K (1999) Overview of the 1990–1995eruption at Unzen. J Volcanol Geotherm Res 89:1–22
Naumann T, Geist D (2000) Physical volcanology and structuraldevelopment of Cerro Azul Volcano, Isabela Island, Galapagos:implications for the development of Galapagos-style shieldvolcanoes. Bull Volcanol 61:497–514
20 Bull Volcanol (2007) 70:1–22

Nichols RL (1936) Flow-units in basalt. J Geol 44:617–630Oddone E (1910) L’eruzione Etnea del Marzo–Aprile 1910. Boll Soc
Sismol Ital 14:143–176Ollier CD (1964) Tumuli and lava blisters of Victoria, Australia.
Nature 202:1284–1286Oppenheimer C (1991) Lava flow cooling estimated from Landsat
Thematic Mapper infrared data: the Lonquimay eruption (Chile,1989). J Geophys Res 96:21865–21878
Oppenheimer C, Francis PW, Rothery DA, Carlton RWT, Glaze LS(1993) Infrared image analysis of volcanic thermal features: LascarVolcano, Chile, 1984–1992. J Geophys Res 98:4269–4286
Patrick MR, Dehn J, Papp KR, Lu Z, Dean K, Moxey L, Izbekov P,Guritz R (2003) The 1997 eruption of Okmok Volcano, Alaska: asynthesis of remotely sensed imagery. J Volcanol Geotherm Res127:87–105
Peterson DW, Holcomb RT, Tilling RI, Christiansen RL (1994)Development of lava tubes in the light of observations at MaunaUlu, Kilauea Volcano, Hawaii. Bull Volcanol 56:343–360
Pieri DC, Baloga SM (1986) Eruption rate, area, and length relation-ships for some Hawaiian lava flows. J Volcanol Geotherm Res30:29–45
Pinkerton H (1993) Measuring the properties of flowing lavas. In:Kilburn CRJ, Luongo G (eds) Active lavas. UCL Press, London,pp 175–191
Pinkerton H, Sparks RSJ (1976) The 1975 subterminal lavas, MountEtna: a case history of the formation of a compound lava field.J Volcanol Geotherm Res 1:167–182
Pinkerton H, Wilson L (1994) Factors affecting the lengths of channel-fed lava flows. Bull Volcanol 56:108–120
Richter DH, Eaton JP, Murata KJ, Ault WU, Krivoy HL (1970)Chronological narrative of the 1959–60 eruption of KilaueaVolcano, Hawaii. US Geol Surv Prof Pap 537:1–73
Ripepe M, Marchetti M, Ulivieri G, Harris A, Dehn J, Burton M,Caltabiano T, Salerno G (2005) Effusive to explosive transitionduring the 2003 eruption of Stromboli volcano. Geology 33:341–344
Romano R, Sturiale C (1982) The historical eruptions of Mt. Etna.Mem Soc Geol Ital 23:75–97
Rose WI (1972) Pattern and mechanism of volcanic activity at theSantiaguito volcanic dome, Guatemala. Bull Volcanol 36:73–94
Rossi MJ (1997) Morphology of the 1984 open-channel lava flow atKrafla Volcano, Northern Iceland. Geomorphol 20:95–112
Rossi MJ, Gudmundsson A (1996) The morphology and formation offlow-lobe tumuli on Icelandic shield volcanoes. J VolcanolGeotherm Res 72:291–308
Rothery DA, Francis PW, Wood CA (1988) Volcano monitoring usingshort wavelength infrared data from satellites. J Geophys Res93:7992–8008
Rowland SK (1996) Slopes, lava flow volumes, and vent distributionson Volcan Fernandina, Galapagos Islands. J Geophys Res101:27657–27672
Rowland SK, Munro DC (1993) The 1919–1920 eruption of MaunaIki, Kilauea: chronology, geologic mapping, and magma trans-port mechanisms. Bull Volcanol 55:190–203
Rowland SK, Walker GPL (1990) Pahoehoe and aa in Hawaii:volumetric flow rate controls the lava structure. Bull Volcanol52:615–628
Rowland SK, MacKay ME, Garbeil H, Mouginis-Mark PJ (1999)Topographic analyses of Kilauea Volcano, Hawai’i, from inter-ferometric airborne radar. Bull Volcanol 61:1–14
Rowland SK, Harris AJL, Wooster MJ, Amelung F, Garbeil H, WilsonL, Mouginis-Mark PJ (2003) Volumetric characteristics of lavaflows from interferometric radar and multispectral satellite data.Bull Volcanol 65:311–330
Rowland SK, Harris AJL, Garbeil H (2004) Effects of Martianconditions on numerically modeled, cooling-limited, channelized
lava flows. J Geophys Res 109:E10010. DOI 10.1029/2004JE002288
Rowland SK, Garbiel H, Harris AJL (2005) Lengths and hazards fromchannel-fed lava flows on Mauna Loa, Hawai’i, determined fromthermal and downslope modeling with FLOWGO. Bull Volcanol67:634–647
Sakimoto SEH, Zuber MT (1998) Flow and convective cooling in lavatubes. J Geophys Res103:27465–27487
Schwarz C (1993) The Chambers dictionary. Chambers Harrap,Edinburgh
Self S, Thordarson T, Keszthelyi L, Walker GPL, Hon K, Murphy MT,Long P, Finnemore S (1996) A new model for the emplacementof Columbia River Basalt as large, inflated Pahoehoe lava flowfields. J Geophys Res 23:2689–2692
Self S, Thordarson T, Keszthelyi L (1997) Emplacement of continen-tal flood basalt lava flows. Am Geophys Union Monograph100:381–410
Smith SJ (2005) Chronologic multisensor assessment for MountCleveland, Alaska from 2000 to 2004 focusing on the 2001eruption. MS thesis, University of Alaska, Fairbanks
Soule SA, Cashman KV, Kauahikaua JP (2004) Examining flowemplacement through the surface morphology of three rapidlyemplaced, solidified lava flows, Kilauea Volcano, Hawai’i. BullVolcanol 66:1–14
Soule SA, Fornari DJ, Perfit MR, Tivey MA, Ridley WI, Schouten H(2005) Channelized lava flows at the East Pacific Rise crest 9°–10°N: the importance of off-axis lava transport in developing thearchitecture of young oceanic crust. Geochem Geophys Geosys6:Q08005. DOI 10.1029/2005GC00912
Sparks RSJ, Young SR, Barclay J, Calder ES, Cole P, Darroux B,Davies MA, Druitt TH, Harford C, Herd R, James M, LejeuneAM, Loughlin S, Norton G, Skerrit G, Stasiuk MV, Stevens NS,Toothill J, Wadge G, Watts R (1998) Magma production andgrowth of the lava dome of the Soufriere Hills Volcano,Monsterrat, West Indies: November 1995 to December 1997.Geophys Res Lett 25:3421–3424
Stasiuk MV, Jaupart C (1997) Lava flow shapes and dimensions asreflections of magma system conditions. J Volcanol GeothermRes 78:31–50
Steffke AM (2005) Temperatures, thermal fluxes and effusion ratesassociated with the growth of Bezymianny volcano usingspaceborne thermal infrared data. MS Thesis, University ofAlaska, Fairbanks
Stevens NF, Murray JB, Wadge G (1997) The volume and shape ofthe 1991–1993 lava flow field at Mount Etna, Sicily. BullVolcanol 58:449–454
Stevens NF, Wadge G, Murray JB (1999) Lava flow volume andmorphology from digitised contour maps: a case study fromMount Etna, Sicily. Geomorphol 28:251–261
Stoiber RE, Williams SN, Huebert BJ (1986) Sulfur and halogen gasesat Masaya caldera complex, Nicaragua: total flux and variationswith time. J Geophys Res 91:12215–12231
Sutton AJ, Elias T, Gerlach TM, Stokes JB (2001) Implications foreruptive processes as indicated by sulfur dioxide emissions fromKilauea Volcano, Hawai’i, 1979–1997. J Volcanol Geotherm Res108:283–302
Sutton AJ, Elias T, Kauahikaua J (2003) Lava-effusion rates for thePu’u ’O’o–Kupaianaha eruption derived from SO2 emissions andvery low frequency (VLF) measurements. US Geol Surv ProfPap 1676:137–148
Swanson DA, Holcomb RT (1990) Regularities in growth of the MountSt. Helens dacite dome, 1980–1986. In: Fink JH (ed) Lava flowsand domes. Springer, Berlin Heidelberg New York, pp 3–24
Swanson DA, Duffield WA, Jackson DB, Peterson DW (1979)Chronological narrative of the 1969–71 Mauna Ulu eruption ofKilauea volcano, Hawaii. US Geol Surv Prof Pap 1056:1–55
Bull Volcanol (2007) 70:1–22 21

Tallarico A, Dragoni M (1999) Viscous Newtonian laminar flow in arectangular channel: application to Etna lava flows. Bull Volcanol61:40–47
Tanguy JC, Kieffer G, Pantanè G (1996) Dynamics, lava volume andeffusion rate during the 1991–1993 eruption of Mount Etna.J Volcanol Geotherm Res 71:259–265
Thordason T, Self S (1996) Sulfur, chlorine and fluorine degassing andatmospheric loading by the Roza eruption, Columbia River BasaltGroup, Washington, USA. J Volcanol Geotherm Res 74:49–73
Thordason T, Self S (1998) The Roza member, Columbia River BasaltGroup: a gigantic Pahoehoe lava flow field formed by endoge-nous processes? J Geophys Res 103:21411–27445
Tilling RI (1987) Fluctuations in surface height of active lava lakesduring the 1972–1974 Mauna Ulu eruption, Kilauea Volcano,Hawaii. J Geophys Res 92:13721–13730
Tilling RI, Peterson DW (1993) Field observations of active lava inHawaii: some practical considerations. In: Kilburn CRJ, LuongoG (eds) Active lavas. UCL Press, London, pp 147–174
Tilling RI, Christansen RL, Duffield WA, Endo ET, Holcomb RT,Koyanagi RY, Peterson DW, Unger JD (1987) The 1972–1974Mauna Ulu eruption, Kilauea Volcano: an example of quasi-steady-state magma transfer. US Geol Surv Prof Pap 1350:405–469
Tryggvason E (1986) Multiple magma reservoirs in a rift zonevolcano: ground deformation and magma transport during theSeptember 1984 eruption of Krafla, Iceland. J VolcanolGeotherm Res 28:1–44
Wadge G (1977) The storage and release of magma on Mount Etna.J Volcanol Geotherm Res 2:361–384
Wadge G (1978) Effusion rate and the shape of aa lava flow-fields onMount Etna. Geology 6:503–506
Wadge G (1981) The variation of magma discharge during basalticeruptions. J Volcanol Geotherm Res 11:139–168
Wadge G (1982) Steady state volcanism: evidence from eruptionhistories of polygenetic volcanoes. J Geophys Res 87:4035–4049
Wadge G (1983) The magma budget of Volcan Arenal, Costa Ricafrom 1968 to 1980. J Volcanol Geotherm Res 19:281–302
Wadge G, Walker GPL, Guest JE (1975) The output of the Etnavolcano. Nature 255:385–387
Wadge G, Young PAV, McKendrick IJ (1994) Mapping lava flowhazards using computer simulation. J Geophys Res 99:489–504
Walker GPL (1973) Lengths of lava flows. Phil Trans R Soc Lond274:107–118
Walker GPL (1991) Structure, and origin by injection of lava undersurface crust, of tumuli, “lava rises,” “lava-rise pits,” and “lava-inflation clefts” in Hawaii. Bull Volcanol 53:546–558
Wilmoth RA, Walker GPL (1993) P-type and S-type pahoehoe: astudy of vesicle distribution patterns in Hawaiian lava flows.J Volcanol Geotherm Res 55:129–142
Wolfe EW, Neal CA, Banks NG, Duggan TJ (1988) Geologicalobservations and chronology of eruptive events. US Geol SurvProf Pap 1463:1–97
Woodcock D, Harris AJL (2005) The dynamics of a channel-fed lavaflow on Pico Partido Volcano, Lanzarote: evidence for ahydraulic jump? Bull Volcanol 69:207–215
Wright R, Blake S, Harris AJL, Rothery DA (2001a) A simpleexplanation for the space-based calculation of lava eruption rates.Earth Planet Sci Lett 192:223–233
Wright R, Flynn LP, Harris AJL (2001b) The evolution of lava flow-fields at Mount Etna, 27–28 October 1999, observed by Landsat7 ETM+. Bull Volcanol 63:1–7
Young P, Wadge G (1990) FLOWFRONT: simulation of a lava flow.Comp Geosci 16:1171–1191
Zebker HA, Rosen P, Hensely S, Mouginis-Mark PJ (1996) Analysisof active lava flows on Kilauea Volcano, Hawaii, using SIR-Cradar correlation measurements. Geology 24:495–498
22 Bull Volcanol (2007) 70:1–22