Temperature and Emissivity Separation from MSG/SEVIRI data
15
This article has been accepted for inclusion in a future issue of this journal. Content is final as presented, with the exception of pagination. IEEE TRANSACTIONS ON GEOSCIENCE AND REMOTE SENSING 1 Temperature and Emissivity Separation From MSG/SEVIRI Data Juan C. Jiménez-Muñoz, José A. Sobrino, Cristian Mattar, Glynn Hulley, and Frank-M. Göttsche Abstract—In this paper, we analyze the feasibility of applying the temperature and emissivity separation (TES) algorithm to thermal-infrared data acquired with three bands of the Spinning Enhanced Visible and Infrared Imager (SEVIRI) onboard the Me- teosat Second Generation platform (SEVTES). The performance of the SEVTES algorithm was tested using data simulated over different atmospheric conditions and surface emissivities, with errors around 1.5% for emissivity and 1.5 K for temperature when atmospheric correction is accurate enough. In contrast, errors on land-leaving radiances higher than 2% or uncertainties on total atmospheric water vapor amount higher than 5% lead to errors on emissivity higher than 2% and errors on land surface temperature higher than 3 K, especially when the atmospheric absorption is overestimated. SEVIRI data acquired in August 2011 were also used to validate SEVTES emissivities against in situ measure- ments collected in five different homogeneous areas over Africa. Values were also intercompared to Moderate Resolution Imaging Spectroradiometer (MODIS)-derived and Advanced Spaceborne Thermal Emission and Reflection Radiometer (ASTER)-derived emissivities and to the LSA SAF emissivity product. Results show that SEVTES-derived emissivity values are consistent with MODIS-TES and ASTER-TES retrievals and that SEVTES also improves the retrievals included in LSA SAF and MOD11Cx v5 products. When compared to laboratory measurements, ac- curacies of around 1%–2% were obtained, although occasional inaccuracies (2%–3%) were also found in some cases at band 8.7 μm. The results presented in this paper show the potential SEVTES has for improving the LSA SAF product over arid and semiarid areas. Index Terms—MODIS, SEVIRI, surface emissivity, surface temperature, TES. Manuscript received November 25, 2012; revised March 8, 2013, August 7, 2013, and November 8, 2013; accepted December 2, 2013. This work was supported by the European Union (CEOP-AEGIS, project FP7-ENV- 2007-1 Proposal No. 212921), the Ministerio de Economía y Competitividad (EODIX, project AYA2008-0595-C04-01; CEOS-Spain, project AYA2011- 29334-C02-01), and the Universitat de València (UV-INV-PRECOMP13- 115366). J. C. Jiménez-Muñoz and J. A. Sobrino are with the Global Change Unit, Image Processing Laboratory, University of Valencia, 46071 Valencia, Spain (e-mail: [email protected]; [email protected]). C. Mattar is with the Laboratory for Analysis of the Biosphere, Department of Environmental Sciences and Renewable Natural Resources, University of Santiago, Santiago 11315, Chile (e-mail: [email protected]). G. Hulley is with the Jet Propulsion Laboratory, California Institute of Technology, Pasadena, CA 91109 USA (e-mail: [email protected]). F.-M. Göttsche is with Karlsruhe Institute of Technology, 76344 Eggenstein- Leopoldshafen, Germany (e-mail: [email protected]). Color versions of one or more of the figures in this paper are available online at http://ieeexplore.ieee.org. Digital Object Identifier 10.1109/TGRS.2013.2293791 I. I NTRODUCTION S URFACE emissivities can be determined by using ap- proaches in which thermal-infrared (TIR) data are not used, such as those based on fractional vegetation cover (FVC) or vegetation indices (VIs) computed from visible and near- infrared (VNIR) data [1]. The main assumption behind these approaches is that the soil and vegetation emissivity spectra are known a priori, and therefore, pixel emissivity can be estimated from component abundances (e.g., FVC) obtained from the VNIR measurements. This assumption is more critical when vegetation fractions are low (e.g., arid or semiarid regions) or when background soil is covered by nongreen vegetation since VIs hardly distinguish between dry vegetation and soils. On the other hand, multispectral TIR measurements allow the application of physically based methods for retrieving surface emissivities. These methods discriminate between different kinds of vegetation cover regardless of greenness, and the retrieved emissivities respond to changes in vegetation canopy densities and to changes in surface soil properties [2], [3]. In the last few decades, several algorithms have been de- veloped for retrieving both land surface temperature (LST) and emissivity, as reviewed in [4] and [5]. Some of them use TIR measurements and are independent of vegetation- based approaches. We selected the temperature and emissivity separation (TES) algorithm, originally developed for Advanced Spaceborne Thermal Emission and Reflection Radiometer (ASTER) multispectral TIR data [6]. The TES algorithm allows the simultaneous retrieval of both surface emissivities and LST from instantaneous multispectral TIR measurements. For this reason, the TES does not require acquisitions at two different times of the day or measurements at the mid-infrared (MIR) spectral region, as is required in the application of other meth- ods, such as the day/night method, the two-temperature method, or the temperature-independent spectral indices [4]. The TES algorithm requires accurate atmospheric correction since the input data for the algorithm are the land-leaving radiance (LLR) and the down-welling atmospheric irradiance (L d ). Since LLR is obtained after subtraction of the up-welling (or path) atmospheric radiance (L u ) from the at-sensor radiance (L sen ) and correction for the atmospheric transmissivity (τ ) LLR = L sen − L u τ (1) it is clear that an accurate atmospheric correction relies on the accurate retrieval of the atmospheric parameters τ , L u , and L d . Whenever the input data are accurate, the TES algorithm is capable of providing LST and emissivities with a nominal 0196-2892 © 2013 IEEE. Personal use is permitted, but republication/redistribution requires IEEE permission. See http://www.ieee.org/publications_standards/publications/rights/index.html for more information.
Transcript of Temperature and Emissivity Separation from MSG/SEVIRI data

This article has been accepted for inclusion in a future issue of this journal. Content is final as presented, with the exception of pagination.
IEEE TRANSACTIONS ON GEOSCIENCE AND REMOTE SENSING 1
Temperature and Emissivity SeparationFrom MSG/SEVIRI Data
Juan C. Jiménez-Muñoz, José A. Sobrino, Cristian Mattar, Glynn Hulley, and Frank-M. Göttsche
Abstract—In this paper, we analyze the feasibility of applyingthe temperature and emissivity separation (TES) algorithm tothermal-infrared data acquired with three bands of the SpinningEnhanced Visible and Infrared Imager (SEVIRI) onboard the Me-teosat Second Generation platform (SEVTES). The performanceof the SEVTES algorithm was tested using data simulated overdifferent atmospheric conditions and surface emissivities, witherrors around 1.5% for emissivity and 1.5 K for temperature whenatmospheric correction is accurate enough. In contrast, errors onland-leaving radiances higher than 2% or uncertainties on totalatmospheric water vapor amount higher than 5% lead to errors onemissivity higher than 2% and errors on land surface temperaturehigher than 3 K, especially when the atmospheric absorption isoverestimated. SEVIRI data acquired in August 2011 were alsoused to validate SEVTES emissivities against in situ measure-ments collected in five different homogeneous areas over Africa.Values were also intercompared to Moderate Resolution ImagingSpectroradiometer (MODIS)-derived and Advanced SpaceborneThermal Emission and Reflection Radiometer (ASTER)-derivedemissivities and to the LSA SAF emissivity product. Resultsshow that SEVTES-derived emissivity values are consistent withMODIS-TES and ASTER-TES retrievals and that SEVTES alsoimproves the retrievals included in LSA SAF and MOD11Cxv5 products. When compared to laboratory measurements, ac-curacies of around 1%–2% were obtained, although occasionalinaccuracies (2%–3%) were also found in some cases at band8.7 μm. The results presented in this paper show the potentialSEVTES has for improving the LSA SAF product over arid andsemiarid areas.
Index Terms—MODIS, SEVIRI, surface emissivity, surfacetemperature, TES.
Manuscript received November 25, 2012; revised March 8, 2013,August 7, 2013, and November 8, 2013; accepted December 2, 2013. Thiswork was supported by the European Union (CEOP-AEGIS, project FP7-ENV-2007-1 Proposal No. 212921), the Ministerio de Economía y Competitividad(EODIX, project AYA2008-0595-C04-01; CEOS-Spain, project AYA2011-29334-C02-01), and the Universitat de València (UV-INV-PRECOMP13-115366).
J. C. Jiménez-Muñoz and J. A. Sobrino are with the Global Change Unit,Image Processing Laboratory, University of Valencia, 46071 Valencia, Spain(e-mail: [email protected]; [email protected]).
C. Mattar is with the Laboratory for Analysis of the Biosphere, Departmentof Environmental Sciences and Renewable Natural Resources, University ofSantiago, Santiago 11315, Chile (e-mail: [email protected]).
G. Hulley is with the Jet Propulsion Laboratory, California Institute ofTechnology, Pasadena, CA 91109 USA (e-mail: [email protected]).
F.-M. Göttsche is with Karlsruhe Institute of Technology, 76344 Eggenstein-Leopoldshafen, Germany (e-mail: [email protected]).
Color versions of one or more of the figures in this paper are available onlineat http://ieeexplore.ieee.org.
Digital Object Identifier 10.1109/TGRS.2013.2293791
I. INTRODUCTION
SURFACE emissivities can be determined by using ap-proaches in which thermal-infrared (TIR) data are not
used, such as those based on fractional vegetation cover (FVC)or vegetation indices (VIs) computed from visible and near-infrared (VNIR) data [1]. The main assumption behind theseapproaches is that the soil and vegetation emissivity spectra areknown a priori, and therefore, pixel emissivity can be estimatedfrom component abundances (e.g., FVC) obtained from theVNIR measurements. This assumption is more critical whenvegetation fractions are low (e.g., arid or semiarid regions)or when background soil is covered by nongreen vegetationsince VIs hardly distinguish between dry vegetation and soils.On the other hand, multispectral TIR measurements allow theapplication of physically based methods for retrieving surfaceemissivities. These methods discriminate between differentkinds of vegetation cover regardless of greenness, and theretrieved emissivities respond to changes in vegetation canopydensities and to changes in surface soil properties [2], [3].
In the last few decades, several algorithms have been de-veloped for retrieving both land surface temperature (LST)and emissivity, as reviewed in [4] and [5]. Some of themuse TIR measurements and are independent of vegetation-based approaches. We selected the temperature and emissivityseparation (TES) algorithm, originally developed for AdvancedSpaceborne Thermal Emission and Reflection Radiometer(ASTER) multispectral TIR data [6]. The TES algorithm allowsthe simultaneous retrieval of both surface emissivities and LSTfrom instantaneous multispectral TIR measurements. For thisreason, the TES does not require acquisitions at two differenttimes of the day or measurements at the mid-infrared (MIR)spectral region, as is required in the application of other meth-ods, such as the day/night method, the two-temperature method,or the temperature-independent spectral indices [4].
The TES algorithm requires accurate atmospheric correctionsince the input data for the algorithm are the land-leavingradiance (LLR) and the down-welling atmospheric irradiance(Ld). Since LLR is obtained after subtraction of the up-welling(or path) atmospheric radiance (Lu) from the at-sensor radiance(Lsen) and correction for the atmospheric transmissivity (τ)
LLR =Lsen − Lu
τ(1)
it is clear that an accurate atmospheric correction relies on theaccurate retrieval of the atmospheric parameters τ , Lu, and Ld.
Whenever the input data are accurate, the TES algorithmis capable of providing LST and emissivities with a nominal
0196-2892 © 2013 IEEE. Personal use is permitted, but republication/redistribution requires IEEE permission.See http://www.ieee.org/publications_standards/publications/rights/index.html for more information.

This article has been accepted for inclusion in a future issue of this journal. Content is final as presented, with the exception of pagination.
2 IEEE TRANSACTIONS ON GEOSCIENCE AND REMOTE SENSING
accuracy of 1.5 K and 0.015 emissivity units [6]. The mainintrinsic characteristic of the TES algorithm is the relationshipestablished between the minimum emissivity (εmin) and thespectral contrast or maximum-minimum difference (MMD)
εmin = a+ b×MMDc. (2)
This is an empirical or semiempirical relationship with coef-ficients a, b, and c obtained from regression analysis usinglaboratory spectra [6].
The TES algorithm cannot be applied to low-resolution sen-sors with only two TIR bands in the 10–12-μm atmosphericwindow. In these cases, split-window (SW) algorithms havebeen usually applied, which are based on the different atmo-spheric absorption in two different spectral bands [7]. Atmo-spheric correction in SW algorithms is mostly included in thealgorithm itself through the difference between the at-sensorbrightness temperatures at two bands and the computation ofalgorithm coefficients using atmospheric profile databases andradiative transfer codes. Some SW algorithms explicitly dependon an atmospheric parameter such as the total (column) atmo-spheric water vapor content [8], which is generally easier toestimate than atmospheric parameters involved in the RTE(transmissivity and up-/down-welling irradiances). In thissense, the atmospheric correction in the SW algorithms canbe considered less critical than that in the TES algorithm, butin contrast, the surface emissivity needs to be known a priori.Some low-resolution sensors currently used for earth observa-tion purposes also have another TIR band in the atmosphericwindow 8–9.5 μm (in addition to the two TIR bands in theregion 10–12 μm). As pointed out by Gillespieet al. [6], at leastthree or four bands are required in order to measure the contrastin images, so it would be possible to apply the TES algorithmto only three TIR bands. The TES method has been appliedto different sensors and has been extensively and rigorouslyvalidated using both simulated and real retrievals. However, ap-plication of the TES algorithm to a three-band configuration hasnot been fully reported in the literature, with the exception ofthe Moderate Resolution Imaging Spectroradiometer (MODIS)case [9]–[12].
The main purpose of the Land Surface Analysis SatelliteApplications Facility (LSA SAF or Land SAF) is to increasethe benefits from European Organisation for the Exploitation ofMeteorological Satellites (EUMETSAT) satellite data relatedto land, land-atmosphere interactions, and biophysical appli-cations (http://landsaf.meteo.pt). The LSA SAF operationallyderives LST from data collected with the Spinning EnhancedVisible and Infrared Imager (SEVIRI) onboard the MeteosatSecond Generation (MSG) platform using the generalized SWalgorithm [13] and land surface emissivities determined fromFVC estimations and a classification-based approach [14]. TheLSA SAF LST product has a targeted accuracy of better than2 K [15], but some inaccuracies have been found to be attributedto incorrect land cover classification and/or assignment ofemissivities to a given land cover type in the determination ofthe surface emissivity [16], [17]. Therefore, improvements tothe surface emissivity retrieval from MSG/SEVIRI data maybenefit the operational LSA SAF LST product.
Fig. 1. Spectral response functions of SEVIRI (from left to right, IR8.7,IR9.7, IR10.8, IR12.0, and IR13.4), MODIS (from left to right, bands 29, 31,and 32), and ASTER (from left to right, bands 10, 11, 12, 13, and 14) TIRbands. A standard atmospheric transmissivity spectrum (thick gray line) andthe emissivity spectrum of quartz (gray circles) are also plotted.
In this paper, we explore the application of a physically basedalgorithm (TES) to the three TIR bands of the MSG/SEVIRIsensor (hereinafter SEVTES algorithm) and discuss its po-tential for improving the operational LSA SAF product. Theperformance of the TES algorithm is tested using simulateddata and SEVIRI imagery. In this last case, results were inter-compared to both laboratory results of field samples collectedover different homogeneous areas in Africa and emissivitiesretrieved from MODIS and ASTER data over those areas.
II. MATERIAL AND METHODS
A. SEVIRI Instrument
The SEVIRI instrument onboard the MSG geostationarysatellite has the capacity to observe the Earth in 12 spectralbands. Seven of these bands are in the TIR region between 6and 14 μm, with one band also in the MIR region (3–5 μm). Thesampling distance at nadir is 3 km. Only three of the seven TIRbands are located in an atmospheric window (Fig. 1), denoted asIR8.7, IR10.8, and IR12.0 and with full-width at half-maximumvalues around 0.4, 1, and 1 μm, respectively. The noise equiv-alent delta temperature (NEDT) of these bands is around 0.1 K(EUMETSAT, technical specifications at launch extracted fromthe web site http://www.eumetsat.int/website/home/Satellites/CurrentSatellites/Meteosat). A comparison between SEVIRI,MODIS, and ASTER TIR bands is presented in Fig. 1.
B. Simulation and Ancillary Data
The performance of the TES algorithm on SEVIRI data istested using data simulated under different atmospheric con-ditions. For this purpose, different atmospheric profiles wereconsidered as input to the MODTRAN4 radiative transfer code[18]. SEVIRI at-sensor radiances were simulated through arearranged radiative transfer (1), using the atmospheric pa-rameters (τ, Lu, Ld) obtained from MODTRAN, the surfacetemperature given by the first layer of a given atmosphericprofile, and different surface emissivity values included in anemissivity spectra data set. Since the TES algorithm requiresa recomputation of the coefficients involved in the εmin-MMD

This article has been accepted for inclusion in a future issue of this journal. Content is final as presented, with the exception of pagination.
JIMÉNEZ-MUÑOZ et al.: TEMPERATURE AND EMISSIVITY SEPARATION FROM MSG/SEVIRI DATA 3
TABLE ITEST SITES USED FOR THE VALIDATION OF SURFACE EMISSIVITY. THE ALTITUDE ABOVE SEA LEVEL (ALT.) IS APPROXIMATE, AND IT HAS BEEN
EXTRACTED FROM GOOGLE EARTH. THE DATE REFERS TO THE ACQUISITION OF THE SEVIRI IMAGE (AT 12 UTC). VIEW ZENITH ANGLES
(VZAS) FOR SEVIRI OBSERVATIONS ARE PROVIDED, AND VZAS FOR MODIS OBSERVATIONS WHEN USED ARE GIVEN IN BRACKETS.ATMOSPHERIC CORRECTION WAS PERFORMED USING TWO DIFFERENT PRODUCTS: MOD07 AND ERA-INTERIM REANALYSIS. TIME,ALTITUDE FOR THE FIRST LAYER, AND TOTAL WATER VAPOR (WV) AT THE GIVEN VZA ARE INCLUDED FOR THE TWO PRODUCTS.WVMOD AND WVSEV REFER TO THE TOTAL WATER VAPOR FOR MODIS AND SEVIRI OBSERVATION CONDITIONS, RESPECTIVELY
relationship for a given sensor (2), the emissivity spectra dataset was also used for this purpose. All spectral magnitudes(MODTRAN outputs and emissivity spectra) were averagedusing the spectral response functions of TIR bands of SEVIRI(and MODIS). Next, we will explain the atmospheric profileand emissivity spectra data sets used in this study, as well asthe simulation procedure to account for imperfect atmosphericcorrection and noise (NEDT) errors.
1) Atmospheric Profiles: The atmospheric profiles includevalues of altitude, pressure, temperature, and relative humidityfor each layer. The rest of the values for the atmosphericconstituents were retrieved from default values included in theappropriate MODTRAN standard atmosphere. Four differentdatabases were used in this study: STD66, TIGR61, TIGR1761,and TIGR2311. These databases were used and described in de-tail in a previous study [19]. Basically, the STD66 database wasconstructed from the different standard atmospheres included inthe MODTRAN code using different atmospheric water vaporscaling (WVS) factors (leading to a total of 66 atmosphericprofiles). The other three databases were extracted from theThermodynamic Initial Guess Retrieval (TIGR) database, andthey include 61, 1761, and 2311 atmospheric profiles, respec-tively. TES performance over the different atmospheric profiledatabases was similar, so the results presented in Section IIIfocus only on the TIGR61 database for convenience.
2) Emissivity Spectra: Surface emissivity values were ex-tracted from the ASTER spectral library (ASTERlib) [20]. Theemissivity data set includes 108 emissivity spectra for naturalsamples: soils, vegetation, water, ice, and rocks. Coefficientsin the εmin-MMD relationship were obtained using all 108spectra, whereas the data set was later divided into two subdatasets (with around 50% of the samples in each one) for validationpurposes. This way, one subdata set was used to obtain theεmin-MMD relationship, and the other subdata set was used tovalidate the regression.
3) Errors on Atmospheric Correction and NEDT: Er-rors in the atmospheric correction were simulated byadding/subtracting a percentage of error to the LLRs, sincethis parameter is the direct input to the TES algorithm. Threedifferent percentages were considered: 1%, 2%, and 5%. Al-
though the down-welling atmospheric irradiance (Ld) is alsoa direct input to the TES algorithm, errors on LLRs had asignificantly higher contribution to TES retrievals than errors inLd, so errors were finally added only to the LLRs. Errors in theatmospheric correction were also accounted for in terms of totalatmospheric water vapor content (WV) uncertainties. For thispurpose, a scaling factor was applied to the input atmosphericprofiles to simulate deviations from the original WV value of±1%, ±5%, ±10%, and ±25%. The impact of the NEDTof the TIR bands was simulated by adding/subtracting threedifferent values of NEDT to the simulated at-sensor brightnesstemperatures, namely, 0.1 K, 0.3 K, and 0.5 K. The resultsobtained in this sensitivity analysis are presented in Section III.
C. Data Processing and Validation
1) Test Sites: Five different media to large homogeneousareas in Africa were chosen as test sites, from North to South:1) an agricultural site in Marrakech (Morocco); 2) a soil areacovered by seasonal grass and sparse trees in Dahra (Senegal);3) the sand dunes in the Namib Desert (Namibia); 4) thegravel plains covered by a mixture of gravel, sand, and sparsegrass near the Gobabeb Research & Training Centre in theNamib Desert (Namibia); and 5) the sand dunes mixed withgrassy shrublands and sparse trees in the Kalahari desert(Botswana/South Africa). These sites will be referred to as Mar-rakech, Dahra, Namib, Gobabeb, and Kalahari, respectively.Some basic information about the sites is included in Table I.
As explained in Section II-C-5, soil emissivity spectra weremeasured over these sites and used in the validation. However,the presence of green/dry grass over the Dahra and Gobabebsites required further analysis on the mixing between soiland vegetation spectra and also on the effect of the multiplescattering (cavity effect), thus adding some uncertainty to theinterpretation of the results. These effects are minimized overthe Kalahari site because of a better characterization of the FVCand almost a negligible cavity effect. For this reason, someintercomparisons between results (Section IV) are restrictedto the Marrakech, Namib, and Kalahari sites, although resultsare also presented for the Dahra and Gobabeb sites since they
This article has been accepted for inclusion in a future issue of this journal. Content is final as presented, with the exception of pagination.
4 IEEE TRANSACTIONS ON GEOSCIENCE AND REMOTE SENSING
include permanent stations managed by the Karlsruhe Instituteof Technology (KIT) and are used for validation of LSA SAFLST product.
2) SEVIRI and MODIS Data: We selected different SEVIRIimages acquired in August 2011 at 12:00 UTC. SEVIRI im-agery was acquired from the receiving station located at theImage Processing Laboratory (IPL) facilities at the Universityof Valencia, Valencia, Spain. Raw data were converted to at-sensor radiances using the calibration coefficients. The LSASAF SEVIRI emissivity (EM) internal product was also usedto compare the new retrievals with the one currently used inthe operational product, based on a classification approach andFVC estimations for dynamic land covers [14].
MODIS imagery included Terra/MODIS (MOD) andAqua/MODIS (MYD) level 1B products (calibrated radiances)at 1-km spatial resolution (MOD021KM, MYD021KM) ac-quired near the SEVIRI acquisition time (∼11–13 UTC).MODIS global climate modeling (GCM) products MOD11C1(daily), MOD11C2 (8 day), and MOD11C3 (monthly; versions4.1 and 5) were also used. Version 4.1 of these productsincludes a global map of surface emissivities obtained fromthe day/night algorithm [21], so values are retrieved from theTIR data and not from a classification-based approach. Inversion 5, the day/night algorithm is closely coupled to the SWalgorithm, resulting in artificial steps typically associated withclassification-based approaches [17], [22].
3) ASTER GED Data: The ASTER Global EmissivityDatabase (ASTER-GED) is high-spatial-resolution (100 m)mean emissivity database generated by the Jet PropulsionLaboratory (JPL) using all ASTER data ever acquired on aglobal scale (http://emissivity.jpl.nasa.gov/test). ASTER-GEDwas initially released for North America, but products forAustralia, Africa, and other sites have recently been generated.The ASTER-GED includes a WVS method [23] to improveTES results over gray bodies such as water and vegetation,and validation over North American sand dune sites showed anerror of 1.6% [24], [25]. ASTER-GED emissivities at the fiveASTER TIR bands were extracted for the Marrakech, Namiband Kalahari sites. A mean value for the period 2000–2010 wasused. The valid number of observations for Marrakech, Namib,and Kalahari sites were 24, 25, and 11, respectively. Standarddeviations (1-sigma) for ASTER TIR bands 10, 11, and 12(8–9 μm) were around 0.02 for the Marrakech and Namib sites,whereas values between 0.03 and 0.04 were obtained for theKalahari site. Standard deviations for ASTER TIR bands 13 and14 (10–11 μm) were lower than 0.01 for the three sites (exceptfor band 13 and the Namib site, with a value of 0.013).
4) Atmospheric Correction and TES Algorithm: At-sensorradiances included in the SEVIRI and MODIS imagery were at-mospherically corrected using two different atmospheric prod-ucts available at global scale: MODIS atmospheric profileproduct (MOD07) at 5-km spatial resolution [26] and ERA-Interim reanalysis data at 1.5◦ × 1.5◦ [27]. Atmospheric pro-files centered at the latitude and longitude of the test sites wereextracted from these two products, and MODTRAN4 radiativetransfer code was executed to compute the atmospheric parame-ters (τ, Lu, Ld). At-sensor radiances were then atmosphericallycorrected to obtain the LLRs (1), and the TES algorithm was
applied. This same procedure was also applied on a pixel-by-pixel basis to generate emissivity maps using ERA-Interimatmospheric products. Due to the different resolution of ERA(1.5◦) in comparison to SEVIRI (3 km), maps of atmosphericparameters obtained from ERA were spatially interpolatedacross the study area.
5) Emissivity Spectra Measured In Situ: Sand/soil sampleswere collected in situ over the different sites, and directionalhemispheric reflectance was measured at the JPL using aNicolet Fourier transform infrared spectrometer [28], [29]. Forthe Gobabeb and Kalahari sites, the grass emissivity spectrumwas also measured. In the case of the Dahra site, green/dry grassspectra were extracted from the ASTERlib. Band emissivitieswere finally obtained by spectral average using the spectralresponse functions of SEVIRI and MODIS bands.
Laboratory measurements of emissivity spectra of back-ground soil were mixed with grass spectra over the Dahra,Gobabeb, and Kalahari sites. Grass cover over the Dahra andGobabeb sites was estimated from visual inspection of acquiredphotographs of the site, whereas mixed values over the Kalaharisite were extracted from the values presented in [28]. For theGobabeb site, emissivity retrievals were also compared to thevalues presented in [17], which refer to SEVIRI band IR10.8,and were obtained from in situ measurements using the boxmethod and from ASTER and MODIS data.
III. RESULTS FROM SIMULATED DATA
The following εmin-MMD relationship adapted to SEVIRITIR bands was obtained from the 108 emissivity spectra ex-tracted from the ASTER spectral library:
εmin = 0.998− 0.684MMD0.747 (3)
with a standard error of determination (1-sigma) of 0.006and a coefficient of determination (R2) of 0.990. A similarrelationship was found for the case of MODIS bands 29, 31,and 32
εmin = 0.998− 0.654MMD0.736 (4)
with the same values of sigma and R2 [10]. The original power-law relationship given by (2) was later linearized to minimizethe imprecision over surfaces with low spectral contrast at theexpense of accuracy, especially for NEDT ≥ 0.3 K [30]. Sincethe NEDT values for the SEVIRI TIR bands are around 0.1 K,we maintained the original power-law in this study. Additionalanalysis was performed using a linear relationship (εmin =a+ b× MMD), but results were not conclusive, and emissivityspectra retrieved from the linear approach were similar to valuesobtained with the power-law approach. Therefore, these resultsare not included in this paper.
The performance of the SEVTES algorithm using (3) wasanalyzed under different atmospheric conditions. The values ofbias (TES values minus reference values), standard deviation(σ), and root-mean-square error (rmse) for the emissivitiesat the three SEVIRI TIR bands and also for the LST areprovided in Table II. For the ideal case with perfect atmosphericcorrection and null NEDT, a negative bias with an absolute
This article has been accepted for inclusion in a future issue of this journal. Content is final as presented, with the exception of pagination.
JIMÉNEZ-MUÑOZ et al.: TEMPERATURE AND EMISSIVITY SEPARATION FROM MSG/SEVIRI DATA 5
TABLE IIVALIDATION OF THE TES ALGORITHM (EMISSIVITIES AT SEVIRI BANDS 8.7, 10.8, AND 12.0, AND LST) USING THE DIFFERENT ATMOSPHERIC
PROFILES INCLUDED IN THE TIGR61 DATABASE. NEDT IS THE NOISE EQUIVALENT DELTA TEMPERATURE, LLR IS THE LAND-LEAVING
RADIANCE, AND WV IS THE TOTAL ATMOSPHERIC WATER VAPOR CONTENT. Δ IS THE ERROR ADDED/SUBTRACTED TO THE
GIVEN VARIABLE. VALUES REFER TO BIAS ± STANDARD DEVIATION. RMSES ARE GIVEN IN BRACKETS
value ≤0.003 was obtained for the emissivities (all bands), withstandard deviations around 0.01. In terms of LST, a positive biasof (0.1 ± 0.3) K was obtained. This result suggests that the TESalgorithm performs well with SEVIRI data in theory. However,it is necessary to also test the algorithm under realistic condi-tions, in which an effect of the NEDT or imperfect atmosphericcorrection should be taken into account.
Results obtained for NEDT ±0.1 K indicate that emissivityand LST retrievals maintain almost the same accuracy as theideal case. As expected, when the NEDT increase, the errorson the retrievals also increase, although asymmetry is observeddepending on whether the NEDT is added or subtracted. BandsIR8.7 and IR10.8 maintain almost the same negative bias forNEDT values of −0.1, −0.3, and −0.5 K, while σ increaseswith increasing NEDT. In any case, the rmse is typically around0.015. However, band IR12.0 shows a significant increase onthe bias and also on σ with increasing NEDT (in those caseswhere NEDT is subtracted), with rmse values higher than 0.3for |NEDT| values ≥0.3 K. In the case of positive NEDT, allthree bands show an increase in both the bias and the standarddeviation, but band IR12.0 maintains an rmse of around 0.01even when the NEDT reaches +0.5 K. In terms of LST, biasis positive for positive NEDT, and bias is negative for negativeNEDT. The rmse for the retrieved LST is below 1.5 K even inthe worst case (NEDT = 0.5 K).
Errors in the atmospheric correction are critical for theaccuracy of the TES retrievals. In terms of the errors directlyin the LLR, the nominal accuracy (1.5 K and 0.015 emissivity
units) is preserved when the error is up to ±2%, except forthe emissivity at band IR12.0 when the error on the LLR is−2%, with an rmse of 0.03. Inaccuracies become unacceptablefor errors on the LLR of ±5%, with rmse values for the bandemissivities between 0.02 and 0.05 (except for band IR12.0 andLLR error of +5%, with an rmse of 0.014) and rmse valuesfor LST higher than 3 K. When the error is applied to the WV,huge inaccuracies are observed in the LST retrieval only forWV errors of +10% and especially +25% (with an rmse upto 8 K), whereas the band emissivities maintain the nominalaccuracy (≈ 0.015) only for errors in WV of ±1%. The error inemissivity at band IR12.0 is higher than 0.04 for WV errors of−5% to −25%, whereas the rmse values for the other bands arebelow 0.02. Emissivity at band IR12.0 shows an rmse below0.02 for WV errors of +5% to +25%. The other two bandsshow huge rmse values for WV errors of +10% and +25%.
The results obtained in this sensitivity analysis using simu-lated data show a different behavior of the TES algorithm whenthe atmospheric absorption is underestimated or overestimated.Hence, when the atmospheric absorption is overestimated (pos-itive errors in LLR or WV), the errors in emissivity at bandIR8.7 are higher than the errors in emissivity at bands IR10.8and IR12.0. In contrast, for negative errors in LLR or WV,errors in emissivity at bands IR8.7 and IR10.8 are similar,and errors in emissivity at band IR12.0 are higher than theerrors for the other two bands. An overestimation (underestima-tion) of the atmospheric absorption leads to an overestimation(underestimation) of the LST; the errors in LST are higher

This article has been accepted for inclusion in a future issue of this journal. Content is final as presented, with the exception of pagination.
6 IEEE TRANSACTIONS ON GEOSCIENCE AND REMOTE SENSING
Fig. 2. (Top) Air temperature and (bottom) relative humidity vertical profiles over the Marrakech, Namib, and Kalahari sites extracted from MOD07 and ERA-Interim products.
when the atmospheric absorption is overestimated. Significantdifferences were not found when comparing the power-lawand the linear regressions (results not shown in this paper),although the linear regression slightly improved the results foremissivity at band IR12.0 and for low spectral contrast surfaces(MMD < 0.03).
Note that errors included in Table II refer to mean values overdifferent atmospheres (midlatitude summer/winter, subarcticsummer/winter, and tropical). Therefore, over particular atmo-spheric conditions, the influence of the atmospheric correctionuncertainty on TES retrievals may be reduced.
IV. RESULTS FROM SEVIRI DATA
A. Atmospheric Correction: Intercomparison BetweenMOD07 and ERA-Interim Atmospheric Profiles
The critical step in the application of the TES algorithm isthe atmospheric correction. In this paper, we used two differentsources of atmospheric profiles (MOD07 and ERA-Interim), soit is worth analyzing the differences in these two profiles inorder to better understand the results obtained in the emissivityspectra retrieval. Fig. 2 shows the air temperature (Ta) andrelative humidity (RH) profiles extracted from MOD07 andERA-Interim products for the Marrakech, Namib, and Kalaharisites. Ta profiles are similar in all cases; however, significantdifferences can be observed in the RH profiles, thus leadingto different atmospheric water vapor contents over the three
areas, depending on the product used (see Table I). ERA-Interim WV is higher than MOD07 WV in the three cases,with differences (ERA-MOD07) of 1.2, 0.4, and 1.7 g/cm2 overthe Marrakech, Namib, and Kalahari sites, respectively. ERAprofiles include more low levels than MOD07 profiles do (seealso altitudes in Table I), which may explain the higher watervapor content extracted from the ERA profile when comparedto the MOD07 profile. Note also the peak in RH between 900and 800 hPa for the Kalahari site, which may indicate cloudcontamination at the ERA spatial scale, not observed at thefiner spatial resolution of MOD07. RH profiles extracted fromMOD07 show saturation (RH = 100%) at the highest levels(<50 hPa) and typically underestimate the humidity at all ofthe pressure levels when compared to the ERA-Interim profiles,especially at around 200 and 800 hPa in the Namib and Kalaharisites, respectively. These differences in the atmospheric profileslead to underestimations or overestimations in the emissivityspectra retrieved over the different sites, as will be presented inthe sections to come.
B. Validation of SEVTES Results
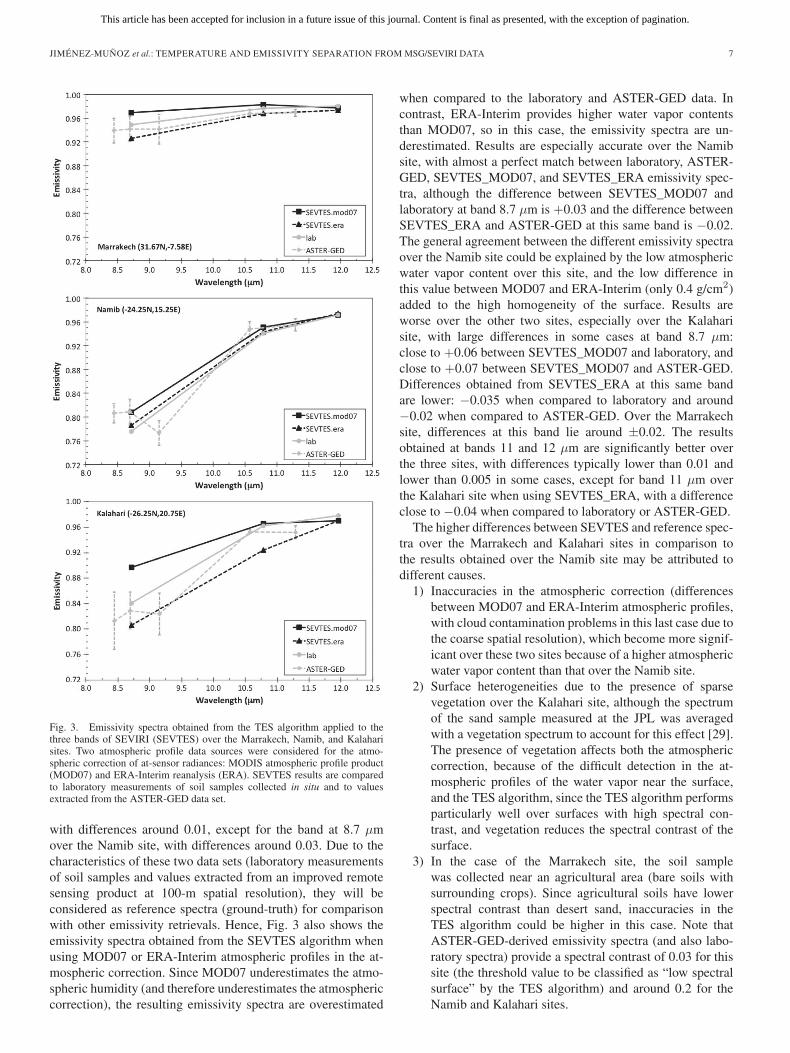
1) Marrakech, Namib, and Kalahari Sites: Fig. 3 showsthe emissivity spectra obtained from laboratory measurementsand those extracted from the ASTER GED data set over theMarrakech, Namib, and Kalahari sites. Laboratory and ASTER-GED emissivity values over the three sites are consistent,
This article has been accepted for inclusion in a future issue of this journal. Content is final as presented, with the exception of pagination.
JIMÉNEZ-MUÑOZ et al.: TEMPERATURE AND EMISSIVITY SEPARATION FROM MSG/SEVIRI DATA 7
Fig. 3. Emissivity spectra obtained from the TES algorithm applied to thethree bands of SEVIRI (SEVTES) over the Marrakech, Namib, and Kalaharisites. Two atmospheric profile data sources were considered for the atmo-spheric correction of at-sensor radiances: MODIS atmospheric profile product(MOD07) and ERA-Interim reanalysis (ERA). SEVTES results are comparedto laboratory measurements of soil samples collected in situ and to valuesextracted from the ASTER-GED data set.
with differences around 0.01, except for the band at 8.7 μmover the Namib site, with differences around 0.03. Due to thecharacteristics of these two data sets (laboratory measurementsof soil samples and values extracted from an improved remotesensing product at 100-m spatial resolution), they will beconsidered as reference spectra (ground-truth) for comparisonwith other emissivity retrievals. Hence, Fig. 3 also shows theemissivity spectra obtained from the SEVTES algorithm whenusing MOD07 or ERA-Interim atmospheric profiles in the at-mospheric correction. Since MOD07 underestimates the atmo-spheric humidity (and therefore underestimates the atmosphericcorrection), the resulting emissivity spectra are overestimated
when compared to the laboratory and ASTER-GED data. Incontrast, ERA-Interim provides higher water vapor contentsthan MOD07, so in this case, the emissivity spectra are un-derestimated. Results are especially accurate over the Namibsite, with almost a perfect match between laboratory, ASTER-GED, SEVTES_MOD07, and SEVTES_ERA emissivity spec-tra, although the difference between SEVTES_MOD07 andlaboratory at band 8.7 μm is +0.03 and the difference betweenSEVTES_ERA and ASTER-GED at this same band is −0.02.The general agreement between the different emissivity spectraover the Namib site could be explained by the low atmosphericwater vapor content over this site, and the low difference inthis value between MOD07 and ERA-Interim (only 0.4 g/cm2)added to the high homogeneity of the surface. Results areworse over the other two sites, especially over the Kalaharisite, with large differences in some cases at band 8.7 μm:close to +0.06 between SEVTES_MOD07 and laboratory, andclose to +0.07 between SEVTES_MOD07 and ASTER-GED.Differences obtained from SEVTES_ERA at this same bandare lower: −0.035 when compared to laboratory and around−0.02 when compared to ASTER-GED. Over the Marrakechsite, differences at this band lie around ±0.02. The resultsobtained at bands 11 and 12 μm are significantly better overthe three sites, with differences typically lower than 0.01 andlower than 0.005 in some cases, except for band 11 μm overthe Kalahari site when using SEVTES_ERA, with a differenceclose to −0.04 when compared to laboratory or ASTER-GED.
The higher differences between SEVTES and reference spec-tra over the Marrakech and Kalahari sites in comparison tothe results obtained over the Namib site may be attributed todifferent causes.
1) Inaccuracies in the atmospheric correction (differencesbetween MOD07 and ERA-Interim atmospheric profiles,with cloud contamination problems in this last case due tothe coarse spatial resolution), which become more signif-icant over these two sites because of a higher atmosphericwater vapor content than that over the Namib site.
2) Surface heterogeneities due to the presence of sparsevegetation over the Kalahari site, although the spectrumof the sand sample measured at the JPL was averagedwith a vegetation spectrum to account for this effect [29].The presence of vegetation affects both the atmosphericcorrection, because of the difficult detection in the at-mospheric profiles of the water vapor near the surface,and the TES algorithm, since the TES algorithm performsparticularly well over surfaces with high spectral con-trast, and vegetation reduces the spectral contrast of thesurface.
3) In the case of the Marrakech site, the soil samplewas collected near an agricultural area (bare soils withsurrounding crops). Since agricultural soils have lowerspectral contrast than desert sand, inaccuracies in theTES algorithm could be higher in this case. Note thatASTER-GED-derived emissivity spectra (and also labo-ratory spectra) provide a spectral contrast of 0.03 for thissite (the threshold value to be classified as “low spectralsurface” by the TES algorithm) and around 0.2 for theNamib and Kalahari sites.
This article has been accepted for inclusion in a future issue of this journal. Content is final as presented, with the exception of pagination.
8 IEEE TRANSACTIONS ON GEOSCIENCE AND REMOTE SENSING
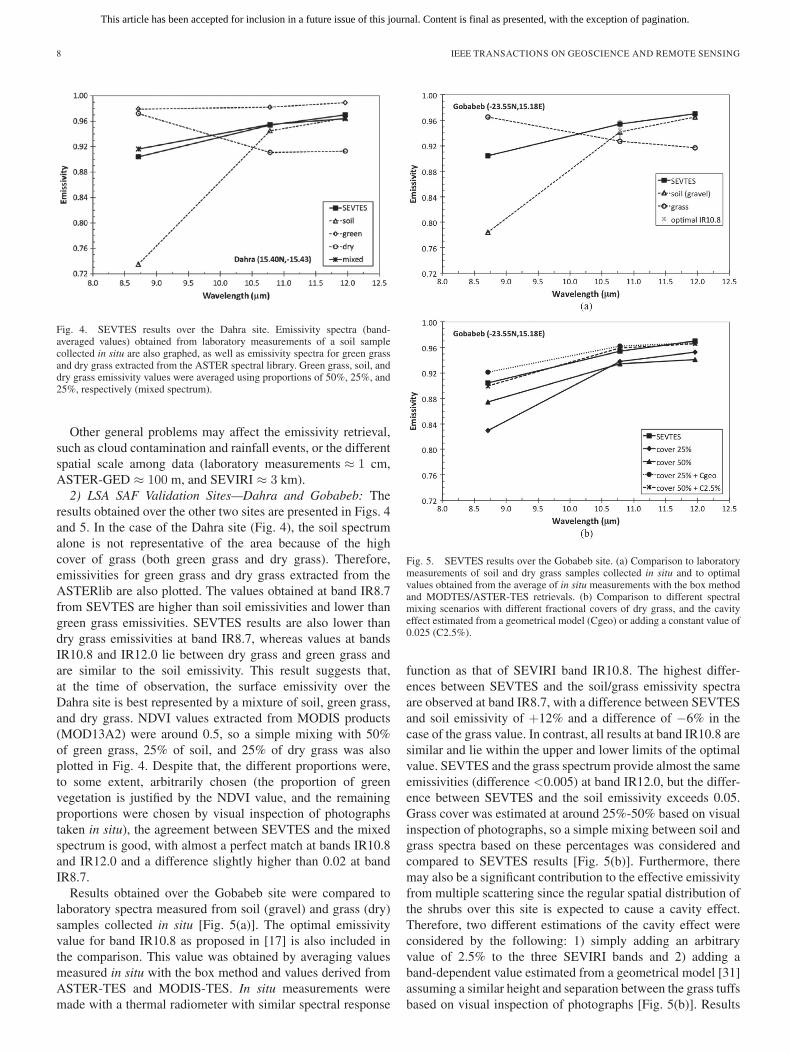
Fig. 4. SEVTES results over the Dahra site. Emissivity spectra (band-averaged values) obtained from laboratory measurements of a soil samplecollected in situ are also graphed, as well as emissivity spectra for green grassand dry grass extracted from the ASTER spectral library. Green grass, soil, anddry grass emissivity values were averaged using proportions of 50%, 25%, and25%, respectively (mixed spectrum).
Other general problems may affect the emissivity retrieval,such as cloud contamination and rainfall events, or the differentspatial scale among data (laboratory measurements ≈ 1 cm,ASTER-GED ≈ 100 m, and SEVIRI ≈ 3 km).
2) LSA SAF Validation Sites—Dahra and Gobabeb: Theresults obtained over the other two sites are presented in Figs. 4and 5. In the case of the Dahra site (Fig. 4), the soil spectrumalone is not representative of the area because of the highcover of grass (both green grass and dry grass). Therefore,emissivities for green grass and dry grass extracted from theASTERlib are also plotted. The values obtained at band IR8.7from SEVTES are higher than soil emissivities and lower thangreen grass emissivities. SEVTES results are also lower thandry grass emissivities at band IR8.7, whereas values at bandsIR10.8 and IR12.0 lie between dry grass and green grass andare similar to the soil emissivity. This result suggests that,at the time of observation, the surface emissivity over theDahra site is best represented by a mixture of soil, green grass,and dry grass. NDVI values extracted from MODIS products(MOD13A2) were around 0.5, so a simple mixing with 50%of green grass, 25% of soil, and 25% of dry grass was alsoplotted in Fig. 4. Despite that, the different proportions were,to some extent, arbitrarily chosen (the proportion of greenvegetation is justified by the NDVI value, and the remainingproportions were chosen by visual inspection of photographstaken in situ), the agreement between SEVTES and the mixedspectrum is good, with almost a perfect match at bands IR10.8and IR12.0 and a difference slightly higher than 0.02 at bandIR8.7.
Results obtained over the Gobabeb site were compared tolaboratory spectra measured from soil (gravel) and grass (dry)samples collected in situ [Fig. 5(a)]. The optimal emissivityvalue for band IR10.8 as proposed in [17] is also included inthe comparison. This value was obtained by averaging valuesmeasured in situ with the box method and values derived fromASTER-TES and MODIS-TES. In situ measurements weremade with a thermal radiometer with similar spectral response
Fig. 5. SEVTES results over the Gobabeb site. (a) Comparison to laboratorymeasurements of soil and dry grass samples collected in situ and to optimalvalues obtained from the average of in situ measurements with the box methodand MODTES/ASTER-TES retrievals. (b) Comparison to different spectralmixing scenarios with different fractional covers of dry grass, and the cavityeffect estimated from a geometrical model (Cgeo) or adding a constant value of0.025 (C2.5%).
function as that of SEVIRI band IR10.8. The highest differ-ences between SEVTES and the soil/grass emissivity spectraare observed at band IR8.7, with a difference between SEVTESand soil emissivity of +12% and a difference of −6% in thecase of the grass value. In contrast, all results at band IR10.8 aresimilar and lie within the upper and lower limits of the optimalvalue. SEVTES and the grass spectrum provide almost the sameemissivities (difference <0.005) at band IR12.0, but the differ-ence between SEVTES and the soil emissivity exceeds 0.05.Grass cover was estimated at around 25%-50% based on visualinspection of photographs, so a simple mixing between soil andgrass spectra based on these percentages was considered andcompared to SEVTES results [Fig. 5(b)]. Furthermore, theremay also be a significant contribution to the effective emissivityfrom multiple scattering since the regular spatial distribution ofthe shrubs over this site is expected to cause a cavity effect.Therefore, two different estimations of the cavity effect wereconsidered by the following: 1) simply adding an arbitraryvalue of 2.5% to the three SEVIRI bands and 2) adding aband-dependent value estimated from a geometrical model [31]assuming a similar height and separation between the grass tuffsbased on visual inspection of photographs [Fig. 5(b)]. Results

This article has been accepted for inclusion in a future issue of this journal. Content is final as presented, with the exception of pagination.
JIMÉNEZ-MUÑOZ et al.: TEMPERATURE AND EMISSIVITY SEPARATION FROM MSG/SEVIRI DATA 9
show a significant difference between SEVTES and mixedvalues when the cavity effect is not considered, especially atband IR8.7, with differences of around 3% for grass cover of50% and up to 7% for grass cover of 25% (SEVTES providinghigher emissivity values than the spectral mixing). Differencesare considerably reduced when the cavity effect is considered.In the case of the estimations from the geometrical model (withgrass cover set to 25%), the difference at band IR8.7 is 2%,whereas the differences at bands IR10.8 and IR12.0 are lowerthan 1%. Almost a perfect match between SEVTES and mixedvalues was found when adding a constant value of 2.5% (withgrass cover set to 50%). However, the values obtained fromthe geometrical model (which are band dependent) are morerealistic and have a physical justification.
C. Intercomparison Between SEVTES- andMODIS-Derived Emissivities
In this section, results obtained from SEVTES are intercom-pared to emissivities derived from MODIS data and extractedfrom two different sources: 1) the MODIS GCM standard prod-ucts at different time-averaged periods and 2) the TES algo-rithm applied to MODIS radiances extracted from the level 1bswath product. An analysis of the results is focused on theMarrakech, Namib, and Kalahari sites.
1) MOD11Cx Products: MODIS GCM products includesurface emissivities at global scale with a spatial resolutionof 0.05◦ (around 5 km). This spatial resolution is similar tothat of the SEVIRI (3–5 km), so it is advisable to intercom-pare the emissivities retrieved from the SEVTES algorithmand the emissivities extracted from the MODIS GCM prod-uct. Since the MODIS project generates a variety of time-averaged products with different processing versions, we firstanalyzed the differences between the MODIS products them-selves: MOD11C1 (daily), MOD11C2 (8 day), and MOD11C3(monthly) products versions 4.1 and 5. Results are presented inFig. 6. Version 4.1 shows more differences between C1, C2, andC3 products than version 5 at bands 31 (11 μm) and 32 (12 μm).Hence, C1, C2, and C3 v5 products provide similar values, withdifferences between these three products lower than 0.002. Inthe case of v4.1, the differences between the three products atthese two bands are around 0.01, except for band 32 over theMarrakech site, with a difference higher than 0.02. However,when we focus on band 29 (8.5 μm), version 4.1 productsshow lower differences than those of version 5: differencesare between 0.01 and 0.016 in version 4.1, but differences inversion 5 are higher than 0.02 and 0.05 over the Marrakech andNamib sites, respectively.
When compared to laboratory measurements, differences inv4.1 products are lower than those of v5 for all of the bands andsites, except for bands 31 and 32 over the Marrakech site, withdifferences (MODIS-laboratory) between 0.003 and 0.006 in v5and differences between −0.012 and −0.037 in v4.1. The twoversions provide large differences at band 29 over the Namiband Kalahari sites: between 0.04 and 0.05, and between 0.08and 0.1, respectively, in the case of v4.1 and between 0.04 and0.09, and slightly higher than 0.01, respectively, in the case ofv5. These results suggest a better performance of v4.1 products
Fig. 6. Intercomparison between MOD11 C1, C2, and C3 v4.1 (top) and v5(bottom) emissivity products at MODIS bands 29 (8.5 μm), 31 (11 μm), and 32(12 μm) over the three study areas. Circles refer to laboratory measurements.
than v5 products, as pointed out in [22], although both versionsare similar in some cases.
Fig. 7 shows a comparison between the emissivity spec-tra obtained from SEVTES (using MOD07 and ERA-Interimfor the atmospheric correction) and MOD11C3 v4.1 and v5products. A clear difference is observed between MOD11C3v4.1 and v5 products over the Marrakech site, with v5providing higher emissivity values than v4.1. In this case,SEVTES_MOD07 results are similar to MOD11C3 v5 re-sults (differences <0.01), whereas the emissivity spectrumobtained from SEVTES_ERA departs significantly from bothMOD11C3 v4.1 and MOD11C3 v5 products. In the case of theNamib site, the differences between the different MOD11C3versions are not observed, and the emissivity spectra obtainedfrom SEVTES_MOD07 and SEVTES_ERA are quite similar,but the differences between MOD11C3 and SEVTES at band29 are extremely large (>0.14). The bias between the twoMOD11C3 versions is not observed over the Kalahari siteeither, but in this case, SEVTES_MOD07 and SEVTES_ERAspectra are different, especially at SEVIRI band IR8.7 (differ-ences between SEVTES_MOD07 and SEVTES_ERA >0.09).Therefore, at this band, the difference between MOD11C3products and SEVTES_ERA is close to 0.12. This differ-ence is significantly reduced to around 0.03 in the case ofSEVTES_MOD07.

This article has been accepted for inclusion in a future issue of this journal. Content is final as presented, with the exception of pagination.
10 IEEE TRANSACTIONS ON GEOSCIENCE AND REMOTE SENSING
Fig. 7. SEVTES results compared to values extracted from MOD11C3v4.1and MOD11C3v5 products over the Marrakech, Namib, and Kalahari sites.MOD07 and ERA-Interim atmospheric profiles were used for the atmosphericcorrection.
2) MODTES: The results obtained from the TES algo-rithm applied to SEVIRI and MODIS data (SEVTES versusMODTES) are presented in Fig. 8. As expected, the resultsobtained from MODTES_MOD07 are similar to those ob-tained from SEVTES_MOD07, whereas the results obtainedfrom MODTES_ERA are similar to those obtained fromSEVTES_ERA. The differences (MODTES-SEVTES) over theNamib and Kalahari sites are typically below 0.01 or evenbelow 0.005 in some cases. However, over the Marrakech site,these differences are −0.018 at band 8.5–8.7 μm when usingMOD07 in the atmospheric correction and up to +0.02 and−0.02, respectively, when using MOD07 and ERA-Interimatmospheric profiles at band 11 μm. Differences are alsoobserved in the shape of the emissivity spectrum due to an
Fig. 8. SEVTES results compared to application of TES algorithm to MODISdata (MODTES), using MOD07 or ERA-Interim atmospheric profiles for theatmospheric correction.
underestimation of emissivity from MODTES at band 11 μm.This result may be attributed to the low spectral contrast of theMarrakech site and the problem of TES over these surfaces,such that even small atmospheric errors could change the shapeof the spectrum.
D. Intercomparison Between SEVTES and LSA SAFEmissivity Product
In order to analyze the potential implications for the LSASAF operational product, SEVTES emissivities were comparedto emissivities extracted from the LSA SAF EM product overthe five sites. Values were extracted from a single SEVIRI pixelcentered at the given latitude and longitude. In the case of theMarrakech, Namib, Gobabeb, and Kalahari sites, the central

This article has been accepted for inclusion in a future issue of this journal. Content is final as presented, with the exception of pagination.
JIMÉNEZ-MUÑOZ et al.: TEMPERATURE AND EMISSIVITY SEPARATION FROM MSG/SEVIRI DATA 11
Fig. 9. Comparison between SEVTES emissivities and those extracted from the LSA SAF emissivity internal product over the different sites. Dahra #1 andDahra #2 refer to values extracted from the central pixel according to the geographical coordinates of the site and the pixel neighbor to the west, respectively.
pixel observed in the LSA SAF EM product was surroundedby pixels with the same value, which means that the area waslargely homogeneous in terms of the classification used in theLSA SAF product (but not necessarily in terms of real surfacecomposition). In the case of Dahra, the pixel neighbor to thewest provided a value different from that of the central pixel, soboth values were extracted and compared to SEVTES results(Dahra #1 and Dahra #2 for the central and western pixels,respectively). Results are presented in Fig. 9. The greatestdifferences between SEVTES and LSA SAF EM are observedfor band IR8.7. In some cases, these differences are extremelylarge: more than 10% in the case of Namib (SEVTES providinglower values than LSA SAF) and around 8% in the case ofGobabeb (SEVTES providing higher values than LSA SAF).Differences are also great over the Kalahari site (near to 5%,SEVTES providing lower values than LSA SAF) and theDahra #2 site (3.5%, SEVTES providing higher values than
LSA SAF). Differences are moderate and around 2% over theother sites (SEVTES providing higher values than LSA SAF overthe Marrakech site and the opposite over the Dahra #1 site).
The differences between SEVTES and LSA SAF EM prod-ucts are less pronounced at band IR10.8, with values below1% except for the Namib and Dahra #1 sites, with differ-ences slightly higher than 1.5%. Significant differences arenot observed at band IR12.0, with almost a perfect match(within ±0.005) between SEVTES values and LSA SAF EMvalues.
E. Spatial Patterns of Emissivity: SEVTES, LSA SAF EM,and MOD11Cx
The analysis of results presented in previous sections focusedon emissivity spectra retrievals over single pixels centered atthe different sites. However, it is also necessary to derive
This article has been accepted for inclusion in a future issue of this journal. Content is final as presented, with the exception of pagination.
12 IEEE TRANSACTIONS ON GEOSCIENCE AND REMOTE SENSING
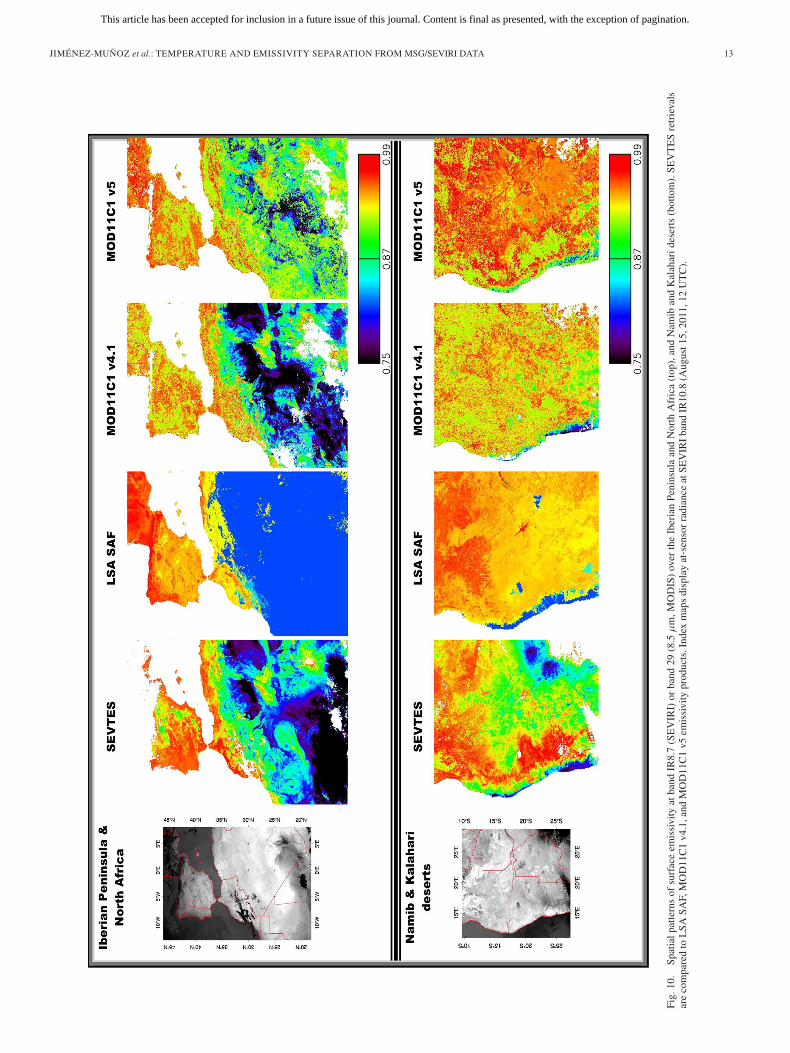
emissivity maps in order to demonstrate the applicability ofthe TES algorithm to SEVIRI data for generating continentaloperational products of emissivity and also for determiningwhether these maps reflect spatial variations on emissivitywithout step discontinuities or other artifacts (e.g., undesirablenoise), regardless of the accuracy of the emissivity values. Forthis purpose, two areas were selected: 1) the Iberian Peninsulaand North Africa and 2) the Namib and Kalahari desert areas inSouthern Africa.
Fig. 10 illustrates the TES-derived emissivity map forSEVIRI band IR8.7 over the two selected areas. ERA-Interimatmospheric profiles were considered in the atmospheric cor-rection on a pixel-by-pixel basis. The emissivity maps showcontinuous variations in surface emissivity, and artificial dis-continuities are not a priori observed. Fig. 10 also includesthe emissivity map for SEVIRI band IR8.7 extracted from theLSA SAF EM product, as well as the emissivity maps forMODIS band 29 (8.5 μm) extracted from MOD11C1 v4.1 andv5 products. The differences in the spatial pattern betweenSEVTES and LSA SAF are significant, especially over barren/desert areas such as the Sahara and Namib Deserts, withdifferences up to 10% between the two products. Emissivitymaps for MOD11C1 v4.1 provide more continuous and realisticspatial patterns for the surface emissivity than MOD11C1 v5over the Sahara desert. In general, MOD11C1 v5 productsshow some step discontinuities (e.g., Sahara desert) due to acloser coupling of SW and day/night algorithms. Significantdifferences between v4.1 and v5 over Southern Africa arealso observed. When SEVTES and MOD11C1 products arecompared, it is observed that MOD11C1 v4.1 provides a similarspatial pattern to that of SEVTES over the Sahara desert,although some discrepancies are observed over the IberianPeninsula (e.g., SEVTES provides higher emissivity valuesover the western part of the peninsula and also over the easterncoast). In contrast, SEVTES provides a more realistic spatialpattern of emissivity over Southern Africa than MOD11C1 v4.1or v5.
V. DISCUSSION AND CONCLUSION
In this paper, we have analyzed the feasibility of applyingthe TES algorithm to three TIR bands of SEVIRI. Althoughthe TES algorithm was originally designed to also work withthis minimal spectral configuration (three bands) [6], only afew analyses are reported in the literature, with the exceptionof the MODIS case [11]. Analysis of the performance of theTES algorithm with only three bands was also an importantdiscussion in the framework of different proposals for futureTIR missions, such as the Micro Satellite for Thermal InfraredGround Surface Imaging mission, initiated by the French SpaceOrganisation (CNES) in collaboration with Spain [32], andthe Thermal Infrared Explorer mission, led by Spain and co-led by France, and presented to the ESA’s proposal for EarthExplorer Opportunity Mission (EE-8) [33]. The TES algorithmwas chosen as the main candidate algorithm to retrieve LSTand emissivity in the framework of these two missions, whilethe imaging sensor has to be designed with the minimumnumber of bands to save costs. To this end, this paper has
provided additional information about the performance of theTES algorithm with only three bands.
The TES algorithm was successfully applied to SEVIRI im-agery, and the retrieved surface emissivities (and temperature)are spatially continuous and appear to reflect real conditionsof the surface, with improved spatial patterns when comparedto MOD11Cx products in some cases. Algorithm testing withsimulated data yields error estimates of 0.015 in emissivityand 1.5 K in temperature over a large variety of surfaceswhenever atmospheric correction is accurate. Algorithm testingusing SEVIRI data shows that accuracies are maintained oversurfaces with high spectral contrast (e.g., Namib Desert). TheTES algorithm exhibits greater uncertainties over graybody sur-faces because low-contrast surfaces depart from the regressionline (εmin versus MMD). The Marrakech, Dahra, and Gobabebsites have the lowest spectral contrast values (between 0.03and 0.05), but in these cases, the TES algorithm still providedsatisfactory results, although inaccuracies were higher than theywere for the Namib site, which had the highest spectral contrast.These inaccuracies can be partly attributed to the presence ofdry grass and green grass over the sites, as well as to the cavityeffect. The presence of grass over the sites requires a correctestimation of fractional covers, an easy task for green grass(e.g., using simple approaches with the NDVI), but a criticaltask when the grass is dry. A rigorous estimation of the cavityeffect requires the use of a geometrical model and estimation ofdifferent geometrical parameters. Over fully vegetated surfaces,approaches based on the NDVI were found to be more accuratethan those using the TES algorithm [34], but these approachesrequire a priori knowledge of background soil and vegetationemissivity spectra. Since these approaches are based on thedetection of vegetation greenness, results over surfaces withdry vegetation or with little vegetation cover—as investigated inthis study-are usually more uncertain. It was demonstrated thatatmospheric correction is a critical step in the retrieval of emis-sivities and LST with the TES algorithm. When using MODISMOD07 and ERA-Interim reanalysis atmospheric products toperform atmospheric correction, significant differences havebeen observed; in summary, MOD07 underestimates the totalatmospheric water vapor content, whereas ERA-Interim overes-timates it, probably due to cloud contamination of the spatiallycoarse ERA-Interim grid cells, which results in overly highwater vapor contents at the location of the satellite pixel. On theother hand, the reanalysis data have the advantage of providingpermanent and globally continuous atmospheric information ona subdaily basis (four times a day). Other methodologies, suchas the WVS method, have been found to improve atmosphericcorrection [35], [36], which allows the TES algorithm to main-tain its accuracy over graybody surfaces.
On the other hand, when surface emissivity is known a priori,SW algorithms for LST can be used, thus avoiding the strongdependence on accurate atmospheric correction. This is theapproach currently adopted in the framework of the LSA SAFproject for generating the operational LST product, using inputemissivities based on a classification-based approach. WhenSEVTES is compared to the LSA SAF emissivity product,large differences are observed for band IR8.7 (e.g., more than10% in the case of the Namib Desert), which implies that the
This article has been accepted for inclusion in a future issue of this journal. Content is final as presented, with the exception of pagination.
JIMÉNEZ-MUÑOZ et al.: TEMPERATURE AND EMISSIVITY SEPARATION FROM MSG/SEVIRI DATA 13
Fig.
10.
Spat
ialp
atte
rns
ofsu
rfac
eem
issi
vity
atba
ndIR
8.7
(SE
VIR
I)or
band
29(8
.5μ
m,M
OD
IS)
over
the
Iber
ian
Peni
nsul
aan
dN
orth
Afr
ica
(top
),an
dN
amib
and
Kal
ahar
ides
erts
(bot
tom
).SE
VT
ES
retr
ieva
lsar
eco
mpa
red
toL
SASA
F,M
OD
11C
1v4
.1,a
ndM
OD
11C
1v5
emis
sivi
typr
oduc
ts.I
ndex
map
sdi
spla
yat
-sen
sor
radi
ance
atSE
VIR
Iba
ndIR
10.8
(Aug
ust1
5,20
11,1
2U
TC
).
This article has been accepted for inclusion in a future issue of this journal. Content is final as presented, with the exception of pagination.
14 IEEE TRANSACTIONS ON GEOSCIENCE AND REMOTE SENSING
LSA SAF EM product may be invalid over some areas. Thisresult does not affect the LSA SAF LST product, since theSW algorithm only uses bands IR10.8 and IR12.0. However,band IR8.7 provides valuable information about soil conditions,such as the soil moisture [9], [37], which could be monitoredat subdaily temporal resolution using SEVTES. Despite thesmaller differences between SEVTES and LSA SAF EM atband IR10.8 of about 1%–2%, this uncertainty may still impactthe SW algorithm. Significant differences at band IR12.0 werenot observed (<0.5%).
Applying TES to SEVIRI data makes it possible for thefirst time to retrieve multispectral emissivity (8.7, 10.8, and12.0 μm) at subdaily temporal resolution and thus providesvaluable information about surface emissivity and its dynamics:therefore, it is recommended that SEVTES emissivity be de-veloped into an operational satellite product for MSG/SEVIRI.Furthermore, SEVTES retrievals improve the LSA SAF prod-uct over arid and semiarid areas, so a combination of SW andTES methodologies is also recommended for improving theoperational LSA SAF LST product, in analogy to the MODIScase [11].
ACKNOWLEDGMENT
The authors would like to thank G. Sòria and Y. Julien(GCU-LPI, University of Valencia) for their technical supportwith SEVIRI images and the anonymous reviewers for theircomments which were helpful in improving this paper. Thein situ validation data for the Gobabeb and Dahra sites wereobtained within the context of the Land Surface AnalysisSatellite Applications Facility, a project funded by the EuropeanOrganization for the Exploitation of Meteorological Satellites(EUMETSAT).
REFERENCES
[1] J. A. Sobrino, J. C. Jiménez-Muñoz, G. Sòria, M. Romaguera, L. Guanter,J. Moreno, A. Plaza, and P. Martínez, “Land surface emissivity retrievalfrom different VNIR and TIR sensors,” IEEE Trans. Geosci. RemoteSens., vol. 46, no. 2, pp. 316–327, Feb. 2008.
[2] A. N French, T. J. Schmugge, J. C. Ritchie, A. Hsu, F. Jacob, andK. Ogawa, “Detecting land cover change at the Jornada ExperimentalRange, New Mexico with ASTER emissivities,” Remote Sens. Environ.,vol. 112, no. 4, pp. 1730–1748, Apr. 2008.
[3] A. N. French and A. Inamdar, “Land cover characterization for hydrolog-ical modelling using thermal infrared emissivities,” Int. J. Remote Sens.,vol. 31, no. 14, pp. 3867–3883, Apr. 2010.
[4] Z.-L. Li, B.-H. Tang, H. Wu, H. Ren, G. Yan, Z. Wan, I. F. Trigo, andJ. A. Sobrino, “Satellite-derived land surface temperature: Current statusand perspectives,” Remote Sens. Environ., vol. 131, pp. 14–37, Apr. 2013.
[5] Z.-L. Li, H. Wu, N. Wang, S. Qiu, J. A. Sobrino, Z. Wan, B.-H. Tang,and G. Yan, “Land surface emissivity retrieval from satellite data,” Int. J.Remote Sens., vol. 34, no. 9/10, pp. 3084–3127, 2013.
[6] A. Gillespie, S. Rokugawa, T. Matsunaga, J. S. Cothern, S. Hook, andA. B. Kahle, “A temperature and emissivity separation algorithm forAdvanced Spaceborne Thermal Emission and Reflection Radiometer(ASTER) images,” IEEE Trans. Geosci. Remote Sens., vol. 36, no. 4,pp. 1113–1126, Jul. 1998.
[7] L. M. McMillin, “Estimation of sea surface temperature from two in-frared window measurements with different absorption,” J. Geophys. Res.,vol. 80, pp. 5113–5117, 1975.
[8] J. A. Sobrino, Z.-L. Li, M. P. Stoll, and F. Becker, “Multi-channel andmulti-angle algorithms for estimating sea and land surface temperaturewith ATSR data,” Int. J. Remote Sens., vol. 17, no. 11, pp. 2089–2114,1996.
[9] G. C. Hulley, S. J. Hook, and A. M. Baldridge, “Investigating the effects ofsoil moisture on thermal infrared land surface temperature and emissivity
using satellite retrievals and laboratory measurements,” Remote Sens.Environ., vol. 114, pp. 1480–1493, Jul. 2010.
[10] J. C. Jiménez-Muñoz, J. A. Sobrino, C. Mattar, B. Franch, G. Sòria,V. Hidalgo, R. Oltra-Carrió, and Y. Julien, “Evaluation of MODIS atmo-spheric profiles product for atmospheric correction in the thermal infrareddomain,” in Proc. 3rd Recent Adv. Quantitative Remote Sens., Valencia,Spain, Sep. 27–Oct. 1, 2010, pp. 39–43.
[11] G. C. Hulley and S. J. Hook, “Generating consistent land surface temper-ature and emissivity products between ASTER and MODIS data for earthscience research,” IEEE Trans. Geosci. Remote Sens., vol. 49, pp. 1304–1315, 2011.
[12] H. Tonooka, “Atmospheric correction of MODIS thermal infrared bandsby water vapor scaling method,” in Proc. SPIE 5979, Remote Sens. CloudsAtmosphere X, Oct. 31, 2005, 59790I.
[13] Z. Wan and J. Dozier, “A generalized split-window algorithm for retriev-ing land-surface temperature from space,” IEEE Trans. Geosci. RemoteSens., vol. 34, no. 4, pp. 892–905, Jul. 1996.
[14] L. F. Peres and C. C. DaCamara, “Emissivity maps to retrieve land-surface temperature from MSG/SEVIRI,” IEEE Trans. Geosci. RemoteSen., vol. 43, no. 8, pp. 1834–1844, Aug. 2005.
[15] S. C. Freitas, I. F. Trigo, J. M. Bioucas-Dias, and F. Göttsche, “Quan-tifying the uncertainty of land surface temperature retrievals fromSEVIRI/Meteosat,” IEEE Trans. Geosci. Remote Sens., vol. 48, no. 1,pp. 523–534, Jan. 1996.
[16] R. Niclòs, J. M. Galve, J. A. Valiente, M. J. Estrela, and C. Coll, “Ac-curacy assessment of land surface temperature retrievals from MSG2-SEVIRI data,” Remote Sens. Environ., vol. 115, no. 8, pp. 2126–2140,Aug. 2012.
[17] F.-M. Göttsche and G. C. Hulley, “Validation of six satellite-retrievedland surface emissivity products over two land cover types in a hyper-aridregion,” Remote Sens. Environ., vol. 124, pp. 149–158, 2012.
[18] A. Beck, G. P. Anderson, P. K. Acharya, J. H. Chetwynd, L. S. Bernstein,E. P. Shettle, M. W. Matthew, and S. M. Adler-Golden, MODTRAN4User’s Manual. Hanscom AFB, MA, USA: Air Force Res. Lab., 1999.
[19] J. C. Jiménez-Muñoz, J. Cristóbal, J. A. Sobrino, G. Sòria, M. Ninyerola,and X. Pons, “Revision of the single-channel algorithm for land surfacetemperature retrieval from Landsat thermal-infrared data,” IEEE Trans.Geosci. Remote Sens., vol. 47, no. 1, pp. 339–349, Jan. 2009.
[20] A. M. Baldridge, S. J. Hook, C. I. Grove, and G. Rivera, “The ASTERspectral library version 2.0,” Remote Sens. Environ., vol. 113, pp. 711–715, Apr. 2009.
[21] Z. Wan and Z.-L. Li, “A physics-based algorithm for retrieving land-surface emissivity and temperature from EOS/MODIS data,” IEEE Trans.Geosci. Remote Sens., vol. 35, no. 4, pp. 980–996, 1997.
[22] G. C. Hulley and S. J. Hook, “Intercomparison of versions 4, 4.1 and5 of the MODIS land surface temperature and emissivity products andvalidation with laboratory measurements of sand samples from the NamibDesert, Namibia,” Remote Sens. Environ., vol. 113, no. 6, pp. 1313–1318,Jun. 2009.
[23] H. Tonooka, “Accurate atmospheric correction of ASTER thermal in-frared imagery using the WVS method,” IEEE Trans. Geosci. RemoteSens., vol. 43, no. 12, pp. 2778–2792, Dec. 2005.
[24] G. C. Hulley and S. J. Hook, “The North American ASTER Land SurfaceEmissivity Database (NAALSED) version 2.0,” Remote Sens. Environ.,vol. 113, no. 9, pp. 1967–1975, Sep. 2009.
[25] G. C. Hulley, S. J. Hook, and A. M. Baldridge, “Validation of theNorth American ASTER Land Surface Emissivity Database (NAALSED)version 2.0,” Remote Sens. Environ., vol. 113, no. 10, pp. 2224–2233,Oct. 2009.
[26] University of Wisconsin-Madison, S. W. Seemann, E. E. Borbas, J. Li,W. P. Menzel, and L. E. Gumley, MODIS Atmospheric Profile RetrievalAlgorithm Theoretical Basis Document, Oct. 25, 2006.
[27] D. P. Dee, S. M. Uppala, A. J. Simmons, P. Berrisford, P. Poli,S. Kobayashi, U. Andrae, M. A. Balmaseda, G. Balsamo, P. Bauer,P. Bechtold, A. C. M. Beljaars, L. van de Berg, J. Bidlot, N. Bormann,C. Delsol, R. Dragani, M. Fuentes, A. J. Geer, L. Haimberger,S. B. Healy, H. Hersbach, E. V. Hólm, L. Isaksen, P. Kållberg, M. Köhler,M. Matricardi, A. P. McNally, B. M. Monge-Sanz, J.-J. Morcrette,B.-K. Park, C. Peubey, P. de Rosnay, C. Tavolato, J.-N. Thépaut, andF. Vitart, “The ERA interim reanalysis: Configuration and performance ofthe data assimilation system,” Q. J. R. Meteorol. Soc., vol. 137, no. 656,pp. 553–597, Apr. 2011.
[28] J. A. Sobrino, C. Mattar, P. Pardo, J. C. Jiménez-Muñoz, S. J. Hook,A. Baldridge, and R. Ibáñez, “Soil emissivity and reflectance spectrameasurements,” Appl. Opt., vol. 48, no. 19, pp. 3664–3670, Jul. 2009.
[29] G. C. Hulley, S. J. Hook, E. Manning, S.-Y. Lee, and E. Fetzer, “Valida-tion of the Atmospheric Infrared Sounder (AIRS) version 5 land surface
This article has been accepted for inclusion in a future issue of this journal. Content is final as presented, with the exception of pagination.
JIMÉNEZ-MUÑOZ et al.: TEMPERATURE AND EMISSIVITY SEPARATION FROM MSG/SEVIRI DATA 15
emissivity product over the Namib and Kalahari Deserts,” J. Geophys.Res., vol. 114, no. D19, p. D19104, Oct. 2009.
[30] D. E. Sabol, Jr., A. R. Gillespie, E. Abbott, and G. Yamada, “Fieldvalidation of the ASTER temperature-emissivity separation algorithm,”Remote Sens. Environ., vol. 113, no. 11, pp. 2328–2344, Nov. 2009.
[31] J. A. Sobrino, V. Caselles, and F. Becker, “Significance of the remotelysensed thermal infrared measurements obtained over a citrus orchard,”ISPRS J. Photogramm., vol. 44, no. 6, pp. 343–354, Mar. 1990.
[32] J.-P. Lagouarde, M. Bach, J. A. Sobrino, G. Boulet, X. Briottet,S. Cherchali, B. Coudert, I. Dadou, G. Dedieu, P. Gamet, O. Hagolle,F. Jacob, F. Nerry, A. Olioso, C. Ottlé, V. Pascal, J.L. Roujean, andF. T. García-Moreno, “MISTIGRI, a microsatellite project associatinghigh spatial resolution and high revisit frequency in the thermal infrared,”in Proc. 3rd Recent Adv. Quantitative Remote Sens., Valencia, Spain,Sep. 27–Oct. 1, 2010, pp. 444–449.
[33] J. A. Sobrino, J. P. Lagouarde, G. Boulet, X. Briottet, S. Cherchali,B. Coudert, I. Dadou, G. Dedieu, A. Gillespie, O. Hagolle, F. Jacob,J. Jiménez-Muñoz, P. Manunta, A. Mueller, F. Nerry, A. Olioso, C. Ottle,K. Price, J. Roujean, A. Royer, W. Stefanov, J. Voogt, I. Wattson, andP. Zarco-Tejada, “Overview of the Thermal Infrared Explorer (TIREX)mission,” in Proc. Abstract Book 3rd Recent Adv. Quantitative RemoteSens., Valencia, Spain, Sep. 27–Oct. 1, 2010, pp. 213–214.
[34] J. C. Jiménez-Muñoz, J. A. Sobrino, A. Gillespie, D. Sabol, andW. T. Gustafson, “Improved land surface emissivities over agriculturalareas using ASTER NDVI,” Remote Sens. Environ., vol. 103, no. 4,pp. 474–487, Aug. 2006.
[35] A. R. Gillespie, E. A. Abbott, L. Gilson, G. Hulley, J.-C. Jiménez-Muñoz,and J. A. Sobrino, “Residual errors in ASTER temperature and emissivitystandard products AST08 and AST05,” Remote Sens. Environ., vol. 115,no. 12, pp. 3681–3694, Dec. 2011.
[36] G. Hulley, C. Hughes, and S. J. Hook, “Quantifying uncertainties in landsurface temperature (LST) and emissivity retrievals from ASTER andMODIS thermal infrared data,” J. Geophys. Res., vol. 117, p. D23, Dec.2012. doi:10.1029/2012JD18506.
[37] J. A. Sobrino, B. Franch, C. Mattar, J. C. Jiménez-Muñoz, and C. Corbari,“A method to estimate soil moisture from Airborne Hyperspectral Scan-ner (AHS) and ASTER data: Application to SEN2FLEX and SEN3EXPcampaigns,” Remote Sens. Environ., vol. 117, pp. 415–428, Feb. 2012.
Juan C. Jiménez-Muñoz received the Ph.D. degreein physics from the University of Valencia, Valencia,Spain, in 2005.
He is currently a Research Scientist with theGlobal Change Unit, Image Processing Laboratory,University of Valencia, where he has been an Assis-tant Professor with the Department of Earth Physicsand Thermodynamics, Faculty of Physics, since2010. His main research interests include applica-tions of thermal remote sensing and land surfacetemperature and emissivity retrieval.
José A. Sobrino is a Professor of physics and remotesensing and the Head of the Global Change Unit,University of Valencia, Valencia, Spain. He is theauthor of more than 150 papers. His research inter-est includes atmospheric correction in visible andinfrared domains, retrieval of emissivity and surfacetemperature from satellite images, and developmentof remote sensing methods for land cover dynamicmonitoring.
Dr. Sobrino is currently the President of the Span-ish Association of Remote Sensing, and he was the
Director of the Spanish Journal of Remote Sensing from 2009 to 2013, thePresident of the series of Symposiums on Recent Advances in QuantitativeRemote Sensing, and a member of the Earth Science Advisory Committee ofthe European Space Agency (2003–2007).
Cristian Mattar received the Ph.D. degree inphysics from the University of Valencia, Valencia,Spain, in 2011.
He is currently a Research Scientist with the Lab-oratory for Analysis of the Biosphere, Departmentof Environmental Sciences, University of Chile,Santiago, Chile. His main research interests includesynergic remote sensing algorithms.
Glynn Hulley received the B.Sc. degree from Fran-cis Marion University, Florence, SC, USA, in 2001and the M.Sc. and Ph.D. degrees in atmosphericphysics from the University of Maryland BaltimoreCounty, Baltimore, MD, USA, in 2004 and 2007,respectively.
He is currently a Research Scientist with theJet Propulsion Laboratory, California Institute ofTechnology, Pasadena, CA, USA. He is a mem-ber of several instrument teams including ASTER,MODIS, AIRS, Suomi-NPP, and Landsat, where he
has played a key role in development of new techniques to analyze andextract critical information from thermal remotely sensed data, particularly landsurface temperature and spectral emissivity. His research expertise is in thermalinfrared spectroscopy.
Frank-M. Göttsche received the M.Sc. degree inphysics and the Ph.D. degree in geophysics from theUniversity of Kiel, Kiel, Germany, in 1993 and 1997,respectively.
From 1996 to 1997, he was a scholar at theDepartment of Earth Sciences, Uppsala University,Uppsala, Sweden. Between 1997 and 2003, he wasa Research Scientist with the Institute of Meteo-rology and Climate Research, ForschungszentrumKarlsruhe, Karlsruhe, Germany, where his main ar-eas of research were the retrieval of land surface
temperature (LST) from satellite data with methods from artificial intelligenceand the modeling of the diurnal temperature cycle. From 2003 to 2007, hewas an Assistant Professor with the Physics Department, United Arab EmiratesUniversity, Al Ain, United Arab Emirates, and he served as a Scientific Con-sultant to the Satellite Application Facility on Land Surface Analysis (Land-SAF; EUMETSAT). Since 2007, he has been a Scientist with the KarlsruheInstitute of Technology (KIT), Eggenstein-Leopoldshafen, Germany, where heis in charge of KIT’s permanent ground truth stations in Europe and Africa. Hiscurrent research focuses on the improvement and validation of satellite-derivedLST and LSE products with in situ measurements.