RST analysis of MSG-SEVIRI TIR radiances at the time of the Abruzzo 6 April 2009 earthquake
12
Nat. Hazards Earth Syst. Sci., 9, 2073–2084, 2009 www.nat-hazards-earth-syst-sci.net/9/2073/2009/ © Author(s) 2009. This work is distributed under the Creative Commons Attribution 3.0 License. Natural Hazards and Earth System Sciences RST analysis of MSG-SEVIRI TIR radiances at the time of the Abruzzo 6 April 2009 earthquake N. Genzano 1 , C. Aliano 1 , R. Corrado 1 , C. Filizzola 2 , M. Lisi 1 , G. Mazzeo 1 , R. Paciello 2 , N. Pergola 2,1 , and V. Tramutoli 1,2 1 University of Basilicata, Department of Engineering and Physics of the Environment, Potenza, Italy 2 National Research Council, Institute of Methodologies for Environmental Analysis (IMAA), Tito Scalo (PZ), Italy Received: 31 October 2009 – Accepted: 10 November 2009 – Published: 11 December 2009 Abstract. Space-time fluctuations of Earth’s emitted Ther- mal Infrared (TIR) radiation have been observed from satel- lite months to weeks before earthquakes occurrence. The general RST approach has been proposed in order to discriminate normal (i.e. related to the change of nat- ural factor and/or observation conditions) TIR signal fluc- tuations from anomalous signal transient possibly associ- ated to earthquake occurrence. In this work RST approach is applied to the Abruzzo 6 April 2009 event (M L =5.8) by using for the first time MSG-SEVIRI (Meteosat Sec- ond Generation -Spinning Enhanced Visible and Infrared Im- ager) thermal infrared observations. A validation/confutation analysis has been performed in order to verify the pres- ence/absence of anomalous space-time TIR transients in the presence/absence of significant seismic activity. March– April 2009 has been analyzed for validation purposes. Rela- tively unperturbed periods (no earthquakes with M L ≥5) have been taken for confutation. A specific TIR anomalies space- time persistence analysis as well as a cloud coverage distribu- tion test have been introduced in order to eliminate artifacts and outliers both in the validation and confutation phases. Preliminary results show clear differences in TIR anomalies occurrence during the periods used for validation and confu- tation purposes. Quite clear TIR anomalies appear also to mark main tectonic lines related to the preparatory phases of others, low magnitude (M L ∼4) earthquakes, occurred in the area. Correspondence to: N. Genzano ([email protected]) 1 Introduction Several studies (see for example Gorny et al., 1988; Qiang and Dian, 1992; Tronin, 1996; Qiang et al., 1997; Tronin et al., 2002; Ouzounov and Freund, 2004) have been per- formed, in the past years, reporting the appearance of space- time anomalies in TIR satellite imagery, from weeks to days, before severe earthquakes. Different authors (Qiang et al., 1991; Tramutoli et al., 2001, 2009), in order to explain the appearance of anomalously high TIR records near the place and the time of earthquake occurrence, attributed their ap- pearance to the increase of green-house gas (such as CO 2 , CH 4 , etc.) emission rates, to the modification of ground wa- ter regime (see Hamza, 2001) and/or to the increase of con- vective heat flux (Qiang et al., 1991; Tronin, 2000; Surkov et al., 2006). Other, more complex models (e.g. Mareev et al., 2002; Pulinets et al., 2002, 2006, 2007; Molchanov, 2004; Molchanov et al., 2004; Ouzounov and Freund, 2004; Tronin et al., 2004; Molchanov and Hayakawa, 2008) have been pro- posed, that include the increase of near surface temperature, among the other expected pre-seismic phenomena. Nevertheless such a claimed correlation has been consid- ered, up to now, with some caution by scientific community. The main problems of the mentioned studies were the lack of a rigorous definition of anomalous TIR signal fluctuations, the absence of a convincing testing step based on a valida- tion/confutation approach and the scarce attention paid to the possibility that other causes (e.g. meteorological) different from seismic activity could be responsible for the observed TIR variations. Considering what has been said, a different approach named Robust Satellite data analysis Technique (RST; Tramutoli, 2007), based on the RAT – Robust AVHRR Published by Copernicus Publications on behalf of the European Geosciences Union.
Transcript of RST analysis of MSG-SEVIRI TIR radiances at the time of the Abruzzo 6 April 2009 earthquake

Nat. Hazards Earth Syst. Sci., 9, 2073–2084, 2009www.nat-hazards-earth-syst-sci.net/9/2073/2009/© Author(s) 2009. This work is distributed underthe Creative Commons Attribution 3.0 License.
Natural Hazardsand Earth
System Sciences
RST analysis of MSG-SEVIRI TIR radiances at the time of theAbruzzo 6 April 2009 earthquake
N. Genzano1, C. Aliano1, R. Corrado1, C. Filizzola2, M. Lisi 1, G. Mazzeo1, R. Paciello2, N. Pergola2,1, andV. Tramutoli 1,2
1University of Basilicata, Department of Engineering and Physics of the Environment, Potenza, Italy2National Research Council, Institute of Methodologies for Environmental Analysis (IMAA), Tito Scalo (PZ), Italy
Received: 31 October 2009 – Accepted: 10 November 2009 – Published: 11 December 2009
Abstract. Space-time fluctuations of Earth’s emitted Ther-mal Infrared (TIR) radiation have been observed from satel-lite months to weeks before earthquakes occurrence.
The general RST approach has been proposed in orderto discriminate normal (i.e. related to the change of nat-ural factor and/or observation conditions) TIR signal fluc-tuations from anomalous signal transient possibly associ-ated to earthquake occurrence. In this work RST approachis applied to the Abruzzo 6 April 2009 event (ML=5.8)by using for the first time MSG-SEVIRI (Meteosat Sec-ond Generation -Spinning Enhanced Visible and Infrared Im-ager) thermal infrared observations. A validation/confutationanalysis has been performed in order to verify the pres-ence/absence of anomalous space-time TIR transients in thepresence/absence of significant seismic activity. March–April 2009 has been analyzed for validation purposes. Rela-tively unperturbed periods (no earthquakes withML≥5) havebeen taken for confutation. A specific TIR anomalies space-time persistence analysis as well as a cloud coverage distribu-tion test have been introduced in order to eliminate artifactsand outliers both in the validation and confutation phases.Preliminary results show clear differences in TIR anomaliesoccurrence during the periods used for validation and confu-tation purposes. Quite clear TIR anomalies appear also tomark main tectonic lines related to the preparatory phases ofothers, low magnitude (ML∼4) earthquakes, occurred in thearea.
Correspondence to:N. Genzano([email protected])
1 Introduction
Several studies (see for example Gorny et al., 1988; Qiangand Dian, 1992; Tronin, 1996; Qiang et al., 1997; Troninet al., 2002; Ouzounov and Freund, 2004) have been per-formed, in the past years, reporting the appearance of space-time anomalies in TIR satellite imagery, from weeks to days,before severe earthquakes. Different authors (Qiang et al.,1991; Tramutoli et al., 2001, 2009), in order to explain theappearance of anomalously high TIR records near the placeand the time of earthquake occurrence, attributed their ap-pearance to the increase of green-house gas (such as CO2,CH4, etc.) emission rates, to the modification of ground wa-ter regime (see Hamza, 2001) and/or to the increase of con-vective heat flux (Qiang et al., 1991; Tronin, 2000; Surkov etal., 2006). Other, more complex models (e.g. Mareev et al.,2002; Pulinets et al., 2002, 2006, 2007; Molchanov, 2004;Molchanov et al., 2004; Ouzounov and Freund, 2004; Troninet al., 2004; Molchanov and Hayakawa, 2008) have been pro-posed, that include the increase of near surface temperature,among the other expected pre-seismic phenomena.
Nevertheless such a claimed correlation has been consid-ered, up to now, with some caution by scientific community.The main problems of the mentioned studies were the lack ofa rigorous definition of anomalous TIR signal fluctuations,the absence of a convincing testing step based on a valida-tion/confutation approach and the scarce attention paid to thepossibility that other causes (e.g. meteorological) differentfrom seismic activity could be responsible for the observedTIR variations.
Considering what has been said, a different approachnamed Robust Satellite data analysis Technique (RST;Tramutoli, 2007), based on the RAT – Robust AVHRR
Published by Copernicus Publications on behalf of the European Geosciences Union.

2074 N. Genzano et al.: RST analysis of MSG-SEVIRI TIR radiances of the Abruzzo earthquake
(Advanced Very High Resolution Radiometer) Techniques– approach (Tramutoli, 1998), was proposed to investigatepossible relations between earthquake occurrence and space-time fluctuations of Earth’s emitted TIR radiation as ob-served from satellite. The RST analysis is mainly based on:
– a statistically based definition of “TIR anomalies” al-lowing their identification even in very variable local(e.g. related to atmosphere and/or surface) and observa-tional (e.g. related to time/season, but also to solar andsatellite zenithal angles) conditions,
– a validation/confutation approach, devoted to verify thepresence/absence of anomalous space-time TIR tran-sients in the presence/absence of seismic activity.
The RST approach was already tested in the case of tens ofearthquakes (Tramutoli et al., 2001b, 2005, 2009; Di Bello etal., 2004; Filizzola at al., 2004; Corrado et al., 2005; Gen-zano et al., 2007, 2009; Aliano et al., 2007, 2008a, b, c)occurred in different continents (Europe, Asia, America andAfrica), in various geo-tectonic settings (compressive, exten-sional and transcurrent) and with a wide range of magnitudes(from 4.0 to 7.9).
In this paper, the results of RST analysis performed on5 years of MSG-SEVIRI TIR data collected over the Italianpeninsula are presented.
Results achieved at the time of Abruzzo earthquake(6 April 2009,ML∼5.8) are compared with an identical anal-ysis (confutation) performed in a quite unperturbed (char-acterized by the absence of earthquakes of similar magni-tude over the same area) year, in order to verify the pres-ence/absence of anomalous space-time TIR transients in thepresence/absence of significant earthquakes in similar obser-vational conditions.
2 A robust estimator of thermal anomalies
The RST approach (Tramutoli, 2007) based on the RAT ap-proach (Tramutoli, 1998), is a suitable tool for monitoringdifferent natural and environmental risks. RST has been suc-cessfully applied to the major natural and environmental haz-ards related to: volcano activity (Pergola et al., 2001, 2004a,b; Tramutoli et al., 2001c; Di Bello et al., 2004; Bonfiglioet al., 2005; Marchese et al., 2006; Filizzola et al., 2007);flood risk (Tramutoli et al., 2001a; Lacava et al., 2005, 2006,2009); forest fires (Cuomo et al., 2001; Mazzeo et al., 2007),etc.
RST was applied for the first time to seismically ac-tive areas monitoring, in the case of the disastrous 1980Irpinia-Basilicata earthquake (Di Bello et al., 2004; Tramu-toli et al., 2001b), then it was successfully tested in severalcases: Athens, 7 September 1999 (Filizzola et al., 2004);Izmit, 17 August 1999 (Tramutoli et al., 2005); Gujarat,26 January 2001 (Genzano et al., 2007), Boumerdes/Thenia,
21 May 2003 (Aliano et al., 2007); Hector Mine, 16 October1999 (Aliano et al., 2008a), Umbria-Marche, October 1997(Aliano et al., 2008b), Mestia Tianeti (Georgia), 23 Octo-ber 1992 (Genzano et al., 2009), and various low magnitudeevents occurred in Greece and Turkey, May and June 1995–1996 (Corrado et al., 2005).
The RST approach has been always implemented by us-ing a validation/confutation approach, in order to verify thepresence/absence of anomalous space-time TIR transientsin the presence/absence of significant seismic events. TheRST technique is based on a preliminary multi-temporalanalysis on several years (at least five, better more) of ho-mogeneous historical data-set of satellite TIR records, whichis devoted to characterize the TIR signal (in terms of its ex-pected value and variation range) for each pixel of the satel-lite image to be processed. On this basis, anomalous TIR pat-terns are identified by using a specific index, RETIRA (Ro-bust Estimator of TIR Anomalies, Filizzola et al., 2004; Tra-mutoli, 2005), to be computed on the image at hand as:
⊗1T (r,t) =1T (r,t)−µ1T (r)
σ1T (r)(1)
where:r≡(x,y) represents location coordinates of the pixel cen-
tre on a satellite image;t is the time of image acquisitionwith t∈τ , whereτ defines the homogeneous domain of satel-lite imagery collected in the same time-slot of the day andperiod (month) of the year;
1T (r,t) = T (r,t)−T (t) is the value of the difference be-tween the punctual value of brightness temperatureT (r,t) atthe locationr≡(x,y) and acquisition timet , and its spatialaverageT (t) computed on the investigated area consideringonly cloud-free locations, all belonging to the same, land orsea, class (i.e. considering only sea pixels ifr is located onthe sea and only land pixels if it is located on the land). Notethat the choice of such a differential variable1T (r,t) in-stead ofT (r,t) is expected to reduce possible contributions(e.g. occasional warming) due to day-to-day and/or year-to-year climatological changes and/or season time-drifts;
µ1T (r) time average value of1T (r,t) at the locationr≡(x,y) computed on cloud free records belonging to theselected data set (t∈τ );
σ1T (r) standard deviation of1T (r,t) at the locationr≡(x,y) computed on cloud free records belonging to theselected data set (t∈τ ).In this way⊗1T (r,t) gives the local excess of the current1T (r,t) signal compared with its historical mean value andweighted by its historical variability at the considered loca-tion. Both,µ1T (r) andσ1T (r), are computed, once and forall, for each locationr, processing several years of histori-cal satellite records acquired in similar observational condi-tions. They are two reference images describing the normalbehaviour of the signal and of its variability at each loca-tion r in observational conditions as similar as possible tothe ones of the image at hand. Excess1T (r,t)−µ1T (r)
Nat. Hazards Earth Syst. Sci., 9, 2073–2084, 2009 www.nat-hazards-earth-syst-sci.net/9/2073/2009/
N. Genzano et al.: RST analysis of MSG-SEVIRI TIR radiances of the Abruzzo earthquake 2075
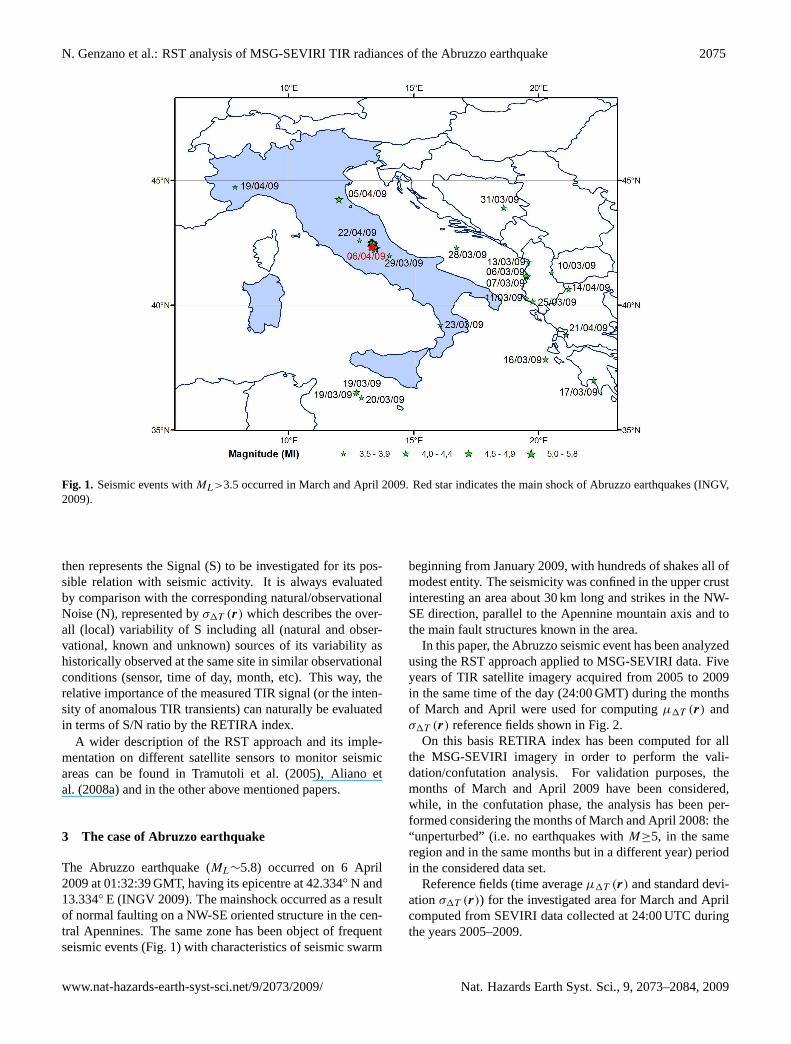
Fig. 1. Seismic events withML>3.5 occurred in March and April 2009. Red star indicates the main shock of Abruzzo earthquakes (INGV,2009).
then represents the Signal (S) to be investigated for its pos-sible relation with seismic activity. It is always evaluatedby comparison with the corresponding natural/observationalNoise (N), represented byσ1T (r) which describes the over-all (local) variability of S including all (natural and obser-vational, known and unknown) sources of its variability ashistorically observed at the same site in similar observationalconditions (sensor, time of day, month, etc). This way, therelative importance of the measured TIR signal (or the inten-sity of anomalous TIR transients) can naturally be evaluatedin terms of S/N ratio by the RETIRA index.
A wider description of the RST approach and its imple-mentation on different satellite sensors to monitor seismicareas can be found in Tramutoli et al. (2005), Aliano etal. (2008a) and in the other above mentioned papers.
3 The case of Abruzzo earthquake
The Abruzzo earthquake (ML∼5.8) occurred on 6 April2009 at 01:32:39 GMT, having its epicentre at 42.334◦ N and13.334◦ E (INGV 2009). The mainshock occurred as a resultof normal faulting on a NW-SE oriented structure in the cen-tral Apennines. The same zone has been object of frequentseismic events (Fig. 1) with characteristics of seismic swarm
beginning from January 2009, with hundreds of shakes all ofmodest entity. The seismicity was confined in the upper crustinteresting an area about 30 km long and strikes in the NW-SE direction, parallel to the Apennine mountain axis and tothe main fault structures known in the area.
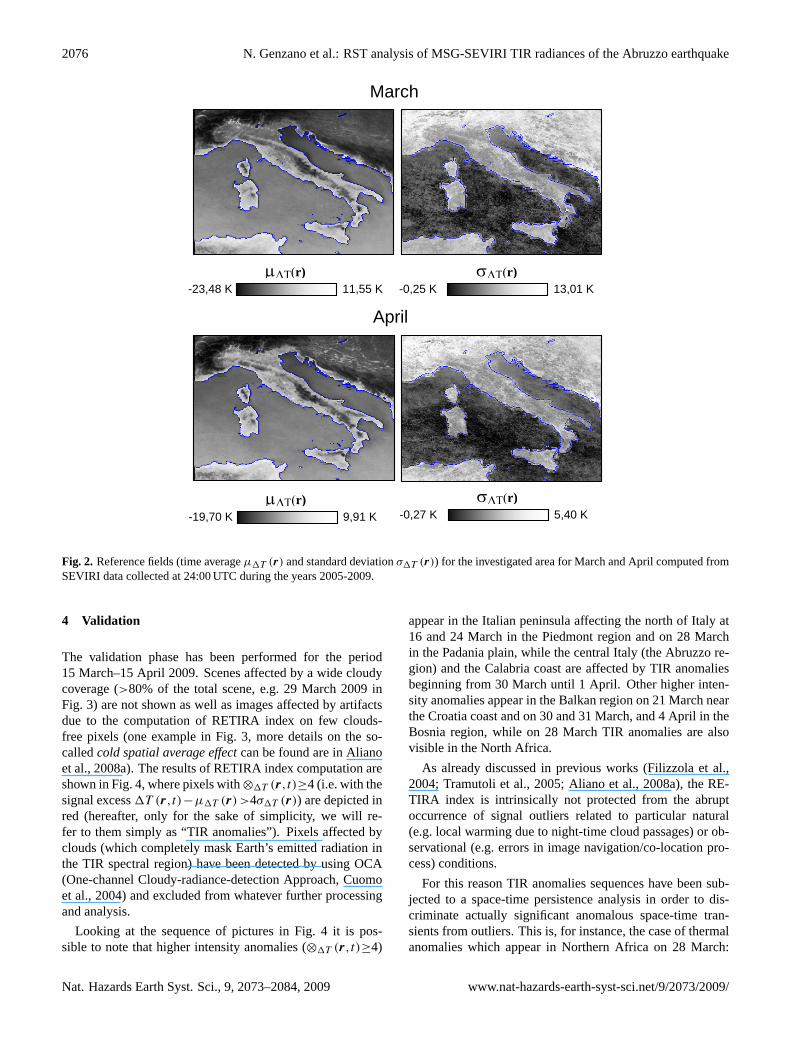
In this paper, the Abruzzo seismic event has been analyzedusing the RST approach applied to MSG-SEVIRI data. Fiveyears of TIR satellite imagery acquired from 2005 to 2009in the same time of the day (24:00 GMT) during the monthsof March and April were used for computingµ1T (r) andσ1T (r) reference fields shown in Fig. 2.
On this basis RETIRA index has been computed for allthe MSG-SEVIRI imagery in order to perform the vali-dation/confutation analysis. For validation purposes, themonths of March and April 2009 have been considered,while, in the confutation phase, the analysis has been per-formed considering the months of March and April 2008: the“unperturbed” (i.e. no earthquakes withM≥5, in the sameregion and in the same months but in a different year) periodin the considered data set.
Reference fields (time averageµ1T (r) and standard devi-ationσ1T (r)) for the investigated area for March and Aprilcomputed from SEVIRI data collected at 24:00 UTC duringthe years 2005–2009.
www.nat-hazards-earth-syst-sci.net/9/2073/2009/ Nat. Hazards Earth Syst. Sci., 9, 2073–2084, 2009
2076 N. Genzano et al.: RST analysis of MSG-SEVIRI TIR radiances of the Abruzzo earthquake
considering the months of March and April 2008: the “unperturbed” (i.e. no earthquakes with M≥5,
in the same region and in the same months but in a different year) period in the considered data set.
March
μ σr) r)
Figure 2. Reference fields (time average ( )rTΔμ and standard deviation ( )rTΔσ ) for the investigated area for March and April computed from SEVIRI data collected at 24:00 UTC during the years 2005–2009.
4 Validation
The validation phase has been performed for the period 15 March-15 April 2009. Scenes
affected by a wide cloudy coverage (> 80% of the total scene, e.g. 29 March 2009 in Fig.3) are not
shown as well as images affected by artifacts due to the computation of RETIRA index on few
clouds-free pixels (one example in Fig. 3, more details on the so-called cold spatial average effect
can be found are in Aliano et al., 2008a). The results of RETIRA index computation are shown in
Fig. 4, where pixels with ( ) 4, ≥⊗Δ tT r (i.e. with the signal excess ( ) (rr TtT Δ− )Δ μ, > 4 ( )rTΔσ ) are
depicted in red (hereafter, only for the sake of simplicity, we will refer to them simply as “TIR
anomalies”). Pixels affected by clouds (which completely mask Earth’s emitted radiation in the TIR
spectral region) have been detected by using OCA (One-channel Cloudy-radiance-detection
Approach, Cuomo et al., 2004) and excluded from whatever further processing and analysis.
April
-23,48 K 11,55 K ΔT(
-0,25 K 13,01 K ΔT(
-19,70 K 9,91 K μΔT(r)
-0,27 K 5,40 K σΔT(r)
6
Fig. 2. Reference fields (time averageµ1T (r) and standard deviationσ1T (r)) for the investigated area for March and April computed fromSEVIRI data collected at 24:00 UTC during the years 2005-2009.
4 Validation
The validation phase has been performed for the period15 March–15 April 2009. Scenes affected by a wide cloudycoverage (>80% of the total scene, e.g. 29 March 2009 inFig. 3) are not shown as well as images affected by artifactsdue to the computation of RETIRA index on few clouds-free pixels (one example in Fig. 3, more details on the so-calledcold spatial average effectcan be found are in Alianoet al., 2008a). The results of RETIRA index computation areshown in Fig. 4, where pixels with⊗1T (r,t)≥4 (i.e. with thesignal excess1T (r,t)−µ1T (r) >4σ1T (r)) are depicted inred (hereafter, only for the sake of simplicity, we will re-fer to them simply as “TIR anomalies”). Pixels affected byclouds (which completely mask Earth’s emitted radiation inthe TIR spectral region) have been detected by using OCA(One-channel Cloudy-radiance-detection Approach, Cuomoet al., 2004) and excluded from whatever further processingand analysis.
Looking at the sequence of pictures in Fig. 4 it is pos-sible to note that higher intensity anomalies (⊗1T (r,t)≥4)
appear in the Italian peninsula affecting the north of Italy at16 and 24 March in the Piedmont region and on 28 Marchin the Padania plain, while the central Italy (the Abruzzo re-gion) and the Calabria coast are affected by TIR anomaliesbeginning from 30 March until 1 April. Other higher inten-sity anomalies appear in the Balkan region on 21 March nearthe Croatia coast and on 30 and 31 March, and 4 April in theBosnia region, while on 28 March TIR anomalies are alsovisible in the North Africa.
As already discussed in previous works (Filizzola et al.,2004; Tramutoli et al., 2005; Aliano et al., 2008a), the RE-TIRA index is intrinsically not protected from the abruptoccurrence of signal outliers related to particular natural(e.g. local warming due to night-time cloud passages) or ob-servational (e.g. errors in image navigation/co-location pro-cess) conditions.
For this reason TIR anomalies sequences have been sub-jected to a space-time persistence analysis in order to dis-criminate actually significant anomalous space-time tran-sients from outliers. This is, for instance, the case of thermalanomalies which appear in Northern Africa on 28 March:
Nat. Hazards Earth Syst. Sci., 9, 2073–2084, 2009 www.nat-hazards-earth-syst-sci.net/9/2073/2009/

N. Genzano et al.: RST analysis of MSG-SEVIRI TIR radiances of the Abruzzo earthquake 2077
0%
10%
20%
30%
40%
50%
60%
70%
80%
90%
100%15
/03/20
09
16/03/20
09
17/03/20
09
18/03/20
09
19/03/20
09
20/03/20
09
21/03/20
09
22/03/20
09
23/03/20
09
24/03/20
09
25/03/20
09
26/03/20
09
27/03/20
09
28/03/20
09
29/03/20
09
30/03/20
09
31/03/20
09
01/04/20
09
02/04/20
09
03/04/20
09
04/04/20
09
05/04/20
09
06/04/20
09
07/04/20
09
08/04/20
09
09/04/20
09
10/04/20
09
11/04/20
09
12/04/20
09
13/04/20
09
14/04/20
09
15/04/20
09
cloudy coverage on the total scene pixels anomalous normalized
29 March 2009
( ) 4, ≥⊗Δ tT r clouds no data
29 March 2009
( ) 4, ≥⊗Δ tT r clouds no data( ) 4, ≥⊗Δ tT r clouds no data
Figure 3. Left side: calculation of cloudy coverage over all the SEVIRI scenes processed for the 2009: grey bars represent the percentage of cloudy pixels over the total number of pixels in the image; red bars represent the percentage of TIR anomalies (RETIRA≥4) over the remaining cloud free pixels in the image. Right side: example, on March 29th 2009 scene, of artefacts (spurious TIR anomalies) due to the poorness of cloud-free pixels where RETIRA index can be computed and to the clouds masking quite all the warmest part of the scene (cold spatial average effect, see text). Looking at the sequence of pictures in Fig. 4 it is possible to note that higher intensity anomalies
( ) appear in the Italian peninsula affecting the north of Italy at March 16th and 24th in
the Piedmont region and at March 28th in the Padania plain, while the central Italy (the Abruzzo
region) and the Calabria coast are affected by TIR anomalies beginning from March 30th until April
1st. Other higher intensity anomalies appear in the Balkan region at March 21st near the Croatia
coast and at March 30th, 31st and April 4th in the Bosnia region, while at March 28th TIR anomalies
are also visible in the North Africa.
( ) 4, ≥⊗Δ tT r
As already discussed in previous works (Filizzola et al., 2004; Tramutoli et al., 2005, Aliano
et al., 2008a), the RETIRA index is intrinsically not protected from the abrupt occurrence of signal
outliers related to particular natural (e.g. local warming due to night-time cloud passages) or
observational (e.g. errors in image navigation/co-location process) conditions.
For this reason TIR anomalies sequences have been subjected to a space–time persistence
analysis in order to discriminate actually significant anomalous space–time transients from outliers.
This is, for instance, the case of thermal anomalies which appear in Northern Africa on
March 28th: a local warming effect due to the night time passage of a cloudy system has been
identified as the probable responsible for this spatially extended but not time persistent anomaly.
Spatial extension and persistence in time are in fact the further requirements to be satisfied (together
with relative intensity) in order to preliminarily identify significant TIR anomalies.
7
Fig. 3. Left side: calculation of cloudy coverage over all the SEVIRI scenes processed for the 2009: grey bars represent the percentageof cloudy pixels over the total number of pixels in the image; red bars represent the percentage of TIR anomalies (RETIRA≥ 4) over theremaining cloud free pixels in the image. Right side: example, on the 29 March 2009 scene, of artefacts (spurious TIR anomalies) due to thepoorness of cloud-free pixels where RETIRA index can be computed and to the clouds masking quite all the warmest part of the scene (coldspatial average effect, see text).
a local warming effect due to the night time passage of acloudy system has been identified as the probable responsiblefor this spatially extended but not time persistent anomaly.Spatial extension and persistence in time are in fact the fur-ther requirements to be satisfied (together with relative inten-sity) in order to preliminarily identify significant TIR anoma-lies.
If we consider lower intensity TIR anomalies (pixels with⊗1T (r,t)≥3) it is possible to better appreciate the time evo-lution of the TIR anomalies before observed. Generally, lowintensity anomalies follow the ones of higher intensity no-ticeably enlarging the anomaly area and filling gaps both inthe space (among isolated anomalous pixels) and time do-mains.
On the basis of these considerations and looking at Fig. 1where seismic events withML>3.5 occurred in the periodMarch–April 2009 are shown, it is possible to distinguishbetween pre- and post-seismic thermal anomalies. Amongthe TIR pre-seismic anomalies it is possible to discern 3 mainsequences:
– TIR anomalies are visible in the central area of Italyfrom 30 March to 1 April (5 days before the main-shock of Abruzzo earthquake) located near the main tec-tonic lineaments and the seismic epicentres of the earth-quakes occurred in the Abruzzo area (Fig. 5a);
– TIR anomalies at different levels of intensity are presentin the north of Italy (Piedmont region) beginning from16 March until 28 March. They affect this area in cor-
respondence with a tectonic lineament showing a vari-able persistence in the space and time domain (Fig. 5b).A seismic event (Bra earthquakes) with magnitudeML∼3.9 occurred in this area on 19 April 2009;
– also in the Padana plain since 31 March until 3 Aprillower intensity TIR anomalies are present with a vari-able spatial distribution near the tectonic lineament(Fig. 5c). The regions has been affected by an earth-quake (Forli earthquakes) on 5 April 2009 (ML∼4.6).
On the Balkan area it is possible to appreciate pre- and post-seismic anomalies (Fig. 6). TIR anomalies occurred in thisarea, with a variable spatial distribution and different levelsof intensity, from 30 March (1 day before an earthquake withmagnitudeML=4.2 occurred in the same area) until 4 April.
5 Confutation
The confutation step has been performed by considering thesame period (15 March–15 April) but in a different year(2008), in order to verify the absence of TIR anomalies ina relatively seismically unperturbed period. The selection of2008 for confutation purposes has been done consulting theINGV (2009) seismic catalogue within the range 2005–2009(years for which MSG-SEVIRI data were available): no seis-mic events with magnitude greater than (or equal to) 5 are re-ported over the investigated area during the months of Marchand April 2008 (Fig. 7a).
www.nat-hazards-earth-syst-sci.net/9/2073/2009/ Nat. Hazards Earth Syst. Sci., 9, 2073–2084, 2009

2078 N. Genzano et al.: RST analysis of MSG-SEVIRI TIR radiances of the Abruzzo earthquake
15 March 2009 16 March 2009 17 March 2009 18 March 2009 19 March 2009
20 March 2009 21 March 2009 22 March 2009 23 March 2009 24 March 2009
31 March 2009 1 April 2009 2 April 2009 3 April 2009 4 April 2009
5 April 2009 6 April 2009 8 April 20097 April 2009 9 April 2009
15 April 2009
10 April 2009 11 April 2009 12 April 2009 13 April 2009 14 April 2009
30 March 200926 March 2009 27 March 2009 28 March 200925 March 2009
( ) 4, ≥⊗Δ tT rcloudsno data
Fig. 4. Validation: results of the RETIRA index computation on the investigated area before and after the Abruzzo earthquake (6 April2009,ML∼5.8). All scene from 15 March and 15 April are shown with the exclusion of those scenes (in this case only the one acquired on29 March) affected by clouds covering more than 80% of the whole scene. Thermal anomalies (i.e. pixels with⊗1T (r,t)≥4) are depictedin red. Cloudy locations are depicted in gray. Red boxes contour images containing TIR anomalies. Green dashed circle indicate the areasof occurrence of TIR anomalies (see test).
Nat. Hazards Earth Syst. Sci., 9, 2073–2084, 2009 www.nat-hazards-earth-syst-sci.net/9/2073/2009/

N. Genzano et al.: RST analysis of MSG-SEVIRI TIR radiances of the Abruzzo earthquake 2079
(a)
If we consider lower intensity TIR anomalies (pixels with ( ) 3, ≥⊗Δ tT r ) it is possible to better
appreciate the time evolution of the TIR anomalies before observed. Generally, low intensity
anomalies follow the ones of higher intensity noticeably enlarging the anomaly area and filling gaps
both in the space (among isolated anomalous pixels) and time domains.
On the basis of these considerations and looking at Fig.1 where seismic events with ML>3,5
occurred in the period March-April 2009 are shown, it is possible to distinguish between pre- and
post-seismic thermal anomalies. Among the TIR pre-seismic anomalies it is possible to discern 3
main sequences:
⎯ TIR anomalies are visible in the central area of Italy from 30 March to 1 April (5 days
before the mainshock of Abruzzo earthquake) located near the main tectonic lineaments and
the seismic epicentres of the earthquakes occurred in the Abruzzo area (Fig. 5A);
⎯ TIR anomalies at different levels of intensity are present in the north of Italy (Piedmont
region) beginning from March 16th until March 28th. They affect this area in correspondence
with a tectonic lineament showing a variable persistence in the space and time domain (Fig.
5B). A seismic event (Bra earthquakes) with magnitude ML∼3,9 occurred in this area on
April 19th 2009;
⎯ also in the Padana plain since March 21st until April 3rd lower intensity TIR anomalies are
present with a variable spatial distribution near the tectonic lineament (Fig. 5C). The regions
has been affected by an earthquake (Forli earthquakes) on April 5th 2009 (ML∼4,6).
On the Balkan area it is possible to appreciate pre- and post-seismic anomalies (Fig. 6). TIR
anomalies occurred in this area, with a variable spatial distribution and different levels of intensity,
from March 30th (1 day before an earthquake with magnitude ML=4,2 occurred in the same area)
until April 4th.
30 March 2009 31 March 2009 1 April 2009 Abruzzo seismic events30 March 2009 31 March 2009 1 April 2009 Abruzzo seismic events
Figure 5. Validation: pre-seismic anomalies, a close view in different region: A) Abruzzo region B) Piedmont region C) Padana plain. Seismic events information come from INGV (2009).
9
(b)
16 March 2009 19 March 2009 20 March 2009 24 March 2009
27 March 200926 March 2009 28 March 2009 Bra earthquakes epicenter19th April 2009 (Ml∼3,9)
16 March 2009 19 March 2009 20 March 2009 24 March 200916 March 2009 19 March 2009 20 March 2009 24 March 2009
27 March 200926 March 2009 28 March 2009 Bra earthquakes epicenter19th April 2009 (Ml∼3,9)
27 March 200926 March 2009 28 March 2009 Bra earthquakes epicenter19th April 2009 (Ml∼3,9)
21 March 2009 22 March 2009 28 March 2009 3 April 200921 March 2009 22 March 2009 28 March 2009 3 April 2009
Forlì earthquakes epicenter5th April 2009 (Ml∼4,6)
Forlì earthquakes epicenter5th April 2009 (Ml∼4,6)
( ) 4, ≥⊗Δ tT r
( ) 3, ≥⊗Δ tT r
( ) 5,3, ≥⊗Δ tT r
cloudsno datatectonics lineament
earthquakes epicenter( ) 4, ≥⊗Δ tT r
( ) 3, ≥⊗Δ tT r
( ) 5,3, ≥⊗Δ tT r
cloudsno datatectonics lineament
earthquakes epicenter
C Figure 5. (continued).
3 April 2009 4 April 2009 Bosnia earthquakes epicenter31st March 2009 (Ml∼4,2)
( ) 4, ≥⊗Δ tT r
( ) 3, ≥⊗Δ tT r( ) 5,3, ≥⊗Δ tT r
cloudsno data
earthquakes epicenter3 April 2009 4 April 2009 Bosnia earthquakes epicenter31st March 2009 (Ml∼4,2)
( ) 4, ≥⊗Δ tT r
( ) 3, ≥⊗Δ tT r( ) 5,3, ≥⊗Δ tT r
cloudsno data
earthquakes epicenter
( ) 4, ≥⊗Δ tT r
( ) 3, ≥⊗Δ tT r( ) 5,3, ≥⊗Δ tT r
cloudsno data
earthquakes epicenter
1 April 2009 2 April 200930 March 2009 31 March 2009 1 April 2009 2 April 200930 March 2009 31 March 2009
Figure 6. Validation: pre- and post-seismic anomalies; a close view in the Balkan region.
10
(c)
3 April 2009 4 April 2009 Bosnia earthquakes epicenter31st March 2009 (Ml∼4,2)
1 April 2009 2 April 200930 March 2009 31 March 2009
( ) 4, ≥⊗Δ tT r
( ) 3, ≥⊗Δ tT r( ) 5,3, ≥⊗Δ tT r
clouds
no data
earthquakes epicenter
21 March 2009 22 March 2009 28 March 2009 3 April 2009
Forlì earthquakes epicenter5th April 2009 (Ml∼4,6)
( ) 4, ≥⊗Δ tT r
( ) 3, ≥⊗Δ tT r
( ) 5,3, ≥⊗Δ tT r
cloudsno datatectonic lineaments
earthquakes epicenter
Fig. 5. Validation: pre-seismic anomalies, a close view in different region:(a) Abruzzo region,(b) Piedmont region, and(c) Padana plain.Seismic events information come from INGV (2009).
www.nat-hazards-earth-syst-sci.net/9/2073/2009/ Nat. Hazards Earth Syst. Sci., 9, 2073–2084, 2009

2080 N. Genzano et al.: RST analysis of MSG-SEVIRI TIR radiances of the Abruzzo earthquake
3 April 2009 4 April 2009 Bosnia earthquakes epicenter31st March 2009 (Ml∼4,2)
1 April 2009 2 April 200930 March 2009 31 March 2009
( ) 4, ≥⊗Δ tT r
( ) 3, ≥⊗Δ tT r( ) 5,3, ≥⊗Δ tT r
clouds
no data
earthquakes epicenter
21 March 2009 22 March 2009 28 March 2009 3 April 2009
Forlì earthquakes epicenter5th April 2009 (Ml∼4,6)
( ) 4, ≥⊗Δ tT r
( ) 3, ≥⊗Δ tT r
( ) 5,3, ≥⊗Δ tT r
cloudsno datatectonic lineaments
earthquakes epicenter
Fig. 6. Validation: pre- and post-seismic anomalies; a close view in the Balkan region.
Fig. 7a. Seismic events (ML≥4) occurred during March–April 2008 (INGV, 2009).
As for the validation step, the same cut at 4σ
(i.e. ⊗1T (r,t)≥4) has been used in order to identify im-ages containing TIR anomalies. Scenes (8, 10, and 11 April)affected by a wide (>80%) cloudy coverage have been ex-cluded from the analysis (Fig. 7b).
Figure 8 shows the result of the RST analysis for the2008. It is possible to note that only from 16 March until20 March space-time persistent TIR anomalies appear which
affect Southern Italy (Calabria region) reaching their maxi-mum extension on 19 March. A seismic event with magni-tudeML∼4.0 occurred in the same area on 8 April 2008. Inthe following days only spatially isolated and/or not time per-sistent TIR anomalies appears (disappearing just in one day)probably related to night-time cloud passages (e.g. 24 March2008).
Nat. Hazards Earth Syst. Sci., 9, 2073–2084, 2009 www.nat-hazards-earth-syst-sci.net/9/2073/2009/

N. Genzano et al.: RST analysis of MSG-SEVIRI TIR radiances of the Abruzzo earthquake 2081
5 Confutation
The confutation step has been performed by considering the same period (March 15th –April
15th ) but in a different year (2008), in order to verify the absence of TIR anomalies in a relatively
seismically unperturbed period. The selection of 2008 for confutation purposes has been done
consulting the INGV (2009) seismic catalogue within the range 2005-2009 (years for which MSG-
SEVIRI data were available): no seismic events with magnitude greater than (or equal to) 5 are
reported over the investigated area during the months of March and April 2008 (Fig. 7A).
As for the validation step, the same cut at 4σ (i.e. ( ) 4, ≥⊗Δ tT r ) has been used in order to
identify images containing TIR anomalies. Scenes (April 8th, 10th and 11th ) affected by a wide (>
80%) cloudy coverage have been excluded from the analysis (Fig. 7B).
A
0%
10%
20%
30%
40%
50%
60%
70%
80%
90%
100%15
/03/20
08
16/03/20
08
17/03/20
08
18/03/20
08
19/03/20
08
20/03/20
08
21/03/20
08
22/03/20
08
23/03/20
08
24/03/20
08
25/03/20
08
26/03/20
08
27/03/20
08
28/03/20
08
29/03/20
08
30/03/20
08
31/03/20
08
01/04/20
08
02/04/20
08
03/04/20
08
04/04/20
08
05/04/20
08
06/04/20
08
07/04/20
08
08/04/20
08
09/04/20
08
10/04/20
08
11/04/20
08
12/04/20
08
13/04/20
08
14/04/20
08
15/04/20
08
cloudy coverage on the total scene pixels anomalous normalized
11 April 2008
( ) 4, ≥⊗Δ tT r clouds no data
11 April 2008
( ) 4, ≥⊗Δ tT r clouds no data( ) 4, ≥⊗Δ tT r clouds no data
(b) Figure 7. A) Seismic events (ML≥4) occurred during March-April 2008 (INGV, 2009). B) Left: Calculation of cloudy coverage on all the scenes processed for 2008: grey bars represent the percentage of cloudy pixels over image; red bars represent the percentage of anomalous pixels over the remaining cloud free pixels in the image; Right: example on April 11th 2008 scene of artefacts (spurious TIR anomalies) due to the poorness of cloud-free pixels where RETIRA index can be computed and to the cloud masking all the warmest part of the scene (cold spatial average effect, see text).
11
Fig. 7b. Left: calculation of cloudy coverage on all the scenes processed for 2008: grey bars represent the percentage of cloudy pixelsover image; red bars represent the percentage of anomalous pixels over the remaining cloud free pixels in the image; Right: example on the11 April 2008 scene of artefacts (spurious TIR anomalies) due to the poorness of cloud-free pixels where RETIRA index can be computedand to the cloud masking all the warmest part of the scene (cold spatial average effect, see text).
Fig. 8 shows the result of the RST analysis for the 2008. It is possible to note that only from
March 16th until March 20th space-time persistent TIR anomalies appear which affect Southern Italy
(Calabria region) reaching their maximum extension on March 19th. A seismic event with
magnitude ML∼4,0 occurred in the same area on April 8th 2008. In the following days only spatially
isolated and/or not time persistent TIR anomalies appears (disappearing just in one day) probably
related to night-time cloud passages (e.g. 24 March 2008).
15 March 2008 16 March 2008 17 March 2008 19 March 200818 March 2008
20 March 2008 21 March 2008 22 March 2008 23 March 2008 24 March 2008
25 March 2008 26 March 2008 27 March 2008 28 March 2008 29 March 2008
30 March 2008 31 March 2008 1 April 2008 3 April 20082 April 2008
4 April 2008 5 April 2008 7 April 20086 April 2008 9 April 2008
12 April 2008 13 April 2008 14 April 2008 15 April 2008
( ) 4, ≥⊗Δ tT rcloudsno data
( ) 4, ≥⊗Δ tT rcloudsno data
Figure 8. Confutation: results of the RETIRA index computation over the investigated area for the relatively unperturbed year 2008. Red boxes contour images having pixels with ( ) 4, ≥⊗Δ tT r . Green circle indicate the (unique) sequence of space-time persistent TIR anomalies over Calabria region.
12
Fig. 8. Confutation: results of the RETIRA index computation over the investigated area for the relatively unperturbed year 2008. Red boxescontour images having pixels with⊗1T (r,t)≥4. Green circle indicate the (unique) sequence of space-time persistent TIR anomalies overCalabria region.
www.nat-hazards-earth-syst-sci.net/9/2073/2009/ Nat. Hazards Earth Syst. Sci., 9, 2073–2084, 2009

2082 N. Genzano et al.: RST analysis of MSG-SEVIRI TIR radiances of the Abruzzo earthquake
Fig. 8 shows the result of the RST analysis for the 2008. It is possible to note that only from
March 16th until March 20th space-time persistent TIR anomalies appear which affect Southern Italy
(Calabria region) reaching their maximum extension on March 19th. A seismic event with
magnitude ML∼4,0 occurred in the same area on April 8th 2008. In the following days only spatially
isolated and/or not time persistent TIR anomalies appears (disappearing just in one day) probably
related to night-time cloud passages (e.g. 24 March 2008).
15 March 2008 16 March 2008 17 March 2008 19 March 200818 March 2008
20 March 2008 21 March 2008 22 March 2008 23 March 2008 24 March 2008
25 March 2008 26 March 2008 27 March 2008 28 March 2008 29 March 2008
30 March 2008 31 March 2008 1 April 2008 3 April 20082 April 2008
4 April 2008 5 April 2008 7 April 20086 April 2008 9 April 2008
12 April 2008 13 April 2008 14 April 2008 15 April 2008
( ) 4, ≥⊗Δ tT rcloudsno data
15 March 2008 16 March 2008 17 March 2008 19 March 200818 March 2008
20 March 2008 21 March 2008 22 March 2008 23 March 2008 24 March 2008
25 March 2008 26 March 2008 27 March 2008 28 March 2008 29 March 2008
30 March 2008 31 March 2008 1 April 2008 3 April 20082 April 2008
4 April 2008 5 April 2008 7 April 20086 April 2008 9 April 2008
12 April 2008 13 April 2008 14 April 2008 15 April 2008
( ) 4, ≥⊗Δ tT rcloudsno data
( ) 4, ≥⊗Δ tT rcloudsno data
Figure 8. Confutation: results of the RETIRA index computation over the investigated area for the relatively unperturbed year 2008. Red boxes contour images having pixels with ( ) 4, ≥⊗Δ tT r . Green circle indicate the (unique) sequence of space-time persistent TIR anomalies over Calabria region.
12
Fig. 8. Continued.
6 Conclusions
In this paper, the RST analysis has been applied for the firsttime to thermal image acquired by SEVIRI sensor on boardMSG satellites, in order to verify the possible space-timerelationships among TIR anomalies appearance and seismicevents occurrence. The Abruzzo earthquake (6 April 2009,ML∼5.8) has been considered as a test case for validation,while a relatively unperturbed period (no earthquakes withM≥5) was taken for confutation in the same months (March–April) of a different year (2008).
The validation/confutation approach puts in relief thatthermal anomalies with RETIRA>4 (the highest relative in-tensity and S/N observed until now) appear in the central partof Italy five days before the main shock of Abruzzo earth-quake (6 April 2009,ML∼5.8). No similar anomalies havebeen observed in the absence of earthquakes in similar ob-servation conditions in the period (March–April 2008) con-sidered for confutation.
The possible relation between TIR anomalies appearanceand medium-low magnitude earthquake, already documentedby previous work (e.g. Corrado et al., 2005) is confirmed, infact TIR anomalies persistent in the space-time domain havebeen observed in Italy from few days to few weeks beforeseismic events of medium-low magnitude (Calabria, 8 April2008,ML∼4.0; Forlı, 5 April 2009,ML∼4.6; Bra, 19 April2009,ML∼3.9;) and in the Balkan region both before andafter an earthquake ofML=4.2 here occurred on 31 March2009.
An original approach to identify and exclude TIR anoma-lies purely due to the effect (already described in Aliano etal., 2008a) of cloud cover and spatial distribution was pro-posed. Nevertheless the presence of clouds continue to limitthe possibility to well investigate space-time persistence ofTIR anomalies.
The use of passive MicroWave (MW) sensors could helpto overcome such limitations. In fact, this kind of electro-magnetic radiation, by penetrating (not raining) clouds, al-lows us to observe Earth’s surface in any weather conditions.Even if passive MW sensors operate with a spatial resolution(10–50 km nadir view), which is much lower than the one(1–5 km) achievable by TIR sensors, such spatial resolutionremains largely sufficient to monitor thermal anomalies weobserved always at a wider scale around the epicentre zone.
Acknowledgements.The authors wish to thank the AeronauticaMilitare Italiana for its support to have access to MSG-SEVIRIdata used in this work.
Edited by: P. F. BiagiReviewed by: two anonymous referees
References
Aliano, C., Corrado, R., Filizzola, C., Pergola, N., and Tramu-toli, V.: Robust Satellite Techniques (RST) For SeismicallyActive Areas Monitoring: The Case Of 21st May, 2003Boumerdes/Thenia (Algeria) Earthquake, in: Proceedings of
Nat. Hazards Earth Syst. Sci., 9, 2073–2084, 2009 www.nat-hazards-earth-syst-sci.net/9/2073/2009/

N. Genzano et al.: RST analysis of MSG-SEVIRI TIR radiances of the Abruzzo earthquake 2083
Multitemp 2007, 1–6,doi:10.1109/MULTITEMP.2007.4293042, available at:http://ieeexplore.ieee.org/xpl/tocresult.jsp?isnumber=4293029&isYear=2007, 2007.
Aliano, C., Corrado, R., Filizzola, C., Genzano, N., Pergola, N.,and Tramutoli V.: TIR Satellite Techniques for monitoring Earth-quake active regions: limits, main achievements and perspec-tives, Ann. Geofis., 51(1), 303–317, 2008a.
Aliano, C., Corrado, R., Filizzola, C., Pergola, N., and Tramutoli,V.: Robust satellite techniques (RST) for the thermal monitoringof earthquake prone areas: the case of Umbria-Marche October,1997 seismic events, Ann. Geofis., 51(2/3), 451–459, 2008b.
Aliano, C., Corrado, R., Filizzola, C., Genzano, N., Lanorte, V.,Lisi, M., Martinelli, G., Pergola, N., and Tramutoli, V.: RobustSatellite Techniques for monitoring TIR anomalies in seismo-genic areas, in: Proceedings of the Second Workshop on theUse of Remote Sensing Techniques for Monitoring Volcanoesand Seismogenic Areas, doi:10.1109/USEREST.2008.4740365,2008c.
Bonfiglio, A., Macchiato, M., Pergola., N., Pietrapertosa, C., andTramutoli, V.: AVHRR automated detection of volcanic clouds,Int. J. Remote Sens., 26(1), 9–27, 2005.
Corrado, R., Caputo, R., Filizzola, C., Pergola, N., Pietrapertosa,C., and Tramutoli, V.: Seismically active area monitoring by ro-bust TIR satellite techniques: a sensitivity analysis on low mag-nitude earthquakes in Greece and Turkey, Nat. Hazards EarthSyst. Sci., 5, 101–108, 2005,http://www.nat-hazards-earth-syst-sci.net/5/101/2005/.
Cuomo, V., Lasaponara, R., and Tramutoli, V.: Evaluation of a newsatellite-based method for forest fire detection, Int. J. RemoteSens., 22(9), 1799–1826, 2001.
Cuomo, V., Filizzola, C., Pergola, N., Pietrapertosa, C., and Tra-mutoli, V.: A self-sufficient approach for GERB cloudy radiancedetection, Atmos. Res., 72(1–4), 39–56, 2004.
Di Bello, G., Filizzola, C., Lacava, T., Marchese, F., Pergola, N.,Pietrapertosa, C., Piscitelli, S., Scaffidi, I., and Tramutoli, V.:Robust Satellite Techniques for Volcanic and Seismic HazardsMonitoring, Ann. Geophys-Italy, 47(1), 49–64, 2004.
Filizzola, C., Pergola, N., Pietrapertosa, C., and Tramutoli, V.: Ro-bust satellite techniques for seismically active areas monitoring:a sensitivity analysis on September 7, 1999 Athens’s earthquake,Phys. Chem. Earth, 29, 517–527, 2004.
Filizzola, C., Lacava, T., Marchese, F., Pergola, N., Scaffidi, I., andTramutoli, V.: Assessing RAT (Robust AVHRR Techniques) per-formances for volcanic ash cloud detection and monitoring innear realtime: The 2002 eruption of Mt. Etna (Italy), RemoteSens. Environ., 107, 440–454, 2007.
Genzano, N., Aliano, C., Filizzola, C., Pergola, N., and Tramutoli,V.: A robust satellite technique for monitoring seismically ac-tive areas: The case of Bhuj-Gujarat earthquake, Tectonophysics,431, 197–210, 2007.
Genzano, N., Aliano, C., Corrado, R., Filizzola, C., Lisi, M., Pa-ciello, R., Pergola, N., Tsamalashvili, T., and Tramutoli, V.: As-sessing of the Robust Satellite Techniques (RST) in areas withmoderate seismicity, in: Multitemp 2009, Fifth InternationalWorkshop on the Analysis of Multitemporal Remote Sensing Im-ages, Mistic, Connecticut, USA, 307–314, 28-30 July 2009.
Gorny, V. I., Salman, A. G., Tronin, A. A., and Shilin, B. B.: TheEarth outgoing IR radiation as an indicator of seismic activity,
in: Proceeding of the Academy of Sciences of the USSR, 301,67–69, 1988.
Hamza, V. M.: Tectonic leakage of fault bounded aquifers subject tonon-isothermal recharge: A mechanism generating thermal pre-cursors to seismic events, Phys. Earth Planet. In., 126, 163–177,2001.
INGV (Istituto Nazionale di Geofisica e Vulcanologia): The Ital-ian seismic bullettin, available at:http://iside.rm.ingv.it/iside/standard/index.jsp, 2009.
Lacava, T., Cuomo, V., Di Leo, E. V., Pergola, N., Romano, F.,and Tramutoli, V.: Improving soil wetness variations monitoringfrom passive microwave satellite data: the case of April 2000Hungary flood, Remote Sens. Environ., 96/2, 135–148, 2005.
Lacava, T., Di Leo, E. V., Pergola, N., and Tramutoli, V.: Space-time soil wetness variations monitoring by a multi-temporal mi-crowave satellite records analysis, Phys. Chem. Earth, 31, 1274–1283, 2006.
Lacava, T., Filizzola, C., Pergola, N., Sannazzaro, F., and Tramu-toli, V.: Improving flood monitoring by RAT (Robust AVHRRTechnique) approach: the case of April 2000 Hungary flood, Int.J. Remote Sens., in press, 2009.
Mareev, E. A., Iudin, D. I., and Molchanov, O. A.: Mosaic sourceof internal gravity waves associated with seismic activity, in:Seismo-Electromagnetics (Lithosphere-Atmosphere-IonosphereCoupling), edited by: Hayakawa, M. and Molchanov, O., TER-RUPUB, 335–342, 2002.
Molchanov, O. A.: On the origin of low- and middle-latitude iono-spheric turbulence, Phys. Chem. Earth, 29, 559–567, 2004.
Molchanov, O. and Hayakawa, M.: Seismo-electromagnetics andrelated phenomena: History and latest results, TERRAPUB,Tokyo, 190 pp., 2008.
Molchanov, O., Fedorov, E., Schekotov, A., Gordeev, E., Chebrov,V., Surkov, V., Rozhnoi, A., Andreevsky, S., Iudin, D., Yunga,S., Lutikov, A., Hayakawa, M., and Biagi, P. F.: Lithosphere-atmosphere-ionosphere coupling as governing mechanism forpreseismic short-term events in atmosphere and ionosphere, Nat.Hazards Earth Syst. Sci., 4, 757–767, 2004,http://www.nat-hazards-earth-syst-sci.net/4/757/2004/.
Marchese, F., Pergola, N., and Telesca, L.: Investigating the tempo-ral fluctuations in satellite Advanced very High Resolution Ra-diometer thermal signals measured in the volcanic area of Etna(Italy), Fluct. Noise Lett., 6(3), 305–316, 2006.
Mazzeo, G., Marchese, F., Filizzola, C., Pergola, N., andTramutoli, V.: A Multi-temporal Robust Satellite Technique(RST) for forest fire detection, in: Multitemp 2007, Louven,Belgium, 1–6, doi:10.1109/MULTITEMP.2007.4293060, avail-able at: http://ieeexplore.ieee.org/xpl/tocresult.jsp?isnumber=4293029&isYear=2007, 18–20 July 2007.
Ouzounov, D. and Freund, D.: Mid-infrared emission prior to strongearthquakes analyzed by remote sensing data, Adv. Space Res.,33, 268–273, 2004.
Pergola, N., Pietrapertosa, C., Lacava, T., and Tramutoli, V.: Ro-bust satellite techniques for monitoring volcanic eruptions, Ann.Geofis, 44(2), 167–177, 2001.
Pergola, N., Tramutoli, V., and Marchese, F.: Automated detec-tion of thermal features of active volcanoes by means of infraredAVHRR records, Remote Sens. Environ., 93, 311–327, 2004a.
Pergola, N., Tramutoli, V., Scaffidi, I., Lacava, T., and Marchese,F.: Improving volcanic ash clouds detection by a robust satellite
www.nat-hazards-earth-syst-sci.net/9/2073/2009/ Nat. Hazards Earth Syst. Sci., 9, 2073–2084, 2009

2084 N. Genzano et al.: RST analysis of MSG-SEVIRI TIR radiances of the Abruzzo earthquake
technique, Remote Sens. Environ., 90(1), 1–22, 2004b.Pulinets, S. A., Boyarchuk, K. A., Hegai, V. V., and Karelin, A.
V.: Conception and model of seismo-ionosphere-magnetospherecoupling, in: Seismo-Electromagnetics:Lithosphere-Atmosphere-Ionosphere Coupling, edited by:Hayakawa, M. and Molchanov, O. A., Terra Scientific Publish-ing Co., Tokyo, 353–361, 2002.
Pulinets, S. A., Ouzounov, D., Karelin, A. V., Boyarchuk, K. A., andPokhmelnykh, L. A.: The physical nature of thermal anomaliesobserved before strong earthquakes, Phys. Chem. Earth, 31, 143–153, 2006.
Pulinets, S. A., Biagi, P., Tramutoli, V., Legen’ka, A. D., andDepuev, V. K.: Irpinia earthquake 23 November 1980 – Les-son from Nature revealed by joint data analysis, Ann. Geophys.,50(1), 61–78, 2007.
Qiang, Z. J., Xu, X. D., and Dian, C. G.: Thermal infrared anomalyprecursor of impending earthquakes, Chinese Sci. Bull., 36(4),319–323, 1991.
Qiang, Z. J. and Dian, C. G.: Satellite thermal infrared impendingtemperature increase precursor of Gonghe earthquake of magni-tude 7.0, Qinghai Province, Geoscience, 6(3), 297–300, 1992.
Qiang, Z. J., Xu, X. D., and Dian, C. G.: Thermal infrared anomalyprecursor of impending earthquakes, Pure Appl. Geophys., 149,159–171, 1997.
Surkov, V. V., Pokhotelov, O. A., Parrot, M., and Hayakawa, M.:On the origin of stable IR anomalies detected by satellites aboveseismo-active regions, Phys. Chem. Earth, 31, 164–171, 2006.
Tramutoli, V.:Robust AVHRR techniques (RAT) for environmental monitor-ing: theory and applications, in: Earth surface remote sensing II,SPIE proceedings series, 3496, 101–113, 1998.
Tramutoli, V., Claps, P., Marella, M., Pergola, N., Pietrapertosa,C., and Sileo, C.: Hydrological implications of remotely-sensedthermal inertia, in: Remote Sensing and Hydrology 2000, editedby: Owe, M., Brubaker, K., Ritchie, J., and Rango, A., IAHSPubl., 267, 207–211, 2001a.
Tramutoli, V., Di Bello, G., Pergola, N., and Piscitelli, S.: Robustsatellite techniques for remote sensing of seismically active ar-eas, Ann. Geophys., 44(2), 295–312, 2001b.
Tramutoli, V., Pergola, N., and Pietrapertosa, C.: Training onNOAAAVHRR of robust satellite techniques for next genera-tion of weather satellites: an application to the study of space-time evolution of Pinatubo’s stratospheric volcanic cloud overEurope, in: IRS 2000: Current Problems in Atmospheric Radi-ation, edited by: Smith, W. L. and Timofeyev, Yu. M., DeepakPublishing, Hampton, 36–39, 2001c.
Tramutoli, V., Cuomo, V., Filizzola, C., Pergola, N., and Pietrap-ertosa, C.: Assessing the potential of thermal infrared satellitesurveys for monitoring seismically active areas: The case of Ko-caeli (Yzmit) earthquake, August 17, 1999, Remote Sens. Envi-ron., 96, 409–426, 2005.
Tramutoli, V: Robust Satellite Techniques (RST) for natural andenvironmental hazards monitoring and mitigation: ten years ofsuccessful applications, in: The 9th International Symposiumon Physical Measurements and Signatures in Remote Sensing,Beijing (China), edited by: Liang, S., Liu, J., Li, X., Liu, R.,and Schaepman, M., ISPRS, vol. XXXVI (7/W20), 792–795,ISSN 1682–1750, 2005.
Tramutoli, V.: Robust Satellite Techniques (RST) for Natu-ral and Environmental Hazards Monitoring and Mitigation:Theory and Applications, in: Proceedings of Multitemp2007, 1–6, doi:10.1109/MULTITEMP.2007.4293057, avail-able at: http://ieeexplore.ieee.org/xpl/tocresult.jsp?isnumber=4293029&isYear=2007, 2007.
Tramutoli, V., Aliano, C., Corrado, R., Filizzola, C., Genzano, N.,Lisi, M., Lanorte, V., Tsamalashvili, T., and Pergola, N.: Abruptchange in greenhouse gases emission rate as a possible geneticmodel of TIR anomalies observed from satellite in Earthquakeactive regions, in: Proceedings of 33rd International Symposiumon Remote Sensing of Environment (ISRSE33), Stresa, LagoMaggiore, Italy, 4–8 May 2009.
Tronin, A. A.: Satellite thermal survey – a new tool for the studyof seismoactive regions, Int. J. Remote Sens., 41(8), 1439–1455,1996.
Tronin, A. A.: Thermal IR satellite sensor data application for earth-quake research in China, Int. J. Remote Sens., 21(16), 3169–3177, 2000.
Tronin, A. A., Hayakawa, M., and Molchanov, O. A.: Thermal IRsatellite data application for earthquake research in Japan andChina, J. Geodyn., 33(4–5), 519–534, 2002.
Tronin, A. A., Biagi, P. F., Molchanov, O. A., Khatkevich, Y. M.,and Gordeev, E. I.: Temperature variations related to earthquakesfrom simultaneous observation at the ground stations and bysatellites, Phys. Chem. Earth, 29, 501–506, 2004.
Nat. Hazards Earth Syst. Sci., 9, 2073–2084, 2009 www.nat-hazards-earth-syst-sci.net/9/2073/2009/