Analysing the advantages of high temporal resolution geostationary msg seviri data compared to polar...
9
International Journal of Applied Earth Observation and Geoinformation 13 (2011) 721–729 Contents lists available at ScienceDirect International Journal of Applied Earth Observation and Geoinformation jo u r n al hom epage: www.elsevier.com/locate/jag Analysing the advantages of high temporal resolution geostationary MSG SEVIRI data compared to Polar Operational Environmental Satellite data for land surface monitoring in Africa R. Fensholt a,∗ , A. Anyamba b , S. Huber a , S.R. Proud a , C.J. Tucker b , J. Small b , E. Pak b , M.O. Rasmussen a , I. Sandholt a , C. Shisanya c a University of Copenhagen, Department of Geography and Geology, Øster Voldgade 10, 1350 Copenhagen, Denmark b NASA Goddard Space Flight Center, Biospheric and Hydrological Sciences Laboratory, Greenbelt, MD 20771, USA c Kenyatta University, Department of Geography, Nairobi, Kenya a r t i c l e i n f o Article history: Received 29 July 2010 Accepted 16 May 2011 Keywords: Africa Meteosat Second Generation POES Early warning systems NDVI a b s t r a c t Since 1972, satellite remote sensing of the environment has been dominated by polar-orbiting sen- sors providing useful data for monitoring the earth’s natural resources. However their observation and monitoring capacity are inhibited by daily to monthly looks for any given ground surface which often is obscured by frequent and persistent cloud cover creating large gaps in time series measurements. The launch of the Meteosat Second Generation (MSG) satellite into geostationary orbit has opened new opportunities for land surface monitoring. The Spinning Enhanced Visible and Infrared Imager (SEVIRI) instrument on-board MSG with an imaging capability every 15 min which is substantially greater than any temporal resolution that can be obtained from existing Polar Operational Environmental Satellite (POES) systems currently in use for environmental monitoring. Different areas of the African continent were affected by droughts and floods in 2008 caused by periods of abnormally low and high rainfall, respectively. Based on the effectiveness of monitoring these events from Earth Observation (EO) data the current analyses show that the new generation of geostationary remote sensing data can provide higher temporal resolution cloud-free (<5 days) measurements of the environment as compared to existing POES systems. SEVIRI MSG 5-day continental scale composites will enable rapid assessment of environ- mental conditions and improved early warning of disasters for the African continent such as flooding or droughts. The high temporal resolution geostationary data will complement existing higher spatial reso- lution polar-orbiting satellite data for various dynamic environmental and natural resource applications of terrestrial ecosystems. © 2011 Elsevier B.V. All rights reserved. 1. Introduction The vast majority of land surface remote sensing of vegetation since 1972 has been achieved by polar orbiting satellite sensors (Goward et al., 1985; Tucker et al., 1985). This suite of sensors include the Advanced Very High Resolution Radiometer (AVHRR) (Cracknell, 1996) on National Oceanographic and Atmospheric Administration (NOAA) Polar Operational Environmental Satellite (POES) series, SPOT Vegetation (VGT) (Maisongrande et al., 2004), and more recently, the Moderate Resolution Imaging Spectrora- diometer (MODIS) instruments on NASA’s Terra and Aqua platforms (Salomonson et al., 1992) among others. Medium to coarse resolu- tion sensors such as MODIS, SPOT Vegetation and AVHRR image the entire earth at 1–2 day intervals. The higher resolution sensors, ∗ Corresponding author. Tel.: +45 353 22526. E-mail address: [email protected] (R. Fensholt). such as Landsat can only image the entire world with a patch work of coverage every 16 days. Yet all of these instruments face a chal- lenge of achieving global cloud-free image data due to the frequent presence of clouds. The local overpass times of these sensors often coincide with the periods of maximum cloud built up and cover- age. As a consequence, most single day coverage data are cloud contaminated and cloud-free data can only be achieved using data compositing methods over weeks to months (Holben, 1986). In the tropical cloud prone areas and during the growing (wet) season in most areas of the world a rather long composite period is required to reduce influence from cloud cover (Fensholt et al., 2007). These compositing methods do not only introduce biases in large scale surface measurements because of the tendency towards selection of forward scatter observations (Huete et al., 1992; Cihlar et al., 1994; Fensholt et al., 2010b) but dynamical events such as floods or droughts may not be captured in a timely manner. All these short- comings of POES data limit the ability of near-real-time monitoring for emergency services thereby being unsuccessful in providing 0303-2434/$ – see front matter © 2011 Elsevier B.V. All rights reserved. doi:10.1016/j.jag.2011.05.009
-
Upload
independent -
Category
Documents
-
view
1 -
download
0
Transcript of Analysing the advantages of high temporal resolution geostationary msg seviri data compared to polar...

Journal Identification = JAG Article Identification = 431 Date: July 23, 2011 Time: 10:10 am
Adm
RMa
b
c
a
ARA
KAMPEN
1
s(i(A(ad(tt
0d
International Journal of Applied Earth Observation and Geoinformation 13 (2011) 721–729
Contents lists available at ScienceDirect
International Journal of Applied Earth Observation andGeoinformation
jo u r n al hom epage: www.elsev ier .com/ locate / jag
nalysing the advantages of high temporal resolution geostationary MSG SEVIRIata compared to Polar Operational Environmental Satellite data for land surfaceonitoring in Africa
. Fensholta,∗, A. Anyambab, S. Hubera, S.R. Prouda, C.J. Tuckerb, J. Smallb, E. Pakb,.O. Rasmussena, I. Sandholta, C. Shisanyac
University of Copenhagen, Department of Geography and Geology, Øster Voldgade 10, 1350 Copenhagen, DenmarkNASA Goddard Space Flight Center, Biospheric and Hydrological Sciences Laboratory, Greenbelt, MD 20771, USAKenyatta University, Department of Geography, Nairobi, Kenya
r t i c l e i n f o
rticle history:eceived 29 July 2010ccepted 16 May 2011
eywords:fricaeteosat Second Generation
OESarly warning systemsDVI
a b s t r a c t
Since 1972, satellite remote sensing of the environment has been dominated by polar-orbiting sen-sors providing useful data for monitoring the earth’s natural resources. However their observation andmonitoring capacity are inhibited by daily to monthly looks for any given ground surface which oftenis obscured by frequent and persistent cloud cover creating large gaps in time series measurements.The launch of the Meteosat Second Generation (MSG) satellite into geostationary orbit has opened newopportunities for land surface monitoring. The Spinning Enhanced Visible and Infrared Imager (SEVIRI)instrument on-board MSG with an imaging capability every 15 min which is substantially greater thanany temporal resolution that can be obtained from existing Polar Operational Environmental Satellite(POES) systems currently in use for environmental monitoring. Different areas of the African continentwere affected by droughts and floods in 2008 caused by periods of abnormally low and high rainfall,respectively. Based on the effectiveness of monitoring these events from Earth Observation (EO) data thecurrent analyses show that the new generation of geostationary remote sensing data can provide higher
temporal resolution cloud-free (<5 days) measurements of the environment as compared to existingPOES systems. SEVIRI MSG 5-day continental scale composites will enable rapid assessment of environ-mental conditions and improved early warning of disasters for the African continent such as flooding ordroughts. The high temporal resolution geostationary data will complement existing higher spatial reso-lution polar-orbiting satellite data for various dynamic environmental and natural resource applications of terrestrial ecosystems.. Introduction
The vast majority of land surface remote sensing of vegetationince 1972 has been achieved by polar orbiting satellite sensorsGoward et al., 1985; Tucker et al., 1985). This suite of sensorsnclude the Advanced Very High Resolution Radiometer (AVHRR)Cracknell, 1996) on National Oceanographic and Atmosphericdministration (NOAA) Polar Operational Environmental Satellite
POES) series, SPOT Vegetation (VGT) (Maisongrande et al., 2004),nd more recently, the Moderate Resolution Imaging Spectrora-iometer (MODIS) instruments on NASA’s Terra and Aqua platforms
Salomonson et al., 1992) among others. Medium to coarse resolu-ion sensors such as MODIS, SPOT Vegetation and AVHRR imagehe entire earth at 1–2 day intervals. The higher resolution sensors,∗ Corresponding author. Tel.: +45 353 22526.E-mail address: [email protected] (R. Fensholt).
303-2434/$ – see front matter © 2011 Elsevier B.V. All rights reserved.oi:10.1016/j.jag.2011.05.009
© 2011 Elsevier B.V. All rights reserved.
such as Landsat can only image the entire world with a patch workof coverage every 16 days. Yet all of these instruments face a chal-lenge of achieving global cloud-free image data due to the frequentpresence of clouds. The local overpass times of these sensors oftencoincide with the periods of maximum cloud built up and cover-age. As a consequence, most single day coverage data are cloudcontaminated and cloud-free data can only be achieved using datacompositing methods over weeks to months (Holben, 1986). In thetropical cloud prone areas and during the growing (wet) season inmost areas of the world a rather long composite period is requiredto reduce influence from cloud cover (Fensholt et al., 2007). Thesecompositing methods do not only introduce biases in large scalesurface measurements because of the tendency towards selectionof forward scatter observations (Huete et al., 1992; Cihlar et al.,
1994; Fensholt et al., 2010b) but dynamical events such as floods ordroughts may not be captured in a timely manner. All these short-comings of POES data limit the ability of near-real-time monitoringfor emergency services thereby being unsuccessful in providing
Journal Identification = JAG Article Identification = 431 Date: July 23, 2011 Time: 10:10 am
722 R. Fensholt et al. / International Journal of Applied Earth Observation and Geoinformation 13 (2011) 721–729
F verlaid2
ataeI(Ich(A
MoaVnlo
sfllfr2((mhd(afet2mre
ig. 1. MSG SEVIRI (bands 1, 2 and 3) 10-day composite map (September 1–10) o008; UN UNOCHA, 2008).
lerts in a timely manner to prevent developing disaster condi-ions (Lacaze and Bergés, 2003). For example, the POES systemsre widely used for monitoring vegetation conditions by severalarly warning systems including the United States Agency fornternational Development (USAID) Famine Early Warning SystemFEWSNET) and the Food and Agricultural Organization’s Globalnformation and Early Warning System (GIEWS). The persistentloud coverage, especially during the critical crop growing season,as substantially hampered the usefulness of earth observationEO) information for the development of an efficient EWS of thefrican continent (Anyamba et al., 2005).
Data from satellites in a geosynchronous orbit such as theeteosat Second Generation (MSG) producing high temporal res-
lution data streams every 15 min are therefore an interestinglternative. Deployed on the MSG satellite is the Spinning Enhancedisible and Infrared Imager (SEVIRI) instrument covering visible,ear-infrared, shortwave infrared and thermal infrared wave-
engths and hence providing a range of measurements that havenly been available during the last decade from POES sensors.
Traditionally, geostationary satellites are used to monitor atmo-pheric “triggers” for severe weather conditions such as tornadoes,ash floods, hail storms or hurricanes. Previous studies have high-
ighted the potential of high temporal resolution SEVIRI data alsoor dynamic environmental monitoring, for example to estimateainfall (Tucker and Sear, 2001) and air temperature (Stisen et al.,007), to monitor volcanic activity (Pergola et al., 2008) and firesFrost and Annegarn, 2007) or to produce near-real time UV mapsSchallhart et al., 2008). However, the use of MSG SEVIRI data to
onitor vegetation or land surface vegetation related processesas been limited until recently. Sandholt et al. (2006) used SEVIRIata as an input to a regional hydrological model, Fensholt et al.2006c) investigated diurnal SEVIRI NDVI for the African continentnd Stisen et al. (2008a,b) estimated regional evapotranspirationrom SEVIRI data (Fensholt et al., 2006c; Sandholt et al., 2006; Stisent al., 2008b). More recent studies have demonstrated the poten-ial of SEVIRI data for evapotranspiration modelling (De Bruin et al.,
010; Ghilain et al., 2010; Sun et al., 2011), drought and water stressonitoring (Fensholt et al., 2010a; Rulinda et al., 2010), fire regimeelated studies (Roberts et al., 2008; Amraoui et al., 2010; Freebornt al., 2011) and flooding (Proud et al., 2011a,b).
with areas affected by drought and flooding in East and West Africa 2008 (IFRC,
The objective of this paper is to assess the potential of geo-stationary EO for dynamic land surface monitoring by comparingMSG SEVIRI with commonly used POES data. Data compositingperiod lengths of standard Terra MODIS, SPOT VGT and NOAA-17 AVHRR products were compared to MSG SEVIRI for a droughtand flooding event in East and West Africa in 2008, respectively.Cloud mask and quality flag information was used for all data prod-ucts. Besides the spatial analysis, we explored time-series coveringMarch–September 2008 for 6 locations directly affected by floodingand drought (Fig. 1) to investigate the performance of a MSG 5-daycompositing scene as compared to the performance of the existingstate-of-the-art POES sensors.
2. Study areas
Sub-Saharan Africa is one of the world’s most cloud-proneregions and has presented a challenge to optical remote sens-ing from Polar Operational Environmental Satellites (POESs) overthe last 30 years. The region is characterised by persistent cloudcover generated by the tropical heat engine that produces cloudcover and rainfall all year round with minimum opportunities foracquiring cloud free surface measurements from satellite remotesensing. Different areas of the African continent were affected bydroughts and floods in 2008 caused by periods of abnormally lowand high rainfall, respectively. East Africa was affected by a creep-ing drought between March and June 2008 (UN UNOCHA, 2008)and many areas of West Africa were affected by floods betweenJuly and September 2008 (IFRC, 2008) (Fig. 1). The Greater Horn ofAfrica has a bimodal annual pattern of rainfall characterized by ashort and a long rainy season. The short rainy season failed alto-gether in 2008 (Julian day 61–182) and the corresponding droughtperiod was manifested by below average vegetation development(UN UNOCHA, 2008).
In equatorial regions flooding conditions are normally asso-
ciated with periods of persistent cloud cover and above normalrainfall. On the other hand, drought events can also occur in the so-called rainy season characterized by widespread cloud cover, butwithout rainfall.
Journal Identification = JAG Article Identification = 431 Date: July 23, 2011 Time: 10:10 am
arth O
3
Aa2dtpfaNaadfd(
aae1siew
3
sGLrroaaaoodAtatb
3
Tuaso(rcwoaq4t
R. Fensholt et al. / International Journal of Applied E
. Data and methods
NDVI and cloud property datasets of the polar-orbiting NOAA-17VHRR, Terra MODIS, and SPOT VGT sensors and the geostation-ry MSG SEVERI are mapped and analysed for a common period in008. Normalized difference vegetation index (NDVI) which can beerived from the SEVIRI red and near-infrared bands was used inhis study because it has been shown to be highly correlated withhotosynthetically active biomass, chlorophyll abundance, theraction of absorbed photosynthetically active radiation (fAPAR)nd rainfall in the arid and semi-arid zones (Myneni et al., 1995;icholson et al., 1990; Tucker, 1979). Therefore NDVI can be useds an indicator for land surface variability from seasonal to inter-nnual time scale (Myneni et al., 1996; Reynolds et al., 2000). Toate, NDVI is one of the critical inputs to early warning systemsor general environmental monitoring, predicting agricultural pro-uction and vector-borne disease monitoring as well as predictionAnyamba et al., 2009; Hutchinson, 1991; Reynolds et al., 2000).
The data of the polar-orbiting sensors reach near-daily coveraget the equator but are usually produced as 16-day (Terra MODIS)nd 10-day composites (SPOT VGT and NOAA-17 AVHRR) for veg-tation products to minimize cloud cover contamination (Holben,986). Both Terra MODIS and SPOT VGT provide NDVI based onurface reflectances whereas the NOAA-17 AVHRR NDVI products based on TOA (Top Of Atmosphere). All polar-orbiting data havembedded per-pixel cloud quality information or cloud flags whichere extracted and used in this analysis.
.1. NOAA-17 AVHRR 10-day composite NDVI
NOAA-17 AVHRR 10-day NDVI composite data with an 8 kmpatial resolution were used in this study were processed at NASAoddard Space Flight Center, Biospheric and Hydrological Sciencesaboratory. The AVHRR NDVI uses monthly NOAA National Envi-onmental Satellite, Data, and Information Services (NESDIS) neareal-time vicarious calibration coefficients to adjust for degradationf the visible channels (1, 2, and 3A). NOAA operational coefficientsre based on vicarious calibrations and MODIS measurements over
radiometrically stable desert target (Libya, 21◦–23◦N; 28◦–29◦E)nd cross calibration among POES sensors based on Simultane-us Nadir Overpass (SNO). In 2008 the equatorial crossing timef NOAA-17 was approximately at 10 am. For the daytime cloudetection at the pixel level the NOAA NESDIS Extended Clouds fromVHRR (CLAVR-x) processing system (Heidinger, 2006) in addition
o temperature thresholding were utilized. With the CLAVR-x coden AVHRR data pixel is flagged as either cloudy or cloud-free. Forhe compositing the maximum NDVI of all pixels was used followedy a cloud check.
.2. Terra MODIS 16-day composite NDVI (MOD13A1)
The 16-day MODIS composite product (MOD13A1) from theerra MODIS sensor (equatorial crossing time at 10:30 am) wassed in the current analysis. Global MOD13A1 data are providedt 500 m spatial resolution as a gridded level-3 product in theinusoidal projection. The Terra MODIS MOD13A1 product is basedn the Terra MODIS level 2 (L2G) daily surface reflectance productMOD09 series), which provides red and near-infrared surfaceeflectance corrected for the effect of atmospheric gases, thin cirruslouds and aerosols. The data quality assessment (QA data) producthich is also embedded in the MOD13A1 product was used to
btain information on overall usefulness and cloud conditions on
per-pixel basis. For the MOD13A1 data Vegetation Index (VI)uality information is defined as a VI Usefulness Index (15 classes,bit layer) ranging from “Perfect quality” to “VI not produced dueo bad quality” (TBRS Lab At University of Arizona). In this analysis
bservation and Geoinformation 13 (2011) 721–729 723
pixels within the classes 0–5 have been assigned as cloud-freeand those within the classes 6–15 as cloudy (class 5 is termed“Intermediate quality” and class 6 is termed “Below intermediatequality”). Detailed explanation of MOD13A2 VI QA binary datamay be found at (TBRS Lab At University of Arizona) and (Hueteet al., 1999). MODIS data from the Terra platform has been chosenfor this analysis over data from the identical Aqua platform.
3.3. SPOT VGT 10-day composite NDVI (S10)
The SPOT VGT synthesis product (S10) is a full resolution prod-uct at 1 km resolution providing 10-day maximum value compositeNDVI (Holben, 1986). Data for 2008 is imaged by the SPOT VGTsensor aboard SPOT 5 (equatorial crossing time of 10:30 am). Thequality of S10 products is derived directly from the quality ofP products (physical products). P products are TOA products forwhich the inputs for atmospheric correction are provided. Atmo-spheric correction is performed with the SMAC algorithm (Rahmanand Dedieu, 1994) which corrects for molecular and aerosol scat-tering, water vapour, ozone and other gas absorption. Data inputsfor the atmospheric correction of SPOT VGT are aerosol opticaldepth (AOD), atmospheric water vapour, ozone (Maisongrandeet al., 2004) and a digital elevation model for atmospheric pres-sure estimation (Passot, 2000). P products are corrected for systemerrors (misregistration of the different channels, calibration ofall the detectors along the line-array detectors for each spectralband) and resampled to a Plate–Carrée geographic projection (SPOTVegetation Userı̌s Guide). High absolute location and multi tem-poral registration accuracy are obtained with an absolute locationaccuracy estimation of 330 m RMS (Sylvander et al., 2000). Sta-tus maps are provided for each S10 product including per-pixelcloud-cover information. The cloud flag information is based onthresholding of the TOA reflectance in each of the four bands, whichare compared to reference reflectance maps for each band (Lissenset al., 2000; SPOT Vegetation Userı̌s Guide). The S10 products areavailable at http://free.vgt.vito.be.
3.4. MSG SEVIRI 5-, 10- and 16-day composite NDVI
The MSG satellite is located at 0◦ longitude with a field of viewcovering all of Africa, much of Western Europe and northeast SouthAmerica (EUMETSAT, 2005). A prototype of an operational real timeprocessing system has been built at the Department of Geogra-phy and Geology, University of Copenhagen to process the MSGSEVIRI data (Fensholt et al., 2006c), using the MSG Data ManagerPro version (Taylor and Taylor, 2005). The input for the processoris Level 1.5 MSG SEVIRI data as delivered by EUMETSAT via theEUMETCast service. Images are represented as 10 bit data with asampling distance of 3 by 3 km at the sub-satellite point. Outputfrom the processor is atmospheric corrected reflectance in bands1 (0.56–0.71 �m) and 2 (0.74–0.88 �m), which are used for thecalculation of SEVIRI NDVI. The SEVIRI 15 min data stream fromMSG includes a Cloud Mask product (CLM) produced by EUMET-SAT. The CLM product contains information on the presence ofcloud (cloud/no cloud decision) on a pixel basis – the cloud detec-tion is called scenes analysis (SCE). The SCE algorithm uses satellite,forecast, radiative transfer model output and auxiliary data (Lutz,2007). Atmospheric correction is performed with the SimplifiedMethod for the Atmospheric Correction of satellite measurementsin the solar spectrum (SMAC) algorithm (Rahman and Dedieu,1994; Proud et al., 2010a,b). Daily values of atmospheric compo-sition (water vapor, aerosols, and ozone) as input for SMAC are
derived from the Level-3 MODIS Terra and Aqua Atmosphere DailyGlobal Products.MSG SEVIRI data are characterized by diurnal reflectance vari-ations due to a varying solar zenith angle throughout the day.
Journal Identification = JAG Article Identification = 431 Date: July 23, 2011 Time: 10:10 am
724 R. Fensholt et al. / International Journal of Applied Earth Observation and Geoinformation 13 (2011) 721–729
F inver( eriodsp
SMre(
F2(
ig. 2. Maps of percentage cloudy composite periods/pixels of no MSG SEVIRI BRDFa) NOAA17-AVHRR, (b) SPOT VGT (c) MSG SEVIRI 10-day composite periods (≈12 periods) composite periods.
urface anisotropy has been minimised by a modified version of the
ODerate Resolution Imaging Spectroradiometer (MODIS) Bidi-ectional Reflectance Distribution Function (BRDF) method (Schaaft al., 2002) that produces Normalised BRDF Adjusted ReflectancesNBARs) that are normalised to common scene geometry (Proud
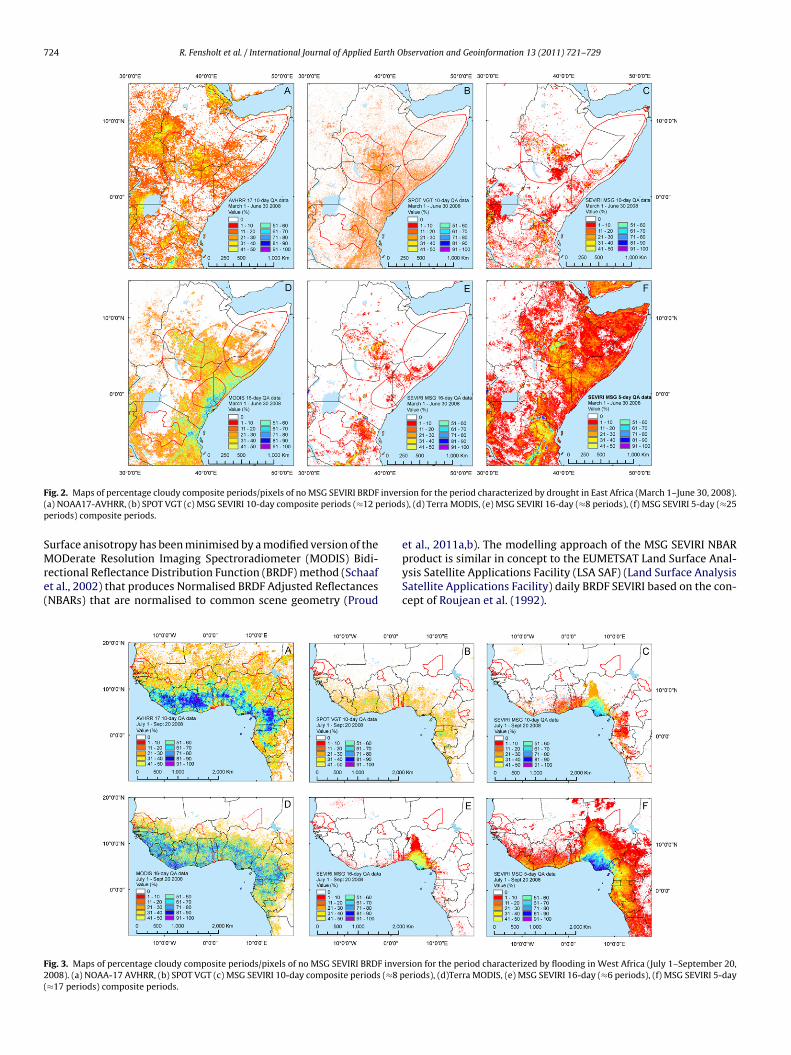
ig. 3. Maps of percentage cloudy composite periods/pixels of no MSG SEVIRI BRDF inve008). (a) NOAA-17 AVHRR, (b) SPOT VGT (c) MSG SEVIRI 10-day composite periods (≈8 p≈17 periods) composite periods.
sion for the period characterized by drought in East Africa (March 1–June 30, 2008).), (d) Terra MODIS, (e) MSG SEVIRI 16-day (≈8 periods), (f) MSG SEVIRI 5-day (≈25
et al., 2011a,b). The modelling approach of the MSG SEVIRI NBAR
product is similar in concept to the EUMETSAT Land Surface Anal-ysis Satellite Applications Facility (LSA SAF) (Land Surface AnalysisSatellite Applications Facility) daily BRDF SEVIRI based on the con-cept of Roujean et al. (1992).rsion for the period characterized by flooding in West Africa (July 1–September 20,eriods), (d)Terra MODIS, (e) MSG SEVIRI 16-day (≈6 periods), (f) MSG SEVIRI 5-day

Journal Identification = JAG Article Identification = 431 Date: July 23, 2011 Time: 10:10 am
R. Fensholt et al. / International Journal of Applied Earth Observation and Geoinformation 13 (2011) 721–729 725
Fig. 4. Time series of NDVI for selected sites (Fig. 1) characterized by drought and flooding (January 1–September 20, 2008) extracted from Terra MODIS 16-day, NOAA-17A en doM ch 5-di figure
bdsmtsic
ipffQ(ota2T(udAot
VHRR, SPOT VGT 10-day and MSG SEVIRI 5-day BRDF corrected composite data (greSG SEVIRI total number of good quality cloud free observations is included for ea
ndicate magnitude inversion). (For interpretation of the references to color in this
Five-, ten- and sixteen-day composites of SEVIRI NBAR’s haveeen compiled based on cloud-free daily 15 min observations. Fiveays has been chosen in order to provide the BRDF model with auitably large selection of input reflectances to perform a robustodel inversion (for the majority of the continent) whilst simul-
aneously allowing a short enough acquisition time to monitorhort term land surface changes. Ten- and sixteen-day compos-tes of SEVIRI NBAR’s have been produced to be able to make directomparisons with the state-of-the-art POES composite products.
In order to determine the accuracy and success of the modelnversion several quality flags are derived in addition to the kernelarameters applied by the model. If any of the quality values areound to be outside of a predetermined range then the inversionails and no parameters are recorded for a given composite period.uality flags also include a check for the range of solar zenith angle
SZA) and view zenith angle (VZA) of image acquisition. For SZAr VZA above 70 degrees observations are disregarded as beyondhis value the atmospheric correction scheme is of low accuracynd the BRDF model may no longer be suitable (see Proud et al.,011a,b for a detailed description of the BRDF model inversion).he successfully inverted NBARs (normalized to VZA and SZA of 0◦)termed full inversion) are finally converted into NDVI values to besed for the analysis of vegetation trends. For lower quality of input
ata the algorithm uses a backup database of BRDF parameters.ccordingly, BRDF parameters are scaled based on the availabilityf SEVIRI data and the scaled BRDF parameters are used to producehe NBARs (termed magnitude inversion). This occurs when too fewts indicate full BRDF inversion and green/white dots indicate magnitude inversion).ay composite period (blue bars indicate full BRDF inversion and hatched blue bars
legend, the reader is referred to the web version of the article.)
input observations are available or when the full inversion fails oneor more quality checks.
4. Results and discussion
Cloud cover frequency maps for POES data and frequency mapsof successful BRDF model inversion (full inversion) for MSG SEVIRIdata were compiled for 5-, 10- and 16-day composite periods for adrought period in East Africa (March 1–June 30, 2008) and a floodperiod in West Africa (July 1–September 20, 2008). In this analysisonly full BRDF inversion is kept as an acceptable solution and ifthe model algorithm produces NBARS based on backup databaseBRDF parameters the inversion is treated as unsuccessful. Theseresults are shown in Figs. 2, 3 and 5. Additionally, time series ofNDVI for selected sites at these two African regions are presentedin Fig. 4, to compare the temporal evolution of NDVI among thedifferent sensors during the drought and flood periods. Note thatNDVI is only used as an indicator for the variability of land surfaceconditions and differences in NDVI levels as caused by differencesin sensor specific spectral response functions and data processingwill not be discussed in details here.
4.1. Comparisons of cloud cover frequency between
polar-orbiting and geostationary sensorsFrequency maps of MSG SEVIRI 10-day composites with suc-cessful BRDF model inversion (Fig. 2c) were compared with 10-day

Journal Identification = JAG Article Identification = 431 Date: July 23, 2011 Time: 10:10 am
7 arth O
c(t1c1atti2uRtis
mopTacnstohra
pomcepciaSpisSim2i
pbscGi(nnacctoie
26 R. Fensholt et al. / International Journal of Applied E
omposite cloud/no cloud information from NOAA-17 AVHRRFig. 2a) and SPOT VGT (Fig. 2b) respectively. The results showhat during approximately 50% of the composite period (March–June 30) the drought impacted areas in East Africa were cloudovered when using NOAA-17 AVHRR data. When using SPOT VGT0-day composites the percent cloud cover is moderately lowers compared to AVHRR. However, the SPOT VGT system is knowno have a deficient cloud screening algorithm due to the lack of ahermal infrared band onboard the sensor, thereby underestimat-ng the cloud influence on the surface products (Fensholt et al.,006a; Swinnen and Veroustraete, 2008) and as a consequencenderrating the number of composite periods masked as cloudy.ealistically the SPOT VGT cloud cover must be assumed to be inhe same range as the one of AVHRR since the VGT sensor has a sim-lar orbiting cycle and equator passing time as the NOAA-17 AVHRRensor.
Interestingly, the MODIS MOD13A1 product did not produceuch useful information in our analysis even though it is integrated
ver 16 days, i.e., the longest compositing period of all the NDVIroducts in this analysis. Drought affected areas covering easternanzania and the borderland between Kenya, Somalia and Ethiopiare severely cloud covered and the percentage cloud cover of theomposite periods reach close to 100% in some areas meaning thato surface-condition information is available from the MODIS sen-or throughout the entire drought period (Fig. 2d). The reason forhe limited data availability of MODIS can be found in the accuracyf the cloud masking. The Terra MODIS 16-day composite productas been validated to have the most accurate cloud screening algo-ithm (Platnick et al., 2003) thereby reflecting the real state of datavailability from a morning pass polar orbiting sensor.
On the contrary, the corresponding 16-day MSG SEVIRI com-osite product (Fig. 2e) based on the daily cloud-free 15-minbservations shows close to 0% of the composite periods beingasked as cloudy (a successful BRDF model inversion for 100% of
omposite periods is obtained) over all of East Africa during thentire drought period except of some small areas of high topogra-hy around Mt. Kenya and Mt. Kilimanjaro with above 50% of theomposite periods being too cloud covered to perform a full BRDFnversion. Shortening the compositing period of the MSG SEVIRI to
10-day period (Fig. 2c), comparable with NOAA-17 AVHRR andPOT VGT, does not increase the percentage of cloudy compositeeriods considerably and for the majority of pixel where a full BRDF
nversion was not obtained for all 10-day composites, it is only aingle period failing. Running the BRDF inversion using a 5-day MSGEVIRI period (Fig. 2f) generally increases the area where full modelnversion is not obtained for all 5-day periods. However, for the vast
ajority of these pixels it is still only a few composite periods out of5 (1–10% interval) that are being too cloudy for a successful BRDF
nversion on a 5-day basis.The results obtained from the analysis of percent cloudy com-
osite periods and BRDF model inversion for the period affectedy flooding in West Africa (July 1–September 20, 2008) are pre-ented in Fig. 3. The NOAA-17 AVHRR 10-day composites are highlyontaminated by cloud cover in the countries along the Gulf ofuinea (including some of the areas severely affected by flood-
ng) where only one to two 10-day periods out of 8 are cloud freeFig. 3a). The impact of clouds on the SPOT VGT data is less pro-ounced (Fig. 3b), as it was for East Africa. However, again this isot reliable since the VGT and AVHRR sensors are acquiring data atpproximately the same time and should encounter similar cloudonditions. With MSG SEVIRI data, on the contrary, 100% 10-dayomposites of successful BRDF model inversion can be obtained for
he majority of the region (Fig. 3c). The coastal areas in the Gulff Guinea are most influenced by cloudiness with the full BRDFnversion failing for about 25% of the 10-day composites. In thequatorial coastal Central Africa there is an increased percentagebservation and Geoinformation 13 (2011) 721–729
of failing BRDF inversions caused by very persistent cloud cover inthis particular area.
Terra MODIS 16-day composites (Fig. 3d) are highly cloud con-taminated, hence only limited information can be obtained onsurface conditions for the period of flooding in the countries alongthe Gulf of Guinea. This is in contrast to higher frequency of MSGSEVIRI composite periods with a successful BRDF model inversionover flooded areas from both 16-, 10- and 5-day products (Fig. 3c,e, f). Only the extremely cloud prone areas of coastal Central Africa(Nigeria) are severely affected characterized by a high percentage offailing BRDF inversions for the 5-day composites. For the floodedareas however, the BRDF model inversion fails only for approxi-mately one to three 5-day composite periods (out of the 17 periodscovering the rainy season).
4.2. Comparison of time series under drought and flood conditions
Time series of NDVI from MSG SEVIRI and POES (NOAA-17AVHRR, SPOT VGT and Terra MODIS) for three selected sites in EastAfrica (Fig. 1) are presented for the period March 1–September 20,2008. In 2008, the short rainy season failed altogether (Julian day61–182, shaded light brown color) and the corresponding droughtperiod caused low vegetation development, shown here by theNDVI (Fig. 4a–c). The number of cloud-free SEVIRI observations(blue bars) for the three selected sites affected by drought under-lines the potential for improved drought monitoring as comparedto the time series information available from POES. The number ofcloud-free SEVIRI observations passing the BRDF modelling qualitycheck criterias within each composite period reveals that producinga 5-day composite period dataset (which is significantly better thanwhat can be obtained from a POES system) generally remains high.It can be seen that only observations from the MSG SEVIRI providesufficient information to guarantee continuous land cover monitor-ing for all sites. Terra MODIS on the contrary only provides a fewcloud free 16-day composite observations throughout the entiredrought period. Time series of NOAA AVHRR and SPOT VGT 10-day composite NDVI generally capture more composite values ascompared to Terra MODIS. However, the quality of the informationproduced every 10 days must be questioned since the orbit designdoes not differ from MODIS and consequently fewer observationsare available to produce NOAA AVHRR and SPOT VGT 10-day com-posites as compared to the Terra MODIS 16-day composite.
Variations in the level and dynamic range of NDVI as producedfrom the different sensors are to be expected due to sensor differ-ences in spectral response functions and atmospheric processingschemes (Fensholt et al., 2006b) (e.g., NOAA-17 AVHRR NDVI isbased on TOA reflectances whereas NDVI from the rest of the sen-sors is based on Top Of Canopy (TOC) reflectances).
As it was the case for the 2008 spring drought in East Africa, it isevident in the case of the West African summer flooding that MODISdata failed to provide sufficient information on surface conditions.Comparing MSG SEVIRI 5-day and Terra MODIS 16-day compositescapabilities to monitor dynamic earth surface properties for threeregions representing flooded areas (Fig. 1) shows a remarkable dif-ference (Fig. 4d–f).
The number of cloud-free MSG SEVIRI observations for the threesites is generally high for each 5-day period producing sufficientdata input for a successful BRDF inversion in the majority of 5-day periods enabling a reliable NDVI estimate. For the Togo sitehowever, it can be seen that the reduced amount of cloud-freeobservations causing the full BRDF inversion to fail more frequentlyand the 5-day NDVI is produced from magnitude inversion includ-
ing a backup database of BRDF parameters (hatched bars). Duringthe period of flooding (Julian day 183–263, indicated by the shadedlight blue color) both SEVIRI- and POES-based NDVI fluctuated con-siderably for the Gambia and Togo site (Fig. 4d and f) probably
Journal Identification = JAG Article Identification = 431 Date: July 23, 2011 Time: 10:10 am
R. Fensholt et al. / International Journal of Applied Earth Observation and Geoinformation 13 (2011) 721–729 727
F ring tE
aeaisAicoma
Sapp2cooc(odhsap
5
sawb2Tivhv
ig. 5. Maps of total number of good quality cloud free MSG SEVIRI observations duast Africa, March 1–June 30.
ssociated with the presence of a mixed spectral signal in the pix-ls representing water and vegetation. Interestingly, for the Gambiand Guinea sites there is only one 16-day composite MODIS NDVImage available within the flooding period whereas for the Togoite no cloud free observations could be acquired (Fig. 4d and e).lso 10-day composite observations from NOAA-17 AVHRR are lim-
ted for the three sites whereas SPOT VGT succeeds in producingontinuous measurements from the approximately same equatorverpass time as Terra MODIS and AVHRR (the SPOT VGT cloudask is known to underestimate cloud and fractional cloud cover,
s already discussed before).The total number of per-pixel cloud free observations from MSG
EVIRI data (passing the BRDF modelling quality check criteria)vailable during the periods of drought and flooding were com-iled for the two affected regions and shown in Fig. 5. During theeriod of widespread flooding in West Africa, July 1–September0, 2008, most of the flooding affected areas have more than 500loud free MSG SEVIRI observations (Fig. 5a). For the semi-arid areasf Senegal, Burkina Faso and Niger, this time period (covering thenset until peak of the rainy season) was characterized by >1000loud-free observations. For the period of drought in East AfricaMarch 1–June 30, 2008) the number of cloud-free MSG SEVIRIbservations generally was in the range of 200 to 2000 for therought affected areas (Fig. 5b). Only the highlands of Ethiopia andigh mountain regions of Kenya and Tanzania are characterised bymall areas of severe cloud contamination, where cloud-free datavailability dropped to below 50–100 observations throughout theeriod of drought.
. Implications for environmental monitoring
Daily changes in surface reflectance as observed from POEShould be interpreted with caution since reflectance measurementsre characterised by wavelength dependant anisotropy and varyith the angles of observation and illumination as described by the
idirectional reflectance distribution function (BRDF) (Gao et al.,002; Jin et al., 2002; Schaaf et al., 2002; Fensholt et al., 2010b).he fixed viewing angle of geostationary satellites provides an
nteresting alternative to POES data characterized by day-to-dayariations in the sun-target-sensor geometry. A fixed viewing angleas important implications for the effectiveness to interpret theseariations in measured surface reflectances, in particular for areashe periods of drought and flooding for (a) West Africa, July 1–September 20 and (b)
affected by dynamic events such as floods or droughts. Geostation-ary data on the other hand are characterised by varying solar zentihangles (SZA) over the course of the day. The high temporal resolu-tion of MSG data, however, provides a significantly higher numberof observations as compared to POES making it possible to correctfor varying SZA with the requirement of only a few days of obser-vations. A BRDF-corrected reflectance product is provided as basedon MODIS data (MOD43B4) by inverting multidate, multiangular,cloud-free, atmospherically corrected, surface reflectance observa-tions acquired over a 16-day period (Schaaf et al., 2002). However,the requirement of multidate and multiangular cloud-free obser-vations for a given pixel compromises the ability of retaining a hightemporal resolution data in the modeled output. To compensate forthis, the most recent MODIS BRDF product is processed using a 16-day rolling acquisition period in which a new composite is startedevery 8 days to better capture rapid changes in surface reflectancethat would not be immediately apparent if a simple 16-day periodwas used. For the coastal areas in sub-Saharan Africa there is anannual BRDF inversion success rate of close to 0% for the MOD43product though (Proud et al., 2011a,b).
In contrast, the 15 min temporal resolution of MSG SEVIRIdata allows for a much larger number of acquisitions to be col-lected and used for a robust BRDF inversion. BRDF correctedSEVIRI reflectance observations modeled on a daily basis (>40observations, depending on the solar zenith acceptance angle)can provide cloud-free NBAR reflectance observations computedon a daily basis for many areas of the world, yet still with arobust model inversion accuracy. Currently MSG SEVIRI BRDFcloud-free reflectance observations computed on a daily basis asbased on a linear kernel-driven BRDF model (Roujean et al., 1992)are provided by the EUMETSAT Land Surface Analysis SatelliteApplications Facility (LSA SAF) (Land Surface Analysis SatelliteApplications Facility). However, despite the influence from thediurnal varying solar zenith angles, the reflectances measuredevery 15 min also contain new and valuable information. Whenanalyzing the diurnal pattern of reflectance/emittance for a pixelcharacterized by the presence of vegetation while affected bydrought, the bell shape of the diurnal canopy surface tempera-
ture observations will be influenced due to plant stomatal closureat some point during the day, and thereby valuable informa-tion on plant water stress/evapotranspiration can be obtained(Benoit et al., 2008; Stisen et al., 2007).
Journal Identification = JAG Article Identification = 431 Date: July 23, 2011 Time: 10:10 am
7 arth O
6
rai(Tsisset2tdivltt(wao
dsfidmssstoldIbme
A
SGa
R
A
A
A
B
C
.
28 R. Fensholt et al. / International Journal of Applied E
. Conclusion and outlook
The Geostationary MSG SEVIRI sensor produces high temporalesolution data covering optical, near infrared, shortwave infrared,nd thermal infrared domains and has opened up new possibil-ties for satellite-based environmental monitoring at a shorter5-day) time scale than is currently available from POES sensors.he improved spectral resolution of the geostationary SEVIRI sen-or can be used for vegetation monitoring by using optical/nearnfrared wavelengths (Fensholt et al., 2006c) and canopy watertress monitoring based on the shortwave infrared reflectance sen-itivity to canopy water content (Fensholt et al., 2010a; Rulindat al., 2010) or by combining the optical/near infrared domain withhermal information (the so called “triangle method”) (Stisen et al.,008a). Combining the improved spectral resolution with the highemporal resolution makes MSG SEVIRI, not only a complementaryata source to POES, but advances large scale disaster monitoring
n cloud prone areas of the world covered by the sensors field ofiew. So far geostationary data are not considered for assessingarge scale natural hazards and disasters (Joyce et al., 2009), evenhough cloud coverage and revisit times signify important limita-ions for near real-time monitoring and assessment of such eventsGillespie et al., 2007). For example, the MODIS NDVI product isidely used in operational environmental monitoring systems but
s illustrated in this paper, during the period of a natural hazard,nly insufficient information was available from the MODIS sensor.
Our analysis illustrates that areas affected by flooding androught can effectively be monitored at significantly shorter timecales with MSG data as compared to any of the POES systems. Thesendings suggest that space agencies world-wide should considereploying and operating a constellation of sensors for environ-ental remote sensing, i.e., covering the optical, near infrared,
hortwave infrared, and thermal infrared spectral range, in geo-tationary orbit to improve cloud free monitoring of the landurface within a latitude range covering ±60◦ to provide capabili-ies for improved early warning in disaster situations. At presentnly the SEVIRI sensor onboard MSG and the Indian INSAT-3A,ocated at 93.5◦ East longitude (ISRO), payloads can provide suchata. The forthcoming GOES-R multi-spectral Advanced Baseline
mager (ABI) with similar spectral bands as SEVIRI is expected toe launched in 2014 enabling geostationary-based environmentalonitoring of the continents of North and South America (Schmit
t al., 2005).
cknowledgements
The authors would like to thank EUMETSAT for providing theEVIRI data used within this study. NASA/MODIS Land Disciplineroup and SpotImage/Vito are thanked for sharing the MODIS LANDnd SPOT VEGETATION data.
eferences
mraoui, M., DaCamara, C.C., Pereira, J.M.C., 2010. Detection and monitoring ofAfrican vegetation fires using MSG-SEVIRI imagery. Remote Sens. Environ. 114(5), 1038–1052.
nyamba, A., Chretien, J.P., Small, J., Tucker, C.J., Formenty, P.B., Richardson, J.H.,Britch, S.C., Schnabel, D.C., Erickson, R.L., Linthicum, K.J., 2009. Prediction of aRift Valley fever outbreak. Proc. Natl. Acad. Sci. U.S.A. 106, 955–959.
nyamba, A., Tucker, C.J., Huete, A.R., Boken, V.K., 2005. Monitoring drought usingcoarseresolution polar-orbiting satellite data. In: Boken, et al. (Eds.), Monitoringand Predicting Agricultural Drought: A Global Study. Oxford Univ. Press, NewYork, pp. 57–78.
enoit, C., Ottle, C., Boudevillan, B., Guerin, C., De Solan, B., Boisgontier, D., Deudon, O.,Testud, J., Moreau, E., Lebouar, E., Olioso, A., 2008. Use of geostationary satellite
thermal infrared data to monitor surface exchanges at local scale over heteroge-neous landscape. In: Application to Meteosat 8 data, in: International Geoscienceand Remote Sensing Symposium (IGARSS) , Boston, USA, pp. 4386–4389.ihlar, J., Manak, D., D’iorio, M., 1994. Evaluation of compositing algorithms forAVHRR data over land. IEEE Trans. Geosci. Remote Sens. 32, 427–437.
bservation and Geoinformation 13 (2011) 721–729
Cracknell, A.P., 1996. The advanced very high resolution radiometer (AVHRR).EUMETSAT, 2005. MSG level 1.5 image data format description, EUM.MSG.ICD.105.
Available from: http://www.eumetsat.int/Home/Main/Documentation/Tech-nical and Scientific Documentation/Technical Notes/SP 1124282611560?l=en(accessed October 2009).
De Bruin, H.A.R., Trigo, I.F., Jitan, M.A., Temesgen Enku, N., Van Der Tol, C., Gieske,A.S.M., 2010. Reference crop evapotranspiration derived from geo-stationarysatellite imagery: a case study for the Fogera flood plain, NW-Ethiopia and theJordan Valley, Jordan. Hydrol. Earth Syst. Sci. 14 (11), 2219–2228.
Fensholt, R., Huber, S., Proud, S.R., Mbow, C., 2010a. Detecting canopy water statususing shortwave infrared reflectance data from polar orbiting and geostation-ary platforms. J. Selected Top. Appl. Earth Observ. Remote Sens. (JSTARS) 3 (3),271–285.
Fensholt, R., Sandholt, I., Proud, S.R., Stisen, S., Rasmussen, M.O., 2010b. Assessmentof MODIS sun-sensor geometry variations effect on observed NDVI using MSGSEVIRI geostationary data. Int. J. Remote Sens. 31 (23), 6163–6187.
Fensholt, R., Ayamba, A., Stisen, S., Sandholt, I., Pak, E., Small, J., 2007. Comparisonsof compositing period length for vegetation index data from polar-orbiting andgeostationary satellites for the cloud-prone region of West Africa. Photogramm.Eng. Remote Sens. 73, 297–309.
Fensholt, R., Nielsen, T.T., Stisen, S., 2006a. Evaluation of AVHRR PAL and GIMMS10-day composite NDVI time series products using SPOT-4 vegetation data forthe African continent. Int. J. Remote Sens. 27, 2719–2733.
Fensholt, R., Sandholt, I., Stisen, S., 2006b. Evaluating MODIS, MERIS, and VEG-ETATION - Vegetation indices using in situ measurements in a semiaridenvironment. IEEE Trans. Geosci. Remote Sens. 44, 1774–1786.
Fensholt, R., Sandholt, I., Stisen, S., Tucker, C., 2006c. Analysing NDVI for the Africancontinent using the geostationary meteosat second generation SEVIRI sensor.Remote Sens. Environ. 101, 212–229.
Freeborn, P.H., Wooster, M.J., Roberts, G., 2011. Addressing the spatiotemporal sam-pling design of MODIS to provide estimates of the fire radiative energy emittedfrom Africa. Remote Sens. Environ. 115 (2), 475–489.
Frost, P., Annegarn, H., 2007. Providing satellite-based early warnings of fires toreduce fire flashovers on South Africa’s transmission lines. In: IEEE InternationalGeoscience and Remote Sensing Symposium , Barcelona, Spain, pp. 2443–2446.
Gao, F., Jin, Y., Li, X., Schaaf, C.B., Strahler, A.H., 2002. Bidirectional NDVI and atmo-spherically resistant BRDF inversion for vegetation canopy. IEEE Trans. Geosci.Remote Sens. 40, 1269–1278.
Ghilain, N., Arboleda, A., Gellens-Meulenberghs, F., 2010. Evapotranspiration mod-elling at large scale using near-real time MSG SEVIRI derived data. Hydrol. EarthSyst. Sci. Discuss. 7 (5), 7079–7120.
Gillespie, T.W., Chu, J., Frankenberg, E., Thomas, D., 2007. Assessment and predictionof natural hazards from satellite imagery. Prog. Phys. Geogr. 31, 459–470.
Goward, S.N., Tucker, C.J., Dye, D.G., 1985. North American vegetation patternsobserved with the NOAA-7 advanced very high resolution radiometer. Vege-tation 64, 3–14.
Heidinger, A., 2006. Clouds from AVHRR. Available from: http://cimss.ssec.wisc.edu/clavr/ (accessed October 2009).
Holben, B.N., 1986. Characteristics of maximum-value composite images from tem-poral AVHRR data. Int. J. Remote Sens. 7, 1417–1434.
Huete, A., Justice, C., van Leeuwen, W., 1999. MODIS Vegetation Index(MOD 13). ATBD Version 3, pp. 1–29. http://modis.gsfc.nasa.gov/data/atbd/atbd mod13.pdf.
Huete, A.R., Hua, G., Qi, J., Chehbouni, A., van Leeuwen, W.J.D., 1992. Normalizationof multidirectional red and NIR reflectance with the SAVI. Remote Sens. Environ.41, 143–154.
Hutchinson, C.F., 1991. Uses of satellite data for famine early warning in sub-SaharanAfrica. Int. J. Remote Sens. 12, 1405–1421.
IFRC, 2008. Floods in Western Africa (as of 30 September 2008). Avail-able from: http://www.reliefweb.int/rw/rwb.nsf/db900sid/LPAA-7JZBJQ?OpenDocument&rc=1&emid=FL-2008-000102-CIV (accessed October 2009).
ISRO, Geo-Stationary Satellites. Available from: http://www.isro.org/satellites/insat-3a.aspx (accessed October 2009).
Jin, Y., Gao, F., Schaaf, C.B., Li, X., Strahler, A.H., Bruegge, C.J., Martonchik, J.V., 2002.Improving MODIS surface BRDF/albedo retrieval with MISR multiangle obser-vations. IEEE Trans. Geosci. Remote Sens. 40, 1593–1604.
Joyce, K.E., Belliss, S.E., Samsonov, S.V., McNeill, S.J., Glassey, P.J., 2009. Areview of the status of satellite remote sensing and image processing tech-niques for mapping natural hazards and disasters. Prog. Phys. Geogr. 33,183–207.
Lacaze, B., Bergés, J.C., 2003. Contribution of Meteosat Second Generation (MSG)imagery to Drought Early Warning Systems. In: 3rd EARSeL Workshop on ImageSpectroscopy, Herrsching, Germany.
Land Surface Analysis Satellite Applications Facility. http://landsaf.meteo.pt/.Lissens, G., Kempeneers, P., Fierens, F., 2000. Development of a cloud,
snow and cloud shadow mask for VEGETATION imagery. In: Saint(Ed.), VEGETATION 2000 Conference: 2 Years of Operation to Preparethe Future, Lake Maggiore, Italy, pp. 303–306. http://www.spot-vegetation.com/vegetationprogramme/Pages/vgtprep/vgt2000/lissenscloud.pdf
Lutz, H.J., 2007. Cloud Detection for MSG – Algorithm Theoretical Basis Document(ATBD). In: EUMETSAT, EUM/MET/REP/07/0132.
Maisongrande, P., Duchemin, B., Dedieu, G., 2004. VEGETATION/SPOT: an operationalmission for the Earth monitoring; presentation of new standard products. Int. J.Remote Sens. 25, 9–14.
Myneni, R.B., Hall, F.G., Sellers, P.J., Marshak, A.L., 1995. Interpretation of spectralvegetation indexes. IEEE Trans. Geosci. Remote Sens. 33, 481–486.

Journal Identification = JAG Article Identification = 431 Date: July 23, 2011 Time: 10:10 am
arth O
M
N
P
P
P
P
P
P
P
R
R
R
R
R
S
S
R. Fensholt et al. / International Journal of Applied E
yneni, R.B., Los, S.O., Tucker, C.J., 1996. Satellite-based identification of linked veg-etation index and sea surface temperature anomaly areas from 1982–1990 forAfrica, Australia and South America. Geophys. Res. Lett. 23, 729–732.
icholson, S.E., Davenport, M.L., Malo, A.R., 1990. A comparison of the vegetationresponse to rainfall in the Sahel and East Africa, using normalized differencevegetation index from NOAA AVHRR. Clim. Change 17, 209–241.
assot, X., 2000. VEGETATION image processing methods in the CTIV. In: Saint(Ed.), VEGETATION 2000 Conference: 2 Years of Operation to Prepare theFuture, Lake Maggiore, Italy. http://www.spot-vegetation.com/ vegetationpro-gramme/Pages/vgtprep/vgt2000/passot.pdf.
ergola, N., Marchese, F., Tramutoli, V., Filizzola, C., Ciampa, M., 2008. Advancedsatellite technique for volcanic activity monitoring and early warning.
latnick, S., King, M.D., Ackerman, S.A., Menzel, W.P., Baum, B.A., Riedi, J.C., Frey,R.A., 2003. The MODIS cloud products: algorithms and examples from terra.IEEE Trans. Geosci. Remote Sens. 41, 459–473.
roud, S.R., Fensholt, R., Rasmussen, L.V., Sandholt, I., 2011a. Rapid response flooddetection using the MSG geostationary satellite. Int. J. Appl. Earth Observ. Geoin-form. 13, 536–544.
roud, S.R., Zhang, Q., Schaaf, C., Fensholt, R., Rasmussen, M.O., Shisanya, C., Mutero,W., Mbow, C., Anyamba, A., Pak, E. and Sandholt, I. The Normalisation of the Sur-face Anisotropy Effects Present in SEVIRI Reflectance Data by Using the MODISBRDF method. IEEE Trans. Geosci. Remote Sens. (in review).
roud, S.R., Fensholt, R., Rasmussen, M.O., et al., 2010a. A comparison of the effec-tiveness of 6S and SMAC in correcting for atmospheric interference of MeteosatSecond Generation images. J. Geophys. Res. – Atmos., 115.
roud, S.R., Rasmussen, M.O., Fensholt, R., et al., 2010b. Improving the SMAC atmo-spheric correction code by analysis of Meteosat Second Generation NDVI andsurface reflectance data. Remote Sens. Environ. 114 (8), 1687–1698.
ahman, H., Dedieu, G., 1994. SMAC – a simplified method for the atmospheric cor-rection of satellite measurements in the solar spectrum. Int. J. Remote Sens. 15,123–143.
eynolds, C.A., Yitayew, M., Slack, D.C., Hutchinson, C.F., Huetes, A., Petersen, M.S.,2000. Estimating crop yields and production by integrating the FAO Crop SpecificWater Balance model with real-time satellite data and ground-based ancillarydata. Int. J. Remote Sens. 21, 3487–3508.
oberts, G., Wooster, M.J., Lagoudakis, E., 2008. Annual and diurnal African biomassburning temporal dynamics. Biogeosci. Discuss. 5/4, 3623–3663.
oujean, J.L., Leroy, M., Deschamps, P.Y., 1992. A bidirectional reflectance model ofthe Earth’s surface for the correction of remote sensing data. J. Geophys. Res. 97(D18).
ulinda, C.M., Bijker, W., Stein, A., 2010. Image mining for drought monitoring ineastern Africa using Meteosat SEVIRI data. Int. J. Appl. Earth Observ. Geoinform.12, S63–S68.
alomonson, V.V., Barnes, W.L., Maymon, P.W., Montgomery, H.E., Ostrow, H., 1992.MODIS: advanced facility instrument for studies of the earth as a system. IEEE
Trans. Geosci. Remote Sens., 145–153.andholt, I., Stisen, S., Fensholt, R., Rasmussen, M.O., Noergaard, A., Iversen, K.M.,Bondo, T., Svendsen, S.H., 2006. MSG SEVIRI data for vegetation monitoring andland surface process modeling in Africa. In: European Space Agency (SpecialPublication) ESA SP, pp. 83–88.
bservation and Geoinformation 13 (2011) 721–729 729
Schallhart, B., Blumthaler, M., Schreder, J., Verdebout, J., 2008. A method togenerate near real time UV-Index maps of Austria. Atmos. Chem. Phys. 8,7483–7491.
Schmit, T.J., Gurka, J., Gunshor, M.M., Menzel, W.P., Li, J., 2005. The Advanced BaselineImager (ABI) on Geostationary Operational Environmental Satellites (GOES)-R.In: 21st International Conference on Interactive Information Processing Systems(IIPS) for Meteorology, Oceanography, and Hydrology.
Schaaf, C.B., Gao, F., Strahler, A.H., Lucht, W., Li, X., Tsang, T., Strugnell, N.C., Zhang,X., Jin, Y., Muller, J.P., Lewis, P., Barnsley, M., Hobson, P., Disney, M., Roberts, G.,Dunderdale, M., Doll, C., D’Entremont, R.P., Hu, B., Liang, S., Privette, J.L., Roy,D., 2002. First operational BRDF, albedo nadir reflectance products from MODIS.Remote Sens. Environ. 83, 135–148.
SPOT, SPOT Vegetation Userı̌s Guide. Available from: http://www.spot-vegetation.com/vegetationprogramme/Pages/TheVegetationSystem/userguide/userguide.htm (accessed October 2009).
Stisen, S., Sandholt, I., Norgaard, A., Fensholt, R., Jensen, K.H., 2008a. Combining thetriangle method with thermal inertia to estimate regional evapotranspiration –applied to MSG-SEVIRI data in the Senegal River basin. Remote Sens. Environ.112, 1242–1255.
Stisen, S., Sandholt, I., Noergaard, A., Fensholt, R., Jensen, K.H., 2008b. Combining thetriangle method with thermal inertia to estimate regional evapotranspiration –applied to MSG-SEVIRI data in the Senegal River basin. Remote Sens. Environ.112, 1242–1255.
Stisen, S., Sandholt, I., Nårgaard, A., Fensholt, R., Eklundh, L., 2007. Estimation ofdiurnal air temperature using MSG SEVIRI data in West Africa. Remote Sens.Environ. 110, 262–274.
Swinnen, E., Veroustraete, F., 2008. Extending the SPOT–VEGETATION NDVI timeseries (1998–2006) back in time with NOAA-AVHRR data (1985–1998) forSouthern Africa. IEEE Trans. Geosci. Remote Sens. 46, 558–572.
Sun, Z., Gebremichael, M., Ardö, J., De Bruin, H.A.R., 2011. Mapping daily evapo-transpiration and dryness index in the East African highlands using MODIS andSEVIRI data. Hydrol. Earth Syst. Sci. 15 (1), 163–170.
Sylvander, S., Henry, P., Bastien-Thiry, C., Meunier, F., Fuster, D., 2000.VEGETATION geometrical image quality. In: Saint (Ed.), VEGETATION2000 Conference: 2 Years of Operation to Prepare the Future, CNES,Toulouse & JRC, Ispra, Lake Maggiore, Italy, pp. 33–44. http://www.spot-vegetation.com/vegetationprogramme/Pages/vgtprep/vgt2000/sylvander.pdf.
Taylor, D., Taylor, C., 2005. MSG data manager pro homepage.http://www.satsignal.net.
TBRS Lab At University of Arizona. http://tbrs.arizona.edu/project/MODIS/UserGuidedoc.php#QA1 (accessed October 2009).
Tucker, C.J., 1979. Red and photographic infrared linear combinations for monitoringvegetation. Remote Sens. Environ. 8, 127–150.
Tucker, C.J., Townshend, J.R.G., Goff, T.E., 1985. African land-cover classification usingsatellite data. Science 227, 369–375.
Tucker, M.R., Sear, C.B., 2001. A comparison of Meteosat rainfall estimation tech-niques in Kenya. Meteorol. Appl. 8, 107–117.
UN UNOCHA, 2008. Horn of Africa Alert 19 September 2008. http://www.reliefweb.int/rw/rwb.nsf/db900SID/EDIS-7JMQCU?OpenDocument&rc=1&emid=ACOS-635NZE (accessed October 2009).