Pollution control in coastal area through Indonesian coastal ...
Upload
khangminh22Category
view
1download
0
N A S A G O D D A R D S P A C E F L I G H T C E N T E R
I n t e g r a t e d D e s i g n C a p a b i l i t y / I n s t r u m e n t D e s i g n L a b o r a t o r y
Geostationary Coastal and Air Pollution Events (GeoCAPE)
Filter Radiometer (FR) ~ Concept Presentation~
Systems Carl Kotecki & Martha Chu
August 6, 2014
To contact study lead: A
ntonio Mannino/616

I n t e g r a t e d D e s i g n C a p a b i l i t y / I n s t r u m e n t D e s i g n L a b o r a t o r y
GEO CAPE FR Study: 8/6 – 8/12/2014 Presentation Delivered: August 6, 2014
Systems p2 Final Presentation
Introduction
• The GeoCAPE Filter Radiometer (FR) Study is a different instrument type than all of the previous IDL GeoCape studies.
• The customer primary goals are to keep mass, volume and cost to a minimum while meeting the science objectives and maximizing flight opportunities by fitting on the largest number of GEO accommodations possible. – Minimize total mission costs by riding on a commercial GEO satellite.
• For this instrument type, the coverage rate, km2/min, was significantly increased while reducing the nadir ground sample size to 250m. This was accomplished by analyzing a large 2d area for each integration period. – The field of view will be imaged on a 4k x 4k detector array of 15um
pixels. • Each ground pixel is spread over 2 x 2 detector pixels so the instantaneous
field of view (IFOV) is 2048 X 2048 ground pixels.
– The baseline is, for each field of view 50 sequential snapshot images are taken, each with a different filter, before indexing the scan mirror to the next IFOV. A delta would be to add additional filters.

I n t e g r a t e d D e s i g n C a p a b i l i t y / I n s t r u m e n t D e s i g n L a b o r a t o r y
GEO CAPE FR Study: 8/6 – 8/12/2014 Presentation Delivered: August 6, 2014
Systems p3 Final Presentation
Coastal Ocean Biology & Biogeochemistry Mission
New Science • Diurnal Rates of processes • Ecosystem Health • Carbon Fluxes • UV radiances
• Colored Dissolved Organic Matter - CDOM • Absorbing Aerosols
• Track Hazards • Oil Spills • Harmful Algal Blooms
• Advanced atmospheric correction capabilities View from 95 W
The black outer circle encompassing much of North and South America represents the 67° sensor viewing angle, which is the approximate limit to ocean color retrievals from 95° W. The two red lines extending beyond the
continental land masses represent the 375 km and 500 km (width from inland of shore [white line] to the ocean) threshold and baseline coastal region requirements. Both lines generally extend beyond the 2500 m bathymetry
of the continental margin

I n t e g r a t e d D e s i g n C a p a b i l i t y / I n s t r u m e n t D e s i g n L a b o r a t o r y
GEO CAPE FR Study: 8/6 – 8/12/2014 Presentation Delivered: August 6, 2014
Systems p4 Final Presentation
• Top-of-the-Atmosphere radiances leading to the following retrievals: – Water-leaving radiances (Lw) from UV-NIR (350-1050 nm);
a.k.a. “ocean color” • Hyperspectral Lw used to retrieve surface layer aquatic optical
properties (absorption and scattering), constituents (chlorophyll, Colored Dissolved Organic Matter, phytoplankton biomass, dissolved and particulate organic carbon, phytoplankton diversity, etc.) and rate processes (photosynthesis, photo-oxidation, etc.) in coastal and ocean waters.
– Atmospheric corrections for ocean color • SWIR band radiances for atmospheric corrections over turbid waters
(ocean is black or nearly black so one can quantify aerosol contributions exclusively) - minimum of 2 bands (1020, 1245, 1640, 2135 nm) – The baseline for this study included the 1020, 1245 and 1640nm
bands, but not the 2135nm band. – The 2135nm band could easily be accommodated by using 2.5um
cutoff MCT instead of the 1.7um MCT in the baseline. The detector operating temperature would have to be lowered to 155K from 185K but that just means a slightly larger passive radiator.
• Detection and quantification of absorbing and non-absorbing aerosols (350-1050 nm and SWIR bands).
Science Measurements

I n t e g r a t e d D e s i g n C a p a b i l i t y / I n s t r u m e n t D e s i g n L a b o r a t o r y
GEO CAPE FR Study: 8/6 – 8/12/2014 Presentation Delivered: August 6, 2014
Systems p5 Final Presentation
• The instrument is to be hosted as a secondary payload on a commercial geostationary communications satellite, thus specific S/C and LV information is not available. – The spreadsheet on later slides contains the specifics on
engineering allocations for various platforms (mass, power, volume, telemetry)
• The scarcest engineering resources addressed: – Mass and volume
• Pointing Line-of-Site (LOS) Error (as % of nadir pixel) Requirements: – Pointing Knowledge LOS: <50% Threshold & <10% Baseline – Pointing Accuracy LOS: <100% Threshold & <25% Baseline – Pointing Stability LOS: <50% Threshold & <10% Baseline
• The instrument needs roll knowledge or active compensation: The roll during operation is expected to be up to +0.1deg
• The instrument needs a vibration suppression system (at S/C to instrument interface) – Spacecraft jitter is expected to exceed what can be tolerated.
S/C and LV Information
I n t e g r a t e d D e s i g n C a p a b i l i t y / I n s t r u m e n t D e s i g n L a b o r a t o r y
GEO CAPE FR Study: 8/6 – 8/12/2014 Presentation Delivered: August 6, 2014
Systems p6 Final Presentation
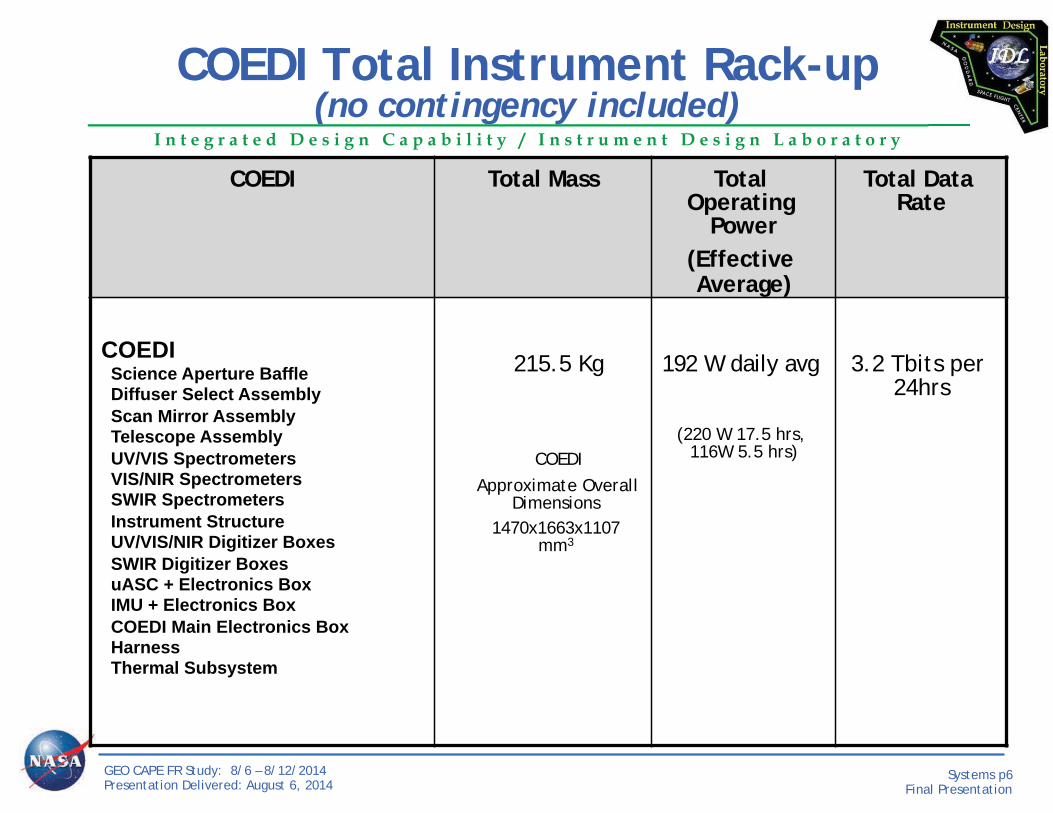
COEDI Total Instrument Rack-up (no contingency included)
COEDI Total Mass Total Operating
Power (Effective Average)
Total Data Rate
COEDI Science Aperture Baffle Diffuser Select Assembly Scan Mirror Assembly Telescope Assembly UV/VIS Spectrometers VIS/NIR Spectrometers SWIR Spectrometers Instrument Structure UV/VIS/NIR Digitizer Boxes SWIR Digitizer Boxes uASC + Electronics Box IMU + Electronics Box COEDI Main Electronics Box Harness Thermal Subsystem
215.5 Kg
COEDI Approximate Overall
Dimensions 1470x1663x1107
mm3
192 W daily avg
(220 W 17.5 hrs, 116W 5.5 hrs)
3.2 Tbits per 24hrs

I n t e g r a t e d D e s i g n C a p a b i l i t y / I n s t r u m e n t D e s i g n L a b o r a t o r y
GEO CAPE FR Study: 8/6 – 8/12/2014 Presentation Delivered: August 6, 2014
Systems p7 Final Presentation
FR Block Diagram
S/C Nadir Deck
Science Aperture Baffle
Diffuser Wheel
Star Tracker (2 heads)
Optical Bench
Roll Correction & Jitter Suppression System
Star Tracker Electronics Box
Detector Digitizer
Detector Radiator & Sun Shades
Electronics Radiators & Sun Shades (2) One north face, one south face
S/C
MEB
IMU Electronics Box
Nadir Direction
Diffuser Wheel Motor
Roll Camera External
Contamination Cover & Mechanism Scan Mirror
& Mechanism
Remaining optical
components shown in next slide
Primary Mirror (M1) Bearings (3) HAWAII-4RG Detector Array
N
Encoder
IMU
Dual Camera Heads
Purchased Components
Filter Wheels (10) and drive

I n t e g r a t e d D e s i g n C a p a b i l i t y / I n s t r u m e n t D e s i g n L a b o r a t o r y
GEO CAPE FR Study: 8/6 – 8/12/2014 Presentation Delivered: August 6, 2014
Systems p8 Final Presentation
Baseline Optical Design
M1
Detector Array
FSM (Fast Steering
Mirror)
M4
M3 Depolarizer Filters M2
Scan Mirror
Diffuser plate Aperture stop
M1
Detector Housing Window

I n t e g r a t e d D e s i g n C a p a b i l i t y / I n s t r u m e n t D e s i g n L a b o r a t o r y
GEO CAPE FR Study: 8/6 – 8/12/2014 Presentation Delivered: August 6, 2014
Systems p9 Final Presentation
Filter Radiometer Mechanical Configuration*
* Courtesy of the mechanical team

I n t e g r a t e d D e s i g n C a p a b i l i t y / I n s t r u m e n t D e s i g n L a b o r a t o r y
GEO CAPE FR Study: 8/6 – 8/12/2014 Presentation Delivered: August 6, 2014
Systems p12 Final Presentation
•Create a detailed instrument point design that meets the science objectives.
•Generate high fidelity cost estimates for various GEO-CAPE ocean color sensor capability trades to inform HQ and the GEO-CAPE team. – We need to generate credible bounds on instrument costs to
demonstrate to HQ that the mission is viable financially (as well as technologically).
– Trades address spatial resolution, spectral resolution, multi- vs hyperspectral and SWIR band capabilities
– A few optical design concepts will be examined to better constrain the costs for different instrument types (multi-spectral filter radiometer, hyper-spectral multi-slit and wide-angle spectrometers, etc.).
•July 21-29 IDL Study focused on the wide-angle spectrometer design.
•Aug. 6-12 IDL study will develop the multi-spectral filter radiometer.
IDL Study Objectives

I n t e g r a t e d D e s i g n C a p a b i l i t y / I n s t r u m e n t D e s i g n L a b o r a t o r y
GEO CAPE FR Study: 8/6 – 8/12/2014 Presentation Delivered: August 6, 2014
Systems p13 Final Presentation
• Class C Mission – Selective electronics redundancy if there is significant
improvement in reliability. None found. – Complete thermal subsystem redundancy.
• 3 year design life (5-yr goal) • Geostationary orbit at 95W
– 35,786km orbit; 0-degree inclination • Launch Dec. 2024 • Hosted payload on commercial satellite; nadir view deck location
(see information provided for COEDI – Aug. 2012 study) • Class B Electronics components • Assume host pointing performance
– We designed the instrument to meet the pointing and stability requirements without any additional expense to improve the spacecraft performance.
• Labor costs – assume out-of-house build • Select lower cost options where possible while maintaining
performance.
Study Parameters

I n t e g r a t e d D e s i g n C a p a b i l i t y / I n s t r u m e n t D e s i g n L a b o r a t o r y
GEO CAPE FR Study: 8/6 – 8/12/2014 Presentation Delivered: August 6, 2014
Systems p14 Final Presentation
GEO-CAPE Ocean Sensor Requirement
Filter Radiometer
Wide-Angle Spectrometer
Roll Instrument
Spatial GSD at Nadir O = 300 m 3 B = 250 m
D = 500 m 3 T = 375 m (IDL baseline) B = 250 m (TBD)
TBD
Spectral range1 T = 340-1050 nm
Multi-spectral2 16 or more bands
Hyper-spectral 1 band
SWIR Bands D = 1640 nm T = 1245, 1640 nm B = 1245, 1640, 2135nm
D = 1640 nm 1 (D), 2 (T) or 3 (B) bands 4
none
UV/Vis/NIR Spectral Sampling/Resolution
D = 10 nm
T = 2.5/5 nm 3 ; B = 0.4/0.8 nm; O = 2/5 nm, but 0.4/0.8 nm for 400-450nm 3
wide
T = Threshold requirements from STM (but not including the NO2 requirements) B = Baseline Requirements from STM (includes the NO2 requirements) O = Between Threshold and Baseline D = Descope 1 SNR >1000 for UV-Vis (at 10nm FWHM) – see table 2 Multispectral: ~MERIS bands plus 360, 385 & 1020 nm. SWIR additional. 3 Compute cost by scaling sensor and results from IDL study. 4 Track costs for additional SWIR bands within MEL without impacting instrument design.
Sensor Trade Space for GEO-CAPE IDL Studies
I n t e g r a t e d D e s i g n C a p a b i l i t y / I n s t r u m e n t D e s i g n L a b o r a t o r y
GEO CAPE FR Study: 8/6 – 8/12/2014 Presentation Delivered: August 6, 2014
Systems p15 Final Presentation
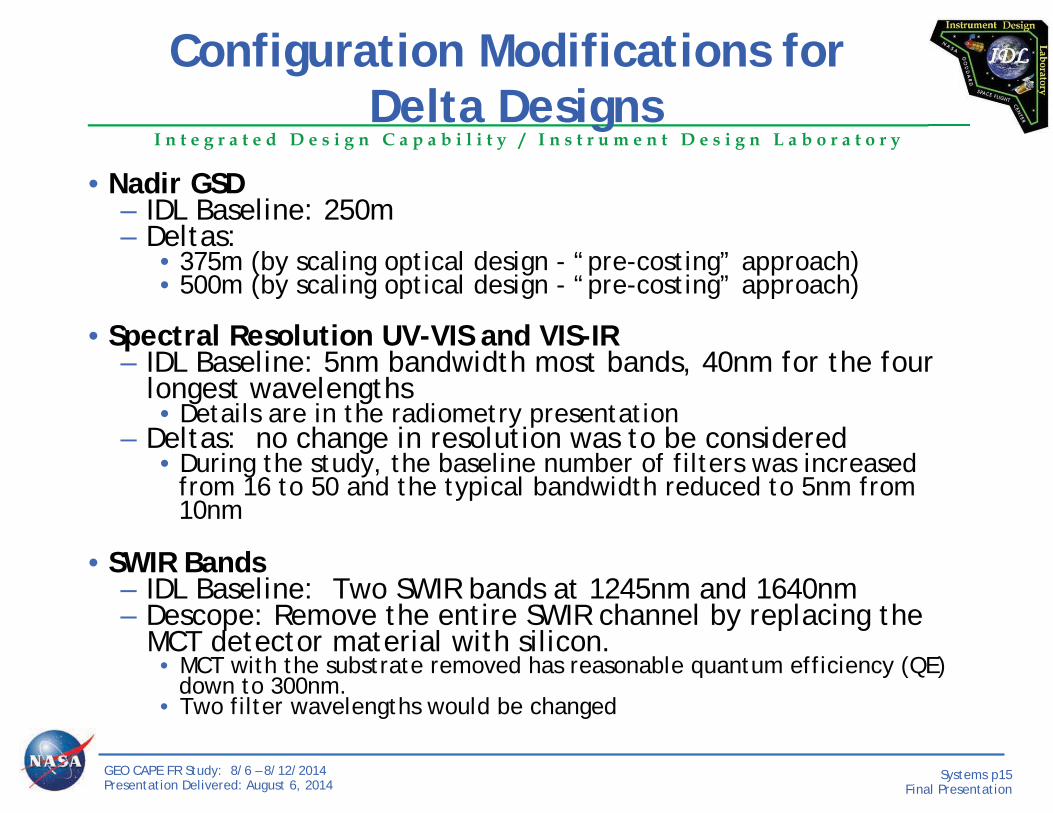
• Nadir GSD – IDL Baseline: 250m – Deltas:
• 375m (by scaling optical design - “pre-costing” approach) • 500m (by scaling optical design - “pre-costing” approach)
• Spectral Resolution UV-VIS and VIS-IR – IDL Baseline: 5nm bandwidth most bands, 40nm for the four
longest wavelengths • Details are in the radiometry presentation
– Deltas: no change in resolution was to be considered • During the study, the baseline number of filters was increased
from 16 to 50 and the typical bandwidth reduced to 5nm from 10nm
• SWIR Bands – IDL Baseline: Two SWIR bands at 1245nm and 1640nm – Descope: Remove the entire SWIR channel by replacing the
MCT detector material with silicon. • MCT with the substrate removed has reasonable quantum efficiency (QE)
down to 300nm. • Two filter wavelengths would be changed
Configuration Modifications for Delta Designs

I n t e g r a t e d D e s i g n C a p a b i l i t y / I n s t r u m e n t D e s i g n L a b o r a t o r y
GEO CAPE FR Study: 8/6 – 8/12/2014 Presentation Delivered: August 6, 2014
Systems p16 Final Presentation
• 2D camera for roll detection – Two applications
• Data to actuator (at S/C to instrument interface), which moves the entire instrument to correct for roll
• Provide information for geo-location reconstruction on the ground – Specifications
• Same # pixels as science instrument (2k) or preferably more • Higher spatial resolution than the science instrument (possibly by 10x) to
detect roll motion by viewing a coastline (contrast of bright land next to dark ocean).
• Detector read at ~100Hz
• Instrument IMU and 2 head star tracker for pointing knowledge.
• FSM (fast-steering mirror) to correct for jitter motion detected by the IMU (Inertial Measurement Unit).
Other Major Components

I n t e g r a t e d D e s i g n C a p a b i l i t y / I n s t r u m e n t D e s i g n L a b o r a t o r y
GEO CAPE FR Study: 8/6 – 8/12/2014 Presentation Delivered: August 6, 2014
Systems p17 Final Presentation
• Signal-to-Noise Ratio (SNR) at Ltyp (70˚ SZA) - see STM & SNR table – 1000:1 for 10 nm FWHM (350-800 nm) (Threshold) – Designed to Meet – Aggregate SWIR bands up to 2x2 GSD pixels to meet SNR (Threshold) - Meets – Aggregate NO2 bands up to 3x3 GSD pixels to meet 500:1 SNR (Threshold) not met with baseline
filter bandwidths • Scanning area per unit time:
– Baseline: 50,000 km2/min, this rate permits > 6 scans of U.S. coastal waters including Laurentian Great Lakes per day.
• Field of Regard: Full disk: 20.8° E-W and 19° N-S imaging capability from nadir for Lunar & Solar Calibrations – Meets by Design
• Non-saturating detector array(s) at Lmax – Meets by Design • On-board Calibration: Lunar - minimum monthly; Solar – daily - Meets • Polarization Sensitivity: Requirement <2%, goal <1.0% – Requires additional analysis,
including consultation with coating vendors, should be able to show Meets by Design • Relative Radiometric Precision: 1% through mission lifetime - Meets • Pointing Line-of-Site (LOS) Error (as a percentage of 1 nadir pixel) - Meets
– Measured by roll camera, closed loop control with actuators and combined with vibration suppression system
– Pointing Knowledge LOS: <50% Threshold & <10% of 1 nadir pixel Baseline – Pointing Accuracy LOS: <100% Threshold & <25% of 1 nadir pixel Baseline – Pointing Stability LOS: <50% Threshold & <10% of 1 nadir pixel Baseline – Geo-location Reconstruction: <100% Threshold & <10% of 1 nadir pixel Baseline
Performance Goals

I n t e g r a t e d D e s i g n C a p a b i l i t y / I n s t r u m e n t D e s i g n L a b o r a t o r y
GEO CAPE FR Study: 8/6 – 8/12/2014 Presentation Delivered: August 6, 2014
Systems p18 Final Presentation
Original Baseline SNR Requirements
o - nm - nm Req'd
Bands FWHM Ltyp Lmax SNRreq
Required Minimum Set of Multi-
Spectral Bands1 NOTES350 15 46.90 166.2 1,000360 10 45.40 175.6 1,000385 10 38.40 177.9 1,000412 10 49.50 281.1 1,000425^ 0.8 48.20 277.0 500443 10 45.00 271.3 1,000460 10 41.90 266.0 1,000475 10 38.20 261.3 1,000490 10 34.90 256.6 1,000510 10 29.00 250.3 1,000532 10 23.30 243.4 1,000555 10 18.50 224.9 1,000583 10 15.30 227.4 1,000617 10 12.20 216.7 1,000640 10 10.50 209.5 1,000655 10 9.57 204.7 1,000665 10 9.17 201.6 1,000678 10 8.66 197.5 1,000710 10 6.95 187.5 1,000748 10 5.60 175.5 600765 40 5.25 170.2 600820 15 3.93 152.9 600865 40 2.77 138.8 6001020 40 1.48 109.1 4501245* 20 0.582 56.10 2501640* 40 0.178 19.70 1802135* 50 0.040 5.35 100
(SZA = 70 )
W/m2- um-ster

I n t e g r a t e d D e s i g n C a p a b i l i t y / I n s t r u m e n t D e s i g n L a b o r a t o r y
GEO CAPE FR Study: 8/6 – 8/12/2014 Presentation Delivered: August 6, 2014
Systems p19 Final Presentation
• Calibration – Dark calibration - performed at start and end of the day – Solar and lunar calibrations as needed (daily to weekly solar; lunar
as frequently as lunar views permit) • Scan as needed to illuminate all detector pixels • Mechanisms: wheel with diffusers for solar calibrations
– Would like to keep costs of solar cal. capability within MEL distinct for possible de-scoping.
• Science – Step and Stare with scan mirror
• Continuous science scans of the Earth for ~16 hours/day • Scan U.S. coastal waters (500km wide scenes) every 1-3 hours. • Scan non-U.S. coastal and open ocean waters as time permits. • Integration time per iFOV depends on minimum Ltyp within iFOV (ranging
from 0.5 to >2 seconds). • Survey and Targeted modes (higher frequency sampling)
– The list of targets are predefined on the ground and uploaded to the instrument on a weekly basis. The load can be updated daily if needed to take into account cloud cover. For each target, ground uploads: Target starting location, Length of time to integrate at each step (stare), Length of time to integrate at each wavelength, Total length of time to observe the target.
• Repeat
Operational Concept

I n t e g r a t e d D e s i g n C a p a b i l i t y / I n s t r u m e n t D e s i g n L a b o r a t o r y
GEO CAPE FR Study: 8/6 – 8/12/2014 Presentation Delivered: August 6, 2014
Systems p20 Final Presentation
Instrument Modes
• Launch – Instrument Off, Survival Heaters On
• Standby/Safe - Enter this mode upon power up or a ground command – Diffuser Wheel is in the closed position and off; Scan Mirror and FSM are powered off – MEB, Star tracker, IRU, Roll Camera, Detectors and Digitizers are all left on to avoid
temperature cycling the electronics. – Operational temperatures are maintained; Housekeeping data collected. – Diagnostics and software updates are performed in this mode.
• Science – Survey and Targeted (high frequency sampling) – The same operation for both Survey and Targeted: step and Stare – Duration about 16 hours/day – The list of targets are predefined on the ground and uploaded to the instrument on a weekly
basis. The load can be updated daily if needed to take into account cloud issues. For each target, ground uploads: Target starting location, Length of time to integrate at each step (stare), Total length of time to observe the target
– Enter Science Mode by either ground or stored command. • Typically stored command since the start time will be in the weekly upload.
• Calibration – Cal-Dark – Performed regularly at the start and end of the day – Cal-Moon and Cal-Sun – as needed
• Commanded from the ground

I n t e g r a t e d D e s i g n C a p a b i l i t y / I n s t r u m e n t D e s i g n L a b o r a t o r y
GEO CAPE FR Study: 8/6 – 8/12/2014 Presentation Delivered: August 6, 2014
Systems p21 Final Presentation
Instrument Calibration
• Cal-Moon – Duration ~5 min; radiometric calibration, performed when moon in the FOR; 3-5
times per month; Scan North/South and East/West for averaging; Performed as needed; Observation sequence and integration time are commanded from the ground
• Cal-Sun – Duration ~20 min; performed when sun in the FOR (at night time); Initially
performed daily but less frequent (weekly) later on; Observation sequence and integration time are commanded from the ground
– Cal-Sun Types: • Standard Solar Diffuser used daily at first, then weekly. • Degradation Monitoring with second standard Solar Diffuser, done about once per month.
• Cal-Star Tracker – Duration ~20 min; Line-of-Sight (LOS) calibration to eliminate bias error; View
dark star field (no sunlight or moon); Continuous at low rate such as once per hour • Cal-Dark
– Duration ~5 to 30min; Dark counts for detectors; Performed during the night to maximize science data collection; Planned twice a day (at the start and end of the day)

I n t e g r a t e d D e s i g n C a p a b i l i t y / I n s t r u m e n t D e s i g n L a b o r a t o r y
GEO CAPE FR Study: 8/6 – 8/12/2014 Presentation Delivered: August 6, 2014
Systems p22 Final Presentation
Mission Operations Concept
Mode Function Frequency Duration Mechanism Configuration
Diffuser Wheel Mechanism
Scan Mirror Mechanism
FSM
Launch Closed, Off & Launch Locked
Off & Launch Locked
Off
Standby Health & Safety, FSW upload, Diagnostic, overnight
Daily ~7 Hours/day Closed; off Off Off
Science Survey & Targeted Daily 16 Hours/day Clear Move & Stare On
Cal – Moon Lunar radiometric cal When available, 3 to 5/Month ~5 min Clear Move &
Stare On
Cal – Sun Solar radiometric cal When available, Daily - Weekly ~5 min
Solar Diffuser or
Rare Earth Doped
Move & Stare On
Cal - Star Tracker
Calibrate instrument LOS wrt attitude hardware
Once per hour Continuously Any Move & Stare
On
Cal - Dark Measure detector dark current and bias 2 x Daily ~5 min Closed N/A N/A

I n t e g r a t e d D e s i g n C a p a b i l i t y / I n s t r u m e n t D e s i g n L a b o r a t o r y
GEO CAPE FR Study: 8/6 – 8/12/2014 Presentation Delivered: August 6, 2014
Systems p23 Final Presentation
Systems Presentation Part II

N A S A G O D D A R D S P A C E F L I G H T C E N T E R
I n t e g r a t e d D e s i g n C a p a b i l i t y / I n s t r u m e n t D e s i g n L a b o r a t o r y
GEO CAPE Filter Radiometer (FR) ~ Concept Presentations ~
Optics Mark Wilson/Code 551
Aug 12, 2014

I n t e g r a t e d D e s i g n C a p a b i l i t y / I n s t r u m e n t D e s i g n L a b o r a t o r y
GEO CAPE FR Study: 8/6 – 8/12/2014 Presentation Delivered: Aug 12, 2014
Optics, p2 Final Version
System Requirements
• Aperture = 250 mm diameter • Geosynchronous orbit (35786 km) • Wavelength range from 345 nm to 2155 nm • Ground footprint = 250 m diameter • The field of view will be imaged on a 4k x 4k detector array of
15um pixels. • Each ground pixel is spread over 2 x 2 detector pixels so the instantaneous field
of view (IFOV) is 2048 X 2048 ground pixels
• Scan mirror used for scanning Earth – Angular range of motion is +/-5.1 degrees along both axes
• Accommodate up to 50 optical filters

I n t e g r a t e d D e s i g n C a p a b i l i t y / I n s t r u m e n t D e s i g n L a b o r a t o r y
GEO CAPE FR Study: 8/6 – 8/12/2014 Presentation Delivered: Aug 12, 2014
Optics, p3 Final Version
Derived Optical Requirements
• Full field of view: 0.82 degree square • F/17 at focal plane • Image quality: 80% ensquared energy in a
science pixel throughout the field of view • Polarization sensitivity <2% (goal of 1%)
through entire wavelength range

I n t e g r a t e d D e s i g n C a p a b i l i t y / I n s t r u m e n t D e s i g n L a b o r a t o r y
GEO CAPE FR Study: 8/6 – 8/12/2014 Presentation Delivered: Aug 12, 2014
Optics, p4 Final Version
Baseline Optical Design
M1
Detector Array
FSM (Fast Steering
Mirror)
M4
M3 Depolarizer Filters M2
Scan Mirror
Diffuser plate Aperture stop
M1
Detector Housing Window

I n t e g r a t e d D e s i g n C a p a b i l i t y / I n s t r u m e n t D e s i g n L a b o r a t o r y
GEO CAPE FR Study: 8/6 – 8/12/2014 Presentation Delivered: Aug 12, 2014
Optics, p5 Final Version
Optical Element list

I n t e g r a t e d D e s i g n C a p a b i l i t y / I n s t r u m e n t D e s i g n L a b o r a t o r y
GEO CAPE FR Study: 8/6 – 8/12/2014 Presentation Delivered: Aug 12, 2014
Optics, p6 Final Version
Mass of optical elements
OPTICAL ELEMENT Material Mass (kg)Lightweighting factor
Scan Mirror ULE 3.637 50%
M1 ULE 1.265
M2 ULE 0.210
M3 ULE 0.096
M4 ULE 0.782
Fast Steering Mirror ULE 0.266
Filters (50) Fused Silica 3.318
Depolarizer Quartz 0.282
Window Sapphire 0.117Diffuser Plates (2) Fused Silica 4.253Roll Camera Lens 1 (2) BALKN3 0.369Roll Camera Lens 2 (2) F4 0.252Roll Camera Lens 3 (2) BK7 0.054Roll Camera Lens 4 (2) F2 0.140Roll Camera Lens 5 (2) F2 0.045Optical Filter (2) Fused Silica 0.175
15.086 TOTAL

I n t e g r a t e d D e s i g n C a p a b i l i t y / I n s t r u m e n t D e s i g n L a b o r a t o r y
GEO CAPE FR Study: 8/6 – 8/12/2014 Presentation Delivered: Aug 12, 2014
Optics, p7 Final Version
Optical Performance

I n t e g r a t e d D e s i g n C a p a b i l i t y / I n s t r u m e n t D e s i g n L a b o r a t o r y
GEO CAPE FR Study: 8/6 – 8/12/2014 Presentation Delivered: Aug 12, 2014
Optics, p8 Final Version
Optical Performance, cont’d
• Diffraction limits performance in SWIR channels

I n t e g r a t e d D e s i g n C a p a b i l i t y / I n s t r u m e n t D e s i g n L a b o r a t o r y
GEO CAPE FR Study: 8/6 – 8/12/2014 Presentation Delivered: Aug 12, 2014
Optics, p9 Final Version
Optical Transmission
•
•
•

I n t e g r a t e d D e s i g n C a p a b i l i t y / I n s t r u m e n t D e s i g n L a b o r a t o r y
GEO CAPE FR Study: 8/6 – 8/12/2014 Presentation Delivered: Aug 12, 2014
Optics, p10 Final Version
Optical Transmission, cont’d

I n t e g r a t e d D e s i g n C a p a b i l i t y / I n s t r u m e n t D e s i g n L a b o r a t o r y
GEO CAPE FR Study: 8/6 – 8/12/2014 Presentation Delivered: Aug 12, 2014
Optics, p11 Final Version
Fast Steering Mirror
• Image motion Sensitivity* = 1 arcsec/0.121 science pixels – Assumed rotation about center of front surface of FSM – Assumed no lightweighting of mirror
* For a 1 arcsec rotation of the FSM, the image moves by 0.121 science pixels

I n t e g r a t e d D e s i g n C a p a b i l i t y / I n s t r u m e n t D e s i g n L a b o r a t o r y
GEO CAPE FR Study: 8/6 – 8/12/2014 Presentation Delivered: Aug 12, 2014
Optics, p12 Final Version
Roll Camera
• Focal length designed to image ground spot onto 5.5 micrometer detector pixel: EFL = 400 mm
• Scaled from WAS design by 400/525 = 0.762 • Current entrance pupil diameter = 82 mm (no
radiometric analysis done for roll camera) • Standard Schott glasses used

I n t e g r a t e d D e s i g n C a p a b i l i t y / I n s t r u m e n t D e s i g n L a b o r a t o r y
GEO CAPE FR Study: 8/6 – 8/12/2014 Presentation Delivered: Aug 12, 2014
Optics, p13 Final Version
Comments/Concerns
• Image quality specification (80% EE in 1 science pixel) is challenging – Corner of the field of view is driver (current design leaves very little margin for fabrication
and alignment errors)
• Mirror fabrication will be expensive but within current fabrication limits • 5 nm bandpass filters are achievable but somewhat more expensive than many
filters; sharpness of cutoff is primary cost driver. • Primary contributor to polarization sensitivity is scan mirror
– Coating design optimized for 45 deg angle of incidence and transmissive depolarizer should reduce the impact but requires additional analysis, including consultation with coating vendor
• Other optical designs with smaller filter sizes may be possible • Still working baffle layout
• Current mirror coating being recommended is not flight qualified yet – ORCA is planning radiation test but risk is it may not happen – Using Kepler silver coating will reduce throughput in 350 band to ~5%
• For Roll camera, modifications are still needed – need to reduce entrance pupil size (82 mm to 50 mm) (KEEP SAME FOCAL LENGTH)
• Keeps overall length the same but uses smaller optics
– Need to include bandpass filter – Rad hard glass materials needed

I n t e g r a t e d D e s i g n C a p a b i l i t y / I n s t r u m e n t D e s i g n L a b o r a t o r y
GEO CAPE FR Study: 8/6 – 8/12/2014 Presentation Delivered: Aug 12, 2014
Optics, p14 Final Version
Increasing ensquared energy in 1 pixel
• To improve ensquared energy to 90% in 1 science pixel, – Change f/number to ~f/9
• For the same aperture size (250 mm), the focal length needs to change to 2100 mm – ground spot diameter = 475 m
• For the same (current) optical system focal length, the diameter needs to change to 477 mm • Airy diameter = 0.63 science pixels (84% EE) • Going from 85% to 90% = 0.33 pixels (ADDITIVE to Airy diameter) • Design/Fabrication/Alignment errors = 0.2 science pixels (RSS’d with other contributions)
– Modify optical surface shapes to achieve diffraction limit

N A S A G O D D A R D S P A C E F L I G H T C E N T E R
I n t e g r a t e d D e s i g n C a p a b i l i t y / I n s t r u m e n t D e s i g n L a b o r a t o r y
GEO CAPE Filter Radiometer (FR) ~ Concept Presentations ~
Mechanical Systems Mike Clark
Bobby Nanan Liz Matson
Aug 12, 2014

I n t e g r a t e d D e s i g n C a p a b i l i t y / I n s t r u m e n t D e s i g n L a b o r a t o r y
GEO CAPE FR Study: 8/6 – 8/12/2014 Presentation Delivered: Aug 12, 2014
Mechanical, p2 Final Version
Requirements
• Package instrument components including optical, electrical, and thermal, and mechanisms.
• Minimize mass and volume • Demonstrate compatibility with “Engineering Allocations” (i.e. volume
and mass)
I n t e g r a t e d D e s i g n C a p a b i l i t y / I n s t r u m e n t D e s i g n L a b o r a t o r y
GEO CAPE FR Study: 8/6 – 8/12/2014 Presentation Delivered: Aug 12, 2014
Mechanical, p3 Final Version
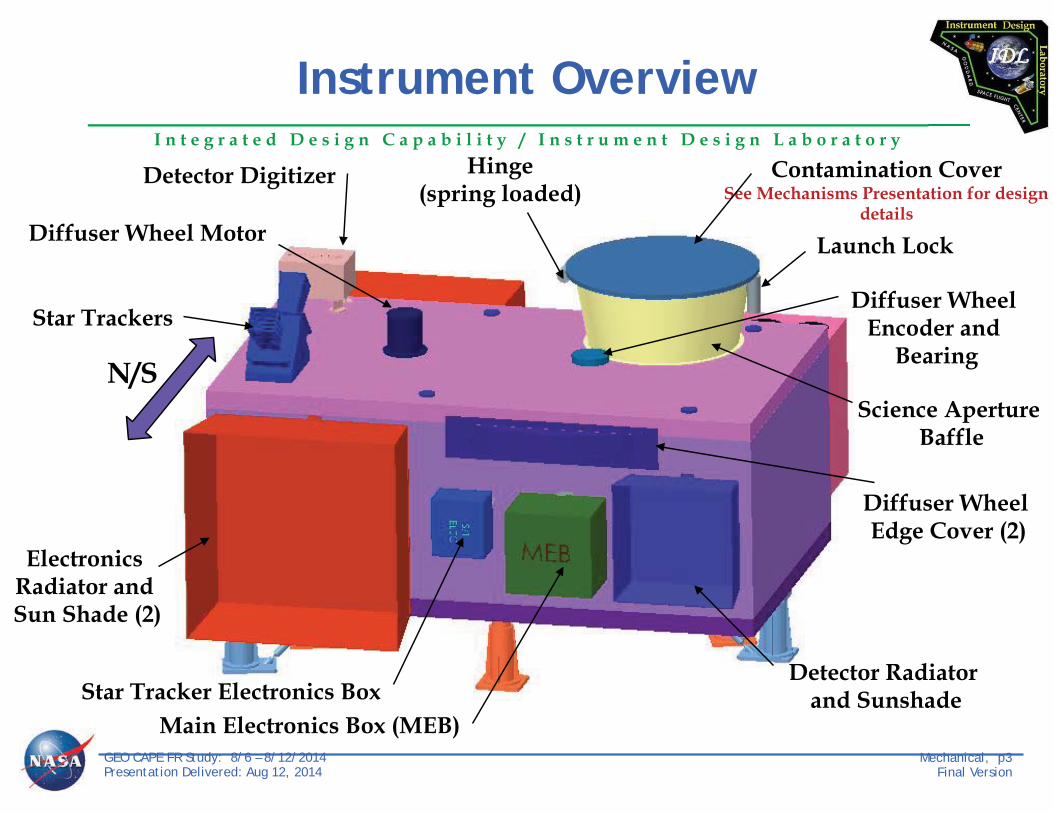
Instrument Overview
Contamination Cover See Mechanisms Presentation for design
details
Launch Lock
Hinge (spring loaded)
Detector Digitizer
Diffuser Wheel Motor
Star Trackers
Electronics Radiator and Sun Shade (2)
Star Tracker Electronics Box Main Electronics Box (MEB)
Detector Radiator and Sunshade
Diffuser Wheel Encoder and
Bearing
Science Aperture Baffle
Diffuser Wheel Edge Cover (2)
N/S

I n t e g r a t e d D e s i g n C a p a b i l i t y / I n s t r u m e n t D e s i g n L a b o r a t o r y
GEO CAPE FR Study: 8/6 – 8/12/2014 Presentation Delivered: Aug 12, 2014
Mechanical, p4 Final Version
Instrument Overview
Roll Camera
IMU Electronics Box
IMU
Electronics Radiator and Sun Shade (2)
N/S

I n t e g r a t e d D e s i g n C a p a b i l i t y / I n s t r u m e n t D e s i g n L a b o r a t o r y
GEO CAPE FR Study: 8/6 – 8/12/2014 Presentation Delivered: Aug 12, 2014
Mechanical, p5 Final Version
Diffuser Wheel
Diffuser Wheel 25 mm Alum Core 1.5 mm Alum f/s
Diffuser 1
Diffuser 2
Gear Teeth and V-groove (on periphery of wheel)
Bearings (4)
See Mechanisms Presentation for design details
Motor

I n t e g r a t e d D e s i g n C a p a b i l i t y / I n s t r u m e n t D e s i g n L a b o r a t o r y
GEO CAPE FR Study: 8/6 – 8/12/2014 Presentation Delivered: Aug 12, 2014
Mechanical, p6 Final Version
S/C Interface – Roll Compensation and Jitter Suppression System
Voice Coil Actuator (in plane)
(2)
Voice Coil Actuator (normal)
(2)
Launch Lock (3)
Flexure (3)
S/C Interface (6)
Note: Flexures would be oriented so that the line of action is through
the c.g. of the instrument
See Mechanisms Presentation for design details

I n t e g r a t e d D e s i g n C a p a b i l i t y / I n s t r u m e n t D e s i g n L a b o r a t o r y
GEO CAPE FR Study: 8/6 – 8/12/2014 Presentation Delivered: Aug 12, 2014
Mechanical, p7 Final Version
S/C Interface – Roll Compensation and Jitter Suppression System
Voice Coil Actuator (in plane)
(2)
Voice Coil Actuator (normal)
(2)
Launch Lock (3)
Flexure (3)
Note: Flexures would be oriented so that the line of action is through the c.g. of
the instrument
See Mechanisms Presentation for design details
I n t e g r a t e d D e s i g n C a p a b i l i t y / I n s t r u m e n t D e s i g n L a b o r a t o r y
GEO CAPE FR Study: 8/6 – 8/12/2014 Presentation Delivered: Aug 12, 2014
Mechanical, p8 Final Version
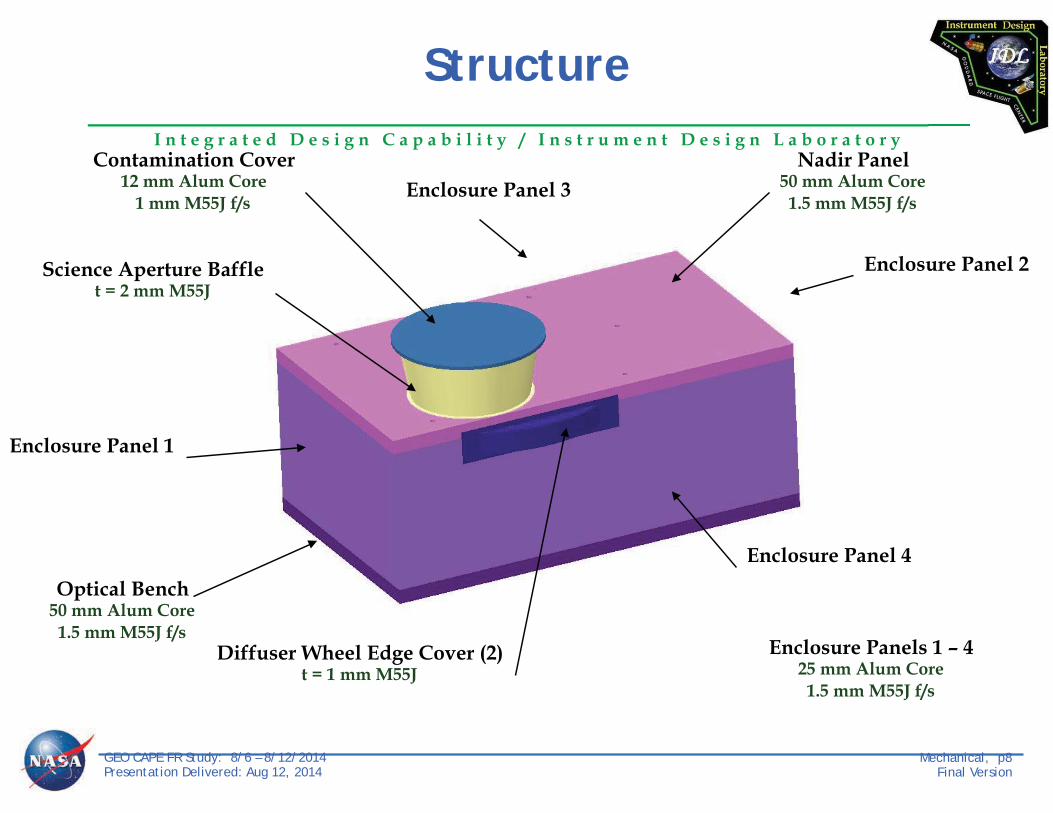
Structure
Contamination Cover 12 mm Alum Core
1 mm M55J f/s
Science Aperture Baffle t = 2 mm M55J
Enclosure Panel 1
Optical Bench 50 mm Alum Core 1.5 mm M55J f/s
Diffuser Wheel Edge Cover (2) t = 1 mm M55J
Enclosure Panels 1 – 4 25 mm Alum Core 1.5 mm M55J f/s
Enclosure Panel 4
Enclosure Panel 2
Enclosure Panel 3 Nadir Panel
50 mm Alum Core 1.5 mm M55J f/s

I n t e g r a t e d D e s i g n C a p a b i l i t y / I n s t r u m e n t D e s i g n L a b o r a t o r y
GEO CAPE FR Study: 8/6 – 8/12/2014 Presentation Delivered: Aug 12, 2014
Mechanical, p9 Final Version
Optical Assembly
Scan Mirror M1
M2
Filter Wheel
Assembly
Depolarizer M3
M4
Fold Flat 1 (FSM)
Detector (not shown here)
Optical Bench
Aperture Stop

I n t e g r a t e d D e s i g n C a p a b i l i t y / I n s t r u m e n t D e s i g n L a b o r a t o r y
GEO CAPE FR Study: 8/6 – 8/12/2014 Presentation Delivered: Aug 12, 2014
Mechanical, p10 Final Version
Optical Assembly
Scan Mirror
Detector
Fold Flat 1 (FSM)
M4
M3 Depolarizer Filter Wheel Assembly
M2
M1
Aperture Stop

I n t e g r a t e d D e s i g n C a p a b i l i t y / I n s t r u m e n t D e s i g n L a b o r a t o r y
GEO CAPE FR Study: 8/6 – 8/12/2014 Presentation Delivered: Aug 12, 2014
Mechanical, p11 Final Version
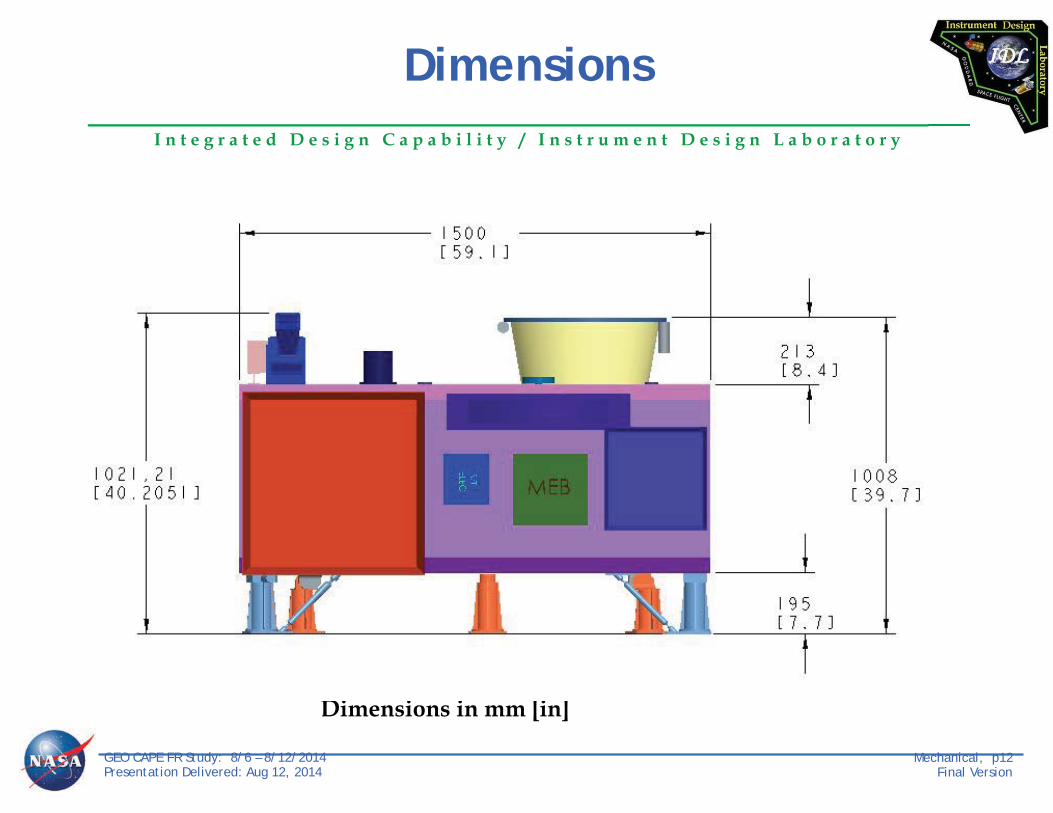
Dimensions
Dimensions in mm [in]
N/S
I n t e g r a t e d D e s i g n C a p a b i l i t y / I n s t r u m e n t D e s i g n L a b o r a t o r y
GEO CAPE FR Study: 8/6 – 8/12/2014 Presentation Delivered: Aug 12, 2014
Mechanical, p12 Final Version
Dimensions
Dimensions in mm [in]

I n t e g r a t e d D e s i g n C a p a b i l i t y / I n s t r u m e n t D e s i g n L a b o r a t o r y
GEO CAPE FR Study: 8/6 – 8/12/2014 Presentation Delivered: Aug 12, 2014
Mechanical, p13 Final Version
Engineering Allocations – Response 2
“Response 2” Volume & Mass Allocation (E/W) X = 630 mm (N/S) Y = 1010 mm (Zenith) Z = 1650 mm
150 kg
X
Z
Y

I n t e g r a t e d D e s i g n C a p a b i l i t y / I n s t r u m e n t D e s i g n L a b o r a t o r y
GEO CAPE FR Study: 8/6 – 8/12/2014 Presentation Delivered: Aug 12, 2014
Mechanical, p14 Final Version
Engineering Allocation – Response 4
“Response 4” Volume & Mass Allocation (E/W) X = 1800 mm (N/S) Y = 1500 mm (Zenith) Z = 1800 mm
300 kg
Y
Z

I n t e g r a t e d D e s i g n C a p a b i l i t y / I n s t r u m e n t D e s i g n L a b o r a t o r y
GEO CAPE FR Study: 8/6 – 8/12/2014 Presentation Delivered: Aug 12, 2014
Mechanical, p15 Final Version
Engineering Allocation – Response 5
“Response 5” Volume & Mass Allocation (E/W) X = 2000 mm (N/S) Y = 2000 mm (Zenith) Z = 2000 mm
250 kg
X Y
Z

I n t e g r a t e d D e s i g n C a p a b i l i t y / I n s t r u m e n t D e s i g n L a b o r a t o r y
GEO CAPE FR Study: 8/6 – 8/12/2014 Presentation Delivered: Aug 12, 2014
Mechanical, p16 Final Version
Engineering Allocation – Response 6
“Response 6” Volume & Mass Allocation (E/W) X = 1000 mm (N/S) Y = 1000 mm (Zenith) Z = 1000 mm
1500 kg
X
Y
Z

I n t e g r a t e d D e s i g n C a p a b i l i t y / I n s t r u m e n t D e s i g n L a b o r a t o r y
GEO CAPE FR Study: 8/6 – 8/12/2014 Presentation Delivered: Aug 12, 2014
Mechanical, p17 Final Version
Adam!!

I n t e g r a t e d D e s i g n C a p a b i l i t y / I n s t r u m e n t D e s i g n L a b o r a t o r y
GEO CAPE FR Study: 8/6 – 8/12/2014 Presentation Delivered: Aug 12, 2014
Mechanical, p18 Final Version
Conclusions
• There are no technology risks associated with the mechanical or structural design(i.e. standard materials as well as fabrication and assembly techniques for primary and secondary structure).
• The detector digitizer box is mounted on the outside of the instrument enclosure,approximately 10 inches from the detector.
• The instrument fits within the volume envelope for Engineering AllocationResponses 4 and 5. Mass requirements are 300 kg for Response 4 and 250 kg for Response 5.
• Stray Light Baffles are not represented in the CAD model but are accounted for inthe MEL.
• The mounts for the Filter Wheel Assembly as represented in the CAD model arelikely under designed. The mass in the MEL represents a more robust design for this mount that we feel is prudent.
• Thermal analysis completed late in the study week determined that the Detectorradiator sunshade needed to be in the same plane as the Electronics radiator sunshade. This “standoff mount” is not represented in the CAD model but is included in the MEL.
• The Hosted Payload frequency requirements of 65 Hz lateral and 90 Hzlongitudinal will likely be a challenge for an instrument of this size and mass.
– Early discussions with the S/C provider will likely be necessary to negotiate thoserequirements.

N A S A G O D D A R D S P A C E F L I G H T C E N T E R
I n t e g r a t e d D e s i g n C a p a b i l i t y / I n s t r u m e n t D e s i g n L a b o r a t o r y
GEO CAPE Filter Radiometer (FR)
~ Mechanisms Presentation ~ Dick McBirney Aug 12, 2014

I n t e g r a t e d D e s i g n C a p a b i l i t y / I n s t r u m e n t D e s i g n L a b o r a t o r y
GEO CAPE FR Study: 8/6 – 12/2014 Presentation Delivered: 8/12/2014
Mechanisms, p2 Final Version
There are five mechanisms in GeoCape 2 FR
These are hyperlinks to each mechanism in this file, but it may not be worth the trouble to use them Me1: Diffuser Wheel Me2: Scan Mirror Me3: Fast Steering Mirror Me4: Jitter Suppression/Roll Correction System Me5: Contamination Door Me6: Filter Wheel Assembly

I n t e g r a t e d D e s i g n C a p a b i l i t y / I n s t r u m e n t D e s i g n L a b o r a t o r y
GEO CAPE FR Study: 8/6 – 12/2014 Presentation Delivered: 8/12/2014
Mechanisms, p3 Final Version
Mechanisms in the optical path
• Locations of mechanismswithin the optical path:

I n t e g r a t e d D e s i g n C a p a b i l i t y / I n s t r u m e n t D e s i g n L a b o r a t o r y
GEO CAPE FR Study: 8/6 – 12/2014 Presentation Delivered: 8/12/2014
Mechanisms, p4 Final Version
Me1: Diffuser Wheel Mechanism (“DWM”)
Me2: Scan Mirror Mechanism (“SMM”)
Me3: Fast Steering Mirror (“FSM”)
Me4: Jitter Suppression/Roll Correction System
(“JSS”) Me5: Contamination Door Me6 Filter Wheel Assembly
Inertial Load
2X 350 mm diffusers (2.1 kg ea), one open position and 1 closed;
MOI = ??
480mm x 280mm Scan Mirror, 2.6 kg
Maximum MOI .082* kg-m2 (*w/motor & encoder)
120 mm Flat MOI = TBD MOI = [Entire Instrument]
Door diameter 706mm (27.8”) MOI TBD
5X 80mm filters (66 gm ea), and one “open” position in each of 10 wheels; Est. MOI = 167 Kg-cm2
Stroke 360° rotation in 90° steps
+/- 5.1° tip/tilt at mirror (for science and solar cal views)
+/- 0.25 deg tip/tilt 270° rotation 360° rotation in 60° steps
for each wheel
Position Accuracy : Goal / Achieved
±0.5° / ±0.3° w/10 bit encoder
0.1 arcsec / 0.08 arcsec w/24 bit encoder <0.1 arcsec / TBD 0.1 arcsec ±5° in open position ±0.5° / ±0.3° w/10 bit
encoder
Duty Cycle <5% 0.16%;
Step in 0.160 sec, stare as 50 filters are indexed
100% 100% <5% ~10%; index in 0.2 sec, stare for ~2 sec
Bandwidth Goal / Achieved
low “fast!” / (step 0.4° in 160 millisec)
High enough to cancel transmitted
S/C jitter
Passive: As low as possible
/Notional 1.7 Hz Active: >1.7 Hz/set by
rate sensor sample rate
One time deploy Fast motion is desired
GEO CAPE FR Mechanisms Table 1/2
Red font To be confirmed

I n t e g r a t e d D e s i g n C a p a b i l i t y / I n s t r u m e n t D e s i g n L a b o r a t o r y
GEO CAPE FR Study: 8/6 – 12/2014 Presentation Delivered: 8/12/2014
Mechanisms, p5 Final Version
GEO CAPE FR Mechanisms Table 2/2
Me1: Diffuser Wheel Mechanism (“DWM”)
Me2: Scan Mirror Mechanism (“SMM”)
Me3: Fast Steering Mirror (“FSM”)
Me4: Jitter Suppression/Roll Correction System
(“JSS”) Me5: Contamination Door Me6 Filter Wheel Assembly
Motion required /Achieved
Diffusers used during solar calibration. Select between 4 positions 90° apart. Select time <30 seconds
“fast!” / 1 arcsec step in 4ms, settle in 2ms, on both axes
Jitter rejection to stabilize Beam on slit; High bandwidth Control
1) Low pass attenuation:angular motion decreases by -40db/decade above angular resonance frequency 2) Active damping:depends on closed loop performance
One time motion on command
Used during science data. Select between 50 filters on 10 wheels. Select time as fast as possible / 0.2 sec per filter
Launch Lock
No; “V” bearings on periphery and bearing on central shaft absorb
launch loads
No, balanced mirror: 1.89kg No, with light mass balanced mirror
Yes, three TiNi Frangibolts to lock 3DOF
suspension Yes, redundant HOP Latch
No, “V” bearings on periphery and axial bearing
on central shaft absorb launch loads
Architecture 4 position, filter wheel-like device driven with stepper motor/gear
2 axis gimbal with limited range Torque Motors & 24 bit encoders
Traditional FSM; quad voice coils (BEI) with LVDTs (Kavlico)
Triple flexure tripod mount with three voice coil actuators controlled by rate sensors and roll
camera
HOP Latch release, kickoff springs set deploy rate,
torsion springs sustain rate and hold in open position
Ten 6-position wheels rotated through central female spline with stepper motor A
Comments Should be balanced by placing heavy diffusers at 180°
Balanced mirror may not need launch locks
May not be required if SMM is fast enough and JSS is soft enough
Flexures remove high freq jitter; actuators remove low frequency
jitter and roll angle error
Torsion springs hold Door in open position (no jettison, and no flopping during S/C
maneuvers)
1 of 10 wheels selected by axial motion of male spline driven by stepper motor B
Red font To be confirmed

I n t e g r a t e d D e s i g n C a p a b i l i t y / I n s t r u m e n t D e s i g n L a b o r a t o r y
GEO CAPE FR Study: 8/6 – 12/2014 Presentation Delivered: 8/12/2014
Mechanisms, p6 Final Version
Me1: Diffuser Wheel Mechanism DWM 1/3
• Primary Requirements:– Wheel contains: four positions: 2 Diffusers, one open position, one closed position– Motion: rotate diffuser wheel to one of 4 positions at 90°– 90°Step time: <30 seconds– Position accuracy: ±0.5°– Diffuser size: 350mm x 10mm thick– Diffuser mass: 2.1 kg each, total of 4.2 kg; bending frequency = 887 Hz
• Derived Requirements:– Diffuser wheel diameter: 971mm (38”)– Balance: diffusers should be positioned diametrically opposite at 180° to roughly balance the wheel– Launch locks: not required; three wheel rim guide bearings and one center bearing absorb launch
loads
• Power Consumption:– Given the mass MOI value of the wheel and the required indexing time, a power estimate could be
created. Lacking those values, but impressed by the wheel size and probable friction torque to be overcome, the estimated power is 20 watts while indexing.
4.2 Diffuser Massdiadiff 350mm:= thickdiff 10mm:= fusedSi 2.2 gm
cm3
massdiff 4diadiff
2• thickdiff• fusedSi•:= massdiff 2.117kg=
4.3 Diffuser resonant frequency
Efused_silica 71.7GPa:= fused_silica 0.17:= GPa 109Pa•
DDEfused_silica thickdiff
3•
12 1 fused_silica2
•
:=
n210.21
2 •diadiff
2
2
•
DD
fusedSi thickdiff••:=
n2 887.351Hz=

I n t e g r a t e d D e s i g n C a p a b i l i t y / I n s t r u m e n t D e s i g n L a b o r a t o r y
GEO CAPE FR Study: 8/6 – 12/2014 Presentation Delivered: 8/12/2014
Mechanisms, p7 Final Version
Me1: Diffuser Wheel Mechanism 2/3
• Proposed design:– 971mm (38”) Wheel supported by four*
peripheral guide bearings and one central bearing for axial support.
– Two solar diffusers made of fused silica placedsymmetrically for balance.
– Stepper motor/gearbox drive a Delrin piniongear that meshes with gear teeth on periphery of wheel (see next slide).
– 10 bit digital rotary position encoder attachedto central shaft for position feedback. (360°/2^10=21arcmin) (see next slide).
2X 350mm x 10mm thick diffusers (2.1 kg ea), one “open” position and 1 cover
4.2 Diffuser Massdiadiff 350mm:= thickdiff 10mm:= fusedSi 2.2 gm
cm3
massdiff 4diadiff
2• thickdiff• fusedSi•:= massdiff 2.117kg=
(*three at 120°are ideal, but the housing is too narrow)
I n t e g r a t e d D e s i g n C a p a b i l i t y / I n s t r u m e n t D e s i g n L a b o r a t o r y
GEO CAPE FR Study: 8/6 – 12/2014 Presentation Delivered: 8/12/2014
Mechanisms, p8 Final Version
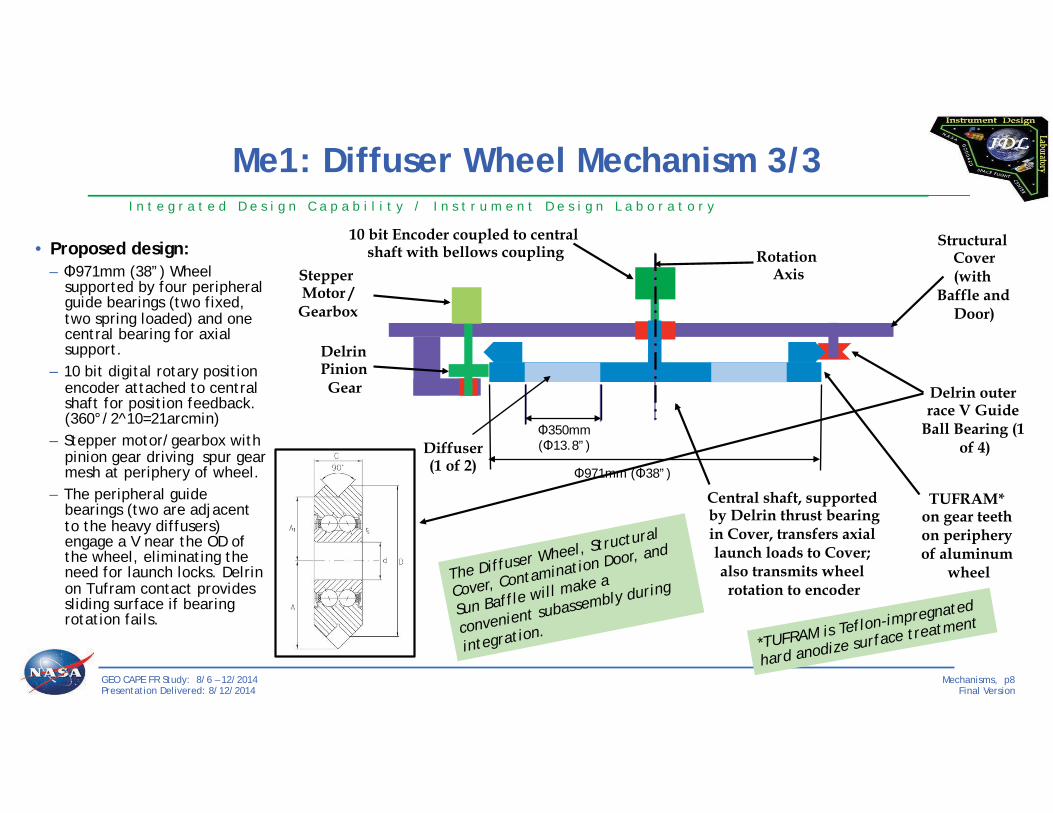
Me1: Diffuser Wheel Mechanism 3/3
• Proposed design:– 971mm (38”) Wheel
supported by four peripheral guide bearings (two fixed, two spring loaded) and one central bearing for axial support.
– 10 bit digital rotary positionencoder attached to central shaft for position feedback. (360°/2^10=21arcmin)
– Stepper motor/gearbox withpinion gear driving spur gear mesh at periphery of wheel.
– The peripheral guidebearings (two are adjacent to the heavy diffusers) engage a V near the OD of the wheel, eliminating the need for launch locks. Delrin on Tufram contact provides sliding surface if bearing rotation fails.
Stepper Motor /
Gearbox
Delrin outer race V Guide
Ball Bearing (1 of 4)
TUFRAM* on gear teeth on periphery of aluminum
wheel
10 bit Encoder coupled to central shaft with bellows coupling
350mm ( 13.8”)
971mm ( 38”)
Structural Cover (with
Baffle and Door)
Diffuser (1 of 2)
Rotation Axis
Central shaft, supported by Delrin thrust bearing in Cover, transfers axial launch loads to Cover; also transmits wheel
rotation to encoder
Delrin Pinion Gear
The Diffuser Wheel, Structural
Cover, Contamination Door, and
Sun Baffle will make a
convenient subassembly during
integration. *TUFRAM is Teflon-impregnated
hard anodize surface treatment

I n t e g r a t e d D e s i g n C a p a b i l i t y / I n s t r u m e n t D e s i g n L a b o r a t o r y
GEO CAPE FR Study: 8/6 – 12/2014 Presentation Delivered: 8/12/2014
Mechanisms, p9 Final Version
Me2: Scan Mirror Mechanism SMM 1/8
• Primary requirements:– Motion: Two axis tip/tilt of scan mirror, scanned in 0.4° steps.– Mirror travel range: ±5.1° on each axis.– Position knowledge accuracy: 0.1 arcsec (1/224 rev).– Beam dimensions at Scan Mirror: 250mm (9.8”) at 45° incidence.– Scan Mirror size and mass: oval 330mm x 500mm x 25.4 mm, est.
at 50% lightweight. – Slew Dynamics: slew 10° on both axes in TBD sec.
• Derived parameters:– Scan Mirror
• Mass: 3.64kg• MOI: 0.025 kg-m2 and 0.103* kg-m2 (*motor and encoder added to this
axis) – Scan Dynamics:
• Move Scan Mirror 0.4° in 0.16 sec, then hold for (50 x 2 sec =) 100 sectotal stare time + (0.2 sec x 50 =) 10 sec total filter index time, then repeat every 110.16 sec.
360deg
224:= 0.077arcsec=
MOIbSM_with_MotorEnc 0.103kgm2=MOIbSM_with_MotorEnc MOIbSM 2 MOImotor•+:=
Assume encoder MOI = motor MOI
MOImotor 0.023kgm2=MOImotor massmotor bSM
2•:=massmotor 13oz:=
MOIbSM 0.057kgm2=MOIbSM massSM
bSM( )2
4
thicknessSM( )2
12+•:=
MOIaSM 0.02495kgm2=MOIaSM massSM
aSM( )2
4
thicknessSM( )2
12+•:=
1.1.2 Estimated Mirror Mass MOI
Flaunch 360.842lbf=Flaunch 15g massSM• 3•:=1.1.1 Estimated Launch Load
massSM 3.637kg=massSM LF ULE• • aSM• bSM• thicknessSM•:=
thicknessSM 25.4mm:=
LF 50%:=a and b are half the principal axes
bSM5002
mm:=aSM3302
mm:=ULE 2.21 gm
cm3:=
l ightweighting factor
ULE glass 1arcsec 4.848microrad=Scan Mirror mass from dimensions, l ightweight factor and density
1arcsec 0.000278deg=1.1 Mass and MOI

I n t e g r a t e d D e s i g n C a p a b i l i t y / I n s t r u m e n t D e s i g n L a b o r a t o r y
GEO CAPE FR Study: 8/6 – 12/2014 Presentation Delivered: 8/12/2014
Mechanisms, p10 Final Version
Me2: Scan Mirror Mechanism 2/8
• Proposed design:• Light-weighted oval flat ULE glass mirror with integral stub shafts
mated to inner motor/encoder rotors and inner ball bearings. • Mirror mass: 3.64 kg.• Launch locks: may not be required.• Inner bearings mount in gimbal ring.
– (Flexpivot spring rates requires too much power to hold position)
• Gimbal ring has integral stub shafts mated to outer motor/encoderrotors and outer ball bearings.
• Motors are limited angle Torquers (Aeroflex)• Position sensors are 24 bit absolute encoders (Renishaw)
– Renishaw uses 1 nm resolution technology; 1 arcsec absolute accuracy isachieved in a 100mm diameter encoder – see slide 14
• Pitch axis motor/encoder should be adjacent so as to maximizetorsional resonant frequency and resultant pitch servo bandwidth (gimbal ring is too compliant).
• Yaw axis motor and encoder could be on opposite sides if mirrortorsional stiffness is high and does not overly reduce yaw servo bandwidth.
Rotation axes
Pitch axis
Yaw axis

I n t e g r a t e d D e s i g n C a p a b i l i t y / I n s t r u m e n t D e s i g n L a b o r a t o r y
GEO CAPE FR Study: 8/6 – 12/2014 Presentation Delivered: 8/12/2014
Mechanisms, p11 Final Version
Me2: SMM Ball Bearing Selection 3/8
• Two Barden SN541TA bearings are used per axis.• Each bearing will absorb 361/2=180 lbf launch
load
• This bearing has an OD of 1.5”, ID of 1.0625”, and a width of 0.250”• With an axial preload of 15 lbf, the bearing friction torque per axis is
estimated at 4.3N-mm (0.61 in-ozf) x 2 bearings = 6.8N-mm (1.23 in-ozf)
1.2 Scan Mirror Bearing Friction TorqueBearing Dimensions OD 1.5in:= ID 1.06in:=
friction coeff of ball bearing fb 0.002:=
axial bearing preload Faxial 15lbf:=
Tf fbOD ID+
2• Faxial•:= Tf 4.339N mm•= Tf 0.614in ozf•=
total ball bearing friction torque per axis
Ttotal_fric_torq 2 Tf•:= Ttotal_fric_torq 1.229in ozf•=
1.6 Scan Mirror Launch loadsAccellaunch 15g:= launch load g factor rms_factor 3:=
Launch_ForceSM massSM Accellaunch• rms_factor•:= Launch_ForceSM 361lbf=

I n t e g r a t e d D e s i g n C a p a b i l i t y / I n s t r u m e n t D e s i g n L a b o r a t o r y
GEO CAPE FR Study: 8/6 – 12/2014 Presentation Delivered: 8/12/2014
Mechanisms, p12 Final Version
Me2: SMM Torque Motor Selection 4/8
• We will use an Aeroflex model TQ25-25PA torque motor:– Mass: 0.37 kg (13 oz) – Size: 2.5” OD x 0.250“ ID(*) x 1.00“ w (*need custom design w/larger ID) – Torque gain: 27 in-ozf/amp– Max continuous torque: 25 in-ozf

I n t e g r a t e d D e s i g n C a p a b i l i t y / I n s t r u m e n t D e s i g n L a b o r a t o r y
GEO CAPE FR Study: 8/6 – 12/2014 Presentation Delivered: 8/12/2014
Mechanisms, p13 Final Version
Me2: SMM Torque Motor 5/8
• Limited Angle Torque Motor– No commutation– Very smooth torque curve (no torque ripple)
• torque gain variation with angle (Curve D) varies control loop gain with position; but this isnormally not a concern
– Low electrical time constant– Direct drive, no transmission issues– Redundant windings– Tends to be slightly larger than commutating equivalent– Has flight heritage
http://aeroflex.com/ams/motion/datasheets/motion-motors-lat.pdf

I n t e g r a t e d D e s i g n C a p a b i l i t y / I n s t r u m e n t D e s i g n L a b o r a t o r y
GEO CAPE FR Study: 8/6 – 12/2014 Presentation Delivered: 8/12/2014
Mechanisms, p14 Final Version
Me2: SMM Encoder 6/8
• in 1990, BEI presented a paper describing a 15” diameter, 24 bit encoder (this was the state of the art in 1990)• http://docs.jach.hawaii.edu/JCMT/a/019_encoders/07/BEI%20ITEK%20presentation%20of%2024%20bit%20encoder.pdf
• In 2014, Renishaw can achieve “32 bit resolution” at a rate of 1/40usec = 25KHz• http://www.renishaw.com/en/resolute-rotary-angle-absolute-encoder-options--10939• http://resources.renishaw.com/en/details/data-sheet-rexa-ultra-high-accuracy-absolute-angle-encoder--44234
1
40 10 6sec•
25000Hz=
360deg
2320.000302arcsec=

I n t e g r a t e d D e s i g n C a p a b i l i t y / I n s t r u m e n t D e s i g n L a b o r a t o r y
GEO CAPE FR Study: 8/6 – 12/2014 Presentation Delivered: 8/12/2014
Mechanisms, p15 Final Version
Me2: SMM Performance 7/8
• With the mirror MOI determined, the torque motor selected, and the bearing friction torque defined, we canestimate the performance:
– The motor/mirror/encoder is operated as a closed position loop, but performance can be estimated by assuming we:1. Accelerate the mirror for 80 millisec with +17 in-ozf torque2. Decelerate the mirror for 80 millisec with -17 in-ozf torque
• So the SMM can step 0.4° in 160 millisec• The power consumption during each step is 10.3 watts
Since the duty cycle is very low, the average power is low:
1.4 SMM Motor Power consumption
Rmotor 25.4ohm:= KT 27 in ozf•
A•:= Imotor
TIandFKT
:= Imotor 0.635A=
Powermotor Imotor2 Rmotor•:= Powermotor 10.253W=
Vmotor Imotor Rmotor•:= Vmotor 16.138V=
1.5 Duty Cycle and average powertimeavg_int_time 2.0sec:= Nfilter 50:=
duty_cycle2 thalf_step•
Nfilter timeavg_int_time•:= duty_cycle 0.16%=
Paverage Powermotor duty_cycle•:= Paverage 0.016W=
Tcontinuous 25in ozf•:=The motor can exert
TIandF 17.154in ozf•=TIandF torquebSM Ttotal_fric_torq+:=total inertial and friction motor torque reqd
torquebSM 15.926in ozf•=torquebSM 112.459N mm•=
torquebSM MOIbSM_with_MotorEnc SM•:=
2t2
•SM 62.5 deg
sec2=SM 2
st ep2
thalf_step( )2•:=
12• t2•thalf_step 0.08sec:=Assume time of half step acceleration
Assume a constant torque to move halfway, then constant negative torque to stop the motion
step 0.4deg:=After each stare, the SMM steps 0.4 deg2048 250• m2 36000• km
0.407deg=
1.3 Scan Mirror Performance

I n t e g r a t e d D e s i g n C a p a b i l i t y / I n s t r u m e n t D e s i g n L a b o r a t o r y
GEO CAPE FR Study: 8/6 – 12/2014 Presentation Delivered: 8/12/2014
Mechanisms, p16 Final Version
Me2: Scan Mirror Mechanism 8/8
• Excerpt from 2010 GeoCape Mechanisms presentation:• “Motion
– E-W DOF: step over 1.1 arc-sec and settle in <250 millisec, repeatonce per second”
• “Image Stability– Goal of 0.5 arc-sec (0.5 arc-sec on N-S DOF, 0.25 arc-sec on E-W
DOF)”
• “Scan Mirror mechanism is on the edge of what isachievable. A separate, intensive study should be performed to determine feasibility.”
• 2014 Technology is better:• An encoder resolution of 0.1 arcsec (24 bit resolution) was
the state of the art achieved by BEI in 1990 with a 15” diameter encoder, but Renishaw – and maybe others – can now achieve 30 bit resolution at that diameter.
BEI data from 1990

I n t e g r a t e d D e s i g n C a p a b i l i t y / I n s t r u m e n t D e s i g n L a b o r a t o r y
GEO CAPE FR Study: 8/6 – 12/2014 Presentation Delivered: 8/12/2014
Mechanisms, p17 Final Version
Me3: FSM (Fast Steering Mirror) 1/4
•Primary Requirements– Motion: Two axis tip/tilt of fold mirror.– Travel range: ±0.25° on each axis.– FSM mirror size: 172 mm x 140mm x 5mm flat, made of ULE.– Dynamics: bandwidth must be sufficient to reject angular
jitter imposed on GeoCape FR instrument from S/C.
•Derived Performance– FSM mirror mass: 266 grams– Bandwidth: the required bandwidth of the FSM should be
minimal; for example, if the passive instrument mount could achieve an angular resonant frequency of, say, 1 Hz, the required FSM bandwidth could be as low as 10 Hz, depending on the results of a detailed analysis of the jitter attenuation required by the instrument.
•Power Consumption– Power consumption is minimal: to remove a 50 Hz, ±0.1°
sinusoidal jitter requires 1.9 W average.
MOIbFSM 1304.37kgmm2=
MOIaFSM massFSMaFSM( )2
4
thickFSM( )2
12+•:= MOIaFSM 1968.51kgmm2
=
assume a sinusoidal motion of the FSM at a frequency "f" and a half amplitude of "Ao". the peak
angular acceleration is max
Ao 0.1deg:= f 50Hz:=
max 4 Ao•2
• f2•:= max 9.87 103 deg
s2=
so the max torque is Tmax MOIaFSM max•:= Tmax 3.001in lbf•=
so the max current is ImaxTmax
K _VCA:= Imax 0.421A=
the max peak power is Ppeak RVCA Imax2
•:= Ppeak 2.661W=
the average power for a sinusoid is PavgPpeak
2:= Pavg 1.882W=
2.1 power consumption of FSM Voice Coil Actuator (VCA)
torque gain of the VCA KT_VCA 2.85 lbfamp
:= coil resistance is RVCA 15ohm:=
radius of the VCA rVCA 2.5in:=
torque gain of the VCA K _VCA KT_VCA rVCA•:= K _VCA 7.125 in lbf•
amp=
Mass of the Fast Steering Mirror (FSM) is :
ULE 2.21 gm
cm3= aFSM 172mm:= bFSM 140mm:= thickFSM 5mm:=ULE
massFSM ULE aFSM• bFSM• thickFSM•:= massFSM 0.266kg=
MOI of the FSM is:
MOIbFSM massFSMbFSM( )2
4
thickFSM( )2
12+•:=

I n t e g r a t e d D e s i g n C a p a b i l i t y / I n s t r u m e n t D e s i g n L a b o r a t o r y
GEO CAPE FR Study: 8/6 – 12/2014 Presentation Delivered: 8/12/2014
Mechanisms, p18 Final Version
Me3: FSM 2/4
• Proposed design: traditional Fast Steering Mirror mechanism:– Flat mirror mounted on 2 Flexpivot bearings in gimbal ring;– Gimbal ring mounted on 2 Flexpivot bearings attached to base.– Four voice coil actuators attached to back of mirror;– Four position sensors attached to the back of the mirror. DITs are
shown, but LVDTs are recommended; see slide 45. – Using push/pull actuation minimizes the dynamic radial loads on the
bearings and gimbal ring. • Alternate design choices
1. The mirror could be supported by a center post with two flexuralcuts to provide tip/tilt motion; this would eliminate 4 Flexpivot bearings and would eliminate the flexural compliance of the gimbal ring.
2. Each pair of actuators and sensors could be aligned radially toeliminate crosstalk; the tradeoff is between (a) the reduced operating radius of the inner pair of components and (b) the complexity of extracting 2D on-axis angular position data from sensors that sense a combination of both tip and tilt motion.
“DIT” = Kaman Differential Impedance Transducer
“LVDT” = Kavlico Linear Variable Differential Transformer
This figure shows an FSM with a circular mirror from a previous study; except for the rectangular shape, the design for GEO CAPE FR would be similar.

I n t e g r a t e d D e s i g n C a p a b i l i t y / I n s t r u m e n t D e s i g n L a b o r a t o r y
GEO CAPE FR Study: 8/6 – 12/2014 Presentation Delivered: 8/12/2014
Mechanisms, p19 Final Version
Me3: Voice Coil Actuator 3/4
• Pairs of VCAs are used in push/pull mode totip and tilt the FSM
BEI
1.56” tall
1.5” dia
“VCA is shown partially disassembled to see the coil windings; in operation, the windings are always totally immersed in the magnetic field to ensure a linear current>force gain over the stroke of the actuator.”
Coil + Field Assembly 230 gm

I n t e g r a t e d D e s i g n C a p a b i l i t y / I n s t r u m e n t D e s i g n L a b o r a t o r y
GEO CAPE FR Study: 8/6 – 12/2014 Presentation Delivered: 8/12/2014
Mechanisms, p20 Final Version
Me3: LVDT 4/4
Pairs of LVDTs are used in differential mode to measure the angular tip/tilt deflection of the FSM. http://pre.kav.com.s3.amazonaws.com/downloads/Industrial%20LVDT.pdf
Photo is for illustration only; not to scale
Cross section of LVDT
FSM Mirror
Lower Flexure
LVDT Core Upper Flexure Rotation Axis

I n t e g r a t e d D e s i g n C a p a b i l i t y / I n s t r u m e n t D e s i g n L a b o r a t o r y
GEO CAPE FR Study: 8/6 – 12/2014 Presentation Delivered: 8/12/2014
Mechanisms, p21 Final Version
Me4: Jitter Suppression/Roll Correction System 1/9
• Primary Requirements:– Jitter rejection: GeoCape FR is attached to a geosynchronous communications spacecraft; these are known to have higher levels
of angular pointing jitter than optical instruments can accommodate. Therefore, GeoCape FR must attenuate the angular motion imposed on it by the host spacecraft.
• Discussion:– This high BW (bandwidth) angular jitter could be removed by active, high BW mirror servos, but a passive approach is
recommended: By angularly floating the instrument on flexures, the high BW jitter is removed passively, turning the high mass
MOI of the instrument to our advantage, leaving only low BW jitter to be removed actively. This approach eliminates the need for high BW sensors, actuators, and control loops.
• Proposed Design:1. Implement a flexible suspension between the GeoCape FR instrument and the S/C:
• Use three flexures whose action lines intersect at the CG of the instrument as shown in the following slides;– (The flexures will only transmit angular jitter motion to the instrument that is below the resonant frequency of the flexure stiffness/
instrument MOI) • Use three active, low stiffness, linear actuators (i.e., voice coil actuators) at the extremities of the instrument housing.• Use inertial rate sensors to measure and remove the residual low frequency pitch and yaw angular motions not removed by the flexures.
2. Provide three launch locks:• Three launch locks placed at the extremities of the instrument housing are required to transmit the launch loads. Note that the flexure mounts
are axially spring loaded to minimize axial loads while launch locks are engaged. See backup slide.
• A question: This proposed design removes only the ANGULAR pitch and yaw jitter motion imposed by the spacecraft. Willthe instrument - and all its sensors and optics – be affected by the LINEAR jitter motion also imposed by the spacecraft – and is NOT removed by this suspension?

I n t e g r a t e d D e s i g n C a p a b i l i t y / I n s t r u m e n t D e s i g n L a b o r a t o r y
GEO CAPE FR Study: 8/6 – 12/2014 Presentation Delivered: 8/12/2014
Mechanisms, p22 Final Version
Me4: Jitter Suppression/Roll Correction System 2/9
• Pitch motion of the S/C is about the Combined CG, so the motion at the CG of the GeoCape FR instrument is a combination oflateral motion and rotation – if the instrument were rigidly attached to S/C.
• Now if we attach the instrument to the S/C through a spherical joint at the instrument CG, lateral motions are transmitted, butrotations are not – but lateral motion of instrument is not a problem, since it does not change the pointing attitude.
• A spherical joint at the instrument CG is not physically possible, but three flexural struts pointed at the instrument CG ispossible, and, for small angular motions, is kinematically equivalent to a spherical joint. Rotational damping is now introduced by attaching three Voice Coil Actuators as far from the instrument CG as possible and driving them with current commands derived from pitch/yaw angular rate sensors and the roll camera.
Instrument CG
Combined (S/C and
Instrument) CG
Launch Lock
(1 of 3)
Voice Coil Actuator (1 of 3)
Rare Earth Magnet
Copper Coil
Detail of Voice Coil Actuator
Magnetic Flux Angular jitter of
S/C
Linear jitter of
Instrument
Spacecraft GEO CAPE
FR Flexures
See slide 19 for
a picture of an
unmounted VCA

I n t e g r a t e d D e s i g n C a p a b i l i t y / I n s t r u m e n t D e s i g n L a b o r a t o r y
itle GEO CAPE FR Study: 8/6 – 12/2014 Presentation Delivered: 8/12/2014
Mechanisms, p23 Final Version
Me4: Jitter Suppression/Roll Correction System 3/9
• Assuming 1 m dimensions and a mass of 250 kg allows usto calculate the MOI of the instrument at 42 kg-m2
• Assuming a max flight load on each flexure of 100 lbfallows us to suggest a 0.1” diameter x 0.4” long flexure with an allowable YS of 50 ksi and a modulus of 30 x 106 psi, which has a bending stiffness of 0.006 in-ozf/ rad
• Combining these results gives a rotational resonantfrequency of 1.73 Hz for a “long” flexure (see slide 50).
• Power Consumption– The electrical power required to actively remove
angular jitter from the instrument is greatly dependent on the bandwidth and amplitude of that jitter, as well as the mass MOI of the instrument.
– When these values are available, a power estimate canbe derived; for budgetary purposes, the power will probably be under 5 watts.
Loadbar YSbar areabar•:= Loadbar 392.699 lbf=
Lengthbar 0.4in:=
The area MOI of the flexure is Ebar 30000000psi:=Ibar 4
diabar2
4
•:= Ibar 4.909 10 6in4=
for a beam of stiffness EI, a moment M will bend the beam into a segment of a circle of radius
ME I•
(1)
Solving (1) for , we haveE I•M
(2)
Now the deflection angle created in a beam of length L by moment M is given by
L(3)
LE I•M
Substituting (2) into (3), we have (4)
Noting that M/ is the bending spring rate K, we can say Kbar
Ebar Ibar•
Lengthbar:= (5) Kbar 5.89 10 3 in ozf•
microrad=
3.1.4 Resonant frequency of instrument mounted on a tripod of three flexures
3 bar•
MOIinst
3. Jitter Attenuation3.1 estimate instrument angular resonance frequency on flexure tripod
3.1.1 instrument MOI
massinstrument 250kg:= Linst 1m:= Winst 1m:= Hinst 1m:=
MOI of rectangular solid
MOIinstmassinstrument
12Linst
2 Hinst2
+•:=
MOIinst 41.667 kgm2=
3.1.2a Launch load on Instrument Launch Locks
Launch_Forceinst massinstrument Accellaunch• rms_factor•:= Launch_Forceinst 24802 lbf=
3.1.2 max axial flight load on flexuresFmax 100lbf:= surely the comsat reboost
thrusters cannot esceed this...amaxFmax
massinstrument:= amax 0.181g=
3.1.3 angular stiffness of flexuresassume an axially loaded cylindrical bar with a Yield Strength of YSbar 50000psi:=
diabar 0.1in:= areabar 4diabar
2•:= areabar 7.854 10 3
in2=
this bar can support an axial load of:

I n t e g r a t e d D e s i g n C a p a b i l i t y / I n s t r u m e n t D e s i g n L a b o r a t o r y
GEO CAPE FR Study: 8/6 – 12/2014 Presentation Delivered: 8/12/2014
Mechanisms, p24 Final Version
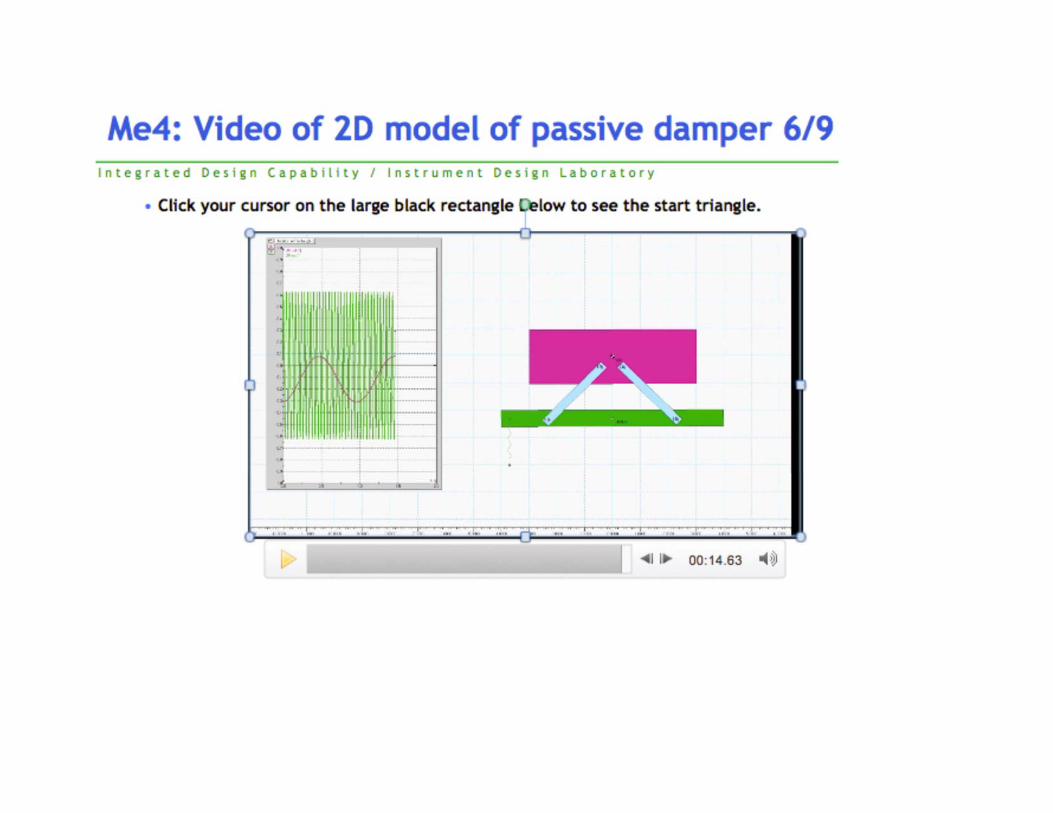
Me4: Simulated 2D performance of a notional passive isolator 4/9
• Two dual flexures attach GEO CAPE FR to the spacecraft - see slide 49:– Let each flexure stiffness be 10 N-m/°, for an effective of more than
20 N-m/° – Assume GEO CAPE FR MOI = 40 kg-m^2`– Then the pitch resonant frequency = 0.85 Hz
• Now we impose an angular motion on the spacecraft:– the spacecraft is pivoted and given an initial angular velocity;– A linear spring from ground to the spacecraft causes an angular
oscillation of the spacecraft at ~25 Hz. • The result:
– While the spacecraft oscillates at 25 Hz with an amplitude of ~±0.6°…– …this motion is transmitted to GEO CAPE FR through these flexures,…– …GEO CAPE FR would oscillate at 0.85 Hz with an amplitude of ~±0.24°
(the 0.85 Hz is the resonant frequency of the flexure stiffnesses and the GEO CAPE FR MOI)
• So GEO CAPE FR is now required to compensate for a 0.85 Hz disturbance,rather than the 25 Hz disturbance of the spacecraft.
– Note that no damping is included here; in an actual implementation,damping would reduce the 0.85 Hz amplitude.
GEO CAPE FR
SPACECRAFT
A video of this simulation is on the next slide
• By creating a simplified 2D mechanism model in WM2D*, it is possible to animatethe expected motion of a notional passive angular jitter attenuation technique.
• WM2D = Working Model 2D software
Time
Angu
lar
mot
ion

GEO CAPE FR Study: 8/6 – 12/2014 Presentation Delivered: 8/12/2014
Mechanisms, p25 Final Version

I n t e g r a t e d D e s i g n C a p a b i l i t y / I n s t r u m e n t D e s i g n L a b o r a t o r y
GEO CAPE FR Study: 8/6 – 12/2014 Presentation Delivered: 8/12/2014
Mechanisms, p26 Final Version
Me4: Transmitted Angular Jitter 6/9
• The orange data on this plot shows theangular jitter spectrum of a typical host spacecraft.
– The horizontal axis is frequency in Hz; thevertical axis is RMS amplitude in microradians.
• The -40 db/decade attenuation of thepassive flexure suspension is shown as the red line; the estimated corner frequency is 1.73 Hz.
– If the red line is multiplied by the orangedata, the result is the transmitted angular jitter RMS amplitude vs. frequency.
• With no attenuation below 1.73 Hz, theactuators must reduce the low frequency jitter to less than 0.1 arcsec, the required pointing accuracy.
• This low frequency jitter appears to beunder 10 microradians (2 arcsec) RMS* between 0.001 Hz and 0.2 Hz as shown by the blue line. (*with higher peaks)
• With angular rate sampled at 15 Hz, wecan achieve an active BW of about 3 Hz, which overlaps the 1.73 Hz passive BW.
2 arcsec
20 arcsec
0.2 arcsec
0.02 arcsec
200 arcsec
0.002 arcsec
0.0002 arcsec
-40 db
-80 db
0 db

I n t e g r a t e d D e s i g n C a p a b i l i t y / I n s t r u m e n t D e s i g n L a b o r a t o r y
GEO CAPE FR Study: 8/6 – 12/2014 Presentation Delivered: 8/12/2014
Mechanisms, p27 Final Version
Me4: VCA Angular motion limits 7/9
• In this design, the coils of all three voice coil actuators are hard mounted to the instrument, and the magnetassemblies are hard mounted to the spacecraft.
• So, when the instrument rotates about its CG, the actuator coils will move in all directions; specifically, eachactuator will move radially as well as axially.
• The actuator coils can move ±0.125” axially, but, due to their small radial clearance, they are limited to aradial motion of ±0.018”. This limited radial clearance would limit the angular motion of the instrument:
This is an active Excel spreadsheet; double click and update the values as they are available.
• With stock actuators, the radial clearance is made small to maximize actuator performance.• But the maximum roll error of 0.1° will cause contact within the X & Y actuators (not the roll actuator, its stroke
is 750mm (30”) x ±0.1° = ±0.052”, less than its capability of ±0.125”). • So, our options are:
• Use X and Y VCAs with a larger radial clearance; or• Restrain the X and Y coils to linear motion within their magnets; see next slide.

I n t e g r a t e d D e s i g n C a p a b i l i t y / I n s t r u m e n t D e s i g n L a b o r a t o r y
GEO CAPE FR Study: 8/6 – 12/2014 Presentation Delivered: 8/12/2014
Mechanisms, p28 Final Version
Me4: Increasing the VCA Angular motion limits 8/9
• To increase the allowable angular motion limits of theinstrument, we can maintain the alignment between a VCA coil and its magnet by adding two flexures and a flex rod to the VCA; the flexures limit the VCA output to linear motion; the rod transmits that linear motion to the instrument. Housed VCAs are also available…
“Linear Voice Coil Actuators - Housed “Housed VCAs models have been designed to simplify the use of linear voice coil actuators. With internal linear bearings the housed actuator design captures the coil assembly mechanically to keep it concentric within the field assembly as well as limiting the axial travel on both ends of the stroke.”
Spacecraft
GeoCape FR
Flex Rod Flexures
NOT TO SCALE
…but without knowing the friction and durability of these linear bearings,we should insist on the use of frictionless, high reliability flexures.
eahani
ng t
r

I n t e g r a t e d D e s i g n C a p a b i l i t y / I n s t r u m e n t D e s i g n L a b o r a t o r y
GEO CAPE FR Study: 8/6 – 12/2014 Presentation Delivered: 8/12/2014
Mechanisms, p29 Final Version
Me4: Jitter Suppression/Roll Correction System 9/9
• Roll Control Requirement:– The estimated RMS amplitude of the spacecraft
roll error is 0.1°, with a bandwidth of 0.1 Hz. – Optics principles require that the entire
instrument be rolled to remove this error; moving individual optics elements will not work.
• Proposed Design– All of this error will have to be removed by the roll
axis jitter attenuation actuator, as the resonant frequency of the flexure/instrument combination is far higher than 0.1 Hz.
– The estimated torque required to rotate theinstrument line of sight by 0.1° is 31 in-ozf.
– Assuming the roll actuator acts at a radius of 1m,the force is 0.78 ozf and the power is 1.4 milliwatts.
– A single roll actuator would need to be at theelevation of the CG to avoid crosstalk, but if two roll actuators are provided under the optical bench, a pure moment is exerted and there is no crosstalk.
3.5 Roll ControlAssume the jitter actuators have a radius of action of ractuator 1m:=
and a torque gain of Force_GainVCA 1.31 lbf
W:=
Assume a roll angle of roll 0.1deg:=
so the torque required is Torqueroll 3 Kbar• roll•:= Torqueroll 30.843 in ozf•=
So the roll actuator must exert a force ForcerollTorquerollractuator
:= Forceroll 0.783ozf=
The roll power required is PVCAForceroll
Force_GainVCA
2
:= PVCA 1.397 10 3W=

I n t e g r a t e d D e s i g n C a p a b i l i t y / I n s t r u m e n t D e s i g n L a b o r a t o r y
GEO CAPE FR Study: 8/6 – 12/2014 Presentation Delivered: 8/12/2014
Mechanisms, p30 Final Version
Me5: Contamination Door
•Primary Requirements:– Protect the optics from ground contamination and host spacecraft contamination– Dry N2 purge requires a close fitting labyrinth seal to minimize purge flow rate– Diameter: 521mm
•Proposed Design:– Instrument contamination doors have flown many times; common features are:1. A door rotating on redundant sliding surface bearings.2. Labyrinth seal at outer edge of door.3. A latch with redundant HOP (High Output Paraffin) actuators.4. Kickoff springs to establish the deployment angular rate.5. Torsion springs to maintain that rate against friction torques and restrain the door against on-orbit
moments.6. A travel stop with energy absorbing material to reduce the impact loads at the end of travel.

I n t e g r a t e d D e s i g n C a p a b i l i t y / I n s t r u m e n t D e s i g n L a b o r a t o r y
GEO CAPE FR Study: 8/6 – 12/2014 Presentation Delivered: 8/12/2014
Mechanisms, p31 Final Version
Me5: Door Latch: HOP Latch
• HOP Power input: 10 Watts • HOP Operating Time: 90 sec at +24C • HOP Operating Temp Range: -40C to +70C • HOP Survival Temp Range: -40C to +70C• Note max temp is limited by self-actuation*
– * Paraffin melting temperature

I n t e g r a t e d D e s i g n C a p a b i l i t y / I n s t r u m e n t D e s i g n L a b o r a t o r y
GEO CAPE FR Study: 8/6 – 12/2014 Presentation Delivered: 8/12/2014
Mechanisms, p32 Final Version
Me6: Filter Wheel Assembly 1/6
• Primary Requirements:– 50 filters– Filter size: Fused silica, 80mm dia x 6mm thick– Filter change time: as fast as possible– Position accuracy: ±0.5° (±1mm at 90mm radius)
• Derived Parameters:– Filter mass: 66 gm– Required life: 6.1 million revolutions in 3 years
Scan Dynamics: Move Me2: Scan Mirror 0.4° in 0.16 sec, then hold for (50 x 2 sec =) 100 sec total stare time + (0.2 sec x 50 =) 10 sec total filter index time, then repeat every 110.16 sec.
5 Filter Wheel diafilter 80mm:= thicknessfilter 6mm:=
5.1 Filter Mass & MOI
volumefilter 4diafilter
2• thicknessfilter•:= volumefilter 30.159289 cm3
=
massfilter fusedSi volumefilter•:= massfilter 0.066kg=
then sec x
10.1
5.6 Filter Wheel LifeThe mission l ifetime isTlife 3yr:=
the duty cycle of the instrument ison_timeinst17hrday
:= on_timeinst 70.833%=
The fi l ter wheel indexes 60 times every 110 sec for 17 hr/da for 3 yearsfreqFW
60110sec
:= freqFW 0.545Hz=
but one index is 1/6th of a revolution
number_cycles_over_mission Tlife on_timeinst• freqFW•16
•:=
number_cycles_over_mission 6.1 106=

I n t e g r a t e d D e s i g n C a p a b i l i t y / I n s t r u m e n t D e s i g n L a b o r a t o r y
GEO CAPE FR Study: 8/6 – 12/2014 Presentation Delivered: 8/12/2014
Mechanisms, p33 Final Version
Me6: Filter Wheel Assembly 2/6
• Proposed Design:– Ten 300 mm diameter Filter Wheels are each
supported by 3 Delrin outer race V guide bearings (see Me1) on periphery.
– Each Wheel has five 80mm Filters and oneopen position, all at a radius of 90mm, and can be indexed to 6 positions at 60°.
– Inner diameter of each Wheel has a femalespline (see slide 62) which mates with OD spline of Filter Selector.
– Filter Selector is moved axially into selected Wheel by dual rack & pinion drive rotated by Stepper Motor B. Axial position is read by encoder or dead reckoned from axial travel stop.
– Filter Selector, rotated by smaller spline on shaft of Stepper Motor A, rotates desired Filter into optical path.
– Two optical photointerruptor switches for each Wheel indicate home and each filter positions.
– One spring detent at each Wheel rim holdseach position.
Gears
Filter Guide bearing 10 Filter
Wheels (5 shown)
Stepper motor & gearbox
A
Filter Selector
Stepper Motor B
& Encoder
Rack & Pinion
Inner spline
Stepper Motor A shaft
ned F
Anti-rotation Key
d by
ve
inirsi
n e oreddesi
interrupate hom
onir

I n t e g r a t e d D e s i g n C a p a b i l i t y / I n s t r u m e n t D e s i g n L a b o r a t o r y
GEO CAPE FR Study: 8/6 – 12/2014 Presentation Delivered: 8/12/2014
Mechanisms, p34 Final Version
Me6: Rotating the filter wheel 3/6
• There are several method of rotating the wheels, from slow and simple to fastest and mostcomplex:– Slow and simple: open loop stepper motor in full step mode – can be turned off when wheel is
stationary. Limited MOI range due to torsional resonance. – Faster and more complex: open loop stepper motor in micro-stepping mode - can be turned off at cardinal
step positions when wheel is stationary. Less limited MOI range. – Fastest and most complex: closed loop brushless DC motor with encoder position feedback and PID controller –
cannot be turned off. Unlimited MOI capability.
• We need to select the simplest/least costly method that is consistent with keeping the filter indextime to a small fraction of the minimum stare/readout time of 0.5 second.
• For the MOI of the filter wheel, the estimated index times and relative complexity for eachmethod are:– Slow and simple: 0.20 sec / 1X complexity – Fastest and most complex: 0.01 sec / 4X complexity

I n t e g r a t e d D e s i g n C a p a b i l i t y / I n s t r u m e n t D e s i g n L a b o r a t o r y
GEO CAPE FR Study: 8/6 – 12/2014 Presentation Delivered: 8/12/2014
Mechanisms, p35 Final Version
Me6: Selecting the motor (no gearbox)… 4/6
• To move the Filter Wheel in 0.4seconds, we need a torque of 62 in-ozf.
• The maximum angular velocity reached after 0.2 sec is 167 steps/sec.
• A Kollmorgen type T21xxLH DC stepper motor has a low speed output torque of >125 in-ozf, and about the same torque at 167 steps/sec.
step_rate_at_max_vel 166.667Hz=step_rate_at_max_velmax
step_size:=
step_size 1.8deg:=
max 300 degsec
=max FW tFWhalf_step•:=After 0.2 sec, the angular velocity is
torqueFW 61.945 in ozf•=torqueFW 0.437N m•=torqueFW MOIwheel FW•:=
2t2
•FW 1.5 103 deg
sec2=FW 2
FW2
tFWhalf_step( )2•:=
12• t2•tFWhalf_step 0.2sec:=Assume time of half step acceleration
Assume a constant torque to move halfway, then constant negative torque to stop the motion
FW 60deg:=After each stare, the Filter Wheel (FW) steps 60 deg
5.3 Filter Wheel Indexing
ed
102
ssume time
i
pper
FW
FW•
FWFW(
stant torque to mo

I n t e g r a t e d D e s i g n C a p a b i l i t y / I n s t r u m e n t D e s i g n L a b o r a t o r y
GEO CAPE FR Study: 8/6 – 12/2014 Presentation Delivered: 8/12/2014
Mechanisms, p36 Final Version
Me6: …But we need a gearbox on the motor 5/6
• The holding torque of this motor is 180 in-ozf.• If the motor were directly attached to the filter
wheel, the resonant frequency of the motor would be 9.8 Hz.
• Our maximum step rate must be kept under this frequency – which we cannot do, as the indexing time would greatly increase.
• So we need to increase this frequency. Thenormal method of raising this frequency is to introduce a gearbox between the motor shaft and the filter wheel; the frequency increases by the square of the gearbox ratio.
• Since we would like to have a resonance of atleast 200 Hz, we need a gear ratio of 4.5:1
• The step rate will increase to 750 Hz, and themax delivered torque to 4.5 x 100 = 450 ozf-in. This torque can be used to decrease the filter indexing time, limited by allowable stresses and instrument disturbance torques.
ept under this
5.4 Resonant frequencyThe resonant frequency of the wheel/motor is
Tholding 180ozf in•:= the holding torque of the Kollmorgen T21xxLH motor is
Using our terminology:
fresTholding
8 • MOIwheel• step_size•:= fres 9.816Hz=
ratio_needed200Hz
fres:= ratio_needed 4.514=
so the max step rate would be
max_step_rate_with_gearbox step_rate_at_max_vel ratio_needed•:=
max_step_rate_with_gearbox 752.32 Hz=

I n t e g r a t e d D e s i g n C a p a b i l i t y / I n s t r u m e n t D e s i g n L a b o r a t o r y
GEO CAPE FR Study: 8/6 – 12/2014 Presentation Delivered: 8/12/2014
Mechanisms, p37 Final Version
Filter Wheel indexing performance with gearbox 6/6
With a gearbox ratio of 4.5:1, the Wheel can move 30° in 0.1 sec. (and another 30° in another 0.1 sec, For a total Wheel motion of 60° in 0.2 sec)
The required motor torque is 55 in-ozf,
The motor step size is 1.8° So its max step rate is 1500Hz. At that speed, the required torque is slightly less than its estimated capability of 60 in-ozf. The power consumption of a stepper motor does not vary with its output torque. The peak power is 64.8 W. With an average stare time of 2 sec, the average power is 6.5 W.
max 600 degsec
=
step_size 1.8deg:=
step_rate_at_max_velmax Ngearbox•
step_size:= step_rate_at_max_vel 1500Hz=
5.4 Filter Wheel Peak PowerTout_motor 60in ozf•:=At this step rate, the motor, driven with 24vdc at 2.7A, can exert
And the motor peak power is Pmotor 24volt 2.7• A:= Pmotor 64.8W=
5.5 Filter Wheel Average PowerWith an average stare time of tstare_avg 2sec:=
andan index time of twheel_index 2 tFWhalf_step•:= twheel_index 0.2s=
The average power is Pavg_FW Pmotortwheel_indextstare_avg
•:= Pavg_FW 6.48W=
5.3 Filter Wheel Indexing
FW 60deg:=After each stare, the Filter Wheel (FW) steps 60 deg
use a gearbox between the step motor and the filter wheel with a ratioNgearbox 4.5:=
Assume a cons tant torque to move halfway, then cons tant negative torque to stop the motion
Assume time of half step acceleration tFWhalf_step 0.1sec:= 12• t2•
FW 2
FW2
tFWhalf_step( )2•:= FW 6 103 deg
sec2= 2
t2•
The torque applied to the Wheel is torqueFW MOIwheel FW•:= torqueFW 247.78in ozf•=
The torque from the motor is torquemotortorqueFWNgearbox
:= torquemotor 55.062in ozf•=
After the half s tep, the wheel angular velocity is max FW tFWhalf_step•:=

I n t e g r a t e d D e s i g n C a p a b i l i t y / I n s t r u m e n t D e s i g n L a b o r a t o r y
GEO CAPE FR Study: 8/6 – 12/2014 Presentation Delivered: 8/12/2014
Mechanisms, p38 Final Version
Conclusions and Concerns
• Conclusions– Me1: Diffuser Wheel low risk, but it is quite large – Me2: Scan Mirror low risk; launch locks should not be needed if mirror is balanced. – Me3: Fast Steering Mirror low risk.– Me4: Jitter/Roll Suppression needs development due to new concept of passive low pass mechanical rotation filter;
the roll actuator must rotate the entire instrument to remove roll error, but instrument inertia helps.
– Me5: Contamination Door low risk.– Me6: Filter Wheel Assembly design must support high duty cycle and many life cycles; mechanism is combination of
standard machine elements (splines, gears, stepper motors)
• Concerns– Me4: This proposed design removes only the ANGULAR jitter motion imposed by the
spacecraft. Will the instrument - and all its sensors and optics – be affected by the LINEAR jitter motion also imposed by the spacecraft – and is NOT removed by this suspension?

I n t e g r a t e d D e s i g n C a p a b i l i t y / I n s t r u m e n t D e s i g n L a b o r a t o r y
GEO CAPE FR Study: 8/6 – 12/2014 Presentation Delivered: 8/12/2014
Mechanisms, p39 Final Version
Future Work
• Most of the mechanisms described here have been used many times; the exception isMe4, the active jitter suppression system.
• More specifically, the use of flexures to passively reject high frequency angular jitter is a new concept, and needs further analysis and prototype testing to verify its viability.
• However, since the concept does not involve any technological breakthroughs, but onlyrequires the proper use of basic rigid body mechanics, the analysis and testing effortsshould be straightforward.
I n t e g r a t e d D e s i g n C a p a b i l i t y / I n s t r u m e n t D e s i g n L a b o r a t o r y
GEO CAPE FR Study: 8/6 – 12/2014 Presentation Delivered: 8/12/2014
Mechanisms, p40 Final Version
Backup Slides
• Me1 backup:– V groove ball bearing
• Me2 backup:– Renishaw Encoder (2 slides)
• Me3 backup– Voice Coil Actuator Specs– LVDTs vs. DITs
• Me4 backup:– Development of Jitter Mount Concept (4)– Flexure Assembly Detail– Effect of flexure length– A flexure mount that creates motion clearance
• Me6/7 backup– Discussion of 100 filter mechanisms concepts– Stepper motor slides

I n t e g r a t e d D e s i g n C a p a b i l i t y / I n s t r u m e n t D e s i g n L a b o r a t o r y
GEO CAPE FR Study: 8/6 – 12/2014 Presentation Delivered: 8/12/2014
Mechanisms, p41 Final Version
Me1: Dual race V groove bearings
• Chart fromhttp://www.nationalprecision.com/ball-bearings/guide-wheel_v-groove_bushings.php
• Lubrication notes (not shown):http://www.pbclinear.com/Download/WhitePaper/Lubrication-for-Linear-Roller-Bearings-and-Raceways.pdf

I n t e g r a t e d D e s i g n C a p a b i l i t y / I n s t r u m e n t D e s i g n L a b o r a t o r y
GEO CAPE FR Study: 8/6 – 12/2014 Presentation Delivered: 8/12/2014
Mechanisms, p42 Final Version
Me2: Renishaw REXA Rotary Encoder
• Accuracy is ±1 arcsec• Repeatability of ±0.01 arcsec• So on-orbit mapping may be
necessary to achieve ground truth accuracy to 0.1 arcsec (10% of pixel size)
• Encoder electronics mass– Two readheads@19gm: 36 gm– Cable: 32 gm/m – Interface box: 218 gm
From http://resources.renishaw.com/en/details/data-sheet-rexa-ultra-high-accuracy-absolute-angle-encoder--44234

I n t e g r a t e d D e s i g n C a p a b i l i t y / I n s t r u m e n t D e s i g n L a b o r a t o r y
GEO CAPE FR Study: 8/6 – 12/2014 Presentation Delivered: 8/12/2014
Mechanisms, p43 Final Version
Me2: Renishaw REXA Rotary Encoder
• Ring diameter of 417mm assumed in MEL

I n t e g r a t e d D e s i g n C a p a b i l i t y / I n s t r u m e n t D e s i g n L a b o r a t o r y
GEO CAPE FR Study: 8/6 – 12/2014 Presentation Delivered: 8/12/2014
Mechanisms, p44 Final Version
Me3: Voice Coil Actuator Specs
• From http://www.beikimco.com/pdf/LA15-16-024%20%28LTR%29.pdf

I n t e g r a t e d D e s i g n C a p a b i l i t y / I n s t r u m e n t D e s i g n L a b o r a t o r y
GEO CAPE FR Study: 8/6 – 12/2014 Presentation Delivered: 8/12/2014
Mechanisms, p45 Final Version
Me3: LVDTs vs. DITs
• Electronics:– LVDTs can be driven by commercial chips
http://www.analog.com/static/imported-files/data_sheets/AD598.pdf
• Per LVDT: 20 pin brazed ceramic DIP: 1” x 0.29” x0.09”
– DITs need matched proprietary electronics:• Per two differential channels: : 6 oz, 2.5” x 2.3” x 1.3”
electronics box.
• Cable length and temperature:– LVDTs are not sensitive– DITs are sensitive
• Cable motion:– LVDTs are not sensitive– DITs are sensitive
From http://www.kamansensors.com/html_pages/tech_note_cable_length.html “CABLE LENGTH AND SYSTEM PERFORMANCE An eddy current, linear displacement system consists of a sensor or probe, an electronics module and an interconnecting coax cable. At the heart of the system is the impedance bridge circuit. One leg of the bridge is connected to the sensor coil via the sensor cable. The impedance of that circuit is balanced with electronic components. As a target engages the electromagnetic field generated by the sensor, the impedance of the sensor side of the bridge changes resulting in an output change in the system. Coil vs. Cable Impedance It is important to understand that the sensor and the interconnecting cable both provide inductance, capacitance, and resistance to that leg of the impedance bridge circuit. This circuit cannot distinguish between coil or cable induced impedance change. System sensitivity is based on the amount of impedance change in the bridge circuit caused by target-field interaction. To maximize sensitivity, the ratio of coil impedance to cable impedance must be maximized. A simple way to do this is to keep the cable lengths as short as possible. Cable Temperature As impedance is a combination of inductance, capacitance, and resistance, anything that affects these properties affects impedance. Changes in the cable temperature can affect the system output. Cable Movement Physical movement of the cable can result in minor changes in the distance between the center conductor of the coax cable and the shield. This can result in capacitance changes in the cable that can affect the system output. When A Long Sensor Cable Is Unavoidable Kaman can optimize the oscillator frequency used to excite the coil allowing for a longer cable. This can be detrimental in some dynamic applications as it reduces the maximum allowable surface velocity of the target. With longer cables, it is important to use a highly conductive target such as aluminum. Restraining long cables to prevent vibration induced movement helps improve overall system stability. Routing long cables to avoid temperature changes is also important to system stability. Routing the cable through conduit can help minimize temperature changes in the cable. Cable lengths can be increased where required by the application. However, performance may be degraded and maximum cable lengths are determined by sensor and target type. Contact Kaman for application assistance.
e
• “DIT” = Differential Impedance Transducer• High impedance sensor; output affected by cable motion
& temperature changes • Two channel electronics box: 6oz x 2.5” x 2.3” x 1.3”• Analog output• http://www.kamansensors.com/index.html

I n t e g r a t e d D e s i g n C a p a b i l i t y / I n s t r u m e n t D e s i g n L a b o r a t o r y
GEO CAPE FR Study: 8/6 – 12/2014 Presentation Delivered: 8/12/2014
Mechanisms, p46 Final Version
Me4: Development of Jitter Mount Concept 1/4
• Conceptually, mount the instrument at its C.G. (Center of Gravity) with a “frictionless sphericalbearing”, so there are no angular moments applied to it by the angular jitter of the spacecraft. The attenuation of angular jitter is theoretically infinite at all frequencies.
• (*Note that the “Combined C.G.” is calculated from the MOI of the spacecraft and only the md2 term ofthe instrument MOI.)
Spacecraft GeoCape FR
Combined C.G.(*)
Instrument C.G.

I n t e g r a t e d D e s i g n C a p a b i l i t y / I n s t r u m e n t D e s i g n L a b o r a t o r y
GEO CAPE FR Study: 8/6 – 12/2014 Presentation Delivered: 8/12/2014
Mechanisms, p47 Final Version
Me4: Development of Jitter Mount Concept 2/4
• But a frictionless spherical bearing is impossible to build, so let’s replace it with three flexures forming atripod pointed at the instrument C.G. For limited angular travel, they will act as a frictionless bearing with small, easily measured angular spring rates.
spacecraft GeoCape FR
Combined C.G.
Instrument C.G.
gula
Cap
• Each flexure consists of a cylindricalbar of high strength material with threaded ends and a circumferential groove near each end (no sharp internal corners; drawing in PowerPoint is limiting). One end threads into brackets attached to strong points on the instrument; the other end threads into brackets fixed to the S/C.
strenand a
nd (nong in
end

I n t e g r a t e d D e s i g n C a p a b i l i t y / I n s t r u m e n t D e s i g n L a b o r a t o r y
GEO CAPE FR Study: 8/6 – 12/2014 Presentation Delivered: 8/12/2014
Mechanisms, p48 Final Version
Me4: Development of Jitter Mount Concept 3/4
• We will add three active linear voice coil actuators at some distance from the instrument C.G. to dampangular motions of the GeoCape FR instrument.
• The actuators’ task will be minimal, since the flexure mounting passively removes the high frequencyangular S/C jitter.
tf
spacecraft GeoCape WAS
Combined C.G.
Instrument C.G.
1.56” tall
1.5” dia
mounti

I n t e g r a t e d D e s i g n C a p a b i l i t y / I n s t r u m e n t D e s i g n L a b o r a t o r y
GEO CAPE FR Study: 8/6 – 12/2014 Presentation Delivered: 8/12/2014
Mechanisms, p49 Final Version
Me4: Development of Jitter Mount Concept 4/4
• But how do we ensure that the effective pivot of the flexures is precisely at the C.G. of theinstrument?
• In two steps:1.Careful instrument design in a 3D modeler would place the vertex of the flexures close to the instrument
C.G.2.By examining the phase angle of the angular acceleration during Flight Acceptance vibration testing of the
instrument, and adding ballast masses to adjust that acceleration to zero, the instrument C.G. is movedslightly to locate it at the effective pivot of the flexures.
spacecraft GeoCape FR
Instrument C.G.
Combined C.G.
mtiveti

I n t e g r a t e d D e s i g n C a p a b i l i t y / I n s t r u m e n t D e s i g n L a b o r a t o r y
GEO CAPE FR Study: 8/6 – 12/2014 Presentation Delivered: 8/12/2014
Mechanisms, p50 Final Version
Me4: Flexure Assembly Detail
• For this application, each flexure assemblyconceptually is a rigid solid bar with circumferential grooves near each end.
• In practice, most of the bar could be analuminum tube, with a high strength flexure threaded into each end of the tube.
• The outer ends of these flexures would also bethreaded to attach the fitting to the spacecraft and instrument.
• The bending spring rate “K” of each flexure isderived elsewhere as:
• K = E * I / L, where– E = elastic modulus,– I = area MOI,– L = length

I n t e g r a t e d D e s i g n C a p a b i l i t y / I n s t r u m e n t D e s i g n L a b o r a t o r y
GEO CAPE FR Study: 8/6 – 12/2014 Presentation Delivered: 8/12/2014
Mechanisms, p51 Final Version
Me4: Effect of flexure length
• The diagram at the right defines two dimensions:– L1 is the distance between the flexure grooves– L2 is the total distance from the spacecraft flexure groove to
the CG of the instrument
• With the 2D model shown, assume that L1 = L2 (i.e.,the spacecraft flexure is at its CG):
– If the instrument were rotated around an axis normal to thescreen, the effective torsional spring rate would be 2*K for this 2D case (for the 3D case, with 3 flexures, the rate would be 3*K), since the flexures near the spacecraft do not bend.
• However, if L1 approaches zero (very short flexureassemblies), the effective rate increases:
– Now, if the instrument were rotated around an axis normalto the screen, the effective torsional spring rate would be 4*K for this 2D case (for the 3D case, with 3 flexures, the rate would be 6*K), since the flexures near the spacecraft bend just as much as the flexures near the instrument.
• Conclusion:– The ratio L1/L2 should be as high as practical to minimize
the effective bending spring rate and so reduce the instrument/flexure resonant frequency.
L1 L2
Instrument spacecraft

I n t e g r a t e d D e s i g n C a p a b i l i t y / I n s t r u m e n t D e s i g n L a b o r a t o r y
GEO CAPE FR Study: 8/6 – 12/2014 Presentation Delivered: 8/12/2014
Mechanisms, p52 Final Version
Me4: A flexure mount that creates motion clearance
• For launch, the instrument is held by launch locks, but when the locks are released, the instrument must moveaway from the lock interface to have room to rotate through small angles to accommodate spacecraft jitter motion.
• A means to create this motion:– One end of each of the 3 flexure assemblies is supported on a sliding block with limited travel.– The block is preloaded to the upper end of its travel by a Belleville spring.– During final assembly, as the instrument is pulled down into the launch locks, each flexure assembly compresses its Belleville
spring. – On orbit, when the launch locks are released, each Belleville spring pushes its attached flexure assembly (and the instrument)
up, away from the launch lock.
• The preload on each Belleville spring is chosen to be:• More than the highest axial force expected on that flexure assembly, and• Less than the force that would buckle the flexures.
• Heritage– The Windsat sensor built by NRL (Naval Research Lab) rotated at 30 rpm during scanning; to create the running clearance after
launch lock release, the structural lower plate was elastically deformed by the launch lock forces, so when it was released, it moved away from the stationary spacecraft, giving it clearance for rotation.
• Concern– It would be highly desirable to slowly release the launch locks to avoid structural shock loads on the flexures and the instrument
as the Belleville springs accelerate the instrument toward its operational position. How to achieve this low shock release needs to be thought through. Could a TiNi Frangibolt be used – not to break a bolt, but to slowly extend the flexures and push the instrument away from its launch locks?

I n t e g r a t e d D e s i g n C a p a b i l i t y / I n s t r u m e n t D e s i g n L a b o r a t o r y
GEO CAPE FR Study: 8/6 – 12/2014 Presentation Delivered: 8/12/2014
Mechanisms, p53 Final Version
Me6: Discussion of 100 filter mechanism concepts
• Given the desirability of having 50 filters available, instead of just the capacity of two wheels, severalpossibilities come to mind:
– Linear magazine– Carousel magazine– Rolodex flipper
• All of these would need handling of individual filters, which is undesirable.• Using multiple stacked filter wheels driven selectively by a single stepper motor appears desirable, as it uses a
minimum of components in a compact envelope. The selector for which wheel is rotated is driven by a second stepper motor that axially moves the drive element from wheel to wheel.

I n t e g r a t e d D e s i g n C a p a b i l i t y / I n s t r u m e n t D e s i g n L a b o r a t o r y
GEO CAPE FR Study: 8/6 – 12/2014 Presentation Delivered: 8/12/2014
Mechanisms, p54 Final Version
Me6: Stepper motors: Microstepping
• from http://en.wikipedia.org/wiki/Stepper_motor#Microstepping• “Microstepping• “What is commonly referred to as microstepping is often "sine cosine microstepping" in which the winding
current approximates a sinusoidal AC waveform. Sine cosine microstepping is the most common form, but other waveforms can be used. Regardless of the waveform used, as the microsteps become smaller, motor operation becomes more smooth, thereby greatly reducing resonance in any parts the motor may be connected to, as well as the motor itself. Resolution will be limited by the mechanical stiction, backlash, and other sources of error between the motor and the end device. Gear reducers may be used to increase resolution of positioning.
• “Step size repeatability is an important step motor feature and a fundamental reason for their use inpositioning.
• “Example: many modern hybrid step motors are rated such that the travel of every full step (example 1.8degrees per full step or 200 full steps per revolution) will be within 3% or 5% of the travel of every other full step, as long as the motor is operated within its specified operating ranges. Several manufacturers show that their motors can easily maintain the 3% or 5% equality of step travel size as step size is reduced from full stepping down to 1/10 stepping. Then, as the microstepping divisor number grows, step size repeatability degrades. At large step size reductions it is possible to issue many microstep commands before any motion occurs at all and then the motion can be a "jump" to a new position.”

I n t e g r a t e d D e s i g n C a p a b i l i t y / I n s t r u m e n t D e s i g n L a b o r a t o r y
GEO CAPE FR Study: 8/6 – 12/2014 Presentation Delivered: 8/12/2014
Mechanisms, p55 Final Version
Me6: Stepper motors: Ringing and resonance
• Resonant frequency of an inertial load attached to astepper motor output shaft:
– Assumes the motor output torque varies sinusoidally withposition
– Where:
“When the motor moves a single step, it overshoots the final resting point and oscillates around this point as it comes to rest. This undesirable ringing is experienced as motor vibration and is more pronounced in unloaded motors. An unloaded or under loaded motor may, and often will, stall if the vibration experienced is enough to cause loss of synchronization. “Stepper motors have a natural frequency of operation. When the excitation frequency matches this resonance, the ringing is more pronounced, steps may be missed, and stalling is more likely.
More info is at http://homepage.cs.uiowa.edu/~jones/step/physics.html#resonance

I n t e g r a t e d D e s i g n C a p a b i l i t y / I n s t r u m e n t D e s i g n L a b o r a t o r y
GEO CAPE FR Study: 8/6 – 12/2014 Presentation Delivered: 8/12/2014
Mechanisms, p56 Final Version
Me6: Stepper motors: Nomenclature

I n t e g r a t e d D e s i g n C a p a b i l i t y / I n s t r u m e n t D e s i g n L a b o r a t o r y
GEO CAPE FR Study: 8/6 – 12/2014 Presentation Delivered: 8/12/2014
Mechanisms, p57 Final Version
Me6: Kollmorgen T2 Series Stepper Motor

I n t e g r a t e d D e s i g n C a p a b i l i t y / I n s t r u m e n t D e s i g n L a b o r a t o r y
GEO CAPE FR Study: 8/6 – 12/2014 Presentation Delivered: 8/12/2014
Mechanisms, p58 Final Version
Me6: Kollmorgen Stepper Motor: T21 drawing
• From http://www.kollmorgen.com/en-us/products/motors/stepper/powermax-m-and-p-series/• From: Stepper_Catalog_en-US_RevC_EN

I n t e g r a t e d D e s i g n C a p a b i l i t y / I n s t r u m e n t D e s i g n L a b o r a t o r y
GEO CAPE FR Study: 8/6 – 12/2014 Presentation Delivered: 8/12/2014
Mechanisms, p59 Final Version
Me6: Kollmorgen Stepper Motor: T21xxLH performance
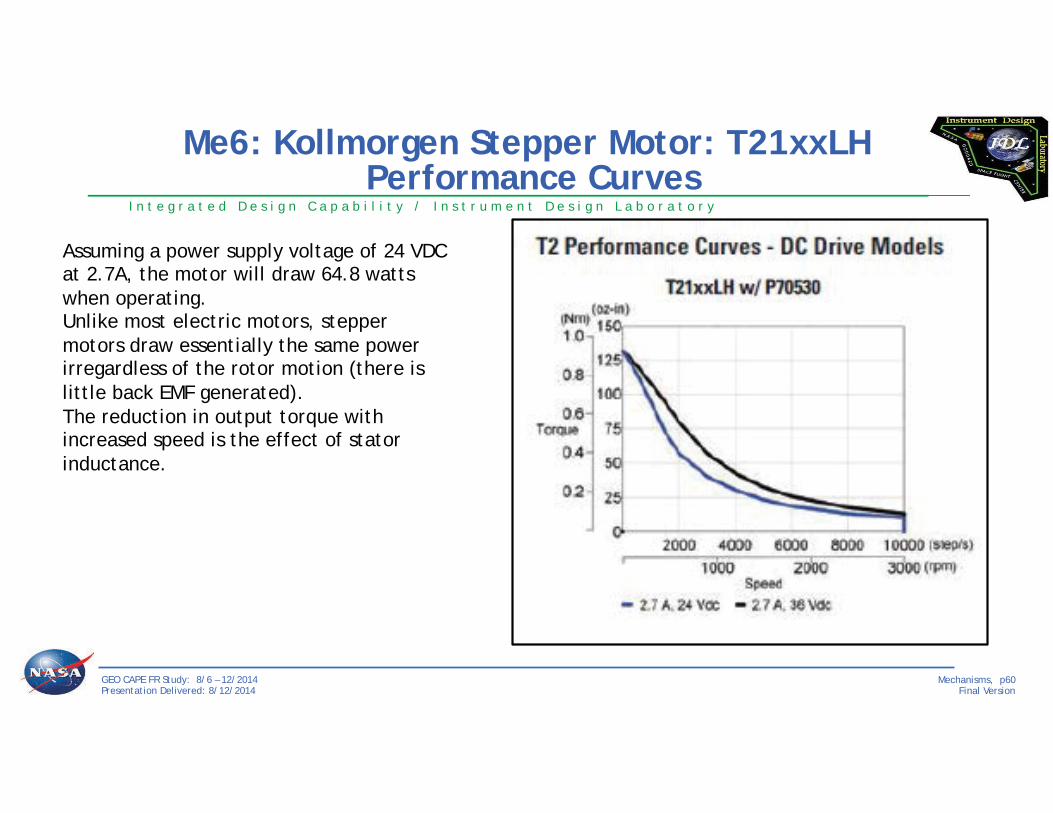
I n t e g r a t e d D e s i g n C a p a b i l i t y / I n s t r u m e n t D e s i g n L a b o r a t o r y
GEO CAPE FR Study: 8/6 – 12/2014 Presentation Delivered: 8/12/2014
Mechanisms, p60 Final Version
Me6: Kollmorgen Stepper Motor: T21xxLH Performance Curves
Assuming a power supply voltage of 24 VDC at 2.7A, the motor will draw 64.8 watts when operating. Unlike most electric motors, stepper motors draw essentially the same power irregardless of the rotor motion (there is little back EMF generated). The reduction in output torque with increased speed is the effect of stator inductance.

I n t e g r a t e d D e s i g n C a p a b i l i t y / I n s t r u m e n t D e s i g n L a b o r a t o r y
GEO CAPE FR Study: 8/6 – 12/2014 Presentation Delivered: 8/12/2014
Mechanisms, p61 Final Version
Me6: Kollmorgen Gearbox

I n t e g r a t e d D e s i g n C a p a b i l i t y / I n s t r u m e n t D e s i g n L a b o r a t o r y
GEO CAPE FR Study: 8/6 – 12/2014 Presentation Delivered: 8/12/2014
Mechanisms, p62 Final Version
Me6: Mechanical Drive Spline
• Fromhttp://en.wikipedia.org/wiki/Spline_%28mechanical%29
• “Splines are ridges or teeth on a drive shaft that meshwith grooves in a mating piece and transfer torque to it, maintaining the angular correspondence between them.
• “For instance, a gear mounted on a shaft might use amale spline on the shaft that matches the female spline on the gear.”

I n t e g r a t e d D e s i g n C a p a b i l i t y / I n s t r u m e n t D e s i g n L a b o r a t o r y
GEO CAPE FR Study: 8/6 – 12/2014 Presentation Delivered: 8/12/2014
Mechanisms, p63 Final Version
Me6: Transmissive Optical Switches
• From http://sensing.honeywell.com/honeywell-sensing-optical-sensors-range-guide-006495-4-en.pdf
• Typical transmissive optical switches:

I n t e g r a t e d D e s i g n C a p a b i l i t y / I n s t r u m e n t D e s i g n L a b o r a t o r y
GEO CAPE FR Study: 8/6 – 12/2014 Presentation Delivered: 8/12/2014
Mechanisms, p64 Final Version
Me6: Optimizing filter change time by half-shifting
• The design described on slide 33 assumes the drive selector will engage one filter wheel at a time, rotating itfrom its open position, through successive filters, and back to its open position. Only then is the filter selector shifted to the next filter wheel to repeat the sequence.
• However, it would be possible to half-shift the filter selector axially while the last filter is staring. The half-shift engages the drive spline of two adjacent filter wheels. Now when the filter selector is rotated, it would simultaneously (a) rotate the previous wheel into its open position, and (b) rotate the next wheel into its first filter position.
• Then, during the stare time of that filter, the filter selector could complete its half-shift, completelydisengaging from the previous wheel, and leave it ready to rotate only the current filter wheel.
• This technique would save some time in indexing through all 50 filters.• If this technique is used, it would be advantageous to locate the filters that need a long stare time at the
beginning and ending position of each filter wheel, so that the half-shift was completed before the stare was completed.

I n t e g r a t e d D e s i g n C a p a b i l i t y / I n s t r u m e n t D e s i g n L a b o r a t o r y
GEO CAPE FR Study: 8/6 – 12/2014 Presentation Delivered: 8/12/2014
Mechanisms, p65 Final Version
Me6: comments on design of filter wheel outer edge
• The outer diameter of each filter wheel is used for several purposes:– Provide a V surface for the guide bearing,– Have a notch for the spring detent, and– Have features at different radii to actuate the two photo-interruptors: six holes for the filters, and one hole for the open
position.
• The conflict is:– The spring detent notch would interrupt the bearing surface; it could also inadvertently trigger the photo-interruptors.
• Careful design will be needed to resolve these concerns.– One approach would be to increase the thickness of the wheel to provide more space for these three functions. However, this
would increase the overall length and mass of the mechanism.

N A S A G O D D A R D S P A C E F L I G H T C E N T E R
I n t e g r a t e d D e s i g n C a p a b i l i t y / I n s t r u m e n t D e s i g n L a b o r a t o r y
GEO CAPE Filter Radiometer (FR) ~ Concept Presentations ~
Detectors Carl Kotecki
Aug 12, 2014

I n t e g r a t e d D e s i g n C a p a b i l i t y / I n s t r u m e n t D e s i g n L a b o r a t o r y
GEO CAPE FR Study: 8/6 – 8/12/2014 Presentation Delivered: Aug 12, 2014
Detectors, p2 Final Version
Detector Requirements
• Filter Radiometer: UV-VIS-NIR-SWIR• UV-VIS-NIR: 350nm thru 1020nm
– Most filter bands are 5nm wide– Need a 2k x 2k array 250m GSD pixels– Standard large format 2-D arrays have 15 or 18um square pixels
• The optical design could not get 80% encircled energy in a 15um square using areasonably sized telescope. However, it was possible assuming a 2pixel x 2pixel “Superpixel”. The detector array active area has to be a 4k X 4k array of 15um pixels.
– Very large SNR requirements means the detector needs:• High QE• Low read noise• Low dark current/noise• Large well capacity
– SWIR 1245 and 1640nm• 20 and 40nm bandwidths• Allowed to be achieved by binning up to a 4 x 4 array of 15 X 15um pixels (60um square
superpixels of 500m GSD). – The atmospheric correction bands as well as diffraction limited optics allows for coarser spatial
resolution at these wavelengths. – SNRs were achieved without performing this spatial binning

I n t e g r a t e d D e s i g n C a p a b i l i t y / I n s t r u m e n t D e s i g n L a b o r a t o r y
GEO CAPE FR Study: 8/6 – 8/12/2014 Presentation Delivered: Aug 12, 2014
Detectors, p3 Final Version
Detector Choices
• UV-VIS-NIR Detector Choices– Silicon is the best detector material choice
• Hybrid PIN Photodiodes on ROICs such as the HAWAII-4RG– Low read noise, small well capacity, fixed square format
• CCDs– Easily customized for array size and pixel size– Large well capacity– Low read noise
• SWIR Detector Choices– InGaAs
• Readily available in 2-D formats with 1.7um cutoff material• Requires cooling to -20C or below to reduce dark current• Large well sizes with moderate read noise available• Material with cutoff wavelengths longer than 1.7um are more susceptible to radiation damage
– Cutoff wavelength slightly longer than 1.7um is required because the knee in QE curve shifts toshorter wavelengths as the detector is cooled
– Mercury Cadmium Telluride (MCT)• Requires lower temperature (185K) operation to minimize dark current• 2-D formats like the HAWAII-4RG readily available
– Larger well capacity for MCT as opposed to silicon, still requires multiple reads to avoid saturation
• UV-VIS-NIR and SWIR Detector Choices– Substrate removed MCT is the only choice

I n t e g r a t e d D e s i g n C a p a b i l i t y / I n s t r u m e n t D e s i g n L a b o r a t o r y
GEO CAPE FR Study: 8/6 – 8/12/2014 Presentation Delivered: Aug 12, 2014
Detectors, p4 Final Version
Teledyne HAWAII-4RG
Note: Assembly comes complete from Teledyne with the MCT detector array chip, flip chip bump bonded to the Silicon ROIC, bonded to the ceramic (Al2O3) fanout board, bonded to the Molybdenum mount and micro-D connector. 1.7, 2.5 and 5um
cutoff wavelength material are all standard products.

I n t e g r a t e d D e s i g n C a p a b i l i t y / I n s t r u m e n t D e s i g n L a b o r a t o r y
GEO CAPE FR Study: 8/6 – 8/12/2014 Presentation Delivered: Aug 12, 2014
Detectors, p5 Final Version
HAWAII-4RG Readout
• 4k X 4k array of 15um pixels• Bin multiple pixels in each band
– 2 x 2 pixels are summed in digitalspace to form the 30um x 30um super pixels
• 32 outputs from sections of 128columns each
• 128 X 4096 = 524,288 pixels perchannel
• 524,288 /0.24sec = ~2.185MHz– But for CDS two reads per sample are
required so actual read speed required is 2x or 4.369MHz
– Output up to 10MHz is supported byboth the ROIC and the SIDECAR 12 bit ADCs so plenty of margin
4096 Columns
4096
Row
s
…..
If the SWIR bands are dropped and the MCT is replaced with Si, the available well size is smaller and the number of reads would be greater to avoid saturation. The minimum integration time would require read speeds beyond the capability of the ROIC and SIDECAR.

I n t e g r a t e d D e s i g n C a p a b i l i t y / I n s t r u m e n t D e s i g n L a b o r a t o r y
GEO CAPE FR Study: 8/6 – 8/12/2014 Presentation Delivered: Aug 12, 2014
Detectors, p6 Final Version
Quantum Efficiency of Teledyne Substrate removed MCT

I n t e g r a t e d D e s i g n C a p a b i l i t y / I n s t r u m e n t D e s i g n L a b o r a t o r y
GEO CAPE FR Study: 8/6 – 8/12/2014 Presentation Delivered: Aug 12, 2014
Detectors, p8 Final Version
MCT Dark Current vs Temperature
• Note: Data shown is for 18micron pixels. For 15microns pixels, values would be~0.7X (152/182). 1.7um cutoff material at 185K would be ~150e-/pix/sec x 0.7 = ~100e-/pix/sec

I n t e g r a t e d D e s i g n C a p a b i l i t y / I n s t r u m e n t D e s i g n L a b o r a t o r y
GEO CAPE FR Study: 8/6 – 8/12/2014 Presentation Delivered: Aug 12, 2014
Detectors, p10 Final Version
GEO Radiation Environment (for a 3 year mission)
{Courtesy Jonathan Pellish}
Shielding thickness to achieve 30 krad(Si) requirement (includes 2x margin, 2020 launch) 2 yr: 5.2 mm, 3 yr: 5.9 mm, 5 yr: 6.9 mm

I n t e g r a t e d D e s i g n C a p a b i l i t y / I n s t r u m e n t D e s i g n L a b o r a t o r y
GEO CAPE FR Study: 8/6 – 8/12/2014 Presentation Delivered: Aug 12, 2014
Detectors, p11 Final Version
De-Scope UV-VIS-NIR Custom Frame Transfer CCD
• Use of a standard CCD is not an option:– Cannot be read out fast enough to prevent
incoming light during readout from corrupting the signal. So either a shutter or a frame transfer device is required.
• Even so, 8 output taps are required to readout thearray in 0.24sec
• Vertical clock speed of ~200kHz shifts frame in~0.01sec
– No COTS frame transfer device with the rightnumber of pixels, pixel size and number of outputs is available
• Not an issue since CCDs are easily customized• At least two know possible vendors: STA, E2V
– 4096 columns X 4096 rows, 15um X 15um pixelsfor the image area
– (2) 2048 columns X 4096 rows, 15um X 15umpixels for the storage area
• Additional rows and columns may be added fordark reference pixels
{For illustrative purposes: The actual CCD would have a 4k x 4k imaging
area and (2) 4k x 2k storage areas}

I n t e g r a t e d D e s i g n C a p a b i l i t y / I n s t r u m e n t D e s i g n L a b o r a t o r y
GEO CAPE FR Study: 8/6 – 8/12/2014 Presentation Delivered: Aug 12, 2014
Detectors, p12 Final Version
Split Frame, Frame Transfer CCD
• Single, split frame, frame transfer CCD• 4k x 4k total Imaging area• Two separate 4k x 2k storage areas• Eight output taps on each side to
enable high speed readout • All pixels see the same wavelength
light passed by the selected bandpass filter in the filter wheel
Frame Transfer Direction
Frame Transfer Direction
Readout registers with 8 output taps
Imaging Areas
Storage areas

I n t e g r a t e d D e s i g n C a p a b i l i t y / I n s t r u m e n t D e s i g n L a b o r a t o r y
GEO CAPE FR Study: 8/6 – 8/12/2014 Presentation Delivered: Aug 12, 2014
Detectors, p14 Final Version
Typical CCD Characteristics
Note: Plots for E2V devices with 26um square pixels. Dark current will be <70e-/pix/sec {~0.333 (225/676) times 200} at 20C.
Extrapolate read noise to ~14e- @ 2MHz

I n t e g r a t e d D e s i g n C a p a b i l i t y / I n s t r u m e n t D e s i g n L a b o r a t o r y
Note: The ceramic detector chip carrier comes with the silicon CCD chip permanently mounted. GEO CAPE FR Study: 8/6 – 8/12/2014
Presentation Delivered: Aug 12, 2014
Detectors, p15 Final Version
CCD Camera Enclosure Notional Figure
Instrument Bench
Detector Enclosure (Open front, not hermetic – for EMI and
radiation shielding: should be 6mm thick, may also provide stray light shielding)
CCD Detector Chip
Detector Chip Carrier
Fanout Board
Camera Mount/Bracket
Clocks & Biases
Video Readout
Analog Connector – raw detector output
Digital Connector – clocks and biases input
Harness
Key:
Flexible Heat Strap from the back of the CCD – attaches to a rigid heat pipe
Standoffs/Mount

I n t e g r a t e d D e s i g n C a p a b i l i t y / I n s t r u m e n t D e s i g n L a b o r a t o r y
GEO CAPE FR Study: 8/6 – 8/12/2014 Presentation Delivered: Aug 12, 2014
Detectors, p16 Final Version
Procurement Strategy
• HAWAII-4RG 1.7um MCT– One flight unit– One flight spare unit– At least three engineering units for radiation testing
• Three for determining total dose effects since the major contributor is trapped electrons– Determine any increase in dark current and loss of QE in the MCT– Determine any total dose effect in the ROIC
• The HAWAII-2RG was tested to 200krad without issue• Heavy ion testing is probably not necessary
– HAWAII-2RG was tested without issue: The CMOS ROIC was not susceptible to SEUs, SEEs or latchup• H4RG uses the same CMOS 0.25um process and design rules as the H2RG
• The engineering units can also be used for shake & bake qualification testing prior to radiation althoughno problems are anticipated (could even be waived)
• Descope CCDs– One flight CCD– One flight spare CCD– At least three engineering units for radiation testing for determining total dose effects since
the major contributor are trapped electrons. – No SEUs (single event upsets) or SEEs (single event effects) possible from protons or heavy ions
• The engineering units can also be used for shake & bake qualification testing prior to radiation althoughno problems are anticipated (could even be waived)

I n t e g r a t e d D e s i g n C a p a b i l i t y / I n s t r u m e n t D e s i g n L a b o r a t o r y
GEO CAPE FR Study: 8/6 – 8/12/2014 Presentation Delivered: Aug 12, 2014
Detectors, p17 Final Version
Conclusion/Concerns
• No new technology development is required.
• 1.7um cutoff MCT material is a standard product– No expected issues with qualifying either the detector material or the ROIC– The quantum efficiency remains high at 1640nm despite cooling and being near the knee in
the response curve.
• Custom CCDs are readily available for the UV-VIS-NIR wavelengths.– Radiation testing will be required. Typical commercial n-channel CCDs see significant
degradation in performance between 5 and 35krad. • Increase in dark current, increased noise from traps, reduction in CTE and image smearing, hot pixels
take out columns.

N A S A G O D D A R D S P A C E F L I G H T C E N T E R
I n t e g r a t e d D e s i g n C a p a b i l i t y / I n s t r u m e n t D e s i g n L a b o r a t o r y GEO CAPE Filter Radiometer (FR) ~ Concept Presentations ~
Radiometry Jay Smith – SGT via Code 551
Mark Wilson, Carl Kotecki, Paul Earle and Dick McBirney
Aug 14, 2014

I n t e g r a t e d D e s i g n C a p a b i l i t y / I n s t r u m e n t D e s i g n L a b o r a t o r y
GEO CAPE FR Study: 8/6 – 8/12/2014 Presentation Delivered: Aug 12, 2014
Radiometry, p2 Final Version
Requirement ’s from GEOCAPE Concept
• Added 10% margin to the required SNR’s to account for EOL degradations• Added additional fixed 5nm bands (19 bands => 50 total channels)
– Channel band-center wavelengths, ’s , Ltyp’s, and Lmax’s provided by customer.
• Fixed aperture diameter = 25 cm (effective clear aperture)• Ground pixel resolution = 125 m
– Aggregate 2x2 pixels for 250m GSD resolution
• Use [ 4096 x 4096 ] MCT and Si-CCD array with 15um pixel pitch– Use SideCar ROIC for MCT ; FPGA control ROIC for Si-CCD array– 1000k pe well capacity for MCT ; 500K pe well capacity for Si CCD array– Dark current; 100 pe/pixel/sec at 185°K (Use same/equivalent spec for Si-CCD array)– 12 bit A/D Converter for MCT SIDECAR ; 14 bit A/D Converter for Si-CCD array
• don’t know the ‘real’ effective number of bits for either
– 32 Readout Taps for MCT ; 16 Readout Taps for Si-CCD array– 10 MHz Tap readout for MCT SIDECAR ; Same spec for Si-CCD readout FPGA control ROIC
• Need to limit Tap frequency to < 5MHz for CDS activity in order to maintain read noise spec
– 100pe read noise for MCT ; 20pe read noise for Si-CCD array
• Need to meet or exceed 50,000km2/min Scan Rate Coverage• NOTE: the (QTY. 19) 5nm bands were analyzed with 10nm Ltyp & Lmax values

I n t e g r a t e d D e s i g n C a p a b i l i t y / I n s t r u m e n t D e s i g n L a b o r a t o r y
GEO CAPE FR Study: 8/6 – 8/12/2014 Presentation Delivered: Aug 12, 2014
Radiometry, p3 Final Version
Fixed Engineering Parameters

I n t e g r a t e d D e s i g n C a p a b i l i t y / I n s t r u m e n t D e s i g n L a b o r a t o r y
GEO CAPE FR Study: 8/6 – 8/12/2014 Presentation Delivered: Aug 12, 2014
Radiometry, p4 Final Version
Diffraction Limit and Optical Crosstalk
nm
GSD-m

I n t e g r a t e d D e s i g n C a p a b i l i t y / I n s t r u m e n t D e s i g n L a b o r a t o r y
GEO CAPE FR Study: 8/6 – 8/12/2014 Presentation Delivered: Aug 12, 2014
Radiometry, p5 Final Version
MCT - SNR Summary Graph
Red = SNR with multiple frame avg’s with 2x2 binning and full science bandwidth
Blue = SNR for well capacity (1 frame) with 2x2 binning and full science bandwidth

I n t e g r a t e d D e s i g n C a p a b i l i t y / I n s t r u m e n t D e s i g n L a b o r a t o r y
GEO CAPE FR Study: 8/6 – 8/12/2014 Presentation Delivered: Aug 12, 2014
Radiometry, p6 Final Version
Si-CCD - SNR Summary Graph
Red = SNR with multiple frame avg’s with 2x2 binning and full science bandwidth
Blue = SNR for well capacity (1 frame) with 2x2 binning and full science bandwidth

I n t e g r a t e d D e s i g n C a p a b i l i t y / I n s t r u m e n t D e s i g n L a b o r a t o r y
GEO CAPE FR Study: 8/6 – 8/12/2014 Presentation Delivered: Aug 12, 2014
Radiometry, p7 Final Version
Area Coverage Rate (MCT)

I n t e g r a t e d D e s i g n C a p a b i l i t y / I n s t r u m e n t D e s i g n L a b o r a t o r y
GEO CAPE FR Study: 8/6 – 8/12/2014 Presentation Delivered: Aug 12, 2014
Radiometry, p8 Final Version
Area Coverage Rate (Si-CCD)

I n t e g r a t e d D e s i g n C a p a b i l i t y / I n s t r u m e n t D e s i g n L a b o r a t o r y
GEO CAPE FR Study: 8/6 – 8/12/2014 Presentation Delivered: Aug 12, 2014
Radiometry, p9 Final Version
SNR Sensitivity Comparison
MCT Si-CCD
Slight Edge goes to Read Noise impact on MCT Little effect on the Si-CCD performance

I n t e g r a t e d D e s i g n C a p a b i l i t y / I n s t r u m e n t D e s i g n L a b o r a t o r y
GEO CAPE FR Study: 8/6 – 8/12/2014 Presentation Delivered: Aug 12, 2014
Radiometry, p10 Final Version
Summary
•GOOD– MCT and Si-CCD detector options - meet all Science Requirements– Both Detector options allow for > 50,000km2/min scan rate
• MCT has a slight edge due to the larger well capacity
•BAD– It’s still not a spectrometer– Will require multiple ‘hand picked’ filter attenuators to limit Si-
CCD ROIC readout tap frequency
•UGLY– Lots of filters to characterize for spatial uniformity ( < 1000:1 ? )
• Transmission, wavelength, wedge, … etc.

I n t e g r a t e d D e s i g n C a p a b i l i t y / I n s t r u m e n t D e s i g n L a b o r a t o r y
GEO CAPE FR Study: 8/6 – 8/12/2014 Presentation Delivered: Aug 12, 2014
Radiometry, p11 Final Version
Backup Charts

I n t e g r a t e d D e s i g n C a p a b i l i t y / I n s t r u m e n t D e s i g n L a b o r a t o r y
GEO CAPE FR Study: 8/6 – 8/12/2014 Presentation Delivered: Aug 12, 2014
Radiometry, p12 Final Version
MCT - FW Radiometer Summary_1

I n t e g r a t e d D e s i g n C a p a b i l i t y / I n s t r u m e n t D e s i g n L a b o r a t o r y
GEO CAPE FR Study: 8/6 – 8/12/2014 Presentation Delivered: Aug 12, 2014
Radiometry, p13 Final Version
MCT - FW Radiometer Summary_2

I n t e g r a t e d D e s i g n C a p a b i l i t y / I n s t r u m e n t D e s i g n L a b o r a t o r y
GEO CAPE FR Study: 8/6 – 8/12/2014 Presentation Delivered: Aug 12, 2014
Radiometry, p14 Final Version
Si-CCD - FW Radiometer Summary_1

I n t e g r a t e d D e s i g n C a p a b i l i t y / I n s t r u m e n t D e s i g n L a b o r a t o r y
GEO CAPE FR Study: 8/6 – 8/12/2014 Presentation Delivered: Aug 12, 2014
Radiometry, p15 Final Version
Si-CCD - FW Radiometer Summary_2
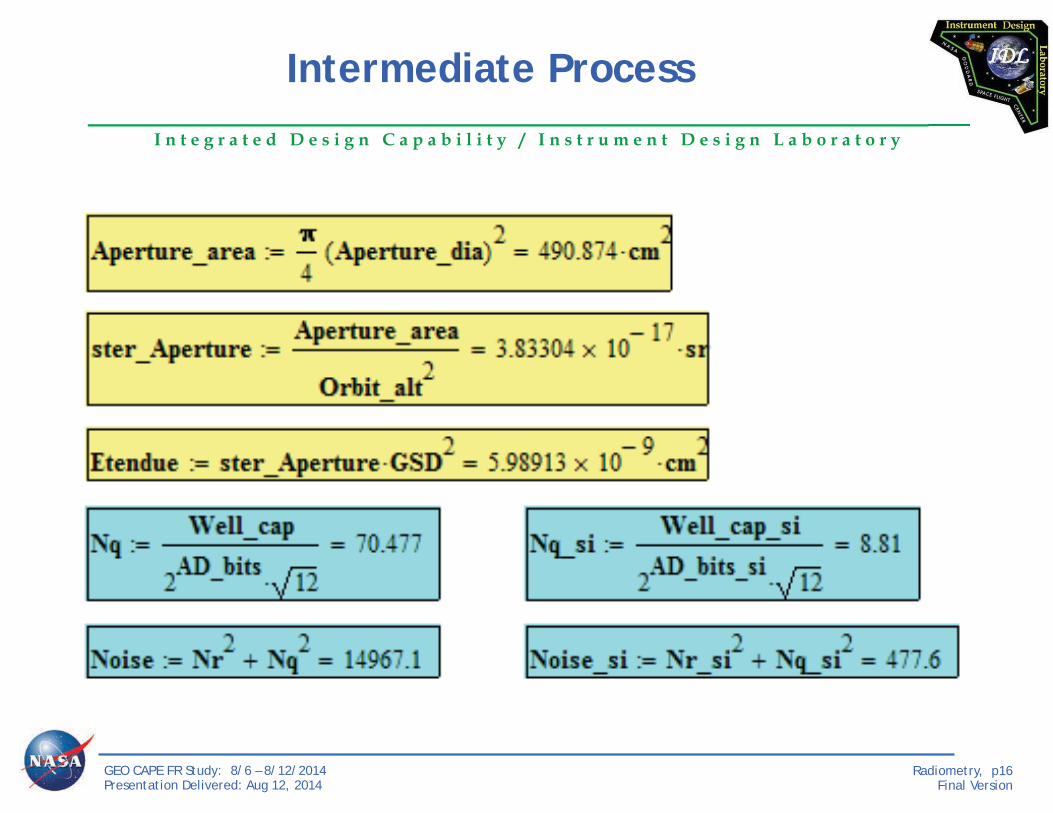
I n t e g r a t e d D e s i g n C a p a b i l i t y / I n s t r u m e n t D e s i g n L a b o r a t o r y
GEO CAPE FR Study: 8/6 – 8/12/2014 Presentation Delivered: Aug 12, 2014
Radiometry, p16 Final Version
Intermediate Process

I n t e g r a t e d D e s i g n C a p a b i l i t y / I n s t r u m e n t D e s i g n L a b o r a t o r y
GEO CAPE FR Study: 8/6 – 8/12/2014 Presentation Delivered: Aug 12, 2014
Radiometry, p17 Final Version
Integration time to avoid well saturation

I n t e g r a t e d D e s i g n C a p a b i l i t y / I n s t r u m e n t D e s i g n L a b o r a t o r y
GEO CAPE FR Study: 8/6 – 8/12/2014 Presentation Delivered: Aug 12, 2014
Radiometry, p18 Final Version
Determine Number of frame averages for SNR

N A S A G O D D A R D S P A C E F L I G H T C E N T E R
I n t e g r a t e d D e s i g n C a p a b i l i t y / I n s t r u m e n t D e s i g n L a b o r a t o r y
GEO CAPE Filter Radiometer (FR) ~ Concept Presentations ~
Electrical Design
C. Paul Earle Aug 12, 2014

I n t e g r a t e d D e s i g n C a p a b i l i t y / I n s t r u m e n t D e s i g n L a b o r a t o r y
GEO CAPE FR Study: 8/6 – 8/12/2014 Presentation Delivered: Aug 12, 2014
Electrical, p2 Final Version
Electrical Architecture (Baseline, MCT Detector)
Figure 1.
+ 28 V
Detector
Thermostats Heaters
Controlled Heaters
Thermistors
Mechanism Control
Digitizer
HAWAII-4RG
MCT
Readout (Digitizer)
Electronics SIDECAR
(FEE)
Filter Wheel Stepper Motors (2)
Encoder (position)
Scan Mirror DC Motor (2)
Encoder (position)
Fast Steering Mirror Voice-coil Actuators (4)
LVDT Position Sensors (4)
Jitter & Roll Compensation Voice-coil Actuator (3)
HOP Actuator (1)
signal
signal
signal
Spacecraft BusMain Electronics Box
Power
Avionics(C&DH)
RF Telecom
PowerPC 750
Processor Card
Filter Wheel Stepper Motor Control Card
Jitter Supression & Roll Compensation Voice-coil
Actuator Card
Fast Steering Mirror Voice-coil Actuator Card
Scan Mirror DC Motor Control Card
* Roll Camera & Electronics
Inertial Measurement Unit (IMU)
Survival Heaters
Attitude Control
Thermal Control
Star Trackers(2) & Electronics
+ 28V (Switched)
+ 28V (Switched)
RS422 (or 1553)
1pps time synch
CCSDS packets (LVDS or Spacewire)Data (LVDS)
(control)
(LV power)
drive (x2)
position (x2)
drive (x2)
position (x2)
drive (x4)
position (x4)
drive (x3)
Diffuser Wheel Stepper Motor Control Card
Heater Control & Housekeeping Card
backplane
(pwr)
Diffuser Wheel Stepper Motor
Encoder (position)
Low Voltage Power Converter (LVPC) Card + 28V
drive
position
* Assume custom built LEONProcessor card to process
feature recognition software with Spacewire interface to MEB. This
allows more margin to MEB processor and more modest
camera output data rate to MEB.
SpW

I n t e g r a t e d D e s i g n C a p a b i l i t y / I n s t r u m e n t D e s i g n L a b o r a t o r y
GEO CAPE FR Study: 8/6 – 8/12/2014 Presentation Delivered: Aug 12, 2014
Electrical, p3 Final Version
Digitizer Box Estimate: (13 x 18 x 8)cm, 1.0Kg (ie. 0.3Kg board total + 0.7Kg Housing), 4W
Note: SIDECAR ADC Sample rate ~ up to 10MHz on each of 32 channels @ 12 bits/sample
Detector Readout Electronics(Baseline, MCT Detector)
Figure 2.
Readout / Digitizer Electronics
SIDECARASIC
- Detector Readout - Digitization
biases
External Master Clock
RS422 to Processor Cardaddress
clock(s)
1LVDS
Power (bias)
32 analog outputs
(science data)
(4" x 6", 0.3Kg, 4W)
Focal Plane Array
(4K x 4K)MCT
Detector
Frame Transfer Readout Buffer
FPGA
- SIDECAR Control- Correlated Double Sampling (CDS)- Pixel Co-Add- 2x2 Pixel Summation- Data Compression
RAM(1.7:1 compression)
science
control

I n t e g r a t e d D e s i g n C a p a b i l i t y / I n s t r u m e n t D e s i g n L a b o r a t o r y
GEO CAPE FR Study: 8/6 – 8/12/2014 Presentation Delivered: Aug 12, 2014
Electrical, p4 Final Version
Instrument Power Estimates (Baseline, MCT Detector)
Avg. Power
Each LVPC External Load Qty (W) (W) (W) (W) (W) (W)
External Load Total: 22 95.1 0.0 2.3 118.1 63.1 0.0E-Box Circuit Boards
1 15.01 5.01 5.01 4.01 4.01 4.01 4.0
Power Converter Efficiency (%) 8034.0 0.0 10.8 39.8 26.0 0.0
E-Box Total: 8 75.0 0.0 51.8 80.7 67.0 0.0Direct S/C Bus Load
IMU 1 24.0Star Trackers 1 4.0
Thermostat Heaters 25 2.8Survival Heaters 21 6.7
Direct S/C Bus Load Total: 52 37.5 140.0 196.0 98.0 98.0 140.0Instrument Total: n/a 207.5 140.0 250.1 296.8 228.1 140.0

I n t e g r a t e d D e s i g n C a p a b i l i t y / I n s t r u m e n t D e s i g n L a b o r a t o r y
GEO CAPE FR Study: 8/6 – 8/12/2014 Presentation Delivered: Aug 12, 2014
Electrical, p5 Final Version
MEB Size Mass Estimate
Circuit Boards Length (x) Width (z) Mass each Qty Mass (Kg) Board Dimensions (inches) 8 6 0.50 7
3.50 (cm) 20 15Power Supply Card " " 0.75 1 0.75 Backplane (inches) 6 8 0.50 1
0.50 (cm) 15 20Board Mass Total: 4.75
Housing Width (y) Qty
1.85
Box Dimensions (inches) 9 7 9 1 (cm) 23 18 23
Box Wall Thickness (mm) 2.5
Material (Aluminum) Density 2,700Housing Mass :
Box Total: 6.60

I n t e g r a t e d D e s i g n C a p a b i l i t y / I n s t r u m e n t D e s i g n L a b o r a t o r y
GEO CAPE FR Study: 8/6 – 8/12/2014 Presentation Delivered: Aug 12, 2014
Electrical, p6 Final Version
MEB Box size: (23 x 18 x 23)cm, 6.6Kg (ie. 4.7Kg board total + 1.9Kg Housing)
MEB Mass & Power Summary
E-Box Boards (Internal Load) Qty Masss (Kg) Watts (W) Description % Analog /
Digital TRL 0.5 Custom Design 5/90 6 0.5 Custom Design 75/20 6 0.5 Custom Design 75/20 6 0.5 Custom Design 75/20 6 0.5 Custom Design 75/20 6 0.5 Custom Design 75/20 6 0.5 Custom Design 75/20 6 0.7 assume 80% efficiency 90/5 6 0.5 - passive - 61.8 - Aluminum (2.5mm) - 7
MEB Totals: (Mass & Power): 6.6 67.0

I n t e g r a t e d D e s i g n C a p a b i l i t y / I n s t r u m e n t D e s i g n L a b o r a t o r y
GEO CAPE FR Study: 8/6 – 8/12/2014 Presentation Delivered: Aug 12, 2014
Electrical, p7 Final Version
Circuit Boards Length (x) Width (z) Mass each Qty Mass (Kg) Board Dimensions (inches) 4 6 0.25 1
0.25 (cm) 10 15Board Mass Total: 0.25
Housing Width (y) Qty
0.64
Box Dimensions (inches) 5 7 3 1 (cm) 13 18 8
Box Wall Thickness (mm) 2.5
Material (Aluminum) Density 2,700Housing Mass :
Box Total: 0.89
SIDECAR Digitizer Box Summary(Baseline, MCT Detector)
Digitizer Box size: (13 x 18 x 8)cm, 0.9Kg (ie. 0.3Kg board total + 0.6Kg Housing)
0.25 4.00.64 - Aluminum (2.5mm) - 7
Box Totals: (Mass & Power): 0.89 4.0

I n t e g r a t e d D e s i g n C a p a b i l i t y / I n s t r u m e n t D e s i g n L a b o r a t o r y
GEO CAPE FR Study: 8/6 – 8/12/2014 Presentation Delivered: Aug 12, 2014
Electrical, p8 Final Version
Detector Readout / Data Rate(Baseline, MCT Detector)
Detector Assumptions - 1(4K x 4K) MCT Detector Array,
32 taps, up to 10MHz sample rate @12 bits/pix resolution
- Perform Correlated Double Sampling (CDS) on each pixel readout and 2x2 pixel summation
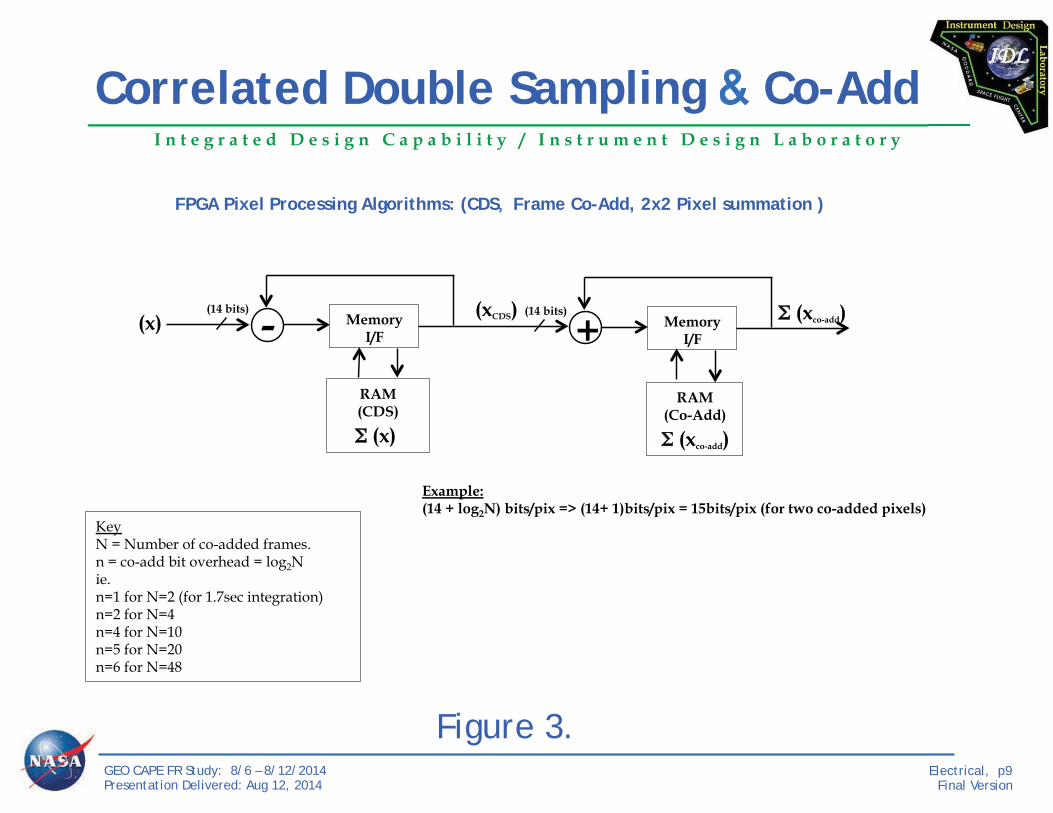
I n t e g r a t e d D e s i g n C a p a b i l i t y / I n s t r u m e n t D e s i g n L a b o r a t o r y
GEO CAPE FR Study: 8/6 – 8/12/2014 Presentation Delivered: Aug 12, 2014
Electrical, p9 Final Version
Example: (14 + log2N) bits/pix => (14+ 1)bits/pix = 15bits/pix (for two co-added pixels)
Key N = Number of co-added frames. n = co-add bit overhead = log2N ie. n=1 for N=2 (for 1.7sec integration) n=2 for N=4 n=4 for N=10 n=5 for N=20 n=6 for N=48
Memory I/F
RAM (CDS)
- (x) (14 bits) (xCDS)
(x)
Memory I/F
RAM (Co-Add)
+(14 bits)
(xco-add)
Correlated Double Sampling Co-Add
(xco-add)
FPGA Pixel Processing Algorithms: (CDS Frame Co-Add, 2x2 Pixel summation )
Figure 3.

I n t e g r a t e d D e s i g n C a p a b i l i t y / I n s t r u m e n t D e s i g n L a b o r a t o r y
GEO CAPE FR Study: 8/6 – 8/12/2014 Presentation Delivered: Aug 12, 2014
Electrical, p10 Final Version
Mechanical Layout Dimensions used as basis for harness length & Mass estimates
Figure 4.

I n t e g r a t e d D e s i g n C a p a b i l i t y / I n s t r u m e n t D e s i g n L a b o r a t o r y
GEO CAPE FR Study: 8/6 – 8/12/2014 Presentation Delivered: Aug 12, 2014
Electrical, p11 Final Version
Instrument Harness Mass Estimate (Baseline, MCT Detector)
Note: • This mass estimate is the current best estimate based on this point design, and represents ~6% of the total instrument mass. Historically,
flight instruments have been delivered with the harness mass totaling 7-12% of the total instrument mass, so the customer may choose to book keep a more conservative estimate of harness mass until a more detailed electrical assessment can be performed.
• 5% misc added for tie-downs, ground straps, and insulation
Digitizer MCT Detector Assembly Single-24AWG M22759/33-24-0 50 0.5 3.25 81.20 51P (MDM) 40.00 121.20 Digitizer MEB Power, LVDS (20, 24)AWG 4 0.5 27.23 54.46 15P (MDM) 32.00 86.46
MEB Filter Wheel Motors + sensors (2) TP-22AWG M27500-22SC2U00 12 3.0 10.50 377.95 15P (MDM) 32.00 409.95 MEB Scan Mirror Assy + Enc TSP-22AWG M27500-22SC2S23 15 3.0 22.97 1033.46 44P (HD) 62.00 1095.46 MEB FSM Voice Coils (4) + LVDT TSP-22AWG M27500-22SC2S23 8 3.0 22.97 551.18 25P (MDM) 34.40 585.58 MEB Diffuser Wheel Motor Assy+ Enc TSP-22AWG M27500-22SC2S23 15 3.0 22.97 1033.46 44P (HD) 62.00 1095.46 MEB Jitter/Roll Voice Coils (3) TSP-22AWG M27500-22SC2S23 3 3.0 22.97 206.69 9P (MDM) 29.20 235.89 MEB Launch Locks (7) TP-20AWG M27500-20SC2U00 7 3.0 16.40 344.49 21P (MDM) 33.20 377.69 MEB Star Tracker Electronics Power, RS422 (12, 24)AWG 1 2.5 109.55 273.87 9P (MDM) 29.20 303.07 MEB IMU Electronics Power, RS422 (12, 24)AWG 1 2.5 109.55 273.87 9P (MDM) 29.20 303.07 MEB Roll Camera Electronics Power, SpW (20, 24)AWG 1 2.5 88.25 220.64 9P (MDM) 29.20 249.84 MEB Precision Heaters (1) TP-20AWG M27500-20SC2U00 2 1.5 16.40 49.21 15P (MDM) 32.00 81.21 MEB Thermostat / Survival Heaters (15) TP-20AWG M27500-20SC2U00 182 2.0 16.40 5971.13 37P (MDM) 40.00 6011.13 MEB Temperature Sensors (20) TSP-24AWG M27500-24SC2S23 44 2.0 18.37 1616.80 51P (MDM) 40.00 1656.80 MEB SCIF Pwr, RS422, 1553, 1pps (12, 24, 24,24)AWG 1 2.0 151.54 303.08 15P (MDM) 32.00 335.08
Digitizer SCIF (3) SpaceWire (SpW) 9 wires (4 TSPs + GND) 3 2.0 74.80 448.82 37P (MDM) 40.00 488.82
+ 5% misc:

I n t e g r a t e d D e s i g n C a p a b i l i t y / I n s t r u m e n t D e s i g n L a b o r a t o r y
GEO CAPE FR Study: 8/6 – 8/12/2014 Presentation Delivered: Aug 12, 2014
Electrical, p12 Final Version
Electrical Architecture (DeScope Option, Si CCD Detectors )
Figure 1b.
+ 28 V
Thermostats Heaters
Controlled Heaters
Thermistors
Mechanism Control
Filter Wheel Stepper Motors (2)
Encoder (position)
Scan Mirror DC Motor (2)
Encoder (position)
Fast Steering Mirror Voice-coil Actuators (4)
LVDT Position Sensors (4)
Jitter & Roll Compensation Voice-coil Actuator (3)
HOP Actuator (1)
signal
signal
signal
Spacecraft BusMain Electronics Box
Power
Avionics(C&DH)
RF Telecom
PowerPC 750
Processor Card
Filter Wheel Stepper Motor Control Card
Jitter Supression & Roll Compensation Voice-coil
Actuator Card
Fast Steering Mirror Voice-coil Actuator Card
Scan Mirror DC Motor Control Card
* Roll Camera & Electronics
Inertial Measurement Unit (IMU)
Survival Heaters
Attitude Control
Thermal Control
Star Trackers(2) & Electronics
+ 28V (Switched)
+ 28V (Switched)
RS422 (or 1553)
1pps time synch
CCSDS packets (LVDS or Spacewire)Data (LVDS)
(LV power)
drive (x2)
position (x2)
drive (x2)
position (x2)
drive (x4)
position (x4)
drive (x3)
Diffuser Wheel Stepper Motor Control Card
Heater Control & Housekeeping Card
backplane
(pwr)
Diffuser Wheel Stepper Motor
Encoder (position)
Low Voltage Power Converter (LVPC) Card + 28V
drive
position
(2Kx4K)
CCD
Detectors
Readout Electronics
(FEE)
(2Kx4K)
CCD
Digitizer
Readout Electronics
(FEE)
(control)
* Assume custom built LEONProcessor card to process
feature recognition software with Spacewire interface to MEB. This
allows more margin to MEB processor and more modest
camera output data rate to MEB.SpW

I n t e g r a t e d D e s i g n C a p a b i l i t y / I n s t r u m e n t D e s i g n L a b o r a t o r y
GEO CAPE FR Study: 8/6 – 8/12/2014 Presentation Delivered: Aug 12, 2014
Electrical, p13 Final Version
Box Estimate: (13 x 18 x 15)cm, 2.0Kg (ie. 1.0Kg board total + 1.0Kg Housing), 32W
Note: ADC Sample rate ~ up to 155MHz on each of 4channels @ 14 bits/sample, ADC14155QML-SP, TI Two readout Cards per (2kx4K) pixels (ie. 4 readout Cards total housed in a single Digitizer Box)
Detector Readout (Digitizer)(Descope Option, Si CCD Detectors)
Figure 2b.
Readout / Digitizer Electronics
FPGA(RTAX-2000)
- Readout Control- Correlated Double Sampling (CDS)- Pixel Summation- Data Compressionbiases
External Master Clock
RS422
address
clock(s)
RAM(1.7:1 compression)
1LVDS
power
Amp4
FET4 4
(2K x 4K)Pixel
ADC14-bits
LVDS
(science)
(4" x 6", 0.3Kg, 8W each)
Pre-AmpsFocal Plane Array
Readout / Digitizer Electronics
FPGA(RTAX-2000)
- Readout Control- Correlated Double Sampling (CDS)- Pixel Summation- Data Compressionbiases
External Master Clock
RS422
address
clock(s)
RAM(1.7:1 compression)
1LVDS
power
Amp4
FET4 4 ADC
14-bits
LVDS
(science)
(4" x 6", 0.3Kg, 8W each)
Pre-Amps
(2K x 4K)Pixels

I n t e g r a t e d D e s i g n C a p a b i l i t y / I n s t r u m e n t D e s i g n L a b o r a t o r y
GEO CAPE FR Study: 8/6 – 8/12/2014 Presentation Delivered: Aug 12, 2014
Electrical, p14 Final Version
Instrument Power Estimates (Descope Option, Si CCD Detectors)
Avg. Power
Each LVPC External Load Qty (W) (W) (W) (W) (W) (W)
External Load Total: 22 103.6 0.0 7.6 126.6 71.6 0.0E-Box Circuit Boards
1 15.01 5.01 5.01 4.01 4.01 4.01 4.0
Power Converter Efficiency (%) 8036.1 0.0 12.1 41.9 28.1 0.0
E-Box Total: 8 77.1 0.0 53.1 82.8 69.1 0.0Direct S/C Bus Load
IMU 1 24.0Star Trackers 1 4.0
Thermostat Heaters 25 2.8Survival Heaters 21 6.7
Direct S/C Bus Load Total: 52 37.5 140.0 196.0 98.0 98.0 140.0Instrument Total: n/a 218.1 140.0 256.7 307.4 238.7 140.0

I n t e g r a t e d D e s i g n C a p a b i l i t y / I n s t r u m e n t D e s i g n L a b o r a t o r y
GEO CAPE FR Study: 8/6 – 8/12/2014 Presentation Delivered: Aug 12, 2014
Electrical, p15 Final Version
CCD Digitizer Box Summary(Descope Option, Si CCD Detector)
Digitizer Box size: (13 x 18 x 15)cm, 2.0Kg (ie. 1.0Kg board total + 1.0Kg Housing)
Circuit Boards Length (x) Width (z) Mass each Qty Mass (Kg) Board Dimensions (inches) 4 6 0.25 4
1.00 (cm) 10 15Board Mass Total: 1.00
Housing Width (y) Qty
0.96
Box Dimensions (inches) 5 7 6 1 (cm) 13 18 15
Box Wall Thickness (mm) 2.5
Material (Aluminum) Density 2,700Housing Mass :
Box Total: 1.96
1.00 32.00.96 - Aluminum (2.5mm) - 7
Box Totals: (Mass & Power): 1.96 32.0

I n t e g r a t e d D e s i g n C a p a b i l i t y / I n s t r u m e n t D e s i g n L a b o r a t o r y
GEO CAPE FR Study: 8/6 – 8/12/2014 Presentation Delivered: Aug 12, 2014
Electrical, p16 Final Version
Detector Readout / Data Rate(DeScope Option, Si CDD Detector)
Detector Assumptions - 1(4K x 4K) CCD Detector Array,
16 taps, up to 155MHz sample rate @14 bits/pix resolution
- Perform Correlated Double Sampling (CDS) on each pixel readout and 2x2 pixel summation

I n t e g r a t e d D e s i g n C a p a b i l i t y / I n s t r u m e n t D e s i g n L a b o r a t o r y
GEO CAPE FR Study: 8/6 – 8/12/2014 Presentation Delivered: Aug 12, 2014
Electrical, p17 Final Version
Instrument Harness Mass Estimate (DeScope Option, Si CCD Detector)
Note: • This mass estimate is the current best estimate based on this point design, and represents ~6% of the total instrument mass. Historically,
flight instruments have been delivered with the harness mass totaling 7-12% of the total instrument mass, so the customer may choose to book keep a more conservative estimate of harness mass until a more detailed electrical assessment can be performed.
• 5% misc added for tie-downs, ground straps, and insulation
Digitizer CCD Detector Assembly Single-24AWG M22759/33-24-0 40 0.5 3.25 64.96 51P (MDM) 40.00 104.96 Digitizer MEB Power, LVDS (20, 24)AWG 4 0.5 27.23 54.46 15P (MDM) 32.00 86.46
MEB Filter Wheel Motors + sensors (2) TP-22AWG M27500-22SC2U00 12 3.0 10.50 377.95 15P (MDM) 32.00 409.95 MEB Scan Mirror Assy + Enc TSP-22AWG M27500-22SC2S23 15 3.0 22.97 1033.46 44P (HD) 62.00 1095.46 MEB FSM Voice Coils (4) + LVDT TSP-22AWG M27500-22SC2S23 8 3.0 22.97 551.18 25P (MDM) 34.40 585.58 MEB Diffuser Wheel Motor Assy+ Enc TSP-22AWG M27500-22SC2S23 15 3.0 22.97 1033.46 44P (HD) 62.00 1095.46 MEB Jitter/Roll Voice Coils (3) TSP-22AWG M27500-22SC2S23 3 3.0 22.97 206.69 9P (MDM) 29.20 235.89 MEB Launch Locks (7) TP-20AWG M27500-20SC2U00 7 3.0 16.40 344.49 21P (MDM) 33.20 377.69 MEB Star Tracker Electronics Power, RS422 (12, 24)AWG 1 2.5 109.55 273.87 9P (MDM) 29.20 303.07 MEB IMU Electronics Power, RS422 (12, 24)AWG 1 2.5 109.55 273.87 9P (MDM) 29.20 303.07 MEB Roll Camera Electronics Power, SpW (20, 24)AWG 1 2.5 88.25 220.64 9P (MDM) 29.20 249.84 MEB Precision Heaters (1) TP-20AWG M27500-20SC2U00 2 1.5 16.40 49.21 15P (MDM) 32.00 81.21 MEB Thermostat / Survival Heaters (15) TP-20AWG M27500-20SC2U00 182 2.0 16.40 5971.13 37P (MDM) 40.00 6011.13 MEB Temperature Sensors (20) TSP-24AWG M27500-24SC2S23 44 2.0 18.37 1616.80 51P (MDM) 40.00 1656.80 MEB SCIF Pwr, RS422, 1553, 1pps (12, 24, 24,24)AWG 1 2.0 151.54 303.08 15P (MDM) 32.00 335.08
Digitizer SCIF (3) SpaceWire (SpW) 9 wires (4 TSPs + GND) 3 2.0 74.80 448.82 37P (MDM) 40.00 488.82
+ 5% misc:

I n t e g r a t e d D e s i g n C a p a b i l i t y / I n s t r u m e n t D e s i g n L a b o r a t o r y
GEO CAPE FR Study: 8/6 – 8/12/2014 Presentation Delivered: Aug 12, 2014
Electrical, p18 Final Version
Baseline vs. Alternate Configuration

I n t e g r a t e d D e s i g n C a p a b i l i t y / I n s t r u m e n t D e s i g n L a b o r a t o r y
GEO CAPE FR Study: 8/6 – 8/12/2014 Presentation Delivered: Aug 12, 2014
Electrical, p19 Final Version
Issues / Conclusion / Summary
• No low TRL items or concerns. All TRLs are > 6.
• The baseline design assumes single-string electronics, except for heaters which areredundant.
• The main processor is dedicated to ACS data processing with input from the IMU,Star Tracker, Roll Cameras, and closed-loop PID heater control, while the FPGAs are used for mechanism control, pixel processing algorithms and data compression.
• A LEON processor card was added to the Roll Camera electronics to “pre-process”the scene identification logic to minimize bandwidth to the MEB and to increase the % utilization margin on MEB PowerPC processor at this stage of the design.
• Data Compression is assumed @ ~ 1.7:1 to reduce downlink bandwidth/transponder requirements (15.2Mbps) and hence cost. Data volume generated over 16 hours of operation is ~ 875.5Gbits.
• Baseline design is best estimate of actual mass, power, and data rate (ie. No margins or contingency were added).

I n t e g r a t e d D e s i g n C a p a b i l i t y / I n s t r u m e n t D e s i g n L a b o r a t o r y
GEO CAPE FR Study: 8/6 – 8/12/2014 Presentation Delivered: Aug 12, 2014
Electrical, p20 Final Version
Backup Slides (Electrical Design Estimates)

I n t e g r a t e d D e s i g n C a p a b i l i t y / I n s t r u m e n t D e s i g n L a b o r a t o r y
GEO CAPE FR Study: 8/6 – 8/12/2014 Presentation Delivered: Aug 12, 2014
Electrical, p21 Final Version
Sample Stepper Motor Controller Circuit
(Assume 4 circuits on 1 Card, 4W)
(Notional: Basis of Estimate)
Figure 9.

I n t e g r a t e d D e s i g n C a p a b i l i t y / I n s t r u m e n t D e s i g n L a b o r a t o r y
GEO CAPE FR Study: 8/6 – 8/12/2014 Presentation Delivered: Aug 12, 2014
Electrical, p22 Final Version
Closed-Loop PID Heater Control & H/K
(Notional: Basis of Estimate)
Figure 10.

I n t e g r a t e d D e s i g n C a p a b i l i t y / I n s t r u m e n t D e s i g n L a b o r a t o r y
GEO CAPE FR Study: 8/6 – 8/12/2014 Presentation Delivered: Aug 12, 2014
Electrical, p23 Final Version
Single Board Computer
6U-220mm Front Side View
6U CompactPCI Single Board Computer
–A Double-sided 6U CompactPCI Single Board Computer–Populated with RAD750 capable of 133 MHz operation–PCI Bus rate of 33 MHz–20 Mbytes of Local Memory SRAM–MIL-STD-1553B Bus interface–4 bi-directional SpaceWire ports–Dimension 6U x 220mm (front side)•Dimension 6U x 160mm (back side)–Power is to be 15 Watts Average–+3.3V Nominal Operation •The EEPROM devices use +5.0V
Backplane Speed of 32Mbytes/sec (@ 33Mhz Bus Rate) ~ 256Mbps meets Raw Data Rate requirement of 56 Mbps

I n t e g r a t e d D e s i g n C a p a b i l i t y / I n s t r u m e n t D e s i g n L a b o r a t o r y
GEO CAPE FR Study: 8/6 – 8/12/2014 Presentation Delivered: Aug 12, 2014
Electrical, p24 Final Version
Teledyne SIDECAR ASIC
System (for) Image Digitization Enhancement Control And Retrieval
Manages FPA Operation and Science Data Digitization
36 Video Input Channels 20 Analog Output Channels
32 Digital I/O (Clocks) 20 Bias Generators 16-Bit Programmable Microprocessor

I n t e g r a t e d D e s i g n C a p a b i l i t y / I n s t r u m e n t D e s i g n L a b o r a t o r y
GEO CAPE FR Study: 8/6 – 8/12/2014 Presentation Delivered: Aug 12, 2014
Electrical, p25 Final Version
SIDECAR ASIC

I n t e g r a t e d D e s i g n C a p a b i l i t y / I n s t r u m e n t D e s i g n L a b o r a t o r y
GEO CAPE FR Study: 8/6 – 8/12/2014 Presentation Delivered: Aug 12, 2014
Electrical, p26 Final Version
155 MSPS 14-bit ADC
ADC14155QML-SP, TI (National Semiconductor)
• 14-bits, ENOB ~11.3• Sample Speed ~ 155MHz• Power consumption ~ 0.967W• Input Bandwidth ~ 1.1GHz• Input Range ~ 2V(p-p)

I n t e g r a t e d D e s i g n C a p a b i l i t y / I n s t r u m e n t D e s i g n L a b o r a t o r y
GEO CAPE FR Study: 8/6 – 8/12/2014 Presentation Delivered: Aug 12, 2014
Electrical, p27 Final Version
Teledyne HAWAII-1RG Read Out Integrated Circuit (ROIC)
HgCdTe Astronomy
Wide Area
Infrared Imager
1024 x 1024 Pixels Reference Pixels
Guide Mode

N A S A G O D D A R D S P A C E F L I G H T C E N T E R
I n t e g r a t e d D e s i g n C a p a b i l i t y / I n s t r u m e n t D e s i g n L a b o r a t o r y
GEO CAPE Filter Radiometer (FR) ~ Concept Presentations ~
Thermal Mike Choi
Aug 12, 2014

I n t e g r a t e d D e s i g n C a p a b i l i t y / I n s t r u m e n t D e s i g n L a b o r a t o r y
GEO CAPE FR Study: 8/6 – 8/12/2014 Presentation Delivered: Aug 12, 2014
Thermal, p2 Final Version
Summary of Cases
Baseline “Descope” Case
MCT HAWAII-4RG Detector UV/Vis/NIR Silicon CCD Detector
SIDECAR (1) Digitizers (2)

I n t e g r a t e d D e s i g n C a p a b i l i t y / I n s t r u m e n t D e s i g n L a b o r a t o r y
GEO CAPE FR Study: 8/6 – 8/12/2014 Presentation Delivered: Aug 12, 2014
Thermal, p3 Final Version
Operating Mode Thermal Requirements
Component Temperature (ºC) Temperature Stability (ºC)
MCT HAWAII-4RG (Baseline) -88 (185K) ±0.01
UV/Vis/NIR Silicon CCD (Descope)
20 (293K) ±0.1
Optics 20 ±3
Optical Bench 20 ±3
Optics Enclosure 20 ±3

I n t e g r a t e d D e s i g n C a p a b i l i t y / I n s t r u m e n t D e s i g n L a b o r a t o r y
GEO CAPE FR Study: 8/6 – 8/12/2014 Presentation Delivered: Aug 12, 2014
Thermal, p4 Final Version
Operating Mode Thermal Requirements
Component Temperature (ºC) Thermal Stability (ºC) ASC-CHU (2) -10 to 60 N/A
ASC DPU -10 to 40 N/A IMU Sensor -10 to 50 ±3
IMU Electronics Box -10 to 40 N/A Digitizer -10 to 40 ±5
Main Electronics Box (MEB) -10 to 40 N/A Roll Camera 0 to 45 N/A
Scan Mirror Mechanism -20 to 20 ±3 Fast Steering Mirror Mechanism -30 to 50 ±3
Diffuser Wheel Mechanism -10 to 60 N/A Jitter Suppression Mechanism -50 to 60 N/A
Filter Wheel Mechanism -20 to 20 N/A
Contamination Cover Mechanism -40 to 50 N/A

I n t e g r a t e d D e s i g n C a p a b i l i t y / I n s t r u m e n t D e s i g n L a b o r a t o r y
GEO CAPE FR Study: 8/6 – 8/12/2014 Presentation Delivered: Aug 12, 2014
Thermal, p5 Final Version
Survival Mode Thermal Requirements
Component Temperature (ºC)
MCT HAWAII-4RG (Baseline) -238 to 60
UV/Vis/NIR Silicon CCD (Descope) -40 to 60
Optics -30 to 60
Optical Bench -30 to 60
Optics Enclosure -30 to 60

I n t e g r a t e d D e s i g n C a p a b i l i t y / I n s t r u m e n t D e s i g n L a b o r a t o r y
GEO CAPE FR Study: 8/6 – 8/12/2014 Presentation Delivered: Aug 12, 2014
Thermal, p6 Final Version
Survival Mode Thermal Requirements
Component Temperature (ºC)
ASC-CHU -55 to 85
ASC DPU -30 to 60 IMU Sensor -30 to 60
IMU Electronics Box -30 to 60 Digitizer Baseline: -238 to 60; Descope: -40 to 60
Main Electronics Box (MEB) -30 to 60 Roll Camera -30 to 60
Scan Mirror Mechanism -30 to 60 Fast Steering Mirror Mechanism -30 to 60
Diffuser Wheel Mechanism -30 to 60 Jitter Suppression Mechanism -50 to 100
Filter Wheel Mechanism -30 to 60 Contamination Cover Mechanism -40 to 70

I n t e g r a t e d D e s i g n C a p a b i l i t y / I n s t r u m e n t D e s i g n L a b o r a t o r y
GEO CAPE FR Study: 8/6 – 8/12/2014 Presentation Delivered: Aug 12, 2014
Thermal, p7 Final Version
Operating Mode Power Dissipation
Component Power Dissipation (W)
MCT HAWAII-4RG (Baseline) 0.01
UV/Vis/NIR Silicon CCD (Descope) 4
Optics 0
Optical Bench 0
Optics Enclosure 0

I n t e g r a t e d D e s i g n C a p a b i l i t y / I n s t r u m e n t D e s i g n L a b o r a t o r y
GEO CAPE FR Study: 8/6 – 8/12/2014 Presentation Delivered: Aug 12, 2014
Thermal, p8 Final Version
Operating Mode Power Dissipation
Component Power Dissipation (W)
ASC-CHU (2) 0.9 each
ASC DPU 3.1 IMU Sensor 1
IMU Electronics Box 23 SIDECAR (Baseline) 2 Digitizer (Descope) 2@16
Main Electronics Box (MEB) 74.9 Roll Camera 23
Scan Mirror Mechanism 0.011 Fast Steering Mirror Mechanism 2.9
Diffuser Wheel Mechanism 2 Jitter Suppression Mechanism 5
Filter Wheel Mechanism 6.5
Contamination Cover Mechanism 0

I n t e g r a t e d D e s i g n C a p a b i l i t y / I n s t r u m e n t D e s i g n L a b o r a t o r y
GEO CAPE FR Study: 8/6 – 8/12/2014 Presentation Delivered: Aug 12, 2014
Thermal, p9 Final Version
Differences in Electronics Boxes & Mechanisms Power between Cases
•Electronics boxes and mechanisms have 145.2W power dissipation in baseline
•Descope case have 30 W more power indigitizer– Total power dissipation is 175.2 W
•30% uncertainty margin to assure conservatismin worst hot case thermal analysis

I n t e g r a t e d D e s i g n C a p a b i l i t y / I n s t r u m e n t D e s i g n L a b o r a t o r y
GEO CAPE FR Study: 8/6 – 8/12/2014 Presentation Delivered: Aug 12, 2014
Thermal, p10 Final Version
Standby Mode Power Dissipation
Power Dissipation (W)
Baseline Detector: 0.01; Electronics Boxes and Mechanisms: 79.7
Descope Detector: 4; Electronics Boxes and Mechanisms: 77.1

I n t e g r a t e d D e s i g n C a p a b i l i t y / I n s t r u m e n t D e s i g n L a b o r a t o r y
GEO CAPE FR Study: 8/6 – 8/12/2014 Presentation Delivered: Aug 12, 2014
Thermal, p11 Final Version
Instrument Thermal Interface with Spacecraft
•Instrument is thermally isolated fromspacecraft nadir deck
•Spacecraft geometry, dimensions andcomponents viewed by instrument are notknown

I n t e g r a t e d D e s i g n C a p a b i l i t y / I n s t r u m e n t D e s i g n L a b o r a t o r y
GEO CAPE FR Study: 8/6 – 8/12/2014 Presentation Delivered: Aug 12, 2014
Thermal, p12 Final Version
Orbit Parameters
•Geostationary orbit•35,786 km altitude•0º inclination

I n t e g r a t e d D e s i g n C a p a b i l i t y / I n s t r u m e n t D e s i g n L a b o r a t o r y
GEO CAPE FR Study: 8/6 – 8/12/2014 Presentation Delivered: Aug 12, 2014
Thermal, p13 Final Version
Beta Angle and Eclipse Duration
-30
-20
-10
0
10
20
30
11/2
0/20
19
12/2
0/20
19
1/20
/202
0
2/20
/202
0
3/20
/202
0
4/20
/202
0
5/20
/202
0
6/20
/202
0
7/20
/202
0
8/20
/202
0
9/20
/202
0
10/2
0/20
20
Beta
Ang
le (
°)

I n t e g r a t e d D e s i g n C a p a b i l i t y / I n s t r u m e n t D e s i g n L a b o r a t o r y
GEO CAPE FR Study: 8/6 – 8/12/2014 Presentation Delivered: Aug 12, 2014
Thermal, p14 Final Version
GEO Orbit
Sun’s Rays
24 Hour Orbit Period
0˚ Beta

I n t e g r a t e d D e s i g n C a p a b i l i t y / I n s t r u m e n t D e s i g n L a b o r a t o r y
GEO CAPE FR Study: 8/6 – 8/12/2014 Presentation Delivered: Aug 12, 2014
Thermal, p15 Final Version
GEO Orbit
24 Hour Orbit Period
Sun’s Rays
23.45˚ Beta

I n t e g r a t e d D e s i g n C a p a b i l i t y / I n s t r u m e n t D e s i g n L a b o r a t o r y
GEO CAPE FR Study: 8/6 – 8/12/2014 Presentation Delivered: Aug 12, 2014
Thermal, p16 Final Version
GEO Orbit
24 Hour Orbit Period
-23.45˚ Beta
Sun’s Rays

I n t e g r a t e d D e s i g n C a p a b i l i t y / I n s t r u m e n t D e s i g n L a b o r a t o r y
GEO CAPE FR Study: 8/6 – 8/12/2014 Presentation Delivered: Aug 12, 2014
Thermal, p17 Final Version
Issue of Solar Flux Entering Scan Aperture
0
10
20
30
40
50
60
70
80
0 3 6 9 12 15 18 21 24
GMT Time
Tem
pera
ture
C
Scan mirrorSecondary MirrorPrimary MirrorBaseplate
GOES-H Imager Scan Cavity Flight Temperature

I n t e g r a t e d D e s i g n C a p a b i l i t y / I n s t r u m e n t D e s i g n L a b o r a t o r y
GEO CAPE FR Study: 8/6 – 8/12/2014 Presentation Delivered: Aug 12, 2014
Thermal, p18 Final Version
Aperture Baffle Sizing
10˚
15 cm radius
85.0822 cm
r
h r = 0.1763 (h+85.0822)
h (cm) r (cm)
5 15.881
10 16.763
15 17.644
20 18.526
25 19.407

I n t e g r a t e d D e s i g n C a p a b i l i t y / I n s t r u m e n t D e s i g n L a b o r a t o r y
GEO CAPE FR Study: 8/6 – 8/12/2014 Presentation Delivered: Aug 12, 2014
Thermal, p19 Final Version
Aperture Baffle to Meet 16 Hours Continuous Science Operation
Solar flux entering scan cavity is
tracked in 15 minute intervals (i.e., 96 orbit positions) in
thermal model
Sun’s Rays

I n t e g r a t e d D e s i g n C a p a b i l i t y / I n s t r u m e n t D e s i g n L a b o r a t o r y
GEO CAPE FR Study: 8/6 – 8/12/2014 Presentation Delivered: Aug 12, 2014
Thermal, p20 Final Version
Aperture Baffle to Meet 16 Hours Continuous Science Operation
12
14
16
18
Scie
nce
Op
Tim
e (H
ours
)
Baffle Height (cm)

I n t e g r a t e d D e s i g n C a p a b i l i t y / I n s t r u m e n t D e s i g n L a b o r a t o r y
GEO CAPE FR Study: 8/6 – 8/12/2014 Presentation Delivered: Aug 12, 2014
Thermal, p21 Final Version
Sunlight Scattering
•If aperture baffle interior is coated withAeroglaze Z307 black paint (absorptance of0.96), sunlight incident on it will be diffuselyreflected
•Materials/coatings with near 1.0 solarabsorptance may be considered

I n t e g r a t e d D e s i g n C a p a b i l i t y / I n s t r u m e n t D e s i g n L a b o r a t o r y
GEO CAPE FR Study: 8/6 – 8/12/2014 Presentation Delivered: Aug 12, 2014
Thermal, p22 Final Version
Thermal Coating
•Radiators have optical solar reflector/indiumtin oxide (OSR/ITO) conductive coating
•MLI outer cover has conductive silvercomposite coating– Low absorptance and high emittance to keep temperature cool– Low surface resistivity

I n t e g r a t e d D e s i g n C a p a b i l i t y / I n s t r u m e n t D e s i g n L a b o r a t o r y
GEO CAPE FR Study: 8/6 – 8/12/2014 Presentation Delivered: Aug 12, 2014
Thermal, p23 Final Version
Detector Thermal Control
•Detectors are cold biased by passive cooling•Trim heaters maintain detector temperaturestable
•Detector thermally isolated from optical bench/optics enclosure
•Short thermal strap transfers heat fromdetector to cold finger
•Constant conductance heat pipe (CCHP)transfers heat from cold finger to North orSouth radiator
•Sun-shade/baffle for radiator– Exterior insulated with MLI
•CCHPs are insulated with MLI

I n t e g r a t e d D e s i g n C a p a b i l i t y / I n s t r u m e n t D e s i g n L a b o r a t o r y
GEO CAPE FR Study: 8/6 – 8/12/2014 Presentation Delivered: Aug 12, 2014
Thermal, p24 Final Version
Detector Thermal Control
•Parasitic heat load is major MCT HAWAII-4RG(baseline) detector heat load since detector andradiator are about 110K colder than opticsenclosure and optical bench, and radiatorsunshade also contributes heat load– 1 W plus 50% uncertainty margin
•Survival heaters– Bimetallic thermostats for heater control
•MCT HAWAII-4RG detector has decontaminationheater– Commanded on/off– Bimetallic thermostats for over-temperature protection

I n t e g r a t e d D e s i g n C a p a b i l i t y / I n s t r u m e n t D e s i g n L a b o r a t o r y
GEO CAPE FR Study: 8/6 – 8/12/2014 Presentation Delivered: Aug 12, 2014
Thermal, p25 Final Version
Electronics Boxes Thermal Control
•Electronics boxes thermally isolated fromoptical bench/optics enclosure
•Constant conductance heat pipe (CCHP)transfers heat from electronics boxes to Northor South radiator
•Sun-shade/baffle for radiator– Exterior insulated with MLI
•Electronics boxes and CCHPs are insulated withMLI
•Survival heaters– Bimetallic thermostats for heater control

I n t e g r a t e d D e s i g n C a p a b i l i t y / I n s t r u m e n t D e s i g n L a b o r a t o r y
GEO CAPE FR Study: 8/6 – 8/12/2014 Presentation Delivered: Aug 12, 2014
Thermal, p26 Final Version
Mechanism Thermal Control
•Scan Mirror, Filter Wheel, Fast Steering Mirror,Jitter Suppression and Diffuser Wheelmechanisms are thermally coupled toelectronics boxes CCHP
•Survival heaters for all mechanisms, includingcontamination cover mechanism– Bimetallic thermostats for heater control

I n t e g r a t e d D e s i g n C a p a b i l i t y / I n s t r u m e n t D e s i g n L a b o r a t o r y
GEO CAPE FR Study: 8/6 – 8/12/2014 Presentation Delivered: Aug 12, 2014
Thermal, p27 Final Version
Optical Bench and Optics Enclosure Thermal Control
•Optical Bench, Optics Enclosure and flexureshave active heater control and MLI– Bimetallic thermostats for heater control
•Survival heaters– Bimetallic thermostats for heater control

I n t e g r a t e d D e s i g n C a p a b i l i t y / I n s t r u m e n t D e s i g n L a b o r a t o r y
GEO CAPE FR Study: 8/6 – 8/12/2014 Presentation Delivered: Aug 12, 2014
Thermal, p28 Final Version
Optics and Optical Bench Thermal
•Instrument thermally isolated from spacecraft•Flexures and exterior of optics enclosure andoptical bench insulated with MLI thermal blankets
•Optical bench thermally isolated from spacecraft•Thermal coating for interior of optics enclosureand optical bench is Aeroglaze Z307 black paint
•Kapton film heaters attached to selected locationsof optics enclosure exterior and optical bench tomaintain optics at 20ºC in operating mode– Operating mode heater circuits controlled to 20ºC±3ºC by
mechanical thermostats
•Other heater circuits– Survival heaters

I n t e g r a t e d D e s i g n C a p a b i l i t y / I n s t r u m e n t D e s i g n L a b o r a t o r y
GEO CAPE FR Study: 8/6 – 8/12/2014 Presentation Delivered: Aug 12, 2014
Thermal, p29 Final Version
Standby Mode Power Management
•Detectors, mirror mechanisms and electronicsboxes, including digitizers, are in StandbyMode (6.5 hours) to primarily increasereliability
•Makeup heater power is required fordetectors, mechanisms and electronics boxes– Detector temperature needs to be maintained same as operating
mode – Temperature of electronics boxes maintained at 20˚C±3˚C

I n t e g r a t e d D e s i g n C a p a b i l i t y / I n s t r u m e n t D e s i g n L a b o r a t o r y
GEO CAPE FR Study: 8/6 – 8/12/2014 Presentation Delivered: Aug 12, 2014
Thermal, p30 Final Version
Radiator and Heater Power Sizing
•Radiators are sized in worst hot operating case•Operating mode heater power is sized in worstcold operating case
•GSFC Gold Rules call for a maximum of 70%heater duty cycle for an active heater controlthermal design– In sizing heater electrical resistance (R), orbital average heater power
shall be no more than 70% of peak heater power (V**2/R) • Valid for both bang-bang and proportional/integral/derivative (PID)
controllers

I n t e g r a t e d D e s i g n C a p a b i l i t y / I n s t r u m e n t D e s i g n L a b o r a t o r y
GEO CAPE FR Study: 8/6 – 8/12/2014 Presentation Delivered: Aug 12, 2014
Thermal, p31 Final Version
Radiator Sunshade
Sun’s Rays
(0˚±23.45˚)
Radiator
Sunshade (Highly Specular Interior)

I n t e g r a t e d D e s i g n C a p a b i l i t y / I n s t r u m e n t D e s i g n L a b o r a t o r y
GEO CAPE FR Study: 8/6 – 8/12/2014 Presentation Delivered: Aug 12, 2014
Thermal, p32 Final Version
Orbit Thermal Model
Worst Hot Case for Electronics Boxes
South Radiator and Detector Radiator
-23.45˚ Beta

I n t e g r a t e d D e s i g n C a p a b i l i t y / I n s t r u m e n t D e s i g n L a b o r a t o r y
GEO CAPE FR Study: 8/6 – 8/12/2014 Presentation Delivered: Aug 12, 2014
Thermal, p33 Final Version
Orbit Thermal Model
23.45˚ Beta
Worst Hot Case for Electronics Boxes North
Radiator

I n t e g r a t e d D e s i g n C a p a b i l i t y / I n s t r u m e n t D e s i g n L a b o r a t o r y
GEO CAPE FR Study: 8/6 – 8/12/2014 Presentation Delivered: Aug 12, 2014
Thermal, p34 Final Version
Thermal Model
Aperture Baffle (10˚ divergence;
20 cm long)
E-Box Radiator (N) and Sunshade (Baseline Size)
MLI Enclosure for E-Boxes
Optics Enclosure Nadir Deck
South
North
S/C (Notional)

I n t e g r a t e d D e s i g n C a p a b i l i t y / I n s t r u m e n t D e s i g n L a b o r a t o r y
GEO CAPE FR Study: 8/6 – 8/12/2014 Presentation Delivered: Aug 12, 2014
Thermal, p35 Final Version
Thermal Model
E-Box Radiator (S) and Sunshade
Detector Radiator (Baseline Size)
MLI Enclosure for E-Boxes
North
South
S/C (Notional)

I n t e g r a t e d D e s i g n C a p a b i l i t y / I n s t r u m e n t D e s i g n L a b o r a t o r y
GEO CAPE FR Study: 8/6 – 8/12/2014 Presentation Delivered: Aug 12, 2014
Thermal, p36 Final Version
Thermal Model
Detector Radiator Elevated to Prevent View to Other Components
or Solar Reflected to it

I n t e g r a t e d D e s i g n C a p a b i l i t y / I n s t r u m e n t D e s i g n L a b o r a t o r y
GEO CAPE FR Study: 8/6 – 8/12/2014 Presentation Delivered: Aug 12, 2014
Thermal, p37 Final Version
Issue of One Radiator (N or S) for Electronics Boxes and Mechanisms
Accommodation of a Large Radiator with Sunshade is a Potential Issue
(Thermal and mechanical) Baseline Radiator (one only)

I n t e g r a t e d D e s i g n C a p a b i l i t y / I n s t r u m e n t D e s i g n L a b o r a t o r y
GEO CAPE FR Study: 8/6 – 8/12/2014 Presentation Delivered: Aug 12, 2014
Thermal, p38 Final Version
Thermal Model
E-Box Radiator (N) and Sunshade
(Descope Case Size: About 20% Larger)

I n t e g r a t e d D e s i g n C a p a b i l i t y / I n s t r u m e n t D e s i g n L a b o r a t o r y
GEO CAPE FR Study: 8/6 – 8/12/2014 Presentation Delivered: Aug 12, 2014
Thermal, p39 Final Version
Thermal Model
Detector Radiator and Sunshade
(Descope Case Size; About Half of Baseline Size)

I n t e g r a t e d D e s i g n C a p a b i l i t y / I n s t r u m e n t D e s i g n L a b o r a t o r y
GEO CAPE FR Study: 8/6 – 8/12/2014 Presentation Delivered: Aug 12, 2014
Thermal, p40 Final Version
Detector Worst Cold Case Temperature Predictions (Heater Enabled)
-100
-80
-60
-40
-20
0
20
40
Tem
pera
ture
, ˚C
Time, hours
MCT HAWAII-4RG Detector UV/VIS/NIR Si CCD detector

I n t e g r a t e d D e s i g n C a p a b i l i t y / I n s t r u m e n t D e s i g n L a b o r a t o r y
GEO CAPE FR Study: 8/6 – 8/12/2014 Presentation Delivered: Aug 12, 2014
Thermal, p41 Final Version
Optics/Optical Bench Worst Cold Case Temperature Predictions (Heater Enabled)

I n t e g r a t e d D e s i g n C a p a b i l i t y / I n s t r u m e n t D e s i g n L a b o r a t o r y
GEO CAPE FR Study: 8/6 – 8/12/2014 Presentation Delivered: Aug 12, 2014
Thermal, p42 Final Version
Baseline Radiator Area Summary
Radiator Area (m2)
MCT HAWAII-4RG Detector 0.037
Electronics Boxes and Mechanisms North: 0.275 South: 0.275

I n t e g r a t e d D e s i g n C a p a b i l i t y / I n s t r u m e n t D e s i g n L a b o r a t o r y
GEO CAPE FR Study: 8/6 – 8/12/2014 Presentation Delivered: Aug 12, 2014
Thermal, p43 Final Version
Descope Case Radiator Area Summary
Radiator Area (m2)
UV/Vis/NIR Si CCD Detector 0.019
Electronics Boxes and Mechanisms North: 0.332 South: 0.332

I n t e g r a t e d D e s i g n C a p a b i l i t y / I n s t r u m e n t D e s i g n L a b o r a t o r y
GEO CAPE FR Study: 8/6 – 8/12/2014 Presentation Delivered: Aug 12, 2014
Thermal, p44 Final Version
Baseline Operating Mode Heater Circuits
Control Primary Circuits
Redundant Circuits
Optical Bench/Optics Enclosure
Mechanical Thermostats
12 12
MCT HAWAII-4RG Detector
Electronics Controller
1 1
Electronics Boxes and Mirror
Mechanisms (Standby Mode)
Mechanical Thermostats
13 13
Total 26 26

I n t e g r a t e d D e s i g n C a p a b i l i t y / I n s t r u m e n t D e s i g n L a b o r a t o r y
GEO CAPE FR Study: 8/6 – 8/12/2014 Presentation Delivered: Aug 12, 2014
Thermal, p45 Final Version
Descope Case Operating Mode Heater Circuits
Control Primary Circuits
Redundant Circuits
Optical Bench/Optics Enclosure
Mechanical Thermostats
12 12
UV/Vis/NIR Si CCD Detector
Electronics Controller
1 1
Electronics Boxes and Mirror
Mechanisms (Standby Mode)
Mechanical Thermostats
13 13
Total 26 26

I n t e g r a t e d D e s i g n C a p a b i l i t y / I n s t r u m e n t D e s i g n L a b o r a t o r y
GEO CAPE FR Study: 8/6 – 8/12/2014 Presentation Delivered: Aug 12, 2014
Thermal, p46 Final Version
Survival Heater Circuits (Mechanical Thermostat Control)
Primary Circuits Redundant Circuits Optical Bench/Optics Enclosure 6 6 Detector (Baseline or Descope) 1 1
MEB 1 1 IMU Electronics 1 1
IMU Sensor 1 1 Digitizer 1* 1* ASC/DPU 1 1 ASC/CHU 2 2
Roll Camera 1 1 Scan Mirror Mechanism 1 1
Fast Steering Mechanism 1 1 Diffuser Wheel Mechanism 1 1
Jitter Suppression Mechanism 1 1 Filter Wheel Mechanism 1 1
Contamination Cover Mechanism 1 1 Total 21** 21**
For Descope Case: *2 instead of 1
**22 instead of 21

I n t e g r a t e d D e s i g n C a p a b i l i t y / I n s t r u m e n t D e s i g n L a b o r a t o r y
GEO CAPE FR Study: 8/6 – 8/12/2014 Presentation Delivered: Aug 12, 2014
Thermal, p47 Final Version
Baseline Operating Mode Heater Power
Average Heater Power (W)
Optical Bench/Optics Enclosure 70
MCT HAWAII-4RG Detector 1.5
Total 71.5

I n t e g r a t e d D e s i g n C a p a b i l i t y / I n s t r u m e n t D e s i g n L a b o r a t o r y
GEO CAPE FR Study: 8/6 – 8/12/2014 Presentation Delivered: Aug 12, 2014
Thermal, p48 Final Version
Baseline Standby Mode Heater Power
Average Heater Power (W)
Optical Bench/Optics Enclosure 70
MCT HAWAII-4RG Detector 1.5
Electronics Boxes and Mirror Mechanisms
98
Total 170

I n t e g r a t e d D e s i g n C a p a b i l i t y / I n s t r u m e n t D e s i g n L a b o r a t o r y
GEO CAPE FR Study: 8/6 – 8/12/2014 Presentation Delivered: Aug 12, 2014
Thermal, p49 Final Version
Descope Case Operating Mode Heater Power
Average Heater Power (W)
Optical Bench/Optics Enclosure 70
UV/Vis/NIR Si CCD Detector 2
Total 72

I n t e g r a t e d D e s i g n C a p a b i l i t y / I n s t r u m e n t D e s i g n L a b o r a t o r y
GEO CAPE FR Study: 8/6 – 8/12/2014 Presentation Delivered: Aug 12, 2014
Thermal, p50 Final Version
Descope Case Standby Mode Heater Power
Average Heater Power (W)
Optical Bench/Optics Enclosure 70
MCT HAWAII-4RG Detector 2
Electronics Boxes and Mirror Mechanisms
136
Total 208

I n t e g r a t e d D e s i g n C a p a b i l i t y / I n s t r u m e n t D e s i g n L a b o r a t o r y
GEO CAPE FR Study: 8/6 – 8/12/2014 Presentation Delivered: Aug 12, 2014
Thermal, p51 Final Version
Baseline Cold Survival Heater Power
Average Heater Power (W)
Optics (Heaters on Optical Bench/Optics Enclosure)
40
MCT HAWAII-4RG Detector <<1
Electronics Boxes and Mechanisms
80
Total 120

I n t e g r a t e d D e s i g n C a p a b i l i t y / I n s t r u m e n t D e s i g n L a b o r a t o r y
GEO CAPE FR Study: 8/6 – 8/12/2014 Presentation Delivered: Aug 12, 2014
Thermal, p52 Final Version
Descope Case Cold Survival Heater Power
Average Heater Power (W)
Optics (Heaters on Optical Bench/Optics Enclosure)
40
UV/Vis/NIR Si CCD Detector 2
Electronics Boxes and Mechanisms
98
Total 140

I n t e g r a t e d D e s i g n C a p a b i l i t y / I n s t r u m e n t D e s i g n L a b o r a t o r y
GEO CAPE FR Study: 8/6 – 8/12/2014 Presentation Delivered: Aug 12, 2014
Thermal, p53 Final Version
Baseline Mass Estimates and TRL
Instrument Components Mass Each
(kg) Qty Mass Total
(kg) TRL MCT HAWAII-4RG Detector Radiator (0.037 m2; 0.254 cm aluminum) 0.2536 1 0.2536 7 Electronics Boxes and Mechanisms Radiator (0.275 m2; 0.254 cm aluminum) 1.8906 2 3.7812 7 MCT HAWAII-4RG Detector Radiator OSR/ITO and Adhesive (0.037 m2 ) 0.0475 1 0.0475 9 Electronics Boxes and Mechanisms Radiator OSR/ITO and Adhesive (0.275 m2 ) 0.3549 2 0.7098 9 MCT HAWAII-4RG Detector Radiator Sun-Shade (0.069 m2; aluminum) 0.2878 1 0.2878 7 Electronics Boxes and Mechanisms Radiator Sun-Shade Support Structure (0.851 m2; hogged out 0.254 cm aluminum) 0.8192 2 1.6384 7 Heat Pipe (CCHP) for MCT HAWAII-4RG Detector (1 m long; 1.27 cm diam.; aluminum; ethane) 0.2 2 0.4 7 Heat Pipe (CCHP) for Electronics Boxes and Mechanisms (3 m long; 1.27 cm diam.; aluminum; ammonia) 0.6 2 1.2 7 Spreader CCHP for Electronics Boxes and Mechanisms Radiator (0.5 m long; 1.27 cm diam.; aluminum; ammonia) 0.1 8 0.8 7 K1100 Heat Strap from MCT HAWAII-4RG Detector to Cold Finger (7.62 cm long) 0.132 1 0.132 7 Aeroglaze Z307 black paint for Optics Enclosure and Optical Bench (5 m2) 0.45 1 0.45 9 Aeroglaze Z307 black paint for aperture baffle interior (0.582 m2) 0.0194 1 0.0194 9 MLI (15-layers) on Backside ofMCT HAWAII-4RG detector Radiator (0.037 m2) 0.0222 1 0.0222 9 MLI (15-layers) for MCT HAWAII-4RG ethane heat pipes (0.12 m2) 0.072 1 0.072 9 MLI (15-layers) for Electronics Boxes and Mechanisms Heat Pipes (0.36 m2) 0.216 1 0.216 9 MLI (15-layers) for Optics Enclosure and Optical Bench (5 m2) 3 1 3 9
MLI (15-layers) for aperture baffle (0.215 m2) 0.129 1 0.129 9
MLI (15-layers) for aperture deployable contamination cover (0.126 m2) 0.0756 1 0.0756 9
MLI (15-layers) on Backside of Electronics Boxes and Mechanisms Radiator (0.275 m2) 0.165 2 0.33 9
MLI (15-layers) on MCT HAWAII-4RG Detector Radiator Sun-Shade (0.069 m2) 0.0407 1 0.0407 9
MLI (15-layers) on Electronics Boxes and Mechanisms Radiator Sun-Shade (0.851 m2) 0.478 2 0.956 9
MLI (15-layers) HAWAII-4RG ethane heat pipes (0.12 m2) 0.072 1 0.072 9

I n t e g r a t e d D e s i g n C a p a b i l i t y / I n s t r u m e n t D e s i g n L a b o r a t o r y
GEO CAPE FR Study: 8/6 – 8/12/2014 Presentation Delivered: Aug 12, 2014
Thermal, p54 Final Version
Baseline Mass Estimates and TRL
Instrument Components Mass Each
(kg) Qty Mass Total
(kg) TRL
MLI (15-layers) for Diffuser Wheel Enclosure (0.25 m2) 0.15 1 0.15 9
MLI (15-layers) for MCT HAWAII-4RG Detector Housing Exterior (0.08 m2) 0.048 2 0.096 9
MLI (15-layers) for MEB (0.247 m2) 0.148 1 0.148 9
MLI (15-layers) for MCT HAWAII-4RG Digitizers (0.1088 m2) 0.0653 1 0.0653 9
MLI (15-layers) for IMU Sensor (0.461 m2) 0.2768 1 0.2768 9
MLI (15-layers) for IMU Electronics Box (0.218 m2) 0.131 1 0.131 9
MLI (15-layers) for ASC DPU (0.107 m2) 0.064 1 0.064 9
MLI (15-layers) for ASC CHU and Baffles (0.032 m2) 0.019 2 0.038 9
MLI (15-layers) for roll camera (0.658 m2) 0.3948 1 0.3948 9
Thermistors/Platinum RTDs for Telemetry 0.001 30 0.03 9
Thermistors/Platinum RTDs for Heater Control (Redundancy included) 0.001 2 0.002 9
Thermostats for Op Heaters -- Honeywell 3100 Series (Redundancy included) 0.006 96 0.576 9
Thermostats for Survival Heaters -- Honeywell 3100 Series (Redundancy included) 0.006 96 0.576 9
Op Heaters -- Kapton Film 5.5 cm x 6.4 cm (Redundancy included) 0.002 8 0.016 9
Op Heaters -- Kapton Film 20 cm x 20 cm (Redundancy included) 0.0229 48 1.0992 9
Survival Heaters -- Kapton Film 5.5 cm x 6.4 cm (Redundancy included) 0.002 96 0.192 9
Buttons, Velcro and Tape for MLI 0.4 1 0.4 9 Adhesive (STYCAST, Nusil) and Aluminum Tape for Heaters, Thermostats and Thermistors/Platinum RTDs 0.3 1 0.3 9
Total 19.1883

I n t e g r a t e d D e s i g n C a p a b i l i t y / I n s t r u m e n t D e s i g n L a b o r a t o r y
GEO CAPE FR Study: 8/6 – 8/12/2014 Presentation Delivered: Aug 12, 2014
Thermal, p55 Final Version
Descope Case Mass Estimates and TRL
Instrument Components Mass Each
(kg) Qty Mass Total
(kg) TRL
UV/Vis/NIR Si CCD Detector Radiator (0.019 m2; 0.254 cm aluminum) 0.1302 1 0.1302 7 Electronics Boxes and Mechanisms Radiator (0.332 m2; 0.254 cm aluminum) 2.2825 2 4.565 7 UV/Vis/NIR Si CCD Detector Radiator OSR/ITO and Adhesive (0.019 m2 ) 0.0244 1 0.0244 9 Electronics Boxes and Mechanisms Radiator OSR/ITO and Adhesive (0.332 m2 ) 0.4285 2 0.857 9 UV/Vis/NIR Si CCD Detector Radiator Sun-Shade (0.069 m2; aluminum) 0.1478 1 0.1478 7 Electronics Boxes and Mechanisms Radiator Sun-Shade Support Structure (1.027 m2; hogged out 0.254 cm aluminum) 0.989 2 1.978 7 Heat Pipe (CCHP) for UV/Vis/NIR Si CCD Detector (1 m long; 1.27 cm diam.; aluminum; ammonia) 0.2 2 0.4 7 Heat Pipe (CCHP) for Electronics Boxes and Mechanisms (3 m long; 1.27 cm diam.; aluminum; ammonia) 0.6 2 1.2 7 Spreader CCHP for Electronics Boxes and Mechanisms Radiator (0.5 m long; 1.27 cm diam.; aluminum; ammonia) 0.1 8 0.8 7 K1100 Heat Strap from UV/Vis/NIR Si CCD Detector to Cold Finger (7.62 cm long) 0.132 2 0.264 7 Aeroglaze Z307 black paint for Optics Enclosure and Optical Bench (5 m2) 0.45 1 0.45 9 Aeroglaze Z307 black paint for aperture baffle interior (0.582 m2) 0.0194 1 0.0194 9 MLI (15-layers) on Backside of CCD detector Radiator (0.019 m2) 0.0114 1 0.0114 9 MLI (15-layers) for CCD ammonia heat pipes (0.12 m2) 0.072 1 0.072 9 MLI (15-layers) for Electronics Boxes and Mechanisms Heat Pipes (0.36 m2) 0.216 1 0.216 9 MLI (15-layers) for Optics Enclosure and Optical Bench (5 m2) 3 1 3 9 MLI (15-layers) for aperture baffle (0.215 m2) 0.129 1 0.129 9
MLI (15-layers) for aperture deployable contamination cover (0.126 m2) 0.0756 1 0.0756 9
MLI (15-layers) on Backside of Electronics Boxes and Mechanisms Radiator (0.332 m2) 0.1992 2 0.3984 9
MLI (15-layers) on UV/Vis/NIR Si CCD Detector Radiator Sun-Shade (0.069 m2) 0.0209 1 0.0209 9
MLI (15-layers) on Electronics Boxes and Mechanisms Radiator Sun-Shade (0.851 m2) 0.577 2 1.154 9

I n t e g r a t e d D e s i g n C a p a b i l i t y / I n s t r u m e n t D e s i g n L a b o r a t o r y
GEO CAPE FR Study: 8/6 – 8/12/2014 Presentation Delivered: Aug 12, 2014
Thermal, p56 Final Version
Descope Case Mass Estimates and TRL
Instrument Components Mass Each
(kg) Qty Mass Total
(kg) TRL
MLI (15-layers) for Diffuser Wheel Enclosure (0.25 m2) 0.15 1 0.15 9
MLI (15-layers) for UV/Vis/NIR Si CCD Detector Housing Exterior (0.08 m2) 0.0246 1 0.0246 9 MLI (15-layers) for MEB (0.247 m2) 0.148 1 0.148 9 MLI (15-layers) for UV/Vis/NIR Si CCD Digitizers (0.1088 m2) 0.0653 2 0.1306 9 MLI (15-layers) for IMU Sensor (0.461 m2) 0.2768 1 0.2768 9 MLI (15-layers) for IMU Electronics Box (0.218 m2) 0.131 1 0.131 9 MLI (15-layers) for ASC DPU (0.107 m2) 0.064 1 0.064 9 MLI (15-layers) for ASC CHU and Baffles (0.032 m2) 0.019 2 0.038 9 MLI (15-layers) for roll camera (0.658 m2) 0.3948 1 0.3948 9 Thermistors/Platinum RTDs for Telemetry 0.001 30 0.03 9 Thermistors/Platinum RTDs for Heater Control (Redundancy included) 0.001 2 0.002 9 Thermostats for Op Heaters -- Honeywell 3100 Series (Redundancy included) 0.006 96 0.576 9 Thermostats for Survival Heaters -- Honeywell 3100 Series (Redundancy included) 0.006 96 0.576 9 Op Heaters -- Kapton Film 5.5 cm x 6.4 cm (Redundancy included) 0.002 8 0.016 9 Op Heaters -- Kapton Film 20 cm x 20 cm (Redundancy included) 0.0229 48 1.0992 9 Survival Heaters -- Kapton Film 5.5 cm x 6.4 cm (Redundancy included) 0.002 96 0.192 9 Buttons, Velcro and Tape for MLI 0.4 1 0.4 9 Adhesive (STYCAST, Nusil) and Aluminum Tape for Heaters, Thermostats and Thermistors/Platinum RTDs 0.3 1 0.3 9 Total 20.4621

I n t e g r a t e d D e s i g n C a p a b i l i t y / I n s t r u m e n t D e s i g n L a b o r a t o r y
GEO CAPE FR Study: 8/6 – 8/12/2014 Presentation Delivered: Aug 12, 2014
Thermal, p57 Final Version
Conclusions
•20 cm long aperture baffle allows 16 hours of continuous science operation– Z307 black paint has 0.96-0.97 absorptance
•Near 1.0 solar absorptance coating/material may beconsidered to minimize scattering of sunlight thatimpinges aperture baffle interior
•Passive cooling meets thermal requirement for detectors •Two radiators, one North and one South, for electronicsboxes and mechanisms reduces thermal (and possiblymechanical packaging) risk of accommodating a largeradiator/sunshade on an unknown spacecraft
•Descope case has about 21% larger electronics andmechanisms radiator size/mass, smaller (half) detectorradiator size/mass, ammonia CCHPs instead of ethaneCCHPs for detector– Ethane CCHP is more expensive

N A S A G O D D A R D S P A C E F L I G H T C E N T E R
I n t e g r a t e d D e s i g n C a p a b i l i t y / I n s t r u m e n t D e s i g n L a b o r a t o r y
GEO CAPE Filter Radiometer (FR) ~ Concept Presentations ~
Pointing and Jitter Eric Stoneking Aug 12, 2014

I n t e g r a t e d D e s i g n C a p a b i l i t y / I n s t r u m e n t D e s i g n L a b o r a t o r y
GEO CAPE FR Study: 8/6 – 8/12/2014 Presentation Delivered: Aug 12, 2014
Pointing and Jitter, p2 Final Version
Host Spacecraft Disturbance Spectrum
• Blue curve is 160-arcsec RMS strawman
– Intended to berepresentative of commercial communications satellites
• Green curve isenvelope of GOES-13 data
– Finer low-frequencyattitude control
– More content at higherfrequency due to instrument mechanisms

I n t e g r a t e d D e s i g n C a p a b i l i t y / I n s t r u m e n t D e s i g n L a b o r a t o r y
GEO CAPE FR Study: 8/6 – 8/12/2014 Presentation Delivered: Aug 12, 2014
Pointing and Jitter, p3 Final Version
Passive Isolator
• Same design asGEO-CAPE WAS study
• 1.7-Hz bandwidth• Damping ratio = 0.1• Second-order roll
off (40 dB/decade)

I n t e g r a t e d D e s i g n C a p a b i l i t y / I n s t r u m e n t D e s i g n L a b o r a t o r y
GEO CAPE FR Study: 8/6 – 8/12/2014 Presentation Delivered: Aug 12, 2014
Pointing and Jitter, p4 Final Version
Fast Steering Controller
• Designed by specifyingdisturbance transmission transfer function (1-Gc)
– Highpass break frequency7 Hz
– Notch filter at 1.7 Hz• Counters isolator
resonance peak • Also improves mid-band
rejection of base disturbance inputs
• Plot is resulting Controller transfer function, Gc
• Controller Bandwidth(-3dB) is 17 Hz
– Requires IMU inputs at~100 Hz for good estimation

I n t e g r a t e d D e s i g n C a p a b i l i t y / I n s t r u m e n t D e s i g n L a b o r a t o r y
GEO CAPE FR Study: 8/6 – 8/12/2014 Presentation Delivered: Aug 12, 2014
Pointing and Jitter, p5 Final Version
Combined Isolator/Controller Disturbance Transmission
• Isolator rejectshigh- frequency base motion
• Fast steering looprejects low-frequency base motion
• Red curve iscombination of isolator and fast steering loop

I n t e g r a t e d D e s i g n C a p a b i l i t y / I n s t r u m e n t D e s i g n L a b o r a t o r y
GEO CAPE FR Study: 8/6 – 8/12/2014 Presentation Delivered: Aug 12, 2014
Pointing and Jitter, p6 Final Version
Base Input and LOS Output Spectrum
• Blue curve is 160-arcsec input spectrum
• Green curve is Line of Sight spectrum, including
– Isolator– Fast steering loop– Spacecraft position
knowledge error – Star tracker/IMU
attitude observer (on instrument)

I n t e g r a t e d D e s i g n C a p a b i l i t y / I n s t r u m e n t D e s i g n L a b o r a t o r y
GEO CAPE FR Study: 8/6 – 8/12/2014 Presentation Delivered: Aug 12, 2014
Pointing and Jitter, p7 Final Version
Accuracy and Stability Spectra
• Windowing splitsspectrum into “accuracy” (low-frequency) portion and “stability” (high-frequency) portion
• 5-second windowingshown

I n t e g r a t e d D e s i g n C a p a b i l i t y / I n s t r u m e n t D e s i g n L a b o r a t o r y
GEO CAPE FR Study: 8/6 – 8/12/2014 Presentation Delivered: Aug 12, 2014
Pointing and Jitter, p8 Final Version
Performance
• Pixel size is 250 m onground
• Accuracy requirement– Baseline: 0.25 pixel– Threshold: 1 pixel
• Stability requirement– Baseline: 0.1 pixel– Threshold: 0.5 pixel
Pointing Accuracy Capability
Window (sec)
Response to 160-arcsec Input
(arcsec RMS)
Response to GOES Input
(arcsec RMS)
0.5 0.284 0.270
1 0.278 0.269
2 0.274 0.269
5 0.271 0.269
Pointing Stability Capability
Window (sec)
Response to 160-arcsec Input
(arcsec RMS)
Response to GOES Input
(arcsec RMS)
0.5 0.084 0.016
1 0.105 0.019
2 0.115 0.020
5 0.120 0.019
Requirement: 0.36 Baseline
1.44 Threshold
Requirement: 0.14 Baseline
0.72 Threshold

I n t e g r a t e d D e s i g n C a p a b i l i t y / I n s t r u m e n t D e s i g n L a b o r a t o r y
GEO CAPE FR Study: 8/6 – 8/12/2014 Presentation Delivered: Aug 12, 2014
Pointing and Jitter, p9 Final Version
Conclusion
• With the assumed input spectra and notional isolation/control design,GEO-CAPE FR pointing accuracy and stability requirements are achievable
• Disturbance rejection in mid-frequency band is performance driver– Accomplished by combination of isolator and fast steering loop
• Fast steering loop requires IMU measurements at ~100 Hz sample rate– Roughly 5x 17-Hz closed-loop bandwidth– Fast steering bandwidth may be decreased if isolator resonance is also decreased

N A S A G O D D A R D S P A C E F L I G H T C E N T E R
I n t e g r a t e d D e s i g n C a p a b i l i t y / I n s t r u m e n t D e s i g n L a b o r a t o r y
GEO CAPE Filter Radiometer (FR) ~ Concept Presentations ~
Flight Software Kequan Luu
with modifications by JP Swinski
August 12, 2014

I n t e g r a t e d D e s i g n C a p a b i l i t y / I n s t r u m e n t D e s i g n L a b o r a t o r y
GEO CAPE FR Study: 8/6 – 8/12/2014 Presentation Delivered: Aug 12, 2014
Flight Software, p2 Final Version
Agenda
• Electrical Block Diagrams
• Flight Software Requirements
• Conceptual Architecture
• LOC Estimate for SEER Input
• Summary
• Back up charts (estimates, testing, etc.)

I n t e g r a t e d D e s i g n C a p a b i l i t y / I n s t r u m e n t D e s i g n L a b o r a t o r y
GEO CAPE FR Study: 8/6 – 8/12/2014 Presentation Delivered: Aug 12, 2014
Flight Software, p3 Final Version
Electrical Architecture (Baseline, MCT Detector)
Figure 1.
+ 28 V
Detector
Thermostats Heaters
Controlled Heaters
Thermistors
Mechanism Control
Digitizer
HAWAII-4RG
MCT
Readout (Digitizer)
Electronics SIDECAR
(FEE)
Filter Wheel Stepper Motors (2)
Encoder (position)
Scan Mirror DC Motor (2)
Encoder (position)
Fast Steering Mirror Voice-coil Actuators (4)
LVDT Position Sensors (4)
Jitter & Roll Compensation Voice-coil Actuator (3)
HOP Actuator (1)
signal
signal
signal
Spacecraft BusMain Electronics Box
Power
Avionics(C&DH)
RF Telecom
PowerPC 750
Processor Card
Filter Wheel Stepper Motor Control Card
Jitter Supression & Roll Compensation Voice-coil
Actuator Card
Fast Steering Mirror Voice-coil Actuator Card
Scan Mirror DC Motor Control Card
* Roll Camera & Electronics
Inertial Measurement Unit (IMU)
Survival Heaters
Attitude Control
Thermal Control
Star Trackers(2) & Electronics
+ 28V (Switched)
+ 28V (Switched)
RS422 (or 1553)
1pps time synch
CCSDS packets (LVDS or Spacewire)Data (LVDS)
(control)
(LV power)
drive (x2)
position (x2)
drive (x2)
position (x2)
drive (x4)
position (x4)
drive (x3)
Diffuser Wheel Stepper Motor Control Card
Heater Control & Housekeeping Card
backplane
(pwr)
Diffuser Wheel Stepper Motor
Encoder (position)
Low Voltage Power Converter (LVPC) Card + 28V
drive
position
* Assume custom built LEONProcessor card to process
feature recognition software with Spacewire interface to MEB. This
allows more margin to MEB processor and more modest
camera output data rate to MEB.
SpW
FSW

I n t e g r a t e d D e s i g n C a p a b i l i t y / I n s t r u m e n t D e s i g n L a b o r a t o r y
GEO CAPE FR Study: 8/6 – 8/12/2014 Presentation Delivered: Aug 12, 2014
Flight Software, p4 Final Version
1. Embed UT700 (Leon3FT) on Roll Camera I/O board
• Just moving 800KB/s into a Rad750 is not trivial, let alone the processing afterwards
• Localizing processing on the I/O board minimizes data transfers and offloadsan already taxed main processor
• The UT700 is a system on a chip minimizing board development; it has SpaceWirebuilt in which makes it easier to interface to an LRO/GPM heritage Rad750
• Dedicating a processor to the roll camera algorithm will allow more flexibility whiledecoupling the affects of that algorithm on C&DH processing
2. It may difficult to assume a Spacecraft will support 3 independent SpaceWire nodes
• Even if they do, are they running it through a SpaceWire router, then we need tounderstand backpressure from a router we don't own
• Consider running it through LRO/GPM heritage Rad750; even though the routeris aged, it is high performance if known issues are worked around
Recommendations
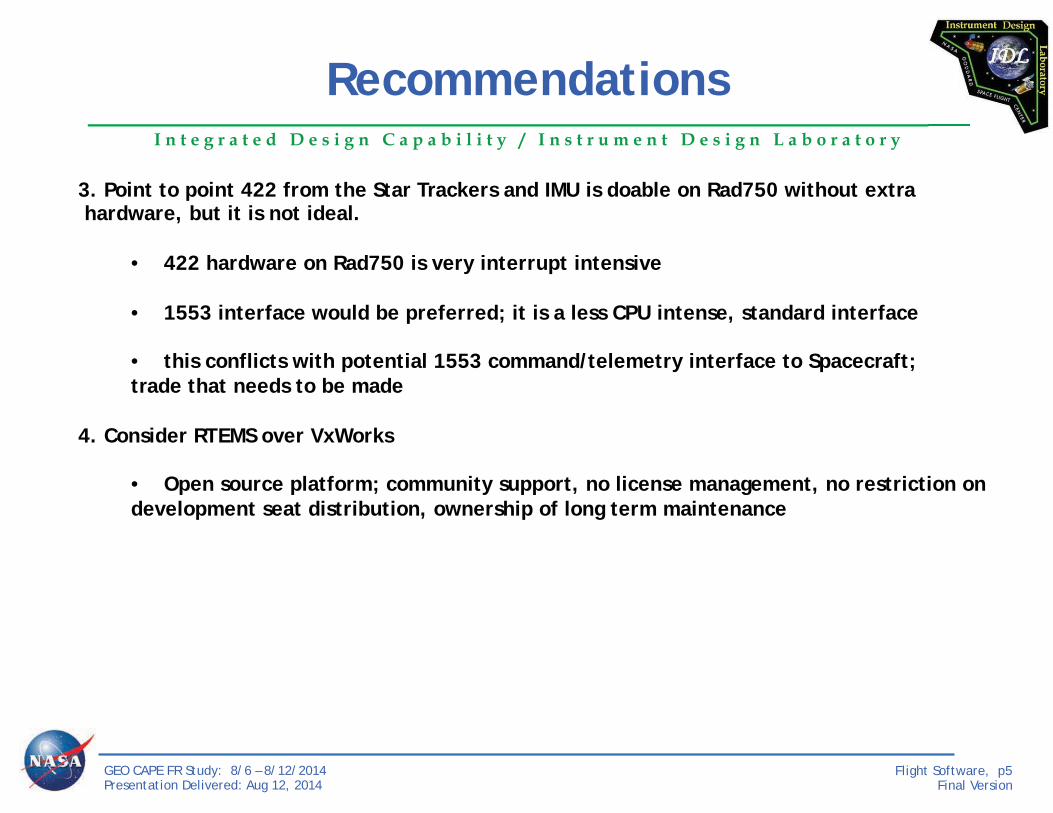
I n t e g r a t e d D e s i g n C a p a b i l i t y / I n s t r u m e n t D e s i g n L a b o r a t o r y
GEO CAPE FR Study: 8/6 – 8/12/2014 Presentation Delivered: Aug 12, 2014
Flight Software, p5 Final Version
3. Point to point 422 from the Star Trackers and IMU is doable on Rad750 without extra hardware, but it is not ideal.
• 422 hardware on Rad750 is very interrupt intensive
• 1553 interface would be preferred; it is a less CPU intense, standard interface
• this conflicts with potential 1553 command/telemetry interface to Spacecraft;trade that needs to be made
4. Consider RTEMS over VxWorks
• Open source platform; community support, no license management, no restriction ondevelopment seat distribution, ownership of long term maintenance
Recommendations

I n t e g r a t e d D e s i g n C a p a b i l i t y / I n s t r u m e n t D e s i g n L a b o r a t o r y
GEO CAPE FR Study: 8/6 – 8/12/2014 Presentation Delivered: Aug 12, 2014
Flight Software, p6 Final Version
Mission Operations Concept as documented in the systems presentation
Mode Function Frequency Duration Mechanism Configuration
Diffuser Wheel Mechanism
Scan Mirror Mechanism
FSM
Launch Closed, Off & Launch Locked
Off & Launch Locked
Off
Standby Health & Safety, FSW upload, Diagnostic, overnight
Daily ~7 Hours/day Closed; off Off Off
Science Survey & Targeted Daily 16 Hours/day Clear Move & Stare On
Cal – Moon Lunar radiometric cal When available, 3 to 5/Month ~5 min Clear Move &
Stare On
Cal – Sun Solar radiometric cal When available, Daily - Weekly ~5 min
Solar Diffuser or
Rare Earth Doped
Move & Stare On
Cal - Star Tracker
Calibrate instrument LOS wrt attitude hardware
Once per hour Continuously Any Move & Stare On
Cal - Dark Measure detector dark current and bias 2 x Daily ~5 min Closed N/A N/A

I n t e g r a t e d D e s i g n C a p a b i l i t y / I n s t r u m e n t D e s i g n L a b o r a t o r y
GEO CAPE FR Study: 8/6 – 8/12/2014 Presentation Delivered: Aug 12, 2014
Flight Software, p7 Final Version
Ephemeris Uncertainty
& Propagation Error
Top-Level Pointing System Diagram
ECEF ECI Instrument Frame
Alignment Error
Scan Mirror Frame
Pointing Control Motion
Scan mirror encoder
quantization & Mirror Control
Response
LOS Motion on Detector
Elements in optical Train
Host S/C Broad Band disturbance
Active Isolation System
Instrument Self-induced disturbances
Knowledge Control Jitter & Compensation
Linear Optical Model Matrix
KF(ST/IRU) On-board Ephemeris Processing
Target command: ECEF Ground
location & Scan Parameters
ECEF Uncertainty
Attitude Solution Error
Alignment Transformation
Mirror Motion Controller
FSM Motion Controller
Roll Camera
Feature Tracking
Model of Linear Feature
Feature Comparison
Roll Control
50 Hz
1 Hz
10 Hz
50 Hz
50 Hz

I n t e g r a t e d D e s i g n C a p a b i l i t y / I n s t r u m e n t D e s i g n L a b o r a t o r y
GEO CAPE FR Study: 8/6 – 8/12/2014 Presentation Delivered: Aug 12, 2014
Flight Software, p8 Final Version
Flight Software Requirements
– Mode management• Launch, Standby/Engineering, Calibration, Science,
etc.
– Instrument Support• Command processing (ST, IMU, Target, etc.)• Setup/Control digitizer board (i.e. detectors readout,
programmable integration period) • SIDECAR Code image storage & management of image
download to SIDECAR
• SIDECAR FSW Management (e.g. memory dump/load/table updates, etc.)
– Instrument pointing• Sensors data processing (ST, IMU, etc.)• Roll camera image processing/feature tracking• s/c ephemeris propagation• AD + Kalman Filter
– Mechanisms control/commanding• Scan Mirror @50Hz• Fast Steering Mirror @50Hz• Diffuser (commanded, 4 positions 90 degree)• Active Isolation System @50Hz• Filter Wheel management
– PID thermal controllers for the detectors (4x)@1Hz, +/- 0.1k stability
– Time Management – maintain time synch withspacecraft to sub second accuracy
– Collect and CCSDS packetization of HK dataincluding time stamping
– Autonomy (e.g. operations, FDC)– Limit Checker (safing, power & thermal
monitoring, etc.) – Store Command Processor
– Software Management (e.g. memory dump/load,software/table updates, etc.)
– Interfaces– 1PPS and time message from Spacecraft– 1553/RS422 cmd/data I/F to Spacecraft– SpaceWire science data I/F to Spacecraft– RS422 to ACS sensors (ST, IMU, Roll camera)– Store and forward S/C provided attitude data
• Derived– VxWork RTOS– Bootstrap– Health & Safety

I n t e g r a t e d D e s i g n C a p a b i l i t y / I n s t r u m e n t D e s i g n L a b o r a t o r y
GEO CAPE FR Study: 8/6 – 8/12/2014 Presentation Delivered: Aug 12, 2014
Flight Software, p9 Final Version
Flight SW Architecture
Inter-task Message Router (SW Bus)
EventServices
Stored Commanding
Software
Scheduler
ExecutiveServices
TimeServices
cFE LRO/LADEE/GPM Heritage
CFS LADEE/GPM Heritage
HK telemetry
Mode Manager
Software Bus
Checksum MemoryManager
HK DataStorage
Local Data
Storage
TableServices
Limit Checker
Re-engineered From LRO/GPM
Instrument Support
Spacecraft
1553/RS442 Control
Com
man
ds/
tab
les
Heath & Safety
Boot Loader
EEPROM SRAM
New or low reuse
Thermal Control
Sci
ence
D
ata
Mechanism Control
SPW Control
File Manager
AD/pointings/c EphemerisTFTP
Image Processing

I n t e g r a t e d D e s i g n C a p a b i l i t y / I n s t r u m e n t D e s i g n L a b o r a t o r y
GEO CAPE FR Study: 8/6 – 8/12/2014 Presentation Delivered: Aug 12, 2014
Flight Software, p10 Final Version
Processor Utilization Estimates
25 16 MHz Coldfire (effective rate) BAE750(%) 12Mhz ST5/SDO 60Mhz LROBase Value 0.75 3.75
Component 50 Mhz 32 Mhz Basis of EstimatecFE 0.12 0.19 LRO B2.5 Measured 0.05 0.19HK Data Storage 0.12 0.19 LRO B2.5 Measured 0.05 0.19Memory Manager 0.01 0.02 LRO B2.5 Measured 0.01 0.02Health & Safety 0.17 0.26 LRO B2.5 Measured 0.07 0.26Stored Commands 0.10 0.15 LRO B2.5 Measured 0.04 0.15Limit Checker 0.10 0.15 LRO B2.5 Measured 0.04 0.15Scheduler 1.46 2.29 LRO B2.5 Measured 0.61 2.29Checksum 0.48 0.75 LRO B2.5 Measured 0.20 0.75File Manager 0.02 0.04 LRO B2.5 Measured 0.01 0.04Mode Manager 0.02 0.04 Estimate 0.01 0.041553/RS422 Control 4.80 7.50 Estimate 2.00 7.50SpaceWire Control 6.00 9.38 Estimate 2.50 9.38Instrument Support 4.80 7.50 Estimate 2.00 7.50TFTP 2.40 3.75 Estimate 1.00 3.75Image Data Processing 76.80 120.00 Estimate 32.00 120.00ACS Orbit Models 4.80 7.50 Estimate 0.50 7.50AD/Pointing 115.20 180.00 Estimate 12.00 180.00Mechanisms Control 144.00 225.00 Estimate 15.00 225.00Thermal Control 7.20 11.25 Estimate 0.75 11.25Subtotal 368.60 575.94 68.83
CPU Percentages
~31% Margin
0.00
36.83
~63 Margin
Updates
0.01
Filter Manager

I n t e g r a t e d D e s i g n C a p a b i l i t y / I n s t r u m e n t D e s i g n L a b o r a t o r y
GEO CAPE FR Study: 8/6 – 8/12/2014 Presentation Delivered: Aug 12, 2014
Flight Software, p11 Final Version
Onboard Data Processing Assessment (Hazardous Site Identification)
MIPS Time required (seconds)
Quad-Core AMD Opteron(tm) Processor 8356
10,500 309
RAD750 240 13,518GSFC SpaceCube 2.0 5,000 648
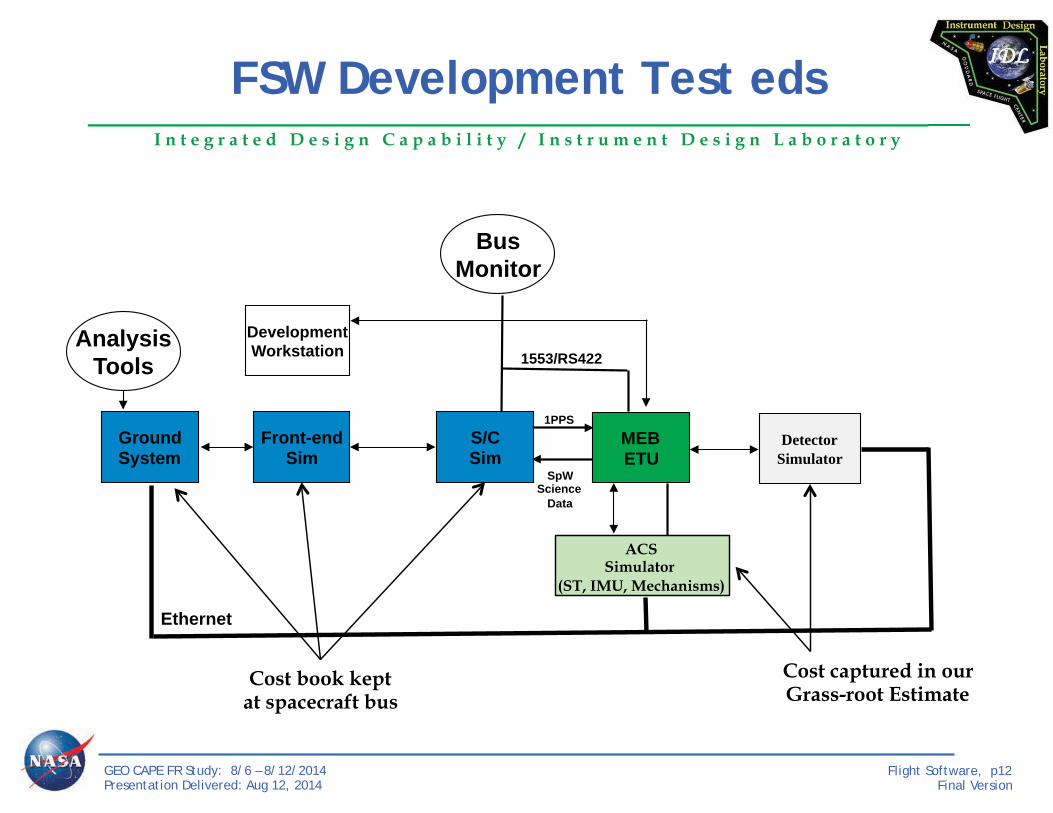
I n t e g r a t e d D e s i g n C a p a b i l i t y / I n s t r u m e n t D e s i g n L a b o r a t o r y
GEO CAPE FR Study: 8/6 – 8/12/2014 Presentation Delivered: Aug 12, 2014
Flight Software, p12 Final Version
FSW Development Test eds
Detector Simulator
Ground System
S/C Sim
Front-end Sim
Development Workstation 1553/RS422
Ethernet
MEB ETU
1PPS
SpW Science
Data
Analysis Tools
Bus Monitor
Cost book kept at spacecraft bus
Cost captured in our Grass-root Estimate
ACS Simulator
(ST, IMU, Mechanisms)

I n t e g r a t e d D e s i g n C a p a b i l i t y / I n s t r u m e n t D e s i g n L a b o r a t o r y
GEO CAPE FR Study: 8/6 – 8/12/2014 Presentation Delivered: Aug 12, 2014
Flight Software, p13 Final Version
Basis of Cost Estimate
– FSW development costs estimated using SEER: System Evaluation & Estimation of Resources
• Separate modules for Hardware, Software, Integrated Circuits, Manufacturability and LifeCycle
• NASA-wide site license for SEER managed by Langley Research Center• The IDL made in-house assumptions for FSW re-use and labor efforts; the IDL cannot
confidently make assumptions about unknown vendor reuse libraries or control measures, or labor efforts or experience, so we apply GSFC reuse and labor assumptions
– Grassroots test bed costs• FSW test bed simulator software development 3 FTE• FSW development tools and test bed GSE $251k
• $6k for 3 pc• $15k for 1553/RS422 bus monitor• $180k custom simulator hardware• $50k for software development tools and VxWorks• The SpW bus monitor/test set is quite expensive and is not needed most of the time,
assumed one is available to share with other GSFC projects

I n t e g r a t e d D e s i g n C a p a b i l i t y / I n s t r u m e n t D e s i g n L a b o r a t o r y
GEO CAPE FR Study: 8/6 – 8/12/2014 Presentation Delivered: Aug 12, 2014
Flight Software, p14 Final Version
SLOC Estimate

I n t e g r a t e d D e s i g n C a p a b i l i t y / I n s t r u m e n t D e s i g n L a b o r a t o r y
GEO CAPE FR Study: 8/6 – 8/12/2014 Presentation Delivered: Aug 12, 2014
Flight Software, p15 Final Version
Summary and Recommendations
• Line Of Code estimation shows ~80% code reuse for MEB– High heritage based on GSFC CFS approach– An implementation at another Center or at an experienced Vendor should also
take advantage of reuse algorithms, but the specific ratio should be evaluated – No technical show-stoppers
• Significant flight computational resources are needed If additionalscience data processing/reduction is to be implemented onboard (i.e. hazardous site identification). Flight computing options: – Spacecube 2.0: GSFC developed, older version demonstrated on ISS– Maestro: maximum 7x7 = 49 cores; the team is working on a 4x4 flight version– Xilinx Virtex 7: capable of hosting many ARM processor cores. 587 is working to get
a prototype board – BAE RAD5545 Quad Core– NASA/DoD recently put out a RFP for high performance computing technology
development – Recommendation: benchmark the Image Data Processing and the Hazard Site
Identification algorithms on a RAD750 and on a Spacecube 2.0 – Recommendation: benchmark the Image Data Processing on UT700 (Leon3FT)

I n t e g r a t e d D e s i g n C a p a b i l i t y / I n s t r u m e n t D e s i g n L a b o r a t o r y
GEO CAPE FR Study: 8/6 – 8/12/2014 Presentation Delivered: Aug 12, 2014
Flight Software, p16 Final Version
582/587 Technology Road Map

I n t e g r a t e d D e s i g n C a p a b i l i t y / I n s t r u m e n t D e s i g n L a b o r a t o r y
GEO CAPE FR Study: 8/6 – 8/12/2014 Presentation Delivered: Aug 12, 2014
Flight Software, p17 Final Version
SpaceCube 2.0 Use Cases
Lower FSW heritage than RAD750 base

I n t e g r a t e d D e s i g n C a p a b i l i t y / I n s t r u m e n t D e s i g n L a b o r a t o r y
GEO CAPE FR Study: 8/6 – 8/12/2014 Presentation Delivered: Aug 12, 2014
Flight Software, p18 Final Version
Processor Comparison
MIPS Power MIPS/W
MIL-STD-1750A 3 15W 0.2RAD6000 35 10-20W 2.331
RAD750 300 10-20W 202
SPARC V8 86 1W3 863
LEON 3FT 60 3-5W3 153
GSFC SpaceCube 1.0 3000 5-15W 4004
GSFC SpaceCube 2.0 5000 10-20W 5005

I n t e g r a t e d D e s i g n C a p a b i l i t y / I n s t r u m e n t D e s i g n L a b o r a t o r y
GEO CAPE FR Study: 8/6 – 8/12/2014 Presentation Delivered: Aug 12, 2014
Flight Software, p19 Final Version

I n t e g r a t e d D e s i g n C a p a b i l i t y / I n s t r u m e n t D e s i g n L a b o r a t o r y
GEO CAPE FR Study: 8/6 – 8/12/2014 Presentation Delivered: Aug 12, 2014
Flight Software, p20 Final Version
SpaceCube Family Overview

I n t e g r a t e d D e s i g n C a p a b i l i t y / I n s t r u m e n t D e s i g n L a b o r a t o r y
GEO CAPE FR Study: 8/6 – 8/12/2014 Presentation Delivered: Aug 12, 2014
Flight Software, p21 Final Version
HyspiRI Demonstration Testbed

I n t e g r a t e d D e s i g n C a p a b i l i t y / I n s t r u m e n t D e s i g n L a b o r a t o r y
GEO CAPE FR Study: 8/6 – 8/12/2014 Presentation Delivered: Aug 12, 2014
Flight Software, p22 Final Version
SpaceCube 2.0 Processor Card
System EDU FLT Notes1.0 $500K $850K RNS configuration1.5 $200K N/A All commercial parts2.0 $640K $1.1MMini $300K $600K Best guest for now

I n t e g r a t e d D e s i g n C a p a b i l i t y / I n s t r u m e n t D e s i g n L a b o r a t o r y
GEO CAPE FR Study: 8/6 – 8/12/2014 Presentation Delivered: Aug 12, 2014
Flight Software, p23 Final Version
SpaceCube 2.0 Data & Processing Flow Diagram
Virtex 5 FGPA
Science Data Processing
Virtex 5 FPGA
Science Data Reduction Image Proc
(SIRF)
SATA
Science Data Processing High Data Rate Low Reliability
Low Data Rate High Reliability
Cmd/control
I/O Memory
S/C
Cmd/HK RS422
SpaceCube 2.0
Power
512 MB SRAM
8 GB flash
Front End Electronics (FEE)
& DBB
SpW Science data
uB uB uB uB
150x4 MIPS
Leon3FT Cmd/control
FSW
Mission Unique Mission Unique
Cameras

I n t e g r a t e d D e s i g n C a p a b i l i t y / I n s t r u m e n t D e s i g n L a b o r a t o r y
GEO CAPE FR Study: 8/6 – 8/12/2014 Presentation Delivered: Aug 12, 2014
Flight Software, p24 Final Version
Backup Slides
• Development Approach• Management Approach• Verification & Validation

I n t e g r a t e d D e s i g n C a p a b i l i t y / I n s t r u m e n t D e s i g n L a b o r a t o r y
GEO CAPE FR Study: 8/6 – 8/12/2014 Presentation Delivered: Aug 12, 2014
Flight Software, p25 Final Version
• Reuse LRO/GPM C&DH FSW (Med to high heritage, low risk - LRO launched 2009,GPM launch 2014)
– LRO/GPM FSW Features (based on 582’s Core Flight Executive)• Developed using FSW best practices consistent w/NPR 7150.2• Onboard file systems and associated file transfer mechanisms• Onboard networks with standard interfaces• Standard application interfaces (API) for ease of development and rapid prototyping• Dynamic application loading, middleware (SB) provide dynamic cmd/tlm registration• POSIX APIs and open source Integrated Development Environment
– Benefits• Will enable parallel collaborative development and system interoperability• Will automate many previously manual development activities• Will simplify technology infusion and system evolution during development and on-orbit• Will enable rapid deployment of low cost, high quality mission software
• Reengineer LRO/GPM FSW for all mission specific components– Mission-specific ops concept support, thermal electronics, etc.
FSW Development Approach

I n t e g r a t e d D e s i g n C a p a b i l i t y / I n s t r u m e n t D e s i g n L a b o r a t o r y
GEO CAPE FR Study: 8/6 – 8/12/2014 Presentation Delivered: Aug 12, 2014
Flight Software, p26 Final Version
• Product Development Process Will Comply with NPR 7150.2 (NASA SoftwareEngineering Requirements and GOLD Rule)
• Development– Product Development Plan per 582 branch standards, approve by Branch & Project– Detailed FSW development schedule integrated with project & subsystems schedules– Requirements management using MKS tool– Monthly PSR with AETD & project; branch status reviews– Weekly system engineering meetings, FSW team meetings– FSW Design & Code reviews– Major milestones (SCR, PDR, CDR, etc)
• Configuration Management– FSW CM Plan per 582 branch standards, approve by Branch & Project– Commercial CM tool (i.e., MKS) to manage source codes and document– Proposed FSW changes affecting missions requirements, cost and/or schedule will be
forwarded to Project level CCB
• Test Plan– FSW Test Plan per 582 branch standards, approve by Branch & Project
Management Approach

I n t e g r a t e d D e s i g n C a p a b i l i t y / I n s t r u m e n t D e s i g n L a b o r a t o r y
GEO CAPE FR Study: 8/6 – 8/12/2014 Presentation Delivered: Aug 12, 2014
Flight Software, p27 Final Version
FSW Verification and Validation
• Unit Test– Done by developers using PC tools– Follow Branch 582 Unit Level Test Standard - Tailored– Includes Path testing, Input/Output testing, Boundary testing, and Error Reporting verification– Occasionally BB H/W is required to verify H/W I/F
• Build Integration Test– Done by developers to verify that the FSW performs properly on the BB H/W in the FSW
testbeds using embedded system tools – First level functionality ensured for integrated software– Build Test Team to assist in GSE I/F checkout
• Build Verification Test– Done by independent test team with Science Team support on the BB H/W in the FSW
testbeds using embedded system tools – Test each requirement in the Flight Software Requirements documents (where possible at the
build level) – Use test scenarios to test requirements in both a positive and negative fashion.– Scenarios constructed to combine requirements that are logically connected to create a test
flow. – Automation to be utilized as much as possible– Requirements Traceability Matrix maintained

N A S A G O D D A R D S P A C E F L I G H T C E N T E R
I n t e g r a t e d D e s i g n C a p a b i l i t y / I n s t r u m e n t D e s i g n L a b o r a t o r y
GEO CAPE Filter Radiometer (FR) ~ Concept Presentations ~
Contamination Mark Secunda Aug 12, 2014

I n t e g r a t e d D e s i g n C a p a b i l i t y / I n s t r u m e n t D e s i g n L a b o r a t o r y
GEO CAPE FR Study: 8/6 – 8/12/2014 Presentation Delivered: Aug 12, 2014
Contamination, p2 Final Version
Filter Radiometer
• Key Parameters:• Geostationary• Commercial Satellite• Covers wavelengths from
350-1050 nm • 10% throughput loss acceptable

I n t e g r a t e d D e s i g n C a p a b i l i t y / I n s t r u m e n t D e s i g n L a b o r a t o r y
GEO CAPE FR Study: 8/6 – 8/12/2014 Presentation Delivered: Aug 12, 2014
Contamination, p3 Final Version
FR Concerns
• Commercial satellite I&T not done to the same cleanliness standards as we’re usedto.
– The FR instrument will need extra protection against unknowns• Well sealed instrument• Aperture one-time deploy cover• Purge
– Likely a special request - often not used at all for commercial satellites
– Lack of satellite contamination requirements may affect radiator EOL values– Need to confirm nothing is in the line of sight to aperture
• Large wavelength band means sensitivity to lots of materials• Medium number of optics and surfaces
– Bake outs may be required• Will help with consistency• Some margin available for satellite unknowns
• Electrostatic Return (ESR) of contamination can be a problem if the hostspacecraft and instrument aren’t completely grounded

I n t e g r a t e d D e s i g n C a p a b i l i t y / I n s t r u m e n t D e s i g n L a b o r a t o r y
GEO CAPE FR Study: 8/6 – 8/12/2014 Presentation Delivered: Aug 12, 2014
Contamination, p4 Final Version
FR Wavelength Sensitivity
• Baseline– Detector range 350-1640 nm– 10 optical surfaces– 1 cryo MCT detector (185K range)– Estimate for 10% throughput loss, launch to end-of-life, is ~580 Angstroms per surface, and
~360 Angstroms for the detector • Good contamination margin on optics, reasonable margin on detector
• Delta– Detector range 350-1050 nm– 10 optical surfaces– 1 Silicon detector (293K range)– Estimate for 10% throughput loss, launch to end-of-life, is ~480 Angstroms per surface, and
~480 Angstroms for the detector – Good contamination margin on optics and detector

I n t e g r a t e d D e s i g n C a p a b i l i t y / I n s t r u m e n t D e s i g n L a b o r a t o r y
GEO CAPE FR Study: 8/6 – 8/12/2014 Presentation Delivered: Aug 12, 2014
Contamination, p5 Final Version
Effects on Processes
• Multiple optics with limited throughput loss means more care– bake-outs for internal components– Clean bench use for subassemblies, clean rooms for assemblies
• Sealing required to protect against possibly unclean spacecraft build• Sealing detector should help, but presents its own contamination challenges• May not allow spacecraft level testing with aperture open• Instrument purge
– Cost, complexity, schedule impacts

I n t e g r a t e d D e s i g n C a p a b i l i t y / I n s t r u m e n t D e s i g n L a b o r a t o r y
GEO CAPE FR Study: 8/6 – 8/12/2014 Presentation Delivered: Aug 12, 2014
Contamination, p6 Final Version
Conclusions
• Internally, nothing unusual• A somewhat contamination sensitive instrument on a satellite with no
contamination concerns, and no ability to enforce requirements, is problematic. – A well sealed instrument should mitigate this.– Large allowable throughput loss (10%) and warm detector helps

N A S A G O D D A R D S P A C E F L I G H T C E N T E R
I n t e g r a t e d D e s i g n C a p a b i l i t y / I n s t r u m e n t D e s i g n L a b o r a t o r y
GEO CAPE Filter Radiometer (FR) ~ Concept Presentations ~
Reliability Aron Brall
Aug 12, 2014

I n t e g r a t e d D e s i g n C a p a b i l i t y / I n s t r u m e n t D e s i g n L a b o r a t o r y
GEO CAPE FR Study: 8/6 – 8/12/2014 Presentation Delivered: Aug 12, 2014
Reliability, p2 Final Version
Reliability Requirements
• Success criteria– Class C mission– 3 year mission requirement with an Instrument Probability of Success
(Ps) of 0.85 or greater at 3 years– 5 year mission goal– 2 Configurations – Baseline and Descope
• Reliability Assurance– Designs are validated with appropriate Reliability Analyses – FTA,
FMEA, Parts Stress Analysis, PRA, etc– Parts are Level 3 (Class S or Class B upscreened to requirements of
EEE-INST-002 for Level 3 parts)• Designs meet NASA and GSFC specifications including:
– EEE-INST-002– GEVS (GSFC-STD-7000: General Environmental Verification Standard)– GSFC Gold Rules (GSFC-STD-1000)– NPR-8705-4

I n t e g r a t e d D e s i g n C a p a b i l i t y / I n s t r u m e n t D e s i g n L a b o r a t o r y
GEO CAPE FR Study: 8/6 – 8/12/2014 Presentation Delivered: Aug 12, 2014
Reliability, p3 Final Version
Reliability Assumptions - 1
• Component lifetimes follow the exponential distribution exceptbearings and gears which are modeled using the Weibull distribution
• The following are considered non-credible single point failures (SPF):– Structural and non-moving mechanical components– Short or open on power bus– Flexure Failures– Optical Failures (non active components)
• Software and procedural failures are not included in the analysis– Software is modeled as reliability of 1– Software Reliability needs to be formally addressed in development
process • Software can have as low as 80% Reliability if this is not seriously
addressed • Standby (Idle Time) Reliability was not addressed• Reliability of Host Spacecraft and Launch Vehicle were not assessed

I n t e g r a t e d D e s i g n C a p a b i l i t y / I n s t r u m e n t D e s i g n L a b o r a t o r y
GEO CAPE FR Study: 8/6 – 8/12/2014 Presentation Delivered: Aug 12, 2014
Reliability, p4 Final Version
Reliability Assumptions - 2
•Exact models were used to determine subsystemreliabilities– Binomial models for k of n subsystems:
•Detector and Roll Camera Arrays– 4055 of 4096 rows for 4096 X 4096 detector– 3000 of 3072 rows for 4096 X 3072 Roll Camera
sensor – Hot Standby Redundant exponential models for:
•Operational and Survival Heater Circuits– All other components are Single String

I n t e g r a t e d D e s i g n C a p a b i l i t y / I n s t r u m e n t D e s i g n L a b o r a t o r y
GEO CAPE FR Study: 8/6 – 8/12/2014 Presentation Delivered: Aug 12, 2014
Reliability, p5 Final Version
Reliability Assumptions - 3
• Bearing loads on rotating assemblies are loaded to theirrecommended preloads per manufacturers recommendations.
• On orbit rotating radial loads in addition to the preloads arenegligible and do not exceed preloads. – These are very small loads with respect to a typical dynamic load
rating on a bearing – Suggests extremely long lifetimes at the low speeds the design is
calling for • Launch loads on the bearings do not exceed their static load ratings
to create initial damage. • Lubrication to the bearings is adequate, and are maintained in clean
room conditions (from bearing manufacturer) during integration • CCD Row failures occur randomly and will not be concentrated in one
given area – Multiple adjacent rows failing is more severe degradation than rows
failing in multiple isolated areas on the CCD

I n t e g r a t e d D e s i g n C a p a b i l i t y / I n s t r u m e n t D e s i g n L a b o r a t o r y
GEO CAPE FR Study: 8/6 – 8/12/2014 Presentation Delivered: Aug 12, 2014
Reliability, p6 Final Version
Reliability Assumptions - 4
•Duty Cycles– Diffuser Wheel -- 5% – Filter Wheel -- 10% – Scan Mirror Bearings -- 1% – Operational Heaters -- 70% – Survival Heaters -- 10% – All other components -- 100%

I n t e g r a t e d D e s i g n C a p a b i l i t y / I n s t r u m e n t D e s i g n L a b o r a t o r y
GEO CAPE FR Study: 8/6 – 8/12/2014 Presentation Delivered: Aug 12, 2014
Reliability, p7 Final Version
System Description - 1
•Detectors– Baseline - UV/VIS/NIR/SWIR Mercury Cadmium
Telluride • 4096 rows X 4096 columns in two arrays
– 1% row loss permitted over life for grouped array– Descope - UV/VIS/NIR Silicon CCD - 4096 rows X 4096
columns – 1% row loss permitted over life each array
• Roll Camera– Two cameras each: 3072 rows X 4096 columns
– Substantial row loss permitted over life eacharray (Modeled at 2.5%)

I n t e g r a t e d D e s i g n C a p a b i l i t y / I n s t r u m e n t D e s i g n L a b o r a t o r y
GEO CAPE FR Study: 8/6 – 8/12/2014 Presentation Delivered: Aug 12, 2014
Reliability, p8 Final Version
System Description - 2
• Electronics– Processor Card -- 1 Card – Heater Control & H/K -- 1 Card – Scan Motor Control -- 1 Card – FSM Voice-Coil Control -- 1 Card – Filter Wheel Control -- 1 Card – Diffuser Wheel Control -- 1 Card – Jitter & Roll Voice Coil Control -- 1 Card – Power Converter -- 1 Card – Digitizer -- 1 Cards (Baseline )
4 Cards (Descope)– HAWAII ROIC Sidecar for SWIR -- 1 Device (Baseline) – Camera Processor & I/O -- 1 Card
• ACS– IMU -- 1 Astrix 200 – Star Tracker -- μASC, 2 heads, 1processor

I n t e g r a t e d D e s i g n C a p a b i l i t y / I n s t r u m e n t D e s i g n L a b o r a t o r y
GEO CAPE FR Study: 8/6 – 8/12/2014 Presentation Delivered: Aug 12, 2014
Reliability, p9 Final Version
System Description - 3
• Mechanisms– Diffuser Wheel
• Stepper Motor• Encoder• Gear Set
– Scan Mirror• 2 axes each with:
– Torquer Motor (Frameless)– 24 bit Encoder– Mechanism Bearings (2)
– Fast Scan Mirror – 2 axes each with:• 2 Voice Coil actuators• 2 LVDT position detectors
– Filter Wheels• 2 Stepper Motors• 2 Encoders• 2 Gear Sets• Optical Switches (20)• Filter Wheel Bearings (30)
– Jitter Suppression/RollCorrection • 3 Flexure Mounts (not
modeled) • 3 Voice Coil Actuators
– Contamination Door• Redundant HOP actuators
each with Redundant Heaters

I n t e g r a t e d D e s i g n C a p a b i l i t y / I n s t r u m e n t D e s i g n L a b o r a t o r y
GEO CAPE FR Study: 8/6 – 8/12/2014 Presentation Delivered: Aug 12, 2014
Reliability, p10 Final Version
System Description - 4
•Thermal– 12 Thermistor controlled redundant Operational
Heater Circuits (Baseline & Descope) – 1 Thermostat controlled redundant Operational Heater
Circuits – 13 Thermostat controlled redundant Survival Heater
Circuits – 2 Redundant heat pipes

I n t e g r a t e d D e s i g n C a p a b i l i t y / I n s t r u m e n t D e s i g n L a b o r a t o r y
GEO CAPE FR Study: 8/6 – 8/12/2014 Presentation Delivered: Aug 12, 2014
Reliability, p11 Final Version
GEO-CAPE FR Reliability Block Diagram
Electrical Mechanisms Detectors/ Detector
Electronics Thermal ACS

I n t e g r a t e d D e s i g n C a p a b i l i t y / I n s t r u m e n t D e s i g n L a b o r a t o r y
GEO CAPE FR Study: 8/6 – 8/12/2014 Presentation Delivered: Aug 12, 2014
Reliability, p12 Final Version
Instrument Reliability Summary
Baseline DescopeYears on Orbit Years on Orbit
3 5 3 5 Detectors-Detector Electronics 0.9852 0.9141 0.9748 0.8001
Electrical 0.9594 0.9333 0.9594 0.9333 Mechanisms 0.9760 0.9621 0.9760 0.9621 ACS 0.9919 0.9865 0.9919 0.9865 Thermal 0.9997 0.9995 0.9997 0.9995
Design Reliability 0.9151 0.8096 0.9052 0.7083

I n t e g r a t e d D e s i g n C a p a b i l i t y / I n s t r u m e n t D e s i g n L a b o r a t o r y
GEO CAPE FR Study: 8/6 – 8/12/2014 Presentation Delivered: Aug 12, 2014
Reliability, p13 Final Version
Reliability Boundary Limits (Baseline)
0
0.2
0.4
0.6
0.8
1
1.2
0 0.5 1 1.5 2 2.5 3 3.5 4 4.5 5
Relia
bilit
y
Time (years)
200% Failure Rate
50% Failure Rate
100% Failure Rate
200% FR/1.5% Row Loss

I n t e g r a t e d D e s i g n C a p a b i l i t y / I n s t r u m e n t D e s i g n L a b o r a t o r y
GEO CAPE FR Study: 8/6 – 8/12/2014 Presentation Delivered: Aug 12, 2014
Reliability, p14 Final Version
Conclusions and Recommendations
• Design exceeds required 85% reliability for 3 years (91.5% for Baseline &90.5% for Descope Configuration), and actually exceeds 80% for 5 years (81.0% for Baseline Configuration) – Lower Boundary Limit (200% Failure Rate) falls off dramatically at 2.5
years due to limited degradation allowed (1% of 4096 rows) • Increase of row loss allowance to 1.5% increases Lower Boundary Limit
to 83.9% at 3 years • Assure all assemblies (in- and out-of-house) have Parts Stress Analysis (PSA)
and Failure Modes and Effects Analysis (FMEA) performed to assure compliance with derating and fault tolerance requirements
• Perform Probabilistic Risk Analysis (PRA) early in the program to identifyhigh risk items and assure estimated reliability is met by designs
• Perform Worst Case Analysis (WCA) to assure part functionality over entiremission duration
• “Non-credible” Single Point Failures should be addressed with ProbabilisticRisk Analysis, Failure Modes and Effects Analysis, and detailed Failure Modeling to assure they are truly “non-credible

I n t e g r a t e d D e s i g n C a p a b i l i t y / I n s t r u m e n t D e s i g n L a b o r a t o r y
GEO CAPE FR Study: 8/6 – 8/12/2014 Presentation Delivered: Aug 12, 2014
Reliability, p15 Final Version
BACKUP SLIDES

I n t e g r a t e d D e s i g n C a p a b i l i t y / I n s t r u m e n t D e s i g n L a b o r a t o r y
GEO CAPE FR Study: 8/6 – 8/12/2014 Presentation Delivered: Aug 12, 2014
Reliability, p16 Final Version
Electrical Model – All Options
3 5 5 3 5 5
Main Electrical Box 1 100% 0.959434053 0.933308486 0.933308486 Single String 0.959434053 0.933308486 0.933308486Processor 1 E 1824485 5.481E-07 0.985699174 0.976279089 0.976279089 Single String 0.959434053 0.933308486 0.933308486LVPS 1 E 4865292 2.0554E-07 0.994613036 0.991037859 0.991037859Diffuser Wheel Stepper Motor Control 1 E 7297938 1.3703E-07 0.996405459 0.994016279 0.994016279Heater Control and H/K 1 E 7297938 1.3703E-07 0.996405459 0.994016279 0.994016279Fast Steering Mirror Voice Coil Actuator 1 E 7297938 1.3703E-07 0.996405459 0.994016279 0.994016279Jitter & Roll Comp. Voice Coil Actuator 1 E 7297938 1.3703E-07 0.996405459 0.994016279 0.994016279Scan Mirror Card 1 E 7297938 1.3703E-07 0.996405459 0.994016279 0.994016279Filter Wheel Stepper Motor Control Card 1 E 7297938 1.3703E-07 0.996405459 0.994016279 0.994016279
3 years 5 years 5 yearsMin Redundancy 0.959434053 0.933308486 0.933308486Max Redundancy 0.959434053 0.933308486 0.933308486
Component Reliability (for time in years)
Subsystem / Component NameRelative
Duty Cycle
MTTF/ Char Life / Lognormal
Mean
Qty Model
Electrical Total
Failure Rate / Shape /
Lognormal Std Dev
Subsytem Reliability (for time in years)Redundancy Configuration
Electrical

I n t e g r a t e d D e s i g n C a p a b i l i t y / I n s t r u m e n t D e s i g n L a b o r a t o r y
GEO CAPE FR Study: 8/6 – 8/12/2014 Presentation Delivered: Aug 12, 2014
Reliability, p17 Final Version
Mechanisms Model – All Options 3 5 5 3 5 5
Filter Wheel Mechanism 1 10% 0.998604538 0.997190046 0.997190046 Single String 0.998604538 0.997190046 0.997190046Motor Winding 2 E 5000000 0.0000002 0.998949352 0.998249534 0.998249534 Single String 0.998604538 0.997190046 0.997190046Motor Bearings 4 W 100000 3.5 0.999988231 0.99992966 0.99992966Resolver 2 E 76923076 1.3E-08 0.999931674 0.999886126 0.999886126Gear set 2 W 250000 2 0.99977902 0.999386288 0.999386288Mechanism Bearings 15 W 100000 3.5 0.999955866 0.999736249 0.999736249
Scan Mirror Mechanism (SMM) Bearings 1 1% 0.999999996 0.999999978 0.999999978 Single String 0.999999996 0.999999978 0.999999978Mechanism Bearings 4 W 100000 3.5 0.999999996 0.999999978 0.999999978 Single String 0.999999996 0.999999978 0.999999978
Scan Mirror Mechanism (SMM) Electrical 1 100% 0.988867154 0.981514198 0.981514198 Single String 0.988867154 0.981514198 0.981514198Motor Winding 2 E 5000000 0.0000002 0.989543058 0.982632583 0.982632583 Single String 0.988867154 0.981514198 0.981514198Encoder 2 E 76923076 1.3E-08 0.999316953 0.998861848 0.998861848
Fast Steering Mirror (FSM) 1 100% 0.997113374 0.995193588 0.995193588 Single String 0.997113374 0.995193588 0.995193588Voice Coil 4 E 50000000 0.00000002 0.997899808 0.996502132 0.996502132 Single String 0.997113374 0.995193588 0.995193588LVDT 4 E 133333333 7.5E-09 0.999211911 0.998686863 0.998686863
Vibration Suppression System Locks 3 100% 0.98 0.98 0.98 Hot Redundancy 0.99880048 0.99880048 0.99880048Frangibolt 1 U 0.98 0.98 0.98 Hot Redundancy 0.99880048 0.99880048 0.99880048
Contamination Door 1 100% 0.95 0.95 0.95 Hot Redundancy 0.9975 0.9975 0.9975HOP 1 U 0.95 0.95 0.95 Hot Redundancy 0.9975 0.9975 0.9975
Vibration Suppression System - Active 1 100% 0.998424442 0.99737545 0.99737545 Single String 0.998424442 0.99737545 0.99737545Voice Coil 3 E 50000000 0.00000002 0.998424442 0.99737545 0.99737545 Single String 0.998424442 0.99737545 0.99737545
Diffuser Wheel 1 5% 0.9996915 0.999450726 0.999450726 Single String 0.9996915 0.999450726 0.999450726Motor Winding 1 E 5000000 0.0000002 0.999737235 0.999562096 0.999562096 Single String 0.9996915 0.999450726 0.999450726Motor Bearings 2 W 100000 3.5 0.99999948 0.999996891 0.999996891Mechanism Bearings 2 W 100000 3.5 0.99999948 0.999996891 0.999996891Resolver 1 E 76923076 1.3E-08 0.999982918 0.99997153 0.99997153Gear set 1 W 250000 2 0.999972375 0.999923265 0.999923265
Filter Wheels Optical Switches 10 100% 0.999843909 0.999739862 0.999739862 Single String 0.998440186 0.997401662 0.997401662LED 1 E 4.167E+09 2.4E-10 0.999993693 0.999989488 0.999989488 Single String 0.998440186 0.997401662 0.997401662Photodetector (1 pixel) 1 E 175438596 5.7E-09 0.999850215 0.999750371 0.999750371
3 years 5 years 5 yearsMin Redundancy 0.977621919 0.964859054 0.964859054Max Redundancy 0.977621919 0.964859054 0.964859054
Component Reliability (for time in years)
Subsystem / Component Name
Mechanisms Total
RelativeDuty Cycle
MTTF/ Char Life / Lognormal
Mean
Qty Model
Failure Rate / Shape /
Lognormal Std Dev
Subsytem Reliability (for time in years)Redundancy Configuration
Mechanisms

I n t e g r a t e d D e s i g n C a p a b i l i t y / I n s t r u m e n t D e s i g n L a b o r a t o r y
GEO CAPE FR Study: 8/6 – 8/12/2014 Presentation Delivered: Aug 12, 2014
Reliability, p18 Final Version
Detector – Detector Electronics Model Baseline
3 5 5 3 5 5
3000 of 3072Roll Camera 2 100% 0.994757789 0.991278257 0.991278257 K of N (Hot) 1 1 1CMOS 1K Row 4 E 20000000 0.00000005 0.994757789 0.991278257 0.991278257 K of N (Hot) 1 1 1
3000 of 3072
Detector Electronics 1 100% 0.996156727 0.993602755 0.993602755 Single String 0.996156727 0.993602755 0.993602755HAWAII ROIC 1 E 1.05E+08 9.5E-09 0.999750371 0.999583987 0.999583987 Single String 0.996156727 0.993602755 0.993602755Digitizer 1 E 7297938 1.3703E-07 0.996405459 0.994016279 0.994016279
Roll Camera Electronics 2 100% 0.996405459 0.994016279 0.994016279 Single String 0.992823838 0.988068363 0.988068363Electronics in Camera 1 E 7297938 1.3703E-07 0.996405459 0.994016279 0.994016279 Single String 0.992823838 0.988068363 0.988068363
4055 of 4096MERCAD Detector Array 1 100% 0.995217998 0.992042708 0.992042708 K of N (Hot) 0.999993086 0.937038065 0.937038065MERCAD Photodetector (1 pixel) 4096 E 2.25E+10 4.4531E-11 0.995217998 0.992042708 0.992042708 K of N (Hot) 0.999993086 0.937038065 0.937038065
4055 of 4096
Roll Camera Interface 1 100% 0.996405459 0.994016279 0.994016279 Single String 0.996405459 0.994016279 0.994016279Processor/I-O Card 1 E 7297938 1.3703E-07 0.996405459 0.994016279 0.994016279 Single String 0.996405459 0.994016279 0.994016279
3 years 5 years 5 yearsMin Redundancy 0.985446302 0.914430096 0.914430096Max Redundancy 0.985446302 0.914430096 0.914430096
RelativeDuty Cycle
MTTF/ Char Life / Lognormal
Mean
Qty Model
Detectors Total
Failure Rate / Shape /
Lognormal Std Dev
Subsytem Reliability (for time in years)Redundancy Configuration
DetectorsComponent Reliability (for time in years)
Subsystem / Component Name

I n t e g r a t e d D e s i g n C a p a b i l i t y / I n s t r u m e n t D e s i g n L a b o r a t o r y
GEO CAPE FR Study: 8/6 – 8/12/2014 Presentation Delivered: Aug 12, 2014
Reliability, p19 Final Version
Detector – Detector Electronics Model Descope
3 5 5 3 5 5
4055 of 4096CCD Detector Array 1 100% 0.994757789 0.991278257 0.991278257 K of N (Hot) 0.999945641 0.834759685 0.834759685CCD 1K Row 4 E 20000000 0.00000005 0.994757789 0.991278257 0.991278257 K of N (Hot) 0.999945641 0.834759685 0.834759685
4055 of 4096
3000 of 3072Roll Camera 2 100% 0.994757789 0.991278257 0.991278257 K of N (Hot) 1 1 1CMOS 1K Row 4 E 20000000 0.00000005 0.994757789 0.991278257 0.991278257 K of N (Hot) 1 1 1
3000 of 3072
Detector Electronics 1 100% 0.985453115 0.975872945 0.975872945 Single String 0.985453115 0.975872945 0.975872945ROIC 1 E 1.05E+08 9.5E-09 0.999750371 0.999583987 0.999583987 Single String 0.985453115 0.975872945 0.975872945Digitizer 4 E 7297938 1.3703E-07 0.985699174 0.97627909 0.97627909
Roll Camera Electronics 2 100% 0.996405459 0.994016279 0.994016279 Single String 0.992823838 0.988068363 0.988068363Electronics in Camera 1 E 7297938 1.3703E-07 0.996405459 0.994016279 0.994016279 Single String 0.992823838 0.988068363 0.988068363
Roll Camera Interface 1 100% 0.996405459 0.994016279 0.994016279 Single String 0.996405459 0.994016279 0.994016279Processor/I-O Card 1 E 7297938 1.3703E-07 0.996405459 0.994016279 0.994016279 Single String 0.996405459 0.994016279 0.994016279
3 years 5 years 5 yearsMin Redundancy 0.97481152 0.800083354 0.800083354Max Redundancy 0.97481152 0.800083354 0.800083354
ctors-Detector Electronics
Failure Rate / Shape /
Lognormal Std Dev
Subsytem Reliability (for time in years)Redundancy Configuration
Detectors-Detector ElectronicsComponent Reliability (for time in years)
Subsystem / Component NameRelative
Duty Cycle
MTTF/ Char Life / Lognormal
Mean
Qty Model

I n t e g r a t e d D e s i g n C a p a b i l i t y / I n s t r u m e n t D e s i g n L a b o r a t o r y
GEO CAPE FR Study: 8/6 – 8/12/2014 Presentation Delivered: Aug 12, 2014
Reliability, p20 Final Version
Thermal Model – All Options
3 5 5 3 5 5
Operational Heaters 12 70% 0.999983575 0.999972625 0.999972625 Single String 0.999802919 0.999671554 0.999671554Redun Htr/T-Stat Ckt 1 E 1.12E+09 8.9286E-10 0.999983575 0.999972625 0.999972625 Single String 0.999802919 0.999671554 0.999671554
Survival Heaters 13 10% 0.999997654 0.999996089 0.999996089 Single String 0.999969497 0.999949162 0.999949162Redun Htr/T-Stat Ckt 1 E 1.12E+09 8.9286E-10 0.999997654 0.999996089 0.999996089 Single String 0.999969497 0.999949162 0.999949162
33 of 34Thermistors 1 100% 0.9999429 0.999904835 0.999904835 K of N (Hot) 0.999998173 0.99999493 0.99999493Thermistors 1 E 4.6E+08 2.1728E-09 0.9999429 0.999904835 0.999904835 K of N (Hot) 0.999998173 0.99999493 0.99999493
33 of 34
Controlled Heaters 1 70% 0.992628929 0.987745092 0.987745092 Hot Redundancy 0.999945667 0.999849817 0.999849817Heater 1 E 2500000 0.0000004 0.992668607 0.987810896 0.987810896 Hot Redundancy 0.999945667 0.999849817 0.999849817thermistor 1 E 4.6E+08 2.1728E-09 0.99996003 0.999933384 0.999933384
Heat Pipes 2 100% 0.99957 0.999283436 0.999283436 Hot Redundancy 0.99999963 0.999998973 0.999998973fixed conductance heat pipe (FCHP) 1 E 61103138 1.6366E-08 0.99957 0.999283436 0.999283436 Hot Redundancy 0.99999963 0.999998973 0.999998973
3 years 5 years 5 yearsMin Redundancy 0.999715906 0.999464513 0.999464513Max Redundancy 0.999715906 0.999464513 0.999464513
RelativeDuty Cycle
MTTF/ Char Life / Lognormal
Mean
Qty Model
Thermal Total
Failure Rate / Shape /
Lognormal Std Dev
Subsytem Reliability (for time in years)Redundancy Configuration
ThermalComponent Reliability (for time in years)
Subsystem / Component Name

I n t e g r a t e d D e s i g n C a p a b i l i t y / I n s t r u m e n t D e s i g n L a b o r a t o r y
GEO CAPE FR Study: 8/6 – 8/12/2014 Presentation Delivered: Aug 12, 2014
Reliability, p21 Final Version
ACS Model – All Options
3 5 5 3 5 5
Star Tracker 1 100% 0.994862363 0.991451944 0.991451944 Single String 0.994862363 0.991451944 0.991451944Star Tracker Head (Mini Star Tracker) 2 E 38461538 0.000000026 0.998634373 0.997724992 0.997724992 Single String 0.994862363 0.991451944 0.991451944Star Tracker Processor (Mini Star Tracker) 1 E 6944444.4 0.000000144 0.996222832 0.993712649 0.993712649
IMU 1 100% 0.996996993 0.995 0.995 Single String 0.996996993 0.995 0.995Astrix 200 1 E 8738081.7 1.14442E-07 0.996996993 0.995 0.995 Single String 0.996996993 0.995 0.995
3 years 5 years 5 yearsMin Redundancy 0.991874784 0.986494684 0.986494684Max Redundancy 0.991874784 0.986494684 0.986494684
Failure Rate / Shape /
Lognormal Std Dev
RelativeDuty Cycle
Component Reliability (for time in years)Redundancy Configuration
Subsytem Reliability (for time in years)
ACS Total
ACSSubsystem / Component Name Qty Model
MTTF/ Char Life / Lognormal
Mean

N A S A G O D D A R D S P A C E F L I G H T C E N T E R
I n t e g r a t e d D e s i g n C a p a b i l i t y / I n s t r u m e n t D e s i g n L a b o r a t o r y
GEO CAPE Filter Radiometer (FR) ~ Concept Presentations ~
Parametric Cost Sanjay Verma
September 8, 2014

I n t e g r a t e d D e s i g n C a p a b i l i t y / I n s t r u m e n t D e s i g n L a b o r a t o r y
GEO CAPE FR Study: 8/6 – 8/12/2014 Presentation Delivered: 9/8/2014
Parametric Cost, p2 Draft Version
NASA Cost Estimating Overview
Proposal cost estimates evaluated at NASA Langley Research Center during Technical, Management, and Cost (TMCO) review
– Parametric models used to validate proposal cost estimate– Assumed criteria for validation of Step 1 proposal (based on feedback): proposal estimate and TMCO
consensus estimate within 20%
NASA Cost Estimating Handbook 2008 Defines three cost estimating Methodologies
• Parametric: based on key engineering data and Cost EstimatingRelationships (CERs)
• Analogy: comparison and extrapolation to like items or efforts• Engineering Build-Up (i.e., “grass-roots”): Labor and Material
estimates based on experience and “professional judgment” Defines two cost estimating Processes
• Advocacy Cost Estimates (ACE)Cost Estimators are members of program/project team
• Independent Cost Estimates (ICE)Cost Estimators are from an organization separate from project
Encourages parametric modeling and analogy estimates during pre-Phase A and Phase A studies
http://www.nasa.gov/offices/ooe/CAD.html
http://ceh.nasa.gov

I n t e g r a t e d D e s i g n C a p a b i l i t y / I n s t r u m e n t D e s i g n L a b o r a t o r y
GEO CAPE FR Study: 8/6 – 8/12/2014 Presentation Delivered: 9/8/2014
Parametric Cost, p3 Draft Version
Current GSFC Proposal Cost Estimating “Best Practices”
• Advocacy Cost Estimating– Proposal Teams
• Grassroots estimate based on Work Breakdown Structure (WBS)• Parametric modeling used for Grassroots validation
– IDC• Parametric modeling used to generate a stand-alone cost estimate• No Grassroots (WBS) cost estimate to validate
• Independent “Assessment” (provided by RAO)– Internal cost estimating tools and historical databases– Provides critical “Sanity Check”
• Evolving “Best Practices”– GSFC Chief Financial Officer (CFO)– NASA Cost Analysis Steering Group– NASA Cost Estimating Handbook

I n t e g r a t e d D e s i g n C a p a b i l i t y / I n s t r u m e n t D e s i g n L a b o r a t o r y
GEO CAPE FR Study: 8/6 – 8/12/2014 Presentation Delivered: 9/8/2014
Parametric Cost, p4 Draft Version
Proposal Cost Estimating Process
You are here
Concept/Formulation Science/Design Study Develop Proposal
GSFC Proposal Path
Grass-roots ROM Grass-roots refinement Grass-roots estimate
Advocacy Cost Estimating Paths
Code 500 MDL/IDL
Study
RAO ICE
“Cost Sanity Check”
GO /
NO-GO
Code 500 MDL/IDL
Study
Red Team ICE *
Cost estimating is an on-going iterative process
Cost Model ROM Cost Model refinement Validate Grass-roots Parametric Parametric
*Parametric ICEmay be performed
on proposal

I n t e g r a t e d D e s i g n C a p a b i l i t y / I n s t r u m e n t D e s i g n L a b o r a t o r y
GEO CAPE FR Study: 8/6 – 8/12/2014 Presentation Delivered: 9/8/2014
Parametric Cost, p5 Draft Version
Parametric Cost Estimating Tools
• NASA Cost Estimating Handbook 2008 describes two commercial tools– PRICE: Parametric Review of Information for Costing and Evaluation
• Separate modules for Hardware, Software, Integrated Circuits, and Life Cycle• PRICE H (Hardware) approaches cost estimates by parametrically defining:
– Hardware to be built– Development and manufacturing environments– Operational environment– Schedule
• PRICE H model is built from key engineering data (e.g., MEL: Master Equipment List)• Tool Heritage: Developed by RCA in the 1960’s for the U.S. NAVY, Air force & NASA; Commercialized by
PRICE Systems, L.L.C. • NASA-wide site license for PRICE H managed by Langley Research Center
(GSFC Contact: Dedra Billings, Code 305.0, e-mail: [email protected]) • PRICE H use at GSFC:
– Mission Design Lab (MDL/IMDC), 10+ years experience and 150+ S/C Bus models– Instrument Design Lab (IDL/ISAL), 8+ years experience and 120+ Instrument models– Code 600/158, 10+ years experience, 100+ S/C Bus and 100+ Instrument models
– SEER: System Evaluation & Estimation of Resources• Separate modules for Hardware, Software, Integrated Circuits, Manufacturability and Life Cycle• NASA-wide site license for SEER managed by Langley Research Center• Application-specific use of SEER-H at GSFC (e.g., detectors, cryocoolers, etc.)• SEER-SEM at GSFC used for estimating FSW w/ SLOC

I n t e g r a t e d D e s i g n C a p a b i l i t y / I n s t r u m e n t D e s i g n L a b o r a t o r y
GEO CAPE FR Study: 8/6 – 8/12/2014 Presentation Delivered: 9/8/2014
Parametric Cost, p6 Draft Version
PRICE H: Key Input Parameters
• Global Parameters:– Labor Rates (set as appropriate)
• GSFC Bid Rates• GSFC Typical Contractor Rates
– Used for GSFC vendor provided hardware– Used when actual rates are not available– 10% G&A, 14% Fee
• PRICE H Industry Labor Rates (default labor rates provided by Price Systems, Inc.)– ?% G&A, ?% Fee
– Inflation (NASA escalation rates)– Engineering Environment (Defined for NASA by PRICE Systems, Inc. calibration study)
• Emphasizes: System Engineering, Project Management, Automated design capabilities
• Individual Cost Component Parameters:– Complexity Factors (Table driven, defined by Price Systems from industry experience)– Modification Level/Remaining Design Factor (Heritage)– Quantity and Design Repeat (Learning Curve)– Composition (Structure, Electronic, Purchased, Cost Pass-through)– Mass– Operating Platform (Unmanned Space – High Reliability)
This Study
FSW for This Study

I n t e g r a t e d D e s i g n C a p a b i l i t y / I n s t r u m e n t D e s i g n L a b o r a t o r y
GEO CAPE FR Study: 8/6 – 8/12/2014 Presentation Delivered: 9/8/2014
Parametric Cost, p7 Draft Version
IDL Parametric Cost Modeling
• GEO CAPE FR Parametric Cost Inputs :– IDL Discipline Engineering Final Presentations– Master Equipment List (MEL)
• GEO CAPE WAS Grassroots Cost Inputs: (provided by IDL Discipline Engineers)
– IDL provided grassroots cost estimates for:• FPGA Firmware (see MEL FPGA tab and Final Electrical Presentation) – Escalated to FY$16• FSW Testbed (see MEL FSW tabs and Final FSW Presentation)• SideCar ASIC Assembly Code (see MEL ASIC Code tab and Final FSW Presentation)• Nickel Plating NRE - Optics
• GEO CAPE WAS Cost Output Customer Products:– PowerPoint presentation– Model results exported to Excel Spreadsheet and merged with grassroots costs (if any) and
appropriate GSFC wrap factors • Excel output spreadsheet includes multiple tabs (at bottom)

I n t e g r a t e d D e s i g n C a p a b i l i t y / I n s t r u m e n t D e s i g n L a b o r a t o r y
GEO CAPE FR Study: 8/6 – 8/12/2014 Presentation Delivered: 9/8/2014
Parametric Cost, p8 Draft Version
• GEO CAPE FR Key Assumptions:ETUs and Component Spares covered by wrap factors Class C Mission (Class B Parts – up-screening not included in cost estimate) Costs reported in FY2016 constant year dollars Instrument built by contractor – do not apply GSFC CM&O FSW Estiamted using GSFC in-House bid rates No existing Manufacturing Process and Assembly Line PRICE-H Estimate is for a Protoflight Unit and EDUs Schedule used: ATP: 12/17, CDR: 12/18, PER: 5/21
GEO CAPE FR Cost Modeling Key Assumptions
Detailed assumptions are tagged CME (Cost Modeler Engineered) in model Minimum mass increment modeled is 3 grams. Items below 3 grams were increased to 3 grams SEER-H cost estimates for CCD & HgCdTe Detectors SEER-SEM cost estimates for FSW based on SLOC IDL Grassroot cost estimates for FPGA firmware, FSW Testbed, SideCar ASIC Micro Code, Roll Camera repackaging, and NRE for optics with nickel plating Costs not calculated by PRICE-H accounted for by GSFC calibrated placeholder ‘wrap’ factors:
• Ground Support Equipment (GSE) - 5% of PRICE-H Instrument Payload Estimate• Environmental Testing - 5% of PRICE-H Instrument Payload Estimate• Component Level Flight Spares - 10% of PRICE-H Partial Instrument Payload Estimate• Engineering Test Units (ETUs) at subassy level – 10% of PRICE-H Partial Instrument Payload Estimate• Instrument to S/C Bus I&T - 5% of PRICE-H Instrument Payload Estimate (Typically Included in WBS 10.0)

I n t e g r a t e d D e s i g n C a p a b i l i t y / I n s t r u m e n t D e s i g n L a b o r a t o r y
GEO CAPE FR Study: 8/6 – 8/12/2014 Presentation Delivered: 9/8/2014
Parametric Cost, p9 Draft Version
FU ETU EDU • Flight Unit (1 for GEO CAPE FR) • Protoflight• “Fly the unit you
qualify” • Used for Class C
mission
• Engineering Test Unit• Hardware tested to
environmental qualification levels
• May be flown as flight spare if successfully qualified
• For GEO CAPE FR :Placeholder bin of money provided via “wrap factor”
• ETUs to be determined afterleaving IDL by customer team to address Gold Rule requirements and/or risk reduction
• ETUs selected by customershould be commensurate with Class C mission risk posture
• Adequacy of placeholder binof money should be adjusted once ETU list is developed.
• Engineering DevelopmentUnit
• Can not be flown• Used to prove out first
build of early concept engineering
• Test form/function only• Limited or no
environmental testing • For GEO CAPE FR : : EDUs
selected are noted in cost detail output.
• EDU of entire instrumentfor consistency with other GEO CAPE studies
• Kept to minimum for ClassC mission.
Spares • Placeholder bin of
money provided via “wrap factor”
• Customer shoulddetermine necessary spares at component and/or subassembly level commensurate with a Class C mission risk posture after leaving IDL
• Adequacy of placeholder bin of money should be adjusted once spares list is developed.
GEO CAPE FR Cost Modeling Key Assumptions

I n t e g r a t e d D e s i g n C a p a b i l i t y / I n s t r u m e n t D e s i g n L a b o r a t o r y
GEO CAPE FR Study: 8/6 – 8/12/2014 Presentation Delivered: 9/8/2014
Parametric Cost, p10 Draft Version
GEO CAPE FR Baseline Parametric Cost Summary
GEOCAPE FR Instrument (Baseline Design) Assembly $85,707,200Science Aperture Baffle Assembly $1,402,550Diffuser Select Assembly $8,383,680Scan Mirror Assembly $8,513,334Optical Assembly $14,804,305Internal Baffles Assembly $240,115HAWAII-4RG Detector Array Assembly $2,239,518Instrument Structure/Enclosure Assembly $9,737,204HAWAII-4RG Digitizer Box $1,622,342Roll Camera Assembly $6,293,326uASC Star Tracker $1,927,269IMU Assembly $1,592,777FR Main Electronics Box (MEB) Assembly $15,645,364Harness Assembly $3,147,704Contamination Purge Hardware (SS ,TRL 6) $468,904Thermal Subsystem Assembly $5,309,597Misc H/W $763,421GEOCAPE FR Instrument Assembly Integration and Test $3,615,790
Baseline Design - Thruput Cost Estimates $17,227,470Optical Nickel Plating NRE - IDL Grassroots Estimate $197,523SEER-H Estimate for 4K X 4K MCT Detector (1 Flt, 1 Sprae, and 4 EDU, FY$16 ~$17.03M) $17,029,947
$102,934,669
$4,308,528FSW Test-Bed (IDL Grassroots Estimate) $899,175
$5,415,840ASIC Development (IDL Grassroots Estimate, Baseline Design SIDECAR Modification) $1,628,917
$5,146,733$5,146,733
$10,293,467$10,293,467
Instrument to SC-BUS I&T (5% of Parametric Estimate, Typically included in NASA WBS 10.0) $5,146,733
$151,214,263
N/A
$151,214,263
(For GSFC, Contact Code 153 to verify applicability to your project)
GEOCAPE-FR Total
Cost Estimate (FY$16)GSFC Contractor Bid Rates
Flight Units = 1
GEOCAPE-FR Subtotal
Institutional Charges (Basis of Estimate: AO Guidance of $43K/FTE, GSFC CM&O)
FPGA development (IDL Grassroots Estimate, 6 Unique FPGA @ & 6 Unique Algorithms @ ~$451K ea)
Flight Software (SEER-SEM SLCO Based Parametric Estimate, incl sustaining Eng., GSFC In-House Bid Rates)
Ground Support Equipment (GSE) (5% of Parametric Estimate)
Engineering Test Unit (ETU, 10% of Parametric Estimate)H/W Spares (10% of Parametric Estimate)
GEOCAPE-FR Parametric Estimate
The Following are NOT PRICE-H estimates but are derived from PRICE-H estimates. These are included for completeness and are considered ROM 'Grass-roots' estimates. Consult the Grass-roots estimating
organization for a more accurate estimate.
(Development and Production Costs) 208.7
Environmental Testing Labor (5% of Parametric Estimate)
GEOCAPE-FR Baseline Design Point Estimate9/8/2014 CBE Dry Mass (kg)
GEOCAPE-FR Parametric Cost Estimate Summary
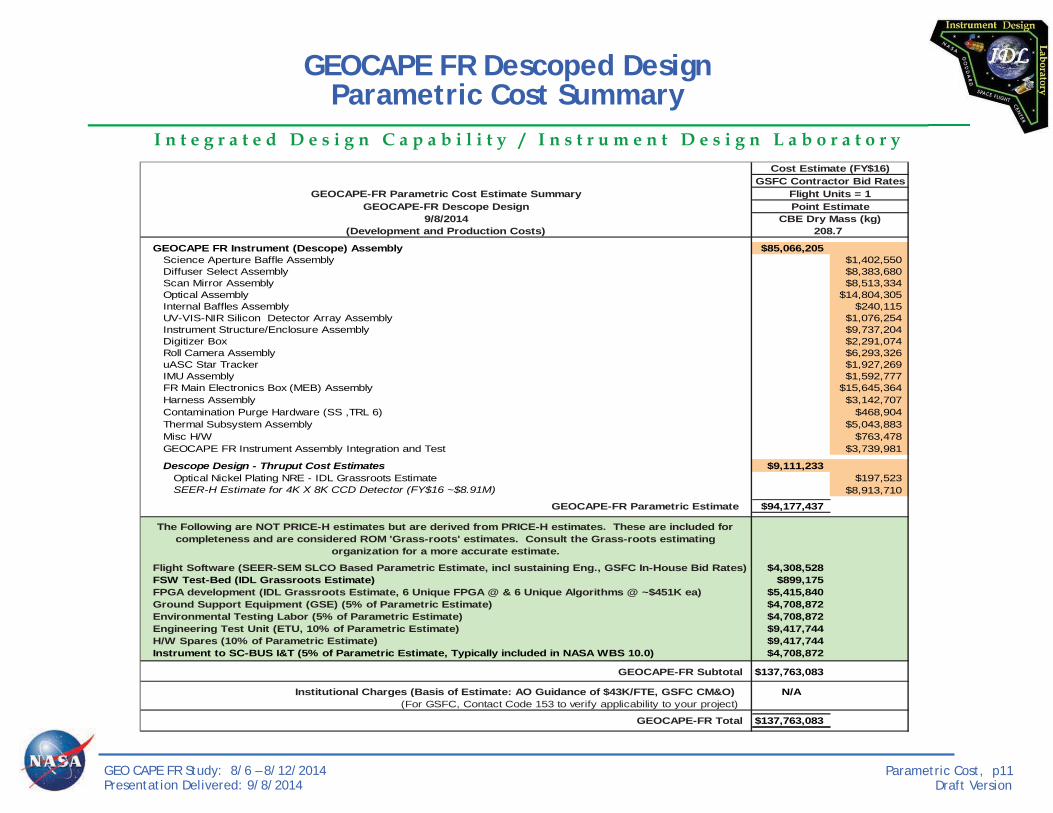
I n t e g r a t e d D e s i g n C a p a b i l i t y / I n s t r u m e n t D e s i g n L a b o r a t o r y
GEO CAPE FR Study: 8/6 – 8/12/2014 Presentation Delivered: 9/8/2014
Parametric Cost, p11 Draft Version
GEOCAPE FR Descoped Design Parametric Cost Summary
GEOCAPE FR Instrument (Descope) Assembly $85,066,205Science Aperture Baffle Assembly $1,402,550Diffuser Select Assembly $8,383,680Scan Mirror Assembly $8,513,334Optical Assembly $14,804,305Internal Baffles Assembly $240,115UV-VIS-NIR Silicon Detector Array Assembly $1,076,254Instrument Structure/Enclosure Assembly $9,737,204Digitizer Box $2,291,074Roll Camera Assembly $6,293,326uASC Star Tracker $1,927,269IMU Assembly $1,592,777FR Main Electronics Box (MEB) Assembly $15,645,364Harness Assembly $3,142,707Contamination Purge Hardware (SS ,TRL 6) $468,904Thermal Subsystem Assembly $5,043,883Misc H/W $763,478GEOCAPE FR Instrument Assembly Integration and Test $3,739,981
Descope Design - Thruput Cost Estimates $9,111,233Optical Nickel Plating NRE - IDL Grassroots Estimate $197,523SEER-H Estimate for 4K X 8K CCD Detector (FY$16 ~$8.91M) $8,913,710
$94,177,437
$4,308,528FSW Test-Bed (IDL Grassroots Estimate) $899,175
$5,415,840$4,708,872$4,708,872$9,417,744$9,417,744
Instrument to SC-BUS I&T (5% of Parametric Estimate, Typically included in NASA WBS 10.0) $4,708,872
$137,763,083
N/A
$137,763,083
GEOCAPE-FR Parametric Cost Estimate Summary
Institutional Charges (Basis of Estimate: AO Guidance of $43K/FTE, GSFC CM&O) (For GSFC, Contact Code 153 to verify applicability to your project)
GEOCAPE-FR Total
Environmental Testing Labor (5% of Parametric Estimate)Engineering Test Unit (ETU, 10% of Parametric Estimate)H/W Spares (10% of Parametric Estimate)
GEOCAPE-FR Subtotal
GEOCAPE-FR Parametric Estimate
The Following are NOT PRICE-H estimates but are derived from PRICE-H estimates. These are included for completeness and are considered ROM 'Grass-roots' estimates. Consult the Grass-roots estimating
organization for a more accurate estimate.
Flight Software (SEER-SEM SLCO Based Parametric Estimate, incl sustaining Eng., GSFC In-House Bid Rates)
FPGA development (IDL Grassroots Estimate, 6 Unique FPGA @ & 6 Unique Algorithms @ ~$451K ea)Ground Support Equipment (GSE) (5% of Parametric Estimate)
9/8/2014(Development and Production Costs)
CBE Dry Mass (kg)208.7
Cost Estimate (FY$16)GSFC Contractor Bid Rates
Flight Units = 1GEOCAPE-FR Descope Design Point Estimate

I n t e g r a t e d D e s i g n C a p a b i l i t y / I n s t r u m e n t D e s i g n L a b o r a t o r y
GEO CAPE FR Study: 8/6 – 8/12/2014 Presentation Delivered: 9/8/2014
Parametric Cost, p12 Draft Version
Engineering
Project Management
Manufacturing
Cost Element (Summary Report Available for each
cost element)
Constant Year Dollars
($16)
Production
Development
Schedule
Mass
PRICE-H Instrument Development and
Production Cost Estimate ~$85.7M
GEOCAPE FR Baseline PRICE-H Cost Summary

I n t e g r a t e d D e s i g n C a p a b i l i t y / I n s t r u m e n t D e s i g n L a b o r a t o r y
GEO CAPE FR Study: 8/6 – 8/12/2014 Presentation Delivered: 9/8/2014
Parametric Cost, p13 Draft Version
GEOCAPE FR Baseline PRICE-H Top-Level Cost Model

I n t e g r a t e d D e s i g n C a p a b i l i t y / I n s t r u m e n t D e s i g n L a b o r a t o r y
GEO CAPE FR Study: 8/6 – 8/12/2014 Presentation Delivered: 9/8/2014
Parametric Cost, p14 Draft Version
GEOCAPE FR Baseline Expanded PRICE-H Model

I n t e g r a t e d D e s i g n C a p a b i l i t y / I n s t r u m e n t D e s i g n L a b o r a t o r y
GEO CAPE FR Study: 8/6 – 8/12/2014 Presentation Delivered: 9/8/2014
Parametric Cost, p15 Draft Version
GEO CAPE WAS Baseline PRICE-H Detailed Cost Estimate
Indenture Title QTY QNA Unit Mass Est Total Cost Mode
1 GEOCAPE FR (Baseline Design) Instrument Assembly 1 1 208.660 $85,707,200 Assembly2 Science Aperture Baffle Assembly 1 1 $1,402,550 Assembly3 Contamination Cover (12mm Al H/C - 1mm M55J FS, TRL 6) 1 1 1.000 1.000 $274,752 STRUCTURAL / MECHANICAL 3 Cover Hinge Assembly (Al/steel/Delrin, TRL 6) 1 1 1.000 1.000 $247,155 STRUCTURAL / MECHANICAL 3 Cover HOP Actuator RL-300 Restraint Latch (TRL 9) 1 1 0.280 0.280 $76,622 ELECTRO / MECHANICAL 3 Cover Limit/Status Sensors/Microswitches (CME: TRL 6) 1 1 0.100 0.100 $244,441 ELECTRO / MECHANICAL 3 Cover Kickoff and Torsion Springs (CRES, TRL 6) 1 1 0.500 0.500 $173,088 STRUCTURAL / MECHANICAL 3 Science Aperture Baffle (M55J, TRL 6) 1 1 1.100 1.100 3.980 $320,866 STRUCTURAL / MECHANICAL 3 Science Aperture Baffle Assembly Integration & Test 1 1 3.980 $65,626 INTEG & TEST 2 Diffuser Select Assembly 1 1 $8,383,680 Assembly3 Diffuser Wheel Edge Cover (Qty 2, M55J, TRL 6) 2 2 0.170 0.340 $114,463 STRUCTURAL / MECHANICAL 3 Diffuser Wheel (Al H/C - AL FS, TRL 6) 1 1 4.000 4.000 $850,537 STRUCTURAL / MECHANICAL 3 Drive Ring (Al, TRL 6) 1 1 7.500 7.500 $1,931,445 STRUCTURAL / MECHANICAL 3 Diffuser-1 (Fused Silica, TRL 6) 1 1 2.100 2.100 $951,035 STRUCTURAL / MECHANICAL 3 Diffuser-2 (Fused Silica, TRL-6) 1 1 2.100 2.100 $951,035 STRUCTURAL / MECHANICAL 3 Diffuser Wheel Stepper Motor/Gearbox (TRL 6) 1 1 2.000 2.000 $1,329,934 ELECTRO / MECHANICAL 3 Diffuser Wheel Gearbox Pinion Gear (Steel, TRL 6) 1 1 0.100 0.100 $68,289 STRUCTURAL / MECHANICAL 3 Diffuser Wheel Central Bearing (Steel, TRL 6) 1 1 0.200 0.200 $105,022 STRUCTURAL / MECHANICAL 3 Diffuser Wheel Guide Bearing (Qty 3, Steel, TRL 6) 3 3 0.100 0.300 $140,074 STRUCTURAL / MECHANICAL 3 Diffuser Wheel 10 bit Absoulte Encoder (TRL 6) 1 1 0.300 0.300 18.940 $1,286,076 ELECTRO / MECHANICAL 3 Diffuser Select Assembly Integration & Test 1 1 18.940 $655,770 INTEG & TEST 2 Scan Mirror Assembly 1 1 $8,513,334 Assembly3 Scan Mirror (ULE, TRL 6) 1 1 3.637 3.637 $2,084,211 STRUCTURAL / MECHANICAL 3 Scan Mirror Mount (M55J, TRL 6) 1 1 2.600 2.600 $864,809 STRUCTURAL / MECHANICAL 3 Mirror Pads (Qty 6 totaling to 6 grams, Invar, TRL-6) 1 1 0.006 0.006 $14,342 STRUCTURAL / MECHANICAL 3 Mirror Flexures (Qty 3 totaling to 4 grams, Ti, TRL-6) 1 1 0.004 0.004 $17,572 STRUCTURAL / MECHANICAL 3 Scan Mirror Mechanism Assembly 1 1 $4,862,750 Assembly4 Tip / Tilt Axis Limited Angle Torque Motor (Qty 2, TRL-9) 2 2 0.680 1.360 $350,720 ELECTRO / MECHANICAL 4 Tip / Tilt Axis 24 bit Absoulte Angle Encoder (Qty 2, TRL-6) 2 2 5.090 10.180 $2,494,400 ELECTRO / MECHANICAL 4 Encoder Read Heads and Interface Box (Qty 2, TRL 6) 2 2 0.254 0.508 $704,620 ELECTRO / MECHANICAL 4 Tip / Tilt Axis Bearing (Qty 4, Steel, TRL 6) 4 4 0.050 0.200 $96,875 STRUCTURAL / MECHANICAL 4 Gimbal Ring (Ti, TRL 6) 1 1 1.500 1.500 $405,812 STRUCTURAL / MECHANICAL 4 Launch Lock (Qty 2, TRL 6) 2 2 0.020 0.040 20.035 $111,916 ELECTRO / MECHANICAL 4 Scan Mirror Mechanism Assembly Integration & Test 1 1 20.035 $698,406 INTEG & TEST 3 Scan Mirror Assembly Integration & Test 1 1 $669,651 INTEG & TEST 2 Optical Assembly 1 1 $14,804,305 Assembly3 Aperture Stop (M55J, TRL-6) 1 1 0.540 0.540 $305,764 STRUCTURAL / MECHANICAL 3 M1 Assembly 1 1 $2,369,915 Assembly4 M1 (ULE, TRL-6) 1 1 1.265 1.265 $1,781,172 STRUCTURAL / MECHANICAL 4 M1 Pad (Qty 6, Invar, TRL-6) 6 6 0.013 0.078 $29,660 STRUCTURAL / MECHANICAL 4 M1 Flexure Blade (Qty 3, Ti, TRL 6) 3 3 0.003 0.009 $11,914 STRUCTURAL / MECHANICAL 4 M1 Mount (M55J, TRL 6) 1 1 0.750 0.750 2.642 $347,942 STRUCTURAL / MECHANICAL 4 M1 Assembly Integration & Test 1 1 $199,227 INTEG & TEST 3 M2 Assembly 1 1 $432,198 Assembly
Total Mass (Kg)
.
.
.
.

I n t e g r a t e d D e s i g n C a p a b i l i t y / I n s t r u m e n t D e s i g n L a b o r a t o r y
GEO CAPE FR Study: 8/6 – 8/12/2014 Presentation Delivered: 9/8/2014
Parametric Cost, p16 Draft Version
IDL Point Design Estimate & Cost Risk
• The IDL Cost Estimate is a Point Estimate based on the single point design of theinstrument
• The point design that the IDL derives in a 1-week study is an engineering solution, but not necessarily THE solution that will be implemented for flight
• The point estimate is described by the IDL in the MEL in terms of Current BestEstimate (CBE) of mass and materials, and represents a single estimate among a range of feasible possibilities
• Cost risk analysis attempts to address the risk that the eventual outcome of theparameters may differ from the CBE selections made at the conceptual design phase of pre-formulation
• Cost risk capabilities within the parametric cost modeling tool allow a range ofinput values to be entered to generate a range of cost outcomes
• Cost risk simulation is performed using well known sampling techniques (e.g.Monte Carlo simulation) of the parameter ranges resulting in a Probability Distribution Function (PDF) of possible outcomes, also known as a Density Curve
• PDF can also be represented as a Cumulative Distribution Function (CDF), alsoknown as an S-Curve to provide a graphical representation of the possibilities of various cost outcomes
• Cost risk analysis takes additional labor and is beyond a 1-week IDL study, and isnot recommended for the initial IDL instrument conceptual design, but will be necessary for proposal development

I n t e g r a t e d D e s i g n C a p a b i l i t y / I n s t r u m e n t D e s i g n L a b o r a t o r y
Selected Slide, Definition of Confidence Level (CL), from “NASA Cost Risk Workshop at GSFC”. GEO CAPE FR Study: 8/6 – 8/12/2014
Presentation Delivered: 9/8/2014 Parametric Cost, p17
Draft Version
Cost Confidence Level

I n t e g r a t e d D e s i g n C a p a b i l i t y / I n s t r u m e n t D e s i g n L a b o r a t o r y
GEO CAPE FR Study: 8/6 – 8/12/2014 Presentation Delivered: 9/8/2014
Parametric Cost, p18 Draft Version
1. Revisit parametric cost analysis when significant changes to mass and/or scheduleare made.
2. Include costs for up-screening of Class B EEE parts3. Project should make sure to carry Instrument contribution to WBS 10.0 (see
summary). 4. Perform parametric cost-risk analysis once candidate design is close to being
frozen. Bring updated ‘frozen’ MEL and charge number to Code 158 to initiate work—contact Sanjay Verma or Anthony McNair.
GEOCAPE FR Recommended Future Work
Copyright © 2022 FDOKUMEN