Analysis of the 2001 lava flow eruption of Mt. Etna from three-dimensional mapping
18
Analysis of the 2001 lava flow eruption of Mt. Etna from three-dimensional mapping M. Coltelli, 1 C. Proietti, 1,2 S. Branca, 1 M. Marsella, 2 D. Andronico, 1 and L. Lodato 1 Received 14 June 2006; revised 17 November 2006; accepted 21 December 2006; published 1 June 2007. [1] The 2001 Etna eruption was characterized by a complex temporal evolution with the opening of seven eruptive fissures, each feeding different lava flows. This work describes a method adopted to obtain the three-dimensional geometry of the whole lava flow field and for the reconstruction, based on topographic data, of the temporal evolution of the largest lava flow emitted from a vent located at 2100 m a.s.l. Preeruption and posteruption Digital Elevation Models (DEM) were extracted from vector contour maps. Comparison of the two DEMs and analysis of posteruption orthophotos allowed us to estimate flow area, thickness, and bulk volume. Additionally, the two-dimensional temporal evolution of the 2100 flow was precisely reconstructed by means of maps compiled during the eruption. These data, together with estimates of flow thickness, allowed us to evaluate emitted lava volumes and in turn the average volumetric flow rates The analysis performed in this paper provided, a total lava bulk volume of 40.1 10 6 m 3 for the whole lava flow field, most of which emitted from the 2100 vent (21.4 10 6 m 3 ). The derived effusion rate trend shows an initial period of waxing flow followed by a longer period of waning flow. This is in agreement not only with the few available effusion rate measurements performed during the eruption, but also with the theoretical model of Wadge (1981) for the temporal variation in discharge during the tapping of a pressurized source. Citation: Coltelli, M., C. Proietti, S. Branca, M. Marsella, D. Andronico, and L. Lodato (2007), Analysis of the 2001 lava flow eruption of Mt. Etna from three-dimensional mapping, J. Geophys. Res., 112, F02029, doi:10.1029/2006JF000598. 1. Introduction [2] On active volcanoes each new effusive eruption alters the local topography and builds new morphological fea- tures. This requires to modify existing maps for keeping topographic maps up-to-date and collecting accurate quan- titative data such as flow area, volume and effusion rate. The availability of detailed maps contributes to monitoring efforts and it is valuable to understand and model the eruptive processes. Currently, several numerical lava flow models are available [Costa and Macedonio, 2005; Crisci et al., 2003; Hidaka et al., 2005; Vicari et al., 2007] with the aim of providing real-time lava flow simulation tools for predicting areas under threat. These models need to be verified and validated by simulating and checking the lava flow emplacement of test-case eruptions. In addition, to run properly the models and to give realistic output values, accurate preeruption topography and effusion rate estimates have to be used together with appropriate physical-chemical parameters of the lava [Vicari et al., 2007]. [3] Because Mount Etna is one of the most active volca- noes on the Earth, well known for its frequent lava flow eruptions, the problem of keeping maps up-to-date is an old and critical issue. The first geological map of the volcano was published by Waltershausen [1880], and documented the presence of several lava flow fields produced by recent activity. Since then, geologists have mapped every new lava flow and have generated, in some cases, very detailed maps, such as that showing the flows of the 1910 eruption [Vinassa de Regny , 1911]. These early maps represent the evolution from a pictorial approach (the use of drawing and painting the shape of lava flows dates back to 15th century) toward topographic maps, though their geometrical content rarely included detailed altimetric information [Ricco ` , 1902]. [4] During the 20th century, ground surveying and aerial photogrammetry methods were used to update topographic maps during and after the emplacement of new lava flows. However, initially such techniques were not systematically adopted because they were considered too expensive for mapping the final lava morphology and, especially, for frequently updating (ideally every day) the area covered by new lava. In the last few decades, the possibility to estimate lava flow volume from topographic data, and to document the evolution of the flow field, has increasingly supported scientific and civil protection applications, such as numerical simulations of lava flow emplacement [e.g., Crisci et al., 1986; Ishihara et al., 1989; Wadge et al., 1994]. [ 5 ] The well-documented 1983 eruption of Etna [Frazzetta and Romano, 1984; Guest et al., 1987; Kilburn and Guest, 1993] initially raised the problem of uncertainty JOURNAL OF GEOPHYSICAL RESEARCH, VOL. 112, F02029, doi:10.1029/2006JF000598, 2007 Click Here for Full Articl e 1 Istituto Nazionale di Geofisica e Vulcanologia, Sezione di Catania, Catania, Italy. 2 Dipartimento Idraulica Trasporti e Strade, Universita ` di Roma ‘‘La Sapienza,’’ Rome, Italy. Copyright 2007 by the American Geophysical Union. 0148-0227/07/2006JF000598$09.00 F02029 1 of 18
Transcript of Analysis of the 2001 lava flow eruption of Mt. Etna from three-dimensional mapping

Analysis of the 2001 lava flow eruption of Mt. Etna from
three-dimensional mapping
M. Coltelli,1 C. Proietti,1,2 S. Branca,1 M. Marsella,2 D. Andronico,1 and L. Lodato1
Received 14 June 2006; revised 17 November 2006; accepted 21 December 2006; published 1 June 2007.
[1] The 2001 Etna eruption was characterized by a complex temporal evolution with theopening of seven eruptive fissures, each feeding different lava flows. This workdescribes a method adopted to obtain the three-dimensional geometry of the whole lavaflow field and for the reconstruction, based on topographic data, of the temporal evolutionof the largest lava flow emitted from a vent located at 2100 m a.s.l. Preeruption andposteruption Digital Elevation Models (DEM) were extracted from vector contour maps.Comparison of the two DEMs and analysis of posteruption orthophotos allowed us toestimate flow area, thickness, and bulk volume. Additionally, the two-dimensionaltemporal evolution of the 2100 flow was precisely reconstructed by means of mapscompiled during the eruption. These data, together with estimates of flow thickness,allowed us to evaluate emitted lava volumes and in turn the average volumetric flow ratesThe analysis performed in this paper provided, a total lava bulk volume of 40.1 � 106 m3
for the whole lava flow field, most of which emitted from the 2100 vent (21.4 � 106 m3).The derived effusion rate trend shows an initial period of waxing flow followed by alonger period of waning flow. This is in agreement not only with the few available effusionrate measurements performed during the eruption, but also with the theoretical modelof Wadge (1981) for the temporal variation in discharge during the tapping of apressurized source.
Citation: Coltelli, M., C. Proietti, S. Branca, M. Marsella, D. Andronico, and L. Lodato (2007), Analysis of the 2001 lava flow
eruption of Mt. Etna from three-dimensional mapping, J. Geophys. Res., 112, F02029, doi:10.1029/2006JF000598.
1. Introduction
[2] On active volcanoes each new effusive eruption altersthe local topography and builds new morphological fea-tures. This requires to modify existing maps for keepingtopographic maps up-to-date and collecting accurate quan-titative data such as flow area, volume and effusion rate.The availability of detailed maps contributes to monitoringefforts and it is valuable to understand and model theeruptive processes. Currently, several numerical lava flowmodels are available [Costa and Macedonio, 2005; Crisci etal., 2003; Hidaka et al., 2005; Vicari et al., 2007] with theaim of providing real-time lava flow simulation tools forpredicting areas under threat. These models need to beverified and validated by simulating and checking the lavaflow emplacement of test-case eruptions. In addition, to runproperly the models and to give realistic output values,accurate preeruption topography and effusion rate estimateshave to be used together with appropriate physical-chemicalparameters of the lava [Vicari et al., 2007].[3] Because Mount Etna is one of the most active volca-
noes on the Earth, well known for its frequent lava flow
eruptions, the problem of keeping maps up-to-date is an oldand critical issue. The first geological map of the volcano waspublished by Waltershausen [1880], and documented thepresence of several lava flow fields produced by recentactivity. Since then, geologists have mapped every new lavaflow and have generated, in some cases, very detailed maps,such as that showing the flows of the 1910 eruption [Vinassade Regny, 1911]. These early maps represent the evolutionfrom a pictorial approach (the use of drawing and painting theshape of lava flows dates back to 15th century) towardtopographic maps, though their geometrical content rarelyincluded detailed altimetric information [Ricco, 1902].[4] During the 20th century, ground surveying and aerial
photogrammetry methods were used to update topographicmaps during and after the emplacement of new lava flows.However, initially such techniques were not systematicallyadopted because they were considered too expensive formapping the final lava morphology and, especially, forfrequently updating (ideally every day) the area covered bynew lava. In the last few decades, the possibility to estimatelava flow volume from topographic data, and to documentthe evolution of the flow field, has increasingly supportedscientific and civil protection applications, such as numericalsimulations of lava flow emplacement [e.g., Crisci et al.,1986; Ishihara et al., 1989; Wadge et al., 1994].[5] The well-documented 1983 eruption of Etna
[Frazzetta and Romano, 1984; Guest et al., 1987; Kilburnand Guest, 1993] initially raised the problem of uncertainty
JOURNAL OF GEOPHYSICAL RESEARCH, VOL. 112, F02029, doi:10.1029/2006JF000598, 2007ClickHere
for
FullArticle
1Istituto Nazionale di Geofisica e Vulcanologia, Sezione di Catania,Catania, Italy.
2Dipartimento Idraulica Trasporti e Strade, Universita di Roma‘‘La Sapienza,’’ Rome, Italy.
Copyright 2007 by the American Geophysical Union.0148-0227/07/2006JF000598$09.00
F02029 1 of 18
associated with lava-volume estimation from different sour-ces, because different authors reported the same planimetricbut different volumes. Frazzetta and Romano [1984], forexample, calculated a volume of 100.2 � 106 m3 from dailymeasurements of lava flux near the vent; conversely Murray[1990] compared data collected by topographic field sur-veying to the 1969 IGM 1:25,000 contour map and esti-mated a volume of 78.5 � 106 m3.[6] Since the early 1990s, the availability of handheld
GPS receivers has opened up the possibility to easily collectthree-dimensional (3D) point measurements to contribute tothe geological mapping of an ongoing eruption. Different3D ground surveying techniques, for example, GPS andEDM [Calvari et al., 1994; Stevens et al., 1997] gavecomparable results for evaluating the volume of the1991–1993 Etna’s flow field.[7] Lava flow volume can be derived indirectly from
observed or extrapolated geometrical parameters, or directlyby subtracting preeruption and posteruption surfaces. Theformer method, also known as the planimetric approach[Stevens et al., 1999] requires measurements of the flowarea, using remote sensing techniques or field data, andmean lava thickness from field surveys. The accuracy of thismethod strongly depends on the quality of the mapping andon the uncertainties of the thickness measurements. Theavailability of field-measured 3D points across the entireflow is necessary to obtain reliable results [Calvari et al.,1994; Stevens et al., 1997]. The latter method, known as thetopographic approach [Stevens et al., 1999], requires a 3Dreconstruction of the topographic surfaces (i.e., DEM gen-eration) before and after the eruption. DEMs can be directlyextracted from remote sensing data [Rowland et al., 1999,2003] or derived from preexisting vector maps [Stevens etal., 1999]. The topographic approach can provide moredetailed data whose accuracy can be easily assessed.[8] In this work a combination of the two approaches was
utilized to evaluate the final area and volume of the 2001Etna flow field (Figure 1). An error analysis permitted us toevaluate the accuracy associated with volume estimatesderived from the different methods. The planimetric ap-proach was also adopted to perform a multitemporal anal-ysis of the flow emitted from the 2100 m vent (Figure 1)because syneruptive DEMs were unavailable. This temporalanalysis was based on quasidaily mapping supported byphotographs taken during helicopter overflights and allowedus to reconstruct the flow rate trend.[9] Several attempts to evaluate the flow rate trend of an
Etna eruption have been carried out in the past [Frazzetta andRomano, 1984;Calvari et al., 1994;Behncke and Neri, 2003]without providing the necessary information to establishthe methodology and data quality. In the paper we detailthe methodology applied to the 2001 eruption, whichrequired analysis of preeruption and posteruption DEMs,as well as of daily maps produced during the eruption.
2. Lava Flow Mapping and DEM Generation: AReview of Remote Sensing–Based Methods
[10] A number remote of remote sensing techniques arenow available for observing the evolution of an eruption insafety [Baldi et al., 2002] and collecting quantitative datauseful for monitoring the morphological changes on the
volcano surface. In order to monitor a specific eruptionparameter (volume and area of the lava field, effusion rates,lava temperature, etc.) the observing system should beselected by considering its temporal and spatial resolutionand the achievable accuracy of the measured parameters.[11] Regarding the geometrical parameters, most of the
available satellite-borne systems provide data which, afterbeing georeferenced and rectified, can be used for mapping2D (planimetric) features, such as lava flow field limits. Inthis case, estimates of erupted lava volume may be obtainedif thickness measurements are available from external datasources. If 3D coordinates of ground points can be mea-sured, it is possible to directly estimate the lava volumesemplaced over a known time period. This can be achievedby reconstructing the surface topography through a DigitalElevation Model (DEM), for example by using SAR inter-ferometry (InSAR) [Franceschetti and Lanari, 1999] tech-niques or processing stereopairs acquired by medium- tohigh-resolution sensors [Curlander and McDonough, 1991;Ridley et al., 1997].[12] Limiting factors for the use of satellite data are not
only the generally low spatial resolution (with the exceptionof the recently available high-resolution commercial satel-lites) but also the constraints stemming from a predefinedacquisition schedules. Satellite overpasses may, for exam-ple, coincide with cloudy periods or may miss short-livedactivity altogether.[13] A more flexible and accurate alternative to the
satellite-based methods for DEM generation over largeareas is aerial data collection using Light Detection AndRanging (LIDAR) systems [Fouler, 2001] and photogram-metric cameras [e.g., Baldi et al., 2002]. Both of thesemethods permit the acquisition of a large number of 3Dpoints and generation of high-resolution DEMs (space griddensity down to few point per square meters). The aerialsurveys can be repeated, if logistical and weather conditionsare favorable, many times during an eruption and thusappropriate for monitoring the spatial evolution of lavaflows [e.g., Baldi et al., 2005; Honda and Nagai, 2002].Recently, the application of LIDAR systems is increasing[e.g., Mouginis-Mark and Garbeil, 2005] owing to theircapability of acquiring dense and accurate 3D point net-works which permit accurate representation of terrain fea-tures, with less processing time than the photogrammetrictechnique.[14] A summary of the main characteristics of the avail-
able techniques to directly extract medium to high spatialresolution DEMs is reported in Table 1. If a DEM cannot bedirectly extracted from data collected during dedicatedsurveys, preexisting contour maps can be digitized andanalyzed as described in this work and, for example, byStevens et al. [1999]. In this case, the planimetric andvertical accuracies should be derived from the map scale.
3. The 2001 Eruption
3.1. Eruption Narrative
[15] The narrative of the 2001 eruption is herebyreported with the support of six maps (Figure 2) whichtrack the complex temporal evolution of the flow field.The six maps are drawn from digital aerial images thatwere rectified to posteruption 1:10,000 aerial orthophotos(Figure 1) of the Provincia Regionale di Catania (PRC).
F02029 COLTELLI ET AL.: THE 2001 ETNA LAVA FLOW ERUPTION
2 of 18
F02029
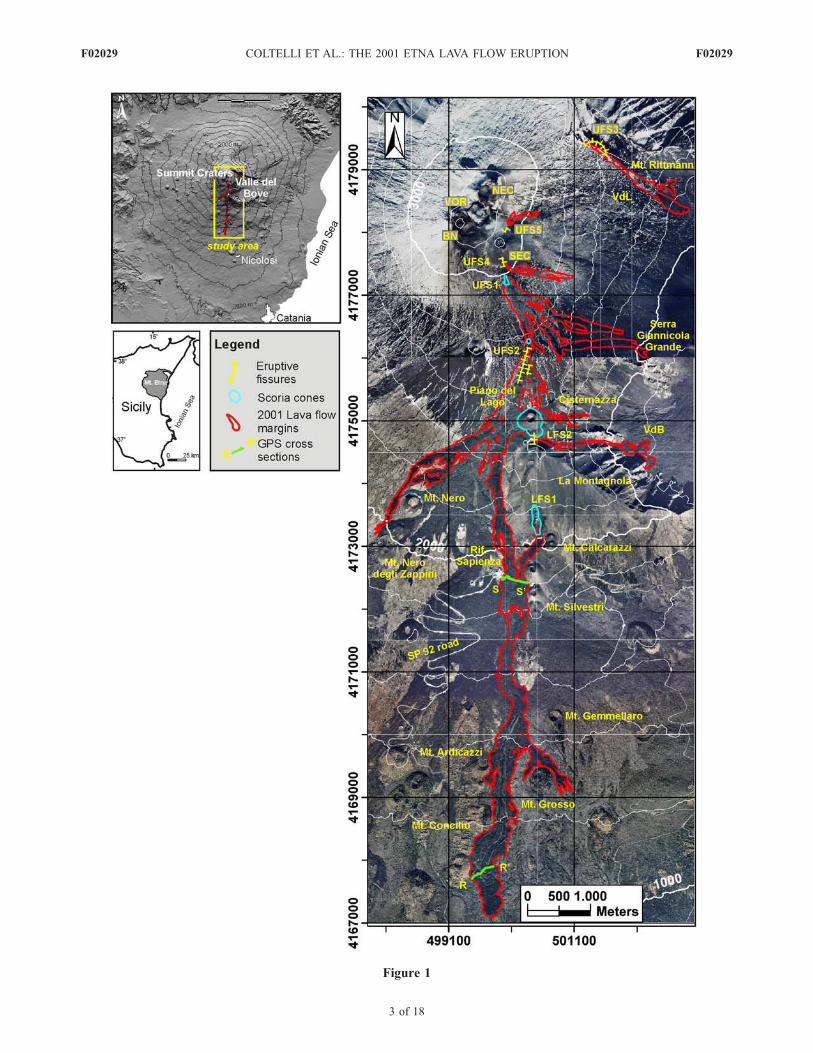
Figure 1
F02029 COLTELLI ET AL.: THE 2001 ETNA LAVA FLOW ERUPTION
3 of 18
F02029
These aerial images were then georeferenced for outliningthe lava flow margins.[16] During the first three days of the eruption, activity
evolved rapidly. The eruption began on 17 July with thealmost simultaneous opening of several eruptive fissures onthe south and northeast flanks of the volcano, extendingbetween the summit and 2100 m a.s.l. (Figure 1). On thebasis of structural data and the geochemical composition ofthe lavas [Calvari, 2001; Corsaro et al., 2007], the fissureswere subdivided into two main groups each belonging todifferent eruptive systems (Figure 1). The Upper FissureSystem (UFS) included those fissures that opened (1) at thefoot of the South-East Crater (UFS1) and on the flanks ofthe South-East cone (UFS4 and UFS5); (2) on the southernflank between 2780 and 2640 m a.s.l. (UFS2); and (3) inValle del Leone, on the northern flank (UFS3). The LowerFissure System (LFS), the most hazardous owing to itslocation in relation to human settlements, opened on thesouthern flank at 2550 m a.s.l. (LFS2) and 2100 m a.s.l.(LFS1).3.1.1. Activity During 17–18 July (Figure 2a)[17] The eruption began around 7:00 on 17 July, when the
eruptive fissure UFS1 opened at the base of the South-EastCrater, feeding a lava flow that moved SE. Late in theevening two new fissures (together called UFS2) opened atabout 2700 m a.s.l., producing lava flows that spread acrossthe Piano del Lago. A few hours later, at 02:20 on 18 July,the LFS1 fissure opened between 2100 and 2150 m a.s.l.,close to Mt. Calcarazzi. The most active effusive vent of the2001 eruption became established at the lower end of thisfissure, emitting a lava flow that extended around Mt.Silvestri and rapidly reached the SP92 road. At the sametime, intense phreatomagmatic activity began at the higherportion of the LFS1 fissure and lasted three days.3.1.2. Activity on 19 July (Figure 2b)[18] While the UFS1 lava flow continued to propagate
toward the Belvedere area, the UFS2 flows moved south-
ward and reached 2400 m a.s.l., close to La Montagnola.Late in the afternoon, two pit craters (LFS2) opened in thePiano del Lago area at 2550 m a.s.l., where an increasingphreatomagmatic ash emission began [Taddeucci et al.,2002; Scollo et al., 2007]. At this time, the main flow fromthe LFS1 vent had extended below 1450 m a.s.l.3.1.3. Activity During 20–23 July (Figure 2c)[19] Early on 20 July, the eruptive fissure UFS3 opened at
2600 m a.s.l. in Valle del Leone, feeding a new lava flow.On 23 July one of the flows fed by the UFS2 fissurescontinued to move approaching the Rifugio Sapienza. Alava flow extended from the UFS1 fissure toward the Valledel Bove. In addition two new short fissures opened on thesouthern (UFS4) and northern flanks (UFS5) of the South-East Crater. Both fed flows at modest effusion rates. Thelava flow fed by LFS1 had extended to 1048 m a.s.l. by theearly afternoon of 23 July.3.1.4. Activity During 24–25 July (Figure 2d)[20] Between 24 and 25 July, most of the flows emitted
from the UFS had reached their maximum lengths. AtUFS2, continuous overflows covered the upper portionsof the previously emplaced lava flow field above 2400 ma.s.l. On 24 July, powerful Strombolian activity graduallybuilt a scoria cone at 2550 m a.s.l. (UFS2). Weak lavaeffusion characterized activity at UFS5 on 25 July. TheUFS3 lava flow in Valle del Leone reached 2100 m a.s.l.,partially covering Mt. Rittmann, and the effusive activity atUFS4 ceased. The lava flow originating at the LFS1 ventattained its lowest elevation of 1040 m a.s.l., while a fewoverflows piled up on the proximal area of the flow field.3.1.5. Activity During 26–27 July (Figure 2e)[21] At the LFS2 fissure, on 26 July, new lava flows
began to issue from the SW base of the cone that haddeveloped on this fissure segment, reaching the SP92 roadduring the evening and connecting with the LFS1 lava fieldat 1840 m a.s.l. On 27 July a lava flow emerged from a newvent located at the southern tip of the LFS2 fissure and
Figure 1. Posteruption orthophotos obtained from the 2001 photogrammetric surveys showing relevant topographicfeatures, lava flows limits (red), eruptive fissures (yellow), scoria cones (light blue), and GPS cross sections (green). TheUpper Fissure System (UFS) consists of five fissures: UFS1: 2950 m a.s.l.; UFS2: 2780–2640 m a.s.l.; UFS3: 2600 ma.s.l.; UFS4: 3050 m a.s.l.; UFS5: 3050 m a.s.l. The Lower Fissure System (LFS) consists of two fissures: LFS1: 2100 ma.s.l.; LFS2: 2550 m a.s.l. The summit craters are: Voragine (VOR), Bocca Nuova (BN), Southeast Crater (SEC) andNortheast Crater (NEC). VdB, Valle del Bove; VDL, Valle del Leone. Contour lines are drawn every 200 m between 1000and 3200 m a.s.l. Insets on the left locate Mt. Etna in the eastern part of Sicily and the study area on the volcano edifice.
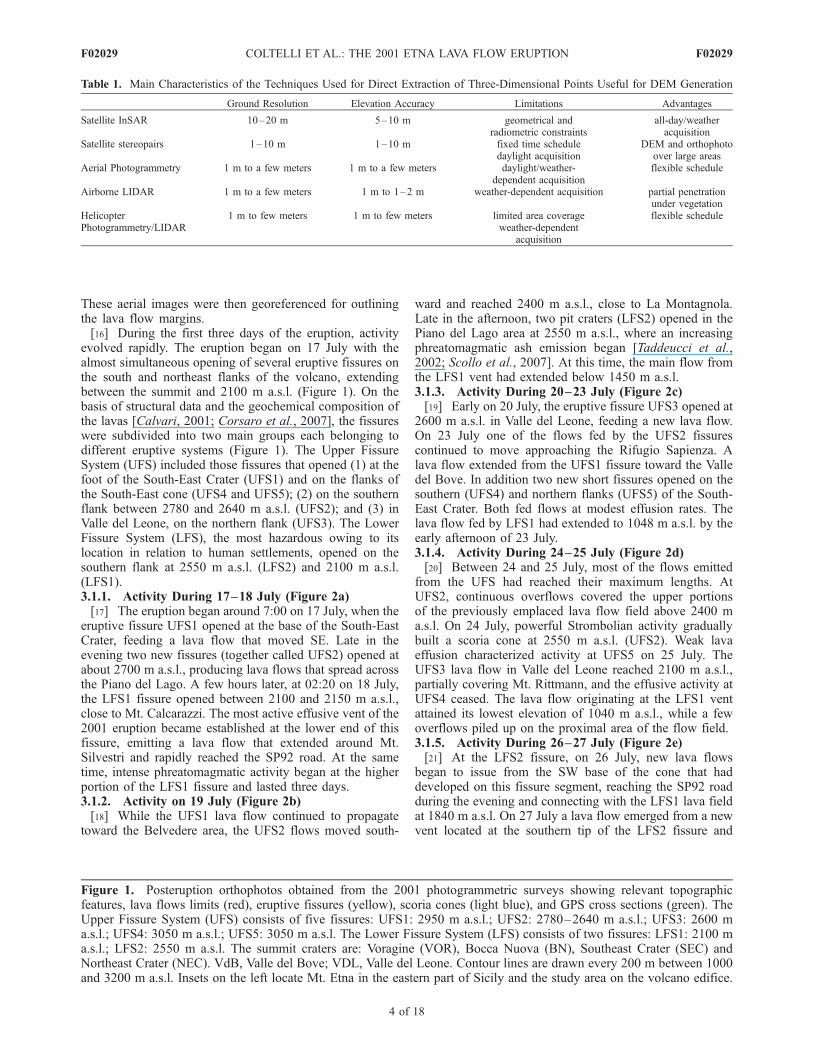
Table 1. Main Characteristics of the Techniques Used for Direct Extraction of Three-Dimensional Points Useful for DEM Generation
Ground Resolution Elevation Accuracy Limitations Advantages
Satellite InSAR 10–20 m 5–10 m geometrical andradiometric constraints
all-day/weatheracquisition
Satellite stereopairs 1–10 m 1–10 m fixed time scheduledaylight acquisition
DEM and orthophotoover large areas
Aerial Photogrammetry 1 m to a few meters 1 m to a few meters daylight/weather-dependent acquisition
flexible schedule
Airborne LIDAR 1 m to a few meters 1 m to 1–2 m weather-dependent acquisition partial penetrationunder vegetation
HelicopterPhotogrammetry/LIDAR
1 m to few meters 1 m to few meters limited area coverageweather-dependent
acquisition
flexible schedule
F02029 COLTELLI ET AL.: THE 2001 ETNA LAVA FLOW ERUPTION
4 of 18
F02029
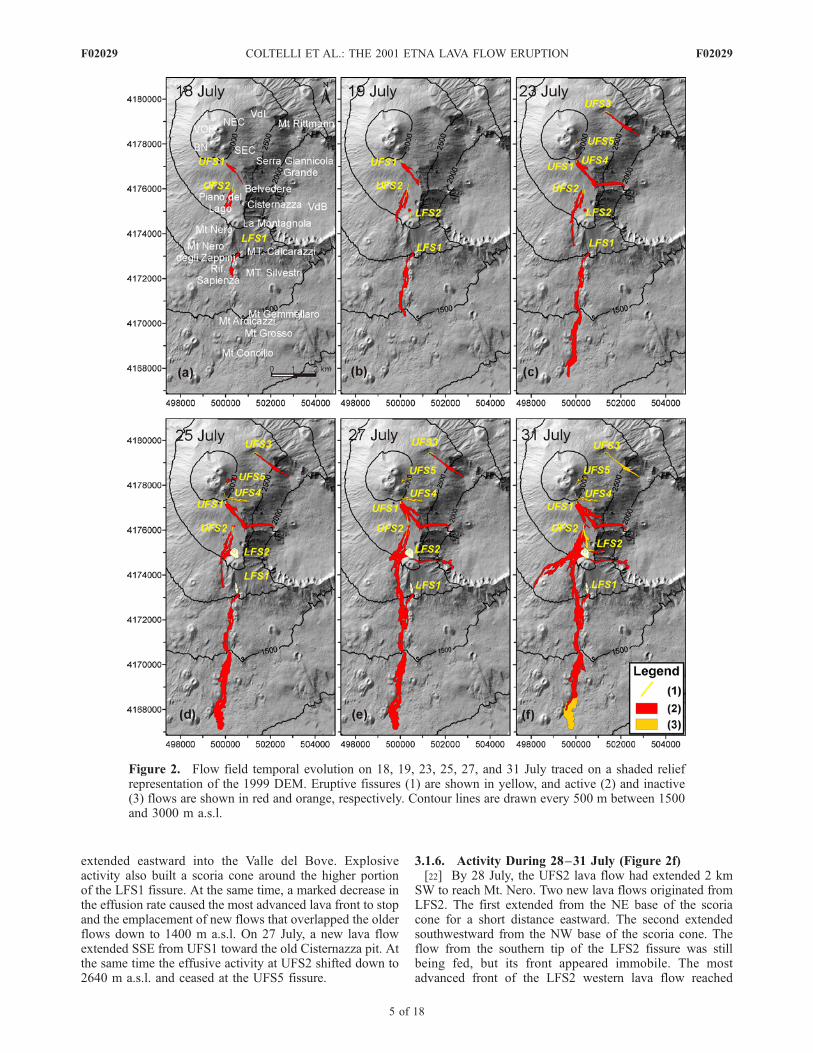
extended eastward into the Valle del Bove. Explosiveactivity also built a scoria cone around the higher portionof the LFS1 fissure. At the same time, a marked decrease inthe effusion rate caused the most advanced lava front to stopand the emplacement of new flows that overlapped the olderflows down to 1400 m a.s.l. On 27 July, a new lava flowextended SSE from UFS1 toward the old Cisternazza pit. Atthe same time the effusive activity at UFS2 shifted down to2640 m a.s.l. and ceased at the UFS5 fissure.
3.1.6. Activity During 28–31 July (Figure 2f)[22] By 28 July, the UFS2 lava flow had extended 2 km
SW to reach Mt. Nero. Two new lava flows originated fromLFS2. The first extended from the NE base of the scoriacone for a short distance eastward. The second extendedsouthwestward from the NW base of the scoria cone. Theflow from the southern tip of the LFS2 fissure was stillbeing fed, but its front appeared immobile. The mostadvanced front of the LFS2 western lava flow reached
Figure 2. Flow field temporal evolution on 18, 19, 23, 25, 27, and 31 July traced on a shaded reliefrepresentation of the 1999 DEM. Eruptive fissures (1) are shown in yellow, and active (2) and inactive(3) flows are shown in red and orange, respectively. Contour lines are drawn every 500 m between 1500and 3000 m a.s.l.
F02029 COLTELLI ET AL.: THE 2001 ETNA LAVA FLOW ERUPTION
5 of 18
F02029
1700 m a.s.l. on 29 July and stopped. Likewise, the effusiveactivity at UFS3 completely ceased on 30 July, at whichpoint the front of the UFS1 flow directed toward theBelvedere appeared motionless. Lava flows fed by LFS1had active fronts that extended from 1180 m a.s.l. on 28 Julyto 1060 m a.s.l. on 30 July. At that point a lateral easternbranch developed at 1490 m a.s.l. (close to Mt. Gemellaro)which moved toward Mt. Grosso. A new overflow beganfrom the SW base of the 2550 m scoria cone (LFS2), againthreatening Rifugio Sapienza on 31 July.3.1.7. Activity During 1–9 August[23] The eruption began to wane following 1 August. The
LFS1 lava flow became tube-contained downslope of1700–1600 m a.s.l. for a distance of about 500 m, beforeemerging and flowing to 1080 m a.s.l. Several ephemeralvents formed and emitted lava flows that were less than onehundred meters long. On 2 August two ephemeral vents,located west of Mt. Gemellaro at 1470 and 1460 m a.s.l.,produced lava flows that moved toward Mt. Grosso andsouthwestward, respectively. While the main flow reached1200 m a.s.l. on 7 August, the lava flow moving eastwardtoward Mt. Grosso stagnated at about 1240 m a.s.l. The lavaflow extending from the LFS2 scoria cone suffered amarked decrease in activity on 1 August and stopped on2 August. Also the explosive activity at this cone becamedrastically reduced, being replaced by minor ash emissionthat entirely ended on 6 August. The front of the UFS1 flowdirected toward the Belvedere was moving slowly on1 August and stopped on 2 August. The flows from UFS2continued to propagate very slowly toward Mt. Nero, buttheir fronts stopped on 7 August. However, several over-flows remained active until 9 August. Finally, on 8 Augustthe Strombolian activity at the top of the LFS1 fissureceased and active overflows remained confined above1900 m a.s.l. The eruption ended during the late eveningof 9 August and its final flow field is delimited in Figure 1.
3.2. Morphological Features of the Lava Flow Field
[24] The lava flow field of the 2001 eruption was mappedusing a series of color 1:10,000 scale PRC (ProvinciaRegionale di Catania) orthophotos acquired on 3 December2001 (Figure 1). The color orthophotos allowed detailedmapping of the lava flow field and description of its mainmorphological features. In this way it was possible todistinguish the 2001 lava flows from the adjacent freshlavas (i.e., those of the 2000, 1999, 1989, 1985 and 1983eruptions) and to reconstruct the 2001 flow field boundarieswith a high accuracy. The only limitation of the orthophotoswas snow cover toward the volcano summit. In particular,the reconstruction of the lava flows emplaced in the summitarea, i.e., above 2600–2800 m a.s.l., were generally char-acterized by a planimetric error of up to 10 m as aconsequence of the poor orthophoto quality and snow cover.Below 2600–2800 m a.s.l., however, the 2001 lava flowswere clearly distinguishable and could be mapped with aplanimetric error of less than 5 m.[25] The final lava flow field produced during the 2001
eruption was the result of lava flow emplacement related toseven fissure systems. The LFS1, LFS2-west, UFS1 andUFS2 vents fed compound lava flow fields. Conversely theLFS2-east, UFS3, UFS4 and UFS5 vents generated simplelava flows (terminology of Walker [1971]).
[26] The long-lasting (23 days) effusive activity at theLFS1 vent produced a narrow lava flow 6.4 km long, with amaximum width of 545 m, that reached 1040 m a.s.l.(Figure 1). This lava flow field was characterized by aamorphology and a large axial lava channel, up to 90 m wide,developed between the vent and about 1700 m a.s.l. Thelava flow field down to 1700 m a.s.l. was characterized bythe superimposition of several lava flow units that weremainly related to overflows from the main lava channel.Between 1460 and 1080 m a.s.l. the main lava channel wasdivided into several secondary channels, with maximumwidths of about 100 m. These formed during the uphillregression of the lava flows that began on 26 July. The frontalportion of the lava flow field was produced by the super-position of the lava flow units that drained from the 1460–1080 m lava channels. A secondary branch that developedbetween 1400 m and 1250 m a.s.l., surrounding Mt. Grosso,was formed by the juxtaposition of several lava flow unitsbetween 30 July and 6 August.[27] The LFS2 fissure comprised four effusive vents
located at the base of the large scoria cone built by thestrombolian activity, as well as at the southern tip of thefissure. The western vents in this system fed prolongedeffusive activity that lasted 15 days and generated a lavaflow field that was 3.3 km long, had a maximum width of265 m and reached 1720 m a.s.l., where it partially over-lapped the LFS1 lava flow. This narrow lava field was builtby the superposition of several lava flow units that filled agully on the west slope of La Montagnola down to RifugioSapienza. The flow units were supplied from lava channelsextending from 2500 m a.s.l., near the vent, to 1900 m a.s.l.In general they showed aa morphology and well developedflow fronts down to a break in slope at 1900 m a.s.l.[28] The UFS1 vent, located at the south base of South-
East Crater, formed a fan-shaped lava flow field that was2.7 km long and 430 m wide (Figure 1). It was active for14 days and had aa morphology. The lava flow field was theresult of the juxtaposition of several single flow units thatextended eastward down the western wall of the Valle delBove and southward (UFS1-LB) toward the LFS2 scoriacone, partially overlapping the UFS2 lava flow. Other flowunits piled up in the central portion of the lava field close tothe vent.[29] The 750-m-long UFS2 (2780–2640 m a.s.l.) fissure
comprised a small spatter cone at its upper tip and wascharacterized by lava emission from different points. In23 days of activity, it formed a lava flow field that was4.1 km long, 360 m wide, and which reached 1890 m a.s.l.,with the flow front reaching a point close to Mt. Nero degliZappini (Figure 1). The lava flows had aa morphology withlava channels related to the emplacement of single flowunits that piled up in the central portion of the lava flowfield. The lateral and frontal portions were characterized bysingle lava flow units that partially overlapped the lava flowfield from the LFS2 west-vents.[30] Simple lava flows were emitted from vents that were
active for less than 10 days. In particular, the LFS2 east-vents generated two distinct lava flows, 0.78 and 2 km long,respectively, and both less than 150 m wide, that developedalong the western wall of the Valle del Bove. The secondone, emitted on the southern tip of the fissure, reached theValle del Bove floor at about 1785 m a.s.l. (Figure 1). The
F02029 COLTELLI ET AL.: THE 2001 ETNA LAVA FLOW ERUPTION
6 of 18
F02029
UFS3 fissure formed an arc that followed the morphologyof the Valle del Leone wall (Figure 1). Two emission pointsestablished along this fissure generated a narrow lava flowthat was 2 km long, had a maximum width of 170 m andwhich reached 2070 m a.s.l. in Valle del Bove. This flow hadaa morphology with a small axial lava channel. The UFS4vent, located on the SE flank of South-East Crater, formed alava flow with aa morphology that was 1.1 km long, lessthan 150 m wide and which extended to 2670 m a.s.l. TheUFS5 vent, on the NE flank of South-East Crater, generated a0.54-km-long lava flow with aa morphology (Figure 1).
3.3. Syneruption and Posteruption Field DataCollection
[31] During the 2001 eruption, daily surveys were carriedout to map the propagation of ground surface fractures anderuptive fissures as well as the evolution of the lava flows.The collected data were plotted onto the 1:10,000 vectormap issued in 1999 by the PRC. This allowed us to producepreliminary estimates of the daily areas covered by lavaflows and to evaluate the rate of advance of the flow fronts.[32] The lava flows were mapped using digital photos
acquired during helicopter overflights and hand-held GPSmeasurements collected during ground surveys along theactive flow margins and fronts. At each GPS checkpoint wemeasured the lava flow thickness using a laser rangefinderwith one meter accuracy.[33] In addition, we carried out seven estimates (on 18,
20, 22, 24 July, August 1, 4, 8) of the effusion rate close tothe LFS1 vent by measuring the main channel width (w)along with the depth of the molten lava inside the channel(d) and a flow surface velocity (v). Effusion rate Er wasestimated from the relation Er = wdv as described byFrazzetta and Romano [1984], Guest et al. [1987] andCalvari et al. [1994]. The measurements were all performedin an area of flat morphology, immediately below the vent,that did not show significant changes during the eruption.We evaluated the depth of the lava channel from thepreeruption and posteruption topography. The lava channeldepth was considered constant, except for possible thermo-mechanical erosion effects on the lava channel floor, that weassumed limited because of the flat substrate. The maximumflow surface velocity was determined by measuring the timetaken by a marker at the center of the flow to travel betweentwo selected natural targets. The distance between the twotargets, the channel width and the depth of the molten lavain the main channel were measured with the laser range-finder. Several marker speeds were taken during theseexperiments to obtain a stable average value. Effusion ratesbetween 30 m3/s toward the beginning of the eruption and1 m3/s at the end were obtained.[34] During September 2001, one month after the erup-
tion ended, a survey was completed around the margins ofthe entire lava flow field to measure the final thickness ofthe flows. As part of this survey, the average thicknesseswere obtained for every flow. These were used to calculatethe volume of those lava flow field portions, located above2700 m a.s.l., where the DEM data are not reliable and/orupdated.[35] Finally, for the lava flow field generated by the LFS1
vent, two flow-transverse sections were carried out using a
kinematic GPS receiver (Trimble 4700 Geodetic Surveyor).This allowed us to measure the local thickness of lava flowswith decimeter precision and to obtain the shape and size oflava channels. The first section (S-S’ in Figure 1) waslocated in the upper portion of the lava flow field at1890 m a.s.l. close to Rifugio Sapienza, about 800 m belowthe vent. This section also crossed the main lava channel.The second section (R-R’ in Figure 1) was located at1065 m a.s.l., close to Mt. Rinazzi, about 50 m upslopefrom the lava front in an area with a nearly flat morphology,characterized by the accumulation of lava flows extendingfrom the main lava channel.
4. Topographic Analysis
[36] The volume and morphology of the flows formingthe 2001 lava field were extracted using both topographicand planimetric approaches as described below.
4.1. Data Collection
[37] The 1999 vector map of the PRC was chosen tocharacterize the preemplacement topography because it wasbased on an aerial survey performed on 9 November 1998.The posteruption map of PRC was obtained from an aerialsurvey performed on 3 December 2001. The two vectorcontour maps were derived from photogrammetric surveys,whose original data were not available to us. The map scalesare 1:10,000 for the 1999 and 1:2000 for the 2001. Themaps contain spot height data and contour lines withintervals of 10 and 2 m for 1999 and 2001, respectively.Contour lines every 10 m were extracted from both contourmaps in order to provide consistent data for DEM extrac-tion. Both maps, originally referred to the national projec-tion system (GAUSS-BOAGA-Datum Roma40), wereconverted into the UTM-WGS84 coordinate system byapplying the necessary transformation.[38] The 1999 map covers the whole province of Catania,
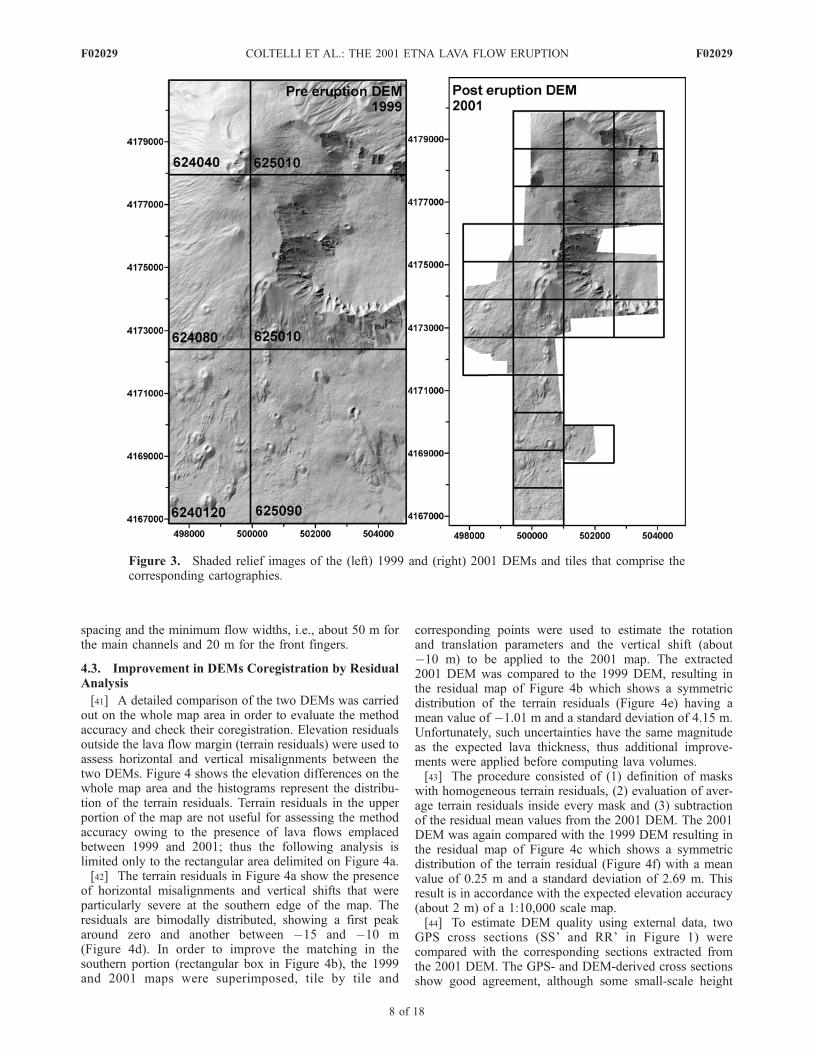
subdivided in 7.5 � 5.5 km tiles, whereas the 2001 islimited to the eruption area and has an irregular shape(Figure 3). Their comparison revealed a geometric incon-sistency both in the planimetric and vertical components,probably due to an inaccurate photogrammetric processingof the 2001 map. A procedure for improving the matchingwith the 1999 map was thus applied to the 2001 map beforeDEM extraction, as described in section 4.3.
4.2. DEM Extraction
[39] The TIN (Triangular Irregular Network) method,based on Delaunay triangulation [Lee and Schachter,1980], was utilized to interpolate elevation data. TheTIN method partitions a surface into a set of contiguous,nonoverlapping triangles. A height value is recorded foreach triangle node. A mask delimiting the 2001 maparea was drawn and the TIN method was applied acrossthis mask to avoid triangulation in areas with no heightdata.[40] The DEMs interpolated from the TIN were used to
reconstruct the 1999 and 2001 topography in a grid format,which is more appropriate for conducting spatial analysis,such as volume estimation. The DEM grid size was set to10 m which was considered appropriate given the data
F02029 COLTELLI ET AL.: THE 2001 ETNA LAVA FLOW ERUPTION
7 of 18
F02029
spacing and the minimum flow widths, i.e., about 50 m forthe main channels and 20 m for the front fingers.
4.3. Improvement in DEMs Coregistration by ResidualAnalysis
[41] A detailed comparison of the two DEMs was carriedout on the whole map area in order to evaluate the methodaccuracy and check their coregistration. Elevation residualsoutside the lava flow margin (terrain residuals) were used toassess horizontal and vertical misalignments between thetwo DEMs. Figure 4 shows the elevation differences on thewhole map area and the histograms represent the distribu-tion of the terrain residuals. Terrain residuals in the upperportion of the map are not useful for assessing the methodaccuracy owing to the presence of lava flows emplacedbetween 1999 and 2001; thus the following analysis islimited only to the rectangular area delimited on Figure 4a.[42] The terrain residuals in Figure 4a show the presence
of horizontal misalignments and vertical shifts that wereparticularly severe at the southern edge of the map. Theresiduals are bimodally distributed, showing a first peakaround zero and another between �15 and �10 m(Figure 4d). In order to improve the matching in thesouthern portion (rectangular box in Figure 4b), the 1999and 2001 maps were superimposed, tile by tile and
corresponding points were used to estimate the rotationand translation parameters and the vertical shift (about�10 m) to be applied to the 2001 map. The extracted2001 DEM was compared to the 1999 DEM, resulting inthe residual map of Figure 4b which shows a symmetricdistribution of the terrain residuals (Figure 4e) having amean value of �1.01 m and a standard deviation of 4.15 m.Unfortunately, such uncertainties have the same magnitudeas the expected lava thickness, thus additional improve-ments were applied before computing lava volumes.[43] The procedure consisted of (1) definition of masks
with homogeneous terrain residuals, (2) evaluation of aver-age terrain residuals inside every mask and (3) subtractionof the residual mean values from the 2001 DEM. The 2001DEM was again compared with the 1999 DEM resulting inthe residual map of Figure 4c which shows a symmetricdistribution of the terrain residual (Figure 4f) with a meanvalue of 0.25 m and a standard deviation of 2.69 m. Thisresult is in accordance with the expected elevation accuracy(about 2 m) of a 1:10,000 scale map.[44] To estimate DEM quality using external data, two
GPS cross sections (SS’ and RR’ in Figure 1) werecompared with the corresponding sections extracted fromthe 2001 DEM. The GPS- and DEM-derived cross sectionsshow good agreement, although some small-scale height
Figure 3. Shaded relief images of the (left) 1999 and (right) 2001 DEMs and tiles that comprise thecorresponding cartographies.
F02029 COLTELLI ET AL.: THE 2001 ETNA LAVA FLOW ERUPTION
8 of 18
F02029
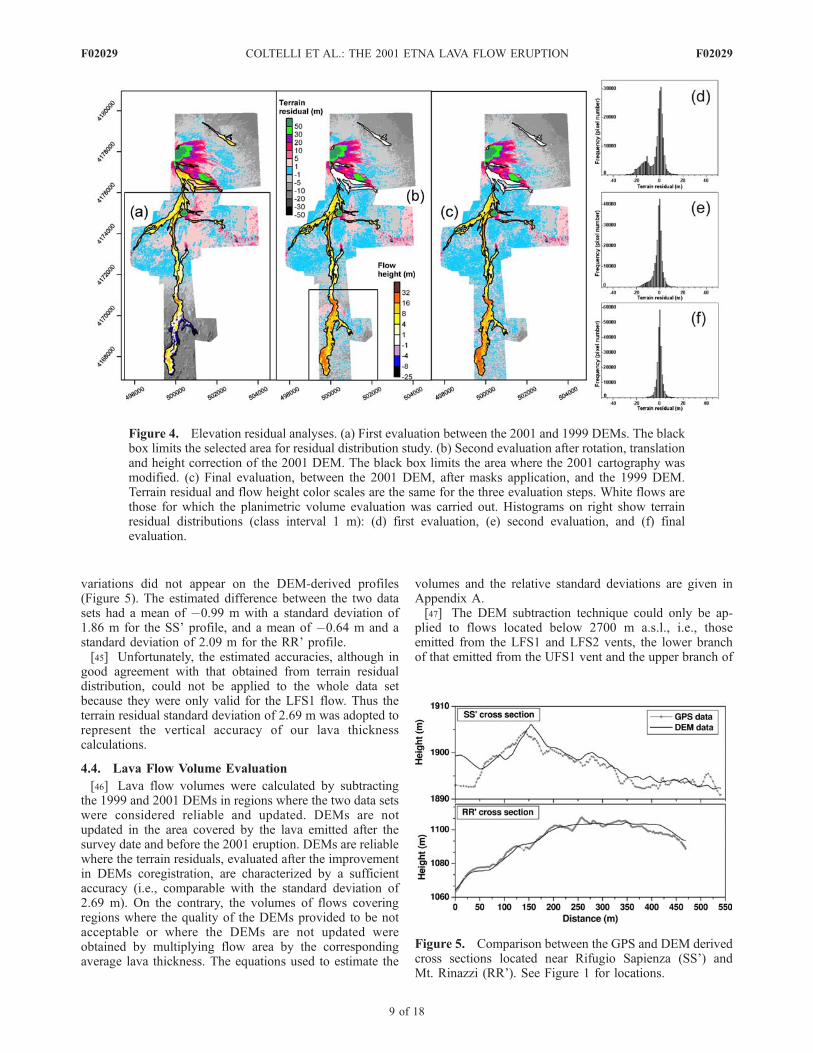
variations did not appear on the DEM-derived profiles(Figure 5). The estimated difference between the two datasets had a mean of �0.99 m with a standard deviation of1.86 m for the SS’ profile, and a mean of �0.64 m and astandard deviation of 2.09 m for the RR’ profile.[45] Unfortunately, the estimated accuracies, although in
good agreement with that obtained from terrain residualdistribution, could not be applied to the whole data setbecause they were only valid for the LFS1 flow. Thus theterrain residual standard deviation of 2.69 m was adopted torepresent the vertical accuracy of our lava thicknesscalculations.
4.4. Lava Flow Volume Evaluation
[46] Lava flow volumes were calculated by subtractingthe 1999 and 2001 DEMs in regions where the two data setswere considered reliable and updated. DEMs are notupdated in the area covered by the lava emitted after thesurvey date and before the 2001 eruption. DEMs are reliablewhere the terrain residuals, evaluated after the improvementin DEMs coregistration, are characterized by a sufficientaccuracy (i.e., comparable with the standard deviation of2.69 m). On the contrary, the volumes of flows coveringregions where the quality of the DEMs provided to be notacceptable or where the DEMs are not updated wereobtained by multiplying flow area by the correspondingaverage lava thickness. The equations used to estimate the
volumes and the relative standard deviations are given inAppendix A.[47] The DEM subtraction technique could only be ap-
plied to flows located below 2700 m a.s.l., i.e., thoseemitted from the LFS1 and LFS2 vents, the lower branchof that emitted from the UFS1 vent and the upper branch of
Figure 4. Elevation residual analyses. (a) First evaluation between the 2001 and 1999 DEMs. The blackbox limits the selected area for residual distribution study. (b) Second evaluation after rotation, translationand height correction of the 2001 DEM. The black box limits the area where the 2001 cartography wasmodified. (c) Final evaluation, between the 2001 DEM, after masks application, and the 1999 DEM.Terrain residual and flow height color scales are the same for the three evaluation steps. White flows arethose for which the planimetric volume evaluation was carried out. Histograms on right show terrainresidual distributions (class interval 1 m): (d) first evaluation, (e) second evaluation, and (f) finalevaluation.
Figure 5. Comparison between the GPS and DEM derivedcross sections located near Rifugio Sapienza (SS’) andMt. Rinazzi (RR’). See Figure 1 for locations.
F02029 COLTELLI ET AL.: THE 2001 ETNA LAVA FLOW ERUPTION
9 of 18
F02029
that emitted from the UFS2 vent (respectively UFS1-LBand UFS2-UB in Table 2). Analysis of the UFS1-LB flowwas complicated by the fact that it partially overlapped theUFS2-UB, similarly the front of the LFS2 flow partiallyoverlapped the LFS1 flow. Because the overlapped areaswere very small, the errors due to not considering the UFS2-UB volume lying under the UFS1-LB and the LFS1 volumelying under the LFS2 flow were considered negligible.[48] Volume estimation by DEM subtraction (Table 2)
was carried out using a mass balance analysis, included in aGIS toolset, and permitted evaluation of surface loss (cut)and gain (fill). In order to restrict the volume computation tothe flow field area, the lava flow field limits, mapped on the2001 orthophotos, were used to mask the 2001 DEM anddagala (Sicilian name for areas not covered by lava withinthe flow borders) limits were taken into account. The areaswith zero or negative elevation change within the lava flowfield limits were not considered in the volume estimation.The elevation changes in these areas most probably werewithin the DEM uncertainty of 2.69 m, or the flow limitswere not correctly defined. However, their contributionsrepresent less than 2% of the total flow areas (Table 2), sothat their exclusion has a negligible impact on the volumeestimation.[49] The volumes of the other lava flows cannot be
estimated from the DEM subtraction. Lava flows eruptedfrom the fissures that opened on the South-East Crater cone(UFS5 and UFS4) and from the UFS1 vent (excluding itslower branch UFS1-LB), overlap lava emitted between late1998 and 2001. The Valle del Leone lava flow (UFS3) laywithin an erroneously georeferenced part of the 2001 map.Volumes for these flows (Table 3) were thus estimated bymeans of the planimetric approach, that is by multiplyingthe corresponding areas by their average thicknesses,obtained from levee heights measured after the end of the
eruption. Moreover the lower branch of the UFS2 flow(UFS2-LB in Table 3) is partially covered by lava emittedfrom the LFS2 vent. Its volume was evaluated by multiply-ing its area, reconstructed from the aerial photos, by itsthickness, estimated from cross sections extracted outsideand inside the overlapping area.[50] Table 4 reports the total volumes obtained for the
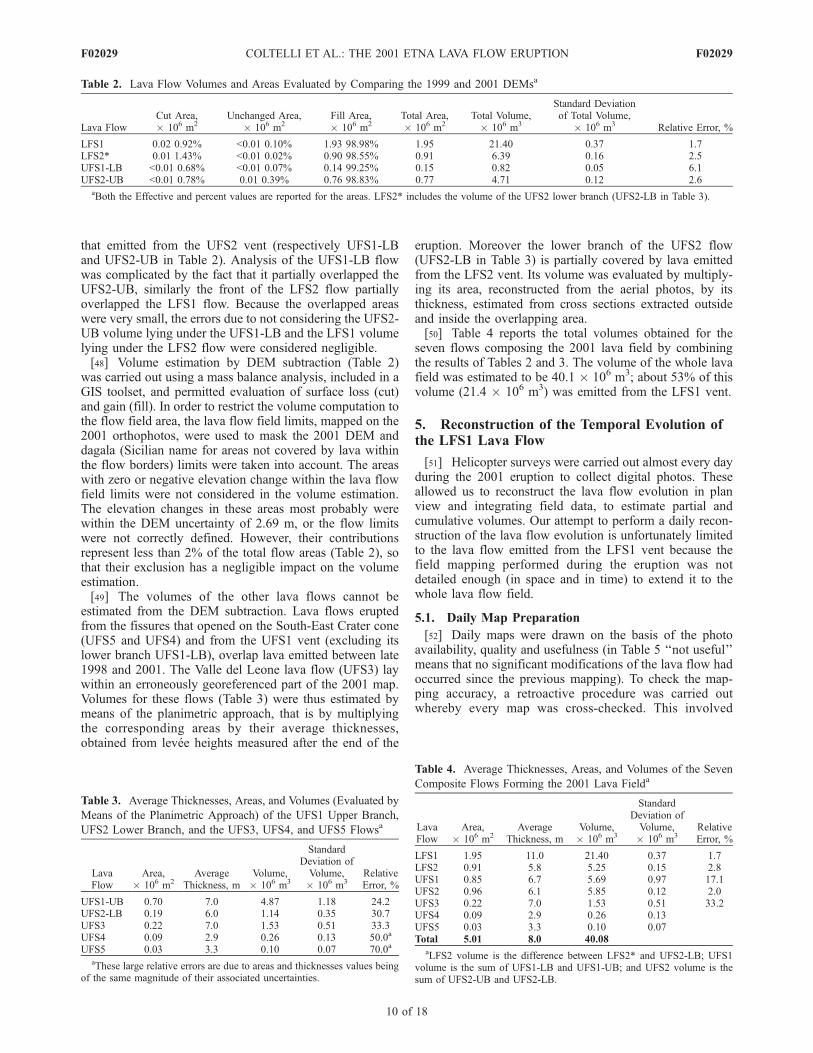
seven flows composing the 2001 lava field by combiningthe results of Tables 2 and 3. The volume of the whole lavafield was estimated to be 40.1 � 106 m3; about 53% of thisvolume (21.4 � 106 m3) was emitted from the LFS1 vent.
5. Reconstruction of the Temporal Evolution ofthe LFS1 Lava Flow
[51] Helicopter surveys were carried out almost every dayduring the 2001 eruption to collect digital photos. Theseallowed us to reconstruct the lava flow evolution in planview and integrating field data, to estimate partial andcumulative volumes. Our attempt to perform a daily recon-struction of the lava flow evolution is unfortunately limitedto the lava flow emitted from the LFS1 vent because thefield mapping performed during the eruption was notdetailed enough (in space and in time) to extend it to thewhole lava flow field.
5.1. Daily Map Preparation
[52] Daily maps were drawn on the basis of the photoavailability, quality and usefulness (in Table 5 ‘‘not useful’’means that no significant modifications of the lava flow hadoccurred since the previous mapping). To check the map-ping accuracy, a retroactive procedure was carried outwhereby every map was cross-checked. This involved
Table 2. Lava Flow Volumes and Areas Evaluated by Comparing the 1999 and 2001 DEMsa
Lava FlowCut Area,� 106 m2
Unchanged Area,� 106 m2
Fill Area,� 106 m2
Total Area,� 106 m2
Total Volume,� 106 m3
Standard Deviationof Total Volume,
� 106 m3 Relative Error, %
LFS1 0.02 0.92% <0.01 0.10% 1.93 98.98% 1.95 21.40 0.37 1.7LFS2* 0.01 1.43% <0.01 0.02% 0.90 98.55% 0.91 6.39 0.16 2.5UFS1-LB <0.01 0.68% <0.01 0.07% 0.14 99.25% 0.15 0.82 0.05 6.1UFS2-UB <0.01 0.78% 0.01 0.39% 0.76 98.83% 0.77 4.71 0.12 2.6
aBoth the Effective and percent values are reported for the areas. LFS2* includes the volume of the UFS2 lower branch (UFS2-LB in Table 3).
Table 3. Average Thicknesses, Areas, and Volumes (Evaluated by
Means of the Planimetric Approach) of the UFS1 Upper Branch,
UFS2 Lower Branch, and the UFS3, UFS4, and UFS5 Flowsa
LavaFlow
Area,� 106 m2
AverageThickness, m
Volume,� 106 m3
StandardDeviation ofVolume,� 106 m3
RelativeError, %
UFS1-UB 0.70 7.0 4.87 1.18 24.2UFS2-LB 0.19 6.0 1.14 0.35 30.7UFS3 0.22 7.0 1.53 0.51 33.3UFS4 0.09 2.9 0.26 0.13 50.0a
UFS5 0.03 3.3 0.10 0.07 70.0a
aThese large relative errors are due to areas and thicknesses values beingof the same magnitude of their associated uncertainties.
Table 4. Average Thicknesses, Areas, and Volumes of the Seven
Composite Flows Forming the 2001 Lava Fielda
LavaFlow
Area,� 106 m2
AverageThickness, m
Volume,� 106 m3
StandardDeviation ofVolume,� 106 m3
RelativeError, %
LFS1 1.95 11.0 21.40 0.37 1.7LFS2 0.91 5.8 5.25 0.15 2.8UFS1 0.85 6.7 5.69 0.97 17.1UFS2 0.96 6.1 5.85 0.12 2.0UFS3 0.22 7.0 1.53 0.51 33.2UFS4 0.09 2.9 0.26 0.13UFS5 0.03 3.3 0.10 0.07Total 5.01 8.0 40.08
aLFS2 volume is the difference between LFS2* and UFS2-LB; UFS1volume is the sum of UFS1-LB and UFS1-UB; and UFS2 volume is thesum of UFS2-UB and UFS2-LB.
F02029 COLTELLI ET AL.: THE 2001 ETNA LAVA FLOW ERUPTION
10 of 18
F02029
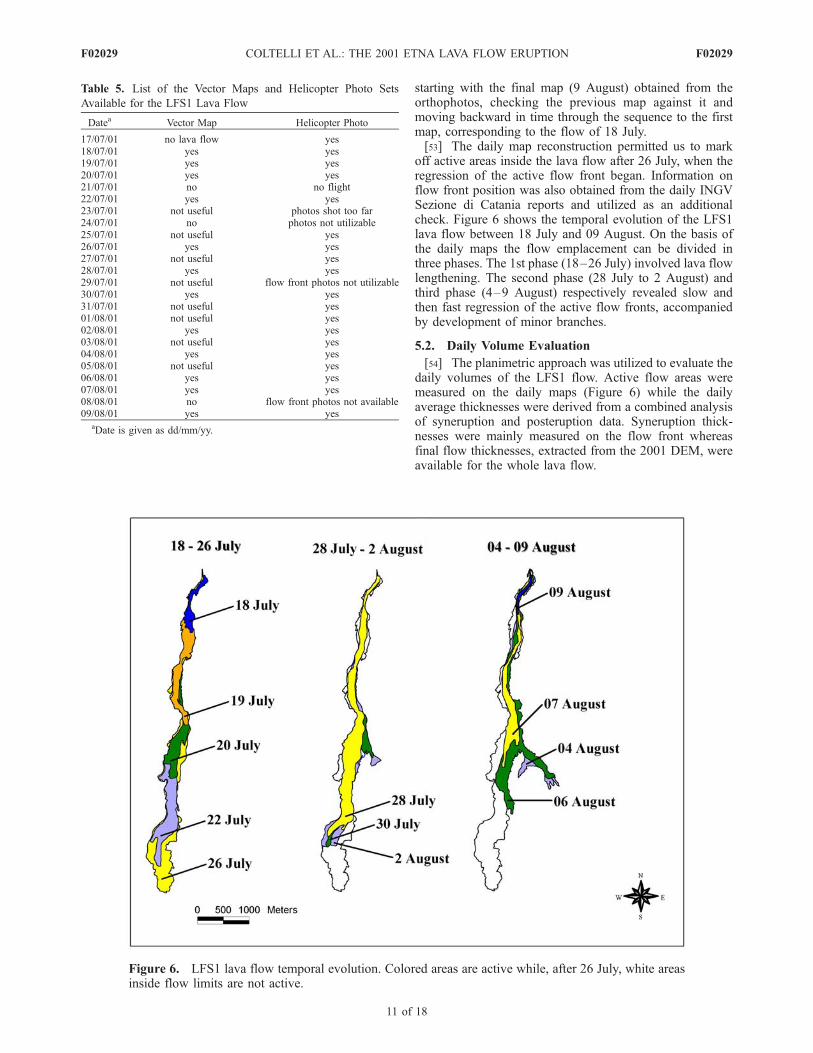
starting with the final map (9 August) obtained from theorthophotos, checking the previous map against it andmoving backward in time through the sequence to the firstmap, corresponding to the flow of 18 July.[53] The daily map reconstruction permitted us to mark
off active areas inside the lava flow after 26 July, when theregression of the active flow front began. Information onflow front position was also obtained from the daily INGVSezione di Catania reports and utilized as an additionalcheck. Figure 6 shows the temporal evolution of the LFS1lava flow between 18 July and 09 August. On the basis ofthe daily maps the flow emplacement can be divided inthree phases. The 1st phase (18–26 July) involved lava flowlengthening. The second phase (28 July to 2 August) andthird phase (4–9 August) respectively revealed slow andthen fast regression of the active flow fronts, accompaniedby development of minor branches.
5.2. Daily Volume Evaluation
[54] The planimetric approach was utilized to evaluate thedaily volumes of the LFS1 flow. Active flow areas weremeasured on the daily maps (Figure 6) while the dailyaverage thicknesses were derived from a combined analysisof syneruption and posteruption data. Syneruption thick-nesses were mainly measured on the flow front whereasfinal flow thicknesses, extracted from the 2001 DEM, wereavailable for the whole lava flow.
Table 5. List of the Vector Maps and Helicopter Photo Sets
Available for the LFS1 Lava Flow
Datea Vector Map Helicopter Photo
17/07/01 no lava flow yes18/07/01 yes yes19/07/01 yes yes20/07/01 yes yes21/07/01 no no flight22/07/01 yes yes23/07/01 not useful photos shot too far24/07/01 no photos not utilizable25/07/01 not useful yes26/07/01 yes yes27/07/01 not useful yes28/07/01 yes yes29/07/01 not useful flow front photos not utilizable30/07/01 yes yes31/07/01 not useful yes01/08/01 not useful yes02/08/01 yes yes03/08/01 not useful yes04/08/01 yes yes05/08/01 not useful yes06/08/01 yes yes07/08/01 yes yes08/08/01 no flow front photos not available09/08/01 yes yes
aDate is given as dd/mm/yy.
Figure 6. LFS1 lava flow temporal evolution. Colored areas are active while, after 26 July, white areasinside flow limits are not active.
F02029 COLTELLI ET AL.: THE 2001 ETNA LAVA FLOW ERUPTION
11 of 18
F02029
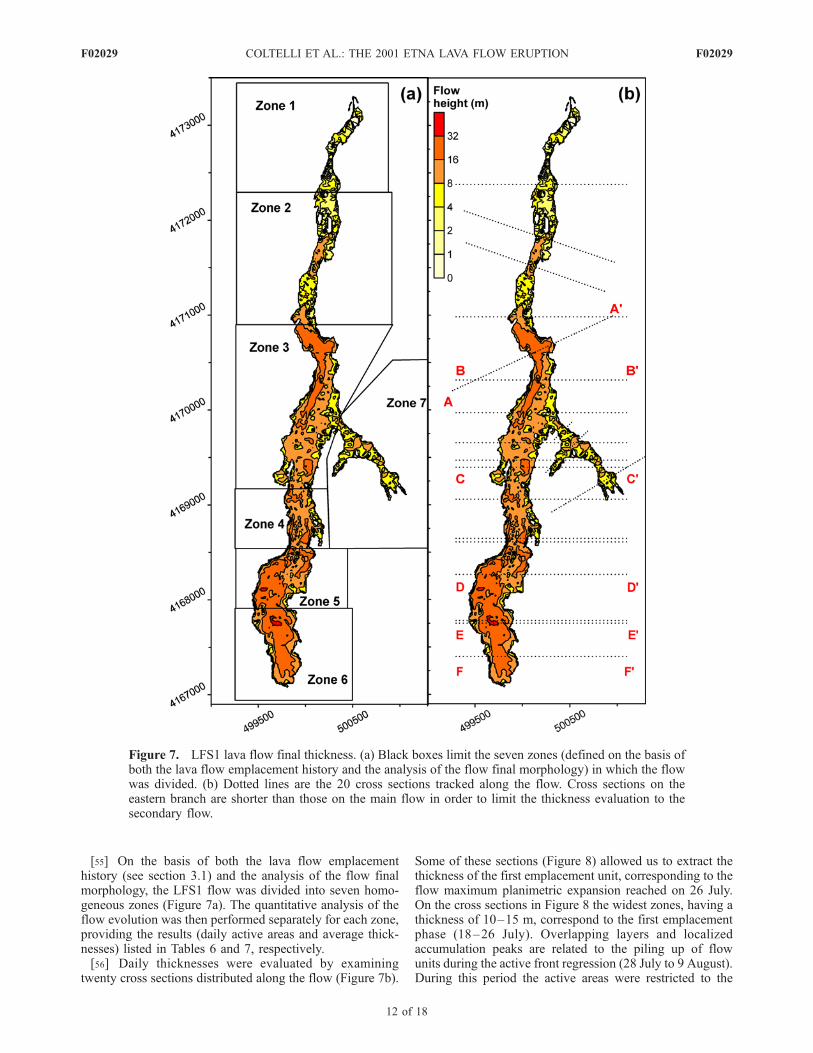
[55] On the basis of both the lava flow emplacementhistory (see section 3.1) and the analysis of the flow finalmorphology, the LFS1 flow was divided into seven homo-geneous zones (Figure 7a). The quantitative analysis of theflow evolution was then performed separately for each zone,providing the results (daily active areas and average thick-nesses) listed in Tables 6 and 7, respectively.[56] Daily thicknesses were evaluated by examining
twenty cross sections distributed along the flow (Figure 7b).
Some of these sections (Figure 8) allowed us to extract thethickness of the first emplacement unit, corresponding to theflow maximum planimetric expansion reached on 26 July.On the cross sections in Figure 8 the widest zones, having athickness of 10–15 m, correspond to the first emplacementphase (18–26 July). Overlapping layers and localizedaccumulation peaks are related to the piling up of flowunits during the active front regression (28 July to 9 August).During this period the active areas were restricted to the
Figure 7. LFS1 lava flow final thickness. (a) Black boxes limit the seven zones (defined on the basis ofboth the lava flow emplacement history and the analysis of the flow final morphology) in which the flowwas divided. (b) Dotted lines are the 20 cross sections tracked along the flow. Cross sections on theeastern branch are shorter than those on the main flow in order to limit the thickness evaluation to thesecondary flow.
F02029 COLTELLI ET AL.: THE 2001 ETNA LAVA FLOW ERUPTION
12 of 18
F02029
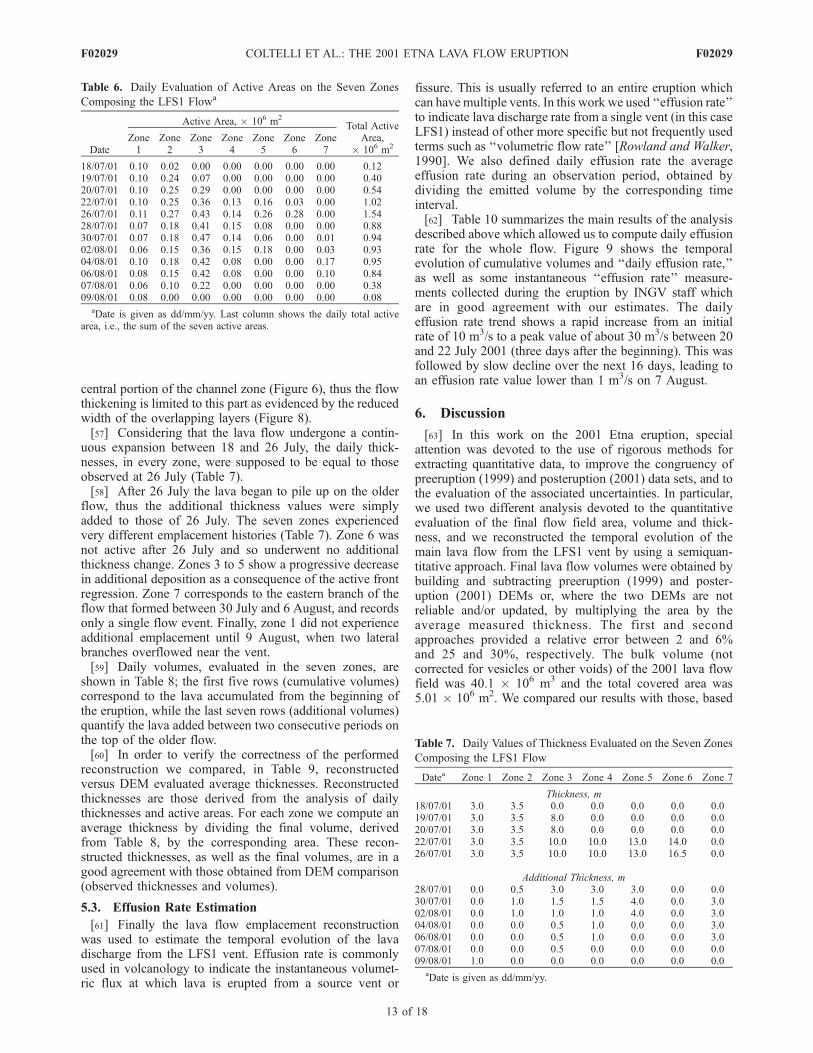
central portion of the channel zone (Figure 6), thus the flowthickening is limited to this part as evidenced by the reducedwidth of the overlapping layers (Figure 8).[57] Considering that the lava flow undergone a contin-
uous expansion between 18 and 26 July, the daily thick-nesses, in every zone, were supposed to be equal to thoseobserved at 26 July (Table 7).[58] After 26 July the lava began to pile up on the older
flow, thus the additional thickness values were simplyadded to those of 26 July. The seven zones experiencedvery different emplacement histories (Table 7). Zone 6 wasnot active after 26 July and so underwent no additionalthickness change. Zones 3 to 5 show a progressive decreasein additional deposition as a consequence of the active frontregression. Zone 7 corresponds to the eastern branch of theflow that formed between 30 July and 6 August, and recordsonly a single flow event. Finally, zone 1 did not experienceadditional emplacement until 9 August, when two lateralbranches overflowed near the vent.[59] Daily volumes, evaluated in the seven zones, are
shown in Table 8; the first five rows (cumulative volumes)correspond to the lava accumulated from the beginning ofthe eruption, while the last seven rows (additional volumes)quantify the lava added between two consecutive periods onthe top of the older flow.[60] In order to verify the correctness of the performed
reconstruction we compared, in Table 9, reconstructedversus DEM evaluated average thicknesses. Reconstructedthicknesses are those derived from the analysis of dailythicknesses and active areas. For each zone we compute anaverage thickness by dividing the final volume, derivedfrom Table 8, by the corresponding area. These recon-structed thicknesses, as well as the final volumes, are in agood agreement with those obtained from DEM comparison(observed thicknesses and volumes).
5.3. Effusion Rate Estimation
[61] Finally the lava flow emplacement reconstructionwas used to estimate the temporal evolution of the lavadischarge from the LFS1 vent. Effusion rate is commonlyused in volcanology to indicate the instantaneous volumet-ric flux at which lava is erupted from a source vent or
fissure. This is usually referred to an entire eruption whichcan have multiple vents. In this work we used ‘‘effusion rate’’to indicate lava discharge rate from a single vent (in this caseLFS1) instead of other more specific but not frequently usedterms such as ‘‘volumetric flow rate’’ [Rowland and Walker,1990]. We also defined daily effusion rate the averageeffusion rate during an observation period, obtained bydividing the emitted volume by the corresponding timeinterval.[62] Table 10 summarizes the main results of the analysis
described above which allowed us to compute daily effusionrate for the whole flow. Figure 9 shows the temporalevolution of cumulative volumes and ‘‘daily effusion rate,’’as well as some instantaneous ‘‘effusion rate’’ measure-ments collected during the eruption by INGV staff whichare in good agreement with our estimates. The dailyeffusion rate trend shows a rapid increase from an initialrate of 10 m3/s to a peak value of about 30 m3/s between 20and 22 July 2001 (three days after the beginning). This wasfollowed by slow decline over the next 16 days, leading toan effusion rate value lower than 1 m3/s on 7 August.
6. Discussion
[63] In this work on the 2001 Etna eruption, specialattention was devoted to the use of rigorous methods forextracting quantitative data, to improve the congruency ofpreeruption (1999) and posteruption (2001) data sets, and tothe evaluation of the associated uncertainties. In particular,we used two different analysis devoted to the quantitativeevaluation of the final flow field area, volume and thick-ness, and we reconstructed the temporal evolution of themain lava flow from the LFS1 vent by using a semiquan-titative approach. Final lava flow volumes were obtained bybuilding and subtracting preeruption (1999) and poster-uption (2001) DEMs or, where the two DEMs are notreliable and/or updated, by multiplying the area by theaverage measured thickness. The first and secondapproaches provided a relative error between 2 and 6%and 25 and 30%, respectively. The bulk volume (notcorrected for vesicles or other voids) of the 2001 lava flowfield was 40.1 � 106 m3 and the total covered area was5.01 � 106 m2. We compared our results with those, based
Table 6. Daily Evaluation of Active Areas on the Seven Zones
Composing the LFS1 Flowa
Date
Active Area, � 106 m2
Total ActiveArea,
� 106 m2Zone1
Zone2
Zone3
Zone4
Zone5
Zone6
Zone7
18/07/01 0.10 0.02 0.00 0.00 0.00 0.00 0.00 0.1219/07/01 0.10 0.24 0.07 0.00 0.00 0.00 0.00 0.4020/07/01 0.10 0.25 0.29 0.00 0.00 0.00 0.00 0.5422/07/01 0.10 0.25 0.36 0.13 0.16 0.03 0.00 1.0226/07/01 0.11 0.27 0.43 0.14 0.26 0.28 0.00 1.5428/07/01 0.07 0.18 0.41 0.15 0.08 0.00 0.00 0.8830/07/01 0.07 0.18 0.47 0.14 0.06 0.00 0.01 0.9402/08/01 0.06 0.15 0.36 0.15 0.18 0.00 0.03 0.9304/08/01 0.10 0.18 0.42 0.08 0.00 0.00 0.17 0.9506/08/01 0.08 0.15 0.42 0.08 0.00 0.00 0.10 0.8407/08/01 0.06 0.10 0.22 0.00 0.00 0.00 0.00 0.3809/08/01 0.08 0.00 0.00 0.00 0.00 0.00 0.00 0.08
aDate is given as dd/mm/yy. Last column shows the daily total activearea, i.e., the sum of the seven active areas.
Table 7. Daily Values of Thickness Evaluated on the Seven Zones
Composing the LFS1 Flow
Datea Zone 1 Zone 2 Zone 3 Zone 4 Zone 5 Zone 6 Zone 7
Thickness, m18/07/01 3.0 3.5 0.0 0.0 0.0 0.0 0.019/07/01 3.0 3.5 8.0 0.0 0.0 0.0 0.020/07/01 3.0 3.5 8.0 0.0 0.0 0.0 0.022/07/01 3.0 3.5 10.0 10.0 13.0 14.0 0.026/07/01 3.0 3.5 10.0 10.0 13.0 16.5 0.0
Additional Thickness, m28/07/01 0.0 0.5 3.0 3.0 3.0 0.0 0.030/07/01 0.0 1.0 1.5 1.5 4.0 0.0 3.002/08/01 0.0 1.0 1.0 1.0 4.0 0.0 3.004/08/01 0.0 0.0 0.5 1.0 0.0 0.0 3.006/08/01 0.0 0.0 0.5 1.0 0.0 0.0 3.007/08/01 0.0 0.0 0.5 0.0 0.0 0.0 0.009/08/01 1.0 0.0 0.0 0.0 0.0 0.0 0.0
aDate is given as dd/mm/yy.
F02029 COLTELLI ET AL.: THE 2001 ETNA LAVA FLOW ERUPTION
13 of 18
F02029
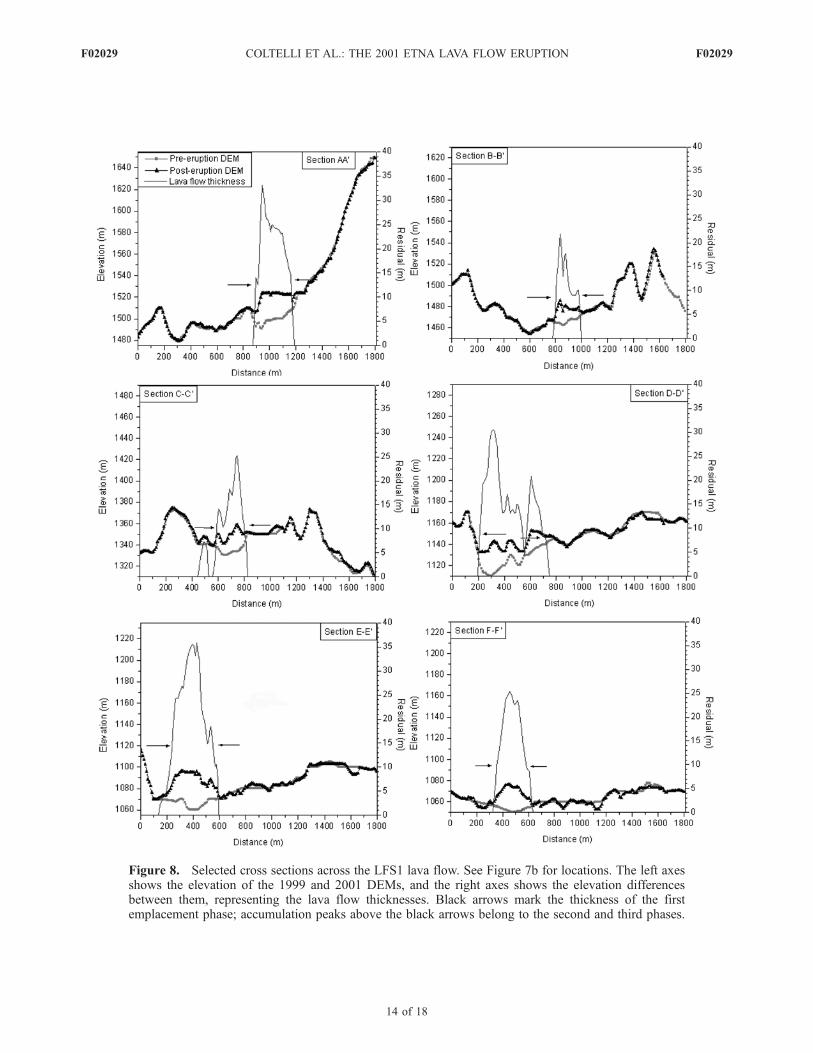
Figure 8. Selected cross sections across the LFS1 lava flow. See Figure 7b for locations. The left axesshows the elevation of the 1999 and 2001 DEMs, and the right axes shows the elevation differencesbetween them, representing the lava flow thicknesses. Black arrows mark the thickness of the firstemplacement phase; accumulation peaks above the black arrows belong to the second and third phases.
F02029 COLTELLI ET AL.: THE 2001 ETNA LAVA FLOW ERUPTION
14 of 18
F02029
only on field measurements, reported in previous works onthe 2001 Etna eruption [Calvari, 2001; Behncke and Neri,2003]. This comparison illustrated the problem of theunreliability of preliminary and unverified data, in partic-ular with regard to thickness measurements. Calvari[2001] used a preliminary lava flow mapping to estimatea bulk volume of 48.0 � 106 m3 and an area of 4.7 �106 m2 for the 2001 flow field. The estimated area agreesfairly well with that obtained in this work on the basis ofthe posteruption orthophotos. However, the volume over-estimation of 7.9 � 106 m3 may be due to the use ofthickness values measured on flow levees and fronts andthen extrapolated over the whole flow. Behncke and Neri[2003] provided, for the 2001 lava flow field, a dense rockequivalent (DRE) volume of 25.191 � 106 m3 and an areaof 5.567 � 106 m2. The conversion from DRE to bulkvolume (assuming the vesicularity of 20% utilized by theauthors; B. Behncke and M. Neri personal communication,2006) gives a bulk volume of 31.489 � 106 m3. Thediscrepancies observed with respect to our estimates(underestimation by �21% on the volume, and overesti-mation of the area by �15%) may be addressed to the useof inaccurate field data.[64] About 53% of the total 2001 volume was emitted
from the LFS1 vent, producing a lava volume of 21.4 �106 m3 and covering an area of 1.95 � 106 m2. Its effusionrate trend (Figure 9) is in accordance with the dischargemodel discussed by Wadge [1981] for eruptions frompressurized sources. Following the terminology of Wadge[1981], the effusion rate curve shows a brief initial period of‘waxing flow’ followed, after the peak value, by a longerperiod of ‘waning flow.’ Consequently, the effusion ratecurve fits well with the model of a magma source depres-surization mainly owing to the reservoir relaxation (elasticcontraction of the magma body). Moreover, the quite higheffusion rate (up to 30 m3/s) and the relatively short duration(only 23 days) suggests a reservoir drainage more efficientthan that expected solely from the reservoir relaxation. Thisbehavior can be due to the gas expansion of the volatile-rich
2001 magma, testified by the strong explosive activityobserved during the eruption [Taddeucci et al., 2002; Scolloet al., 2007].[65] Figure 9 also compares the LFS1 flow effusion
rates presented in this work with those obtained fromFigure 4 of Behncke and Neri [2003] for the same flow(their F4) and with the instantaneous effusion rates mea-sured in the field. The three data sets are in fairly goodagreement only in the final period of the eruption (i.e.,after 1 August). In the first period, the effusion ratesobtained in this work are in accordance with the field-derived instantaneous effusion rates, but both are system-atically higher than the values of Behncke and Neri[2003], derived from daily thickness and area measure-ments. The observed discrepancies highlight the impor-tance of verifying the geometrical data used for volumetriceffusion rate computation. This can be done by means ofcomparative and cumulative analysis using constraints: forexample the final volume (derived from preeruption andposteruption 3D maps) have to correspond to the sum ofthe partial volumes. Finally, effusion rate trends notshowing the lava emission peak between the waning andwaxing flow periods may conduct to completely differentsimulated lava flow paths when adopted as input data inreal-time forecasting applications aimed at hazard mitiga-tion during the eruption.
7. Conclusive Remarks
[66] In this work, we calculated a total bulk volume of40.1 � 106 m3 for the complex lava field emitted by seveneffusive vents during the 2001 Etna eruption. An erroranalysis was conducted to estimate the relative errors ofall the estimated lava flow volumes and our lowest expectederror was about 2% for the DEM-derived volume. Then, wefocused on the LFS1 flow which emplaced a bulk volume of21.40 � 106 m3 (53% of the total) forming a fairly simplelava flow.
Table 8. Daily Volumes of the Seven Zones Composing the LFS1
Flowa
Date Zone 1 Zone 2 Zone 3 Zone 4 Zone 5 Zone 6 Zone 7Total
Volume
Cumulative Volumes, � 106 m3
18/07/01 0.30 0.07 0.00 0.00 0.00 0.00 0.00 0.3719/07/01 0. 30 0.84 0.56 0.00 0.00 0.00 0.00 1.7020/07/01 0. 30 0.88 2.32 0.00 0.00 0.00 0.00 3.5022/07/01 0. 30 0.88 3.60 1.30 2.08 0.42 0.00 8.5826/07/01 0.33 0.95 4.30 1.40 3.38 4.62 0.00 14.98
Additional Volumes, � 106 m3
28/07/01 0.00 0.09 1.23 0.45 0.24 0.00 0.00 2.0130/07/01 0.00 0.18 0.71 0.21 0.24 0.00 0.03 1.3702/08/01 0.00 0.15 0.36 0.15 0.72 0.00 0.09 1.4704/08/01 0.00 0.00 0.21 0.08 0.00 0.00 0.51 0.8006/08/01 0.00 0.00 0.21 0.08 0.00 0.00 0.30 0.5907/08/01 0.00 0.00 0.11 0.00 0.00 0.00 0.00 0.1109/08/01 0.08 0.00 0.00 0.00 0.00 0.00 0.00 0.08
aDate is given as dd/mm/yy. Daily volumes are active areas multipliedper evaluated thicknesses. Volumes until 26 July 2001 are cumulative whilesubsequent volumes are partial. Last column shows the daily volumes of thewhole flow.
Table 9. Total Area, Measured From the 2001 DEM; Observed
Volume Measured From the Comparison of the 1999 and the 2001
DEMs; Reconstructed Volume, Evaluated From Table 8 by Adding
Partial Volumes After 26 July 2001 to the Volumes at 26 July 2001;
Observed Average Thicknesses Measured From the Comparison of
the 1999 and the 2001 DEMs; and Reconstructed Average
Thickness Evaluated by Dividing the Reconstructed Volume by
the Total Areaa
Values at 09August 2001
Zone1
Zone2
Zone3
Zone4
Zone5
Zone6
Zone7
Total area,� 106 m2
0.13 0.28 0.63 0.20 0.29 0.28 0.17
Observed volume� 106 m3
0.38 1.49 7.25 2.26 4.62 4.46 0.95
Reconstructed volume,� 106 m3
0.40 1.36 7.11 2.37 4.63 4.54 0.97
Observed averagethickness, m
3.0 5.5 11.7 11.4 15.8 16.2 5.5
Reconstructed averagethickness, m
3.2 4.9 11.4 11.8 16.0 16.5 5.6
aEvery measure characterizes the LFS1 flow at the end of the eruption(9 August 2001), and it is evaluated inside the seven zones composing theLSF1 flow.
F02029 COLTELLI ET AL.: THE 2001 ETNA LAVA FLOW ERUPTION
15 of 18
F02029

[67] The temporal evolution of the LFS1 lava flow, aswell as its effusion rate trend, was reconstructed by meansof a semiquantitative method using daily maps. Thesedepicted the LFS1 flow expansion and were used, togetherwith lava thicknesses evaluated in the field and from theanalysis of preeruption (1999) and posteruption (2001)DEMs, to obtain volumes emplaced over known timeperiods. Volumes were then converted to time-averagedeffusion rates by dividing their values by the correspondingemplacement times. The derived effusion rates were in goodagreement with field measurements acquired during theeruption by INGV staff. Moreover, the observed trend isin agreement with the theoretical effusion rate curve ofWadge [1981] for a pressurized eruption, showing an initialperiod of waxing flow followed by a longer period ofwaning flow.[68] This work shows that flow volume and area can be
evaluated with higher accuracy if sufficiently detailedtopographic data are available before, during, and after aneruption. It points out that special attention must be devotedto the assessment of the accuracy of the data mapping, ifthey have to be used for quantitative processes and analysissuch as modeling of the lava flow emplacement. Moreovervolumes based solely on field data, such as those evaluatedfrom the planimetric approach, can be affected by largeerrors and are not adequate to reconstruct a lava flowevolution. In order to apply a completely quantitativeapproach for the reconstruction of a lava flow evolution,data for generating DEMs should be daily collected (ideally)for example by means of photogrammetric or LIDARsurveys.
Appendix A
[69] The volumes (V) computed from the DEM subtrac-tion (Table 2) were calculated from
V ¼Xij
Dx2 �Dzij ðA1Þ
where Dx = 10 m is the linear dimension of the squareDEM cells and Dzij is the height variation between the 1999
and the 2001 DEM. The sum is limited to cells inside lavaflow limits.[70] The standard deviation associated with this volume is
calculated from the variance propagation law,
sV ¼
ffiffiffiffiffiffiffiffiffiffiffiffiffiffiffiffiffiffiffiffiffiffiffiffiffiffiffiffiffiffiffiffiffiffiffiffiffiffiffiffiffiffiffiffiffiffiffiffiffiffiffiffiffiffiffiffiffiffiffiffiffiffiffiffiffiffiffiXij
@V
@zij
� �2
s2Dz þ
@V
@x
� �2
s2Dx
!vuut¼
ffiffiffiffiffiffiffiffiffiffiffiffiffiffiffiffiffiffiffiffiffiffiffiffiffiffiffiffiffiffiffiffiffiffiffiffiffiffiffiffiffiffiffiffiffiffiffiffiffiffiffiffiffiffiffiffiffiffiffiffiffiffiffiffiffiffiffiffiffiffiffiffiffiffiXij
Dx4 � s2Dz þ 4 �Dz2ij �Dx2 � s2
Dx
�sðA2Þ
where sDx = 10 m is the planimetric accuracy and sDz =2.69 m is the lava residual vertical accuracy.
Table 10. Partial and Cumulative Volumes of the Whole LFS1 Lava Flow for Each Acquisition Datea
Acquisition Date andLocal Time
EruptionDay
AcquisitionTime, s
CumulativeVolume,� 106 m3 Time Span, s
PartialVolume,� 106 m3
Daily EffusionRate, m3/s
18/07/2001, 03:00 0 0 0.00 0 0.00 0.0018/07/2001, 13:00 1 36,000 0.37 36,000 0.37 10.2819/07/2001, 16:00 2 133,200 1.70 97,200 1.33 13.6820/07/2001, 13:00 3 208,800 3.50 75,600 1.80 23.8122/07/2001, 11:00 5 374,400 8.58 165,600 5.08 30.6826/07/2001, 12:00 9 723,600 14.98 349,200 6.40 18.3328/07/2001, 16:00 11 910,800 16.99 187,200 2.01 10.7430/07/2001, 11:00 13 1,065,600 18.35 154,800 1.37 8.8502/08/2001, 10:00 16 1,321,200 19.82 255,600 1.47 5.7504/08/2001, 07:00 18 1,483,200 20.62 162,000 0.80 4.9406/08/2001, 11:00 20 1,670,400 21.21 187,200 0.59 3.1507/08/2001, 07:00 21 1,742,400 21.32 72,000 0.11 1.5309/08/2001, 10:00 23 1,926,000 21.40 183,600 0.08 0.44aDate is given as dd/mm/yyyy. Partial volume is the volume emitted between two subsequent acquisition times (time span). Daily effusion rates were
evaluated by dividing partial volumes by time spans.
Figure 9. Left axis shows the temporal evolution of dailyeffusion rates evaluated in this work (gray bars) and in workby Behncke and Neri [2003] (squares), as well as fieldmeasurement of the instantaneous effusion rate (stars) madeduring the eruption by INGV staff. The right axis shows thecumulative volumes of the LFS1 lava flow evaluated in thiswork.
F02029 COLTELLI ET AL.: THE 2001 ETNA LAVA FLOW ERUPTION
16 of 18
F02029
[71] The volumes obtained from the planimetric approach(Table 3) were calculated from
V ¼ A � H ðA3Þ
where A is the area covered by lava, evaluated by means ofa mass balance analysis, and H is the average flowthickness. The related standard deviation is
sV ¼
ffiffiffiffiffiffiffiffiffiffiffiffiffiffiffiffiffiffiffiffiffiffiffiffiffiffiffiffiffiffiffiffiffiffiffiffiffiffiffiffiffiffiffiffiffiffiffiffi@V
@H
� �2
s2
Hþ @V
@A
� �2
s2A
s¼
ffiffiffiffiffiffiffiffiffiffiffiffiffiffiffiffiffiffiffiffiffiffiffiffiffiffiffiffiffiffiffiffiffiffiffiA2 � s2
Hþ H
2 � s2A
qðA4Þ
where sH = 1 m is the accuracy of the thicknessmeasurements, and sA = nDx2 is the area accuracy, with nbeing the number of cells forming the perimeter of the lavaflow and of its dagala.[72] Total volumes for the LFS2, UFS1 and UFS2 flows
(Table 4) were obtained by summing or subtracting twoindependently estimated volumes: from DEM comparison(V1) and by means of a planimetric approach (V2). Theaccuracy of the total volume is then obtained adoptingweights to take into account the different contribution tothe total volume,
sV ¼ffiffiffiffiffiffiffiffiffiffiffiffiffiffiffiffiffiffiffiffiffiffiffiffiffiffiffiffiffiffiffiffiffiffiffiffiffiP1 � s2
V1 þ P2 � s2V2
qðA5Þ
where P1 and P2 are the percent areas corresponding to theDEM and planimetric volumes respectively.
[73] Acknowledgments. The authors especially thank G. Garfi andS. Di Mauro for their help in the preparation of the daily maps during theeruption, and M. Pompilio for his precious support during the fieldwork.We are indebted to the colleagues of INGV from Catania, Napoli, Pisa, andRoma involved in the lava-flow field monitoring. We are grateful to thepilots and technicians of the Italian Civil Protection helicopters for theirprofessional work that permitted the daily overflight of the eruption. Wewish to thank G. Calı head of the VII Dipartimento, 1� Servizio AreaPianificazione Territoriale, of the Provincia Regionale di Catania thatfurnished us the posteruption vector maps and the orthophotos. Themanuscript benefited from the suggestions of A. J. L. Harris, S. Calvari,and P. Baldi.
ReferencesBaldi, P., S. Bonvalot, P. Briole, M. Coltelli, K. Gwinner, M. Marsella,G. Puglisi, and D. Remy (2002), Validation and comparison of differenttechniques for the derivation of digital elevation models and volcanicmonitoring (Vulcano Island, Italy), Int. J. Remote Sens., 23, 4783–4800.
Baldi, P., M. Fabris, M. Marsella, and R. Monticelli (2005), Monitoring themorphological evolution of the Sciara del Fuoco during the 2002–2003Stromboli eruption using multi-temporal photogrammetry, ISPRSJ. Photogramm. Remote Sens., 59, 199–211.
Behncke, B., and M. Neri (2003), The July –August 2001 eruption ofMt. Etna (Sicily), Bull. Volcanol., 65, 461–476, doi:10.1007/s00445-003-0274-1.
Calvari, S. (2001), Multidisciplinary approach yields insight into Mt. Etna2001 eruption, Eos Trans. AGU, 82(52), 653.
Calvari, S., M. Coltelli, M. Neri, M. Pompilio, and V. Scrivano (1994), The1991–1993 Etna eruption: Chronology and lava flow-field evolution,Acta Volcanol., 4, 1–14.
Corsaro, R. A., L. Miraglia, and M. Pompilio (2007), Petrologic evidenceof a complex plumbing system feeding the July–August 2001 eruption ofMt. Etna, Sicily, Italy, Bull. Volcanol., 69, 401–421.
Costa, A., and G. Macedonio (2005), Numerical simulation of lava flowsbased on depth-averaged equations, Geophys. Res. Lett., 32, L05304,doi:10.1029/2004GL021817.
Crisci, G. M., S. Di Gregorio, O. Pindaro, and G. Ranieri (1986), Lava flowsimulation by a discrete cellular model: First implementation, Int.J. Modell. Simul., 6, 137–140.
Crisci, G. M., S. Di Gregorio, R. Rongo, M. Scarpelli, W. Spataro, andS. Calvari (2003), Revisiting the 1669 Etnean eruptive crisis using acellular automata model and implications for volcanic hazard in the Cat-ania area, J. Volcanol. Geotherm. Res., 123, 211–230.
Curlander, J. C., and R. N. McDonough (1991), Synthetic Aperture Radar:Systems and Signal Processing, 647 pp., John Wiley, Hoboken, N. J.
Fouler, R. (2001), Topographic lidar, in Digital Elevation Model Technol-ogies and Applications: The DEM Users Manual, edited by D. F. Maune,pp. 207–236, Am. Soc. for Photogramm. and Remote Sens., Bethesda,Md.
Franceschetti, G., and R. Lanari (1999), Synthetic Aperture Radar Proces-sing, 307 pp., CRC Press, Boca Raton, Fla.
Frazzetta, G., and R. Romano (1984), The 1983 Etna eruption: Eventchronology and morphological evolution of the lava flow, Bull. Volcanol.,47, 1079–1096.
Guest, J. E., C. R. J. Kilburn, H. Pinkerton, and A. M. Duncan (1987), Theevolution of lava flow field: Observation of 1981 and 1983 eruptions ofMount Etna, Sicily, Bull. Volcanol., 49, 527–540.
Hidaka, M., A. Goto, S. Umino, and E. Fujita (2005), VTFS project:Development of the lava flow simulation code LavaSIM with a modelfor three-dimensional convection, spreading, and solidification,Geochem. Geophys. Geosyst., 6, Q07008, doi:10.1029/2004GC000869.
Honda, K., and M. Nagai (2002), Real-time volcano activity mapping usingground-based digital imagery, ISPRS J. Photogramm. Remote Sens., 57,159–168.
Ishihara, K., M. Iguchi, and K. Kamo (1989), Numerical simulation of lavaflows on some volcanoes in Japan, in Lava Flows and Domes, IAVCEIProc. Volcanol., vol. 2, edited by J. Fink, pp. 174–207, Springer, NewYork.
Kilburn, C. R. J., and G. E. Guest (1993), Aa lavas of Mount Etna, Sicily, inActive Lavas: Monitoring and Modeling, edited by C. R. J. Kilburn andG. Luongo, pp. 73–101, UCL Press, London.
Lee, D. T., and B. J. Schachter (1980), Two algorithms for constructing aDelaunay triangulation, Int. J. Comput. Inf. Sci., 9, 219–242.
Mouginis-Mark, P. J., and H. Garbeil (2005), Quality of TOPSAR topo-graphic data for volcanology studies at Kilauea Volcano, Hawaii: Anassessment using airborne lidar data, Remote Sens. Environ., 96, 149–164.
Murray, J. B. (1990), High-level magma transport at Mount Etna volcano,as deduced from ground deformation measurements, in Magma Trans-port and Storage, edited by M. P. Ryan, pp. 357–383, John Wiley,Hoboken, N. J.
Ricco, A. (1902), Rilevamento topografico della lava dell’eruzione Etneadel 1892, Boll. Accad. Gioenia Sci. Nat. Catania, 75, 5–8.
Ridley, H. M., P. M. Atkinson, P. Aplin, J.-P. Muller, and I. Dowman(1997), Evaluating the potential of the forthcoming commercial U.S.high-resolution satellite sensor imagery at the ordnance survey, Photo-gramm. Eng. Remote Sens., 63, 997–1005.
Rowland, S. K., and G. P. L. Walker (1990), Pahoehoe and aa in Hawaii:Volumetric flow rate controls the lava structure, Bull. Volcanol., 52, 615–628.
Rowland, S. K., M. E. MacKay, H. Garbeil, and P. J. Mouginis-Mark(1999), Topographic analyses of Kilauea Volcano, Hawai’i, from inter-ferometric airborne radar, Bull. Volcanol., 61, 1–14.
Rowland, S. K., A. J. L. Harris, M. J. Wooster, F. Amelung, H. Garbeil,L. Wilson, and P. J. Mouginis-Mark (2003), Volumetric characteristics oflava flows from interferometric radar and multispectral satellite data: The1995 Fernandina and 1998 Cerro Azul eruptions in the western Galapa-gos, Bull. Volcanol., 65, 311–330.
Scollo, S., P. Del Carlo, and M. Coltelli (2007), Tephra fallout of the July–August 2001 Etna eruption: Deposit features and analysis of plume dis-persion, J. Volcanol. Geotherm. Res., 160, 147–164.
Stevens, N. F., J. B. Murray, and G. Wadge (1997), The volume and shapeof the 1991–1993 lava flow field at Mount Etna, Sicily, Bull. Volcanol.,58, 449–454.
Stevens, N. F., G. Wadge, and J. B. Murray (1999), Lava flow volume andmorphology from digitised contour maps: A case study at Mount Etna,Sicily, Geomorphology, 28, 251–261.
Taddeucci, J., M. Pompilio, and P. Scarlato (2002), Monitoring the explo-sive activity of the July–August 2001 eruption of Mt. Etna (Italy) by ashcharacterization, Geophys. Res. Lett., 29(8), 1230, doi:10.1029/2001GL014372.
Vicari, A., A. Herault, C. Del Negro, M. Coltelli, M. Marsella, andC. Proietti (2007), Modeling of the 2001 lava flow at Etna Volcano by acellular automata approach, Environ. Modell. Software, doi:10.1016/j.envsoft.2006.10.005, in press.
F02029 COLTELLI ET AL.: THE 2001 ETNA LAVA FLOW ERUPTION
17 of 18
F02029

Vinassa de Regny, P. (1911), L’eruzione Etnea del 1910, Parte quinta:Osservazioni geologiche e morfologiche, Atti Acc., 5, 4–11.
Wadge, G. (1981), The variation of magma discharge during basaltic erup-tions, J. Volcanol. Geotherm. Res., 11, 139–168.
Wadge, G., P. A. V. Young, and I. J. McKendrick (1994), Mapping lavaflow hazards using computer simulation, J. Geophys. Res., 99, 489–504.
Walker, G. P. L. (1971), Compound and simple lava flows and flood basalts,Bull. Volcanol., 35, 579–590.
Waltershausen, W. S. (1880), Der Etna, 2 vols., 317 pp., Engelman,Leipzig, Germany.
�����������������������D. Andronico, S. Branca, M. Coltelli, L. Lodato, and C. Proietti, Istituto
Nazionale di Geofisica e Vulcanologia, Sezione di Catania, Piazza Roma, 2,I-95125 Catania, Italy. ([email protected]; [email protected]; [email protected]; [email protected]; [email protected])M. Marsella, Dipartimento Idraulica Trasporti e Strade, Universita di
Roma ‘‘La Sapienza,’’ Via Eudossiana, 18, I-00184 Rome, Italy.([email protected])
F02029 COLTELLI ET AL.: THE 2001 ETNA LAVA FLOW ERUPTION
18 of 18
F02029