Volcanomagnetic changes accompanying the onset of the 2002–2003 eruption of Mt. Etna (Italy
14
Volcanomagnetic changes accompanying the onset of the 2002–2003 eruption of Mt. Etna (Italy) Ciro Del Negro a, * , Gilda Currenti a , Rosalba Napoli a , Annamaria Vicari a,b a Istituto Nazionale di Geofisica e Vulcanologia-Sezione di Catania, Italy b Dipartimento di Ingegneria Elettrica, Elettronica e dei Sistemi-Universita ` di Catania, Italy Received 18 March 2004; received in revised form 14 October 2004; accepted 14 October 2004 Editor: V. Courtillot Abstract Remarkable changes in the local magnetic field were associated with the onset of the 2002–2003 flank eruption at Mt. Etna. After differential magnetic field measurements were filtered from the external noise by using adaptive filters, we recognized two stages in the total intensity changes, which are closely related to different volcanic events: (a) rapid variations of about 4–5 nT associated with October 26 seismic swarm recorded beneath the summit craters; (b) step-like variations of 9–10 nT coincident with October 27 eruptive fissures opening up in the north flank. These observations are generally consistent with those calculated from simple magnetic models of these volcanic processes, in which the magnetic changes are generated by stress redistribution due to magmatic intrusions at different depth. The magnetic data not only allow the timing of the intrusive event to be described in greater detail but also, together with other volcanological and geophysical evidences, permit some constraints to be set on the characteristics of propagation of a shallow dike. Firstly, at around midnight on 26 October magma was rapidly injected to a depth of 3–4 km just below the summit craters. Secondly, after 1:00 on 27 October, continued intrusion magma occurred upward and culminated a few hundred meters below the free surface fractured along a N–E direction. Thirdly, at about 2:28, magma gave rise to an explosive fissural vent at the northern base of the NE crater near 3000 m a.s.l. Finally, at about 5:00, the first eruptive fissure became active along the eastern border of the NE rift at 2500 m a.s.l. The rate of growth of the magnetic anomalies, moreover, leads to the interpretation that the magmatic intrusion travelled northward from base of the NE crater to the NE rift at approximately 14 m/min. D 2004 Elsevier B.V. All rights reserved. Keywords: eruptions; monitoring; magnetic methods; volcanomagnetic modeling; Mt. Etna 1. Introduction In the recent past, the magnetic method at Mt. Etna has proved its ability to detect small changes in the local magnetic field linked to volcanic activity. The 0012-821X/$ - see front matter D 2004 Elsevier B.V. All rights reserved. doi:10.1016/j.epsl.2004.10.033 * Corresponding author. Tel.: +39 95 716 5800; fax: +39 95 43 5801. E-mail address: [email protected] (C. Del Negro). Earth and Planetary Science Letters 229 (2004) 1 – 14 www.elsevier.com/locate/epsl
-
Upload
independent -
Category
Documents
-
view
0 -
download
0
Transcript of Volcanomagnetic changes accompanying the onset of the 2002–2003 eruption of Mt. Etna (Italy

www.elsevier.com/locate/epsl
Earth and Planetary Science
Volcanomagnetic changes accompanying the onset
of the 2002–2003 eruption of Mt. Etna (Italy)
Ciro Del Negroa,*, Gilda Currentia, Rosalba Napolia, Annamaria Vicaria,b
aIstituto Nazionale di Geofisica e Vulcanologia-Sezione di Catania, ItalybDipartimento di Ingegneria Elettrica, Elettronica e dei Sistemi-Universita di Catania, Italy
Received 18 March 2004; received in revised form 14 October 2004; accepted 14 October 2004
Editor: V. Courtillot
Abstract
Remarkable changes in the local magnetic field were associated with the onset of the 2002–2003 flank eruption at Mt. Etna.
After differential magnetic field measurements were filtered from the external noise by using adaptive filters, we recognized two
stages in the total intensity changes, which are closely related to different volcanic events: (a) rapid variations of about 4–5 nT
associated with October 26 seismic swarm recorded beneath the summit craters; (b) step-like variations of 9–10 nT coincident
with October 27 eruptive fissures opening up in the north flank. These observations are generally consistent with those
calculated from simple magnetic models of these volcanic processes, in which the magnetic changes are generated by stress
redistribution due to magmatic intrusions at different depth. The magnetic data not only allow the timing of the intrusive event
to be described in greater detail but also, together with other volcanological and geophysical evidences, permit some constraints
to be set on the characteristics of propagation of a shallow dike. Firstly, at around midnight on 26 October magma was rapidly
injected to a depth of 3–4 km just below the summit craters. Secondly, after 1:00 on 27 October, continued intrusion magma
occurred upward and culminated a few hundred meters below the free surface fractured along a N–E direction. Thirdly, at about
2:28, magma gave rise to an explosive fissural vent at the northern base of the NE crater near 3000 m a.s.l. Finally, at about
5:00, the first eruptive fissure became active along the eastern border of the NE rift at 2500 m a.s.l. The rate of growth of the
magnetic anomalies, moreover, leads to the interpretation that the magmatic intrusion travelled northward from base of the NE
crater to the NE rift at approximately 14 m/min.
D 2004 Elsevier B.V. All rights reserved.
Keywords: eruptions; monitoring; magnetic methods; volcanomagnetic modeling; Mt. Etna
0012-821X/$ - see front matter D 2004 Elsevier B.V. All rights reserved.
doi:10.1016/j.epsl.2004.10.033
* Corresponding author. Tel.: +39 95 716 5800; fax: +39 95 43
5801.
E-mail address: [email protected] (C. Del Negro).
1. Introduction
In the recent past, the magnetic method at Mt. Etna
has proved its ability to detect small changes in the
local magnetic field linked to volcanic activity. The
Letters 229 (2004) 1–14
C. Del Negro et al. / Earth and Planetary Science Letters 229 (2004) 1–142
first experiment goes back to the end of the seventies,
when two proton magnetometers operated for 4 years
on the volcano. The large anomaly identified in the
geomagnetic time series recorded in 1981 was asso-
ciated with the March 17–23 lateral eruption and was
considered to be the joint effect of piezomagnetism and
thermal demagnetization engendered by a intrusive
dike [1]. A convincing case of thermomagnetic effect
observation relates to the 1989 fissure eruption, when
repeated measurements at intervals of about 3 months
for 2 years revealed the slow buildup of a 130-nT
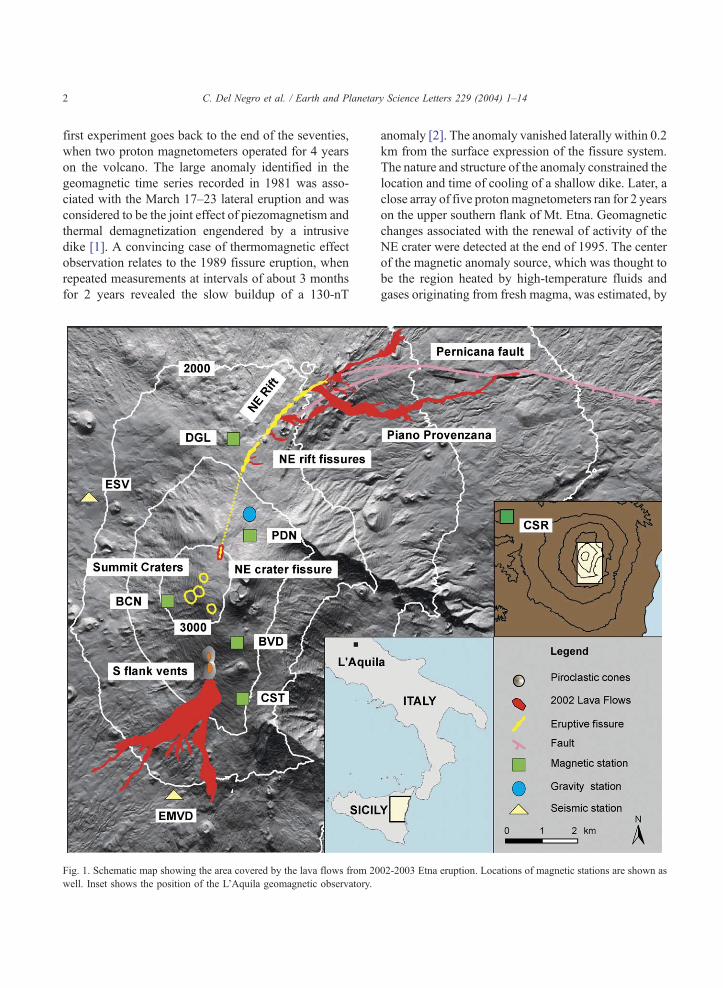
Fig. 1. Schematic map showing the area covered by the lava flows from 20
well. Inset shows the position of the L’Aquila geomagnetic observatory.
anomaly [2]. The anomaly vanished laterally within 0.2
km from the surface expression of the fissure system.
The nature and structure of the anomaly constrained the
location and time of cooling of a shallow dike. Later, a
close array of five protonmagnetometers ran for 2 years
on the upper southern flank of Mt. Etna. Geomagnetic
changes associated with the renewal of activity of the
NE crater were detected at the end of 1995. The center
of the magnetic anomaly source, which was thought to
be the region heated by high-temperature fluids and
gases originating from fresh magma, was estimated, by
02-2003 Etna eruption. Locations of magnetic stations are shown as

C. Del Negro et al. / Earth and Planetary Science Letters 229 (2004) 1–14 3
the spatial distribution of the variation rate, at a depth of
about 500 m near the 1991–1993 eruptive vents [3].
Detection of clear magnetic signals associated with
the renewal of the volcanic activity led to an increase
in magnetic monitoring of Mt. Etna. Since the end of
1998 a permanent magnetic network equipped with
Overhauser effect magnetometers has been set up [4].
The present network consists of five stations placed
on the volcanic edifice (CST, BVD, BCN, PDN, and
DGL), flanked by a sixth external reference station
(CSR) installed further west (about 50 km) on the
Nebrodi Mountains (Fig. 1). Stations on Etna are
located at elevations ranging between 2350 and 3000
m a.s.l. along a North–South profile crossing the
summit craters. All sites sample synchronously every
10 s and transmit data via mobile phone to the Catania
Section where these data are processed and analyzed.
The 2001 lateral eruption at Mt. Etna [5] provided
the first opportunity to verify the ability of our
network to detect volcanomagnetic effects. After
differential magnetic field measurements were filtered
from the seasonal thermic noise by using temperature
data, significant magnetic variations ranging between
3 and 7 nT were detected at several stations during
main volcanic events. These observations were mostly
generated by stress redistribution due to magmatic
intrusions at different depth and by the thermal
demagnetization at a rather shallow depth [6].
The latest eruption of Mt. Etna, occurring from late
2002 to early 2003, represented a further step towards
the definition of the real potential for continuous
magnetic studies as an effective volcano-monitoring
tool. During the night of 26–27 October 2002, two
fissure systems opened on the S and NE flanks of the
volcano, feeding explosive activity and two distinct
lava flows. The mainly explosive S flank eruption
lasted 3 months (26 October 2002–28 January 2003),
while the vents on the NE Rift erupted only for 8 days
and their activity was mainly effusive. The most
significant change in the magnetic field to occur here
is associated with the opening and propagation of the
vents along the NE Rift. In the following, we present
and discuss magnetic anomalies that were observed
during the night between 26 and 27 October 2002,
simultaneously with the onset of the 2002–03
eruption. The ash emissions and lava flows occurred
on the south flank entirely buried the BCN, BVD and
CST stations (they had been newly set up at the end of
2003), and the data were completely lost. Data
collected from the PDN and DGL stations located
on the north flank are analyzed below and the strategy
developed to eliminate disturbances and enhance
signal-to-noise ratios is presented. Simple models of
the main structures involved with the eruption, which
account for such magnetic changes, are proposed.
2. Magnetic observations during 2002
The geomagnetic field variations attributable to the
dynamics of volcano can be useful indicators of the
modifications of the stress field or of the thermody-
namic state within the volcanic edifice. However, the
volcanic geomagnetic field varies with amplitudes of
1~10 nT in most cases, while changes up to a few
hundreds nT are caused by ionospheric and magneto-
spheric currents, and secular variations. Therefore, it is
necessary to remove the unnecessary variations in
order to investigate an on-going physical process
inside a volcano. In general, the spatial distribution
of the secular variation and external field fluctuations
can be considered uniform (because of the large
distance of sources), and therefore, simple differences
in the total intensity with respect to the simultaneous
value at a remote reference (usually located at a
magnetically quiet site) are used to reduce these
effects. In Fig. 2a, the daily means of total intensity
variations from January to December 2002 observed at
PDN and DGL, relative to CSR are shown. Differ-
entiating these data more than 95% of magnetic
disturbances are reduced and the average of these
differentiated data on a daily basis reduces the standard
deviations by a factor of 10. Normally, measurement
accuracy for these data is better than 1 nT, depending
on site separation and local magnetic gradients.
Volcanomagnetic signals, unfortunately, are very
small and, even if data reduction processes are properly
employed, we often see geomagnetic variations regard-
less of the state of the volcanic activity. Very much
larger time variations, with periods from minutes to
years, are present in these differences. For example,
also in the absence of any volcanic activity, some of the
time changes can occur because of secondary fields
induced in the crustal rocks by external current
systems. Where the electrical conductivity of the rocks
of a volcano changes over short distances, time changes

Fig. 2. Daily mean differences of total magnetic intensity with respect to CSR station from January to December 2002 (a) and after removal of
external effects (b). The local K index values (c) obtained from L’Aquila geomagnetic observatory are shown as well.
C. Del Negro et al. / Earth and Planetary Science Letters 229 (2004) 1–144
can vary correspondingly. Differences in underground
conductivity between two close (order of 10 km apart)
sites will make the time variable fields different, even
if the primary field from the magnetosphere is the same
[7]. In addition, variable-induced magnetization, due
to large susceptibility contrasts, could locally modify a
magnetic disturbance field by an amount up to 5 nT
[8]. These effects are highlighted at PDN station,
where in correspondence of strong external activity
(geomagnetic K index values more than 5; Fig. 2c)
high geomagnetic components clearly appear in the
differences.
At different positions, this disturbance appears
with different properties and characteristics because of
its interaction with the local environment [9], but it
should be predictable, because the variations at the
different stations are correlated by their electromag-
netic impedances [10], which should remain constant
in time [11]. Therefore, a number of methods of
predictive filtering were proposed to further reduce
the changes in the difference fields due to contrasting
responses at magnetometer sites, with the filters
giving the relative responses between sites. A first
type of approach, relative to predictive methods based

C. Del Negro et al. / Earth and Planetary Science Letters 229 (2004) 1–14 5
on classical Wiener filters theory, was in particular
developed by Davis et al. [11]. This method provides
an estimation y(t) of the sequence y(t) by means of a
weighted linear combination of past samples from
other correlated sequences u1(t),. . ., up(t) and from
the same sequence to be estimated:
yy tð Þ ¼Xn
i¼1
a0iy t � ið Þ þXp
i¼1
Xmt
j¼0
aijui t � jð Þ ð1Þ
where aij are the filter parameters, p stations, n and mi
predictors.
The predictive filtering estimates the variations that
are common to different sites, and the filter output is a
prediction of the signal based on observations in other
sites. The residual field (the difference between the
observed values and the predicted values) contains
only the effects that are spatially local. This one
represents the signal to be analyzed [12].
It is worth noting that total field differences are
dependent on the direction of the disturbating field
[13]. The directional effect has meant that vector
information as well as that from total fields must be
used as input to the filter to take this into account [11].
In our case, the vector magnetic field data from
L’Aquila Geomagnetic Observatory, which is the
closest vector magnetometer, are utilized (Fig. 1).
Even if L’Aquila Geomagnetic Observatory is many
kilometers away from Mt. Etna (about 700 km),
signals correlate well. The correlation coefficients,
calculated between total magnetic field data at Etna
stations and L’Aquila observatory for the whole year
2002, are more than 0.90. In this case, the three
component fields of the vector magnetometer at
L’Aquila and the total field at CSR reference station
(of Etna array) represent inputs to the filter, and one of
the two stations (DGL or PDN) is the output, as
reported below:
yy tð Þ ¼Xn
i¼1
a0iy t � ið Þ þXm1
i¼0
a1iX t � ið Þ
þXm2
i¼0
a2iY t � ið Þ þXm3
i¼0
a3iZ t � ið Þ
þXm4
i¼0
a4iCSR t � ið Þ ð2Þ
where y is the station to be filtered, X, Y, Z the vector
components of LTAquila, CSR the total field recorded
at reference station, a the filter parameters, n and
m1,. . ., m4 predictors.
However, predictive filters designed during quiet
solar times fail during periods of intense geo-
magnetic activity, characterized by rapid transient
variations. On the contrary, filters working well
during severe geomagnetic storm are less efficient.
This practical result shows that the assumption of
considering the signal stationary is restrictive [14]. If
we assume the process to be time-variant, a non-
stationary approach is required to describe the
natural geomagnetic fluctuations. For this reason,
we implemented an adaptive type approach, and the
Eq. (2) becomes:
yy tð Þ ¼Xn
i¼1
a0i tð Þy t � ið Þ þXm1
i¼0
a1i tð ÞX t � ið Þ
þXm2
i¼0
a2i tð ÞY t � ið Þ þXm3
i¼0
a3i tð ÞZ t � ið Þ
þXm4
i¼0
a4i tð ÞCSR t � ið Þ ð3Þ
where the aij are now time-varying parameters. The
objective of the adaptive filter is to estimate and
update the filter parameters continuously by means
of the new observations, so that predictions closely
match the observed data. The aij are automatically
determined by using the recursive least squares
algorithm [15], with the aim of minimizing the error
(i.e. the residual field). The choice of number
parameters mki relies on the estimation of a quality
factor by using the Akaike Information Criterion
[16]. An efficient filter was accomplished when the
number of filter coefficients reaches to five.
Inclusion of more coefficients led to no further
improvements.
Finally, we used the adaptive algorithm for filtering
the signal from DGL and PDN stations by means of
the vector magnetic components from L’Aquila and
the reference station CSR. The residual components
are now further reduced (Fig. 2b), and the application
of adaptive filtering is clearly gainful during disturbed
days. The adaptive filter is effective enough and the
changes in October 2002 are the only significant ones
during the observed period.

C. Del Negro et al. / Earth and Planetary Science Letters 229 (2004) 1–146
3. Magnetic modeling
In Fig. 3a, the 10-min means of total intensity
variations at PDN and DGL stations, located on the
northeast flank of volcano, are shown after removal
of external components between 20 October and 3
November 2002. Comparison of the experimental
data with the different volcanic events occurring here
showed the close temporal correspondence between:
(a) sudden drop in geomagnetic total intensity and
October 26 seismic swarm recorded beneath the
summit craters; and (b) step-like magnetic variations
and October 27 eruptive fissures opening up in the
north flank. Therefore, the geophysical sources,
which could produce these magnetic field variations,
were searched separately. We will briefly summarize
results obtained for these two stages in chronological
order.
Fig. 3. Plot of 10-min means of total intensity variations (a), cumulative str
20 October and 3 November 2002.
3.1. Before the eruption onset
The seismic swarm began at about 21:25 local
solar time on 26 October, and continued without any
fall in energy release till the early hours of 28 October
(Fig. 3b). Until 1st November, about 500 shocks were
recorded [17]. The great majority of seismic events
(about 110) were recorded in the first 5–6 h and, in
this time interval, the seismicity occurred in a NS
elongated area crossing Mt. Etna summit craters.
Epicenters time pattern evidenced, in fact, an almost
stationary distribution in the central part of the
volcano until 2:28 local solar time on 27 October
[18,19]. In the early morning of 27 October, a set of
extensional fractures trending N–S (horizontal dis-
placements between 10 and 50 cm) formed at the base
of the NE crater [20]. In concomitance with the
seismic crisis, during a 48-h period encompassing the
ain release and earthquake hourly rate (b; after Patane [17]) between

C. Del Negro et al. / Earth and Planetary Science Letters 229 (2004) 1–14 7
start of the 2002 NE Rift eruption, marked tilt
variations were recorded at the closest stations to the
fractures field. The deformation recorded by the
tiltmeters (ranging between 10–15 Arad on the south
flank and 50–60 Arad on the northwestern flank) was
mainly cumulated through local midnight on 26
October [21]. Also the continuous microgravity
sequence, acquired at the station on the N slope
(2800 m a.s.l.), showed a marked decrease (about 400
mGal in less than one hour) during the night between
26 and 27 October [20].
Until October 26, no significant changes were
observed at all magnetic stations (Fig. 3a). On
October 27, after the beginning of the seismic swarm
but before the northeast lava flows emission, large
changes in local magnetic field occurred only at PDN.
The total intensity decreased by about 5 nT at PDN
within a few hours coinciding with the quick
propagation of the fractures at the base of the NE
crater. Before eruption, ascending magma has to push
rocks apart and this perturbs stress distribution and
pore fluid pressures, commonly resulting in fracturing
and numerous earthquakes. The minimum peak in the
local magnetic field at PDN was reached at the same
time as the temporary fall in seismic energy release
(Fig. 3b), when the total intensity at DGL slightly
decreased about 1 nT.
Although the available magnetic data are not dense
enough to uniquely identify the physical process that
generated the observed anomalies, a preliminary
interpretation is possible by taking into account
available geophysical data. The time–space evolution
of seismic events indicated that firstly a rapid dike
intrusion occurred vertically to a depth ranging
between 0 and 5 km bsl in the central part of the
volcano, along the direction NS of the maximum
compressive stress [17]. Thenceforth, the deformation
pattern unequivocally showed a response to a tensile
Table 1
Summary of fault parameters used in two piezomagnetic models
Event Fault X center Y center D
(km) (km) (m
Seismic swarm Tensile 5 3.4 1
Eruptive fissures in the North flank Tensile 6.5 3.9
Tensile 9 5.2
Strike 10.5 7.5
Magnetization 2 A/m, inclination 53.38, declination 1.88, and sensitivity 0
mechanism coherent with a magmatic intrusion
occurring upward and culminating a few hundred
meters below the free surface fractured along a N–E
direction [22]. The location of the tensile source lies
within the zone of the seismic swarm that occurred
during the magma ascent. Branca et al. [20] inter-
preted the strong gravity decrease, recorded in the
hours before the eruption onset, as the gravity effect
produced by a two-dimensional vertical sheet, with
width ranging between 3 and 4 m, cutting through the
volcano pile slightly northeast of the crater area. The
magnetic change could have resulted from stress
redistribution due to dike emplacement at a rather
shallow depth, which took place in a few hours. In
these cases, the piezomagnetic effect (stress-induced
changes in rock magnetization) is the principal
mechanism, since it could justify both the amplitude
and the time-scale of the magnetic changes. It is worth
noting that the magnetic field changes might also be
expected to accompany magmatic intrusions as a
result of electrokinetic effects generated by fluid flow
[23]. However, to explain the observed rapid and
reversible changes in terms of electrokinetics would
require rapid and implausibly intense fluid flow
[24,25]. Thus, even if the electrokinetic mechanism
cannot be ignored, we favor a more straightforward
explanation in terms of the piezomagnetic effect.
A piezomagnetic model, based on the techniques
described in Utsugi et al. [26], who revised solutions
given by Sasai [27], was employed to calculate the
expected magnetic field change at the earthTs surfacefor a dike. Model parameters were based on estimated
dike geometry using gravity and seismic data [19,20],
and induced rock magnetization was calculated from
surface samples near the various magnetometer sites
(Table 1). Fig. 4 shows the calculated anomaly from
this model. Predicted values at the magnetometer sites
provide a reasonable fit to the observed data.
epth Length Width Strike about North Dip Dislocation
) (km) (km) (8) (8) (m)
000 2.5 3 15 90 3.0
800 2.1 1 15 90 2.5
300 3.6 1 45 90 2.5
250 2.9 1 78 90 0.7
.0001 bars�1.

Fig. 4. Computed piezomagnetic field change related to the 26 October 2002 seismic swarm, i.e. an intrusive dike. The geometry and physical
properties used to model are reported in Table 1.
C. Del Negro et al. / Earth and Planetary Science Letters 229 (2004) 1–148
3.2. After the eruption onset
In the early morning of 27 October, a short N–S
trending fissure at the northern base of the NE crater
(3000 m a.s.l.) produced a short-lived explosive event,
marking the onset of the 2002 NE-Rift eruption (Fig.
1). At this time, epicenters time pattern evidenced a
clear migration of seismic events in the NE direction,
involving the volcano-tectonic structure named NE
Rift [18,19]. The downslope propagation of the dike
was subsequently disclosed by the opening of an
eruptive fissure system at 2500 m a.s.l. It extended
along the eastern border of the NE rift, covering a
distance of 3.5 km up to 1900 m a.s.l. The eruptive
fissures were mainly characterized by effusive activ-
ity. During their propagation downslope, they gradu-
ally became inactive. From 29 October, the effusion
rate from the 1920–1900-m vent gradually decreased,
until it stopped on 4 November. On the whole, about
10�106 m3 of lava was erupted forming two narrow
lava flow fields a few kilometers long [28].
The opening of the eruptive fissures was clearly
seen at the close PDN and DGL stations, where
progressive changes in the total intensity were
recorded in coincidence with the outpouring lava
flows. According to Fig. 3a, the minimum peak in the
total intensity at DGL was reached, while the local
magnetic field at PDN turned to increase of about 7
nT. The total intensity sharply decreased by about 4
nT at DGL at the same time as the secondary rise in
seismic energy release (Fig. 3b), which we may
reasonably associate with the outbreak at 2500 m a.s.l.
The magnetic changes, started along with the onset of
the eruption, continuously increased by about 2 nT at
PDN and near 10 nT at DGL within a few hours,
while the eruptive fissures extended northward up to

C. Del Negro et al. / Earth and Planetary Science Letters 229 (2004) 1–14 9
1900 m a.s.l. (Fig. 1), and remained stable at a new
level. The fact that a jump in the magnetic field
remained constant implies that the field is maintained
by the stress buildup accompanying the opening of the
eruptive fissures.
Based on the opening and the propagation patterns
of this eruptive fissures field, we developed a
mechanical model that successfully explained the
on-going crustal movement associated with this event.
The analysis of seismic events points out that, during
the early hours on 27 October, dike intrusion
modified the preexistent stress field generating a re-
orientation of the main axes able to induce magma
injection along the NE Rift and subsequent activation
of northeastern sector [18]. We presumed that with
progressing extension and upward propagation of
dike, failure reached the ground surface, and the
eruption started. The opening of eruptive fractures
Fig. 5. Expected piezomagnetic field change produced by the northward ex
parameters are reported in Table 1.
was also seen at tilt station, located in the Volcano-
logical Observatory of Pizzi Deneri, where the radial
tilt variation decelerated in coincidence with the
outpouring lava flow [22]. The extensional fractures
(horizontal displacements between 2 and 3 m) were
interpreted as an expression of the lateral propagation
of a shallow radial dike fed by the central conduit.
The quick propagation of the vents along the NE Rift
sharply slowed down after the crossing with the E–W
trending Pernicana fault system. Moreover, contem-
poraneously with the opening of eruptive fissures, the
westernmost Pernicana fault system (Fig. 1) became
active again, with an almost purely left-lateral
displacement of about 70 cm [29]. We considered
the entire northeastern block (confined at north by the
Pernicana fault system and at west by the NE rift)
subjected to a sliding in NW–SE direction. Ground
fracturing along the Pernicana fault system migrated
tension of a dyke up to 2500 m a.s.l. on October 27, 2002. The dyke

C. Del Negro et al. / Earth and Planetary Science Letters 229 (2004) 1–1410
eastward from the NE Rift, accommodating the
extension caused by the intrusion.
The variations occurred at the two closest sites
(PDN and DGL) and the simultaneity and proximity
in space and time point to the piezomagnetic effect as
the primary physical mechanism driving these anoma-
lies. Two models at different time instants based on
stress redistribution due to intruding magma could
explain the relationships between the observed
anomalies and the eruptive events. Firstly, after the
magmatic intrusion occurred below the summit craters
(Fig. 4), the increase in the total intensity at PDN can
be recognized as due to northward extension of a new
dyke up to 2500 m a.s.l. As the dyke approached
DGL, the total intensity sharply decreased there. The
expected piezomagnetic anomaly caused by a tensile
fault was calculated (Fig. 5). The geometry and the
Fig. 6. Expected piezomagnetic field change produced by the 27 October 2
a left-lateral strike-slip fault. The geometry and physical properties are re
slip of the fault have the same form as that determined
by earthquake distributions and surface fracturing
[19]. Secondly, growth of another dyke up to cross the
Pernicana fault system gave rise to rapid increase in
the total intensity at DGL, while it also contributed to
gradual increase at PDN. The piezomagnetic field
change due to two typical faults was then computed
(Fig. 6): the former is a tensile fault due to intrusive
magma, whose volume was estimated to be in the
order of lava volume emitted, and the latter is a left-
lateral strike-slip fault corresponding to the displace-
ment of the westernmost Pernicana fault system. Data
and model prove that the strike-slip fault (Pernicana
fault) does not affect the local magnetic field at both
stations, because it was located rather far away and its
dislocation was relatively small. The fault parameters
together with estimates of rock magnetization are
002 eruptive fissure system in the North flank, i.e. a tensile fault and
ported in Table 1.
C. Del Negro et al. / Earth and Planetary Science Letters 229 (2004) 1–14 11
listed in Table 1. The calculated values from the two
models are in good agreement with the observed local
magnetic field data (Figs. 5 and 6).
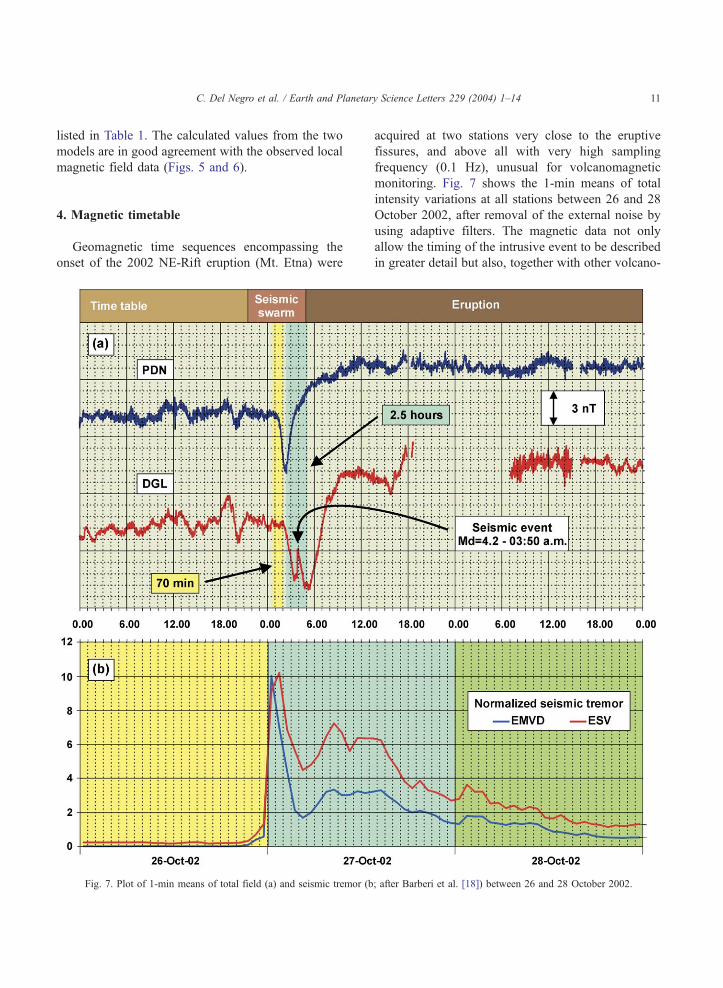
4. Magnetic timetable
Geomagnetic time sequences encompassing the
onset of the 2002 NE-Rift eruption (Mt. Etna) were
Fig. 7. Plot of 1-min means of total field (a) and seismic tremor (b
acquired at two stations very close to the eruptive
fissures, and above all with very high sampling
frequency (0.1 Hz), unusual for volcanomagnetic
monitoring. Fig. 7 shows the 1-min means of total
intensity variations at all stations between 26 and 28
October 2002, after removal of the external noise by
using adaptive filters. The magnetic data not only
allow the timing of the intrusive event to be described
in greater detail but also, together with other volcano-
; after Barberi et al. [18]) between 26 and 28 October 2002.

C. Del Negro et al. / Earth and Planetary Science Letters 229 (2004) 1–1412
logical and geophysical evidences, permit some
constraints to be set on the characteristics of prop-
agation of a shallow dike. In the following, we use the
timetable of magnetic events to describe step-by-step
the actual temporal sequence of dike intrusion along
the NE rift in the early hours on 27 October 2002.
Until at 1:00 local time, no significant changes were
observed at all magnetic stations. At this time, magma
was rapidly injected just below the summit craters to
large depth, more than 3–4 km bsl. No variations were
predicted at the two sites, DGL and PDN. In fact, the
dike intrusion is too deep and far from them to record
appreciable changes at these stations.
After 1:00 local time, the first variation of
magnetic field is seen at PDN, the station nearest to
central craters. The decrease of the total intensity at
PDN began when the seismic tremor reached the
maximum amplitude (Fig. 7b). While continued
intrusion magma occurred upward, vertical fractures
and perhaps faults developed around the growing dike
top in the subsurface at the northern base of the NE
crater. At DGL station, located about 2.5 km north-
ward, the first magnetic change was observed about
70 min later.
After 2:28 local time, the magnetic activity at PDN
reversed soon at high rate toward the level observed
before the seismic swarm, while the seismic tremor
showed an abrupt decrease (Fig. 7b) and the seismic
events migrated northeastward. We mark the opening
of the short eruptive fissure at the northern base of the
NE crater at about 3000 m a.s.l. at this time. The
magnetic offset at the close PDN station is ascribed to
the piezomagnetic effect due to a rapid mechanical
event.
At 3:50 local time, a rapid transient variation of
more than 2 nTwas recorded at the DGL station, while
the transient at PDN has an amplitude of �0.6 nT (by
readings at 10 seconds). The magnetic transients are
coincident with one of the largest earthquakes,
magnitude Md=4.2, recorded during the seismic
swarm preceding and accompanying the opening of
fractures on the volcano. This earthquake was located
roughly midway between DGL and PDN, with focal
depth 3.4 km. The magnetic changes related to seismic
activity were reversible; in fact they cancel at the same
time as the fall in seismic energy release.
Right after 5:00 local time, a very strong and rapid
magnetic increase took place at DGL, and the seismic
tremor and the earthquake hourly rate started rising
again. More rapid volcanomagnetic variations are
well associated with rapid modifications of the stress
field induced by magma that reaches the ground
surface through volcanic vents and fissures. We
located the onset of the eruption along the NE rift
at this time, when the first eruptive fissure opened at
2500 m a.s.l. producing a lava flow that spread in the
direction of Piano Provenzana (Fig. 1). The offsets in
magnetic time series occurred in different time points
spaced approximately 2.5 h apart, near 2:28 at PDN
located at 2783 m a.s.l. and around 5:00 at DGL
situated at 2372 m a.s.l.
After 8:00 local time, geomagnetic total intensity at
both stations turned almost flat at the higher level
(Fig. 7a), while new lava flows outpoured from the
lower fractures (at 2150 and 1900 m) and expanded
on the north flank of the volcano. These events were
associated with a new local maximum of the seismic
tremor (Fig. 7b) and the earthquake hourly rate. Since
the eruption started and the stress field became stable,
the induced magnetic changes were permanent at both
sites. The modifications of the local magnetic field
lasted longer than duration of the seismic swarm and
of the NE rift eruption (Fig. 3).
In short, the rate of growth of the magnetic
anomalies allows describing how the eruption
evolved on NE flank of Etna. The basic features
were inferred by examining resemblances and differ-
ences in the characteristics of magnetic anomalies at
two sites. The similar characteristics (the shape and
the amplitude) point to a common geophysical
mechanism as source of the anomalies. On the other
hand, the differences in the anomalies (the phase shift
and the duration) are useful to determine the changes
of source positions. The anomaly at DGL has a delay
of 70 min, but it lasts about 2.5 h more than PDN.
This behaviour is a clear indication that the anoma-
lies are generated by a progressive intrusion of
dykes. The time interval between the reverses at
PDN and DGL amounting to 2.5 h (Fig. 7a) could
represent the time taken by magma to reach the
ground surface through the first eruptive fissure
opened at the base of the NE Crater and the
subsequent eruptive fissures field activated along
the NE rift spaced about 2.2 km apart. The 2.5-h time
delay simply indicates the time interval until the
intrusion of a new dyke starts.

C. Del Negro et al. / Earth and Planetary Science Letters 229 (2004) 1–14 13
5. Concluding remarks
The early stages of 2002–2003 lateral eruption at
Mt. Etna were accompanied by local magnetic field
changes recorded at the continuously operating Over-
hauser effect magnetometers set up on the volcanic
edifice. When the natural magnetic fluctuations are
removed using the adaptive filtering, no noticeable
precursory long-term signal is detected before the
eruption, while conspicuous short-time changes
anticipated and accompanied the eruptive fissure
openings. The comparison between magnetic data,
seismicity and surface phenomena imply that the
piezomagnetic effect is the primary physical mecha-
nism driving these anomalies. The position and the
geometry of sources, which could explain the total
intensity changes at each stage, were estimated. In
general, our data indicate that magnetic networking is
an efficient tool for detecting, locating, and modeling
even a narrow dike. This exceptional set of observa-
tions provided valuable information on what hap-
pened at a rather shallow depth beneath the volcano.
The various sources within the volcano of magnetic
changes at each stage suggest the most likely scenario
occurring during the eruption. Firstly, at around
midnight on 26 October, magma was rapidly injected
to a depth of 3–4 km just below the summit craters.
Secondly, after 1:00 on 27 October, continued
intrusion magma occurred upward and culminated a
few hundred meters below the free surface fractured
along a N–E direction. Thirdly, at about 2:28 magma
gave rise to an explosive fissural vent at the northern
base of the NE crater near 3000 m a.s.l. Finally, at
about 5:00, the first eruptive fissure became active
along the eastern border of the NE rift at 2500 m a.s.l.
The rate of growth of the magnetic anomalies,
moreover, leads to the interpretation that the magmatic
intrusion travelled northward from base of the NE
crater to the NE rift at approximately 14 m/min.
Acknowledgments
We are indebted to all personal of Geomagnetism
Laboratory of National Institute of Geophysics and
Volcanology (Catania Section) who ensure the regular
working of the permanent magnetic network. Thanks
are due to Paolo Palangio for making the data of
L’Aquila magnetic observatory available. We are
grateful to Yochi Sasai for constructive and helpful
comments that improved greatly the manuscript. An
anonymous reviewer also gave valuable comments.
This research was carried out in the frame of the
project EPOT of the Gruppo Nazionale per la
Vulcanologia of the INGV.
References
[1] C. Del Negro, F. Ferrucci, R. Napoli, Retrieval of large
volcanomagnetic effects observed during the 1981 eruption of
Mt. Etna, Ann. Geofis. XL (1997) 547–562.
[2] C. Del Negro, F. Ferrucci, Magnetic history of a dyke on Mt.
Etna, Geophys. J. Int. 133 (1998) 451–458.
[3] C. Del Negro, F. Ferrucci, R. Napoli, The permanent network
for magnetic surveillance of Mt. Etna: changes in the
geomagnetic total intensity observed in 1995, Acta Vulcanol.
9 (1997) 67–72.
[4] C. Del Negro, R. Napoli, A. Sicali, Automated system for
magnetic monitoring of active volcanoes, Bull. Volcanol. 64
(2002) 94–99.
[5] INGV-CT, Istituto Nazionale di Geofisica e Vulcanologia-
Sezione di Catania, Multidisciplinary approach yields insight
Mt. Etna eruption, EOS Trans. Am. Geophys. Union 82 (2001)
653–656.
[6] C. Del Negro, G. Currenti, Volcanomagnetic signals associated
with the 2001 flank eruption of Mt. Etna (Italy), Geophys. Res.
Lett. 30 (7) (2003) 1357.
[7] W.D. Parkinson, Introduction to Geomagnetism, Scottish
Academic Press, 1983, 433 pp.
[8] P.M. Davis, F.D. Stacey, C.J. Zablocki, J.V. Olson, Improved
signal discrimination in tectonomagnetism: discovery of a
volcanomagnetic effect at Kilauea, Hawaii, Phys. Earth Planet.
Inter. 19 (1979) 331–336.
[9] X.Y. Zhou, F.S. Wei, Prediction of recurrent geomagnetic
disturbances by using adaptive filtering, Earth Planets Space
50 (1998) 839–845.
[10] J.A. Steppe, Reducing noise in tectonomagnetic experiments
by linear regression, J. Geophys. Res. 84 (1979) 3063–3067.
[11] P.M. Davis, D.D. Jackson, C.A. Searls, R.L. McPhernon,
Detection of tectonomagnetic events using multichannel
predictive filtering, J. Geophys. Res. 86 (1981) 1731–1737.
[12] M. Hattingh, A new data adaptive filtering program to remove
noise from geophysical time or space series data, Comput.
Geosci. 14 (1988) 467–480.
[13] K.A. Poehls, D.D. Jackson, Tectonomagnetic event detection
using empirical transfer functions, J. Geophys. Res. 83 (B10)
(1978) 4933–4940.
[14] M. Fedi, M. La Manna, F. Palmieri, Nonstationary analysis of
geomagnetic time sequences from Mount Etna and North Palm
Springs earthquake, J. Geophys. Res. 108 (2003) 2493.
[15] S.S. Haykin, Adaptive Filter Theory, Prentice Hall, 1996,
pp. 365–372.

C. Del Negro et al. / Earth and Planetary Science Letters 229 (2004) 1–1414
[16] H. Akaike, A new look at the statistical model identification,
IEEE Trans. AC (1974) 716–723 (AC-19).
[17] D. Patane, Seismic activity preceding and accompanying the
2002–2003 Etna eruption, Etna Eruption in 2002, GNV
General Assembly Proc., 2003, p. 72.
[18] G. Barberi, L. Cammarata, O. Cocina, V. Maiolino, C.
Musumeci, E. Privitera, Seismic activity related to the 2002–
2003 Mt. Etna volcano eruption (Italy): fault plane solutions
and stress tensor computation, Etna Eruption in 2002, GNV
General Assembly Proc., 2003, p. 84.
[19] V. Acocella, B. Behncke, M. Neri, S. D’Amico, Link between
major flank slip and eruptions at Mt. Etna (Italy), Geophys.
Res. Lett. 30 (24) (2003) 2286.
[20] S. Branca, D. Carbone, F. Greco, Intrusive mechanism of the
2002 NE-Rift eruption at Mt. Etna (Italy) inferred through
continuous microgravity data and volcanological evidences,
Geophys. Res. Lett. 30 (20) (2003) 2077.
[21] G. Puglisi, M. Aloisi, M. Amore, A. Bonaccorso, A. Bonforte,
M. Cantarero, F. Calvagna, O. Campisi, S. Consoli, O.
Consoli, G. Falzone, A. Ferro, S. Gambino, F. Gugliemino,
G. Laudani, M. Mattia, B. Puglisi, M. Rossi, B. Saraceno, R.
Velardita, Geodetic monitoring of the strain field evolution
before and during the 2002 Mt. Etna Eruption, Etna Eruption
in 2002, GNV General Assembly Proc., 2003, p. 74.
[22] A. Bonaccorso, O. Campisi, G. Falzone, A. Ferro, S.
Gambino, G. Laudani, B. Saraceno, Spatio-temporal con-
strains on 2002 eruption inferred from tilt data, Etna eruption
in 2002, GNV General Assembly Proc., 2003, p. 71.
[23] D.V. Fitterman, Theory of Electrokinetic magnetic anomalies in
a faulted half space, J. Geophys. Res. 84 (1979) 6031–6040.
[24] P. Adler, J.L. Le MouJl, J. Zlotnicki, Electrokinetic and
magnetic fields generated by flow through a fracture zone: a
sensitivity study for La Fournaise Volcano, Geophys. Res.
Lett. 26 (1999) 795.
[25] H. Murakami, Geomagnetic fields produced by electrokinetic
sources, J. Geomagn. Geoelectr. 41 (1989) 221–247.
[26] M. Utsugi, Y. Nishida, Y. Sasai, Piezomagnetic potentials due
to an inclined rectangular fault in a semi-infinite medium,
Geophys. J. Int. 140 (2000) 479–492.
[27] Y. Sasai, Tectonomagnetic modeling on the basis of the linear
piezomagnetic effect, Bull. Earthq. Res. Inst. Univ. Tokyo 66
(1991) 585–722.
[28] D. Andronico, S. Branca, S. Calvari, M. Burton, T. Caltabiano,
R.A. Corsaro, et al., A multi-disciplinary study of the 2002–03
Etna eruption: insights into a complex plumbing system, Bull.
Volcanol., DOI:10.1007/s00445-004-0372-8 (in press).
[29] M. Neri, V. Acocella, B. Behncke, The role of the
Pernicana Fault System in the spreading of Mount Etna
(Italy) during the 2002–2003 eruption, Bull. Volcanol. 66
(2003) 417–430.