
Attenuation and Source Parameters of Shallow Microearthquakes at Mt. Etna Volcano, Italy
1
2
3
4
5
6
7
8
9
1011121314151617181920212223242526
2728
29
al Research xx (2006) xxx–xxx
+ MODEL
VOLGEO-03627; No of Pages 15
www.elsevier.com/locate/jvolgeores
ARTICLE IN PRESS
Journal of Volcanology and Geotherm
OF
Analysis of sustained long-period activity at Etna Volcano, Italy
Gilberto Saccorotti a,⁎, Ivan Lokmer b, Christopher J. Bean b,Giuseppe Di Grazia c, Domenico Patanè c
a Istituto Nazionale di Geofisica e Vulcanologia Sez. di Napoli, Osservatorio Vesuviano. Via Diocleziano, 328- 80124 Napoli, Italyb School of Geological Sciences, University College Dublin. Belfield, Dublin 4, Ireland, United Kingdomc Istituto Nazionale di Geofisica e Vulcanologia, Sez. di Catania. Piazza Roma, 2- 95123 Catania, Italy
Received 18 March 2006; received in revised form 9 October 2006; accepted 27 October 2006
ORECT
EDPRAbstract
Following the installation of a broadband network on Mt. Etna, sustained Long- Period (LP) activity was recordedaccompanying a period of total quiescence and the subsequent onset of the 2004–2005 effusive episode. From c. about 56000events detected by an automatic classification procedure, we analyse a subset of about 3000 signals spanning the December 17th,2003–September 25th, 2004, time interval. LP spectra are characterised by several, unevenly-spaced narrow peaks spanning the0.5–10 Hz frequency band. These peaks are common to all the recording sites of the network, and different from those associatedwith tremor signals. Throughout the analysed time interval, LP spectra and waveforms maintain significant similarity, thusindicating the involvement of a non-destructive source process that we interpret in terms of the resonance of a fluid-filled buriedcavity. Polarisation analysis indicates radiation from a non-isotropic source involving large amounts of shear. Concurrently with LPsignals, recordings from the summit station also depict Very-Long-Period (VLP) pulses whose rectilinear motion points to a regionlocated beneath the summit craters at depths ranging between 800 and 1100 m beneath the surface. Based on a refined repicking ofsimilar waveforms, we obtain robust locations for a selected subset of the most energetic LP events from probabilistic inversion oftravel-times calculated for a 3D heterogenous structure. LP sources cluster in a narrow volume located beneath the summit craters,and extending to a maximum depth of ≈800 m beneath the surface. No causal relationships are observed between LP, VLP andtremor activities and the onset of the 2004–2005 lava effusions, thus indicating that magmatic overpressure played a limited role intriggering this eruption. These data represent the very first observation of LP and VLP activity at Etna during non-eruptive periods,and open the way to the quantitative modelling of the geometry and dynamics of the shallow plumbing system.© 2006 Elsevier B.V. All rights reserved.
R OKeywords: long-period seismicity; etna volcano; volcano monitoring; precursorUNC
30
31
32
33
34
35
⁎ Corresponding author. Now at Istituto Nazionale di Geofisica eVulcanologia- Sez. di Pisa. Via U. della Faggiola, 32, 56126 Pisa, Italy.Tel.: +39 050 8311960; fax: +39 050 8311942.
E-mail address: [email protected] (G. Saccorotti).
0377-0273/$ - see front matter © 2006 Elsevier B.V. All rights reserved.doi:10.1016/j.jvolgeores.2006.10.008
Please cite this article as: Saccorotti, G. et al. Analysis of sustained long(2006), doi:10.1016/j.jvolgeores.2006.10.008
1. Introduction
Long-Period (LP) andVery-Long-Period (VLP) eventsare seismic signals which have been documented at manyvolcanoes throughout the world. In most cases this seis-micity occurs in association with surface eruptive activity,such as at Stromboli, Italy (Neuberg et al., 1994; Chouet
-period activity at Etna Volcano, Italy. J. Volcanol. Geotherm. Res.
36
37
38
39
40
41
42
43
44
45
46
47
48
49
50
51
52
53
54
55
56
57
58
59
60
61
62
63
64
65
66
67
68
69
70
71
72
73
74
75
76
77
78
79
80
81
82
83
84
85
86
87
88
89
90
91
2 G. Saccorotti et al. / Journal of Volcanology and Geothermal Research xx (2006) xxx–xxx
ARTICLE IN PRESS
et al., 1997, 1999), Galeras, Colombia (Gil Cruz andChouet, 1997), Erebus, Antarctica (Rowe et al., 1998),Soufriere Hills, Montserrat, (Neuberg et al., 1998), Usu,Japan (Matsubara and Yomogida, 2004), Popocatepetl,Mexico (Arciniega-Ceballos et al., 2000). Other observa-tions account instead for LP-VLP signals occurringwithout any evident correlation with phenomena whichare visible at the surface, such as at Lascar, Chile(Hellweg, 1999), Shishaldin, Alaska (Petersen et al.,2006), Tongariro, New Zealand (Hagerty and Benites,2003), Deception, Antarctica (Ibañez et al., 2000),Kusatsu-Shirane, Japan (Kumagai et al., 2002a). Al-though different models have been invoked to explain thesource mechanism of these events (e.g., Crosson andBame, 1985; Chouet, 1988; Fujita et al., 1995; Joussetet al., 2003, 2004), all involve the resonance and/ortransport of fluids inmagmatic and hydrothermal systems.The quantitative assessment of these sources is thuscritically important for our ability to model volcanicsystems, and to successfully forecast eruptive activity(e.g., Chouet et al., 1994).
With a single exception (Falsaperla et al., 2002), EtnaVolcano lacks significant records of long-period seis-micity, mostly owing to the reduced bandwidth of thesurveillance network, which was traditionally basedupon 1 Hz seismometers. Volcanic signals, however,often exhibit a broadband behaviour (see references inthe introduction). The undesired effects of the path andrecording site are reduced when analysing Long and
UNCO
RREC
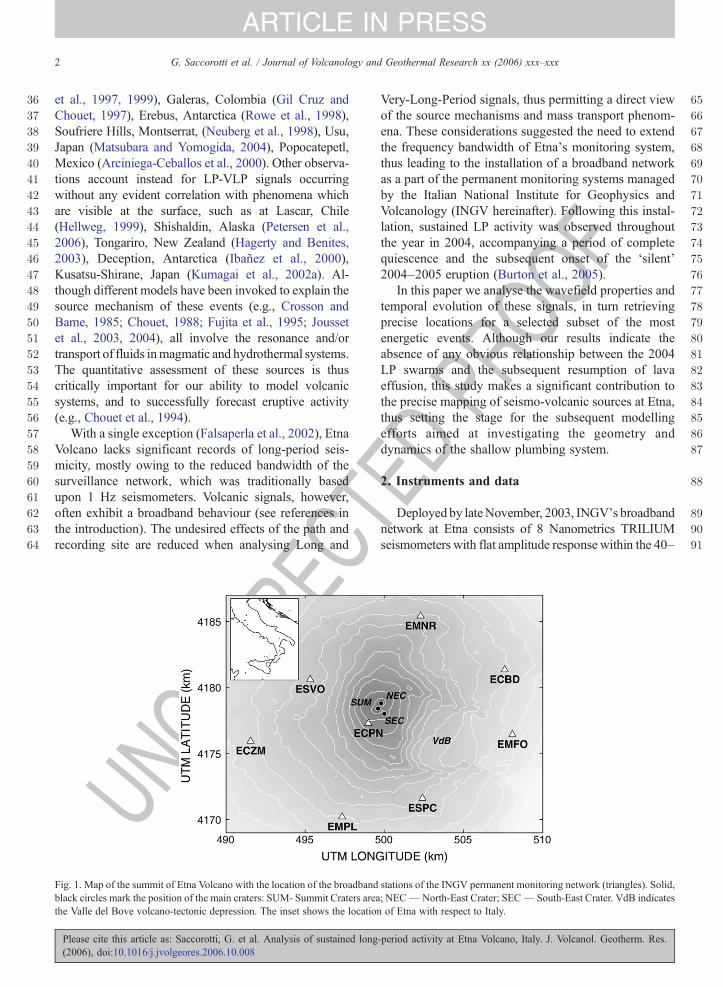
Fig. 1. Map of the summit of Etna Volcano with the location of the broadbandblack circles mark the position of the main craters: SUM- Summit Craters areathe Valle del Bove volcano-tectonic depression. The inset shows the locatio
Please cite this article as: Saccorotti, G. et al. Analysis of sustained long(2006), doi:10.1016/j.jvolgeores.2006.10.008
TEDPR
OOF
Very-Long-Period signals, thus permitting a direct viewof the source mechanisms and mass transport phenom-ena. These considerations suggested the need to extendthe frequency bandwidth of Etna's monitoring system,thus leading to the installation of a broadband networkas a part of the permanent monitoring systems managedby the Italian National Institute for Geophysics andVolcanology (INGV hereinafter). Following this instal-lation, sustained LP activity was observed throughoutthe year in 2004, accompanying a period of completequiescence and the subsequent onset of the ‘silent’2004–2005 eruption (Burton et al., 2005).
In this paper we analyse the wavefield properties andtemporal evolution of these signals, in turn retrievingprecise locations for a selected subset of the mostenergetic events. Although our results indicate theabsence of any obvious relationship between the 2004LP swarms and the subsequent resumption of lavaeffusion, this study makes a significant contribution tothe precise mapping of seismo-volcanic sources at Etna,thus setting the stage for the subsequent modellingefforts aimed at investigating the geometry anddynamics of the shallow plumbing system.
2. Instruments and data
Deployed by lateNovember, 2003, INGV's broadbandnetwork at Etna consists of 8 Nanometrics TRILIUMseismometers with flat amplitude response within the 40–
stations of the INGV permanent monitoring network (triangles). Solid,; NEC— North-East Crater; SEC— South-East Crater. VdB indicatesn of Etna with respect to Italy.
-period activity at Etna Volcano, Italy. J. Volcanol. Geotherm. Res.
92
93
94
95
96
97
98
99
100
101
102
103
104
105
106
107
108
109
110
111
112
113
114
115
116
117
118
119
120
121
122
123
124
125
126
127
128
129
130
131
132
133
134
135
136
137
138
139
140
141
142
143
144
145
146
147
148
149
150
151
152
153
154
155
156
157
158
159
160
161
162
163
164
165
166
167
168
169
170
171
172
173
174
175
176
177
178
179
180
181
182
183
184
185
186
187
188
189
190
191
192
3G. Saccorotti et al. / Journal of Volcanology and Geothermal Research xx (2006) xxx–xxx
ARTICLE IN PRESS
UNCO
RREC
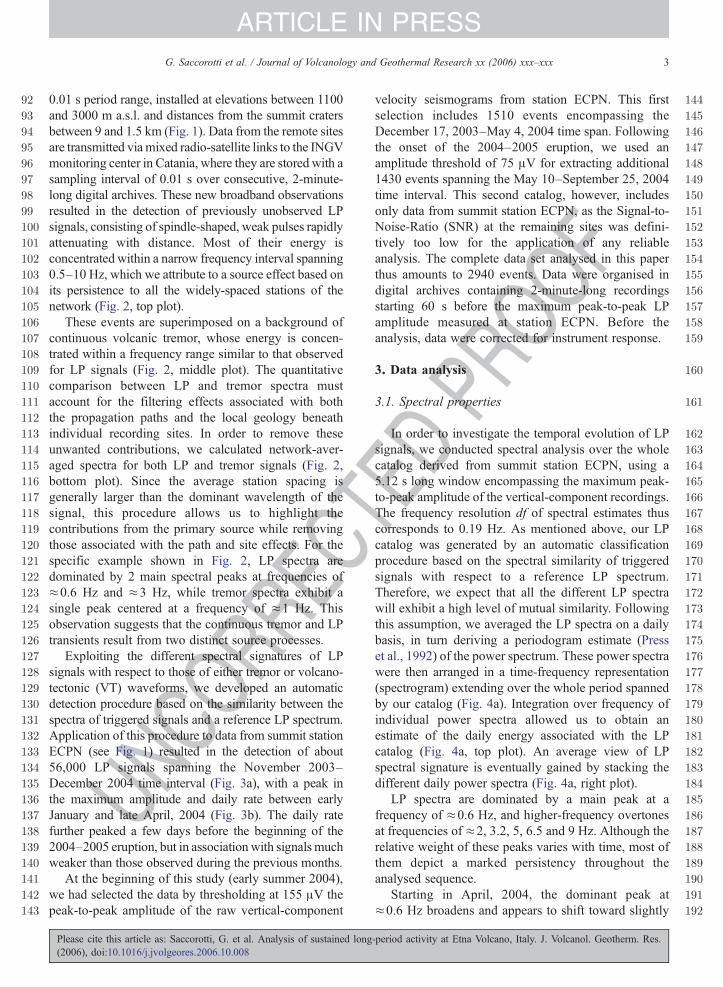
0.01 s period range, installed at elevations between 1100and 3000 m a.s.l. and distances from the summit cratersbetween 9 and 1.5 km (Fig. 1). Data from the remote sitesare transmitted via mixed radio-satellite links to the INGVmonitoring center in Catania, where they are stored with asampling interval of 0.01 s over consecutive, 2-minute-long digital archives. These new broadband observationsresulted in the detection of previously unobserved LPsignals, consisting of spindle-shaped, weak pulses rapidlyattenuating with distance. Most of their energy isconcentrated within a narrow frequency interval spanning0.5–10 Hz, which we attribute to a source effect based onits persistence to all the widely-spaced stations of thenetwork (Fig. 2, top plot).
These events are superimposed on a background ofcontinuous volcanic tremor, whose energy is concen-trated within a frequency range similar to that observedfor LP signals (Fig. 2, middle plot). The quantitativecomparison between LP and tremor spectra mustaccount for the filtering effects associated with boththe propagation paths and the local geology beneathindividual recording sites. In order to remove theseunwanted contributions, we calculated network-aver-aged spectra for both LP and tremor signals (Fig. 2,bottom plot). Since the average station spacing isgenerally larger than the dominant wavelength of thesignal, this procedure allows us to highlight thecontributions from the primary source while removingthose associated with the path and site effects. For thespecific example shown in Fig. 2, LP spectra aredominated by 2 main spectral peaks at frequencies of≈0.6 Hz and ≈3 Hz, while tremor spectra exhibit asingle peak centered at a frequency of ≈1 Hz. Thisobservation suggests that the continuous tremor and LPtransients result from two distinct source processes.
Exploiting the different spectral signatures of LPsignals with respect to those of either tremor or volcano-tectonic (VT) waveforms, we developed an automaticdetection procedure based on the similarity between thespectra of triggered signals and a reference LP spectrum.Application of this procedure to data from summit stationECPN (see Fig. 1) resulted in the detection of about56,000 LP signals spanning the November 2003–December 2004 time interval (Fig. 3a), with a peak inthe maximum amplitude and daily rate between earlyJanuary and late April, 2004 (Fig. 3b). The daily ratefurther peaked a few days before the beginning of the2004–2005 eruption, but in association with signals muchweaker than those observed during the previous months.
At the beginning of this study (early summer 2004),we had selected the data by thresholding at 155 μV thepeak-to-peak amplitude of the raw vertical-component
Please cite this article as: Saccorotti, G. et al. Analysis of sustained long(2006), doi:10.1016/j.jvolgeores.2006.10.008
TEDPR
OOF
velocity seismograms from station ECPN. This firstselection includes 1510 events encompassing theDecember 17, 2003–May 4, 2004 time span. Followingthe onset of the 2004–2005 eruption, we used anamplitude threshold of 75 μV for extracting additional1430 events spanning the May 10–September 25, 2004time interval. This second catalog, however, includesonly data from summit station ECPN, as the Signal-to-Noise-Ratio (SNR) at the remaining sites was defini-tively too low for the application of any reliableanalysis. The complete data set analysed in this paperthus amounts to 2940 events. Data were organised indigital archives containing 2-minute-long recordingsstarting 60 s before the maximum peak-to-peak LPamplitude measured at station ECPN. Before theanalysis, data were corrected for instrument response.
3. Data analysis
3.1. Spectral properties
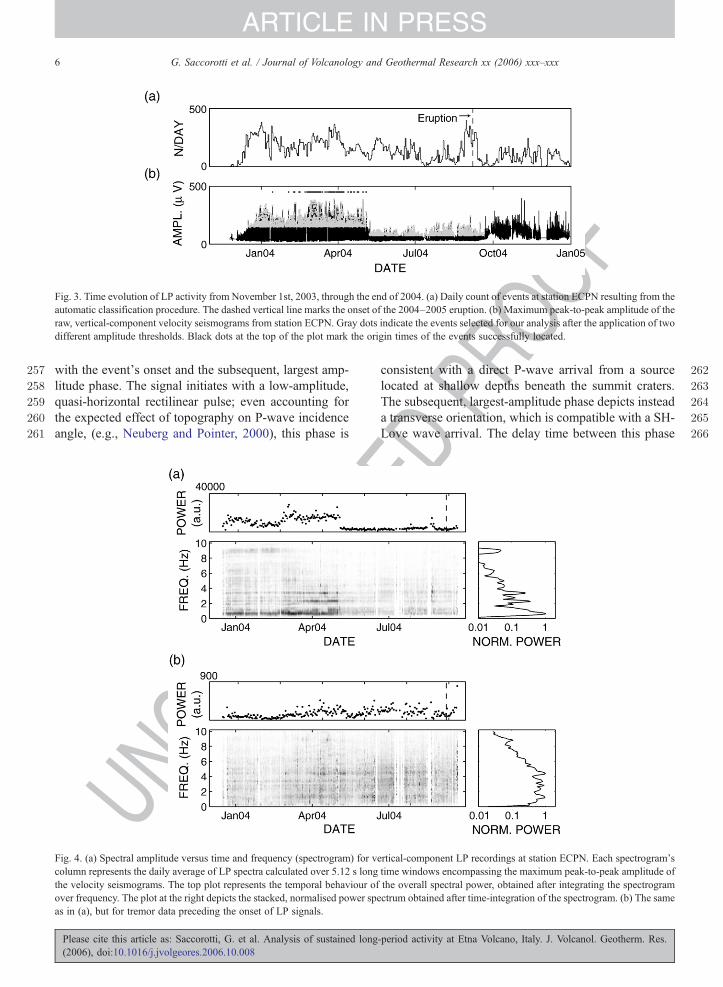
In order to investigate the temporal evolution of LPsignals, we conducted spectral analysis over the wholecatalog derived from summit station ECPN, using a5.12 s long window encompassing the maximum peak-to-peak amplitude of the vertical-component recordings.The frequency resolution df of spectral estimates thuscorresponds to 0.19 Hz. As mentioned above, our LPcatalog was generated by an automatic classificationprocedure based on the spectral similarity of triggeredsignals with respect to a reference LP spectrum.Therefore, we expect that all the different LP spectrawill exhibit a high level of mutual similarity. Followingthis assumption, we averaged the LP spectra on a dailybasis, in turn deriving a periodogram estimate (Presset al., 1992) of the power spectrum. These power spectrawere then arranged in a time-frequency representation(spectrogram) extending over the whole period spannedby our catalog (Fig. 4a). Integration over frequency ofindividual power spectra allowed us to obtain anestimate of the daily energy associated with the LPcatalog (Fig. 4a, top plot). An average view of LPspectral signature is eventually gained by stacking thedifferent daily power spectra (Fig. 4a, right plot).
LP spectra are dominated by a main peak at afrequency of ≈0.6 Hz, and higher-frequency overtonesat frequencies of ≈2, 3.2, 5, 6.5 and 9 Hz. Although therelative weight of these peaks varies with time, most ofthem depict a marked persistency throughout theanalysed sequence.
Starting in April, 2004, the dominant peak at≈0.6 Hz broadens and appears to shift toward slightly
-period activity at Etna Volcano, Italy. J. Volcanol. Geotherm. Res.
UNCO
RREC
TEDPR
OOF
4 G. Saccorotti et al. / Journal of Volcanology and Geothermal Research xx (2006) xxx–xxx
ARTICLE IN PRESS
Please cite this article as: Saccorotti, G. et al. Analysis of sustained long-period activity at Etna Volcano, Italy. J. Volcanol. Geotherm. Res.(2006), doi:10.1016/j.jvolgeores.2006.10.008

F
193
194
195
196
197
198
199
200
201
202
203
204
205
206
207
208
209
210
211
212
213
214
215
216
217
218
219
220
221
222
223
224
225
226
227
228
229
230
231
232
233
234
235
236
237
238
239
240
241
242
243
244
245
246
247
248
249
250
251
252
253
254
255
256
Fig. 2 (continued ).
5G. Saccorotti et al. / Journal of Volcanology and Geothermal Research xx (2006) xxx–xxx
ARTICLE IN PRESS
UNCO
RREC
higher frequencies; this effect, however, is likely due tocontamination of LP spectra by the tremor peak atfrequency≈1 Hz (see Fig. 4 2). Over the same period, infact, LP energy decreases while the energy associatedwith the background gets relatively larger (Fig. 4).Moreover, it is difficult to assess such subtle frequencychanges on the basis of our Fourier-based spectralmeasurements; the brief duration of LP signals con-strains us to perform spectral estimates over short timewindows, thus necessarily leading to poor frequencyresolution. Any future effort aimed at investigating thefine spectral structure of our LP data should therefore bebased upon techniques, such as instantaneous frequencydeterminations or Autoregressive Modelling of thesignal (Lesage et al., 2002), which allow for the efficientseparation of closely-spaced spectral peaks even overshort-duration time series.
Similar analyses were conducted over tremor data, bycomputing spectral estimates over 5.12-s-long windowsof signal taken from the beginning of the LP recordings(Fig. 4b). Tremor spectra broadens over the 1–5 Hzfrequency range, and their peaks are less marked thanand different from those observed for LP spectra. Nonoticeable variations of either the energy or spectralcontent of tremor signal appear to herald the onset of the2004–2005 eruptive episode.
3.2. Waveform similarity
Although individual, raw LP signals depict quitedifferent waveforms, once band-pass filtered around themain frequency peak they all share a common signature.
We quantified this observation by conducting correla-tion analyses for all the independent event pairs using 5-s-
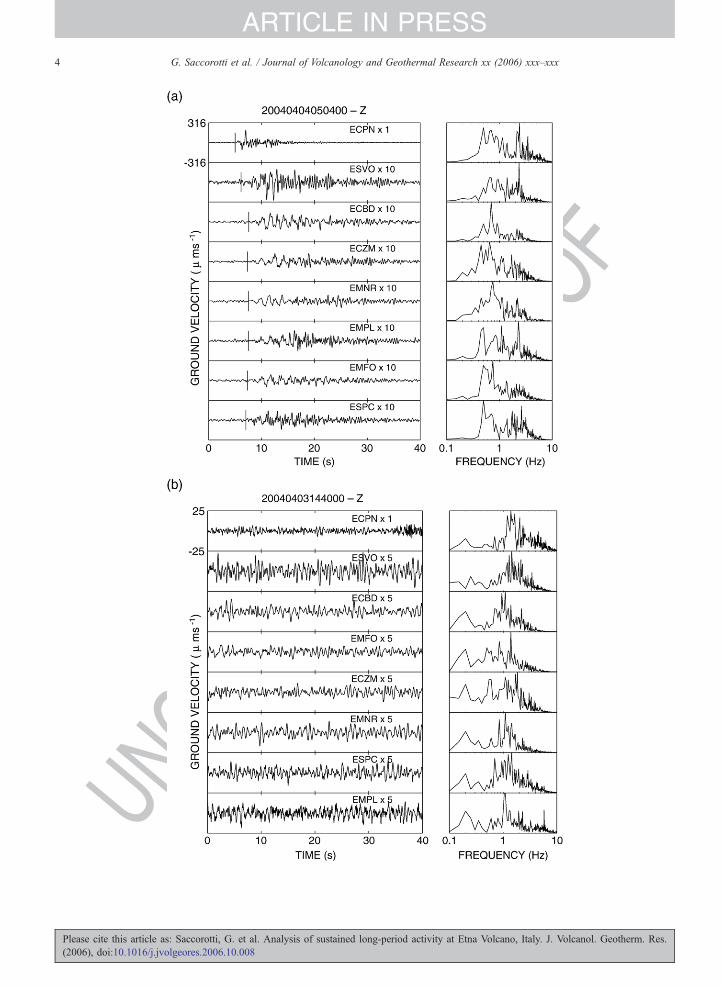
Fig. 2. Top: Vertical-component velocity seismograms for a LP event recoramplitude spectra calculated over a 15 s long window starting at the onset of thof decreasing amplitude. Middle : Vertical-component velocity seismograms famplitude spectra calculated over a 15 s long window. Bottom: Network-aveground velocity associated with the LP and tremor signals shown in two pan
Please cite this article as: Saccorotti, G. et al. Analysis of sustained long(2006), doi:10.1016/j.jvolgeores.2006.10.008
TEDPR
OOlong windows encompassing the maximum peak-to-peakamplitude of the 0.1–1 Hz band-pass-filtered, vertical-component seismograms from summit station ECPN. Wethen scanned this large correlation matrix in ascendingchronological order and extracted the elements for whichthe correlations among all the possible permutations weregreater than the arbitrary threshold of 0.8. In thisprocedure, we didn’t allow any overlap between clusters;in other words, once an event was assigned to a givengroup, it was removed from the correlation matrix thuspreventing it from being associated with any other cluster.At the end of the process we then discarded the smallclusters constituted by less than 5 elements, and found that1759 out of the initial 2940 events grouped into four largefamilies, whose temporal distributions seem to depict aweak evolutionary trend (Fig. 5a). Rather than theconsecutive evolution of distinct sources, however, sucha trend is probably an artifact of our sequential, exclusiveclustering procedure. For each of these clusters, we usedthe inter-event delay times derived from correlationanalyses to align seismograms, and computed stackedwaveforms (e.g., Rowe et al., 2004). The stacked signalsassociated with the different clusters display a markedsimilarity (Fig. 5b), thus reinforcing the idea thatindividual groups are most likely representative of thesame source. We also repeated the correlation andclustering procedures over the two horizontal componentsof ground velocity, the result of which support ourfindings for the vertical component case.
3.3. Polarisation analysis
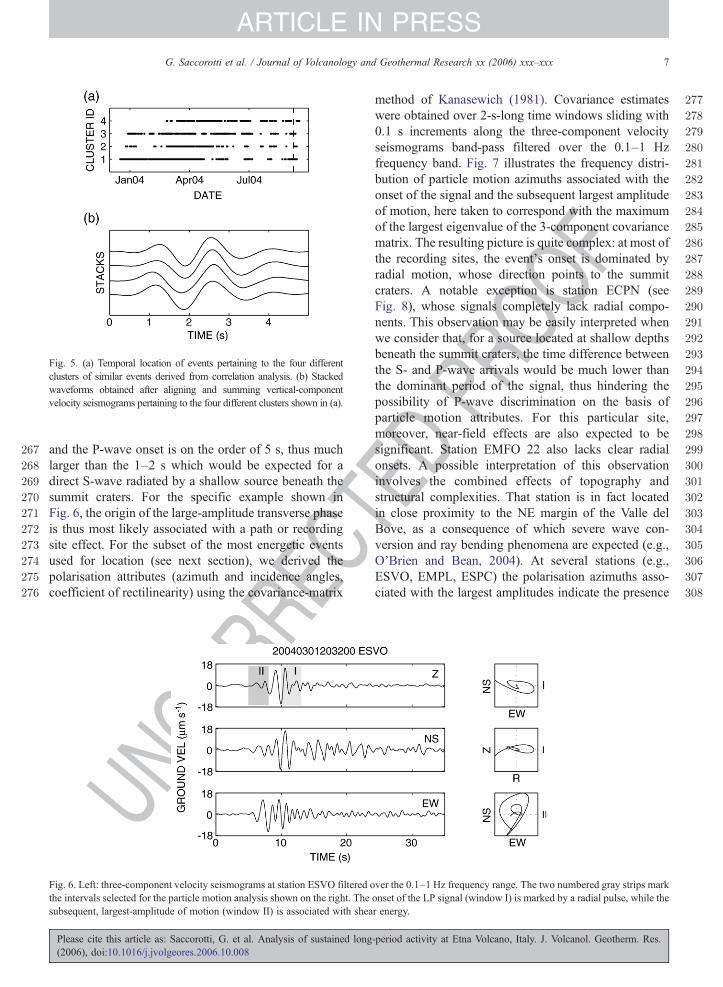
Fig. 6 illustrates an example of particle motiontrajectories observed at station ESVO in association
ded by all the stations of the network, and corresponding normalisede event (vertical lines on the seismograms). Traces are arranged in orderor a 40 s long section of volcanic tremor, and corresponding normalisedraged normalized power spectra estimates for the three components ofels above (continuous and dashed lines, respectively).
-period activity at Etna Volcano, Italy. J. Volcanol. Geotherm. Res.
OOF
257
258
259
260
261
262
263
264
265
266
Fig. 3. Time evolution of LP activity from November 1st, 2003, through the end of 2004. (a) Daily count of events at station ECPN resulting from theautomatic classification procedure. The dashed vertical line marks the onset of the 2004–2005 eruption. (b) Maximum peak-to-peak amplitude of theraw, vertical-component velocity seismograms from station ECPN. Gray dots indicate the events selected for our analysis after the application of twodifferent amplitude thresholds. Black dots at the top of the plot mark the origin times of the events successfully located.
6 G. Saccorotti et al. / Journal of Volcanology and Geothermal Research xx (2006) xxx–xxx
ARTICLE IN PRESS
with the event’s onset and the subsequent, largest amp-litude phase. The signal initiates with a low-amplitude,quasi-horizontal rectilinear pulse; even accounting forthe expected effect of topography on P-wave incidenceangle, (e.g., Neuberg and Pointer, 2000), this phase is
UNCO
RREC
Fig. 4. (a) Spectral amplitude versus time and frequency (spectrogram) for vcolumn represents the daily average of LP spectra calculated over 5.12 s longthe velocity seismograms. The top plot represents the temporal behaviour ofover frequency. The plot at the right depicts the stacked, normalised power spas in (a), but for tremor data preceding the onset of LP signals.
Please cite this article as: Saccorotti, G. et al. Analysis of sustained long(2006), doi:10.1016/j.jvolgeores.2006.10.008
PRconsistent with a direct P-wave arrival from a sourcelocated at shallow depths beneath the summit craters.The subsequent, largest-amplitude phase depicts insteada transverse orientation, which is compatible with a SH-Love wave arrival. The delay time between this phase
TED
ertical-component LP recordings at station ECPN. Each spectrogram'stime windows encompassing the maximum peak-to-peak amplitude ofthe overall spectral power, obtained after integrating the spectrogram
ectrum obtained after time-integration of the spectrogram. (b) The same
-period activity at Etna Volcano, Italy. J. Volcanol. Geotherm. Res.
267
268
269
270
271
272
273
274
275
276
277
278
279
280
281
282
283
284
285
286
287
288
289
290
291
292
293
294
295
296
297
298
299
300
301
302
303
304
305
306
307
308
Fig. 5. (a) Temporal location of events pertaining to the four differentclusters of similar events derived from correlation analysis. (b) Stackedwaveforms obtained after aligning and summing vertical-componentvelocity seismograms pertaining to the four different clusters shown in (a).
7G. Saccorotti et al. / Journal of Volcanology and Geothermal Research xx (2006) xxx–xxx
ARTICLE IN PRESS
Cand the P-wave onset is on the order of 5 s, thus muchlarger than the 1–2 s which would be expected for adirect S-wave radiated by a shallow source beneath thesummit craters. For the specific example shown inFig. 6, the origin of the large-amplitude transverse phaseis thus most likely associated with a path or recordingsite effect. For the subset of the most energetic eventsused for location (see next section), we derived thepolarisation attributes (azimuth and incidence angles,coefficient of rectilinearity) using the covariance-matrix
UNCO
RRE
Fig. 6. Left: three-component velocity seismograms at station ESVO filtered othe intervals selected for the particle motion analysis shown on the right. Thesubsequent, largest-amplitude of motion (window II) is associated with shea
Please cite this article as: Saccorotti, G. et al. Analysis of sustained long(2006), doi:10.1016/j.jvolgeores.2006.10.008
TEDPR
OOF
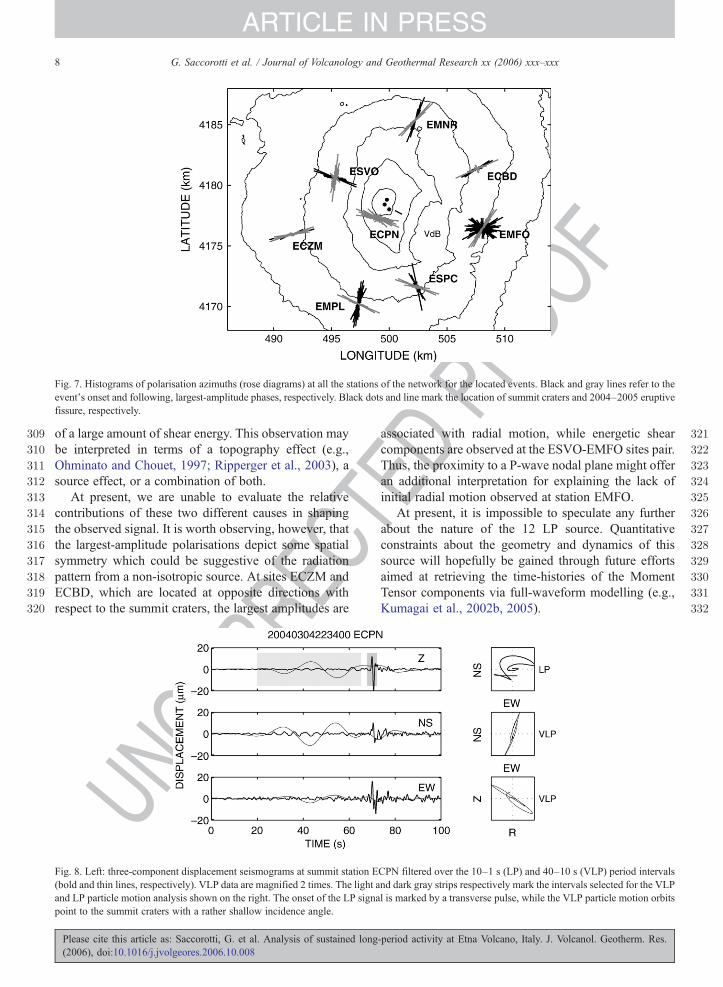
method of Kanasewich (1981). Covariance estimateswere obtained over 2-s-long time windows sliding with0.1 s increments along the three-component velocityseismograms band-pass filtered over the 0.1–1 Hzfrequency band. Fig. 7 illustrates the frequency distri-bution of particle motion azimuths associated with theonset of the signal and the subsequent largest amplitudeof motion, here taken to correspond with the maximumof the largest eigenvalue of the 3-component covariancematrix. The resulting picture is quite complex: at most ofthe recording sites, the event's onset is dominated byradial motion, whose direction points to the summitcraters. A notable exception is station ECPN (seeFig. 8), whose signals completely lack radial compo-nents. This observation may be easily interpreted whenwe consider that, for a source located at shallow depthsbeneath the summit craters, the time difference betweenthe S- and P-wave arrivals would be much lower thanthe dominant period of the signal, thus hindering thepossibility of P-wave discrimination on the basis ofparticle motion attributes. For this particular site,moreover, near-field effects are also expected to besignificant. Station EMFO 22 also lacks clear radialonsets. A possible interpretation of this observationinvolves the combined effects of topography andstructural complexities. That station is in fact locatedin close proximity to the NE margin of the Valle delBove, as a consequence of which severe wave con-version and ray bending phenomena are expected (e.g.,O'Brien and Bean, 2004). At several stations (e.g.,ESVO, EMPL, ESPC) the polarisation azimuths asso-ciated with the largest amplitudes indicate the presence
ver the 0.1–1 Hz frequency range. The two numbered gray strips markonset of the LP signal (window I) is marked by a radial pulse, while ther energy.
-period activity at Etna Volcano, Italy. J. Volcanol. Geotherm. Res.
ROOF
309
310
311
312
313
314
315
316
317
318
319
320
321
322
323
324
325
326
327
328
329
330
331
332
Fig. 7. Histograms of polarisation azimuths (rose diagrams) at all the stations of the network for the located events. Black and gray lines refer to theevent's onset and following, largest-amplitude phases, respectively. Black dots and line mark the location of summit craters and 2004–2005 eruptivefissure, respectively.
8 G. Saccorotti et al. / Journal of Volcanology and Geothermal Research xx (2006) xxx–xxx
ARTICLE IN PRESS
ECof a large amount of shear energy. This observation maybe interpreted in terms of a topography effect (e.g.,Ohminato and Chouet, 1997; Ripperger et al., 2003), asource effect, or a combination of both.
At present, we are unable to evaluate the relativecontributions of these two different causes in shapingthe observed signal. It is worth observing, however, thatthe largest-amplitude polarisations depict some spatialsymmetry which could be suggestive of the radiationpattern from a non-isotropic source. At sites ECZM andECBD, which are located at opposite directions withrespect to the summit craters, the largest amplitudes are
UNCO
RR
Fig. 8. Left: three-component displacement seismograms at summit station E(bold and thin lines, respectively). VLP data are magnified 2 times. The light aand LP particle motion analysis shown on the right. The onset of the LP signapoint to the summit craters with a rather shallow incidence angle.
Please cite this article as: Saccorotti, G. et al. Analysis of sustained long(2006), doi:10.1016/j.jvolgeores.2006.10.008
TEDP
associated with radial motion, while energetic shearcomponents are observed at the ESVO-EMFO sites pair.Thus, the proximity to a P-wave nodal plane might offeran additional interpretation for explaining the lack ofinitial radial motion observed at station EMFO.
At present, it is impossible to speculate any furtherabout the nature of the 12 LP source. Quantitativeconstraints about the geometry and dynamics of thissource will hopefully be gained through future effortsaimed at retrieving the time-histories of the MomentTensor components via full-waveform modelling (e.g.,Kumagai et al., 2002b, 2005).
CPN filtered over the 10–1 s (LP) and 40–10 s (VLP) period intervalsnd dark gray strips respectively mark the intervals selected for the VLPl is marked by a transverse pulse, while the VLP particle motion orbits
-period activity at Etna Volcano, Italy. J. Volcanol. Geotherm. Res.

333
334
335
336
337
338
339
340
341
342
343
344
345
346
347
348
349
350
351
352
353
354
355
356
357
358
359
360
361
362
363
364
365
366
367
368
369
370
371
372
373
374
375
376
377
378
379
380
381
382
383
384
385
386
387
388
389
Fig. 9. Temporal evolution of azimuth (a) and incidence (b) angles forVLPpulses observed at summit station ECPN. The bold, black line is the fit tothe original data, obtained by averaging subsequent groups of 40measurements overlapping by 20. The thin, gray lines are the error boundsderived from the standard deviation of each set of observations. The plot in(c) indicates the depth of the VLP source obtained by projecting thepolarisation vector onto the EW vertical plane passing through the craters.The depth is calculated with respect to the summit craters.
Fig. 10. Relationships between the daily-average of LP and VLP signalamplitudes.
9G. Saccorotti et al. / Journal of Volcanology and Geothermal Research xx (2006) xxx–xxx
ARTICLE IN PRESS
UNCO
RREC
At station ECPN we also observed weak VLPoscillations at a period of about 20 s (Fig. 8), occurringeither concurrently with or independently from the LPsignals. These pulses exhibit rectilinear particle motionoriented toward the summit craters, with dominantincidence angles between 50° and 70°.
Using band-pass filtering over the 50–10 s periodinterval, we extended measurements of the VLPpolarisation azimuth and incidence angles to all datasegments from station ECPN. The low energy of thesepulses means that they are not visible or cannot beanalysed at the remaining recording sites.
Fig. 9 illustrates the temporal variation of the directionof VLP particle motion. By constraining the VLP sourcesto the EW vertical plane passing through the crater, andneglecting the particle motion distortion as a consequenceof free-surface interaction (Neuberg and Pointer, 2000),we then convert VLP polarisation angles to source depths.Under such simplifying assumptions, and accounting formeasurement uncertainties, the depth of the VLP sourcewould vary between ≈750 m and ≈1100 m beneath thesummit craters. The shallowest locations are associatedwith the January–April, 2004, interval, and with the laterpart of the catalog preceding the onset of the eruption.Finally, we compare the daily average of the peak-to-peakamplitudes of LP and VLP signals (Fig. 10). Within the
Please cite this article as: Saccorotti, G. et al. Analysis of sustained long(2006), doi:10.1016/j.jvolgeores.2006.10.008
TEDPR
OOF
inherent limitations due to the lack of completeness ofboth catalogs, significant correlation exists between thetwo sets of observations, thus suggesting an inter-relationship between LP and VLP seismicity.
4. Locations
Determining the location of our LP data is challengingdue to the emergent onsets and poor SNR atmost stations.However, the similarity ofwaveformsmay be exploited toget consistent estimates of inter-event differential timesand high-SNR stacked waveforms to be used for reliablephase-picking procedures. From the LP catalog,we used athreshold of 50 μms−1 on the peak-to-peak amplitude ofthe vertical-component velocity seismograms at stationECPN to extract the largest 123 events for which re-cordings by at least 6 stations were available. For theseevents, we used the preliminary time pickings at stationECPN to guess P-wave onsets at the remaining sites of thenetwork, based on the travel times predicted for a sourcelocated 500 m beneath the craters. Using this set ofguessed time pickings, we repeated the correlationanalyses using short (2.5 s long) time windows encom-passing the expected signal onset. We then applied theEquivalence Class (EC) clustering algorithm (Press et al.,1992) to the resulting correlation matrices, using acorrelation threshold of 0.9. In this manner, we foundthat all the recordings from individual stations groupedinto a single, large family. In contrast to the clusteringprocedure presented above, the group formed by the ECalgorithm is an ‘open’ tree, in the sense that not everyevent pair in the tree needs to be correlated. Events A, Band C form a tree if (A,B) and (B,C) are correlated,
-period activity at Etna Volcano, Italy. J. Volcanol. Geotherm. Res.
390
391
392
393
394
395
396
397
398
399
400401402403404405406
407408409410411412413
414415416417418419420
421422423
424
425
426
427
428
429
430
431
432
433
434
435
436
437
438
439
440
441
442
443
444
445
446
447
448
449
450
451
452
453
454
455
456
457
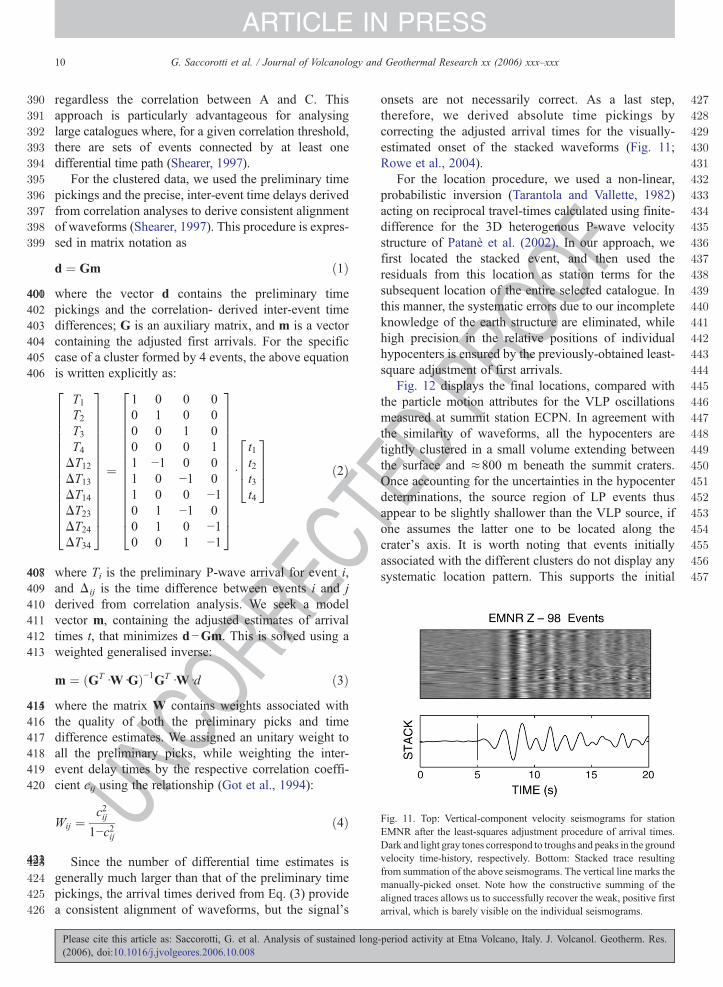
Fig. 11. Top: Vertical-component velocity seismograms for stationEMNR after the least-squares adjustment procedure of arrival times.Dark and light gray tones correspond to troughs and peaks in the groundvelocity time-history, respectively. Bottom: Stacked trace resultingfrom summation of the above seismograms. The vertical line marks themanually-picked onset. Note how the constructive summing of thealigned traces allows us to successfully recover the weak, positive firstarrival, which is barely visible on the individual seismograms.
10 G. Saccorotti et al. / Journal of Volcanology and Geothermal Research xx (2006) xxx–xxx
ARTICLE IN PRESS
UNCO
RREC
regardless the correlation between A and C. Thisapproach is particularly advantageous for analysinglarge catalogues where, for a given correlation threshold,there are sets of events connected by at least onedifferential time path (Shearer, 1997).
For the clustered data, we used the preliminary timepickings and the precise, inter-event time delays derivedfrom correlation analyses to derive consistent alignmentof waveforms (Shearer, 1997). This procedure is expres-sed in matrix notation as
d ¼ Gm ð1Þwhere the vector d contains the preliminary timepickings and the correlation- derived inter-event timedifferences; G is an auxiliary matrix, and m is a vectorcontaining the adjusted first arrivals. For the specificcase of a cluster formed by 4 events, the above equationis written explicitly as:
T1T2T3T4
DT12DT13DT14DT23DT24DT34
2666666666666664
3777777777777775
¼
1 0 0 00 1 0 00 0 1 00 0 0 11 −1 0 01 0 −1 01 0 0 −10 1 −1 00 1 0 −10 0 1 −1
2666666666666664
3777777777777775
d
t1t2t3t4
2664
3775 ð2Þ
where Ti is the preliminary P-wave arrival for event i,and Δij is the time difference between events i and jderived from correlation analysis. We seek a modelvector m, containing the adjusted estimates of arrivaltimes t, that minimizes d−Gm. This is solved using aweighted generalised inverse:
m ¼ ðGT dWdGÞ−1GT dWdd ð3Þwhere the matrix W contains weights associated withthe quality of both the preliminary picks and timedifference estimates. We assigned an unitary weight toall the preliminary picks, while weighting the inter-event delay times by the respective correlation coeffi-cient cij using the relationship (Got et al., 1994):
Wij ¼c2ij
1−c2ijð4Þ
Since the number of differential time estimates isgenerally much larger than that of the preliminary timepickings, the arrival times derived from Eq. (3) providea consistent alignment of waveforms, but the signal's
Please cite this article as: Saccorotti, G. et al. Analysis of sustained long(2006), doi:10.1016/j.jvolgeores.2006.10.008
TEDPR
OOF
onsets are not necessarily correct. As a last step,therefore, we derived absolute time pickings bycorrecting the adjusted arrival times for the visually-estimated onset of the stacked waveforms (Fig. 11;Rowe et al., 2004).
For the location procedure, we used a non-linear,probabilistic inversion (Tarantola and Vallette, 1982)acting on reciprocal travel-times calculated using finite-difference for the 3D heterogenous P-wave velocitystructure of Patanè et al. (2002). In our approach, wefirst located the stacked event, and then used theresiduals from this location as station terms for thesubsequent location of the entire selected catalogue. Inthis manner, the systematic errors due to our incompleteknowledge of the earth structure are eliminated, whilehigh precision in the relative positions of individualhypocenters is ensured by the previously-obtained least-square adjustment of first arrivals.
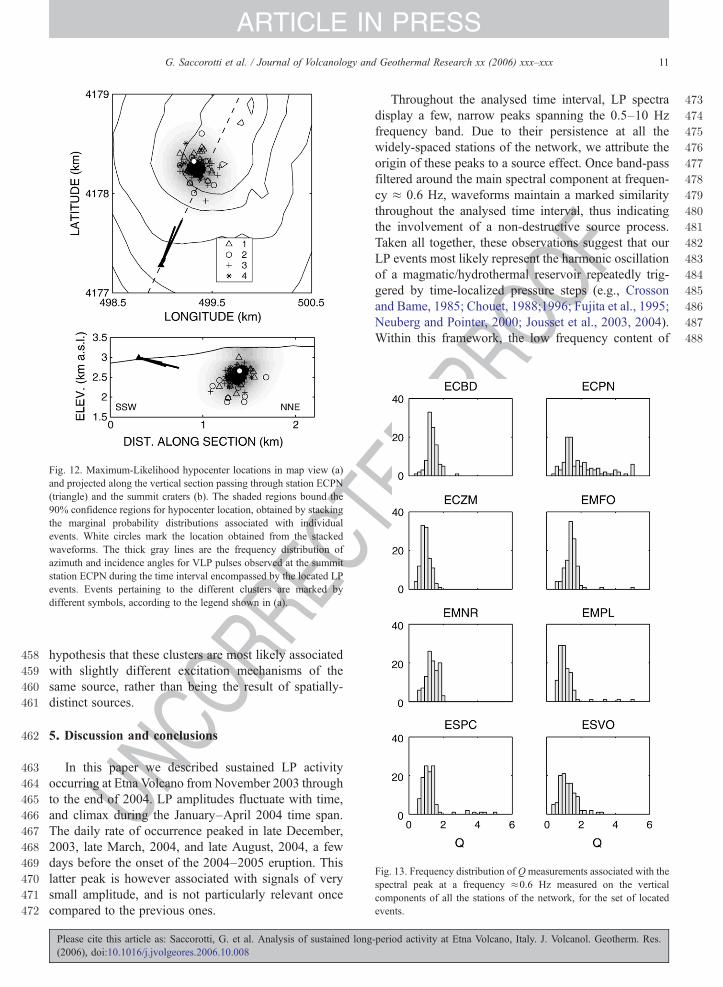
Fig. 12 displays the final locations, compared withthe particle motion attributes for the VLP oscillationsmeasured at summit station ECPN. In agreement withthe similarity of waveforms, all the hypocenters aretightly clustered in a small volume extending betweenthe surface and ≈800 m beneath the summit craters.Once accounting for the uncertainties in the hypocenterdeterminations, the source region of LP events thusappear to be slightly shallower than the VLP source, ifone assumes the latter one to be located along thecrater's axis. It is worth noting that events initiallyassociated with the different clusters do not display anysystematic location pattern. This supports the initial
-period activity at Etna Volcano, Italy. J. Volcanol. Geotherm. Res.
ECTEDPR
O458
459
460
461
462
463
464
465
466
467
468
469
470
471
472
473
474
475
476
477
478
479
480
481
482
483
484
485
486
487
488
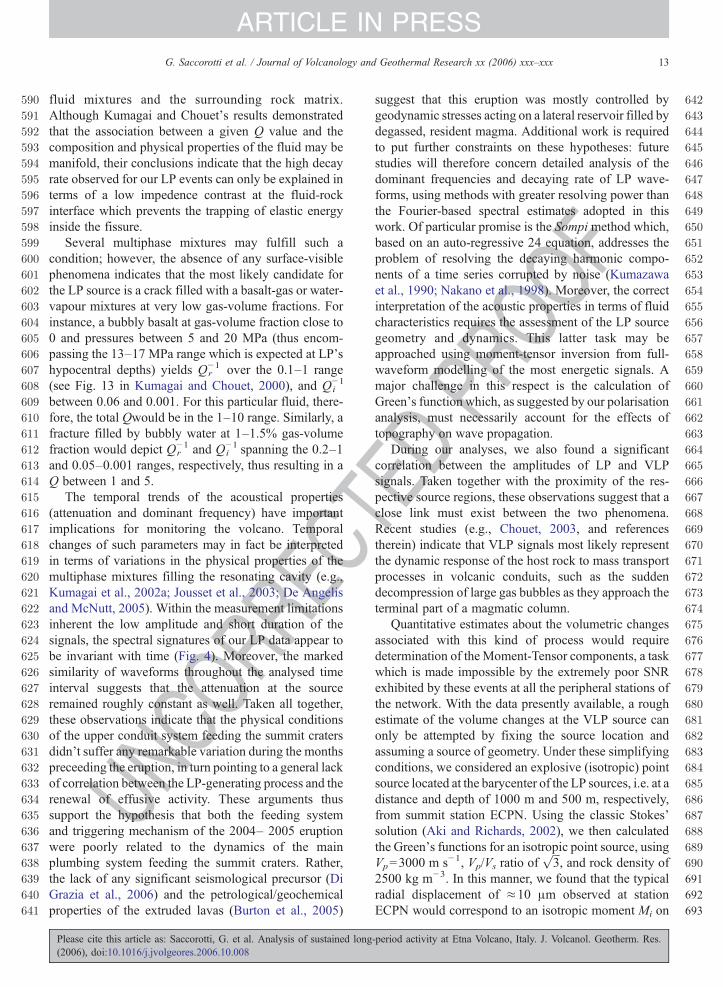
Fig. 13. Frequency distribution of Qmeasurements associated with thespectral peak at a frequency ≈0.6 Hz measured on the verticalcomponents of all the stations of the network, for the set of locatedevents.
Fig. 12. Maximum-Likelihood hypocenter locations in map view (a)and projected along the vertical section passing through station ECPN(triangle) and the summit craters (b). The shaded regions bound the90% confidence regions for hypocenter location, obtained by stackingthe marginal probability distributions associated with individualevents. White circles mark the location obtained from the stackedwaveforms. The thick gray lines are the frequency distribution ofazimuth and incidence angles for VLP pulses observed at the summitstation ECPN during the time interval encompassed by the located LPevents. Events pertaining to the different clusters are marked bydifferent symbols, according to the legend shown in (a).
11G. Saccorotti et al. / Journal of Volcanology and Geothermal Research xx (2006) xxx–xxx
ARTICLE IN PRESS
UNCO
RRhypothesis that these clusters are most likely associatedwith slightly different excitation mechanisms of thesame source, rather than being the result of spatially-distinct sources.
5. Discussion and conclusions
In this paper we described sustained LP activityoccurring at Etna Volcano from November 2003 throughto the end of 2004. LP amplitudes fluctuate with time,and climax during the January–April 2004 time span.The daily rate of occurrence peaked in late December,2003, late March, 2004, and late August, 2004, a fewdays before the onset of the 2004–2005 eruption. Thislatter peak is however associated with signals of verysmall amplitude, and is not particularly relevant oncecompared to the previous ones.
Please cite this article as: Saccorotti, G. et al. Analysis of sustained long(2006), doi:10.1016/j.jvolgeores.2006.10.008
OF
Throughout the analysed time interval, LP spectradisplay a few, narrow peaks spanning the 0.5–10 Hzfrequency band. Due to their persistence at all thewidely-spaced stations of the network, we attribute theorigin of these peaks to a source effect. Once band-passfiltered around the main spectral component at frequen-cy ≈ 0.6 Hz, waveforms maintain a marked similaritythroughout the analysed time interval, thus indicatingthe involvement of a non-destructive source process.Taken all together, these observations suggest that ourLP events most likely represent the harmonic oscillationof a magmatic/hydrothermal reservoir repeatedly trig-gered by time-localized pressure steps (e.g., Crossonand Bame, 1985; Chouet, 1988;1996; Fujita et al., 1995;Neuberg and Pointer, 2000; Jousset et al., 2003, 2004).Within this framework, the low frequency content of
-period activity at Etna Volcano, Italy. J. Volcanol. Geotherm. Res.

489
490
491
492
493
494
495
496
497
498
499
500
501
502
503
504
505
506
507
508
509
510
511
512
513
514
515
516
517
518
519
520
521
522
523
524
525
526
527
528
529
530
531
532
533
534
535
536
537
538
539
540
541
542
543
544
545
546
547
548
549
550
551
552
553
554
555
556
557
558
559
560
561
562563564565566567568569570571572573574575576577578579580581
582
583
584
585
586
587
588
589
12 G. Saccorotti et al. / Journal of Volcanology and Geothermal Research xx (2006) xxx–xxx
ARTICLE IN PRESS
UNCO
RREC
these signals would be indicative of the existence ofinterface waves generated at the fluid-rock boundary.
Previous studies of tremor and LP suggested thatboth events represented the response of the same sourceto different excitation mechanisms. For instance, Chouetet al. (1997) analysed tremor and LP explosion-quakesat Stromboli Volcano, Italy, and found that both signalsdepicted several common spectral peaks. Neuberg andPointer (2000) analysed LP and tremor from LaSoufriere Volcano, Montserrat, and observed that LPsignals occur in swarms, occasionally merging in tremorepisodes characterised by harmonic spectral linesshifting with time. Neuberg and Pointer (2000) modeledthis observation by simulating tremor signals as theregular, repeated activation of the LP source atconsecutive time intervals. Thus, at both Stromboliand La Soufriere volcanoes, LPs and tremor appear toshare the same source process, and would represent theresponse of the same resonator to transient or repeatedexcitation mechanisms, respectively.
In contrast, the spectral analyses presented for ourEtna data do not depict any common peak between LPand tremor spectra. Moreover, detailed time-frequencyanalyses (not shown here) indicate that the tremor-LPtransition is marked by an abrupt change of the spectralsignature, without any evidence of shifting spectral lines.These observations thus suggest that, during the periodof our observations, LPs and tremor at Etna originatedfrom two distinct source processes and/or locations.Corroborating this hypothesis are the results from arecent study by Di Grazia et al. (2006), who retrievedtremor locations at Etna throughout the year 2004. Forthe period relevant to the present work (early April,2004) the tremor sources imaged by Di Grazia et al.(2006) are clustered beneath the summit craters, atelevations around 1600 m (see their Fig. 2), and thusconsiderably deeper than the source centroid of our LPsignals. These observations thus point to a complexplumbing system, where different portions of the summitconduits' network are affected by different dynamicalprocesses, thus generating distinct classes of signals.
The quantitative investigation about the geometryand dynamics of the LP source requires a definition ofthe time-history of the Moment-Tensor and Single-Force components via full-waveform modelling of thesignals (e.g., Kumagai et al., 2002b; Nakano et al.,2003; Kumagai et al., 2005). Some of the observationspresented above, however, already give hints about thegeometry of the LP source. LP models have beenproposed accounting for spherical (e.g., Crosson andBame, 1985; Fujita et al., 1995) or cylindrical (Chouet,1985) geometries. The large amount of shear energy,
Please cite this article as: Saccorotti, G. et al. Analysis of sustained long(2006), doi:10.1016/j.jvolgeores.2006.10.008
TEDPR
OOF
and the non-isotropic radiation pattern observed duringour polarisation analysis can be explained, however,only by invoking a crack-like geometry (Chouet, 1988),as it is the only source geometry which is able togenerate a significant amount of shear waves. Chouet(1988) showed that the fluid-filled crack generates avery slow wave, that he called the crack wave, whichleads to more realistic estimates of the size of theresonator than those associated with the sphericalgeometry. Moreover, the crack-like geometry is alsoappropriate for mass transport conditions beneath avolcano. Under this perspective, the unevenly-spacedpeaks observed in our LP spectra would be represen-tative of the different longitudinal and transverse modesof vibration of the crack.
Following the resonating-fracture hypothesis, hintsabout the composition and physical properties of thefluid contained in the crack may be gained throughexamination of the quality factor Q of the resonator,that we measure from LP spectral estimates using therelationship:
Q ¼ fDf
ð5Þ
where f is the frequency corresponding to a givenspectral peak and Δf is the width of that peak at half thepeak's magnitude. We applied Eq. (5) to the dominantpeak at a frequency ≈0.6 Hz separately to the threecomponents of motion for the set of located events,obtaining similar results. Therefore, in Fig. 13 we onlyshow results for the vertical component. All the stationsof the network yield consistent results, with distributionsof Q peaked at values around. This value is significantlysmaller than those observed at other volcanoes. Qestimates from the literature span in fact the 10–500range, the lower and upper bounds being associated withLPs observed at Kilauea volcano, Hawaii (Kumagai etal., 2005) and Galeras volcano, Colombia (Kumagai andChouet, 1999). The quality factor is made up by twoterms: Q−1 =Q−1
i +Q−1r , where Q−1
i expresses theintrinsic attenuation in the fluid, and Q−1
r refers toenergy losses at the fluid-rock interface.
Using Chouet's (1988) crack model, Kumagai andChouet (1999, 2000) performed a detailed investigationof the acoustic properties of a fluid-filled fracture undera variety of fluid and rock-matrix properties, in turnexamining (Kumagai and Chouet, 2001) the dependenceof such properties on the crack geometry and vibrationmodes. These studies demonstrated that the wide rangespanned by Q measurements may be explained in termsof the different physical properties of the multiphase
-period activity at Etna Volcano, Italy. J. Volcanol. Geotherm. Res.
590
591
592
593
594
595
596
597
598
599
600
601
602
603
604
605
606
607
608
609
610
611
612
613
614
615
616
617
618
619
620
621
622
623
624
625
626
627
628
629
630
631
632
633
634
635
636
637
638
639
640
641
642
643
644
645
646
647
648
649
650
651
652
653
654
655
656
657
658
659
660
661
662
663
664
665
666
667
668
669
670
671
672
673
674
675
676
677
678
679
680
681
682
683
684
685
686
687
688
689
690
691692693
13G. Saccorotti et al. / Journal of Volcanology and Geothermal Research xx (2006) xxx–xxx
ARTICLE IN PRESS
UNCO
RREC
fluid mixtures and the surrounding rock matrix.Although Kumagai and Chouet's results demonstratedthat the association between a given Q value and thecomposition and physical properties of the fluid may bemanifold, their conclusions indicate that the high decayrate observed for our LP events can only be explained interms of a low impedence contrast at the fluid-rockinterface which prevents the trapping of elastic energyinside the fissure.
Several multiphase mixtures may fulfill such acondition; however, the absence of any surface-visiblephenomena indicates that the most likely candidate forthe LP source is a crack filled with a basalt-gas or water-vapour mixtures at very low gas-volume fractions. Forinstance, a bubbly basalt at gas-volume fraction close to0 and pressures between 5 and 20 MPa (thus encom-passing the 13–17 MPa range which is expected at LP'shypocentral depths) yields Q−1
r over the 0.1–1 range(see Fig. 13 in Kumagai and Chouet, 2000), and Q−1
i
between 0.06 and 0.001. For this particular fluid, there-fore, the total Qwould be in the 1–10 range. Similarly, afracture filled by bubbly water at 1–1.5% gas-volumefraction would depict Q−1
r and Q−1i spanning the 0.2–1
and 0.05–0.001 ranges, respectively, thus resulting in aQ between 1 and 5.
The temporal trends of the acoustical properties(attenuation and dominant frequency) have importantimplications for monitoring the volcano. Temporalchanges of such parameters may in fact be interpretedin terms of variations in the physical properties of themultiphase mixtures filling the resonating cavity (e.g.,Kumagai et al., 2002a; Jousset et al., 2003; De Angelisand McNutt, 2005). Within the measurement limitationsinherent the low amplitude and short duration of thesignals, the spectral signatures of our LP data appear tobe invariant with time (Fig. 4). Moreover, the markedsimilarity of waveforms throughout the analysed timeinterval suggests that the attenuation at the sourceremained roughly constant as well. Taken all together,these observations indicate that the physical conditionsof the upper conduit system feeding the summit cratersdidn't suffer any remarkable variation during the monthspreceeding the eruption, in turn pointing to a general lackof correlation between the LP-generating process and therenewal of effusive activity. These arguments thussupport the hypothesis that both the feeding systemand triggering mechanism of the 2004– 2005 eruptionwere poorly related to the dynamics of the mainplumbing system feeding the summit craters. Rather,the lack of any significant seismological precursor (DiGrazia et al., 2006) and the petrological/geochemicalproperties of the extruded lavas (Burton et al., 2005)
Please cite this article as: Saccorotti, G. et al. Analysis of sustained long(2006), doi:10.1016/j.jvolgeores.2006.10.008
TEDPR
OOF
suggest that this eruption was mostly controlled bygeodynamic stresses acting on a lateral reservoir filled bydegassed, resident magma. Additional work is requiredto put further constraints on these hypotheses: futurestudies will therefore concern detailed analysis of thedominant frequencies and decaying rate of LP wave-forms, using methods with greater resolving power thanthe Fourier-based spectral estimates adopted in thiswork. Of particular promise is the Sompimethod which,based on an auto-regressive 24 equation, addresses theproblem of resolving the decaying harmonic compo-nents of a time series corrupted by noise (Kumazawaet al., 1990; Nakano et al., 1998). Moreover, the correctinterpretation of the acoustic properties in terms of fluidcharacteristics requires the assessment of the LP sourcegeometry and dynamics. This latter task may beapproached using moment-tensor inversion from full-waveform modelling of the most energetic signals. Amajor challenge in this respect is the calculation ofGreen's function which, as suggested by our polarisationanalysis, must necessarily account for the effects oftopography on wave propagation.
During our analyses, we also found a significantcorrelation between the amplitudes of LP and VLPsignals. Taken together with the proximity of the res-pective source regions, these observations suggest that aclose link must exist between the two phenomena.Recent studies (e.g., Chouet, 2003, and referencestherein) indicate that VLP signals most likely representthe dynamic response of the host rock to mass transportprocesses in volcanic conduits, such as the suddendecompression of large gas bubbles as they approach theterminal part of a magmatic column.
Quantitative estimates about the volumetric changesassociated with this kind of process would requiredetermination of the Moment-Tensor components, a taskwhich is made impossible by the extremely poor SNRexhibited by these events at all the peripheral stations ofthe network. With the data presently available, a roughestimate of the volume changes at the VLP source canonly be attempted by fixing the source location andassuming a source of geometry. Under these simplifyingconditions, we considered an explosive (isotropic) pointsource located at the barycenter of the LP sources, i.e. at adistance and depth of 1000 m and 500 m, respectively,from summit station ECPN. Using the classic Stokes'solution (Aki and Richards, 2002), we then calculatedthe Green's functions for an isotropic point source, usingVp=3000 m s−1, Vp/Vs ratio of
ffiffiffi3
p, and rock density of
2500 kg m−3. In this manner, we found that the typicalradial displacement of ≈10 μm observed at stationECPN would correspond to an isotropic moment Mi on
-period activity at Etna Volcano, Italy. J. Volcanol. Geotherm. Res.
694695696
697698699700701702703704705706707708709710711712713714
715
716
717
718
719
720
721
722
723
724
725
726
727
728
729
730
731
732
733
734
735
736
737
738
739
740
741
742
743
744
745
746
747
748
749750751752753754755756757758759760761762763764765766767768769770771772773774775776777778779780781782783784785786787788789790791792793794795796797798799
14 G. Saccorotti et al. / Journal of Volcanology and Geothermal Research xx (2006) xxx–xxx
ARTICLE IN PRESS
UNCO
RREC
the order of ≈4×10¹² Nm. The isotropic moment isrelated to the volume change ΔV at the source by therelationship (Aki and Richards, 2002):
Mi ¼ DV ðkþ 2lÞ ð6Þ
where λ and μ are Lame's elastic coefficients. Assumingλ=2 μ, and μ=7.5 GPa, from the above relationship weobtain a ΔV on the order of 1.5×10² m3. This value issmaller than, but comparable to, the≈200m3 volumetricchanges associated with Strombolian explosions atStromboli volcano (Chouet, 2003). Our estimates thusreinforce the hypothesis that the weak VLP eventsobserved at Etna could actually be representative of amass-transport process involving the movement andassociated decompression of gas slugs as they approachthe terminal part of the magmatic column. Under thisperspective, the injection of these fluids into anoverlying cavity filled by either magmatic or hydrother-mal fluids at poor gas volume fraction would drive theperiodic pressurisation steps of such a shallow reservoir,thus triggering its resonant, LP oscillations.
In a previous work, Falsaperla et al. (2002) performeda detailed study of LP swarms occurred during the 1991–1993 eruption of Mt. Etna. These swarms weretemporally correlated with episodic collapses of the NEcrater floor, and originated in a region located slightlyeast of the NE crater, extending from the surface to adepth of 2000 m. These events depicted narrow spectralpeaks spanning the 1–5 Hz frequency range, and fairlylow quality factors (Q=13–18). Falsaperla et al. (2002)used these features to develop a fluid-filled crack modelof the source, in turn postulating that the locus of LPevents was most likely associated with a dyke connect-ing the NE crater to a depressurizing magma body.Falsaperla et al. (2002) postulated that the repeatedcollapse of the overlaying crater floor could haveinduced the transient pressurisations of that dyke, thustriggering its resonant, LP oscillations.
These past results, and the ones presented in thiswork, provide two interesting case studies demonstrat-ing the variety of dynamical processes acting as sourceof LP seismic waves. The quantitative assessment ofthese processes thus represent a fundamental steptoward a better understanding of volcanic systems, inturn constituting a critical improvement in our ability tosuccessfully forecast eruptive activity.
Acknowledgments
The paper benefited from many thoughtful commentsby P. Jousset and 4 anonymous reviewers. Luciano
Please cite this article as: Saccorotti, G. et al. Analysis of sustained long(2006), doi:10.1016/j.jvolgeores.2006.10.008
Zuccarello is greatly acknowledged for his constanthelping hand during the data retrieval procedure. Thiswork was financed 6 by the INGV-Department for CivilProtection and EU 6th framework project 7 VOLUME.Ivan Lokmer is supported by the EU 6th frameworkMarie Curie 8 RTN, SPICE.
TEDPR
OOFReferences
Aki, K., Richards, P.G., 2002. Quantitative Seismology, second ed.University Science Books, Sausalito (CA). 700 pp.
Arciniega-Ceballos, A., Valdes-Gonzalez, C., Dawson, P., 2000.Temporal and spectral characteristics of seismicity observed atPopocatepetl volcano, central Mexico. J. Volcanol. Geotherm. Res.102, 207–216.
Burton, M.R., Neri, M., Andronico, D., Branca, S., Caltabiano, T.,Calvari, S., Corsaro, R.A., Del Carlo, P., Lanzafame, G., Lodato, L.,Miraglia, L., Salerno, G., Spampinato, L., 2005. Etna 2004–2005:an archetype for geodynamically-controlled effusive eruptions.Geophys. Res. Lett. 32 (L09303). doi:10.1029/2005GL022527.
Chouet, B.A., 1985. Excitation of a buried magmatic pipe: a seismicsourcemodel for volcanic tremor. J. Geophys. Res. 90, 1881–1893.
Chouet, B.A., 1988. Resonance of a fluid-driven crack: radiationproperties and implications for the source of long-period eventsand harmonic tremor. J. Geophys. Res. 93, 4375–4400.
Chouet, B.A., 1996. Long-Period volcano seismicity: its source anduse in eruption forecasting. Nature 380, 309–316.
Chouet, B.A., 2003. Volcano Seismology. PAGEOPH 160, 739–788.Chouet, B.A., Page, R.A., Stephens, C.D., Lahr, J.C., Power, J.A.,
1994. Precursory swarms of long-period events at RedoubtVolcano (1989–1990), Alaska: their origin and use as a forecastingtool. J. Volcanol. Geotherm. Res. 62, 95–135.
Chouet, B.A., Saccorotti, G., Martini, M., Dawson, P.B., De Luca, G.,Milana, G., Scarpa, R., 1997. Source and path effects in thewavefields of tremor and explosions at Stromboli volcano, Italy.J. Geophys. Res. 102, 15129–15150.
Chouet, B.A., Saccorotti, G., Dawson, P., Martini, M., Scarpa, R., DeLuca, G., Milana,M., Cattaneo,M., 1999. Broadband measurementsof the sources of explosions at Stromboli Volcano, Italy. Geophys.Res. Lett. 26 (13), 1937–1940. doi:10.1029/1999GL900400.
Crosson, R.S., Bame, D.A., 1985. A spherical source model for low-frequency volcanic earthquakes. J. Geophys. Res. 90, 10237–10247.
De Angelis, S., McNutt, S.R., 2005. Degassing and hydrothermalactivity at Mt. Spurr, Alaska during the summer of 2004 inferredfrom the complex frequencies of long-period events. Geophys.Res. Lett. 32 (L12312). doi:10.1029/2005GL022618.
Di Grazia, G., Falsaperla, S., Langer, H., 2006. Volcanic tremorlocation during the 2004 Mt. Etna lava effusion. Geophys. Res.Lett. 33 (L04304). doi:10.1029/2005GL025177. Di Grazia, G.,Falsaperla, S., Langer, H., 2006. Volcanic tremor location duringthe 2004 Mount Etna lava effusion. Geophys. Res. Lett. 33.
Falsaperla, S., Privitera, E., Chouet, B.A., Dawson, P.B., 2002.Analysis of long-period events recorded at Mt. Etna (Italy) in 1992,and their relationship to eruptive activity. J. Volcanol. Geotherm.Res. 114, 419–440.
Fujita, E., Ida, Y., Oikawa, J., 1995. Eigen oscillation of a fluid sphereand source mechanism of harmonic volcanic tremor. J. Volcanol.Geotherm. Res. 69, 365–378.
Gil Cruz, F., Chouet, B.A., 1997. Long-Period events: the mostcharacteristic seismicity accompanying the emplacement and
-period activity at Etna Volcano, Italy. J. Volcanol. Geotherm. Res.
800801802803804805806807808809810811812813814815816817818819820821822823824825826827828829830831832833834835836837838839840841842843844845846847848849850851
852853854855856857858859860861862863864865866867868869870871872873874875876877878879880881882883884885886887888889890891892893894895896897898899900
901
902
15G. Saccorotti et al. / Journal of Volcanology and Geothermal Research xx (2006) xxx–xxx
ARTICLE IN PRESS
CORR
EC
extrusion of a lava dome in Galeras Volcano, Colombia, in 1991.J. Volcanol. Geotherm. Res. 77, 121–158.
Got, J.L., Frechet, J., Klein, F.W., 1994. Deep fault geometry inferredfrom multiplet relative relocation beneath the South flank ofKilauea. J. Geophys. Res. 99, 15375–15386.
Hagerty, M., Benites, R., 2003. Tornillos beneath Tongariro Volcano,New Zealand. J. Volcanol. Geotherm. Res. 125, 151–169.
Hellweg, M., 1999. Seismic signals from Lascar Volcano. J. SouthAm. Earth Sci. 12, 123–133.
Ibañez, J.M., Del Pezzo, E., Almendros, J., La Rocca, M., Alguacil, G.,Ortiz, R., García, A., 2000. Seismovolcanic signals at DeceptionIsland volcano, Antarctica: wave field analysis and source modeling.J. Geophys. Res. 105, 13905–13932.
Jousset, P., Neuberg, J., Sturton, S., 2003. Modelling the time-dependent frequency content of low-frequency volcanic earth-quakes. J. Volcanol. Geotherm. Res. 128, 201–223.
Jousset, P., Neuberg, J., Jolly, A., 2004. Modelling low-frequencyvolcanic earthquakes. In a visco-elastic medium with topography.Geophys. J. Int. 159, 776–802.
Kanasewich, E.R., 1981. Time sequence Analysis in Geophysics.University of Alberta Press, Edmonton, pp. 1–532.
Kumagai, H., Chouet, B.A., 1999. The complex frequencies of long-period seismic events as probes of fluid composition beneathvolcanoes. Geophys. J. Int. 138, F7–F12.
Kumagai, H., Chouet, B.A., 2000. Acoustic properties of a crackcontaining magnetic or hydrothermal fluids. J. Geophys. Res. 105,25493–25512.
Kumagai, H., Chouet, B.A., 2001. The dependence of acoustic propertiesof a crack on the resonance mode and geometry. Geophys. Res. Lett.28, 3325–3328.
Kumagai, H., Chouet, B.A., Nakano, M., 2002a. Temporal evolutionof a hydrothermal system in Kusasutsu-Shirane Volcano, Japan,inferred from the complex frequencies of long-period events.J. Geophys. Res. 107 (2236). doi:10.1029/2001JB000653.
Kumagai, H., Chouet, B.A., Nakano, M., 2002b. Waveform inversionof oscillatory signatures in long-period events beneath volcanoes.J. Geophys. Res. 107 (2301). doi:10.1029/2001JB001704.
Kumagai, H., Chouet, B.A., Dawson, P.B., 2005. Source process of along period event at Kilauea volcano, Hawaii. Geophys. J. Int. 161,243–254.
Kumazawa, M., Ymanishi, Y., Fukao, Y., Furumoto, M., Yamamoto, Y.,1990. A theory of spectral analysis based on the characteristicproperty of a linear dynamic system. Geophys. J. Int. 101, 613–630.
Lesage, P., Glangeaud, F., Mars, J., 2002. Applications of autore-gressive models and time-frequency analysis to the study ofvolcanic tremor and long period events. J. Volcanol. Geotherm.Res. 114, 391–417.
Matsubara, W., Yomogida, M., 2004. Source process of low-frequencyearthquakes associated with the 2000 eruption of Mt. Usu.J. Volcanol. Geotherm. Res. 134, 223–240.
Nakano, M., Kumagai, H., Kumazawa, M., Yamaoka, K., Chouet, B.A.,1998. The excitation and characteristic frequency of the long-period
UN
Please cite this article as: Saccorotti, G. et al. Analysis of sustained long(2006), doi:10.1016/j.jvolgeores.2006.10.008
TEDPR
OOF
volcanic event: an approach based on an inhomogeneous auto-regressive model of a linear dynamic system. J. Geophys. Res. 103,10031–10046.
Nakano, M., Kumagai, H., Chouet, B.A., 2003. Source mechanism oflong period events at Kusatsu-Shirane Volcano, Japan, inferredfrom waveform in version of effective excitation functions.J. Volcanol. Geotherm. Res. 122, 149–164.
Neuberg, J., Pointer, T., 2000. Effects of volcano topography onseismic broadband waveforms. Geophys. J. Int. 143, 239–248.
Neuberg, J., Luckett, R., Ripepe, M., Braun, T., 1994. Highlights froma seismic broadband array on Stromboli Volcano. Geophys. Res.Lett. 21, 749–752.
Neuberg, J., Baptie, B., Luckett, R., Stewart, R., 1998. Results fromthe broad-band seismic network on Montserrat. Geophys. Res.Lett. 25, 3661–3664.
O'Brien, G.S., Bean, C.J., 2004. A 3D discrete numerical elastic latticemethod for seismic wave propagation in heterogeneous media withtopography. Geophys. Res. Lett. 31 (L14608). doi:10.1029/2004GL020069.
Ohminato, T., Chouet, B.A., 1997. A free-surface boundary conditionfor including 3D topography in the finite-difference method. Bull.Seismol. Soc. Am. 87, 494–515.
Patanè, D., Chiarabba, C., Cocina, O., De Gori, P., Moretti, M.,Boschi, E., 2002. Tomographic images and 3D earthquakelocations of the seismic swarm preceding the 2001 Mt. Etnaeruption: evidence for a dyke intrusion. Geophys. Res. Lett. 29(10). doi:10.1029/2001GL014391.
Petersen, T., Caplan-Auerbach, J., McNutt, S.R., 2006. Sustained longperiod seismicity at Shishaldin Volcano, Alaska. J. Volcanol.Geotherm. Res. 151, 365–381.
Press, W., Teukolsky, S.A., Vetterling, W.T., Flannery, B.P., 1992.Numerical Recipes. Cambridge Academic Press.
Ripperger, J., Igel, H., Wassermann, J., 2003. Seismic wave simulationin the presence of real volcano topography. J. Volcanol. Geoterm.Res. 128, 31–44.
Rowe, C.A., Aster, R.C., Kyle, P.R., Schlue, J.W., Dibble, R.R., 1998.Broadband recording of Strombolian explosions and associatedvery-long-period seismic signals on Mount Erebus Volcano, RossIsland, Antarctica. Geophys. Res. Lett. 25, 2297–2300.
Rowe, C.A., Thurber, C.H., White, R.A., 2004. Dome growth behaviorat Soufriere Hills Volcano, Montserrat, revealed by relocation ofvolcanic event swarms, 1995–1996. J. Volcanol. Geotherm. Res.134, 199–221.
Shearer, P.M., 1997. Improving local earthquake locations using theL1-norm and waveform cross-correlation: application to theWhittier Narrows, California, aftershock sequence. J. Geophys.Res. 102, 8269–8283.
Tarantola,A.,Vallette, B., 1982. Inverse problem= quest for information.J. Geophys. 50, 159–170.
-period activity at Etna Volcano, Italy. J. Volcanol. Geotherm. Res.
Copyright © 2022 FDOKUMEN