Attenuation and Source Parameters of Shallow Microearthquakes at Mt. Etna Volcano, Italy
Upload
independentCategory
view
3download
0
Accepted Manuscript
Title: Temperature-dependent viscoelastic modeling of grounddeformation: Application to Etna volcano during the1993-1997 inflation period
Authors: Ciro Del Negro, Gilda Currenti, Danila Scandura
PII: S0031-9201(08)00308-7DOI: doi:10.1016/j.pepi.2008.10.019Reference: PEPI 5088
To appear in: Physics of the Earth and Planetary Interiors
Received date: 7-3-2008Revised date: 1-7-2008Accepted date: 15-10-2008
Please cite this article as: Del Negro, C., Currenti, G., Scandura, D., Temperature-dependent viscoelastic modeling of ground deformation: Application to Etna volcanoduring the 1993-1997 inflation period, Physics of the Earth and Planetary Interiors(2008), doi:10.1016/j.pepi.2008.10.019
This is a PDF file of an unedited manuscript that has been accepted for publication.As a service to our customers we are providing this early version of the manuscript.The manuscript will undergo copyediting, typesetting, and review of the resulting proofbefore it is published in its final form. Please note that during the production processerrors may be discovered which could affect the content, and all legal disclaimers thatapply to the journal pertain.
peer
-005
3218
4, v
ersi
on 1
- 4
Nov
201
0Author manuscript, published in "Physics of the Earth and Planetary Interiors 172, 3-4 (2008) 299"
DOI : 10.1016/j.pepi.2008.10.019
Page 1 of 26
Accep
ted
Man
uscr
ipt
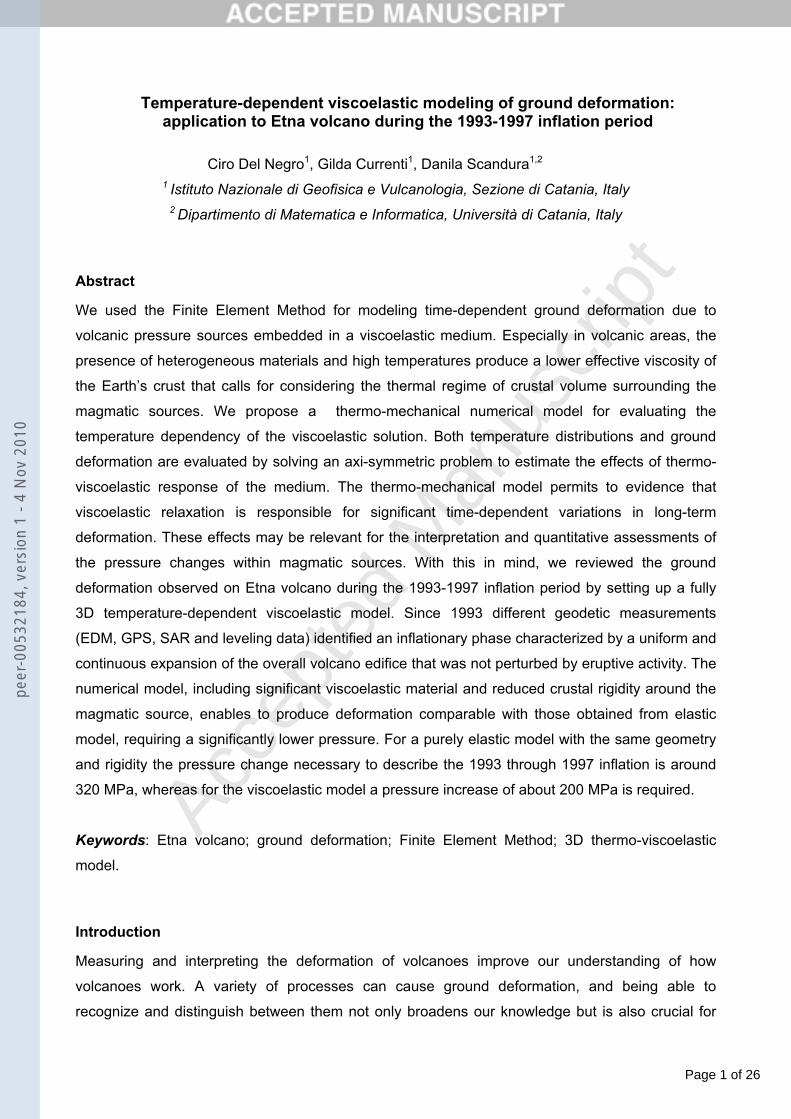
Temperature-dependent viscoelastic modeling of ground deformation: application to Etna volcano during the 1993-1997 inflation period
Ciro Del Negro1, Gilda Currenti1, Danila Scandura1,2
1 Istituto Nazionale di Geofisica e Vulcanologia, Sezione di Catania, Italy 2 Dipartimento di Matematica e Informatica, Università di Catania, Italy
Abstract
We used the Finite Element Method for modeling time-dependent ground deformation due to
volcanic pressure sources embedded in a viscoelastic medium. Especially in volcanic areas, the
presence of heterogeneous materials and high temperatures produce a lower effective viscosity of
the Earth’s crust that calls for considering the thermal regime of crustal volume surrounding the
magmatic sources. We propose a thermo-mechanical numerical model for evaluating the
temperature dependency of the viscoelastic solution. Both temperature distributions and ground
deformation are evaluated by solving an axi-symmetric problem to estimate the effects of thermo-
viscoelastic response of the medium. The thermo-mechanical model permits to evidence that
viscoelastic relaxation is responsible for significant time-dependent variations in long-term
deformation. These effects may be relevant for the interpretation and quantitative assessments of
the pressure changes within magmatic sources. With this in mind, we reviewed the ground
deformation observed on Etna volcano during the 1993-1997 inflation period by setting up a fully
3D temperature-dependent viscoelastic model. Since 1993 different geodetic measurements
(EDM, GPS, SAR and leveling data) identified an inflationary phase characterized by a uniform and
continuous expansion of the overall volcano edifice that was not perturbed by eruptive activity. The
numerical model, including significant viscoelastic material and reduced crustal rigidity around the
magmatic source, enables to produce deformation comparable with those obtained from elastic
model, requiring a significantly lower pressure. For a purely elastic model with the same geometry
and rigidity the pressure change necessary to describe the 1993 through 1997 inflation is around
320 MPa, whereas for the viscoelastic model a pressure increase of about 200 MPa is required.
Keywords: Etna volcano; ground deformation; Finite Element Method; 3D thermo-viscoelastic
model.
Introduction
Measuring and interpreting the deformation of volcanoes improve our understanding of how
volcanoes work. A variety of processes can cause ground deformation, and being able to
recognize and distinguish between them not only broadens our knowledge but is also crucial for
peer
-005
3218
4, v
ersi
on 1
- 4
Nov
201
0
Page 2 of 26
Accep
ted
Man
uscr
ipt
predicting eruptions. Notwithstanding, most volcano deformation models developed to date
assume that the Earth's crust behaves as a perfectly elastic solid and allow us to obtain only a
simple image of volcanic deformation sources. Over the last decades, elastic numerical models
have contributed to asses how medium heterogeneity and topography can influence ground
deformation especially near the volcano summit (Cayol & Cornet 1998; Williams & Wadge 2000;
Currenti et al., 2008a). All these mechanical deformation models based on an elastic rheology
assumption have been successfully and widely applied to interpret geodetic data acquired on
several volcanoes (e.g. Walsh & Decker, 1971; Yang et al., 1992; Okada and Yamamoto, 1991;
Bonaccorso & Davis, 1999; Currenti et al., 2008b). However, in many cases elastic models seem
to be unable to reproduce the observed uplifts unless unrealistic overpressures are considered
(e.g. Berrino et al. 1984). In volcanic regions, elastic rheology assumption is oftentimes an overly
simplification. The elastic approximation is generally appropriate for small deformations of crustal
materials with temperatures cooler than the brittle-ductile transition, between 300 and 500°C
depending mainly on composition and strain rate. Although elastic behavior well describes the
upper 10-15 km of the Earth's crust, in active volcanic zones viscoelastic behavior is more
appropriate to characterize the medium around the magmatic sources, which at relatively shallow
crustal levels can extensively perturb the geothermal gradient. Materials surrounding a long-lived
magmatic source are heated significantly above the brittle-ductile transition and rocks no longer
behave in a purely elastic manner, but permanently deform because of the lower effective viscosity
(Newman et al., 2001). Therefore, the thermal state of the volcanoes can greatly influence the
surface deformation field, making the elastic approximation inappropriate to model the observed
ground deformation.
Some studies on the deformation of a viscoelastic Earth were developed since 1970’s, and very
slow crustal deformations with the duration time of several days to a few years were investigated
(Peltier, 1974). The multi-layer Earth model was rather difficult to deal with analytically, however a
simpler case study was anticipated in order to describe the behavior of a viscoelastic half-space.
Bonafede et al. (1986) presented the crustal deformation due to the Mogi model in a viscoelastic
half-space and worked out analytical solutions for the displacements and associated stress fields
induced by a pressure point source. Dragoni and Magnanensi (1989) computed an analytical
model considering a spherical magma chamber in an infinite space and surrounded by a
homogeneous shell of thermal metamorphic rocks, which is elastic dilatational and Maxwell
deviatoric. Recently, Piombo et al. (2007) computed the viscoelastic effect on displacement,
displacement gradient and stress fields due to shear and tensile dislocations. Investigations were
also conducted using numerical methods, highlighting that rheological heterogeneities may be
much more important than elastic heterogeneities in the interpretation of long-term deformation
(Folch et al. 2000; Trasatti et al. 2003; Fernandez et al., 2001).
In the present study, we investigated the temporal evolution of the ground deformation caused by a
peer
-005
3218
4, v
ersi
on 1
- 4
Nov
201
0
Page 3 of 26
Accep
ted
Man
uscr
ipt
heating pressurized magma chamber embedded in a viscoelastic heterogeneous medium using
Finite Element Method (FEM). We developed a thermo-mechanical model, in which the
viscoelastic properties of the medium are derived from the computed temperature distribution.
Initially, we carried out several axi-symmetric models to appraise the influence of temperature field
on ground deformation. Next, we developed a 3D finite element model to analyze the ground
deformation accompanying the 1993-1997 inflation period on Mt Etna. The real topography of
volcanic edifice and the crustal heterogeneities inferred from the seismic tomography data were
included in the 3D model. We evaluated the effects of conductive thermal propagation on long-term
deformation in terms of viscoelastic response of the medium.
Linear Viscoelastic model
The phenomenological behavior of large classes of materials, including elasticity, linear viscosity,
and some time-effects, can be studied using analogue models. Simple viscoelastic rheologies can
be derived from extrapolations of 1D mechanical models composed of linear combinations of linear
springs with spring constant of shear modulus µ and dashpots with coefficient of viscosity η
(Currenti et al, 2008c). In such a case analytical solutions can be derived for a homogeneous half-
space model using the Correspondence Principle. The computation of the analytical solution is
useful to properly set up the numerical model and test the accuracy of the numerical solutions.
Viscoelastic material
We considered linear viscoelastic material in which the stress linearly depends on the strain and its
time derivatives. It is usually assumed that the viscous part of the deformation is incompressible,
so that the volumetric strain is completely elastic and the viscoelastic deformation may be
expressed purely in terms of deviatoric components. Therefore, the bulk modulus K=E/3(1-2υ)
behaves elastically and is simply defined in terms of Young’s modulus E and Poisson’s ratio υ. In
such a case, the rheological constitutive equation can be written as:
( ) ( )es QP = (1)
where s and e are the stress and strain deviators respectively (Ivins and Sammis, 1996). P and Q
are differential operators expressed as:
01
1
1 ... at
at
aP m
m
mm
m
m ++∂∂
+∂∂
=−
−
− (2)
01
1
1 ... bt
bt
bQ m
m
mm
m
m ++∂∂
+∂∂
=−
−
− (3)
where ai and bi come from the assumed material constants for i=0,…,m. The differential operators
are defined depending on the type of viscoelastic model. Commonly the generalized Maxwell
model is represented by a set of M Maxwell models in parallel (Fig. 1). In this case, the operator
peer
-005
3218
4, v
ersi
on 1
- 4
Nov
201
0
Page 4 of 26
Accep
ted
Man
uscr
ipt
may be written as:
∑∑==
=⎟⎠
⎞⎜⎝
⎛+=
M
ii
M
iiiqeGs
010 1,2 µµµ (4)
where the variable qi is the solution of differential equation:
eqq i
ii =+
τ1
(5)
The material is completely defined by assigning the total shear modulus G=E/2(1+υ) (which is
identical to the elastic shear modulus), the fractional shear moduli µi and the viscosity ηi for each
spring element, leading to the relaxation times τi=ηi/(Gµi). It is not necessary to specify the
fractional modulus µ0, since it is obtained by subtracting the sum of the other ratios from one. A
number of common material models may be obtained from the generalized Maxwell model by
setting the shear moduli of various springs to zero, such as the Maxwell model.
Viscoelastic analytical solution
For a linear viscoelastic material, the solution of the governing equations can be obtained
employing the Correspondence Principle (Fung 1965; Christensen 1971), which allows to solve a
linear viscoelastic problem using the associated elastic solutions, in which the elastic moduli are
replaced by the Laplace transform complex moduli. The Correspondence Principle cannot be
applied to a general thermo-viscoelastic problem, but it can be applied to thermo-rheologically
simple materials, i.e. when the temperature dependence of mechanical properties is amenable to
analytical description, and one of following conditions is satisfied: (i) the temperature field is
spatially uniform but time dependent; (ii) the temperature field has a spatial dependence but is
independent of time (Christensen, 1982). If the analytic solution for the deformation field of any
linear elastic model is given, we can apply the Correspondence Principle to the elastic solution to
obtain the viscoelastic behavior of deformation field. The Laplace transform of the viscoelastic
solution ( )sW i~ is given by:
( ) ( ) ( )sUsgsW ii~~~
= (6)
where ( )sg~ is the Laplace transform of the source time function g(s) giving the temporal evolution
of the pressure amplitude, and ( )sU i~ indicates the displacement function Ui in which the constant
moduli are replaced with their Laplace transform moduli. The Laplace transform of the shear
modulus, which depends on the particular rheology considered, can be easily obtained using Eq.
(1) as:
( )( )sPsQGs ~2
~)(~ =µ (7)
where ( )sQi~ and ( )sPi
~ are the Laplace transforms of Eqs. (2) and (3). For a generalized Maxwell
model with M Maxwell linear viscoelastic models in parallel (Fig. 1), the Laplace transform of the
peer
-005
3218
4, v
ersi
on 1
- 4
Nov
201
0
Page 5 of 26
Accep
ted
Man
uscr
ipt
shear modulus is:
∑= +
+=M
i
iiGssGs
10 1)(~
ηµ
µµ (8)
When the shear modulus has been defined and the elastic analytical solution is available, the
resulting expression in Eq. (8) must be inverted in order to obtain the viscoelastic solution for the
displacement field in the time domain.
Spherical pressure source in a viscoelastic half-space
The elastic analytical solution of a point dilatation source embedded in an elastic and
homogeneous half-space was proposed by Mogi (1958). The model well reproduces a finite
spherical source if the source depth d is twice compared to the radius a (McTigue, 1987). The
elastic displacements are described by the spherical source position, its radius a , and the
pressure change ∆P:
( ) ( ) 3
3
3
3
32432,1
3243
RdPa
KKUiwith
RxPa
KKU z
ii
∆+
+==
∆+
+=
µµµ
µµµ
(9)
where R is the radial distance from the source center to the observation point. We derive the
viscoelastic solution applying the Correspondence Principle to Eq. (9). Only the first term in Eq. (9)
(3K+4µ)/2µ(3K+µ) depends on the rheology assumption. Adopting a generalized Maxwell rheology
with one Maxwell model in parallel and using Eq. (8), the Laplace transform of the shear modulus
is given by:
ηµ
ηµµµµµ
//)()(~
1
21010
GsGGss
+++
= (10)
Since we assume that the viscous part of the deformation is incompressible, the bulk modulus
K=E/3(1-2υ) is constant. As source time history, we consider a step-like increase in pressure
amplitude at t=0 on the source wall:
( )⎩⎨⎧
≥∆
<=∆=
000
)(tPt
tHPtg (11)
where H(t) is the Heaviside function whose Laplace transform is ∆P/s.
To derive the analytical viscoelastic solution we have to multiply the second term of Eqs. (9) with
the inverse Laplace transform of the following equation:
( )( )(s)µ43K(s)µ2s
(s)µ43KsA ~~~~+
+= (12)
which is given by:
peer
-005
3218
4, v
ersi
on 1
- 4
Nov
201
0
Page 6 of 26
Accep
ted
Man
uscr
ipt
( )( )
( )( )( )
⎥⎥⎥
⎦
⎤
⎢⎢⎢
⎣
⎡
⎟⎟⎠
⎞⎜⎜⎝
⎛−−−
++−
+
+=
−+
+−
tηµµG
00
000
tG3KηµG3KµG
2
00
00
0
1000
0010
0 e1µ1µ1
G3KµG3KηeηG
3µG3Kµ4G3K
2G1A(t) (13)
For the generalized Maxwell rheology, the viscoelastic response depends on time through two
characteristic times:
000
01 τ
µG3KG3Kτ
+
+= (14)
0
02 µ
ττ = (15)
with 10 µG
ητ =0 the Maxwell time.
Numerical model
The analytical solutions of displacement field in a viscoelastic half-space were used to asses the
accuracy of the numerical solutions obtained by Finite Element Method (FEM). We assumed a
pressurized spherical source located at 4 km depth with a radius a of 0.7 km and a step-like
temporal increase in pressure of ∆P=100 MPa at t=0. The source is embedded in a homogeneous
half-space having Poisson ratio υ=0.25, total shear modulus G=30 GPa, fractional shear moduli
µ0=µ1=0.5, viscosity η=2⋅1016 Pa*s giving characteristic times τo=1.33⋅106 s, τ1=1.45⋅106 s and
τ2=2.66⋅106 s. The numerical analysis needs to set some parameters that could affect the accuracy of the
solution. In particular, the size of the computational domain and the size of the finite elements are
to be accurately chosen. The domain size is important because of the assignment of finite
boundary conditions. We assumed free displacement values at the upper surface and zero
displacement values at bottom and lateral boundaries. Since in numerical methods the size domain
is finite, these boundary conditions are implemented by considering a domain big enough that the
assumption of zero potential at the boundary does not affect the solution in the interested area.
Preliminarily, we considered a 3D axi-symmetric model. In such a case a simpler two dimensional
domain can be considered by exploiting the symmetries. Hence, the number of nodes, in which the
solution is computed, decreases significantly. This model was chosen to perform a coarser
analysis and carry out several tests to assess the goodness of numerical solutions. The FEM
model is made up of ~16000 triangular elements of variable size, in axi-symmetric configuration.
The domain extends 25 km horizontally from the source centre and 35 km below the surface, and
well reproduces the conditions generally imposed to half-space models (vanishing stresses at
infinity). Computations are carried out by using the commercial software COMSOL Multiphysics,
peer
-005
3218
4, v
ersi
on 1
- 4
Nov
201
0
Page 7 of 26
Accep
ted
Man
uscr
ipt
version 3.3 (Comsol, 2006). Benchmark tests were carried out on the axi-symmetric models in
order to verify the accuracy of the numerical solution. For the sake of simplicity, we report only the
vertical displacements but similar results are achieved for horizontal displacements. The
viscoelastic solution at t=0 coincides with the elastic solution. Subsequently, the deformation grows
exponentially approaching a finite value. The numerical deformation solution practically coincides
with the analytical ones (Fig. 2). This result allowed to validate the numerical technique used in
these computations. The ground deformation of the viscoelastic model is enhanced with respect
the elastic solution. Particularly, the ratio between the steady-state viscoelastic solution and the
elastic one is about 1.7. Therefore, the inclusion of a viscoelastic rheology significantly lowers the
pressures changes, necessary to obtain the same amount of ground deformation, from 100 MPa to
58.9 MPa. To estimate the increase in ground deformation with respect to the elastic solution, we
computed the relative misfit for the vertical displacement as:
100%U
UUE
elastic
elasticicviscoelast% ∑
∑ −= (16)
The steady-state viscoelastic solution yields a misfit E% of 71%. In order to get a more realistic
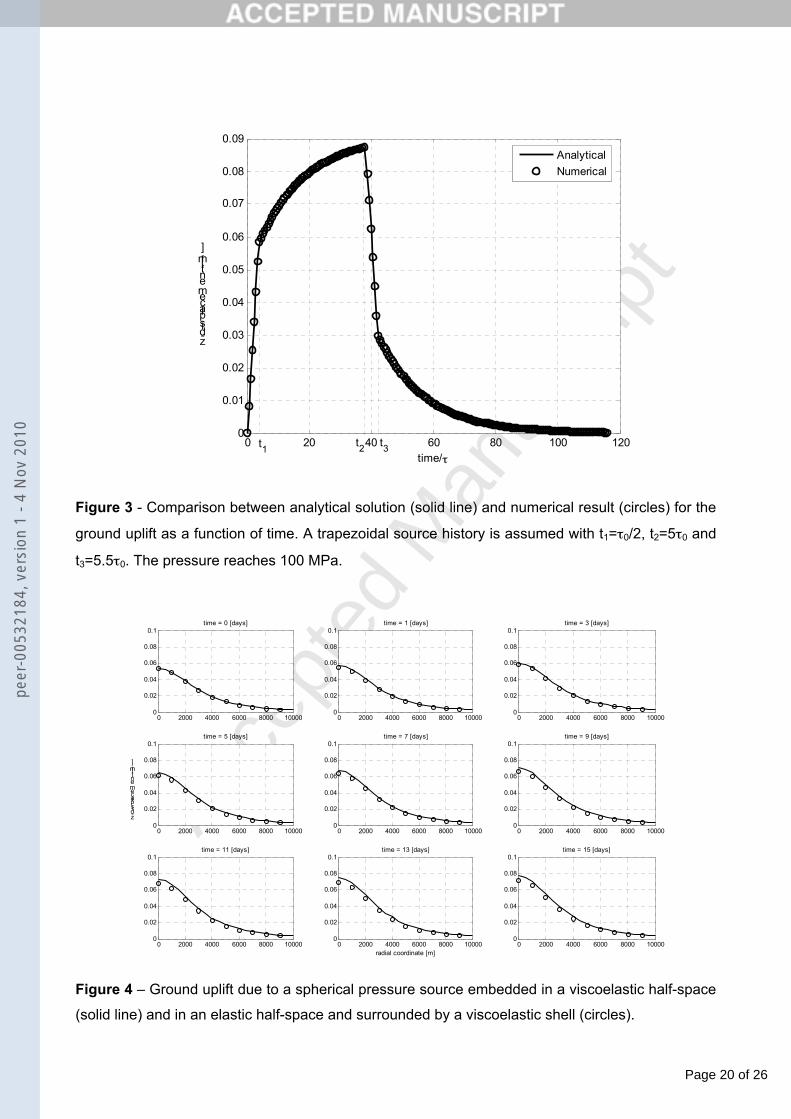
result, we used a pressure source that evolves following a trapezoidal source history instead of a
step-like source function. Trapezoidal shape function describes the pressurization followed by
depressurization of the magmatic source, usually observed in volcanic areas. The source history
increases linearly in time from 0 to ∆P for t ranging between 0 and t1, remains constant to ∆P for
t1≤ t ≤ t2, and finally decreases from ∆P to 0 for t2≤ t ≤ t3:
[ ] [ ]
⎭⎬⎫
⎩⎨⎧
−−−−−
+−−−+−−∆= )()()()()(1)( 3223
3211 ttHttH
ttttttHttHttH
ttPtgt (17)
whose Laplace transform is:
⎟⎟⎠
⎞⎜⎜⎝
⎛−−
+−∆
=−−−
2312
2311)(~ttee
te
sPsg
ststst
(18)
Following the procedure described above, we firstly derived the analytical solution and secondly
compared it with the numerical one. As shown in Fig. 3, the numerical solution is nearly identical to
the analytical one.
The assumption of a homogeneous viscoelastic half-space is too restrictive and limits the
application of the model to more realistic case study. In fact, the upper lithosphere does not
participate in viscoelastic flow due to its lower temperature. To overcome this limitation, we explore
a viscoelastic shell model in which the spherical source is embedded in an elastic half-space and
surrounded by a concentric shell of viscoelastic material. It is reasonable to assume that rocks
near the inflation source are considerably heated and weakened beyond the brittle-ductile
transition temperature, where viscoelastic rheology is more appropriate to describe the mechanical
behavior of the surrounding rocks. We supposed a viscoelastic behaviour inside the shell, while an
peer
-005
3218
4, v
ersi
on 1
- 4
Nov
201
0
Page 8 of 26
Accep
ted
Man
uscr
ipt
elastic behaviour outside it. We firstly choose a homogeneous viscoelastic shell with radius 1.7 km.
The viscoelastic medium parameters within the shell are the same as in the homogeneous half-
space model. As we can notice from Fig. 4, after the introduction of the viscoelastic shell the
surface uplift is less enhanced with respect to the previous model when the entire half-space
medium is assumed viscoelastic. The relative misfit E% is decreased to 54%. The amplitude of the
viscoelastic response is dependent on the size of the shell (Dragoni and Magnanensi, 1989): wider
the shell, higher the deformation observed at the ground surface. Both the thickness and the
viscosity of the shell are strongly influenced by the temperature state of the volcanic source.
Temperature-dependentviscoelastic solution
The spatial dependence of viscosity on temperature can be included in the model solving a thermal
model to compute the temperature field distribution. Therefore, we conducted a thermo-mechanical
model in which the viscoleastic properties of the medium are derived from the computed
temperature distribution. We simulated the model in two steps solving separately: (i) the heat
conduction equation to compute the temperature profile, and (ii) the viscoelastic problem to obtain
the numerical solution of the deformation field.
To derive the temperature profile, we numerically solved the heat conduction equations in an axial
symmetric formulation, given by:
ATk −=∇⋅∇ )( (19)
where T=T(r,z) is the temperature field, r is the radial coordinate, z is the vertical coordinate, k is
thermal conductivity, and A(z)=ASexp(-z/b) is the crustal volumetric heat production, where As is
the volumetric rate of heat production, and b is a characteristic depth of the order of 10±5 km.
Since the deformation timescales are much shorter than those over which the magma chamber
evolution takes place, the temperature distribution, and therefore the viscosity profile inside the
shell, can be considered as steady. As boundary condition at the ground surface, we assumed that
the surface is kept constant at atmospheric temperature, since the thermal conductivity of the air is
much smaller than that of the ground. At bottom and lateral boundaries we assigned the
geothermal temperature values, because they are far enough to not be affected by the magmatic
source. We used the steady-state geothermal profile given by (Ranalli, 1995; Turcotte and
Schubert, 1982):
( )z/b2
sms e1
kbA
kzqTT(z) −−⎟⎟
⎠
⎞⎜⎜⎝
⎛+⎟
⎠⎞
⎜⎝⎛+= (20)
where Ts is the surface temperature, qm is the heat flow coming from the mantle. The temperature
on the magma wall was set to T0=1000 K. Physically, this boundary condition is equivalent to
stating that the magma walls act as heat sources, simulating a continuous refilling of the magma
chamber (Dragoni et al., 1997; Civetta et al., 2004).
peer
-005
3218
4, v
ersi
on 1
- 4
Nov
201
0
Page 9 of 26
Accep
ted
Man
uscr
ipt
Starting from the temperature distribution, a variety of empirical relationships can be used to infer
the temperature-viscosity dependence. We estimated the medium viscosity surrounding the source
region using the Arrhenius formula:
⎟⎠⎞
⎜⎝⎛=RTEexpAη D (21)
where AD is the Dorn parameter, E is the activation energy, R is the Boltzmann constant, and T the
absolute temperature. Additional work is needed to define plausible values for the rheological
parameters, and determine the extent to which these parameters vary in the region of high thermal
gradients near the magma chamber. The values of the parameters used in the computations are
summarized in Table I. The viscosity inside the shell depends on the temperature distribution.
However, the thickness of the shell was kept constant at 1.7 km.
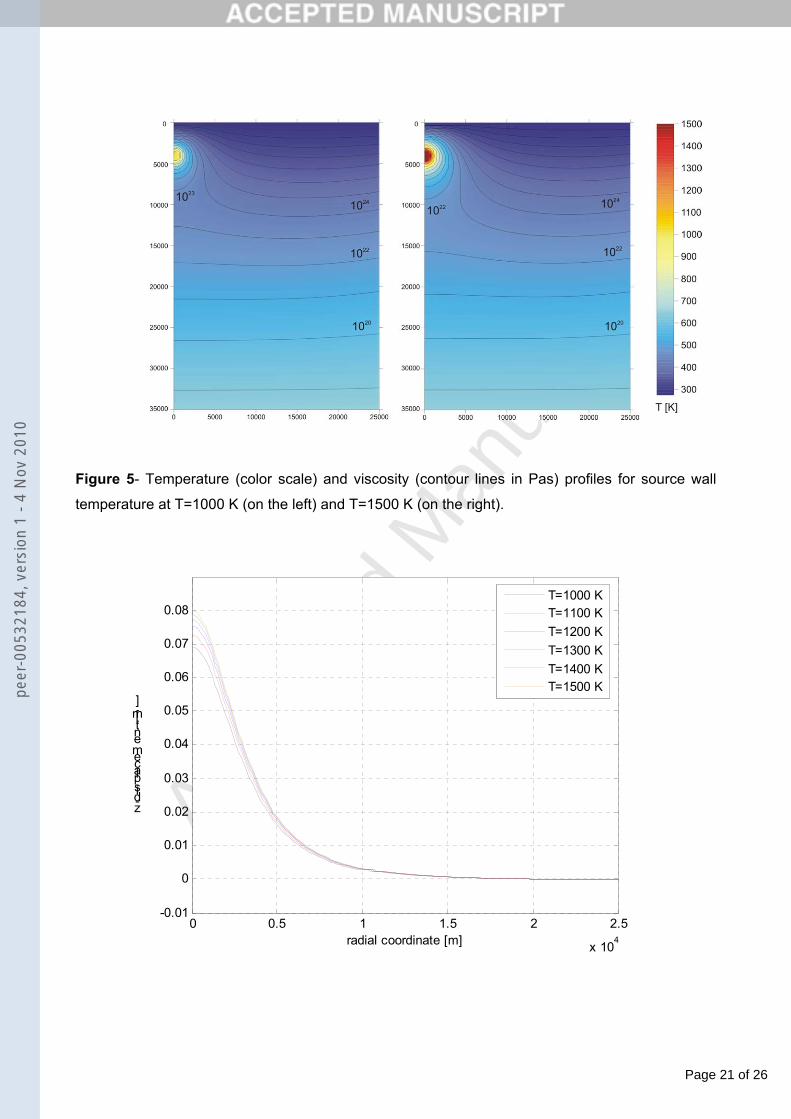
Several simulations were also conducted to investigate how the temperature of the magmatic
source affects the ground uplift. Different values of temperature in the range 1000-1500 K were
used. The steady-state temperature profiles using T=1000 K and T=1500 K at the source wall are
shown in Fig. 5 together with the estimated medium viscosity from Eq. (21). The viscosity within
the viscoelastic shell is ranging from 1015 Pas to 1020 Pas for T=1000 K, and from 1013 Pas to 1017
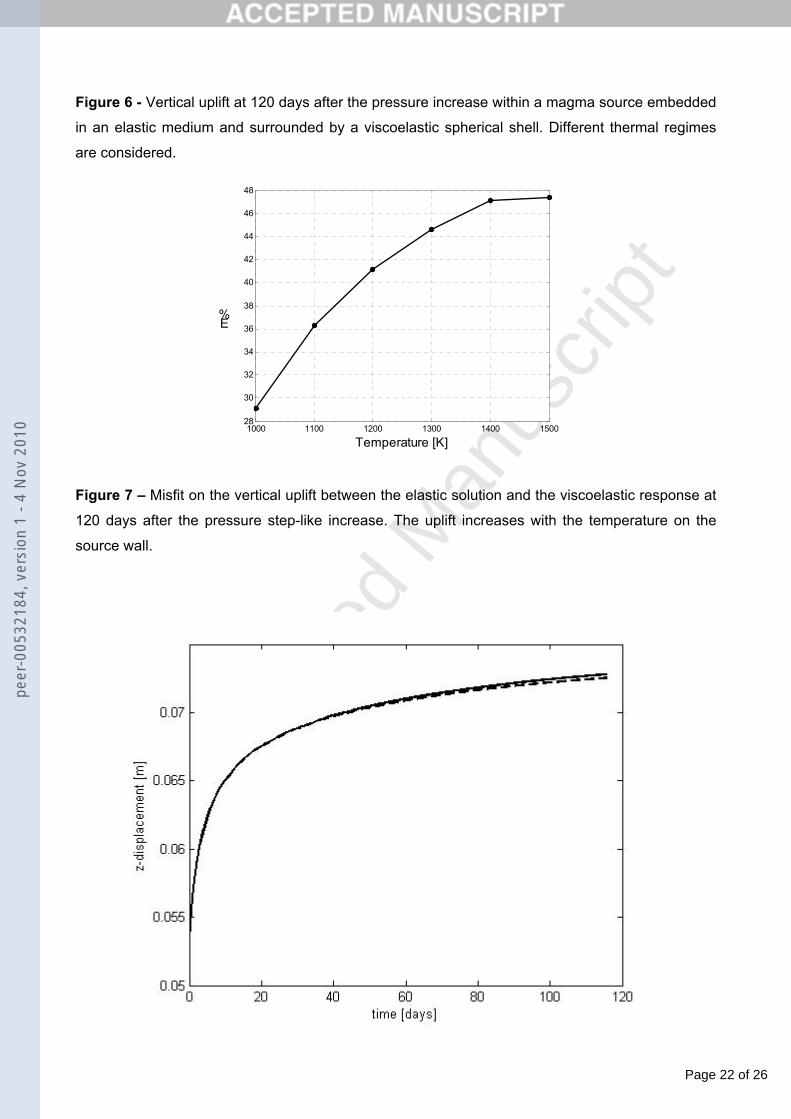
Pas for T=1500 K (Fig. 5). The amplitude of the deformation after 120 days is dependent on the
temperature profile (Fig. 6). The vertical uplift at the ground surface above the source center varies
from 6.9 cm at 1000 K to 7.9 cm at 1500 K with a relative misfit E% of 29% and 47%, respectively
(Fig. 7). However, the increase is not linearly proportional, but a saturation effect is observed for
higher temperatures. This could be ascribed to the fixed dimension of the shell and to the
exponential dependency of the viscosity on the temperature. It is reasonable to assume that the
thickness of the viscoelastic shell increases with the temperature.
The viscoelastic behaviour is appropriate around the magmatic source where the temperature is
higher. Instead of using a constant thickness for the viscoelastic spherical shell, we modified the
properties of the medium through the constitutive equations, allowing the element of the domain to
behave elastically or viscoelastically in function of the temperature distribution. We associated to
the medium elastic proprieties where the temperature values are below a fixed threshold and
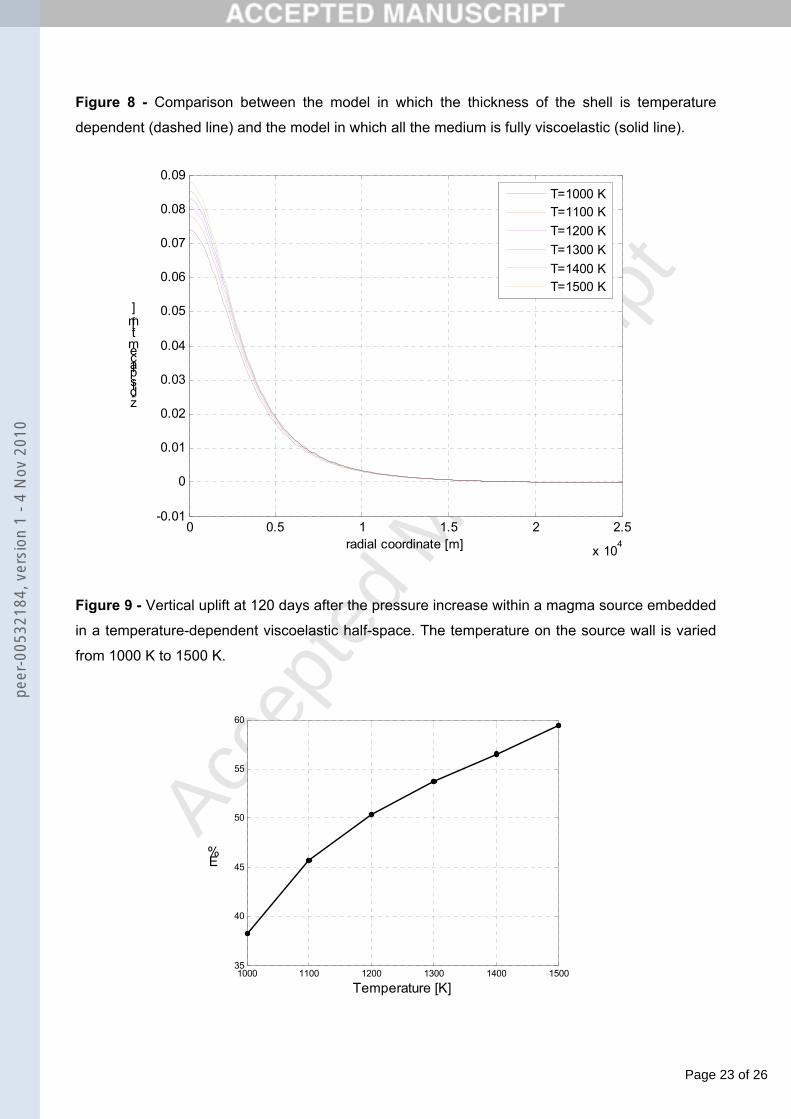
viscoelastic proprieties above this threshold. The solutions vary as a function of the threshold. We
made a comparison between this model in which the thickness of the shell is temperature
dependent and the model in which all the medium is fully viscoelastic. We observed that these
results does not differ too much using temperature threshold lower than 700 K (Fig. 8). Far away
from the source, the temperature decays, yielding a higher value of viscosity which makes the
medium to behave as elastically (Williams and Richardson, 1991). As before, the deformation
raises with temperature (Fig. 9), but no saturation phenomena are observed (Fig. 10). The vertical
uplift at the ground surface above the source center reaches, after 120 days, a deformation of 7.4
cm at 1000 K (E% = 38%) and 8.8 cm at 1500 K (E% = 59%). It is worth to note that in this case the
peer
-005
3218
4, v
ersi
on 1
- 4
Nov
201
0

Page 10 of 26
Accep
ted
Man
uscr
ipt
deformation is enhanced with respect to the case in which the viscoelastic behavior is restricted to
a fixed shell around the source. The temporal evolutions of the vertical uplift with source wall
temperature at T=1000 K and T=1500 K are shown in Fig. 11. As the temperature increases, the
viscoelasticity decreases yielding lower relaxation times (Fig. 11) and the ground deformation
raises faster. Even when the viscoelastic shell thickness is fixed (Fig. 11a), the temperature profile
affects the amount of deformation reached after the exponential increase. When the rheological
behavior of the whole surrounding medium is temperature-dependent (Fig. 11b), the region, which
behaves viscoelastically, becomes wider as the temperature increases and gives more contribution
to the viscoelastic part of the deformation field.
An application to Etna volcano
We extended the finite element method, used for the axi-symmetric model, to a fully 3D formulation
to study the long-term deformation observed at Mt Etna in 1993-1997 period. Etna is one of the
better monitored and successfully studied volcanoes in the world, where continuously running
geodetic networks are operating (Bonaccorso et al. 2004). Since 1993, different geodetic
techniques (EDM, GPS, SAR and leveling data) identified an inflation phase characterized by a
uniform expansion of the overall volcano edifice. The beginning of the inflation phase was detected
from the comparison of SAR images covering the 1993-1995 time interval. The inversion of
interferograms required the inflation from a spheroidal magmatic source located at about 5 km bsl
(Lundgren al., 2003). Also levelling data supported the presence of a pressurized spherical source
beneath the summit craters at 4.5 km bsl (Obrizzo et al., 2004). Recently, Bonaccorso et al. (2005)
interpreted the 1993-1997 GPS and EDM data by a pressurized ellipsoidal source using a
numerical elastic model. In order to reproduce the observed displacements, an effective
overpressure of about 320 MPa was needed, which is exceedingly high. The inclusion of a realistic
viscoelastic component could significantly lower the inferred pressure necessary to explain the
observed surface deformation (Newman et al., 2006). With this in mind, we reviewed the 1993-
1997 inflation phase on Mt Etna using a 3D thermo-viscoelastic numerical model. We adopt the
same ellipsoidal source determined by Bonaccorso et al. (2005), which is located 4.2 km bsl
beneath the central craters (latitude 4177.9 UTM km and longitude 500.7 UTM km). The ellipsoid
has a semi-major axis of 1854 m and the other two semi-axes of 725 m and 544 m, respectively
with an orientation angle of 124° and a dip angle of 77°. In the numerical model we also included
the rheological heterogeneities of the medium. Instead of using a simple multi-layered crustal
rigidity model, a complex distribution of rheological medium properties was considered (Currenti et
al., 2007). We used P-wave and S-wave seismic velocities, inferred from recent seismic
tomography studies (Chiarabba et al., 2000; Patanè et al., 2006), to derive the elastic medium
parameters. Particularly, the Young modulus was estimated by using the following equation
peer
-005
3218
4, v
ersi
on 1
- 4
Nov
201
0

Page 11 of 26
Accep
ted
Man
uscr
ipt
(Kearey and Brooks, 1991):
( )νρ += 12 2sVE (22)
where Vs is the seismic S-wave propagation velocity, and ρ is the density of the medium which was
fixed to 2500 kg/m3. Instead, the values of Poisson ratio were obtained using the equation (Kearey
and Brooks, 1991)
]2)/(2/[]2)/[( 22 −−= spsp VVVVν (23)
where Vp is the seismic P-wave propagation velocity. On the basis of Eqs. (22) and (23), the
Young modulus varies from 11.5 GPa to 133 GPa, while the Poisson ratio is in the range 0.12-
0.32.
The 3D model drastically increases the computational load. In this case, no symmetries can be
exploited and the number of elements and nodes hugely increases. The procedure for computing
the viscoelastic deformation field is the same as for the previous axi-symmetric model. The
computational domain was set up to a large volume extending 100x100x100 km3 in order to avoid
artifacts in the numerical solution because of the proximity of the boundary. The mesh of the
ground surface was generated using a digital elevation model of Etna volcano from the 90 m
Shuttle Radar Topography Mission (SRTM) data. The computational domain was represented by
number of 20000 arbitrarily distorted tetrahedral elements connected by 4000 nodes. The mesh
resolution is about 100 m around the ellipsoidal source, about 300 m in the area surrounding the
volcano edifice, and decreases to 2 km in the far field. Firstly, we solved the conductive heat
transfer equation. As thermal boundary condition, a steady-state geothermal profile was set up
along the bottom and lateral boundaries. A vertical geothermal gradient of 22 °C/km was assumed
for the areas surrounding the volcano edifice in agreement with the temperature measurements
carried out in deep boreholes (AGIP, 1977). A continuous refilling of the magma chamber was
simulated by setting the temperature on the ellipsoidal source wall. We performed two simulations
using T=1000 K and T=1500 K to understand the role played by the temperature values on the
source wall. The temperature profile was used to compute the viscoelasticity of the overall domain.
Then, we solved the mechanical viscoleastic model using the computational scheme described in
the axi-symmetric model. The comparison between the elastic solutions and the viscoelastic
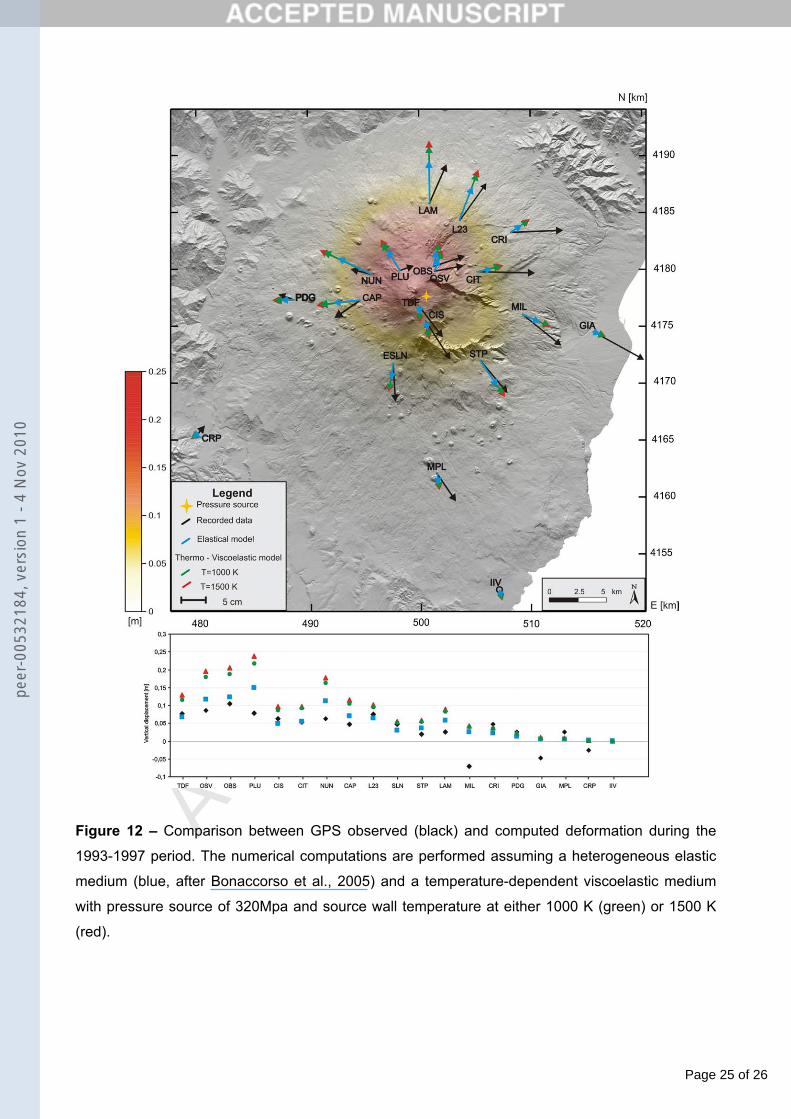
response after about 3 years and half are shown in Fig. 12.
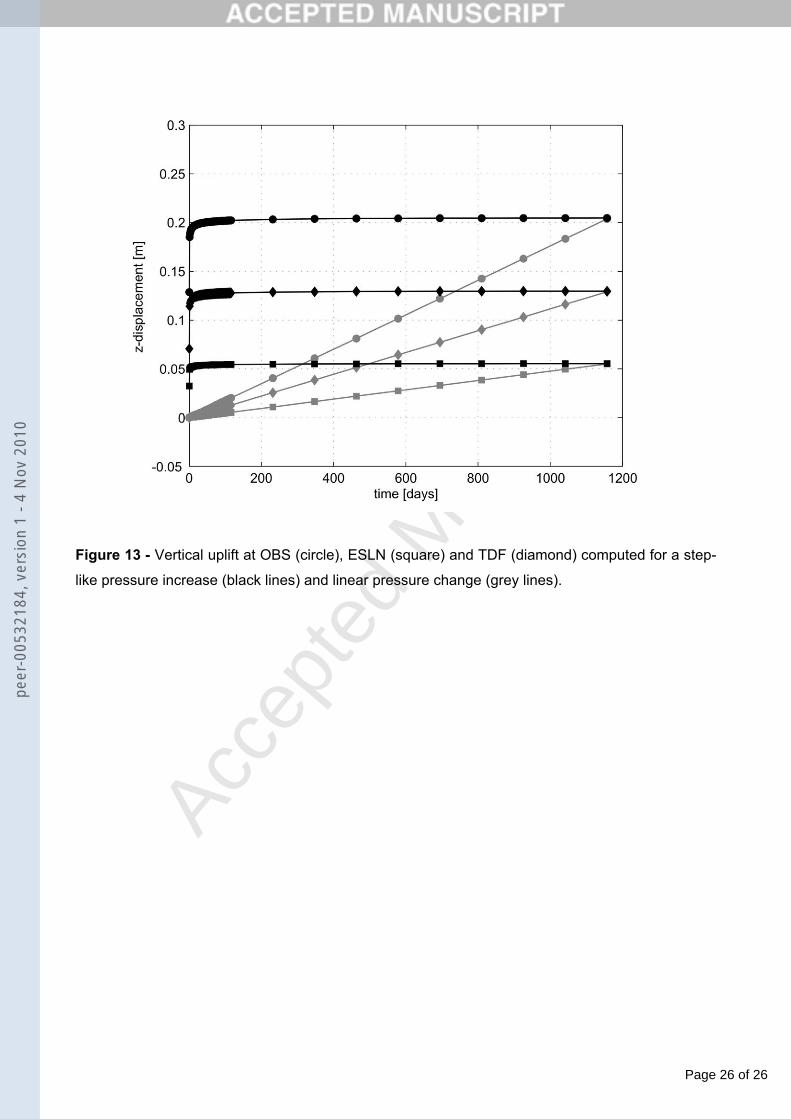
Two other simulations were carried out. In the first one we assumed a step-like pressure change,
in the second one we assumed a linear pressure increase in order to simulate the continuous
inflation phase of the pressurized magmatic source. The pressure source evolves like a ramp
function from 0 MPa to 320 MPa during 1993-1997 with a increment of 90 MPa/year. Even if the
temporal evolution is very different, the final uplift is quite similar (Fig. 13). Therefore, a comparison
with the temporal evolution of real data could allow for distinguishing between them. In Bonaccorso
et al. 2005, no temporal evolution of ground deformation data was shown. However, a cumulative
peer
-005
3218
4, v
ersi
on 1
- 4
Nov
201
0
Page 12 of 26
Accep
ted
Man
uscr
ipt
planar areal dilatation was computed for the Etna networks. Since a fairly continuous expansion
seems to affect the volcanic edifice starting from 1993 to 1997, we can better consider a
continuous linear feeding rate of the pressure source.
The relative misfit with respect to the elastic solution at the ground surface is 55% for a wall
temperature of T=1000 K and 66% for T=1500 K. Both the horizontal and vertical deformation in
the viscoelastic solution are enhanced of about 1.6 in comparison with the elastic solution.
Therefore, the temperature-dependent viscoelastic model requires a lower pressure changes
(~200 MPa) that is nearer to the lithostatic load (~170 MPa), but still higher than the crustal
strength (~45 MPa).
Discussion and Conclusions
Numerical models have been carried out to investigate the temporal evolution of viscoelastic
deformation caused by pressure changes within a magmatic source. The presence of viscoelastic
material, which likely characterizes the crust around magmatic sources, greatly alters the
deformation field. We found out that the ground uplift grows in time and its temporal evolution is
mainly dependent on the average rigidity and viscosity of the medium surrounding the source.
Initially, we assumed a spherical source embedded in a homogeneous viscoelastic half-space
model with a generalized Maxwell rheology. In this simple case, we derived the analytical
viscoelastic solution applying the Correspondence Principle. It allowed to compare the numerical
solution with the analytical one to verify the accuracy of the numerical method. The homogeneity
assumption is an overlay simplification that was overcome with the introduction of a viscoelastic
spherical shell around the magmatic source and an elastic medium outside it. However, the
thickness and the viscosity of the spherical shell depend on the magma temperature and the
thermal state of the surrounding rocks. The definition of elastic\anelastic rock properties cannot
disregard the thermal regime of the crust especially in volcanic regions. To this aim, we examined
the effect of magma source temperature on viscoelastic deformation implementing a thermo-
mechanical model. The simulations evidenced that the thermal state of the crust influences both
the temporal evolution of deformation field, in terms of relaxation time, and the amplitudes of the
steady-state ground deformation.
Successively, we extended the procedure to a fully 3D model to investigate the effects of
viscoelastic rheologies surrounding a pressurized prolate spheroid source during the inflation
period of time-dependent deformation occurred at Mt Etna between 1993 and 1997. This period of
increasing pressurization of the plumbing system was not perturbed by eruptive activity, which
resumed afterward in 1998 from the summit craters (Bonaccorso et al., 2005). The viscoelastic
model enables to produce deformation comparable with those obtained from elastic model,
requiring a significantly lower pressure. For a purely elastic model with the same geometry and
rigidity the pressure change necessary to describe the 1993 through 1997 inflation is around 320
peer
-005
3218
4, v
ersi
on 1
- 4
Nov
201
0
Page 13 of 26
Accep
ted
Man
uscr
ipt
MPa, whereas for the viscoelastic model a pressure increase of about 200 MPa is required.
Nevertheless, the pressure change is still high. Since no eruption had occurred, the overall
pressure change should remain below the lithostatic load. Assessing source pressure is essential
for improving the knowledge of the physics of volcano deformation and eruption hazard. Because
of the strict link between crustal rigidity and source pressure, a lack of insight into the rheology can
increase the uncertainty on source volumes and associated pressures (Newman et al., 2001).
Moreover, Trasatti et al. (2007) showed that the presence of heterogeneities strongly modify the
position of the pressure sources inferred by numerical inversion. Therefore, the rheology
assumption strongly affects the estimates of both pressure and position.
In order to validate thermal and mechanical numerical models it is necessary to have a more
complete overall picture of the thermal state and the elastic/anelastic rock properties in the crust of
Mt Etna. The medium heterogeneity, estimated from the 3D velocity model, can be significantly
affected by: (i) the low spatial resolution of 3 km in the tomography model by Chiarabba et al.
(2000), (ii) the variation of 3D velocity model in the analyzed period, (iii) the difference between the
static elastic modulus and the dynamic elastic modulus deduced from the P-wave velocity. Patanè
et al. (2006) obtained new 3D velocity models at higher resolution on Mt Etna, detecting significant
variations in the elastic parameters during different volcanic cycles. A correction factor of 0.7 can
be used to account for the difference between the static and dynamic moduli at confining pressure
of about 100 MPa. That would also contribute to a proportional decrease in the source pressure to
140 MPa. Therefore, the inclusion of significant viscoelastic material and lower crustal rigidity near
a magmatic source, which is geologically expected, can considerably reduce the pressure
necessary to produce the observed surface deformation.
The thermal parameters involved in the thermo-mechanical model can be better constrained using
temperature data, when available, and seismic attenuation tomography. The study of attenuation of
seismic waves can provide a more realistic image of the thermal regime in the upper crust inside
the Mt Etna. Laboratory measurements in the seismic frequency range indicate an exponential
Arrhenius-law type increase of intrinsic attenuation with the temperature of the rocks (Kampfmann
and Berckemer, 1985). Several recent works (Arevalo et al., 2005; De Gori et al., 2005; Patanè et
al., 2006) have shown that the imaging of Vp/Vs and quality factor Qp could be useful tools to
define location and extension of melt or highly fractured materials accompanying the volcanic
activity at Mt Etna. On the west of the high rigidity body recognized beneath the South-East flank of
Etna volcano, De Gori et al. (2005) hypothesized a shallow broad region of low Qp hot fluids, which
is in agreement with the location of the estimated ellipsoidal source. With the inclusion of
temperature distribution coming from local temperature T and Qp relationship, we will be capable
of performing more realistic numerical simulations.
peer
-005
3218
4, v
ersi
on 1
- 4
Nov
201
0
Page 14 of 26
Accep
ted
Man
uscr
ipt
ACKNOWLEDGMENTS
This study was undertaken with financial support from the ETNA project (DPC-INGV 2004–2006
contract) and the VOLUME project (European Commission FP6-2004-Global-3). This work was
developed in the frame of the TecnoLab, the Laboratory for the Technological Advance in Volcano
Geophysics organized by DIEES-UNICT and INGV-CT. We are grateful to Giuliano Cammarata
and Giuseppe Petrone from Catania University for making available the computational resources to
perform the computations of the 3D numerical model. We thank the editor Mark Jellinek, Michele
Dragoni and an anonymous reviewer for their useful comments on this paper.
References
AGIP S.p.A., 1977. Temperature sotterranee. Grafiche Fili Brugora, Milano, p. 1390.
Arevalo, C. M., Patanè, D., Rietbrock, A., Ibanez, J. M., 2005. The intrusive process leading to the
Mt. Etna 2001 flank eruption: Constraints from 3-D attenuation tomography. Geophys. Res.
Lett., 32, doi:10.1029/2005GL023736.
Berrino G., Corrado G., Luongo G., Toro B., 1984, Ground Deformation and Gravity Changes
Accompanying the 1982 Pozzuoli Uplift. Bull. Volcanol. 47-2, 187-200.
Bonaccorso, A., Davis, P. M., 1999. Models of ground deformationfrom vertical volcanic conduits
with application to eruptions of Mount St. Helens and Mount Etna. Geophys. Res. L ett.,
104(B5), 10531–10542.
Bonaccorso, A., Davis, P. M., 2004. Modeling of ground deformation associated with recent lateral
eruptions: Mechanics of magma ascent and intermediate storage at Mt. Etna, in Mount Etna
Volcano Laboratory. Vol. 143, edited by A. Bonaccorso, S. Calvari, M. Coltelli, C. D. Negro,
and S. Falsaperla, p. 384, American Geophysical Union Monography Series.
Bonaccorso, A., Cianetti, S., Giunchi, C., Trasatti, E., Bonafede, M. Boschi E., 2005. Analytical and
3D numerical modeling of Mt. Etna (Italy) volcano inflation. Geophys. J. Int., 163, 852-862.
Bonafede, M., Dragoni, M., Quareni, F., 1986. Displacement and stress fields produced by a centre
of dilatation and by a pressure source in a viscoelastic half-space:application to the study of
round deformation and seismic activity at Campi Flegrei, Italy. Geophys. J. R. astr. Soc., 87,
455-485.
Cayol, V., Cornet, F.H., 1998. Effects of topography on the inter pretation of the deformation field
of prominent volcanoes, Application to Etna. Geophys. Res. Lett., 25, 1979–1982.
Chiarabba, C., Amato, A., Boschi, E., Barberi, F., 2000. Recent seismicity and tomographic
modeling of the Mount Etna plumbing system. J. Geophys. Res., 105, 10923-10938.
Christensen, R. M., 1971. Theory of Viscoelasticity: An Introduction. Academic Press, New York.
Christensen, R. M., 1982. Theory of viscoelasticity: An introduction. pp. 364 , Academic San Diego
Calif.
Comsol Multiphysics 3.3, 2006. Comsol AB, Stockholm, Sweden.
peer
-005
3218
4, v
ersi
on 1
- 4
Nov
201
0
Page 15 of 26
Accep
ted
Man
uscr
ipt
Civetta, L., D’Antonio, M., De Lorenzo, S., Di Renzo, V., Gasparini, P., 2004. Thermal and
geochemical constraints on the ‘deep’ magmatic structure of Mt. Vesuvius. J. Volcanol.
Geotherm. Res., 133, 1-12.
Currenti, G., Del Negro, C., Ganci, G., 2007. Modelling of ground deformation and gravity fields
using finite element method: an application to Etna volcano. Geophys. J. Int., doi:
10.1111/j.1365-246X.2007.03380.x.
Currenti, G., Del Negro, C., Ganci, G., Scandura, D., 2008a. 3D numerical deformation model of
the intrusive event forerunning the 2001 Etna eruption. Phys. Earth Planet. Interiors,
doi:10.1016/j.pepi.2008.05.004
Currenti, G., Del Negro, C., Ganci, G., Williams, C.A., 2008b. Static stress changes induced by the
magmatic intrusions during the 2002-2003 Etna eruption, submitted to J. Geophys. Res.
Currenti, G., Del Negro, C., Sasai, Y., 2008c. Time dependent piezomagnetic fields in viscoelastic
medium, Geophys. J. Int., 172, 536–548 doi:10.1111/j.1365-246X.2007.03679.x.
De Gori, P., C. Chiarabba, D. Patanè, 2005. Qp structure of Mt. Etna: constraints for the physics of
the plumbing system. J. Geophys. Res., 110, doi:10.1029/2003JB002875.
Dragoni, M. and Magnanensi, C., 1989. Displacement and stress produced by a pressurized,
spherical magma chamber, surrounded by a viscoelastic shell Phys.Earth Planet. Interiors, 56,
316-328.
Dragoni, M., Harabaglia, P, Mongelli, F., 1997. Stress Field at a Transcurrent Plate Boundary in
the Presence of Frictional Heat Production at Depth. Pure appl. geophys., 150, 181-201.
Fernández, J., Tiampo, K. F., Rundle, J. B., 2001. Viscoelastic displacement and gravity changes
due to point magmatic intrusions in a gravitational layerd solid earth. Geophys. J. Int., 146,
155-170.
Folch, A., Fernàndez, J., Rundle, J. B., Martì, J., 2000. Ground deformation in a viscoelastic
medium composed of a layer overlying a half-space: a comparison between point and
extended sources. Geophys. J. Int., 140, 37-50.
Fung, Y.C., 1965. Foundations of solid Mechanics, Prentice-Hall, Englewood Cliffs.
Kampfmann, W., Berckemer, H., 1985. High temperature experiments on the elastic and anelastic
behaviour of magmatic rocks. Phys. Earth Planet. Interiors 40, 223–247.
Kearey, P. Brooks, M., 1991. An introduction to geophysical exploration. Second edition. Blackwell
Scientific Publications, Oxford, pp. 254.
Ivins, E. R., Sammis, C. G., 1996. Transient creep of a composite lower crust, J. Geophys. Res.,
101(B12), 27981-28004.
Lundgren, P., P. Berardino, M. Coltelli, G. Fornaro, R. Lanari, G. Puglisi, E. Sansosti, M. Tesauro
(2003), Coupled magma chamber inflation and sector collapse slip observed with synthetic
aperture radar interferometry on Mt. Etna volcano. J. Geophys. Res., 108(B5), 2247,
doi:10.1029/2001JB000657.
peer
-005
3218
4, v
ersi
on 1
- 4
Nov
201
0
Page 16 of 26
Accep
ted
Man
uscr
ipt
McTigue, D.F., 1987. Elastic stress and deformation near a finite spherical magma body: resolution
of the point source paradox. J. Geophys. Res., 92, 12 931–12 940.
Mogi, K., 1958. Relations between the eruptions of various volcanoes and the deformations of the
ground surfaces around them. Bull. Earthq. Res. Inst., Univ. Tokyo, 36, 99-134.
Newman, A. V., T. Dixon, G. Ofoegbu, J. Dixon, 2001. Geodetic data constraints on recent activity
at Long Valley Caldera, California: evidence for viscoelastic rheology. J. Volcan.Geoth.Res.,
105, 183–206.
Newman, A. V., Dixon, T. H., Gourmelen N., 2006. A four-dimensional viscoelastic deformation
model for Long Valley Caldera, California, between 1995 and 2000, J. Volcanol. Geotherm.
Res., 150, 244-269.
Obrizzo, F., Pingue, F., Troise, C., De Natale, G., 2004. Bayesian inversion of 1994-98 vertical
displacements at Mt. Etna; evidence for magma intrusion. Geophys. J. Int., 157(2), 935–946,
doi:10.1111/j.1365- 246X.2004.02160.x.
Okada, Y., Yamamoto, Y., 1991. Dyke intrusion model for the 1989 seismovolcanic activity of Off
Ito, Central Japan. J. Geophys. Res. 96, 10361-10376.
Patanè, D., Barberi, G., Cocina, O.,De Gori, P., Chiarabba, C., 2006. Time-Resolved Seismic
Tomography Detects Magma Intrusions at Mount Etna. Science, 313, 821-823.
Peltier, W.R., 1974. The impulse response of a Maxwell earth. Rev. Geophys. Space Phys., 12,
649–669.
Piombo, A., Tallarico, A., Dragoni, M., 2007. Displacement, strain and stress fields due to shear
and tensile dislocations in a viscoelastic half-space. Geophys. J. Int., doi: 10.1111/j.1365-
246X.2007.03283.x.
Ranalli, G., 1995. Rheology of the Earth, pp. 413, Chapman and Hall, London.
Trasatti, E., C. Giunchi, M. Bonafede, 2003. Effects of topography and rheological layering on
ground deformation in volcanic regions. J.Volcanol. Geotherm. Res., 122, 89–110.
Trasatti, E., C. Giunchi, N. Piana Agostinetti, 2007. Numerical inversion of deformation caused by
pressure sources: application to Mount Etna (Italy). Geophys. J. Int., doi:10.1111/j.1365-
246X.2007.03677.x.
Turcotte, D. L. Schubert, G., 1982. Geodynamics – Applications of continuum physics to geological
problems, Wiley, New York.
Walsh, J.B., Decker, R.W., 1971. Surface deformation associated with volcanism. J. Geophys.
Res. 76, 3291-3302.
Williams, C. A., Richardson, R. M., 1991. A rheologically layered three-dimensional model of the
San Andreas fault in central and southern California. Geophys. Res. Lett., 25, 1549-1552.
Williams, C. A. Wadge, G., 2000. An accurate and efficient method for including the effects of
topography in three-dimensional elastic models of ground deformation with applications to
radar interferometry. J. Geophys. Res., 105, 103-8120.
peer
-005
3218
4, v
ersi
on 1
- 4
Nov
201
0
Page 17 of 26
Accep
ted
Man
uscr
ipt
Yang, X., Davis, P.M., Delaney, P.T., Okamura, A.T., 1992. Geodetic analysis of dike intrusion and
motion of the magma reservoir beneath the summit of Kilauea volcano, Hawaii: 1970-1985. J.
Geophys. Res. 97, 3305-3324.
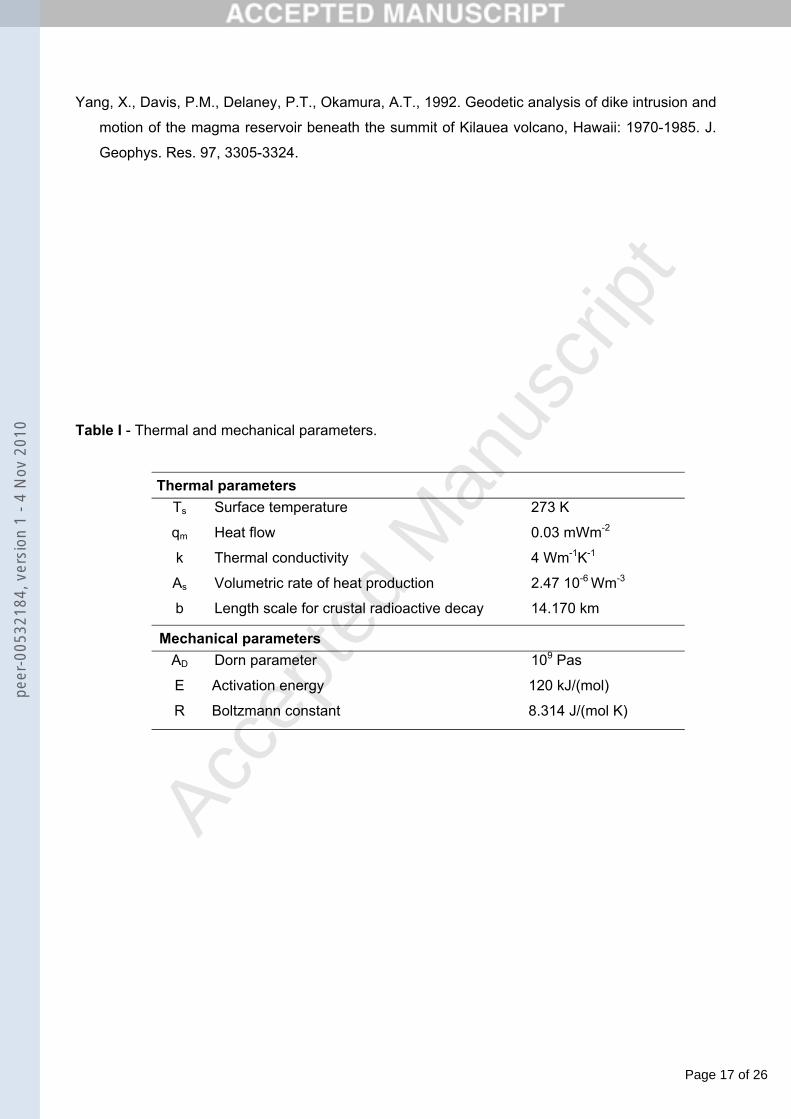
Table I - Thermal and mechanical parameters.
Thermal parameters Ts Surface temperature 273 K
qm Heat flow 0.03 mWm-2
k Thermal conductivity 4 Wm-1K-1
As Volumetric rate of heat production 2.47 10-6 Wm-3
b Length scale for crustal radioactive decay 14.170 km
Mechanical parameters AD Dorn parameter 109 Pas
E Activation energy 120 kJ/(mol)
R Boltzmann constant 8.314 J/(mol K)
peer
-005
3218
4, v
ersi
on 1
- 4
Nov
201
0
Page 18 of 26
Accep
ted
Man
uscr
ipt
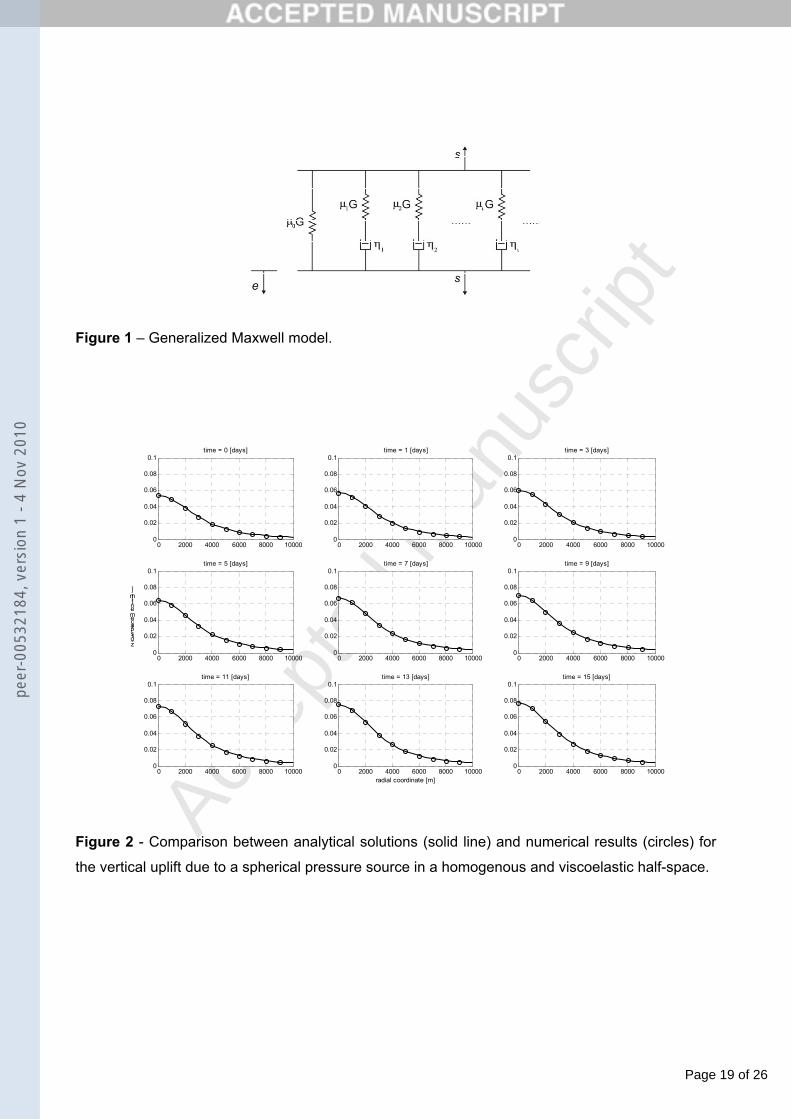
Figure Captions Figure 1 - Generalized Maxwell model.
Figure 2 - Comparison between analytical solutions (solid line) and numerical results ( circles) for
the vertical uplift due to a spherical pressure source in a homogenous and viscoelastic half-space.
Figure 3 - Comparison between analytical solution (solid line) and numerical result ( circles) for the
ground uplift as a function of time. A trapezoidal source history is assumed with t1=τ0/2, t2=5τ0 and
t3=5.5τ0. The pressure reaches 100 MPa.
Figure 4 – Ground uplift due to a spherical pressure source embedded in a viscoelastic half-space
(solid line) and in an elastic half-space and surrounded by a viscoelastic shell (circles).
Figure 5- Temperature (color scale) and viscosity (contour lines in Pas) profiles for source wall
temperature at T=1000 K (on the left) and T=1500 K (on the right). Figure 6 - Vertical uplift at 120 days after the pressure increase within a magma source embedded
in an elastic medium and surrounded by a viscoelastic spherical shell. Different thermal regimes
are considered.
Figure 7 – Misfit on the vertical uplift between the elastic solution and the viscoelastic response at
120 days after the pressure step-like increase. The uplift increases with the temperature on the
source wall.
Figure 8 - Comparison between the model in which the thickness of the shell is temperature
dependent (dashed line) and the model in which all the medium is fully viscoelastic (solid
line).Figure 9 - Vertical uplift at 120 days after the pressure increase within a magma source
embedded in a temperature-dependent viscoelastic half-space. The temperature on the source
wall is varied from 1000 K to 1500 K.
Figure 10 - Misfit on the vertical uplift between the elastic solution and the viscoelastic solution at
120 days after the pressure increases. The viscoelastic response is strongly dependent on the
temperature along the source wall.
Figure 11 – Ground uplift at r=0 as function of time. (a) The pressure source is surrounded by a
viscoelastic spherical shell and the wall temperature is T=1000 K (solid line) and T=1500 K
(dashed line). (b) The pressure source is embedded in a temperature-dependent viscoelastic half-
space and the wall temperature is T=1000 K (solid line) and to T=1500 K (dashed line). Figure 12 – Comparison between GPS observed (black) and computed deformation during the
1993-1997 period. The numerical computations are performed assuming a heterogeneous elastic
medium (blue, after Bonaccorso et al., 2005) and a temperature-dependent viscoelastic medium
with pressure source of 320 MP and source wall temperature at either 1000 K (green) or 1500 K
(red).
Figure 13 – Vertical uplift at OBS (circle), ESLN (square) and TDF (diamond) computed for a step-
like pressure increase (black lines) and linear pressure change (grey lines).
peer
-005
3218
4, v
ersi
on 1
- 4
Nov
201
0
Page 19 of 26
Accep
ted
Man
uscr
ipt
Figure 1 – Generalized Maxwell model.
0 2000 4000 6000 8000 100000
0.02
0.04
0.06
0.08
0.1time = 0 [days]
0 2000 4000 6000 8000 100000
0.02
0.04
0.06
0.08
0.1time = 1 [days]
0 2000 4000 6000 8000 100000
0.02
0.04
0.06
0.08
0.1time = 3 [days]
0 2000 4000 6000 8000 100000
0.02
0.04
0.06
0.08
0.1
z-displacement [m]
time = 5 [days]
0 2000 4000 6000 8000 100000
0.02
0.04
0.06
0.08
0.1time = 7 [days]
0 2000 4000 6000 8000 100000
0.02
0.04
0.06
0.08
0.1time = 9 [days]
0 2000 4000 6000 8000 100000
0.02
0.04
0.06
0.08
0.1time = 11 [days]
0 2000 4000 6000 8000 100000
0.02
0.04
0.06
0.08
0.1
radial coordinate [m]
time = 13 [days]
0 2000 4000 6000 8000 100000
0.02
0.04
0.06
0.08
0.1time = 15 [days]
Figure 2 - Comparison between analytical solutions (solid line) and numerical results (circles) for
the vertical uplift due to a spherical pressure source in a homogenous and viscoelastic half-space.
peer
-005
3218
4, v
ersi
on 1
- 4
Nov
201
0
Page 20 of 26
Accep
ted
Man
uscr
ipt
0 20 40 60 80 100 1200
0.01
0.02
0.03
0.04
0.05
0.06
0.07
0.08
0.09
time/τ
z-displacement [m]
AnalyticalNumerical
t1 t2 t3
Figure 3 - Comparison between analytical solution (solid line) and numerical result (circles) for the
ground uplift as a function of time. A trapezoidal source history is assumed with t1=τ0/2, t2=5τ0 and
t3=5.5τ0. The pressure reaches 100 MPa.
0 2000 4000 6000 8000 100000
0.02
0.04
0.06
0.08
0.1time = 0 [days]
0 2000 4000 6000 8000 100000
0.02
0.04
0.06
0.08
0.1time = 1 [days]
0 2000 4000 6000 8000 100000
0.02
0.04
0.06
0.08
0.1time = 3 [days]
0 2000 4000 6000 8000 100000
0.02
0.04
0.06
0.08
0.1
z-displacement [m]
time = 5 [days]
0 2000 4000 6000 8000 100000
0.02
0.04
0.06
0.08
0.1time = 7 [days]
0 2000 4000 6000 8000 100000
0.02
0.04
0.06
0.08
0.1time = 9 [days]
0 2000 4000 6000 8000 100000
0.02
0.04
0.06
0.08
0.1time = 11 [days]
0 2000 4000 6000 8000 100000
0.02
0.04
0.06
0.08
0.1
radial coordinate [m]
time = 13 [days]
0 2000 4000 6000 8000 100000
0.02
0.04
0.06
0.08
0.1time = 15 [days]
Figure 4 – Ground uplift due to a spherical pressure source embedded in a viscoelastic half-space
(solid line) and in an elastic half-space and surrounded by a viscoelastic shell (circles).
peer
-005
3218
4, v
ersi
on 1
- 4
Nov
201
0
Page 21 of 26
Accep
ted
Man
uscr
ipt
Figure 5- Temperature (color scale) and viscosity (contour lines in Pas) profiles for source wall
temperature at T=1000 K (on the left) and T=1500 K (on the right).
0 0.5 1 1.5 2 2.5
x 104
-0.01
0
0.01
0.02
0.03
0.04
0.05
0.06
0.07
0.08
radial coordinate [m]
z-displacement [m]
T=1000 KT=1100 KT=1200 KT=1300 KT=1400 KT=1500 K
peer
-005
3218
4, v
ersi
on 1
- 4
Nov
201
0
Page 22 of 26
Accep
ted
Man
uscr
ipt
Figure 6 - Vertical uplift at 120 days after the pressure increase within a magma source embedded
in an elastic medium and surrounded by a viscoelastic spherical shell. Different thermal regimes
are considered.
1000 1100 1200 1300 1400 150028
30
32
34
36
38
40
42
44
46
48
Temperature [K]
E%
Figure 7 – Misfit on the vertical uplift between the elastic solution and the viscoelastic response at
120 days after the pressure step-like increase. The uplift increases with the temperature on the
source wall.
peer
-005
3218
4, v
ersi
on 1
- 4
Nov
201
0
Page 23 of 26
Accep
ted
Man
uscr
ipt
Figure 8 - Comparison between the model in which the thickness of the shell is temperature
dependent (dashed line) and the model in which all the medium is fully viscoelastic (solid line).
0 0.5 1 1.5 2 2.5
x 104
-0.01
0
0.01
0.02
0.03
0.04
0.05
0.06
0.07
0.08
0.09
radial coordinate [m]
z-displacemt [m]
T=1000 KT=1100 KT=1200 KT=1300 KT=1400 KT=1500 K
Figure 9 - Vertical uplift at 120 days after the pressure increase within a magma source embedded
in a temperature-dependent viscoelastic half-space. The temperature on the source wall is varied
from 1000 K to 1500 K.
1000 1100 1200 1300 1400 150035
40
45
50
55
60
Temperature [K]
E%
peer
-005
3218
4, v
ersi
on 1
- 4
Nov
201
0

Page 24 of 26
Accep
ted
Man
uscr
ipt
Figure 10 - Misfit on the vertical uplift between the elastic solution and the viscoelastic solution at
120 days after the pressure increases. The viscoelastic response is strongly dependent on the
temperature along the source wall.
a) b)
0 20 40 60 80 100 1200.04
0.05
0.06
0.07
0.08
0.09
0.1
time [days]
vertical displacemnt [m]
T=1000 KT=1500 K
0 20 40 60 80 100 1200.04
0.05
0.06
0.07
0.08
0.09
0.1
time [days]
vertical displacement [m]
T=1000 KT=1500 K
Figure 11 – Ground uplift at r=0 as function of time. (a) The pressure source is surrounded by a
viscoelastic spherical shell and the wall temperature is T=1000 K (solid line) and T=1500 K
(dashed line). (b) The pressure source is embedded in a temperature-dependent viscoelastic half-
space and the wall temperature is T=1000 K (solid line) and to T=1500 K (dashed line). pe
er-0
0532
184,
ver
sion
1 -
4 N
ov 2
010
Page 25 of 26
Accep
ted
Man
uscr
ipt
Figure 12 – Comparison between GPS observed (black) and computed deformation during the
1993-1997 period. The numerical computations are performed assuming a heterogeneous elastic
medium (blue, after Bonaccorso et al., 2005) and a temperature-dependent viscoelastic medium
with pressure source of 320Mpa and source wall temperature at either 1000 K (green) or 1500 K
(red).
peer
-005
3218
4, v
ersi
on 1
- 4
Nov
201
0
Page 26 of 26
Accep
ted
Man
uscr
ipt
Figure 13 - Vertical uplift at OBS (circle), ESLN (square) and TDF (diamond) computed for a step-
like pressure increase (black lines) and linear pressure change (grey lines).
peer
-005
3218
4, v
ersi
on 1
- 4
Nov
201
0
Copyright © 2022 FDOKUMEN