Familial nonkinesigenic paroxysmal dyskinesia and intracranial calcifications: A new syndrome?
Seismoacoustic investigations of paroxysmal activity at Mt. Etnavolcano: New insights into the 16 November 2006 eruption
M. Sciotto,1 A. Cannata,2 G. Di Grazia,2 S. Gresta,1 E. Privitera,2 and L. Spina1
Received 1 December 2010; revised 30 May 2011; accepted 8 June 2011; published 8 September 2011.
[1] On 16 November 2006, a 1 day long paroxysmal eruption occurred at the summitcraters of Mt. Etna volcano. A multiparametric approach, consisting of analyzinginfrasonic, seismic, and video camera recordings, was carried out to follow its evolution.Volcanological and geophysical observations identified three eruptive phases. In the firstphase, infrasonic and seismic characteristics reflected the highly explosive nature of theactivity. Waveform characterization of infrasound events confirmed the activity of theseveral explosive vents at the summit of Southeast Crater (SEC). During the second phase,results highlighted the decoupling between seismic and infrasonic sources, which wasdue to the decrease in explosive activity and the reactivation of effusive vents locatedsouth of Bocca Nuova and on the saddle between Bocca Nuova and SEC. The third phasewas the most intense and was characterized by various volcanic phenomena (pyroclasticflows, jets of dark ash, and white steam). The very high radiated infrasonic energy,together with infrasound event features, led us to infer a gas enrichment of the shallowmagma column, preceding by a few minutes and likely related to the pyroclastic flows inthe SEC area. After the eruption at SEC, variations in infrasound events related to theactivity of Northeast Crater (NEC) were found. The observed spectral changes and thesource mechanism modeling of the NEC infrasound events suggest the existence of a linkin the plumbing system feeding the two craters.
Citation: Sciotto, M., A. Cannata, G. Di Grazia, S. Gresta, E. Privitera, and L. Spina (2011), Seismoacoustic investigations ofparoxysmal activity at Mt. Etna volcano: New insights into the 16 November 2006 eruption, J. Geophys. Res., 116, B09301,doi:10.1029/2010JB008138.
1. Introduction
[2] The most promising method for both monitoringvolcanoes and investigating their dynamics is the multi-parametric approach [e.g.,McNutt et al., 2000; Tilling, 2008].Recently, joint analysis of seismic, infrasonic and thermal/video signals has proved very useful in investigatingexplosive processes and distinguishing the different eruptivestyles and dynamics in various volcanoes (e.g., Stromboli[Ripepe et al., 2002], Tungurahua [Johnson et al., 2005],Karymsky [Johnson, 2007], Santiaguito [Johnson et al., 2004;Sahetapy‐Engel et al., 2008], and Villarica and Fuego[Marchetti et al., 2009a]). Moreover, recent multiparametricapproaches, based on the investigation of infrasound, severaldifferent types of seismic signals, such as earthquakes andseismovolcanic signals, ground deformation and so on, haveallowed tracking the evolution of activity in both deep andshallow parts of volcanoes [e.g., Matoza et al., 2007; Moranet al., 2008a; Di Grazia et al., 2009; Peltier et al., 2009;Aiuppa et al., 2010].
[3] In the last decade, new insights into explosive volca-nic processes have been made by studying infrasonic signals[e.g., Johnson et al., 2003; Vergniolle et al., 2004; Matozaet al., 2009b]. Indeed, infrasonic activity on volcanoes isgenerally evidence of open conduit conditions (temporary orpermanent) and can provide useful information on thedynamics of the explosive processes. When the efficiency ofvideo cameras and thermal sensors is reduced (or inhibited)in the case of poor visibility due to clouds or gas plumes,then infrasound may prove a very powerful tool for thedetection and characterization of explosive activity [e.g.,Cannata et al., 2009a]. Furthermore, despite potentialatmospheric variability, over intermediate distances (<5 km)infrasound propagation is relatively simple compared toseismic propagation [Johnson, 2003].[4] In a volcanic environment, several phenomena are
able to generate infrasound signals such as rockfalls [Moranet al., 2008b] or pyroclastic flows [Oshima and Maekawa,2001]. Nevertheless, in many cases infrasound signals arerelated to internal magma dynamics, like the acoustic reso-nance of fluids in the conduit, triggered by explosive sources;this implies the propagation of sound waves in both magmaand the atmosphere [Garcés and McNutt, 1997]. Infrasoundwaves may also be explained by the sudden uncorking ofthe volcano [Johnson and Lees, 2000], the opening of“valves” sealing fluid‐filled cracks [Matoza et al., 2009a],
1Dipartimento di Scienze Geologiche, Università di Catania, Catania,Italy.
2Istituto Nazionale di Geofisica e Vulcanologia, Osservatorio Etneo‐Sezione di Catania, Catania, Italy.
Copyright 2011 by the American Geophysical Union.0148‐0227/11/2010JB008138
JOURNAL OF GEOPHYSICAL RESEARCH, VOL. 116, B09301, doi:10.1029/2010JB008138, 2011
B09301 1 of 21
the local coalescence within a magma foam [Vergniolle andCaplan‐Auerbach, 2004], the Strombolian bubble vibration[Vergniolle et al., 2004], the Helmholtz resonator [Fee et al.,2010] and monopole/dipole models of bubble bursting dynam-ics [Gerst et al., 2008; Johnson et al., 2008].[5] Over time, Mt. Etna has exhibited, several changes in
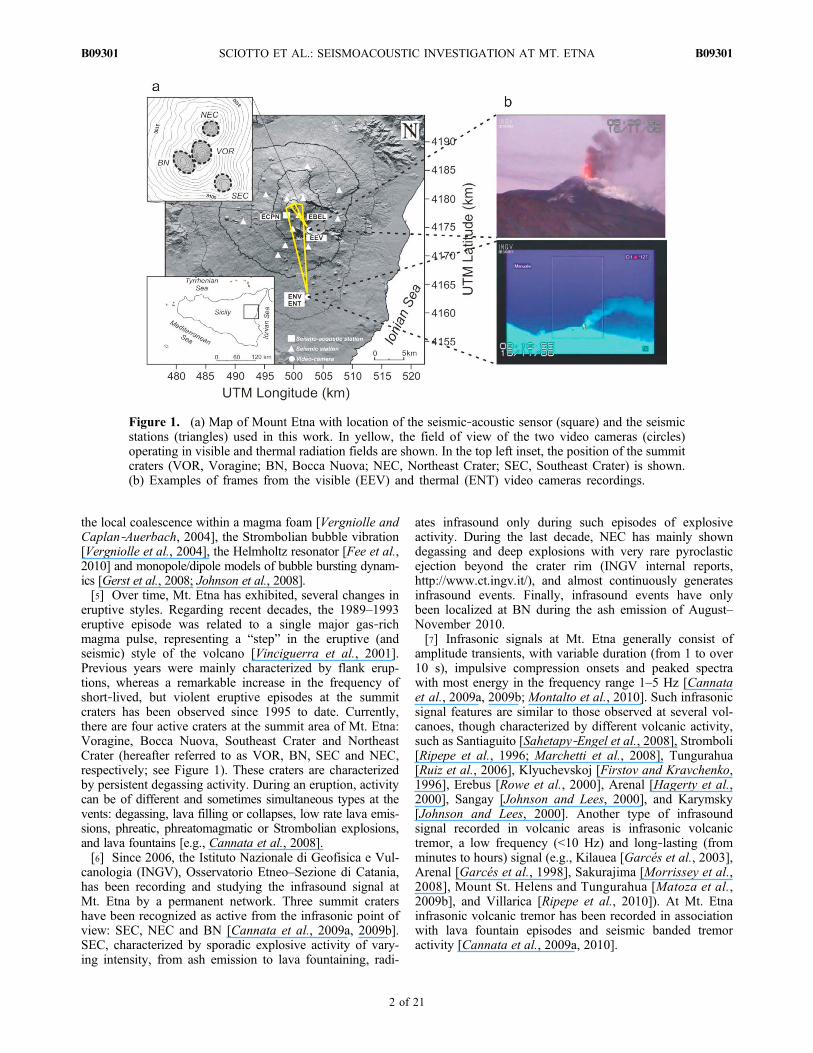
eruptive styles. Regarding recent decades, the 1989–1993eruptive episode was related to a single major gas‐richmagma pulse, representing a “step” in the eruptive (andseismic) style of the volcano [Vinciguerra et al., 2001].Previous years were mainly characterized by flank erup-tions, whereas a remarkable increase in the frequency ofshort‐lived, but violent eruptive episodes at the summitcraters has been observed since 1995 to date. Currently,there are four active craters at the summit area of Mt. Etna:Voragine, Bocca Nuova, Southeast Crater and NortheastCrater (hereafter referred to as VOR, BN, SEC and NEC,respectively; see Figure 1). These craters are characterizedby persistent degassing activity. During an eruption, activitycan be of different and sometimes simultaneous types at thevents: degassing, lava filling or collapses, low rate lava emis-sions, phreatic, phreatomagmatic or Strombolian explosions,and lava fountains [e.g., Cannata et al., 2008].[6] Since 2006, the Istituto Nazionale di Geofisica e Vul-
canologia (INGV), Osservatorio Etneo–Sezione di Catania,has been recording and studying the infrasound signal atMt. Etna by a permanent network. Three summit cratershave been recognized as active from the infrasonic point ofview: SEC, NEC and BN [Cannata et al., 2009a, 2009b].SEC, characterized by sporadic explosive activity of vary-ing intensity, from ash emission to lava fountaining, radi-
ates infrasound only during such episodes of explosiveactivity. During the last decade, NEC has mainly showndegassing and deep explosions with very rare pyroclasticejection beyond the crater rim (INGV internal reports,http://www.ct.ingv.it/), and almost continuously generatesinfrasound events. Finally, infrasound events have onlybeen localized at BN during the ash emission of August–November 2010.[7] Infrasonic signals at Mt. Etna generally consist of
amplitude transients, with variable duration (from 1 to over10 s), impulsive compression onsets and peaked spectrawith most energy in the frequency range 1–5 Hz [Cannataet al., 2009a, 2009b; Montalto et al., 2010]. Such infrasonicsignal features are similar to those observed at several vol-canoes, though characterized by different volcanic activity,such as Santiaguito [Sahetapy‐Engel et al., 2008], Stromboli[Ripepe et al., 1996; Marchetti et al., 2008], Tungurahua[Ruiz et al., 2006], Klyuchevskoj [Firstov and Kravchenko,1996], Erebus [Rowe et al., 2000], Arenal [Hagerty et al.,2000], Sangay [Johnson and Lees, 2000], and Karymsky[Johnson and Lees, 2000]. Another type of infrasoundsignal recorded in volcanic areas is infrasonic volcanictremor, a low frequency (<10 Hz) and long‐lasting (fromminutes to hours) signal (e.g., Kilauea [Garcés et al., 2003],Arenal [Garcés et al., 1998], Sakurajima [Morrissey et al.,2008], Mount St. Helens and Tungurahua [Matoza et al.,2009b], and Villarica [Ripepe et al., 2010]). At Mt. Etnainfrasonic volcanic tremor has been recorded in associationwith lava fountain episodes and seismic banded tremoractivity [Cannata et al., 2009a, 2010].
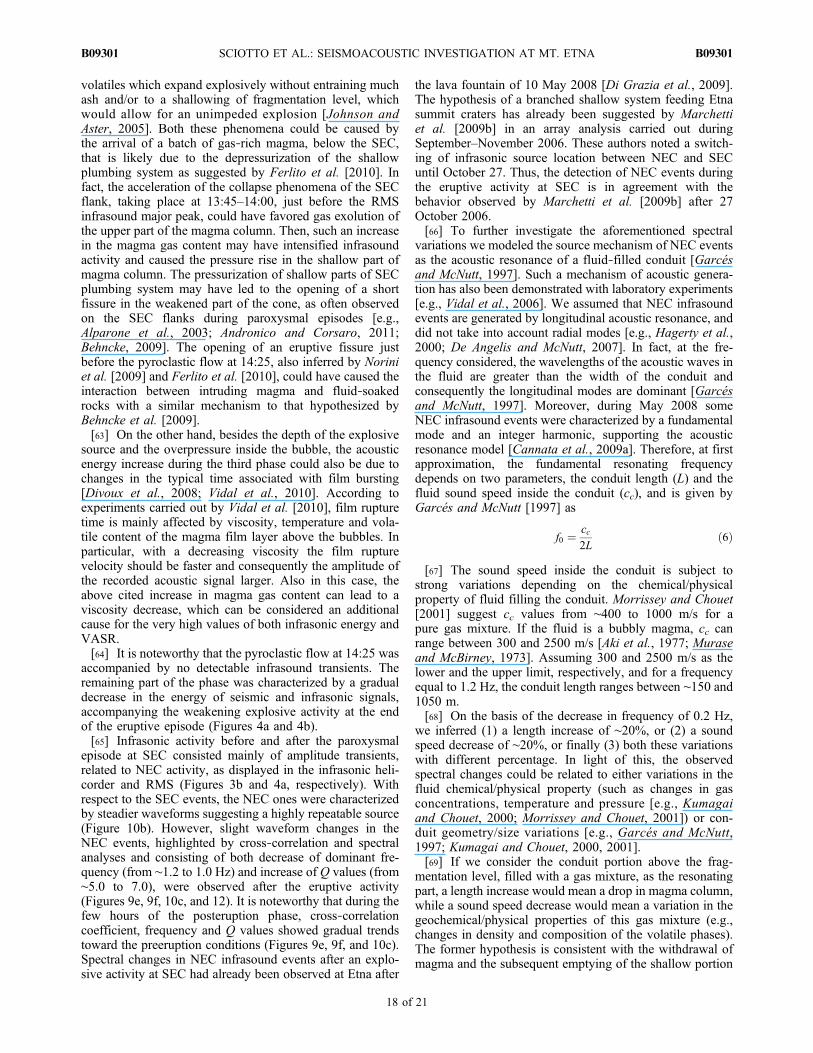
Figure 1. (a) Map of Mount Etna with location of the seismic‐acoustic sensor (square) and the seismicstations (triangles) used in this work. In yellow, the field of view of the two video cameras (circles)operating in visible and thermal radiation fields are shown. In the top left inset, the position of the summitcraters (VOR, Voragine; BN, Bocca Nuova; NEC, Northeast Crater; SEC, Southeast Crater) is shown.(b) Examples of frames from the visible (EEV) and thermal (ENT) video cameras recordings.
SCIOTTO ET AL.: SEISMOACOUSTIC INVESTIGATION AT MT. ETNA B09301B09301
2 of 21
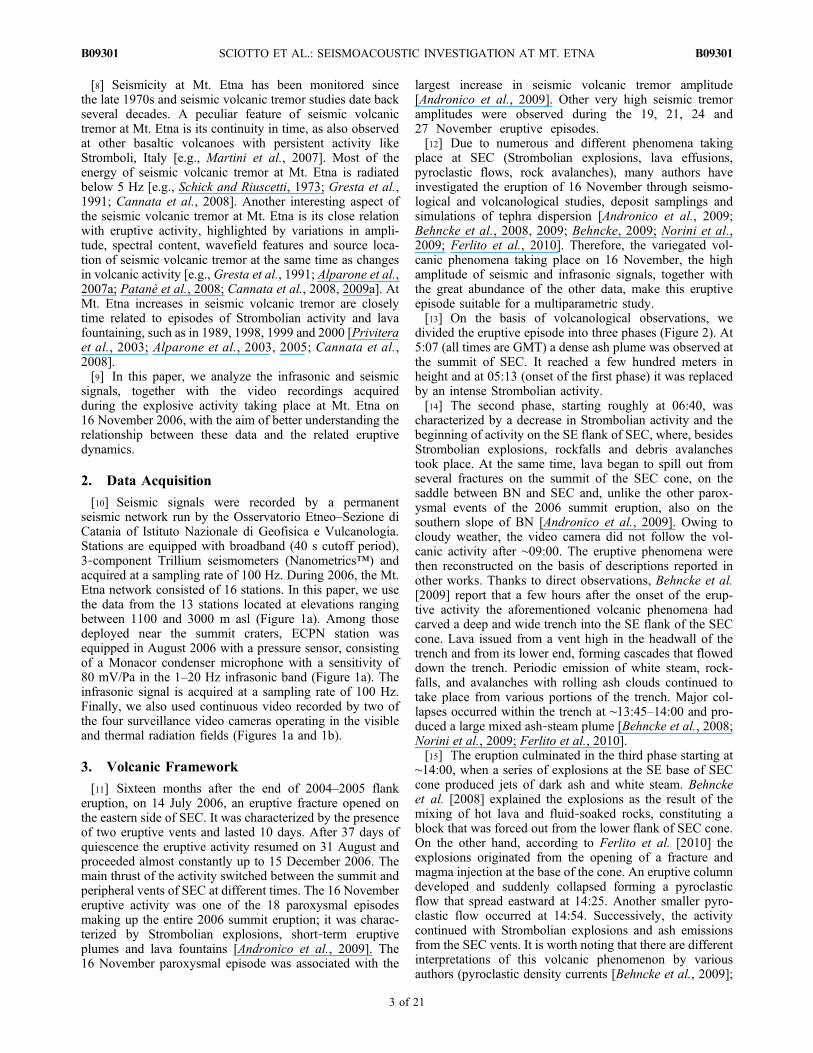
[8] Seismicity at Mt. Etna has been monitored sincethe late 1970s and seismic volcanic tremor studies date backseveral decades. A peculiar feature of seismic volcanictremor at Mt. Etna is its continuity in time, as also observedat other basaltic volcanoes with persistent activity likeStromboli, Italy [e.g., Martini et al., 2007]. Most of theenergy of seismic volcanic tremor at Mt. Etna is radiatedbelow 5 Hz [e.g., Schick and Riuscetti, 1973; Gresta et al.,1991; Cannata et al., 2008]. Another interesting aspect ofthe seismic volcanic tremor at Mt. Etna is its close relationwith eruptive activity, highlighted by variations in ampli-tude, spectral content, wavefield features and source loca-tion of seismic volcanic tremor at the same time as changesin volcanic activity [e.g., Gresta et al., 1991; Alparone et al.,2007a; Patanè et al., 2008; Cannata et al., 2008, 2009a]. AtMt. Etna increases in seismic volcanic tremor are closelytime related to episodes of Strombolian activity and lavafountaining, such as in 1989, 1998, 1999 and 2000 [Priviteraet al., 2003; Alparone et al., 2003, 2005; Cannata et al.,2008].[9] In this paper, we analyze the infrasonic and seismic
signals, together with the video recordings acquiredduring the explosive activity taking place at Mt. Etna on16 November 2006, with the aim of better understanding therelationship between these data and the related eruptivedynamics.
2. Data Acquisition
[10] Seismic signals were recorded by a permanentseismic network run by the Osservatorio Etneo–Sezione diCatania of Istituto Nazionale di Geofisica e Vulcanologia.Stations are equipped with broadband (40 s cutoff period),3‐component Trillium seismometers (Nanometrics™) andacquired at a sampling rate of 100 Hz. During 2006, the Mt.Etna network consisted of 16 stations. In this paper, we usethe data from the 13 stations located at elevations rangingbetween 1100 and 3000 m asl (Figure 1a). Among thosedeployed near the summit craters, ECPN station wasequipped in August 2006 with a pressure sensor, consistingof a Monacor condenser microphone with a sensitivity of80 mV/Pa in the 1–20 Hz infrasonic band (Figure 1a). Theinfrasonic signal is acquired at a sampling rate of 100 Hz.Finally, we also used continuous video recorded by two ofthe four surveillance video cameras operating in the visibleand thermal radiation fields (Figures 1a and 1b).
3. Volcanic Framework
[11] Sixteen months after the end of 2004–2005 flankeruption, on 14 July 2006, an eruptive fracture opened onthe eastern side of SEC. It was characterized by the presenceof two eruptive vents and lasted 10 days. After 37 days ofquiescence the eruptive activity resumed on 31 August andproceeded almost constantly up to 15 December 2006. Themain thrust of the activity switched between the summit andperipheral vents of SEC at different times. The 16 Novembereruptive activity was one of the 18 paroxysmal episodesmaking up the entire 2006 summit eruption; it was charac-terized by Strombolian explosions, short‐term eruptiveplumes and lava fountains [Andronico et al., 2009]. The16 November paroxysmal episode was associated with the
largest increase in seismic volcanic tremor amplitude[Andronico et al., 2009]. Other very high seismic tremoramplitudes were observed during the 19, 21, 24 and27 November eruptive episodes.[12] Due to numerous and different phenomena taking
place at SEC (Strombolian explosions, lava effusions,pyroclastic flows, rock avalanches), many authors haveinvestigated the eruption of 16 November through seismo-logical and volcanological studies, deposit samplings andsimulations of tephra dispersion [Andronico et al., 2009;Behncke et al., 2008, 2009; Behncke, 2009; Norini et al.,2009; Ferlito et al., 2010]. Therefore, the variegated vol-canic phenomena taking place on 16 November, the highamplitude of seismic and infrasonic signals, together withthe great abundance of the other data, make this eruptiveepisode suitable for a multiparametric study.[13] On the basis of volcanological observations, we
divided the eruptive episode into three phases (Figure 2). At5:07 (all times are GMT) a dense ash plume was observed atthe summit of SEC. It reached a few hundred meters inheight and at 05:13 (onset of the first phase) it was replacedby an intense Strombolian activity.[14] The second phase, starting roughly at 06:40, was
characterized by a decrease in Strombolian activity and thebeginning of activity on the SE flank of SEC, where, besidesStrombolian explosions, rockfalls and debris avalanchestook place. At the same time, lava began to spill out fromseveral fractures on the summit of the SEC cone, on thesaddle between BN and SEC and, unlike the other parox-ysmal events of the 2006 summit eruption, also on thesouthern slope of BN [Andronico et al., 2009]. Owing tocloudy weather, the video camera did not follow the vol-canic activity after ∼09:00. The eruptive phenomena werethen reconstructed on the basis of descriptions reported inother works. Thanks to direct observations, Behncke et al.[2009] report that a few hours after the onset of the erup-tive activity the aforementioned volcanic phenomena hadcarved a deep and wide trench into the SE flank of the SECcone. Lava issued from a vent high in the headwall of thetrench and from its lower end, forming cascades that floweddown the trench. Periodic emission of white steam, rock-falls, and avalanches with rolling ash clouds continued totake place from various portions of the trench. Major col-lapses occurred within the trench at ∼13:45–14:00 and pro-duced a large mixed ash‐steam plume [Behncke et al., 2008;Norini et al., 2009; Ferlito et al., 2010].[15] The eruption culminated in the third phase starting at
∼14:00, when a series of explosions at the SE base of SECcone produced jets of dark ash and white steam. Behnckeet al. [2008] explained the explosions as the result of themixing of hot lava and fluid‐soaked rocks, constituting ablock that was forced out from the lower flank of SEC cone.On the other hand, according to Ferlito et al. [2010] theexplosions originated from the opening of a fracture andmagma injection at the base of the cone. An eruptive columndeveloped and suddenly collapsed forming a pyroclasticflow that spread eastward at 14:25. Another smaller pyro-clastic flow occurred at 14:54. Successively, the activitycontinued with Strombolian explosions and ash emissionsfrom the SEC vents. It is worth noting that there are differentinterpretations of this volcanic phenomenon by variousauthors (pyroclastic density currents [Behncke et al., 2009];
SCIOTTO ET AL.: SEISMOACOUSTIC INVESTIGATION AT MT. ETNA B09301B09301
3 of 21
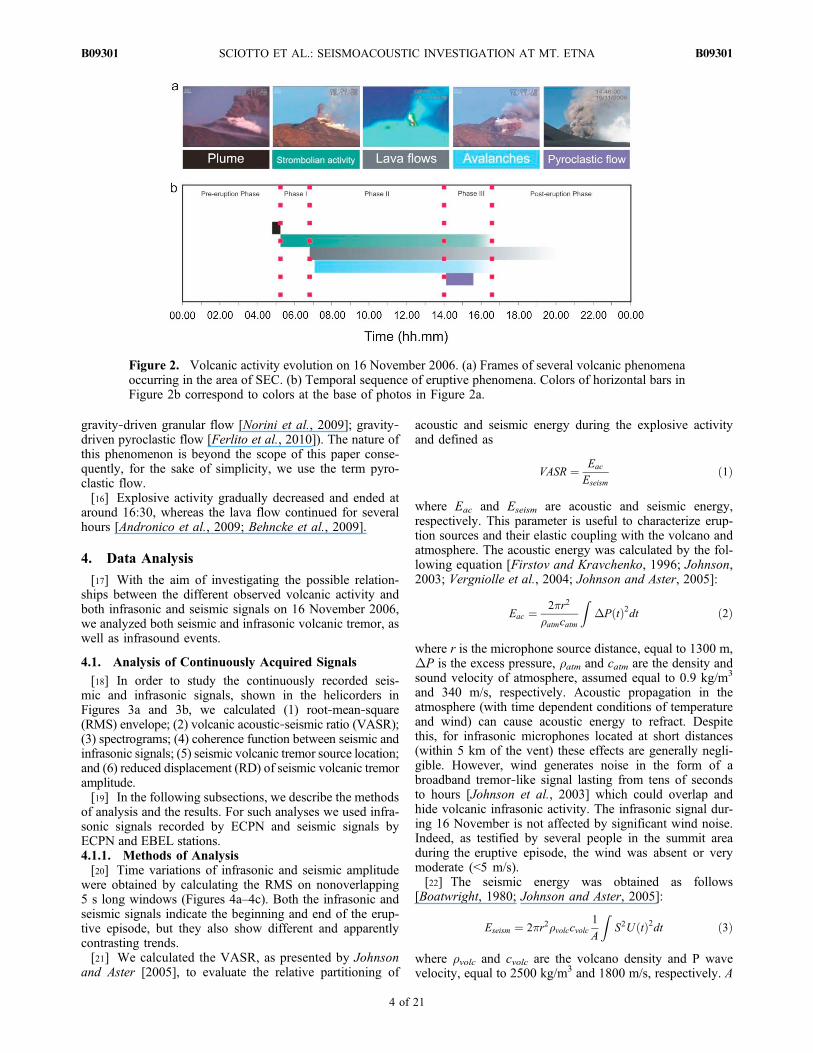
gravity‐driven granular flow [Norini et al., 2009]; gravity‐driven pyroclastic flow [Ferlito et al., 2010]). The nature ofthis phenomenon is beyond the scope of this paper conse-quently, for the sake of simplicity, we use the term pyro-clastic flow.[16] Explosive activity gradually decreased and ended at
around 16:30, whereas the lava flow continued for severalhours [Andronico et al., 2009; Behncke et al., 2009].
4. Data Analysis
[17] With the aim of investigating the possible relation-ships between the different observed volcanic activity andboth infrasonic and seismic signals on 16 November 2006,we analyzed both seismic and infrasonic volcanic tremor, aswell as infrasound events.
4.1. Analysis of Continuously Acquired Signals
[18] In order to study the continuously recorded seis-mic and infrasonic signals, shown in the helicorders inFigures 3a and 3b, we calculated (1) root‐mean‐square(RMS) envelope; (2) volcanic acoustic‐seismic ratio (VASR);(3) spectrograms; (4) coherence function between seismic andinfrasonic signals; (5) seismic volcanic tremor source location;and (6) reduced displacement (RD) of seismic volcanic tremoramplitude.[19] In the following subsections, we describe the methods
of analysis and the results. For such analyses we used infra-sonic signals recorded by ECPN and seismic signals byECPN and EBEL stations.4.1.1. Methods of Analysis[20] Time variations of infrasonic and seismic amplitude
were obtained by calculating the RMS on nonoverlapping5 s long windows (Figures 4a–4c). Both the infrasonic andseismic signals indicate the beginning and end of the erup-tive episode, but they also show different and apparentlycontrasting trends.[21] We calculated the VASR, as presented by Johnson
and Aster [2005], to evaluate the relative partitioning of
acoustic and seismic energy during the explosive activityand defined as
VASR ¼ Eac
Eseismð1Þ
where Eac and Eseism are acoustic and seismic energy,respectively. This parameter is useful to characterize erup-tion sources and their elastic coupling with the volcano andatmosphere. The acoustic energy was calculated by the fol-lowing equation [Firstov and Kravchenko, 1996; Johnson,2003; Vergniolle et al., 2004; Johnson and Aster, 2005]:
Eac ¼ 2�r2
�atmcatm
ZDP tð Þ2dt ð2Þ
where r is the microphone source distance, equal to 1300 m,DP is the excess pressure, ratm and catm are the density andsound velocity of atmosphere, assumed equal to 0.9 kg/m3
and 340 m/s, respectively. Acoustic propagation in theatmosphere (with time dependent conditions of temperatureand wind) can cause acoustic energy to refract. Despitethis, for infrasonic microphones located at short distances(within 5 km of the vent) these effects are generally negli-gible. However, wind generates noise in the form of abroadband tremor‐like signal lasting from tens of secondsto hours [Johnson et al., 2003] which could overlap andhide volcanic infrasonic activity. The infrasonic signal dur-ing 16 November is not affected by significant wind noise.Indeed, as testified by several people in the summit areaduring the eruptive episode, the wind was absent or verymoderate (<5 m/s).[22] The seismic energy was obtained as follows
[Boatwright, 1980; Johnson and Aster, 2005]:
Eseism ¼ 2�r2�volccvolc1
A
ZS2U tð Þ2dt ð3Þ
where rvolc and cvolc are the volcano density and P wavevelocity, equal to 2500 kg/m3 and 1800 m/s, respectively. A
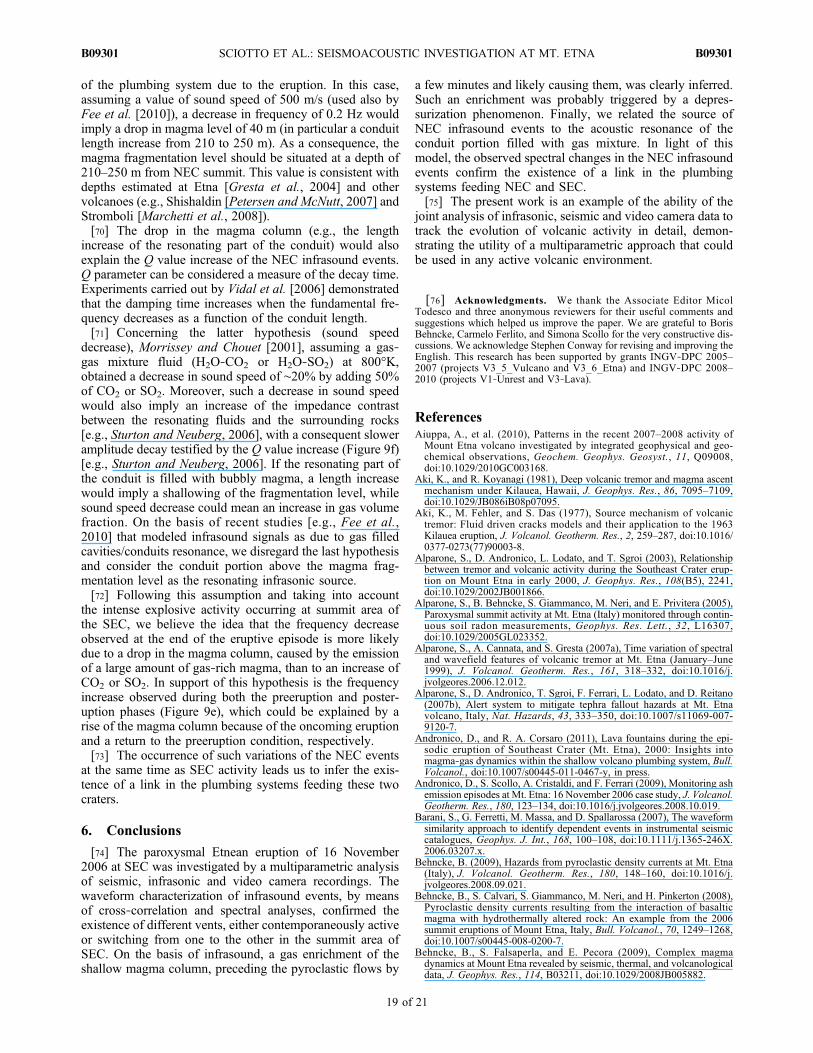
Figure 2. Volcanic activity evolution on 16 November 2006. (a) Frames of several volcanic phenomenaoccurring in the area of SEC. (b) Temporal sequence of eruptive phenomena. Colors of horizontal bars inFigure 2b correspond to colors at the base of photos in Figure 2a.
SCIOTTO ET AL.: SEISMOACOUSTIC INVESTIGATION AT MT. ETNA B09301B09301
4 of 21
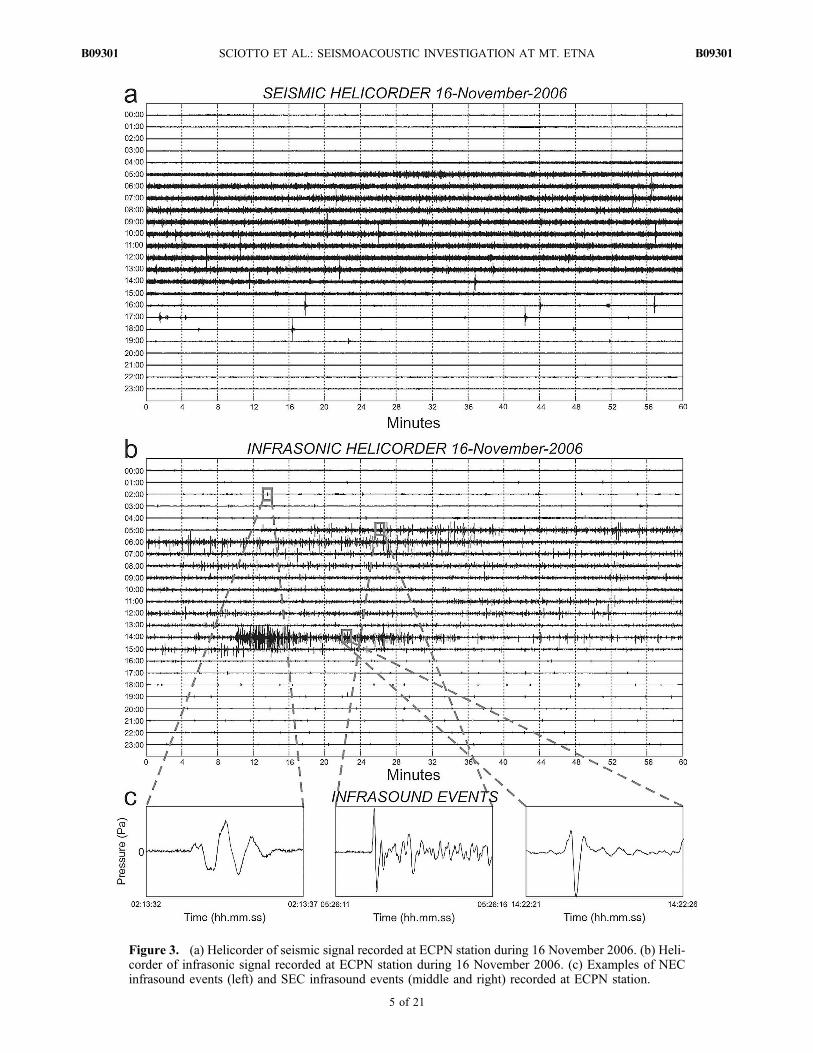
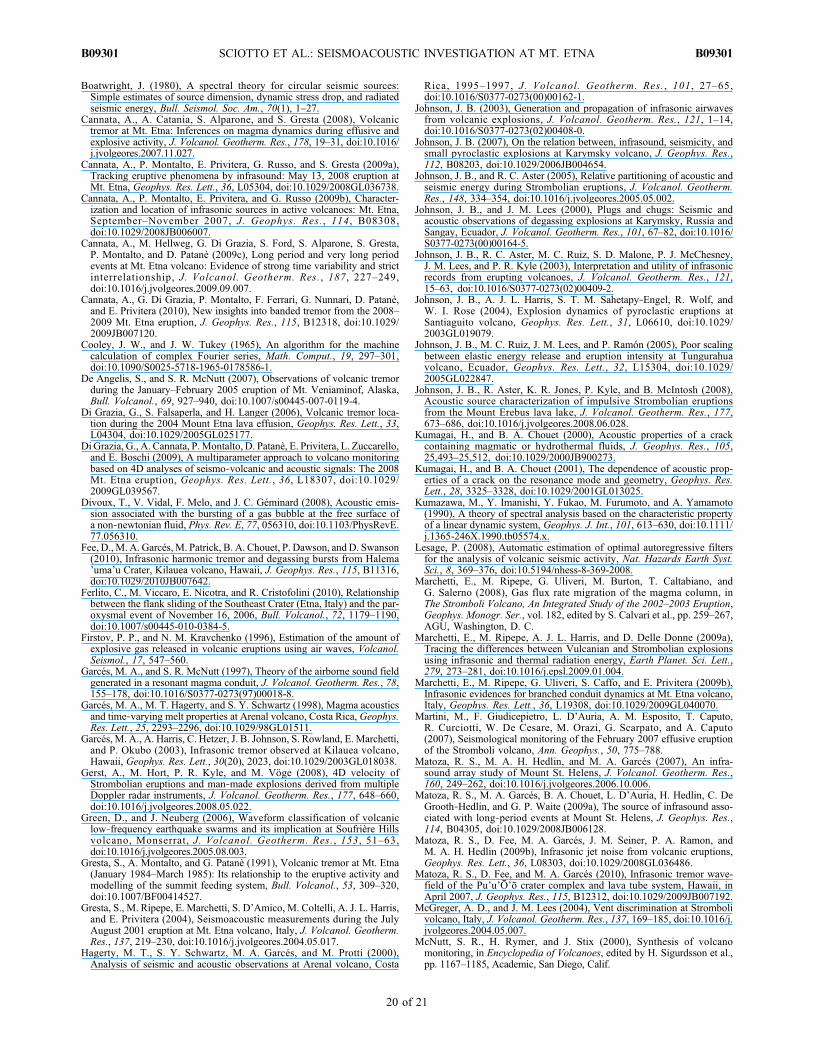
Figure 3. (a) Helicorder of seismic signal recorded at ECPN station during 16 November 2006. (b) Heli-corder of infrasonic signal recorded at ECPN station during 16 November 2006. (c) Examples of NECinfrasound events (left) and SEC infrasound events (middle and right) recorded at ECPN station.
SCIOTTO ET AL.: SEISMOACOUSTIC INVESTIGATION AT MT. ETNA B09301B09301
5 of 21

Figure 4
SCIOTTO ET AL.: SEISMOACOUSTIC INVESTIGATION AT MT. ETNA B09301B09301
6 of 21
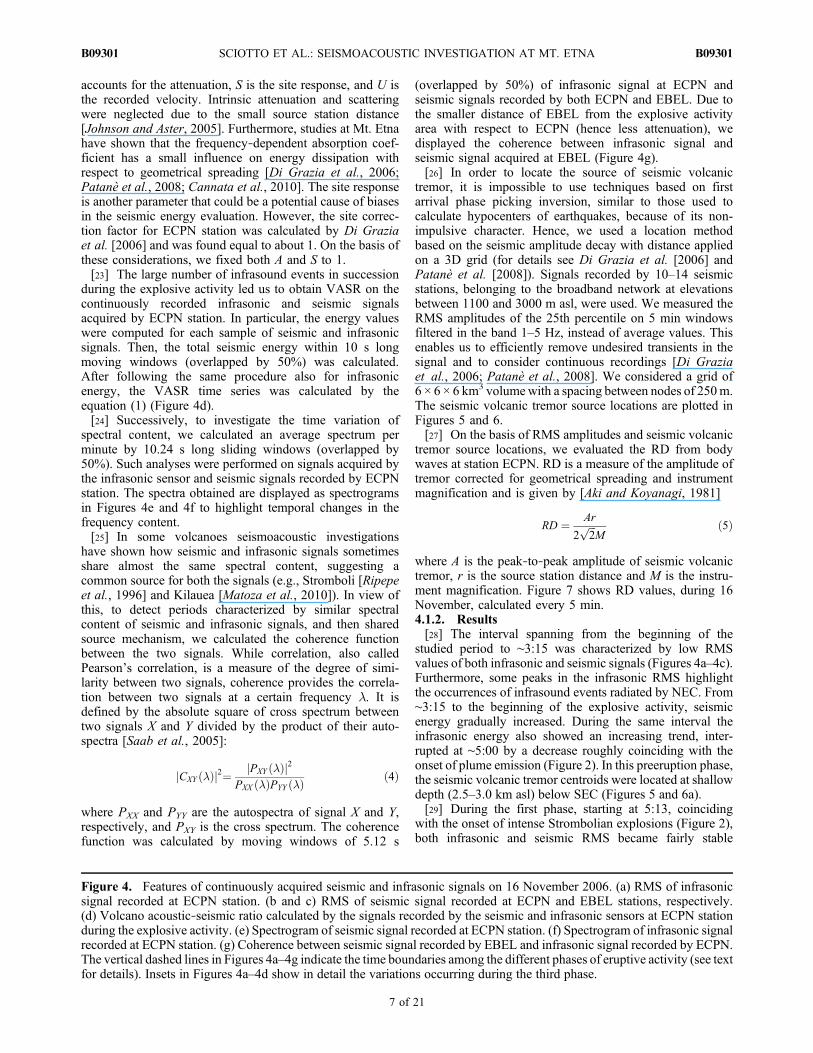
accounts for the attenuation, S is the site response, and U isthe recorded velocity. Intrinsic attenuation and scatteringwere neglected due to the small source station distance[Johnson and Aster, 2005]. Furthermore, studies at Mt. Etnahave shown that the frequency‐dependent absorption coef-ficient has a small influence on energy dissipation withrespect to geometrical spreading [Di Grazia et al., 2006;Patanè et al., 2008; Cannata et al., 2010]. The site responseis another parameter that could be a potential cause of biasesin the seismic energy evaluation. However, the site correc-tion factor for ECPN station was calculated by Di Graziaet al. [2006] and was found equal to about 1. On the basis ofthese considerations, we fixed both A and S to 1.[23] The large number of infrasound events in succession
during the explosive activity led us to obtain VASR on thecontinuously recorded infrasonic and seismic signalsacquired by ECPN station. In particular, the energy valueswere computed for each sample of seismic and infrasonicsignals. Then, the total seismic energy within 10 s longmoving windows (overlapped by 50%) was calculated.After following the same procedure also for infrasonicenergy, the VASR time series was calculated by theequation (1) (Figure 4d).[24] Successively, to investigate the time variation of
spectral content, we calculated an average spectrum perminute by 10.24 s long sliding windows (overlapped by50%). Such analyses were performed on signals acquired bythe infrasonic sensor and seismic signals recorded by ECPNstation. The spectra obtained are displayed as spectrogramsin Figures 4e and 4f to highlight temporal changes in thefrequency content.[25] In some volcanoes seismoacoustic investigations
have shown how seismic and infrasonic signals sometimesshare almost the same spectral content, suggesting acommon source for both the signals (e.g., Stromboli [Ripepeet al., 1996] and Kilauea [Matoza et al., 2010]). In view ofthis, to detect periods characterized by similar spectralcontent of seismic and infrasonic signals, and then sharedsource mechanism, we calculated the coherence functionbetween the two signals. While correlation, also calledPearson’s correlation, is a measure of the degree of simi-larity between two signals, coherence provides the correla-tion between two signals at a certain frequency l. It isdefined by the absolute square of cross spectrum betweentwo signals X and Y divided by the product of their auto-spectra [Saab et al., 2005]:
CXY �ð Þj j2¼ PXY �ð Þj j2PXX �ð ÞPYY �ð Þ ð4Þ
where PXX and PYY are the autospectra of signal X and Y,respectively, and PXY is the cross spectrum. The coherencefunction was calculated by moving windows of 5.12 s
(overlapped by 50%) of infrasonic signal at ECPN andseismic signals recorded by both ECPN and EBEL. Due tothe smaller distance of EBEL from the explosive activityarea with respect to ECPN (hence less attenuation), wedisplayed the coherence between infrasonic signal andseismic signal acquired at EBEL (Figure 4g).[26] In order to locate the source of seismic volcanic
tremor, it is impossible to use techniques based on firstarrival phase picking inversion, similar to those used tocalculate hypocenters of earthquakes, because of its non-impulsive character. Hence, we used a location methodbased on the seismic amplitude decay with distance appliedon a 3D grid (for details see Di Grazia et al. [2006] andPatanè et al. [2008]). Signals recorded by 10–14 seismicstations, belonging to the broadband network at elevationsbetween 1100 and 3000 m asl, were used. We measured theRMS amplitudes of the 25th percentile on 5 min windowsfiltered in the band 1–5 Hz, instead of average values. Thisenables us to efficiently remove undesired transients in thesignal and to consider continuous recordings [Di Graziaet al., 2006; Patanè et al., 2008]. We considered a grid of6 × 6 × 6 km3 volumewith a spacing between nodes of 250m.The seismic volcanic tremor source locations are plotted inFigures 5 and 6.[27] On the basis of RMS amplitudes and seismic volcanic
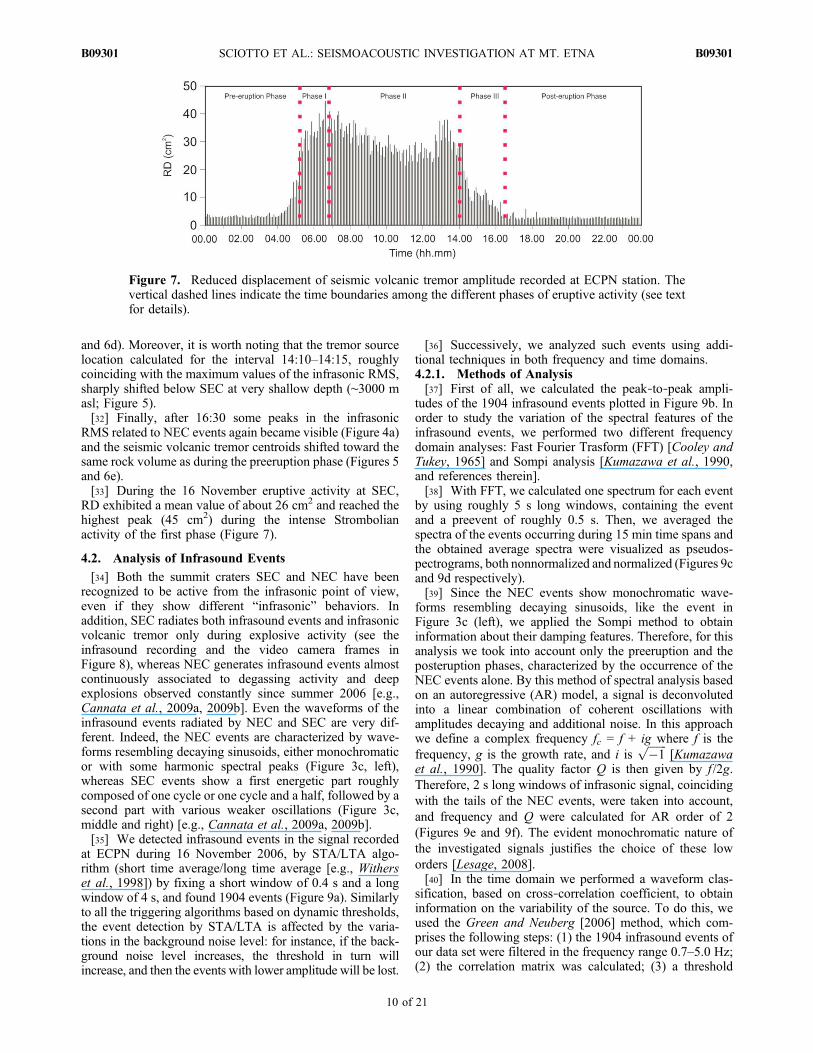
tremor source locations, we evaluated the RD from bodywaves at station ECPN. RD is a measure of the amplitude oftremor corrected for geometrical spreading and instrumentmagnification and is given by [Aki and Koyanagi, 1981]
RD ¼ Ar
2ffiffiffi2
pM
ð5Þ
where A is the peak‐to‐peak amplitude of seismic volcanictremor, r is the source station distance and M is the instru-ment magnification. Figure 7 shows RD values, during 16November, calculated every 5 min.4.1.2. Results[28] The interval spanning from the beginning of the
studied period to ∼3:15 was characterized by low RMSvalues of both infrasonic and seismic signals (Figures 4a–4c).Furthermore, some peaks in the infrasonic RMS highlightthe occurrences of infrasound events radiated by NEC. From∼3:15 to the beginning of the explosive activity, seismicenergy gradually increased. During the same interval theinfrasonic energy also showed an increasing trend, inter-rupted at ∼5:00 by a decrease roughly coinciding with theonset of plume emission (Figure 2). In this preeruption phase,the seismic volcanic tremor centroids were located at shallowdepth (2.5–3.0 km asl) below SEC (Figures 5 and 6a).[29] During the first phase, starting at 5:13, coinciding
with the onset of intense Strombolian explosions (Figure 2),both infrasonic and seismic RMS became fairly stable
Figure 4. Features of continuously acquired seismic and infrasonic signals on 16 November 2006. (a) RMS of infrasonicsignal recorded at ECPN station. (b and c) RMS of seismic signal recorded at ECPN and EBEL stations, respectively.(d) Volcano acoustic‐seismic ratio calculated by the signals recorded by the seismic and infrasonic sensors at ECPN stationduring the explosive activity. (e) Spectrogram of seismic signal recorded at ECPN station. (f) Spectrogram of infrasonic signalrecorded at ECPN station. (g) Coherence between seismic signal recorded by EBEL and infrasonic signal recorded by ECPN.The vertical dashed lines in Figures 4a–4g indicate the time boundaries among the different phases of eruptive activity (see textfor details). Insets in Figures 4a–4d show in detail the variations occurring during the third phase.
SCIOTTO ET AL.: SEISMOACOUSTIC INVESTIGATION AT MT. ETNA B09301B09301
7 of 21
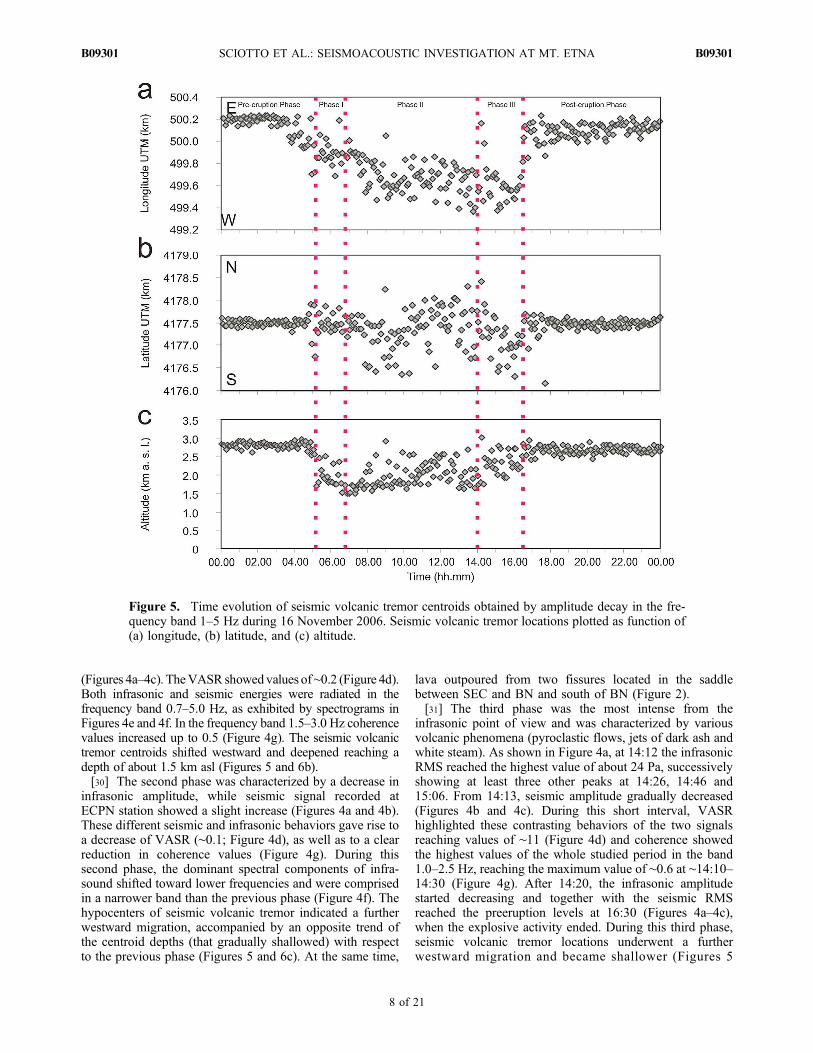
(Figures 4a–4c). TheVASR showedvalues of∼0.2 (Figure 4d).Both infrasonic and seismic energies were radiated in thefrequency band 0.7–5.0 Hz, as exhibited by spectrograms inFigures 4e and 4f. In the frequency band 1.5–3.0 Hz coherencevalues increased up to 0.5 (Figure 4g). The seismic volcanictremor centroids shifted westward and deepened reaching adepth of about 1.5 km asl (Figures 5 and 6b).[30] The second phase was characterized by a decrease in
infrasonic amplitude, while seismic signal recorded atECPN station showed a slight increase (Figures 4a and 4b).These different seismic and infrasonic behaviors gave rise toa decrease of VASR (∼0.1; Figure 4d), as well as to a clearreduction in coherence values (Figure 4g). During thissecond phase, the dominant spectral components of infra-sound shifted toward lower frequencies and were comprisedin a narrower band than the previous phase (Figure 4f). Thehypocenters of seismic volcanic tremor indicated a furtherwestward migration, accompanied by an opposite trend ofthe centroid depths (that gradually shallowed) with respectto the previous phase (Figures 5 and 6c). At the same time,
lava outpoured from two fissures located in the saddlebetween SEC and BN and south of BN (Figure 2).[31] The third phase was the most intense from the
infrasonic point of view and was characterized by variousvolcanic phenomena (pyroclastic flows, jets of dark ash andwhite steam). As shown in Figure 4a, at 14:12 the infrasonicRMS reached the highest value of about 24 Pa, successivelyshowing at least three other peaks at 14:26, 14:46 and15:06. From 14:13, seismic amplitude gradually decreased(Figures 4b and 4c). During this short interval, VASRhighlighted these contrasting behaviors of the two signalsreaching values of ∼11 (Figure 4d) and coherence showedthe highest values of the whole studied period in the band1.0–2.5 Hz, reaching the maximum value of ∼0.6 at ∼14:10–14:30 (Figure 4g). After 14:20, the infrasonic amplitudestarted decreasing and together with the seismic RMSreached the preeruption levels at 16:30 (Figures 4a–4c),when the explosive activity ended. During this third phase,seismic volcanic tremor locations underwent a furtherwestward migration and became shallower (Figures 5
Figure 5. Time evolution of seismic volcanic tremor centroids obtained by amplitude decay in the fre-quency band 1–5 Hz during 16 November 2006. Seismic volcanic tremor locations plotted as function of(a) longitude, (b) latitude, and (c) altitude.
SCIOTTO ET AL.: SEISMOACOUSTIC INVESTIGATION AT MT. ETNA B09301B09301
8 of 21
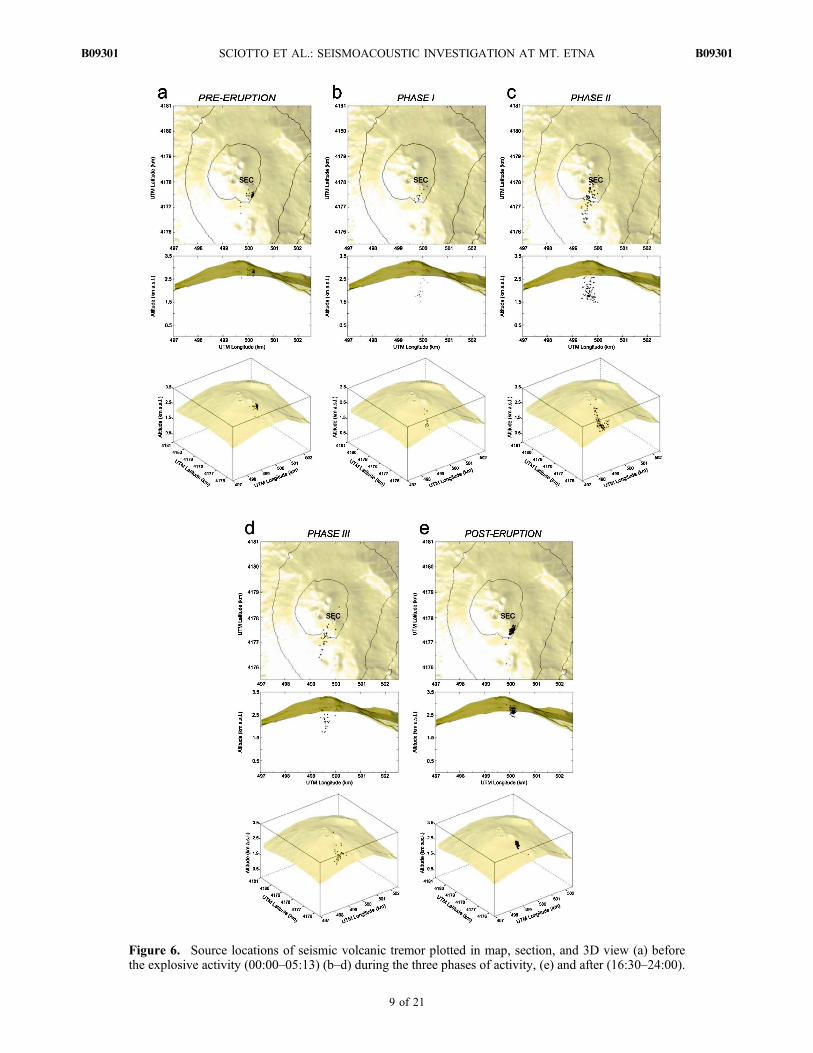
Figure 6. Source locations of seismic volcanic tremor plotted in map, section, and 3D view (a) beforethe explosive activity (00:00–05:13) (b–d) during the three phases of activity, (e) and after (16:30–24:00).
SCIOTTO ET AL.: SEISMOACOUSTIC INVESTIGATION AT MT. ETNA B09301B09301
9 of 21
and 6d). Moreover, it is worth noting that the tremor sourcelocation calculated for the interval 14:10–14:15, roughlycoinciding with the maximum values of the infrasonic RMS,sharply shifted below SEC at very shallow depth (∼3000 masl; Figure 5).[32] Finally, after 16:30 some peaks in the infrasonic
RMS related to NEC events again became visible (Figure 4a)and the seismic volcanic tremor centroids shifted toward thesame rock volume as during the preeruption phase (Figures 5and 6e).[33] During the 16 November eruptive activity at SEC,
RD exhibited a mean value of about 26 cm2 and reached thehighest peak (45 cm2) during the intense Strombolianactivity of the first phase (Figure 7).
4.2. Analysis of Infrasound Events
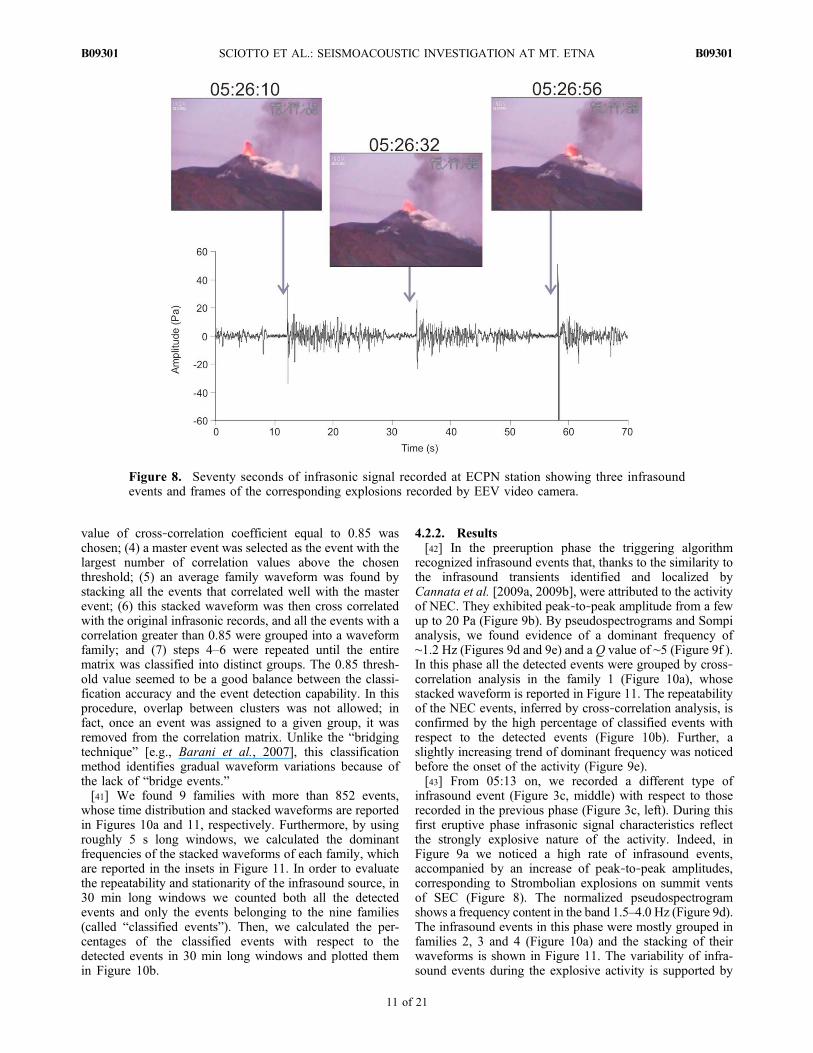
[34] Both the summit craters SEC and NEC have beenrecognized to be active from the infrasonic point of view,even if they show different “infrasonic” behaviors. Inaddition, SEC radiates both infrasound events and infrasonicvolcanic tremor only during explosive activity (see theinfrasound recording and the video camera frames inFigure 8), whereas NEC generates infrasound events almostcontinuously associated to degassing activity and deepexplosions observed constantly since summer 2006 [e.g.,Cannata et al., 2009a, 2009b]. Even the waveforms of theinfrasound events radiated by NEC and SEC are very dif-ferent. Indeed, the NEC events are characterized by wave-forms resembling decaying sinusoids, either monochromaticor with some harmonic spectral peaks (Figure 3c, left),whereas SEC events show a first energetic part roughlycomposed of one cycle or one cycle and a half, followed by asecond part with various weaker oscillations (Figure 3c,middle and right) [e.g., Cannata et al., 2009a, 2009b].[35] We detected infrasound events in the signal recorded
at ECPN during 16 November 2006, by STA/LTA algo-rithm (short time average/long time average [e.g., Witherset al., 1998]) by fixing a short window of 0.4 s and a longwindow of 4 s, and found 1904 events (Figure 9a). Similarlyto all the triggering algorithms based on dynamic thresholds,the event detection by STA/LTA is affected by the varia-tions in the background noise level: for instance, if the back-ground noise level increases, the threshold in turn willincrease, and then the events with lower amplitude will be lost.
[36] Successively, we analyzed such events using addi-tional techniques in both frequency and time domains.4.2.1. Methods of Analysis[37] First of all, we calculated the peak‐to‐peak ampli-
tudes of the 1904 infrasound events plotted in Figure 9b. Inorder to study the variation of the spectral features of theinfrasound events, we performed two different frequencydomain analyses: Fast Fourier Trasform (FFT) [Cooley andTukey, 1965] and Sompi analysis [Kumazawa et al., 1990,and references therein].[38] With FFT, we calculated one spectrum for each event
by using roughly 5 s long windows, containing the eventand a preevent of roughly 0.5 s. Then, we averaged thespectra of the events occurring during 15 min time spans andthe obtained average spectra were visualized as pseudos-pectrograms, both nonnormalized and normalized (Figures 9cand 9d respectively).[39] Since the NEC events show monochromatic wave-
forms resembling decaying sinusoids, like the event inFigure 3c (left), we applied the Sompi method to obtaininformation about their damping features. Therefore, for thisanalysis we took into account only the preeruption and theposteruption phases, characterized by the occurrence of theNEC events alone. By this method of spectral analysis basedon an autoregressive (AR) model, a signal is deconvolutedinto a linear combination of coherent oscillations withamplitudes decaying and additional noise. In this approachwe define a complex frequency fc = f + ig where f is thefrequency, g is the growth rate, and i is
ffiffiffiffiffiffiffi�1p
[Kumazawaet al., 1990]. The quality factor Q is then given by f /2g.Therefore, 2 s long windows of infrasonic signal, coincidingwith the tails of the NEC events, were taken into account,and frequency and Q were calculated for AR order of 2(Figures 9e and 9f). The evident monochromatic nature ofthe investigated signals justifies the choice of these loworders [Lesage, 2008].[40] In the time domain we performed a waveform clas-
sification, based on cross‐correlation coefficient, to obtaininformation on the variability of the source. To do this, weused the Green and Neuberg [2006] method, which com-prises the following steps: (1) the 1904 infrasound events ofour data set were filtered in the frequency range 0.7–5.0 Hz;(2) the correlation matrix was calculated; (3) a threshold
Figure 7. Reduced displacement of seismic volcanic tremor amplitude recorded at ECPN station. Thevertical dashed lines indicate the time boundaries among the different phases of eruptive activity (see textfor details).
SCIOTTO ET AL.: SEISMOACOUSTIC INVESTIGATION AT MT. ETNA B09301B09301
10 of 21
value of cross‐correlation coefficient equal to 0.85 waschosen; (4) a master event was selected as the event with thelargest number of correlation values above the chosenthreshold; (5) an average family waveform was found bystacking all the events that correlated well with the masterevent; (6) this stacked waveform was then cross correlatedwith the original infrasonic records, and all the events with acorrelation greater than 0.85 were grouped into a waveformfamily; and (7) steps 4–6 were repeated until the entirematrix was classified into distinct groups. The 0.85 thresh-old value seemed to be a good balance between the classi-fication accuracy and the event detection capability. In thisprocedure, overlap between clusters was not allowed; infact, once an event was assigned to a given group, it wasremoved from the correlation matrix. Unlike the “bridgingtechnique” [e.g., Barani et al., 2007], this classificationmethod identifies gradual waveform variations because ofthe lack of “bridge events.”[41] We found 9 families with more than 852 events,
whose time distribution and stacked waveforms are reportedin Figures 10a and 11, respectively. Furthermore, by usingroughly 5 s long windows, we calculated the dominantfrequencies of the stacked waveforms of each family, whichare reported in the insets in Figure 11. In order to evaluatethe repeatability and stationarity of the infrasound source, in30 min long windows we counted both all the detectedevents and only the events belonging to the nine families(called “classified events”). Then, we calculated the per-centages of the classified events with respect to thedetected events in 30 min long windows and plotted themin Figure 10b.
4.2.2. Results[42] In the preeruption phase the triggering algorithm
recognized infrasound events that, thanks to the similarity tothe infrasound transients identified and localized byCannata et al. [2009a, 2009b], were attributed to the activityof NEC. They exhibited peak‐to‐peak amplitude from a fewup to 20 Pa (Figure 9b). By pseudospectrograms and Sompianalysis, we found evidence of a dominant frequency of∼1.2 Hz (Figures 9d and 9e) and a Q value of ∼5 (Figure 9f ).In this phase all the detected events were grouped by cross‐correlation analysis in the family 1 (Figure 10a), whosestacked waveform is reported in Figure 11. The repeatabilityof the NEC events, inferred by cross‐correlation analysis, isconfirmed by the high percentage of classified events withrespect to the detected events (Figure 10b). Further, aslightly increasing trend of dominant frequency was noticedbefore the onset of the activity (Figure 9e).[43] From 05:13 on, we recorded a different type of
infrasound event (Figure 3c, middle) with respect to thoserecorded in the previous phase (Figure 3c, left). During thisfirst eruptive phase infrasonic signal characteristics reflectthe strongly explosive nature of the activity. Indeed, inFigure 9a we noticed a high rate of infrasound events,accompanied by an increase of peak‐to‐peak amplitudes,corresponding to Strombolian explosions on summit ventsof SEC (Figure 8). The normalized pseudospectrogramshows a frequency content in the band 1.5–4.0 Hz (Figure 9d).The infrasound events in this phase were mostly grouped infamilies 2, 3 and 4 (Figure 10a) and the stacking of theirwaveforms is shown in Figure 11. The variability of infra-sound events during the explosive activity is supported by
Figure 8. Seventy seconds of infrasonic signal recorded at ECPN station showing three infrasoundevents and frames of the corresponding explosions recorded by EEV video camera.
SCIOTTO ET AL.: SEISMOACOUSTIC INVESTIGATION AT MT. ETNA B09301B09301
11 of 21
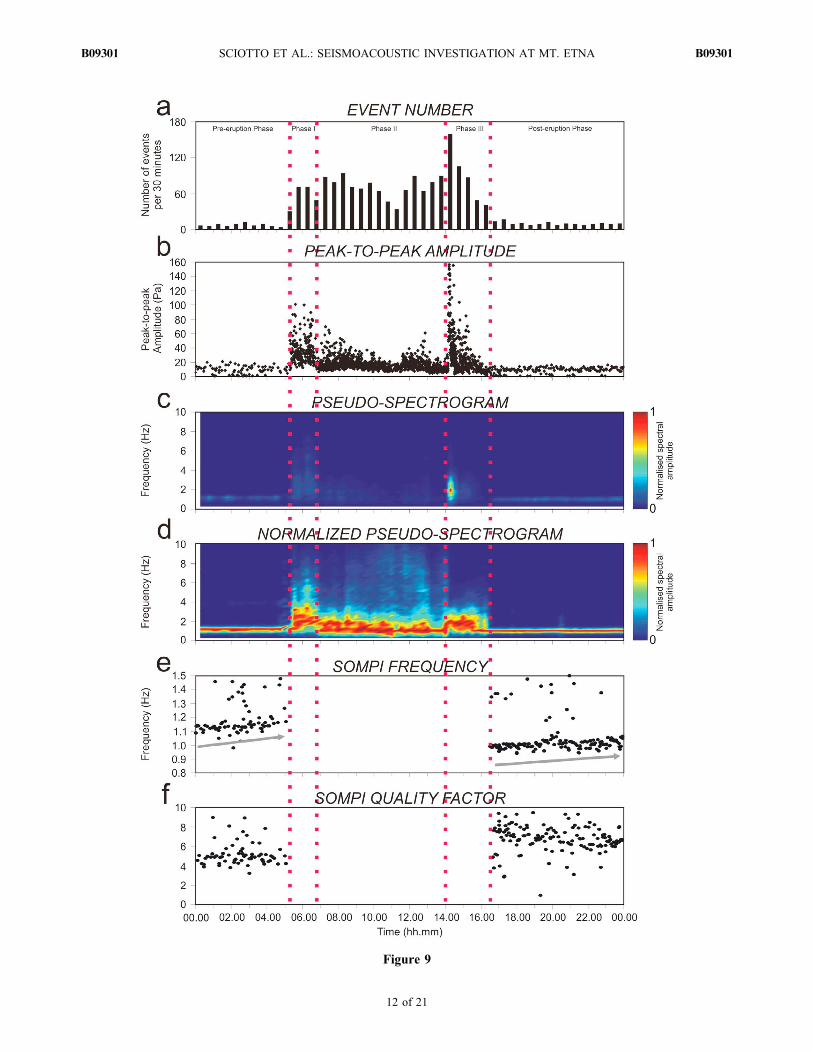
Figure 9
SCIOTTO ET AL.: SEISMOACOUSTIC INVESTIGATION AT MT. ETNA B09301B09301
12 of 21
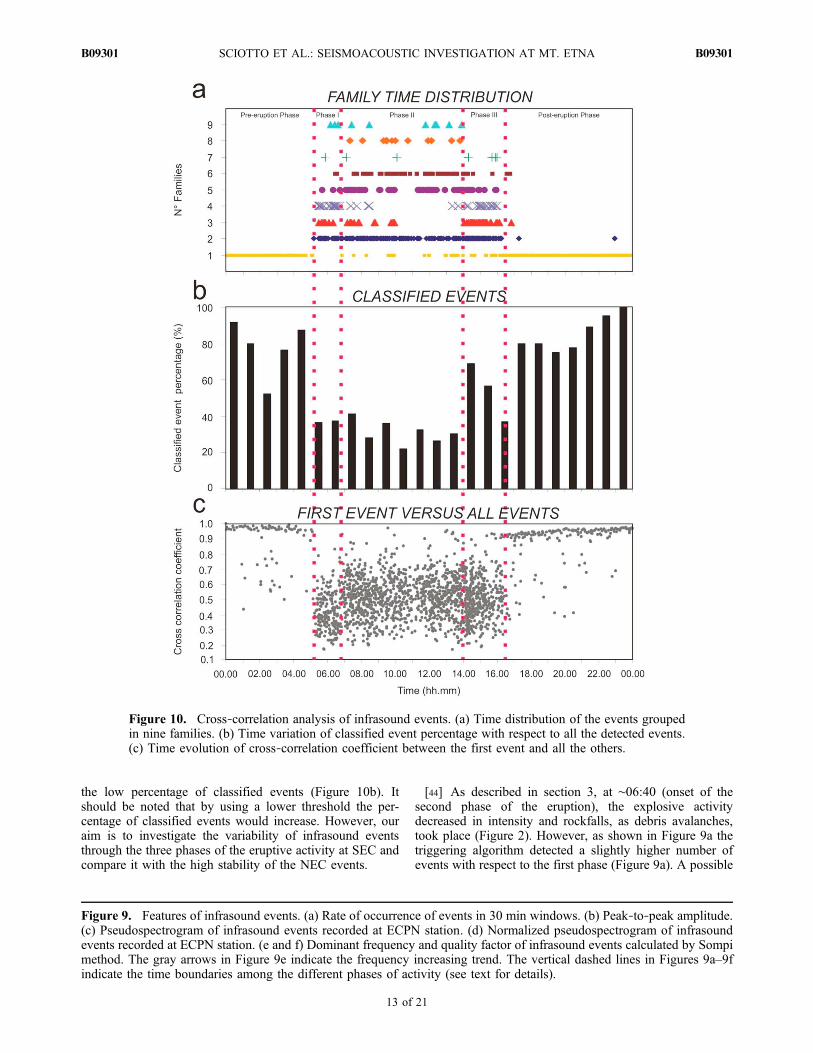
the low percentage of classified events (Figure 10b). Itshould be noted that by using a lower threshold the per-centage of classified events would increase. However, ouraim is to investigate the variability of infrasound eventsthrough the three phases of the eruptive activity at SEC andcompare it with the high stability of the NEC events.
[44] As described in section 3, at ∼06:40 (onset of thesecond phase of the eruption), the explosive activitydecreased in intensity and rockfalls, as debris avalanches,took place (Figure 2). However, as shown in Figure 9a thetriggering algorithm detected a slightly higher number ofevents with respect to the first phase (Figure 9a). A possible
Figure 9. Features of infrasound events. (a) Rate of occurrence of events in 30 min windows. (b) Peak‐to‐peak amplitude.(c) Pseudospectrogram of infrasound events recorded at ECPN station. (d) Normalized pseudospectrogram of infrasoundevents recorded at ECPN station. (e and f) Dominant frequency and quality factor of infrasound events calculated by Sompimethod. The gray arrows in Figure 9e indicate the frequency increasing trend. The vertical dashed lines in Figures 9a–9findicate the time boundaries among the different phases of activity (see text for details).
Figure 10. Cross‐correlation analysis of infrasound events. (a) Time distribution of the events groupedin nine families. (b) Time variation of classified event percentage with respect to all the detected events.(c) Time evolution of cross‐correlation coefficient between the first event and all the others.
SCIOTTO ET AL.: SEISMOACOUSTIC INVESTIGATION AT MT. ETNA B09301B09301
13 of 21

reason for the greater number of detected events is thedecrease in background noise level (testified by the loweredinfrasound RMS; Figure 4a) and then in the dynamic trig-gering threshold allowing the detection of a larger numberof events. This is confirmed by the generally lower peak‐to‐peak amplitude of the events (Figure 9b). The temporalevolution of volcanic phenomena is also highlighted by thedecreasing dominant frequency and the narrowing fre-quency band (Figure 9d). Such decreasing dominant fre-quency is also clearly visible in stacked waveforms anddominant frequencies of families 6, 8 and 9, into which mostof the events of this second phase were grouped (Figures 10aand 11). However, it should be noted that the families didnot always switch between each other; for instance, families2, 5 and 7 are spread out through all the phases (Figure 10a).As in the first phase, the percentage of classified events withrespect to all the detected events is low (Figure 10b). Inother words, the data display a great deal of variability,suggesting that conditions are unstable.[45] Most infrasonic energy was radiated in the third
phase, between the 14:10 and 14:20, as proved by the largestnumber of infrasound events (Figure 9a) and by the highestpeak‐to‐peak and spectral amplitudes (Figures 9b and 9c)during this interval. The events during the third phaseshowed frequency content in the band 1–3 Hz. Most infra-sound events of the third phase were grouped into families2, 3, 4 and 5 (Figure 10a) and were characterized by a fairlygood repeatability, as shown by the high percentage ofclassified events (in particular during 14:10–14:20 interval;Figure 10b). It is interesting to note that families 3 and 4were also observed during the first phase.[46] After the explosive activity at SEC (∼16:30), only
NEC events were again recorded. In this posteruption phase,peak‐to‐peak amplitude values were similar to the pre-eruption phase (Figure 9b). The pseudospectrogram shows adecrease in frequency content, more clearly highlighted by
Sompi analysis, from 1.2 to 1.0 Hz (Figure 9d and 9e), whileQ underwent an increase with a mean value of 7 (Figure 9f).This means that infrasound events during the posteruptionphase had a slower amplitude decay with respect to thepreeruption phase. Also in this phase, NEC events weregrouped in family 1 (Figure 10a) and exhibited a highclustering (Figure 10b). The time distribution of the family 1shows how NEC events also occurred during the eruptiveepisode (Figure 10a), albeit in small numbers.[47] To further investigate such a difference we performed
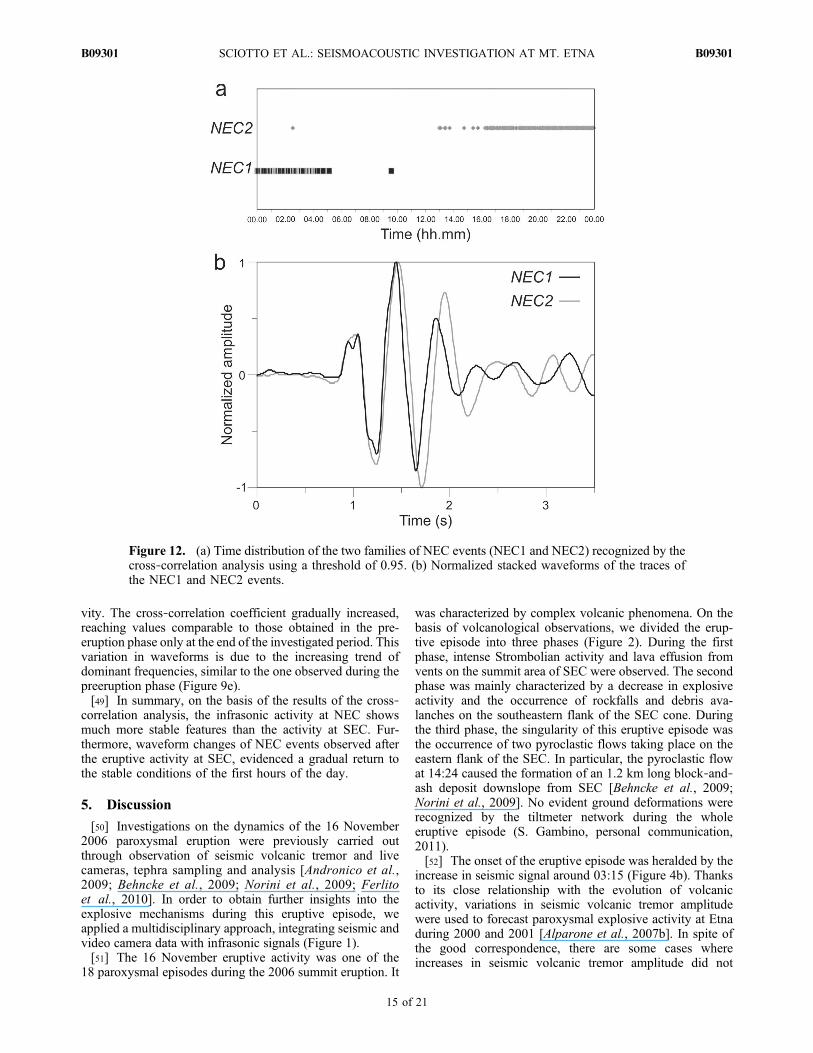
the waveform classification again by increasing the thresh-old up to 0.95 and focusing on NEC events. Thus, twodifferent families of NEC events have been found, calledNEC1 and NEC2. The former preceded and the latter fol-lowed the eruptive activity (Figure 12a). The stackedwaveforms of NEC1 and NEC2, reported in Figure 12b,confirm the results from the frequency domain analyses:NEC2 events are characterized by lower dominant fre-quency and higher Q values than NEC1 events.[48] Finally, we extracted from the cross‐correlation
matrix the cross‐correlation coefficient values calculated bycomparing the first event with all the others (Figure 10c).This kind of plot, also used by some authors to investigatethe variations of Long Period and Very Long Period events[e.g., Stephens and Chouet, 2001; Cannata et al., 2009c],shows the time evolution of all the detected infrasoundevents with respect to a reference one. Before the onset ofthe eruptive activity, most of the cross‐correlation valueswere high and fairly stable. Therefore, since the first event isa NEC event, the infrasonic NEC source seemed to remainfairly steady during this interval. During the eruptiveactivity we noted a sharp decrease in the cross‐correlationvalues, suggesting the activation of different infrasonicsources (the active vents in the SEC area). After the eruptiveactivity the cross‐correlation coefficient increased but didnot immediately reach the values obtained before the acti-
Figure 11. Stacked waveforms of each of the nine families obtained by cross‐correlation analysis. Thedominant frequency is indicated by fd.
SCIOTTO ET AL.: SEISMOACOUSTIC INVESTIGATION AT MT. ETNA B09301B09301
14 of 21
vity. The cross‐correlation coefficient gradually increased,reaching values comparable to those obtained in the pre-eruption phase only at the end of the investigated period. Thisvariation in waveforms is due to the increasing trend ofdominant frequencies, similar to the one observed during thepreeruption phase (Figure 9e).[49] In summary, on the basis of the results of the cross‐
correlation analysis, the infrasonic activity at NEC showsmuch more stable features than the activity at SEC. Fur-thermore, waveform changes of NEC events observed afterthe eruptive activity at SEC, evidenced a gradual return tothe stable conditions of the first hours of the day.
5. Discussion
[50] Investigations on the dynamics of the 16 November2006 paroxysmal eruption were previously carried outthrough observation of seismic volcanic tremor and livecameras, tephra sampling and analysis [Andronico et al.,2009; Behncke et al., 2009; Norini et al., 2009; Ferlitoet al., 2010]. In order to obtain further insights into theexplosive mechanisms during this eruptive episode, weapplied a multidisciplinary approach, integrating seismic andvideo camera data with infrasonic signals (Figure 1).[51] The 16 November eruptive activity was one of the
18 paroxysmal episodes during the 2006 summit eruption. It
was characterized by complex volcanic phenomena. On thebasis of volcanological observations, we divided the erup-tive episode into three phases (Figure 2). During the firstphase, intense Strombolian activity and lava effusion fromvents on the summit area of SEC were observed. The secondphase was mainly characterized by a decrease in explosiveactivity and the occurrence of rockfalls and debris ava-lanches on the southeastern flank of the SEC cone. Duringthe third phase, the singularity of this eruptive episode wasthe occurrence of two pyroclastic flows taking place on theeastern flank of the SEC. In particular, the pyroclastic flowat 14:24 caused the formation of an 1.2 km long block‐and‐ash deposit downslope from SEC [Behncke et al., 2009;Norini et al., 2009]. No evident ground deformations wererecognized by the tiltmeter network during the wholeeruptive episode (S. Gambino, personal communication,2011).[52] The onset of the eruptive episode was heralded by the
increase in seismic signal around 03:15 (Figure 4b). Thanksto its close relationship with the evolution of volcanicactivity, variations in seismic volcanic tremor amplitudewere used to forecast paroxysmal explosive activity at Etnaduring 2000 and 2001 [Alparone et al., 2007b]. In spite ofthe good correspondence, there are some cases whereincreases in seismic volcanic tremor amplitude did not
Figure 12. (a) Time distribution of the two families of NEC events (NEC1 and NEC2) recognized by thecross‐correlation analysis using a threshold of 0.95. (b) Normalized stacked waveforms of the traces ofthe NEC1 and NEC2 events.
SCIOTTO ET AL.: SEISMOACOUSTIC INVESTIGATION AT MT. ETNA B09301B09301
15 of 21
match eruptive activity [e.g., Cannata et al., 2010]. Theincrease in seismic volcanic tremor amplitude of the studiederuptive episode was accompanied by an increase of infra-sonic amplitude (Figure 4a). Explosive volcanic activity iscontrolled by the violent release in the atmosphere of largevolumes of gas in overpressure conditions. This produceslarge pressure perturbations which can be detected asinfrasonic waves [e.g., Ripepe et al., 2009]. For this reason,infrasonic investigation appears to be a simple and usefulmethod for explosive activity detection. At the distancesconsidered here, scattering/dissipitation of atmosphericacoustic waves is less pronounced than for seismic waves[Ripepe et al., 2009], but weather‐dependent effects likewind noise are not easily filtered out, especially if only one
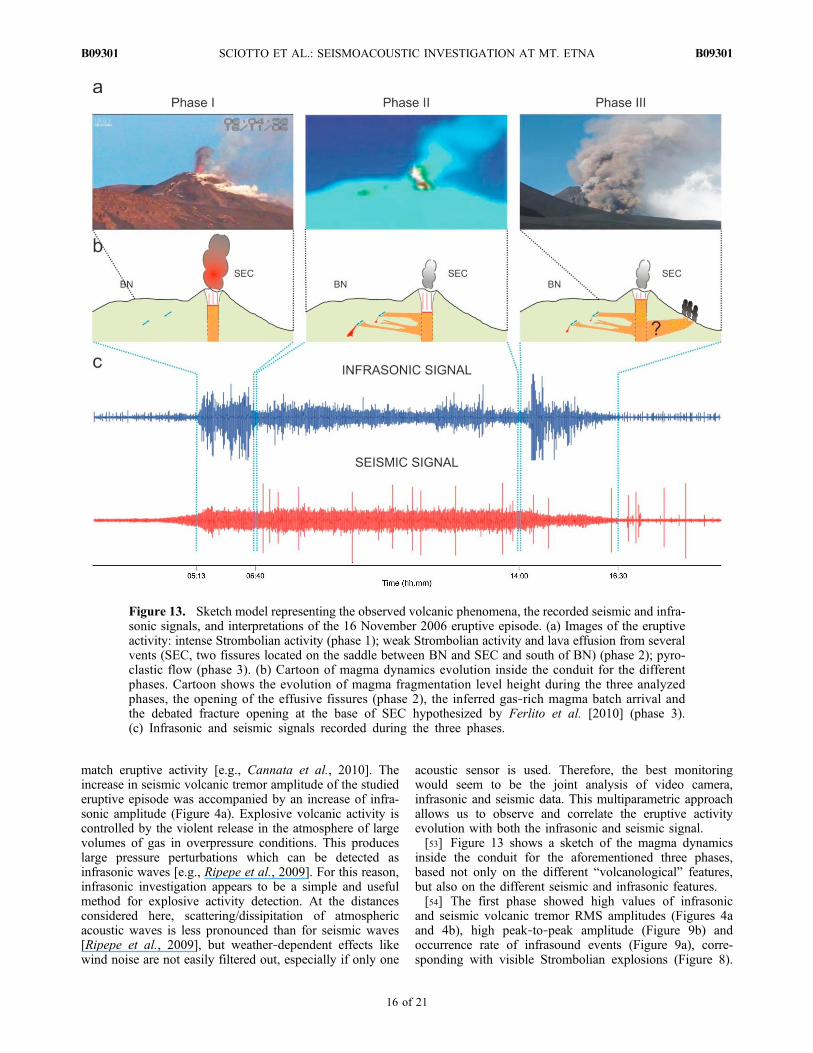
acoustic sensor is used. Therefore, the best monitoringwould seem to be the joint analysis of video camera,infrasonic and seismic data. This multiparametric approachallows us to observe and correlate the eruptive activityevolution with both the infrasonic and seismic signal.[53] Figure 13 shows a sketch of the magma dynamics
inside the conduit for the aforementioned three phases,based not only on the different “volcanological” features,but also on the different seismic and infrasonic features.[54] The first phase showed high values of infrasonic
and seismic volcanic tremor RMS amplitudes (Figures 4aand 4b), high peak‐to‐peak amplitude (Figure 9b) andoccurrence rate of infrasound events (Figure 9a), corre-sponding with visible Strombolian explosions (Figure 8).
Figure 13. Sketch model representing the observed volcanic phenomena, the recorded seismic and infra-sonic signals, and interpretations of the 16 November 2006 eruptive episode. (a) Images of the eruptiveactivity: intense Strombolian activity (phase 1); weak Strombolian activity and lava effusion from severalvents (SEC, two fissures located on the saddle between BN and SEC and south of BN) (phase 2); pyro-clastic flow (phase 3). (b) Cartoon of magma dynamics evolution inside the conduit for the differentphases. Cartoon shows the evolution of magma fragmentation level height during the three analyzedphases, the opening of the effusive fissures (phase 2), the inferred gas‐rich magma batch arrival andthe debated fracture opening at the base of SEC hypothesized by Ferlito et al. [2010] (phase 3).(c) Infrasonic and seismic signals recorded during the three phases.
SCIOTTO ET AL.: SEISMOACOUSTIC INVESTIGATION AT MT. ETNA B09301B09301
16 of 21
Furthermore, similarly to infrasonic data, thermal data,reported by Behncke et al. [2009], exhibited very high valuesduring the first hours of the eruption. Unfortunately, thelimited range of this kind of data, and then the saturatedthermal measurements, did not allow us to verify if thehighest value of apparent temperature was reached duringthe first or the second phase. All these evidences reflect thehighly explosive nature of this first phase.[55] The three recognized families of infrasound events
suggest the presence of simultaneously active sources(Figures 10a and 11). Indeed, sometimes a vent has a uniquesignature and can be distinguished visually from the wave-form character of infrasonic waves [McGreger and Lees,2004; Cannata et al., 2009a, 2009b]. During the studiederuptive episode, at least three vents at the summit area ofSEC produced Strombolian explosions and ash emissions[Behncke et al., 2009].[56] Before the onset of the paroxysmal episode, the
seismic volcanic tremor centroids were located below SECprobably because of the ongoing eruption (Figures 5 and6a). At the beginning of the explosive activity, the seismicvolcanic tremor centroids deepened (Figures 5c and 6b). Asimilar pattern was noticed during lava fountains at SEC in2000 [Alparone et al., 2003] and at VOR in 1999 [Cannataet al., 2008]. As suggested by these authors, we infer thatthe intense Strombolian activity at summit vents of SECwould have enabled a depressurization process, causing theinvolvement of deeper magma and then the deepening of theseismic volcanic tremor source centroids.[57] The VASR ratio, taking into account the coupling
between volcanic activity and both the volcanic edifice andthe atmosphere, was ∼0.2 (Figure 4d) and the coherencebetween seismic and infrasonic signals reached a maximumvalue of 0.5 (Figure 4g). Such coherence values lead us tohypothesize that in the first phase at least the shallowestcomponent of seismic volcanic tremor was well coupledwith explosive activity, and then seismic and infrasonicsignals shared a common source. During the first phase, RDexhibited a mean value of 34 cm2, reaching the maximumvalue of 45 cm2, which at Mt. Etna, in literature, is asso-ciated to intense Strombolian activity and lava fountain [e.g.,Privitera et al., 2003; Alparone et al., 2003].[58] Successively, during the second phase, changes in the
infrasonic sources were observed, testified by both lowerinfrasonic RMS (Figure 4a) and event peak‐to‐peakamplitudes (Figure 9b), in agreement with the decreasingexplosive activity. Furthermore, slightly different infrasonicwaveforms were detected. It is worth noting that a clear cutswitching of families from first to second phase was notfound, though infrasound events certainly underwent adecrease in frequency and increased variations in thewaveform characteristics (Figures 10a and 11).[59] The westward migration of seismic volcanic tremor
centroids (Figures 5a and 6c), leading to the slight seismicRMS increase at ECPN station (Figure 4b), occurred at thesame time as the reactivation of two effusive fissureslocated on the saddle between BN and SEC and south of BN(Figure 2). The opposite behaviors of infrasonic and seismicRMS caused a decrease in VASR values (Figure 4d).Moreover, the very low values of coherence (up to 0.25;Figure 4g) suggest the decoupling between seismic andinfrasonic sources during this phase. Late in the second
phase, the temporal evolution of thermal data [Behnckeet al., 2009] followed a similar trend to infrasonic RMS,undergoing a decrease until ∼12:00 and a slight increase forthe rest of the second phase.[60] The decrease in the explosive activity and the
resulting reduction of infrasonic energy were likely due tothe opening of the two aforementioned effusive fissures.Indeed, according to the model by Ripepe et al. [2005,2009] for the 2003 and 2007 Stromboli eruptions, theopening of effusive fractures might cause a reduction inmagma column height. The lower level of magma within theconduit and the consequent deepening of the fragmentationlevel led to a decrease in gas overpressure and therefore inthe explosive activity.[61] In the light of this interpretation, we can formulate
hypotheses about the observed changes in the infrasoundevent waveforms. Assuming propagation effects are negli-gible, changes in waveforms mainly imply variations insource mechanisms. For instance, taking into considerationthe Strombolian bubble vibration model [Vergniolle et al.,2004], then infrasonic waveforms depend closely on over-pressure and bubble dimension, linked to vent/conduitgeometry. In view of this, the inferred deepening of frag-mentation level and hence the different conditions of theinfrasound generation (e.g., conduit geometry and over-pressure) could have caused variations in the infrasoundevent waveforms from the first to the second phase. On theother hand, as suggested by Johnson and Aster [2005], alsothe VASR decrease could be related to such a deepening ofthe fragmentation level.[62] During the third phase, the contrasting behavior
between infrasonic and seismic signal became more pro-nounced: indeed, at the onset of this phase the infrasonicsignal underwent a very sharp increase from 14:05, reachingthe highest RMS values of the whole episode at 14:12, whilethe seismic amplitude from 14:13 gradually decreased(Figures 4a and 4b). In addition, at least three other RMSpeaks were observed at 14:26, 14:46 and 15:06. Owing tothe cloud cover a comparison with thermal data was notpossible during the whole of the third phase. Most infrasonicenergy of this phase was radiated between the 14:10 and14:30, as also testified by the largest number (Figure 9a) andhighest peak‐to‐peak amplitudes (Figure 9b) of infrasoundevents. These showed highly comparable waveforms to theinfrasound events detected during the first phase (Figures 10aand 11), but were characterized by a higher repeatability(Figure 10b), suggesting the presence of very similar sta-tionary and repeatable infrasonic sources to those observedduring the first phase. During this short time span 14:10–14:30, coherence exhibited the highest value (Figure 4g) ofthe paroxysmal episode, again indicating a good couplingbetween the two signals. Indeed, at 14:10–14:15, at the sametime as the maximum peak of the infrasonic activity wasreached, the tremor source centroids shifted below SEC atvery shallow depth. The progressive shallowing of the seis-mic volcanic tremor centroids during the third phase testifiedto the reduced activity of the deeper sources not directlyassociated with infrasonic sources. Apparently in contrastwith coherence results, VASR reached the highest value(Figure 4d). Assuming of a coupling of infrasonic and seismicsignals, such high VASR, together with the very highrecorded infrasonic energy, could be due to pressurized
SCIOTTO ET AL.: SEISMOACOUSTIC INVESTIGATION AT MT. ETNA B09301B09301
17 of 21
volatiles which expand explosively without entraining muchash and/or to a shallowing of fragmentation level, whichwould allow for an unimpeded explosion [Johnson andAster, 2005]. Both these phenomena could be caused bythe arrival of a batch of gas‐rich magma, below the SEC,that is likely due to the depressurization of the shallowplumbing system as suggested by Ferlito et al. [2010]. Infact, the acceleration of the collapse phenomena of the SECflank, taking place at 13:45–14:00, just before the RMSinfrasound major peak, could have favored gas exolution ofthe upper part of the magma column. Then, such an increasein the magma gas content may have intensified infrasoundactivity and caused the pressure rise in the shallow part ofmagma column. The pressurization of shallow parts of SECplumbing system may have led to the opening of a shortfissure in the weakened part of the cone, as often observedon the SEC flanks during paroxysmal episodes [e.g.,Alparone et al., 2003; Andronico and Corsaro, 2011;Behncke, 2009]. The opening of an eruptive fissure justbefore the pyroclastic flow at 14:25, also inferred by Noriniet al. [2009] and Ferlito et al. [2010], could have caused theinteraction between intruding magma and fluid‐soakedrocks with a similar mechanism to that hypothesized byBehncke et al. [2009].[63] On the other hand, besides the depth of the explosive
source and the overpressure inside the bubble, the acousticenergy increase during the third phase could also be due tochanges in the typical time associated with film bursting[Divoux et al., 2008; Vidal et al., 2010]. According toexperiments carried out by Vidal et al. [2010], film rupturetime is mainly affected by viscosity, temperature and vola-tile content of the magma film layer above the bubbles. Inparticular, with a decreasing viscosity the film rupturevelocity should be faster and consequently the amplitude ofthe recorded acoustic signal larger. Also in this case, theabove cited increase in magma gas content can lead to aviscosity decrease, which can be considered an additionalcause for the very high values of both infrasonic energy andVASR.[64] It is noteworthy that the pyroclastic flow at 14:25 was
accompanied by no detectable infrasound transients. Theremaining part of the phase was characterized by a gradualdecrease in the energy of seismic and infrasonic signals,accompanying the weakening explosive activity at the endof the eruptive episode (Figures 4a and 4b).[65] Infrasonic activity before and after the paroxysmal
episode at SEC consisted mainly of amplitude transients,related to NEC activity, as displayed in the infrasonic heli-corder and RMS (Figures 3b and 4a, respectively). Withrespect to the SEC events, the NEC ones were characterizedby steadier waveforms suggesting a highly repeatable source(Figure 10b). However, slight waveform changes in theNEC events, highlighted by cross‐correlation and spectralanalyses and consisting of both decrease of dominant fre-quency (from ∼1.2 to 1.0 Hz) and increase of Q values (from∼5.0 to 7.0), were observed after the eruptive activity(Figures 9e, 9f, 10c, and 12). It is noteworthy that during thefew hours of the posteruption phase, cross‐correlationcoefficient, frequency and Q values showed gradual trendstoward the preeruption conditions (Figures 9e, 9f, and 10c).Spectral changes in NEC infrasound events after an explo-sive activity at SEC had already been observed at Etna after
the lava fountain of 10 May 2008 [Di Grazia et al., 2009].The hypothesis of a branched shallow system feeding Etnasummit craters has already been suggested by Marchettiet al. [2009b] in an array analysis carried out duringSeptember–November 2006. These authors noted a switch-ing of infrasonic source location between NEC and SECuntil October 27. Thus, the detection of NEC events duringthe eruptive activity at SEC is in agreement with thebehavior observed by Marchetti et al. [2009b] after 27October 2006.[66] To further investigate the aforementioned spectral
variations we modeled the source mechanism of NEC eventsas the acoustic resonance of a fluid‐filled conduit [Garcésand McNutt, 1997]. Such a mechanism of acoustic genera-tion has also been demonstrated with laboratory experiments[e.g., Vidal et al., 2006]. We assumed that NEC infrasoundevents are generated by longitudinal acoustic resonance, anddid not take into account radial modes [e.g., Hagerty et al.,2000; De Angelis and McNutt, 2007]. In fact, at the fre-quency considered, the wavelengths of the acoustic waves inthe fluid are greater than the width of the conduit andconsequently the longitudinal modes are dominant [Garcésand McNutt, 1997]. Moreover, during May 2008 someNEC infrasound events were characterized by a fundamentalmode and an integer harmonic, supporting the acousticresonance model [Cannata et al., 2009a]. Therefore, at firstapproximation, the fundamental resonating frequencydepends on two parameters, the conduit length (L) and thefluid sound speed inside the conduit (cc), and is given byGarcés and McNutt [1997] as
f0 ¼ cc2L
ð6Þ
[67] The sound speed inside the conduit is subject tostrong variations depending on the chemical/physicalproperty of fluid filling the conduit. Morrissey and Chouet[2001] suggest cc values from ∼400 to 1000 m/s for apure gas mixture. If the fluid is a bubbly magma, cc canrange between 300 and 2500 m/s [Aki et al., 1977; Muraseand McBirney, 1973]. Assuming 300 and 2500 m/s as thelower and the upper limit, respectively, and for a frequencyequal to 1.2 Hz, the conduit length ranges between ∼150 and1050 m.[68] On the basis of the decrease in frequency of 0.2 Hz,
we inferred (1) a length increase of ∼20%, or (2) a soundspeed decrease of ∼20%, or finally (3) both these variationswith different percentage. In light of this, the observedspectral changes could be related to either variations in thefluid chemical/physical property (such as changes in gasconcentrations, temperature and pressure [e.g., Kumagaiand Chouet, 2000; Morrissey and Chouet, 2001]) or con-duit geometry/size variations [e.g., Garcés and McNutt,1997; Kumagai and Chouet, 2000, 2001].[69] If we consider the conduit portion above the frag-
mentation level, filled with a gas mixture, as the resonatingpart, a length increase would mean a drop in magma column,while a sound speed decrease would mean a variation in thegeochemical/physical properties of this gas mixture (e.g.,changes in density and composition of the volatile phases).The former hypothesis is consistent with the withdrawal ofmagma and the subsequent emptying of the shallow portion
SCIOTTO ET AL.: SEISMOACOUSTIC INVESTIGATION AT MT. ETNA B09301B09301
18 of 21
of the plumbing system due to the eruption. In this case,assuming a value of sound speed of 500 m/s (used also byFee et al. [2010]), a decrease in frequency of 0.2 Hz wouldimply a drop in magma level of 40 m (in particular a conduitlength increase from 210 to 250 m). As a consequence, themagma fragmentation level should be situated at a depth of210–250 m from NEC summit. This value is consistent withdepths estimated at Etna [Gresta et al., 2004] and othervolcanoes (e.g., Shishaldin [Petersen and McNutt, 2007] andStromboli [Marchetti et al., 2008]).[70] The drop in the magma column (e.g., the length
increase of the resonating part of the conduit) would alsoexplain the Q value increase of the NEC infrasound events.Q parameter can be considered a measure of the decay time.Experiments carried out by Vidal et al. [2006] demonstratedthat the damping time increases when the fundamental fre-quency decreases as a function of the conduit length.[71] Concerning the latter hypothesis (sound speed
decrease), Morrissey and Chouet [2001], assuming a gas‐gas mixture fluid (H2O‐CO2 or H2O‐SO2) at 800°K,obtained a decrease in sound speed of ∼20% by adding 50%of CO2 or SO2. Moreover, such a decrease in sound speedwould also imply an increase of the impedance contrastbetween the resonating fluids and the surrounding rocks[e.g., Sturton and Neuberg, 2006], with a consequent sloweramplitude decay testified by the Q value increase (Figure 9f)[e.g., Sturton and Neuberg, 2006]. If the resonating part ofthe conduit is filled with bubbly magma, a length increasewould imply a shallowing of the fragmentation level, whilesound speed decrease could mean an increase in gas volumefraction. On the basis of recent studies [e.g., Fee et al.,2010] that modeled infrasound signals as due to gas filledcavities/conduits resonance, we disregard the last hypothesisand consider the conduit portion above the magma frag-mentation level as the resonating infrasonic source.[72] Following this assumption and taking into account
the intense explosive activity occurring at summit area ofthe SEC, we believe the idea that the frequency decreaseobserved at the end of the eruptive episode is more likelydue to a drop in the magma column, caused by the emissionof a large amount of gas‐rich magma, than to an increase ofCO2 or SO2. In support of this hypothesis is the frequencyincrease observed during both the preeruption and poster-uption phases (Figure 9e), which could be explained by arise of the magma column because of the oncoming eruptionand a return to the preeruption condition, respectively.[73] The occurrence of such variations of the NEC events
at the same time as SEC activity leads us to infer the exis-tence of a link in the plumbing systems feeding these twocraters.
6. Conclusions
[74] The paroxysmal Etnean eruption of 16 November2006 at SEC was investigated by a multiparametric analysisof seismic, infrasonic and video camera recordings. Thewaveform characterization of infrasound events, by meansof cross‐correlation and spectral analyses, confirmed theexistence of different vents, either contemporaneously activeor switching from one to the other in the summit area ofSEC. On the basis of infrasound, a gas enrichment of theshallow magma column, preceding the pyroclastic flows by
a few minutes and likely causing them, was clearly inferred.Such an enrichment was probably triggered by a depres-surization phenomenon. Finally, we related the source ofNEC infrasound events to the acoustic resonance of theconduit portion filled with gas mixture. In light of thismodel, the observed spectral changes in the NEC infrasoundevents confirm the existence of a link in the plumbingsystems feeding NEC and SEC.[75] The present work is an example of the ability of the
joint analysis of infrasonic, seismic and video camera data totrack the evolution of volcanic activity in detail, demon-strating the utility of a multiparametric approach that couldbe used in any active volcanic environment.
[76] Acknowledgments. We thank the Associate Editor MicolTodesco and three anonymous reviewers for their useful comments andsuggestions which helped us improve the paper. We are grateful to BorisBehncke, Carmelo Ferlito, and Simona Scollo for the very constructive dis-cussions. We acknowledge Stephen Conway for revising and improving theEnglish. This research has been supported by grants INGV‐DPC 2005–2007 (projects V3_5_Vulcano and V3_6_Etna) and INGV‐DPC 2008–2010 (projects V1‐Unrest and V3‐Lava).
ReferencesAiuppa, A., et al. (2010), Patterns in the recent 2007–2008 activity ofMount Etna volcano investigated by integrated geophysical and geo-chemical observations, Geochem. Geophys. Geosyst., 11, Q09008,doi:10.1029/2010GC003168.
Aki, K., and R. Koyanagi (1981), Deep volcanic tremor and magma ascentmechanism under Kilauea, Hawaii, J. Geophys. Res., 86, 7095–7109,doi:10.1029/JB086iB08p07095.
Aki, K., M. Fehler, and S. Das (1977), Source mechanism of volcanictremor: Fluid driven cracks models and their application to the 1963Kilauea eruption, J. Volcanol. Geotherm. Res., 2, 259–287, doi:10.1016/0377-0273(77)90003-8.
Alparone, S., D. Andronico, L. Lodato, and T. Sgroi (2003), Relationshipbetween tremor and volcanic activity during the Southeast Crater erup-tion on Mount Etna in early 2000, J. Geophys. Res., 108(B5), 2241,doi:10.1029/2002JB001866.
Alparone, S., B. Behncke, S. Giammanco, M. Neri, and E. Privitera (2005),Paroxysmal summit activity at Mt. Etna (Italy) monitored through contin-uous soil radon measurements, Geophys. Res. Lett., 32, L16307,doi:10.1029/2005GL023352.
Alparone, S., A. Cannata, and S. Gresta (2007a), Time variation of spectraland wavefield features of volcanic tremor at Mt. Etna (January–June1999), J. Volcanol. Geotherm. Res., 161, 318–332, doi:10.1016/j.jvolgeores.2006.12.012.
Alparone, S., D. Andronico, T. Sgroi, F. Ferrari, L. Lodato, and D. Reitano(2007b), Alert system to mitigate tephra fallout hazards at Mt. Etnavolcano, Italy, Nat. Hazards, 43, 333–350, doi:10.1007/s11069-007-9120-7.
Andronico, D., and R. A. Corsaro (2011), Lava fountains during the epi-sodic eruption of Southeast Crater (Mt. Etna), 2000: Insights intomagma‐gas dynamics within the shallow volcano plumbing system, Bull.Volcanol., doi:10.1007/s00445-011-0467-y, in press.
Andronico, D., S. Scollo, A. Cristaldi, and F. Ferrari (2009), Monitoring ashemission episodes at Mt. Etna: 16 November 2006 case study, J. Volcanol.Geotherm. Res., 180, 123–134, doi:10.1016/j.jvolgeores.2008.10.019.
Barani, S., G. Ferretti, M. Massa, and D. Spallarossa (2007), The waveformsimilarity approach to identify dependent events in instrumental seismiccatalogues, Geophys. J. Int., 168, 100–108, doi:10.1111/j.1365-246X.2006.03207.x.
Behncke, B. (2009), Hazards from pyroclastic density currents at Mt. Etna(Italy), J. Volcanol. Geotherm. Res., 180, 148–160, doi:10.1016/j.jvolgeores.2008.09.021.
Behncke, B., S. Calvari, S. Giammanco, M. Neri, and H. Pinkerton (2008),Pyroclastic density currents resulting from the interaction of basalticmagma with hydrothermally altered rock: An example from the 2006summit eruptions of Mount Etna, Italy, Bull. Volcanol., 70, 1249–1268,doi:10.1007/s00445-008-0200-7.
Behncke, B., S. Falsaperla, and E. Pecora (2009), Complex magmadynamics at Mount Etna revealed by seismic, thermal, and volcanologicaldata, J. Geophys. Res., 114, B03211, doi:10.1029/2008JB005882.
SCIOTTO ET AL.: SEISMOACOUSTIC INVESTIGATION AT MT. ETNA B09301B09301
19 of 21
Boatwright, J. (1980), A spectral theory for circular seismic sources:Simple estimates of source dimension, dynamic stress drop, and radiatedseismic energy, Bull. Seismol. Soc. Am., 70(1), 1–27.
Cannata, A., A. Catania, S. Alparone, and S. Gresta (2008), Volcanictremor at Mt. Etna: Inferences on magma dynamics during effusive andexplosive activity, J. Volcanol. Geotherm. Res., 178, 19–31, doi:10.1016/j.jvolgeores.2007.11.027.
Cannata, A., P. Montalto, E. Privitera, G. Russo, and S. Gresta (2009a),Tracking eruptive phenomena by infrasound: May 13, 2008 eruption atMt. Etna, Geophys. Res. Lett., 36, L05304, doi:10.1029/2008GL036738.
Cannata, A., P. Montalto, E. Privitera, and G. Russo (2009b), Character-ization and location of infrasonic sources in active volcanoes: Mt. Etna,September–November 2007, J. Geophys. Res., 114 , B08308,doi:10.1029/2008JB006007.
Cannata, A., M. Hellweg, G. Di Grazia, S. Ford, S. Alparone, S. Gresta,P. Montalto, and D. Patanè (2009c), Long period and very long periodevents at Mt. Etna volcano: Evidence of strong time variability and strictinterrelationship, J. Volcanol. Geotherm. Res., 187, 227–249,doi:10.1016/j.jvolgeores.2009.09.007.
Cannata, A., G. Di Grazia, P. Montalto, F. Ferrari, G. Nunnari, D. Patanè,and E. Privitera (2010), New insights into banded tremor from the 2008–2009 Mt. Etna eruption, J. Geophys. Res., 115, B12318, doi:10.1029/2009JB007120.
Cooley, J. W., and J. W. Tukey (1965), An algorithm for the machinecalculation of complex Fourier series, Math. Comput., 19, 297–301,doi:10.1090/S0025-5718-1965-0178586-1.
De Angelis, S., and S. R. McNutt (2007), Observations of volcanic tremorduring the January–February 2005 eruption of Mt. Veniaminof, Alaska,Bull. Volcanol., 69, 927–940, doi:10.1007/s00445-007-0119-4.
Di Grazia, G., S. Falsaperla, and H. Langer (2006), Volcanic tremor loca-tion during the 2004 Mount Etna lava effusion, Geophys. Res. Lett., 33,L04304, doi:10.1029/2005GL025177.
Di Grazia, G., A. Cannata, P.Montalto, D. Patanè, E. Privitera, L. Zuccarello,and E. Boschi (2009), A multiparameter approach to volcano monitoringbased on 4D analyses of seismo‐volcanic and acoustic signals: The 2008Mt. Etna eruption, Geophys. Res. Lett., 36, L18307, doi:10.1029/2009GL039567.
Divoux, T., V. Vidal, F. Melo, and J. C. Géminard (2008), Acoustic emis-sion associated with the bursting of a gas bubble at the free surface ofa non‐newtonian fluid, Phys. Rev. E, 77, 056310, doi:10.1103/PhysRevE.77.056310.
Fee, D.,M. A. Garcés,M. Patrick, B. A. Chouet, P. Dawson, and D. Swanson(2010), Infrasonic harmonic tremor and degassing bursts from Halema’uma’u Crater, Kilauea volcano, Hawaii, J. Geophys. Res., 115, B11316,doi:10.1029/2010JB007642.
Ferlito, C., M. Viccaro, E. Nicotra, and R. Cristofolini (2010), Relationshipbetween the flank sliding of the Southeast Crater (Etna, Italy) and the par-oxysmal event of November 16, 2006, Bull. Volcanol., 72, 1179–1190,doi:10.1007/s00445-010-0384-5.
Firstov, P. P., and N. M. Kravchenko (1996), Estimation of the amount ofexplosive gas released in volcanic eruptions using air waves, Volcanol.Seismol., 17, 547–560.
Garcés, M. A., and S. R. McNutt (1997), Theory of the airborne sound fieldgenerated in a resonant magma conduit, J. Volcanol. Geotherm. Res., 78,155–178, doi:10.1016/S0377-0273(97)00018-8.
Garcés, M. A., M. T. Hagerty, and S. Y. Schwartz (1998), Magma acousticsand time‐varying melt properties at Arenal volcano, Costa Rica, Geophys.Res. Lett., 25, 2293–2296, doi:10.1029/98GL01511.
Garcés, M. A., A. Harris, C. Hetzer, J. B. Johnson, S. Rowland, E. Marchetti,and P. Okubo (2003), Infrasonic tremor observed at Kilauea volcano,Hawaii, Geophys. Res. Lett., 30(20), 2023, doi:10.1029/2003GL018038.
Gerst, A., M. Hort, P. R. Kyle, and M. Vöge (2008), 4D velocity ofStrombolian eruptions and man‐made explosions derived from multipleDoppler radar instruments, J. Volcanol. Geotherm. Res., 177, 648–660,doi:10.1016/j.jvolgeores.2008.05.022.
Green, D., and J. Neuberg (2006), Waveform classification of volcaniclow‐frequency earthquake swarms and its implication at Soufrière Hillsvolcano, Monserrat, J. Volcanol. Geotherm. Res., 153 , 51–63,doi:10.1016/j.jvolgeores.2005.08.003.
Gresta, S., A. Montalto, and G. Patanè (1991), Volcanic tremor at Mt. Etna(January 1984–March 1985): Its relationship to the eruptive activity andmodelling of the summit feeding system, Bull. Volcanol., 53, 309–320,doi:10.1007/BF00414527.
Gresta, S., M. Ripepe, E. Marchetti, S. D’Amico, M. Coltelli, A. J. L. Harris,and E. Privitera (2004), Seismoacoustic measurements during the JulyAugust 2001 eruption at Mt. Etna volcano, Italy, J. Volcanol. Geotherm.Res., 137, 219–230, doi:10.1016/j.jvolgeores.2004.05.017.
Hagerty, M. T., S. Y. Schwartz, M. A. Garcés, and M. Protti (2000),Analysis of seismic and acoustic observations at Arenal volcano, Costa
Rica, 1995–1997, J. Volcanol. Geotherm. Res. , 101 , 27–65,doi:10.1016/S0377-0273(00)00162-1.
Johnson, J. B. (2003), Generation and propagation of infrasonic airwavesfrom volcanic explosions, J. Volcanol. Geotherm. Res., 121, 1–14,doi:10.1016/S0377-0273(02)00408-0.
Johnson, J. B. (2007), On the relation between, infrasound, seismicity, andsmall pyroclastic explosions at Karymsky volcano, J. Geophys. Res.,112, B08203, doi:10.1029/2006JB004654.
Johnson, J. B., and R. C. Aster (2005), Relative partitioning of acoustic andseismic energy during Strombolian eruptions, J. Volcanol. Geotherm.Res., 148, 334–354, doi:10.1016/j.jvolgeores.2005.05.002.
Johnson, J. B., and J. M. Lees (2000), Plugs and chugs: Seismic andacoustic observations of degassing explosions at Karymsky, Russia andSangay, Ecuador, J. Volcanol. Geotherm. Res., 101, 67–82, doi:10.1016/S0377-0273(00)00164-5.
Johnson, J. B., R. C. Aster, M. C. Ruiz, S. D. Malone, P. J. McChesney,J. M. Lees, and P. R. Kyle (2003), Interpretation and utility of infrasonicrecords from erupting volcanoes, J. Volcanol. Geotherm. Res., 121,15–63, doi:10.1016/S0377-0273(02)00409-2.
Johnson, J. B., A. J. L. Harris, S. T. M. Sahetapy‐Engel, R. Wolf, andW. I. Rose (2004), Explosion dynamics of pyroclastic eruptions atSantiaguito volcano, Geophys. Res. Lett., 31, L06610, doi:10.1029/2003GL019079.
Johnson, J. B., M. C. Ruiz, J. M. Lees, and P. Ramón (2005), Poor scalingbetween elastic energy release and eruption intensity at Tungurahuavolcano, Ecuador, Geophys. Res. Lett., 32, L15304, doi:10.1029/2005GL022847.
Johnson, J. B., R. Aster, K. R. Jones, P. Kyle, and B. McIntosh (2008),Acoustic source characterization of impulsive Strombolian eruptionsfrom the Mount Erebus lava lake, J. Volcanol. Geotherm. Res., 177,673–686, doi:10.1016/j.jvolgeores.2008.06.028.
Kumagai, H., and B. A. Chouet (2000), Acoustic properties of a crackcontaining magmatic or hydrothermal fluids, J. Geophys. Res., 105,25,493–25,512, doi:10.1029/2000JB900273.
Kumagai, H., and B. A. Chouet (2001), The dependence of acoustic prop-erties of a crack on the resonance mode and geometry, Geophys. Res.Lett., 28, 3325–3328, doi:10.1029/2001GL013025.
Kumazawa, M., Y. Imanishi, Y. Fukao, M. Furumoto, and A. Yamamoto(1990), A theory of spectral analysis based on the characteristic propertyof a linear dynamic system, Geophys. J. Int., 101, 613–630, doi:10.1111/j.1365-246X.1990.tb05574.x.
Lesage, P. (2008), Automatic estimation of optimal autoregressive filtersfor the analysis of volcanic seismic activity, Nat. Hazards Earth Syst.Sci., 8, 369–376, doi:10.5194/nhess-8-369-2008.
Marchetti, E., M. Ripepe, G. Uliveri, M. Burton, T. Caltabiano, andG. Salerno (2008), Gas flux rate migration of the magma column, inThe Stromboli Volcano, An Integrated Study of the 2002–2003 Eruption,Geophys. Monogr. Ser., vol. 182, edited by S. Calvari et al., pp. 259–267,AGU, Washington, D. C.
Marchetti, E., M. Ripepe, A. J. L. Harris, and D. Delle Donne (2009a),Tracing the differences between Vulcanian and Strombolian explosionsusing infrasonic and thermal radiation energy, Earth Planet. Sci. Lett.,279, 273–281, doi:10.1016/j.epsl.2009.01.004.
Marchetti, E., M. Ripepe, G. Uliveri, S. Caffo, and E. Privitera (2009b),Infrasonic evidences for branched conduit dynamics at Mt. Etna volcano,Italy, Geophys. Res. Lett., 36, L19308, doi:10.1029/2009GL040070.
Martini, M., F. Giudicepietro, L. D’Auria, A. M. Esposito, T. Caputo,R. Curciotti, W. De Cesare, M. Orazi, G. Scarpato, and A. Caputo(2007), Seismological monitoring of the February 2007 effusive eruptionof the Stromboli volcano, Ann. Geophys., 50, 775–788.
Matoza, R. S., M. A. H. Hedlin, and M. A. Garcés (2007), An infra-sound array study of Mount St. Helens, J. Volcanol. Geotherm. Res.,160, 249–262, doi:10.1016/j.jvolgeores.2006.10.006.
Matoza, R. S., M. A. Garcés, B. A. Chouet, L. D’Auria, H. Hedlin, C. DeGrooth‐Hedlin, and G. P. Waite (2009a), The source of infrasound asso-ciated with long‐period events at Mount St. Helens, J. Geophys. Res.,114, B04305, doi:10.1029/2008JB006128.
Matoza, R. S., D. Fee, M. A. Garcés, J. M. Seiner, P. A. Ramon, andM. A. H. Hedlin (2009b), Infrasonic jet noise from volcanic eruptions,Geophys. Res. Lett., 36, L08303, doi:10.1029/2008GL036486.
Matoza, R. S., D. Fee, and M. A. Garcés (2010), Infrasonic tremor wave-field of the Pu’u’Ō’ō crater complex and lava tube system, Hawaii, inApril 2007, J. Geophys. Res., 115, B12312, doi:10.1029/2009JB007192.
McGreger, A. D., and J. M. Lees (2004), Vent discrimination at Strombolivolcano, Italy, J. Volcanol. Geotherm. Res., 137, 169–185, doi:10.1016/j.jvolgeores.2004.05.007.
McNutt, S. R., H. Rymer, and J. Stix (2000), Synthesis of volcanomonitoring, in Encyclopedia of Volcanoes, edited by H. Sigurdsson et al.,pp. 1167–1185, Academic, San Diego, Calif.
SCIOTTO ET AL.: SEISMOACOUSTIC INVESTIGATION AT MT. ETNA B09301B09301
20 of 21
Montalto, P., A. Cannata, E. Privitera, S. Gresta, G. Nunnari, and D. Patanè(2010), Towards an automatic monitoring system for infrasonic events atMt. Etna: Strategies for source location and modelling, Pure Appl.Geophys., 167, 1215–1231, doi:10.1007/s00024-010-0051-y.
Moran, S. C., P. J. McChesney, and A. B. Lockhart (2008a), Seismicity andinfrasound associated with explosions at Mount St. Helens, 2004–2005,in A Volcano Rekindled; The Renewed Eruption of Mount St. Helens,2004–2006, edited by D. R. Sherrod, W. E. Scott, and P. H. Stauffer, U.S.Geol. Surv. Prof. Pap., 1750, 111–127.
Moran, S. C., R. S.Matoza,M. A. Garcés, H. Hedlin, D. Bowers,W. E. Scott,D. R. Sherrod, and J. W. Vallance (2008b), Seismic and acoustic record-ings of an unusually large rockfall at Mount St. Helens, Washington,Geophys. Res. Lett., 35, L19302, doi:10.1029/2008GL035176.
Morrissey, M. M., and B. A. Chouet (2001), Trends in long‐period seismic-ity related to magmatic fluid compositions, J. Volcanol. Geotherm. Res.,108, 265–281, doi:10.1016/S0377-0273(00)00290-0.
Morrissey, M. M., M. A. Garcés, K. Ishihara, and M. Iguchi (2008), Anal-ysis of infrasonic and seismic events related to the 1998 Vulcanian erup-tion at Sakurajima, J. Volcanol. Geotherm. Res., 175, 315–324,doi:10.1016/j.jvolgeores.2008.03.008.
Murase, T., and A. R. McBirney (1973), Properties of some commonigneous rocks and their melts at high temperatures, Geol. Soc. Am. Bull.,84, 3563–3592, doi:10.1130/0016-7606(1973)84<3563:POSCIR>2.0.CO;2.
Norini, G., E. De Beni, D. Andronico, M. Polacci, M. Burton, and F. Zucca(2009), The 16 November 2006 flank collapse of the south‐east crater atMount Etna, Italy: Study of the deposit and hazard assessment, J. Geophys.Res., 114, B02204, doi:10.1029/2008JB005779.
Oshima, H., and T. Maekawa (2001), Excitation process of infrasonicwaves associated with Merapi‐type pyroclastic flow as revealed by anew recording system, Geophys. Res. Lett., 28, 1099–1102, doi:10.1029/1999GL010954.
Patanè, D., G. Di Grazia, A. Cannata, P. Montalto, and E. Boschi (2008),The shallow magma pathway geometry at Mt. Etna volcano, Geochem.Geophys. Geosyst., 9, Q12021, doi:10.1029/2008GC002131.
Peltier, A., P. Bachèlery, and T. Staudacher (2009), Magma transport andstorage at Piton de La Fournaise (La Réunion) between 1972 and2007: A review of geophysical and geochemical data, J. Volcanol.Geotherm. Res., 184, 93–108, doi:10.1016/j.jvolgeores.2008.12.008.
Petersen, T., and S. R. McNutt (2007), Seismo‐acoustic signals associatedwith degassing explosions recorded at Shishaldin volcano, Alaska, 2003–2004, Bull. Volcanol., 69, 527–536, doi:10.1007/s00445-006-0088-z.
Privitera, E., T. Sgroi, and S. Gresta (2003), Statistical analysis of intermit-tent volcanic tremor associated with the September 1989 summit explo-sive eruptions at Mount Etna, Sicily, J. Volcanol. Geotherm. Res., 120,235–247, doi:10.1016/S0377-0273(02)00400-6.
Ripepe, M., P. Poggi, T. Braun, and E. Gordeev (1996), Infrasonic wavesand volcanic tremor at Stromboli, Geophys. Res. Lett., 23, 181–184,doi:10.1029/95GL03662.
Ripepe, M., A. J. L. Harris, and R. Carniel (2002), Thermal, seismic andinfrasonic evidences of variable degassing rates at Stromboli volcano,J. Volcanol. Geotherm. Res., 118, 285–297, doi:10.1016/S0377-0273(02)00298-6.
Ripepe, M., E. Marchetti, G. Ulivieri, A. J. L. Harris, J. Dehn, M. Burton,T. Caltabiano, and G. Salerno (2005), Effusive to explosive transitionduring the 2003 eruption of Stromboli volcano, Geology, 33, 341–344,doi:10.1130/G21173.1.
Ripepe, M., D. Delle Donne, G. Lacanna, E. Marchetti, and G. Ulivieri(2009), The onset of the 2007 Stromboli effusive eruption recorded byan integrated geophysical network, J. Volcanol. Geotherm. Res., 182,131–136, doi:10.1016/j.jvolgeores.2009.02.011.
Ripepe, M., E. Marchetti, C. Bonadonna, A. J. L. Harris, L. Pioli, andG. Ulivieri (2010), Monochromatic infrasonic tremor driven by persistentdegassing and convection at Villarrica volcano, Chile, Geophys. Res.Lett., 37, L15303, doi:10.1029/2010GL043516.
Rowe, C. A., R. C. Aster, P. R. Kyle, R. R. Dibble, and J. W. Schlue(2000), Seismic and acoustic observations at Mount Erebus volcano,Ross Island, Antarctica, 1994–1998, J. Volcanol. Geotherm. Res., 101,105–128, doi:10.1016/S0377-0273(00)00170-0.
Ruiz, M. C., J. M. Lees, and J. B. Johnson (2006), Source constraints ofTungurahua volcano explosion events, Bull. Volcanol., 68, 480–490,doi:10.1007/s00445-005-0023-8.
Saab, R., M. J. McKeown, L. J. Myers, and R. Abu‐Gharbieh (2005), Awavelet based approach for the detection of coupling in EEG signals,paper presented at 2nd International IEEE EMBS Conference on NeuralEngineering, Arlington, Va.
Sahetapy‐Engel, S. T., A. J. L. Harris, and E. Marchetti (2008), Thermal,seismic and infrasound observations of persistent explosive activity andconduit dynamics at Santiaguito lava dome, Guatemala, J. Volcanol.Geotherm. Res., 173, 1–14, doi:10.1016/j.jvolgeores.2007.11.026.
Schick, R., and M. Riuscetti (1973), An analysis of volcanic tremors atsouth Italian volcanoes, Z. Geophys., 39, 247–262.
Stephens, C. D., and B. A. Chouet (2001), Evolution of the December14, 1989 precursory long period event swarm at Redoubt volcano,Alaska, J. Volcanol. Geotherm. Res., 109, 133–148, doi:10.1016/S0377-0273(00)00308-5.
Sturton, S., and J. Neuberg (2006), The effects of conduit length andacoustic velocity on conduit resonance: Implications for low‐frequencyevents, J. Volcanol. Geotherm. Res., 151, 319–339, doi:10.1016/j.jvolgeores.2005.09.009.
Tilling, R. I. (2008), The critical role of volcano monitoring in riskreduction, Adv. Geosci., 14, 3–11, doi:10.5194/adgeo-14-3-2008.
Vergniolle, S., and J. Caplan‐Auerbach (2004), Acoustic measurements ofthe 1999 basaltic eruption of Shishaldin volcano, Alaska: 2. Precursor tothe Subplinian activity, J. Volcanol. Geotherm. Res., 137, 135–151,doi:10.1016/j.jvolgeores.2004.05.004.
Vergniolle, S., M. Boichu, and J. Caplan‐Auerbach (2004), Acousticmeasurements of the 1999 basaltic eruption of Shishaldin volcano,Alaska: 1. Origin of Strombolian activity, J. Volcanol. Geotherm.Res., 137, 109–134, doi:10.1016/j.jvolgeores.2004.05.003.
Vidal, V., J. C. Gèminard, T. Divoux, and F. Melo (2006), Acoustic signalassociated with the bursting of a soap film which initially closes on over-pressurized cavity, Eur. Phys. J. B, 54, 321–339, doi:10.1140/epjb/e2006-00450-0.
Vidal, V., M. Ripepe, T. Divoux, D. Legrand, J. C. Géminard, and F. Melo(2010), Dynamics of soap bubble bursting and its implications to volcanoacoustics, Geophys. Res. Lett., 37, L07302, doi:10.1029/2009GL042360.
Vinciguerra, S., S. Gresta, M. S. Barbano, and G. Distefano (2001), The twobehaviors of Mt. Etna volcano before and after a large intrusive episode:Evidences from b value and fractal dimension of seismicity, Geophys.Res. Lett., 28, 2257–2260, doi:10.1029/2000GL012434.
Withers, M., R. C. Aster, C. Young, J. Beiriger, M. Harris, S. Moore,and J. Trujillo (1998), A comparison of select trigger algorithms for auto-mated global seismic phase and event detection, Bull. Seismol. Soc. Am.,88, 95–106.
A. Cannata, G. Di Grazia, and E. Privitera, Istituto Nazionale diGeofisica e Vulcanologia, Osservatorio Etneo‐Sezione di Catania, PiazzaRoma 2, I‐95123 Catania, Italy. ([email protected])S. Gresta, M. Sciotto, and L. Spina, Dipartimento di Scienze Geologiche,
Università di Catania, Corso Italia 57, I‐95129 Catania, Italy.
SCIOTTO ET AL.: SEISMOACOUSTIC INVESTIGATION AT MT. ETNA B09301B09301
21 of 21
Copyright © 2022 FDOKUMEN