The 2005 eruption of Sierra Negra volcano, Galápagos, Ecuador
19
RESEARCH ARTICLE The 2005 eruption of Sierra Negra volcano, Galápagos, Ecuador Dennis J. Geist & Karen S. Harpp & Terry R. Naumann & Michael Poland & William W. Chadwick & Minard Hall & Erika Rader Received: 15 September 2006 / Accepted: 16 May 2007 / Published online: 31 July 2007 # Springer-Verlag 2007 Abstract Sierra Negra volcano began erupting on 22 October 2005, after a repose of 26 years. A plume of ash and steam more than 13 km high accompanied the initial phase of the eruption and was quickly followed by a ~2-km- long curtain of lava fountains. The eruptive fissure opened inside the north rim of the caldera, on the opposite side of the caldera from an active fault system that experienced an m b 4.6 earthquake and ~84 cm of uplift on 16 April 2005. The main products of the eruption were an `a`a flow that ponded in the caldera and clastigenic lavas that flowed down the north flank. The `a`a flow grew in an unusual way. Once it had established most of its aerial extent, the interior of the flow was fed via a perched lava pond, causing inflation of the `a`a. This pressurized fluid interior then fed pahoehoe breakouts along the margins of the flow, many of which were subsequently overridden by `a`a, as the crust slowly spread from the center of the pond and tumbled over the pahoehoe. The curtain of lava fountains coalesced with time, and by day 4, only one vent was erupting. The effusion rate slowed from day 7 until the eruption’ s end two days later on 30 October. Although the caldera floor had inflated by ~5 m since 1992, and the rate of inflation had accelerated since 2003, there was no transient deformation in the hours or days before the eruption. During the 8 days of the eruption, GPS and InSAR data show that the caldera floor deflated ~5 m, and the volcano contracted horizontally ~6 m. The total eruptive volume is estimated as being ~150×10 6 m 3 . The opening-phase tephra is more evolved than the eruptive products that followed. The compositional variation of tephra and lava sampled over the course of the eruption is attributed to eruption from a zoned sill that lies 2.1 km beneath the caldera floor. Keywords Caldera . Basalt . Galápagos . Tephra . Lava flow emplacement . Volcano deformation . Magma chamber processes Introduction There is an eruption every few years in the Galápagos Archipelago, but only recently have the eruptions been Bull Volcanol (2008) 70:655–673 DOI 10.1007/s00445-007-0160-3 Editorial responsibility: J Stix D. J. Geist (*) Department of Geological Sciences, University of Idaho 3022, Moscow, ID 83844, USA e-mail: [email protected] K. S. Harpp : E. Rader Geology Department, Colgate University, Hamilton, NY 13348, USA K. S. Harpp e-mail: [email protected] T. R. Naumann Geology Department, University of Alaska, Anchorage, AK, USA e-mail: [email protected] M. Poland USGS-HVO, P.O. Box 51, Hawai’i National Park, HI, USA e-mail: [email protected] W. W. Chadwick Hatfield Marine Science Center, Oregon State University, Newport, OR 97365, USA e-mail: [email protected] M. Hall Instituto Geofisico, Escuela Politecnica Nacional, Quito 17-01-2759, Ecuador
Transcript of The 2005 eruption of Sierra Negra volcano, Galápagos, Ecuador

RESEARCH ARTICLE
The 2005 eruption of Sierra Negra volcano,Galápagos, Ecuador
Dennis J. Geist & Karen S. Harpp & Terry R. Naumann &
Michael Poland & William W. Chadwick & Minard Hall &Erika Rader
Received: 15 September 2006 /Accepted: 16 May 2007 /Published online: 31 July 2007# Springer-Verlag 2007
Abstract Sierra Negra volcano began erupting on 22October 2005, after a repose of 26 years. A plume of ashand steam more than 13 km high accompanied the initialphase of the eruption and was quickly followed by a ~2-km-long curtain of lava fountains. The eruptive fissure openedinside the north rim of the caldera, on the opposite side of thecaldera from an active fault system that experienced an mb
4.6 earthquake and ~84 cm of uplift on 16 April 2005. Themain products of the eruption were an `a`a flow that pondedin the caldera and clastigenic lavas that flowed down thenorth flank. The `a`a flow grew in an unusual way. Once ithad established most of its aerial extent, the interior of theflow was fed via a perched lava pond, causing inflation ofthe `a`a. This pressurized fluid interior then fed pahoehoebreakouts along the margins of the flow, many of whichwere subsequently overridden by `a`a, as the crust slowlyspread from the center of the pond and tumbled over thepahoehoe. The curtain of lava fountains coalesced withtime, and by day 4, only one vent was erupting. Theeffusion rate slowed from day 7 until the eruption’s end twodays later on 30 October. Although the caldera floor hadinflated by ~5 m since 1992, and the rate of inflation hadaccelerated since 2003, there was no transient deformation inthe hours or days before the eruption. During the 8 days of theeruption, GPS and InSAR data show that the caldera floordeflated ~5 m, and the volcano contracted horizontally ~6 m.The total eruptive volume is estimated as being ~150×106 m3.The opening-phase tephra is more evolved than the eruptiveproducts that followed. The compositional variation oftephra and lava sampled over the course of the eruption isattributed to eruption from a zoned sill that lies 2.1 kmbeneath the caldera floor.
Keywords Caldera . Basalt . Galápagos . Tephra .
Lava flow emplacement . Volcano deformation .
Magma chamber processes
Introduction
There is an eruption every few years in the GalápagosArchipelago, but only recently have the eruptions been
Bull Volcanol (2008) 70:655–673DOI 10.1007/s00445-007-0160-3
Editorial responsibility: J Stix
D. J. Geist (*)Department of Geological Sciences, University of Idaho 3022,Moscow, ID 83844, USAe-mail: [email protected]
K. S. Harpp : E. RaderGeology Department, Colgate University,Hamilton, NY 13348, USA
K. S. Harppe-mail: [email protected]
T. R. NaumannGeology Department, University of Alaska,Anchorage, AK, USAe-mail: [email protected]
M. PolandUSGS-HVO,P.O. Box 51, Hawai’i National Park, HI, USAe-mail: [email protected]
W. W. ChadwickHatfield Marine Science Center, Oregon State University,Newport, OR 97365, USAe-mail: [email protected]
M. HallInstituto Geofisico, Escuela Politecnica Nacional,Quito 17-01-2759, Ecuador

observed and monitored by volcanologists equipped withinstrumental and petrological tools (e.g., Allan and Simkin2000; Teasdale et al. 2005). Sierra Negra volcano began itsfirst eruption in 26 years on 22 October 2005. The eruptionprovided new opportunities for the study of active volcanismbecause the volcano’s geologic history is well known(Reynolds et al. 1995; Jonsson et al. 2005); geodetic studiesin the 13 years prior to the eruption have providedconstraints on recent magmatism and tectonism (Amelunget al. 2000; Geist et al. 2006; Chadwick et al. 2006), andmodern communications and good fortune enabled directobservations during much of the eruption.
This work takes amultidisciplinary approach to studying the2005 eruption of Sierra Negra. First, visual and photographicobservations are described and applied to recent models of ventprocesses and lava flow emplacement. Second, results fromcontinuous Global Positioning System (GPS) and satellite radarinterferometry (InSAR) measurements are used to constrain thehistory of magma discharge from the shallow chamber as wellas pre-eruptive deformation phenomena. Third, results fromgeochemical and petrologic studies of a time-series collectionof lava and tephra samples are used to assess pre- and syn-eruptive differentiation and crystallization processes.
Geologic background
Sierra Negra is the most voluminous and one of the mostactive volcanoes in the Galápagos Archipelago (Fig. 1;
Simkin and Siebert 1994). The archipelago is related to ahotspot that lies 100–300 km south of the GalápagosSpreading Center. Because the Nazca plate is movingeastward, historical volcanic activity has been concentratedin the western part of the archipelago.
The geologic history of Sierra Negra is described byReynolds et al. (1995). The oldest known rocks on thevolcano crop out on the southern and eastern flanks andare <7,000 years old (Reynolds et al. 1995). The mostrecent activity has been within the caldera and fromcircumferential vents near the northern caldera rim. Thelong-term eruptive rate of Sierra Negra is estimated to be~1×10⁶ m3/year (Reynolds et al. 1995).
Sierra Negra’s caldera has plan dimensions of 9×7 km,with the major axis oriented NE–SW. The caldera isstructurally complex, with a prominent sinuous ridge thatis subparallel to the caldera wall (Fig. 2). This ridge is anupthrust part of the caldera floor, and in places it has beenuplifted higher than the caldera rim. The fault that boundsthe outward margins of this ridge remains active, withdocumented earthquakes in 1998 (Amelung et al. 2000), 16April 2005 (Chadwick et al. 2006), and just before the 2005eruption (Yun et al. 2006b). Onlapping lava flows formunconformities on the ridge’s inward-facing slopes, indi-cating a prolonged history of uplift interspersed withcaldera-ponded eruptions.
Measurements by GPS and InSAR indicate that thecaldera floor has a dynamic record of inflation and deflationsince at least 1992 with about 5 m of total uplift preceding
Fig. 1 Shaded relief map of thecentral Galápagos Archipelago,showing the location of SierraNegra volcano. Box outlines thecaldera of Sierra Negra. Insetshows the location of theGalápagos Archipelago on aregional scale. Figure courtesyof Sang-Ho Yun
656 Bull Volcanol (2008) 70:655–673

the 2005 eruption (Amelung et al. 2000; Geist et al. 2006;Chadwick et al. 2006). The pattern of inflation is domalover the long-term but is punctuated by trapdoor faultingevents along the sinuous-ridge faults (Amelung et al. 2000;Jonsson et al. 2005; Yun et al. 2006a; Chadwick et al.2006). Between 1992 and early 1998, the caldera floorbulged elastically nearly 2 m (Amelung et al. 2000),culminating in a trapdoor faulting event along the southernextent of the caldera floor fault system (Fig. 2). Inflationrenewed after the faulting event but decelerated sometimein 2000–2001, when the caldera floor began deflating(Geist et al. 2006). Models of the deformation from 1992 to2000 (Amelung et al. 2000; Yun et al. 2006a) and 2000 to2002 (Geist et al. 2006) are both consistent with a 3×5 kmflat-topped chamber or sill centered ~2.1 km beneath thecaldera floor.
Sierra Negra has had ten recorded historical eruptions(Simkin and Siebert 1994). Repose times have ranged from4 to 37 years, with an average of 15 years. The most recenteruption before 2005 was in 1979, which was an unusuallyprolonged and voluminous event, with an estimated outputof nearly 9×10⁸ m3 of lava (Reynolds et al. 1995). Eruptivefissures at Sierra Negra are circumferentially disposedabout the caldera near the summit, and radial on the flanksof the volcano (Reynolds et al. 1995). All describedhistorical eruptions prior to 2005 have been from circum-ferential fissures north of the caldera floor.
Sierra Negra has an active hydrothermal system (Simkinand Siebert 1994; Goff et al. 2000). The most vigorous vents
are at the western end of the sinuous ridge. New fumarolesbecame active in early 2005 along the southeastern part ofthe sinuous ridge, about 1 km east of GPS station GV06(Fig. 2; Patricio Ramón, personal communication, 2005).Until the 2005 eruption, the 1979 vents also were steaming,although with decreasing vigor over the past 20 years.
Sierra Negra’s lavas are tholeiitic basalts, with a smallcompositional range (Reynolds and Geist 1995). Most lavasare sparsely porphyritic, typically with <5% plagioclasephenocrysts. Most of the compositional variation is attrib-uted to fractional crystallization of plagioclase + augite +olivine, at pressures ranging from 100 to 300 MPa.
Eruption chronology
Field observations
Sierra Negra volcano began erupting at approximately 1730local time (LT) on Saturday, 22 October 2005 (2330 UTC).To the best of our knowledge, there were no directobservations of the fissure opening in the first minutes ofthe eruption. A Mw 5.5 earthquake preceded the eruption at1434 LT (2034 UTC; National Earthquake InformationCenter; http://neic.usgs.gov). The precise location of thisearthquake was not measured. In June 2006, we discovereda fresh vertical fault scarp on the southern and western partsof the sinuous ridge (Fig. 2), which had ~150 cm of dip-slipdisplacement, with the northeastern block up. Modeling of
Fig. 2 Shaded relief map of thesummit area of Sierra Negravolcano. The 2005 lava flow isshown in orange, with arrowsindicating flow directions. Redlines indicate clefts from whichthe lava flow spread duringinflation. Red region is locationof the perched lava pond that fedthe interior of the flow after itsinitial emplacement
Bull Volcanol (2008) 70:655–673 657

coeruptive InSAR images is consistent with major dis-placement centered on the western part of the sinuous ridge(Yun et al. 2006b).
Eyewitness reports indicate that the initial volcanicplume was >10 km in height, and our measurements fromphotos taken in the first hour of the eruption (Fig. 3a) yieldestimates of 13–14 km. Hall observed the plume from thehighlands of Santa Cruz island at 2030 LT and estimatesthat it was 13–15 km high. The plume was carried to thewest, depositing a tephra blanket across the northern andwestern flanks of the volcano. Photos taken from Alcedovolcano, approximately 40 km northeast of the Sierra Negrasummit, reveal that a fissure had opened along the northerncaldera rim by 1800 LT. Approximately 40 min later, thefissure had extended to the east, tripling in length. Activityappeared to be concentrated at the two ends of the fissure,most strongly along the western third. Beginning ~2030 LT,activity along the western segment of the fissure increasedin intensity, forming a chain of discrete lava fountains.Within the next 45 min, a clastigenic flow supplied by thelava fountains rooted inside the caldera had established atleast four distinct channels down the north flank of thevolcano.
At 0700 LT on Sunday, 23 October (day 2), the plumewas weaker than on the first day of the eruption, extendingonly several kilometers high with a diffuse source along theentire ~2 km length of the fissure. The caldera was visitedat 0745 LT by Galápagos National Park and DarwinResearch Station officials. By this time, the most vigorousactivity along the fissure had switched to the eastern end,where two major vents were continuously producingfountains up to 300 m high, and three smaller vents wereactive less than 200 m to their east. Small areas ofincandescence remained visible on the western end of thefissure, and a single lava fountain there threw spatter toabout 20 m, but the amount of lava being emitted from thewestern vents was insignificant. Spatter from the two largeeastern vents continued to coalesce into a clastigenic flowthat extended ~5 km down the north flank.
All of the vents were located inside the caldera rimthroughout the eruption, and the lava on the north flankoriginated from coalesced pyroclasts erupted from theintracaldera lava fountains. Most of the lava emplaced inthe caldera was erupted from 5 vents, which supplied a~2 km-wide anastamosing flow field that cascaded downintracaldera benches to the caldera floor. Lava in thechannels was estimated to be flowing at ~15 m s−1 andformed standing waves >5 m high. The intracaldera flowponded to form a ~2 km wide `a`a field that extended to thesoutheast caldera wall approximately 4 km south of thevent, banked against it, and curved in a 1 km-wide lobe thateventually reached about 1.5 km west (Fig. 2). The flowfront advanced westward in the moat between the caldera
wall and the southernmost scarps forming the sinuousridge, while closer to the vents, the flow spread moreslowly laterally to the west along most of its length.Vigorous fumaroles on the caldera wall about 200 m east ofthe easternmost vent may mark the extension of the fissure-feeding dike in that direction. Subsequent field observationscoupled with photographic evidence suggest that thesefumaroles may have also been the site of small firefountains, forming short spatter-fed flows, which extendedinto the caldera sometime during the first 3 days of theeruption.
Lapilli and Pele’s hair erupted in the initial explosivephase of the eruption were deposited along the caldera rimup to 4 km south of the vents and >5 km to the west. Thelatter deposits are in line with the higher altitude prevailingwinds according to early satellite images. Within 500 m ofthe vents, most of the pyroclastic material is scoriaceouslapilli >1 cm in diameter.
On the third day of the eruption (24 October), activityfocused to two or three vents, and the eruptive intensitydecreased (Fig. 3b). Instead of a widespread flow fieldacross the intracaldera benches, lava was organized intofive distinct braided channels. These cascaded down thebenches to feed a >1-km-wide lava pool on the northerncaldera floor, which in turn supplied the intracaldera `a`afield. On 25 or 26 October (day 4 or 5) the easternmost ventshut down, leaving only one active vent near the easternterminus of the fissures. Witnesses reported that atapproximately 0830 on 27 October, the major eastern ventre-opened, without any loss of intensity at the western vent.Three of the coauthors (KH, DG, and TN) arrived at theeruption on the afternoon of 27 October.
Lava fountaining on the evening of 27 October (day 6)produced spatter clasts up to 30 cm in diameter, which werebeing deposited to the northeast (downwind) onto the outerflank of the volcano, within 100 m of the vent. We estimatethat the highest fountain, a directed, collimated jet from thewestern vent, extended to 50 m. The fountain at the easternvent was wider and reached only ~30 m in height. Gaseswere emitted as nearly continuous jets from all vents, andthe lava fountaining was steady. During fountaining, themajority of the fragments were recycled back into the vents,some by falling directly back into the craters and others byavalanching of still-incandescent slabs down the innercrater walls. The spatter accumulated quickly enough onthe outer flanks (primarily from the stronger western lavafountain) to coalesce and feed the easternmost clastigenic`a`a flow, which remained incandescent over 1 km downthe north flank of the volcano (Fig. 2).
By the evening of 27 October, three braided channelssupplied the intracaldera lava flow, each 10–20 m wide.The channels crossed the northern caldera bench, twooriginating from the western vent and one from the eastern
658 Bull Volcanol (2008) 70:655–673

Fig. 3 a Photograph of theinitial plume (by Askel Voigt)taken from about 100 km northof Sierra Negra at 1734 localtime on 22 October 2004. Theplume is estimated to be 13–14 km high. b Photograph of theeruption on 24 October taken byGreg Estes from the southeast.By this time, the original ~2 kmfissure was erupting only fromits eastern margin. Four lavachannels can be seen spillingover the intracaldera bench andfeeding the caldera floor flow,whose eastern margin is incan-descent and in the foreground.c The waning stage of theeruption, when it changed to apulsating Strombolian style,taken from about 100 m east ofthe last open vent. The singleactive open channel can be seenin the background
Bull Volcanol (2008) 70:655–673 659

vent. The estimated velocity of lava in the channelsexceeded 10 m s−1, sufficient to set up standing waves inthe lava as it rounded corners and reversals at small dropsin elevation. Periodic increases in the flux of lava, oftencaused by avalanches of accumulated spatter back into thevents, would cause extensive channel overflows, mostly aspahoehoe.
The intracaldera lava flow did not lengthen significantlybeyond the first two days of the eruption; instead, from thesecond day forward, the flow enlarged by slowly spreadinglaterally, mostly westward up the east-sloping caldera floor.Lava was delivered to the western margin through the interiorof the flow, while the surface crust inflated and spread moreslowly (only several m/day). The lateral growth of the flowoccurred by extrusion of pahoehoe lobes from the `a`a front.The pahoehoe front was then overridden by `a`a as the crustspread, presumably sliding downhill owing to inflation andelevation of the flow’s center. The spreading tore two ~3 kmlong clefts in the flow top, as well as multiple 10–30 m-longcracks, and smooth lava welled up to fill them. A contributingfactor to spreading on the west margin may have been theseveral-meter deflation of the center of the caldera over thecourse of the eruption, as measured by GPS and discussedbelow. Post-eruption inspection of the southwestern terminusof the lava flow (9 km from the vent) revealed that toothpastelava also oozed out of the flow top during this episode of theeruption (Rader et al. 2006).
The flux of lava, spatter, and gas emitted by the twovents increased notably beginning around midday on theseventh day of the eruption, 28 October. Several tremorsthat coincided with the change in activity were felt within~300 m of the vents. By sunset, the bases of both fountainshad widened by several meters with no decrease in fountainheight. The previously braided lava flows on the benchfocused into two main channels over the course of theafternoon. On the basis of velocity measurements and post-eruption inspection of the channels, we estimate that theeruptive flux at this time was ~100 m3 s−1.
During the early morning hours of 29 October (day 8),the western vent stopped erupting, producing only gas. Theeastern vent continued to fountain (Fig. 3c), but instead of asteady jet, the fountain pulsated between 20 and 50 m inheight every 1–5 s. Over the course of the day, the vigor ofthe fountaining steadily decreased, and a lava lake becamevisible in the eastern crater for the first time. By this time,the level of the lava in the channel fed by the eastern venthad dropped by about 50% relative to the previous day.That evening, the velocity of lava in the channel wasmeasured to be 4 m s−1. Consequently, we estimate that theeruptive flux had decreased to ~25% of the previous day’srate (or ~25 m3 s−1).
The eruption terminated between 0200 and 0400 LT onthe ninth day of the eruption, 30 October. Strong plumes of
gas continued to be emitted from the vents, particularly thewestern one. The final area of the intra-caldera lava flow is14.2 km2 and that of the extra-caldera clastigenic lava flows4.1 km2. The distal flow front of the intracaldera flow 9 kmfrom the vent is estimated to be ~10 m thick. If this is theaverage thickness of the entire intracaldera flow, then thebulk volume of this flow is 1.5×10⁸ m3.
The eruption had little effect on the wildlife, a particularconcern in the Galápagos National Park, mainly becausethe tephra and lavas covered areas comprising young poorlyvegetated deposits. The population of rare giant tortoisesfrom Sierra Negra, Geochelone Guntheri, was unaffected.The lava flow ignited wildfires that caused much of thevegetated caldera wall and upper southwestern slopes toburn for over a month after the cessation of the eruption.
In February 2006, several fumaroles continued to ventfrom the main body of the lava flow on the caldera floor,and substantial gas was being emitted from the westernvent. White mineral deposits decorated the flow wherenow-extinct fumaroles had vented, and yellow sulfurdeposits were visible west of the main vents and at somelocations on the caldera floor flow. Meter-scale cracks andslumping of the eastern edge of the `a`a flow had occurredalong the caldera wall, likely the result of deflation of theintracaldera flow as it cooled.
As of June 2006, the western vent was still producinggas but at a decreased rate relative to February, 2006. Thecaldera floor fumaroles continued to degas at a vigorousrate, producing plumes several tens of meters in height andvarying in intensity every few minutes. Smaller fumaroleswere observed emanating from the rootless flows on thenorth flank. The clastigenic flows that were coated in tephraon the flank and the pool at the base of the caldera benchremained hot enough to emit visible heat shimmers.
Satellite observations
A thermal anomaly was detected at 2345 UTC on 22October by the GOES satellite system http://goes.higp.hawaii.edu/); the previous image had been collected at 2315UTC and showed no anomaly, confirming eyewitnessreports of the initiation of the eruption. Hotspots werevisible in the GOES images around the vent and within thecaldera over the course of the entire eruption, and thecooling intracaldera lava flow was observable through 16November 2005. The eruptive plume was also detected inNASA MODIS data http://visibleearth.nasa.gov/). An im-age from 23 October shows a dense cloud approximately40 km in diameter centered over the volcano and a morediffuse haze extending for at least 200 km to the WNW. On25 October the plume margins were much sharper thanbefore and extended for over 400 km to the west of thevolcano. Images from 30 October reveal no distinct plume,
660 Bull Volcanol (2008) 70:655–673

but instead a low-level volcanic haze that spread to the westcovering an area >400 km across.
Measurements by the Ozone Monitoring Instrumentspanning 23 October through 1 November showed a robustSO2 plume over the course of the eruption http://www.knmi.nl/omi/publ-en/news/archive/2005/index_en.html).Levels of SO2 >1.5 Dobson units were present over an areaof ~3,300×1,100 km, extending west of the volcano, withmore diffuse concentrations reaching twice this distance.The maximum concentration was >3 Dobson units.
Deformation observations
In 2002, a continuous GPS network was installed on SierraNegra (Chadwick et al. 2006), which recorded minordeflation until April 2003, when inflation began. Theinflation accelerated over the next 2 years until on 16 April2005, a fault on the southern part of the sinuous ridgeruptured, causing a mb 4.6 earthquake and raising thesouthern part of the caldera floor 84 cm in a southern-dipping trapdoor geometry. Inflation about the center of thecaldera was not affected by the earthquake and continued toaccelerate until it reached a rate of about 2.5 m/year in themonths preceding the 2005 eruption (Chadwick et al.2006). The total uplift of the center of the caldera floorbetween April 2003 and the start of the 2005 eruption was2.2 m. The ~5 m of uplift between 1992 and 2005 is thelargest recorded on a basaltic volcano (Chadwick et al.2006) and was caused by the intrusion of magma into areservoir at ~2.1 km depth.
Despite the long-term pattern of uplift of the calderafloor, continuous GPS data yielded no immediate precursor
to the eruption; the positions of stations within the calderaon the days before the 22 October eruption lie precisely onthe trends from the previous weeks (Fig. 4). However, noGPS data are available for the last 16 h leading up to theeruption, because a hardware failure occurred and thenetwork was not restored until 24 October. Also, no dual-frequency receiver had been operating in the region sinceearly September, and the only sites working during theeruption were on the caldera floor. This conspiracy offailures resulted in two lost opportunities. First, deforma-tion related to the precursory Mw 5.5 earthquake and theinitiation of the eruption was not recorded. Second, theposition of the four-station single-frequency networkrelative to a fixed point is uncertain. Thus, the GPS dataduring the eruption were processed as baselines connectingto station GV03 (Fig. 2).
During the eruption, the center of the caldera floor (GV04)dropped by about 2.4 m relative to GV03 (Fig. 5a), and theN–S diameter of the caldera floor (GV03–GV06) contractedhorizontally by >6 m (Fig. 5b). Most of the deflationoccurred during the first two days of the eruption. Thedeflation rate then decreased until the end of the eruption on30 October, when inflation resumed immediately.
Co-eruptive surface displacements were also measured bysatellite radar interferometry (InSAR). The European SpaceAgency ENVISATsatellite acquired SAR data from multiplelook angles over Sierra Negra both before and after theeruption. We used these data to construct several 35-day co-eruption interferograms following the procedures of Chadwicket al. (2006) and using the merged SRTM-TOPSAR dataof Yun et al. (2005) for topographic corrections. The mostcoherent of these is from track 61, beam mode 2, and spans
0
0.05
0.1
0.15
0.2
0.25
0.3
0.35
0 5 10 15 20 25
North-South baselineacross caldera floor
Start of E
ruption
-223 cm/y
73 cm/y
-2.6 cm/y
Day in October, 2005
GV
06 D
ispl
acem
ent
Rel
ativ
e to
GV
03 (
m)
North
East
Vertical
Fig. 4 Position changes of aroughly N–S baseline acrossthe caldera floor, from GV03 toGV06 (Fig. 2). Horizontal ex-tension of this baseline is themost sensitive one in the net-work to precursory deformation.No inflection in the longer-termmotions is apparent, suggestingthat any deformation directlyrelated to the intrusion of thefissure-feeding dike did not oc-cur until immediately before theeruption
Bull Volcanol (2008) 70:655–673 661

24 September to 29 October 2005 (Fig. 6a). The timespanned by this interferogram therefore includes about1 month of pre-eruption deformation, which, based on GPSmeasurements, probably amounts to 20 cm of uplift at thecenter of the caldera, and little motion outside the caldera.
Line-of-sight (LOS) deformation in all co-eruptioninterferograms is dominated by deflation that extends welloutside the caldera boundaries. This is a significant departurefrom previous results, which have noted only minordeformation outside the confines of the caldera (Amelunget al. 2000; Geist et al. 2006; Yun et al. 2006a, b; Chadwicket al. 2006). Unfortunately, the caldera floor is almostcompletely incoherent in all co-eruption interferograms,
attributable to the several-meter co-eruption displacementsdemonstrated by GPS measurements. Although this inco-herence obscures the large signal associated with theeruption, it also means that nearly all the LOS deformationin the co-eruption interferograms is related to the eruption,because pre-eruption deformation was not significantbeyond the caldera.
The maximum line-of-sight lengthening (deflation) inthe most coherent interferogram (Fig. 6a) is about 30 cmand occurs on the north edge of the caldera. There is also aregion of line-of-sight shortening of about 5 cm centered1 km east of the east caldera rim, which is probably a resultof a combination of the non-vertical look angle and the co-
-3
-2
-1
0
1
2
3
4
5
0 5 10 15 20 25 30 35 40
-2
-1.5
-1
-0.5
0
0.5
1
1.5
0 5 10 15 20 25 30 35 40
GV03-GV06(Across Caldera Floor)
GV03-GV04(Base of N. Caldera Wall to Center)
Met
ers
Day from October 1, 2005
Sta
rt o
f Eru
ptio
n
End
of E
rupt
ion
Met
ers
a
b
Vertical
North
East
North
VerticalEast
1
Fig. 5 a, b Position changesacross two baselines, expressedin three directional componentsand spanning the duration of theeruption; note the different scalecompared to Fig. 4, whichencompasses the pre-eruption de-formation. The first baseline isbetween the north and southmargins of the caldera floor(GV03–GV06; Fig. 2) and theother from the northern calderafloor to near the caldera center(GV03–GV04). Subsidence andcontraction rates decelerate overthe course of the eruption. Infla-tion began within a day after theend of the eruption on October 30
662 Bull Volcanol (2008) 70:655–673

eruption displacements, however, and not an indication thata center of uplift exists east of the caldera.
Petrology and geochemistry
Tephra samples were collected as they fell on four days ofthe eruption, 23 October and 27–29 October (Table 1).Additional samples (SN05-02 and SN05-A) gathered 4 kmfrom the fissure almost certainly represent the opening
phase of the eruption on 22 October as no tephra >1 cm indiameter was observed to have fallen >500 m from the ventafter 23 October. We also took three lava samples whosetimes of eruption are unknown (Table 1), as well as onesample which was taken from an active pahoehoe toe andquenched in water (SN95-5; Table 1). A single sample oftephra from the 1979 eruption collected in 1991 (SN91-21)was analyzed with the 2005 samples for comparison.
Samples were imaged using a back-scattered electrondetector on an SEM (Fig. 7). Glass from all tephra samples
Table 1 Major element compositions of glasses from Sierra Negra, determined by electron probe microanalysis
Sample Eruptiondate
Material SiO2 TiO2 Al2O3 FeO* MnO MgO CaO Na2O K2O P2O5 S Total
SN-91-21
1979 Tephra 48.43 4.20 13.36 13.62 0.22 5.36 10.20 3.34 0.65 0.48 0.05 98.51
SN-05-01
27-Oct Tephra 48.30 4.13 13.39 13.77 0.22 5.36 10.27 3.26 0.65 0.41 0.09 98.92
SN-05-02
22-Oct Tephra 51.25 3.69 13.46 13.27 0.28 4.41 8.53 3.57 1.01 0.41 0.05 99.09
SN-05-04
28-Oct Tephra 49.06 4.23 13.47 13.33 0.23 5.20 9.77 3.46 0.67 0.45 0.05 98.15
SN-05-06
28-Oct Tephra 48.10 4.11 13.30 14.14 0.21 5.36 10.28 3.19 0.63 0.44 0.10 99.11
SN-05-07
29-Oct Tephra 48.48 4.27 13.18 14.00 0.23 5.31 10.10 3.24 0.66 0.39 0.05 98.49
SN-05-08
Unknown Lava 48.16 4.39 13.05 14.78 0.25 5.20 9.87 3.00 0.72 0.45 0.04 98.63
SN-05-11
29-Oct Tephra 48.41 4.12 13.20 14.01 0.23 5.41 10.10 3.32 0.63 0.45 0.04 98.37
SN05-A 28-Oct Tephra 51.03 3.70 13.47 13.14 0.21 4.44 8.71 3.80 0.95 0.47 0.03 98.64SN-05Hall
23-Oct Tephra 48.78 4.12 13.35 13.65 0.25 5.20 10.03 3.34 0.69 0.58 0.01 98.32
SN-05-05
28-Oct Lava 47.92 5.15 11.97 15.63 0.24 4.80 9.68 3.18 0.76 0.61 0.02 98.03
%RSDa 0.5% 1.5% 0.9% 3.5% 10.9% 1.1% 2.8% 5.1% 3.4% 21.9% 83.3%
a% RSD is representative reproducibility based on six analyses of the same glass shard
5 km 0 2?
range change
a b c
Fig. 6 a ENVISAT beam mode 2, track 61 interferogram spanning 24September to 29 October 2005 showing broad subsidence of SierraNegra volcano. The caldera is incoherent due to modification by lavaflows and high deformation gradients. b Predicted range change from
a model consisting of a uniform opening sill (black box) and a pointsource of volume loss (white circle), both at 2 km depth. c Residualrange change. Color and distance scales are the same in all three parts
Bull Volcanol (2008) 70:655–673 663

and two lavas were analyzed by electron microprobe usingthe Cameca Camebax at Washington State University. Aslightly defocused 15 kV, 15 nA beam was used, andsodium loss was monitored but negligible. Natural glassand mineral standards were used for calibration, and matrixeffects corrected with a ZAF procedure. Representativeestimates of precision were obtained via six replicateanalyses of glass from each sample (Table 1). Plagioclasefrom tephra erupted on the first day and from theintracaldera lava flow were analyzed under the sameconditions as glass.
Trace element analyses were carried out by inductivelycoupled plasma-mass spectrometer (ICP-MS) on an AgilentHP4500 at Colgate University according to methodsdescribed in Harpp et al. 2003). A suite of USGS standardreference materials was used as external standards (BIR-1,W-2, DNC-1, BHVO-2, AGV-2). Instrument drift wasmonitored using a 1:20 online dilution of an internalstandard solution of 115In and 133Cs. Analyte masses werecorrected to the nearest internal standard isotope. Replicateanalyses of USGS standard W-2 were used to quantifyaccuracy and precision (Table 2).
Tephra sampled after the first day of the eruption isremarkably aphyric and glassy (Fig. 7). Most fragments oftephra only contain sparse microlites of plagioclase, withdimensions of <1×15 μm, and a few larger crystals~5×30 μm. The average total crystal content in the 23–29October tephra is 1.3%. Tephra erupted during the earliestphase of the eruption on 22 October has larger and moreabundant microlites of plagioclase (Fig. 7b). The microlitesare up to 10×100 μm in section and constitute 4.4% of therock on average. Vesicles in all of the tephra range from>1 cm in diameter down to isolated bubble nuclei, whichare as small as 2 μm.
The sample of pahoehoe that was collected and water-quenched as it oozed out of the sides of the caldera floor`a`a flow on 27 October (day 6) is notably more crystallinethan any of the tephra. It contains 23% microlites ofplagioclase and clinopyroxene (Fig. 7c). Plagioclase crys-tals have dimensions up to 20×120 μm, and clinopyroxeneis up to 30×30 μm. The plagioclase in this rock ranges fromAn48 to An54 (Table 1).
Major element analyses of glass in tephra erupted after23 October (day 2) and bulk-rock analyses of the lavasamples are indistinguishable from those of the 1979tephra, and among these samples there is no significantcompositional variation (Figs. 8 and 9); we refer to this asthe “main phase” of the eruption. The relative standarddeviation (RSD) of the six tephra samples collectedbetween 23 and 29 October is less than 3.5% for all themajor elements, except for P2O5, for which the RSD is 15%and we attribute to greater analytical uncertainty (Table 1).In contrast, tephra erupted on the first day (SN05-2 and
Fig. 7 Back-scattered electron images of tephra and lava from the2005 eruption of Sierra Negra. Top image is SN05-2, from the initialphase of the eruption; middle is SN05-1 from the main phase (27October), and bottom is sample taken and quenched from theintracaldera lava flow on 28 October. Plagioclase grains are darkcolored, augite (bottom image only) is light colored, and glass ismedium gray
664 Bull Volcanol (2008) 70:655–673
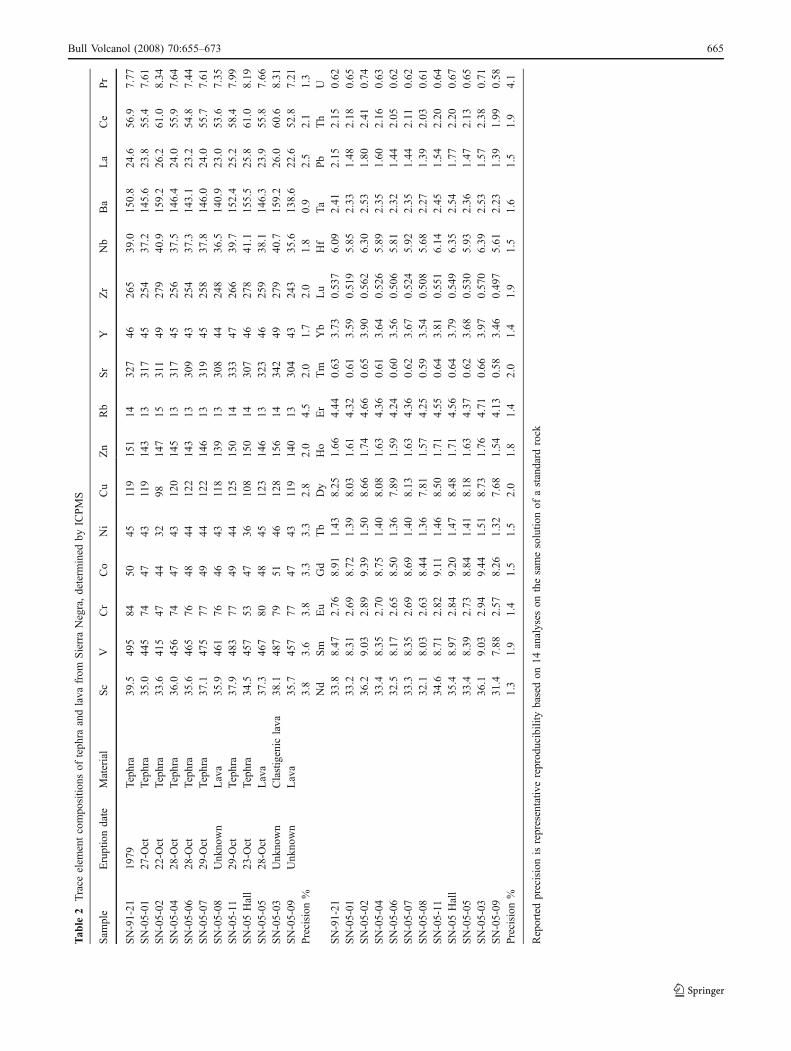
Tab
le2
Trace
elem
entcompo
sitio
nsof
teph
raandlava
from
SierraNegra,determ
ined
byICPMS
Sam
ple
Eruptiondate
Material
Sc
VCr
Co
Ni
Cu
Zn
Rb
Sr
YZr
Nb
Ba
La
Ce
Pr
SN-91-21
1979
Tephra
39.5
495
8450
45119
151
1432
746
265
39.0
150.8
24.6
56.9
7.77
SN-05-01
27-O
ctTephra
35.0
445
7447
43119
143
1331
745
254
37.2
145.6
23.8
55.4
7.61
SN-05-02
22-O
ctTephra
33.6
415
4744
3298
147
15311
4927
940
.915
9.2
26.2
61.0
8.34
SN-05-04
28-O
ctTephra
36.0
456
7447
4312
014
513
317
4525
637
.514
6.4
24.0
55.9
7.64
SN-05-06
28-O
ctTephra
35.6
465
7648
4412
214
313
309
4325
437
.314
3.1
23.2
54.8
7.44
SN-05-07
29-O
ctTephra
37.1
475
7749
4412
214
613
319
4525
837
.814
6.0
24.0
55.7
7.61
SN-05-08
Unk
nown
Lava
35.9
461
7646
43118
139
1330
844
248
36.5
140.9
23.0
53.6
7.35
SN-05-11
29-O
ctTephra
37.9
483
7749
4412
515
014
333
4726
639
.715
2.4
25.2
58.4
7.99
SN-05Hall
23-O
ctTephra
34.5
457
5347
3610
815
014
307
4627
841
.115
5.5
25.8
61.0
8.19
SN-05-05
28-O
ctLava
37.3
467
8048
4512
314
613
323
4625
938
.114
6.3
23.9
55.8
7.66
SN-05-03
Unk
nown
Clastigenic
lava
38.1
487
7951
4612
815
614
342
4927
940
.715
9.2
26.0
60.6
8.31
SN-05-09
Unk
nown
Lava
35.7
457
7747
43119
140
1330
443
243
35.6
138.6
22.6
52.8
7.21
Precision
%3.8
3.6
3.8
3.3
3.3
2.8
2.0
4.5
2.0
1.7
2.0
1.8
0.9
2.5
2.1
1.3
Nd
Sm
Eu
Gd
Tb
Dy
Ho
Er
Tm
Yb
Lu
Hf
Ta
Pb
Th
USN-91-21
33.8
8.47
2.76
8.91
1.43
8.25
1.66
4.44
0.63
3.73
0.53
76.09
2.41
2.15
2.15
0.62
SN-05-01
33.2
8.31
2.69
8.72
1.39
8.03
1.61
4.32
0.61
3.59
0.51
95.85
2.33
1.48
2.18
0.65
SN-05-02
36.2
9.03
2.89
9.39
1.50
8.66
1.74
4.66
0.65
3.90
0.56
26.30
2.53
1.80
2.41
0.74
SN-05-04
33.4
8.35
2.70
8.75
1.40
8.08
1.63
4.36
0.61
3.64
0.52
65.89
2.35
1.60
2.16
0.63
SN-05-06
32.5
8.17
2.65
8.50
1.36
7.89
1.59
4.24
0.60
3.56
0.50
65.81
2.32
1.44
2.05
0.62
SN-05-07
33.3
8.35
2.69
8.69
1.40
8.13
1.63
4.36
0.62
3.67
0.52
45.92
2.35
1.44
2.11
0.62
SN-05-08
32.1
8.03
2.63
8.44
1.36
7.81
1.57
4.25
0.59
3.54
0.50
85.68
2.27
1.39
2.03
0.61
SN-05-11
34.6
8.71
2.82
9.11
1.46
8.50
1.71
4.55
0.64
3.81
0.55
16.14
2.45
1.54
2.20
0.64
SN-05Hall
35.4
8.97
2.84
9.20
1.47
8.48
1.71
4.56
0.64
3.79
0.54
96.35
2.54
1.77
2.20
0.67
SN-05-05
33.4
8.39
2.73
8.84
1.41
8.18
1.63
4.37
0.62
3.68
0.53
05.93
2.36
1.47
2.13
0.65
SN-05-03
36.1
9.03
2.94
9.44
1.51
8.73
1.76
4.71
0.66
3.97
0.57
06.39
2.53
1.57
2.38
0.71
SN-05-09
31.4
7.88
2.57
8.26
1.32
7.68
1.54
4.13
0.58
3.46
0.49
75.61
2.23
1.39
1.99
0.58
Precision
%1.3
1.9
1.4
1.5
1.5
2.0
1.8
1.4
2.0
1.4
1.9
1.5
1.6
1.5
1.9
4.1
Reportedprecisionisrepresentativ
ereprod
ucibility
basedon
14analyses
onthesamesolutio
nof
astandard
rock
Bull Volcanol (2008) 70:655–673 665

SN05-A) is more evolved than main-phase tephra, (i.e.,4.41 wt% MgO, compared to 5.31 wt%; Figs. 8 and 9).Tephra from the first day also has lower CaO and TiO2
abundances and higher K2O.Similar to the major elements, the trace elements define a
narrow range of concentrations (Fig. 10), except for tephraproduced on the first two days of the eruption. Theseearliest tephras have higher incompatible trace elementcontents than the average of the rest of the samples andexhibit lower Cr, Sc, and Ni, consistent with their evolvedmajor element compositions.
Discussion
Changes in eruptive style
The style of the Sierra Negra 2005 eruption evolvedthrough four stages:
1. An explosive vent-opening phase that produced aneruptive column ~13 km high
2. A curtain-of-fire phase, with lava fountains emanatingfrom the ~2 km-long fissure
3. A focused-fountain phase, with continuously streaminggases propelling the fire fountains from isolated vents
4. A pulsing phase, with a periodically bursting lavafountain from a single vent
The changes in eruptive style can be related to currentmodels of conduit flow and mechanisms of explosivebasaltic eruptions, as discussed below.
Transition from curtain-of-fire to discrete vents
The ~2 km long fissure that characterized the beginning ofthe eruption focused to 2–3 vents by day 3, and to a singlevent by day 4 or 5 before a second vent reopened. The ventfocusing is consistent with observations from basalticfissure eruptions of comparable size, as well as models ofdike flow (e.g., Wolfe et al. 1988; Bruce and Huppert 1989;Wylie et al. 1999). Over the course of a few hours of flowwithin a dike, increases in temperature-dependent viscosity(Wylie et al. 1999) or partial solidification (Bruce andHuppert 1989) result in constriction of magma flow.Decreased mass flux leads to lower heat supply toconstricted areas, resulting in a feedback mechanism thatchokes much of the conduit but ultimately enlarges active
4.0
4.2
4.4
4.6
4.8
5.0
5.2
5.4
5.6
20 22 24 26 28 30
1979
Uncertainty
Main Phase
MgO
(w
t. %
)
Day in October, 2005Fig. 9 Variation of MgO in tephra glasses over the course of theeruption. 1979 tephra is shown for comparison
48
49
50
51
52
4.0 4.2 4.4 4.6 4.8 5.0 5.2 5.4 5.612
13
14
15
4.0 4.2 4.4 4.6 4.8 5.0 5.2 5.4 5.6
12
13
14
15
4.0 4.2 4.4 4.6 4.8 5.0 5.2 5.4 5.68
8.5
9
9.5
10
10.5
4.0 4.2 4.4 4.6 4.8 5.0 5.2 5.4 5.6
MgO (wt. %) MgO (wt. %)S
iO2 (w
t. %
)
MgO (wt. %) MgO (wt. %)
Early Phase
Main Phase
CaO
(w
t. %
)
FeO
* (w
t. %
)
MeltsLLDLLD
Pl + Aug + OlPl + Aug + Ol + Mag
Early PhaseMain PhaseA
l 2O3 (w
t. %
)
Fig. 8 Compositions of glassesfrom the 2005 eruption (datafrom Table 1) compared tomodel trends of MELTS forcooling from 1,128° to 1,108°C
666 Bull Volcanol (2008) 70:655–673

vents and focuses eruptive activity to a few isolatedlocations along the original fissure. The transition from acontinuous line of fountaining to several discrete vents,which coincided with a decrease in the net eruptive flux, isconsistent with this explanation.
After the reopening of the easternmost vent on day 6, theintensity of the lava fountain at the continually activewestern vent was unaffected. This implies that the conduitssupplying the two vents were isolated from each other bythis stage of the eruption and were independently connectedto the pressurized magma at depth, despite being only~50 m apart at the surface.
Changes in lava fountain height
Head and Wilson (1987) propose that the height of a lavafountain depends most strongly on the magma’s gas contentand is relatively insensitive to the magma flux. The heightof the lava fountains at the two main vents was nearlyconstant from day 3 through day 6 of the eruption,supporting Head and Wilson’s (1987) hypothesis, becausethe generally decreasing eruptive flux and decliningsubsidence rate (Fig. 5) indicate that the pressure exertedby the magma chamber decreased throughout the eruption.The plume at the explosive beginning of the eruption andthe progressively shrinking lava fountain on the last dayare the exceptions to the constant lava-fountain height,suggesting that the initial magma was especially gas-rich, anddecreased pressure of the chamber was important near theeruption’s termination. Sierra Negra’s lava-fountain heightcontrasts with observations from Pu’u ‘O’o, (Kilauea,Hawaii) where Head and Wilson (1987) documentedvariations in fountain height within eruptive episodes,which they attributed to variable amounts of conduitdegassing over the course of the eruption.
Using the relationships of Head and Wilson (1987), andgiven an estimated volume flux of 100 m3 s−1 for theseventh day of the eruption and a fountain height of ~50 m,the exsolved magma volatile content was likely between0.1 and 0.2 wt%. This range is valid for volume fluxes upto and exceeding 200 m3 s−1, and for fountain heights assmall as 10–20 m, ranges that encompass most of the 2005eruption. These estimates of the volume flux and magmagas content yield an estimate of the vent’s diameter (Headand Wilson 1987) of 6–8 m. These calculations arecomplicated, however, by the presence of recycled pyro-clasts or a lava pond within the vents (Parfitt et al. 1995),which reduce the velocity of the lava fountain. Thus, theabove estimates of magmatic volatile contents and ventdiameter are both probably minimums.
The Hawaiian to Strombolian transition
The 2005 Sierra Negra eruption underwent an importanttransition from Hawaiian to Strombolian style betweendays 7 and 8. Only the easternmost vent was active bythis point, and its lava fountain ceased continuous jettingbehavior and began pulsing. Large bursting bubbles wereclearly visible in the pond at the base of the fountain.Bursts took place every 1–5 s, hurling pyroclasts up to50 m into the air, the classic characteristic of Strombo-lian eruptions (e.g., Blackburn et al. 1976; Wilson 1980;Vergniolle and Brandeis 1996). During the Strombolianphase of the eruption, pyroclasts were too cold tocontribute to a rootless flow, resulting in greater accumu-lation of scoriaceous tephra instead (e.g., Vergniolle andMangan 2000).
The transition from Hawaiian to Strombolian styles hasbeen attributed to a decrease in magma ascent speed belowa certain threshold (Wilson 1980; Sparks 1978; Parfitt andWilson 1995), and this explanation is consistent with theobservations at Sierra Negra, where there was clearly adecrease in magma chamber pressure with time (Fig. 5). Atrelatively high ascent velocities, vesiculated magma movesthrough the conduit as a homogeneous two-phase flow(e.g., Wilson and Head 1981; Sparks 1978). As magma risespeed decreases, larger bubbles segregate and coalesce,forming a gas slug (e.g., Sparks 1978). Parfitt and Wilson(1995) estimate that the Hawaiian-Strombolian transitionoccurs when magma rise speeds are in the range of ~0.01–0.3 m s−1. Rise speed can be estimated from observedvolume flux divided by the estimated area of the eruptivevents (Parfitt 2004). Our estimates for volume flux for days7 and 8 of the eruption, when the transition in eruptivebehavior occurred, are 100 and 25 m3 s−1, and the ventdiameter is calculated to be ~8 m. The magma rise rate forday 7 (Hawaiian style) is calculated to be 0.64 m s−1; forday 8 (Strombolian), it drops to 0.32 m s−1, broadly
22.0
22.5
23.0
23.5
24.0
24.5
25.0
25.5
26.0
26.5
40 50 60 70 80 90
13% FractionalCrystallization
Early PhaseClastigenicLava
Day 7
Main Phase
Cr (ppm)
La (p
pm
)
Fig. 10 Cr and La concentrations in samples of lava and tephra fromthroughout the eruption. Model arrow shows the effect of 13%fractional crystallization of an assemblage 48% augite, 40% plagio-clase, and 12% magnetite, with mineral/melt distribution coefficientsof 4, 0, and 30. Bulk distribution coefficient for La=0.01
Bull Volcanol (2008) 70:655–673 667

consistent with the Hawaiian to Strombolian transition ascalculated by Parfitt and Wilson (1995).
Clastigenic lava flows
The 2005 lava flows on the northern flank of Sierra Negraare all rootless clastigenic flows, fed by the lava fountainsinside the caldera rim. Several factors led to the formationof these extensive flows. First, the low altitude wind duringthe eruption was mostly from the south, causing spatter andtephra to accumulate on the uppermost north flanks.Second, the easternmost vent produced an inclined foun-tain, directed to the north, so the pyroclasts accumulateddisproportionately on that side of the vent. Third, the lavafountaining was vigorous, which allowed the pyroclasts toaccumulate to lava-flow thickness before it cooled signif-icantly (e.g., Capaccioni and Cuccoli 2005; Sumner et al.2005).
During the curtain-of-fire phase, the clastigenic lavaflows were active across a 2-km wide swath of the northflank, advancing ~5 km down the flank in <12 h. Weestimate that the flows have an average thickness 4 m.These values yield estimates of the accumulation rate ofpyroclasts of ~1,600 m/h, far beyond the minimumthreshold for agglutination and welding (Capaccioni andCuccoli 2005). The easternmost clastigenic flow, whichremained active for a week, formed from pyroclastsaveraging 1–5 cm in diameter. The accumulation rate ofpyroclastic material must have exceeded 0.2 m h−1 over thisweek (Capaccioni and Cuccoli 2005). The deposition of upto 1 m of scoria on top of the easternmost clastigenic flowalso contributed to its longevity, acting as insulation to slowcooling.
Ponded lava flow
The ponding of voluminous `a`a flows inside calderas is acommon process in the Galápagos, and these lavas havedistinctive characteristics that aid in the interpretation of thevolcanoes’ eruptive and structural histories. In addition tothe 2005 eruption of Sierra Negra, ponded intracalderalavas were emplaced during the 1982 eruption of Wolfvolcano (Geist et al. 2005) and the 1960 eruption ofFernandina (Rowland and Munro 1992). Furthermore,many of the lavas described from the caldera walls at thesevolcanoes as well as Cerro Azul (Naumann and Geist 2000)and Ecuador (Geist et al. 2002) have been interpreted ashaving ponded in pre-existing calderas. Observation of theemplacement of the 2005 Sierra Negra lava revealed twounusual attributes, both related to the containment of thelava in a confined depression. First, the `a`a progressed byemitting a pahoehoe flow front, a process that haspreviously been recognized in Hawaii (Jurado-Chichay
and Rowland 1995; Hon et al. 2003). Second, after thefirst day, the ponded lava flow grew in volume mostlythrough thickening by inflation, a process previouslydocumented in the emplacement of pahoehoe lava flows(e.g., Hon et al. 1994; Self et al. 1998), but so far as we areaware, formerly unrecognized for `a`a flows. These unusualprocesses are attributed to the fact that the lava flowreached most of its maximum aerial extent within a day ofthe onset of the eruption, and thereafter its margins werecontained within the inward-sloping caldera floor andwalls.
The key element of inflationary pahoehoe is that once asurface crust forms to a sufficient thickness, it retards theflow top’s horizontally advance. This permits a stableviscoelastic layer to form, which thickens as a function ofthe square root of time (Hon et al. 1994) and containspressurized lava. Inflation is then driven by a pressure headin the fluid interior of the flow, which is in turn driven bygravity acting on lava contained inside the viscoelasticcrust. During the first day of the 2005 eruption, the flowadvanced as typical channel-fed `a`a. From the second dayon, however, the crust of the ponded `a`a only advancedvery slowly, perhaps a couple of meters per day, by slowspreading across elevated axial clefts (Fig. 11). Wehypothesize that this transition in behavior occurred whena viscoelastic crust stabilized beneath the `a`a surface,between the brittle top and pressurized, near-Newtonianlava in the core of the flow (Hon et al. 1994; Self et al.1998). The source of the internal pressure within theponded `a`a was not derived from a sloping lava tube.Instead, lava cascaded down the bench in an open channeland pooled in a lava pond at the base of the escarpment.This elevated pool then supplied the interior of the lavaflow, causing inflation and slow spreading.
This model (Fig. 11) also explains the effusion of thepahoehoe lobes from the interior of the `a`a flow and theextrusion of congealed toothpaste lava near the flow front.The effect of cooling within the intracaldera lava flow ismodeled using MELTS, an energy-minimization model ofcrystallization of silicate liquids (Ghiorso and Sack 1995),using glass from the main phase tephra as a parentcomposition and setting the oxygen fugacity initially atNi–NiO at the liquidus but closing the system to oxygenthereafter. The composition of the glass in quenched lavasample SN05-5 is best matched by 29°C of cooling, whichresults in the formation of 23% microlites. This smallamount of cooling and crystallization almost certainlyoccurred while the lava was in the open channels on thecaldera-wall benches, because thereafter it was containedentirely within the interior of the flow. When this still-hotand poorly crystalline lava broke out from the front marginof the stagnant `a`a flow, it acted as a low-effusion rate flowand created pahoehoe (Rowland and Walker 1990). In
668 Bull Volcanol (2008) 70:655–673

places, the more slowly spreading `a`a would then advanceover the pahoehoe front.
Volcano deformation
The absence of precursory changes in the deformationpattern (Figs. 4 and 5) indicates that the dike that fed theeruptive fissure likely started to propagate within the last16 h before the eruption, after the GPS network failed. Forexample, if a dike that is 1 m wide at the surface hadpropagated from 2 to 1 km depth, GV03 should havemoved ~7 cm southward (Pollard et al. 1983), and theabsence of such observed motion indicates that this couldnot have happened, because the GV06-GV03 baseline
shows no offset >5 mm from the long-term trend before22 October. We suspect that the earthquake that precededthe eruption by ~3 h triggered the dike that fed the eruptivefissure. If so, then the dike ascended from the 2-km-deepmagma chamber at a minimum velocity of 0.2 m s−1.
Deflation during the eruption was caused by depressur-ization and loss of magma from the subcaldera magmareservoir. Moreover, intrusion of the dike and opening ofthe eruptive fissure contributed to deformation. Modelingof the deformation is severely hampered by the absence ofany stable GPS station in the region for the first three daysof the eruption and the lack of coherence within the calderain co-eruption interferograms. Thus, we have made bestestimates of most parameters before inverting for
Fig. 11 Schematic diagram ofthe features in the caldera-fillinglava flow (compare to Figs. 2and 3). Top: plan view. Middle:cross section across the middleof the flow. Bottom: longitudinalcross section
Bull Volcanol (2008) 70:655–673 669

unknowns. The four GPS stations operating over the courseof the eruption do not constrain the geometry of the magmabody well, but the long-term deformation at Sierra Negraindicates a flat-roofed chamber (perhaps a sill), roughly5×3 km in horizontal extent, and whose top is about 2.1 kmdeep (Amelung et al. 2000; Geist et al. 2006; Yun et al.2006a). The minimum subsidence of GV04 was 2.4 m overthe course of the eruption (with the most conservativeassumption that GV03 underwent no subsidence). A morerealistic estimate, arrived at by extrapolating the long-termuplift of GV03 to 22 October and comparing that to itsposition on 24 October (when its position relative to astable station could be determined), is that the totalsubsidence at GV04 was 5.4 m. The minimum subsidencerequires that the chamber contracted in volume by8.3×107 m3, using the geometry modeled by Geist et al.(2006) and the method of Okada (Okada 1985). The morerealistic estimate of subsidence yields an estimated con-traction of the magma chamber of 1.9×10⁸ m3. Thiscalculated range in eruptive volume from deformation datais consistent with our maximum volume estimate of1.5×108 m3.
We also modeled the most coherent radar interferogram(Fig. 6a) to gain insight into the magma source associatedwith the eruption. Unfortunately, deformation due to theintrusion of the dike along the north caldera rim cannot beresolved because of the lack of coherent data within thecaldera We first modeled the InSAR data by assuming auniformly closing, horizontal dislocation at 2.1 km depth(Amelung et al. 2000; Geist et al. 2006; Yun et al. 2006a, b)and solved for aerial extent and opening (Okada 1985). Thebest-fitting dislocation to the co-eruption interferogram isslightly larger in plan view than that of Geist et al. (2006),reaching a size of about 5×5 km centered within thecaldera, with a volume loss of 66×106 m3. The maximumexpected subsidence in the caldera from this model is lessthan 2 m, a smaller value than the minimum estimated GPSdisplacement. We note that these estimates are poorlyconstrained, owing to the lack of coherence where it ismost needed for modeling.
A point source model is required to explain the line-of-sight shortening east of the caldera, so we combined a pointsource and a sill source to best approximate the deformationfield. The best-fitting model has a 4.5×4.5 km uniformopening sill and a point source, and both located at 2.1 kmdepth beneath the caldera (Fig. 6b). The cumulative volumeloss from the two model sources is 80×106 m3, and themaximum predicted subsidence within the caldera is about3.5 m, which are within the range of estimates from theGPS measurements. The residual displacements (Fig. 6c)are significant in some areas, especially the south and eastparts of the caldera, because of the lack of data in thecaldera where deformation gradients are highest. Refine-
ments to the deformation models are currently being undertaken by Sang-Ho Yun and his colleagues at StanfordUniversity, who have developed methods to obtain mean-ingful InSAR measurements within the caldera (Yun et al.2006b).
The deformation of Sierra Negra is coupled closely intime to the eruptive flux. The subsidence rate deceleratedexponentially over the course of the eruption (Fig. 5). Theeruptive flux is poorly constrained, because we have noway of knowing if the depths of the lava channels changedover the course of the eruption. If, however, we use thecumulative width of the lava channels spilling over thecaldera bench (measured in photographs taken duringthe course of the eruption) as a proxy for flux, there is a directcorrelation between flux and deformation rate (Fig. 12),indicating nearly immediate elastic response of the calderafloor to the eruption of magma.
Petrologic interpretation
The range of glass compositions (Fig. 6) cannot simply be theresult of in situ microlite crystallization, because the tephracontains <5% crystals, which is not enough to account forthe variation (Fig. 7). Also, bulk-rock (glass + crystals) traceelement compositions display significant variation (Fig. 10).Relative to the main-phase tephra and lavas, the first tephraerupted is enriched in incompatible elements by >10% anddepleted in elements compatible in plagioclase, clinopyrox-ene, and magnetite (Table 1, Fig. 10). The difference in traceelement composition between the first-erupted and main-phase tephra is reproduced by ~13% crystallization (Fig. 10).The compositions of the rocks show strong evidence forcrystallization of both plagioclase (lower Sr/Y) and clino-pyroxene (lower Sc/Y) crystallization in the first-eruptedlavas (Fig. 13).
The major element evolution of the Sierra Negra magmawithin the subcaldera reservoir is modeled using MELTS(Ghiorso and Sack 1995) at 70 MPa, because the top of themagma chamber at Sierra Negra is known to be about2.1 km deep (Amelung et al. 2000; Geist et al. 2006). Theoxygen fugacity was initially set at Ni–NiO at the liquidus,but the system was closed to oxygen upon cooling. Theinitial water concentration was set at 0.6%. The modelshows that the entire range in glass compositions is likelydue to crystallization of plagioclase, olivine, augite, andtitanomagnetite, by cooling from 1,128 to 1,108°C (Fig. 8).
Two explanations for the intra-eruption zoning and thedifferentiation of the early-phase magma are possible. First,the initial magma that intruded through the conduit mayhave cooled and undergone fractional crystallization as itascended. Second, the early-phase magma may haveerupted from a differentiated upper boundary layer in thesubcaldera magma body.
670 Bull Volcanol (2008) 70:655–673

The complete absence of crystals >100 μm in the earlyphase tephra argues against crystallization and removal ofthe crystals during ascent. The lack of a deformation signalin the days prior to the eruption also suggests that the dikethat fed the eruptive fissure intruded only hours before theeruption, perhaps initiated by the earthquake that occurredearlier on 22 October. Nucleation, growth, and near-perfectremoval of >10% crystals in the matter of a few hours isimplausible. Cashman (1993) estimated that plagioclasegrowth rates are in the range of 10−10 to 10−11 cm s−1 inshallow basaltic dikes. Thus growth of the 100 μm micro-lites observed in the rock would have taken weeks to years.In addition to crystal growth and nucleation, both pre-existing and newly formed crystals need to be perfectlysegregated from the liquid during ascent through thefissure-feeding dike, which is estimated to have propagatedat ~0.2 m s−1.
We therefore suggest that the magma body that lies2.1 km beneath the caldera is stably zoned, with an upperthermal boundary layer that is cooler and more evolvedthan the interior of the magma body. According to resultsfrom MELTs calculations, the first 20° of cooling causesapproximately 13% crystallization of plagioclase, clinopyr-oxene, olivine and titanomagnetite. Because the residualliquid is slightly buoyant relative to the undifferentiatedmagma (the calculated density is 2,670 versus 2,700 kg/m3)and crystals, it is unlikely that the differentiated liquidcould have been created in an upper solidification front(Marsh 1996, 2002). In contrast, Helz et al. (1989) foundthat buoyant differentiated liquid pooled in the upper part ofthe Kilauea Iki lava lake. This liquid derived from the lowersolidification front and is hypothesized to have risen to thetop of the magma body in buoyant diapirs, with no mixing.Jellinek and Kerr (Jellinek and Kerr 2001) have argued
against this hypothesis but their model invokes vigorousconvection in the lava lake an unresolved issue. In the Helzet al. (1989) model diapirs are driven by a density contrastof ~20 kg/m3 nearly that calculated for the Sierra Negrachamber.
Thus, our preferred explanation is that a pool ofdifferentiated liquid accumulated beneath the upper solid-ification front of the Sierra Negra magma chamber. Thisdifferentiated liquid formed from ~13% crystallization nearthe bottom of the reservoir, and the liquid rose buoyantlythrough the main body. Additional crystallization of micro-lites without crystal-liquid segregation then took place with~5° further cooling in the upper boundary layer and duringconduit ascent. As the shallow magma body at Sierra Negrabecame increasingly pressurized by intrusion, the surround-ing rocks eventually failed, and the first magma eruptedwas from this mostly liquid-differentiated upper-boundarylayer. The differentiated magma was evacuated in the firsthours of the eruption, and later products are from therelatively homogeneous interior of the magma body. One ofthe attractive aspects of this model is that crystallizationwould also tend to enrich the differentiated melt in water,which accounts for the greater explosivity of the first phaseof the eruption.
The nearly aphyric rocks erupted during October 2005 atSierra Negra provide almost no evidence regarding thecomposition of the parental magma that intruded andpressurized the reservoir. We suspect that it is evolvedbasalt, not much different from what was erupted during themain phase, because exposed Sierra Negra lavas areremarkably homogeneous in composition and contain noevidence of xenocrysts derived by crystallization of a moreprimitive magma (Reynolds and Geist 1995).
0 0.2 0.4 0.6 0.8 1 1.2 1.4 1.6 1.80
0.1
0.2
0.3
0.4
0.5
0.6
0 0.2 0.4 0.6 0.8 1 1.2 1.4 1.6 1.8
Oct.23
Oct.24
Oct.27
Oct. 28-29
Rate of Subsidence (m/day)
Nor
mal
ized
Wid
th o
fL
ava
Cha
nnel
s
Fig. 12 Subsidence of the caldera correlates almost perfectly with theeruptive flux. Horizontal axis is the rate of subsidence of GPS stationGV04 relative to GV03, which decelerated over the course of theeruption. Vertical axis is the proportion of the caldera bench edge thatis covered by an open lava channel, which is proportional to theeruptive flux, if the depth of the channels is the same
6.3
6.4
6.5
6.6
6.7
6.8
6.9
7.0
7.1
7.2
0.65 0.70 0.75 0.80 0.85 0.90
Sc/Y
Sr/
Y
First Tephra Out
Tephra Second Day
ClastogenicLava
CPX
PlagPlag
Fig. 13 Plot of Sc/Y versus Sr/Y for 2005 tephra and lava. The earlyphase tephra has lower Sr/Y and Sc/Y than the main phase rocks,indicating an origin by fractionation of both plagioclase and pyroxene
Bull Volcanol (2008) 70:655–673 671

Conclusion: a bottom-up view of the 2005 eruption
This study reveals that even in a remote setting with littleinstrumentation, an integrated study of an active eruption canreveal much about eruptive processes and the dynamics ofmagma transport. Deformation data indicate that the magmachamber feeding summit eruptions at Sierra Negra is a sill orflat-topped diapir that lies 2.1 km beneath the caldera floor(Amelung et al. 2000; Geist et al. 2006; Yun et al. 2006a).This reservoir is pressurized by magma intruding frombelow, which is already differentiated. Cooling takes placeat the roof and floor of the magma body; residual liquids atthe roof do not segregate from the crystals, but residualliquids formed at the floor are buoyant and segregate to theroof of the reservoir after about 13% crystallization. Thisdifferentiated magma is about 20°C cooler than the mainbody and is relatively rich in dissolved H2O.
The subcaldera magma reservoir has been intrudedepisodically since at least 1992 (Amelung et al. 2000) andprobably since the previous eruption in 1979. These eventspressurized the sill, which domed the caldera floor by >5 mand caused repeated inelastic failure along trapdoor faults(Chadwick et al. 2006). Although the pressure increaseaccelerated starting in 2003, there is no indication of anysudden change in the days leading up to the eruption.
At 14:34 local time on 22 October 2005, a Mw 5.5earthquake occurred at Sierra Negra. This earthquakeprobably initiated dike injection from the magma reservoir,but the dike did not propagate along the active fault:instead, it followed a path on the side of the volcanoopposite the active faults. That the dike avoided the activefaults is consistent with the long-term mechanical andrecent eruptive behavior of Sierra Negra (Reynolds et al.1995; Yun et al. 2006a).
The first magma that erupted was chemically moreevolved and richer in water than the magma that eruptedlater. Its eruption led to the formation of a ~13 km highplume of steam, gases, and ash. Within an hour, the dikewas delineated by a 2-km-long curtain of fire. Thefountains fed clastigenic flows that quickly progresseddown the north side of the volcano. They also supplied avoluminous `a`a flow that advanced 5 km south across thecaldera floor, banked against the southern caldera wall, andthen flowed west in the moat between the trapdoor fault andcaldera wall. The intra-caldera lava flow grew to most of itsfinal area within the first two days of the eruption. Therootless clastigenic flows formed because the depositionrate of the tephra and spatter on the uppermost north flankwas rapid, maintained by high effusion rates at the start ofthe eruption, a favorable wind direction, and collimatedlava fountains later in the eruption.
The curtain-of-fire phase ended when the fissure focusedinto several vents at its eastern end, probably owing to
constriction of the dike from cooling, increases in viscosity,and a focusing feedback mechanism (Wylie et al. 1999). Allbut the easternmost rootless flow ceased activity once thevents coalesced from the fissure. Except for the openingblast, this phase of eruptive activity was Hawaiian in style,with continuously streaming gases carrying spatter andtephra in the fire fountain.
Lava continued to pond within the caldera after flowingover intracaldera benches in open channels. The calderafloor lava flow was fed by a perched lava pond beneath thebench, which fed the interior of the main flow andpressurized it, causing slow inflation and slight spreadingabout its center. After the first day, the `a`a flow advancedslowly by emitting lobes of pahoehoe.
On the last day of the eruption, the eruptive stylechanged to Strombolian, characterized by the bursting oflarge bubbles near the surface and pulsating fire fountains.The transition occurred when the ascent rate of the magmain the conduit decreased below a threshold value of~25 m3 s−1, probably owing to waning driving pressurefrom the magma chamber. The eruption ended in the earlyhours of 30 October 2005, when the cooling rate within thedike exceeded a critical flow rate, a reflection of continuallydecreasing driving pressure. The magma reservoir beganinflating the next day.
Acknowledgements We would like to extend our thanks to theGalápagos National Park and the Charles Darwin Research Station,who made our observation of the Sierra Negra eruption possible,particularly Srs. O. Carvajal, W. Tapia, F. Cruz, and G. Watkins. Weare also grateful to individuals who have provided us with imagesfrom the early phases of the eruption, including G. Estes, F. Cruz, andA. Voigt. Thanks to J. Normandeau of UNAVCO for his heroicpatience in helping us get the GPS receivers working again during theeruption. This work was supported by NSF grants EAR-0207425 toKSH and EAR-0207605, 0538205, and 0004067 (which supported theinstallation of the GPS network) to DJG. ENVISAT ASAR data arecopyrighted 2004–2006 by the European Space Agency, and wereobtained via Category-1 Proposal 3493. Thanks to W. Tater for hishelp with the SEM. We thank B. Cousens and especially S. Rowlandfor review and J. Stix for his editorial help.
References
Allan JF, Simkin R (2000) Fernandina Volcano’s evolved, well-mixedbasalts: mineralogical and petrological constraints on the natureof the Galapagos plume. J Geophys Res 105:6017–6031
Amelung F, Jonsson S, Zebker H, Segall P (2000) Widespread upliftand ‘trapdoor’ faulting on Galapagos volcanoes observed withradar interferometry. Nature 407:993–996
Blackburn EA, Wilson L, Sparks RSJ (1976) Mechanisms anddynamics of Strombolian activity. J Geol Soc London 132:429–440
Bruce PM, Huppert HE (1989) Thermal control of basaltic fissureeruptions. Nature 342:665–667
Capaccioni B, Cuccoli F (2005) Spatter and welded air fall depositsgenerated by fire-fountaining eruptions: cooling of pyroclasts
672 Bull Volcanol (2008) 70:655–673

during transport and deposition. J Volcanol Geotherm Res145:263–280
Cashman KV (1993) Relationship between plagioclase crystallizationand cooling rate in basaltic melts. Contrib Mineral Petrol113:126–142
Chadwick WW, Geist DJ, Johnsson S, Poland M, Johnson DJ (2006)A volcano bursting at the seams: inflation, faulting, and eruptionat Sierra Negra Volcano, Galápagos. Geology 34:1025–1028
Geist D (2002) Volcanic evolution in the Galapagos: the dissectedshield of Volcan Ecuador. Geochem Geophys Geosyst 3(10):1061. DOI 10.1019/2002GC000355
Geist DJ, Naumann TR, Standish JJ, Kurz MD, Harpp KS, WhiteWM, Fornari DJ (2005) Wolf Volcano, Galapagos Archipelago:melting and magmatic evolution at the margins of a mantleplume. J Petrol 46:2197–2224
Geist D, Chadwick W, Johnson D (2006) Results from new GPS andgravity monitoring networks at Fernandina and Sierra Negravolcanoes, Galapagos, 2000–2002. J Volcanol Geotherm Res150:79–97
Ghiorso MS, Sack RO (1995) Chemical mass transfer in magmaticprocesses: IV. a revised and internally consistent thermodynamicmodel for the interpolation and extrapolation of liquid-solidequilibria in magmatic systems at elevated temperatures andpressures. Contrib Mineral Petrol 119:197–212
Goff F, McMurtry GM, Counce D, Simac JA, Roldan-Manzo AR,Hilton DR (2000) Contrasting hydrothermal activity at SierraNegra and Alcedo volcanoes, Galapagos Archipelago, Ecuador.Bull Volcanol 62:34–52
Harpp KS, Fornari DJ, Geist DJ, Kurz MD (2003) GenovesaSubmarine Ridge: a manifestation of plume-ridge interaction inthe Northern Galápagos Islands. Geochem Geophys Geosys 4DOI 10.1029/2003GC000531
Head JW, Wilson L (1987) Lava fountain heights at Pu’u O’o,Kilauea, Hawaii: indictators of amount and variations of exsolvedmagma volatiles. J Geophys Res 92:13,715–713,719
Helz RT, Kirschenbaum H, Marinenko JW (1989) Diapiric transfer ofmelt in Kilauea Iki lava lake, Hawaii: a quick, efficient process ofigneous differentiation. Geol Soc Am Bull 101:578–594
Hon KA, Gansecki C, Kauahikaua J (2003) The transition from ‘a’a topahoehoe crust on flows emplaced during the Pu’u ‘O’o-Kupaianaha eruption. US Geol Surv Prof Pap 89-103
Hon K, Kauahikaua J, Denlinger R, Mackay K (1994) Emplacementand inflation of pahoehoe sheet flows: observations and measure-ments of active lava flows on Kilauea volcano, Hawaii. Geol SocAm Bull 106:351–370
Jellinek AM, Kerr RC (2001) Magma dynamics, crystallization, andchemical differentiation of the 1959 Kilauea Iki lava lake,Hawaii, revisited. J Volcanol Geotherm Res 110:235–263
Jonsson S, Zebker H, Amelung F (2005) On trapdoor faulting at SierraNegra volcano, Galapagos. J Volcanol Geotherm Res 144:59–71
Jurado-Chichay Z, Rowland SK (1995) Channel overflows of thePhue Bay flow, Mauna Loa, Hawai’i: examples of the contrastbetween surface and interior lava. Bull Volcanol 57(2):117–126
Marsh BD (1996) Solidification fronts and magmatic evolution.Mineral Mag 60:5–40
Marsh BD (2002) On bimodal differentiation by solidification frontinstability in basaltic magmas, part 1: basic mechanics. GeochimCosmochim Acta 66:2211–2229
Naumann TR, Geist D (2000) Physical volcanology and structuraldevelopment of Cerro Azul Volcano, Isabela Island, Galapagos:implications for the development of Galapagos-type shieldvolcanoes. Bull Volcanol 61:497–514
Okada Y (1985) Surface deformation due to shear and tensile faults ina half-space. Bull Seism Soc Am 75:1135–1154
Parfitt EA (2004) A discussion of the mechanisms of explosivebasaltic eruptions. J Volcanol Geotherm Res 134:77–107
Parfitt EA, Wilson L (1995) Explosive volcanic eruptions: IX. thetransition between Hawaiian-style lava fountaining and Strombo-lian explosive activity. Geophys J Int 121:226–232
Parfitt EA, Wilson L, Neal CA (1995) Factors influencing the heightof Hawaiian lava fountains: implications for the use of fountainheight as an indicator of magma gas content. Bull Volcanol57:440–450
Pollard DD, Delaney PT, Duffield WA, Endo ET, Okamura AT (1983)Surface deformation in volcanic rift zones. Tectonophys 94:541–584
Rader E, Harpp KS, Geist DJ (2006) Eruption dynamics and flowmorphology during the 2005 Sierra Negra eruption, GalapagosIslands. EOS Trans AGU Fall Meet Assem Suppl 87:AbstractV23A-0586
Reynolds RW, Geist DJ (1995) Petrology of lavas from Sierra Negravolcano, Isabela Island, Galapagos Archipelago. J Geophys Res100:24,537–524,553
Reynolds RW, Geist D, Kurz MD (1995) Physical volcanology andstructural development of Sierra Negra volcano, Isabela Island,Galapagos Archipelago. Geol Soc Am Bull 107:1398–1410
Rowland SK, Walker GPL (1990) Pahoehoe and aa in Hawaii:volumetric flow rate controls the lava structure. Bull Volcanol 52(8):615–628
Rowland SK, Munro D (1992) The caldera of Volcan Fernandina: aremote sensing study of its structure and recent activity. BullVolcanol 55:97–109
Self S, Keszthelyi L, Thordarson T (1998) The importance ofpahoehoe. Ann Rev Earth Planet Sci 26:81–110
Simkin T, Siebert L (1994) Volcanoes of the world. Geoscience Press,Tucson, AZ
Sparks RSJ (1978) The dynamics of bubble formation and growth inmagmas: a review and analysis. J Volcanol Geotherm Res 3:1–37
Sumner JM, Blake S, Matela RJ, Wolff JA (2005) Spatter. J VolcanolGeotherm Res 142:49–65
Teasdale R, Geist D, Kurz M, Harpp K (2005) 1998 eruption atVolcan Cerro Azul, Galapagos Islands: I. syn-eruptive petrogen-esis. Bull Volcanol 67:170–185
Vergniolle S, Brandeis G (1996) Strombolian explosions 1: a largebubble breaking at the surface of a lava column as a source ofsound. J Geophys Res 101:20,433–420,447
Vergniolle S, Mangan MT (2000) Hawaiian and Strombolianeruptions. In: Sigurdsson H, Houghton B, McNutt SR, RymerH, Stix J (eds) Encyclopedia of volcanoes. Academic Press, SanDiego, CA, pp 447–461
Wilson L (1980) Relationships between pressure, volatile content andejecta velocity in three types of volcanic explosion. J VolcanolGeotherm Res 8:297–313
Wilson L, Head JW (1981) Ascent and eruption of basaltic magma onthe Earth and Moon. J Geophys Res 86:2971–3001
Wolfe EW, Neal CA, Banks NG, Duggan TJ (1988) Geologicobservations and chronology of eruptive events. US Geol SurvProf Pap 1463:1–97
Wylie JJ, Helfrich KR, Dade B, Lister JR, Salzig JF (1999) Flowlocalization in fissure eruptions. Bull Volcanol 60:432–440
Yun S, Zebker H, Segall P, Hooper A, Poland M (2005) The 2005eruption at Sierra Negra volcano unveiled by InSAR observa-tions, EOS Trans AGU Fall Meet Assem Suppl 87(52):AbstractG52A-01
Yun S, Segall P, Zebker H (2006a) Constraints on magma chambergeometry at Sierra Negra Volcano, Galapagos Islands, basedon InSAR observations. J Volcanol Geotherm Res 150:232–243
Yun S, Zebker H, Segall P, Hooper A, Poland M (2006b) 2005Eruption at Sierra Negra volcano unveiled by InSAR observa-tions. EOS Trans AGU Fall Meet Assem Suppl 87(52):AbstractG52A-01
Bull Volcanol (2008) 70:655–673 673