Mechanisms of geochemical and geophysical variations along the western Galápagos Spreading Center
30
Mechanisms of geochemical and geophysical variations along the western Gala ´ pagos Spreading Center Stephanie Ingle, Garrett Ito, John J. Mahoney, William Chazey III, and John Sinton Department of Geology and Geophysics, SOEST, University of Hawai‘i at Manoa, Honolulu, Hawaii 96822, USA ([email protected]) Melissa Rotella Department of Geology and Geophysics, SOEST, University of Hawai‘i at Manoa, Honolulu, Hawaii 96822, USA Now at School of Geography, Environment and Earth Sciences, Victoria University, PO Box 600, Wellington, New Zealand David M. Christie West Coast and Polar Regions Undersea Research Center and Kasitsna Bay Laboratory, University of Alaska Fairbanks, PO Box 757220, Fairbanks, Alaska 99775, USA [1] Improved insights into the processes of hot spot–ridge interaction along the Gala ´pagos Spreading Center (GSC) are revealed by geochemical data between 91°W and 98°W. Principal components analysis reveals that >87% of the total isotopic variability can be explained with only two mantle source components. The ‘‘depleted’’ component has lower ratios of highly to moderately incompatible elements, higher Nd isotopic ratios, and lower Sr and Pb isotopic ratios. The second component is relatively enriched in incompatible elements, has more radiogenic Pb and Sr and less radiogenic Nd, and is comparable to the C or ‘‘common’’ mantle component observed at many locations in the Pacific. The enriched component’s signature is strongest nearest the hot spot at 92°W and diminishes with distance from the hot spot to 95.5°W. Near 95.5°W, lava compositions change sharply, becoming dominated by the depleted component and remaining so farther west, to 98°W. Thus, the Gala ´pagos hot spot most clearly influences the composition of the GSC between 91°W and 95.5°W. The depleted component between 91°W and 98°W differs from that evident at the Gala ´pagos Archipelago, along the GSC east of 91°W, and along the East Pacific Rise. This suggests some form of compositional zoning in the regional mantle. If the depleted materials are intrinsic to the Gala ´pagos mantle plume, then the plume is bilaterally zoned and feeds a depleted component to the GSC at 91°W–98°W that is distinct from the depleted material elsewhere in the region. This possibility is supported by melting models in which the Gala ´pagos plume is a uniform mixture of a depleted matrix and fine-scale enriched veins. The expression of the more fusible veins is predicted to be enhanced nearest the hot spot (92°W), where plume-like upwelling drives rapid flow and melting deeper in the melting zone (where the veins are melting). With increasing westward distance from the hot spot, the deep, plume-driven flow is predicted to decrease, as does the expression of the enriched veins in lava compositions. The model therefore adequately explains the compositional and crustal variations from 92°W to 95.5°W. The average model composition of the plume in this region does not differ significantly from that of the ambient mantle beneath other ridges not influenced by hot spots. G 3 G 3 Geochemistry Geophysics Geosystems Published by AGU and the Geochemical Society AN ELECTRONIC JOURNAL OF THE EARTH SCIENCES Geochemistry Geophysics Geosystems Article Volume 11, Number 4 16 April 2010 Q04003, doi:10.1029/2009GC002694 ISSN: 1525-2027 Click Here for Full Article Copyright 2010 by the American Geophysical Union 1 of 30
Transcript of Mechanisms of geochemical and geophysical variations along the western Galápagos Spreading Center

Mechanisms of geochemical and geophysical variations alongthe western Galapagos Spreading Center
Stephanie Ingle, Garrett Ito, John J. Mahoney, William Chazey III, and John SintonDepartment of Geology and Geophysics, SOEST, University of Hawai‘i at Manoa, Honolulu, Hawaii 96822, USA([email protected])
Melissa RotellaDepartment of Geology and Geophysics, SOEST, University of Hawai‘i at Manoa, Honolulu, Hawaii 96822, USA
Now at School of Geography, Environment and Earth Sciences, Victoria University, PO Box 600, Wellington,New Zealand
David M. ChristieWest Coast and Polar Regions Undersea Research Center and Kasitsna Bay Laboratory, University of Alaska Fairbanks,PO Box 757220, Fairbanks, Alaska 99775, USA
[1] Improved insights into the processes of hot spot–ridge interaction along the Galapagos SpreadingCenter (GSC) are revealed by geochemical data between �91�Wand 98�W. Principal components analysisreveals that >87% of the total isotopic variability can be explained with only two mantle sourcecomponents. The ‘‘depleted’’ component has lower ratios of highly to moderately incompatible elements,higher Nd isotopic ratios, and lower Sr and Pb isotopic ratios. The second component is relatively enrichedin incompatible elements, has more radiogenic Pb and Sr and less radiogenic Nd, and is comparable to theC or ‘‘common’’ mantle component observed at many locations in the Pacific. The enriched component’ssignature is strongest nearest the hot spot at �92�W and diminishes with distance from the hot spot to95.5�W. Near 95.5�W, lava compositions change sharply, becoming dominated by the depleted componentand remaining so farther west, to 98�W. Thus, the Galapagos hot spot most clearly influences thecomposition of the GSC between 91�W and 95.5�W. The depleted component between 91�W and 98�Wdiffers from that evident at the Galapagos Archipelago, along the GSC east of 91�W, and along the EastPacific Rise. This suggests some form of compositional zoning in the regional mantle. If the depletedmaterials are intrinsic to the Galapagos mantle plume, then the plume is bilaterally zoned and feeds adepleted component to the GSC at 91�W–98�W that is distinct from the depleted material elsewhere in theregion. This possibility is supported by melting models in which the Galapagos plume is a uniform mixtureof a depleted matrix and fine-scale enriched veins. The expression of the more fusible veins is predicted tobe enhanced nearest the hot spot (�92�W), where plume-like upwelling drives rapid flow and meltingdeeper in the melting zone (where the veins are melting). With increasing westward distance from the hotspot, the deep, plume-driven flow is predicted to decrease, as does the expression of the enriched veins inlava compositions. The model therefore adequately explains the compositional and crustal variations from92�W to 95.5�W. The average model composition of the plume in this region does not differ significantlyfrom that of the ambient mantle beneath other ridges not influenced by hot spots.
G3G3GeochemistryGeophysics
Geosystems
Published by AGU and the Geochemical Society
AN ELECTRONIC JOURNAL OF THE EARTH SCIENCES
GeochemistryGeophysics
Geosystems
Article
Volume 11, Number 4
16 April 2010
Q04003, doi:10.1029/2009GC002694
ISSN: 1525-2027
ClickHere
for
FullArticle
Copyright 2010 by the American Geophysical Union 1 of 30

Components: 18,303 words, 17 figures, 3 tables.
Keywords: plume-ridge interaction; Galapagos Spreading Center; mantle dynamics; radiogenic isotopes; trace element
geochemistry; mantle plumes.
Index Terms: 1009 Geochemistry: Geochemical modeling (3610, 8410); 1032 Geochemistry: Mid-oceanic ridge processes
(3614, 8416); 1040 Geochemistry: Radiogenic isotope geochemistry.
Received 19 June 2009; Revised 19 January 2010; Accepted 26 January 2010; Published 16 April 2010.
Ingle, S., G. Ito, J. J. Mahoney, W. Chazey III, J. Sinton, M. Rotella, and D. M. Christie (2010), Mechanisms of geochemical
and geophysical variations along the western Galapagos Spreading Center, Geochem. Geophys. Geosyst., 11, Q04003,
doi:10.1029/2009GC002694.
1. Introduction
[2] Many hot spots are located near mid-oceanridges. Hot spots are commonly thought to derivefrom volatile-rich [e.g., Bonatti, 1990; Asimow andLangmuir, 2003], chemically fertile [e.g., Sobolevet al., 2007], and/or unusually hot material rising asa ‘‘plume’’ from the deep mantle [e.g., Morgan,1971]. Plumes have been inferred to feed materiallaterally to nearby ridges [e.g., Morgan, 1978] anddeliver material along the ridge axis over distancesas great as 1000 km [e.g., Vogt, 1976; Schilling etal., 1976]. The surface expression of plume-ridgeinteraction is recognized by a bathymetric swelland thickened crust, which may be attributable tounusually hot or fertile mantle from the plume[e.g., Ito and Lin, 1995; Canales et al., 2002].The geochemistry of rocks formed along plume-affected ridge segments also differs from those of‘‘normal’’ ridge segments (i.e., those that are farfrom and not influenced by hot spots). Elementaland radiogenic isotope ratios vary considerablyalong axis, with compositions ranging from thoseof normal mid-ocean ridge basalts (MORB) tothose more common among ocean island basalts(OIB) [e.g., Schilling, 1991; Blichert-Toft et al.,2005; Nicolaysen et al., 2007]. Although manyfactors can control these geochemical and geophys-ical variations, the relative roles of mantle flow,magma flux, andmantle heterogeneity remain poorlyunderstood [e.g., Ito et al., 2003; Hall and Kincaid,2003, 2004].
[3] The Galapagos Spreading Center (GSC), in theequatorial eastern Pacific Ocean, is a classicexample of off-axis plume-ridge interaction. In thispaper, we present trace element and Sr, Nd and Pbisotope data for GSC rocks collected during theG-PRIME experiment in 2000 [Detrick et al., 2002].These data are combined with previously published
major element data [Cushman et al., 2004] andgeophysical observations. G-PRIME sample spac-ing was 7–10 km, allowing us to resolve shorter-wavelength fluctuations than previously detected.We use the data and observations to examinevariations in extents of melting and fractionalcrystallization as well as the mantle compositionalong the ridge. Finally, we investigate the possibleupper mantle dynamics that can explain the geo-chemical and geophysical variations.
2. Geological Setting
[4] The east-west trending GSC separates theCocos Plate (north) from the Nazca Plate (south)and intersects the East Pacific Rise to the west(Figure 1). The Galapagos hot spot is inferred to becentered at the western edge of the GalapagosArchipelago, some �200 km to the south of theGSC near �92�W [e.g., White et al., 1993]. TheGSC initiated around 23 Ma with the breakup ofthe Farallon Plate along a preexisting fracture zonenear the Galapagos hot spot [e.g., Hey, 1977;Barckhausen et al., 2001; Werner et al., 2003].For the past several million years, the GSC hasbeen migrating away from the Galapagos hot spot[e.g., Hey et al., 1980; Wilson and Hey, 1995]. Thehot spot has impacted the geometry of the plateboundary [Hey et al., 1989], and is associated withseveral propagating ridge segments, including twoon the eastern GSC (EGSC, east of the 91�Wtransform fault) and two on the western GSC(WGSC, west of 91�W) with propagating rift tipscurrently at 93.3�W and 95.5�W. The hot spot hasalso influenced the morphology of the axial topog-raphy [Detrick et al., 2002; Sinton et al., 2003;Werner et al., 2003; White et al., 2008], thethickness of the crust [Canales et al., 2002], andthe geochemistry of the crust along the GSC[Schilling et al., 1982; Verma et al., 1983; Detrick
GeochemistryGeophysicsGeosystems G3G3
ingle et al.: western galapagos spreading center 10.1029/2009GC002694
2 of 30
et al., 2002; Schilling et al., 2003; Cushman et al.,2004; Christie et al., 2005]. Together, the aboveindicators reveal that the hot spot influence islargest near the hot spot (�92�W) and decreaseswith distance east and west away from the hot spot.
3. Previous Geochemical Studies
[5] The foundational geochemical work in the areais by Schilling et al. [1976, 1980, 1982], Vermaand Schilling [1982], and Verma et al. [1983] and,e.g., Christie and Sinton [1981, 1986]. Recently,Schilling et al. [2003] presented radiogenic isotopedata for the entire length of the GSC (83�W–101�W). Cushman et al. [2004] published majorelement and volatile (H2O and CO2) data for adetailed sampling of the WGSC between �91�Wand 98�W, and Christie et al. [2005] publishedmajor and trace element data for the EGSC(85.5�W–91�W). Rotella et al. [2009] used ele-
mental and isotopic data to investigate magmaticprocesses near the 93.3�W overlapping spreadingcenter. Clear geographic trends emerge from thesestudies. Nearest the hot spot (�92�W–90.5�W),concentrations of the most incompatible trace ele-ments and ratios of these elements to moderatelyincompatible elements are highest, 87Sr/86Sr and206Pb/204Pb are elevated, and 143Nd/144Nd and176Hf/177Hf are lowest. These findings indicate thatnear the hot spot, where the crust is thickest, theGSC most extensively samples one or more mantlesources with a long-term enrichment in the moreincompatible elements. The elemental concentra-tions in this area were thought to reveal relativelylow (not high) extents of melting due to enhancedhydrous melting in this near–hot spot area [Asimowand Langmuir, 2003; Cushman et al., 2004]. Theabove expressions of the enriched source materialand hydrous melting decrease with crustal thick-ness and distance, east and west, away from thehot spot. The origin of the along-axis variations,
Figure 1. (a) Bathymetric map of the eastern Pacific Ocean showing the plate configuration of the area surroundingthe GSC. (b) Detailed bathymetry map and sampling locations. Maps are from Cushman et al. [2004].
GeochemistryGeophysicsGeosystems G3G3
ingle et al.: western galapagos spreading center 10.1029/2009GC002694ingle et al.: western galapagos spreading center 10.1029/2009GC002694
3 of 30

constrained by additional trace element and iso-topic data, is a central topic of this study.
4. Methods
[6] Detrick et al. [2002] and Cushman et al. [2004]reported the first geochemical results of the G-PRIMEexperiment, which sampled most of the WGSC at ahigher spatial resolution than in previous studies.Major and minor element analyses of glasses wereobtained by electron microprobe and H2O and CO2
analyses by Fourier transform infrared spectrosco-py (FTIR). Using the same samples, we presentnew data obtained at the University of Hawaii for asuite of trace elements, and Sr, Nd, and Pb isotopecompositions.
4.1. Elemental Analyses
[7] Chlorine, fluorine, and sulfur data (Table 1)were acquired on glass chips using a Cameca SX50electron microprobe following Thordarson et al.[1996]. Average reproducibility is ±2% for S,±10% for Cl and ±20% for F.
[8] Data for several trace elements were acquiredon a Siemens 303AS XRF (X-ray fluorescence)spectrometry system using a Rh target, end win-dow X-ray tube. Whole rocks were crushed in analumina swing mill, and powders were analyzedfor major elements on fused disks followingmethods similar to those of Norrish and Chappell[1977]. Trace elements were analyzed on pressedpowder pellets (Table 1). Peak intensities for thetrace elements were corrected for backgrounds, lineinterferences and matrix absorption using methodssimilar to those of Chappell [1991]. Correctedintensities were calibrated against a wide range ofnatural rock standards. Accuracy and precisiondata for this system are reported by Sinton et al.[2005].
[9] When available, unaltered glass chips wereselected for analysis of additional incompatibletrace elements and data were obtained using aVG PQ-2S inductively coupled plasma sourcemass spectrometer (ICP-MS) following proceduresof Neal [2001]. Reproducibility is generally betterthan 5% at levels above 0.5 ppm (Table 1). Anindication of accuracy is given by measured (anaverage of 5 analyses) and recommended [seeGovindaraju, 1994] values for BHVO-1 analyzedas an unknown.
4.2. Radiogenic Isotopic Compositions(Sr, Nd, and Pb) and Pb Concentrations
[10] Preparation and mass spectrometry for Sr, Nd,and Pb isotope analyses followed Mahoney et al.[1998] and Sheth et al. [2003]. Measurements weremade on a multicollector VG Sector thermal ion-ization mass spectrometer (TIMS). Fractionationcorrections are 0.1194 for 86Sr/88Sr and 0.242436for 148NdO/144NdO (i.e., Nd was run as an oxide).Ratios are reported relative to measured 87Sr/86Sr =0.710238 ± 0.000014 (2s, n = 29) for NBS987 Srand to 143Nd/144Nd = 0.511850 ± 0.000008 (mea-sured at 0.511843; 2s, n = 25; this uncertaintycorresponds to ±0.2 eNd units) for La Jolla Nd.Lead isotope ratios for most samples were mea-sured with a double-spike method [Galer, 1999].Most of these measurements were made in multi-static mode on 5–10 ng loads of sample; meanvalues (±2s) obtained for 33 analyses on 5 to 10 ngloads of NBS 981 Pb were 16.938 ± 0.003, 15.494 ±0.004, and 36.712 ± 0.008 for 206Pb/204Pb,207Pb/204Pb, and 208Pb/204Pb, respectively. Theremainder of the double-spike measurements weremade in multidynamic mode on larger sampleloads (15–40 ng); mean values (±2s) obtainedfor 22 analyses on 30–40 ng loads of NBS 981 Pbwere 16.9406 ± 0.0008, 15.4974 ± 0.0010, and36.7216 ± 0.0022, for 206Pb/204Pb, 207Pb/204Pb,and 208Pb/204Pb, respectively. For a set of samplesfrom the 95.5�W propagating rift, Pb isotope ratiosare conventional (non-double-spike), multistaticmeasurements made on 5–10 ng loads. Theseconventional data are reported relative to the NBS981 Pb values of Todt et al. [1996]; the 2s rangefor conventional measurements of NBS 981 Pb(n = 31) was ± 0.010 for 206Pb/204Pb, 0.011 for207Pb/204Pb, and 0.032 for 208Pb/204Pb. Within-runerrors on the isotopic data in Table 2 are less thanor equal to the external uncertainties on thesestandards, except for the dynamic mode Pb isotopeanalyses; for those analyses, within-run errors arelisted adjacent to the corresponding isotope ratiosin Table 2. Concentrations of Pb were determinedby isotope dilution; uncertainties are less than0.5%. Total procedural blanks are <40 pg for Pb,<35 pg for Sr, and <12 pg for Nd. Note that inFigures 5, 6, 12, 13, and 16, 143Nd/144Nd ispresented as eNd as defined in Table 2.
5. Results
[11] Cushman et al. [2004] defined three mainMORB groups, based on K/Ti, along the WGSC:
GeochemistryGeophysicsGeosystems G3G3
ingle et al.: western galapagos spreading center 10.1029/2009GC002694
4 of 30

N- (normal) MORB have K/Ti < 0.09, T- (transi-tional) MORB have K/Ti between 0.09 and 0.15,and E- (enriched) MORB have K/Ti > 0.15. We usethese definitions in our study as well. The three
main geochemical groups roughly coincide withthe three main physiographic provinces of theWGSC: E-MORB in the eastern axial high province(91�W–92.7�W), T-MORB in the middle section
Table 1. (Sample). Trace Element Data for Western GSC Lavasa [The full Table 1 is available in the HTML versionof this article]
Meth.bUnit ofConc.c BHVOd BHVOe
Groupf and Sampleg
E-MORB
7D-4 10D-1 11D-1 11D-3 12D-5 16D-2 17D-2, 5 17D-4 19D-1 20D-1
Longitude (�W) NA NA 91.28 91.36 91.41 91.41 91.49 91.75 91.80 91.80 91.96 92.01Latitude (�N) NA NA 1.922 1.962 1.973 1.973 1.986 2.062 2.071 2.071 2.111 2.117Depth (mbsl) NA NA 1635 1621 1651 1651 1672 1872 1762 1762 1640 1708Elem.h
F EMP ppm – – 320 521 838 – 556 403 – 417 540 322S EMP wt % – – 0.145 0.185 – – 0.185 0.133 – 0.110 0.174 0.121Cl EMP ppm – – 599 147 3360 – 1910 364 – 332 875 261Sc XRF ppm – – 47.8 39.0 34.4 37.6 – 40.4 36.4 35.4 44.4 40.0V XRF ppm – – 385 470 316 421 – 325 244 248 469 281Cr XRF ppm – – 193 27.8 10.6 10.5 – 210 284 241 57.7 259Co XRF ppm – – 45.5 41.9 31.9 39.7 – 42.6 48.4 46.5 44.5 46.7Ni XRF ppm – – 66.8 38.8 11.3 15.6 – 96.6 153 128 37.9 116Zn XRF ppm – – 98.6 131 148 146 – 93.0 77.5 75.8 137 81.8Rb ICP ppm 9.6 11 5.55 12.7 23.1 – 13.1 7.68 – 9.22 13.6 6.37Sr ICP ppm 388 390 134 162 141 – 142 210 – 273 142 191Y XRF ppm 25.6 27.6 37.3 53.8 80.5 68.2 – 36.9 28.6 28.8 57.2 30.0Zr XRF ppm 180 179 121 206 371 298 – 149 146 149 216 119Nb XRF ppm 19.4 19 10.4 22.9 40.2 36.2 – 13.0 14.8 14.6 21.3 11.8Ba ICP ppm 133 139 66.2 149 230 – 150 91.8 – 106 128 75.1La ICP ppm 15.5 15.8 7.67 15.9 27.7 – 16.9 10.2 – 12.1 15.5 8.50Ce ICP ppm 37.7 39 18.9 37.0 61.0 – 39.8 24.8 – 27.4 34.8 20.2Pr ICP ppm 5.5 5.7 2.91 5.39 8.49 – 5.80 3.74 – 3.98 5.34 2.96Nd ICP ppm 24.5 25.2 13.9 24.5 39.8 – 26.3 17.5 – 18.1 25.2 13.6Sm ICP ppm 6.2 6.2 4.30 6.97 10.6 – 7.43 5.09 – 4.96 6.73 3.90Eu ICP ppm 2.05 2.06 1.46 2.20 2.94 – 2.29 1.75 – 1.67 2.00 1.33Gd ICP ppm 6.27 6.4 5.64 8.81 13.0 – 9.42 6.31 – 5.46 7.92 4.79Tb ICP ppm 0.95 0.96 0.991 1.50 2.29 – 1.61 1.06 – 0.922 1.51 0.798Dy ICP ppm 5.38 5.25 6.10 9.17 13.8 – 9.85 6.38 – 5.67 9.88 4.91Ho ICP ppm 1.00 0.99 1.30 1.95 3.09 – 2.10 1.32 – 1.16 2.09 1.03Er ICP ppm 2.58 2.4 3.68 5.49 8.41 – 5.92 3.64 – 3.04 5.41 2.87Tm ICP ppm 0.330 0.33 0.564 0.841 1.36 – 0.902 0.561 – 0.458 0.850 0.443Yb ICP ppm 2.01 2.2 3.70 5.48 8.29 – 6.04 3.62 – 2.89 5.40 2.84Lu ICP ppm 0.270 0.29 0.585 0.871 1.36 – 0.941 0.558 – 0.448 0.856 0.452Hf ICP ppm 4.33 4.38 3.03 5.19 9.38 – 5.64 3.69 – 3.88 5.18 2.77Ta ICP ppm 1.18 1.23 0.656 1.48 2.47 – 1.56 0.834 – 0.988 1.31 0.707Pb ID ppm – – 0.5273 0.8485 1.3610 – 1.000 0.7671 – 0.9109 0.8780 0.6555Th ICP ppm 1.21 1.08 0.716 1.59 2.66 – 1.75 0.964 – 1.03 1.41 0.800U ICP Ppm 0.41 0.42 0.201 0.448 0.848 – 0.480 0.258 – 0.319 0.389 0.219
aA dash means not determined. NA, not applicable; mbsl, meters below sea level.
bMeth. is the method used for the acquisition of the element: EMP, electron microprobe analysis of glass chips; XRF, X-ray fluorescence of whole
rock powders; ICP, inductively coupled plasma source mass spectrometry on dissolved glass chips; ID, isotope dilution (outlined in section 4.4).cConc. is the concentration and is in parts per million (ppm) except for S, which is reported as weight percent (wt %).
dReported measured values of BHVO standard data are for analyses by ICP-MS.
eRecommended values for BHVO from Govindaraju [1994].
fSample groups are divided based on K/Ti ratios as reported by Cushman et al. [2004].gSample number is dredge or dive number, followed by ‘‘D’’ if a dredged sample and no letter for Alvin dive samples, followed by unique
sample number (e.g., 7D-4 is dredge 7 sample 4). In cases where multiple samples are listed (e.g., 25D-3, 4, 6) the elemental data are averages ofdata for those samples.
hElem. is the analyzed element as listed in the column below.
GeochemistryGeophysicsGeosystems G3G3
ingle et al.: western galapagos spreading center 10.1029/2009GC002694
5 of 30

Table 2. Radiogenic Isotope Compositions for Samples From the Western GSC
Sample Longitude (�W) eNda 143Nd/144Nd 87Sr/86Sr 206Pb/204Pbb 207Pb/204Pbb 208Pb/204Pbb
E-MORB7D-4 91.28 7.3 0.513014 0.70287 18.996 15.574 38.69710D-1 91.36 7.1 0.513003 0.70293 19.0678 (20) 15.5877 (24) 38.7959 (42)11D-1 91.41 6.9 0.512991 0.70295 19.1119 (47) 15.5919 (54) 38.8357 (96)12D-5 91.49 7.2 0.513009 0.70294 19.0729 (30) 15.5915 (36) 38.8026 (62)16D-2 91.75 7.1 0.513002 0.70292 19.005 15.590 38.80517D-4 91.80 6.8 0.512988 0.70296 19.0225 (23) 15.5921 (28) 38.7986 (47)19D-1 91.96 6.5 0.512971 0.70300 18.9766 (30) 15.5911 (37) 38.8332 (62)20D-1 92.01 6.5 0.512971 0.70302 19.125 15.608 38.93825D-1 92.32 7.0 0.512997 0.70301 18.9594 (16) 15.5852 (20) 38.7772 (34)25D-1c 92.32 6.8 0.512987 0.70301 – – –28D-1 92.52 6.9 0.512992 0.70299 18.987 15.589 38.82028D-1c 92.52 6.8 0.512990 0.70305 18.987 15.589 38.820
T-MORB4D-1 91.06 8.1 0.513054 0.70278 18.838 15.557 38.4899D-1 91.32 7.6 0.513031 0.70282 18.9418 (24) 15.5731 (30) 38.6191 (53)15D-1 91.61 7.0 0.513000 0.70298 19.046 15.581 38.80829D-1 92.62 7.3 0.513015 0.70294 18.930 15.576 38.68541D-7 93.09 7.4 0.513018 0.70307 18.864 15.573 38.67738D-2 93.27 7.4 0.513018 0.70301 18.796 15.566 38.61045D-2 93.35 7.7 0.513032 0.70287 18.902 15.580 38.69648D-4 93.66 7.3 0.513014 0.70294 18.859 15.571 38.67049D-1 93.87 7.3 0.513012 0.70294 18.843 15.577 38.66658D-2 94.35 7.5 0.513025 0.70293 18.817 15.578 38.64962D-1 94.66 6.9 0.512994 0.70306 18.834 15.564 38.80867D-1 95.03 7.5 0.513025 0.70294 18.763 15.559 38.55869D-1 95.21 7.8 0.513039 0.70290 18.747 15.555 38.53570D-1 95.32 7.9 0.513046 0.70278 18.7131 (20) 15.5544 (24) 38.5115 (42)A6-4 95.37 7.7 0.513034 0.70289 18.759 15.549 38.4881549-6d 95.38 8.2 0.513059 0.70288 18.768 15.572 38.5871557-1d 95.46 7.8 0.513039 0.70288 18.732 15.557 38.5501541-2d 95.48 7.6 0.513029 0.70292 18.726 15.554 38.5231557-3d 95.48 7.9 0.513044 0.70293 18.733 15.540 38.502K12-28 95.47 8.6 0.513077 0.70274 18.655 15.527 38.378
N-MORB2D-1 90.82 6.3 0.512965 0.70299 18.975 15.579 38.5811545-4d 95.37 8.3 0.513063 0.70287 18.738 15.558 38.5881549-5d 95.38 7.9 0.513043 0.70289 18.718 15.549 38.5561544-3d 95.46 8.3 0.513065 0.70281 18.763 15.554 38.4011551-3 95.48 8.5 0.513076 0.70266 18.583 15.536 38.3051554-1d 95.51 8.0 0.513048 0.70283 18.713 15.526 38.3551554-9d 95.51 – – 0.70279 18.780 15.525 38.43271D-1 95.60 9.0 0.513103 0.70262 18.518 15.513 38.1881555-6d 95.66 – – 0.70274 18.583 15.518 38.28273D-1 95.70 6.3 0.512961 0.70308 18.439 15.534 38.33373D-1c 95.70 – – – 18.439 15.538 38.34475D-1 95.88 8.6 0.513082 0.70271 18.619 15.534 38.36577D-2 96.19 8.3 0.513064 0.70276 18.564 15.513 38.24780D-2 96.63 9.4 0.513121 0.70266 18.456 15.509 38.12280D-2c 96.63 9.4 0.513121 0.70266 18.445 15.510 38.11884D-4 96.88 9.5 0.513127 0.70268 18.466 15.514 38.23588D-1 97.19 9.3 0.513114 0.70265 18.452 15.508 38.19792D-1 97.78 9.3 0.513119 0.70263 18.452 15.511 38.169
aeNd is calculated as the difference, in parts per 10,000, of the measured sample 143Nd/144Nd from a present-day chondritic average (chond)value of 0.51264; that is, eNdsample = (143Nd/144Ndsample/
143Nd/144Ndchond � 1) * 104.bFor Pb isotope compositions determined by the double spike method, values listed to the third decimal place were determined in static mode on
5–10 ng loads; those listed to the fourth decimal place were determined in dynamic mode on 15–40 ng loads (individual within-run errors are givenin parentheses adjacent to each measurement and apply to the last two digits).
cSecond dissolution of a separate glass split (i.e., full procedural duplicates) for 25D-1, 28D-1, and 73D-1 and, for 80D-2, a second dissolution of
a holocrystalline part of the same sample.dPb isotopes on these samples were determined by conventional (non-double-spike) multistatic measurements on 5–10 ng loads.
GeochemistryGeophysicsGeosystems G3G3
ingle et al.: western galapagos spreading center 10.1029/2009GC002694
6 of 30

(92.7�W–95.5�W) with transitional axial morphol-ogy, and N-MORB in the western axial valleyprovince (95.5�W–98�W) [Detrick et al., 2002;Sinton et al., 2003]. There are, however, a fewexceptions. For example, N-MORB are sporadical-ly present east of 95.5�W, T-MORB are presentnear 91�W, and one E-MORB was recovered near97�W [Cushman et al., 2004].
5.1. Trace Elements
[12] Concentrations of the most incompatible traceelements (e.g., Rb, U, Nb, La) in the E-MORB aregenerally elevated above those in T- and N-MORB(Figure 2). The middle rare earth elements (REE)are also slightly more abundant in E-MORB,although there is some overlap with the T-MORB.In contrast, heavy REE concentrations are similarfor E- and T-MORB, and are only slightly elevatedover those of the N-MORB. These characteristicsgive the E-MORB patterns a negative slope (e.g.,normalized Sm/Yb � 1) from the middle to heavyREE in primitive mantle–normalized plots. Insummary, from east to west, abundances of incom-patible trace elements generally decrease, withsome overlap among the three MORB groups;however, the amount of overlap increases withdecreasing elemental incompatibility.
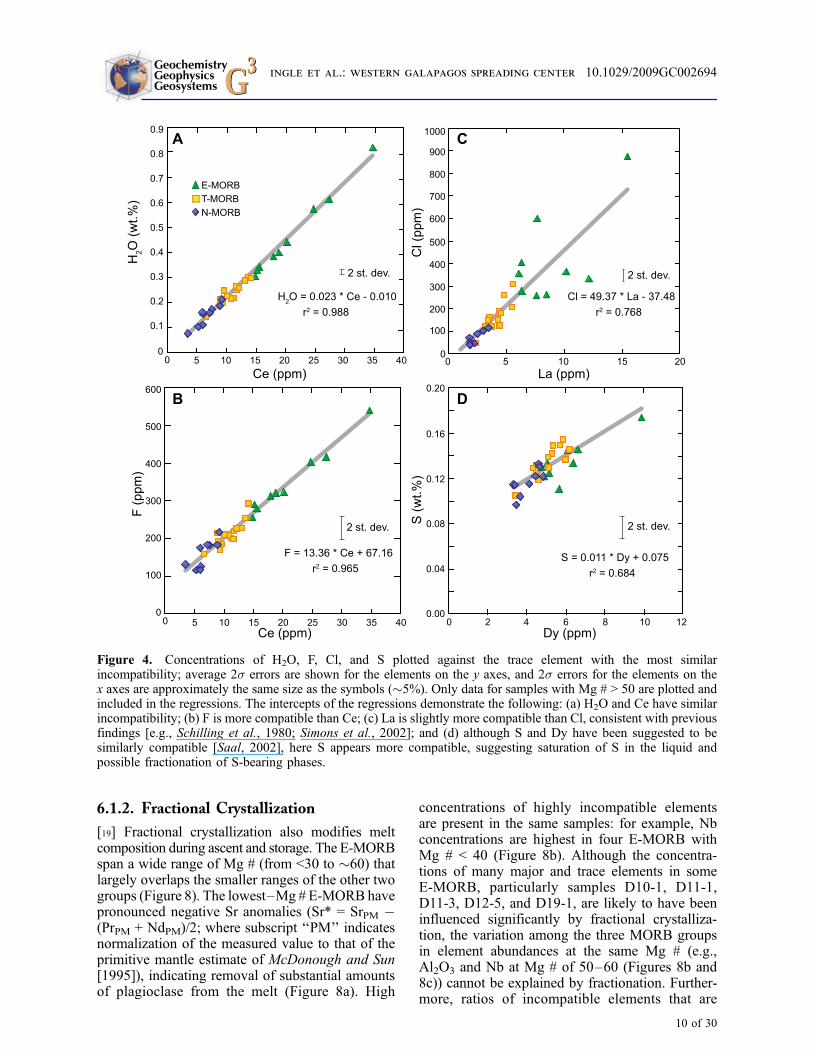
[13] Concentrations of H2O, Cl, and F are alsoelevated in the E-MORB relative to the T- andN-MORB, but S does not vary as systematically(Figures 3 and 4). The element best correlated withH2O and F is Ce (r2 = 0.988 and r2 = 0.983,respectively); Cl and S are weakly correlated withLa and Dy (r2 = 0.768 and r2 = 0.684, respectively).
5.2. Radiogenic Isotopes
[14] The isotope ratios correlate strongly with eachother (r2 values generally >0.8), forming simplelinear arrays in isotope space (Figure 5). Also, thethree MORB groups defined by K/Ti generallyoccupy distinct portions of the isotope arrays(Figure 5). A few exceptions include sample D2-1,dredged from the transform fault at 90.9�W, andD73-1 from near the offset at 95.5�W. Sample D2-1is an N-MORB in terms of K/Ti but has isotopicratios more similar to those of the E-MORBsampled on the axis nearby. Sample D73-1 isanomalous in many respects. It is a T-MORB interms of K/Ti, but its incompatible trace elementpattern lies well within the N-MORB field. It is oneof several high-Al2O3 MORB from the GSC thatEason and Sinton [2006] interpret to have beenaffected by high-pressure fractionation in the upper
mantle. It has the most radiogenic 87Sr/86Sr andleast radiogenic eNd of all samples from the entireWGSC. It also has the lowest 206Pb/204Pb of any ofthe WGSC samples, similar to values of N-MORBnearby, whereas its 207Pb/204Pb and 208Pb/204Pb lieabove the trend formed by the N-MORB in Figures5c and 5d.
[15] Along axis, 206Pb/204Pb, 207Pb/204Pb, and208Pb/204Pb become less radiogenic westward,away from the hot spot (Figure 6). eNd and87Sr/86Sr also vary between 91�W and the propa-gating ridge segment at 95.5�W, but more subtlythan the Pb isotopes do. Between the propagatingrift tip near 95.5�W and �96.5�W, all isotopicratios change suddenly: eNd rises and Sr and Pbisotopic ratios drop by 30%–50% of the totalvariation seen in our data. Considerable variationin trace element and isotopic ratios also character-izes samples near the 93.3�W ridge offset [Rotellaet al., 2009], but the variation is smaller than thatnear 95.5�Wand a stepwise change in compositionis not evident. Between 98�Wand 96.5�W, isotopiccompositions remain nearly uniform.
6. Factors Determining Trace Elementand Isotope Compositions in GSCRocks
[16] As is typical in studies of oceanic basalts, it isessential to first address the influences of crustalprocesses on lava compositions, including extentsof fractional crystallization, assimilation of wallrock by magmas, and posteruptive alteration oflavas by seawater, before we can gain the under-standing we seek on mantle processes, namely,extent and depth of partial melting and composi-tion of the mantle sources.
6.1. Crustal Processes
6.1.1. Assimilation and Alteration
[17] Both assimilation and alteration can mask oroverprint primary geochemical signatures of oceanicrocks. Alteration effects have been minimized byanalyzing only fresh glass chips (see section 4) formobile elements and isotopes. Some trace ele-ments are useful indicators of both processes, asinteractions between magmas or lavas and thesurrounding oceanic crust and seawater createvariations in mobile elements that do not covaryregularly with primary magmatic indicators. Forexample, assimilation of hydrated minerals tends toincrease concentrations of Cl relative to elements
GeochemistryGeophysicsGeosystems G3G3
ingle et al.: western galapagos spreading center 10.1029/2009GC002694
7 of 30

having similar incompatibility, such as La (Figure 7[e.g., Simons et al., 2002]).
[18] E-MORB data scatter widely around a regres-sion line fit to the T- and N-MORB Cl and La data(Figure 7a); D11-1 and D12-5 have particularlyhigh Cl contents relative to their La concentrations.
When Cl contents are normalized to La and plottedagainst Mg # (Mg # = 100 x Mg2+/[Mg2+ + Fe2+],assuming all Fe as Fe+2), data for samples D11-1and D12-5 lie on the extreme end of the plot, at thelowest Mg # and highest Cl/La (Figure 7b). Thus,assimilation of Cl-rich material is likely to haveaffected these two samples the most. In contrast,
Figure 2. Concentrations of incompatible trace elements in WGSC lavas normalized to estimated primitive mantleconcentrations of McDonough and Sun [1995]. Only data for samples with Mg # > 50 are plotted. (a) E-MORB,(b) T-MORB, and (c) N-MORB. Fields for the other subgroups are shown in each plot; the T-MORB field excludessample D73-1, and the N-MORB field excludes sample D2-1. The inset shows that some N-MORB have primitivemantle–normalized concentrations of <1 for some highly incompatible elements.
GeochemistryGeophysicsGeosystems G3G3
ingle et al.: western galapagos spreading center 10.1029/2009GC002694
8 of 30

the low Cl content of sample D10-1 suggests itmay have experienced extensive degassing [e.g.,Dixon and Clague, 2001]. Removing D11-1 andD12-5 from consideration yields a statistically in-significant trend (r2 = 0.07). The remaining weakcorrelation is mainly controlled by T-MORB, withmoderateCl/La andmoderateMg#, and theN-MORB,with generally lower Cl/La and higher Mg # (corre-
lation coefficient of 0.4). There are no trends withinindividual MORB groups. Thus, compositionaldifferences between the T- and N-MORB cannotbe due to crustal assimilation and instead likelyreflect changes in crustal processes such as crys-tallization [Detrick et al., 2002; Cushman et al.,2004; Asimow and Langmuir, 2003].
Figure 3. Primitive mantle–normalized concentrations of volatile and selected trace elements in approximate orderof solid-liquid incompatibility (most to least incompatible from left to right) in WGSC glasses. (a) E-MORB,(b) T-MORB, and (c) N-MORB data are shown along with the fields for the other subgroups. Only data for sampleshaving Mg # > 50 are plotted or included in the fields; the T-MORB field excludes sample D73-1, and the N-MORBfield excludes sample D2-1. Primitive mantle concentrations are from McDonough and Sun [1995], except for H2O(335 ppm, assuming H2O/Ce = 200 for the primitive mantle), which is from Workman and Hart [2005].
GeochemistryGeophysicsGeosystems G3G3
ingle et al.: western galapagos spreading center 10.1029/2009GC002694
9 of 30
6.1.2. Fractional Crystallization
[19] Fractional crystallization also modifies meltcomposition during ascent and storage. The E-MORBspan a wide range of Mg # (from <30 to �60) thatlargely overlaps the smaller ranges of the other twogroups (Figure 8). The lowest–Mg # E-MORB havepronounced negative Sr anomalies (Sr* = SrPM �(PrPM + NdPM)/2; where subscript ‘‘PM’’ indicatesnormalization of the measured value to that of theprimitive mantle estimate of McDonough and Sun[1995]), indicating removal of substantial amountsof plagioclase from the melt (Figure 8a). High
concentrations of highly incompatible elementsare present in the same samples: for example, Nbconcentrations are highest in four E-MORB withMg # < 40 (Figure 8b). Although the concentra-tions of many major and trace elements in someE-MORB, particularly samples D10-1, D11-1,D11-3, D12-5, and D19-1, are likely to have beeninfluenced significantly by fractional crystalliza-tion, the variation among the three MORB groupsin element abundances at the same Mg # (e.g.,Al2O3 and Nb at Mg # of 50–60 (Figures 8b and8c)) cannot be explained by fractionation. Further-more, ratios of incompatible elements that are
Figure 4. Concentrations of H2O, F, Cl, and S plotted against the trace element with the most similarincompatibility; average 2s errors are shown for the elements on the y axes, and 2s errors for the elements on thex axes are approximately the same size as the symbols (�5%). Only data for samples with Mg # > 50 are plotted andincluded in the regressions. The intercepts of the regressions demonstrate the following: (a) H2O and Ce have similarincompatibility; (b) F is more compatible than Ce; (c) La is slightly more compatible than Cl, consistent with previousfindings [e.g., Schilling et al., 1980; Simons et al., 2002]; and (d) although S and Dy have been suggested to besimilarly compatible [Saal, 2002], here S appears more compatible, suggesting saturation of S in the liquid andpossible fractionation of S-bearing phases.
GeochemistryGeophysicsGeosystems G3G3
ingle et al.: western galapagos spreading center 10.1029/2009GC002694
10 of 30

relatively unaffected by fractionation (e.g., Nb/Zr(Figure 8d)) must reflect different parental magmacompositions, arising from variable extents ofmelting or in mantle source composition, especiallyfor samples having Mg # > 50. Weak correlations
of Nb/Zr (and Cl/La) with Mg # within groups areconsistent with fractionation effects, but the �3�variation in Nb/Zr at Mg # = 55 between groupsmust reflect mantle processes, as supported by thestrong correlations among incompatible trace ele-ment and isotopic ratios in GSC magmas, as wediscuss below.
6.2. Mantle Processes
6.2.1. Melting Variations Along the WGSC
[20] Along-axis geochemical gradients can resultfrom variations in extent and depth of melting,although isolating these effects from variations insource composition is challenging, especially forheterogeneous mantle. For example, if the mantlecontains lithologies with different solidi, a lowextent of melting will tend to favor sampling ofthe more fusible material(s), which may also havehigher concentrations of incompatible trace ele-ments and more radiogenic Sr and Pb. Nonetheless,some qualitative conclusions about partial meltingcan be drawn from ratios like La/SmPM and Nb/ZrPM. These ratios involve elements with suffi-ciently different partition coefficients that the ratiosare somewhat influenced by partial melting, par-ticularly at small amounts of melting. These ratiostend to increase toward the Galapagos hot spot andfrom the N- to T- to E-MORB (Figures 9 and 10),which is consistent with the extent of meltingdecreasing from the N-MORB-dominated westernprovince of the GSC toward the hot spot. Decreas-ing extent of melting coinciding with increasingcrustal thickness toward the hot spot is perhapscounterintuitive; however, this result can be recon-ciled with an increasing influence of water in themantle which causes an enhanced flux of hydrousmelts from greater depths near the Galapagos hotspot [Asimow and Langmuir, 2003; Cushman et
Figure 5. Radiogenic isotope compositions groupedby MORB type: (a) eNd, (b) 87Sr/86Sr, (c) 207Pb/204Pb,and (d) 208Pb/204Pb versus 206Pb/204Pb. MORB typesdefined previously on the basis of K/Ti are also largelydistinguishable in isotope composition. This is espe-cially true for the Pb isotopes, whereas Sr and Ndisotope ratios show more overlap, particularly betweenE- and T-MORB. Outlying samples are labeled in Figure5d. All errors (at 2s) are smaller than the symbols. Pbisotope ratios analyzed by the double-spike method aredistinguished by filled symbols; open symbols denoteconventional Pb isotope measurements (not doublespiked) and have slightly larger errors (see section 4).
11 of 30
GeochemistryGeophysicsGeosystems G3G3
ingle et al.: western galapagos spreading center 10.1029/2009GC002694

al., 2004; Asimow et al., 2004]. On the other hand,variations in these elemental ratios may also berelated to changes in source composition. Thecompeting influences of extent of melting and
source composition are explored more fully insection 7.2.
[21] Constraints on depths of melting are providedby ratios involving the heavy REE, which aresensitive indicators of garnet in the residue, althoughsource composition can also play a role. Forexample, the N- and T-MORB have similar Sm/YbPM and Hf/LuPM, whereas the E-MORB as agroup have higher values (Figures 9 and 10).These findings suggest that if depth of meltingchanges along the GSC, it is likely to be deepest
Figure 6. Radiogenic isotope variations along axis:(a) 87Sr/86Sr, (b) eNd, (c) 206Pb/204Pb, (d) 207Pb/204Pb,and (e) 208Pb/204Pb versus longitude. Major physio-graphic features are indicated by dashed (ridge offsets)and solid (transform fault) lines. All errors (at 2s) aresmaller than the symbols. For Pb isotope ratios, samplesanalyzed by the double-spike method are shown as filledsymbols, and those analyzed by the conventionaltechnique (not double spiked) are shown as opensymbols. Data labeled ‘‘other WGSC’’ are from Rotellaet al. [2009].
Figure 7. Indicators for seawater assimilation. (a) Clversus La. Regression line is only for samples withMg # > 50; Mg # values are calculated assuming all Fe asFe2+ (FeO = 0.8998 * Fe2O3) [from Cushman et al.,2004]. The gray-shaded area is expanded in the inset.(b)Cl/La versus Mg # confirms that seawater assimilationdid not play a major role in petrogenesis, except perhapsfor samples D11-1 and D12-5 (Cl should increasesubstantially relative to La during assimilation).
GeochemistryGeophysicsGeosystems G3G3
ingle et al.: western galapagos spreading center 10.1029/2009GC002694
12 of 30

beneath the E-MORB-dominated portion of theridge. That said, this does not preclude the possibilitythat the elevated Sm/YbPM and Hf/LuPM of theE-MORB are source characteristics.
6.2.2. Principal Components Analysis ofthe Isotope Arrays
[22] To quantitatively assess the number of mantleend-member components involved in generatingthe WGSC rocks, we performed a principal com-ponents analysis (PCA) using 87Sr/86Sr, eNd,206Pb/204Pb, 207Pb/204Pb, and 208Pb/204Pb. PCAdoes not yield the isotopic compositions of themantle end-member components but resolves thevariation in the data into the fewest number ofeigenvectors that can explain that variation (seeAlbarede [1995] for a more thorough description ofPCA). The first principal component (PC) forWGSC lavas accounts for more than 87% of theisotopic variation observed (Figure 11). The secondPC explains a further 9%, and the next three PCsexplain the remaining 4%. The systematic changein lava compositions along the GSC is thus pri-marily along the first PC. The simplest interpreta-tion is that the first PC reflects binary mixingbetween two main mantle end-member compo-nents, as indeed can be inferred from inspectionof the isotopic arrays in Figures 5 and 12, espe-cially the linear trend in Pb-Pb isotope space.
[23] The second PC may reflect a third mantle end-member component, but we prefer an interpretationby which it is related to small-amplitude heteroge-neity within one (or both) of the two dominant end-member components. This interpretation is favored
Figure 8. Elemental and elemental ratio variationsagainst Mg #. (a) Sr* versus Mg # (Sr* = SrPM� (PrPM +NdPM)/2, where PM indicates normalization to estimatedprimitive mantle values): strongly negative values of Sr*in E-MORB with Mg # < 45 indicate extensiveplagioclase fractionation. (b) Nb versus Mg #. Notethe progressively higher concentrations of Nb at Mg # of50–60 from N-MORB to T-MORB to E-MORB.Increasing Nb contents of parental magmas betweenthese groups must be inherited from mantle processes,e.g., progressively smaller extents of partial melting or asource enriched in Nb. (c) Al2O3 versus Mg #. ElevatedAl2O3 for a given Mg #, as recorded in the E-MORB, isconsistent with delay in plagioclase fractionation likelyresulting from increased magmatic H2O [Sinton andFryer, 1987]. (d) Nb/ZrPM versus Mg # shows a widevariation in Nb/ZrPM at a given Mg #, with the exceptionof the four highly fractionated E-MORB. Nb/ZrPM isaffected by extent of partial melting (lower extents raisethe ratio) and by mantle source composition.
13 of 30
GeochemistryGeophysicsGeosystems G3G3
ingle et al.: western galapagos spreading center 10.1029/2009GC002694

by the small value of the second PC, and becauseits significance (score) does not change systemat-ically along the length of the WGSC (Figure 11).The next three PCs have only minor significance;their scores are most variable at 95.5�W, for whichseveral of the Pb isotope analyses were not done bythe double-spike method. These least significantPCs are possibly related to small-amplitude hetero-geneity in the two main mantle components but arealso comparable to levels of analytical uncertainty.
[24] When plotted versus longitude, variations ofthe first PC reveal the pattern seen in the isotopicdata themselves: a gradual change from 91�W to95.5�W, followed by a sudden change near95.5�W, and mostly constant compositions between96.5�W and 98�W (Figures 6 and 11). A similarabrupt change is also apparent in DNb (Figure 9e),a measurement of the deficiency or excess of Nbrelative to Zr that is attributed to long-term sourcevariations at hot spots; positive DNb has beenassociated with plume mantle sources and negativevalues with depleted upper mantle sources [Fittonet al., 1997]. The stepwise change in compositionsnear 95.5�W is consistent with, but not adequatelyresolved in Schilling et al.’s [2003] isotope databecause of their wider sample spacing. Schillinget al. [2003] emphasized two samples collectedbetween 98�W and 100�W, which are even lessradiogenic in Sr and Pb and more radiogenic in Ndthan those taken between 96.5� and 98�W. Schillinget al. [2003] therefore interpreted their averagegradients in isotopic composition as revealing asteady decline in plume-ridge interaction over theentire distance between 91�W and 101�W. Ourgeochemical results indicate that plume effectsdecrease dramatically west of 95.5�W, further sup-ported by reduced gradients in crustal thickness[Canales et al., 2002] and axial depth [Ito and Lin,1995; Sinton et al., 2003] between 95.5�W and98�W. We suspect that the region west of 98�W isbeyond the Galapagos plume’s influence on theridge, as discussed further below.
6.2.3. Enriched Component Beneath theWGSC
[25] One of the two main source componentsassociated with the first PC is characterized byradiogenic Pb and Sr, unradiogenic Nd, and enrich-ment in the highly incompatible elements. A logicalquestion is whether this component also is evidentin lavas of the Galapagos Archipelago. A HIMU-like [e.g., Zindler and Hart, 1986; Stracke et al.,2005] enriched end-member for the Galapagos
Figure 9. Variations in incompatible trace elementsalong axis. (a) La/SmPM, (b) Sm/YbPM, (c) Nb/ZrPM,(d) Nb/LaPM, and (e)DNb (= 1.74 + log10(Nb/Y)� 1.92 *log10(Zr/Y)) versus longitude [Fitton et al., 1997]. Majorphysiographic features are shown by dotted (ridgeoffsets) and solid (transform fault) lines. The ratios inFigures 9a–9c can be affected by both extents (anddepths) of partial melting and by mantle sourcecomposition, whereas the values in Figures 9d and 9eare primarily influenced by source composition. La/SmPM
and Nb/ZrPM are different among the three groups:E-MORB have the highest values followed by T- andN-MORB, Sm/YbPM is only slightly elevated in someE-MORB samples, and Nb/LaPM and DNb arecomparable in the E- and T-MORB but distinguishablylower in the N-MORB. Data labeled ‘‘other WGSC’’ arefrom Rotella et al. [2009].
GeochemistryGeophysicsGeosystems G3G3
ingle et al.: western galapagos spreading center 10.1029/2009GC002694
14 of 30

Archipelago is apparent in the southernmost Gal-apagos island, Floreana [Harpp and White, 2001],but it has 206Pb/204Pb values that are too highrelative to its eNd for it to be the enriched end-member along the WGSC (Figure 12b). A secondenriched component invoked by Harpp and White[2001] to explain variations in the archipelago andprevious data from the WGSC [Schilling et al.,2003] is the Wolf-Darwin (WD) component; how-ever, this component is offset to higher 207Pb/204Pband 208Pb/204Pb relative to 206Pb/204Pb than thetrend of the WGSC arrays shown in Figures 12a
and 13a. Last, Harpp and White’s [2001]‘‘PLUME’’ component lies closest to our data;however, it cannot be an end-member becauseWGSC data extend to more extreme Pb isotoperatios (Figure 12). Although Schilling et al. [2003]argued that the WGSC and the GSC east of 91�W(EGSC) required distinct enriched components, thedata shown in Figures 12 and 13 suggests that thesetwo portions of the GSC share a common enrichedcomponent. In this sense, our new samples anddata reduce the complexity inferred by Schilling et
Figure 10. Covariations in incompatible trace element ratios with isotopic compositions. (a) La/SmPM, (b) Hf/LuPM, and (c) DNb versus eNd and (d) Nb/ZrPM, (e) Sm/YbPM, and (f) Nb/LaPM versus 206Pb/204Pb. La/SmPM andNb/ZrPM correlate well with isotopic composition and again are distinct among the three MORB groups. In contrast,Hf/LuPM and Sm/YbPM show little correlation with isotope composition. DNb and Nb/LaPM vary considerably withisotope ratios but are similar between the E- and T-MORB and distinctly lower in the N-MORB.
GeochemistryGeophysicsGeosystems G3G3
ingle et al.: western galapagos spreading center 10.1029/2009GC002694
15 of 30

al. [2003], although the origin of the enrichedcomponent is still unclear.
[26] A plausible enriched end-member is Hananand Graham’s [1996] ‘‘C,’’ which is similar toHart et al.’s [1992] ‘‘FOZO.’’ Both ‘‘C’’ and‘‘FOZO’’ are recognized as being common tomany OIB and MORB worldwide. One character-istic that is often linked with C and FOZO is high3He/4He [e.g., Hanan and Graham, 1996; Hart etal., 1992;Dixon et al., 2002], and indeed some lavasof the Galapagos Archipelago with C/FOZO-likeSr-Nd-Pb isotopic signatures have high 3He/4He (ashigh as 27 times the atmospheric ratio [Graham etal., 1993; Kurz and Geist, 1999]). In contrast, allGSC lavas studied thus far have low, MORB-like3He/4He (<8.5 times the atmospheric ratio) [e.g.,Detrick et al., 2002; Graham et al., 2006]. Thismay suggest that the C-like end-member is thesame in both settings, but that most of its He wasextracted by volcanism in the islands [Kurz andGeist, 1999; Graham et al., 2006] prior to lateralflow of plume mantle toward and then remeltingbeneath the ridge.
[27] It is notable that although the same mantle(plume) material involved in forming the GalapagosArchipelago is probably now interacting with the
WGSC, none of the archipelago’s enriched end-member compositions, as identified by Harpp andWhite [2001], are apparent along theWGSC, at leastnot in pure enough form to be recognized individ-ually. Possible explanations include the following:
[28] 1. The archipelago components WD, FLO,and PLUME are thoroughly mixed beneath theWGSC so as to behave as a single enrichedcomponent in the ridge basalts, as in pseudobinarymixing [Douglass and Schilling, 2000; Schilling etal., 2003].
[29] 2. One or more of Harpp and White’s [2001]end-member components are not present beneaththe WGSC because they were efficiently extractedfrom the plume beneath the archipelago (as sug-gested for He above).
[30] 3. One or more of the end-member compo-nents that feed the archipelago are not presentbeneath the WGSC because the mantle flow pathscontaining these particular components in theplume simply fail to reach the WGSC.
[31] 4. Still another possibility is that the volumesof these end-members are so small that theircompositions are swamped beneath the WGSCby the extensivemelting of the twomore voluminous
Figure 11. Graphical representation of principal components analysis (PCA) employing Pb, Nd, and Sr isotopicdata. (a) Bar graph of the importance of each principal component (PC), as a percentage of the total, in explaining thevariation. The first PC is shown in red, the second is shown in blue, and the third is shown in green. The remaining1.7% variation is explained by a fourth and fifth PC that are likely to be irrelevant in explaining the key features of thedata. (b) Degree of importance (score) of each PC for individual samples versus dredge longitude. Each sample isrepresented by three points, one for each of the first three PC scores. The maximum score possible for the first PC is 1(associated most strongly with samples from the east), and the minimum score possible is �1 (associated moststrongly with samples in the west). A score of zero would reflect equal importance of the component expressed moststrongly in the east and that expressed most strongly in the west. The second and third PCs are less important than thefirst PC for explaining variation in the data at all longitudes except 95.5�W; their scores also do not show obviousalong-axis gradients, implying that they may be associated with either dispersed heterogeneity in one (or both) of themain mantle end-member components or with analytical uncertainty.
GeochemistryGeophysicsGeosystems G3G3
ingle et al.: western galapagos spreading center 10.1029/2009GC002694
16 of 30

components (our enriched and depleted WGSCcomponents). In this case, our enriched WGSC(possibly C) component would be voluminous inthe plume but have a composition that is intermedi-ate to Harpp and White’s [2001] end-members.
[32] Resolving which possibility is most correctwill likely require further investigations of volcanocompositions between the archipelago and theGSC, coupled with modeling of 3-D mantle flowand melting.
6.2.4. Depleted Component(s) Beneath theGSC
[33] In Figures 12 and 13, the depleted componentof the WGSC lies at the opposite end of the isotopearrays, having relatively high eNd and less radio-genic Pb and Sr. A depleted component withcompositions similar to those along the East PacificRise (EPR) was proposed by Harpp and White[2001] to explain data from the archipelago, and,based on two EPR-like samples west of 98�W,Schilling et al. [2003] interpreted the GSC array interms of mixing between the (enriched) plume andan EPR-like depleted component in the ambientupper mantle. However, these authors’ and our datafrom the WGSC east of 98�W reveal a conspicu-ously shallower trend in Pb-Pb isotope space andextrapolate to higher 207Pb/204Pb and 208Pb/204Pbat low 206Pb/204Pb values than data for either the
Figure 12. Comparison of isotopic compositions forGSC lavas with proposed Galapagos plume and globalmantle end-members: (a) 208Pb/204Pb versus 206Pb/204Pbfor GSC MORB from this study, Schilling et al. [2003](labeled WGSC* and EGSC* for the western andeastern GSC, respectively), and White et al. [1987](labeled WGSC^); the southern and northern EPR(SEPR and NEPR, respectively); the Costa Rica Rift(CRR; DSDP Site 504, formed �6 Ma on the eastern-most GSC, age-corrected for in situ radioactive decay);and Indian MORB (IMORB) compared to end-membersproposed for the Galapagos plume and other oceanicbasalts. End-members are as follows: FOZO-STR andHIMU-STR (FOZO and HIMU compositions of Strackeet al. [2005]); C-HG (common mantle end-member ‘‘C’’of Hanan and Graham [1996]); HIMU-SCH, EM-SCH,and DM-SCH (HIMU, enriched mantle, and depletedmantle end-members for the Galapagos system pro-posed by Schilling et al. [2003]); and FLO-HW, WD-HW, PLU-HW, and DM-HW (Floreana, Wolf-Darwin,plume, and depleted mantle end-members proposed forthe Galapagos system by Harpp and White [2001]).(b)Values of eNd versus 206Pb/204Pb for the same samplesand end-members as shown in Figure 12a. (c) The gray-shaded area of Figure 12a expanded to demonstrate theclear offset of WGSC lavas to higher 207Pb/204Pb and208Pb/204Pb relative to 206Pb/204Pb compared to theEGSC and both the SEPR and NEPR. Data lying outsidethe main WGSC trend are labeled by the sample’slongitude: these samples are either from the western endof the GSC (>98�W, approaching the triple junction withthe EPR) or near the transform fault near 91�W, whichseparates the WGSC and EGSC. All errors (at 2s) aresmaller than the symbols. Additional data sources areSEPR [Mahoney et al., 1994], NEPR [Castillo et al.,2000], CRR [Pedersen and Furnes, 2001], and IMORB[Hamelin et al., 1986; Dosso et al., 1988; Mahoney etal., 1992].
17 of 30
GeochemistryGeophysicsGeosystems G3G3
ingle et al.: western galapagos spreading center 10.1029/2009GC002694
EGSC or the EPR (Figure 13a). This findingrequires the WGSC (east of 98�W) to be mixingwith a depleted end-member that is distinct fromthat beneath the archipelago and the EGSC. Thetwo compositions found west of 98�Wappear to lieoff of the trend of the WGSC east of 98�W,suggesting that an EPR-like depleted componentis present west of 98�W.
[34] Thus we confirm Schilling et al.’s [2003]conclusion that the depleted component beneathmost of the WGSC differs from that along theEGSC. A common interpretation is that depletedcomponents are intrinsic to the ambient uppermantle [e.g., Schilling et al., 2003] whereasenriched components are contained in, or come
from, plumes. For this to be true along the GSC,the ambient (depleted) upper mantle beneath 91�Wand 98�W must differ from that beneath the EGSC,the archipelago, the EPR, and possibly beneath theGSC west of 98�W. Such a possibility requirescompositional zoning in the ambient upper mantleat scales of hundreds of kilometers.
[35] An alternative interpretation is that two, some-what different depleted components are intrinsic tothe Galapagos plume. One appears in lavas at thearchipelago and along the EGSC, and is similar tothe depleted component beneath the EPR. Theother Galapagos depleted component is unique tothe WGSC, 91�W–98�W. The topic of depletedmantle plume components has been discussed anddebated for the Hawaiian [e.g., Regelous et al.,2003; Mukhopadhyay et al., 2003; Huang et al.,2005; Frey et al., 2005] and Icelandic [e.g., Kerr etal., 1995; Chauvel and Hemond, 2000; Kempton et
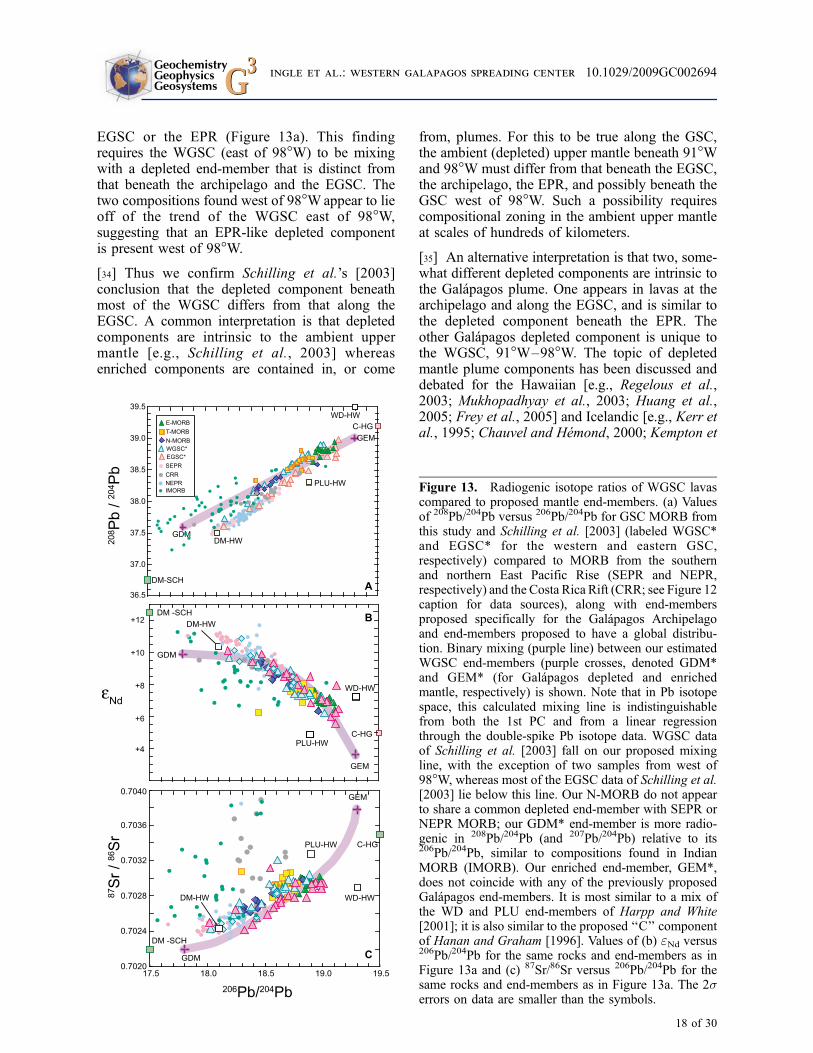
Figure 13. Radiogenic isotope ratios of WGSC lavascompared to proposed mantle end-members. (a) Valuesof 208Pb/204Pb versus 206Pb/204Pb for GSC MORB fromthis study and Schilling et al. [2003] (labeled WGSC*and EGSC* for the western and eastern GSC,respectively) compared to MORB from the southernand northern East Pacific Rise (SEPR and NEPR,respectively) and the Costa Rica Rift (CRR; see Figure 12caption for data sources), along with end-membersproposed specifically for the Galapagos Archipelagoand end-members proposed to have a global distribu-tion. Binary mixing (purple line) between our estimatedWGSC end-members (purple crosses, denoted GDM*and GEM* (for Galapagos depleted and enrichedmantle, respectively) is shown. Note that in Pb isotopespace, this calculated mixing line is indistinguishablefrom both the 1st PC and from a linear regressionthrough the double-spike Pb isotope data. WGSC dataof Schilling et al. [2003] fall on our proposed mixingline, with the exception of two samples from west of98�W, whereas most of the EGSC data of Schilling et al.[2003] lie below this line. Our N-MORB do not appearto share a common depleted end-member with SEPR orNEPR MORB; our GDM* end-member is more radio-genic in 208Pb/204Pb (and 207Pb/204Pb) relative to its206Pb/204Pb, similar to compositions found in IndianMORB (IMORB). Our enriched end-member, GEM*,does not coincide with any of the previously proposedGalapagos end-members. It is most similar to a mix ofthe WD and PLU end-members of Harpp and White[2001]; it is also similar to the proposed ‘‘C’’ componentof Hanan and Graham [1996]. Values of (b) eNd versus206Pb/204Pb for the same rocks and end-members as inFigure 13a and (c) 87Sr/86Sr versus 206Pb/204Pb for thesame rocks and end-members as in Figure 13a. The 2serrors on data are smaller than the symbols.
18 of 30
GeochemistryGeophysicsGeosystems G3G3
ingle et al.: western galapagos spreading center 10.1029/2009GC002694

al., 2000; Fitton et al., 2003; Thirlwall et al., 2004;Kokfelt et al., 2006] hot spots in particular. Thenature and origin of these components is importantfor understanding the composition of the lowermantle, if indeed plumes rise from such depths.The presence of one depleted component between91�W and 98�W, but not apparent elsewhere,would require some form of east-west, bilateralzoning of the Galapagos plume, analogous to whathas been postulated for the Hawaiian plume [e.g.,Abouchami et al., 2005].
7. Mechanism Responsible forGeochemical Variations Along theWGSC
7.1. Plausible Scenarios and OverallPredictions
[36] Two classes of explanation have been for-warded for the origin of along-axis geochemicalvariations in studies of hot spot–ridge interaction.The first emphasizes mantle heterogeneity on inter-mediate scales (tens to hundreds of kilometers),relates lava composition directly to bulk mantlecomposition, and assumes the depleted compo-nents are primarily within the ambient upper man-tle and not in plumes. The other class emphasizesheterogeneity at smaller scales (�1 km or smaller),considers depleted components to be intrinsic toplumes, and relates lava compositions to interme-diate-scale variations in mantle flow and meltextraction, and not to intermediate-scale variationsin the composition of the bulk source. Figure 14depicts examples of the two classes.
7.1.1. Model A1
[37] The original explanation of GSC geochemistryis that of Schilling and colleagues. The near-ridgeplume is more enriched than the depleted ambientupper mantle. Plume mantle flows toward, and thendisperses along, the ridge axis where it becomesprogressively diluted by ambient asthenosphere[e.g., Schilling, 1991] (Figure 14a). This hypothesispredicts a continuous, steady isotopic mixing trendalong axis without any abrupt transitions.
[38] The main difficulty with the above hypothesisis that although geodynamic modeling studiespredict plumes to interact with and spread substan-tially along ridges [e.g., Ribe, 1996; Ito et al., 1997;Sleep, 1996; Albers and Christensen, 2001], nonehave predicted any appreciable solid-state or magmamixing between plume and ambient mantle. The
plume is predicted to push all of the ambientasthenosphere aside, so that only plume materialmelts beneath the section of ridge it influences [see,e.g., Ito et al., 2003]. If the original large- tointermediate-scale composition of the plume isuniform in terms of the relative amounts ofenriched versus depleted material, then numericalmodels predict an unrealistically constant compo-sition where the plume underlies the ridge, and asudden change in composition at the edge of plumeinfluence [Ito et al., 1997] (Figure 14b). The failureof geodynamic studies to predict gradients incomposition along plume-influenced ridges mayreflect shortcomings of the models, misinterpreta-tion of the observations, or both. Resolving thisissue is beyond the scope of this paper.
7.1.2. Model A2
[39] If indeed the Schilling type of model is cor-rect, then our finding of a distinct, depleted com-ponent beneath the WGSC requires a slightmodification. Namely, if all of the componentsare contained primarily in the ambient upper man-tle, then our results would require an intermediate-scale (�500 km) zoning in ambient upper mantlecomposition (Figure 14c).
7.1.3. Model B1
[40] In the second class, the mantle is a heteroge-neous mixture on a fine scale, but uniform atintermediate and larger scales, so that both depletedand enriched components are present in plumeswith abundances much like they are in ambientupper mantle. Different source components beginmelting at deeper or shallower depths dependingon their composition (e.g., in Fe/Mg ratio, volatileand other incompatible element contents); conse-quently, spatial variations in the rate of mantle flowlead to spatial variations in the rate at which thesecomponents melt. If the chemical indicators of thedifferent components occur in surface lavas inproportion to the rate they were first liberated fromthe solid by melting, then there is a predictable linkbetween spatial variations in mantle flow and lavacomposition [Ito and Mahoney, 2005a, 2005b].
[41] Figure 14d considers a relatively broad mantleplume that is mostly depleted but contains vein-like enriched material. Again, the ambient astheno-sphere and plume both have the same proportion ofenriched veins relative to depleted matrix. Becausethe plume buoyancy extends well below the melt-ing zone, the rate of upwelling is greatest near thebase of the melting zone where the more fusible
GeochemistryGeophysicsGeosystems G3G3
ingle et al.: western galapagos spreading center 10.1029/2009GC002694
19 of 30

enriched veins begin melting. At shallower depths,where the more refractory depleted matrix beginsto melt, mantle flow (and melting) is slower,because it is impaired by the rigid lithosphericlid. As a consequence, this model predicts the mostprominent expression of the enriched veins to be inlavas nearest the plume where deep mantle flow isstrongest. With progressive distance away from theplume, the enriched component signature in lavassteadily decreases as mantle flow becomes lessinfluenced by the plume.
7.2. Quantitative Modeling of Model B1:Veined Plume With Variable MeltExtraction and Upwelling
7.2.1. Methodology
[42] Our goal is to explain the variations in crustalthickness, incompatible element ratios, and isoto-pic ratios along the WGSC, including the suddenshift in compositions near 95.5�W. We use a modellike B1 above as our starting point.
[43] The melting model is explained in detail by Itoand Mahoney [2005a] (see also the online support-ing material of Ito and Mahoney [2005a]); here weoutline the main assumptions. We simulate non-modal fractional melting of peridotite in the pres-ence of garnet (>3 GPa), spinel (�3 GPa), and afterclinopyroxene is exhausted (F > 0.2). Melting ofboth depleted matrix and enriched peridotite veinsoccurs as mantle ascends through the melting zone(Figures 15a and 15b). Each melt increment isassumed to be chemically isolated from the sur-rounding solid prior to pooling with other meltincrements (i.e., pooled, accumulated fractionalmelting). The composition of the pooled melts ateach point along the ridge is the weighted average
Figure 14. Cartoons of five different mechanisms forhot spot–ridge interaction, overlain with idealizedisotopic profiles that would be generated. Colorsrepresent different materials as indicated in the legend.(a) Model A1. The concept of Schilling et al. [2003]involves a narrow plume that is compositionally distinctfrom the ambient mantle. The plume progressivelymixes with the local depleted ambient mantle causingthe plume signature in lava composition to graduallydecrease with distance from the plume center. (b) Ito etal.’s [1997] geodynamic model involves a plume thatascends and displaces the ambient mantle while itspreads beneath the lithosphere. No solid-state mixingoccurs; thus, a sharp boundary (black curve) separatesenriched and ambient, depleted mantle. Geodynamicmodels predict that over most of the region of plumeinfluence, the plume layer extends deeper than thesolidus (dashed line), so lavas do not reflect any mixingbetween plume and ambient upper mantle. (c) ModelA2. Like model A1 but incorporating our new results byincluding a zone of ambient upper mantle that is distinctfrom that elsewhere in the region. The shape of theintermediate-scale heterogeneity between 91 and 98�Wis shown schematically; that is, the boundaries would benear 91�W and 98�W but not necessarily have thevertical sides as depicted. The question marks indicateuncertainty as to whether there is a compositionalboundary at the edge of the plume on the EGSC.(d)Model B1. After Ito andMahoney [2005a], this modelinvolves a uniformly heterogeneous mantle sourcebeneath the entire ridge that is dominantly depleted butcontains small enriched blobs or veins (in red). The ratethat mantle flows through the deepest portion of themelting zone (purple arrows) is largest above the plumestem and decreases toward the sides (expressed witharrow length). (e)Model B2. A hybrid model in which thedeep upwelling varies along axis; as in Figure 14d, thematrix is depleted, but here the abundance of enrichedveins changes slightly near 95.5�W to give rise to the stepin composition. Also, the depleted matrix beneath theWGSC is distinct from that elsewhere.
20 of 30
GeochemistryGeophysicsGeosystems G3G3
ingle et al.: western galapagos spreading center 10.1029/2009GC002694

of that needed to create the residual mantle column(RMC; [Plank and Langmuir, 1992; Langmuir etal., 1992]) which is exiting the melting zoneperpendicular to the ridge axis. The average isweighted by the extent of melting (F) and by theRMC width (approximately proportional to theupwelling rate), both of which vary with depth(discussed below and shown in Figure 15).
[44] In our model, the depleted end-member com-poses 90% of the mantle and has only �35 ppmwater, or 10% of the water present in the enrichedend-member. This end-member thus begins melt-ing at shallow depths. We also assume it has a traceelement content equal to that of the average depletedMORB mantle estimate of Workman and Hart[2005] and has high-eNd, low-206Pb/204Pb andlow-87Sr/86Sr values. The enriched end-member isassumed to be peridotite (not pyroxenite) veins or
blobs, making up the remaining 10% of the mantle,and crossing the solidus �60 km deeper than thedepleted component does (as predicted for a watercontent of �350 ppm; Asimow et al. [2004]). Thiscomponent is assumed to have an incompatibleelement composition like the primitive mantle(using McDonough and Sun’s [1995] estimate)and isotopic compositions like C. Estimated com-positions for the two end-members (see GDM andGEM in Figure 13) were determined by tryingdifferent possible isotopic compositions with valuessimilar (in isotope space) to those of either thedepleted mantle or C. Thus, multiple iterations ofour model were carried out to determine thelikeliest end-member isotopic compositions assum-ing melting conditions as discussed above. Impor-tantly, the binary mixing curve in Pb isotope space(Figure 13a) produced using these conditions andend-members coincide with a line formed by alinear regression through the double-spike Pb iso-tope data. Table 3 specifies the values of all modelparameters as well as our derived end-memberisotope compositions.
[45] The effects of mantle flow are simulated byconsidering the rate at which the residue exits themelting zone as a function of depth normalized tothe half-spreading rate, yielding a dimensionless,relative rate of flow (Figure 15c). Thus, the RMCeffectively varies in width (per increment of time)as a function of depth and position along the axis.Far from the plume, the RMC is assumed to have auniform width, as predicted for passive upwellingand corner flow driven purely by plate spreading(a relative flow rate of 1) [Ito and Mahoney,2005a]. In the plume-influenced areas, we consideran additional component of buoyancy-driven flowthat starts near where the depleted matrix begins tomelt, or more specifically when melt extent (F) is0.02, at �65 km (Figure 15a), and extends to adepth of 125 km [Ito et al., 1997]. This flow profileis designed to simulate the effects of water onmantlerheology, in which the mantle begins with a moder-ate water content and low viscosity so that buoyancydrives rapid mantle flow at depth [Ito et al., 1999].As water is extracted from the matrix at low degreesof partial melting, the mantle becomes too viscous[Hirth and Kohlstedt, 1996] for buoyancy to influ-ence the flow (i.e., at �60 km (Figure 15c)) andupwelling slows to the rate driven by the strongplates. The result is rapid, buoyancy-driven flowand melting where the enriched peridotite veins aremelting (Figures 15a and 15b), followed by moresluggish, plate-driven flow and melting where thedepleted matrix is primarily melting.
Figure 15. Profiles of (a) extent of fractional melting,or F; (b) melt productivity, or the rate change in meltfraction per increment of pressure release, dF/dP; and(c) relative rate of flow (flow out of the melting zonenormalized by the half-spreading rate) versus depth forconditions listed in case I (Table 3 and section 7.2.2) formodel B1 (see section 7.2). For Figure 15c, cases II, IV,and V produce no change, but in case III the maximumrelative flow rate is 7.5 (or reduced by half from the15 shown for case I).
GeochemistryGeophysicsGeosystems G3G3
ingle et al.: western galapagos spreading center 10.1029/2009GC002694
21 of 30

[46] The models are run in the forward sense,predicting crustal thickness and lava compositionalong the ridge axis. To demonstrate the sensitivityof the model predictions to differences in mantletemperature, flow rate, end-member proportions,and bulk distribution coefficients, we present fivedifferent cases. Also, by comparing the predictionsof the different cases with the observations, we willconstrain the values of the model parameters (seeTable 3 and Figures 16 and 17), which we willassociate with plume-ridge interaction along theWGSC.
7.2.2. Reference Model: Case I
[47] Case I represents our reference model. Theexcess flow due to plume buoyancy at the base of
the melting zone decreases along axis as anexponential function of distance, from a high of15 times the spreading rate at 92�W to 1 times thespreading rate at 96�W, at which point the RMChas a uniform thickness created entirely by plate-driven flow (Figure 15c). The excess mantle tem-perature also decreases exponentially over thesame distance, with a peak of 30�C at 92�W.
[48] The model predicts a steadily decreasingaverage extent of partial melting (i.e., mean F, ortotal melt thickness divided by the height of themelting zone) toward the plume center (from meanF �9% at �95.5�W to �6% at 92�W). Thisdecrease in mean F toward the hot spot is causedby buoyant mantle flow enhancing the flux of low-degree melts produced in the lower portion of the
Table 3. Model Parameters Used for Five Different Test Casesa
Variable
Feature Model
Case I,Preferred
Case II,DecreasedTemperature
Case III,Decreased
Relative FlowCase IV,
Amount EMCase V,Kds
DVb 15 15 7.5 15 15DTc 30 10 30 30 30hd 60 60 60 60 60DMe W&H ADM W&H ADM W&H ADM W&H ADM W&H ADMEMf M&S PM M&S PM M&S PM M&S PM M&S PMDM/EM 90/10 90/10 90/10 80/20 90/10206Pb/204PbDM 17.8 17.8 17.8 17.8 17.8207Pb/204PbDM 15.45 15.45 15.45 15.45 15.45208Pb/204PbDM 37.6 37.6 37.6 37.6 37.687Sr/86SrDM 0.7022 0.7022 0.7022 0.7022 0.7022
eNd(DM)+10 +10 +10 +10 +10
206Pb/204PbEM 19.3 19.3 19.3 19.3 19.3207Pb/204PbEM 15.65 15.65 15.65 15.65 15.65208Pb/204PbEM 39.0 39.0 39.0 39.0 39.087Sr/86SrEM 0.7038 0.7038 0.7038 0.7038 0.7038
eNd(EM)+3.6 +3.6 +3.6 +3.6 +3.6
Kds changedg none none none none Nb, La, Yb
aCase I is the combination of parameters that is the best fit to our data and the other four reflect one or more deviations from this preferred model.
Case II considers the effect of a diminished temperature differential. In case III, relative mantle flow is decreased to half the rate of case I. Case IVexamines the effect of the amount of enriched component available. Case V shows the impact of a change in Kd values for three of the modeledelements. Note that Nd isotope compositions are represented in e units as defined in Table 2.
bdV is the change in relative effective mantle velocity through the melt zone.
cdT is the change in temperature along axis.
dh is the height of the plume layer.
eDM stands for our ‘‘depleted end-member’’ and assumes the elemental abundances of ‘‘average depleted mantle’’ from Workman and Hart
[2005] (W&H ADM); elements used in the model and their concentrations (in ppm) are: Th = 0.0079, U = 0.0032, Nb = 0.1485, La = 0.192, Ce =0.550, Pb = 0.018, Sr = 7.664, Nd = 0.581, Zr = 5.082, Sm = 0.239, Y = 3.328, Yb = 0.365, H2O = 35.
fEM stands for our ‘‘enriched end-member,’’ and we use the elemental abundances of ‘‘primitive mantle’’ from McDonough and Sun [1995]
(M&S PM) except for water, which is fromWorkman and Hart [2005]; elements used in the model and their concentrations (in ppm) are as follows:Th = 0.085, U = 0.021, Nb = 0.713, La = 0.687, Ce = 1.775, Pb = 0.185, Sr = 21.1, Nd = 1.354, Zr = 11.2, Sm = 0.444, Y = 4.55, Yb = 0.493, andH2O = 335.
gKds, or partition coefficients, for the first three cases are from Salters and Stracke [2004] for all elements except Nb (clinopyroxene and garnet
only [Johnson, 1998]), La (clinopyroxene and garnet only [Johnson, 1998]), Zr (olivine and orthopyroxene [Salters et al., 2002] or clinopyroxeneand garnet [Johnson, 1998]), Y [Green, 1994], and Yb (clinopyroxene and garnet only [Johnson, 1998]). For the fourth case, all Kds are fromSalters and Stracke [2004] except for Y and Zr, which are as above.
GeochemistryGeophysicsGeosystems G3G3
ingle et al.: western galapagos spreading center 10.1029/2009GC002694
22 of 30
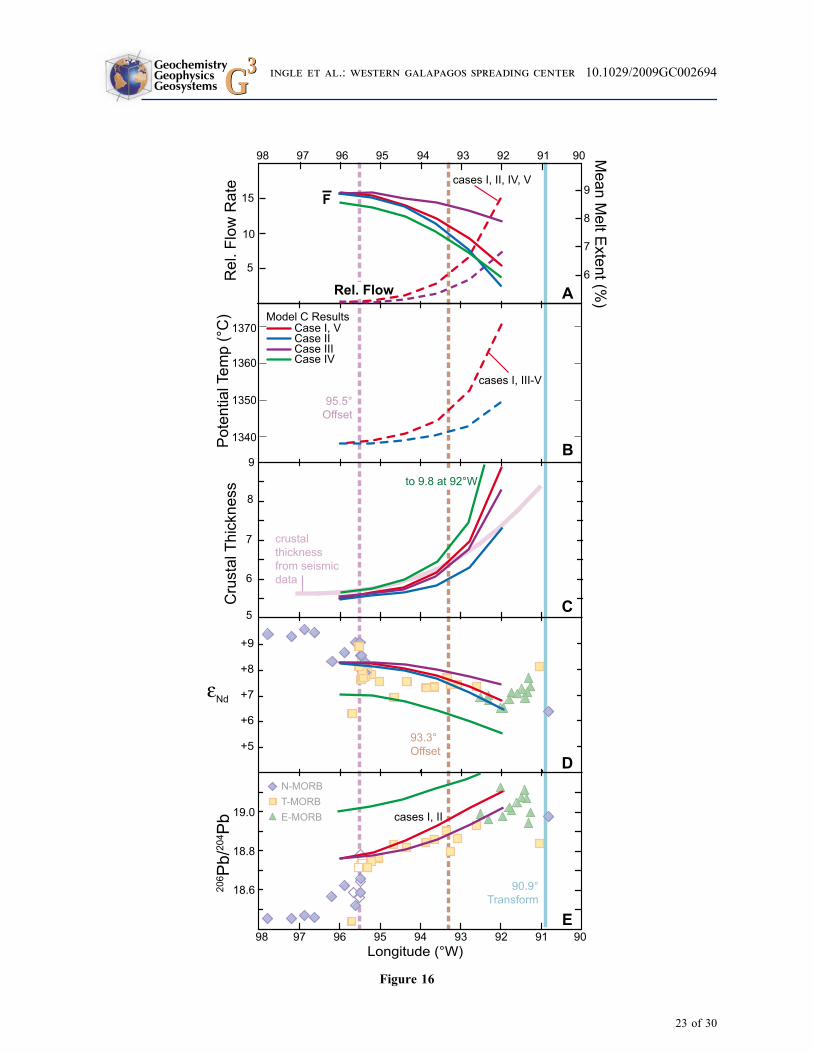
Figure 16
23 of 30
GeochemistryGeophysicsGeosystems G3G3
ingle et al.: western galapagos spreading center 10.1029/2009GC002694
melting zone, essentially the same effect attributedto a variation in bulk water content by Asimowand Langmuir [2003], Asimow et al. [2004], andCushman et al. [2004]. However, in this case bulkwater content is the same everywhere. The enhancedflux of low-degree melts from deep in the meltingzone is consistent with observations of higher Nb/ZrPM, La/SmPM, and Sm/YbPM in the E-MORB(Figure 17).
[49] The variations in isotopic ratios and mostincompatible element ratios are reproduced rela-tively well in the 95.5�W–92�W region; mixingarrays in isotope space are likewise reproducedwell (not shown). Case I also predicts crustalthickness to increase toward the hot spot, butoverpredicts crustal thickness nearest the hot spot.Overall, this model case provides a reasonablematch with the geochemical and geophysicalobservations in the region of the WGSC mostinfluenced by the hot spot 95.5�W–92�W. Case Idoes not explain the data west of 95.5�W (nor docases II–V), an issue discussed in section 7.3.
7.2.3. Lower Excess Temperature: Case II
[50] A second set of calculations examines theeffects of mantle temperature by simulating asmaller temperature variation along axis (DT =10�C). Compared to case I, this case slightlyunderpredicts crustal thickness farther from thehot spot and better predicts crustal thickness near92�W. Case II predicts the variations in traceelement and isotope ratios equally as well as caseI. The smaller temperature change of case II causesaverage extents of melting to decrease more towardthe hot spot than case I. The mean F of �5.5% forthe E-MORB, as predicted at 92�W, is similar tothe 5% estimated by Cushman et al. [2004] (3%–5%) and Asimow and Langmuir [2003]. Overall,cases I and II show that DT is probably 10�C–30�C. This finding is consistent with prior esti-mates by Cushman et al. [2004] (DT � 20�C) andCanales et al. [2002] (DT � 30�C).
7.2.4. Slower Deep Upwelling: Case III
[51] Case III is identical to case I but with a factorof two reduction in maximum relative flow rate(i.e., 7.5 times the half-spreading rate). Comparedto case I, case III predicts slightly thinner crust, anda much more subtle change in mean extent ofmelting along the GSC (from �9% at 96�W to�8% at 92�W). The predictions for observedvariations are comparable to those of case I in thatsome fits are slightly better (e.g., 206Pb/204Pb,crustal thickness) whereas others are poorer (e.g.,
eNd and La/SmPM).
7.2.5. More Enriched Veins (Case IV) andDifferent Partition Coefficients (Case V)
[52] Case IV differs from case I in having a largerproportion (20%) of the enriched component in thestarting source. Obviously, varying the isotopiccompositions of the end-members also would havea strong effect on the model’s predictions; however,there is a direct trade-off between isotopic compo-sitions and the amount of enriched material present,so we focus on the latter. A doubling in the amountof enriched component leads to thicker crust com-pared to case I, because of the larger fraction ofwater-rich veins that melt where buoyant upwellingis the most rapid. The resulting Pb isotope compo-sitions, however, are too radiogenic. A similar misfitresults for Nd isotopic ratios and the modeled traceelement ratios are generally overpredicted. This casesuggests that the amount of enriched veins is lessthan 20%.
[53] Case V is the same as case I but uses thedistribution coefficients of Salters and Stracke[2004] rather than those used by Ito and Mahoney[2005a]. Changing the distribution coefficients,while keeping all other parameters the same, hasa relatively small effect on isotopic and crustalthickness predictions but, as expected, modifies therelevant elemental concentration ratios.
Figure 16. Model B1 (see section 7.2) predictions compared to our data. Prescribed variations in model variables(dashed lines) and predicted results (solid lines) shown are (a) relative mantle flow (i.e., flow exiting the melting zonenormalized by spreading rate, left axis) and mean extent of melt (total quantity of melt divided by the height of themelting zone, right axis), (b) potential temperature, (c) crustal thickness compared to that measured seismically byCanales et al. [2002], (d) eNd, and (e) 206Pb/204Pb versus longitude. Case I is our reference case (parameters given inTable 3). Maximum relative flow rate (Figure 16a) is the same for cases I, II, IV, and Vand is 50% lower for case III;therefore, case III predicts a thinner crust than case I. For a reduced temperature anomaly (case II), average extents ofmelting decrease more rapidly toward the east, and less crust is produced than in case I. For larger proportions ofenriched mantle material (case IV), average extents of melting are generally less and crust is thicker than in case I. All2s errors on measured data are smaller than the symbols.
GeochemistryGeophysicsGeosystems G3G3
ingle et al.: western galapagos spreading center 10.1029/2009GC002694
24 of 30

[54] In summary, the geochemical and geophysicaldata between 95.5�W and 92�W are generallymatched with maximum temperature anomalies ofDT = 10�C–30�C, excess deep mantle flow of7.5–15 times the spreading rate, and a proportionof enriched veins <20% and probably close to10%.
7.2.6. Buoyancy Flux of Model B1
[55] The reasonableness of a relative mantle flowrate (DV) of 7.5–15 times the spreading rate maybe assessed by estimating the buoyancy flux B,
B ¼ QDr; ð1Þ
where Q is the volume flux of the excess buoyantupwelling and Dr the density anomaly of theplume. Volume flux Q can be estimated as,
Q ¼ U H W 1þ 2=3 DV=2ð Þ=2½ �; ð2Þ
where U is full spreading rate (1.6 � 10�9 m/s), His the total thickness of the plume layer (1.2� 105m,about twice as thick as the zone of rapidupwelling), W is total along-axis width of plumeinfluence (i.e., both west and east of 91�, or �1 �106 m), and the maximum excess flow rate hasbeen halved to account for the decrease to zeroalong the ridge axis (DV/2 = 7.5, the factor of 2/3comes from integrating the quadratic function ofplume-driven flow over depth). This gives Q =670m3/s. Assuming Dr is purely thermal, it is theproduct of upper mantle density (3300 kg/m3), thecoefficient of thermal expansion (3.5� 10�5 �C�1),and the upper bound for excess temperature(DT = 30�C). Thus, the estimated buoyancy fluximplied by our reference case I is B = 2.3� 103 kg/s.This estimate is comparable to the buoyancy fluxestimate of �2 � 103 kg/s by Ito et al. [1997]. Ourlower bound estimate for the excess flow of7.5 times the spreading rate, for DT = 10�C–30�C,brings our estimate forB down to 0.5–1.5� 103 kg/s,orwithin the estimates of Sleep [1990] andCanales etal. [2002], which are based on the flux needed tosupport the Galapagos hot spot swell.
7.3. Hybrid Model B2 and Implications
[56] Model B1 shows that variations in buoyancy-driven mantle flow, combined with the effects ofdehydration to retard upwelling where the depletedmatrix is melting, can explain most of the geo-chemical and geophysical variations within the zoneof greatest plume influence (91�W–95.5�W). How-ever, model B1 fails to account for the sharp
Figure 17. Model B1 (see section 7.2) predictions forour preferred case, case I, and cases II–V compared tomeasured incompatible trace element variation alongaxis. (a) La/SmPM, (b) Sm/YbPM, (c) Nb/ZrPM, (d) Nb/LaPM, and (e) DNb versus longitude. Both cases I and IIreproduce the observed patterns of WGSC data fairlywell (and are indistinguishable in Figure 17d). Case IIIunderpredicts La/SmPM, Sm/YbPM, and Nb/ZrPM. Pre-dictions of case IV match some observations butoverpredict Nb/Zr, eNd, and 206Pb/204Pb. All 2s errorson measured data are smaller than the symbols.
GeochemistryGeophysicsGeosystems G3G3
ingle et al.: western galapagos spreading center 10.1029/2009GC002694
25 of 30

transition in the compositions between 95.5�W–96.5�W. In the context of model B1, this transitionwould require a sharp and large decrease in buoyantupwelling, for which we have no simple explana-tion. A more likely explanation is that the abruptchange near 95.5�Wsignifies a geochemical boundaryassociated with intermediate-scale zoning in mantlecomposition. Our finding that the same depletedcomponent is present east and west of 95.5�Wcouldindicate the mantle between 95.5�W and 98�W isambient upper mantle similar in composition to thedepleted component in the plume, or that the mantlewest of 95.5� is still part of the plume. The latterpossibility would imply the presence of an outerplume, a sheath containing fewer enriched veinsthan the inner region it surrounds. It is the innerregion that appears to be hottest, most activelyupwelling, and therefore generating the largest geo-physical and geochemical anomalies (91�W–95.5�W). This hybrid model B2 is illustrated inFigure 14e. As discussed in section 6, this modelwould require another compositional boundary near91�W, the approximate longitude that marks theappearance on the EGSC of the other depletedcomponent, which is also evident at the GalapagosArchipelago. The WGSC data can therefore beinterpreted as revealing an east-west bilateral, com-positional zoning of the Galapagos mantle plume.The zoning pertains particularly to depleted compo-nents that are intrinsic to the plume.
[57] An important implication is that even theinner, more enriched, region of the Galapagosplume influencing the WGSC between 91�W and95.5�W is mostly depleted mantle. Its bulk com-position is approximately expressed by the modelcompositions at 95.5�W (Figures 16 and 17) anddoes not clearly differ from that of the mantleexpressed at other ocean ridge segments unaffectedby hot spots. The inference is that the source regionof the plume material feeding the GSC (e.g., thedeeper upper mantle, lower mantle, or core-mantleboundary) may be similar to the source of manynormal ridge basalts in terms of the abundance ofdepleted material. It has yet to be tested whetherthis material could represent the bulk compositionof Galapagos plume at its center, beneath thearchipelago.
[58] Last, the discovery that the inferred extent ofstrong plume influence occurs near the tip of apropagating rift near 95.5�W, as emphasized byboth PCA results (Figure 11b) and by a changefrom positive (plume-like) to negative (MORB-
like) DNb values (Figure 9e), could reveal someform ofmechanical interaction between the astheno-sphere and lithosphere. Geochemical boundaries atpropagating rift tips have been observed at a fewother locations, including 20.7�S along the EPR[Sinton et al., 1991; Mahoney et al., 1994]. The95.5�W propagator is one of several, often smaller-offset, propagators that are or were recently activealong the GSC [Hey, 1977; Wilson and Hey, 1995];therefore, not all propagating rifts mark the edge ofstrong Galapagos plume influence. Indeed, we cansee from the PCA scores and analysis of geochem-ical data [Rotella et al., 2009] that the propagator at�93.3�W displays no such boundary. Bathymetricgradients and lateral asthenospheric flow, such asthose associated with plume-ridge interaction, havebeen shown to drive rift propagation [PhippsMorganand Parmentier, 1985; West and Lin, 1999], but acausal link between propagators and the edge ofbuoyant plume material has not yet been established.Also an analogous compositional boundary along theEGSC, for example at the 87�W OSC, has yet to befound [Christie et al., 2005]. Detailed samplingacross the Inca (85.5�W) and Ecuador (84.5�W)transforms are probably needed for this test.
8. Conclusions
[59] Geochemical data for WGSC basalts providenew information about the causes of geochemicaland geophysical variations along axis. Our majorconclusions are as follows.
[60] 1. From 91�W to 95.5�W, lava compositionsshow an overall steady decline in abundances ofincompatible trace elements, ratios of highly overmoderately incompatible elements, and radiogenicSr and Pb, and increasingly radiogenic Nd. To thewest of 95.5�W, compositions change by 30%–50% of the total variation over an axial distance of�100 km, to background levels of less radiogenicSr and Pb and lower abundances of highly incom-patible elements. Between 96.5�Wand 98�W, com-positions show little further systematic variation.
[61] 2. Two main mantle source end-membersexplain 87% of the isotopic variability along theWGSC. The enriched end-member is comparableto the C or ‘‘common’’ mantle component sampledat many ridges and hot spots and is dissimilar toany of the individual end-members of the GalapagosArchipelago. This finding could be revealing differ-ences in sampling and/or mixing between the two
GeochemistryGeophysicsGeosystems G3G3
ingle et al.: western galapagos spreading center 10.1029/2009GC002694
26 of 30

locations, or spatial variability in the compositionand flow within the Galapagos mantle plume.
[62] 3. The depleted WGSC end-member is distinctfrom that beneath the Galapagos Archipelago, theeastern GSC, and the nearby EPR. Thus, there issome form of compositional zoning either in theambient upper mantle or in the plume.
[63] 4. To explain geochemical and geophysicalvariations between 91�W and 95.5�W, we proposea model in which the mantle is a uniform mixtureof a depleted matrix (90%) and incompatibleelement–enriched veins (10%). Variations in melt-ing caused by deep, buoyancy-driven flow explainthe geochemical and crustal thickness variationsalong the WGSC between 92� and 95.5�W.
[64] 5. The geochemical boundary near 95.5�Wmarks a mantle compositional boundary. It sepa-rates a region with slightly less enriched material tothe west compared to the east.
[65] 6. The bulk composition of our model plumebetween 91�W and 95.5�W beneath the GSC iscomparable to compositions of other ridges farfrom hot spots.
Acknowledgments
[66] D. Pyle, S. Sherman, and D. Vonderhaar are thanked for
help with acquisition of analyses. Conversations with many
colleagues have greatly improved the ideas presented herein;
we would especially like to thank D. Eason, S. Escrig, F. Hauff,
E. Mittelstaedt, K. Rubin, V. Salters, R. Sohn, S. White, and
R. Workman. Many thanks to D. Geist, K. Harpp, two
anonymous referees, and Editor V. Salters for the time and
care they spent in providing constructive and critical reviews.
Their work led to major improvements of this paper. This work
was funded by NSF-OCE grants 98-18632 and 03-27051 to
J. Sinton, J. J. Mahoney, and G. Ito; by NSF-OCE04-52127 to
J. J. Mahoney; by NSF-EAR-OCE 04-40365 and NSF-OCE
03-51234 to G. Ito; and by the University of Hawaii SOEST
Young Investigator Program (S. Ingle).
References
Abouchami, W., A. W. Hofmann, S. J. G. Galer, F. A. Frey,J. Eisele, and M. Feigenson (2005), Lead isotopes revealbilateral asymmetry and vertical continuity in the Hawaiianmantle plume, Nature, 434(7035), 851–856, doi:10.1038/nature03402.
Albarede, F. (1995), Introduction to Geochemical Modeling,543 pp., Cambridge Univ. Press, New York.
Albers, M., and U. R. Christensen (2001), Channeling ofplume flow beneath mid-ocean ridges, Earth Planet. Sci.Lett., 187, 207–220, doi:10.1016/S0012-821X(01)00276-X.
Asimow, P. D., and C. H. Langmuir (2003), The importance ofwater to oceanic mantle melting regimes, Nature, 421, 815–820, doi:10.1038/nature01429.
Asimow, P. D., J. E. Dixon, and C. H. Langmuir (2004), Ahydrous melting and fractionation model for mid-ocean ridgebasalts: Application to the Mid-Atlantic Ridge near theAzores, Geochem. Geophys. Geosyst., 5, Q01E16,doi:10.1029/2003GC000568.
Barckhausen, U., C. R. Ranero, R. von Huene, S. C. Cande,and H. A. Roeser (2001), Revised tectonic boundaries in theCocos Plate off Costa Rica: Implications for the segmenta-tion of the convergent margin and for plate tectonic models,J. Geophys. Res., 106, 19,207–19,220, doi:10.1029/2001JB000238.
Blichert-Toft, J., A. Agranier, M. Andres, R. Kingsley, and J.-G.Schilling (2005), Geochemical segmentation of the Mid-Atlantic Ridge north of Iceland and ridge-hot spot interactionin the North Atlantic, Geochem. Geophys. Geosyst., 6,Q01E19, doi:10.1029/2004GC000788.
Bonatti, E. (1990), Not so hot ‘‘hot spots’’ in the oceanic mantle,Science, 250, 107–110, doi:10.1126/science.250.4977.107.
Canales, J. P., G. Ito, R. S. Detrick, and J. Sinton (2002),Crustal thickness along the western Galapagos SpreadingCenter and the compensation of the Galapagos hotspot swell,Earth Planet. Sci. Lett., 203, 311–327, doi:10.1016/S0012-821X(02)00843-9.
Castillo, P. R., E. Klein, J. Bender, C. Langmuir, S. Shirey,R. Batiza, and W. White (2000), Petrology and Sr, Nd, andPb isotope geochemistry of mid-ocean ridge basalt glassesfrom the 11�450N to 15�000N segment of the East PacificRise, Geochem. Geophys. Geosyst., 1(11), 1011,doi:10.1029/1999GC000024.
Chappell, B. W. (1991), Trace element analysis of rocks byX-ray spectrometry, Adv. X Ray Anal., 34, 263–276.
Chauvel, C., and C. Hemond (2000), Melting of a completesection of recycled oceanic crust: Trace element and Pb iso-topic evidence from Iceland, Geochem. Geophys. Geosyst.,1(2), 1001, doi:10.1029/1999GC000002.
Christie, D., and J. M. Sinton (1981), Evolution of abyssallavas along propagating segments of the Galapagos spread-ing center, Earth Planet. Sci. Lett., 56, 321 – 335,doi:10.1016/0012-821X(81)90137-0.
Christie, D., and J. M. Sinton (1986), Major element con-straints on melting, differentiation and mixing of magmasfrom the Galapagos 95.5�W propagating rift system, Con-trib. Mineral. Petrol., 94, 274 – 288, doi:10.1007/BF00371437.
Christie, D. M., R. Werner, F. Hauff, K. Hoernle, and B. B.Hanan (2005), Morphological and geochemical variationsalong the eastern Galapagos Spreading Center, Geochem.Geophys. Geosyst., 6, Q01006, doi:10.1029/2004GC000714.
Cushman, B., J. Sinton, G. Ito, and E. T. Dixon (2004), Glasscompositions, plume-ridge interaction, and hydrous meltingalong the Galapagos Spreading Center, 90.5�W to 98�W,Geochem. Geophys. Geosyst., 5, Q08E17, doi:10.1029/2004GC000709.
Detrick, R. S., et al. (2002), Correlated geophysical, geochem-ical, and volcanological manifestations of plume-ridge inter-action along the Galapagos Spreading Center, Geochem.Geophys.Geosyst., 3(10), 8501, doi:10.1029/2002GC000350.
Dixon, J. E., and D. A. Clague (2001), Volatiles in basalticglasses from Loihi Seamount, Hawaii: Evidence for a rela-tively dry plume component, J. Petrol., 42(3), 627–654,doi:10.1093/petrology/42.3.627.
Dixon, J. E., L. Leist, C. Langmuir, and J.-G. Schilling (2002),Recycled dehydrated lithosphere observed in plume-influenced mid-ocean-ridge basalt, Nature, 420, 385–389,doi:10.1038/nature01215.
GeochemistryGeophysicsGeosystems G3G3
ingle et al.: western galapagos spreading center 10.1029/2009GC002694
27 of 30

Dosso, L., H. Bougault, P. Beuzart, J.-Y. Calvez, and J.-L.Joron (1988), The geochemical structure of the South-EastIndian Ridge, Earth Planet. Sci. Lett., 88, 47 –59,doi:10.1016/0012-821X(88)90045-3.
Douglass, J., and J.-G. Schilling (2000), Systematics of three-component, pseudo-binary mixing lines in 2D isotope ratiospace representations and implications for mantle plume-ridge interaction, Chem. Geol., 163, 1–23, doi:10.1016/S0009-2541(99)00070-4.
Eason, D., and J. M. Sinton (2006), Origin of high-AlN-MORB by fractional crystallization in the upper mantlebeneath the Galapagos Spreading Center, Earth Planet. Sci.Lett., 252, 423–436, doi:10.1016/j.epsl.2006.09.048.
Fitton, J. G., A. D. Saunders, M. J. Norry, B. S. Hardarson, andR. N. Taylor (1997), Thermal and chemical structure of theIceland plume, Earth Planet. Sci. Lett., 153, 197–208,doi:10.1016/S0012-821X(97)00170-2.
Fitton, J. G., A. D. Saunders, P. D. Kempton, and B. S.Hardarson (2003), Does depleted mantle form an intrinsicpart of the Iceland plume?, Geochem. Geophys. Geosyst.,4(3), 1032, doi:10.1029/2002GC000424.
Frey, F. A., S. Huang, J. Blichert-Toft, M. Regelous, andM. Boyet (2005), Origin of depleted components in basaltrelated to the Hawaiian hot spot: Evidence from isotopicand incompatible element ratios, Geochem. Geophys. Geo-syst., 6, Q02L07, doi:10.1029/2004GC000757.
Galer, S. J. G. (1999), Optimal double and triple spiking forhigh precision lead isotopic measurement, Chem. Geol., 157,255–274, doi:10.1016/S0009-2541(98)00203-4.
Govindaraju, K. (1994), Compilation of working values andsample descriptions for 383 geostandards, Geostand. Newsl.,18, 1–158.
Graham, D. W., D. M. Christie, K. S. Harpp, and J. E. Lupton(1993), Mantle plume helium in submarine basalts from theGalapagos Platform, Science, 262, 2023–2026, doi:10.1126/science.262.5142.2023.
Graham, D. W., J. M. Sinton, K. Hoernle, D. M. Christie, J. J.Mahoney, B. B. Hanan, P. J. Michael, and J. E. Lupton(2006), Helium isotope variations and mantle plume-spreading ridge interaction along the Galapagos SpreadingCenter, Eos Trans. AGU, 87(52), Fall Meet. Suppl., AbstractV14A-02.
Green, T. H. (1994), Experimental studies of trace-elementpartitioning applicable to igneous petrogenesis—Sedon16 years later, Chem. Geol., 117, 1–36, doi:10.1016/0009-2541(94)90119-8.
Hall, P. S., and C. Kincaid (2003), Melting, dehydration, andthe dynamics of off-axis plume-ridge interaction, Geochem.Geophys. Geosyst., 4(9), 8510, doi:10.1029/2003GC000567.
Hall, P. S., and C. Kincaid (2004), Melting, dehydration, andthe geochemistry of off-axis plume-ridge interaction, Geo-chem. Geophys. Geosyst., 5, Q12E18, doi:10.1029/2003GC000667.
Hamelin, B., B. Dupre, and C. J. Allegre (1986), Pb-Sr-Ndisotopic data of Indian Ocean ridges: New evidence oflarge-scale mapping of mantle heterogeneities, EarthPlanet. Sci. Lett., 76, 288–298, doi:10.1016/0012-821X(86)90080-4.
Hanan, B. B., and D. W. Graham (1996), Lead and heliumisotope evidence from oceanic basalts for a common deepsource of mantle plumes, Science, 272, 991 – 995,doi:10.1126/science.272.5264.991.
Harpp, K. S., and W. M. White (2001), Tracing a mantleplume: Isotopic and trace element variations of Galapagosseamounts, Geochem. Geophys. Geosyst., 2(6), 1042,doi:10.1029/2000GC000137.
Hart, S. R., E. H. Hauri, L. A. Oschmann, and J. A. Whitehead(1992), Mantle plumes and entrainment: Isotopic evidence,Science, 256, 517–520, doi:10.1126/science.256.5056.517.
Hey, R. N. (1977), A new class of ‘‘pseudofaults’’ and theirbearing on plate tectonics: A propagating rift model, EarthPlanet. Sci. Lett., 37, 321 – 325, doi:10.1016/0012-821X(77)90177-7.
Hey, R. N., F. K. Duennebier, and W. J. Morgan (1980), Pro-pagating rifts on mid-ocean ridges, J. Geophys. Res., 85,3647–3658, doi:10.1029/JB085iB07p03647.
Hey, R. N., J. M. Sinton, and F. K. Duennebier (1989), Pro-pagating rifts and spreading centers, in The Geology of NorthAmerica: The Eastern Pacific Ocean and Hawaii, edited byE. L. Winterer et al., pp. 161–175, Geol. Soc. of Am.,Boulder, Colo.
Hirth, G., and D. L. Kohlstedt (1996), Water in the oceanicupper mantle: Implications for rheology, melt extraction andthe evolution of the lithosphere, Earth Planet. Sci. Lett., 144,93–108, doi:10.1016/0012-821X(96)00154-9.
Huang, S., M. Regelous, and T. Thordarson (2005), Petrogen-esis of lavas from Detroit Seamount: Geochemical differ-ences between Emperor Chain and Hawaiian volcanoes,Geochem. Geophys. Geosyst., 6, Q01L06, doi:10.1029/2004GC000756.
Ito, G., and J. Lin (1995), Mantle temperature anomalies alongthe past and paleoaxes of the Galapagos spreading center asinferred from gravity analyses, J. Geophys. Res., 100(B3),3733–3745, doi:10.1029/94JB02594.
Ito, G., and J. J. Mahoney (2005a), Flow and melting of aheterogeneous mantle: 1. Method and importance to the geo-chemistry of ocean island and mid-ocean ridge basalts, EarthPlane t . Sc i . Le t t . , 230 , 29 – 46 , do i :10 .1016/j.epsl.2004.10.035.
Ito, G., and J. J. Mahoney (2005b), Flow and melting of aheterogeneous mantle: 2. Implications for a chemically non-layered mantle, Earth Planet. Sci. Lett., 230, 47–63,doi:10.1016/j.epsl.2004.10.034.
Ito, G., J. Lin, and C. Gable (1997), Interaction of mantleplumes and migrating mid-ocean ridges: Implications forthe Galapagos plume-ridge systemsJ. Geophys. Res.,102(B7), 15,403–15,417, doi:10.1029/97JB01049.
Ito, G., Y. Shen, G. Hirth, and C. J. Wolfe (1999), Mantle flow,melting, and dehydration of the Iceland mantle plume, EarthPlanet. Sci. Lett., 165, 81 –96, doi:10.1016/S0012-821X(98)00216-7.
Ito, G., J. Lin, and D. Graham (2003), Observational and theo-retical studies of the dynamics of mantle plume-mid-oceanridge interaction, Rev. Geophys., 41(4), 1017, doi:10.1029/2002RG000117.
Johnson, K. T. (1998), Experimental determination of partitioncoefficients for rare earth and high-field-strength elementsbetween clinopyroxene, garnet, and basaltic melt at highpressures, Contrib. Mineral. Petrol., 133, 60 – 68,doi:10.1007/s004100050437.
Kempton, P. D., J. G. Fitton, A. D. Saunders, G. M. Nowell,R. N. Taylor, B. S. Hardarson, and G. Pearson (2000), TheIceland plume in space and time: A Sr-Nd-Pb-Hf study ofthe North Atlantic rifted margin, Earth Planet. Sci. Lett.,177, 255–271, doi:10.1016/S0012-821X(00)00047-9.
Kerr, A. C., A. D. Saunders, J. Tarney, N. H. Berry, and V. L.Hards (1995), Depleted mantle-plume geochemical signa-tures: No paradox for plume theories, Geology, 23(9),8 43 – 846 , do i : 1 0 . 1130 / 0091 - 7613 ( 1995 ) 023<0843:DMPGSN>2.3.CO;2.
Kokfelt, T. F., K. Hoernle, F. Hauff, J. Fiebig, R. Werner, andD. Garbe-Schonberg (2006), Combined trace element and
GeochemistryGeophysicsGeosystems G3G3
ingle et al.: western galapagos spreading center 10.1029/2009GC002694
28 of 30

Pb-Nd-Sr-O isotope evidence for recycled oceanic crust(upper and lower) in the Iceland mantle plume, J. Petrol.,47, 1705–1749, doi:10.1093/petrology/egl025.
Kurz, M. D., and D. Geist (1999), Dynamics of the Galapagoshotspot from helium isotope geochemistry, Geochim. Cos-mochim. Acta, 63(23–24), 4139–4156, doi:10.1016/S0016-7037(99)00314-2.
Langmuir, C. H., E. M. Klein, and T. Plank (1992), Petrologi-cal systematics of mid-ocean ridge basalts: Constraints onmelt generation beneath ocean ridges, in Mantle Flow andMelt Generation at Mid-Ocean Ridges, Geophys. Monogr.Ser., vol. 71, edited by J. Phipps Morgan et al., pp. 183–280,AGU, Washington, D. C.
Mahoney, J., A. P. le Roex, Z. Peng, R. L. Fisher, and J. H.Natland (1992), Southwestern limits of Indian Ocean ridgemantle and the origin of low 206Pb/204Pb mid-ocean ridgebasalt: Isotope systematics of the central Southwest IndianRidge (17�–50�E), J. Geophys. Res., 97(B13), 19,771–19,790, doi:10.1029/92JB01424.
Mahoney, J. J., J. M. Sinton, M. D. Kurz, J. D. Macdougall,K. J. Spencer, and G. W. Lugmair (1994), Isotopic and traceelement characteristics of a super-fast spreading ridge: EastPacific Rise 13–23�S, Earth Planet. Sci. Lett., 121, 173–193, doi:10.1016/0012-821X(94)90039-6.
Mahoney, J. J., R. Frei, M. L. G. Tejada, X. X. Mo, P. T. Leat,and T. F. Nagler (1998), Tracing the Indian Ocean mantledomain through time: Isotopic results from old west Indian,east Tethyan, and south Pacific seafloor, J. Petrol., 39(7),1285–1306, doi:10.1093/petrology/39.7.1285.
McDonough, W. F., and S. Sun (1995), The composition of theEarth, Chem. Geol., 120, 223–253, doi:10.1016/0009-2541(94)00140-4.
Morgan, W. J. (1971), Convection plumes in the lower mantle,Nature, 230, 42–43, doi:10.1038/230042a0.
Morgan, W. J. (1978), Rodriguez, Darwin, Amsterdam, . . ., Asecond type of hotspot island, J. Geophys. Res., 83(B11),5355–5360, doi:10.1029/JB083iB11p05355.
Mukhopadhyay, S., J. C. Lassiter, K. A. Farley, and S. W.Bogue (2003), Geochemistry of Kauai shield-stage lavas:Implications for the chemical evolution of the Hawaiianplume, Geochem. Geophys. Geosyst., 24(1), 1009,doi:10.1029/2002GC000342.
Neal, C. R. (2001), Interior of the Moon: The presence of garnetin the primitive deep lunar mantle, J. Geophys. Res.,106(E11), 27,865–27,885, doi:10.1029/2000JE001386.
Nicolaysen, K. P., F. A. Frey, J. J. Mahoney, K. T. M. Johnson,and D. W. Graham (2007), Influence of the Amsterdam/St.Paul hot spot along the Southeast Indian Ridge between77� and 88�E: Correlations of Sr, Nd, Pb, and He isotopicvariations with ridge segmentation, Geochem. Geophys.Geosyst., 8, Q09007, doi:10.1029/2006GC001540.
Norrish, K., and B. W. Chappell (1977), X-ray fluorescencespectrography, in Physical Methods in Determinative Miner-alogy, edited by J. Zussman, pp. 161–214, Academic,London.
Pedersen, R. B., and H. Furnes (2001), Nd- and Pb-isotopicvariations through the upper oceanic crust in DSDP/ODPHole 504B, Costa Rica Rift, Earth Planet. Sci. Lett., 189,221–235, doi:10.1016/S0012-821X(01)00349-1.
Phipps Morgan, J., and E. M. Parmentier (1985), Causes andrate-limiting mechanisms of ridge propagation: A fracturemechanics model, J. Geophys. Res., 90, 8603–8612,doi:10.1029/JB090iB10p08603.
Plank, T., and C. Langmuir (1992), Effects of the meltingregime on the composition of the oceanic crust, J. Geophys.Res., 97, 19,749–19,770, doi:10.1029/92JB01769.
Regelous, M., A. W. Hofmann, W. Abouchami, and S. J. G.Galer (2003), Geochemistry of lavas from the Emperor Sea-mounts, and the geochemical evolution of Hawaiian magma-tism from 85 to 42 Ma, J. Petrol., 44(1), 113–140,doi:10.1093/petrology/44.1.113.
Ribe, N. (1996), The dynamics of plume-ridge interaction: 2.Off-ridge plumes, J. Geophys. Res., 101, 16,195–16,204,doi:10.1029/96JB01187.
Rotella, M. D., J. M. Sinton, J. J. Mahoney, and W. Chazey III(2009), Geochemical evidence for low magma supply anddueling propagation at the Galapagos 93.25�W overlappingspreading center, Geochem. Geophys. Geosyst., 10, Q09005,doi:10.1029/2009GC002445.
Saal, A. (2002), Vapour undersaturation in primitive mid-ocean-ridge basalt and the volatile content of Earth’s uppermantle, Nature, 419, 451–455, doi:10.1038/nature01073.
Salters, V. J. M., and A. Stracke (2004), Composition of thedepleted mantle, Geochem. Geophys. Geosyst., 5, Q05B07,doi:10.1029/2003GC000597.
Salters, V. J. M., J. E. Longhi, and M. Bizimis (2002), Nearmantle solidus trace element partitioning at pressures up to3.4 GPa, Geochem. Geophys. Geosyst., 3(7), 1038,doi:10.1029/2001GC000148.
Schilling, J.-G. (1991), Fluxes and excess temperatures ofmantle plumes inferred from their interaction with migratingmid-ocean ridges, Nature, 352, 397–403, doi:10.1038/352397a0.
Schilling, J.-G., R. N. Anderson, and P. Vogt (1976), Rareearth, Fe and Ti variations along the Galapagos SpreadingCenter and their relationship to the Galapagos mantle plume,Nature, 261, 108–113, doi:10.1038/261108a0.
Schilling, J.-G., M. B. Bergeron, and R. Evans (1980), Halo-gens in the mantle beneath the North Atlantic, Philos. Trans.R. Soc. London, Ser. A, 297, 147–178, doi:10.1098/rsta.1980.0208.
Schilling, J.-G., R. H. Kingsley, and J. D. Devine (1982),Galapagos hot spot– spreading center system: 1. Spatialpetrological and geochemical variations (83�W–101�W),J. Geophys. Res., 87(B7), 5593–5610, doi:10.1029/JB087iB07p05593.
Schilling, J.-G., D. Fontignie, J. Blichert-Toft, R. Kingsley,and U. Tomza (2003), Pb-Hf-Nd-Sr isotope variations alongthe Galapagos Spreading Center (101�–83�W): Constraintson the dispersal of the Galapagos mantle plume, Geochem.Geophys . Geosys t . , 4 (10) , 8512, doi :10.1029/2002GC000495.
Sheth, H. C., J. J. Mahoney, and A. N. Baxter (2003),Geochemistry of lavas from Mauritius: Mantle source andpetrogenesis, Int. Geol. Rev., 45, 780–797, doi:10.2747/0020-6814.45.9.780.
Simons, K., J. E. Dixon, J.-G. Schilling, R. Kingsley, andR. Poreda (2002), Volatiles in basaltic glasses from the Easter-Salas y Gomez Seamount Chain and Easter Microplate:Implications for geochemical cycling of volatile elements,Geochem. Geophys. Geosyst., 3(7), 1039, doi:10.1029/2001GC000173.
Sinton, J. M., and P. Fryer (1987), Mariana trough lavas from18�N: Implications for the origin of back arc basin basalts,J. Geophys. Res., 92, 12,782 –12,802, doi:10.1029/JB092iB12p12782.
Sinton, J. M., S. M. Smaglik, J. J. Mahoney, and K. C.Macdonald (1991), Magmatic processes at superfast spread-ing mid-ocean ridges: Glass compositional variations alongthe East Pacific Rise 13�–23�S, J. Geophys. Res., 96,6133–6155, doi:10.1029/90JB02454.
GeochemistryGeophysicsGeosystems G3G3
ingle et al.: western galapagos spreading center 10.1029/2009GC002694
29 of 30

Sinton, J., R. S. Detrick, J. P. Canales, G. Ito, and M. Behn(2003), Morphology and segmentation of the western Gala-pagos Spreading Center, 90.5�–98�W: Plume-ridge interac-tion at an intermediate spreading ridge, Geochem. Geophys.Geosyst., 4(12), 8515, doi:10.1029/2003GC000609.
Sinton, J., K. Gronvold, and K. Sæmundsson (2005), Postgla-cial eruptive history of the Western Volcanic Zone, Iceland,Geochem. Geophys. Geosyst., 6, Q12009, doi:10.1029/2005GC001021.
Sleep, N. H. (1990), Hotspots and mantle plumes: Some phe-nomenology, J. Geophys. Res., 95(B5), 6715–6736,doi:10.1029/JB095iB05p06715.
Sleep, N. H. (1996), Lateral flow of hot plume material pondedat sublithospheric depths, J. Geophys. Res., 101, 28,065–28,083, doi:10.1029/96JB02463.
Sobolev, A. V., et al. (2007), The amount of recycled crust insources of mantle-derived melts, Nature, 316, 412–417.
Stracke, A., A. W. Hofmann, and S. R. Hart (2005), FOZO,HIMU, and the rest of the mantle zoo, Geochem. Geophys.Geosyst., 6, Q05007, doi:10.1029/2004GC000824.
Thirlwall, M. F., M. A. M. Gee, R. N. Taylor, and B. J. Murton(2004), Mantle components in Iceland and adjacent ridgesinvestigated using double-spike Pb isotope ratios, Geochim.Cosmochim. Acta, 68(2), 361–386, doi:10.1016/S0016-7037(03)00424-1.
Thordarson, T., S. Self, N. Oskarsson, and T. Hulsebosch(1996), Sulfur, chlorine, and fluorine degassing and atmo-spheric loading by the 1783–1784 AD Laki (Skaftar Fires)eruption in Iceland, Bull. Volcanol., 58, 205 – 225,doi:10.1007/s004450050136.
Todt, W., R. A. Cliff, A. Hanser, and A. W. Hofmann (1996),Evaluation of a 202Pb–205Pb double spike for high-precisionlead isotope analysis, in Earth Processes: Reading the Iso-tope Code, Geophys. Monogr. Ser., vol. 95, edited by S. R.Hart and A. Basu, AGU, Washington, D. C.
Verma, S. P., and J.-G. Schilling (1982), Galapagos hot spot-spreading center system: 2. 87Sr/86Sr and large ion lithophileelement variations (85�W–101�W), J. Geophys. Res., 87,10,838–10,856, doi:10.1029/JB087iB13p10838.
Verma, S. P., J.-G. Schilling, and D. G. Waggoner (1983),Neodymium isotopic evidence for Galapagos hotspot-spreading centre system evolution, Nature, 306, 654–657,doi:10.1038/306654a0.
Vogt, P. R. (1976), Plumes, subaxial pipe flow, and topographyalong the mid-ocean ridge, Earth Planet. Sci. Lett., 29, 309–325, doi:10.1016/0012-821X(76)90135-7.
Werner, R., K. Hoernle, U. Barckhausen, and F. Hauff (2003),Geodynamic evolution of the Galapagos hot spot system(central East Pacific) over the past 20 m.y.: Constraints frommorphology, geochemistry, and magnetic anomalies, Geo-chem. Geophys. Geosyst., 4(12), 1108, doi:10.1029/2003GC000576.
West, B. P., and J. Lin (1999), Forces driving ridge propaga-tion, J. Geophys. Res., 104, 22,845–22,858, doi:10.1029/1999JB900154.
White, S. M., J. D. Meyer, R. M. Haymon, K. C. Macdonald,E. T. Baker, and J. A. Resing (2008), High-resolution sur-veys along the hot spot–affected Galapagos Spreading Cen-ter: 2. Influence of magma supply on volcanic morphology,Geochem. Geophys. Geosyst., 9, Q09004, doi:10.1029/2008GC002036.
White, W. M., A. W. Hofmann, and H. Puchelt (1987), Isotopegeochemistry of Pacific mid-ocean ridge basalts, J. Geophys.Res., 92, 4881–4893, doi:10.1029/JB092iB06p04881.
White, W. M., A. R. McBirney, and R. A. Duncan (1993),Petrology and geochemistry of the Galapagos Islands: Por-trait of a pathological mantle plume, J. Geophys. Res.,98(B11), 19,533–19,563, doi:10.1029/93JB02018.
Wilson, D. S., and R. N. Hey (1995), History of rift propaga-tion and magnetization intensity for the Cocos-Nazca spread-ing center, J. Geophys. Res., 100, 10,041– 10,056,doi:10.1029/95JB00762.
Workman, R., and S. Hart (2005), Major and trace element com-position of the depleted MORB mantle (DMM), Earth Planet.Sci. Lett., 231, 53–72, doi:10.1016/j.epsl.2004.12.005.
Zindler, A., and S. Hart (1986), Chemical geodynamics, Annu.Rev. Earth Planet. Sci., 14, 493–571, doi:10.1146/annurev.ea.14.050186.002425.
GeochemistryGeophysicsGeosystems G3G3
ingle et al.: western galapagos spreading center 10.1029/2009GC002694
30 of 30