Estimating arrival rate of nonhomogeneous Poisson processes with semidefinite programming
Upload
independentCategory
view
0download
0
Molecular Phylogenetics and Evolution 39 (2006) 237–247www.elsevier.com/locate/ympev
Phylogeography of the Galápagos hawk (Buteo galapagoensis): A recent arrival to the Galápagos Islands
Jennifer L. Bollmer a,¤, Rebecca T. Kimball b, Noah Kerness Whiteman a, José Hernán Sarasola c, Patricia G. Parker a
a Department of Biology, University of Missouri-St. Louis, St. Louis, MO 63121, USAb Department of Zoology, University of Florida, Gainesville, FL 32611, USA
c Department of Applied Biology, Estación Biológica de Doñana, 41013 Seville, Spain
Received 30 June 2005; revised 5 October 2005; accepted 9 November 2005Available online 11 January 2006
Abstract
Galápagos hawks (Buteo galapagoensis) are one of the most inbred bird species in the world, living in small, isolated island popula-tions. We used mitochondrial sequence and nuclear minisatellite data to describe relationships among Galápagos hawk populations andtheir colonization history. We sampled 10 populations (encompassing the entire current species range of nine islands and one extirpatedpopulation), as well as the Galápagos hawk’s closest mainland relative, the Swainson’s hawk (B. swainsoni). There was little sequencedivergence between Galápagos and Swainson’s hawks (only 0.42% over almost 3 kb of data), indicating that the hawks colonized Galápa-gos very recently, likely less than 300,000 years ago, making them the most recent arrivals of the studied taxa. There were only seven,closely related Galápagos hawk haplotypes, with most populations being monomorphic. The mitochondrial and minisatellite datatogether indicated a general pattern of rapid population expansion followed by genetic isolation of hawk breeding populations. Therecent arrival, genetic isolation, and phenotypic diVerentiation among populations suggest that the Galápagos hawk, a rather new speciesitself, is in the earliest stages of further divergence.© 2005 Elsevier Inc. All rights reserved.
Keywords: Buteo galapagoensis; Galápagos hawk; Minisatellite DNA; Mitochondrial DNA; Phylogeography
1. Introduction
Island archipelagos have long been valuable for under-standing evolutionary processes (Darwin, 1859; Grant,1998; Whittaker, 1998). The relatively small size and isola-tion of populations on archipelagos often results in theoccurrence of multiple, closely related yet distinct lineageson neighboring islands. There are numerous examples ofradiations occurring in a variety of taxa on island systemsaround the world (e.g., Wagner and Funk, 1995). ThereWnement of phylogenetic techniques has opened up newavenues of investigation of these systems (Emerson, 2002;Grant, 2001), revealing mainland source populations and
* Corresponding author. Fax: +1 314 516 6233.E-mail address: [email protected] (J.L. Bollmer).
1055-7903/$ - see front matter © 2005 Elsevier Inc. All rights reserved.doi:10.1016/j.ympev.2005.11.014
colonization patterns within archipelagos (e.g., Warrenet al., 2003).
The Galápagos Islands, located on the equator 1000 kmwest of mainland Ecuador, are one of the most isolatedarchipelagos in the world and thus have a high degree ofendemism. Almost a third of the plant species and half ofthe insect species are endemic (Tye et al., 2002). Fifty-ninepercent of the vertebrates are endemic, including all of thenative reptile and terrestrial mammal (rats) taxa (Tye et al.,2002). Endemism is high among the native terrestrial birds(84%) also, but it is much lower among the seabirds (26%)and shorebirds (23%; Tye et al., 2002). Though many taxahave speciated from their mainland ancestors, radiationswithin the Galápagos archipelago are relatively rare com-pared to other, older archipelagos where taxa have hadmore time to speciate (Tye et al., 2002).

238 J.L. Bollmer et al. / Molecular Phylogenetics and Evolution 39 (2006) 237–247
The islands in the Galápagos archipelago form over amantle hotspot and drift in a southeasterly direction withthe movement of the Nazca plate. The current islands rangefrom less than half a million years old in the west up to 4million years old in the east (White et al., 1993); however,older, now submerged islands indicate that islands havebeen present over the hotspot for at least 17 million years(Christie et al., 1992; Werner and Hoernle, 2003).
Radiations within Galápagos vertebrate lineages areskewed toward the reptiles and mammals, with few occur-ring among the birds (Table 1). There are about 40 recog-nized reptile taxa (including species and subspecies,depending on the latest taxonomic revisions). These 40likely arose from only 9 or 10 original lineages from themainland. The species and subspecies within taxa are gener-ally isolated on diVerent islands or volcanoes within anisland. Within the mammals, the rice rats underwent a radi-ation, while neither of the two bat species have done so.
The pattern among the terrestrial birds is distinctlydiVerent from that of the reptiles. Only two of the foundingbird lineages radiated into multiple species on the archipel-ago: the Wnches and the mockingbirds (Table 1). Two sub-species of Galápagos dove have been recognized (Swarth,1931), but the rest of the taxa (even though they are allpresent on multiple islands) have not been subdivided. So,
the 30 distinct lineages of terrestrial birds present nowarose from only 14 colonizing lineages. This is a 2:1 ratio ofcurrent to colonizing lineages, whereas the reptiles areabout 4:1. The 2:1 ratio is highly skewed by the Wnch radia-tion, the complexity of which is unique among Galápagosbirds. Excluding the Wnches, the relationship drops to 1.4:1.None of the 32 lineages of seabird or aquatic/shorebirdhave radiated within the Galápagos Islands. This strikingdiVerence between birds and reptiles has two possibleexplanations. First, birds are obviously more mobile, and sogene Xow among populations might be preventing furtherdivergence. Second, most of the bird species might have col-onized the archipelago more recently and thus have not hadtime to diverge. Both explanations are supported by thelower degree of endemism seen among the birds, especiallythe waterbirds. It is possible that the lack of diVerentiationwithin bird lineages is due to their being not as well studiedas the reptiles, but most Galápagos vertebrate lineages havebeen recognized for decades from extensive museum collec-tions (long before genetic studies on particular taxa).
1.1. Galápagos hawk
Here, we characterize the population genetic structureand colonization history of one of these terrestrial bird
Table 1Summary of terrestrial vertebrate taxa of Galápagos, including the number of lineages that evolved on the archipelago, the number of colonizing speciesfrom which they evolved, and whether they are endemic
Only native, resident taxa are listed (i.e., no introduced species or seasonal migrants), and lineages that arose in Galápagos but have since gone extinct areincluded. There are references listed where genetic studies have determined the likely number of founding events; otherwise, the numbers reXect what isbelieved based on morphological characters.
Class Taxa Number of lineages Number of founding taxa Endemic
Reptilia Giant tortoises (Geochelone nigra) 11 subspecies 1 (Caccone et al., 1999) YesMarine (Amblyrhynchus cristatus) and land (Conolophus subcristatus, C. pallidus) iguanas
7 subspecies (marine),2 species (land)
1 (Rassmann, 1997) Yes
Lava lizards (Microlophus spp.) 7 species 2 (Kizirian et al., 2004) YesGeckos (Phyllodactylus spp.) 6 species 2 (Wright, 1983) YesSnakes (Philodryas hoodensis, Antillophis slevini, A. steindachmeri, Alsophis biseralis subspp.)
3 species, 3 subspecies At most 4 Yes
Total 40 10
Mammalia Rice rats (Oryzomys spp., Nesoryzomys spp., Megaoryzomys curiori)
At least 8 species 3 Yes
Bats (Lasiurus brachyotis, L. cinerius) 2 species 2 Yes (L. brachyotis)Total 10 5
Aves Darwin’s Wnches (Geospiza spp., Camarhynchus spp., Cactospiza spp., Platyspiza crassirostris, Certhidea olivacea)
13 species 1 (Sato et al., 1999; Burns et al., 2002)
Yes
Galápagos mockingbirds (Nesomimus spp.) 4 species 1 YesGalápagos dove (Zenaida galapagoensis) 2 subspecies 1 YesGalápagos hawk (Buteo galapagoensis) 1 species 1 (this study) YesBarn owl (Tyto alba punctatissima) 1 subspecies 1 SubspeciesShort-eared owl (Asio Xammeus galapagoensis) 1 subspecies 1 SubspeciesGalápagos martin (Progne modesta) 1 species 1 YesYellow warbler (Dendroica petechia aureola) 1 subspecies 1 (Collins, 2003) SubspeciesGalápagos Xycatcher (Myiarchus magnirostris) 1 species 1 YesVermilion Xycatcher (Pyrocephalus rubinus) 1 species 1 NoDark-billed cuckoo (Coccyzus melacoryphus) 1 species 1 NoGalápagos rail (Laterallus spilonotus) 1 species 1 YesPaint-billed crake (Neocrex erythrops) 1 species 1 NoCommon gallinule (Gallinula chloropus) 1 species 1 No
Total 30 14

J.L. Bollmer et al. / Molecular Phylogenetics and Evolution 39 (2006) 237–247 239
species, the endemic Galápagos hawk (Buteo galapagoen-sis). The islands’ only diurnal raptor, this hawk is widelydistributed within the archipelago, currently inhabitingnine islands: Española, Santa Fe, Pinzón, Santiago, Isabela,Fernandina, Marchena, Pinta, and Santa Cruz. Once the“center of abundance” of the species distribution (GiVord,1919), the Santa Cruz breeding population may now beextinct, though juveniles are occasionally seen there (Boll-mer et al., 2005). To our knowledge, hawks have neverexisted on Genovesa, and their populations on Floreana(Steadman and DeLeon, 1999) and San Cristóbal wereextirpated due to human activities. Morphological studieshave been inconclusive as to the putative mainland sisterspecies of the Galápagos hawk, focusing on several NewWorld Buteo species (Brown and Amadon, 1968; Mayr andShort, 1970; Voous and de Vries, 1978). Molecular phyloge-netic studies suggest that Galápagos hawks are most closelyrelated to the Swainson’s hawk (B. swainsoni; Fleischer andMcIntosh, 2001; Riesing et al., 2003), a Neotropicalmigrant which breeds in North America but migrates annu-ally to southern South America (Fuller et al., 1998). Swain-son’s hawks are generally smaller and more slender thanGalápagos hawks, and Swainson’s adults have three colormorphs as opposed to one dark morph in adult Galápagoshawks (Ferguson-Lees and Christie, 2001).
Island-populations of Galápagos hawks have extremelylow levels of genetic variability as evidenced by mean simi-larity indices between 0.66 and 0.96 at hypervariable mini-satellite loci, and genetic variation is positively correlatedwith island area, an index of population size (Bollmer et al.,2005). There is a signiWcant amount of genetic diVerentia-tion among most populations; only two populations (Fer-nandina and Isabela) are statistically indistinguishable atminisatellite loci (Bollmer et al., 2005). Galápagos hawkpopulations vary behaviorally and morphologically (Boll-mer et al., 2003; de Vries, 1973). The hawks breed in cooper-atively polyandrous groups consisting of one female and upto eight males (DeLay et al., 1996; Faaborg and Patterson,1981), and mean group size varies across islands (Bollmer
et al., 2003). Galápagos hawks also vary in overall body sizeand shape across islands, with female mass in the smallest-bodied population averaging 22% less than in the largest-bodied population (26% in males; Bollmer et al., 2003).
In this study, we described the phylogeographic and popu-lation genetic structure of the Galápagos hawk, a species weknow to be genetically monomorphic within populations butdivergent between populations at nuclear loci. We collectedmitochondrial sequence data from all nine extant populationsof Galápagos hawk. We were also able to obtain sequencedata from a San Cristóbal hawk (a population now extir-pated) collected during the 1905–1906 California Academy ofSciences expedition. In addition, we sampled migratory Swa-inson’s hawks and investigated the degree of divergencebetween the two species to determine when the Galápagoslineage likely colonized the archipelago. Within Galápagoshawks, we examined relationships among diVerent islandpopulations at mitochondrial loci, using multilocus minisatel-lite data as a nuclear comparison, with the goal of elucidatingthe colonization history of the hawks in the archipelago.
2. Materials and methods
2.1. Field methods
We visited the Galápagos Islands for two to threemonths between May and August of each year from 1998to 2003 and sampled 541 Galápagos hawk individuals fromall nine extant populations (Table 2). We captured hawksusing balchatri traps baited with rats (Berger and Mueller,1959) and rope nooses on poles. We banded each hawk andtook morphological measurements (see Bollmer et al.,2003) and two 50 �l blood samples via venipuncture. Inaddition, we captured and sampled 34 Swainson’s hawksusing balchatri traps placed in agricultural Welds near thetown of Las Varillas, in Córdoba province (Central Argen-tina) during January 2003.
The California Academy of Sciences in San Francisco,California has a single Galápagos hawk specimen collected
Table 2Sample sizes of Galápagos and Swainson’s hawks sequenced at mitochondrial loci and Wngerprinted at minisatellite loci
A total of 26 hawks were sequenced at all four mitochondrial regions (CYB, CR, COI, and ND2). An additional 126 hawks were then sequenced at thetwo variable regions (COI 3� and CR) for a total of 152 hawks sequenced at those regions, though the San Cristóbal hawk sequence is incomplete.
Species Population No. sequencedat all regions
No. sequenced at variable regions
No. Wngerprinted at minisatellite loci
Galápagos hawk Española 2 10 10Santa Fe 2 9 9Santa Cruz 4 4 4Santiago 2 21 20Pinzón 2 10 10Marchena 2 15 15Pinta 2 13 12Isabela 4 20 19Fernandina 2 20 20San Cristóbal 0 1 0
Swainson’s hawk 4 29 0
Total 26 152 119

240 J.L. Bollmer et al. / Molecular Phylogenetics and Evolution 39 (2006) 237–247
in 1905 from the now extirpated San Cristóbal population.In order to obtain genetic data from this population, wevisited the Academy in June 2004 and excised a toe padfrom that specimen.
2.2. Laboratory methods
For most populations, we used a subset of the individu-als in the genetic analyses (Table 2). When possible, wepreferentially limited our pool of individuals to territorial,breeding adults, the class most likely to be genetically repre-sentative of the population and consist of nonrelatives[individuals within groups are unrelated (Faaborg et al.,1995)]. On Pinzón and Santa Cruz, however, we capturedonly juveniles and used all of them in the analyses. Initially,we sequenced 26 hawks (Table 2) at four mitochondrialregions comprising 2860 bp. This included completeNADH dehydrogenase subunit 2 (ND2) sequences(1041 bp), 320 bases at the 3� end of cytochrome b (CYB),72 bp between CYB and the control region (CR), includingtRNAthr, 415 bp of the 5� end of CR (66 bp of the 5� end ofCR were problematic to sequence and are excluded fromanalyses), and 516 bp near the 5� end and 496 bp near the 3�end of cytochrome oxidase (COI). Among the Galápagoshawks sampled, most regions were invariant in this initialsample; therefore, we sampled 126 additional individuals(Table 2; 123 Galápagos and 29 Swainson’s hawks) at onlythe variable 3� end of COI and 415 bp of the CR.
The majority of sequences were single-stranded, thoughwe obtained double-stranded sequences from those individ-uals where all gene regions were ampliWed, and forsequences where there were uncertainties. Table 3 lists theprimers used to amplify and sequence the CYB-CR, COI,and ND2 regions. Unless noted, primers are named to indi-cate light (L) or heavy (H) strand and the 3� position of theprimer numbered according to the complete mitochondrialgenome of Gallus gallus (Desjardins and Morais, 1990). TheCYB-CR region was ampliWed with L15662 and H15414(name indicates the 3� end of the primer numbered accord-
ing to the complete mitochondrion of Buteo buteo). To dou-ble-strand sequences, we used the internal primers H16065and L15004 (name indicates the 3� end of the primer num-bered according to the complete mitochondrion of Buteobuteo). COI was ampliWed in two reactions. The 5� regionwas ampliWed with L6615 and H7539, and sequencing wasdone using L6615 or H7181. The 3� region of COI wasampliWed with L7201 and H8214; sequencing was doneusing L7651 and H8214. ND2 sequences were obtained byamplifying and sequencing with primers L5216 and H6313.Sequences were double-stranded with internal primersL5716 and H5766.
PCR ampliWcation followed standard protocols. WepuriWed amplicons by precipitation using an equal volumeof PEG:NaCl (20%:2.5 M) and washing with 70% ethanol.We sequenced puriWed amplicons using either ABI BigDyeTerminator v.1.0, BigDye Terminator v.3.1, or BeckmanDTCS Quickstart chemistries. Manufacturers’ recommen-dations were followed, except reaction volumes were cut to1/2–1/6 of the recommended volume. Sequences were ana-lyzed on an ABI Prism 310, ABI Prism 3100-Avant geneticanalyzer (PE Applied Biosystems), or a CEQ 8000 (Beck-man–Coulter) genetic analysis system.
The 100-year-old San Cristóbal sample was processed ina laboratory dedicated to working with ancient DNA at theFlorida Museum of Natural History located at the Univer-sity of Florida. We extracted DNA from the toe pad andampliWed the appropriate regions in the ancient DNA labo-ratory. Due to the poorer quality of the ancient DNA, weneeded to sequence the regions in smaller segments usingadditional primers designed from Galápagos hawksequences (primer sequences available from RTK uponrequest).
We performed multilocus minisatellite DNA Wngerprint-ing using the restriction endonuclease HaeIII and JeVreys’probe 33.15 (JeVreys et al., 1985) following proceduresdescribed in general in Parker et al. (1995) and speciWcallyfor Galápagos hawks in Bollmer et al. (2005). We visualizedhybridized Wngerprints using a Storm 820 Phosphorimager.
Table 3Primers used in this study to amplify and sequence three hawk mitochondrial regions
Region Primer Source Sequence (5�–3�) TM
CYB-CR L15662 Kimball et al. (1999) CTAGGCGACCCAGAAAACTT 54 °C, 30 sH15414 This study CAAGTAGTGCTAGGGGTTTAGGL15004 This study CACATATCATGAACTATTATGGG Seq. onlyH16065 Kimball et al. (1999) TTCAGTTTTTGGTTTACAAGAC Seq. only
COI L6615 ModiWed from Sorenson et al. (1999) TCTGTAAAAAGGACTACAGCC 52 °C, 30 sH7539 Sorenson et al. (1999) GATGTAAAGTAGGCCGGGTGTCTACH7181 This study TACGAATAGGGGTGTTTGG Seq. onlyL7201 This study ACCAAACACCCCTATTCGTATG 54 °C, 30 sH8214 This study ATGCRGYTGGCTTGAAACC 54 °C, 30 sL7651 This study GGAACTATCAAATGAGACCC Seq. only
ND2 L5216 Sorenson et al. (1999) GCCCATACCCCRAAAATG 52 °C, 30 sH6313 Sorenson et al. (1999) CCTTATTTAAGGCTTTGAAGGCL5716 This study CCCTACTYACCYTCCTAGCAAT Seq. onlyH5766 ModiWed from Sorenson et al. (1999) GATGARAAGGCTAGGATYTTTCG Seq. only

J.L. Bollmer et al. / Molecular Phylogenetics and Evolution 39 (2006) 237–247 241
We Wngerprinted a total of 119 of the 122 Galápagos hawkssequenced at the variable mitochondrial loci (Table 2).From the resulting banding patterns, we created a pres-ence–absence matrix of bands (alleles) encompassing allindividuals.
2.3. Data analysis
We examined and compared sequences using Sequen-cher 4.1 (Gene Codes). We used DnaSP v. 4.0.5 (Rozaset al., 2003) to calculate within-population genetic diversityindices: haplotype diversity (Nei, 1987) and nucleotidediversity (�; Nei, 1987). We generated a 95% statistical par-simony-based haplotype network using TCS v. 1.18 (Clem-ent et al., 2000). Mean genetic distances (number of variablesites and uncorrected p-distances) within and between spe-cies were calculated using MEGA v. 2.1 (Kumar et al.,2001). Standard errors were calculated via bootstrapping(500 replicates). When the level of genetic diVerentiationbetween populations was ambiguous, we used pairwisediVerences to calculate FST values in Arlequin version 2.000(Schneider et al., 2000).
To estimate divergence times, we assumed the mitochon-drial protein-coding regions were diverging at 2% per mil-lion years (Shields and Wilson, 1987). There were sixdiVerences between Galápagos and Swainson’s hawks (sitesinvariant within each species but variable between them) inthe 2373 bp of protein-coding data used to determine diver-gence time: 3 in ND2, 1 in CYB, 1 in COI 5�, and 1 in COI3�. There were other variable sites where some individualsfrom both species shared the same nucleotide, but thesewere not used to calculate the divergence between the twospecies. We estimated a 95% conWdence interval for thedivergence time assuming a Poisson model of evolution(e.g., Braun and Kimball, 2001). While this method does notcorrect for ancestral polymorphism, we were primarilyinterested in setting an upper limit on divergence time,making a correction unnecessary.
For the nuclear minisatellite data, pairwise similarityvalues were calculated from the presence–absence matrix(based on 46 characters) using the program GELSTATS v.2.6 (Rogstad and Pelikan, 1996). Similarity values, the pro-portion of bands shared between any two individuals(Lynch, 1990), were converted to distances (1¡ similarityvalue). We used the distances to construct a neighbor-join-ing tree in PAUP* v. 4.0b10 (SwoVord, 2002), using mid-point rooting and constraining it to non-negative branchlengths.
3. Results
3.1. Haplotype variation within and between Galápagos and Swainson’s hawks
Sequence data are available in GenBank Accession Nos.AY870866–AY870892. For the 26 individuals sequenced atthe four mitochondrial regions, polymorphic sites were
present in only two of those regions, the CR and the 3� endof COI (911 bp total), while the other regions (1949 bptotal) were invariant within each species, diVering by 5 bpbetween species. Among the 151 individuals (excluding theSan Cristóbal hawk) sequenced for the two variableregions, there were only 27 variable sites across all individu-als: 6 found only within the 122 Galápagos hawks sampled,16 only within the 29 Swainson’s hawks, 3 in both species,and 2 monomorphic within species but variable betweenthem (Table 4). There were a total of 19 haplotypessequenced, 7 among the 122 Galápagos hawks and 12among the 29 Swainson’s hawks, indicating greater geneticvariability in the Swainson’s hawks (Tables 4 and 5). Theseven Galápagos hawk haplotypes diVered from each otherby an average of 3.14§ 1.07 (SE) bases (mean uncorrectedp-distance of 0.003§0.001), while the 12 Swainson’s hawkhaplotypes diVered by an average of 4.55§ 1.10 bases(mean p-distance of 0.005§0.001). The p-distances withinGalápagos hawks ranged from 0 to 0.007, while they rangedfrom 0 to 0.011 in the Swainson’s hawks. Including all thesampled individuals, the mean uncorrected p-distance was0.002§0.001 within Galápagos hawks and 0.003§0.001within Swainson’s hawks. Galápagos and Swainson’s hawkhaplotypes diVered from each other by an average of10.43§2.46 bases, with a mean p-distance of 0.011§ 0.003,and p-distances ranged from 0.005 to 0.015. The smallest
Table 4The polymorphic sites within the variable COI 3� and CR regions of theGalápagos and Swainson’s hawk mitochondrial DNA
Of the 911 bp sequenced at the COI 3� and CR regions, there were 27 vari-able sites. The sites are numbered according to their position within ourcombined COI and CR dataset; positions 1–496 are COI sites and posi-tions 497–911 are CR sites. Each Galápagos hawk haplotype is labeledwith a symbol corresponding to the symbols in Figs. 1 and 2. Each Swain-son’s hawk haplotype is labeled with a letter corresponding to the letters inFig. 1.
1 2 2 4 5 6 6 6 6 6 6 6 7 7 7 7 7 7 7 7 7 7 7 7 7 7
2 7 0 0 4 7 1 1 1 1 5 6 7 0 0 0 1 1 1 2 2 2 2 3 4 6 72 1 1 7 3 3 0 2 6 8 6 8 7 7 8 9 2 4 9 0 1 4 7 1 4 4 0
Galápagos hawks� CTGAT CACCA TGTCT TGAGA CGTTTAC� TTGGT CACCA TGTCT TGAGA CGTTTAC� TTGGT CGTCA TGTCT TGAGA CGTTTAC� TTAGT CGCCA TGTCT TGAGT TGTTTAC� TTAGT CGCCA TGTCT TGAGA CGTTTAC� TTGGT TGCCA TGTCT TGAGA CGTTTAC+ TTGGC TGCCA TGTCT TGAGA CGTTTAC
Swainson’s hawksA TTGGC CACCA TGTCT TAGGA CATCTGTB TTGGC CACTG TGTCT TGGGA TATTTGTC TTGGC CACCA TGTCT TAAGA CATTTGTD TCGGC CACCA TGTTT CAAGA CATTTGTE TTGGC CACCA TATTC TAAGA CATTCGTF TTGGC CACCA TGCTC TAAGA CATTCGTG TTGGC CACCA TGCTC TAAGA CACTCGTH TTGGC CACCA CGCTC TAAGA CATTCGTI TTGGC CACCA TGCTC TAAGT CATTCGTJ TTGGC CACCA TGCTC TAAAA CATTCGTK TTGGC TACCA TGCTC TAAGA CATTCGTL TTGGC CACCA TGCTC TAAGA CGTTCGT

242 J.L. Bollmer et al. / Molecular Phylogenetics and Evolution 39 (2006) 237–247
p-distance between Galápagos and Swainson’s hawks(0.005) is less than the largest distance within either one ofthem (0.007 in Galápagos and 0.011 in Swainson’s hawks).Including all the sampled individuals, Galápagos and Swa-inson’s hawks diVered by an average of 10.20§2.75 bases,with a mean p-distance of 0.011§ 0.003.
Using DnaSP, we inferred the amino acid sequencesfrom 492 of the 496 bp at the 3� end of COI, which resultedin 164 codons in an open reading frame. Interestingly,within the 122 Galápagos hawks, of the Wve nucleotide sub-stitutions, four were nonsynonymous and one was synony-mous. Within the 29 Swainson’s hawks, the only mutationin this region was synonymous.
Using a divergence rate of 2% per million years for the2373 bp of coding DNA (Shields and Wilson, 1987), Galá-pagos and Swainson’s hawks diverged approximately126,000 years ago, with a 95% conWdence interval between51,000 and 254,000 years ago. While there is a large amountof error in molecular clock estimates (Arbogast et al., 2002;Lovette, 2004), our estimate still indicates that Galápagoshawks arrived in Galápagos very recently, likely less than300,000 years ago.
3.2. Divergence among Galápagos hawk populations
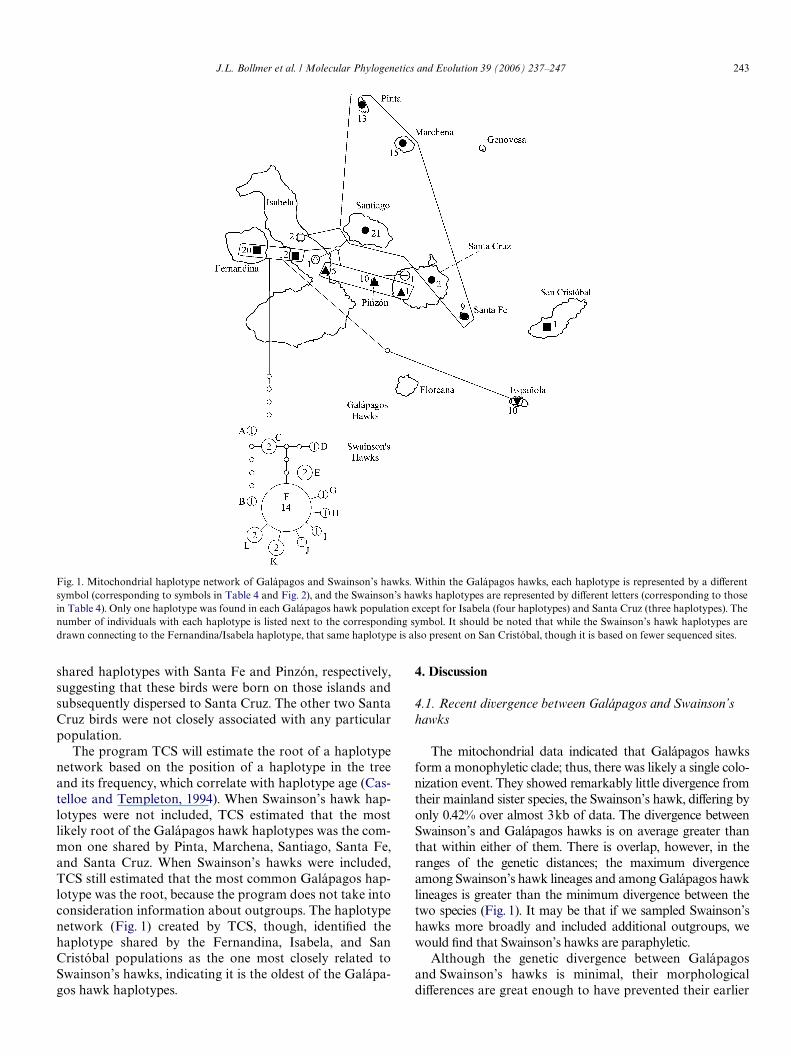
There were only seven mitochondrial haplotypes presentacross the nine extant Galápagos hawk populations; multiplehaplotypes were present in two populations (Isabela andSanta Cruz), while the other seven populations were Wxed(Fig. 1). Three haplotypes were present on multiple islands.One (black circles in Fig. 1) was found in all individuals fromthe northern and central islands of Pinta, Marchena, Santi-ago, and Santa Fe, and in two of the four Santa Cruz birds.The second haplotype (black triangles) was shared among allPinzón individuals, as well as Wve individuals from Isabelaand one from Santa Cruz. The third haplotype (blacksquares) was found in all Fernandina individuals, the major-ity of the sampled individuals from Isabela, and the SanCristóbal individual (see below). The remaining four haplo-types were unique to individual islands: one present in allEspañola individuals, one in a single Santa Cruz individual,and two in three Isabela individuals. Interestingly, one Isa-bela haplotype was more similar to the common haplotype
present on the Wve central and northern islands than it was toother Isabela haplotypes. The genetic distances between pop-ulations were small, with the average number of base pairdiVerences ranging from 0 to 4.25 (mean uncorrected p-dis-tances ranging from 0 to 0.005).
Due to the degraded nature of the San Cristóbal sample,we sequenced a subset of the COI 3� and CR regions. Wewere able to sequence 281 of the 496 bp of COI 3� and 308of the 415 bp of the CR, covering 65% of the 911 bpsequenced from the other individuals. These two fragmentsencompassed all but one of the sites that were variable inthe other Galápagos hawks; the one missing site was a sitethat separated the Española haplotype from all the rest ofthe haplotypes, including the Swainson’s haplotypes (sitenumber 22 in Table 4). At the regions sequenced, the SanCristóbal haplotype was identical to the Fernandina/Isa-bela haplotype. While we cannot rule out possible variablesites in the 311 bp not sequenced for the San Cristóbalhawk, the rest of the Galápagos haplotypes were all mono-morphic at those sites (except for site 22). It is likely thatthis individual is representative of the former population onSan Cristóbal given that seven of the other nine popula-tions were Wxed for a single haplotype.
We calculated FST values between Isabela and Fernan-dina and Isabela and Pinzón, because Fernandina and Pin-zón were each Wxed for haplotypes present on Isabela,though Isabela had additional haplotypes. Both Fernan-dina (FSTD0.216, P < 0.01) and Pinzón (FSTD 0.451,P < 0.01) were signiWcantly diVerentiated from Isabela.
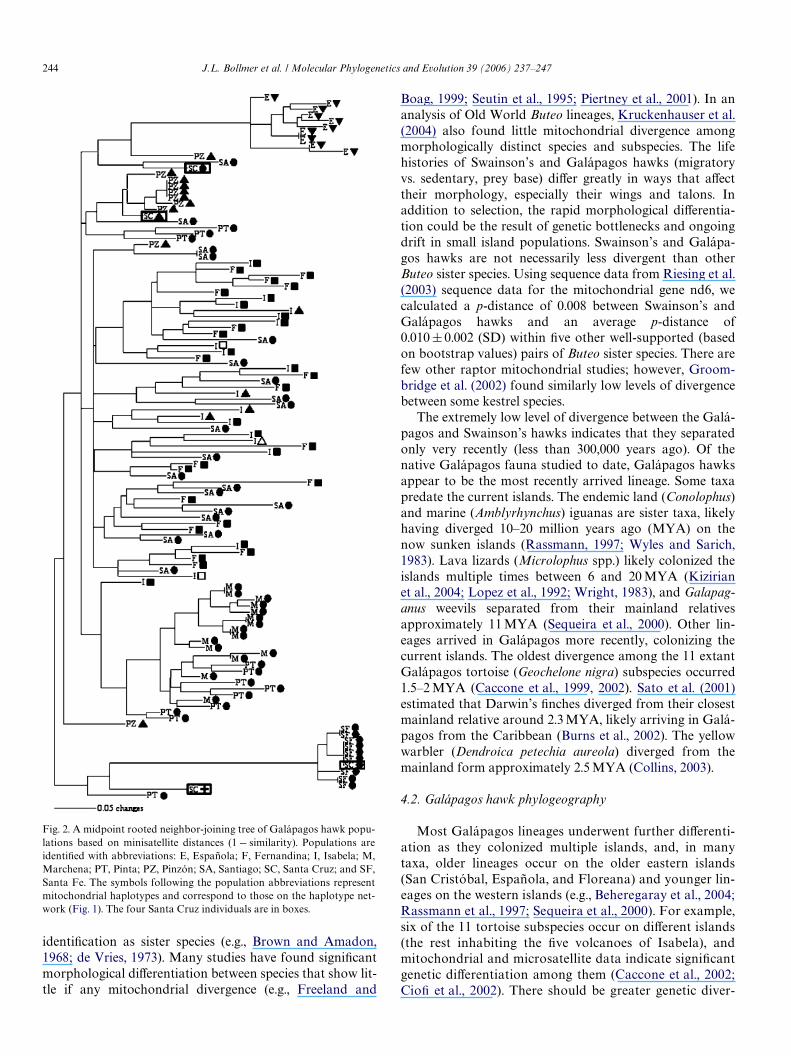
The minisatellite data indicated some diVerentiationamong populations (Fig. 2). Española and Santa Fe indi-viduals formed independent, distinct clusters. Most of thePinzón individuals also clustered, though not as distinctlyas those from Española and Santa Fe. Marchena andPinta individuals generally clustered together, with somediVerentiation between them. Only individuals from San-tiago, Isabela, and Fernandina, the three largest and mostvariable populations, were indistinguishable from eachother.
The four Santa Cruz birds were widely distributed in thetree. One individual fell within the Santa Fe cluster, havinga banding pattern identical to four Santa Fe individuals.Another fell within the Pinzón cluster. These two birds also
Table 5Genetic variability at Wve mitochondrial regions within Galápagos (N D 122; excluding the San Cristóbal hawk) and Swainson’s (N D 29) hawks
CYB, ND2, COI 5� (1949 bp)
COI 3� (496 bp) CR (415 bp) COI 3�/CR combined (911 bp)
B. galapagoensisNo. of polymorphic sites 0 4 5 9Nucleotide diversity 0 0.0017 0.0019 0.0018No. of haplotypes 1 4 5 7Haplotype diversity (§SD) 0 0.578§ 0.023 0.625§ 0.025 0.671 § 0.030
B. swainsoniNo. of polymorphic sites 0 1 18 19Nucleotide diversity 0 0.0001 0.0059 0.0028No. of haplotypes 1 2 12 12Haplotype diversity (§SD) 0 0.069§ 0.063 0.766§ 0.081 0.766 § 0.081
J.L. Bollmer et al. / Molecular Phylogenetics and Evolution 39 (2006) 237–247 243
shared haplotypes with Santa Fe and Pinzón, respectively,suggesting that these birds were born on those islands andsubsequently dispersed to Santa Cruz. The other two SantaCruz birds were not closely associated with any particularpopulation.
The program TCS will estimate the root of a haplotypenetwork based on the position of a haplotype in the treeand its frequency, which correlate with haplotype age (Cas-telloe and Templeton, 1994). When Swainson’s hawk hap-lotypes were not included, TCS estimated that the mostlikely root of the Galápagos hawk haplotypes was the com-mon one shared by Pinta, Marchena, Santiago, Santa Fe,and Santa Cruz. When Swainson’s hawks were included,TCS still estimated that the most common Galápagos hap-lotype was the root, because the program does not take intoconsideration information about outgroups. The haplotypenetwork (Fig. 1) created by TCS, though, identiWed thehaplotype shared by the Fernandina, Isabela, and SanCristóbal populations as the one most closely related toSwainson’s hawks, indicating it is the oldest of the Galápa-gos hawk haplotypes.
4. Discussion
4.1. Recent divergence between Galápagos and Swainson’s hawks
The mitochondrial data indicated that Galápagos hawksform a monophyletic clade; thus, there was likely a single colo-nization event. They showed remarkably little divergence fromtheir mainland sister species, the Swainson’s hawk, diVering byonly 0.42% over almost 3kb of data. The divergence betweenSwainson’s and Galápagos hawks is on average greater thanthat within either of them. There is overlap, however, in theranges of the genetic distances; the maximum divergenceamong Swainson’s hawk lineages and among Galápagos hawklineages is greater than the minimum divergence between thetwo species (Fig. 1). It may be that if we sampled Swainson’shawks more broadly and included additional outgroups, wewould Wnd that Swainson’s hawks are paraphyletic.
Although the genetic divergence between Galápagosand Swainson’s hawks is minimal, their morphologicaldiVerences are great enough to have prevented their earlier
Fig. 1. Mitochondrial haplotype network of Galápagos and Swainson’s hawks. Within the Galápagos hawks, each haplotype is represented by a diVerentsymbol (corresponding to symbols in Table 4 and Fig. 2), and the Swainson’s hawks haplotypes are represented by diVerent letters (corresponding to thosein Table 4). Only one haplotype was found in each Galápagos hawk population except for Isabela (four haplotypes) and Santa Cruz (three haplotypes). Thenumber of individuals with each haplotype is listed next to the corresponding symbol. It should be noted that while the Swainson’s hawk haplotypes aredrawn connecting to the Fernandina/Isabela haplotype, that same haplotype is also present on San Cristóbal, though it is based on fewer sequenced sites.
244 J.L. Bollmer et al. / Molecular Phylogenetics and Evolution 39 (2006) 237–247
identiWcation as sister species (e.g., Brown and Amadon,1968; de Vries, 1973). Many studies have found signiWcantmorphological diVerentiation between species that show lit-tle if any mitochondrial divergence (e.g., Freeland and
Fig. 2. A midpoint rooted neighbor-joining tree of Galápagos hawk popu-lations based on minisatellite distances (1 ¡ similarity). Populations areidentiWed with abbreviations: E, Española; F, Fernandina; I, Isabela; M,Marchena; PT, Pinta; PZ, Pinzón; SA, Santiago; SC, Santa Cruz; and SF,Santa Fe. The symbols following the population abbreviations representmitochondrial haplotypes and correspond to those on the haplotype net-work (Fig. 1). The four Santa Cruz individuals are in boxes.
Boag, 1999; Seutin et al., 1995; Piertney et al., 2001). In ananalysis of Old World Buteo lineages, Kruckenhauser et al.(2004) also found little mitochondrial divergence amongmorphologically distinct species and subspecies. The lifehistories of Swainson’s and Galápagos hawks (migratoryvs. sedentary, prey base) diVer greatly in ways that aVecttheir morphology, especially their wings and talons. Inaddition to selection, the rapid morphological diVerentia-tion could be the result of genetic bottlenecks and ongoingdrift in small island populations. Swainson’s and Galápa-gos hawks are not necessarily less divergent than otherButeo sister species. Using sequence data from Riesing et al.(2003) sequence data for the mitochondrial gene nd6, wecalculated a p-distance of 0.008 between Swainson’s andGalápagos hawks and an average p-distance of0.010§0.002 (SD) within Wve other well-supported (basedon bootstrap values) pairs of Buteo sister species. There arefew other raptor mitochondrial studies; however, Groom-bridge et al. (2002) found similarly low levels of divergencebetween some kestrel species.
The extremely low level of divergence between the Galá-pagos and Swainson’s hawks indicates that they separatedonly very recently (less than 300,000 years ago). Of thenative Galápagos fauna studied to date, Galápagos hawksappear to be the most recently arrived lineage. Some taxapredate the current islands. The endemic land (Conolophus)and marine (Amblyrhynchus) iguanas are sister taxa, likelyhaving diverged 10–20 million years ago (MYA) on thenow sunken islands (Rassmann, 1997; Wyles and Sarich,1983). Lava lizards (Microlophus spp.) likely colonized theislands multiple times between 6 and 20 MYA (Kizirianet al., 2004; Lopez et al., 1992; Wright, 1983), and Galapag-anus weevils separated from their mainland relativesapproximately 11 MYA (Sequeira et al., 2000). Other lin-eages arrived in Galápagos more recently, colonizing thecurrent islands. The oldest divergence among the 11 extantGalápagos tortoise (Geochelone nigra) subspecies occurred1.5–2 MYA (Caccone et al., 1999, 2002). Sato et al. (2001)estimated that Darwin’s Wnches diverged from their closestmainland relative around 2.3 MYA, likely arriving in Galá-pagos from the Caribbean (Burns et al., 2002). The yellowwarbler (Dendroica petechia aureola) diverged from themainland form approximately 2.5 MYA (Collins, 2003).
4.2. Galápagos hawk phylogeography
Most Galápagos lineages underwent further diVerenti-ation as they colonized multiple islands, and, in manytaxa, older lineages occur on the older eastern islands(San Cristóbal, Española, and Floreana) and younger lin-eages on the western islands (e.g., Beheregaray et al., 2004;Rassmann et al., 1997; Sequeira et al., 2000). For example,six of the 11 tortoise subspecies occur on diVerent islands(the rest inhabiting the Wve volcanoes of Isabela), andmitochondrial and microsatellite data indicate signiWcantgenetic diVerentiation among them (Caccone et al., 2002;CioW et al., 2002). There should be greater genetic diver-

J.L. Bollmer et al. / Molecular Phylogenetics and Evolution 39 (2006) 237–247 245
gence among the older lineages due to a longer period ofisolation. In the tortoises, diVerences among populationsexplain 97% of mitochondrial molecular variance forolder islands and only 60% for younger islands (Beherega-ray et al., 2004). Within geckos (Phyllodactylus spp.) andlava lizards, Wright (1983) found that the populations onthe central and western islands tended to have higher allo-zyme similarities than the more divergent populations tothe east.
The Galápagos hawk haplotype network shows a strik-ing pattern of genetic monomorphism within populationsand short genetic distances among populations at themitochondrial loci. Four diVerent populations (Santa Fe,Santiago, Marchena, and Pinta) comprising 58 sampledindividuals were Wxed for a single haplotype. Fernandina,Pinzón, and Española were also Wxed but for diVerenthaplotypes. Only the populations on Isabela and SantaCruz had any variability. Española hawks in the east havethe highest mean genetic distance from the other popula-tions; however, Española is not necessarily the oldest pop-ulation, but instead may have become the Wrst populationto be isolated from the rest. The paucity of diVerent hap-lotypes and the small genetic distances among them sug-gests the hawks spread across the archipelago relativelyquickly, with subsequent lineage sorting resulting indiVerent haplotypes on diVerent islands. The pattern onIsabela, with haplotypes that are not most closely relatedto each other, and the presence of the same haplotype onSan Cristóbal as on Fernandina (at opposite ends of thearchipelago) further supports this. It is diYcult to sayfrom which direction the initial hawk colonization of thearchipelago occurred; the Swainson’s hawks were mostclosely related to the Fernandina/Isabela/San Cristóbalhaplotype that was located on the far eastern and westernislands. Limitations due to lineage sorting and possiblehomoplasy prevent a more deWnitive determination of thecolonization pattern. Our understanding is also hinderedby the missing information from the extirpated Floreanapopulation, and our four samples from Santa Cruz (themost central island) are likely not representative of theformer population there (see next section).
The role of genetic drift in these island populations wasalso demonstrated by the Wnding that the majority of nucle-otide substitutions in the 3� end of COI within Galápagoshawks were nonsynonymous. This Wnding is unsurprisingfrom a theoretical perspective, given that slightly deleteri-ous mutations with respect to Wtness are expected to drift toWxation at a higher rate within small populations relative tolarger populations (reviewed in Johnson and Seger, 2001).This qualitative interpretation is supported further by anempirical study by Johnson and Seger (2001) which foundelevated rates of nonsynonymous substitutions on lineagesof island bird taxa compared to their mainland relatives.Finally, the fact that Galápagos hawks have very smallisland populations, the majority of which are geneticallyisolated (Bollmer et al., 2005) also lends support for the roleof drift in generating these patterns.
4.3. Mitochondrial vs. nuclear diVerentiation among populations
Mitochondrial and nuclear markers can often be usedin conjunction to draw more accurate conclusions aboutgenetic structure. The eastern population on Españolawas clearly genetically isolated at both mitochondrial andminisatellite loci. The central and northern populations(Santa Fe, Santiago, Marchena, and Pinta) share a com-mon mitochondrial haplotype even though our pairwiseFST estimates show signiWcant diVerentiation among themat the more rapidly evolving minisatellite loci (Bollmeret al., 2005). The western populations of Fernandina andIsabela, less than 5 km apart, were statistically indistin-guishable at minisatellite loci (Bollmer et al., 2005) andshared a mitochondrial haplotype; moreover, one femalehawk banded as a juvenile on Isabela (Volcan Alcedo) in1998 was observed in a territorial group on Fernandina in2003, though we do not know which is its natal island(Bollmer et al., 2005). The presence of other haplotypes onIsabela, however, resulted in a signiWcant FST valuebetween them for the mitochondrial data. This discrep-ancy between the nuclear and mitochondrial data couldbe due to male-biased gene Xow, though we have no otherevidence that this occurs. Another explanation is that it isdue to the diVering natures of the two markers. Santiago,Isabela, and Fernandina are the largest of the hawk popu-lations and have retained the most genetic variability. Thefact that they are more distinguishable at mitochondrialloci than at minisatellite loci could be attributed to theshorter coalescent time of the mitochondrial loci, thusallowing signiWcant genetic structuring to arise morequickly.
The combined mitochondrial and nuclear data can alsobe used to determine the populations of origin of dispersers,which is of potential conservation importance, both fromthe perspective of disease transmission and populationmanagement. Given the apparent absence of a breedingpopulation on Santa Cruz, both the mitochondrial and theminisatellite data suggest that the four Santa Cruz juvenilesare likely dispersers from diVerent islands. One was verylikely born on Pinzón and one on Santa Fe; both theirminisatellite and mitochondrial proWles are consistent withthat. The origin of the other two individuals is less clear.Neither of them is closely associated with any of the moreinbred populations at the minisatellite loci, leaving Fernan-dina, Isabela, and Santiago as possible source populations.One shares the same haplotype as Santiago; the other has aunique haplotype that is most closely related to the oneshared by Isabela and Pinzón. Given the genetic monomor-phism on Pinzón, the latter bird more likely originated onIsabela.
Taking both the nuclear and mitochondrial data intoaccount, the overall pattern among Galápagos hawk popu-lations is one of genetic isolation. The Santa Cruz popula-tion is certainly an exception in that juveniles appear tobe dispersing there, and there may be gene Xow between

246 J.L. Bollmer et al. / Molecular Phylogenetics and Evolution 39 (2006) 237–247
Fernandina and Isabela, since they are indistinguishable atthe nuclear loci (though not at the mitochondrial loci). Allthe other populations show statistically signiWcant diver-gence at nuclear or mitochondrial loci or both. This, com-bined with the morphological diVerentiation amongpopulations and the recentness of its arrival, may mean thatthe Galápagos hawk is in the very early stages of speciation.The much older Wnch colonization of the archipelagoresulted in fourteen morphological species; however, mito-chondrial data only distinguished four groups (Sato et al.,1999), and interspeciWc genetic distances at microsatelliteloci were generally lower among sympatric populationsthan among allopatric populations, likely due to introgres-sive hybridization (Grant et al., 2005). Galápagos hawksare less vagile, and most of their populations, like thoseof other sedentary species in the archipelago (e.g., tortoises,lava lizards), appear to be on separate evolutionarytrajectories. Although the colonization history of the Galá-pagos hawk remains unclear, reconstructing the genealo-gies of its parasites (de Vries, 1975; Whiteman and Parker,2005) may yield insight into the hosts’ movements withinthe archipelago.
Acknowledgments
We would like to thank Tj. de Vries, J. C. Bednarz, T.Sanchez, D. Sanchez, S. Struve, B. Cannon, K. Huyvaert, K.Levenstein, G. Jimenez, P. Jimenez, A. Lara, P. Castillo, G.Scacco, D. Santiago, and P. Sanchez for their help collect-ing blood samples. A. Cox and B. Burkley assisted in thelab. We would like to thank J. Dumbacher at the CaliforniaAcademy of Sciences for allowing us to sample fromamong their specimens and J. Kirchman for processing theSan Cristóbal sample. R. Dowler provided informationabout the native rats. The Charles Darwin Research Sta-tion and the Galápagos National Park gave permission forthis project and provided logistical support. Personnel fromEa. La Independencia and the Agencia Córdoba Ambienteprovided permission for trapping in Argentina. Also,TAME provided discounted Xights to Galápagos. Thiswork was funded by the National Science Foundation(Grant No. INT-9722735; Dissertation EnhancementGrant No. INT-030759 to P.G.P. and N.K.W.), theNational Geographic Society (Grant No. 6821-00), theInternational Center for Tropical Ecology, and the SaintLouis Zoo’s Field Research for Conservation Program.J.H.S. was funded by the Consejo Nacional de Investigaci-ones CientíWcas y Técnicas (CONICET) of Argentina.
References
Arbogast, B.S., Edwards, S.V., Wakeley, J., Beerli, P., Slowinski, J.B., 2002.Estimating divergence times from molecular data on phylogenetic andpopulation genetic timescales. Ann. Rev. Ecol. Syst. 33, 707–740.
Beheregaray, L.B., Gibbs, J.P., Havill, N., Fritts, T.H., Powell, J.R., Cac-cone, A., 2004. Giant tortoises are not so slow: rapid diversiWcation andbiogeographic consensus in the Galápagos. Proc. Natl. Acad. Sci. USA101, 6514–6519.
Berger, D.D., Mueller, H.C., 1959. The bal-chatri: a trap for the birds ofprey. Bird Banding 30, 18–26.
Bollmer, J.L., Whiteman, N.K., Donaghy Cannon, M., Bednarz, J.C., deVries, Tj., Parker, P.G., 2005. Population genetics of the Galápagoshawk (Buteo galapagoensis): genetic monomorphism within isolatedpopulations. Auk 122, 1210–1224.
Bollmer, J.L., Sanchez, T., Donaghy Cannon, M., Sanchez, D., Cannon, B.,Bednarz, J.C., de Vries, Tj., Struve, M.S., Parker, P.G., 2003. Variationin morphology and mating system among island populations of Galá-pagos Hawks. Condor 105, 428–438.
Braun, E.L., Kimball, R.T., 2001. Polytomies, the power of phylogeneticinference, and the stochastic nature of molecular evolution: a commenton Walsh et al. (1999). Evolution 55, 1261–1263.
Brown, L.H., Amadon, D., 1968. Eagles, Hawks, and Falcons of the World.McGraw-Hill, New York.
Burns, K.J., Hackett, S.J., Klein, N.K., 2002. Phylogenetic relationshipsand morphological diversity in Darwin’s Wnches and their relatives.Evolution 56, 1240–1252.
Caccone, A., Gentile, G., Gibbs, J.P., Fritts, T.H., Snell, H.L., Betts, J., Pow-ell, J.R., 2002. Phylogeography and history of giant Galápagos tor-toises. Evolution 56, 2052–2066.
Caccone, A., Gibbs, J.P., Ketmaier, V., Suatoni, E., Powell, J.R., 1999. Ori-gin and evolutionary relationships of giant Galápagos tortoises. Proc.Natl. Acad. Sci. USA 96, 13223–13228.
Castelloe, J., Templeton, A.R., 1994. Root probabilities for intraspeciWcgene trees under neutral coalescent theory. Mol. Phylogenet. Evol. 3,102–113.
Christie, D.M., Duncan, R.A., McBirney, A.R., Richards, M.A., White,W.M., Harpp, K.S., Fox, C.G., 1992. Drowned islands downstreamfrom the Galápagos hotspot imply extended speciation times. Nature355, 246–248.
CioW, C., Milinkovitch, M.C., Gibbs, J.P., Caccone, A., Powell, J.R., 2002.Microsatellite analysis of genetic divergence among populations ofgiant Galápagos tortoises. Mol. Ecol. 11, 2265–2283.
Clement, M., Posada, D., Crandall, K.A., 2000. TCS: a computer programto estimate gene genealogies. Mol. Ecol. 9, 1657–1659.
Collins, E.I., 2003. Genetic Variation of Yellow Warblers, Dendroica pete-chia, in Galápagos, Ecuador. MS thesis, Wake Forest University, Win-ston-Salem, North Carolina.
Darwin, C., 1859. On the Origin of Species by Means of Natural Selection.Murray, London.
DeLay, L.S., Faaborg, J., Naranjo, J., Paz, S.M., de Vries, Tj., Parker, P.G.,1996. Paternal care in the cooperatively polyandrous Galápagos Hawk.Condor 98, 300–311.
Desjardins, P., Morais, R., 1990. Sequence and gene organization of thechicken mitochondrial genome: a novel gene order in higher verte-brates. J. Mol. Biol. 212, 599–634.
de Vries, Tj., 1973. The Galápagos Hawk, an Eco-geographical Study withSpecial Reference to Its Systematic Position. PhD thesis, Vrije Univer-sity, Amsterdam.
de Vries, Tj., 1975. The breeding biology of the Galápagos hawk, Buteogalapagoensis. Le Gerfaut 65, 29–57.
Emerson, B.C., 2002. Evolution on oceanic islands: molecular phylogeneticapproaches to understanding pattern and process. Mol. Ecol. 11, 951–966.
Faaborg, J., Patterson, C.B., 1981. The characteristics and occurrence ofcooperative polyandry. Ibis 123, 477–484.
Faaborg, J., Parker, P.G., DeLay, L., de Vries, Tj., Bednarz, J.C., Paz, S.M.,Naranjo, J., Waite, T.A., 1995. ConWrmation of cooperative polyandryin the Galápagos hawk (Buteo galapagoensis). Behav. Ecol. Sociobiol.36, 83–90.
Ferguson-Lees, J., Christie, D.A., 2001. Raptors of the World. HoughtonMiZin, New York.
Fleischer, R.C., McIntosh, C.E., 2001. Molecular systematics and biogeog-raphy of the Hawaiian avifauna. Stud. Avian Biol. 22, 51–60.
Freeland, J.R., Boag, P.T., 1999. The mitochondrial and nuclear genetichomogeneity of the phenotypically diverse Darwin’s ground Wnches.Evolution 53, 1553–1563.

J.L. Bollmer et al. / Molecular Phylogenetics and Evolution 39 (2006) 237–247 247
Fuller, M.R., Seegar, W.S., Schueck, L.S., 1998. Routes and travel rates ofmigrating Peregrine Falcons Falco peregrinus and Swainson’s HawksButeo swainsoni in the Western Hemisphere. J. Avian Biol. 29, 433–440.
GiVord, E.W., 1919. Expedition of the California Academy of Sciences tothe Galapagos Islands, 1905-1906. XIII. Field Notes on the Land Birdsof the Galapagos Islands and of Cocos Island, Costa Rica. Proc. Calif.Acad. Sci. Fourth Series 2, 189–258.
Grant, P.R. (Ed.), 1998. Evolution on Islands. Oxford University Press,Oxford.
Grant, P.R., 2001. Reconstructing the evolution of birds on islands: 100years of research. Oikos 92, 385–403.
Grant, P.R., Grant, B.R., Petren, K., 2005. Hybridization in the recent past.Am. Nat. 166, 56–67.
Groombridge, J.J., Jones, C.G., Bayes, M.K., van Zyl, A.J., Carrillo, J., Nic-hols, R.A., Bruford, M.W., 2002. A molecular phylogeny of Africankestrels with reference to divergence across the Indian Ocean. Mol.Phylogenet. Evol. 25, 267–277.
JeVreys, A.J., Wilson, V., Thein, S.L., 1985. Hypervariable ‘minisatellite’regions in human DNA. Nature 314, 67–73.
Johnson, K.P., Seger, J., 2001. Elevated rates of nonsynonymous substitu-tions in island birds. Mol. Biol. Evol. 18, 874–881.
Kimball, R.T., Braun, E.L., Zwartjes, P.W., Crowe, T.M., Ligon, J.D., 1999.A molecular phylogeny of the pheasants and partridges suggests thatthese lineages are not monophyletic. Mol. Phylogenet. Evol. 11, 38–54.
Kizirian, D., Trager, A., Donnelly, M.A., Wright, J.W., 2004. Evolution ofGalapagos Island lava lizards (Iguania: Tropiduridae: Microlophus).Mol. Phylogenet. Evol. 32, 761–769.
Kruckenhauser, L., Haring, E., Pinsker, W., Riesing, M.J., Winkler, H.,Wink, M., Gamauf, A., 2004. Genetic vs. morphological diVerentiation ofOld World buzzards (genus Buteo, Accipitridae). Zool. Scr. 33, 197–211.
Kumar, S., Tamura, K., Jakobsen, I.B., Nei, M., 2001. MEGA2: MolecularEvolutionary Genetics Analysis software. Bioinformatics 17, 1244–1245.
Lopez, T.J., Hauselman, E.D., Maxson, L.R., Wright, J.W., 1992. Prelimi-nary analysis of phylogenetic relationships among Galapagos Islandlizards of the genus Tropidurus. Amphib. Reptil. 13, 327–339.
Lovette, I.J., 2004. Mitochondrial dating and mixed support for the “2%rule” in birds. Auk 121, 1–6.
Lynch, M., 1990. The similarity index and DNA Wngerprinting. Mol. Biol.Evol. 7, 478–484.
Mayr, E., Short, L.L., 1970. Species taxa of North American birds. Publ.Nuttal Ornithol. Club No. 9.
Nei, M., 1987. Molecular Evolutionary Genetics. Columbia Univ. Press,New York.
Parker, P.G., Waite, T.A., Decker, M.D., 1995. Kinship and association incommunally roosting black vultures. Anim. Behav. 49, 395–401.
Piertney, S.B., Summers, R., Marquiss, M., 2001. Microsatellite and mito-chondrial DNA homogeneity among phenotypically diverse crossbilltaxa in the UK. Proc. R. Soc. Lond. B 268, 1511–1517.
Rassmann, K., 1997. Evolutionary age of the Galápagos iguanas predates theage of the present Galápagos Islands. Mol. Phylogenet. Evol. 7, 158–172.
Rassmann, K., Tautz, D., Trillmich, F., Gliddon, C., 1997. The microevolu-tion of the Galápagos marine iguana Amblyrhynchus cristatus assessedby nuclear and mitochondrial genetic analyses. Mol. Ecol. 6, 437–452.
Riesing, M.J., Kruckenhauser, L., Gamauf, A., Haring, E., 2003. Molecularphylogeny of the genus Buteo (Aves: Accipitridae) based on mitochon-drial marker sequences. Mol. Phylogenet. Evol. 27, 328–342.
Rogstad, S.H., Pelikan, S., 1996. GELSTATS: a computer program forpopulation genetics analyses using VNTR multilocus probe data. Bio-Techniques 21, 1128–1131.
Rozas, J., Sánchez-DelBarrio, J.C., Messeguer, X., Rozas, R., 2003. DnaSP,DNA polymorphism analyses by the coalescent and other methods.Bioinformatics 19, 2496–2497.
Sato, A., O’hUigin, C., Figueroa, F., Grant, P.R., Grant, B.R., Tichy, H.,Klein, J., 1999. Phylogeny of Darwin’s Wnches as revealed by mtDNAsequences. Proc. Natl. Acad. Sci. USA 96, 5101–5106.
Sato, A., Tichy, H., O’hUigin, C., Grant, P.R., Grant, B.R., Klein, J., 2001.On the origin of Darwin’s Wnches. Mol. Biol. Evol. 18, 299–311.
Schneider, S., Roessli, D., ExcoYer, L., 2000. Arlequin ver. 2.000: A Soft-ware for Population Genetics Data Analysis. Genetics and BiometryLaboratory, Univ. of Geneva, Switzerland.
Sequeira, A.S., Lanteri, A.A., Scataglini, M.A., Confalonieri, V.A., Farrell,B.D., 2000. Are Xightless Galapaganus weevils older than the Galápa-gos Islands they inhabit? Heredity 85, 20–29.
Seutin, G., RatcliVe, L.M., Boag, P.T., 1995. Mitochondrial-DNA homoge-neity in the phenotypically diverse redpoll Wnch complex (Aves: Cardu-elinae: Carduelis Xammea-hornemanni). Evolution 49, 962–973.
Shields, G.F., Wilson, A.C., 1987. Calibration of mitochondrial DNA evo-lution in geese. J. Mol. Evol. 24, 212–217.
Sorenson, M.D., Ast, J.C., DimcheV, D.E., Yuri, T., Mindell, D.P., 1999.Primers for a PCR-based approach to mitochondrial genome sequenc-ing in birds and other vertebrates. Mol. Phylogenet. Evol. 12, 105–114.
Steadman, D.W., DeLeon, V.B., 1999. First highly stratiWed prehistoricvertebrate sequence from the Galapagos Islands, Ecuador. PaciWc Sci.53, 129–143.
Swarth, H.S., 1931. The avifauna of the Galápagos Islands. OccasionalPapers Calif. Acad. Sci. 18, 1–299.
SwoVord, D.L., 2002. PAUP*. Phylogenetic Analysis Using Parsimony(* and Other Methods). Version 4. Sinauer Associates, Sunderland,Massachusetts.
Tye, A., Snell, H.L., Peck, S.B., Adsersen, H., 2002. Outstanding terrestrialfeatures of the Galapagos archipelago. In: A Biodiversity Vision forthe Galapagos Islands. Charles Darwin Foundation and World Wild-life Fund, Puerto Ayora, Galapagos.
Voous, K.H., de Vries, Tj., 1978. Systematic place and geographic historyof the Galápagos Hawk, Buteo galapagoensis. Le Gerfaut 68, 245–252.
Wagner, W.L., Funk, V.A. (Eds.), 1995. Hawaiian Biogeography: Evolu-tion on a Hot Spot Archipelago. Smithsonian Institution Press, Wash-ington.
Warren, B.H., Bermingham, E., Bowie, R.C.K., Prys-Jones, R.P., Thébaud,C., 2003. Molecular phylogeography reveals island colonization historyand diversiWcation of western Indian Ocean sunbirds (Nectarinia: Nec-tariniidae). Mol. Phylogenet. Evol. 29, 67–85.
Werner, R., Hoernle, K., 2003. New volcanological and volatile data pro-vide strong support for the continuous existence of Galápagos Islandsover the past 17 million years. Int. J. Earth Sci. 92, 904–911.
White, W.M., McBirney, A.R., Duncan, R.A., 1993. Petrology and geo-chemistry of the Galápagos Islands: portrait of a pathological mantleplume. J. Geophys. Res. 98, 19533–19563.
Whiteman, N.K., Parker, P.G., 2005. Using parasites to infer host popula-tion history: a new rationale for parasite conservation. Anim. Conserv.8, 1–7.
Whittaker, R.J., 1998. Island Biogeography: Ecology, Evolution, and Con-servation. Oxford University Press, Oxford.
Wright, J.W., 1983. The evolution and biogeography of the lizards of theGalapagos archipelago: evolutionary genetics of Phyllodactylus andTropidurus populations. In: Bowman, R.I., Berson, B., Levinton, A.E.(Eds.), Patterns of Evolution in Galapagos Organisms. American Asso-ciation for the Advancement of Science, PaciWc Division, San Fran-cisco, pp. 123–155.
Wyles, J.S., Sarich, V.M., 1983. Are the Galapagos iguanas older than theGalapagos. Molecular evolution and colonization models for the archi-pelago. In: Bowman, R.I., Berson, B., Levinton, A.E. (Eds.), Patterns ofEvolution in Galapagos Organisms. American Association for theAdvancement of Science, PaciWc Division, San Francisco, pp. 177–185.
Copyright © 2022 FDOKUMEN