Electroencephalogram paroxysmal theta characterizes cataplexy in mice and children
17
BRAIN A JOURNAL OF NEUROLOGY Electroencephalogram paroxysmal theta characterizes cataplexy in mice and children Anne Vassalli, 1 Jose M. Dellepiane, 1 Yann Emmenegger, 1 Sonia Jimenez, 1 Stefano Vandi, 2 Giuseppe Plazzi, 2 Paul Franken 1, * and Mehdi Tafti 1, * 1 Centre for Integrative Genomics, University of Lausanne, Lausanne, Switzerland 2 DIBINEM-University of Bologna and IRCCS, Istituto delle Scienze Neurologiche, Bologna, Italy *These authors contributed equally to this work. Correspondence to: Dr. Anne Vassalli, Centre for Integrative Genomics, Universite ´ de Lausanne, CH-1015 Lausanne, Switzerland E-mail: [email protected] Astute control of brain activity states is critical for adaptive behaviours and survival. In mammals and birds, electroencephalo- graphic recordings reveal alternating states of wakefulness, slow wave sleep and paradoxical sleep (or rapid eye movement sleep). This control is profoundly impaired in narcolepsy with cataplexy, a disease resulting from the loss of orexin/hypocretin neurotransmitter signalling in the brain. Narcolepsy with cataplexy is characterized by irresistible bouts of sleep during the day, sleep fragmentation during the night and episodes of cataplexy, a sudden loss of muscle tone while awake and experiencing emotions. The neural mechanisms underlying cataplexy are unknown, but commonly thought to involve those of rapid eye movement–sleep atonia, and cataplexy typically is considered as a rapid eye movement sleep disorder. Here we reassess cataplexy in hypocretin (Hcrt, also known as orexin) gene knockout mice. Using a novel video/electroencephalogram double- blind scoring method, we show that cataplexy is not a state per se, as believed previously, but a dynamic, multi-phased process involving a reproducible progression of states. A knockout-specific state and a stereotypical paroxysmal event were introduced to account for signals and electroencephalogram spectral characteristics not seen in wild-type littermates. Cataplexy almost invariably started with a brief phase of wake-like electroencephalogram, followed by a phase featuring high-amplitude irregular theta oscillations, defining an activity profile distinct from paradoxical sleep, referred to as cataplexy-associated state and in the course of which 1.5–2 s high-amplitude, highly regular, hypersynchronous paroxysmal theta bursts (7 Hz) occurred. In contrast to cataplexy onset, exit from cataplexy did not show a predictable sequence of activities. Altogether, these data contradict the hypothesis that cataplexy is a state similar to paradoxical sleep, even if long cataplexies may evolve into paradoxical sleep. Although not exclusive to overt cataplexy, cataplexy-associated state and hypersynchronous paroxysmal theta activities are highly enriched during cataplexy in hypocretin/orexin knockout mice. Their occurrence in an independent narcolepsy mouse model, the orexin/ataxin 3 transgenic mouse, undergoing loss of orexin neurons, was confirmed. Importantly, we document for the first time similar paroxysmal theta hypersynchronies (4 Hz) during cataplexy in narcoleptic children. Lastly, we show by deep recordings in mice that the cataplexy-associated state and hypersynchronous paroxysmal theta activities are independent of hippocampal theta and involve the frontal cortex. Cataplexy hypersynchronous paroxysmal theta bursts may represent medial prefrontal activity, associated in humans and rodents with reward-driven motor impulse, planning and conflict monitoring. doi:10.1093/brain/awt069 Brain 2013: 136; 1592–1608 | 1592 Received July 12, 2012. Revised December 31, 2012. Accepted February 2, 2013 ß The Author (2013). Published by Oxford University Press on behalf of the Guarantors of Brain. All rights reserved. For Permissions, please email: [email protected] at Université & EPFL Lausanne on April 24, 2013 http://brain.oxfordjournals.org/ Downloaded from
Transcript of Electroencephalogram paroxysmal theta characterizes cataplexy in mice and children
BRAINA JOURNAL OF NEUROLOGY
Electroencephalogram paroxysmal thetacharacterizes cataplexy in mice and childrenAnne Vassalli,1 Jose M. Dellepiane,1 Yann Emmenegger,1 Sonia Jimenez,1 Stefano Vandi,2
Giuseppe Plazzi,2 Paul Franken1,* and Mehdi Tafti1,*
1 Centre for Integrative Genomics, University of Lausanne, Lausanne, Switzerland
2 DIBINEM-University of Bologna and IRCCS, Istituto delle Scienze Neurologiche, Bologna, Italy
*These authors contributed equally to this work.
Correspondence to: Dr. Anne Vassalli,
Centre for Integrative Genomics,
Universite de Lausanne,
CH-1015 Lausanne,
Switzerland
E-mail: [email protected]
Astute control of brain activity states is critical for adaptive behaviours and survival. In mammals and birds, electroencephalo-
graphic recordings reveal alternating states of wakefulness, slow wave sleep and paradoxical sleep (or rapid eye movement
sleep). This control is profoundly impaired in narcolepsy with cataplexy, a disease resulting from the loss of orexin/hypocretin
neurotransmitter signalling in the brain. Narcolepsy with cataplexy is characterized by irresistible bouts of sleep during the day,
sleep fragmentation during the night and episodes of cataplexy, a sudden loss of muscle tone while awake and experiencing
emotions. The neural mechanisms underlying cataplexy are unknown, but commonly thought to involve those of rapid eye
movement–sleep atonia, and cataplexy typically is considered as a rapid eye movement sleep disorder. Here we reassess
cataplexy in hypocretin (Hcrt, also known as orexin) gene knockout mice. Using a novel video/electroencephalogram double-
blind scoring method, we show that cataplexy is not a state per se, as believed previously, but a dynamic, multi-phased process
involving a reproducible progression of states. A knockout-specific state and a stereotypical paroxysmal event were introduced
to account for signals and electroencephalogram spectral characteristics not seen in wild-type littermates. Cataplexy
almost invariably started with a brief phase of wake-like electroencephalogram, followed by a phase featuring high-amplitude
irregular theta oscillations, defining an activity profile distinct from paradoxical sleep, referred to as cataplexy-associated
state and in the course of which 1.5–2 s high-amplitude, highly regular, hypersynchronous paroxysmal theta bursts (�7 Hz)
occurred. In contrast to cataplexy onset, exit from cataplexy did not show a predictable sequence of activities. Altogether, these
data contradict the hypothesis that cataplexy is a state similar to paradoxical sleep, even if long cataplexies may evolve into
paradoxical sleep. Although not exclusive to overt cataplexy, cataplexy-associated state and hypersynchronous paroxysmal
theta activities are highly enriched during cataplexy in hypocretin/orexin knockout mice. Their occurrence in an independent
narcolepsy mouse model, the orexin/ataxin 3 transgenic mouse, undergoing loss of orexin neurons, was confirmed. Importantly,
we document for the first time similar paroxysmal theta hypersynchronies (�4 Hz) during cataplexy in narcoleptic children.
Lastly, we show by deep recordings in mice that the cataplexy-associated state and hypersynchronous paroxysmal theta
activities are independent of hippocampal theta and involve the frontal cortex. Cataplexy hypersynchronous paroxysmal theta
bursts may represent medial prefrontal activity, associated in humans and rodents with reward-driven motor impulse, planning
and conflict monitoring.
doi:10.1093/brain/awt069 Brain 2013: 136; 1592–1608 | 1592
Received July 12, 2012. Revised December 31, 2012. Accepted February 2, 2013
� The Author (2013). Published by Oxford University Press on behalf of the Guarantors of Brain. All rights reserved.
For Permissions, please email: [email protected]
at UniversitÃ
© &
EPFL
Lausanne on A
pril 24, 2013http://brain.oxfordjournals.org/
Dow
nloaded from
Keywords: narcolepsy with cataplexy; orexin/hypocretin; theta EEG activity; mouse models; childhood cataplexy
Abbreviations: CAS = cataplexy-associated state; HSPT = hypersynchronous paroxysmal theta; REM = rapid eye movement
IntroductionIn cataplexy the patient suddenly loses bilateral postural muscle
tone, most often when experiencing a strong emotion, such as
elation, anticipation or anger (Dauvilliers et al., 2007; Overeem
et al., 2011). Atonia may be restricted to selected muscles (seg-
mental cataplexy) or be complete, and last from a split second to
several minutes, during which time the body is paralysed, but
consciousness is preserved. The phenomenon of cataplexy has
long captured fascination, but its underlying mechanisms have
remained largely unexplained.
Cataplexy is a symptom unique to narcolepsy, a lifelong neuro-
logical disease in which regulation of behavioural states is
profoundly impaired. Narcolepsy is characterized by an inability
to maintain sustained periods of wakefulness. This leads to
abrupt, irrepressible episodes of sleepiness during the day, with
so-called sleep attacks. The latter are frequent when performing
repetitive, poorly stimulating tasks. In contrast, cataplexy occurs in
alert states. Cataplexy and sleep attacks are also distinguished
by environmental awareness in cataplexy. Therefore the neural
pathways implicated in the two symptoms are expected to differ.
Furthermore, night time sleep is unstable in narcolepsy and
characterized by premature occurrence of rapid eye movement
(REM) sleep. Hypnagogic hallucinations and sleep paralysis, two
further symptoms, were interpreted as direct intrusions of REM
sleep into wakefulness. Currently, narcolepsy is best understood
as a failure of state stability (Saper et al., 2001, 2010; Mochizuki
et al, 2004; Diniz Behn et al., 2010).
Studies in mice and dogs indicated that genetic failure in brain
orexin/hypocretin signalling causes narcolepsy (Chemelli et al.,
1999; Lin et al., 1999). Unlike mouse and dog narcolepsy, the
human disease is generally not caused by mutations in the hypo-
cretin gene, which encodes orexins A and B (hypocretins 1 and 2)
or the orexin type 1 and 2 receptor (hypocretin receptor 1 and 2)
genes (Peyron et al., 2000). The disease is nevertheless strongly
associated with low/undetectable orexin A levels in the CSF, and
post-mortem analysis of narcoleptic brains revealed a specific loss
of orexin neurons in the hypothalamus (Peyron et al., 2000;
Thannickal et al., 2000). Current evidence suggests narcolepsy
may be an autoimmune disorder resulting in the specific degener-
ation of orexin neurons (Aran et al., 2009; Cvetkovic-Lopes et al.,
2010; Ritchie et al., 2010).
Orexins are neuropeptides produced by a small population of
neurons in the hypothalamus. These cells send direct excitatory
projections to a multitude of brain nuclei, which include the
major arousal centres (Peyron et al., 1998). Orexin and their pro-
jecting neurons thus form an extensive network throughout the
brain (Marcus et al., 2001), which is thought to sense a wide
variety of metabolic (e.g. glucose level) and external (e.g. pres-
ence of an intruder) cues, and build a core of adaptive responses.
These responses are exerted in particular at the autonomic and
locomotor levels, one aspect of which is alertness (sleep/wake)
(Ohno and Sakurai, 2008; Sinton, 2011). In this light, cataplexy
may represent an impaired motor response to a category of emo-
tional stimuli (Tucci et al., 2003).
The phenomenon of cataplexy has been subject to different
interpretations. Because in its full form, cataplexy features atonia
as in paradoxical sleep, it has been viewed as another case of
pathological paradoxical sleep intrusion into wakefulness. It also
has been described as an example of ‘state dissociation’ (Vetrugno
et al., 2010; Stamelou et al., 2012), whereby paradoxical sleep
atonia is uncoupled from other paradoxical sleep features, such as
the lack of consciousness. In these views, cataplexy and paradox-
ical sleep atonia were thought to share neural pathways.
It also has been suggested that cataplexy and paradoxical sleep
engage distinct circuits. First, unlike paradoxical sleep, cataplexy is
best triggered by emotions, pointing to the involvement of an
emotion-processing structure, such as the amygdala or the ventro-
medial prefrontal cortex (Salzman and Fusi, 2010). Next, neuronal
firing patterns distinguishing cataplexy from paradoxical sleep
were identified in the amygdala (Gulyani et al., 2002) and in
tuberomammillary nucleus histamine neurons (John et al., 2004)
of narcoleptic dogs. Furthermore, cataplexy is physiologically dis-
tinct from paradoxical sleep in humans, with the full atonic phase
showing deceleration of the heart rate and a stable blood pressure,
in contrast to paradoxical sleep, which is associated with instability
of both heart rate and blood pressure (Rubboli et al., 2000;
Donadio et al., 2008; Vetrugno et al., 2010).
Reports of EEG activity during cataplexy in animals and humans
are relatively few and altogether fail to describe a specific activity
pattern, most often likening cataplexy EEG to paradoxical sleep.
Recently, several groups including ours observed previously unrec-
ognized theta activity bursts in the EEG of orexin-deficient mice
undergoing cataplexy (Bastianini et al., 2012).
The narcoleptic phenotype of orexin knockout mice was dis-
covered by observing frequent behavioural arrests in these mice
(Chemelli et al., 1999), some of which were interpreted as cata-
plexy (Willie et al., 2003). An operational definition of murine
cataplexy was introduced by Scammell et al. (2009) to standardize
mouse cataplexy research. This uses a mixture of EEG and EMG
and macroscopic behavioural criteria to define cataplexy as: (i) an
abrupt episode of nuchal atonia lasting 510 s; (ii) during which
the animal is immobile; (iii) the EEG is dominated by theta activity;
with (iv) 540 s of wakefulness preceding cataplexy (Scammell
et al., 2009). We reasoned that some of the episodes identified
by this method may represent direct REM sleep transitions (sleep
onset REM periods ‘SOREMPs’), or sleep paralysis-like events, that
are distinct symptoms and may engage different neural substrates.
Furthermore, we reasoned that if cataplexy had an, as of yet,
undiscovered EEG signature, no EEG prerequisite should be
assigned to identify cataplexy initially.
For these reasons we reassessed cataplexy in the orexin knock-
out and orexin/ataxin 3 transgenic mice (collectively referred to as
orexin-deficient mice; Chemelli et al., 1999; Hara et al. 2001).
EEG paroxysmal theta in cataplexy Brain 2013: 136; 1592–1608 | 1593
at UniversitÃ
© &
EPFL
Lausanne on A
pril 24, 2013http://brain.oxfordjournals.org/
Dow
nloaded from

Instead of scoring cataplexy as a ‘state’ defined partly by theta
activity, we performed a ‘clinical’ assessment of cataplexy, inde-
pendently of EEG analysis. This entailed scoring macroscopic
behavioural criteria of cataplexy, emphasizing the goal-driven
(non-automatic) component of triggering activities, based uniquely
on video examination.
In a parallel double-blind process, EEG/EMG traces were visually
scored. This dual scoring method led us to identify an orexin-
deficient mutant-specific EEG/EMG state with visual pattern and
EEG spectral characteristics different from wakefulness, slow wave
sleep, slow wave sleep-to-paradoxical sleep transitions and para-
doxical sleep, that we call cataplexy-associated state (CAS) owing
to its enrichment during cataplexy. Furthermore, we describe a
prominent phasic EEG signal, the hypersynchronous paroxysmal
theta (HSPT) burst associated with CAS, as well as with paradox-
ical sleep. Closely resembling theta bursts were recognized in the
recordings of recently diagnosed narcoleptic children experiencing
cataplexy induced by watching cartoon movies. We suggest rele-
vance of the mouse model for a deeper understanding of the
human disease, and in particular cataplexy at early disease stages.
Materials and methods
MiceTwo mouse models of narcolepsy were used: the prepro-orexin
gene (hypocretin, Hcrt) knockout line (Chemelli et al., 1999), and
the orexin/ataxin 3 line, carrying a transgene [Tg(HCRT-MJD)1Stak],
responsible for post-natal degeneration of orexin neurons (Hara
et al., 2001).
Animals used for quantitative analyses were male offspring from
heterozygous orexin knockout intercrosses (OX +/ko� OX +/ko), identi-
fied as wild-type (controls) or homozygous knockout (OXko/ko or
‘orexin null mice’) by PCR genotyping (Chemelli et al., 1999). The
line was backcrossed for seven to nine generations to inbred C57BL/
6J parents. For some experiments, hemizygous orexin/ataxin 3 trans-
genic male mice and wild-type littermates, from crosses between a
hemizygous parent and a C57BL/6J mate, were recorded (sixth to
seventh backcross generation). Recordings of female mice from
either the orexin knockout, or the orexin/ataxin 3 lines did not
reveal obvious sex differences. Mice were housed in polycarbonate
cages with food and water ad libitum and maintained on a 12 h
light–12h dark cycle (lights on at 09:00). All animal experiments
were carried out in accordance with the regulations of the Swiss
Federal and State of Vaud Veterinary Offices.
Electrode implantation surgeryEEG electrodes were implanted through the mouse skull and EMG
electrodes were implanted in nuchal muscles (Franken et al., 1998).
Surgery was performed at 10–12 weeks under deep anaesthesia (keta-
mine/xylazine intraperitoneally, 75 and 10 mg/kg). After surgery,
animals were allowed to recover for 5–7 days, after which cables
were attached to the head-mount connecting to an EMBLATM record-
ing device. After another 5–7 days for cable habituation, data acqui-
sition was performed in the animal’s individual home cage at 12–16
weeks.
Fronto-parietal electroencephalogramrecordingTwo gold-plated mini-screws (diameter 1.1 mm) serving as EEG elec-
trodes were screwed through the skull on the right hemisphere. The
frontal electrode was positioned 1.5 mm anterior to bregma, 1.7 mm
lateral to midline, the parietal electrode was placed 1.5 mm anterior to
lambda, 1.7 mm lateral to midline, and the differential EEG recorded.
All quantitative EEG analysis was based on fronto-parietal differential
EEG recordings. To further investigate the atypical signals of mutant
mice, we performed additional recordings with other electrode
montages, as described.
Bilateral fronto-parietal recordingFour EEG electrodes were implanted bilaterally as above. A fifth was
positioned on the cerebellar midline (2 mm posterior to lambda), ser-
ving as common reference.
Intra-hippocampal and prefrontal cortexdepth recordingsA varnish-insulated gold wire electrode (diameter 0.2 mm) was im-
planted in the hippocampal CA1 layer (bregma: �2.3 mm, midline:
1.8 mm, depth: 1.5 mm), or in prefrontal cortex at several medial-lat-
eral coordinates (bregma: + 2.0 mm, midline: 0.2 to 3.2 mm, depth:
2.2 mm) on the left hemisphere. A frontal EEG electrode was im-
planted as described above on the contralateral hemisphere. All elec-
trodes were referenced to a cerebellar EEG electrode.
Polysomnographic and infrared videorecording of miceEMBLATM hardware was used for signal acquisition and Somnologica-
3TM (Medcare) software for data analysis. High-resolution
CCD cameras (Panasonic WV-CP500) placed alongside mouse cages
and a ceiling-mounted LED infrared projector (850 nm; Ecoline)
were used for high-quality, horizontal (side-view) imaging of the
animal posture. The video recording was fed to Somnologica software,
allowing integrated timing and analysis of the video and EEG/EMG
signals.
Video/electroencephalogram dualscoring methodThree consecutive recording days were analysed. Each 4 s time interval
(epoch) of recording was double-blindly assigned two scores: (i) a
macroscopic behavioural score, based exclusively on infrared video
imaging (‘cataplexy’ or ‘not cataplexy’, see definition below);
and (ii) an EEG/EMG behavioural state, based exclusively on visual
evaluation of fronto-parietal EEG and EMG traces. The latter score
was one of six options (wakefulness, slow wave sleep, paradoxical
sleep, CAS, HSPT or artefact). Wakefulness, slow wave sleep or para-
doxical sleep were scored as described in Franken et al. (1998),
and CAS and HSPT, using criteria described below. The two scorings
were performed by two different trained investigators (J.D. and Y.E.,
respectively).
1594 | Brain 2013: 136; 1592–1608 A. Vassalli et al.
at UniversitÃ
© &
EPFL
Lausanne on A
pril 24, 2013http://brain.oxfordjournals.org/
Dow
nloaded from
Mouse cataplexy definitionWe chose to restrict analysis to the behaviourally most striking arrests,
displaying abrupt body collapse interrupting high-motivation activity,
as assessed by video examination alone. Criteria identifying this
category of arrests were stringently defined. Episodes were termed
‘cataplexy’ based on the rationale that they positively represent
murine homologues of human cataplexy, or a subset thereof.
Cataplexy scoring is thus performed independently of the nature, or
stability, of any associated EEG activity. A cataplexy unambiguously
displays all the following features: (i) starts with an abrupt and global
postural collapse; (ii) directly follows 540 s of intense, goal-oriented
behaviour, showing one or several of the following activities: excited
ambulation/exploration, rearing/jumping, burrowing, nest building,
vigorous grooming or drinking; (iii) consists in 510 s of continuous
immobility; and (iv) ends with sudden resumption of visible tone and
purposeful behaviour. If visible motor impairment preceded an even-
tual global collapse, suggesting segmental cataplexy, positive scoring
started only at the first epoch of lasting immobility after collapse. In an
episode, the epoch within which the body collapsed (irrespective of
when in the epoch), all subsequent epochs displaying continuous im-
mobility, and the last epoch during which the mouse was immobile for
52 s, were scored as cataplexy. All OXko/ko animals observed to date
(n = 30) showed episodes of cataplexy, while this behaviour was not
observed in wild-type littermates (n = 7).
Behavioural states definitionsUsing the standard mouse EEG/EMG scoring method, based on rules
established in wild-type mice (Valatx et al., 1972; Franken et al.,
1998), we were unable to assign a state to some recording intervals
in orexin-deficient animals. These intervals nevertheless shared stable
EEG/EMG characteristics, both within and across animals. To account
for these activity patterns, state scoring rules were modified by adding
two ‘new’ scores, CAS and HSPT, to the classical scores of wakeful-
ness, slow wave sleep and paradoxical sleep. CAS and HSPT definitions
were established in OXko/ko mice (C57BL/6J background), as described
below. Definitions of wakefulness, slow wave sleep and paradoxical
sleep scores were unchanged.
Cataplexy-associated stateCAS is defined by highly irregular, high-amplitude mixed delta/theta
EEG oscillations, with a visible dominance of theta (�7 Hz) over delta
oscillations. Spectral analysis confirms bimodal distribution with dom-
inating theta power, and a smaller contribution of delta power that, at
times, did not stand out above background. Further defining CAS is
the organization of high-amplitude theta activity in waxing and
waning bursts, often of �1.5–2 s duration, and a constantly low
EMG activity. CAS is distinguished from slow wave sleep by theta
dominance, and distinguished from paradoxical sleep by a highly ir-
regular and larger amplitude. Analysis revealed that this state is highly
enriched in cataplexy of OXko/ko mice, while not observed in wild-type
littermates; its EEG spectral characteristics are distinct from all other
states (see ‘Results’ section). Hence its designation as CAS. Four
second epochs showing 52 s of CAS activity were scored as CAS.
Hypersynchronous paroxysmaltheta burstHSPT defines a conspicuous, stereotypical, high-amplitude theta EEG
burst, with a relatively ‘pure’ frequency of �7 Hz and a duration of
�1.5–2 s. Spectral analysis shows a surging theta power at 7 Hz, and
up to four harmonic peaks (14, 21, 28 and 35 Hz). We call these EEG
events HSPT. Any 4 s epoch showing one or more HSPT event(s)
lasting 41 s was scored as HSPT. Note that even though we score
epochs containing such an event distinctively, HSPT is not considered
as a state, but a transient signal.
Electroencephalogram spectral analysisEEG and EMG signals were amplified, filtered, analogue to digitally
converted at 2000 Hz and stored at 200 Hz. EEG signals were sub-
jected to discrete Fourier transform to determine EEG power density
spectra (0–90 Hz) for 4 or 2 s windows with 0.25 or 0.5 Hz frequency
resolution. Mean EEG spectral profiles for each behavioural state and
for HSPT events were calculated. To account for inter-individual dif-
ferences in overall EEG power, EEG spectra of all behavioural states
were expressed as a percentage of individual reference value calcu-
lated as the total EEG power across all frequencies considered (0.75–
47.50 Hz) and the behavioural states: wakefulness, slow wave sleep
and paradoxical sleep. This reference value was weighted so that for
each animal the relative contribution of the three main behavioural
states to this reference value was equal, according to Franken et al.
(1998). By using one EEG power density reference, EEG spectra can be
directly compared among states. Theta peak frequency was deter-
mined by determining frequency of maximum power density in the
theta frequency range (5–10 Hz). For spectral quantification of the
characteristic slow wave sleep EEG preceding paradoxical sleep (pre-
paradoxical sleep), pre-paradoxical sleep was defined as slow wave
sleep during the 20 s before paradoxical sleep onset. Paradoxical
sleep onset was defined by the first occurrence of regular (both in
amplitude and frequency) theta oscillations, as assessed by EEG trace
visual examination (Franken et al., 1998).
Statistical analysisTo assess the effects of the factors genotype, time of day, EEG fre-
quency, and state, one- and two-way ANOVAs were performed first
as an omnibus test. When significance was reached for the main
factors and/or the interactions between them, contrasts were decom-
posed using post hoc paired (within-animal assessment of factor state
for EEG spectra) or unpaired (factor genotype for behavioural state
duration) t-tests, or Tukey’s honestly significant difference test (for
within-animal assessment of factor state on theta peak frequency).
For within-animal comparisons of EEG spectra between two states,
power density ratios were log transformed to ensure symmetry of
distribution. Only consistent differences over broader frequency
ranges were reported and discussed in the text. To quantify relation-
ships between the time course of time spent awake, on the one hand,
and that of CAS, HSPT occurrence, and cataplexy, on the other,
Pearson product moment correlations were performed. Statistical
analyses were performed using SAS (SAS Institute Inc.). Cut-off for
statistical significance was set to P = 0.01 (0.05 for data in
Supplementary material) and results are reported as mean � SEM.
SigmaPlot v12 (Systat Software Inc.) was used for graphs.
Polysomnographic and video recordingof childrenSix drug-free narcoleptic children with clear-cut cataplexy participated
in this study. All six patients were positive for the HLA-DQB1*06:02
allele. Orexin A levels in the CSF were found to be low (5120 pg/ml)
EEG paroxysmal theta in cataplexy Brain 2013: 136; 1592–1608 | 1595
at UniversitÃ
© &
EPFL
Lausanne on A
pril 24, 2013http://brain.oxfordjournals.org/
Dow
nloaded from
or undetectable in all of them. Recordings of these six patients were
further analysed after browsing the recordings of 20 narcoleptic
children revealed they showed readily identifiable theta bursts in cata-
plexy. Time from disease onset was 1.5 to 4.8 years.
Settings of cataplexy recordings were as described in Plazzi et al.
(2011). Briefly, video recordings were performed with the subject sit-
ting or standing and consisted of a 5 min baseline recording followed
by up to 30 min while subjects were watching comic cartoon movies.
Patients were asked to take a brief nap before video recordings to
reduce sleepiness, and asked again whether they felt sleepy at the
end of the procedure; this was done to avoid confounding effects of
sleepiness on the observation of cataplexy.
The following signals were recorded. EEG: two channels, one central
(C3 or C4) and one occipital (O1 or O2), referred to the contralateral
earlobe (A1 or A2). No frontal derivations were obtained in our eight
cataplexy recordings. Electrooculogram: electrodes placed 1 cm above
the right outer cantus and 1 cm below the left outer cantus, referred
to A1. EMG: at least two channels: submentalis muscle and tibialis
muscle (bipolar derivations with two electrodes placed 3 cm apart).
Electrocardiogram: one derivation. Impedance was kept 510 K� (typ-
ically 55 K�). Signals were sampled at 200 or 256 Hz and stored in
European data format (EDF). Recordings were acquired using
Neuroscan and analysed using Somnologica. Cataplexy was identified
by both minimal submental and tibialis EMG activities, and confirmed
by video imaging. EEG recordings were scored in 4 s epochs by visual
examination of the C4–A1 derivation (the choice of C4–A1 over
C3–A2 was arbitrary). Any epoch featuring one or more HSPT
event(s) lasting 41 s was scored as HSPT. For each cataplexy record-
ing, an HSPT EEG power density spectrum was generated by using all
epochs scored as HSPT and a ‘cataplexy minus HSPT’ spectrum was
generated by using all other artefact-free epochs. EEG C4–A1 values
were used. In both cases, EEG spectra derive from discrete Fourier
transform of 2 s time windows with 0.5 Hz frequency resolution.
Results
Abrupt atonia interrupting motivatedbehaviourAs reported by others (Chemelli et al., 1999; Willie et al., 2003),
we found that OXko/ko mice exhibit a range of abnormal behav-
iours, characterized by atypical interruptions of ongoing activity.
Some of these behavioural arrests were preceded by signs of loco-
motor impairment, with uncoordinated, stumbling movements,
suggesting the animal was fighting paralysis. However, unlike
Willie et al. (2003), we found it impossible to categorize all arrests
as either homologous to sleep attack or cataplexy.
We thus chose to restrict our analysis to a set of stereotypical
arrests that showed a sudden interruption of a sustained, goal-
oriented and highly kinetic activity. We set stringent criteria of
‘cataplexy’ definition (see ‘Materials and methods’ section).
These criteria were based on the assumptions that they identify
events that (i) most unlikely represent sleep attacks, experienced in
patients during repetitive, low-attention tasks (Dauvilliers et al.,
2007); and (ii) occur as the animal experiences alertness and
high motivation, as engaged in an activity providing shelter/
defence (nest building, burrowing, escape), self-cleaning, water
or food. Hence pre-cataplexy behaviour is interpreted as
reward-driven, linked to emotions such as fear and pleasure.
These arrests were identified as ‘cataplexy’, while other arrests
were not identified. We do not rule out that we have selected a
subset of cataplexy attacks. Per 12 h dark period, an average of
22.6 cataplexies were observed in OXko/ko animals (SEM = 4.2;
n = 8; total of 24 dark periods, two to four per animal; 578
cataplexies).
Only video-assessed criteria defined the cataplexy data set. In
parallel and independently, a separate trained investigator, naive
to the video result, performed behavioural state scoring by visual
assessment of EEG/EMG traces. Thus two independent scores
were assigned to each 4 s epoch of recording.
A novel non-canonicalelectroencephalogram/electromyogramstate and stereotypical paroxysmalevent in orexin-deficient miceIn our initial recordings, we readily observed brief (1.5–2 s) atypical
bursts of very high-amplitude, regular theta oscillations, frequently
coinciding with cataplexy. These transient EEG events were not
observed in wild-type littermates (n = 7), but were present in the
EEG of all OXko/ko animals of either sex we recorded to date
(n = 30). As detailed in the ‘Materials and methods’ section, we
modified classical EEG/EMG scoring rules to account for these
events, which we termed HSPT bursts. A distinct, sustained
EEG/EMG activity characterized by an irregular theta dominated
rhythm, was likewise found in OXko/ko animals but not wild-type
littermates, and defined a novel state, scored as CAS. CAS fre-
quently displayed a 1.5–2 s theta burst phasic pattern, reminiscent
of HSPT bursts but lacking their highly regular pattern, suggesting
that CAS might consist of HSPTs mixed with other signals.
Figure 1A shows the recording of a representative cataplexy in
an OXko/ko mouse. Note the continuing wakefulness-like EEG
activity persisting for 3 s after body collapse (the latter, indicated
by the first vertical red arrow, is video-assessed), followed by a 2 s
HSPT burst, and an ensuing theta-dominated EEG activity, featur-
ing a second HSPT burst, and a period of more irregular theta
oscillations (CAS).
To confirm that CAS and HSPT bursts of OXko/ko mice are con-
sequences of orexin signalling failure, and not caused by other
factors associated with this specific knockout line, we recorded a
different mouse model of narcolepsy, the orexin/ataxin 3 trans-
genic line, which undergoes post-natal degeneration of orexin
neurons (Hara et al., 2001). We found very similar EEG profiles
in these mice, featuring both CAS and HSPT events (Fig. 1B),
while neither signal was observed in wild-type littermates of
either mouse line. Presence of similar EEG pattern abnormalities
in two independent models of narcolepsy strongly suggests that
CAS and HSPT activities result from specific disruption of orexin
pathways. Real-time movies of cataplexy episodes with video and
EEG/EMG traces are available in the online Supplementary
material.
To follow the daily profile of occurrence of these abnormal EEG
signals, we calculated hourly amounts of wakefulness, slow wave
sleep, paradoxical sleep and CAS, and hourly count of HSPT bursts,
1596 | Brain 2013: 136; 1592–1608 A. Vassalli et al.
at UniversitÃ
© &
EPFL
Lausanne on A
pril 24, 2013http://brain.oxfordjournals.org/
Dow
nloaded from

in two consecutive days of recording of OXko/ko mice (n = 8) and
wild-type littermates (n = 7) (Fig. 2A). CAS and HSPT activities
were not observed in the EEG of the wild-type littermates. The
daily profile of time spent in cataplexy in OXko/ko mice was assessed
in parallel by inspection of video recordings (Fig. 2B). Note that
the amount of time spent in CAS, incidence of HSPT events, and
time spent in cataplexy, are all seen to parallel the time-course of
wakefulness. Correlation analysis confirmed that the time-course
of the hourly values of wakefulness and CAS, of wakefulness
and HSPT, and of wakefulness and cataplexy were highly signifi-
cantly correlated (Pearson’s correlation coefficient: wakefulness
versus CAS: r = 0.90; wakefulness versus HSPT: r = 0.69; wakeful-
ness versus cataplexy: r = 0.79, P50.0001, n = 48).
As reported by others (Willie et al., 2003), time spent in the
waking state is reduced in OXko/ko mice during the first half of the
dark period (Fig. 2A). This decrease was due mostly to an increase
in paradoxical sleep, and occurrence of CAS, leaving slow wave
sleep unaffected. Part of the paradoxical sleep increase occurs in
the frequent cataplexies of this period, as cataplexy frequently
terminates in a phase with an EEG undistinguishable from para-
doxical sleep (see below).
Because the daily time course of CAS parallels that of cataplexy
(Pearson’s correlation coefficient: CAS versus cataplexy: r = 0.91;
P50.0001, n = 48), we asked whether CAS EEG activity specifically
coincided with cataplexy attacks. We first measured the state com-
position of cataplexy episodes and compared it with the state
Figure 1 EEG/EMG traces of typical cataplexy attacks in (A) an orexin null (OXko/ko) mouse and (B) an orexin/ataxin 3 transgenic mouse.
In both panels, the upper trace is the fronto-parietal differential EEG and the bottom trace is the neck muscle EMG. Note occurrence
of hypersynchronous paroxysmal theta (HSPT) bursts and cataplexy-associated state (CAS) activity in the EEG. EMG activity seen
concomitant to HSPT bursts in (A) stemmed from contaminating EEG activity generated during the most powerful bursts. EMG of the
mouse shown in (B) was flat throughout, as the recording starts 2 min 30 s into a long cataplexy (3 min 50 s in total). Video imaging
confirmed the mouse remained totally immobile throughout the episode. Shown are 40 s recording windows. Insets in each panel show
EEG power spectra for a 2 s time window centred on an individual HSPT burst, and delineated by a blue double-arrowhead bar above the
trace. Note �7 Hz theta peak frequency and its harmonics (A). Red vertical arrows indicate beginning (body collapse) and end (activity
resumption) of cataplexy, as identified by video image monitoring. Number in top-left corner above each recording is the time of day
(lights-off at 21:00). See Supplementary material for two real-time movies showing video-EEG/EMG recordings of two other OXko/ko
animals undergoing a cataplexy.
EEG paroxysmal theta in cataplexy Brain 2013: 136; 1592–1608 | 1597
at UniversitÃ
© &
EPFL
Lausanne on A
pril 24, 2013http://brain.oxfordjournals.org/
Dow
nloaded from

composition of the entire 12 h dark period in OXko/ko mice (Fig. 3).
Whereas CAS represents only 1.4% of the 12 h dark period,
CAS occupies 31.6% of time in cataplexy, thus showing a 23-fold
enrichment during cataplexy. Similarly, we found that 46% of HSPT
bursts occurred in epochs scored as cataplexy (which altogether rep-
resents 2.8% of the 12 h dark period), hence HSPTs occur 16-fold
more frequently during cataplexy than during any other time of the
dark period. Thus both CAS and HSPT activities are highly enriched
during cataplexy, and their occurrence profiles follow the predom-
inance of the waking state. Deciphering whether CAS and HSPT
activities seen outside of cataplexy reflect the stringency of our cata-
plexy definition (asking for intense behavioural activity preceding
arrest), or acknowledge existence of conditions other than cataplexy
that are accompanied by CAS and HSPT events, would require
further detailed analysis of such episodes.
Next we compared the EEG spectral profiles of wakefulness,
slow wave sleep and paradoxical sleep in OXko/ko and wild-type
animals. As reported previously (Willie et al., 2003; Mochizuki
et al., 2004), inactivation of the orexin pathway does not preclude
expression of the three classical behavioural states. Spectra
were essentially normal, with nevertheless subtle differences
(Supplementary Fig. 1). The EEG during slow wave sleep in
OXko/ko mice was increased in theta (post hoc t-test, P50.05;
n = 8–7), and during paradoxical sleep, mutant mice theta peak
frequency was faster (� = + 0.5 Hz, post hoc t-test, P50.05).
In general, OXko/ko mice thus produce normal waking EEG/EMG
traces; however, these are interrupted by episodes of EMG flat-
tening and substantial EEG alterations, as cataplexies ensue. To
gain insight in cataplexy triggers, we compared the waking EEG
in the 60 s preceding cataplexy with the waking EEG in the entire
12 h dark period. Pronounced spectral differences were revealed,
with decreased delta power and increase in both theta (�8 Hz)
and gamma (35–60 Hz) power in the minute preceding cataplexy
(Fig. 4; post hoc paired t-tests, P50.01, n = 8). This is consistent
with our video-assessed cataplexy identification criteria, which
target behavioural arrests intervening with intense activities sug-
gestive of elevated motivation. High theta/gamma wakefulness
correlates with intense explorative activity in rodents, and mental
concentration in humans (Mitchell et al., 2008).
It was reported that the EEG during a subset of cataplexies of
orexin null and orexin/ataxin 3 mice resemble the EEG in slow
wave to paradoxical sleep transitions (Chemelli et al., 1999;
Hara et al., 2001). To test this, we first performed an EEG spectral
analysis of slow wave sleep in the 20s preceding paradoxical sleep
Figure 2 Time course of EEG/EMG-determined behavioural
states (A) and video-determined cataplexy (B) over a 2-day
recording of OXko/ko mice (filled black symbols; n = 8) and
wild-type (OX + / + ) littermates (open symbols; n = 7). EEG/EMG
state and cataplexy scorings were performed independently of
each other by two separate investigators for each 4s time
window. (A) Time spent in wakefulness (W), slow wave sleep
(SWS), paradoxical sleep (PS), CAS (min/h), and count of HSPT
bursts (events/h) across time. (B) Parallel infrared video recording
Figure 2 Continuedwas used to identify time spent in cataplexy. Values are
mean � SEM. Paradoxical sleep in OXko/ko mice refers to the
EEG/EMG visual state pattern, irrespective of whether the mouse
experienced cataplexy or any other type of behavioural arrest.
HSPT bursts, CAS activity and cataplexies were not observed in
wild-type mice. Note the alternating left and right hand labelling
of the y-scales of the successive panels. Red horizontal bars along
time axis indicate intervals with significant genotype differences
(post hoc t-tests; P50.01). Time values 0 and 24 h indicate light
onset. Grey shadings mark the 12 h dark periods.
1598 | Brain 2013: 136; 1592–1608 A. Vassalli et al.
at UniversitÃ
© &
EPFL
Lausanne on A
pril 24, 2013http://brain.oxfordjournals.org/
Dow
nloaded from

onset (‘pre-paradoxical sleep’) in OXko/ko mutant and wild-type
animals. This time window was chosen because in wild-type
mice it consistently displays the distinctive EEG features character-
izing slow wave to paradoxical sleep transitions, i.e. decrease in
delta, increase in theta oscillations, and dominance of an irregular
high-amplitude low-frequency theta signal (Franken et al., 1998).
Mutant animal’s pre-paradoxical sleep showed no significant dif-
ference with that of wild-type control mice pre-paradoxical sleep
(Supplementary Fig. 2). CAS and pre-paradoxical sleep EEG power
density spectra could thus directly be compared in OXko/ko ani-
mals. Figure 5 compares spectra of slow wave sleep, pre-paradox-
ical sleep, CAS and paradoxical sleep in OXko/ko mice, revealing
the widely separated profiles of slow wave sleep and paradoxical
sleep. As expected, pre-paradoxical sleep, heralding transition to
paradoxical sleep, stands in between, with a decrease in delta and
increase in theta activity relative to slow wave sleep, but with
delta still dominating over theta (statistics not shown). On the
other hand the CAS EEG spectral profile differs from the three
other states, with a bimodal delta–theta distribution in which
theta dominates (Fig. 5A, lower panel, post hoc paired t-tests,
P5 0.01). Lastly, as expected, paradoxical sleep is essentially lack-
ing delta waves. Interestingly, we found that fast frequencies,
including beta (18–25 Hz) and gamma (35–60 Hz), were increased
in CAS compared with paradoxical sleep or pre-paradoxical sleep
(Fig. 5A lower panel).
Another salient observation was that the theta peak frequency
shows a graded distribution among the three states: theta peak
frequency in CAS is higher than that in pre-paradoxical sleep, but
lower than the one in paradoxical sleep (post hoc Tukey HSD test,
P5 0.01) (Fig. 5B). In contrast, theta peak frequencies of CAS and
HSPT events did not significantly differ from each other (Fig. 5B),
consistent with CAS and HSPT theta activities sharing a common
origin. Altogether, these features argue for differential scoring of
CAS in OXko/ko mice.
Hypersynchronous paroxysmal thetaevents in mice and humansFigure 6 displays the average EEG spectral profile of HSPT bursts in
OXko/ko mice. EEG spectra of slow wave sleep, paradoxical sleep and
CAS were depicted for comparison. Reflecting the high amplitude
and high spectral ‘purity’ of HSPT bursts, HSPT power density in the
theta frequency range reached�4-fold higher values compared with
the other two states dominated by theta activity (i.e. CAS and para-
doxical sleep). In addition to having similar theta peak frequencies
(see above), CAS and HSPT EEG activity closely match each other in
the 1–5 Hz frequency range. This supports the notion that these two
Figure 4 The EEG during waking preceding cataplexy is
enriched in theta and gamma activity. (Top) EEG spectra of
wakefulness (W) during the minute preceding cataplexy
(dark red) and of the remainder of the dark period (black).
Pre-cataplexy wakefulness shows increased EEG power density
in the theta (7.5–11.0 Hz) and gamma (430.5 Hz) frequency
ranges, while activity in the high delta frequency range
(2.5–6.5 Hz) was decreased. Power density values were
expressed as percentage of the individual total EEG power (see
‘Materials and methods’ section). EEG spectra were derived from
discrete Fourier transform of 4 s time windows. Note non-linear
ordinate axis allowing to emphasize EEG activity in the higher
frequency range. (Bottom) Spectral differences seen in top panel
are plotted. A cataplexy/total dark period ratio of 0.0 indicates
no difference, and 1.0, or �1.0, indicate a 2-fold increase, or
decrease, respectively. Horizontal red bar indicates frequency
bins showing significant differences (post hoc paired t-tests,
P50.01).
Figure 3 CAS is highly enriched during cataplexy. Behavioural
state composition of cataplexies occurring during the dark period
(A) compared with composition of the entire 12 h dark period
(B) in OXko/ko mice (n = 8). CAS was enriched 23-fold during
cataplexy relative to the entire dark period. Similarly, HSPT
events were enriched 16-fold in cataplexy (see text). Values
are expressed as percentage of either total 12 h recording time
(B), or time spent in cataplexy (A). Cataplexies represent ca.
21 min or 2.8 � 0.5% of the 12 h dark period. Data are from
eight mice, 24 dark periods with 578 cataplexies.
PS = paradoxical sleep; SWS = slow wave sleep;
W = wakefulness.
EEG paroxysmal theta in cataplexy Brain 2013: 136; 1592–1608 | 1599
at UniversitÃ
© &
EPFL
Lausanne on A
pril 24, 2013http://brain.oxfordjournals.org/
Dow
nloaded from
mutant-specific EEG activities may be related, with CAS possibly
containing covert or less synchronized HSPT rhythmicity.
To gain insight to the significance of HSPTs, we asked which
was the behavioural state in the epoch preceding and following an
HSPT event. We found that the majority (69%) of HSPT events
were followed by the same state they occurred in. Thus HSPT
bursts are not associated with any acute alteration in global
brain state.
Next, we addressed the functional relevance of the HSPT dis-
charges observed in OXko/ko mice to human narcolepsy. Earlier
reports mention the presence of slow-alpha activity mixed with
theta rhythms in the EEG of patients with narcolepsy during cata-
plexy (Guilleminault, 1976; Dyken et al., 1996; Rubboli et al.,
2000; Vetrugno et al., 2010). Moreover, cases of prominent
hypersynchronous theta activity during cataplexy in children
close to disease onset have recently been noticed (G.P., personal
observation). However, until now, theta bursts in cataplexy have
not been systematically investigated. We thus analysed polysom-
nographic recordings of eight cataplexy episodes experienced by
six narcoleptic children (aged 8–11 years) recorded while they
were watching humorous cartoon movies.
Visual examination of the EEG during these cataplexies revealed
three remarkable features: (i) frequent hypersynchronous alpha
(8–10 Hz) oscillations, maximal in occipital derivations (not shown);
alternating with (ii) hypersynchronous theta (3–5 Hz) oscillations,
maximal in central derivations; and most notably (iii) paroxysmal
high-amplitude theta bursts (range 3–5 Hz), displaying a fairly
homogeneous duration of �1.5 s, occasionally fused one to the
other (Fig. 7A and Table 1). The latter pattern and event duration
are highly reminiscent of HSPT events we observed in orexin-null
mice.
Children’s HSPTs were most often observed bilaterally on cen-
tral electrodes, but not always [among 30 HSPT bursts, one was
seen on the left electrode (C3) only, one was left hemisphere-
dominant and one began earlier in the left hemisphere; as seen
in three different children]. Figure 7B shows the spectral profiles of
HSPT bursts for each of the eight cataplexy recordings. The dom-
inant frequency of individual HSPTs varied from 2.5 to 5.0 Hz. In
the patient for whom we have two cataplexy recordings with
HSPT bursts (Patient 6), this value is 4.0 Hz for both episodes.
All eight cataplexy recordings were preceded by segmental cata-
plexy with waxing and waning EMG tone (Vetrugno et al., 2010)
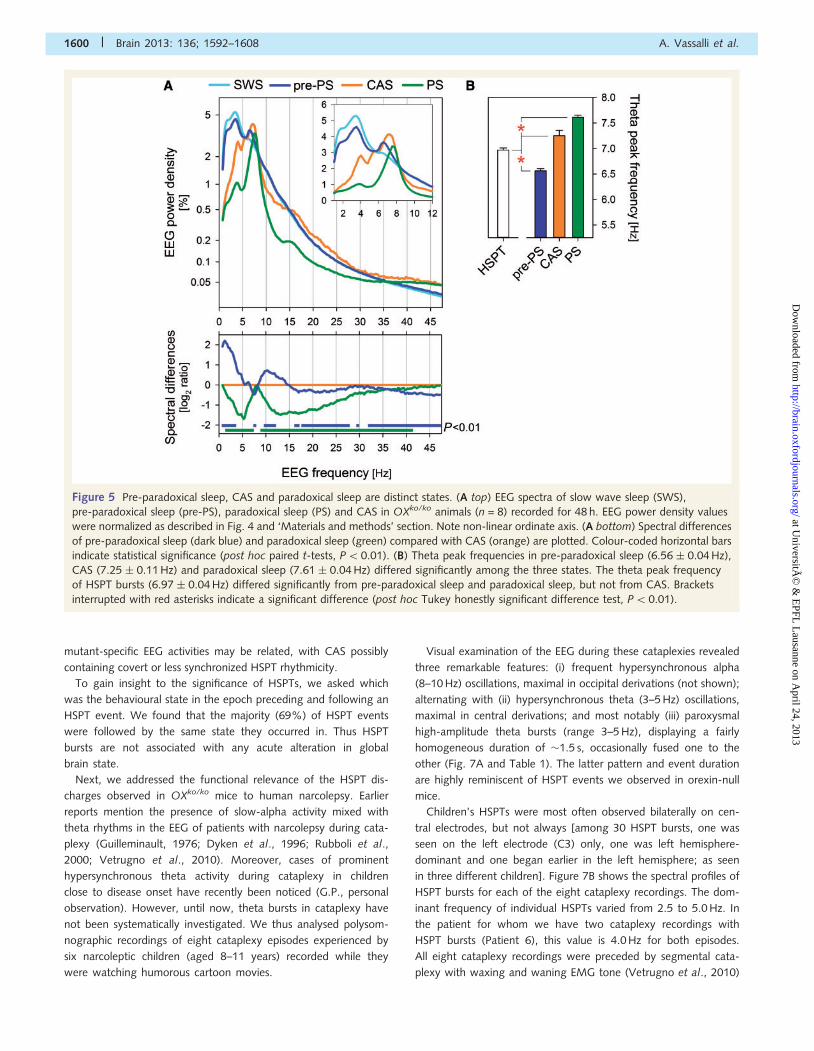
Figure 5 Pre-paradoxical sleep, CAS and paradoxical sleep are distinct states. (A top) EEG spectra of slow wave sleep (SWS),
pre-paradoxical sleep (pre-PS), paradoxical sleep (PS) and CAS in OXko/ko animals (n = 8) recorded for 48 h. EEG power density values
were normalized as described in Fig. 4 and ‘Materials and methods’ section. Note non-linear ordinate axis. (A bottom) Spectral differences
of pre-paradoxical sleep (dark blue) and paradoxical sleep (green) compared with CAS (orange) are plotted. Colour-coded horizontal bars
indicate statistical significance (post hoc paired t-tests, P50.01). (B) Theta peak frequencies in pre-paradoxical sleep (6.56 � 0.04 Hz),
CAS (7.25 � 0.11 Hz) and paradoxical sleep (7.61 � 0.04 Hz) differed significantly among the three states. The theta peak frequency
of HSPT bursts (6.97 � 0.04 Hz) differed significantly from pre-paradoxical sleep and paradoxical sleep, but not from CAS. Brackets
interrupted with red asterisks indicate a significant difference (post hoc Tukey honestly significant difference test, P50.01).
1600 | Brain 2013: 136; 1592–1608 A. Vassalli et al.
at UniversitÃ
© &
EPFL
Lausanne on A
pril 24, 2013http://brain.oxfordjournals.org/
Dow
nloaded from

and all (except Patient 1) ended in global cataplexy (i.e. blunting
of all EMG activity, indicating complete postural collapse, as con-
firmed by video recording).
The pattern of theta bursts in the EEG of these children is remin-
iscent of hypnagogic hypersynchronies, observed in normal infants
and children. Hypnagogic hypersynchronies are paroxysmal runs or
bursts of 3–4.5 Hz waves observed in drowsiness and stage 1 non-
REM sleep. We thus examined our recordings for EEG features dis-
tinguishing stage 1 from cataplexy. Because (i) the submental EMG
tone was observed to be at its minimum during these episodes; and
(ii) sharp REMs were present in the electrooculograms, the children
were unlikely experiencing drowsiness or stage 1 non-REM sleep,
and the identified HSPTs are unlikely to represent hypnagogic hyper-
synchronies. Furthermore, our cataplexy recording protocol included
a nap session before the movie, to decrease the likelihood that the
child feels sleepy during the movie (Serra et al., 2008). Moreover,
hypnagogic hypersynchrony occurrence decreases after age 4 to 5
years, and our patient group consisted of 8 to 11 year-olds (Grigg-
Damberger et al., 2007). Taken together, this argues for the occur-
rence of abnormal paroxysmal theta EEG activity during cataplexy in
young patients with narcolepsy.
Cataplexy time courseIndependent video/EEG analysis of OXko/ko mice allowed us to
examine the evolution of brain activity over cataplexy course.
Examination of individual attacks revealed clear recurrent patterns.
We thus aligned all cataplexy episodes (578 cataplexy episodes;
n = 8 mice) by the first time window scored as cataplexy by video
assessment (i.e. the epoch showing postural collapse). This resulted
in an average time course of EEG/EMG-assessed behavioural states,
plotted in Fig. 8A from 1 min before cataplexy onset to 2 min into
cataplexy. Mean duration of cataplexy was 56 � 2 s, keeping in
mind that minimal duration was defined as 10 s. Most often, body
collapse was followed by a 4–8 s period of waking EEG activity,
shifting to CAS for the next �40 s, and paradoxical sleep activity at
later times. HSPT bursts were most frequent at 8–16 s of onset and
became rare after 28 s of attack onset. A very different picture
emerged when cataplexy episodes were aligned by their end,
rather than onset (not shown). The play-back time course of states
failed to reveal a temporal state structure respective to the episode’s
end. This suggests that a structured, time-measured process is
initiated at cataplexy onset, but that emergence from cataplexy
does not follow a pre-set pattern.
To gain insight to the finer spectral changes in and around cata-
plexy, and to perform an analysis that is independent of state scoring,
we next performed a spectral time-course of cataplexy based only on
EEG measures. Using video-based determination of cataplexy start
and end, all recorded cataplexies were aligned, and the evolution of
the EEG spectral profile from 2 min before to 2 min into cataplexy was
analysed (Fig. 8B), using the same cataplexy data set as used for Fig.
8A. EEG power density values are colour-coded along time and fre-
quency axes using the same logarithmic scaling as in Fig. 8C. The
spectral changes in wakefulness preceding cataplexy onset, revealed
a decrease in delta and an increase in theta activity in the minute
preceding cataplexy, as already described in Fig. 4. Remarkably, this
wakefulness signal stays unchanged for the 4–8 s period after pos-
tural collapse. A dramatic surge in EEG power density across the
entire 1–20 Hz frequency range then follows, with a maximum at
7.2 Hz, lasting until�45 s after cataplexy onset, and rapidly subsiding
thereafter, as the remainder of the cataplexy episode is characterized
by theta-dominated paradoxical sleep-like activity. This late cata-
plexy paradoxical sleep-like phase displays a statistically significant
increase in theta peak frequency (from 7.2 to 7.6 Hz; Fig. 8B and see
Fig. 5), consistent with a potential shift in neural substrate generating
the dominant theta activity (see ‘Discussion’ section). The EEG spec-
trum in the first 45 s of cataplexy resembles the average EEG spec-
trum of epochs scored as CAS (Fig. 8C). Altogether these data reveal
an unexpected EEG fingerprint characteristic of cataplexy onset.
Cataplexy-associated state andhypersynchronous paroxysmal thetaactivities are not hippocampalTo address CAS and HSPT signal origin, EEG and depth recording
electrodes were implanted in various locations of the brain of
OXko/ko animals. Figure 9A shows representative recordings from
a mouse harbouring bilateral EEG electrodes in frontal and parietal
locations, with a cerebellar electrode as common reference (‘4-
EEG’). In this configuration, parietal electrodes overlie the posterior
hippocampus, and detect hippocampal activity, as shown by a
dominant highly regular theta activity in paradoxical sleep (Fig.
9A), while frontal electrodes lie above the prefrontal cortex, and
dominantly record the slow waves in slow wave sleep (Fig. 9A).
During cataplexy, CAS and HSPT signals are seen bilaterally in the
frontal EEG derivations but, surprisingly, remain entirely
Figure 6 EEG spectral profile of HSPT bursts in OXko/ko mice
(n = 8). EEG power density values were normalized as in Fig. 4
(see ‘Materials and methods’ section). HSPT spectrum derives
from 24 dark periods and 498 HSPT events. slow wave sleep
(SWS, blue), paradoxical sleep (PS, green) and CAS (orange)
spectra from the same mice were included for comparison (see
Fig. 5).
EEG paroxysmal theta in cataplexy Brain 2013: 136; 1592–1608 | 1601
at UniversitÃ
© &
EPFL
Lausanne on A
pril 24, 2013http://brain.oxfordjournals.org/
Dow
nloaded from
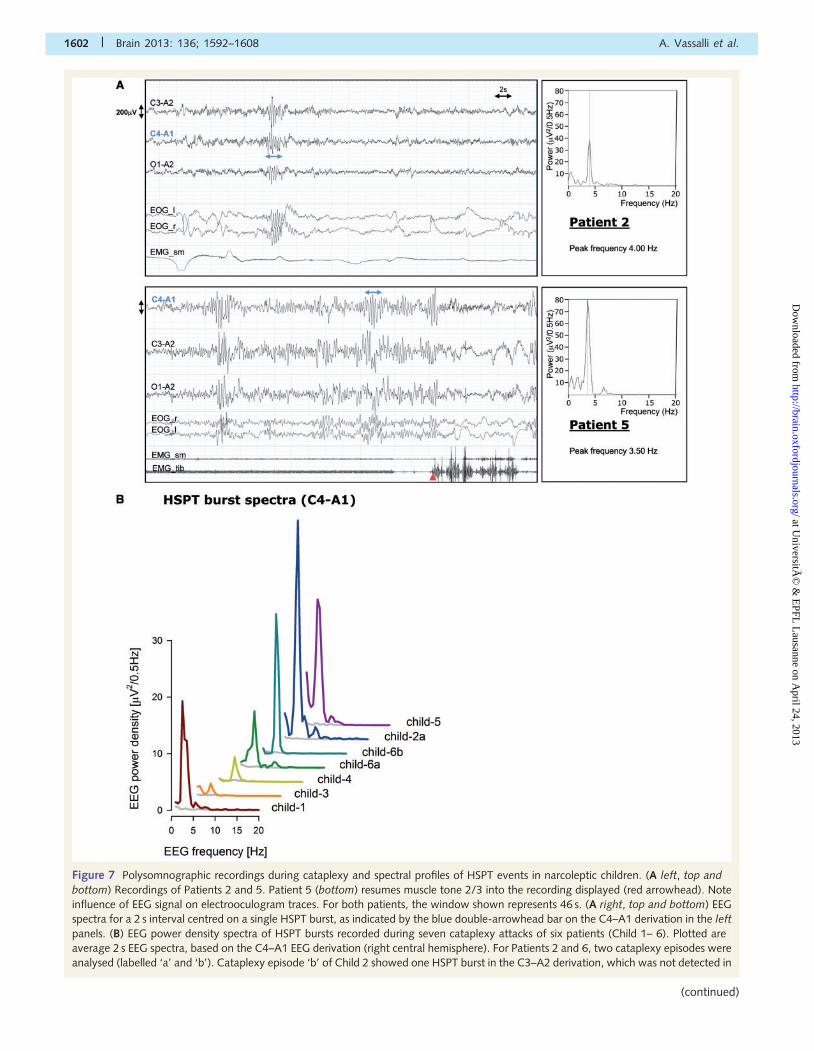
Figure 7 Polysomnographic recordings during cataplexy and spectral profiles of HSPT events in narcoleptic children. (A left, top and
bottom) Recordings of Patients 2 and 5. Patient 5 (bottom) resumes muscle tone 2/3 into the recording displayed (red arrowhead). Note
influence of EEG signal on electrooculogram traces. For both patients, the window shown represents 46 s. (A right, top and bottom) EEG
spectra for a 2 s interval centred on a single HSPT burst, as indicated by the blue double-arrowhead bar on the C4–A1 derivation in the left
panels. (B) EEG power density spectra of HSPT bursts recorded during seven cataplexy attacks of six patients (Child 1– 6). Plotted are
average 2 s EEG spectra, based on the C4–A1 EEG derivation (right central hemisphere). For Patients 2 and 6, two cataplexy episodes were
analysed (labelled ‘a’ and ‘b’). Cataplexy episode ‘b’ of Child 2 showed one HSPT burst in the C3–A2 derivation, which was not detected in
1602 | Brain 2013: 136; 1592–1608 A. Vassalli et al.
(continued)
at UniversitÃ
© &
EPFL
Lausanne on A
pril 24, 2013http://brain.oxfordjournals.org/
Dow
nloaded from
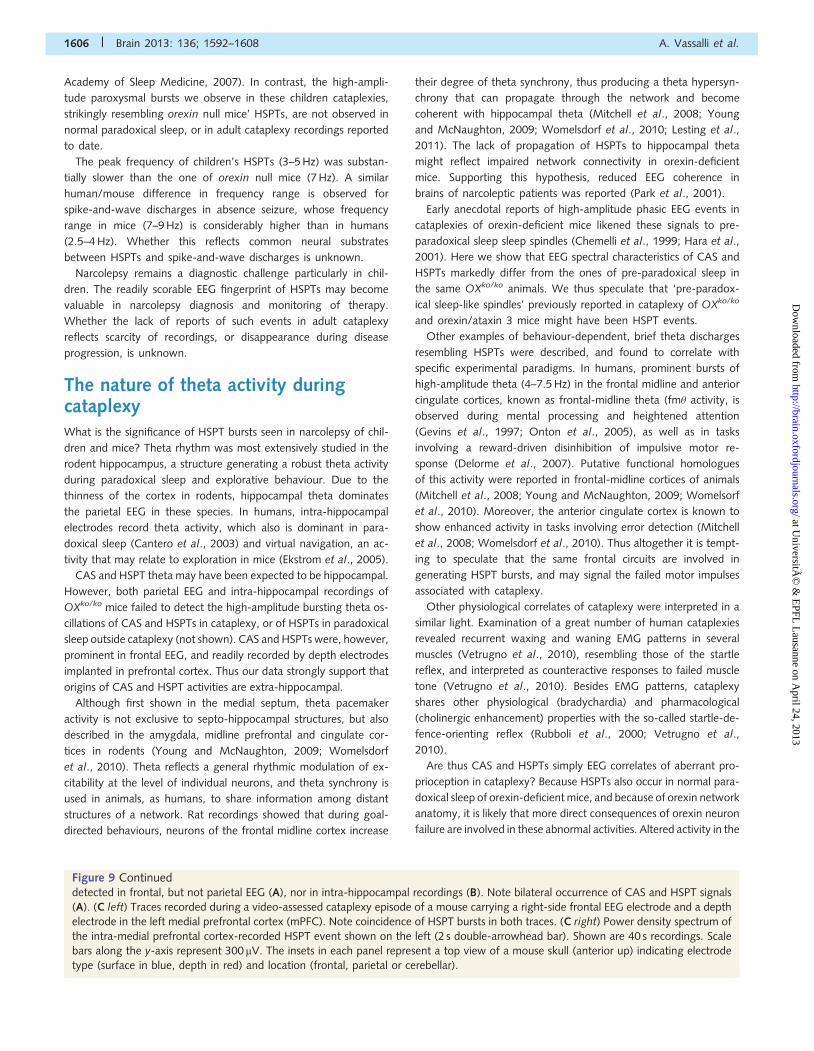
undetected in parietal derivations, which concurrently record a
monotonous theta signal (Fig. 9A). HSPT bursts occurring during
paradoxical sleep outside cataplexy, as the ones during cataplexy,
are not detected in parietal derivations. Lack of diffusion of CAS/
HSPT signals in hippocampal activity suggests a spatially confined
frontal neural substrate to CAS and HSPT.
To confirm this finding, we implanted four mice directly in the
hippocampus. Figure 9B shows representative recordings from a
mouse with a frontal EEG electrode, and a contralateral depth
electrode in the hippocampal CA1 pyramidal layer. Both electrodes
are referred to the cerebellum. In this mouse too, frontally
recorded CAS and HSPT signals do not appear in hippocampal
derivations. We next investigated whether HSPTs could be re-
corded by depth electrodes in the midline prefrontal cortex.
Three mice were implanted with a frontal EEG electrode as
above, and a contralateral depth electrode in the midline prefrontal
cortex. HSPT bursts were faithfully recorded by the midline pre-
frontal cortical electrodes (Fig. 9C). Electrode locations were con-
firmed by brain sectioning and histological examination of each
animal contributing intra-hippocampal (n = 4), or prefrontal cortical
(n = 3) recordings. Fine mapping of the source of CAS and HSPT
activities will require recordings using a denser set of electrodes.
Discussion
Cataplexy as a multi-phased processWe here reveal a sequence of brain activities underlying cataplexy
progression in mice. Most attacks begin by a brief waking EEG phase
with an activity indistinguishable from that seen before body col-
lapse, followed by a phase with high-amplitude irregular theta oscil-
lations, defining a state we term CAS, and conspicuous highly regular
HSPT bursts. Cataplexies longer than 60 s almost invariably end in a
theta pattern undistinguishable from paradoxical sleep, however fre-
quently interspersed with additional HSPT bursts. Occurrence of a
conspicuous HSPT event a few seconds before resumption of EMG
activity is repeatedly seen (data not shown).
We found that CAS and HSPTs are orexin-deficient specific EEG
activities, present both in orexin knockout and orexin/ataxin 3 mice.
Occurrence of high-amplitude regular theta bursts in orexin-defi-
cient mice was independently recognized by Bastianini et al.
(2012). Sinton (2010) described wakefulness-like EEG at cataplexy
onset in orexin-deficient mice and rats, which rapidly progressed to a
paradoxical sleep pattern. We confirm the initial wakefulness phase
and that many cataplexies end with paradoxical sleep. We describe
an intermediary phase, featuring a state whose EEG characteristics
are different from both wakefulness and paradoxical sleep (CAS).
Interestingly, whereas aligning a great number of cataplexies by
their onset reveals a timely structured sequence of EEG activities, it
does not relative to their end. Exit from cataplexy is therefore not the
reversal from its entry. Independent mechanisms for onset and ter-
mination were also suggested in a study in double OX1R-OX2R
knockout mice (Kalogiannis et al., 2011). The authors found that
cholinergic drugs modulated the rate of onset, but not the duration
of behavioural arrests. Cataplexy onset appeared to involve cholin-
ergic-sensitive circuits, whereas cataplexy termination did not. The
authors further observed that duration of arrests fits an exponential
distribution, suggesting that termination is a stochastic process
(Kalogiannis et al., 2011). This is consistent with our finding of un-
predictable duration of the final cataplexy phase.
In narcoleptic dogs, Kushida et al. (1985) distinguished three
phases in food-elicited cataplexies. Following postural collapse,
the first (C1) phase features a wake-like EEG and visual tracking
movements suggesting awareness. EEG amplitude then markedly
increases during a ‘paradoxical sleep-like’ C2 phase, with a theta
rhythm reported maximal over the hippocampal regions, sporadic
REMs and muscle twitches. The final C3 phase shows mixed fre-
quency EEG activity and lack of REMs and muscle twitches.
Whether the dog C2 phase is homologous to mouse CAS will
be interesting to investigate.
In humans, EEG correlates of cataplexy have remained
largely elusive, although descriptions of paradoxical sleep-like,
pre-paradoxical sleep-like, and wakefulness-like activities were
reported (Dyken et al., 1996).
Hypersynchronous paroxysmal theta innarcoleptic childrenIn a large-scale investigation of childhood narcolepsy, we identified
unique early phenotypes of the disease, found to later subside.
These included prominent facial symptoms (‘cataplectic facies’)
and disordered movements, notably during cataplexy, and a
Table 1 Patient’s gender, age, HSPT peak frequency andthe number of HSPT events in C4-A1 derivation per minuteof cataplexy recording (absolute number of events inparentheses)
Cataplexy Patientgender,age (years)
Peakfrequency(Hz)
HSPTevents/min(total)
1 M, 11.0 3.13 0.95 (4)
2a F, 9.8 4.00 1.15 (1)
2b F, 9.8 N/A N/A (0)
3 M, 9.8 4.00 0.59 (2)
4 M, 7.8 4.67 0.54 (5)
5 F, 8.6 3.64 2.02 (17)
6a M, 10.2 4.00 0.63 (1)
6b M, 10.2 4.00 0.58 (1)
Figure 7 ContinuedC4–A1, and is thus not represented. Individual average HSPT spectra are offset horizontally (by 5 Hz) and vertically (by 2.5 mV2/0.5 Hz) to
avoid overlap of curves. Light grey curves represent ‘background’ EEG spectra during cataplexy excluding HSPTs and serve as comparison
of ongoing EEG activity. C = central electrode; O = occipital electrode; A = earlobe reference electrode; EOG_l/EOG_r = electrooculogram
of left/right eye; EMG_sm = electromyogram of submental muscle; EMG_tib = electromyogram of tibialis muscle.
EEG paroxysmal theta in cataplexy Brain 2013: 136; 1592–1608 | 1603
at UniversitÃ
© &
EPFL
Lausanne on A
pril 24, 2013http://brain.oxfordjournals.org/
Dow
nloaded from
tendency to generalized hypotonia and ataxic gait (Serra et al.,
2008; Plazzi et al., 2011). The cataplexy recordings of children
analysed in this study showed frequent runs of alpha oscillations,
alternating with runs of regular theta oscillations. Both these fea-
tures had been previously observed in adult cataplexy
(Guilleminault, 1976; Dyken et al., 1996; Rubboli et al., 2000;
Vetrugno et al., 2010), but also in paradoxical sleep and sleep
paralysis/hypnagogic hallucination of patients with narcolepsy
(Dyken et al., 1996). Moreover, alpha activity is not unusual
during paradoxical sleep in unaffected individuals (American
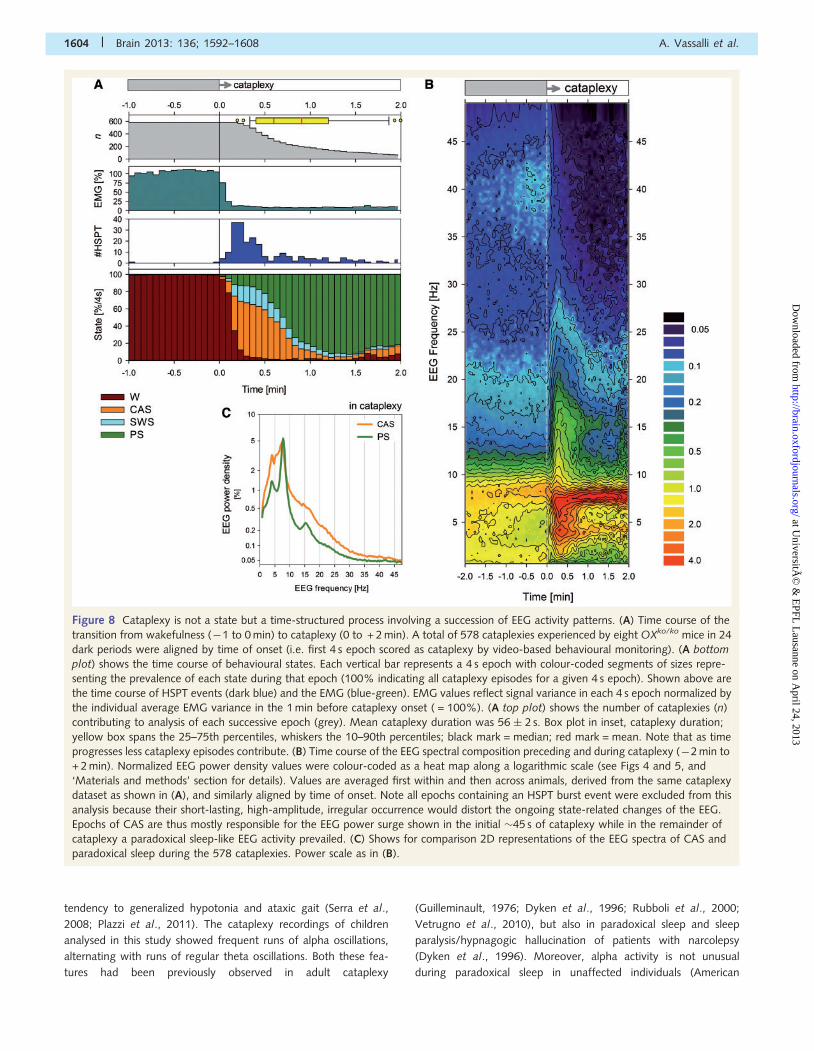
Figure 8 Cataplexy is not a state but a time-structured process involving a succession of EEG activity patterns. (A) Time course of the
transition from wakefulness (�1 to 0 min) to cataplexy (0 to + 2 min). A total of 578 cataplexies experienced by eight OXko/ko mice in 24
dark periods were aligned by time of onset (i.e. first 4 s epoch scored as cataplexy by video-based behavioural monitoring). (A bottom
plot) shows the time course of behavioural states. Each vertical bar represents a 4 s epoch with colour-coded segments of sizes repre-
senting the prevalence of each state during that epoch (100% indicating all cataplexy episodes for a given 4 s epoch). Shown above are
the time course of HSPT events (dark blue) and the EMG (blue-green). EMG values reflect signal variance in each 4 s epoch normalized by
the individual average EMG variance in the 1 min before cataplexy onset ( = 100%). (A top plot) shows the number of cataplexies (n)
contributing to analysis of each successive epoch (grey). Mean cataplexy duration was 56 � 2 s. Box plot in inset, cataplexy duration;
yellow box spans the 25–75th percentiles, whiskers the 10–90th percentiles; black mark = median; red mark = mean. Note that as time
progresses less cataplexy episodes contribute. (B) Time course of the EEG spectral composition preceding and during cataplexy (�2 min to
+ 2 min). Normalized EEG power density values were colour-coded as a heat map along a logarithmic scale (see Figs 4 and 5, and
‘Materials and methods’ section for details). Values are averaged first within and then across animals, derived from the same cataplexy
dataset as shown in (A), and similarly aligned by time of onset. Note all epochs containing an HSPT burst event were excluded from this
analysis because their short-lasting, high-amplitude, irregular occurrence would distort the ongoing state-related changes of the EEG.
Epochs of CAS are thus mostly responsible for the EEG power surge shown in the initial �45 s of cataplexy while in the remainder of
cataplexy a paradoxical sleep-like EEG activity prevailed. (C) Shows for comparison 2D representations of the EEG spectra of CAS and
paradoxical sleep during the 578 cataplexies. Power scale as in (B).
1604 | Brain 2013: 136; 1592–1608 A. Vassalli et al.
at UniversitÃ
© &
EPFL
Lausanne on A
pril 24, 2013http://brain.oxfordjournals.org/
Dow
nloaded from

Figure 9 CAS and HSPT activities of OXko/ko mice are not hippocampal. Shown are surface (EEG) and depth potential recordings in
OXko/ko mice carrying electrodes in various locations. (A) Mouse with EEG electrodes on frontal (F) and parietal (P) cortices of both
hemispheres (‘4-EEG’). (B) Mouse with a frontal EEG electrode on the right cortex (F_r) and a depth electrode within the CA1 pyramidal
layer of the left hippocampus (Hipp_l). All signals shown in this figure are referred to an EEG cerebellar (Cb) electrode. (A and B) (Top)
show recordings during slow wave sleep. Note the characteristic, high-amplitude delta waves, appearing more prominently in frontal than
parietal EEG. Mouse in B wakes up in the last quarter of the recording. (Middle) Recordings in paradoxical sleep (A), or a slow wave sleep-
to-paradoxical sleep transition (B). In paradoxical sleep, a highly regular theta activity is best recorded in parietal cortex overlying the
posterior hippocampus (A), or directly within the hippocampus (B). Note that paradoxical sleep theta activity appears in intra-hippocampal
recording before it appears in surface frontal EEG. (Bottom) Recordings during video-determined cataplexy episodes. HSPT bursts are
EEG paroxysmal theta in cataplexy Brain 2013: 136; 1592–1608 | 1605
(continued)
at UniversitÃ
© &
EPFL
Lausanne on A
pril 24, 2013http://brain.oxfordjournals.org/
Dow
nloaded from
Academy of Sleep Medicine, 2007). In contrast, the high-ampli-
tude paroxysmal bursts we observe in these children cataplexies,
strikingly resembling orexin null mice’ HSPTs, are not observed in
normal paradoxical sleep, or in adult cataplexy recordings reported
to date.
The peak frequency of children’s HSPTs (3–5 Hz) was substan-
tially slower than the one of orexin null mice (7 Hz). A similar
human/mouse difference in frequency range is observed for
spike-and-wave discharges in absence seizure, whose frequency
range in mice (7–9 Hz) is considerably higher than in humans
(2.5–4 Hz). Whether this reflects common neural substrates
between HSPTs and spike-and-wave discharges is unknown.
Narcolepsy remains a diagnostic challenge particularly in chil-
dren. The readily scorable EEG fingerprint of HSPTs may become
valuable in narcolepsy diagnosis and monitoring of therapy.
Whether the lack of reports of such events in adult cataplexy
reflects scarcity of recordings, or disappearance during disease
progression, is unknown.
The nature of theta activity duringcataplexyWhat is the significance of HSPT bursts seen in narcolepsy of chil-
dren and mice? Theta rhythm was most extensively studied in the
rodent hippocampus, a structure generating a robust theta activity
during paradoxical sleep and explorative behaviour. Due to the
thinness of the cortex in rodents, hippocampal theta dominates
the parietal EEG in these species. In humans, intra-hippocampal
electrodes record theta activity, which also is dominant in para-
doxical sleep (Cantero et al., 2003) and virtual navigation, an ac-
tivity that may relate to exploration in mice (Ekstrom et al., 2005).
CAS and HSPT theta may have been expected to be hippocampal.
However, both parietal EEG and intra-hippocampal recordings of
OXko/ko mice failed to detect the high-amplitude bursting theta os-
cillations of CAS and HSPTs in cataplexy, or of HSPTs in paradoxical
sleep outside cataplexy (not shown). CAS and HSPTs were, however,
prominent in frontal EEG, and readily recorded by depth electrodes
implanted in prefrontal cortex. Thus our data strongly support that
origins of CAS and HSPT activities are extra-hippocampal.
Although first shown in the medial septum, theta pacemaker
activity is not exclusive to septo-hippocampal structures, but also
described in the amygdala, midline prefrontal and cingulate cor-
tices in rodents (Young and McNaughton, 2009; Womelsdorf
et al., 2010). Theta reflects a general rhythmic modulation of ex-
citability at the level of individual neurons, and theta synchrony is
used in animals, as humans, to share information among distant
structures of a network. Rat recordings showed that during goal-
directed behaviours, neurons of the frontal midline cortex increase
their degree of theta synchrony, thus producing a theta hypersyn-
chrony that can propagate through the network and become
coherent with hippocampal theta (Mitchell et al., 2008; Young
and McNaughton, 2009; Womelsdorf et al., 2010; Lesting et al.,
2011). The lack of propagation of HSPTs to hippocampal theta
might reflect impaired network connectivity in orexin-deficient
mice. Supporting this hypothesis, reduced EEG coherence in
brains of narcoleptic patients was reported (Park et al., 2001).
Early anecdotal reports of high-amplitude phasic EEG events in
cataplexies of orexin-deficient mice likened these signals to pre-
paradoxical sleep sleep spindles (Chemelli et al., 1999; Hara et al.,
2001). Here we show that EEG spectral characteristics of CAS and
HSPTs markedly differ from the ones of pre-paradoxical sleep in
the same OXko/ko animals. We thus speculate that ‘pre-paradox-
ical sleep-like spindles’ previously reported in cataplexy of OXko/ko
and orexin/ataxin 3 mice might have been HSPT events.
Other examples of behaviour-dependent, brief theta discharges
resembling HSPTs were described, and found to correlate with
specific experimental paradigms. In humans, prominent bursts of
high-amplitude theta (4–7.5 Hz) in the frontal midline and anterior
cingulate cortices, known as frontal-midline theta (fm� activity, is
observed during mental processing and heightened attention
(Gevins et al., 1997; Onton et al., 2005), as well as in tasks
involving a reward-driven disinhibition of impulsive motor re-
sponse (Delorme et al., 2007). Putative functional homologues
of this activity were reported in frontal-midline cortices of animals
(Mitchell et al., 2008; Young and McNaughton, 2009; Womelsorf
et al., 2010). Moreover, the anterior cingulate cortex is known to
show enhanced activity in tasks involving error detection (Mitchell
et al., 2008; Womelsdorf et al., 2010). Thus altogether it is tempt-
ing to speculate that the same frontal circuits are involved in
generating HSPT bursts, and may signal the failed motor impulses
associated with cataplexy.
Other physiological correlates of cataplexy were interpreted in a
similar light. Examination of a great number of human cataplexies
revealed recurrent waxing and waning EMG patterns in several
muscles (Vetrugno et al., 2010), resembling those of the startle
reflex, and interpreted as counteractive responses to failed muscle
tone (Vetrugno et al., 2010). Besides EMG patterns, cataplexy
shares other physiological (bradychardia) and pharmacological
(cholinergic enhancement) properties with the so-called startle-de-
fence-orienting reflex (Rubboli et al., 2000; Vetrugno et al.,
2010).
Are thus CAS and HSPTs simply EEG correlates of aberrant pro-
prioception in cataplexy? Because HSPTs also occur in normal para-
doxical sleep of orexin-deficient mice, and because of orexin network
anatomy, it is likely that more direct consequences of orexin neuron
failure are involved in these abnormal activities. Altered activity in the
Figure 9 Continueddetected in frontal, but not parietal EEG (A), nor in intra-hippocampal recordings (B). Note bilateral occurrence of CAS and HSPT signals
(A). (C left) Traces recorded during a video-assessed cataplexy episode of a mouse carrying a right-side frontal EEG electrode and a depth
electrode in the left medial prefrontal cortex (mPFC). Note coincidence of HSPT bursts in both traces. (C right) Power density spectrum of
the intra-medial prefrontal cortex-recorded HSPT event shown on the left (2 s double-arrowhead bar). Shown are 40 s recordings. Scale
bars along the y-axis represent 300mV. The insets in each panel represent a top view of a mouse skull (anterior up) indicating electrode
type (surface in blue, depth in red) and location (frontal, parietal or cerebellar).
1606 | Brain 2013: 136; 1592–1608 A. Vassalli et al.
at UniversitÃ
© &
EPFL
Lausanne on A
pril 24, 2013http://brain.oxfordjournals.org/
Dow
nloaded from

brain of patients with narcolepsy not undergoing cataplexy was re-
ported, notably in the medial prefrontal cortex (Kim et al., 2008;
Ponz et al., 2010) and type 1 orexin receptor is expressed in
medial prefrontal, cingulate and infralimbic cortices (Marcus et al.,
2001), suggesting direct innervation. Orexin neurons also project to
dopamine neurons of the ventro-tegmental area (Fadel and Deutch,
2002) and modulate critically their function (Borgland et al., 2006).
Thus orexin loss may affect dopaminergic efferents to the striatum
and the medial prefrontal cortex (Vittoz et al., 2006). Movement
disorders of childhood narcolepsy were indeed suggested to reflect
acute destabilization of orexin-dopaminergic interactions (Plazzi
et al., 2011).
ConclusionOur data show that the early phases of cataplexy, characterized
by CAS and HSPT activities, markedly differ from both pre-
paradoxical sleep and paradoxical sleep, and support a model in
which the neural substrates of cataplexy are distinct from those of
paradoxical sleep and paradoxical sleep atonia. Similar activities
are present in childhood narcolepsy with cataplexy, close to
disease onset.
Models of cataplexy circuits should accommodate sudden emer-
gence of theta bursts in frontal cortex, isolated from hippocampal
theta, in absence of functional orexin connectivity. This transient
CAS/HSPT (�7.1 Hz) activity tends to subside after �45 s from
cataplexy onset, as the circuit transitions to a higher theta
(�7.6 Hz) paradoxical sleep-like activity, now engaging the hippo-
campus, and most likely involving the paradoxical sleep circuit. An
unexpected outcome of future cataplexy research may be in fur-
ther understanding prefrontal theta, and its behavioural and emo-
tional correlates.
AcknowledgementsWe would like to thank Celine Favrod for her help in the video
recording set-up, Masashi Yanagisawa and Takeshi Sakurai for the
generous gift of mice, Benjamin Boutrel for discussion, Daniela
Andries and Gianina Luca for help with patient recording assess-
ment, Frederic Schutz for advice on statistical issues, Christina
Schrick for mouse colony management and histological examina-
tion of electrode implantation sites, and the children and their
family for polysomnographic recordings.
FundingThis work was supported by fellowships from the Marie
Heim-Vogtlin program of the Swiss National Science Foundation,
and the Pierre Mercier Foundation for Science (A.V.), and grants
from the Swiss National Science Foundation to A.V. (125323) and
to P.F. supporting YE (130825).
Supplementary materialSupplementary material is available at Brain online.
ReferencesAmerican Academy of Sleep Medicine. Manual for the Scoring of Sleep and
Associated Events: Rules, Terminology and Technical Specifications.
Westchester, IL: American Academy of Sleep Medicine; 2007.Aran A, Lin L, Nevsimalova S, Plazzi G, Hong SC, Weiner K, et al.
Elevated anti-streptococcal antibodies in patients with recent narco-
lepsy onset. Sleep 2009; 32: 979–83.
Bastianini S, Silvani A, Berteotti C, Lo Martire V, Zoccoli G. High-
amplitude theta wave bursts during REM sleep and cataplexy in
hypocretin–deficient narcoleptic mice. J Sleep Res 2012; 21: 185–8.Borgland SL, Taha SA, Sarti F, Fields HL, Bonci A. Orexin A in the VTA is
critical for the induction of synaptic plasticity and behavioral sensitiza-
tion to cocaine. Neuron 2006; 49: 589–601.
Cantero JL, Atienza M, Stickgold R, Kahana MJ, Madsen JR, Kocsis B.
Sleep-dependent theta oscillations in the human hippocampus and
neocortex. J Neurosci 2003; 23: 10897–903.Chemelli RM, Willie JT, Sinton CM, Elmquist JK, Scammell T, Lee C, et al.
Narcolepsy in orexin knockout mice: molecular genetics of sleep
regulation. Cell 1999; 98: 437–51.
Cvetkovic-Lopes V, Bayer L, Dorsaz S, Maret S, Pradervand S,
Dauvilliers Y, et al. Elevated Tribbles homolog 2-specific antibody
levels in narcolepsy patients. J Clin Invest 2010; 120: 713–9.Dauvilliers Y, Arnulf I, Mignot E. Narcolepsy with cataplexy [Review].
Lancet 2007; 369: 499–511.
Delorme A, Westerfield M, Makeig S. Medial prefrontal theta bursts
precede rapid motor responses during visual selective attention.
J Neurosci 2007; 27: 11949–59.
Diniz Behn CG, Klerman EB, Mochizuki T, Lin SC, Scammell TE.
Abnormal sleep/wake dynamics in orexin knockout mice. Sleep
2010; 33: 297–306.
Donadio V, Plazzi G, Vandi S, Franceschini C, Karlsson T, Montagna P,
et al. Sympathetic and cardiovascular activity during cataplexy in
narcolepsy. J Sleep Res 2008; 17: 458–63.
Dyken ME, Yamada T, Lin-Dyken DC, Seaba P, Yeh M. Diagnosing
narcolepsy through the simultaneous clinical and electrophysiologic
analysis of cataplexy. Arch Neurol 1996; 535: 456–60.
Ekstrom AD, Caplan JB, Ho E, Shattuck K, Fried I, Kahana MJ. Human
hippocampal theta activity during virtual navigation. Hippocampus
2005; 15: 881–9. Erratum in Hippocampus 2006; 16: 101.
Fadel J, Deutch AY. Anatomical substrates of orexin-dopamine inter-
actions: lateral hypothalamic projections to the ventral tegmental
area. Neuroscience 2002; 111: 379–87.
Franken P, Malafosse A, Tafti M. Genetic variation in EEG activity during
sleep in inbred mice. Am J Physiol 1998; 275 (4 Pt 2): R1127–37.
Gevins A, Smith ME, McEvoy L, Yu D. High-resolution EEG mapping
of cortical activation related to working memory: effects of task
difficulty, type of processing, and practice. Cereb Cortex 1997; 7:
374–85.
Grigg-Damberger M, Gozal D, Marcus CL, Quan SF, Rosen CL,
Chervin RD, et al. The visual scoring of sleep and arousal in infants
and children [Review]. J Clin Sleep Med 2007; 3: 201–40.
Guilleminault C. Cataplexy. In: Guilleminault C, Passouant P,
Dement WC, editors. Narcolepsy. New York: Spectrum Publication;
1976. p. 125–43.
Gulyani S, Wu MF, Nienhuis R, John J, Siegel JM. Cataplexy-related
neurons in the amygdala of the narcoleptic dog. Neuroscience 2002;
112: 355e65.
Hara J, Beuckmann CT, Nambu T, Willie JT, Chemelli RM, Sinton CM,
et al. Genetic ablation of orexin neurons in mice results in narcolepsy,
hypophagia, and obesity. Neuron 2001; 30: 345–54.
John J, Wu MF, Boehmer LN, Siegel JM. Cataplexy-active neurons in
the hypothalamus: implications for the role of histamine in sleep and
waking behavior. Neuron 2004; 42: 619–34.
Kalogiannis M, Hsu E, Willie JT, Chemelli RM, Kisanuki YY,
Yanagisawa M, et al. Cholinergic modulation of narcoleptic attacks
in double orexin receptor knockout mice. PLoS One 2011; 6: e18697.
EEG paroxysmal theta in cataplexy Brain 2013: 136; 1592–1608 | 1607
at UniversitÃ
© &
EPFL
Lausanne on A
pril 24, 2013http://brain.oxfordjournals.org/
Dow
nloaded from
Kim SJ, Lyoo IK, Lee YS, Sung YH, Kim HJ, Kim JH, et al. IncreasedGABA levels in medial prefrontal cortex of young adults with narco-
lepsy. Sleep 2008; 31: 342–7.
Kushida CA, Baker TL, Dement WC. Electroencephalographic correlates
of cataplectic attacks in narcoleptic canines. ElectroencephalogrClin Neurophysiol 1985; 61: 61–70.
Lesting J, Narayanan RT, Kluge C, Sangha S, Seidenbecher T, Pape HC.
Patterns of coupled theta activity in amygdala-hippocampal-prefrontal
cortical circuits during fear extinction. PLoS One 2011; 6: e21714.Lin L, Faraco J, Li R, Kadotani H, Rogers W, Lin X, et al. The sleep
disorder canine narcolepsy is caused by a mutation in the hypocretin
(orexin) receptor 2 gene. Cell 1999; 98: 365–76.Marcus JN, Aschkenasi CJ, Lee CE, Chemelli RM, Saper CB,
Yanagisawa M, et al. Differential expression of orexin receptors 1
and 2 in the rat brain. J Comp Neurol 2001; 435: 6–25.
Mitchell DJ, McNaughton N, Flanagan D, Kirk IJ. Frontal-midline thetafrom the perspective of hippocampal “theta”. Prog Neurobiol 2008;
86: 156–85.
Mochizuki T, Crocker A, McCormack S, Yanagisawa M, Sakurai T,
Scammell TE. Behavioral state instability in orexin knock-out mice.J Neurosci 2004; 24: 6291–300.
Ohno K, Sakurai T. Orexin neuronal circuitry: role in the regulation of
sleep and wakefulness. Front Neuroendocrinol 2008; 29: 70–87.
Onton J, Delorme A, Makeig S. Frontal midline EEG dynamics duringworking memory. Neuroimage 2005; 27: 341–56.
Overeem S, van Nues SJ, van der Zande WL, Donjacour CE, van
Mierlo P, Lammers GJ. The clinical features of cataplexy: a question-naire study in narcolepsy patients with and without hypocretin-1
deficiency. Sleep Med 2011; 12: 12–8.
Park DH, Kwon JS, Jeong DU. Changes of EEG coherence in narcolepsy
measured with computerized EEG mapping technique. Sleep MedPsychophysiol 2001; 8: 121–8.
Peyron C, Faraco J, Rogers W, Ripley B, Overeem S, Charnay Y, et al.
A mutation in a case of early onset narcolepsy and a generalized ab-
sence of hypocretin peptides in human narcoleptic brains. Nat Med2000; 6: 991–7.
Peyron C, Tighe DK, van den Pol AN, de Lecea L, Heller HC, Sutcliffe JG,
et al. Neurons containing hypocretin (orexin) project to multipleneuronal systems. J Neurosci 1998; 18: 9996–10015.
Plazzi G, Pizza F, Palaia V, Franceschini C, Poli F, Moghadam KK, et al.
Complex movement disorders at disease onset in childhood narcolepsy
with cataplexy. Brain 2011; 134: 3480–92.Ponz A, Khatami R, Poryazova R, Werth E, Boesiger P, Bassetti CL, et al.
Abnormal activity in reward brain circuits in human narcolepsy with
cataplexy. Ann Neurol 2010; 67: 190–200.
Ritchie C, Okuro M, Kanbayashi T, Nishino S. Hypocretin liganddeficiency in narcolepsy: recent basic and clinical insights [Review].
Curr Neurol Neurosci Rep 2010; 10: 180–9.
Rubboli G, d’Orsi G, Zaniboni A, Gardella E, Zamagni M, Rizzi R, et al.A video-polygraphic analysis of the cataplectic attack. Clin
Neurophysiol 2000; 111 (Suppl 2): S120–8.
Salzman CD, Fusi S. Emotion, cognition, and mental state representation
in amygdala and prefrontal cortex. Annu Rev Neurosci 2010; 33:
173–202.
Saper CB, Chou TC, Scammell TE. The sleep switch: hypothalamic
control of sleep and wakefulness [Review]. Trends Neurosci 2001;
24: 726–31.
Saper CB, Fuller PM, Pedersen NP, Lu J, Scammell TE. Sleep state switch-
ing [Review]. Neuron 2010; 68: 1023–42.
Scammell TE, Willie JT, Guilleminault C, Siegel JM; International
Working Group on Rodent Models of Narcolepsy. A consensus defin-
ition of cataplexy in mouse models of narcolepsy. Sleep 2009; 32:
111–6.
Serra L, Montagna P, Mignot E, Lugaresi E, Plazzi G. Cataplexy features
in childhood narcolepsy. Mov Disord 2008; 23: 858–65.
Sinton CM. Animal models of narcolepsy: development, findings and
perspectives. In: Goswami M, Pandi-Perumal SR, Thorpy MJ, editors.
Narcolepsy: a Clinical Guide. New York, USA: Springer; 2010.Sinton CM. Orexin/hypocretin plays a role in the response to physio-
logical disequilibrium. Sleep Med Rev 2011; 15: 197–207.Stamelou M, Plazzi G, Lugaresi E, Edwards MJ, Bhatia KP. The dis-
tinct movement disorder in anti-NMDA receptor encephalitis may
be related to status dissociatus: A hypothesis. Mov Disord 2012; 27:
1360–3.Thannickal TC, Moore RY, Nienhuis R, Ramanathan L, Gulyani S,
Aldrich M, et al. Reduced number of hypocretin neurons in human
narcolepsy. Neuron 2000; 27: 469–74.Tucci V, Stegagno L, Vandi S, Ferrillo F, Palomba D, Vignatelli L, et al.
Emotional information processing in patients with narcolepsy: a psy-
chophysiologic investigation. Sleep 2003; 26: 558–64.Valatx JL, Bugat R, Jouvet M. Genetic studies of sleep in mice. Nature
1972; 238: 226–7.Vetrugno R, D’Angelo R, Moghadam KK, Vandi S, Franceschini C,
Mignot E, et al. Behavioural and neurophysiological correlates of
human cataplexy: a video-polygraphic study. Clin Neurophysiol
2010; 121: 153–62.Vittoz NM, Berridge CW. Hypocretin/orexin selectively increases
dopamine efflux within the prefrontal cortex: involvement of
the ventral tegmental area. Neuropsychopharmacology 2006; 31:
384–95.Willie JT, Chemelli RM, Sinton CM, Tokita S, Williams SC, Kisanuki YY,
et al. Distinct narcolepsy syndromes in Orexin receptor-2 and Orexin
null mice: molecular genetic dissection of Non-REM and REM sleep
regulatory processes. Neuron 2003; 38: 715–30.
Womelsdorf T, Vinck M, Leung LS, Everling S. Selective theta-synchron-
ization of choice-relevant information subserves goal-directed behav-
ior. Front Hum Neurosci 2010; 4: 210.
Young CK, McNaughton N. Coupling of theta oscillations between
anterior and posterior midline cortex and with the hippocampus in
freely behaving rats. Cereb Cortex 2009; 19: 24–40.
1608 | Brain 2013: 136; 1592–1608 A. Vassalli et al.
at UniversitÃ
© &
EPFL
Lausanne on A
pril 24, 2013http://brain.oxfordjournals.org/
Dow
nloaded from