Modelling of ground deformation and gravity fields using finite element method: an application to...
12
Geophys. J. Int. (2007) 169, 775–786 doi: 10.1111/j.1365-246X.2007.03380.x GJI Volcanology, geothermics, fluids and rocks Modelling of ground deformation and gravity fields using finite element method: an application to Etna volcano Gilda Currenti 1 , Ciro Del Negro 1 and Gaetana Ganci 1,2 1 Istituto Nazionale di Geofisica e Vulcanologia, Sezione di Catania, Italy. E-mail: [email protected] 2 Dipartimento di Ingegneria Elettrica, Elettronica e dei Sistemi, Universit` a di Catania, Italy Accepted 2007 February 6. Received 2006 December 21; in original form 2006 October 4 SUMMARY Elastic finite element models are applied to investigate the effects of topography and medium heterogeneities on the surface deformation and the gravity field produced by volcanic pres- sure sources. Changes in the gravity field cannot be interpreted only in terms of gain of mass disregarding the ground deformation of the rocks surrounding the source. Contributions to gravity changes depend also on surface and subsurface mass redistribution driven by dilation of the volcanic source. Both ground deformation and gravity changes were firstly evaluated by solving a coupled axisymmetric problem to estimate the effects of topography and medium het- erogeneities. Numerical results show significant discrepancies in the ground deformation and gravity field compared to those predicted by analytical solutions, which disregard topography, elastic heterogeneities and density subsurface structures. With this in mind, we reviewed the ex- pected gravity changes accompanying the 1993–1997 inflation phase on Mt Etna by setting up a fully 3-D finite element model in which we used the real topography, to include the geometry, and seismic tomography, to infer the crustal heterogeneities. The inflation phase was clearly detected by different geodetic techniques (EDM, GPS, SAR and levelling data) that showed a uniform expansion of the overall volcano edifice. When the gravity data are integrated with ground deformation data and a coupled FEM modelling was solved, a mass intrusion could have occurred at depth to justify both ground deformation and gravity observations. Key words: Etna volcano, finite element method, gravity changes, ground deformation. INTRODUCTION Microgravity and geodetic observations have proven to be useful methods for the monitoring of the volcanic activity and for the quantitative evaluation of the geophysical processes preceding and accompanying volcanic unrest (Carbone et al. 2003; Gottsmann et al. 2006). Ground deformation studies provide insight about vol- ume changes in the magma reservoir and the dynamics of dike in- trusion processes (Voight et al.1998; Battaglia et al. 2003; Murase et al. 2006). However, deformation data alone are not able to prop- erly constrain the mass of the intrusions. Geodetic studies need to be supported by gravity observations in order to infer the density of the intrusive body and better define the volcanic source (Carbone et al. 2006). Attempts to model gravity changes which are expected to accom- pany crustal deformation often involve a great deal of effort due to the complexity of the problem. A series of analytical solutions for modelling ground deformation and gravity changes due to volcanic sources have been devised and widely used in literature (Okubo 1992; Jousset et al. 2003). These models take into account the inter- action between the intrusive mass and the effect caused by volcanic pressure sources. Most of the analytical formulations for modelling inflation and deflation episodes are based on the assumption of a pressurized magma chamber embedded in a homogeneous elastic half-space. These models describe the effects caused by sources with a specific shape such as spheres (Hagiwara 1977), ellipsoids (Battaglia & Segall 2004) or rectangular prisms (Okubo & Watanabe 1989). Analytical elastic models are quite attractive because of their computational feasibility. However, investigations of the effect of a non-uniform elastic medium are indispensable for describing more realistic models. For the static elastic deformation in a multilay- ered half-space, there exist a number of semi-analytical and numer- ical solutions (Bonafede et al. 2002; Wang et al. 2003; Zhao et al. 2004). For the gravity field, Rundle (1980) devised the solution of the coupled self-gravitational model due to a magma intrusion in elastic-gravitational layered medium (Fernandez et al. 1997; Charco et al., 2004; Tiampo et al. 2004). In volcanic areas, however, not only elastic heterogeneities but also density stratifications are also to be accounted for (Fernandez et al. 1999). Moreover, volcanic ar- eas are usually characterized by consistent topographic relief that is responsible for significant effects (Williams & Wadge 1998). In- vestigations were firstly carried out by means of numerical methods to assess the effect of topography on ground deformation at Etna volcano (Cayol & Cornet 1998; Williams & Wadge 2000). Lately, C 2007 The Authors 775 Journal compilation C 2007 RAS
-
Upload
independent -
Category
Documents
-
view
1 -
download
0
Transcript of Modelling of ground deformation and gravity fields using finite element method: an application to...

Geophys. J. Int. (2007) 169, 775–786 doi: 10.1111/j.1365-246X.2007.03380.x
GJI
Vol
cano
logy
,ge
othe
rmic
s,flui
dsan
dro
cks
Modelling of ground deformation and gravity fields using finiteelement method: an application to Etna volcano
Gilda Currenti1, Ciro Del Negro1 and Gaetana Ganci1,2
1Istituto Nazionale di Geofisica e Vulcanologia, Sezione di Catania, Italy. E-mail: [email protected] di Ingegneria Elettrica, Elettronica e dei Sistemi, Universita di Catania, Italy
Accepted 2007 February 6. Received 2006 December 21; in original form 2006 October 4
S U M M A R YElastic finite element models are applied to investigate the effects of topography and mediumheterogeneities on the surface deformation and the gravity field produced by volcanic pres-sure sources. Changes in the gravity field cannot be interpreted only in terms of gain of massdisregarding the ground deformation of the rocks surrounding the source. Contributions togravity changes depend also on surface and subsurface mass redistribution driven by dilationof the volcanic source. Both ground deformation and gravity changes were firstly evaluated bysolving a coupled axisymmetric problem to estimate the effects of topography and medium het-erogeneities. Numerical results show significant discrepancies in the ground deformation andgravity field compared to those predicted by analytical solutions, which disregard topography,elastic heterogeneities and density subsurface structures. With this in mind, we reviewed the ex-pected gravity changes accompanying the 1993–1997 inflation phase on Mt Etna by setting upa fully 3-D finite element model in which we used the real topography, to include the geometry,and seismic tomography, to infer the crustal heterogeneities. The inflation phase was clearlydetected by different geodetic techniques (EDM, GPS, SAR and levelling data) that showeda uniform expansion of the overall volcano edifice. When the gravity data are integrated withground deformation data and a coupled FEM modelling was solved, a mass intrusion couldhave occurred at depth to justify both ground deformation and gravity observations.
Key words: Etna volcano, finite element method, gravity changes, ground deformation.
I N T RO D U C T I O N
Microgravity and geodetic observations have proven to be useful
methods for the monitoring of the volcanic activity and for the
quantitative evaluation of the geophysical processes preceding and
accompanying volcanic unrest (Carbone et al. 2003; Gottsmann
et al. 2006). Ground deformation studies provide insight about vol-
ume changes in the magma reservoir and the dynamics of dike in-
trusion processes (Voight et al.1998; Battaglia et al. 2003; Murase
et al. 2006). However, deformation data alone are not able to prop-
erly constrain the mass of the intrusions. Geodetic studies need to
be supported by gravity observations in order to infer the density of
the intrusive body and better define the volcanic source (Carbone etal. 2006).
Attempts to model gravity changes which are expected to accom-
pany crustal deformation often involve a great deal of effort due to
the complexity of the problem. A series of analytical solutions for
modelling ground deformation and gravity changes due to volcanic
sources have been devised and widely used in literature (Okubo
1992; Jousset et al. 2003). These models take into account the inter-
action between the intrusive mass and the effect caused by volcanic
pressure sources. Most of the analytical formulations for modelling
inflation and deflation episodes are based on the assumption of a
pressurized magma chamber embedded in a homogeneous elastic
half-space. These models describe the effects caused by sources
with a specific shape such as spheres (Hagiwara 1977), ellipsoids
(Battaglia & Segall 2004) or rectangular prisms (Okubo & Watanabe
1989). Analytical elastic models are quite attractive because of their
computational feasibility. However, investigations of the effect of a
non-uniform elastic medium are indispensable for describing more
realistic models. For the static elastic deformation in a multilay-
ered half-space, there exist a number of semi-analytical and numer-
ical solutions (Bonafede et al. 2002; Wang et al. 2003; Zhao et al.2004). For the gravity field, Rundle (1980) devised the solution of
the coupled self-gravitational model due to a magma intrusion in
elastic-gravitational layered medium (Fernandez et al. 1997; Charco
et al., 2004; Tiampo et al. 2004). In volcanic areas, however, not
only elastic heterogeneities but also density stratifications are also
to be accounted for (Fernandez et al. 1999). Moreover, volcanic ar-
eas are usually characterized by consistent topographic relief that
is responsible for significant effects (Williams & Wadge 1998). In-
vestigations were firstly carried out by means of numerical methods
to assess the effect of topography on ground deformation at Etna
volcano (Cayol & Cornet 1998; Williams & Wadge 2000). Lately,
C© 2007 The Authors 775Journal compilation C© 2007 RAS

776 G Currenti, C. D. Negro and G. Ganci
both topography and medium heterogeneities were included for in-
terpreting surface deformation patterns observed on Etna volcano
during recent eruptions (Bonaccorso et al. 2005).
Although several studies on the deformation field were per-
formed, few investigations have been carried out to asses how
medium heterogeneity and topography can also influence gravity
changes in volcanic areas. To fill this lack we evaluated both ground
deformation and gravity changes using finite element method (FEM)
computations. Initially, we focused our attention on the effects given
by introducing elastic and density heterogeneities. Successively, sev-
eral tests were carried out to appraise the influence of topography
on ground deformation and gravity field. Finally, we performed a
3-D finite element modelling to analysing the inflation episode in
1993–1997 at Mt Etna, in which the elastic and density properties
of volcanic edifice and its real topography were introduced. We also
compared analytical and numerical solutions to estimate the discrep-
ancies that could be caused by neglecting medium heterogeneities
and topographic relief.
G RO U N D D E F O R M AT I O N
A N D G R AV I T Y VA R I AT I O N S
I N V O L C A N I C A R E A S
Temporal changes in ground deformation and gravity field have
been frequently detected during inflation or deflation episodes in
volcanic areas. Subsurface displacement fields caused by pressure
sources necessarily alter the density distribution of the medium that
in turn affects the gravity field. The gravity anomaly δg, related to
the mass redistribution, can be calculated by solving the follow-
ing Poisson’s differential equation for the gravitational potential øg
using appropriate boundary conditions (Cai & Wang 2005):
∇2φg = −4πG�ρ(x, y, z), (1)
where G denotes the universal gravitational constant and �ρ(x, y,
z) is the change in the density distribution. Generally, the total grav-
ity change at a benchmark on the ground surface associated with
pressure source changes is given by:
δg(x, y, z) = −∂φg
∂z+ δg0, (2)
where δg0 represents the ‘free air’ gravity change accompanying
the uplift of the observation site. In fact, the deformation moves the
point of measurement relative to the centre of gravity of the Earth
with a consequent change in gravity. The density variations related
to the subsurface mass redistribution can be accounted for by three
main terms:
�ρ(x, y, z) = −u · ∇ρ0 + δρ1 − ρ0∇ · u (3)
where u is the displacement field, ρ 0 is the embedding medium den-
sity and δρ 1 is the density change due to the new intrusive mass. The
first term is due to the displacement of density boundaries in hetero-
geneous media. The second-term originates from the density change
related to the introduction of the new mass into the pressurized vol-
ume, and the third term is the contribution due to the volume change
arising from compressibility of the surrounding medium (Bonafede
& Mazzanti 1998).
Each term in the density variation contributes in the total grav-
ity change observed at the ground surface. Therefore, the gravity
changes caused by pressure sources are made up by four different
contributions:
δg = δg0 + δg1 + δg2 + δg3, (4)
where δg1 arises from the first term in eq. (3); δg2 denotes the
contribution of the inflation source (second term in eq. 3); and δg3 is
the gravity change produced by density variations in the surrounding
medium (third term in eq. 3).
Free-air correction only adjusts for the elevation of the observa-
tion point that, in first approximation, is given by:
δg0 = −γ δh, (5)
where γ is the free-air gravity gradient (γ = 308.6 μGal m−1,
1 μGal = 10−8 m s−2) and δh the elevation change.
Usually, δg1 is only accounted for the excess mass above the
reference level corresponding to the upheaved portion of the free
surface. A simple Bouguer correction is applied assuming the mass
distributed as an infinite slab with thickness equal to the uplift.
In mountainous regions, a more complex terrain correction must
be performed. Terrain effect and Bouguer anomalies can cause γ
to differ by up to 40% from its theoretical value (Rymer 1994).
Furthermore, in volcanic areas density heterogeneity of the sub-
surface structures can contribute to density variation through the
displacement of the buried density interfaces. The δg1 and δg3
terms highlight that the computation of the displacement field at
depth is required in order to evaluate these gravity contributions. It
calls that changes in the gravity field cannot be interpreted only in
term of additional mass input disregarding the deformations of the
surrounding rocks (Charco et al. 2006). Since gravity changes are
strictly related with deformation of the elastic medium, deforma-
tion field and the gravity anomalies produced by volcanic sources
need to be modelled jointly. In the following we solve a coupled nu-
merical problem computing the displacement field and the gravity
anomaly to estimate the effects of δg1, δg2 and δg3 terms on the total
gravity variation. Numerical techniques, such as FEM, have been
widely used to compute the displacement field caused by pressure
sources. FEM is also appropriate to be used in solving the Poisson’s
differential eq. (1). Therefore, once the numerical solution of elastic
deformation and its derivatives are computed, the coupled gravity
potential field can be calculated using a FEM to derive the gravity
changes.
N U M E R I C A L M O D E L
The great advantage of the FEM is its flexibility: by dividing the
computational domain in small elements (meshing operation), it’s
possible to associate to each element different physical properties
such as elastic parameters or densities. Since smaller or curvilinear
elements can be used in order to fit every kind of roughness, complex
shapes of the computational domain or sources can be considered.
In order to investigate the gravity variations caused by pressure
changes, we solve the model equations in two steps. Firstly, we solve
the deformation field in terms of elastostatic equilibrium equations,
computing the displacement field and the stress field at each point
of the domain. Secondly, we resolve the coupled problem for the
gravity field, in which the solutions of the deformation field are used
to compute the δg1, δg2 and δg3 contributions. Computations are
carried out using the commercial software COMSOL Multiphysics,
version 3.2.
The numerical analysis involves setting up of some parameters
that could affect the accuracy of the solution. The size of the compu-
tational domain and the size of the finite elements are to be accurately
chosen. The domain size is important because of the assignment of
the boundary conditions. In order to solve the Poisson’s differen-
tial eq. (1), the potential or the potential derivative (Dirichlet or
Neumann boundary conditions) is to be assigned at the boundaries
C© 2007 The Authors, GJI, 169, 775–786
Journal compilation C© 2007 RAS

Modelling of ground deformation and gravity fields using finite element method 777
of the domain. Because the gravity potential is generally unknown
on the boundaries, the boundary condition is set up to φ = 0 at
infinite distance (Zhang et al. 2004). Since in numerical methods
the size domain is finite, this boundary condition is implemented by
considering a domain big enough that the assumption of zero poten-
tial at the boundary does not affect the solution in the interested area.
As for finite elements size, the meshing operation is a fundamental
step: the smaller the elements, the more precise the solution. How-
ever, if too small elements are used, the number of nodes in which
the equations are to be solved increases and computation becomes
heavy.
As preliminary tests, we consider a 3-D axisymmetric model. In
such a case a simpler 2-D domain can be considered by exploiting
the symmetries. Hence, the number of nodes, in which the solution
is computed, decreases significantly. We choose this model with the
aim to perform a coarser analysis and carry out several tests to assess
the goodness of numerical solutions.
A X I S Y M M E T R I C M O D E L
Benchmark tests were carried out on the axisymmetric models in or-
der to analyse the δg1, δg2 and δg3 gravity terms. A computational
domain of a 100 × 100 km2 was considered for the deformation
field calculations. As for boundary conditions, we fix to zero the
radial displacement along the axis of symmetry and the vertical dis-
placement at the bottom. The radial and vertical displacements on
the outermost boundaries at 100 km from the axis are both set to
zero, while the ground surface is under stress free condition. Since
the different contributions to density variation (eq. 3) are linearly
summed in the Poisson’s equation, we can solve the three terms δg1,
δg2 and δg3 separately thanks to the superposition principle. All the
gravity anomalies were solved extending the computational domain
up to a distance of 100 km, in a way to assume the gravity potential
equal to zero to the external boundaries. Neumann conditions are
instead imposed on gravity potential along the symmetry axis. To
perform comparisons with analytical solutions available, we choose
to model the ground deformation and the gravity change caused by
a spherical source, with overpressure 100 MPa and radius 0.5 km,
buried at a depth of 5 km in a half-space homogeneous medium
characterized by a density value ρ 0 of 2500 kg m−3 and a Young
modulus of 62.5 GPa. Following this framework, the numerical so-
lutions were compared with the analytical ones. The gravity changes
δg1, δg2 and δg3 caused by the expansion of a spherical source em-
bedded in a homogeneous Poisson’s medium (λ = μ) are given by
the following analytical expressions (Hagiwara 1977):
δg1 = 2πGρ0δh, (6)
δg2 = G[(ρ ′ − ρ0)�V + (
ρ ′ − ρ)
V] z
(z2 + r 2)3/2, (7)
δg3 = −2
3πGρ0δh, (8)
where ρ(ρ ′) and V (V ′) are the average density and the volume of
the source before (after) the inflation, �V = V ’ – V is the vol-
ume change and δh is the elevation change at the surface (Mogi
1958). The δg2 term takes into account: (i) the displacement of the
source boundaries, which implies replacement of surrounding mass
(δg2� V ) and (ii) the input of new mass inside the source volume
(δg2V ).
We found a good trade-off between the computational domain
and the computational load in a way to ensure good correspondence
between the analytical and numerical solutions for both deformation
and gravity fields (Fig. 1). For the computation of the δg2 contribu-
tion, we assumed ρ = 2400 kg m–3 and ρ ′ = 2800 kg m–3. If the
source inflates without addition of new mass (V ′ρ ′ = Vρ), the δg2
contribution becomes:
δg2 = −4
3πGρ0δh = −Gρ0�V
z
(z2 + r 2)3/2(9)
which is equivalent to the contribution of a volume �V that was
initially filled with surrounding rock density material and become
empty after the expansion (Bonafede & Mazzanti 1998). In such a
case the overall gravity change (δg1 + δg2 + δg3) due to the de-
formation of a homogeneous half-space caused by a point source
vanishes identically (Walsh and Rice 1979). Also in this case, nu-
merical results agree with the analytical ones (Fig. 2).
On the basis of this favourable domain configuration, we carried
out several tests to appraise the effects of heterogeneity and topogra-
phy on elevation and gravity changes. In the beginning, we studied
the effects caused by the structural multi-layering of the medium.
Successively, we took into account simple topographic profiles to
evaluate the influence of the topography effect on the solutions.
It is worth to note that the δg2V contribution depends only on
the difference between the average density of the source before
and after the inflation and on the distance between the observation
point and the source. Therefore, this contribution is not affected
by the medium heterogeneities. Moreover, for spherical sources the
topography can be included by replacing the source depth z by z′,where z′ = z + f with f the elevation above the reference level. As
a result, in the following we numerically compute only the δg2� V
term since no differences are found between the numerical and the
analytical solution for the δg2V term.
A stratified medium was considered by introducing several layers
of material with different Young’s moduli and density values. Since
density and elastic material properties can be inferred from seismic
p-wave propagation velocities Vp (Birch 1961; Brocher 2005), it is
reasonable to use seismic tomography data to define the geophys-
ical properties of the stratified medium. As for the density values,
in literature there exist several empirical laws that relate seismic
wave velocities and density values on the basis of subsurface geom-
etry of geologic units and of chemical composition of the Earth’s
crust (Brocher 2005). We have derived a density model of the crust
by using four density-velocity empirical relationships (Christensen
& Mooney 1995; Brocher 2005). These laws are interpolated by
means of a third order polynomial function that yields the following
relationship:
ρ = 1.2861 + 0.5498Vp − 0.0930V 2p + 0.007V 3
p , (10)
where ρ is the medium density (Fig. 3). As for elastic parameters,
if a Poisson medium (Poisson ratio equal to 0.25) is assumed, the
Young’s modulus, E, is related to ρ and Vp through the following
relation:
E = 5
6ρV 2
P. (11)
Starting from these assumptions, we built a multilayered crustal
structure with six horizontal layers whose elastic and density pa-
rameters are reported in Table 1.
Multilayered model
The gravity contributions δg1, δg2 and δg3 were evaluated for a
pressurized spherical source embedded in the multilayered medium
C© 2007 The Authors, GJI, 169, 775–786
Journal compilation C© 2007 RAS
778 G Currenti, C. D. Negro and G. Ganci
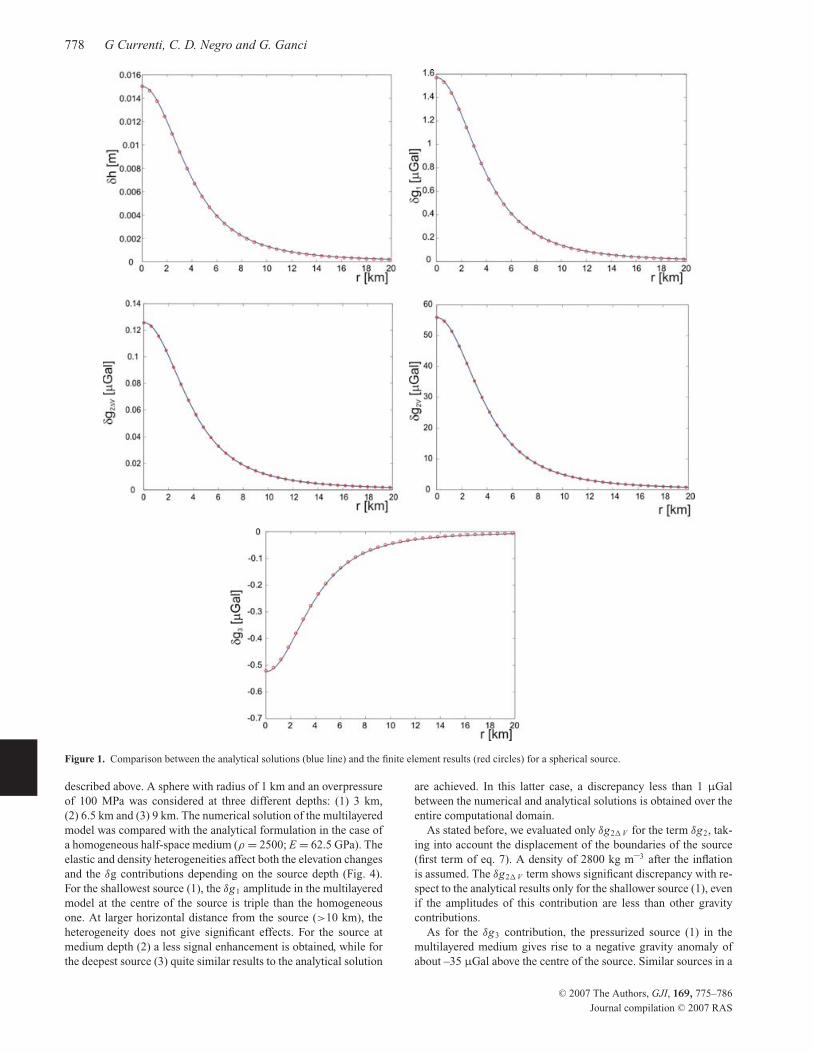
Figure 1. Comparison between the analytical solutions (blue line) and the finite element results (red circles) for a spherical source.
described above. A sphere with radius of 1 km and an overpressure
of 100 MPa was considered at three different depths: (1) 3 km,
(2) 6.5 km and (3) 9 km. The numerical solution of the multilayered
model was compared with the analytical formulation in the case of
a homogeneous half-space medium (ρ = 2500; E = 62.5 GPa). The
elastic and density heterogeneities affect both the elevation changes
and the δg contributions depending on the source depth (Fig. 4).
For the shallowest source (1), the δg1 amplitude in the multilayered
model at the centre of the source is triple than the homogeneous
one. At larger horizontal distance from the source (>10 km), the
heterogeneity does not give significant effects. For the source at
medium depth (2) a less signal enhancement is obtained, while for
the deepest source (3) quite similar results to the analytical solution
are achieved. In this latter case, a discrepancy less than 1 μGal
between the numerical and analytical solutions is obtained over the
entire computational domain.
As stated before, we evaluated only δg2� V for the term δg2, tak-
ing into account the displacement of the boundaries of the source
(first term of eq. 7). A density of 2800 kg m–3 after the inflation
is assumed. The δg2� V term shows significant discrepancy with re-
spect to the analytical results only for the shallower source (1), even
if the amplitudes of this contribution are less than other gravity
contributions.
As for the δg3 contribution, the pressurized source (1) in the
multilayered medium gives rise to a negative gravity anomaly of
about –35 μGal above the centre of the source. Similar sources in a
C© 2007 The Authors, GJI, 169, 775–786
Journal compilation C© 2007 RAS

Modelling of ground deformation and gravity fields using finite element method 779
Figure 2. Comparison between the analytical solutions (solid line) and the
finite element results (circles) for the δg1 (blue), δg2� V (red) and δg3
(green). The overall gravity change vanishes identically (black circle) as
demonstrated analytically (black solid line) by Walsh and Rice (1979).
homogeneous medium bring only about –11 μGal. In Fig. 4 are
shown significant differences between the heterogeneous and ho-
mogeneous model mainly on the ground surface above the source.
The (2) and (3) heterogeneous models generate quite similar grav-
ity anomalies to the analytical ones (Fig. 4). Indeed, the misfit with
respect to the homogeneous model is well within the measurement
error for gravity data acquired in volcanic areas. Therefore, for all
the gravity contributions, significant deviations from the homoge-
neous case are obtained for the source (1). We can conclude that the
shallower is the source, the higher is the discrepancy between the
multilayered model and the homogeneous one. This is mainly due
to the medium properties of the layer in which the source is embed-
ded. In fact, the shallower source is surrounded by a lower rigidity
medium that leads a higher displacement around the pressure source.
The result is an increase of the density variation because of the en-
hancement of the u and ∇ · u terms (eq. 3) in the surrounding region
of the source. When the medium is elastic, the deformation pattern
and the gravity changes δg1, δg2� V and δg3 depend almost entirely
on the average rigidity and the density of the medium surrounding
the source.
Figure 3. Empirical relations between seismic p-wave propagation velocities Vp and density values (solid lines; after Christensen & Mooney 1995; Gardner
et al. 1974). A polynomial relationship was derived by fitting the empirical relations (dashed line).
Table 1. Medium properties of the multilayered model.
Layers’ depth Vp Density Young’s Modulus
(m) (km m–1) (kg m–3) (GPa)
0/ −1000 2.5 2200 11.5
−1000/−5000 3.8 2400 28.8
−5000/−8000 5.4 2600 63
−8000/ −15 000 6.2 2700 86
−15 000/ −23 000 6.6 2800 101
−23 000/ −50 000 7.3 3000 133
Topography effect
In order to quantify the effect of topography on gravity anomalies,
we performed several tests by adding a topographic relief to the pre-
vious multilayered models. Using the axisymmetric formulation, a
simplified ground surface profile was introduced and a spherical
coaxial source was considered as shown in Fig. 5. The volcano edi-
fice is modelled as a cone 3300 m high and 20 km in radius with an
average slope of the flanks of about 10◦. The computations are per-
formed using the pressure source described above at three different
depths. To estimate the effects of topography on gravity anomalies
a comparison with the analytical solution was carried out. As for
the analytical model, we choose a reference surface at 1500 m a.s.l.
that represents the average altitude of the topographic relief in the
numerical model. For all the three pressure sources, the δg1 con-
tribution is enhanced with respect to the analytical solutions. What
is more important is the change in shape observed in the proximity
of the volcano summit, where a sharper decrease is obtained (Fig.
6). At a horizontal distance of about 10 km from the summit the
numerical results are quite similar to the analytical ones. The δg2� V
term shows variations less than 2 μGal and, therefore, is negligible
for all the three sources. Also the δg3 gravity term does not show
significant shape deviations from the analytical results when we take
simultaneously into account topography and heterogeneity features.
The enhancement in the δg3 contribution depends on the depth of
the source. For the shallower source this contribution is almost dou-
bled, while for the deeper source the increase is less evident. As it
can be seen from eqs (6 and 8), the ratios between gravity contribu-
tions and elevation changes (δg1/δh and δg3/δh) for the analytical
model at any point on the surface are constant. It is worth noting that
in the presence of topography, the gravity changes not longer de-
pend linearly on the elevation changes (Fig. 7). For all three sources,
the ratio (δg1/δh) is dependent on the horizontal distance from the
C© 2007 The Authors, GJI, 169, 775–786
Journal compilation C© 2007 RAS

780 G Currenti, C. D. Negro and G. Ganci
Figure 4. Elevation and gravity changes using the heterogeneity model (dashed lines) for a source at three different depths: 3 km (blue), 6.5 km (green) and 9
km (red). The analytical solutions for homogeneous medium are also shown (solid lines).
source. The deviations from the linear behaviour are produced by
the higher increasing of the δg1 term. Particularly in the summit
area, this gravity contribution is more sensitive to the topography
than the elevation change (Fig. 6). Conversely, the (δg3/δh) ratios
keep almost constant over the whole profile, even if the ratios are
different from the homogeneous half-space model.
To better evaluate the topography effect on δg1 and δg3 contri-
butions, we also performed several tests on the shallower source
(1) considering different topographic profiles with average slopes
of 10◦, 20◦ and 30◦ (Fig. 8). The δg1 term decreases faster as the
volcano slope increases. It appears that the steeper the volcano,
the higher the δg1 gravity contribution. Moreover, the minimum
amplitude in the δg3 gravity anomaly is not more at the volcano
summit but is shifted some kilometres away. The distance of the
local minimum from the summit increases for steeper relief. Simi-
lar behaviours are obtained for the surface vertical displacements.
As shown by Cayol & Cornet (1998), for a volcano edifice with
significant average slope, the maximum of vertical displacements is
not above the centre of the source. However, the same effect is not
detectable for δg1 contribution.
Our findings, shown in Figs 4 and 6, evidence that the analyti-
cal models underestimate elevation changes and gravity variations.
Therefore, if analytical models are used to estimate the volcanic
source parameters on the basis of microgravity and geodetic data
observed at the ground surface, the pressure change would be over-
estimated, while the source depth would be underestimated.
A N A P P L I C AT I O N T O E T N A V O L C A N O
We extended the FEM, used for the axisymmetric model, to a fully
3-D formulation to study in a more realistic way the observations car-
ried out on Mt Etna in 1993–1997 period. Mt Etna is one of the better
monitored and successfully studied volcanoes in the world, where
continuously running gravity and geodetic networks are operating
(Bonaccorso et al. 2004). Since 1993, different geodetic techniques
(EDM, GPS, SAR and levelling data) identified an inflation phase
characterized by a uniform expansion of the overall volcano edifice.
The beginning of the inflation episode was detected from the com-
parison of SAR images covering the 1993–1995 time interval. The
inversion of interferograms required the inflation from a spheroidal
magmatic source located at about 5 km b.s.l. (Lundgren et al. 2003).
Also levelling data supported the presence of a pressurized spherical
source beneath the summit craters at 4.5 km b.s.l. (Obrizzo et al.2004). Recently, Bonaccorso et al. (2005) modelled the 1993–1997
GPS and EDM data by a pressurized ellipsoidal source. Conversely,
C© 2007 The Authors, GJI, 169, 775–786
Journal compilation C© 2007 RAS

Modelling of ground deformation and gravity fields using finite element method 781
Figure 5. Model geometry used to estimate the influence of topography on
surface deformation and gravity field. The features in the picture are not in
scale.
Figure 6. Numerical (dashed lines) and homogeneous half-space solutions (solid lines) for the elevation changes and the δg1, δg2� V and δg3 gravity
contributions. The increase in the gravity field depends on the depth of the source: 3 km (blue), 6.5 km (green) and 9 km (red).
gravity measurements revealed mainly a positive change between
the 1994 and the 1996, which Budetta et al. (1999) interpreted as an
intrusion of magma beneath the summit craters at about 1 km a.s.l.
Following the conclusions of the studies cited above, we have
estimated the gravity changes expected to accompany the 1993–
1997 inflation episode on Mt Etna applying the ellipsoidal source
model by Bonaccorso et al. (2005). The source is located 4.2 km
b.s.l. beneath the central craters (latitude 4177.9 km and longitude
500.7 km, coordinates in UTM projection, zone 33 N) with an inter-
nal overpressure of 320 MPa. The ellipsoid has a semi-major axis of
1854 m and the other two axes of 725 and 544 m, respectively, with
an azimuth angle of 124◦ and a dip angle of 77◦. The subsurface
density distribution and the elastic heterogeneities of the medium
were included in the numerical model by assigning to each element
of the meshed domain the value of density and elastic Young’s mod-
ulus estimated from the seismic tomography (Chiarabba et al. 2000)
and interpolated at the proper location. In this way, smooth density
variations and smooth elastic medium heterogeneities, instead of
sharp boundary layers, may be included that are effectively true for
many geological settings.
Using the relationships in eqs (10 and 11), the range of density
values was estimated between 2000 and 3500 kg m–3 as the depth
increases. These density values are in agreement with the crustal
structure of Mt Etna inferred from compositional studies (Corsaro
& Pompilio 2003). The elastic Young’s modulus varies in the range
C© 2007 The Authors, GJI, 169, 775–786
Journal compilation C© 2007 RAS

782 G Currenti, C. D. Negro and G. Ganci
Figure 7. Ratios between δg1 and δg3 gravity terms and δh elevation changes for the numerical model (red line) and the analytical one (blue line). The ratios
are computed for spherical pressurized source at depths of 3 km (a and b), 6.5 km (c and d) and 9 km (e and f).
Figure 8. Finite element computations of the δg1 and δg3 terms generated by a spherical pressure source embedded in a heterogeneity medium and with simple
topographicprofiles. Three average volcano slopes of 10◦ (blue), 20◦ (green) and 30◦ (red) are taken into account.
from 11.5 GPa at shallower depth to 133 GPa at higher depth. The 3-
D model drastically increases the computational load. In this case, no
symmetries can be exploited and the number of elements and nodes
drastically increases. The procedure for the gravity field calculation
is the same as for the previous axisymmetric model. We first solve for
the deformation field in terms of elastostatic equilibrium equations.
The computational domain is set up to a volume extending 100 ×100 × 50 km3 in order to avoid artefacts in the numerical solution
because of the proximity of the boundary. The mesh of the ground
surface was generated from a digital elevation model of Etna volcano
using the 90 m Shuttle Radar Topography Mission (SRTM) data.
Once the deformation field is computed, even in the subsurface
medium, we solve the coupled Poisson’s equation for the gravity
potential. The domain is further enlarged above the ground surface
up to 50 km, therefore, the computational domain extends to a 100 ×100 × 100 km3 volume. Zero potential conditions are assumed on
the outermost surfaces using Dirichlet boundary conditions. This
assumption is plausible because all the boundaries are located far
away enough from the pressure source.
A good way to understand how each single gravity contribution
can affect the gravity field is to investigate each one separately. In
order to appraise whether a new mass input is required to explain
the gravity changes, the contributions to gravity changes due to the
deformation of the medium (δg1 and δg3) must be evaluated at first.
Starting from the results obtained for the axisymmetric model, sig-
nificant deviations from the analytical results are expected in the δg1
gravity term due to the irregular topography of Mt Etna. Indeed, the
volcano edifice is rather asymmetric having a strong mass deficit in
the eastern sector with respect to the western sector in correspon-
dence of Valle del Bove. The numerical results are compared with
an analytical model whose reference surface is assumed to be at
1500 m a.s.l. that represents the average altitude of the areas cov-
ered by the geodetic and gravity networks operating on Mt Etna.
Considering that the spherical source is subjected to the same vol-
ume change of the ellipsoidal source, a radius of 900 m is assumed.
The δg1 contribution shows a reverse in sign that is not obtained
from analytical solutions (Fig. 9). This could be generated from the
gravitational attraction of the gain of mass above the observation
C© 2007 The Authors, GJI, 169, 775–786
Journal compilation C© 2007 RAS

Modelling of ground deformation and gravity fields using finite element method 783
Figure 9. Contour map of the δg1 and δg3 gravity contributions at Etna volcano due to the an ellipsoid source located at 4.5 km b.s.l. (star). The δg1 term
computed by the numerical model (a) is compared with the analytical solution (b). The δg3 term from the numerical model (c) is quite similar to the analytical
model (d). The gravity stations (yellow diamond) are also shown.
points due to the elevation changes of the local topographic relief.
In fact, the negative anomalies are observed in correspondence of
lower altitude points located near prominent topographic relief. The
numerical results show that δg1 gravity anomalies exhibit fluctua-
tions strongly related to the topography. On the contrary, the δg3
term is closely similar to the gravity anomaly computed by using
the analytical model, although the anomaly is a little enhanced and
asymmetric.
To evaluate whether the ellipsoidal source inflated with mass in-
put, we have to compute the expected δg2 contribution and compare
the overall gravity change (δg1 + δg2 + δg3) with the gravity obser-
vations. According to the results of the microgravity data reported
by Budetta et al. (1999), mass intrusion occurred only beneath the
summit region at rather shallow depth (1000 m a.s.l.) between 1994
and 1996, a period including explosive activity characterized by
episodic strombolian eruptions with some lava fountaining from
the volcano’s summit craters. Even if a further mass intrusion of
about 1.5 × 10¹¹ kg at 2–3 km b.s.l. was also identified during
the 1995–1996 time interval, it was located in the southern flank
of the volcano and it cannot be linked with the ellipsoidal source
we are dealing with. Microgravity observations did not support the
presence of mass redistribution at deeper depth associated with the
ellipsoidal source and able to cause detectable gravity changes dur-
ing the 1994–1996 time interval (Figs 5 and 6 by Budetta et al.1999). If the ellipsoidal source was inflated with no addition of new
mass, the overall gravity contributions (δg1 + δg2 + δg3) should
have leaded to a negative gravity anomaly (Fig. 10a). However a
mass intrusion could have occurred, whose effect (δg2) balanced
the negative contribution given by (δg1 + δg3) term. We can infer
the mass change inside the ellipsoid source in a way to justify the
gravity observations. Also a mass intrusion of about 12 × 1010 kg
would lead a δg2 contribution that summed with the other terms
gives rise to an overall gravity change of about 16 μGal (Fig. 10b)
in proximity of gravity stations that is under the detectability of
C© 2007 The Authors, GJI, 169, 775–786
Journal compilation C© 2007 RAS

784 G Currenti, C. D. Negro and G. Ganci
Figure 10. Contour map of the overall gravity changes at Etna volcano
due to the an ellipsoid source located at 4.5 km b.s.l. (star). The gravity
changes were computed for inflation with no mass intrusion (a) and with
a mass intrusion of 12 × 1010 kg. In the case of mass intrusion, also the
analytical solution was computed (c). The yellow diamonds represent the
gravity stations.
common gravimeters used for volcano monitoring. Instead, the over-
all gravity change computed using the analytical solutions would
give rise to about 40 μGal near the summit craters. Moreover, the
gravity variation computed by numerical model is no concentric
as the analytical solution because of topography and heterogeneity
(Fig. 10b and c).
D I S C U S S I O N A N D C O N C L U S I O N S
Finite element model was applied to evaluate deformation and grav-
ity changes produced by pressurized volcanic sources. The FEM
allows for taking into account the real topographic relief and elastic
heterogeneities, and appraising their effects on the expected fields.
Among the four gravity effects generated by pressure sources, we
do not report on the contribution to the gravity due to free air ef-
fect (δg0), since gravity changes are usually corrected, before the
interpretation, for the effect of uplift (the free-air correction) by us-
ing levelling data. Indeed, it is mainly proportional to the elevation
change on which many studies were already carried out by means of
numerical methods (Williams & Wadge 2000; Trasatti et al. 2003).
We took into account not only the elastic heterogeneities of the
medium but also the density distribution of subsurface structures.
Therefore, the δg1, which usually accounts for only the Bouguer
anomaly, was computed considering also the displacements of the
subsurface density layers. Numerical solutions for the δg1, δg2 and
δg3 terms, computed by the FEM, have been compared to analytical
results for a homogeneous half-space medium. Our findings high-
light that heterogeneity and topography engender deviations from
analytical results in the deformation and gravity fields produced by
pressurized sources under elastic conditions. However, such per-
turbations are more evident in presence of severe heterogeneities
and steeper topography, that is, in the volcano summit. The elastic
heterogeneity only affects the amplitudes of anomalies, while the
topography strongly alters both the magnitude and the shape espe-
cially in the δg1 contribution. In particular, our results evidenced that
the analytical model underestimates elevation changes and gravity
variations.
Finally, we reviewed the 1993–1997 inflation episode detected
at Mt Etna by geodetic data and verified the consistency of ground
deformation interpretation with gravity observations. We would like
to emphasize that we do not invert either the geodetic data or the
gravity data but we assume the ellipsoidal source (at 4.2 km b.s.l.
depth) retrieved by Bonaccorso et al. (2005) to compute the expected
gravity changes. Budetta et al. (1999) associated the 1994–1996
gravity changes mainly with shallow mass redistributions related
to the summit craters activity. Since microgravity observations do
not show up effects due to deep sources, we estimated that a mass
intrusion at most of 12 × 1010 kg could have occurred at depth
within the ellipsoidal source leading to a gravity change under the
detectability of common gravimeters used for volcano monitoring.
Our findings highlighted two main points. First, changes in the
gravity field cannot be interpreted only in term of additional mass
input disregarding the ground deformation of the surrounding rocks.
Hence, in order to obtain a reliable estimate of the depth and density
of the intrusion, it is advisable to jointly model geodetic and grav-
ity data, which independently reflect the state of volcano. Secondly,
standard analytical models, that neglect the complexities associ-
ated with morphology and medium properties of volcanic edifice,
could provide an inaccurate estimate of the ground deformation and
gravity anomalies expected at the surface. This can lead to a misin-
terpretation of the geophysical observations carried out in volcanic
C© 2007 The Authors, GJI, 169, 775–786
Journal compilation C© 2007 RAS

Modelling of ground deformation and gravity fields using finite element method 785
areas. The application of FEMs, instead, allows for a more accurate
modelling procedure, which might provide sensible insights into
volcanic source definition.
A C K N O W L E D G M E N T S
This work was developed in the frame of the TecnoLab, the Labo-
ratory for the Technological Advance in Volcano Geophysics orga-
nized by INGV-CT and DIEES-UNICT. This study was performed
with the financial support from the ETNA project (DPC–INGV
2004–2006 contract) and the VOLUME project (European Com-
mission FP6–2004-Global-3). Constructive criticism by Kristy F.
Tiampo, Maurizio Bonafede and Carl Gerstenecker helped to
improve the content of this paper.
R E F E R E N C E S
Battaglia, M. & Segall, P., 2004. The Interpretation of gravity changes and
crustal deformation in active volcanic areas, Pure Appl. Geophys., 161,1453–1467.
Battaglia, M., Segall, P., Murray, J., Cervelli, P. & Langbein, J., 2003. The
mechanics of unrest at Long Valley caldera, California: 1. Modeling the
geometry of the source using GPS, leveling and two-color EDM data, J.Volcan. Geotherm. Res., 127, 195–217.
Battaglia, M., Segall, P. & Roberts, C., 2003. The mechanics of unrest at
Long Valley caldera, California: 2. Constraining the nature of the source
using geodetic and micro-gravity data, J. Volcan. Geotherm. Res., 127,219–245.
Birch, F., 1961. The velocity of compressional waves in rocks to 10 kilobars,
(Part II), J. Geophys. Res., 66, 2199–2224.
Bonaccorso, A., Calvari, S., Coltelli, M., Del Negro, C. & Falsaperla, S.,
2004. Mt. Etna: Volcano Laboratory, American Geophysical Union, Geo-physical Monograph, 143, pp. 369.
Bonaccorso, A., Cianetti, S., Giunchi, C., Trasatti, E., Bonafede, M. &
Boschi, E., 2005. Analytical and 3D numerical modeling of Mt. Etna
(Italy) volcano inflation, Geophys. J. Int., 163, 852–862.
Bonafede, M., Parenti, B. & Rivalta, E., 2002. On strike slip faulting in
layered media, Geophys. J. Int., 149, 698–723.
Bonafede, M. & Mazzanti, M., 1998. Modelling gravity variations consistent
with ground deformation in the Campi Flegrei Caldera (Italy), J. Volcan.Geotherm. Res., 81, 137–157.
Brocher, T. M., 2005. empirical relations between elastic wavespeeds and
density in the earth’s crust, Bull. Seism. Soc. Am., 95, 2071–2092.
Budetta, G., Carbone, D. & Greco, F., 1999. Subsurface mass redistributions
at Mount Etna (Italy) during the 1995–1996 explosive activity detected
by microgravity studies, Geophys. J. Int., 138, 77–88.
Cai, Y. & Wang, C. Y., 2005. Fast finite-element calculation of gravity
anomaly in complex geological regions, Geophys. J. Int., 162, 696–708
Carbone, D., Budetta, G. & Greco, F., 2003. Bulk processes some months be-
fore the start of the 2001 Mt Etna eruption, evidenced throught micrograv-
ity studies. J. Geoph. Res., 108(B12), 2556, doi:10.1029/2003JB002542.
Carbone, D., Currenti, G. & Del Negro, C., 2006. Elastic model for the
gravity and elevation changes prior to the 2001 eruption of Etna volcano,
Bull. Volcanol., in press.
Cayol, V. & Cornet, F. H., 1998. Effects of topography on the interpreta-
tion of the deformation field of prominent volcanoes-Application to Etna,
Geophys. Res. Lett., 25(11), 11979–11982.
Charco, M., Fernandez, J., Tiampo, K., Battaglia, M., Kellogg, L., Mcclain, J.
& Rundle, J. B., 2004. Study of volcanic sources at Long Valley Caldera,
California, using gravity data and a Genetic Algorithm inversion tech-
nique, Pure Appl. Geophys., 161, 1399–1413. doi:10.1007/s00024–004-
2511–8.
Charco, M., Fernandez, J., Luzon, F. & Rundle, J. B., 2006. On the rel-
ative importance of self-gravitation and elasticity in modeling volcanic
ground deformation and gravity changes, J. Geophys. Res., 111, B03404,
doi:10.1029/2005JB003754.
Chiarabba, C., Amato, A., Boschi, E. & Barberi, F., 2000. Recent seismicity
and tomographic modeling of the Mount Etna plumbing system, J. Geoph.Res., 105(B5), 10923–10938.
Christensen, N. I. & Mooney, W. D., 1995. Seismic velocity structure and
composition of the continental crust: a global overview, J. Geoph. Res.,100(B2), 24473–24486.
Corsaro, R. & Pompilio, M., 2003. Buoyancy-controlled eruption of magmas
at Mt Etna, TerraNova, 16, 16–22.
Fernandez, J., Carrasco, J. M., Rundle, J. B. & Arana, V., 1999. Geodetic
methods for detecting volcanic unrest: a theoretical approach, Bull. Vol-canol., 60, 534–544.
Fernandez, J., Rundle, J. B., Granell, R. D. R. & Yu, T. T., 1997. Programs
to compute deformation due to a magma intrusion in elastic-gravitational
layered Earth models, Comput. Geosci., 23, 231–249.
Gardener, G. H. F., Gardner, L. W. & Gregory, A. M., 1974. Formation veloc-
ity and density – the diagnostic basics for stratigraphic traps, Geophysics,39(6), 770–780.
Gottsmann, J., Rymer, H. & Berrino, G., 2006. Unrest at the Campi Flegrei
caldera (Italy):˙ A critical evaluation of source parameters from geodetic
data inversion, J. Volcan. Geotherm. Res., 150, 132–145.
Hagiwara, Y., 1977. The Mogi model as a possible cause of the crustal
uplift in the eastern part of Izu Peninsula and related gravity change, Bull.Earthq. Res. Inst., Univ. Tokyo, 52, 301–309.
Jousset, P., Mori, H. & Okada, H., 2003. Elastic models for the magma
intrusion associated with the 2000 eruption of Usu Volcano, Hokkaido,
Japan, J. Volcan. Geotherm. Res., 2607, 1–26.
Lundgren, P., Berardino, P., Coltelli, M., Fornaro, G., Lanari, R., Puglisi,
G., Sansosti, E. & Tesauro, M. 2003. Coupled magma chamber infla-
tion and sector collapse slip observed with synthetic aperture radar in-
terferometry on Mt. Etna volcano, J. Geophys. Res., 108(B5), 2247,
doi:10.1029/2001JB000657.
Mogi, K., 1958. Relations between the eruptions of various volcanos and
the deformations of the ground surfaces around them, Bull. Earthq. Res.Inst., Univ. Tokyo, 36, 99–134.
Murase, M., Irwan, M., Kariya, S., Tabei, T., Okuda, T., Miyajima, R.,
Oikawa, J., Watanabe, H. et al., 2006. Time dependent model of magma
intrusion in and around Miyake and Kozu Islands, Central Japan in June–
August, 2000, Volcanol. Geotherm. Res., 150, 213– 231.
Obrizzo, F., Pingue, F., Troise, C. & De Natale, G., 2004. Bayesian in-
version of 1994–98 vertical displacements at Mt. Etna; evidence for
magma intrusion, Geophys. J. Int., 157(2), 935–946, doi:10.1111/j.1365–
246X.2004.02160.x.
Okubo, S., 1992. Gravity and potential changes due to shear and tensile
faults in a half-space, J. Geoph. Res., 97(B5), 7137–7144.
Okubo, S. & Watanabe, H., 1989. Gravity change caused by a fissure erup-
tion, Geophys. Res. Lett., 16, 445–448.
Rundle, J. B., 1980. Static elastic-gravitational deformation of a layered half
space by point couple sources, J. Geoph. Res., 85, 5355–5363.
Rymer, H., 1994. Microgravity changes as a precursor to volcanic activity,
J. Volcanol. Geotherm. Res., 61, 311–328.
Sasai, Y., 1986. Multiple tension-crack model for dilatancy: surface dis-
placement, gravity and magnetic change, Bull. Earthq. Res. Inst., Univ.Tokyo, 61, 429–473.
Tiampo, K. F., Fernandez, J., Jentzsch, G., Charco, M. & Rundle, J. B., 2004.
New results at Mayon, Philippines, from a joint inversion of gravity and
deformation measurements, Pure Appl. Geophys., 161, 1433–1452.
Trasatti, E., Giunchi, C. & Bonafede, M., 2003. Effects of elastic and rhe-
ological layering on ground deformation in volcanic regions, J. Volcan.Geotherm. Res., 122, 89–110.
Voight, B., Hoblitt, R., Clarke, A., Lockhart, A., Miller, A., Lynch, L. &
McMahon, J., 1998. Remarkable cyclic ground defomation monitored in
real-time on Montserrat, and its use in eruption forcastin, Geophys. Res.Lett., 24, 3405–3408.
Walsh, J. B. & Rice, J. R., 1979. Local changes in gravity resulting from
deformation, J. Geoph. Res., 84, 165–170.
Wang, R., Martin, F. L. & Roth, F., 2003. Computation of deformation in-
duced by earthquakes in a multi-layered elastic crust-FORTRAN pro-
grams EDGRN/EDCMP, Comput. Geosci., 29, 195–207.
C© 2007 The Authors, GJI, 169, 775–786
Journal compilation C© 2007 RAS

786 G Currenti, C. D. Negro and G. Ganci
Williams, C. A. & Wadge, G., 1998. The effects of topography on magma
chamber deformation models: Application to Mt. Etna and radar interfer-
ometry, Geophys. Res. Lett., 25, 1549–1552.
Williams, C. A. & Wadge, G., 2000. An accurate and efficient method for
including the effects of topography in three-dimensional elastic mod-
els of ground deformation with applications to radar interferometry,
J. Geophys. Res., 105(B4), doi: 10.1029/1999JB900307. issn: 0148–
0227.
Zhang, J., Wang, C. Y., Shi, Y., Cai, Y., Chi, W. C., Dreger, D., Cheng, W. B. &
Yuan, Y. H., 2004. Three-dimensional crustal structure in central Taiwan
from gravity inversion with a parallel genetic algorithm, Geophysics, 69,4917–924.
Zhao, S., Muller, R. D., Takahashi, Y. & Kaneda, Y., 2004. 3-D finite-
element modelling of deformation and stress associated with faulting:
effect of inhomogeneous crustal structures, Geophys. J. Int., 157, 629–
644.
C© 2007 The Authors, GJI, 169, 775–786
Journal compilation C© 2007 RAS