The Gravity of Knowledge
63
The Gravity of Knowledge ∗ Wolfgang Keller † University of Colorado, NBER, and CEPR Stephen R. Yeaple ‡ Pennsylvania State University and NBER August 2012 Abstract We analyze the international operations of multinational firms to measure the spatial barriers to transferring knowledge. We model firms that can transfer bits of knowledge to their foreign affiliates in either embodied (traded intermediates) or disembodied form (direct communication). The model shows how knowledge trans- fer costs can be inferred from multinationals’ operations. We use firm-level data on the trade and sales of U.S. multinationals to confirm the model’s predictions. Dis- embodied knowledge transfer costs not only make the standard multinational firm model consistent with the fact that affiliate sales fall in distance but quantitatively accounts for much of the gravity in multinational activity. ∗ An earlier version of this paper circulated under the title "Gravity in the Weightless Economy". We thank four anonymous referees as well as Nick Bloom, Gene Grossman, Stefania Garetto, Gordon Hanson, Ann Harrison, Pete Klenow, Rod Ludema, Jim Markusen, Marc Melitz, Ulrich Muller, Jim Rauch, Carol Shiue, Eric Verhoogen, Jonathan Vogel, Bill Zeile, and participants at many seminars for useful comments. We also thank Gordon Hanson for providing us with data. Yeaple thanks the Human Capital Foundation for support. The statistical analysis of firm-level data on U.S. multinational corporations reported in this study was conducted at U.S. Bureau of Economic Analysis under arrangements that maintained legal confidentiality requirements. Views expressed are those of the authors and do not necessarily reflect those of the Bureau of Economic Analysis. The BEA has requested to review the results of the study prior to their dissemination. The sole purpose of this review is to ensure that the confidentiality of the data is not unintentionally compromised. The authors have no relevant or material financial interests that relate to the research described in this paper. † Department of Economics, University of Colorado, Boulder, CO 80309; email: Wolf- [email protected] ‡ Department of Economics, Penn State University, University Park, PA 18602; email: [email protected]. 1
-
Upload
univ-tours -
Category
Documents
-
view
0 -
download
0
Transcript of The Gravity of Knowledge

The Gravity of Knowledge∗
Wolfgang Keller†
University of Colorado, NBER, and CEPR
Stephen R. Yeaple‡
Pennsylvania State University and NBER
August 2012
Abstract
We analyze the international operations of multinational firms to measure the
spatial barriers to transferring knowledge. We model firms that can transfer bits
of knowledge to their foreign affiliates in either embodied (traded intermediates) or
disembodied form (direct communication). The model shows how knowledge trans-
fer costs can be inferred from multinationals’ operations. We use firm-level data on
the trade and sales of U.S. multinationals to confirm the model’s predictions. Dis-
embodied knowledge transfer costs not only make the standard multinational firm
model consistent with the fact that affiliate sales fall in distance but quantitatively
accounts for much of the gravity in multinational activity.
∗An earlier version of this paper circulated under the title "Gravity in the Weightless Economy". Wethank four anonymous referees as well as Nick Bloom, Gene Grossman, Stefania Garetto, Gordon Hanson,
Ann Harrison, Pete Klenow, Rod Ludema, Jim Markusen, Marc Melitz, Ulrich Muller, Jim Rauch, Carol
Shiue, Eric Verhoogen, Jonathan Vogel, Bill Zeile, and participants at many seminars for useful comments.
We also thank Gordon Hanson for providing us with data. Yeaple thanks the Human Capital Foundation
for support. The statistical analysis of firm-level data on U.S. multinational corporations reported in this
study was conducted at U.S. Bureau of Economic Analysis under arrangements that maintained legal
confidentiality requirements. Views expressed are those of the authors and do not necessarily reflect those
of the Bureau of Economic Analysis. The BEA has requested to review the results of the study prior to
their dissemination. The sole purpose of this review is to ensure that the confidentiality of the data is
not unintentionally compromised. The authors have no relevant or material financial interests that relate
to the research described in this paper.†Department of Economics, University of Colorado, Boulder, CO 80309; email: Wolf-
[email protected]‡Department of Economics, Penn State University, University Park, PA 18602; email:
1

1 Introduction
The development and diffusion of knowledge is center stage in many fields of economics.
Modern theories of growth and international trade, for instance, place little emphasis on
the accumulation of tangible factors such as capital and labor, focusing almost entirely on
access to knowledge. With the recent advances in communication technology, the access
to knowledge is greater than it has ever been, but just how mobile is knowledge? This is
a central question to much of economics that is addressed here.
The paper starts from the premise that knowledge moves over geographic space either
in embodied or disembodied form. When knowledge moves in embodied form the costs of
moving it can be measured as the cost of goods trade. The intangibility of disembodied
knowledge, however, makes its movements hard to observe, and the costs of moving this
knowledge are difficult to assess. We shed new light on this issue by casting the question
in terms of the operations of multinational firms. Multinationals account for much of the
world’s research and development (R&D), and they have an incentive to endow offshore
affiliates with their knowledge as efficiently as possible—after all, knowledge transfer costs
raise overall costs and therefore reduce competitiveness.
Multinational affiliates, it turns out, sell less the further away they are from their home
country, akin to the gravity finding in trade. Moreover, this gravity effect is strongest for
high-R&D, or knowledge-intensive, goods. Our model focuses on the difficulty of commu-
nicating knowledge from one person to another versus the costs of moving knowledge in
goods. Knowledge can often not fully be codified, and communicating knowledge is prone
to errors.1 The relatively high costs of knowledge-intensive production lead to both lower
affiliate sales and the firm’s shifting its mix from disembodied (direct communication) to-
wards embodied (trade) knowledge transfer. The paper tests and quantifies a new model
of knowledge transfer fleshing this out.
In the model multinational firms produce final goods from individual intermediate
inputs that vary in the extent that their production requires non-codified knowledge. In-
puts highly dependent on non-codified knowledge are called knowledge intensive. Because
not all knowledge can be codified, offshore production calls for communication between
home country CEOs and affiliate managers. We assume that communication is more
costly the more knowledge-intensive inputs are, but these costs are invariant to physical
distance. Alternatively, the multinational can transfer knowledge by shipping ready-to-go
inputs embodying the knowledge. This entails no communication costs since the input
is produced near the expert at home, however shipping incurs trade costs that rise in
geographic distance. The reason why multinational sales in knowledge-intensive indus-
1Arrow (1969) views knowledge transfer costs as communication costs between teacher and student.
2

tries suffer most strongly from gravity is that here disembodied knowledge transfer costs
are highest, and to avoid them means embodied knowledge transfer whose costs rise in
distance.
Two sharp, firm-level predictions emerge from this analysis. First, the knowledge
intensity of production affects the level of affiliate sales around the world. The com-
petitiveness of affiliates, measured in terms of their sales, falls as trade costs rise, and
the effect of trade costs is strongest for knowledge-intensive goods, precisely because it
is here that the scope for offshoring is most limited by costly disembodied knowledge
transfer. Second, the knowledge intensity of production affects the composition of knowl-
edge transfers that the multinational will employ. The affiliate’s cost share of imports
gives the relative importance of embodied knowledge transfer. It falls more slowly with
distance in knowledge-intensive industries than in less knowledge-intensive industries. As
trade costs increase, multinational affiliates substitute away from importing inputs but
their ability to do so is constrained by how high disembodied knowledge transfer costs
are. Therefore, trade costs have the weakest influence on affiliate imports in relatively
knowledge-intensive industries.
These two predictions are tested using information on the sales and intermediate
goods trade of individual multinationals from the United States’ Bureau of Economic
Analysis. Confronting the model with this rich micro dataset, we find strong support for
both predictions using variation in multinational activity across industries and countries.
Consistent with the model, there is evidence that both the level of the affiliate’s sales and
its imports are affected by the ease to which knowledge can be transferred across space.
A quantitative analysis based on these micro estimates shows that both market size and
geography are central determinants of aggregate foreign direct investment (FDI). This is
in contrast to the benchmark model which largely ignores the geography dimension.
Moreover, the model predicts that as trade costs change relative to communication
costs, the nature of trade in terms of its knowledge intensity changes systematically.
Specifically, an increase in trade costs makes disembodied knowledge transfer more at-
tractive so that the average knowledge intensity of inputs that continue to be traded
increases. Despite the large body of work on the factor service content of trade, this is
one of the few results on the knowledge content of trade of which we are aware. We
find strong supportive evidence for this prediction from the international trade of U.S.
multinational firms.
This paper develops a new theory for the distribution of knowledge across countries,
the subject of much analysis in macroeconomics and growth (Lucas 1993, Aghion and
Howitt 1998, and Jones 2002). Our analysis also provides a new framework for explaining
the labor market effects of offshoring (Blinder 2006, Levy and Murnane 2005) in terms of
3

the firms’ ability to transfer knowledge abroad. The allocation of activities within firms
and across geographic space speaks not only to international trade (Antras, Garicano,
and Rossi-Hansberg 2008) but also to regional economics (Krugman 1991) and industrial
organization (Acemoglu, Aghion, Lelarge, van Reenen, and Zilibotti 2007), because the
impact of firm organization on economic structure and performance is felt at all of these
levels.
In international trade, frictions to economic activity in geographic space are commonly
called trade costs. Virtually always they are discussed in terms of gravity, the finding
that the volume of trade is declining in distance (see Anderson and van Wincoop 2004).
While spatial frictions are important as well between cities and regions within a country
(Hillberry and Hummels 2003, Glaeser and Kohlhase 2004), these frictions are not well
understood. Knowledge, as an intangible, seems ideally suited to overcoming spatial
frictions, although there appear to be limits to the transfer of knowledge. The productivity
effects of R&D are declining in distance (Keller 2002), and recent work by Irrazabal,
Moxnes, and Opramolla (2010), Ramondo and Rodriguez-Clare (2010), and Arkolakis,
Ramondo, Rodriguez-Clare, and Yeaple (2011) is consistent with substantial knowledge
transfer costs. We provide unique insights on the nature of spatial frictions by matching
a model of disembodied versus embodied knowledge transfer to micro data on all key
dimensions, testing, and quantifying it.
This paper makes also progress in the literature on multinational firms. First, we
extend the canonical model in which firms can transfer their knowledge without cost
to their affiliates (Helpman 1984, Markusen 1984).2 In particular, by generalizing the
benchmark model with heterogeneous firms by Helpman, Melitz, and Yeaple (2004), our
analysis reconfirms the importance of geography for aggregate FDI sales, an important
issue that cannot be handled by the benchmark model. Moreover, in addition to well-
known influences such as factor cost differences (Hanson, Mataloni, and Slaughter 2005),
we establish knowledge transfer costs as a determinant of the vertical specialization within
multinational firms, at the same time that vertical specialization is determined jointly with
the multinational’s sales. This highlights the forces generating complementarity between
trade and FDI when there is substitution at the activity level (Blonigen 2001). Finally, the
analysis shows that the multinational firms’ trade-off between disembodied and embodied
knowledge transfer shapes the knowledge content of international trade.
The remainder of the paper is as follows. The following section 2 introduces the
model and shows that knowledge intensity affects both the level of offshoring as well
as the breakdown between the firm’s production at home and abroad. Also we show
2Antras, Garicano, and Rossi-Hansberg (2008) and Burstein and Monge-Naranjo (2009) have recently
analyzed knowledge embodied in people.
4
how the firm’s choice on disembodied versus embodied knowledge transfer affects the
knowledge intensity of trade across different trade partners. Moreover, section 2 derives
the estimating equations implied by the model. Our data on individual U.S. multinational
firms is described in section 3. Section 4 provides evidence on the firm-level predictions
of the model. Section 5 quantifies and discusses the model’s implications for aggregate
multinational activity. In section 6 evidence is presented on the knowledge content of
trade along the line of the model’s prediction. A number of concluding observations are
offered in section 7. Throughout the paper we will refer to additional results presented in
the Web Appendix which complement the paper in important ways.
2 Theory
We begin by introducing the main elements of our model. Any country has a large number
of firms that can each produce a unique variety of a differentiated final good. A given firm
in the home country can sell its good to consumers abroad in one of two ways. First, the
good can be produced at home and exported. Second, the firm can turn multinational,
which means setting up an affiliate in the foreign country, producing there, and selling
locally. By exporting, the firm incurs trade costs that vary across countries, while if the
firm serves the foreign market through affiliate sales it has to pay a fixed cost of opening
a plant and it faces the costs of transferring its knowledge: productivity abroad is lower
than at home.
Each differentiated final good is produced from a range of intermediate goods and
services. The intermediate activities may include market research, R&D toward product
design, organization of shop floor production, final assembly, marketing and advertising,
and legal services. The ease of knowledge transfer varies by activity. It is relatively diffi-
cult, for example, to transfer R&D activities abroad because this technological knowhow
is highly non-codified.
This set-up leads to an exports-versus-FDI trade-off for the firm at the level of assem-
bly, and conditional on FDI, the firm faces an exports-versus-FDI decision at the level of
each intermediate input. For a given foreign market, inputs with high knowledge transfer
costs will be produced at home and exported (embodied knowledge transfer), while inputs
with low transfer costs will be produced abroad (disembodied knowledge transfer). As
distance to the foreign market increases, the trade costs of exporting increase. Firms
equate trade and disembodied knowledge transfer costs at the margin, and affiliates lo-
cated far from home have relatively high costs. Because higher costs reduce sales, affiliates
in relatively distant countries sell less than affiliates in more nearby countries (gravity).
In the remainder of this section, we first describe the model assumptions, followed by
5

the derivation of the structure of multinational activity that they yield. We then move
to the equations that will be estimated in the empirical work. To improve exposition, all
proofs are relegated to the Paper Appendix.
Model Assumptions Consider a world populated by countries indexed by and
. Country is endowed with units of labor, the only primary factor of production.
In each country, the representative consumer has preferences over differentiated goods
and one homogeneous good given by
=
X=1
Φ ln
µZ∈Ω
()−1
¶ −1
+
Ã1−
X=1
Φ
!ln (1)
where Φ is the expenditure share of good , Ω is the set of available varieties of good ,
() is the quantity of variety , 1 is the elasticity of substitution across varieties,
and is the quantity of the homogeneous good consumed. Each country produces good
using a single unit of labor and so wages everywhere can be normalized to unity.3
In country , there are firms in industry that have the ability to produce a
unique variety using a variety-specific composite intermediate. Firms are heterogeneous
in terms of their productivity: Firm with productivity () requires 1() units of
the composite intermediate to produce one unit of output. In industry , the composite
intermediate is produced from a continuum of (firm-specific) intermediates that vary in
their knowledge intensity:
=
µZ ∞
0
(|) 1()−1
¶ −1, (2)
where () is the quantity of an intermediate of knowledge intensity , (|) is thecost share parameter of intermediate in an industry with knowledge intensity , and
≥ 1 is the elasticity of substitution across intermediates. It is assumed that in all
industriesR∞0
(|) = 1. We give meaning to different knowledge intensities acrossindustries by assuming that (|) is log supermodular in and .4 Specifically, if
0 00 and 1 2, that is, industry 1 is more knowledge intensive than industry 2 then
log supermodularity implies(0|1)(0|2)
(00|1)(00|2) . Intuitively, a more knowledge-intensive
industry is so because it requires relatively more knowledge-intensive intermediate inputs
than a less knowledge intensive industry.
Each firm must decide whether and how to serve each of the world’s markets. A
3Wage equalization is not crucial to what follows. Keller and Yeaple (2008) show that similar results
are obtained in a model where factor costs are lower in the South than in the North.4Costinot (2009) has employed these concepts recently.
6

firm in industry that is located in country can always assemble its variety in country
and then export the finished good to any country , which requires iceberg-type trade
costs ≥ 1. For = , = 1, and for 6= , 1∀. Alternatively, this firm mayassemble its final good in country 6= to serve the local market, which requires the firm
to incur fixed cost . Once a firm has decided where to assemble its final product to serve
country , it must decide where to produce each intermediate input. If intermediate is
produced in home country , one unit of labor produces one unit of intermediate . If that
intermediate is exported from country to country (embodied knowledge transfer), it
is subject to the iceberg-type trade cost . Alternatively, the affiliate in country can
produce that intermediate for itself (requiring disembodied knowledge transfer). Local
production of an intermediate allows the firm to avoid trade costs, but it exposes the
affiliate to efficiency losses that are increasing in the knowledge intensity of production.
As in Arrow (1969) this efficiency loss stems from the lack of physical proximity between
the inventors of the technological knowledge (located in country ) and the users of this
knowledge (located in country 6= ).5 This efficiency loss takes the form of a increase in
the local labor requirement and is given by the function (), where (0) = 1, 0() 0,
and lim→∞ () .6
In summary, trade costs vary across countries and industries while knowledge transfer
costs due to communication failure vary across inputs of different knowledge intensities
but not across foreign countries. Knowledge transfer costs are zero only when CEOs
and production managers can meet face-to-face. Note that while face-to-face contact will
clearly be the exception for day-to-day problem solving in a multinational—a firm that is
spread over different countries—it might occur only rarely even for multi-plant operations
within a country. This is a point we will return to in the conclusions.
The geography of input sourcing The cost of obtaining input of a foreign
assembly plant facing trade costs of is () = min() The assumptions on thefunction () guarantee that there exists a marginal input
b() = −1( ). (3)
5Technological knowledge is difficult to communicate because it is often not fully codified (Polanyi
1966), and it is most easily transferred through face-to-face interaction because that allows immediate
feedback (see Koskinen and Vanharanta 2002).6In an earlier version of the paper, we provided explicit microfoundations for a specific functional
form with these properties. Specifically, more knowledge intensive intermediates required more tasks to
be completed and each task had a constant probability of failure due to imperfect communication.
7

such that inputs b() are produced locally and inputs b() are imported.7Equation 3) implies that the average knowledge intensity of trade between countries is
increasing with trade costs. Moreover, this sourcing pattern combined with equation (2)
implies that the cost of the composite intermediate input to an affiliate facing trade cost
with knowledge intensity of is
( ) =
ÃZ ()0
(|)()1− + 1−Z ∞
() (|)
! 11−
(4)
Letting ( ) be the elasticity of ( ) with respect to trade costs, we have
( ) =1− R∞() (|)R ()
0(|)()1− +
1− R∞() (|) (5)
This expression can be used to prove the following lemma.
Lemma 1 Let industry 1 be knowledge intensive relative to industry 2 (1 2). Then
the elasticity of marginal cost with respect to trade costs is greater in industry 1 than
industry 2, i.e. ( 1) ( 2) 0.
The marginal cost of production of an affiliate in the relatively knowledge intensive
industry is more sensitive to trade costs than of an affiliate in the less knowledge-intensive
industry because the former relies more heavily on imported inputs than the latter. To see
this, first note that Shephard’s lemma implies that the share of imported inputs ( )
in total costs ( ) is
( ) ≡ ( )
( )= ( )
This import cost share ( ) varies across countries and industries as follows.
Proposition 1 ( Import Cost Share) Let industry 1 be knowledge intensive relative to
industry 2 (1 2). (i) The import cost share is greater in industry 1 than industry
2 for any given level of , (( 1) ( 2)); (ii) the import cost share is declining in
trade cost in all industries; and (iii) the rate of decline in the import cost share is slower
in the more knowledge intensive industry ( log ( 2) log ( 1) 0).
7For ease of notation we omit the indices on whenever possible.
8
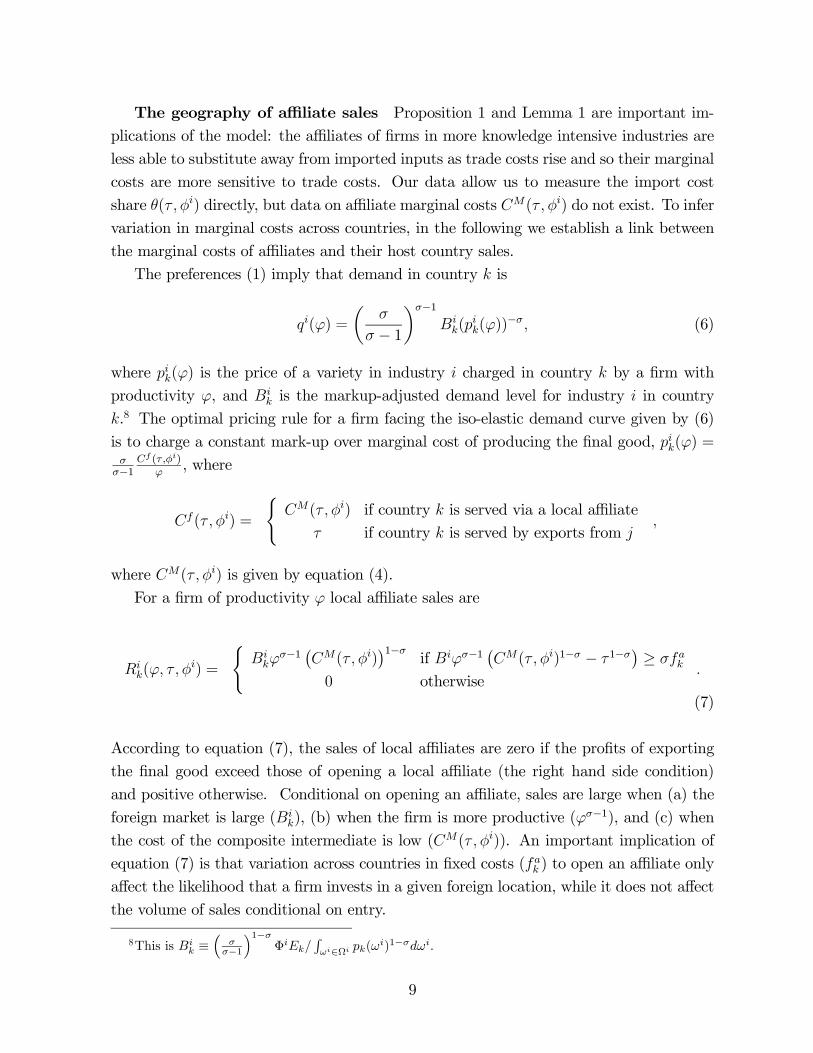
The geography of affiliate sales Proposition 1 and Lemma 1 are important im-
plications of the model: the affiliates of firms in more knowledge intensive industries are
less able to substitute away from imported inputs as trade costs rise and so their marginal
costs are more sensitive to trade costs. Our data allow us to measure the import cost
share ( ) directly, but data on affiliate marginal costs ( ) do not exist. To infer
variation in marginal costs across countries, in the following we establish a link between
the marginal costs of affiliates and their host country sales.
The preferences (1) imply that demand in country is
() =
µ
− 1¶−1
(
())
− (6)
where () is the price of a variety in industry charged in country by a firm with
productivity , and is the markup-adjusted demand level for industry in country
.8 The optimal pricing rule for a firm facing the iso-elastic demand curve given by (6)
is to charge a constant mark-up over marginal cost of producing the final good, () =
−1 ()
, where
( ) =
(( ) if country is served via a local affiliate
if country is served by exports from
where ( ) is given by equation (4).
For a firm of productivity local affiliate sales are
(
) =
(
−1 ¡( )¢1−
if −1 ¡( )1− − 1−¢ ≥
0 otherwise
(7)
According to equation (7), the sales of local affiliates are zero if the profits of exporting
the final good exceed those of opening a local affiliate (the right hand side condition)
and positive otherwise. Conditional on opening an affiliate, sales are large when (a) the
foreign market is large (), (b) when the firm is more productive (−1), and (c) when
the cost of the composite intermediate is low (( )). An important implication of
equation (7) is that variation across countries in fixed costs ( ) to open an affiliate only
affect the likelihood that a firm invests in a given foreign location, while it does not affect
the volume of sales conditional on entry.
8This is ≡
³
−1´1−
ΦR∈Ω (
)1−.
9

Let ( ) be the elasticity of affiliate local sales revenue with respect to trade costs
. We have the following proposition:
Proposition 2 (Affiliate Sales) Conditional on opening an affiliate, (i) an increase in
trade costs is associated with lower affiliate sales (( ) 0), and (ii) the elasticity
of these sales with respect to trade costs is larger in absolute value in more knowledge
intensive industries.
The intuition for the effect of trade costs on the intensive margin (the volume of sales
conditional on entry) is straightforward: the marginal costs of firms in more knowledge
intensive industries are rising faster in trade costs because they have less scope for sub-
stituting local production for imported intermediates and so their local sales are more
sensitive to trade costs as well.
Key model predictions to be tested The model has a number of implications for
multinational activity and trade. First, it predicts that the average knowledge intensity
of trade between countries is increasing in the distance between them (from equation (3)).
Further, the model has testable implications for multinational behavior at the firm level.
The empirical analysis below will focus on the predictions that are specific to our model,
as opposed to the result that import cost shares and sales are declining in trade costs,
which could be simply due to cultural or taste differences increasing with distance from
home. The main empirical implications for imports and sales as a function of knowledge
intensity, based on Propositions 1 and 2, are summarized as follows.
Hypothesis 1: The percentage rate of decline of the share of inputs imported from the
home country in total costs (
) as trade costs (
) increase is slower in
relatively knowledge-intensive industries (high ).
Hypothesis 2 : Holding fixed the demand level, , the percentage rate of the decrease
in affiliates’ local revenues () as trade costs (
) increase is faster in more
knowledge-intensive industries (high ).
In deriving these hypotheses, we have strived to keep the model simple and the set
of assumptions parsimonious. Central is the ability of firms to choose between embod-
ied knowledge transfer using imported inputs and the disembodied knowledge transfer
required for offshore production. First, we assume that affiliate import costs rise in dis-
tance while disembodied transfer costs do not, but all we need is that the disembodied
transfer costs rise at a slower rate than trade costs. Second, the knowledge intensity of
different activities matters because their technologies can be more or less codified. We
10

assume that communication costs vary with the degree of codification while trade costs do
not, although it is enough for our results if communication costs rise faster in knowledge
intensity than trade costs. These two, arguably mild, assumptions yield that affiliates
import the relatively knowledge intensive inputs so that the average knowledge intensity
of trade rises with distance.9
Estimating Equations Based on this theory we now specify an econometric model
of the input sourcing and local sales behavior of U.S. multinational affiliates. Three
elements are critical. First, to test Hypotheses 1 and 2, the effect of changes in trade
costs on both the firm’s input sourcing and sales decisions must vary with knowledge
intensity. Second, in the presence of fixed costs of opening an affiliate it is important to
correct for potential selection of firms across destinations. Third, the model must account
for local demand conditions and firm productivity.
Intensive Margin We begin by specifying the affiliate’s reliance on inputs imported
from its home country conditional on owning an affiliate. The cost share of imported
inputs of an affiliate of firm in industry in country at time is given by
ln
µ
¶=
+¡1 + 2
¢ln + ln
+ (8)
where is an firm-year fixed effect, is our measure of knowledge intensity, and
is an ad valorem measure of trade costs between the United States and country .10
Further, is a vector of controls including important host country characteristics (such
as market size), and is the error term.11
The model has the following predictions on the signs of the coefficient estimates. First,
while in general an increase in trade costs is associated with the increased offshoring of
production to the affiliate so that¡1 + 2
¢ 0, according to Hypothesis 1 this
effect should be less pronounced in more knowledge intensive industries so that 2 0.
Our model of the local affiliate sales, ln, of firm in industry in country at
time is symmetric to (8) up to the coefficients and so is given by
ln =
+¡1 + 2
¢ln + ln
+ (9)
The sales of affiliates in their host country is decreasing in trade costs so that¡1 + 2
¢
9The preceding arguments are formally developed in Section 1 of the Web Appendix, where also a
number of additional assumptions are discussed.10We have dropped the source country subscript as it is always the United States in our data.11We do not include by itself because since all firms belong to a single industry the specification
controls for industry-year fixed effects.
11

0, and according to Hypothesis 2 this effect should be more pronounced in knowledge in-
tensive industries so that 2 0. The prediction 2 0 is exactly the opposite to the
model’s prediction in the import cost share equation, where 2 0 The fact that im-
port and sales behavior are predicted to vary in qualitatively different ways as trade costs
change provides a powerful test of the theory.
We will estimate (8) and (9) through two methods. First the firms’ locational decisions
are taken as given and these equations are estimated via ordinary least squares (OLS). We
then adjust the econometric model to allow for locational decisions to be endogenous and
explicitly model the extensive margin. In the presence of fixed costs of opening a foreign
plant, firms that face unusually large costs abroad relative to the cost of exporting their
final good or face unusually low demand abroad will not be observed in our data. There-
fore, all of the variables included in equations (8) and (9) also feature in the likelihood
that an affiliate appears in our sample. Theory also indicates that fixed costs associated
with opening a foreign plant will influence the likelihood of observing an affiliate without
affecting the level of activity conditional on being observed, see equation (7). Thus, prox-
ies of fixed costs at the country-level are appropriate exclusion restrictions. We estimate
the likelihood that an affiliate appears in our sample with a probit model.
In the two-step Heckman (1976) model this probit is estimated in conjunction with
variants of our import cost share and sales equations. The changes relative to equations
(8) and (9) are as follows. First, since selection is based on firm characteristics, we want to
employ cross-firm variation; consequently we replace the firm fixed effects with industry
fixed effects.12 Second, we include parent domestic sales as a proxy for firm productivity.
If fixed costs to disembodied knowledge transfer are important, we would expect that
firm productivity enters with a negative sign in the import cost share equation as more
productive firms sell enough units to justify the local fixed cost. In the sales equation
we expect to find a positive coefficient on firm productivity, indicating that relatively
productive firms sell more than less productive firms. It is shown formally in section
2 of the Web Appendix that in the presence of fixed costs of knowledge transfer high
productivity firms will have lower import cost shares than low productivity firms.
In addition to selection, there are a number of other econometric and measurement
issues. For instance, to address the potential endogeneity of knowledge intensity, ,
we eschew firm-level measures of knowledge intensity in favor of industry averages and
control for firm-fixed effects where possible. We also conduct a range of robustness checks
with other determinants of multinational activity and alternate measures of knowledge
intensity; they are presented in section 4 below as well as in section 4 of theWeb Appendix.
12Using industry- instead of firm-fixed effects also reduces concerns that the estimates are affected by
incidental parameter problems.
12

We now turn to describing the data set.
3 Data
Firm-level data of the international structure of U.S. multinationals’ operations come from
the Bureau of Economic Analysis (BEA) surveys of U.S. Direct Investment Abroad.13 A
U.S. multinational firm is the combination of a single U.S. legal entity that has made
the direct investment, called the U.S. parent, and at least one foreign business enterprise,
called the foreign affiliate. As a result of confidentiality assurances and penalties for non-
compliance, the BEA believes that coverage in this survey is close to complete and the
level of accuracy is high.
We have linked the BEA data for each U.S. parent whose main-line-of-business is a
manufacturing industry to each of its majority-owned foreign affiliates for each of the
benchmark years 1994, 1999, and 2004. For each U.S. parent we observe the location
of all of their manufacturing affiliates, the value of the affiliates’ imports of intermediate
inputs from the United States, and the value of affiliate sales to various destinations.14
A large share of the typical affiliate’s imports come from its U.S. parent firm (intra-firm
trade). These data are aggregated over each country-year pair to form a single firm-
country-year observation for each of our main dependent variables: affiliate import cost
shares and local affiliate sales. In addition to local sales, we also present results on affiliate
sales to the U.S. and to third countries. Each observation is assigned to the parent firm’s
industry.15 In our final sample, the activity of more than 1,000 U.S. multinationals and
3,000 affiliates is classified into 48 distinct industries.16
We also use the BEA data for firm productivity and to construct our main measure
of knowledge intensity. Firm productivity is measured by the market share of the parent
firm in the United States.17 For each parent firm, we observe total R&D expenditures
and the parent firm’s total sales by year. Aggregating over each industry for each year,
we construct the industry’s R&D intensity, the ratio of R&D expenditures to sales. This
13U.S. direct investment abroad is defined as the direct or indirect ownership or control of a single U.S.
legal entity of at least ten percent of the voting securities of an incorporated foreign business enterprise
or the equivalent interest in an unincorporated foreign business enterprise.14Intermediate input imports in the BEA data are identified as imports "for further processing". We
have also employed the broader measure of all affiliate imports, which gives similar results.15To do so we have concorded the later year NAICS-based categories into 1994 SIC-based categories.16In three food processing industries and one fabricated metal industry, there is virtually no trade
between parent and affiliate. These industries were dropped from the sample. Also, given that the
dependent variable in our import equation is in logs, affiliates with zero imports are excluded from the
sample.We justify this restriction with the main focus of the paper, which is on firms that make an interior
choice of embodied versus disembodied knowledge transfer (that is, positive imports).17This is consistent with heterogeneous firm models in the spirit of Melitz (2003).
13

is our primary measure of the unobserved knowledge intensity. It is a plausible measure
because the outcome of R&D is often non-codified information. Moreover, in industries
with high R&D intensity production techniques are subject to rapid change and frequent
communication needs between managers in the home country and the affiliate. A number
of alternative measures of knowledge intensity are considered in section 4.1 of the Web
Appendix.
The ad-valorem measure of trade costs is defined as
= 1 + +
where is an ad-valorem measure of freight costs, and is an ad-valorem mea-
sure of tariffs, both at the industry-country-year level. Freight costs, , are constructed
from trade values including cost, insurance, freight (c.i.f.) to values that do not in-
clude this (free on board, or f.o.b. values) in the Feenstra, Romalis, and Schott (2002)
dataset following the methodology of Hanson, Mataloni, and Slaughter (2005).18 The
tariff measure, is calculated from figures in the United Nations’ Trade Analy-
sis and Information System (TRAINS) dataset and extracted with the World Integrated
Trade Solutions (WITS) software of the World Bank, where we use the same method of
computing industry-level values as employed to construct freight costs.
In the sample selection specifications we proxy for country-level fixed costs using two
measures. First, the difficulty of entry due to barriers is captured through World Bank
data from the World Development Indicators database. We use as exclusion restrictions
the Costs of Starting a Business and a country’s Foreign Market Potential, defined as
the distance-weighted size of a country’s surrounding markets. As our dependent variable
is solely related either to domestic demand (local affiliate sales) or trade frictions with
the United States (import cost share) it is not directly determined by the proximity of a
country to other potential markets. Yet, in a model that allowed for affiliates to serve not
only the local but also third-country markets the proximity of other large markets would
generate an additional inflow of FDI. This motivates the use of Foreign Market Potential
as an exclusion variable (source: CEPII Market Potentials Database).
In our analysis of the knowledge intensity of trade we employ the U.S. Census Bureau’s
data base on related party trade, while disaggregated data on R&D and sales, as well as
the relationship between firm size and firm rank is obtained from the COMPUSTAT
18From U.S. import data disaggregated by country-industry-year, the freight cost is computed as the
ratio of freight and insurance charges to the customs value of imports. The resulting figures are then
aggregated to BEA industry classifications using U.S. exports to that country as weights. These proxy
trade costs are based on the industry of final production itself, not on information on the trade costs of
intermediate inputs; the latter is not available.
14
database. Below we also employ a number of country- and industry-level variables that
allow us to see whether our results are driven by factors other than those emphasized by
our theory (such as comparative advantage); these variables are discussed in section 3 of
the Web Appendix.
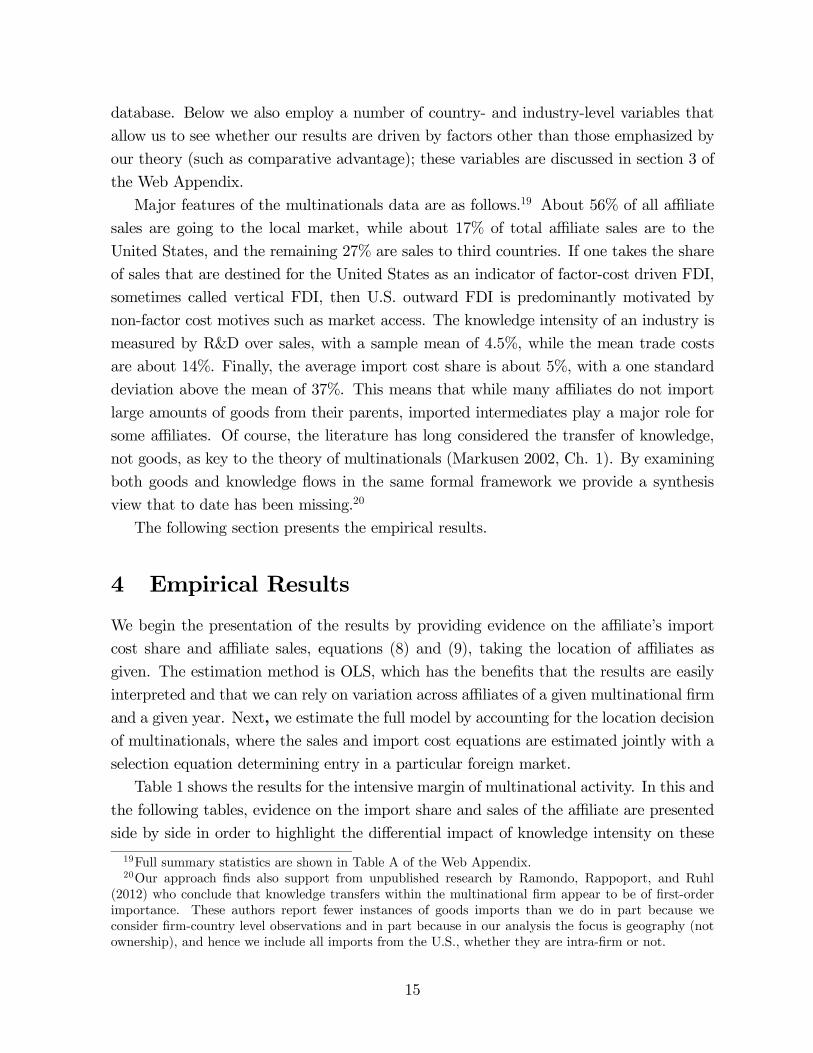
Major features of the multinationals data are as follows.19 About 56% of all affiliate
sales are going to the local market, while about 17% of total affiliate sales are to the
United States, and the remaining 27% are sales to third countries. If one takes the share
of sales that are destined for the United States as an indicator of factor-cost driven FDI,
sometimes called vertical FDI, then U.S. outward FDI is predominantly motivated by
non-factor cost motives such as market access. The knowledge intensity of an industry is
measured by R&D over sales, with a sample mean of 4.5%, while the mean trade costs
are about 14%. Finally, the average import cost share is about 5%, with a one standard
deviation above the mean of 37%. This means that while many affiliates do not import
large amounts of goods from their parents, imported intermediates play a major role for
some affiliates. Of course, the literature has long considered the transfer of knowledge,
not goods, as key to the theory of multinationals (Markusen 2002, Ch. 1). By examining
both goods and knowledge flows in the same formal framework we provide a synthesis
view that to date has been missing.20
The following section presents the empirical results.
4 Empirical Results
We begin the presentation of the results by providing evidence on the affiliate’s import
cost share and affiliate sales, equations (8) and (9), taking the location of affiliates as
given. The estimation method is OLS, which has the benefits that the results are easily
interpreted and that we can rely on variation across affiliates of a given multinational firm
and a given year. Next, we estimate the full model by accounting for the location decision
of multinationals, where the sales and import cost equations are estimated jointly with a
selection equation determining entry in a particular foreign market.
Table 1 shows the results for the intensive margin of multinational activity. In this and
the following tables, evidence on the import share and sales of the affiliate are presented
side by side in order to highlight the differential impact of knowledge intensity on these
19Full summary statistics are shown in Table A of the Web Appendix.20Our approach finds also support from unpublished research by Ramondo, Rappoport, and Ruhl
(2012) who conclude that knowledge transfers within the multinational firm appear to be of first-order
importance. These authors report fewer instances of goods imports than we do in part because we
consider firm-country level observations and in part because in our analysis the focus is geography (not
ownership), and hence we include all imports from the U.S., whether they are intra-firm or not.
15
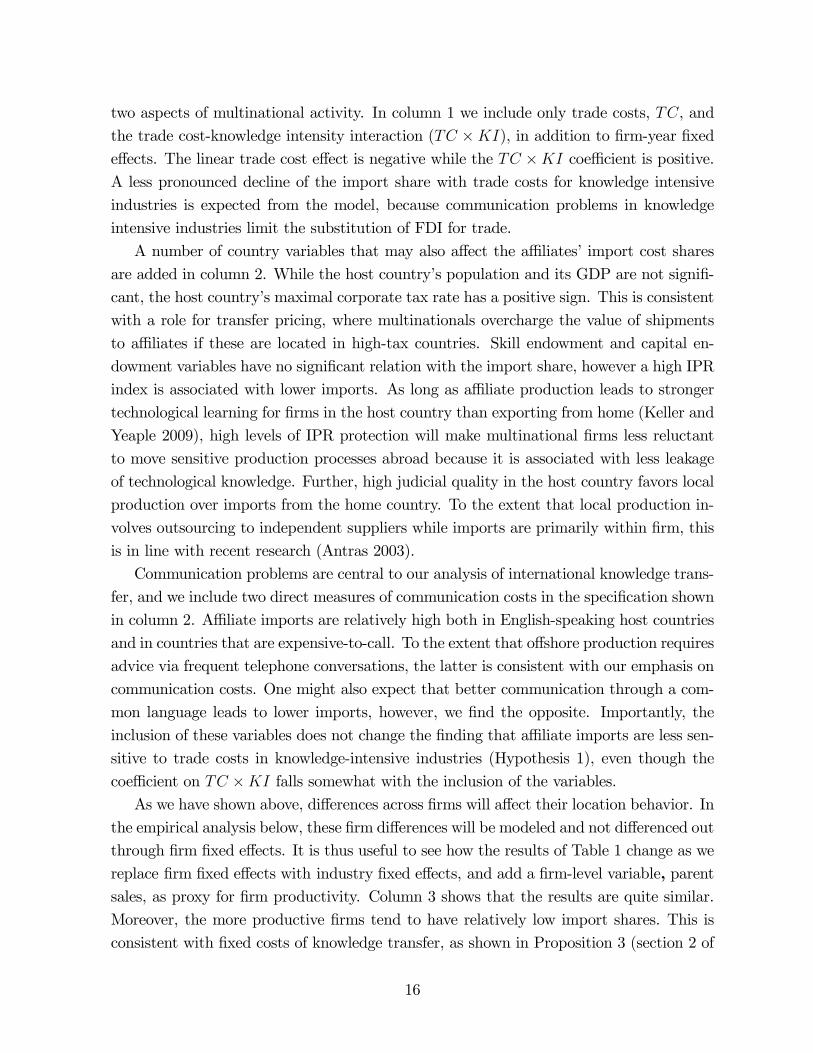
two aspects of multinational activity. In column 1 we include only trade costs, , and
the trade cost-knowledge intensity interaction ( ×), in addition to firm-year fixed
effects. The linear trade cost effect is negative while the × coefficient is positive.
A less pronounced decline of the import share with trade costs for knowledge intensive
industries is expected from the model, because communication problems in knowledge
intensive industries limit the substitution of FDI for trade.
A number of country variables that may also affect the affiliates’ import cost shares
are added in column 2. While the host country’s population and its GDP are not signifi-
cant, the host country’s maximal corporate tax rate has a positive sign. This is consistent
with a role for transfer pricing, where multinationals overcharge the value of shipments
to affiliates if these are located in high-tax countries. Skill endowment and capital en-
dowment variables have no significant relation with the import share, however a high IPR
index is associated with lower imports. As long as affiliate production leads to stronger
technological learning for firms in the host country than exporting from home (Keller and
Yeaple 2009), high levels of IPR protection will make multinational firms less reluctant
to move sensitive production processes abroad because it is associated with less leakage
of technological knowledge. Further, high judicial quality in the host country favors local
production over imports from the home country. To the extent that local production in-
volves outsourcing to independent suppliers while imports are primarily within firm, this
is in line with recent research (Antras 2003).
Communication problems are central to our analysis of international knowledge trans-
fer, and we include two direct measures of communication costs in the specification shown
in column 2. Affiliate imports are relatively high both in English-speaking host countries
and in countries that are expensive-to-call. To the extent that offshore production requires
advice via frequent telephone conversations, the latter is consistent with our emphasis on
communication costs. One might also expect that better communication through a com-
mon language leads to lower imports, however, we find the opposite. Importantly, the
inclusion of these variables does not change the finding that affiliate imports are less sen-
sitive to trade costs in knowledge-intensive industries (Hypothesis 1), even though the
coefficient on × falls somewhat with the inclusion of the variables.
As we have shown above, differences across firms will affect their location behavior. In
the empirical analysis below, these firm differences will be modeled and not differenced out
through firm fixed effects. It is thus useful to see how the results of Table 1 change as we
replace firm fixed effects with industry fixed effects, and add a firm-level variable, parent
sales, as proxy for firm productivity. Column 3 shows that the results are quite similar.
Moreover, the more productive firms tend to have relatively low import shares. This is
consistent with fixed costs of knowledge transfer, as shown in Proposition 3 (section 2 of
16

the Web Appendix).21
The results for local affiliate sales are shown on the right side of Table 1. Sales are
declining in trade costs from the United States, and this effect is particularly strong in
knowledge intensive industries (column 5). The latter finding confirms Hypothesis 2 of
the model. Adding country variables does not change this result, even though the effect
become somewhat less pronounced (column 6). Affiliate sales are larger in countries with
high GDP, because the potential for sales is higher in these markets. The finding that
high IPR leads to low imports and to high affiliate sales suggests that with strong IPR
regimes multinationals are willing to move more technological knowledge. Moreover, sales
are falling in the host countries’ judicial quality and its skill endowment, in part perhaps
because such countries have the same comparative advantage as the United States.
In column 7 we show sales results with industry- instead of firm fixed effects. While
most results are similar, in particular the coefficient on ×, there are some differ-
ences. The linear trade cost coefficient is not significant anymore, and moreover, neither
judicial quality nor the host country’s skill endowment affect affiliate sales anymore. The
coefficient on parent sales is positive and less than one. This suggests that relatively pro-
ductive firms sell more also through their foreign affiliates, although home productivity
advantages translate abroad less than one for one.
So far our empirical analysis has exploited variation across industries with different
knowledge intensity as well as variation across different host countries, and one might
wonder to what extent the results are driven by either dimension. One way to assess this
is to introduce country fixed effects in the regression, as commonly done in the gravity
of trade literature. In columns 4 and 8 we show results for the import cost share and
affiliate sales, respectively, that focuses on industry variation because country fixed effects
are included. We see that country fixed effects matter in the import equation, for example
in that the 2 rises and the size of the linear coefficient is lower. Some variables lose
in terms of significance, likely because their variation over time is limited. At the same
time, the results for the × interaction are quite similar, in fact the point estimate
is somewhat higher than before. In the case of affiliate sales we obtain a similar pattern,
except that now the point estimate on the × interaction is slightly smaller (in
absolute value) than before (Table 1, column 8). Overall we conclude that the results in
support of Hypothesis 1 and Hypothesis 2 so far are not driven by cross-country variation
in multinational activity.
Multinational Affiliate Entry and Activity In the following we treat the entry
decision of the multinational firm in a particular foreign market jointly with the decisions
21This finding is not only due to differences in affiliate age, see Table E in the Web Appendix.
17

of how much to sell and which fraction to import from the home country. Our analysis
employs Heckman’s (1976) well-known two-step approach to analyze the extensive margin
of multinational operation. In the first step, we run a probit to estimate the probability of
the presence of a given multinational firm in a given host country. From this we obtain the
Mills ratio, which addresses the sample selection problem under the assumptions made in
Heckman (1976).22
The results are presented in Table 2. The first three columns are for the import
cost share as the dependent variable, while the last three are for sales. Each column
presents results for a specification with a different set of exclusion variables in the selection
equation, shown in the lower part of Table 2. In all specifications and in both step one
and step two, the full list of country variables of Table 1 is included. Not all coefficients
are reported to save space.
Consider first column 1 of Table 2. The number of observations now is 45,121, the
sum of cases where affiliate activity is actually observed and where the firm did end up
not opening an affiliate in this particular country. The exclusion variable in column 1 is
the World Bank’s Cost of Starting a Business. Because these fixed costs are independent
of the volume of imports and sales, this measure can plausibly serve as an exclusion
restriction. The Costs of Starting a Business enters with a negative sign, consistent with
the hypothesis that host countries in which there are higher fixed costs of starting a
business are less likely to attract multinational affiliates. Also the significant Mills ratio
indicates that selection is an issue.
Countries with larger population are more likely to have inward FDI, a finding con-
sistent with fixed costs of FDI. In addition, firms with larger parent sales are more likely
to open an affiliate abroad. This is in line with our model and it confirms the well-known
result that FDI entry is driven in part by high firm productivity.
What is the key impact of selection in terms of knowledge transfer and the gravity of
multinational sales? Comparing column 1 of Table 2 with column 3 of Table 1, in the
Heckman specification trade costs have smaller impact on reducing the import cost share
than according to the least squares specification (coefficient on of −17 versus −37).Primarily, this appears to be due to affiliates that operate at high distances from the U.S.
which tend to have low import cost shares, and the main way this is captured by the least
squares estimator is a high (in absolute terms) elasticity of imports with trade costs.
Once selection is accounted for it appears that firms that operate in high- locations
tend to be high productivity firms. In the Heckman results the coefficient on parent sales
22To address sample selection with Heckman’s (1976) approach we have to make strong parametric
assumptions, including joint normality, and our analysis of sample selection is specific to those. This is
the reason why we report the less restrictive OLS results for the intensive margin.
18

in the second stage is much higher (in absolute terms) than in the least-squares regression
(−037 versus −005). Accounting for the selection of firms at high versus low values oftrade costs may therefore explain why the coefficient on moves closer to zero.
While this shows that selection has an important effect on the trade cost elasticity of
the affiliates import cost share, the impact on the degree to which the trade cost elasticity
varies with knowledge intensity is much smaller: the coefficient on × changes only
from about 24 to about 20 (see Table 1, column 3, and Table 2, column 1). The evidence in
favor of Hypothesis 1 is, according to these Heckman results, not driven by the extensive
margin decision of firms.
This result is robust to employing different exclusion variables. In column 2 we em-
ploy the foreign market potential (FMP) of the host country, computed as the distance-
weighted size of the market, excluding the host market itself. A high FMP raises the
probability that a U.S. firm opens an affiliate in that country (coefficient of about 0.23).
There is less evidence for sample selection than before, with the Mills ratio insignificant.
This may have to do with changes in the sample size. At the same time, the trade cost-
knowledge intensity interaction variable × is positive and its magnitude is similar
to before. In column 3 both Costs of Starting a Business and FMP are employed as
exclusion variables. They both come in with the expected sign, and the Mills ratio is
significant. In the second-step the import cost share is declining in trade costs, and this
effect is less strong in knowledge-intensive industries. This result confirms earlier evidence
in favor of Hypothesis 1.
Turning to the second hypothesis, Table 2 on the right side shows the influence of
knowledge intensity on the gravity of U.S. affiliates’ sales. Because the selection equations
for the import cost shares and sales differ only in terms of the number of uncensored
observations (see Table 2, bottom), the estimated coefficients are similar.23 The Mills
ratio is now positive. This is what one expects if some unobserved determinant of opening
an affiliate in a particular country, such as firm productivity, at the same time leads to
higher affiliate sales.
How does accounting for sample selection affect the sales results? First, compared to
the earlier results of Table 1, column 6, sales are falling now stronger (and significantly,
at standard levels) with trade costs, with the coefficient on moving from around -0.2
to -0.8 in Table 3. Second, the impact of productivity on affiliate sales becomes somewhat
stronger than before. Taken together, accounting for sample selection means lower sales
in distant locations, especially if the firm has relatively low productivity. The findings
regarding Hypothesis 2 are unchanged: gravity in sales is particularly strong in industries
23There is a subtle difference in the interpretation of the first step: in the import specifications, the
affiliate is present and has positive imports, while for sales, it is that the affiliate is present.
19

where knowledge is difficult to transfer. We estimate coefficients on the × variable
of about -18, versus -16 in the comparable least-squares specification. We conclude that
the support for our model’s Hypotheses 1 and 2 is not due to selection generating the
particular sample for which we observe FDI.
Comparative Advantage The model of Helpman (1985) suggests that imports
of intermediate inputs should be high when countries are very different in terms of their
endowments so that comparative advantage plays a role. In his model, high human capital
countries develop technologies and intermediates of relatively high skill intensity. In the
following we consider three specific sources of comparative advantage, arising from skill
abundance, capital abundance, and institutional factors. Our approach, following Romalis
(2004) and Nunn (2007), is based on multiplying a country characteristic (such as skill
abundance) by the corresponding industry characteristic (skill intensity). If the empirical
support for Hypotheses 1 and 2 presented above masks comparative advantage forces at
work, including these variables should alter our findings on the × variable.
The results from including all three sources of comparative advantage in the imports
regression are shown in columns 1 (OLS) and 2 (Heckman) of Table 3. It turns out that
none of the comparative advantage interaction variables has a significant effect on the
import cost share of U.S. multinational affiliates, and consequently, the impact on the
trade cost-knowledge intensity ( ×) variable is small.
On the right side of Table 3 the corresponding results for affiliate sales are shown.
Generally, comparative advantage has a stronger impact on affiliate sales than on the
affiliate’s import cost share. According to the Heckman specification (column 4), U.S.
affiliates have relatively low local sales of skill intensive goods in skill abundant countries.
This may be because the host country has a comparative advantage in the same goods
that U.S. multinationals specialize in and so product market competition is more intense.
We also find that affiliate sales are higher in countries with an institutional comparative
advantage. While the three comparative advantage interactions raise the (absolute) size
of the × coefficient somewhat, overall there is little evidence to suggest that our
previous results on Hypotheses 1 and 2 are driven by comparative advantage.
Third-Country and Richer FDI Patterns So far we have analyzed the sales of
multinational affiliates to unaffiliated parties in the local (host country) market. We are
mindful however that affiliate sales also go back to the home market, the United States, in
which case the products were most likely intermediate goods. Another possibility is that
affiliate sales go into third markets. This may be final products, a phenomenon that is
sometimes called export platform FDI. It could also be that multinational firms maintain
20

a network of affiliates abroad in which different affiliates specialize in particular inputs,
so that the multinational’s input sourcing decisions are not exclusively between home and
host country. As noted above, the FDI data we are working with allows to separate sales
to the local (host country) market from sales to home (the U.S.) and from sales to third
markets. In this section we explore these different sales destinations; see Table 4 for the
results.24
On the left side, we repeat the OLS and Heckman results for local sales from Tables
1 and 2 for convenience. Results for onward sales to third markets are in columns 3 and
4, for sales to the U.S. in columns 5 and 6, while columns 7 and 8 show results for All
Sales. Consider first affiliate sales to third countries. Here, the impact of trade costs is
positive, in line with a ’trade-cost jumping’ argument: if the sales do not go to the local
market, they are higher the further away the host country is from the United States.
This is because a greater distance to the United States means that the firm would have
to incur higher and higher trade costs if it would not sell through an affiliate. Also note
that host country GDP is not as important for third-market sales as it is for local sales.
This supports our interpretation of the coefficient in the local sales regressions as being a
measure of sales potential. Moreover, whether the local language is English or not has no
significant impact on third-market sales. While in the case of third-market sales there is
no evidence that sample selection matters, the coefficient on × remains negative
and, with about -36, it is about twice as large in absolute value as in the case of local
sales.
An even stronger impact of knowledge intensity on the degree of gravity in affiliate
sales exists in the case of sales back to the United States, as seen from the results in
columns 5 and 6. This is plausible because for these sales there is typically two-way
shipping, intermediate goods from the U.S. to the FDI host country, and back to the
United States. The linear trade cost effect for affiliate sales to the U.S. is also larger than
for local- or third-market sales. Moreover, the GDP of the host country plays even less of
a role for affiliate sales to the U.S. than for third-market FDI. This suggests that market
access considerations do not drive this FDI, but lower factor cost motives (assembly in the
South) may be the motive. As expected, the results for All Sales in columns 7 and 8 pick
up elements from all three sales destinations. The coefficient on the trade cost-knowledge
intensity interaction is about -30, which supports Hypothesis 2 derived above.
Overall, we take the results on the trade cost-knowledge intensity variable to mean
that frictions to disembodied knowledge transfer matter whether there are strong market
access motives to FDI or not.
24For affiliate imports, we know the fraction that is intermediate inputs ("for further processing"), as
well as the fraction that comes from the multinational parent as opposed to other U.S. entities.
21

Further Micro-Level Estimation Results In section 4 of the Web Appendix
we show additional regression results that examine the robustness of the evidence in
support of Hypothesis 1 and Hypothesis 2 along several important dimensions. First,
we have constructed seven alternative measures of the knowledge intensity of production,
including four based on the widely-used O*NET data base of the U.S. Department of
Labor. Results for each of these alternative measures are compared to our main measure,
R&D intensity, in section 4.1. Second, we have assessed the extent to which our results
on the × variable are indeed driven by the geography of multinational activity, or
in fact by other factors—such as institutional quality, costs of communication, and factor
cost differences—that are not explicitly modeled in our framework; see section 4.2 of the
Web Appendix for results. Moreover, in section 4.3.1 of the Web Appendix we analyze
whether our results might be driven primarily by trade within the network of affiliates
a particular multinational has, as opposed to being related to costly knowledge transfer
from the headquarters. In addition, the possibility that the costs of knowledge transfer
are primarily sunk (as opposed to recurrent) is explored by examining the dynamics
of multinational activity (see section 4.3.2 of the Web Appendix). The general picture
emerging from these analyses is that our focus on the importance of costly disembodied
international knowledge transfer is justified because empirically accounting for the factors
that are not included in our framework does not substantially weaken the evidence in
support of Hypothesis 1 and Hypothesis 2.
So far we have tested two central predictions of the model. Moreover, a number of
factors outside of the framework have been considered as well, providing ample oppor-
tunity for the model to be rejected by the data. As discussed in the previous section,
this has not happened. Thus, we change tacks at this point and use the model as a tool
to quantify the importance of costly knowledge transfer. We now turn to the economic
magnitudes implied by our estimates.
5 Economic Magnitudes
In this section, we use the model together with the econometric estimates to quantify
the economic impact of disembodied knowledge transfer costs. First, we parameterize
the cost function and use the econometric estimates to calculate the implied effect of the
disembodied knowledge transfer frictions on affiliates’ marginal costs. Second, building
on the affiliate cost estimates we employ the model to assess how important disembodied
knowledge transfer costs are in explaining aggregate sales of multinational firms.
22

Affiliate Marginal Cost To operationalize the cost equation (4), we assume that
the elasticity of substitution across intermediate inputs is equal to unity, that the knowl-
edge transfer cost function is given by () = exp(), and that the cost share function
(|) is exponential with parameter 1. This implies that
ln
= − 1
ln
By further assuming that 1 = 0 − 1 we arrive at a reduced form that is exactly
consistent with our estimating equation. Using the coefficient estimates from column 1
of Table 1 and evaluating the expression at the average knowledge intensity, we obtain
1 = 2794 − 36089 × 0042 = 127825 As we are working with industry averages,
industry indices are henceforth dropped.
With this parameterization, the marginal cost of obtaining the composite intermediate
for the average affiliate is
( ) = exp
µ
µ1−
− 1
¶¶ (10)
Aggregating trade costs using export weights to obtain country-level average trade costs
() and using the estimate of 1, we can compute the marginal cost of a given affiliate
relative to the marginal cost of a plant in the United States.
The results on average for certain groups of countries are shown in Table 5a. In column
1 the (relative) cost of a plant in the U.S. are shown; it is equal to one irrespective of
the destination of final sales. Trade frictions induce variation in the costs of serving
foreign markets through exporting and embodied technology transfer, see column 2. The
multinational affiliate’s average costs inclusive of disembodied knowledge transfer costs,
( ), is shown in column 3, while the affiliate’s average costs under the assumption
that countries were to reduce their tariffs by 50% are shown in column 4.
The last row of Table 5a indicates that, across all countries, the average affiliate’s
marginal cost of production is 9 percent higher than that of a U.S. plant while the marginal
cost of exporting is 10 percent higher. Were host countries to embark on a 50% tariff
liberalization, the average effect would be to lower the affiliate cost disadvantage relative
to a U.S. plant by 22 percent (column 4). At the other extreme, if trade in intermediate
inputs would be banned ( approaches∞) so that firms could only rely on disembodiedknowledge transfer, the cost of the average affiliate would rise to 119 percent above that
25The Table 1, column 1 estimates are preferred to make this calculation because without other variables
the coefficients have a structural interpretation in terms of the model.
23

of a U.S. plant.
The key insight is that the endogenous choice between disembodied and embodied
knowledge transfer—both of which entail costs—ties the costs of affiliate operation to that
of shipping from home, and the marginal cost savings obtained by opening a local affiliate
are smaller than in the standard trade-versus-FDI framework.
Gravity and Knowledge Transfer We now assess the ability of the mechanism
in the model to explain aggregate affiliate sales. To do this, we further parameterize the
model. First, we assume that the distribution of productivities over the mass of firms is
distributed Pareto, () = 1−−. We show in section 5 of the Web Appendix that the
aggregate affiliate sales made by home country firms in country is then given by
= ()
1− −1
− + 1×h¡
¢ −1i×h( )
1− −1i× (11)h
( )1− ¡( )
1− − 1−
¢ −1−1
iThis expression shows that aggregate sales can be decomposed into three components
isolated in equation (11) by square brackets. The first captures differences across countries
in the level of demand, , facing a typical U.S. firm. The second is differences across
countries in the size of the fixed cost, , of opening an affiliate. The last bracketed term
captures the direct impact of trade costs on aggregate affiliate sales to investing abroad
in the presence of embodied and disembodied knowledge transfer costs.
It is useful to compare this expression with that for the standard proximity benefit
model of multinational production, Helpman, Melitz, and Yeaple (2004; HMY), which
our analysis generalizes. In their model aggregate affiliate sales are given by the same
expression as equation (11) except that ( ) is fixed at unity. In both models, an
increase in raises the proximity benefit of FDI production because it avoids rising trade
costs. In HMY this is the only effect, and consequently the model implies that affiliate
sales are rising in trade costs. In our model, there are two other effects. First, on the
intensive margin an increase in raises ( ) and so it reduces affiliate sales. Second,
on the extensive margin because affiliates reduce their marginal cost relative to the parent
from only to ( ) (not to 1), the proximity benefit of affiliate production is only
( )1− − 1− rather than 1− 1−
By parameterizing (11) using (10) and employing estimates for and −1 , each of the
square-bracketed terms in equation (11) and its equivalents in the HMY model can be
computed, see section 5 of the Web Appendix.26 The terms are separable in logarithms, so
26We choose = 6 to be consistent with a twenty percent mark-up over marginal cost. Our estimate
24

that we can directly assess the importance of each mechanism for aggregate affiliate sales.
Because market size and geography are the two central determinants of multinational
activity, we do so by projecting the log of each square-bracketed term on the log host
country GDP and the log of bilateral trade costs, akin to the gravity equation in trade.
The results are shown in Table 5b.
The first column shows results from a regression of local affiliate sales on host country
GDP and trade costs; this uses aggregate (country-level) data from the publicly available
1999 U.S. benchmark survey ( = 30). Sales vary roughly one for one with GDP, and a one
percent increase in trade costs is associated with a 10 percent fall in affiliate sales. How do
these results match up with the standard trade-versus-FDI model of HMY? In column 2,
labeled Marginal Cost, we run the log ofh¡1− 1−
¢ −1−1
i the HMY analog of the third
bracketed term in equation (11), on the gravity variables GDP and trade costs.27 The
coefficient estimate on trade cost is precisely estimated at around 0.7. This coefficient says
that on account of the Marginal Cost mechanism, higher trade costs lead to higher affiliate
sales. It captures the essence of the proximity argument for FDI: opening more affiliates
abroad is the way to avoid rising trade costs. However, as the Data regression shows, an
increase in trade costs is associated with lower affiliate sales. The standard model gets
this part of the story wrong, and the only way to rationalize within the model the lower
sales in high-trade cost destinations is to pick up that high-trade cost destinations also
tend to have relatively low demand for U.S. products (see column 4).
The results of the Marginal Cost regression for our model, with the third square-
bracketed term of equation (11) as the dependent variable, are shown in column 5. The
coefficient estimate on trade cost is equal to -2.89. The fact that this is negative means
that affiliates’ marginal cost increases contribute to affiliates having lower sales in high-
trade cost locations. Lower sales with rising trade costs is a major feature of FDI data
(see column 1), and higher marginal cost is an excellent candidate for explaining lower
sales in virtually any economic model, so we find this qualitative result comforting.
The negative coefficients on trade cost in Fixed Cost and Market Size regressions
(columns 6 and 7) mean that higher fixed costs and lower market size in high-trade cost
destinations also help to account for the overall finding of lower affiliate sales in high-
trade cost locations.28 It is natural to ask how quantitatively important disembodied
knowledge transfer costs, as captured in our analysis by the Marginal Cost term, are in
of −1 = 109 is obtained by running a log-rank - log size regression on U.S. manufacturing data. This
estimate is above the 1.01 used by Irrazabal et al (2010) and slightly below the average industry value
found by Helpman, Melitz, and Yeaple (2004) using European firm-level data.27In constructing this Marginal Cost term, we employ our estimates on and as described above.28The Fixed Cost dependent variable is log
h( )
1− −1i. Because
−1 1, the results indicate that
fixed costs are increasing in GDP and increasing in the size of trade cost.
25
accounting for variation in aggregate affiliate sales. Given the log-additivity of the three
square-bracketed terms that are the dependent variables in Table 5b, columns (5), (6),
and (7), the sum of the coefficients on the trade cost regressor is by construction equal
to -10.11, the value in the Data regression. Thus, we compute as the contribution of the
Marginal Cost, Fixed Cost, and Market Size terms in explaining the overall gravity of
multinational affiliate sales about 29% (=(-2.89)/(-10.11)), 16%, and 56%, respectively,
as given in the last row of Table 5b.
The main lesson is that not only can our model explain lower affiliate sales in more
distant markets, which the standard model cannot, but the gravity of knowledge mecha-
nism is quantitatively important with almost 30% of the total effect.29 We now turn to
implications of the theory for the knowledge content of multinational trade.
6 The Knowledge Intensity of Multinational Trade
The model predicts that as trade costs rise, multinationals offshore the production of
increasingly knowledge-intensive activities, and so the affiliates’ imports become increas-
ingly concentrated in goods that are knowledge intensive as well (this follows from equation
3). To examine whether this is borne out by the data, we compute the average knowl-
edge intensity of U.S. exports to affiliates in other countries from the related-party trade
data of the U.S Census Bureau.30 Across 500 possibly traded six-digit NAICS industries
with varying R&D intensities, this average reflects the extensive margin of the knowledge
intensity of multinational trade.
[Figure 1 somewhere here]
Figure 1 shows a positive relationship between knowledge intensity and trade costs.31
Moreover, with an 2 of 0.44 the fit is quite tight. One might be concerned that this bi-
variate relationship is driven by other factors, such as the variables that were employed in
the regression analysis in section 4. A more specific concern is that the relationship reflects
trade costs rising more slowly in distance for highly knowledge-intensive goods because
these goods, to some extent intangibles, have lower weight-to-value ratios. However, we
have found that the relationship between average knowledge intensity and trade cost is
29If we compute based on a specification that account for factors not in the model, including
wage differences leading to comparative advantage such as column 2 in Table 4, this leads to a value
of 1 = 1979 − 21915 ∗ 0042 = 106 and, following the same steps as before, the contribution of
disembodied knowledge transfer to the gravity in affiliate sales is estimated at about 29% as well.30This covers all related-party trade between U.S. entities and foreign entities, where a related-party is
one in which there exists at least a 6 percent ownership share. We employ Census rather than BEA data
because the former has much greater industry detail while at the same time the firm-level information of
the BEA is here not required. The data is for the year 2002.31Data is in logs; the best-fit line corresponds to a weighted regression, with GDP as weights.
26

robust to these considerations, see section 6 of the Web Appendix. The finding that the
knowledge content of multinational trade follows the model’s prediction constitutes an
important confirmation of the model.
We now turn to some concluding observations.
7 Conclusions
How large are barriers to transferring knowledge across space, and what is the nature of
these barriers? To provide answers to these fundamental questions, we have analyzed the
structure of the international operations of U.S. multinational firms. Because these firms
develop production knowledge in one location and then seek to deploy this knowledge as
efficiently as possible across the globe, we can infer much from their behavior about the
size and the nature of knowledge transfer costs.
We proposed a model in which trading inputs means embodied knowledge transfer,
while input production through FDI involves disembodied knowledge transfer. The costs
of transfer vary with the knowledge intensity and the destination market. For each com-
ponent of knowledge, firms select the transfer mode in order to minimize their cost of
serving each foreign market, and affiliate costs reflect an endogenous mixture of disem-
bodied and embodied knowledge transfer costs. We derived several key predictions from
this mechanism. In particular, because production of firms in knowledge intensive indus-
tries requires more non-codified knowledge, these firms rely more on embodied knowledge
transfer and the affiliates’ production cost is more sensitive to variation in trade costs.
Also, if disembodied knowledge transfer entails substantial fixed costs, large firms will
employ a higher ratio of disembodied to embodied knowledge transfer.
Using rich panel data on individual U.S. multinational firms, we confirmed these pre-
dictions of the model. Our results provide evidence that the knowledge intensity of pro-
duction affects the level of foreign sales as well as the composition of disembodied versus
embodied technology transfer that firms use. We show that only when amended with
our knowledge transfer mechanism can the standard multinational firm model explain
why sales decline with distance from home. Moreover, our mechanism can account quan-
titatively for a significant portion of the variation in aggregate affiliate sales. Finally,
we confirm the model’s prediction that the knowledge intensity of trade rises with the
distance between trade partners.
Economists know little about the impact of relative cost changes for disembodied ver-
sus embodied knowledge transfer, even though both appear to be changing at a rapid
pace. Communicating knowledge-intensive information may become cheaper through
video-conferencing compared to telephone calls, while at the same time the knowledge
27

embodied in traded inputs becomes more movable because trade barriers and transporta-
tion costs are falling. Our results suggest that spatial frictions — in form of both costs of
trading goods and of transferring knowledge — cannot be addressed independently. This
research provides a starting point for assessing the impact of such changes for production
and trade across the globe.
Even in the world of the internet we find that spatial barriers to disembodied knowledge
transfer are large, and this has implications for many fields of economics, such as industrial
organization, productivity and innovation, and development. In industrial organization
it has been shown that firms that are part of a domestic production chain do not nearly
transfer as many goods within the chain as existing theories of vertical integration suggest,
a finding which may be due to the fact that the key inputs determining firm organization
are knowledge inputs (Hortacsu and Syverson 2009). If so, the spatial organization of
firms depends critically on the spatial barriers to disembodied knowledge transfer, and as
spatial barriers to disembodied knowledge transfer fall, vertical links between firms will be
increasingly invisible as there is less embodied knowledge transfer and more disembodied
transfer.
Our findings are consistent with the view that the returns to the accumulation of
knowledge are reduced in the presence of barriers to effective knowledge transfer, which
has implications for the literature on innovation and productivity. Moreover, our work
suggests in general that the more knowledge intensive a production process is, the less
likely its knowledge will spatially diffuse, which has important implications for cross-
country income convergence. Given the relative simplicity of the mechanism highlighted
in this paper, we hope to incorporate it into models of endogenous innovation and growth
in future work.
References
[1] Acemoglu, Daron, Philippe Aghion, Claire Lelarge, John van Reenan, and Fabrizio
Zilibotti (2007), “Technology, Information and the Decentralization of the Firm,”
Quarterly Journal of Economics 122: 1759-1799.
[2] Aghion, Philippe., and Peter Howitt (1998), Endogenous Growth Theory, MIT Press:
Cambridge, MA.
[3] Anderson, James, and Eric VanWincoop (2004),“Trade Costs,” Journal of Economic
Literature, 42, 691-751.
28

[4] Antras, Pol. (2003), "Firms, Contracts, and Trade Structure", Quarterly Journal of
Economics 118: 1375-1418.
[5] Antras, Pol., Luis Garicano, and Esteban Rossi-Hansberg (2008), "Organizing Off-
shoring: Middle Managers and Communication Costs," in Elhanan Helpman, Dalia
Marin, and Thierry Verdier (eds.), The Organization of Firms in a Global Economy,
Harvard University Press.
[6] Arkolakis, Costas, Natalia Ramondo, Andres Rodriguez-Clare, and Stephen Yeaple
(2011).“Proximity versus Comparative Advantage: A Quantitative Theory of Trade
and Multinational Production,” mimeo, Penn State University.
[7] Arrow, Kenneth (1969). “Classificatory Notes on the Production and Transmission
of Technological Knowledge,” American Economic Review 59(2): 29-35.
[8] Blinder, Alan. (2006), “Offshoring: The Next Industrial Revolution?,” Foreign Af-
fairs, March/April 2006, pp.113-128.
[9] Blonigen, Bruce. (2001), "In Search of Substitution Between Foreign Production and
Exports", Journal of International Economics, Vol. 53 (February 2001), pp. 81-104.
[10] Burstein, Ariel, and Alexander Monge-Naranjo (2009), "Foreign Know-how, Firm
Control, and the Income of Developing Countries", Quarterly Journal of Economics
124(1): 149-195.
[11] Costinot, Arnaud (2009), “An Elementary Theory of Comparative Advantage",
Econometrica 77,4: 1165-1192.
[12] Feenstra, Robert, John Romalis, and Peter Schott (2002), "U.S. Imports, Exports,
and Tariff Data, 1989-2001", NBER Working Paper # 9387.
[13] Glaeser, Edward L. and Janet E. Kohlhase (2004), “Cities, Regions and the Decline
of Transport Costs,” Papers in Regional Science 83(1): 197—228.
[14] Hall, R., and C. Jones (1999), "Why do some countries produce so much more Output
per Worker than other Countries?",Quarterly Journal Economics
[15] Hanson, Gordon, Raymond Mataloni, and Matthew Slaughter (2005). “Vertical Pro-
duction Networks in Multinational Firms,” Review of Economics and Statistics 87(4):
664-678.
29

[16] Heckman, James (1976), “The Common Structure of Statistical Models of Trunca-
tion, Sample Selection and Limited Dependent Variables,” Annals of Economic and
Social Measurement.
[17] Helpman, Elhanan (1985), "Multinational Corporations and Trade Structure", Re-
view of Economic Studies 52: 443-458.
[18] Helpman, Elhanan (1984). “A Simple Theory of International Trade with Multina-
tional Corporations," Journal of Political Economy 92(3): 451-471.
[19] Helpman, Elhanan, Marc Melitz, and Stephen R. Yeaple (2004), “Exports versus
FDI with Heterogenous Firms,” American Economic Review.
[20] Hillberry, Russell, and David Hummels (2003), “Intra-national Home Bias: Some
Explanations”, Review of Economics and Statistics 85: 1089-1092.
[21] Hortacsu, Ali, and Chad Syverson (2009), “Why Do Firms Own Production Chains?”
mimeo University of Chicago.
[22] Irarrazabal, Alfonso, Andreas Moxnes, and Luca David Opromolla (2010). “The Mar-
gins of Multinational Production and the Role of Intra-Firm Trade,” mimeo, Univer-
sity of Oslo.
[23] Jones, Chad (2002), “Sources of U.S. Economic Growth in a World of Ideas,” Amer-
ican Economic Review 92 (1): 220-239.
[24] Keller, Wolfgang (2002), ”Geographic localization of international technology diffu-
sion”, American Economic Review 92: 120-142.
[25] Keller, Wolfgang, and Stephen R. Yeaple (2009), "Multinational Enterprises, Inter-
national Trade, and Productivity Growth: Firm-Level Evidence from the United
States", Review of Economics and Statistics, November.
[26] Keller, Wolfgang, and Stephen R. Yeaple (2008), "Global Production and Trade in
the Knowledge Economy", NBER Working Paper # 14626.
[27] Koskinen, Kaj U., and Hannu Vanharanta (2002), "The role of tacit knowledge in
innovation processes of small technology companies", International Journal of Pro-
duction Economics 80: 57-64.
[28] Krugman, Paul (1991), “Increasing Returns and Economic Geography,” Journal of
Political Economy 99(3): 483-499.
30

[29] Levy, Frank and Richard Murnane (2005),“How Computerized Work and Globaliza-
tion Shape Human Skill Demands,” mimeo, MIT.
[30] Lucas, Robert (1993), “Making a Miracle,” Econometrica 61 (1993): 251-272.
[31] Markusen, James (2002),Multinational Firms and the Theory of International Trade,
Cambridge, MA: MIT Press.
[32] Markusen, James (1984). “Multinationals, Multi-Plant Economies, and the Gains
from Trade,” Journal of International Economics 16: 205-226.
[33] Melitz, Marc (2003) "The Impact of Trade on Intra-Industry Reallocation and Ag-
gregate Industry Productivity", Econometrica.
[34] Nunn, Nathan (2007), "Relationship-Specificity, Incomplete Contracts and the Pat-
tern of Trade," Quarterly Journal Economics, 122(2): 569-600.
[35] Polanyi, Michael (1966), The Tacit Dimension, Garden City, New York: Doubleday.
[36] Ramondo, Natalia, Veronica Rappoport, and Kim Ruhl (2012), "Horizontal ver-
sus Vertical FDI: Revisiting Evidence from U.S. Multinationals", working paper,
Columbia University.
[37] Ramondo, Natalia and Andres Rodriguez-Clare (2010). “The Gains from Openness:
Trade, Multinational Production, and Foreign Ideas,” mimeo, Penn State University.
[38] Romalis, John (2004), “Factor Proportions and the Structure of Commodity Trade,”
American Economic Review, 94(1): 67-97.
31

A Appendix
A.1 Proof of Lemma 1 - Elasticity of Marginal Cost
Proof is by contradiction. Suppose ( 1) ( 2), then from (5) the following
condition must holdR∞ (|1)R 0(|1)()1− +
1− R∞ (|1)
R∞ (|2)R 0(|2)()1− +
1− R∞ (|2)
which simplifies toZ ∞
(|1)Z 0
(|2)()1− Z ∞
(|2)Z 0
(|1)()1− (12)
Let 0 00, then log supermodularity implies
(0|1)(00|2)(00)1− (0|2)(00|1)(00)1−
Now integrate this expression with respect to 00 over [0 0) and integrate this expression
with respect to 0 over [0∞) to obtainZ ∞
0(|1)
Z 0
0
(|2)()1− Z ∞
0(|2)
Z 0
0
(|1)()1−
Replacing 0 with b yields an expression that contradicts (12).A.2 Proof of Proposition 1 - Import Cost Share
Part (i) follows directly from Lemma 1 and the definition of the import cost share. To
prove part (ii) take the logarithm of (5) and differentiate with respect to to obtain
( )
( )= −( − 1)(1− ( ))− b
(b|)R∞ (|) 0 (13)
To prove part (iii), use (13), the fact that part (i) implies ( 1) ( 2), and the fact
that the monotone likelihood ratio property implies
(b|1)R∞ (|1) (b|2)R∞ (|2)
32

to obtain
−"( − 1)(1− ( 2)) +
b
(b|2)R∞ (|2)
# −
"( − 1)(1− ( 1)) +
b
(b|1)R∞ (|1)
# 0
A.3 Proof of Proposition 2 - Gravity of Affiliate Sales
Parts (i) and (ii) follow from the fact that the elasticity of local affiliate sales revenue
with respect to trade costs is proportional to the elasticity of marginal cost with respect
to trade costs:
( ) = (1− ) ( )
and from Lemma 1.
33
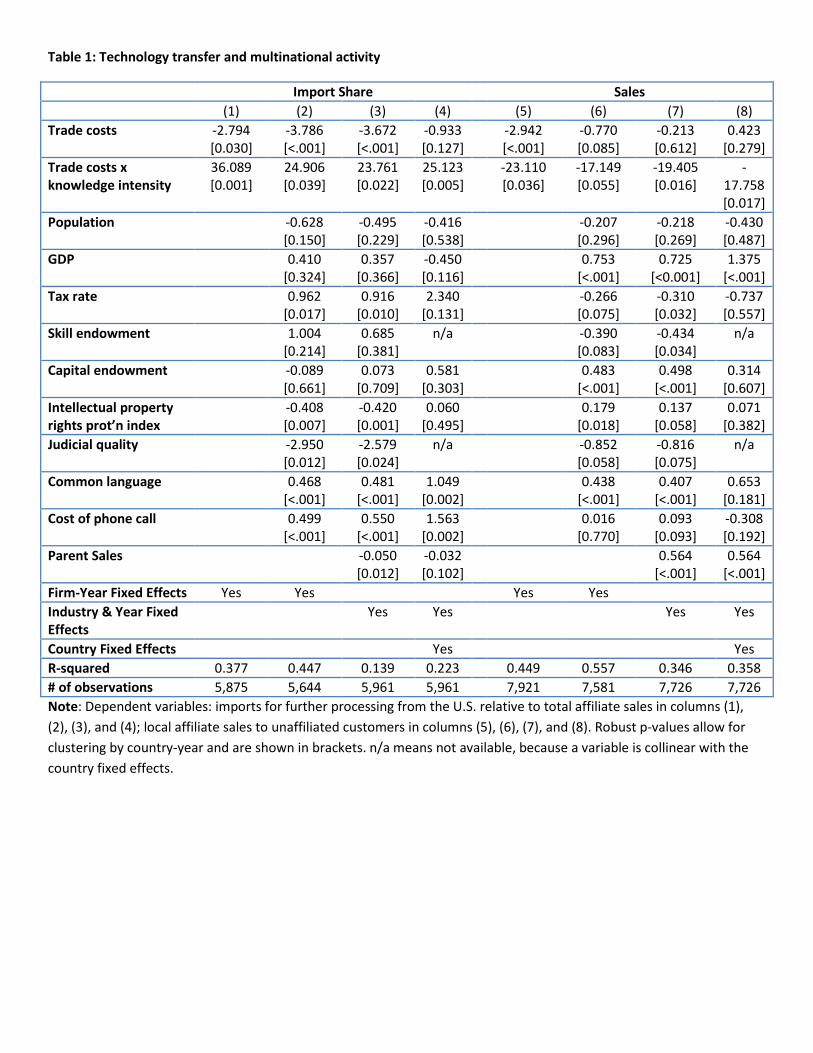
Table 1: Technology transfer and multinational activity
Import Share Sales (1) (2) (3) (4) (5) (6) (7) (8)
Trade costs -2.794 [0.030]
-3.786 [<.001]
-3.672 [<.001]
-0.933 [0.127]
-2.942 [<.001]
-0.770 [0.085]
-0.213 [0.612]
0.423 [0.279]
Trade costs x knowledge intensity
36.089 [0.001]
24.906 [0.039]
23.761 [0.022]
25.123 [0.005]
-23.110 [0.036]
-17.149 [0.055]
-19.405 [0.016]
-17.758 [0.017]
Population -0.628 [0.150]
-0.495 [0.229]
-0.416 [0.538]
-0.207 [0.296]
-0.218 [0.269]
-0.430 [0.487]
GDP 0.410 [0.324]
0.357 [0.366]
-0.450 [0.116]
0.753 [<.001]
0.725 [<0.001]
1.375 [<.001]
Tax rate 0.962 [0.017]
0.916 [0.010]
2.340 [0.131]
-0.266 [0.075]
-0.310 [0.032]
-0.737 [0.557]
Skill endowment 1.004 [0.214]
0.685 [0.381]
n/a -0.390 [0.083]
-0.434 [0.034]
n/a
Capital endowment -0.089 [0.661]
0.073 [0.709]
0.581 [0.303]
0.483 [<.001]
0.498 [<.001]
0.314 [0.607]
Intellectual property rights prot’n index
-0.408 [0.007]
-0.420 [0.001]
0.060 [0.495]
0.179 [0.018]
0.137 [0.058]
0.071 [0.382]
Judicial quality -2.950 [0.012]
-2.579 [0.024]
n/a -0.852 [0.058]
-0.816 [0.075]
n/a
Common language 0.468 [<.001]
0.481 [<.001]
1.049 [0.002]
0.438 [<.001]
0.407 [<.001]
0.653 [0.181]
Cost of phone call 0.499 [<.001]
0.550 [<.001]
1.563 [0.002]
0.016 [0.770]
0.093 [0.093]
-0.308 [0.192]
Parent Sales -0.050 [0.012]
-0.032 [0.102]
0.564 [<.001]
0.564 [<.001]
Firm-Year Fixed Effects Yes Yes Yes Yes Industry & Year Fixed Effects
Yes Yes Yes Yes
Country Fixed Effects Yes Yes R-squared 0.377 0.447 0.139 0.223 0.449 0.557 0.346 0.358 # of observations 5,875 5,644 5,961 5,961 7,921 7,581 7,726 7,726 Note: Dependent variables: imports for further processing from the U.S. relative to total affiliate sales in columns (1), (2), (3), and (4); local affiliate sales to unaffiliated customers in columns (5), (6), (7), and (8). Robust p-values allow for clustering by country-year and are shown in brackets. n/a means not available, because a variable is collinear with the country fixed effects.

Table 2: Technology transfer and the extensive margin
Import Share Sales (1) (2) (3) (4) (5) (6) Second Stage Trade costs -1.744
[0.002] -3.806 [<.001]
-2.037 [<.001]
-0.751 [0.036]
-1.607 [<.001]
-0.772 [0.029]
Trade costs x knowledge intensity
20.599 [0.046]
24.030 [0.011]
22.349 [0.024]
-18.060 [0.005]
-16.034 [0.023]
-18.223 [0.004]
Parent Sales -0.365 [<.001]
-0.028 [0.594]
-0.297 [<.001]
0.665 [<.001]
0.835 [<.001]
0.658 [<.001]
Selection Equation Trade costs -0.982
[<.001] -1.087 [<.001]
-0.904 [<.001]
-0.857 [<.001]
-0.937 [<.001]
-0.767 [<.001]
Trade costs x knowledge intensity
3.762 [0.229]
1.510 [0.623]
3.560 [0.250]
3.043 [0.298]
0.662 [0.818]
2.719 [0.348]
Parent Sales 0.216 [<.001]
0.214 [<.001]
0.217 [<.001]
0.242 [<.001]
0.240 [<.001]
0.243 [<.001]
Population -0.272 [<.001]
-0.185 [<.001]
-0.297 [<.001]
-0.182 [<.001]
-0.095 [0.044]
-0.201 [<0.001]
GDP 0.671 [<.001]
0.594 [<.001]
0.675 [<.001]
0.648 [<.001]
0.568 [<.001]
0.644 [<.001]
Cost of Starting Business
-0.181 [<.001]
-0.188 [<.001]
-0.174 [<.001]
-0.183 [<.001]
Foreign Market Potential
0.225 [<.001]
0.257 [<.001]
0.237 [<.001]
0.269 [<.001]
Mills Ratio: λ -1.993 [<.001]
0.137 [0.659]
-1.572 [<.001]
0.579 [<.001]
1.607 [<.001]
0.541 [<.001]
Wald χ2 (59 d.o.f.)
819.98 [<.001]
960.12 [<.001]
883.34 [<.001]
1,755.42 [<.001]
1,456.15 [<.001]
1,853.08 [<.001]
# of obs. 45,121 46,562 45,121 45,121 46,562 45,121 Note: Dependent variables: imports for further processing from the US parent relative to total affiliate sales in columns (1), (2), and (3); local affiliate sales to unaffiliated customers in columns (4), (5), and (6). All specifications include in both stages the following variables: Population, GDP, Parent Sales, Tax rate, Skill Endowment, Capital Endowment, Intellectual Property Rights Index, Judicial Quality, Common Language, and Cost of Phone Call (not all estimates shown). All specifications include industry and year fixed effects. P-values are shown in brackets.
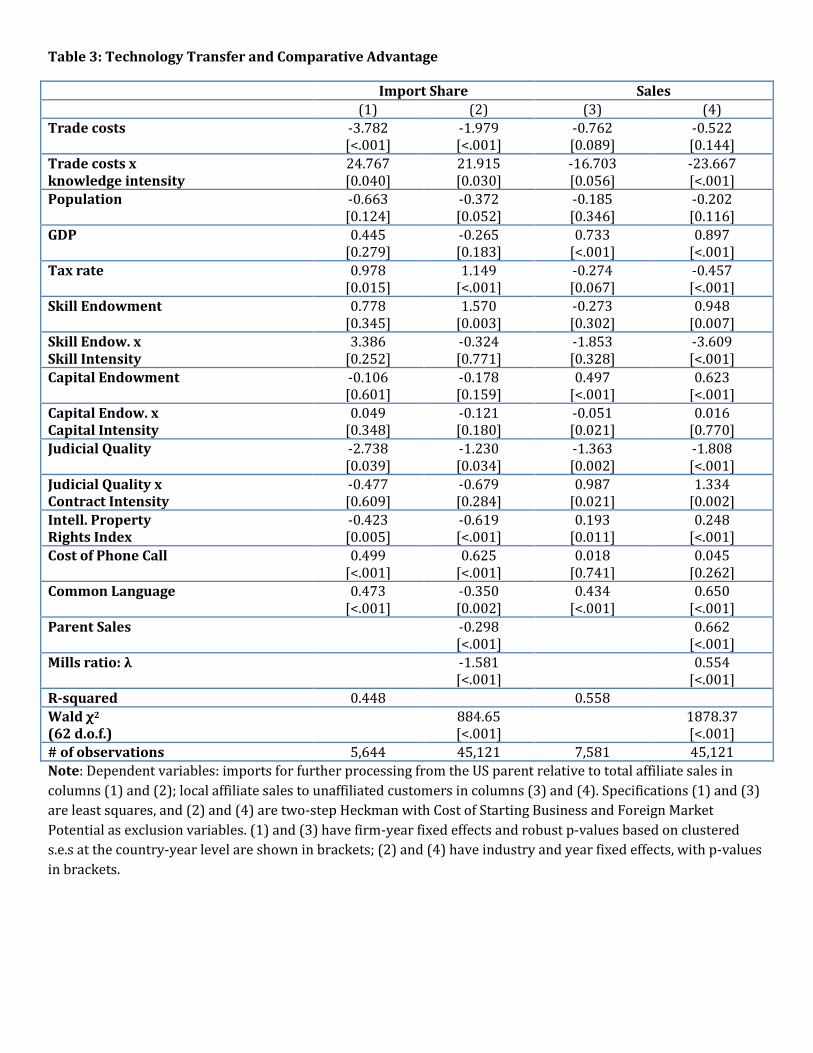
Table 3: Technology Transfer and Comparative Advantage
Import Share Sales (1) (2) (3) (4) Trade costs -3.782
[<.001] -1.979 [<.001]
-0.762 [0.089]
-0.522 [0.144]
Trade costs x knowledge intensity
24.767 [0.040]
21.915 [0.030]
-16.703 [0.056]
-23.667 [<.001]
Population -0.663 [0.124]
-0.372 [0.052]
-0.185 [0.346]
-0.202 [0.116]
GDP 0.445 [0.279]
-0.265 [0.183]
0.733 [<.001]
0.897 [<.001]
Tax rate 0.978 [0.015]
1.149 [<.001]
-0.274 [0.067]
-0.457 [<.001]
Skill Endowment 0.778 [0.345]
1.570 [0.003]
-0.273 [0.302]
0.948 [0.007]
Skill Endow. x Skill Intensity
3.386 [0.252]
-0.324 [0.771]
-1.853 [0.328]
-3.609 [<.001]
Capital Endowment -0.106 [0.601]
-0.178 [0.159]
0.497 [<.001]
0.623 [<.001]
Capital Endow. x Capital Intensity
0.049 [0.348]
-0.121 [0.180]
-0.051 [0.021]
0.016 [0.770]
Judicial Quality -2.738 [0.039]
-1.230 [0.034]
-1.363 [0.002]
-1.808 [<.001]
Judicial Quality x Contract Intensity
-0.477 [0.609]
-0.679 [0.284]
0.987 [0.021]
1.334 [0.002]
Intell. Property Rights Index
-0.423 [0.005]
-0.619 [<.001]
0.193 [0.011]
0.248 [<.001]
Cost of Phone Call 0.499 [<.001]
0.625 [<.001]
0.018 [0.741]
0.045 [0.262]
Common Language 0.473 [<.001]
-0.350 [0.002]
0.434 [<.001]
0.650 [<.001]
Parent Sales -0.298 [<.001]
0.662 [<.001]
Mills ratio: λ -1.581 [<.001]
0.554 [<.001]
R-squared 0.448 0.558 Wald χ2
(62 d.o.f.) 884.65
[<.001] 1878.37
[<.001] # of observations 5,644 45,121 7,581 45,121 Note: Dependent variables: imports for further processing from the US parent relative to total affiliate sales in columns (1) and (2); local affiliate sales to unaffiliated customers in columns (3) and (4). Specifications (1) and (3) are least squares, and (2) and (4) are two-step Heckman with Cost of Starting Business and Foreign Market Potential as exclusion variables. (1) and (3) have firm-year fixed effects and robust p-values based on clustered s.e.s at the country-year level are shown in brackets; (2) and (4) have industry and year fixed effects, with p-values in brackets.

Table 4: Sales to different customers: Local, Third-country, U.S., and All
Local Sales Third-Country Sales U.S. Sales All Sales Intensive
Margin Int. & Ext.
Margin Intensive
Margin Int. & Ext.
Margin Intensive
Margin Int. & Ext.
Margin Intensive
Margin Int. & Ext.
Margin Trade costs -0.770
[0.085] -0.772 [0.029]
2.808 [0.005]
2.863 [<.001]
-4.859 [0.005]
-1.405 [0.167]
-0.314 [0.549]
0.252 [0.425]
Trade costs x knowledge intensity
-17.149 [0.055]
-18.223 [0.004]
-36.442 [0.049]
-38.376 [0.002]
-60.503 [0.049]
-47.242 [0.014]
-31.022 [0.003]
-30.078 [<.001]
Population -0.207 [0.296]
-0.233 [0.071]
-0.224 [0.660]
-0.219 [0.333]
-0.131 [0.819]
-0.571 [0.086]
-0.242 [0.224]
-0.270 [0.018]
GDP 0.753 [<.001]
0.922 [<.001]
0.477 [0.345]
0.338 [0.156]
-0.007 [0.990]
-0.351 [0.285]
0.589 [0.003]
0.484 [<.001]
Tax rate -0.266 [0.075]
-0.433 [<.001]
-1.482 [<.001]
-1.252 [<.001]
1.740 [<.001]
1.971 [<.001]
-0.125 [0.343]
-0.030 [0.689]
Skill endowment
-0.390 [0.083]
-0.591 [<.001]
-2.445 [<.001]
-2.510 [<.001]
-1.299 [0.103]
0.122 [0.767]
-1.044 [<.001]
-0.910 [<.001]
Capital endowment
0.483 [<.001]
0.622 [<.001]
-0.289 [0.251]
-0.382 [0.002]
-0.555 [0.111]
-1.213 [<.001]
0.244 [0.020]
0.115 [0.060]
IPR prot’n index
0.179 [0.018]
0.216 [<.001]
0.999 [<.001]
0.976 [<.001]
0.160 [0.624]
-0.171 [0.264]
0.416 [<.001]
0.322 [<.001]
Judicial quality
-0.852 [0.058]
-1.087 [<.001]
2.730 [0.025]
2.655 [<.001]
-0.737 [0.587]
-0.705 [0.364]
-0.070 [0.875]
0.054 [0.842]
Common language
0.438 [<.001]
0.642 [<.001]
0.124 [0.575]
0.065 [0.639]
0.944 [<.001]
-0.339 [0.044]
0.447 [<.001]
0.290 [<.001]
Cost of phone call
0.016 [0.770]
0.034 [0.395]
-0.710 [<.001]
-0.712 [<.001]
-0.558 [0.012]
-0.059 [0.584]
-0.119 [0.078]
-0.090 [0.014]
Parent Sales 0.658 [<.001]
0.559 [<.001]
0.243 [<.001]
0.555 [<.001]
Mills ratio: λ 0.541 [<.001]
-0.072 [0.776]
-2.283 [<.001]
-0.255 [0.015]
Firm-Year FEs Yes Yes Yes Yes Industry and Year FEs
Yes Yes Yes Yes
R-squared 0.557 0.537 0.504 0.567 Wald χ2 (59 d.o.f)
1,853.08 [<.001]
1,822.86 [<.001]
1,048.01 [<.001]
2,665.31 [<.001]
# of observations
7,581 45,221 5,132 45,121 4,496 45,121 8,184 45,121
Note: dependent variable is local affiliate sales to unaffiliated customers in columns (1) and (2); affiliate sales to third countries in columns (3) and (4); sales to the U.S. in (5) and (6); and all affiliate sales in columns (7) and (8). Specifications (1), (3), (5) and (7) by least squares, and specifications (2), (4),(6) and (8) by two-step Heckman; exclusion variables Cost of Starting Business and Foreign Market Potential. p-values, robust and allowing for clustering by country-year in columns (1), (3), (5), and (7) are shown in brackets.

Table 5a: The Marginal Cost of Exporting versus FDI Production (for the average firm) Cost of Plant in
the U.S. Cost of U.S. Plant inclusive of trade
costs
Cost of Affiliate, Actual
Cost of Affiliate after 50% Tariff
Cut Canada 1.00 1.02 1.02 1.02 South America 1.00 1.16 1.14 1.10 Europe 1.00 1.06 1.05 1.05 Australia, New Zealand and Asia
1.00 1.12 1.10 1.07
Global 1.00 1.10 1.09 1.07
Table 5b: Knowledge Transfer and Aggregate Affiliate Sales
Data Helpman, Melitz, Yeaple (2004) This Paper Dependent Variable
Local Sales
Marginal Cost
Fixed Costs
Market Size
Marginal Cost
Fixed Costs
Market Size
(1) (2) (3) (4) (5) (6) (7) GDP 0.92
(6.94) -0.002
(-0.48) -0.04
(-7.03) 0.96
(7.04) 0.00
(0.30) -0.04
(-5.19) 0.96
(7.03) Trade Cost -10.11
(-3.86) 0.692
(10.99) -0.538 (-4.66)
-10.27 (-3.80)
-2.89 (-31.39)
-1.57 (-10.51)
-5.65 (-2.10)
R-squared 0.69 0.82 0.74 0.69 0.97 0.83 0.66 Share of Trade Cost Effect
100% -7% 5% 102% 29% 16% 56%
Notes: All variables are in logarithms. The constant term is suppressed in all regressions. Robust t-statistics in parentheses. N = 30 observations.
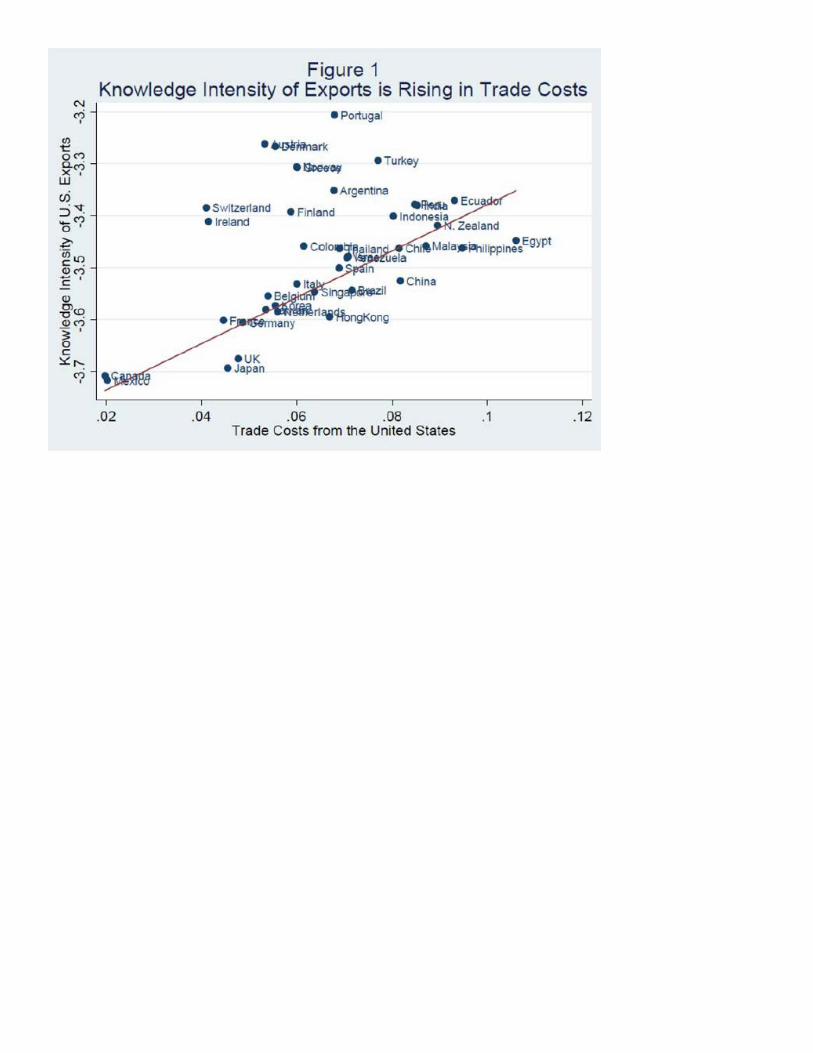

Web Appendix for The Gravity of Knowledge
Wolfgang Keller Stephen R. Yeaple
August 2012
This appendix provindes theoretical and empirical results that take a number of im-
portant steps beyond the analysis in the main text. In section 1 we discuss the generality
of our model, in particular the assumptions that the costs of disembodied knowledge
transfer does not vary with geography and that trade costs do not vary with knowledge
intensity. Section 2 lays out an extension of the model to include fixed costs of knowledge
transfer, while details on the data are given in section 3. The robustness of our micro-level
estimation results is examined along several dimensions in the following section 4. Section
5 provides more details on the steps taken in the quantification of the model. Finally, in
section 6 we corroborate the finding on the knowledge intensity of trade as presented in
Figure 1 in the paper.
1 Generalizations of the Theory
In this section, we elaborate on generalizations of the simple model presented in the
paper lead to qualitatively similar results. First, the assumption that shipping costs were
uniform across goods could have been weaken to all these costs to vary across goods
according to
() = × ()
where () ≥ 1 and 0() 0(). The key assumption is that trade costs do not rise
faster in knowledge intensity than do disembodied knowledge transfer costs. Second, the
assumption that knowledge transfer costs did not rise in trade costs can be adjusted so
that
(; ) = ()()
where 0() ≥ 0 and 0()() 1. The key assumption is that trade costs rise faster indistance than do disembodied knowledge transfer costs. Third, the assumption that the
only variation across industries was in the composition of inputs used in the production
1

of the composite intermediate input can be generalized to allow an industry’s knowledge
intensity to affect intermediate input transfer costs directly according to
() = ()()
where 0() 0. As long as () is not too convex in it is straightforward to show
that this is sufficient to generate our results, and it reinforces the composition effect in
the model.
Some of the model assumptions cannot be generalized. For instance, if the elasticity
of substitution across goods is relatively low in knowledge intensive industries, as opposed
to be identical across industries as we have assumed, this would limit the transmission of
higher marginal costs to affiliate sales, thereby confounding Proposition 2 which supports
Hypothesis 2. In contrast, if inputs were relatively substitutable in knowledge inten-
sive industries, which seems implausible, this too would have confounding effects on the
relationship between trade costs and the import share.
In the following section we consider fixed costs of knowledge transfer.
2 Fixed Costs of Knowledge Transfer
Recent quantitative models of multinational production typically maintain tractability
by assuming that knowledge transfer costs take the form of variable, not fixed costs
(Burstein and Monge-Naranjo 2009, McGrattan and Prescott 2010, and Ramondo and
Rodriguez Clare 2010). This is also the case here, even though it is worth noting that
our framework allows already for fixed costs of affiliate production ( ), which are absent
in much of the literature. Nevertheless, fixed costs may be particularly relevant in the
context of knowledge transfers. While a full treatment is beyond the scope of this paper,
the following extension captures what we think would be their central implication in any
model: firms with large operations incur fixed costs of knowledge transfers in order to
lower their marginal costs, while small firms do not.
Suppose that firms may invest in information and communication technology (ICT) in
order to lower the efficiency cost of knowledge transfer, but doing so requires incurring an
additional fixed cost . Having installed ICT, the efficiency loss of remote production
falls from () to () ∈ (0 1) for all and for all foreign locations. In this setting,the following proposition holds.
Proposition 3: In each industry, there exists a threshold productivity b such that
firms with productivity b incur the fixed cost . Firms that incur the fixed cost
have lower import cost shares in all countries relative to other firms in their industry.
2

Proof. We first show that the affiliates of a firm that installs ICT equipment have lower
marginal costs and a lower import cost share in all countries relative to a firm that does
not We then show that only highly productive firms will install such equipment. The
marginal imported input, e(), of the affiliate of a firm that has incurred that faces
trade costs is given by e() = b() b(),where b() is given by equation (4). Themarginal cost of the composite intermediate of such a firm, ( ), is
( ) =
ÃZ ()0
(|)()1− + 1−Z ∞
() (|)
!1(1−)
which is strictly increasing in . Hence, ( ) ( 1) for 1. The
import cost share is
( ) = 1−
R∞() (|)R ()0
(|)()1− + 1−R∞() (|)
where 1 if () is incurred and = 1 otherwise. We now show that ( )
( 1). Suppose instead that ( ) ( 1), thenR∞() (|)R ()0
(|)()1− + 1−R∞() (|)
R∞() (|)R ()0
(|)()1− + 1−R∞() (|)R ()
0(|)()1−R ()
0(|)()1−
R∞() (|)R∞() (|) 1
where the last step follows from b() e(). Hence,0
Z ()() (|)()1− +
Z ()0
(|) ¡()1− − ()1−¢
Because ()1− ≥ ()1− for ≥ 1 the term on the right hand of this expression must
be positive, which contradicts the assertion. We conclude that ( ) ( 1).
The profit on sales to country of a firm of productivity in industry with an affiliate
in country is given by
Π () =
−1( )1− − (1)
3

and the profit of this firm were it to not install the ICT would be
Π () = max
©
−1( 1)1− − 0ª (2)
Let be the set of countries the firm would open an affiliate if it installs ICT and
let be the set of countries the firm would open an affiliate if it did not install ICT.
It is immediate from the condition in (8) that ⊂ because ( )1−
( 1)1− so the profit associated with local production will be higher relative to
exporting from the home country. The profit gain associated with installing ICT is thus
given by X
³Π ()−Π
()
´−
This expression is strictly increasing, continuous and unbounded from above in and
negative for sufficiently small , hence there exists a cutoff productivity b that satisfiesP
³Π
¡b¢−Π
¡b¢´= . Further, all firms with b will invest
in ICT and all others will not.
Firms that reduce the efficiency loss of disembodied technology transfer reduce their
reliance on imported intermediates and reduce their affiliates’ marginal cost of production.
It is only profitable to incur this fixed cost when aggregate affiliate sales will be large,
which will happen when the scale of a firm’s foreign operations is large as will be the case
if it is very productive (high ).
The following section provides additional details on the data that we employ.
3 Data Sources and Summary Statistics
As noted in section 3 of the paper, the empirical analysis employs a number of country-
and industry-level variables to see whether our results are due to mechanisms other than
emphasized by the model. This section describes the rationale for these additional control
variables as well as their sources. According to the model the size of foreign demand
determines the scale of foreign operations and so directly affects the volume of local sales
and indirectly can affect the import cost share. Therefore, we include GDP and the size
of the host country’s population, which are taken from the Penn World Tables. Other
controls are motivated by determinants of FDI that are outside our model. To allow
for comparative advantage to affect the structure of affiliate operations, we control for
factor price differences across countries by interacting a country’s skill abundance with an
industry’s skill intensity and capital abundance with capital intensity. Our measure of skill
abundance is human capital per worker, and the analogous measure of capital abundance is
4

capital per worker (source: Hall and Jones 1999). We also consider comparative advantage
based on institutional quality as proposed by Nunn (2007), which is also the source of our
skill and capital intensity variables.
We employ a number of variables that are directly related to international transactions
costs: an indicator variable for common language between the host country and the U.S.,
from Hanson, Mataloni, and Slaughter (2005), and the costs of making a phone call,
from the World Competitiveness Yearbook (1999). Moreover, some research suggests
that multinationals may engage in transfer pricing by altering the value of within-firm
transactions to reduce their global tax burden. We address this by including the host
country’s maximum marginal corporate tax rate (source: University of Michigan World
Tax Database).
A major strand of work views multinational firms as vehicles that internalize (within
the firm) relationships where contracting on the transfer of technological knowledge is
crucial (Ethier 1986). We expect that countries in which intellectual property regimes
are strongly enforced will be those in which relationships between independent firms are
more prevalent. In contrast, countries with weak IPRs may require more frequently the
in-house, that is, multinational, mode of organization. To make sure that our results are
not principally driven by make-versus-buy decisions related to a country’s IPR regime,
we control for the quality of country’s IPR regime using data from Park (2008).
Recent work has also emphasized that the quality of a country’s legal institutions will
affect the boundary of the firm in the presence of contract incompleteness, especially for
knowledge-intensive goods. While our analysis is consistent with both FDI and foreign
outsourcing, we want to be certain that our findings are not primarily due to factors that
determine the make-versus-buy decision. We include therefore as another variable the
quality of the judicial system of a country; this has recently been emphasized by Nunn
(2007), which is also the source of our data. Table A gives summary statistics for the
firm-level sample that is employed to test Hypothesis 1 and Hypothesis 2.
The following section presents a number of regression results that are an important
complement to the micro evidence we have presented in section 4 of the text.
4 Micro-level evidence: further results
4.1 Alternative Measures of Knowledge Intensity
Several of our alternative measures of knowledge intensity are inspired by the recent
literature on offshoring (Levy and Murnane 2005, Costinot, Oldenski, and Rauch 2009).
According to this literature, offshoring of production activities is relatively more difficult
5

in industries in which production activities are non-routine or that require the exercise of
judgment. We use the Occupational Information Network (O*NET) data from the Bureau
of Labor Statistics that ranks occupations by the extent to which these occupations require
(i) the extensive analysis of data, (ii) the processing of information, or (iii) the exercise of
judgement and the need for decision making. Aggregating over occupations using labor
requirements by industry for the year 2004, we construct alternative measures capturing
the difficulty of offshoring activities by industry. We construct this measure as described
in Costinot, Oldenski, and Rauch (2009). We also employ industry-level values of the
share of computers in total capital as alternative measures of knowledge intensity (source:
Bureau of Labor Statistics).
In Table B, we present results for one of the O*NET measures, the importance of
Analyzing Data as determinant of the knowledge intensity of an industry.1 The second
measure is the share of information technology (IT) capital in total capital, specifically,
the computer share. In this table, the R&D intensity results are repeated in columns 1
and 4 for convenience. with OLS estimates in Panel A on top and two-step Heckman
results in Panel B at the bottom. Generally the differences between Panel A and Panel B
are small, and we focus the discussion on the latter. If knowledge intensity is proxied by
Analyzing Data, we estimate a positive coefficient on the trade cost-knowledge intensity
(×) variable in the import cost share equation (column 2B, Table B). This is in line
with Hypothesis 1. While the size of the coefficient is not comparable to that of the R&D
intensity specification in column 1B due to different scales, the Analyzing Data variable
performs better in the sense that the × coefficient is more precisely estimated
than with R&D intensity, and the empirical fit of the equation is somewhat improved.
Turning to the sales results on the right, using the Analyzing Data variable the coeffi-
cient on × is estimated at 0.029 and not significant at standard levels in the sales
specification (column 5B). This suggests that the skill of Analyzing Data is not important
in explaining why affiliate sales fall particularly strongly with trade costs in certain indus-
tries. In contrast, a high computer share is very powerful in explaining gravity for affiliate
sales (column 6B): the linear trade cost coefficient is not significant anymore, while the
coefficient on the × interaction variable is precisely estimated. At the same time,
the computer share in total capital yields a negative coefficient on × in the import
cost share equation (see column 3B), which is not what is expected if the computer share
were a good proxy for knowledge intensity in the light of the model. This may be related
to the fact that the linear variable is not significant in the import cost share equation
in column 3B.
1The exact definition is: "Identifying the underlying principles, reasons, or facts of information by
breaking down information or data into separate parts."
6

Given these results with the computer share and Analyzing Data variables, we have
broadened our analysis and considered five additional variables that might measure the
knowledge intensity of an industry. There is, first of all, a frequently used measure of
skills in the labor force, the share of non-production workers in all workers. Second,
we present results on three additional occupational measures derived from the O*NET
database, namely:
1. Processing information (Mental Processes): Compiling, coding, categorizing, calcu-
lating, tabulating, auditing, or verifying information or data.
2. Updating and using relevant information (Work Activities): Keeping up-to-date
technically and applying new knowledge to your job.
3. Judgment and decision making (System Skills): Consider the relative costs and
benefits of potential actions to choose the most appropriate one.
Third, results are shown for a second information capital variable, namely the share
of communication capital in total capital (from the Bureau of Labor Statistics). Table
C reports results employing these varying for four different specifications: one the one
hand, least squares and two-step Heckman specifications, and on the other hand, for both
import cost share and affiliate sales equations. We report only the trade cost-knowledge
intensity ( ×) coefficient estimate from these regressions for space reasons.
The main findings are as follows. First, the communication capital share does not ap-
pear to capture the notion of knowledge intensity as laid out in the model, as the ×
coefficient is estimated imprecisely in all four cases. Second, the three O*NET variables
give similar results, which are also similar to the Analyzing Data variable employed in
Table B: proxying knowledge intensity by an O*NET variable yields results in the import
equation that support the model, and that are in fact stronger than for R&D intensity.
At the same time, the O*NET variables do not predict well how the gravity of affiliate
sales varies with knowledge intensity according to the model. Finally, the results based on
the share of non-production workers are quite similar to those using the occupation-based
O*NET variables.
These results can be summarized as follows. We find that the Analyzing Data variable
performs very well in the import cost share equation (a result that is confirmed for other
O*NET measures, see Table C). Moreover, a particular type of information technology
capital, namely computers, performs well as an alternative proxy for knowledge intensity
in the sales equation. This constitutes support for the model going beyond identifying
knowledge intensity with R&D intensity. At the same time, there is no strong support
from either the O*NET measures or the computer share for both hypotheses. Specifically,
7

while the O*NET variables determine well the split between imports and local affiliate
activity, they do not predict well the level of affiliate sales. And while the computer share
predicts well the level of affiliate sales, in line with earlier work on foreign outsourcing
(Feenstra and Hanson 1999), it does not predict well the import share of the affiliate.
4.2 Geography, or Other Variation? Further Results on Knowl-
edge Intensity Interactions
One might be concerned that the results on the trade cost-knowledge intensity ( ×)
variable supporting Hypothesis 1 and Hypothesis 2 is driven by omitted variables, in par-
ticular other relevant features in the world that might vary with the trade costs from the
United States. While there are potentially numerous channels, among the most salient are
(i) institutional quality, (ii) comparative advantage, and (iii) the costs of communication.
For example, it is not implausible that knowledge intensive products rely systematically
more on strong institutions than less knowledge intensive products, and if the quality of
institutions across offshoring destinations is correlated with trade costs from the United
States, our results on × could be spurious. In the following, we address this
concern by including additional interactions with knowledge intensity as regressors, and
check whether our results are substantially unchanged. The results are shown in Table D,
with Panel A reporting OLS results and Panel B summarizing the corresponding two-step
Heckman results.
In column 1 of Table D, Panel A, the IPR interaction with knowledge intensity,
× is included in the import cost share equation in addition to all regressors
of column 3 in Table 1 (in particular, the linear variable). The × vari-
able does not enter significantly and the trade cost-knowledge intensity variable is vir-
tually unchanged compared to before (see column 3, Table 1). Adding further the skill
endowment-knowledge intensity and judicial quality-knowledge intensity interactions cap-
turing comparative advantage effects, we see that this does not qualitatively change the
results in support of Hypothesis 1 and Hypothesis 2; if anything it strengthens these re-
sults by raising the point estimate on × away from zero. In contrast, the IPR-,
skill-, and judicial quality- interactions are generally not significant. At the same time
it appears that the additional knowledge intensity interactions are correlated with each
other, as, for example, the × point estimate changes signs upon the inclusion of
the skill- and judicial quality knowledge interaction variables (Table D, Panel A, columns
1 and 2).
In the corresponding Heckman MLE results we also find that the trade cost-knowledge
intensity results are not substantially affected by the inclusion of further knowledge in-
8
tensity interaction variables; the point estimate on × is around 22 (columns 1 and
2 of Table D, Panel B), which is quite similar to the value of 22.3 reported earlier (see
Table 2, column 3).
Turning to the affiliate sales results on the right side of Table D, the inclusion of
additional knowledge intensity interactions seems to matter more than for the affiliate’s
imports, especially if several of them are present at the same time. In particular, the
coefficient on × falls for the Heckman two-step case in absolute value from about
-18.2 without the three additional interactions (Table 2, column 6) to -12.7 with them
(Table D, Panel B, column 5). Similarly, if on top of the three additioinal knowledge
intensity interactions country fixed effects are included, the coefficient on × is not
statistically significant at standard levels anymore (p-value of 0.107, see Table D, Panel
A, column 7).2 However these results should be discounted because there is evidence
that the high correlation among the additional knowledge intensity interactions produces
poor results; in the Heckman results, for example, as with imports the × point
estimate changes from about -0.5 (p-value of 0.122) to +1.4 (p-value of 0.04) upon the
inclusion of the skill- and judicial quality-interaction variables.
In the following we consider the impact of the costs of communication. Specifically, it
may be that the choice of multinational firms in how much and in what way to offshore is
affected by the ease of communication between headquarter and affiliate plant, and that is
driven by the bilateral costs of communication independent of the geography of countries
as captured by the × variable. To explore this possibility we construct knowledge
intensity interaction variables for both of our measures of communication costs, namely
common language and the cost of a phone call; denote these by × and ×
respectively. As seen from Table D, the × and × interaction variables enter
with varying significance (Panel A, columns 4 and 8; Panel B, columns 3 and 6). At the
same time, we find that in all specifications—import share versus sales, OLS versus MLE—
the point estimate of the trade cost-knowledge intensity rises in absolute value upon the
inclusion of the communication cost-knowledge intensity interaction variables. Moreover,
in the case of the Heckman estimates the p-values of the × point estimate are now
less than 0.001, for example (see Table D, Panel B, columns 3 and 6). Thus, our results
tend to be strengthened here.
In summary, the size of our estimates is somewhat reduced upon the inclusion of
institutional quality and comparative advantage interactions with knowledge intensity,
mostly for affiliate sales. Even here, statistical significance at standard levels is preserved
2The country fixed effects specification is omitted in Panel B because there is not sufficient variation
in the exclusion variables (Cost of Starting a Business, Foreign Market Potential) to be able to estimate
the selection equation. Note that adding country fixed effects per se changes the results very little (Table
1, columns 4 and 8).
9
except when the joint inclusion of many collinear regressors apparently leads to overall
poor results. Moreover, as we have seen the inclusion of communication cost effects tends
to strengthen our results. On balance, we conclude that the existence of major biases
by factors outside the model is unlikely, and the support in favor of Hypothesis 1 and
Hypothesis 2 of the model as presented in the main text is both qualitatively as well as
quantitatively confirmed.
4.3 Third-Country Imports and Dynamics of U.S. Multinational
Firms: Firm-level Evidence
4.3.1 Imports from Affiliates in Third-Countries
In the model, all imports of the affiliates come from the U.S., both from the parent and
from unaffiliated sources located in the United States. One might be concerned, however,
that imports from third-country affiliates may be higher whenever more embodied knowl-
edge is imported from the parent country. If this were the case and the effect would ‘pass’
the control variables, it may produce an important bias for our import share results. Un-
fortunately in the BEA data (and nowhere else that we know of) there is no information
on bilateral trade of affiliates with non-parent countries. To explore this possibility in a
more limited way we have pursued two strategies, see Table E for results.
In the first, we add a measure of prevalence of third-country sales on the right hand side
of the regression. It is reasonable to assume that third-country affiliate imports will tend
to be high whenever third-country sales (which we observe) are high. While third-country
imports could come also from unaffiliated parties, and correspondingly third-country sales
could be to unaffiliated parties, we expect there to be a strong positive correlation be-
tween third-country sales and imports from affiliates in third countries. We have thus
computed the ratio of third-country sales of its affiliates relative to its total sales for each
multinational firm, and include it on the right hand side of our hypothesis 2-regressions.
The results are in Table E, column (2) for OLS and column (4) for the full model in-
cluding extensive margin, compared to the benchmark results in (1) and (3), which are
from Table 1a and Table 2, respectively. In both the OLS and the Heckman specification,
the third-country sales variable enters significantly with a negative coefficient, indicating
that imports from the U.S. tend to be low whenever third-country sales are high. This is
consistent with imports from the parent and imports from third-country affiliates being
substitutes for each other. While the third-country sales variable enters significantly, its
inclusion has virtually no effect on our estimates of the trade cost x knowledge intensity
( ×) variable.
We have also split the sample into two subsamples, the observations with low imports
10
from the U.S. and the observations with high imports from the U.S. If our result is
obtained primarily because affiliates that import relatively much from the U.S. import
relatively much embodied knowledge in general, one would expect that the results for the
sample with generally low imports from the U.S. are quite different than the results for
the sample with generally high imports from the U.S. In Table E, columns (5) and (6)
we report the results for these two samples. The estimated coefficients on the ×
intensity variable are very similar in both subsamples, even though the coefficient for the
low import share sample is less precisely estimated.
Overall we conclude from this that it is unlikely that the results in support of Hypoth-
esis 2 are in imported ways driven by imports from affiliates from third-countries that are
not accounted for.
4.3.2 The Nature of International Knowledge Transfer: Dynamics
In our static model, the costs of knowledge transfer are variable in the sense that per
unit of intermediate good produced in the affiliate, the resource costs are higher than if it
was produced in the multinational home country. In a multi-period setting, it would be
possible to distinguish between a number of different knowledge transfer costs. First, it
may be that there are ongoing communication frictions that do not diminish over time,
perhaps because the number of possible problems is very large relative to the actual num-
ber of production steps that are required. Second, it may be that some of the knowledge
transfer costs are of the once-and-for-all type. In the latter case, one would expect that
over time affiliates produce more locally and import less from home. While making the
model fully dynamic is beyond the scope of this paper, given the panel nature of our
data where affiliates are (potentially) observed in 1994, 1999, and 2004, Table F provides
evidence on this.
The specifications in Table F are identical to those in Table 1 and Table 2 except that
we include a variable which is equal to one if the affiliate existed in the previous period
(five years earlier). In the intensive-margin specification for the import cost share, Table
F, column 1, the affiliate age variable comes in positive, whereas once sample selection is
accounted for affiliate age has a negative coefficient (column 2). The latter is consistent
with the idea that technology transfer costs are in part fixed, in the sense that over time
the affiliate relies more on local input production. Moreover, the largely unchanged coef-
ficient on the trade cost-knowledge intensity variable × indicates that these fixed
technology transfer costs exist side-by-side with ongoing (variable) technology transfer
costs. Note that the coefficient on parent sales changes from about -0.3 to -0.15 with the
inclusion of the age variable. One interpretation of that is that firm productivity is to
11

some extent captured by parent sales and to some extent by age.
A similar picture emerges in the affiliate sales specifications, see Table F on the right
side. If the affiliate had existed five years earlier already, it tends to have higher sales, and
the coefficient on parent sales in the Heckman specification falls from 0.66 to 0.60 (Table
2, column 6, and Table F, column 4). Again it appears that age is an alternative proxy
for firm productivity, and moreover, as before the coefficient on the trade cost-knowledge
intensity variable is largely unchanged.
The analyses discussed in this section has generally confirmed the results reported in
the text. First, multinationals have greater difficulty in knowledge intensive industries
to substitute local production for trade, which is in line with the costs of knowledge
transfer in specific industries making it hard for these firms to switch from embodied
to disembodied knowledge transfer as trade costs rise. Second, our result that gravity
is particularly strong in knowledge intensive industries is robust to a broad range of
robustness checks. Overall, this is strong evidence that the support in favor of Hypothesis
1 and Hypothesis 2 of the model is due to the mechanism that the model emphasizes and
not other factors.
In the following section, we provide results that are employed in the quantification of
the model (section 5).
5 A Decomposition of Multinational Sales
An expression for affiliate sales can be derived in our model as follows. From equation
(8) in the text, we find that all firms with productivity exceeding a cutoff ( ≥ b) will
open an affiliate in country . This cutoff is the solution to
(b)−1 ¡( )1− − 1−
¢= (3)
The total sales of affiliates to country and industry is obtained by aggregating over
the individual firms that own an affiliate:
=
Z ∞
( )()
= ( )
1−Z ∞
−1()
= ( )
1−
− + 1b−+−1
substituting for the cutoff using (3), we obtain (11). We now derive an expression for the
fixed cost of opening an affiliate in country . First, note that the number of home firms
12
that own an affiliate in country is given by = b− Combining this expression with
(11) and (3), we arrive at the following expression:
=
µ
− + 1
( )1−
( )1− − 1−
¶ (4)
This equation shows that the fixed cost parameters for each country can be recovered
given estimate of and ( ), average affiliate size , and parameters and
. Trade costs and average affiliate size are directly coming from our data,
while the marginal costs ( ) are estimated as discussed in the first part of the
quantitative section 5.
This leaves the parameters and to be determined. First, the parameter is set at
= 6 to be consistent with a twenty percent mark-up over cost. Second, given we can
estimate the parameter analogous to the procedure employed in Helpman, Melitz, and
Yeaple (2004), which our model generalizes. In this procedure the dispersion parameter
of the Pareto distribution (− 1) is estimated from a log rank-log sales regression. Weemploy COMPUSTAT data for 1999 and calculate the domestic sales as the difference
between total firm revenues and the value of exports. As the Pareto approximation of
the size distribution is only appropriate in the upper tail, we restrict attention to the top
10% of firms. Using the bias correction method in Gabaix and Ibragimov (2011), the
regression of the logarithm of a firm’s rank in the distribution on the logarithm of a firm’s
sales yields a coefficient of 1.09 with a T-statistic of over 104 and an R-squared in excess
of 0.98. With ( − 1) = 109 and = 6 it follows that is equal to 545
With the parameters and and information on trade costs, marginal costs, and
average affiliate size in hand, we employ equation (4) to back out the country specific
fixed costs, . Finally, given this same information and the derived , we can then use
(11) to isolate the mark-up adjusted demand level. This allows us to construct the three
individual components of affiliate sales, for both our model and the more restricted model
of Helpman, Melitz, and Yeaple (2004), which are employed in the gravity decomposition
of Table 5b in the text.
6 The Knowledge Intensity of Multinational Trade:
Regression Results
In section 6 of the paper we have discussed the relationship between trade costs from
the United States and the knowledge intensity of multinational trade that is implied by
the model. In this section we examine the robustness of the positive relationship shown
13
in Figure 1 by moving to a multiple regression framework. Summary statistics for this
country-level data are provided in Table G, while the regression results are given in Table
H. The first column reports the simple bivariate relationship that is plotted in Figure
1.3 An increase in trade costs is associated with an increase in the average knowledge
intensity of U.S. multinational trade. Indeed, this single regressor accounts for 44 percent
of the variation as indicated by the R-squared. In column 2, we add a number of country
control variables to the regression. The knowledge intensity of multinational trade is lower
in large, developed countries where English is spoken. None of the other coefficients are
statistically significant. The coefficient on trade costs is still significantly positive but
moderately smaller than in the bi-variate case.
One concern is that the relationship reflects trade costs rising more slowly in distance
for highly knowledge-intensive goods because these goods, to some extent intangibles,
have lower weight-to-value ratios. To see if this is the case, we have calculated the average
weight-to-value ratio of goods traded between the U.S. and each host country and include
that measure in the regression; see column 3.4 The weight-to-value variable turns out to
be not statistically significant, while the coefficient on trade costs retains its approximate
magnitude and level of statistical significance. The model’s prediction that multinational
firms change the knowledge content of their international trade in relation to geographic
distance (and trade costs) thus finds strong support in the data.
References
[1] Costinot, Arnaud, Lindsay Oldenski, and James Rauch (2009), "Adaptation and the
Boundary of Multinational Firms", Review of Economics and Statistics.93(1):. 298-
308.
[2] Ethier, Wilfred (1986), “The Multinational Firm,” Quarterly Journal of Economics.
[3] Feenstra, Robert, and Gordon Hanson. (1999). “The Impact of Outsourcing and High-
Technology Capital on Wages: Estimates for the United States, 1979-1990”, Quarterly
Journal of Economics, 114(3): 907-40.
[4] Gabaix, Xavier and Rustam Ibragimov (2011), “Rank-1/2: A Simple Way to Improve
the OLS Estimation of Tail Exponents,” Journal of Business Economics and Statistics.
29(1): 24—39.
3These are weighted least squares results, with GDP as the weight; the results are qualitatively similar
when not weighted.4This variable is computed from detailed U.S. Census imports data, adding the values of air and vessel
shipments and dividing by the sum of their weight.
14
[5] Hall, Robert, and Charles. Jones (1999), "Why do some countries produce so much
more Output per Worker than other Countries?",Quarterly Journal Economics
[6] McGrattan, Ellen, and Edward Prescott (2010), "“Technology Capital and the U.S.
Current Account," American Economic Review 100(4): 1493—1522.
[7] Nunn, N. (2007), "Relationship-Specificity, Incomplete Contracts and the Pattern of
Trade," Quarterly Journal Economics, 122(2): 569-600.
[8] Park, Walter (2008), "International Patent Protection: 1960 - 2005", Research Policy.
[9] World Competitiveness Yearbook (1999), World Competitiveness Yearbook, IMD
Business School, http://www.imd.ch/
15

Table A: Summary Statistics
Mean Standard Deviation Firm-level data Affiliate Sales, total 10.900 1.696 To local unaffiliated customers
10.388 1.771
To U.S. customers 7.932 2.850 To 3rd country customers 9.236 2.509 Parent Sales 13.705 1.544 Import Cost Share -3.005 1.961 Industry Characteristics R&D Intensity 0.045 0.039 Analyzing Data 51.974 8.677 Computer Share 0.024 0.011 Skill Intensity 0.426 0.124 Capital Intensity 0.804 0.395 Contract Intensity 0.538 0.202 Other Variables Trade Cost 0.133 0.108 Phone Call 0.621 0.605 IPR protection index 3.701 1.080 GDP 19.521 1.244 Population 10.205 0.984 Tax Rate 3.524 0.241 Common Language 0.231 0.422 Skill Endowment 0.772 0.216 Physical Capital Endowment 10.250 0.983 Judicial Quality 0.669 0.212 Cost of Starting a Business 1.074 0.662 Foreign Market Potential 14.487 1.198 Note: All variables, except Industry Characteristics and Common Language, are in natural logarithms.
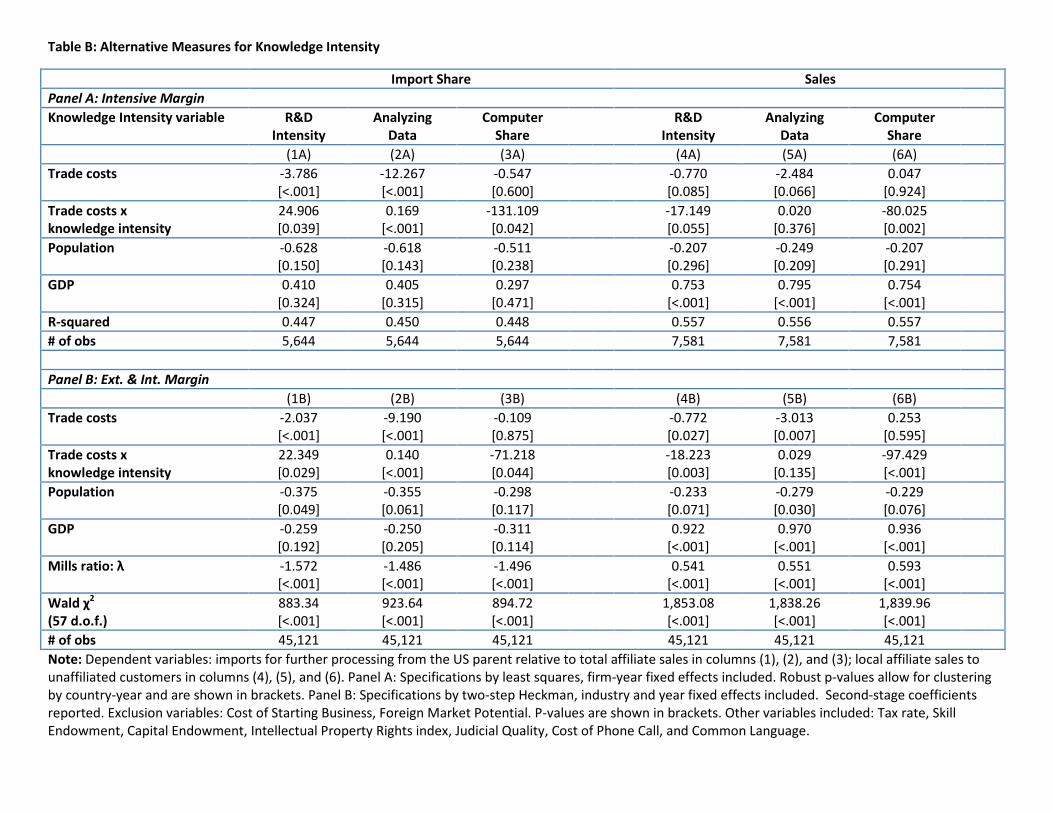
Table B: Alternative Measures for Knowledge Intensity
Import Share Sales Panel A: Intensive Margin Knowledge Intensity variable R&D
Intensity Analyzing
Data Computer
Share R&D
Intensity Analyzing
Data Computer
Share
(1A) (2A) (3A) (4A) (5A) (6A) Trade costs -3.786
[<.001] -12.267 [<.001]
-0.547 [0.600]
-0.770 [0.085]
-2.484 [0.066]
0.047 [0.924]
Trade costs x knowledge intensity
24.906 [0.039]
0.169 [<.001]
-131.109 [0.042]
-17.149 [0.055]
0.020 [0.376]
-80.025 [0.002]
Population -0.628 [0.150]
-0.618 [0.143]
-0.511 [0.238]
-0.207 [0.296]
-0.249 [0.209]
-0.207 [0.291]
GDP 0.410 [0.324]
0.405 [0.315]
0.297 [0.471]
0.753 [<.001]
0.795 [<.001]
0.754 [<.001]
R-squared 0.447 0.450 0.448 0.557 0.556 0.557 # of obs 5,644 5,644 5,644 7,581 7,581 7,581 Panel B: Ext. & Int. Margin (1B) (2B) (3B) (4B) (5B) (6B) Trade costs -2.037
[<.001] -9.190 [<.001]
-0.109 [0.875]
-0.772 [0.027]
-3.013 [0.007]
0.253 [0.595]
Trade costs x knowledge intensity
22.349 [0.029]
0.140 [<.001]
-71.218 [0.044]
-18.223 [0.003]
0.029 [0.135]
-97.429 [<.001]
Population -0.375 [0.049]
-0.355 [0.061]
-0.298 [0.117]
-0.233 [0.071]
-0.279 [0.030]
-0.229 [0.076]
GDP -0.259 [0.192]
-0.250 [0.205]
-0.311 [0.114]
0.922 [<.001]
0.970 [<.001]
0.936 [<.001]
Mills ratio: λ -1.572 [<.001]
-1.486 [<.001]
-1.496 [<.001]
0.541 [<.001]
0.551 [<.001]
0.593 [<.001]
Wald χ2 (57 d.o.f.)
883.34 [<.001]
923.64 [<.001]
894.72 [<.001]
1,853.08 [<.001]
1,838.26 [<.001]
1,839.96 [<.001]
# of obs 45,121 45,121 45,121 45,121 45,121 45,121 Note: Dependent variables: imports for further processing from the US parent relative to total affiliate sales in columns (1), (2), and (3); local affiliate sales to unaffiliated customers in columns (4), (5), and (6). Panel A: Specifications by least squares, firm-year fixed effects included. Robust p-values allow for clustering by country-year and are shown in brackets. Panel B: Specifications by two-step Heckman, industry and year fixed effects included. Second-stage coefficients reported. Exclusion variables: Cost of Starting Business, Foreign Market Potential. P-values are shown in brackets. Other variables included: Tax rate, Skill Endowment, Capital Endowment, Intellectual Property Rights index, Judicial Quality, Cost of Phone Call, and Common Language.
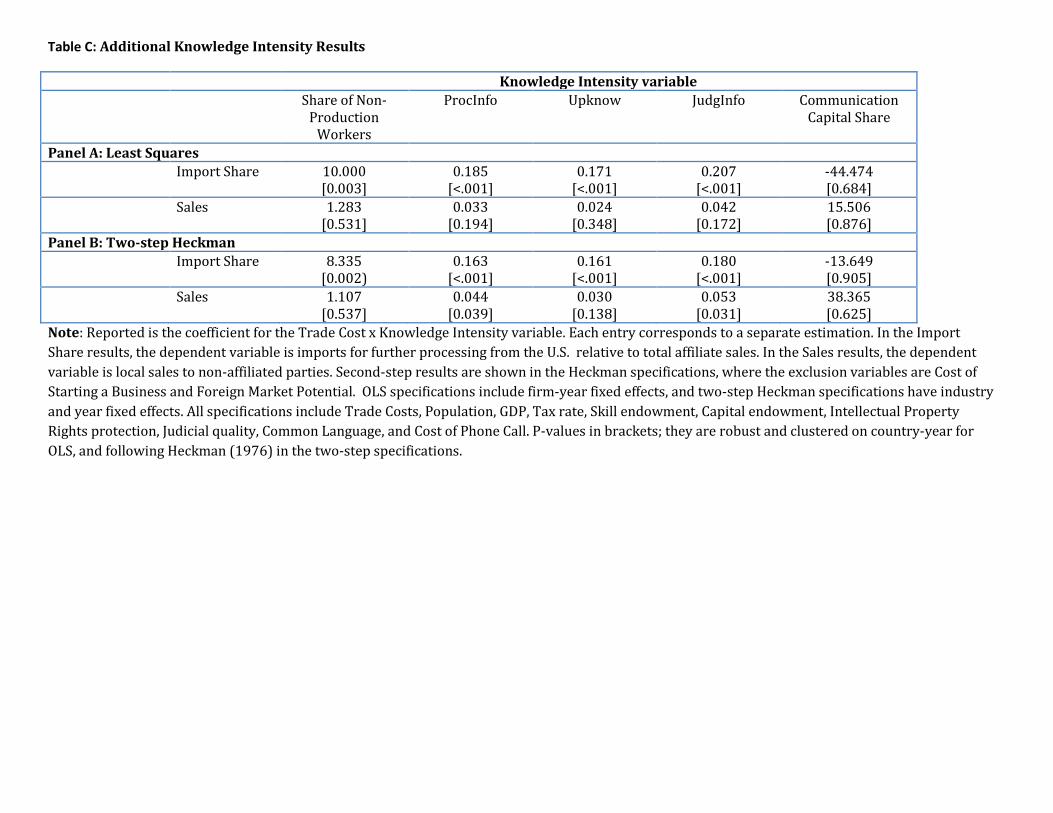
Table C: Additional Knowledge Intensity Results
Knowledge Intensity variable Share of Non-
Production Workers
ProcInfo Upknow JudgInfo Communication Capital Share
Panel A: Least Squares Import Share 10.000
[0.003] 0.185
[<.001] 0.171
[<.001] 0.207
[<.001] -44.474 [0.684]
Sales 1.283 [0.531]
0.033 [0.194]
0.024 [0.348]
0.042 [0.172]
15.506 [0.876]
Panel B: Two-step Heckman Import Share 8.335
[0.002) 0.163
[<.001] 0.161
[<.001] 0.180
[<.001] -13.649 [0.905]
Sales 1.107 [0.537]
0.044 [0.039]
0.030 [0.138]
0.053 [0.031]
38.365 [0.625]
Note: Reported is the coefficient for the Trade Cost x Knowledge Intensity variable. Each entry corresponds to a separate estimation. In the Import Share results, the dependent variable is imports for further processing from the U.S. relative to total affiliate sales. In the Sales results, the dependent variable is local sales to non-affiliated parties. Second-step results are shown in the Heckman specifications, where the exclusion variables are Cost of Starting a Business and Foreign Market Potential. OLS specifications include firm-year fixed effects, and two-step Heckman specifications have industry and year fixed effects. All specifications include Trade Costs, Population, GDP, Tax rate, Skill endowment, Capital endowment, Intellectual Property Rights protection, Judicial quality, Common Language, and Cost of Phone Call. P-values in brackets; they are robust and clustered on country-year for OLS, and following Heckman (1976) in the two-step specifications.

Table D: Additional Interactions with Knowledge Intensity
Panel A: Ordinary Least Squares
Import Share Affiliate Sales (1) (2) (3) (4) (5) (6) (7) (8)
Trade costs -3.670 [<.001]
-3.729 [<.001]
-0.939 [0.113]
-4.041 [<.001]
-0.208 [0.622]
-0.346 [0.396]
0.270 [0.462]
-0.540 [0.311]
Trade costs x knowledge intensity
23.629 [0.023]
25.499 [0.015]
25.123 [0.005]
30.215 [0.021]
-19.661 [0.017]
-14.998 [0.091]
-13.289 [0.107]
-21.635 [0.081]
Intellectual property rights prot’n index x knowledge intensity
-0.234 [0.688]
1.545 [0.190]
1.369 [0.263]
-0.387 [0.400]
1.532 [0.036]
1.519 [0.044]
Skill endowment x Knowledge intensity
-14.605 [0.070]
-9.225 [0.296]
-21.180 [<.001]
-20.455 [<.001]
Judicial quality x knowledge intensity
5.430 [0.523]
0.247 [0.977]
11.482 [0.005]
10.973 [0.008]
Common language x knowledge intensity
-2.110 [0.280]
-4.516 [<.001]
Cost of phone call x knowledge intensity
-2.828 [<.001]
0.517 [0.589]
Industry & Year Fixed Effects Yes Yes Yes No Yes Yes Yes No Country Fixed Effects No No Yes No No No Yes No Firm-year Fixed Effects No No No Yes No No No Yes Note: Dependent variables: imports for further processing from the US parent relative to total affiliate sales in columns (1), (2), (3), and (4); local affiliate sales to unaffiliated customers in columns (5), (6), (7), and (8). Specifications with industry and year effects include parent sales as a regressor. Also included are GDP, population, skill endowment, capital endowment, tax rate, intellectual property rights protection, judicial quality, common language, and cost of phone call in columns (1), (2), (3), (5), (6), and (7); also included in columns (4) and (8) are GDP per capita, skill endowment, capital endowment, tax rate, intellectual property rights protection, judicial quality, common language, and cost of phone call. Robust p-values allow for clustering by country-year and are shown in brackets.

Table D, continued
Panel B: Two-step Heckman estimation
Import Share Affiliate Sales (1) (2) (3) (4) (5) (6)
Trade costs -2.058 [<.001]
-2.008 [<.001]
-2.786 [<.001]
-0.763 [0.031]
-0.965 [0.007]
-0.383 [0.290]
Trade costs x knowledge intensity
22.818 [0.022]
21.013 [0.037]
40.347 [<.001]
-18.570 [0.004]
-12.710 [0.055]
-25.875 [<.001]
Intellectual property rights prot’n index x knowledge intensity
0.386 [0.390]
1.740 [0.107]
-0.464 [0.122]
1.435 [0.040]
Skill endowment x Knowledge intensity
-3.226 [0.545]
-23.756 [<.001]
Judicial quality x knowledge intensity
-4.432 [0.435]
14.236 [<.001]
Common language x knowledge intensity
-0.954 [0.486]
-5.373 [<.001]
Cost of phone call x knowledge intensity
-5.337 [<.001]
1.676 [0.022]
Note: Dependent variables: imports for further processing from the US parent relative to total affiliate sales in columns (1), (2), and (3); local affiliate sales to unaffiliated customers in columns (4), (5), and (6). Shown are results from the second step. Exclusion variables in the first step: Cost of starting a business, foreign market potential. All specifications include industry and year fixed effects. Also included are parent sales, GDP, population, skill endowment, capital endowment, tax rate, intellectual property rights protection, judicial quality, common language, and cost of phone call in columns (1), (2), (4), and (5); also included in columns (3) and (6) are parent sales, GDP per capita, skill endowment, capital endowment, tax rate, intellectual property rights protection, judicial quality, common language, and cost of phone call. P-values are shown in brackets.
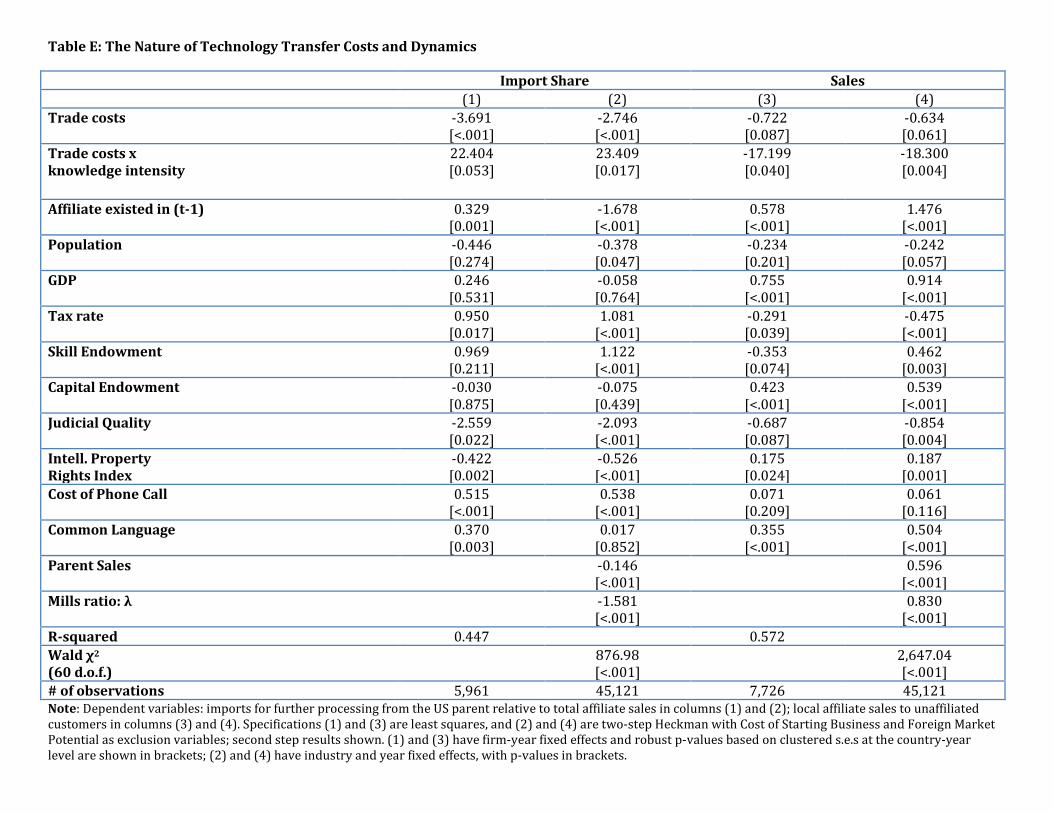
Table E: The Nature of Technology Transfer Costs and Dynamics
Import Share Sales (1) (2) (3) (4) Trade costs -3.691
[<.001] -2.746 [<.001]
-0.722 [0.087]
-0.634 [0.061]
Trade costs x knowledge intensity
22.404 [0.053]
23.409 [0.017]
-17.199 [0.040]
-18.300 [0.004]
Affiliate existed in (t-1) 0.329 [0.001]
-1.678 [<.001]
0.578 [<.001]
1.476 [<.001]
Population -0.446 [0.274]
-0.378 [0.047]
-0.234 [0.201]
-0.242 [0.057]
GDP 0.246 [0.531]
-0.058 [0.764]
0.755 [<.001]
0.914 [<.001]
Tax rate 0.950 [0.017]
1.081 [<.001]
-0.291 [0.039]
-0.475 [<.001]
Skill Endowment 0.969 [0.211]
1.122 [<.001]
-0.353 [0.074]
0.462 [0.003]
Capital Endowment -0.030 [0.875]
-0.075 [0.439]
0.423 [<.001]
0.539 [<.001]
Judicial Quality -2.559 [0.022]
-2.093 [<.001]
-0.687 [0.087]
-0.854 [0.004]
Intell. Property Rights Index
-0.422 [0.002]
-0.526 [<.001]
0.175 [0.024]
0.187 [0.001]
Cost of Phone Call 0.515 [<.001]
0.538 [<.001]
0.071 [0.209]
0.061 [0.116]
Common Language 0.370 [0.003]
0.017 [0.852]
0.355 [<.001]
0.504 [<.001]
Parent Sales -0.146 [<.001]
0.596 [<.001]
Mills ratio: λ -1.581 [<.001]
0.830 [<.001]
R-squared 0.447 0.572 Wald χ2
(60 d.o.f.) 876.98
[<.001] 2,647.04
[<.001] # of observations 5,961 45,121 7,726 45,121 Note: Dependent variables: imports for further processing from the US parent relative to total affiliate sales in columns (1) and (2); local affiliate sales to unaffiliated customers in columns (3) and (4). Specifications (1) and (3) are least squares, and (2) and (4) are two-step Heckman with Cost of Starting Business and Foreign Market Potential as exclusion variables; second step results shown. (1) and (3) have firm-year fixed effects and robust p-values based on clustered s.e.s at the country-year level are shown in brackets; (2) and (4) have industry and year fixed effects, with p-values in brackets.

Table F: Imports from affiliates in third-countries
Ordinary Least Squares Heckman Second Stage
Low Import Share
High Import Share
(1) (2) (3) (4) (5) (6) Trade costs -3.672
[<.001] -3.601 [<.001]
-2.037 [<.001]
-2.008 [<.001]
-1.029 [0.042]
-1.197 [0.001]
Trade costs x knowledge intensity
23.761 [0.022]
23.424 [0.023]
22.349 [0.024]
22.385 [0.024]
11.987 [0.191]
11.494 [0.055]
Parent Sales -0.050 [0.012]
-0.036 [0.052]
-0.297 [<.001]
-0.268 [<.001]
0.031 [0.180]
-0.033 [0.013]
Third-Country Sales -0.787 [0.010]
-1.429 [<.001]
Mills Ration: λ -1.572 [<.001]
-1.532 [<.001]
Industry & Year Fixed Effects Yes Yes Yes Yes Yes Yes R-squared 0.139 0.141 0.071 0.091 Wald χ2 883.34
[<.001] 896.03 [<.001]
# of observations 5,961 5,961 45,121 45,121 3,003 2,958 Note: Dependent variable: imports for further processing from the US parent relative to total affiliate sales. Other independent variables included are Population, GDP, Tax rate, Skill Endowment, Capital Endowment, Intellectual property rights protection index, Judicial quality, Common language, and Cost of phone call. Exclusion variables in the Heckman specifications are Cost of Starting Business and Foreign Market Potential. P-values are shown in brackets, robust to clustering by country-year in the OLS specifications.

Table G: Summary Statistics for Country-level Sample
Mean Standard Deviation Knowledge Intensity -3.471 0.128 Trade Costs 0.065 0.019 Cost of Phone Call 0.582 0.619 IPR Protection Index 1.393 0.150 GDP per Capita 9.429 0.756 Population 16.138 1.424 Maximal Tax Rate -1.093 0.516 Common Language 0.085 0.252 Skill Endowment 0.801 0.207 Judicial Quality 0.694 0.202 Value-to-Weight 0.385 1.383 Note: All variables except Common Language are in natural logarithms. There are a maximum N = 39 countries.
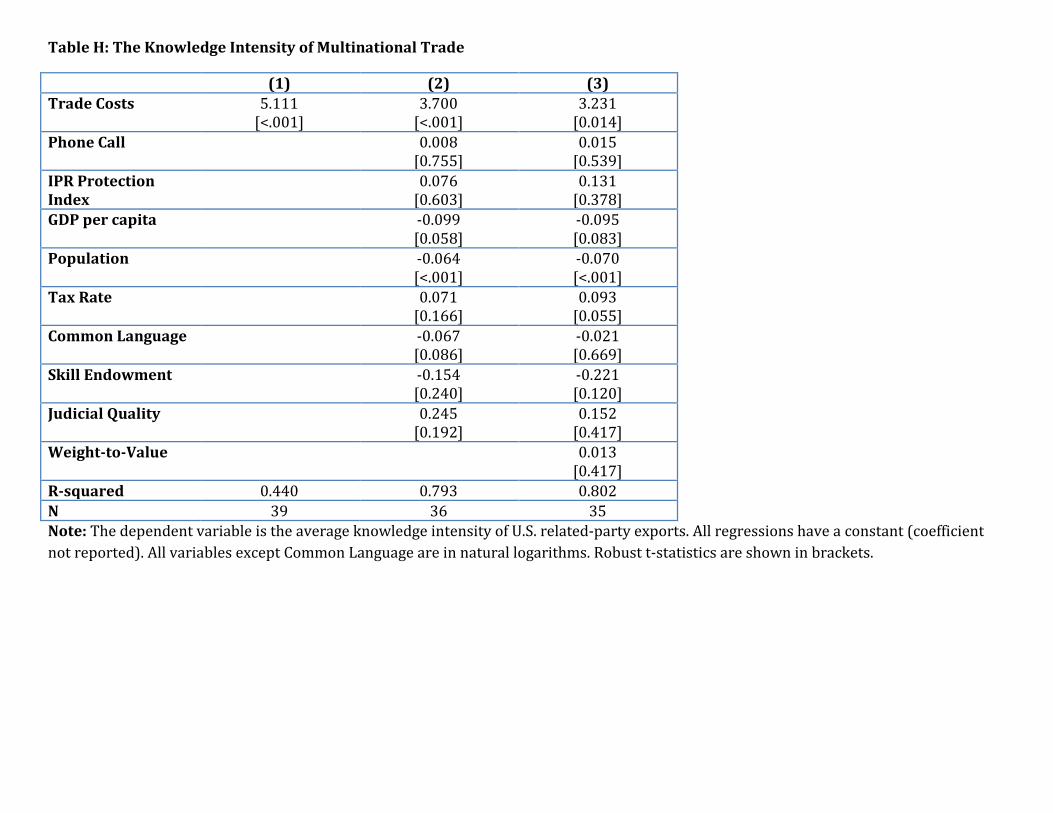
Table H: The Knowledge Intensity of Multinational Trade
(1) (2) (3) Trade Costs 5.111
[<.001] 3.700
[<.001] 3.231
[0.014] Phone Call 0.008
[0.755] 0.015
[0.539] IPR Protection Index
0.076 [0.603]
0.131 [0.378]
GDP per capita -0.099 [0.058]
-0.095 [0.083]
Population -0.064 [<.001]
-0.070 [<.001]
Tax Rate 0.071 [0.166]
0.093 [0.055]
Common Language -0.067 [0.086]
-0.021 [0.669]
Skill Endowment -0.154 [0.240]
-0.221 [0.120]
Judicial Quality 0.245 [0.192]
0.152 [0.417]
Weight-to-Value 0.013 [0.417]
R-squared 0.440 0.793 0.802 N 39 36 35 Note: The dependent variable is the average knowledge intensity of U.S. related-party exports. All regressions have a constant (coefficient not reported). All variables except Common Language are in natural logarithms. Robust t-statistics are shown in brackets.