
Anatomy of an unstable volcano from InSAR: Multiple processes affecting flank instability at Mt....
21
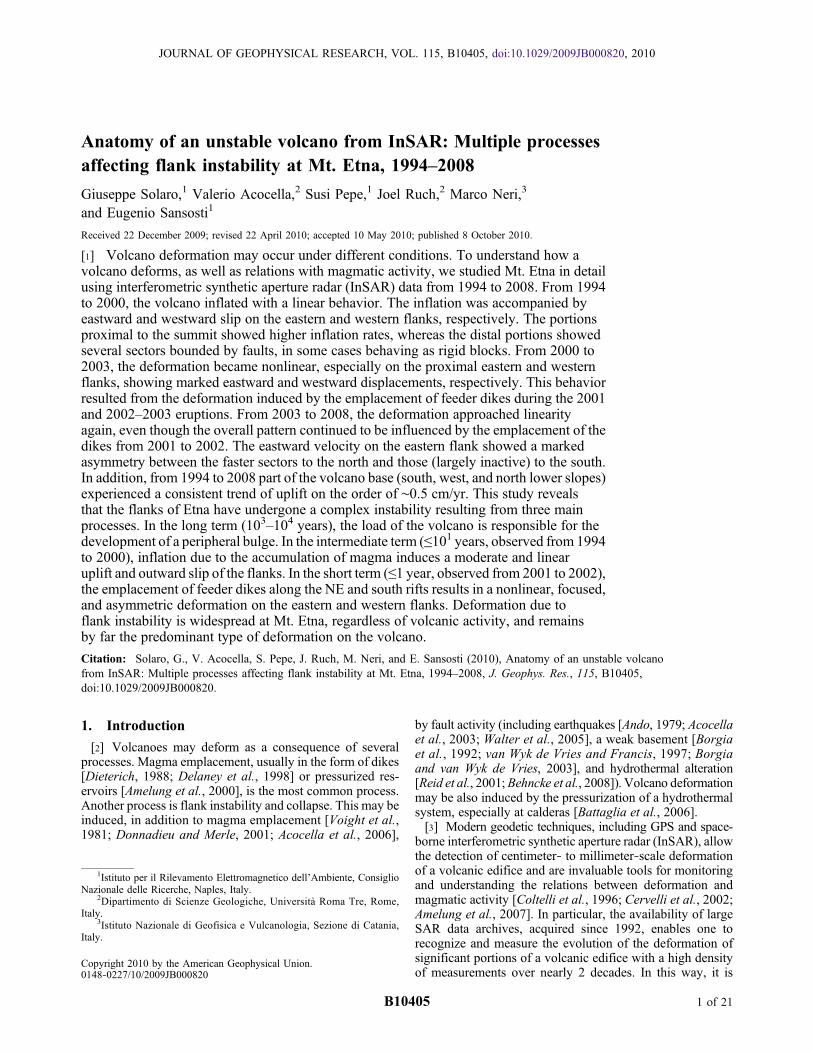
Anatomy of an unstable volcano from InSAR: Multiple processes affecting flank instability at Mt. Etna, 1994–2008 Giuseppe Solaro, 1 Valerio Acocella, 2 Susi Pepe, 1 Joel Ruch, 2 Marco Neri, 3 and Eugenio Sansosti 1 Received 22 December 2009; revised 22 April 2010; accepted 10 May 2010; published 8 October 2010. [1] Volcano deformation may occur under different conditions. To understand how a volcano deforms, as well as relations with magmatic activity, we studied Mt. Etna in detail using interferometric synthetic aperture radar (InSAR) data from 1994 to 2008. From 1994 to 2000, the volcano inflated with a linear behavior. The inflation was accompanied by eastward and westward slip on the eastern and western flanks, respectively. The portions proximal to the summit showed higher inflation rates, whereas the distal portions showed several sectors bounded by faults, in some cases behaving as rigid blocks. From 2000 to 2003, the deformation became nonlinear, especially on the proximal eastern and western flanks, showing marked eastward and westward displacements, respectively. This behavior resulted from the deformation induced by the emplacement of feeder dikes during the 2001 and 2002–2003 eruptions. From 2003 to 2008, the deformation approached linearity again, even though the overall pattern continued to be influenced by the emplacement of the dikes from 2001 to 2002. The eastward velocity on the eastern flank showed a marked asymmetry between the faster sectors to the north and those (largely inactive) to the south. In addition, from 1994 to 2008 part of the volcano base (south, west, and north lower slopes) experienced a consistent trend of uplift on the order of ∼0.5 cm/yr. This study reveals that the flanks of Etna have undergone a complex instability resulting from three main processes. In the long term (10 3 –10 4 years), the load of the volcano is responsible for the development of a peripheral bulge. In the intermediate term (≤10 1 years, observed from 1994 to 2000), inflation due to the accumulation of magma induces a moderate and linear uplift and outward slip of the flanks. In the short term (≤1 year, observed from 2001 to 2002), the emplacement of feeder dikes along the NE and south rifts results in a nonlinear, focused, and asymmetric deformation on the eastern and western flanks. Deformation due to flank instability is widespread at Mt. Etna, regardless of volcanic activity, and remains by far the predominant type of deformation on the volcano. Citation: Solaro, G., V. Acocella, S. Pepe, J. Ruch, M. Neri, and E. Sansosti (2010), Anatomy of an unstable volcano from InSAR: Multiple processes affecting flank instability at Mt. Etna, 1994–2008, J. Geophys. Res., 115, B10405, doi:10.1029/2009JB000820. 1. Introduction [2] Volcanoes may deform as a consequence of several processes. Magma emplacement, usually in the form of dikes [Dieterich, 1988; Delaney et al., 1998] or pressurized res- ervoirs [Amelung et al., 2000], is the most common process. Another process is flank instability and collapse. This may be induced, in addition to magma emplacement [Voight et al., 1981; Donnadieu and Merle, 2001; Acocella et al., 2006], by fault activity (including earthquakes [Ando, 1979; Acocella et al., 2003; Walter et al., 2005], a weak basement [Borgia et al., 1992; van Wyk de Vries and Francis, 1997; Borgia and van Wyk de Vries, 2003], and hydrothermal alteration [Reid et al., 2001; Behncke et al., 2008]). Volcano deformation may be also induced by the pressurization of a hydrothermal system, especially at calderas [Battaglia et al., 2006]. [3] Modern geodetic techniques, including GPS and space- borne interferometric synthetic aperture radar (InSAR), allow the detection of centimeter‐ to millimeter‐scale deformation of a volcanic edifice and are invaluable tools for monitoring and understanding the relations between deformation and magmatic activity [Coltelli et al., 1996; Cervelli et al., 2002; Amelung et al., 2007]. In particular, the availability of large SAR data archives, acquired since 1992, enables one to recognize and measure the evolution of the deformation of significant portions of a volcanic edifice with a high density of measurements over nearly 2 decades. In this way, it is 1 Istituto per il Rilevamento Elettromagnetico dell’Ambiente, Consiglio Nazionale delle Ricerche, Naples, Italy. 2 Dipartimento di Scienze Geologiche, Università Roma Tre, Rome, Italy. 3 Istituto Nazionale di Geofisica e Vulcanologia, Sezione di Catania, Italy. Copyright 2010 by the American Geophysical Union. 0148‐0227/10/2009JB000820 JOURNAL OF GEOPHYSICAL RESEARCH, VOL. 115, B10405, doi:10.1029/2009JB000820, 2010 B10405 1 of 21
-
Upload
independent -
Category
Documents
-
view
1 -
download
0
Transcript of Anatomy of an unstable volcano from InSAR: Multiple processes affecting flank instability at Mt....
Anatomy of an unstable volcano from InSAR: Multiple processesaffecting flank instability at Mt. Etna, 1994–2008
Giuseppe Solaro,1 Valerio Acocella,2 Susi Pepe,1 Joel Ruch,2 Marco Neri,3
and Eugenio Sansosti1
Received 22 December 2009; revised 22 April 2010; accepted 10 May 2010; published 8 October 2010.
[1] Volcano deformation may occur under different conditions. To understand how avolcano deforms, as well as relations with magmatic activity, we studied Mt. Etna in detailusing interferometric synthetic aperture radar (InSAR) data from 1994 to 2008. From 1994to 2000, the volcano inflated with a linear behavior. The inflation was accompanied byeastward and westward slip on the eastern and western flanks, respectively. The portionsproximal to the summit showed higher inflation rates, whereas the distal portions showedseveral sectors bounded by faults, in some cases behaving as rigid blocks. From 2000 to2003, the deformation became nonlinear, especially on the proximal eastern and westernflanks, showing marked eastward and westward displacements, respectively. This behaviorresulted from the deformation induced by the emplacement of feeder dikes during the 2001and 2002–2003 eruptions. From 2003 to 2008, the deformation approached linearityagain, even though the overall pattern continued to be influenced by the emplacement of thedikes from 2001 to 2002. The eastward velocity on the eastern flank showed a markedasymmetry between the faster sectors to the north and those (largely inactive) to the south.In addition, from 1994 to 2008 part of the volcano base (south, west, and north lower slopes)experienced a consistent trend of uplift on the order of ∼0.5 cm/yr. This study revealsthat the flanks of Etna have undergone a complex instability resulting from three mainprocesses. In the long term (103–104 years), the load of the volcano is responsible for thedevelopment of a peripheral bulge. In the intermediate term (≤101 years, observed from 1994to 2000), inflation due to the accumulation of magma induces a moderate and linearuplift and outward slip of the flanks. In the short term (≤1 year, observed from 2001 to 2002),the emplacement of feeder dikes along the NE and south rifts results in a nonlinear, focused,and asymmetric deformation on the eastern and western flanks. Deformation due toflank instability is widespread at Mt. Etna, regardless of volcanic activity, and remainsby far the predominant type of deformation on the volcano.
Citation: Solaro, G., V. Acocella, S. Pepe, J. Ruch, M. Neri, and E. Sansosti (2010), Anatomy of an unstable volcanofrom InSAR: Multiple processes affecting flank instability at Mt. Etna, 1994–2008, J. Geophys. Res., 115, B10405,doi:10.1029/2009JB000820.
1. Introduction
[2] Volcanoes may deform as a consequence of severalprocesses. Magma emplacement, usually in the form of dikes[Dieterich, 1988; Delaney et al., 1998] or pressurized res-ervoirs [Amelung et al., 2000], is the most common process.Another process is flank instability and collapse. This may beinduced, in addition to magma emplacement [Voight et al.,1981; Donnadieu and Merle, 2001; Acocella et al., 2006],
by fault activity (including earthquakes [Ando, 1979; Acocellaet al., 2003; Walter et al., 2005], a weak basement [Borgiaet al., 1992; van Wyk de Vries and Francis, 1997; Borgiaand van Wyk de Vries, 2003], and hydrothermal alteration[Reid et al., 2001;Behncke et al., 2008]). Volcano deformationmay be also induced by the pressurization of a hydrothermalsystem, especially at calderas [Battaglia et al., 2006].[3] Modern geodetic techniques, including GPS and space-
borne interferometric synthetic aperture radar (InSAR), allowthe detection of centimeter‐ to millimeter‐scale deformationof a volcanic edifice and are invaluable tools for monitoringand understanding the relations between deformation andmagmatic activity [Coltelli et al., 1996; Cervelli et al., 2002;Amelung et al., 2007]. In particular, the availability of largeSAR data archives, acquired since 1992, enables one torecognize and measure the evolution of the deformation ofsignificant portions of a volcanic edifice with a high densityof measurements over nearly 2 decades. In this way, it is
1Istituto per il Rilevamento Elettromagnetico dell’Ambiente, ConsiglioNazionale delle Ricerche, Naples, Italy.
2Dipartimento di Scienze Geologiche, Università Roma Tre, Rome,Italy.
3Istituto Nazionale di Geofisica e Vulcanologia, Sezione di Catania,Italy.
Copyright 2010 by the American Geophysical Union.0148‐0227/10/2009JB000820
JOURNAL OF GEOPHYSICAL RESEARCH, VOL. 115, B10405, doi:10.1029/2009JB000820, 2010
B10405 1 of 21

possible to measure an intermediate‐term deformation, whichis not necessarily directly related to a specific eruptive epi-sode. Short‐term deformation, lasting from weeks to monthsand related to unrests or eruptive episodes, may be moredifficult to appreciate. In fact, since data are mainly acquiredmonthly, InSAR technique is usually not able to detect veryshort‐period (<1 month) elastic deformation, if it has recov-ered before a new acquisition. This limitation is now partiallyreduced since new sensors with a much shorter revisit periodbecame available (e.g., 8 days for COSMO‐SkyMed or11 days for TerraSAR‐X).[4] Understanding both the short‐ and intermediate‐term
deformation of a volcano provides a more robust ground indefining its dynamic behavior, putting in a wider perspectiveany unrest or eruption as resulting from the recent evolutionof the magmatic system. So far, few studies have attemptedto consider such an approach [e.g., Neri et al., 2009], whichis expected to provide significantly more comprehensiveinformation on how volcanoes behave.[5] In this study, we provide a general frame for under-
standing how volcanoes deform over a 15 year time spanand for assessing the interplay between surface deformationand volcanic activity. For these purposes, we use InSARobservations at Mt. Etna from 1994 to 2008. The InSARtechnique used in this study is the small baseline subset(SBAS) approach (Berardino et al., 2002; Pepe et al., 2005),which has been already applied to resolve the space‐timeevolution of surface deformation in many volcanic areas[Manzo et al., 2006; Tizzani et al., 2007; Trasatti et al., 2008;Neri et al., 2009]. SBAS proves capable to follow even thedeformation characterized by a strong nonlinear behavior[Tizzani et al., 2007; Neri et al., 2009; Casu et al., 2009].[6] Etna is one of the largest and most active volcanoes
worldwide, erupting every ∼1.5 years over the last century(Figure 1) [Behncke and Neri, 2003a, 2003b; Branca and DelCarlo, 2005]. Our InSAR data analysis will first focus on thedeformation of the eastern and western flanks of the volcanobefore, during, and after the major 2001 and 2002–2003eruptions (section 4); then, after having placed this defor-mation within its context (section 5.1), we relate it to threemain processes, acting on different timescales (section 5.2).
2. Tectonic Features and Eruptive Behaviorof Mt. Etna
[7] Three main structural units characterize eastern Sicily(Figure 1a): the Apennine‐Maghrebian chain (AMC) to thenorth, the Hyblean foreland to the south, and the Catania‐Gela foredeep in between [Lentini, 1982]. To the east, theseunits are interrupted by the NNW‐SSE trending MaltaEscarpment (ME; Figure 1a), a lithospheric boundary sepa-rating the Ionian oceanic domain from the Sicilian continentaldomain [Barberi et al., 1974;Monaco et al., 1997;Gvirtzmanand Nur, 1999].[8] Etna is located at the front of the AMC along the ME
and mainly lies on pre‐Quaternary foredeep deposits. Thetectonic setting of Etna is interpreted in the context of an east‐west oriented extensional regime, as suggested by the NNW‐SSE trending transtensional fault system (Timpe fault system(TFS); Figure 1b), which is part of the ME, on the easternflank [Monaco et al., 1997, 2008; Corsaro et al., 2002;Azzaro, 2004]. Themain segments of TFS are theMoscarello,
Acireale, and San Leonardello faults (LF; Figure 1b). Qua-ternary compressive features have been also observed to thesouth of the volcano and related to the southwardmigration ofthe chain [Bousquet and Lanzafame, 1986; Labaume et al.,1990; Lanzafame et al., 1997a, 1997b; Catalano et al.,2004]. These are consistent with the present‐day state ofstress, as inferred from in situ stress measurements [Bousquetet al., 1988], ground deformation studies [Nunnari andPuglisi, 1994; Bonaccorso et al., 1996], and earthquakefault‐plane solutions [Scarpa et al., 1983;Gresta et al., 1990;Cocina et al., 1997]. These studies suggest that a north‐southoriented compressive regime is associated with the east‐westoriented extension [Lanzafame et al., 1997b].[9] Recent volcanic activity is mainly focused on the
summit craters [Neri et al., 2008] and along fissures on theflanks [Behncke et al., 2005]. In the upper part of the volcano(>1500 m), three main “rift zones” radiate from the summit[Rittmann, 1973]: the NE rift, the south rift, and the west rift(Figure 1b). These rifts are probably shallow rooted, appar-ently not tapping deep magma [Kieffer, 1985; Tanguy andKieffer, 1993, 1994], and are usually fed by the central con-duit rather than from an underlying shallow magma chamber[Sharp et al., 1980; Sanderson, 1982; McGuire and Pullen,1989; Bousquet and Lanzafame, 2001; Patanè et al., 2003].[10] Mt. Etna is characterized by the seaward displacement
of its eastern to southern flanks [Kieffer, 1985; Borgia et al.,1992; Lo Giudice and Rasà, 1992], affecting an onshore areaof >700 km2 [Neri et al., 2004]. This unstable area is confinedto the north by the Pernicana fault system (PFS; Figure 1b)[Tibaldi and Groppelli, 2002; Acocella and Neri, 2005] andto the SW by the Ragalna fault system (RFS; Figure 1b) [Rustand Neri, 1996; Rust et al., 2005; Neri et al., 2007]. RecentInSAR observations reveal slip along the Belpasso‐Ogninafault (BOF) and the Tremestieri‐Mascalucia fault (TMF)(Figure 1b) [Froger et al., 2001; Neri et al., 2009] as well aslocalized uplift to the south [Borgia et al., 2000b; Lundgrenet al., 2004; Neri et al., 2009]. Field data reveal the slipactivity of the Trecastagni fault (TF) and Aci Trezza fault(ATF; Figure 1b) [Acocella et al., 2003; Neri et al., 2009].Flank slip as well as faulting has also been inferred on thewestern flank, although at much lower rates [Lundgren andRosen, 2003; Mattia et al., 2007].[11] A close relationship between flank deformation and
eruptive activity at Etna has been noted previously [e.g.,Acocella et al., 2003; Burton et al., 2005; Bonaccorso et al.,2006; Bonforte et al., 2007, 2008; Neri and Acocella, 2006;Neri et al., 2009]. Distinct eruptive cycles have beenobserved since 1865, with flank eruptions occurring in clus-ters, separated by periods of quiescence and summit activity[Behncke and Neri, 2003a]. The onset of the last cycle startedafter the 1991–1993 eruption [Allard et al., 2006]. Thevolcano degassed (1994–1995) and then showed increasingsummit activity (1995–2001) [Behncke et al., 2006], culmi-nating in flank and summit eruptions (2001–2008) [Neriet al., 2009]. The 2001 and 2002–2003 flank eruptionsexhibited the highest eruptive rates in the last period. The2001 eruption was fed by a vertically propagating north‐south trending dike on the southern flank; the 2002–2003eruption was characterized, in addition to the renewed activityof the same 2001 dike, by the emplacement of a NE‐SWtrending dike along the NERift. Both the 2001 and 2002–2003eruptions were accompanied by seismic activity and extensive
SOLARO ET AL.: INSAR AT ETNA BETWEEN 1994–2008 B10405B10405
2 of 21
surface fracturing, mainly on the eastern flank [Acocella andNeri, 2003; Acocella et al., 2003; Behncke and Neri, 2003b;Neri et al., 2005; Aloisi et al., 2006; Bonforte et al., 2004,2009].
3. Methodology
[12] We processed 139 ascending (track 129, frame 747)and 120 descending (track 222, frame 2853) SAR dataacquired by the ERS‐1/2 and Envisat sensors for the 1992–2008 period. From these SAR data, we computed 372 inter-
ferograms from the ascending orbits and 347 from the des-cending ones. These are subsequently inverted by applyingthe SBAS approach [Berardino et al., 2002;Pepe et al., 2005]in order to produce average velocity maps and deformationtime series for both the ascending and descending orbits. TheSBAS technique allows us to combine data acquired frommultiple radar sensors and generate one single, long timeseries; this is achieved if the data sets exhibit enough temporaloverlap and the acquisition geometry (i.e., sensor look angle)is similar [Pepe et al., 2005]. This is the case of ERS andEnvisat data sets when the Envisat data belong to swath IS‐2.
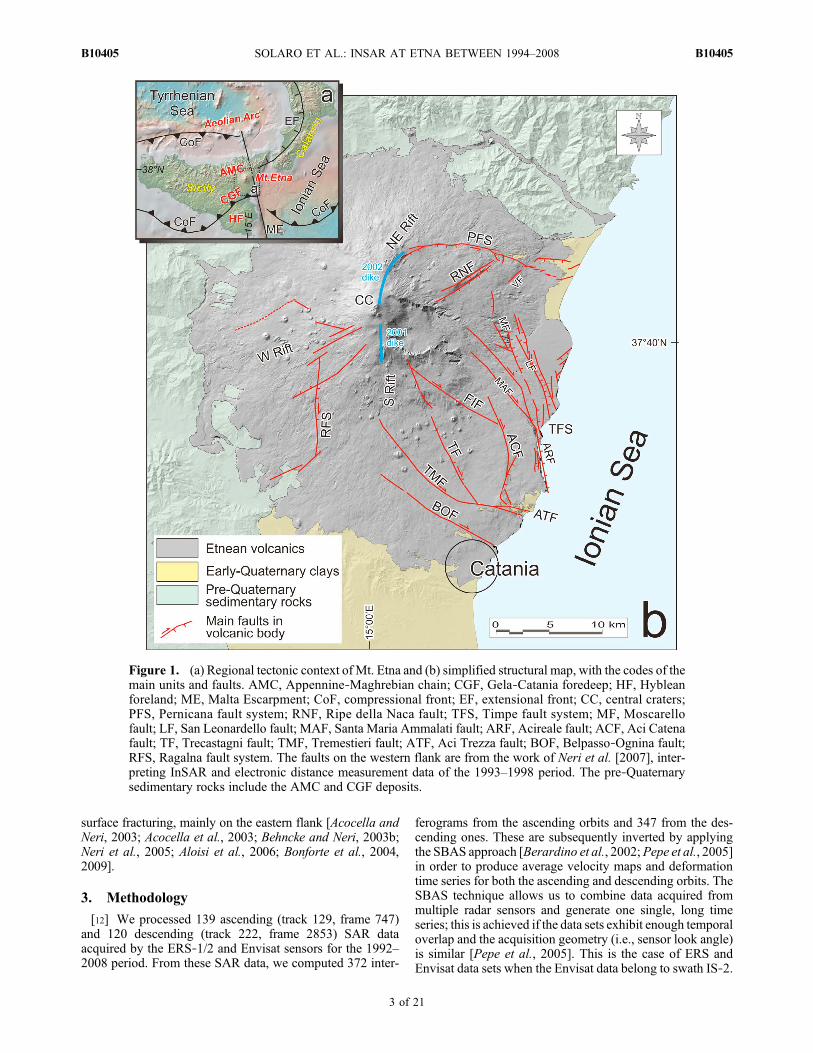
Figure 1. (a) Regional tectonic context of Mt. Etna and (b) simplified structural map, with the codes of themain units and faults. AMC, Appennine‐Maghrebian chain; CGF, Gela‐Catania foredeep; HF, Hybleanforeland; ME, Malta Escarpment; CoF, compressional front; EF, extensional front; CC, central craters;PFS, Pernicana fault system; RNF, Ripe della Naca fault; TFS, Timpe fault system; MF, Moscarellofault; LF, San Leonardello fault; MAF, Santa Maria Ammalati fault; ARF, Acireale fault; ACF, Aci Catenafault; TF, Trecastagni fault; TMF, Tremestieri fault; ATF, Aci Trezza fault; BOF, Belpasso‐Ognina fault;RFS, Ragalna fault system. The faults on the western flank are from the work of Neri et al. [2007], inter-preting InSAR and electronic distance measurement data of the 1993–1998 period. The pre‐Quaternarysedimentary rocks include the AMC and CGF deposits.
SOLARO ET AL.: INSAR AT ETNA BETWEEN 1994–2008 B10405B10405
3 of 21
[13] After multisensor combination, we obtain separatedeformation time series and velocity maps for the ascendingand descending orbits with full coverage of the analyzedperiod. The time series measure the projection of the grounddisplacement vector along the radar line of sight. This can becombined to resolve vertical and horizontal displacementsthat are easier to interpret. The difference between ascendingand descending measurements effectively eliminates theirvertical and north‐south horizontal vector components and isindicative, with a deviation <3%, of the east‐west componentof the horizontal motion [Lundgren et al., 2004]. On the otherhand, their sum gives a figure that is mostly related to thevertical motion, the residual contribution of the north‐southhorizontal component being <10% [Lundgren et al., 2004].The resulting horizontal displacement is quite insensitive tothe north‐south component, which is here neglected, ascrib-ing the horizontal displacement to the east‐west componentonly. At this stage, the vertical and east‐west components ofthe mean deformation velocity maps are separated (Figure 2)[Manzo et al., 2006]. Moreover, it is also possible to obtainsuch a separation for the deformation time series [Trasattiet al., 2008; Neri et al., 2009]. Nevertheless, the procedurecannot be directly applied to each point of the time seriessince ascending and descending data are acquired at different
times and with a nonuniform temporal sampling. To over-come this problem, each time series is averaged down to onevalue per year; subsequently, the ascending and descendingdata are combined on a year‐to‐year basis. Both velocitymaps and time series describe relative movements withrespect to a reference point located near the city of Catania(white square in Figure 2a).[14] The SBAS approach has been previously used to
resolve the space‐time evolution of surface deformation, alsowith a strong nonlinear behavior [Tizzani et al., 2007; Casuet al., 2009; Neri et al., 2009]. In ideal conditions, the SBAStime series accuracy has been proven to be less than 1 cm [Casuet al., 2006]. However, larger errors might arise whendeformation signals are, at the same time, large compared tothe radar wavelength and fast with respect to the satelliterevisit time (i.e., temporal sampling). For our data, the crit-ical rate is around 5 cm/month. This is mainly due to phaseunwrapping errors that tend to underestimate large phasejumps and thus the measured displacements.[15] During the 1994–2008 period, conditions of fast
deformation were met in 2001 on the summit area and in late2002 on the northern part of the volcano [Neri et al., 2004,2005; Bonforte et al., 2008; Puglisi et al., 2008; Neri et al.,2009]. Therefore, in the 2001–2002 period, the InSAR data
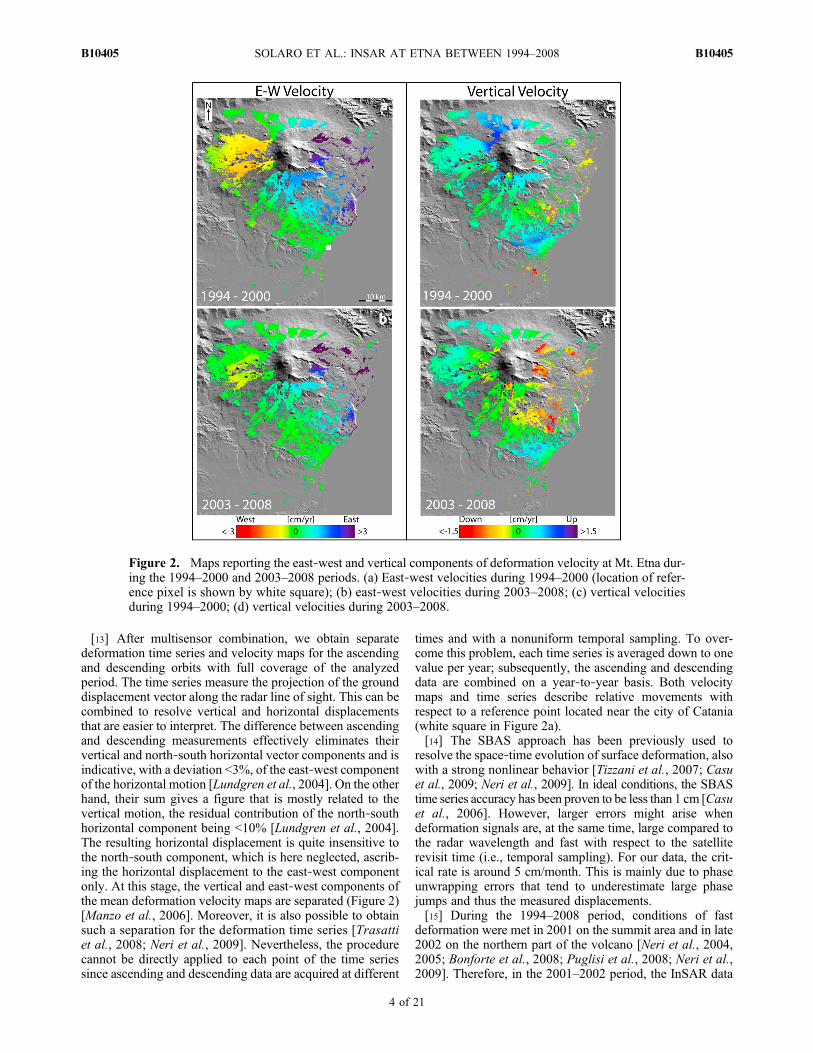
Figure 2. Maps reporting the east‐west and vertical components of deformation velocity at Mt. Etna dur-ing the 1994–2000 and 2003–2008 periods. (a) East‐west velocities during 1994–2000 (location of refer-ence pixel is shown by white square); (b) east‐west velocities during 2003–2008; (c) vertical velocitiesduring 1994–2000; (d) vertical velocities during 2003–2008.
SOLARO ET AL.: INSAR AT ETNA BETWEEN 1994–2008 B10405B10405
4 of 21
might underestimate the deformation in these areas. More-over, in this period, the deformation shows a strong nonlinearbehavior, characterized by inelastic nonrecoverable motion[Neri et al., 2009]. Conversely, in the 1994–2000 and 2003–2008 periods, the time series exhibit an overall linearity, partlydue to inflation, with a predominant elastic and potentiallyrecoverable behavior [Palano et al., 2008; Neri et al., 2009].[16] These different behaviors require different analysis
strategies: (1) For the periods spanning from 1994 to 2000and from 2003 to 2008, we focus, for sake of simplicity, onthe deformation velocity (sections 4.2 and 4.3). To this end,we use representative profiles of the mean deformationvelocity on selected portions of the eastern and westernflanks. These are integrated with an analysis of the kinematicbehavior of fault‐bounded sectors of the distal portion (withregard to the summit) of the volcano, using histograms of thedeformation velocity to characterize the kinematics of eachsector and to highlight any slip along the faults. (2) From2000 to 2003, when nonlinear deformation is observed,we consider the cumulative displacement and the deforma-tion time series (section 4.4). (3) To study synchronouslydeforming areas on the distal portion of the volcano over the1994–2008 period, we use a cross‐correlation analysis of thedeformation time series (section 4.5) [Tizzani et al., 2007;Trasatti et al., 2008], which enables us to identify all thepoints uplifting synchronously relative to a reference area onthe southern distal flank.[17] The data set shown in this study constitutes an
exceptional opportunity to monitor the intermediate‐termbehavior of a volcano (101 years) and is a significantimprovement on previous Mt. Etna InSAR studies thatfocused on deformation maps retrieved from single inter-ferograms [Massonnet et al., 1995; Borgia et al., 2000b;Froger et al., 2001; Lundgren et al., 2003; Lundgren andRosen, 2003; Neri et al., 2007] or investigating InSAR timeseries limited to the 1992–2000 interval [Lundgren et al., 2004;Palano et al., 2007, 2008]. The general ground displacementbehavior at the volcano scale has been recently describedusing InSAR data for the period from 1992 to 2006 [Neriet al., 2009]. With regard to this study, here we: (1) start ourobservations from 1994 (excluding the 1991–1993 eruption,which marks the end of the previous cycle of activity [e.g.,Behncke and Neri, 2003a; Allard et al., 2006]); (2) extendthe observation period to 2008; and (3) provide a moredetailed analysis, considering the deformation of each por-tion of the volcano, and discuss possible triggering factors.
4. Results
4.1. General Features
[18] The velocity maps of the east‐west and vertical com-ponents of the deformation during the 1994–2000 and 2003–2008 periods are displayed in Figure 2. The east‐westvelocity from 1994 to 2000 shows an overall eastward andwestward displacement on the eastern and western flanks,respectively (Figure 2a). However, since most of the southernflank moves eastward, the eastward slipping area is almosttwice as large as that slipping westward. Also, while theeastern flank locally reaches eastward mean velocities of3 cm/yr, the maximum westward velocities on the westernflank do not reach 2 cm/yr. The east‐west velocity from 2003to 2008 shows a much more asymmetric behavior, both
between the eastern and western flanks and within the easternflank itself (Figure 2b). In fact, while most of the eastern flankundergoes a significant eastward displacement (>2 cm/yr),only a minor portion of the western flank moves westward(<1 cm/yr). Also, the northern part of the eastern flank ismuch faster (>2.5 cm/yr) than the southern part (<0.5 cm/yr),highlighting a strong gradient in the east‐west deformation.[19] The vertical velocity from 1994 to 2000 indicates
uplift of the upper portion of the volcano (∼1.5 cm/yr) andareas along its periphery (Figure 2c). Although from 2003to 2008 the volcano’s summit remains largely stable, weobserve localized subsidence on the NE flank (1.5 cm/yr),whereas peripheral areas continue to uplift (as to the SE;∼0.5 cm/yr; Figure 2d).[20] We now describe in detail the deformation pattern
during the 1994–2000 and 2003–2008 periods. Since avail-able InSAR observations are restricted to vertical and east‐west components of deformation, and InSAR coverage onthe northern flank is limited (Figure 2), we focus our studyon the eastern and western flanks. Deformation of thesouthern flank is included in sections 4.2 and 4.3 as theyregard the eastern and western flanks, respectively.
4.2. The Eastern Flank Between 1994–2000and 2003–2008
[21] The first part of our analysis of the eastern flank con-siders the mean east‐west and vertical velocities for the per-iods spanning from 1994 to 2000 (black) and 2003 to 2008(grey) along the profiles of Figure 3 (traces in Figure 3a).These profiles are representative of the overall deformationon the eastern flank. The trace of the known active faults (seeFigure 1) is also reported to highlight any relation with dis-continuities in the deformation velocity.[22] The first profile (profile 1; Figures 3a and 3b) is
approximately north‐south trending and parallel to thecoastline. The east‐west velocity from 1994 to 2000 (positivevelocities indicate eastward movement, while negativevelocities indicate westward movement) progressively in-creases in eastward motion to the north, with a sharp increase(step) of ∼2.5 cm/yr in correspondence with ATF. From ATFto PFS, the eastward motion shows steps of ≤1 cm/yr incorrespondence with LF and Santa Maria Ammalati fault(MAF). Another step of ∼2 cm/yr coincides with PFS. From2003 to 2008, the eastward velocity increases to 5 cm/yrbetween LF and PFS. The vertical velocity in the 1994–2000period is also shown in Figure 3b. A broad uplift, reaching amaximum in correspondence with ATF, is observed from thesouthernmost portion of the profile to MAF, where a drop of∼0.5 cm/yr is observed. To the north, there is a broad subsi-dence between LF and PFS. From 2003 to 2008, the verticalvelocity shows an overall similar behavior, with a subsidence5 km to the south of PFS.[23] The upper portion of the eastern flank is represented
in profile 2 (Figures 3a and 3c), which is partly parallel toprofile 1. The eastward slip between 1994 and 2000 constantlyincreases northward, with higher rates from 2003 to 2008.The vertical velocity from 1994 to 2000 shows a broad uplift,with a local subsidence (Figure 3c) in the area of the 1991–1993 lava flow, suggesting cooling and contraction (Stevenset al., 2001). From 2003 to 2008, the whole sector subsides.[24] Two nearby NW‐SE oriented profiles (profiles 3;
Figures 3a and 3d) to the north give information on the
SOLARO ET AL.: INSAR AT ETNA BETWEEN 1994–2008 B10405B10405
5 of 21
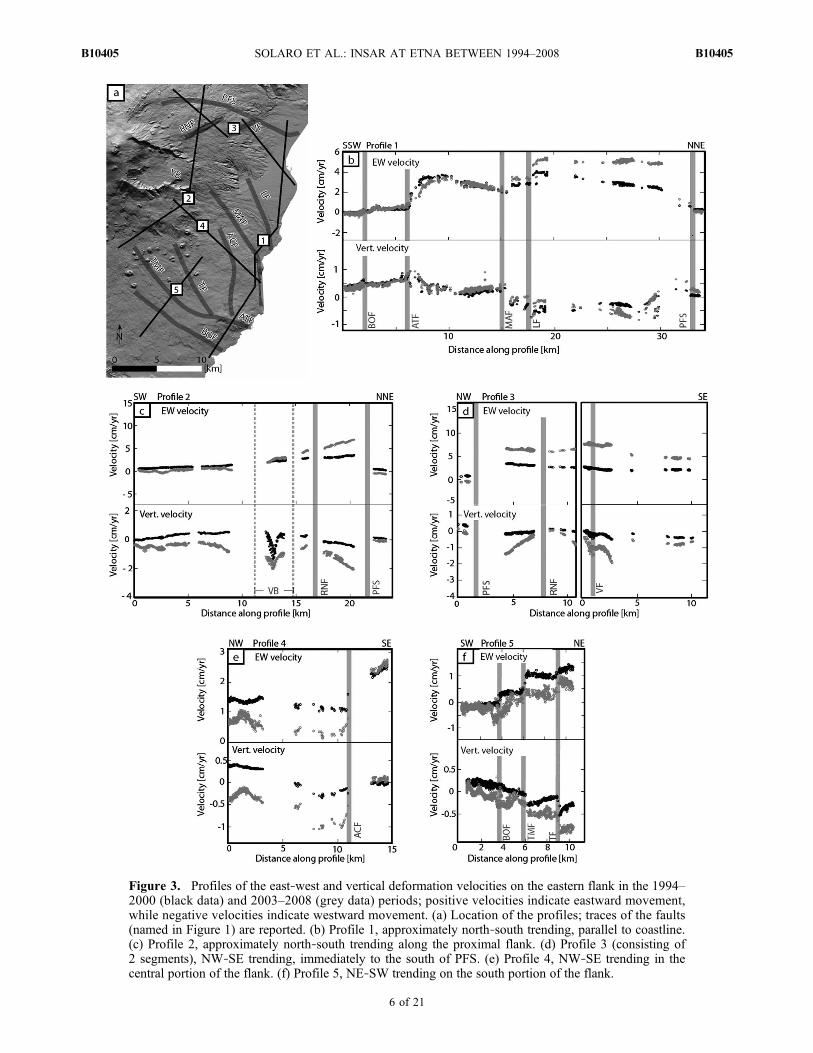
Figure 3. Profiles of the east‐west and vertical deformation velocities on the eastern flank in the 1994–2000 (black data) and 2003–2008 (grey data) periods; positive velocities indicate eastward movement,while negative velocities indicate westward movement. (a) Location of the profiles; traces of the faults(named in Figure 1) are reported. (b) Profile 1, approximately north‐south trending, parallel to coastline.(c) Profile 2, approximately north‐south trending along the proximal flank. (d) Profile 3 (consisting of2 segments), NW‐SE trending, immediately to the south of PFS. (e) Profile 4, NW‐SE trending in thecentral portion of the flank. (f) Profile 5, NE‐SW trending on the south portion of the flank.
SOLARO ET AL.: INSAR AT ETNA BETWEEN 1994–2008 B10405B10405
6 of 21
deformation velocity from the NE Rift to the coastline.The eastward velocity between 1994 and 2000 constantlydecreases to the east, whereas it increases from 2003 to 2008.From 2003 to 2008, a subsidence has a trapdoor pattern ofdeformation between PFS and Ripe della Naca fault (RNF),with a hinge in the area of RNF.[25] The eastward velocity along the NW‐SE oriented
profile 4 (center of the eastern flank) between 1994 and 2000is 1–1.5 cm/yr, except to the east of the Aci Catena fault(Figures 3a and 3e) where the velocity increases. The east-ward velocity from 2003 to 2008 is slightly higher, while tothe SE the rates remain consistent. The vertical velocity from1994 to 2000 decreases from NW to SE (Figure 3e). From2003 to 2008, most of the profile shows subsidence.[26] The eastward velocity from 1994 to 2000 along the
SW‐NE trending profile 5 (on the southern flank; Figures 3aand 3f) increases with steps of ∼0.5 cm/yr toward the NE,with each step corresponding to TF, TMF, and BOF. From2003 to 2008, a similar trend can be still observed, eventhough the data are more scattered and no evident disconti-nuity occurs along TMF and BOF. The vertical velocity from1994 to 2000 passes from uplift (SW) to subsidence (NE),largely in correspondence with TF and TMF (Figure 3f).From 2003 to 2008, a similar behavior is found, even thoughthe amount of subsidence doubles.[27] The profiles have highlighted a general correspon-
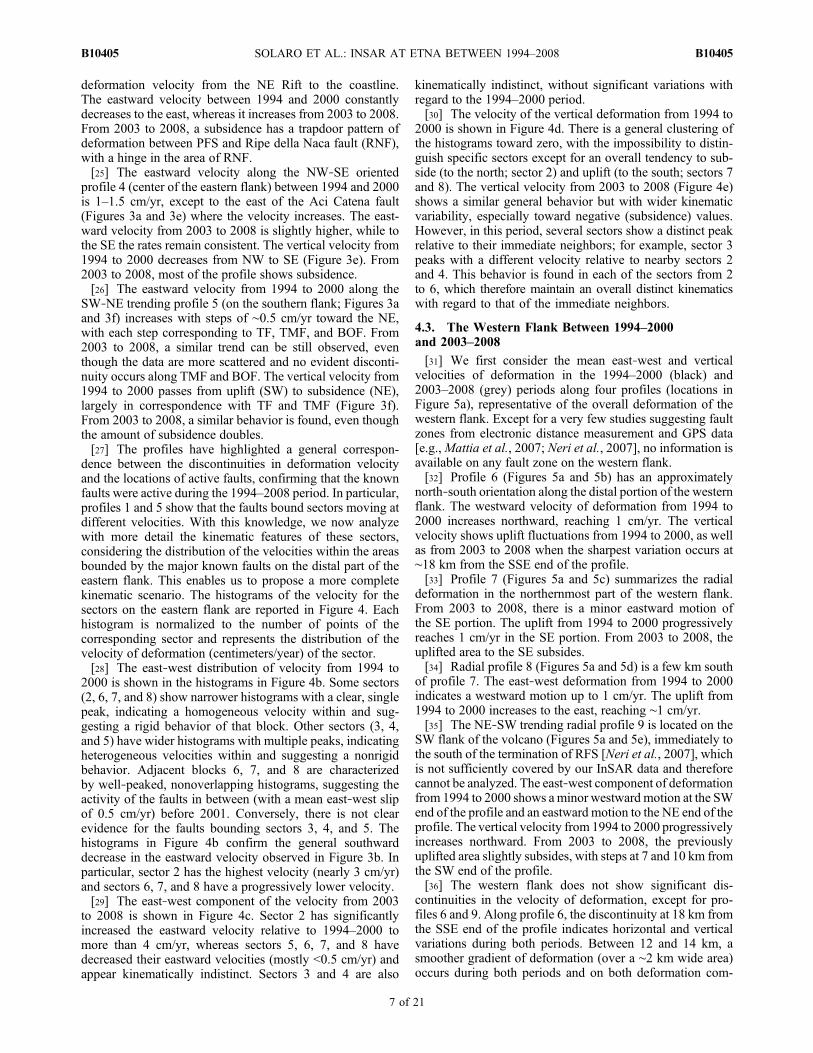
dence between the discontinuities in deformation velocityand the locations of active faults, confirming that the knownfaults were active during the 1994–2008 period. In particular,profiles 1 and 5 show that the faults bound sectors moving atdifferent velocities. With this knowledge, we now analyzewith more detail the kinematic features of these sectors,considering the distribution of the velocities within the areasbounded by the major known faults on the distal part of theeastern flank. This enables us to propose a more completekinematic scenario. The histograms of the velocity for thesectors on the eastern flank are reported in Figure 4. Eachhistogram is normalized to the number of points of thecorresponding sector and represents the distribution of thevelocity of deformation (centimeters/year) of the sector.[28] The east‐west distribution of velocity from 1994 to
2000 is shown in the histograms in Figure 4b. Some sectors(2, 6, 7, and 8) show narrower histograms with a clear, singlepeak, indicating a homogeneous velocity within and sug-gesting a rigid behavior of that block. Other sectors (3, 4,and 5) have wider histograms with multiple peaks, indicatingheterogeneous velocities within and suggesting a nonrigidbehavior. Adjacent blocks 6, 7, and 8 are characterizedby well‐peaked, nonoverlapping histograms, suggesting theactivity of the faults in between (with a mean east‐west slipof 0.5 cm/yr) before 2001. Conversely, there is not clearevidence for the faults bounding sectors 3, 4, and 5. Thehistograms in Figure 4b confirm the general southwarddecrease in the eastward velocity observed in Figure 3b. Inparticular, sector 2 has the highest velocity (nearly 3 cm/yr)and sectors 6, 7, and 8 have a progressively lower velocity.[29] The east‐west component of the velocity from 2003
to 2008 is shown in Figure 4c. Sector 2 has significantlyincreased the eastward velocity relative to 1994–2000 tomore than 4 cm/yr, whereas sectors 5, 6, 7, and 8 havedecreased their eastward velocities (mostly <0.5 cm/yr) andappear kinematically indistinct. Sectors 3 and 4 are also
kinematically indistinct, without significant variations withregard to the 1994–2000 period.[30] The velocity of the vertical deformation from 1994 to
2000 is shown in Figure 4d. There is a general clustering ofthe histograms toward zero, with the impossibility to distin-guish specific sectors except for an overall tendency to sub-side (to the north; sector 2) and uplift (to the south; sectors 7and 8). The vertical velocity from 2003 to 2008 (Figure 4e)shows a similar general behavior but with wider kinematicvariability, especially toward negative (subsidence) values.However, in this period, several sectors show a distinct peakrelative to their immediate neighbors; for example, sector 3peaks with a different velocity relative to nearby sectors 2and 4. This behavior is found in each of the sectors from 2to 6, which therefore maintain an overall distinct kinematicswith regard to that of the immediate neighbors.
4.3. The Western Flank Between 1994–2000and 2003–2008
[31] We first consider the mean east‐west and verticalvelocities of deformation in the 1994–2000 (black) and2003–2008 (grey) periods along four profiles (locations inFigure 5a), representative of the overall deformation of thewestern flank. Except for a very few studies suggesting faultzones from electronic distance measurement and GPS data[e.g.,Mattia et al., 2007; Neri et al., 2007], no information isavailable on any fault zone on the western flank.[32] Profile 6 (Figures 5a and 5b) has an approximately
north‐south orientation along the distal portion of the westernflank. The westward velocity of deformation from 1994 to2000 increases northward, reaching 1 cm/yr. The verticalvelocity shows uplift fluctuations from 1994 to 2000, as wellas from 2003 to 2008 when the sharpest variation occurs at∼18 km from the SSE end of the profile.[33] Profile 7 (Figures 5a and 5c) summarizes the radial
deformation in the northernmost part of the western flank.From 2003 to 2008, there is a minor eastward motion ofthe SE portion. The uplift from 1994 to 2000 progressivelyreaches 1 cm/yr in the SE portion. From 2003 to 2008, theuplifted area to the SE subsides.[34] Radial profile 8 (Figures 5a and 5d) is a few km south
of profile 7. The east‐west deformation from 1994 to 2000indicates a westward motion up to 1 cm/yr. The uplift from1994 to 2000 increases to the east, reaching ∼1 cm/yr.[35] The NE‐SW trending radial profile 9 is located on the
SW flank of the volcano (Figures 5a and 5e), immediately tothe south of the termination of RFS [Neri et al., 2007], whichis not sufficiently covered by our InSAR data and thereforecannot be analyzed. The east‐west component of deformationfrom 1994 to 2000 shows aminor westward motion at the SWend of the profile and an eastward motion to the NE end of theprofile. The vertical velocity from 1994 to 2000 progressivelyincreases northward. From 2003 to 2008, the previouslyuplifted area slightly subsides, with steps at 7 and 10 km fromthe SW end of the profile.[36] The western flank does not show significant dis-
continuities in the velocity of deformation, except for pro-files 6 and 9. Along profile 6, the discontinuity at 18 km fromthe SSE end of the profile indicates horizontal and verticalvariations during both periods. Between 12 and 14 km, asmoother gradient of deformation (over a ∼2 km wide area)occurs during both periods and on both deformation com-
SOLARO ET AL.: INSAR AT ETNA BETWEEN 1994–2008 B10405B10405
7 of 21
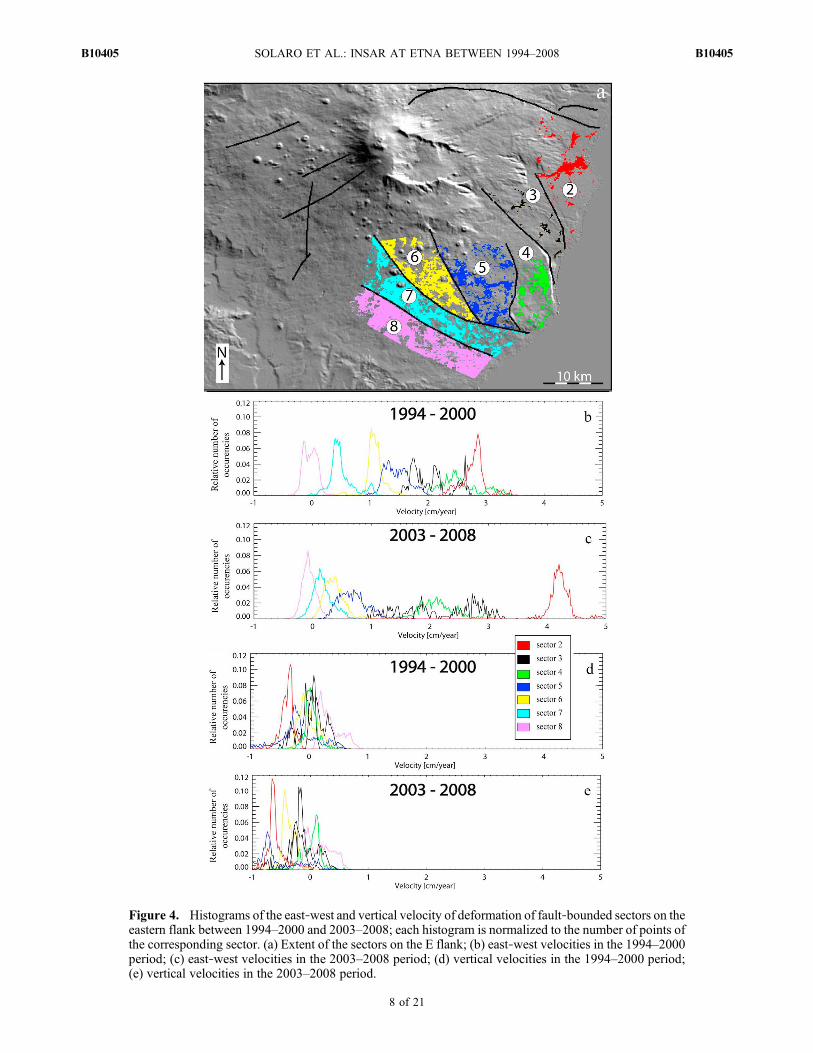
Figure 4. Histograms of the east‐west and vertical velocity of deformation of fault‐bounded sectors on theeastern flank between 1994–2000 and 2003–2008; each histogram is normalized to the number of points ofthe corresponding sector. (a) Extent of the sectors on the E flank; (b) east‐west velocities in the 1994–2000period; (c) east‐west velocities in the 2003–2008 period; (d) vertical velocities in the 1994–2000 period;(e) vertical velocities in the 2003–2008 period.
SOLARO ET AL.: INSAR AT ETNA BETWEEN 1994–2008 B10405B10405
8 of 21
ponents. These data suggest that the distal part of the westernflank consists of three main sectors moving independently.To better characterize their areal extent and kinematics, weconsider an analysis based on histograms of velocity withinthe distal part of the western flank (Figure 6).[37] The east‐west component of the velocity from 1994 to
2000 shows that sectors 9 and 10 are in part kinematicallydistinct, whose histograms peak a very few millimeters apart,both moving westward (Figure 6b). Therefore, they partlybehave as rigid blocks. Conversely, sector 11, having a moredispersed histogram, lacks a kinematic identity. Between2003 and 2008, blocks 9 and 10 can still be partly distin-guished through their east‐west velocities, while sector 11 iskinematically undistinguished (Figure 6c). In general, thethree sectors in the 2003–2008 period decrease their west-ward velocity of approximately 1 cm/yr.
[38] The vertical component of velocity during 1994–2000shows that the three sectors are well peaked but centeredaround zero, suggesting that they are kinematically indistinct(Figure 6d). From 2003 to 2008, the vertical velocity showsthat while sectors 9 and 10 are undistinguished around thezero value, sector 11 does not overlap and has a relativelydefined kinematics with an overall subsidence (Figure 6e).Therefore, sector 11might be considered a distinct block onlythrough its vertical velocity after 2001.
4.4. Deformation Between 2000 and 2003
[39] From 2000 to 2003, the volcano underwent a nonlineardeformation [e.g., Neri et al., 2009]. We first show the effectof such a nonlinear behavior on the previously consideredsectors on the eastern and western flanks. The diagrams ofFigure 7a report the east‐west deformation time series for all
Figure 5. Profiles of the velocity of east‐west and vertical deformation on the western flank during 1994–2000 (black data) and 2003–2008 (grey data) periods; positive velocities indicate eastward movement whilenegative velocities indicate westward movement. (a) Location of the profiles with traces of previouslyknown faults (named as in Figure 1); (b) profile 6, approximately north‐south trending on the distalflank; (c) profile 7, NW‐SE trending on the northernmost flank; (d) profile 8, east‐west trending on the NWflank; (e) profile 9, NE‐SW trending along the south flank.
SOLARO ET AL.: INSAR AT ETNA BETWEEN 1994–2008 B10405B10405
9 of 21
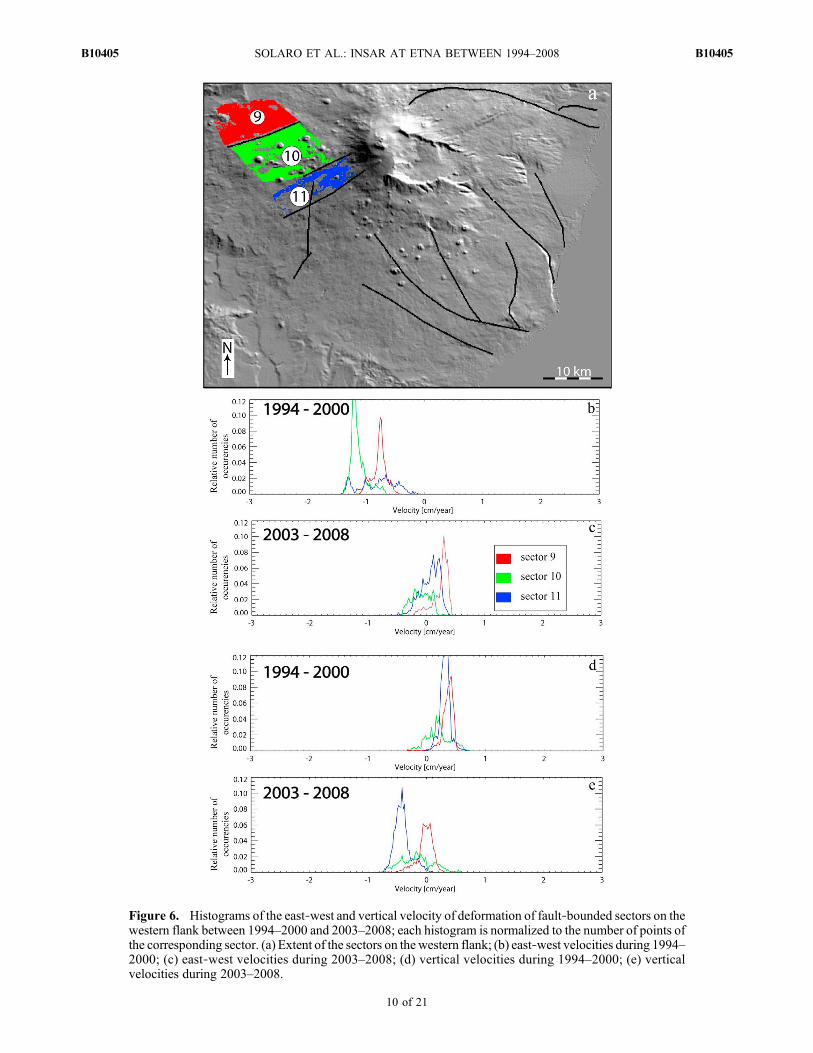
Figure 6. Histograms of the east‐west and vertical velocity of deformation of fault‐bounded sectors on thewestern flank between 1994–2000 and 2003–2008; each histogram is normalized to the number of points ofthe corresponding sector. (a) Extent of the sectors on the western flank; (b) east‐west velocities during 1994–2000; (c) east‐west velocities during 2003–2008; (d) vertical velocities during 1994–2000; (e) verticalvelocities during 2003–2008.
SOLARO ET AL.: INSAR AT ETNA BETWEEN 1994–2008 B10405B10405
10 of 21

Figure 7
SOLARO ET AL.: INSAR AT ETNA BETWEEN 1994–2008 B10405B10405
11 of 21
the pixels of each sector for the 1994–2008 period. There is asimilar deformation for the pixels of a given sector until 2000;afterward the amplitude of the deformation sharply increasesin several sectors, especially those on the western flank(sectors 9, 10, and 11). We then considered the time series inthe 1994–2000 and 2003–2008 periods, omitting the 2000–2003 period (Figure 7b). From 2003 to 2008, we haveassumed that all the pixels of each sector have the same initialamount of deformation. This has been arbitrarily fixed ascorresponding to the mean value achieved in 2000; thisassumption has been chosen to better visualize the data anddoes not affect our results or interpretations. In fact, whatcounts in Figure 7b is that, omitting any deformation from2000–2003, during 2003–2008 the pixels of each sectordeform in a much more uniform way (Figure 7b). Thesediagrams show: (1) a partly different behavior of the pixels ofthe distal portion of the volcano during 1994–2000 versus2003–2008 and (2) after the significant kinematic variations
from 2000 to 2003, the sectors still show a largely consistentkinematics.[40] To better define the extent and possible cause(s) of the
nonlinear behavior of the deformation in this period, weconsider our data with more detail. The period includes theJuly–August 2001 and the October 2002 to January 2003eruptions, characterized by major dike emplacements [Neriet al., 2005, 2009, and references therein]. In this period,despite the desirable shorter time sampling due to theexpected large ground deformations, there is a general lack ofacquisitions. This is due to the unavailability of two of thethree satellites (ERS‐1 mission terminated in 2000, Envisatbegan in March 2002) as well as a system failure on theremaining satellite (ERS‐2) from January 2000 to late 2001.These limitations make the analysis via single‐interferogramtechniques quite difficult. The SBAS technique impliesgenerating interferograms between those few images andseveral other data (even outside the time period considered);those interferograms are subsequently inverted. Using this
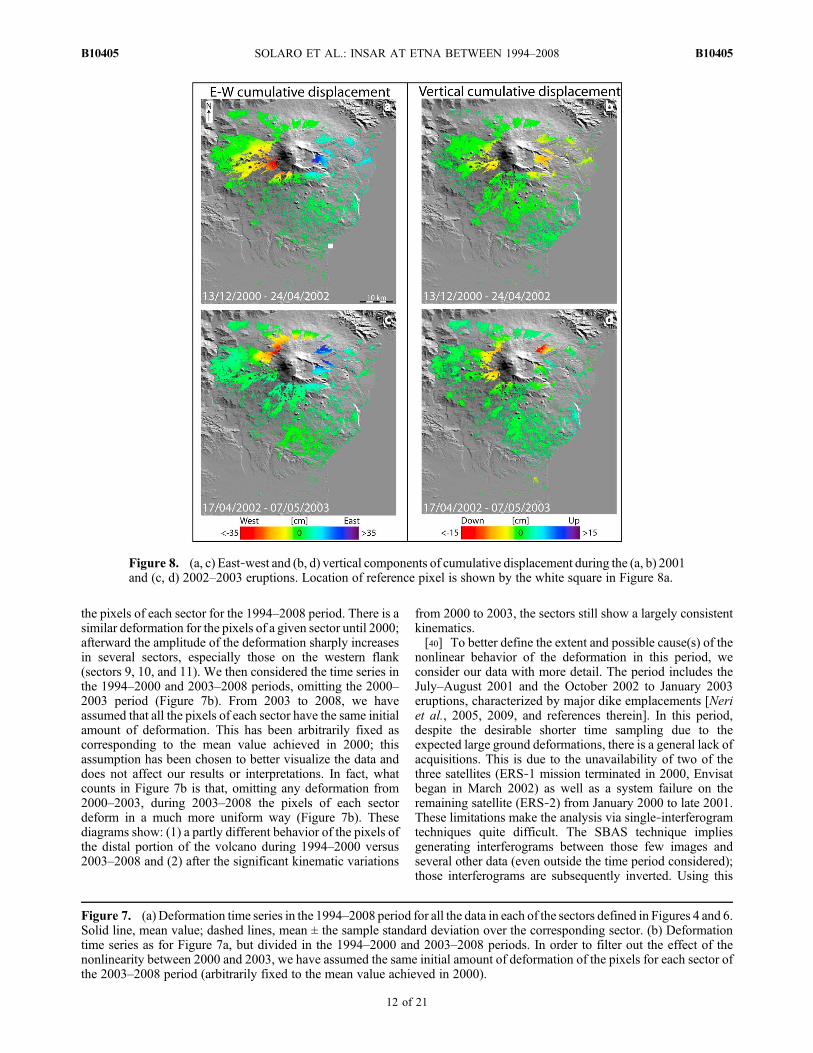
Figure 8. (a, c) East‐west and (b, d) vertical components of cumulative displacement during the (a, b) 2001and (c, d) 2002–2003 eruptions. Location of reference pixel is shown by the white square in Figure 8a.
Figure 7. (a) Deformation time series in the 1994–2008 period for all the data in each of the sectors defined in Figures 4 and 6.Solid line, mean value; dashed lines, mean ± the sample standard deviation over the corresponding sector. (b) Deformationtime series as for Figure 7a, but divided in the 1994–2000 and 2003–2008 periods. In order to filter out the effect of thenonlinearity between 2000 and 2003, we have assumed the same initial amount of deformation of the pixels for each sector ofthe 2003–2008 period (arbitrarily fixed to the mean value achieved in 2000).
SOLARO ET AL.: INSAR AT ETNA BETWEEN 1994–2008 B10405B10405
12 of 21
redundancy, we were able to compute the cumulative defor-mation covering the 2001 (Figures 8a and 8b) and 2002–2003(Figures 8c and 8d) eruptions. The analysis of the east‐westdeformation indicates that the eastern flank moved mostlyeastward, while the western flank showed a westwarddeformation during both eruptions. In general, the deforma-tion was focused within an approximately east‐west elon-gated, roughly elliptical area, with the longer axis on theeastern flank. Also, the most strained area migrates northwardfrom 2001 to 2002–2003, especially on the east‐west com-ponent (Figures 8a and 8c). The vertical cumulative defor-mation shows that the area with the highest east‐west motionhas also undergone the largest subsidence in both eruptions(Figures 8b and 8d).[41] We then consider the nonlinear kinematics of the upper
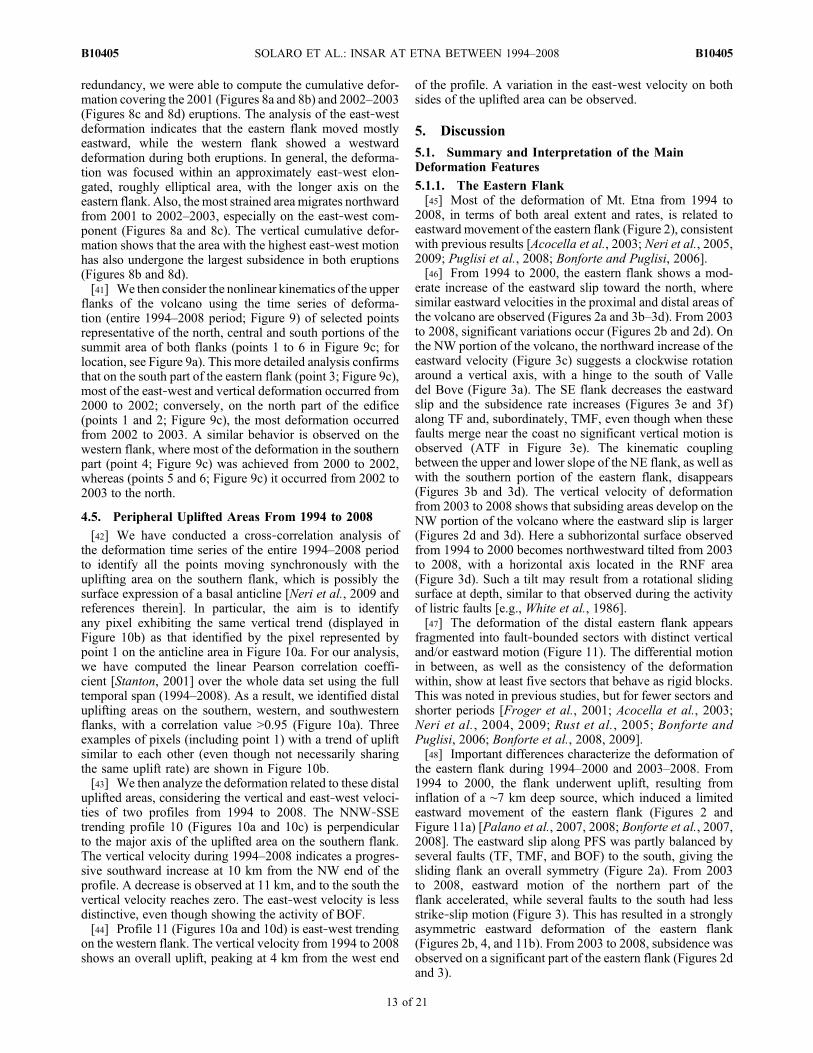
flanks of the volcano using the time series of deforma-tion (entire 1994–2008 period; Figure 9) of selected pointsrepresentative of the north, central and south portions of thesummit area of both flanks (points 1 to 6 in Figure 9c; forlocation, see Figure 9a). This more detailed analysis confirmsthat on the south part of the eastern flank (point 3; Figure 9c),most of the east‐west and vertical deformation occurred from2000 to 2002; conversely, on the north part of the edifice(points 1 and 2; Figure 9c), the most deformation occurredfrom 2002 to 2003. A similar behavior is observed on thewestern flank, where most of the deformation in the southernpart (point 4; Figure 9c) was achieved from 2000 to 2002,whereas (points 5 and 6; Figure 9c) it occurred from 2002 to2003 to the north.
4.5. Peripheral Uplifted Areas From 1994 to 2008
[42] We have conducted a cross‐correlation analysis ofthe deformation time series of the entire 1994–2008 periodto identify all the points moving synchronously with theuplifting area on the southern flank, which is possibly thesurface expression of a basal anticline [Neri et al., 2009 andreferences therein]. In particular, the aim is to identifyany pixel exhibiting the same vertical trend (displayed inFigure 10b) as that identified by the pixel represented bypoint 1 on the anticline area in Figure 10a. For our analysis,we have computed the linear Pearson correlation coeffi-cient [Stanton, 2001] over the whole data set using the fulltemporal span (1994–2008). As a result, we identified distaluplifting areas on the southern, western, and southwesternflanks, with a correlation value >0.95 (Figure 10a). Threeexamples of pixels (including point 1) with a trend of upliftsimilar to each other (even though not necessarily sharingthe same uplift rate) are shown in Figure 10b.[43] We then analyze the deformation related to these distal
uplifted areas, considering the vertical and east‐west veloci-ties of two profiles from 1994 to 2008. The NNW‐SSEtrending profile 10 (Figures 10a and 10c) is perpendicularto the major axis of the uplifted area on the southern flank.The vertical velocity during 1994–2008 indicates a progres-sive southward increase at 10 km from the NW end of theprofile. A decrease is observed at 11 km, and to the south thevertical velocity reaches zero. The east‐west velocity is lessdistinctive, even though showing the activity of BOF.[44] Profile 11 (Figures 10a and 10d) is east‐west trending
on the western flank. The vertical velocity from 1994 to 2008shows an overall uplift, peaking at 4 km from the west end
of the profile. A variation in the east‐west velocity on bothsides of the uplifted area can be observed.
5. Discussion
5.1. Summary and Interpretation of the MainDeformation Features
5.1.1. The Eastern Flank[45] Most of the deformation of Mt. Etna from 1994 to
2008, in terms of both areal extent and rates, is related toeastward movement of the eastern flank (Figure 2), consistentwith previous results [Acocella et al., 2003; Neri et al., 2005,2009; Puglisi et al., 2008; Bonforte and Puglisi, 2006].[46] From 1994 to 2000, the eastern flank shows a mod-
erate increase of the eastward slip toward the north, wheresimilar eastward velocities in the proximal and distal areas ofthe volcano are observed (Figures 2a and 3b–3d). From 2003to 2008, significant variations occur (Figures 2b and 2d). Onthe NW portion of the volcano, the northward increase of theeastward velocity (Figure 3c) suggests a clockwise rotationaround a vertical axis, with a hinge to the south of Valledel Bove (Figure 3a). The SE flank decreases the eastwardslip and the subsidence rate increases (Figures 3e and 3f)along TF and, subordinately, TMF, even though when thesefaults merge near the coast no significant vertical motion isobserved (ATF in Figure 3e). The kinematic couplingbetween the upper and lower slope of the NE flank, as well aswith the southern portion of the eastern flank, disappears(Figures 3b and 3d). The vertical velocity of deformationfrom 2003 to 2008 shows that subsiding areas develop on theNW portion of the volcano where the eastward slip is larger(Figures 2d and 3d). Here a subhorizontal surface observedfrom 1994 to 2000 becomes northwestward tilted from 2003to 2008, with a horizontal axis located in the RNF area(Figure 3d). Such a tilt may result from a rotational slidingsurface at depth, similar to that observed during the activityof listric faults [e.g., White et al., 1986].[47] The deformation of the distal eastern flank appears
fragmented into fault‐bounded sectors with distinct verticaland/or eastward motion (Figure 11). The differential motionin between, as well as the consistency of the deformationwithin, show at least five sectors that behave as rigid blocks.This was noted in previous studies, but for fewer sectors andshorter periods [Froger et al., 2001; Acocella et al., 2003;Neri et al., 2004, 2009; Rust et al., 2005; Bonforte andPuglisi, 2006; Bonforte et al., 2008, 2009].[48] Important differences characterize the deformation of
the eastern flank during 1994–2000 and 2003–2008. From1994 to 2000, the flank underwent uplift, resulting frominflation of a ∼7 km deep source, which induced a limitedeastward movement of the eastern flank (Figures 2 andFigure 11a) [Palano et al., 2007, 2008; Bonforte et al., 2007,2008]. The eastward slip along PFS was partly balanced byseveral faults (TF, TMF, and BOF) to the south, giving thesliding flank an overall symmetry (Figure 2a). From 2003to 2008, eastward motion of the northern part of theflank accelerated, while several faults to the south had lessstrike‐slip motion (Figure 3). This has resulted in a stronglyasymmetric eastward deformation of the eastern flank(Figures 2b, 4, and 11b). From 2003 to 2008, subsidence wasobserved on a significant part of the eastern flank (Figures 2dand 3).
SOLARO ET AL.: INSAR AT ETNA BETWEEN 1994–2008 B10405B10405
13 of 21
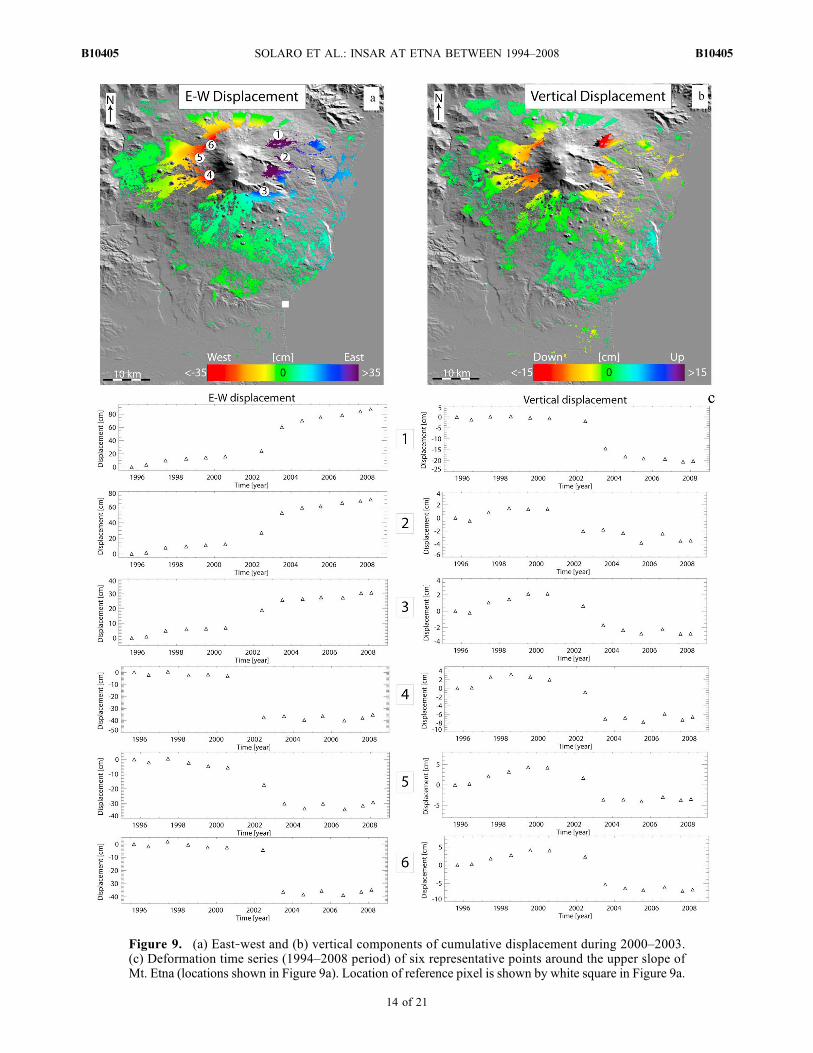
Figure 9. (a) East‐west and (b) vertical components of cumulative displacement during 2000–2003.(c) Deformation time series (1994–2008 period) of six representative points around the upper slope ofMt. Etna (locations shown in Figure 9a). Location of reference pixel is shown by white square in Figure 9a.
SOLARO ET AL.: INSAR AT ETNA BETWEEN 1994–2008 B10405B10405
14 of 21

[49] Part of the eastward deformation of the eastern flankfrom 2003 to 2008 occurred as a result of the 2001 and 2002–2003 eruptions (Figure 7b). The largest eastward displace-ments during 2001–2002 were on the uppermost easternflank, from south of Valle del Bove (east of the southerntermination of the 2001 dike) to the NE rift (east of thenorthern termination of the 2002 dike; Figures 8 and 9). Thisnonlinear deformation was induced by the emplacement ofthe dikes responsible for the 2001 and 2002–2003 eruptions[e.g., Bonaccorso et al., 2002;Neri et al., 2005, 2009; Puglisiet al., 2008]. In particular, the nonlinearity from 2000 to 2002resulted from the emplacement of the north‐south trendingdike responsible for the 2001 eruption along the south rift onthe southern part of the summit. Conversely, the nonlinearity
from 2002 to 2003 resulted from the emplacement of the NE‐SW trending dike responsible for part of the 2002–2003eruption along the NE rift on the NE part of the summit.Therefore, the nonlinear behavior of the deformation timeseries on the upper part of the volcano migrated northwardfrom 2001 to 2002 as a response to repeated dike emplace-ment. Our data show that the nonlinear behavior between2000 and 2003 is not restricted to the upper flank but alsoaffects, to a lesser extent, the more distal flanks (Figure 7).The emplacement of both dikes induced an overall approx-imately ESE‐WNW extension direction, consistent withregional patterns [e.g., Lanzafame et al., 1997b] and sug-gesting a regional control on the short‐term activity of thevolcano.
Figure 10. (a) Cross‐correlation analysis (index = 0.95) of all the pixels characterized in the 1994–2008period by a consistent trend of uplift as that of the pixel of point 1 on the southern flank. (b) Three examplesof selected pixels (including that of point 1; numbers refer to locations in Figure 10a) showing a similar trendof uplift. East‐west and vertical velocity of deformation in the 1994–2008 period along the (c) NW‐SEtrending profile 10 on the southern flank and (d) the east‐west trending profile 11 on the western flank.
SOLARO ET AL.: INSAR AT ETNA BETWEEN 1994–2008 B10405B10405
15 of 21

[50] In summary, the motion on the eastern flank from1994 to 2008 largely records both the inflation of the edi-fice [Palano et al., 2007, 2008; Bonforte et al., 2008] andthe shallow emplacement of the 2001 and 2002 dikes[Bonaccorso et al., 2002; Neri et al., 2005; Puglisi et al.,2008; Bonforte et al., 2008].5.1.2. The Western Flank[51] The deformation of the western flank is more limited
and homogenous and less fault‐controlled than the easternflank (Figure 2). From 1994 to 2000, the distal part of thewestern flank was characterized by an overall westwardmotion (up to 1 cm/yr), with two fault zones defining a centralsector that slid westward at a higher rate (Figure 5b). The twonorthernmost sectors of the western flank (sectors 9 and 10;Figure 6) partly behave as rigid blocks, with minor internaldeformation, while the southern sector (sector 11; Figure 6)shows internal deformation and is kinematically less distin-guished. The eastward velocity along the upper part of theSW flank (Figure 5e) suggests a kinematic consistency withthe southern portion of the eastern flank (Figures 2a and 2b).The uplift on the western flank during 1994–2000 increasestoward the central part of the volcano (Figures 2 and 5)consistent with GPS data [Puglisi and Bonforte, 2004; Palanoet al., 2008; Puglisi et al., 2008; Bonforte et al., 2008]. From2003 to 2008, the westward velocity of the distal westernflank decreases (Figures 2 and 5). Moderate subsidenceoccurs approaching the upper slope (Figures 5c–5e). To thesouth, the subsidence is partly accommodated by minornormal faults, downthrowing to the north or east (Figure 5).These may constitute the southern termination of RFS,
which has a similar normal motion (its dextral componentis not detectable on this part of the volcano). These splaysmay eventually merge with the NW continuation of BOF,which shows a similar kinematics (Figure 5a).[52] Similar to that observed on the eastern flank, the
largest variations in the east‐west deformation migratednorthward on the uppermost western flank during 2000–2003(Figure 9). Again, this nonlinearity resulted from theemplacement of the 2001 and 2002 dikes. Conversely to theeastern flank, however, dike emplacement affected only a partof the proximal portion of the western flank (Figure 5).[53] In summary, during 1994–2000, inflation of the vol-
cano induced an overall westward motion of the westernflank, which mobilized three different sectors on the lowerslope, two of which behaved as rigid blocks (Figure 11a). Theemplacement of the 2001 and 2002 dikes induced significantwestward motion on the upper slope. From 2003 to 2008, thekinematics of the western flank remained largely homoge-neous except for the eastward motion of the upper SW flank.The westward motion on the western flank from 1994 to 2008is a result of both inflation of the edifice (due to a deep source)[Bonaccorso et al., 2004a; Palano et al., 2008] and theemplacement of shallow dikes [Bonaccorso et al., 2002;Neri et al., 2005; Puglisi et al., 2008].5.1.3. Peripheral Uplifted Areas[54] Uplift of the southern part of the volcano was known
from previous studies and was suggested to be related toeither the growth of a basal anticline due to the load of thevolcanic edifice [e.g., Borgia et al., 1992; Rust and Neri,1996; Rust et al., 2005] or to regional tectonics, due to a
Figure 11. Summary of the deformation pattern on Mt. Etna during (a) 1994–2000 and (b) 2003–2008periods. The second period remains heavily influenced by the emplacement of the dikes between 2001and 2002 and shows an important asymmetry in the deformation on the eastern flank, characterized by highervelocities (north portion) and locking of some sectors (south portion).
SOLARO ET AL.: INSAR AT ETNA BETWEEN 1994–2008 B10405B10405
16 of 21

north‐south compression to the front of the Apennines[Bousquet and Lanzafame, 1986; Bousquet et al., 1988;Labaume et al., 1990; Monaco et al., 2002, 2008; Catalanoet al., 2004].[55] Our cross‐correlation analysis (Figure 10) shows that
parts of the volcano to the west and north move synchro-nously with the uplifting area in the south (i.e., with a linearbehavior over the entire 1994–2008 period). The profile inFigure 10c shows that the uplifted area to the south is highlyasymmetric. This we interpret as the expression of an anti-cline resulting from the activity of a buried NNW dippingthrust fault, confining the uplift on the steeper side in theform of a fault‐propagation fold. The differential east‐westvelocity of ∼1 cm/yr at the sides of the uplifted area on thewestern flank (Figure 10d) may similarly result from lateralcompression, developing another fault‐propagation fold.[56] Our InSAR observations show, for the first time, that a
comparable trend of uplift associated with the development offault‐propagation folds is present around the base ofMt. Etna,suggesting that any contribution from regional stresses isnegligible. The constant trend of uplift implies the existenceof a persistent mechanism that is also independent of anyvolcanic activity. This mechanism may be related to the loadimposed by the volcanic edifice itself and probably controlledby a basement with a nonrigid behavior [Palano et al., 2009],inducing peripheral bulging [Borgia et al., 1992, 2000a,2000b; Lundgren et al., 2004; Rust et al., 2005]. The distanceof the uplifted area from the volcano summit varies signifi-cantly, from 15–20 km (to the south) to 7–8 km (to the north).Such a variation may be related to differential buttressingof the volcano base [Froger et al., 2001]. Where the con-finement is stronger, the distance between the summit anduplifted areas is smaller (as on the north side, toward theAMC), whereas, where the confinement is weaker, the dis-tance is greater (as on the south side, toward Catania). Thisprocess may explain the lack of uplifted areas on the onshore
eastern flank. In fact, the offshore shows a bathymetric gra-dient of 2 km over a distance of 20 km, suggesting little orno confinement and an absent or very distant uplifted area.[57] An additional factor controlling the distance of the
uplifted area from the volcano summit may be related to thestrike‐slip activity of faults on the volcano’s flank. The higherthe strike‐slip displacement, the farther the uplifted areafrom the summit. Such a process is observed on the westernand southern flanks. On the western flank, the approximatelyNE‐SW trending tear fault separating blocks 9 and 10 maydisplace the uplifted area of block 9 to the west. On thesouthern flank, BOF and ATF tear faults displace eastwardthe axis of the uplifted area (Figure 2).
5.2. General Model
[58] The data shown here suggest that deformationobserved during the last 15 years at Mt. Etna results from theinterplay of three processes occurring on different timescales(Figure 12).[59] The first process is related to the load of the volcano,
which induces a continuous growth of a peripheral bulgedue to motion along a weak basement (Figure 12a). Thelinear trend of deformation over our observation periodsuggests that this mechanism is not influenced by any vol-canic activity or slip of the flanks. The bulge is discontin-uous and dissected by tear faults. Its extent is reasonablyconstrained to the north, west, and south but not to the SW,where InSAR coverage is poor (Figure 12a). To the east, thepresence of any submerged bulge remains speculative. Thistype of deformation is expected to occur during long‐termgrowth (103–104 years) of the volcano.[60] A second process is related to the inflation of the
volcano due to magma storage, as from 1994 to 2000, when∼1 km3 of magma was inferred to have accumulated [Neriet al., 2009] at depths greater than 5 km below sea level(Figure 12b) [Bonaccorso et al., 2004b;Puglisi and Bonforte,
Figure 12. Schematic representation of the main processes responsible for the recent deformation pattern(highlighted by the main faults and the affected areas) observed on Mt. Etna. (a) Effect of the load of thevolcano; question mark refers to poor InSAR coverage in that area; (b) effect of magma accumulationbeneath the summit [Palano et al., 2009]; (c) effect of dike emplacement (the emplacement and com-bined effect of both the 2001 and 2002 dikes is considered here).
SOLARO ET AL.: INSAR AT ETNA BETWEEN 1994–2008 B10405B10405
17 of 21
2004; Palano et al., 2008, 2009; Bonforte et al., 2008].Magma accumulation at depth uplifts the edifice and dis-places the western and eastern flanks westward and eastward,respectively. This displacement involved the activity of rigidblocks (blocks 2, 6, 7, and 8; Figure 11) on the distal easternflank. The east‐west displacement on the eastern flank isusually higher (2–3 cm/yr) than that on the western flank(∼1 cm/yr), probably as a result of the weaker buttressingconditions at the base of the former [e.g., Froger et al., 2001].Similarly, the areal extent of the deformed region on theeastern flank is twice of that of the western flank (Figures 2aand 12b). This type of eastward andwestward slip depends onthe rate of emplacement of magma below the volcano and canbe thus considered as an intermediate‐term (1 to 101 years)deformation.[61] Even though we do not have any means to assess the
existence of an outward slip also on the northern and southernflanks (the north‐south component of horizontal deformationcannot be detected through InSAR data), we believe that suchmotion is feasible [e.g., Rust et al., 2005]. A limitation of thisstudy is the inability to detect strike‐slip movement alongnorth‐south trending faults on the southern flank, such asRFS, which certainly plays an important role in the dynamicsof the flank [Neri et al., 2007 and references therein].[62] A third process of deformation is related to the
emplacement of dikes along the rifts, as during the 2001 and2002–2003 eruptions (Figure 1b) [Neri et al., 2009 andreferences therein]. Dike emplacement occurred alongapproximately north‐south and NE‐SW trending dikes,resulting in an overall approximate ESE‐WNWdisplacementof the eastern and western flanks of the volcano, consistentwith regional tectonics [Bonaccorso et al., 2002; Acocellaet al., 2003; Puglisi et al., 2008; Bonforte et al., 2009]. Thelargest (nonlinear) part of the deformation was coeval tothe emplacement of the dikes in 2001–2002, especially on theproximal flanks. However, even when the velocities becomealmost linear again during the period from 2003 to 2008,the overall deformation pattern continues to be partly influ-enced by the emplacement of the dikes (see Figure 7b). Thisdike‐induced displacement in the post‐emplacement period(2003–2008) is significantly higher, up to 1–2 orders ofmagnitude, than that induced by inflation alone, especially onthe eastern flank. Rigid blocks with differential kinematicsare active on both flanks (Figure 11b), even though faultsbordering southward slipping blocks, as RNF, remain active[Neri et al., 2007]. As most of the slip associated with eachdike occurred within 1 year, such a dike‐induced deformationcan be considered as affecting the volcano flanks in the shortterm (years or less).[63] While loading (associated with a long‐term deforma-
tion) is not induced by any magmatic activity, inflation anddike emplacement (acting in the intermediate and short term)are directly related to magmatic activity. Although thesethree processes are independent, they may be spatially andtemporally superimposed. Also, while inflation suggestsan elastic and potentially recoverable process, loading anddike emplacement are largely inelastic and nonrecoverable.Therefore, the deformation of Mt. Etna during 1994–2008 ischaracterized by both elastic and inelastic behaviors. Thesehave an almost comparable duration in the considered period,even though dike emplacement is shorter than inflation;however, in terms of amount of deformation, the inelastic
strain due to dike emplacement is significantly larger than theelastic strain due to inflation.[64] Finally, the contemporaneous activity of multiple
processes inducing the instability of the flanks of Mt. Etnamay also explain the complex deformation pattern observedon the SE flank. As anticipated (see section 2), the SE flankhas been characterized by the contemporaneous and/or spo-radic activity of different structures, highlighted by differentmonitoring methods [Froger et al., 2001; Acocella et al.,2003; Lundgren et al., 2004; Neri et al., 2009]. This studyshows how each type of deformation results from specificconditions. The continuous uplift of the peripheral area of thevolcano is load induced. BOF and TMF (Figure 1b) are activeduring periods of inflation of the volcano and become almostlocked during dike emplacement. Conversely, the activityof TF (Figure 1b) continues also during dike emplacement.[65] The methodological approach and the results of this
study, providing a detailed analysis of the deformation of theflanks of a volcano over a significant time span (15 years),also may find a wider applicability to other volcanoes.[66] As far as the methodology is concerned, we have
highlighted the occurrence and interdependence of severalprocesses controlling volcano deformation both in the inter-mediate and short term. In particular, our study has shownhow the short‐term deformation may be affected by theintermediate‐term one (as the 1994–2000 inflation of thevolcano culminated in dike emplacement in 2001–2002)and how the short‐term deformation may also affect theintermediate‐term one (as observed during 2003–2008).Highlighting the relationships between events at differenttimescales provides crucial information to understand themagmatic evolution of a volcano. While an increasingamount of geodetic data is becoming available to studyvolcano deformation, this study represents one of the firstattempts of analyzing repeated magmatic events, as well astheir relationships, in different temporal frames. The SBAStechnique may constitute an important tool to capture theshort‐term deformation, usually nonlinear, and place it ina wider context.[67] As far as the scientific results are concerned, this study
may also provide a reference to help the understanding ofcomplex deformation patterns, induced by multiple pro-cesses, on other volcanoes. In particular, the example ofMt. Etna shows the following main points: (1) Volcanodeformation may result from a complex interplay of differentprocesses, partly overlapping, acting on different timescales.Even though similar results were recently obtained at Kilauea[Brooks et al., 2008], this study represents one of the firstattempts to analyze the intermediate‐term deformation of avolcano in a multi‐process perspective. (2) Flank instabilitymay be the most important type of deformation of a volcano,independent of its activity, which may be related to deepermagma storage, shallower dike emplacement, or even inac-tivity (the volcano load remaining the only driving factor).(3) Dike emplacement is an effective trigger for volcanodestabilization, even though the areal extent of the deformedarea is not necessarily large.
6. Conclusions
[68] The deformation pattern on Mt. Etna highlighted byInSAR data in the 1994–2008 period shows widespread
SOLARO ET AL.: INSAR AT ETNA BETWEEN 1994–2008 B10405B10405
18 of 21
instability of the flanks, activating several fault‐boundedsectors on the distal portions that partly behave as rigidblocks. The deformation of these sectors results from threemain processes. In the long term (103–104 years), the loadof the volcano develops peripheral uplifted areas, forming adiscontinuous bulge. In the intermediate term (≤101 years),inflation due to storage of magma induces outward slip ofsectors of the flanks as well as moderate uplift of the areaproximal to the summit. In the short term (≤1 year), theemplacement of feeder dikes along the NE and south riftsproduces a nonlinear, focused, and asymmetric deformationon the eastern and western flanks, with significant variationsin the kinematics of the sectors. Therefore, whatever theactivity (magma storage, dike emplacement, inactivity), flankinstability is widespread and remains by far the predomi-nant type of deformation at Mt. Etna. Our results may helprevealing and understanding complex deformations at othervolcanoes as well.
[69] Acknowledgments. ESA provided the SAR data (Cat‐1 no. 4532and GEO Supersite initiative). The DEM was obtained from the SRTMarchive, while the ERS‐1/2 orbits are courtesy of the TU‐Delft, The Nether-lands. This work was partially funded by INGV and the Italian DPC (DPC‐INGV project V4 “Flank”), the Italian DPC (under special agreement withIREA‐CNR), and the Italian Space Agency under contract “sistema rischiovulcanico (SRV).” The authors thank Francesco Casu, Paolo Berardino,and Riccardo Lanari for their support and Geoff Wadge and Michael Polandfor their helpful and constructive review of the manuscript.
ReferencesAcocella, V., and M. Neri (2003), What makes flank eruptions? The 2001Etna eruption and the possible triggering mechanisms, Bull. Volcanol.,65, 517–529, doi:10.1007/s00445-003-0280-3.
Acocella, V., and M. Neri (2005), Structural features of an active strike‐slip fault on the sliding flank of Mt. Etna (Italy), J. Struct. Geol.,27(2), 343–355, doi:10.1016/j.jsg.2004.07.006.
Acocella, V., B. Behncke, M. Neri, and S. D’Amico (2003), Link betweenmajor flank slip and eruptions at Mt. Etna (Italy), Geophys. Res. Lett.,30(24), 2286, doi:10.1029/2003GL018642.
Acocella, V., M. Neri, and P. Scarlato (2006), Understanding shallowmagma emplacement at volcanoes: Orthogonal feeder dikes during the2002–2003 Stromboli (Italy) eruption, Geophys. Res. Lett., 33,L17310, doi:10.1029/2006GL026862.
Allard, P., B. Behncke, S. D’Amico, M. Neri, and S. Gambino (2006),Mount Etna 1993–2005: Anatomy of an evolving eruptive cycle, EarthSci. Rev., 78, 85–114, doi:10.1016/j.earscirev.2006.04.002.
Aloisi, M., A. Bonaccorso, and S. Gambino (2006), Imaging compositedike propagation (Etna, 2002 case), J. Geophys. Res., 111, B06404,doi:10.1029/2005JB003908.
Amelung, F., S. Jonsson, H. Zebker, and P. Segall (2000), Widespreaduplift and “trapdoor” faulting on Galapagos volcanoes observed withradar interferometry, Nature, 407, 993–996.
Amelung, F., S. Yun, T. R. Walter, P. Segall, and S. Kim (2007), Stresscontrol of deep rift intrusion at Mauna Loa Volcano, Hawaii, Science,316, 1026–1030, doi:10.1126/science.1140035.
Ando, M. (1979), The Hawaii earthquake of November 29, 1975: Low dipangle faulting due to forceful injection of magma, J. Geophys. Res., 84,7616–7626.
Azzaro, R. (2004), Seismicity and active tectonics in the Etna region:Constraints for a seismotectonic model, in Etna Volcano Laboratory,Geophys. Monogr. Ser., vol. 143, edited by A. Bonaccorso et al.,pp. 205–220, AGU, Washington, D. C.
Barberi, F., L. Civetta, P. Gasparini, F. Innocenti, P. Scandone, and L. Villari(1974), Evolution of a section of the Africa‐Eurapa plate boundary: Paleo-magnetic and volcanological evidence from Sicily, Earth Planet. Sci. Lett.,22, 123–132.
Battaglia, M., C. Troise, F. Obrizzo, F. Pingue, and G. De Natale (2006),Evidence for fluid migration as the source of deformation at CampiFlegrei caldera (Italy), Geophys. Res. Lett., 33, L01307, doi:10.1029/2005GL024904.
Behncke, B., and M. Neri (2003a), Cycles and trends in the recent eruptivebehaviour of Mount Etna (Italy), Can. J. Earth Sci., 40, 1405–1411,doi:10.1139/E03-052.
Behncke, B., and M. Neri (2003b), The July–August 2001 eruption ofMt. Etna (Sicily), Bull. Volcanol., 65, 461–476, doi:10.1007/s00445-003-0274-1.
Behncke, B., M. Neri, and A. Nagay (2005), Lava flow hazard at MountEtna (Italy): New data from a GIS‐based study, in Kinematics andDynamics of Lava Flows, Spec. Pap. Geol. Soc. Am., vol. 396, editedby M. Manga and G. Ventura, pp. 189–208, doi:10.1130/0-8137-2396-5.189.
Behncke, B., M. Neri, E. Pecora, and V. Zanon (2006), The exceptionalactivity and growth of the Southeast Crater, Mount Etna (Italy), between1996 and 2001, Bull. Volcanol., 69, 149–173, doi:10.1007/s00445-006-0061-x.
Behncke, B., S. Calvari, S. Giammanco, M. Neri, and H. Pinkerton (2008),Pyroclastic density currents resulting from interaction of basaltic magmawith hydrothermally altered rock: An example from the 2006 summiteruptions of Mount Etna, Italy, Bull. Volcanol., 70, 1249–1268,doi:10.1007/s00445-008-0200-7.
Berardino, P., G. Fornaro, R. Lanari, and E. Sansosti (2002), A newalgorithm for surface deformation monitoring based on small baselinedifferential SAR interferograms, IEEE Trans. Geosci. Remote Sens.,40, 2375–2383, doi:10.1109/TGRS.2002.803792.
Bonaccorso, A., F. Ferrucci, D. Patanè, and L. Villari (1996), Fast deforma-tion processes and eruptive activity at Mount Etna (Italy), J. Geophys.Res., 101(B8), 17,467–17,480.
Bonaccorso, A., M. Aloisi, and M. Mattia (2002), Dike emplacementforerunning the Etna July 2001 eruption modeled through continuoustilt and GPS data, Geophys. Res. Lett., 29(13), 1624, doi:10.1029/2001GL014397.
Bonaccorso, A., O. Campisi, G. Falzone, and S. Gambino (2004a), Contin-uous tilt monitoring: A lesson from 20 years experience at Mt. Etna, inEtna Volcano Laboratory, Geophys. Monogr. Ser., vol. 143, edited byA. Bonaccorso et al., pp. 307–320, AGU, Washington, D. C.
Bonaccorso, A., S. D’Amico, M. Mattia, and D. Patanè (2004b), Intrusivemechanisms at Mt. Etna forerunning the July–August 2001 eruption fromseismic and ground deformation data, Pure Appl. Geophys., 161, 1469–1487, doi:10.1007/s00024-004-2515-4.
Bonaccorso, A., A. Bonforte, F. Guglielmino, M. Palano, and G. Puglisi(2006), Composite ground deformation pattern forerunning the2004–2005 Mount Etna eruption, J. Geophys. Res., 111, B12207,doi:10.1029/2005JB004206.
Bonforte, A., and G. Puglisi (2006), Dynamics of the eastern flank ofMt. Etna volcano (Italy) investigated by a dense GPS network, J. Volcanol.Geotherm. Res., 153, 357–369, doi:10.1016/j.jvolgeores.2005.12.005.
Bonforte, A., F. Guglielmino, M. Palano, and G. Puglisi (2004), A syn‐eruptive ground deformation episode measured by GPS, during the2001 eruption on the upper southern flank of Mt. Etna, Bull. Volcanol.,66, 336–341.
Bonforte, A., S. Gambino, F. Guglielmino, F. Obrizzo, M. Palano, andG. Puglisi (2007), Ground deformation modeling of flank dynamics priorto the 2002 eruption of Mt. Etna, Bull. Volcanol., 69, 757–768,doi:10.1007/s00445-006-0106-1.
Bonforte, A., A. Bonaccorso, F. Guglielmino, M. Palano, and G. Puglisi(2008), Feeding system and magma storage beneath Mt. Etna as revealedby recent inflation/deflation cycles, J. Geophys. Res., 113, B05406,doi:10.1029/2007JB005334.
Bonforte, A., S. Gambino, and M. Neri (2009), Intrusion of eccentric dikes:The case of the 2001 eruption and its role in the dynamics of Mt. Etnavolcano, Tectonophysics, 471, 78–86, doi:10.1016/j.tecto.2008.09.028.
Bousquet, J. C., and G. Lanzafame (1986), Déformations compressivesquaternaires au bord sud de l’Etna, C. R. Acad. Sci., Ser. II, 303(3),235–240.
Bousquet, J. C., and G. Lanzafame (2001), Nouvelle interprétation desfractures des éruptions latérales de l’Etna: Conséquences pour son cadretectonique, Bull. Soc. Géol. Fr., 172, 455–467.
Bousquet, J. C., G. Lanzafame, and C. Paquin (1988), Tectonic stresses andvolcanism: In‐situ stress measurements and neotectonic investigations inthe Etna area (Italy), Tectonophysics, 149, 219–231.
Borgia, A., and B. van Wyk de Vries (2003), The volcano‐tectonic evolu-tion of Concepción, Nicaragua, Bull. Volcanol., 65(4), 248–266.
Borgia, A., L. Ferrari, and G. Pasquale (1992), Importance of gravitationalspreading in the tectonic and volcanic evolution of Mount Etna, Nature,357, 231–235.
Borgia, A., P. T. Delaney, and R. P. Denlinger (2000a), Spreading volca-noes, Ann. Rev. Earth Planet. Sci., 28, 539–570.
Borgia, A., R. Lanari, E. Sansosti, M. Tesauro, P. Berardino, G. Fornaro,M. Neri, and J. B. Murray (2000b), Actively growing anticlines beneathCatania from the distal motion of Mount Etna’s decollement measuredby SAR interferometry and GPS, Geophys. Res. Lett., 27(20),3409–3412.
SOLARO ET AL.: INSAR AT ETNA BETWEEN 1994–2008 B10405B10405
19 of 21
Branca, S., and P. Del Carlo (2005) Types of eruptions of Etna volcanoAD 1670–2003: Implications for short‐term eruptive behaviour, Bull.Volcanol., 67, 732–742, doi:10.1007/s00445-005-0412-z.
Brooks, B. A., J. Foster, D. Sandwell, C. J. Wolfe, P. Okubo, M. Poland,and D.Myer (2008), Magmatically triggered slow slip at Kilauea Volcano,Hawaii, Science, 321, 1177.
Burton, M. R., et al. (2005), Etna 2004–2005: An archetype forgeodynamically‐controlled effusive eruptions, Geophys. Res. Lett., 32,L09303, doi:10.1029/2005GL022527.
Casu, F., M. Manzo, and R. Lanari (2006), A quantitative assessment ofthe SBAS algorithm performance for surface deformation retrieval fromDInSAR data, Remote Sens. Environ., 102, 195–210.
Casu, F., M. Poland, G. Solaro, P. Tizzani, A. Miklius, E. Sansosti, andR. Lanari (2009), Surface deformation analysis of the Mauna Loa andKilauea volcanoes, Hawaii, revealed by InSAR measurements, paperpresented at General Assembly, Eur. Geosci. Union, Vienna.
Catalano, S., S. Torrisi, and C. Ferlito (2004), The relationship betweenLate Quaternary deformation and volcanism of Mt. Etna (eastern Sicily):New evidence from the sedimentary substratum in the Catania region,J. Volcanol. Geotherm. Res., 132(4), 311–334.
Cervelli, P., P. Segall, K. Johnson, M. Lisowski, and A. Miklius (2002),Sudden aseismic fault slip on the south flank of Kilauea volcano, Nature,415, 1014–1018.
Cocina, O., G. Neri, E. Privitera, and S. Spampinato (1997), Stress tensorcomputations in the Mount Etna area (Southern Sicily) and tectonicimplications, J. Geod., 23, 109–127.
Coltelli, M., G. Fornaro, G. Franceschetti, R. Lanari, M. Migliaccio, J. R.Moreira, K. P. Papathanassiou, G. Puglisi, D. Riccio, and M. Schwaebisch(1996), SIR‐C/X‐SAR multifrequency multipass interferometry: A newtool for geological interpretation, J. Geophys. Res., 101, 23,127–23,148.
Corsaro, R. A., M. Neri, and M. Pompilio (2002), Paleo‐environmental andvolcano‐tectonic evolution of the south‐eastern flank of Mt. Etna duringthe last 225 ka inferred from volcanic succession of the “Timpe,” Acir-eale, Sicily, J. Volcanol. Geotherm. Res., 113, 289–306, doi:10.1016/S0377-0273(01)00262-1.
Delaney, P. T., R. P. Denlinger, M. Lisowski, A. Miklius, P. G. Okubo,A. T. Okamura, and M. K. Sako (1998), Volcanic spreading at Kilauea,1976–1996, J. Geophys. Res., 103, 18,003–18,023.
Dieterich, J. H. (1988), Growth and persistence of Hawaiian volcanic riftzones, J. Geophys. Res., 93, 4258–4270.
Donnadieu, F., and O. Merle (2001), Geometrical constraints of the 1980Mount St. Helens intrusion from analogue models, Geophys. Res. Lett.,28, 639–642.
Froger, J., O. Merle, and P. Briole (2001), Active spreading and regionalextension at Mount Etna imaged by SAR interferometry, Earth Planet.Sci. Lett., 187, 245–258.
Gresta, S., V. Longo, and A. Viavattene (1990), Geodynamic behaviour ofeastern and western sides of Mount Etna, Tectonophysics, 179, 81–92.
Gvirtzman, Z., and A. Nur (1999) The formation of Mount Etna as the con-sequence of slab rollback, Nature, 401, 782–785.
Kieffer, G. (1985), Evolution structurale et dynamique d’un grand volcanpolygénique: Stades d’edification et activité actuelle de l’Etna (Sicile),thése d’etat., 497 pp., Université Blaise‐Pascal, Clermont‐Ferrand,France.
Labaume, P., J. C. Bousquet, and G. Lanzafame (1990), Early deformationsat a submarine compressive front: the Quaternary Catania foredeep southMt. Etna, Sicily, Tectonophysics, 177, 349–366.
Lanzafame, G., A. Leonardi, M. Neri, and D. Rust (1997a), Late overthrustof the Appenine—Maghrebian Chain at the NE periphery of Mt. Etna,Sicily, C. R. Acad. Sci., Ser. II, 324, 325–332.
Lanzafame, G., M. Neri, M. Coltelli, L. Lodato, and D. Rust (1997b),North‐South compression in the Mt. Etna region (Sicily): Spatial andtemporal distribution, Acta Vulcanol., 9, 121–133.
Lentini, F. (1982), The geology of the Mt. Etna basement, Mem. Soc. Geol.Ital., 23, 7–25.
Lo Giudice, E., and R. Rasà (1992), Very shallow earthquakes and brittledeformation in active volcanic areas: the Etnean region as an example,Tectonophysics, 202, 257–268.
Lundgren, P., and P. A. Rosen (2003), Source model for the 2001 flankeruption of Mt. Etna volcano, Geophys. Res. Lett., 30(7), 1388,doi:10.1029/2002GL016774.
Lundgren, P., P. Berardino, M. Coltelli, G. Fornaro, R. Lanari, G. Puglisi,E. Sansosti, and M. Tesauro (2003), Coupled magma chamber inflationand sector collapse slip observed with synthetic aperture radar inter-ferometry on Mt. Etna volcano, J. Geophys. Res., 108(B5), 2247,doi:10.1029/2001JB000657.
Lundgren, P., F. Casu, M. Manzo, A. Pepe, P. Berardino, E. Sansosti, andR. Lanari (2004), Gravity and magma induced spreading of Mount Etna
volcano revealed by satellite radar interferometry, Geophys. Res. Lett.,31, L04602, doi:10.1029/2003GL018736.
Manzo, M., G. P. Ricciardi, F. Casu, G. Ventura, G. Zeni, S. Borgström,P. Berardino, C. Del Gaudio, and R. Lanari (2006), Surface deformationanalysis in the Ischia Island (Italy) based on spaceborne radar interferom-etry, J. Volcanol. Geotherm. Res., 151(4), 399–416.
Massonnet, D., P. Briole, and A. Arnaud (1995), Deflation of Mount Etnamonitored by spaceborne radar interferometry, Nature, 375, 567–570.
Mattia, M., D. Patanè, M. Aloisi, and M. Amore (2007), Faulting on thewestern flank of Mt Etna and magma intrusions in the shallow crust,Terra Nova, 19(1), 89–94, doi:10.1111/j.1365-3121.2006.00724.x.
McGuire, W. J., and A. D. Pullen (1989), Location and orientation of erup-tive fissures and feeder‐dykes at Mount Etna: influence of gravitationaland regional stress regimes, J. Volcanol. Geotherm. Res., 38, 325–244.
Monaco, C., P. Tapponnier, L. Tortorici, and P. Y. Gillot (1997), Late Qua-ternary slip rates on the Acireale‐Piedimonte normal faults and tectonicorigin of Mt. Etna (Sicily), Earth Planet. Sci. Lett., 147, 125–139.
Monaco, C., M. Bianca, S. Catalano, G. De Guidi, and L. Tortorici (2002),Sudden change in the Late Quaternary tectonic regime in eastern Sicily:Evidences from geological and geo‐morphological features, Boll. Soc.Geol. Ital., 1, 901–913.
Monaco, C., G. De Guidi, S. Catalano, C. Ferlito, G. Tortorici, andL. Tortorici (2008), Carta Morfotettonica del Monte Etna, LitografiaArtistica Cartografica, Firenze.
Neri, M., and V. Acocella (2006), The 2004–05 Etna eruption: Implicationsfor flank deformation and structural behaviour of the volcano, J. Volcanol.Geotherm. Res., 158, 195–206, doi:10.1016/j.jvolgeores.2006.04.022.
Neri, M., V. Acocella, and B. Behncke (2004), The role of the PernicanaFault System in the spreading of Mount Etna (Italy) during the 2002–2003 eruption, Bull. Volcanol., 66, 417–430, doi:10.1007/s00445-003-0322-x.
Neri, M., V. Acocella, B. Behncke, V. Maiolino, A. Ursino, and R. Velardita(2005), Contrasting triggering mechanisms of the 2001 and 2002–2003eruptions of Mount Etna (Italy), J. Volcanol. Geotherm. Res., 144, 235–255, doi:10.1016/j.jvolgeores.2004.11.025.
Neri, M., F. Guglielmino, and D. Rust (2007), Flank instability onMount Etna: Radon, radar interferometry and geodetic data from thesouthern boundary of the unstable sector, J. Geophys. Res., 112,B04410, doi:10.1029/2006JB004756.
Neri, M., F. Mazzarini, S. Tarquini, M. Bisson, I. Isola, B. Behncke, andM. T. Pareschi (2008), The changing face of Mount Etna’s summit areadocumented with Lidar technology, Geophys. Res. Lett., 35, L09305,doi:10.1029/2008GL033740.
Neri, M., F. Casu, V. Acocella, G. Solaro, S. Pepe, P. Berardino, E. Sansosti,T. Caltabiano, P. Lundgren, and R. Lanari (2009), Deformation and erup-tions at Mt. Etna (Italy): A lesson from 15 years of observations,Geophys.Res. Lett., 36, L02309, doi:10.1029/2008GL036151.
Nunnari, G., and G. Puglisi (1994), The global positioning system as auseful technique for measuring ground deformations in volcanic areas,J. Volcanol. Geotherm. Res., 61(3–4), 267–280.
Palano, M., G. Puglisi, and S. Gresta (2007), Ground deformation atMt. Etna: A joint interpretation of GPS and InSAR data from 1993 to2000, Bol. Geofis. Teor. Appl., 48, 81–98.
Palano, M., G. Puglisi, and S. Gresta (2008), Ground deformation patternsat Mt. Etna from 1993 to 2000 from joint use of InSAR and GPS tech-niques, J. Volcanol. Geotherm. Res., 169(3–4), 99–120.
Palano, M., S. Gresta, and G. Puglisi (2009), Time‐dependent deformationof the eastern flank of Mt. Etna: After‐slip or viscoelastic relaxation?Tectonophysics,473(3–4), 300–311, doi:10.1016/j.tecto.2009.02.047.
Patanè, D., C. Chiarabba, P. De Gori, and A. Bonaccorso (2003), Magmaascent and the pressurization of Mt. Etna’s volcanic system, Science, 299,2061–2063.
Pepe, A., E. Sansosti, P. Berardino, and R. Lanari (2005), On the genera-tion of ERS/ENVISAT DInSAR time‐series via the SBAS technique,IEEE Geosci. Remote Sens. Lett., 2, 265–269, doi:10.1109/LGRS.2005.848497.
Puglisi, G., and A. Bonforte (2004), Dynamics of Mount Etna Volcanoinferred from static and kinematic GPS measurements, J. Geophys.Res., 109, B11404, doi:10.1029/2003JB002878.
Puglisi, G., A. Bonforte, A. Ferretti, F. Guglielmino, M. Palano, and C. Prati(2008), Dynamics ofMount Etna before, during, and after the July–August2001 eruption inferred from GPS and differential synthetic aperture radarinterferometry data, J. Geophys. Res., 113, B06405, doi:10.1029/2006JB004811.
Reid, M. E., T. W. Sisson, and D. L. Brien (2001), Volcano collapsepromoted by hydrothermal alteration and edifice shape, Mount Rainier,Washington, Geology, 29, 779–782.
Rittmann, A. (1973), Structure and evolution of Mount Etna, Philos. Trans.R. Soc. A, 274, 5–16.
SOLARO ET AL.: INSAR AT ETNA BETWEEN 1994–2008 B10405B10405
20 of 21

Rust, D., and M. Neri (1996), The boundaries of large‐scale collapse on theflanks of Mount Etna, Sicily, in Volcano Instability on the Earth andOther Planets, edited by W. M. McGuire, A. P. Jones, and J. Neuberg,Spec. Publ. Geol. Soc. London, 110, 193–208.
Rust, D., B. Behncke, M. Neri, and A. Ciocanel (2005), Nested zones ofinstability in the Mount Etna volcanic edifice, Sicily, J. Volcanol.Geotherm. Res., 144, 137–153, doi:10.1016/j.jvolgeores.2004.11.021.
Sanderson, T. J. O. (1982), Direct gravimetric detection of magma move-ments at Mount Etna, Nature, 297, 487–490, doi:10.1038/297487a0.
Scarpa, R., G. Patanè, and G. Lombardo (1983), Space‐time evolution ofseismic activity at Mount Etna during 1974–1892, Ann. Geophys.,1(6), 451–461.
Sharp, A. D. L., P. M. Davis, and F. Gray (1980), A low velocity zonebeneath Mount Etna and magma storage, Nature, 287, 587–591.
Stanton, J. M. (2001), Galton, Pearson, and the peas: A brief history oflinear regression for statistics instructors (online), Journal of StatisticsEducation, 9(3).
Stevens, N. F., G. Wadge, C. A. Williams, J. G. Morely, J.‐P. Muller, J. B.Murray, and U. Upton (2001), Surface movements of emplaced lavaflows measured by synthetic aperture radar interferometry, J. Geophys.Res., 106, 11,293–11,313.
Tanguy, J. C., and G. Kieffer (1993), Les éruptions de l’Etna et leursmécanismes, Mém. Soc. Géol. Fr., 163, 239–252.
Tanguy, J. C., and G. Kieffer (1994), Volcanic and seismic hazards atMount Etna (Sicily), Bull. Soc. Geol. Fr., 165(1), 37–47.
Tibaldi, A., and G. Groppelli (2002), Volcano‐tectonic activity along struc-tures of the unstable NE flank of Mt.Etna (Italy) and their possible origin,J. Volcanol. Geotherm. Res., 115, 277–302.
Tizzani, P., P. Berardino, F. Casu, P. Euillades, M. Manzo, G. P. Ricciardi,G. Zeni, and R. Lanari (2007), Surface deformation of Long Valley
caldera and Mono Basin, California, investigated with the SBAS‐InSARapproach, Remote Sens. Environ., 108, 277–289, doi:10.1016/j.rse.2006.11.015.
Trasatti, E., et al. (2008), The 2004–2006 uplift episode at Campi FlegreiCaldera (Italy): Constraints from SBAS‐DInSAR ENVISAT data andBayesian source inference, Geophys. Res. Lett. , 35 , L07308,doi:10.1029/2007GL033091.
Van Wyk de Vries, B., and P. W. Francis (1997), Catastrophic collapseat stratovolcanoes induced by slow volcano spreading, Nature, 387,387–390.
Voight, B., H. Glicken, R. J. Janda, and P. M. Douglas (1981), Catastrophicrockslide avalanche of May 18, in The 1980 Eruptions of MountSt. Helens, Washington, edited by P. W. Lipman and D. R. Mullineaux,Geol. Surv. Prof. Pap., 1250, 347–377.
Walter, T. R., V. Acocella, M. Neri, and F. Amelung (2005), Feedbackprocesses between magmatism and E‐flank movement at Mt. Etna (Italy)during the 2002–2003 eruption, J. Geophys. Res., 110, B10205,doi:10.1029/2005JB003688.
White, N. J., A. Jackson, and D. P. McKenzie (1986), The relationshipbetween the geometry of normal faults and that of the sedimentary layersin their hanging walls, J. Struct. Geol., 8, 897–909.
V. Acocella and J. Ruch, Dipartimento di Scienze Geologiche, UniversitàRoma Tre, Rome, Italy. ([email protected])M. Neri, Istituto Nazionale di Geofisica e Vulcanologia, Sezione di
Catania, Italy.S. Pepe, E. Sansosti, and G. Solaro, Istituto per il Rilevamento
Elettromagnetico dell’Ambiente, Consiglio Nazionale delle Ricerche,Naples, Italy.
SOLARO ET AL.: INSAR AT ETNA BETWEEN 1994–2008 B10405B10405
21 of 21